Attached files
| file | filename |
|---|---|
| EX-99 - EX-99 - Veritex Holdings, Inc. | a3q20pressrelease-quarterl.htm |
| EX-99.1 - EX-99.1 - Veritex Holdings, Inc. | a2020q3-exhibit991.htm |
| 8-K - 8-K - Veritex Holdings, Inc. | vbtx-20201027.htm |

V E R I T E X Investor Presentation 3rd Quarter 2020

Safe Harbor Forward-looking statements This presentation contains certain “forward-looking statements” within the meaning of the Private Securities Litigation Reform Act of 1995. Forward-looking statements are based on various facts and derived utilizing assumptions, current expectations, estimates and projections and are subject to known and unknown risks, uncertainties and other factors that may cause actual results, performance or achievements to be materially different from any future results, performance or achievements expressed or implied by such forward-looking statements. Forward-looking statements include, without limitation, statements relating to the expected payment date of Veritex Holdings, Inc.’s (“Veritex”) quarterly cash dividend, impact of certain changes in Veritex’s accounting policies, standards and interpretations, the effects of the COVID-19 pandemic and actions taken in response thereto, Veritex’s future financial performance, business and growth strategy, projected plans and objectives, as well as other projections based on macroeconomic and industry trends, which are inherently unreliable due to the multiple factors that impact broader economic and industry trends, and any such variations may be material. Statements preceded by, followed by or that otherwise include the words “believes,” “expects,” “anticipates,” “intends,” “projects,” “estimates,” “plans” and similar expressions or future or conditional verbs such as “will,” “should,” “would,” “may” and “could” are generally forward-looking in nature and not historical facts, although not all forward-looking statements include the foregoing words. We refer you to the “Risk Factors” and “Management’s Discussion and Analysis of Financial Condition and Results of Operations” sections of Veritex’s Annual Report on Form 10-K for the year ended December 31, 2019 and any updates to those risk factors set forth in Veritex’s Quarterly Reports on Form 10-Q, Current Reports on Form 8-K and other filings with the Securities and Exchange Commission (“SEC”), which are available on the SEC’s website at www.sec.gov. If one or more events related to these or other risks or uncertainties materialize, or if Veritex’s underlying assumptions prove to be incorrect, actual results may differ materially from what Veritex anticipates. Accordingly, you should not place undue reliance on any such forward-looking statements. Any forward-looking statement speaks only as of the date on which it is made. Veritex does not undertake any obligation, and specifically declines any obligation, to update or revise any forward-looking statements, whether as a result of new information, future developments or otherwise, except as required by law. All forward-looking statements, expressed or implied, included in this presentation are expressly qualified in their entirety by this cautionary statement. This cautionary statement should also be considered in connection with any subsequent written or oral forward-looking statements that Veritex or persons acting on Veritex’s behalf may issue. This presentation also includes industry and trade association data, forecasts and information that Veritex has prepared based, in part, upon data, forecasts and information obtained from independent trade associations, industry publications and surveys, government agencies and other information publicly available to Veritex, which information may be specific to particular markets or geographic locations. Some data is also based on Veritex's good faith estimates, which are derived from management's knowledge of the industry and independent sources. Industry publications, surveys and forecasts generally state that the information contained therein has been obtained from sources believed to be reliable. Although Veritex believes these sources are reliable, Veritex has not independently verified the information contained therein. While Veritex is not aware of any misstatements regarding the industry data presented in this presentation, Veritex's estimates involve risks and uncertainties and are subject to change based on various factors. Similarly, Veritex believes that its internal research is reliable, even though such research has not been verified by independent sources. 2
Non-GAAP Financial Measures Veritex reports its results in accordance with United States generally accepted accounting principles (“GAAP”). However, management believes that certain supplemental non-GAAP financial measures used in managing its business provide meaningful information to investors about underlying trends in its business. Management uses these non-GAAP measures to assess the Company’s operating performance and believes that these non-GAAP measures provide information that is important to investors and that is useful in understanding Veritex’s results of operations. However, non-GAAP financial measures are supplemental and should be viewed in addition to, and not as an alternative for, Veritex’s reported results prepared in accordance with GAAP. The following are the non-GAAP measures used in this presentation: • Tangible book value per common share; • Tangible common equity to tangible assets; • Returns on average tangible common equity; • Operating earnings; • Pre-tax, pre-provision operating earnings; • Diluted operating earnings per share (“EPS”); • Pre-tax, pre-provision operating return on average assets; • Operating return on average tangible common equity; • Operating efficiency ratio; • Operating noninterest income; • Operating noninterest expense; • Adjusted net interest margin. Please see “Reconciliation of Non-GAAP Financial Measures” at the end of this presentation for reconciliations of non-GAAP measures to the most directly comparable financial measures calculated in accordance with GAAP. 3
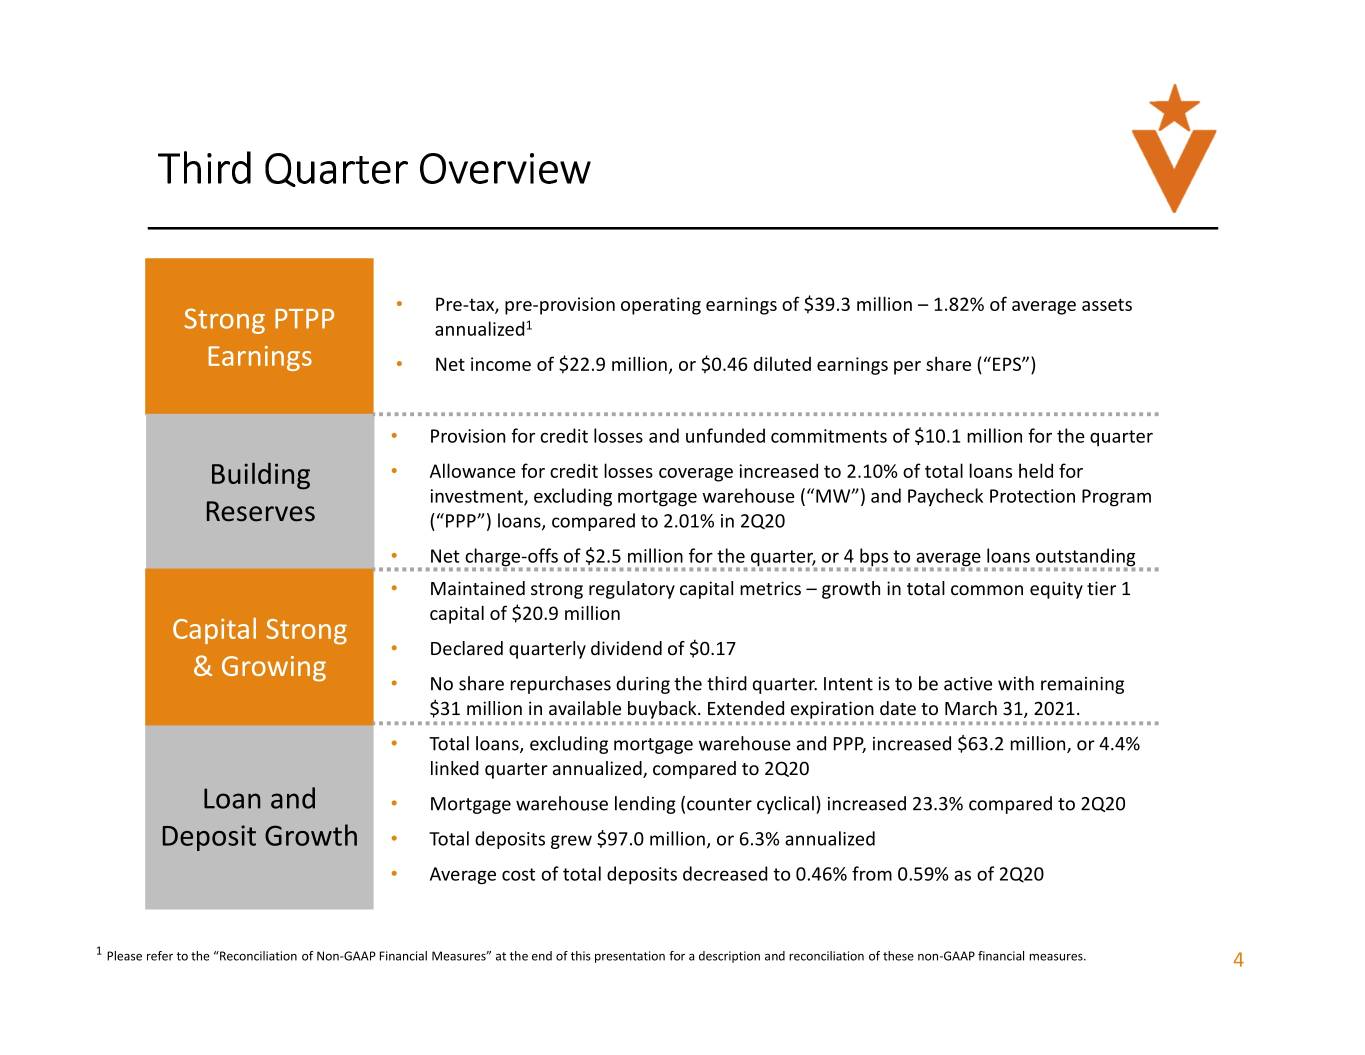
Third Quarter Overview • Pre-tax, pre-provision operating earnings of $39.3 million – 1.82% of average assets Strong PTPP annualized 1 Earnings • Net income of $22.9 million, or $0.46 diluted earnings per share (“EPS”) • Provision for credit losses and unfunded commitments of $10.1 million for the quarter Building • Allowance for credit losses coverage increased to 2.10% of total loans held for investment, excluding mortgage warehouse (“MW”) and Paycheck Protection Program Reserves (“PPP”) loans, compared to 2.01% in 2Q20 • Net charge-offs of $2.5 million for the quarter, or 4 bps to average loans outstanding • Maintained strong regulatory capital metrics – growth in total common equity tier 1 Capital Strong capital of $20.9 million • Declared quarterly dividend of $0.17 & Growing • No share repurchases during the third quarter. Intent is to be active with remaining $31 million in available buyback. Extended expiration date to March 31, 2021. • Total loans, excluding mortgage warehouse and PPP, increased $63.2 million, or 4.4% linked quarter annualized, compared to 2Q20 Loan and • Mortgage warehouse lending (counter cyclical) increased 23.3% compared to 2Q20 Deposit Growth • Total deposits grew $97.0 million, or 6.3% annualized • Average cost of total deposits decreased to 0.46% from 0.59% as of 2Q20 1 Please refer to the “Reconciliation of Non-GAAP Financial Measures” at the end of this presentation for a description and reconciliation of these non-GAAP financial measures. 4
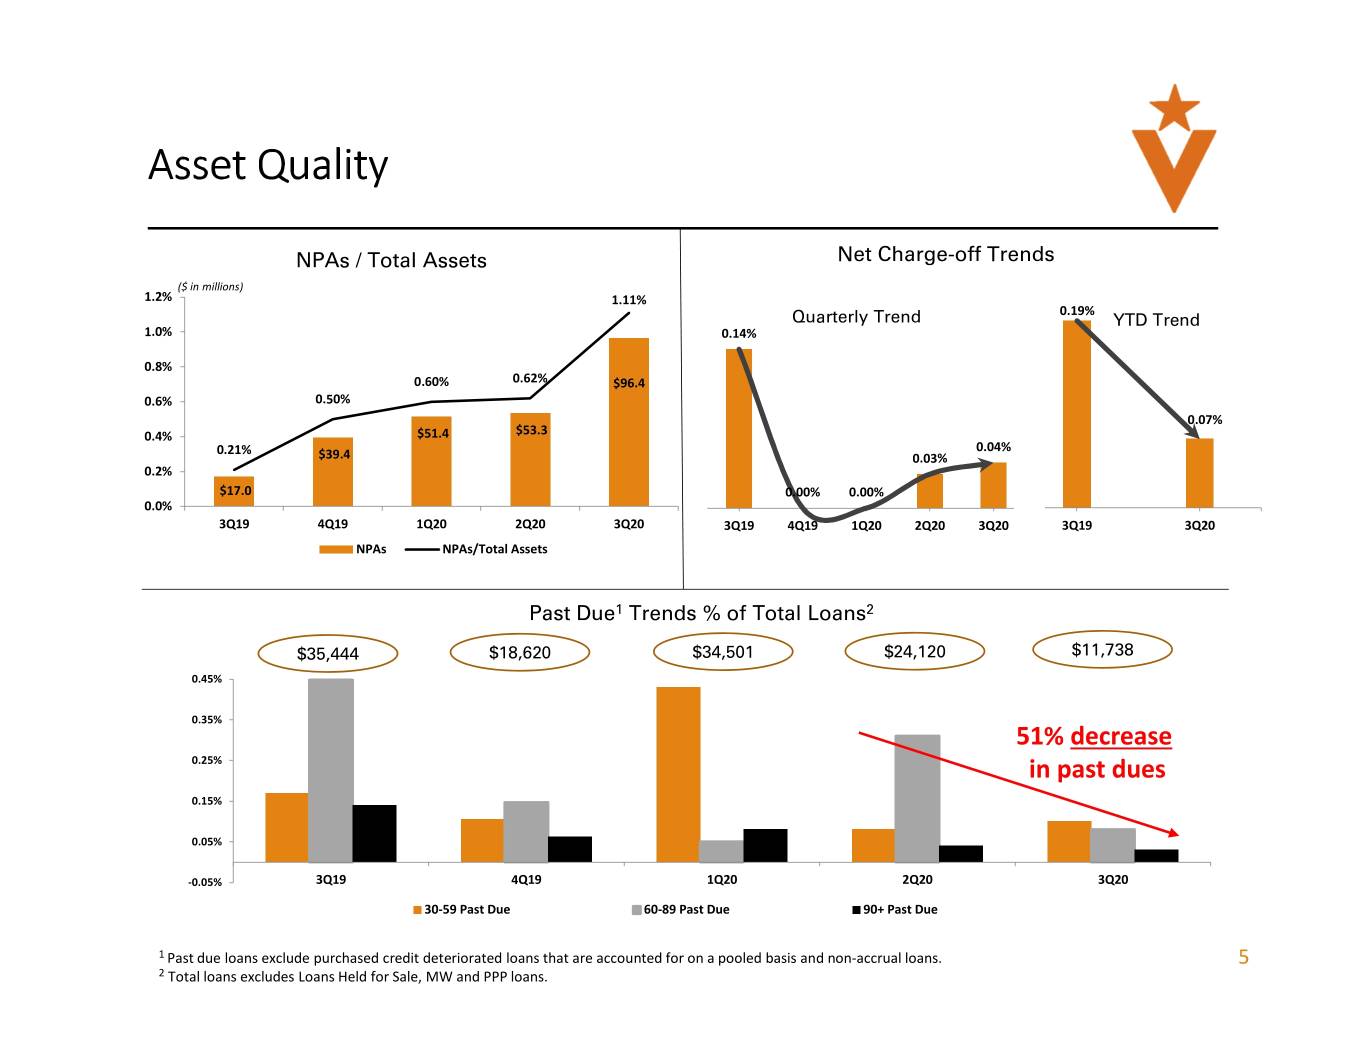
Asset Quality NPAs / Total Assets Net Charge-off Trends ($ in millions) 1.2% 1.11% 0.19% Quarterly Trend YTD Trend 1.0% 0.14% 0.8% 0.60% 0.62% $96.4 0.6% 0.50% 0.07% 0.4% $51.4 $53.3 0.21% 0.04% $39.4 0.03% 0.2% $17.0 0.00% 0.00% 0.0% 3Q19 4Q19 1Q20 2Q20 3Q20 3Q19 4Q19 1Q20 2Q20 3Q20 3Q19 3Q20 NPAs NPAs/Total Assets Past Due 1 Trends % of Total Loans 2 $35,444 $18,620 $34,501 $24,120 $11,738 0.45% 0.35% 51% decrease 0.25% in past dues 0.15% 0.05% -0.05% 3Q19 4Q19 1Q20 2Q20 3Q20 30-59 Past Due 60-89 Past Due 90+ Past Due 1 Past due loans exclude purchased credit deteriorated loans that are accounted for on a pooled basis and non-accrual loans. 5 2 Total loans excludes Loans Held for Sale, MW and PPP loans.

Financial Results
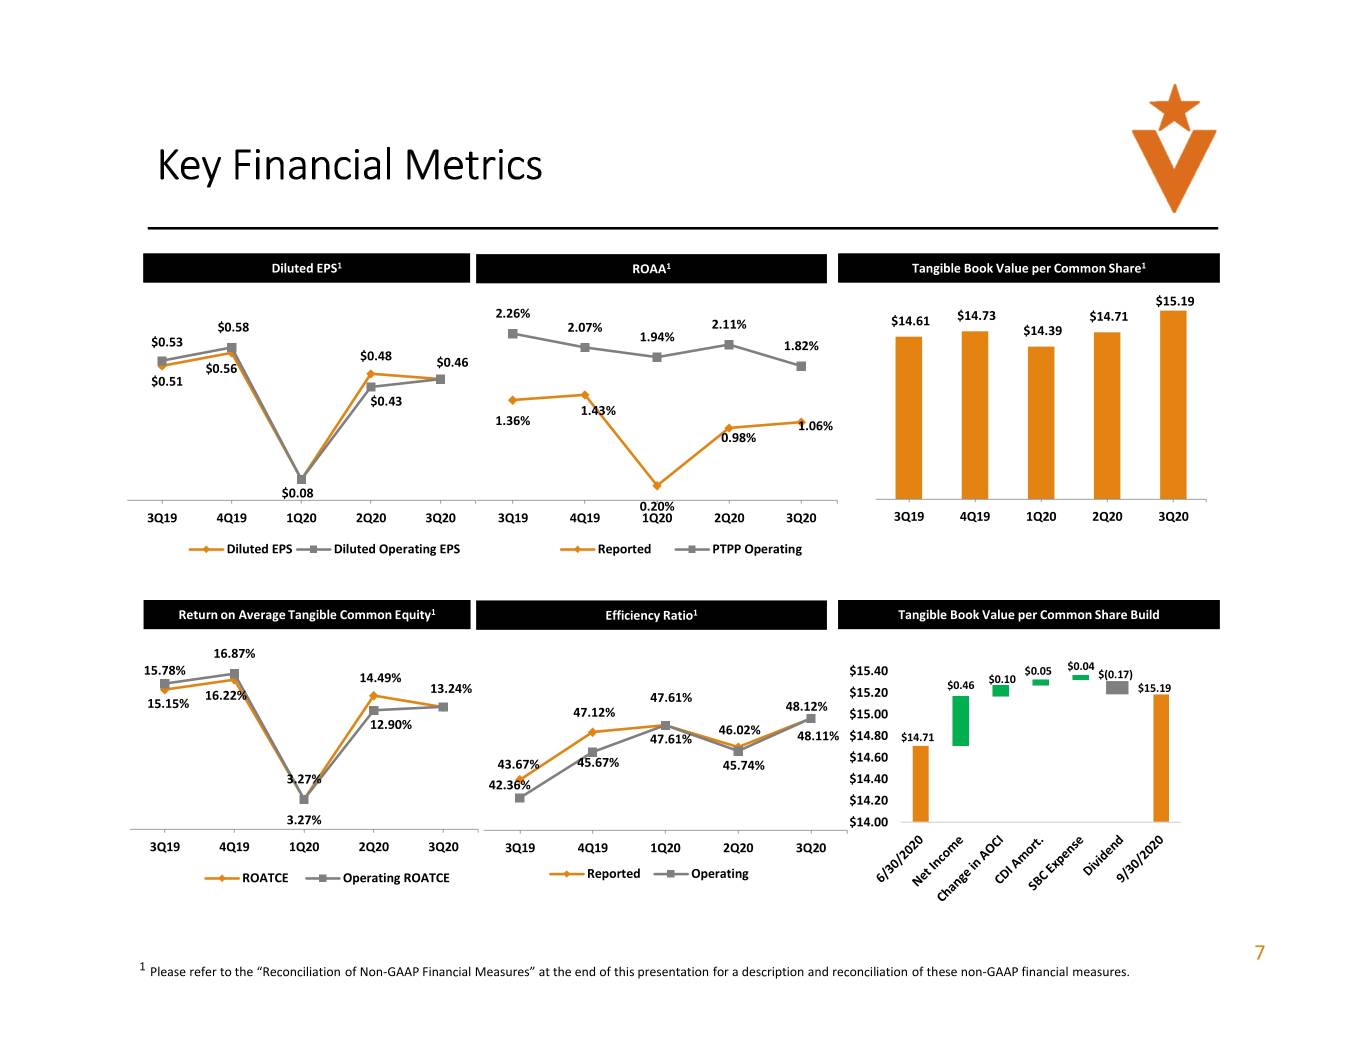
Key Financial Metrics Diluted EPS 1 ROAA 1 Tangible Book Value per Common Share 1 $15.19 2.26% $14.73 $14.71 $0.58 2.07% 2.11% $14.61 1.94% $14.39 $0.53 1.82% $0.48 $0.56 $0.46 $0.51 $0.43 1.43% 1.36% 1.06% 0.98% $0.08 0.20% 3Q19 4Q19 1Q20 2Q20 3Q20 3Q19 4Q19 1Q20 2Q20 3Q20 3Q19 4Q19 1Q20 2Q20 3Q20 Diluted EPS Diluted Operating EPS Reported PTPP Operating Return on Average Tangible Common Equity 1 Efficiency Ratio 1 Tangible Book Value per Common Share Build 16.87% 15.78% $15.40 $0.05 $0.04 14.49% $0.10 $(0.17) 13.24% $0.46 $15.19 16.22% 47.61% $15.20 15.15% 48.12% 47.12% $15.00 12.90% 46.02% 47.61% 48.11% $14.80 $14.71 $14.60 43.67% 45.67% 45.74% 3.27% 42.36% $14.40 $14.20 3.27% $14.00 3Q19 4Q19 1Q20 2Q20 3Q20 3Q19 4Q19 1Q20 2Q20 3Q20 ROATCE Operating ROATCE Reported Operating 7 1 Please refer to the “Reconciliation of Non-GAAP Financial Measures” at the end of this presentation for a description and reconciliation of these non-GAAP financial measures.
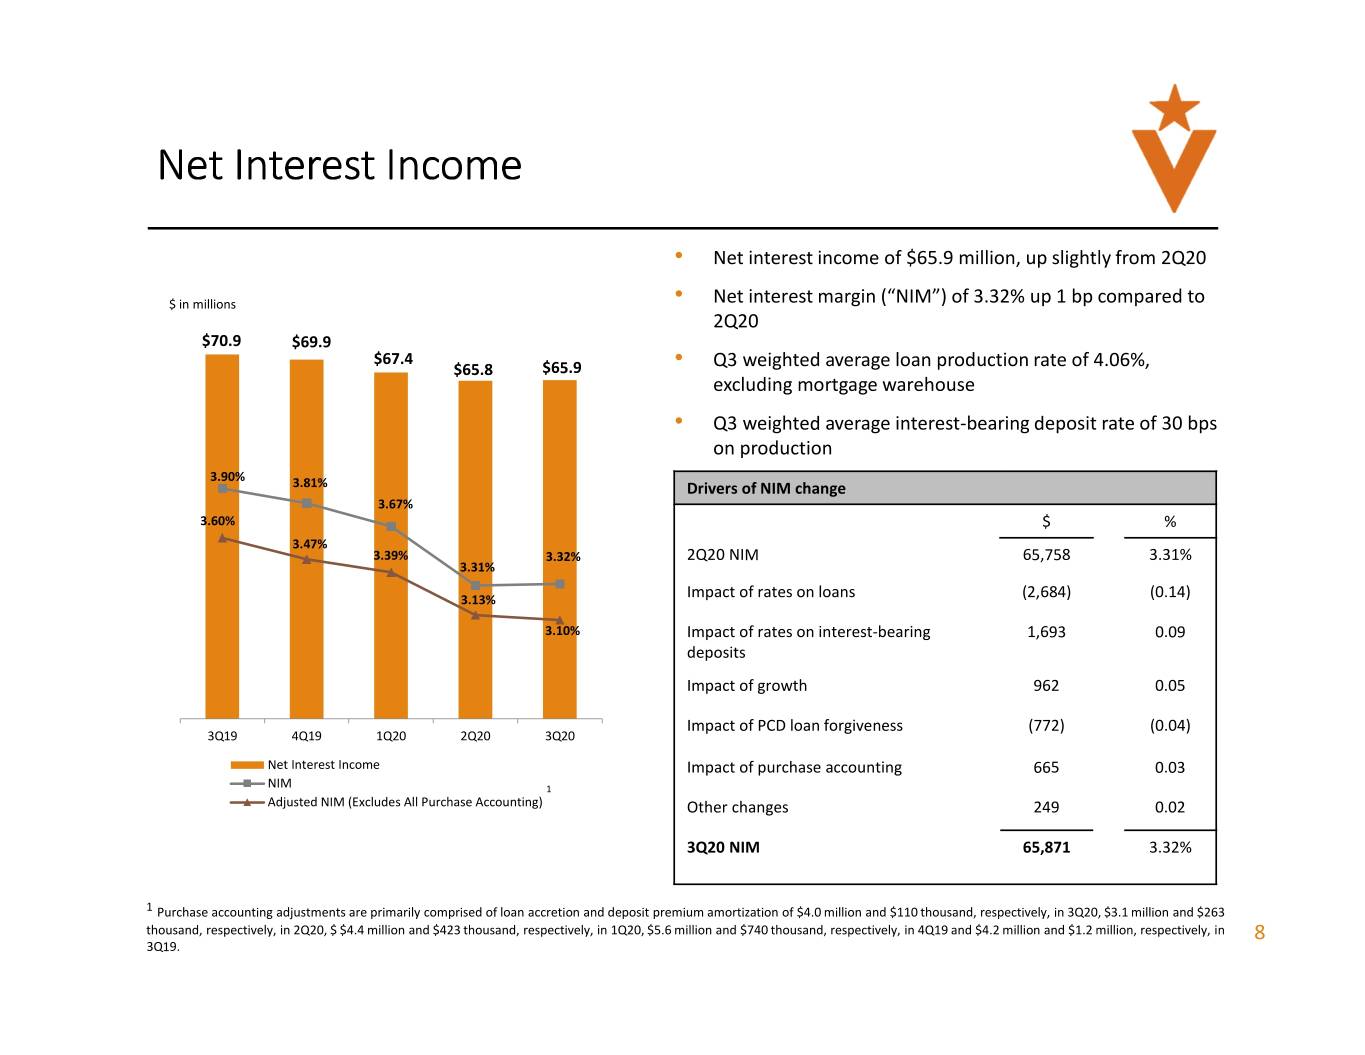
Net Interest Income • Net interest income of $65.9 million, up slightly from 2Q20 $ in millions • Net interest margin (“NIM”) of 3.32% up 1 bp compared to 2Q20 $70.9 $69.9 $67.4 $65.8 $65.9 • Q3 weighted average loan production rate of 4.06%, excluding mortgage warehouse • Q3 weighted average interest-bearing deposit rate of 30 bps on production 3.90% 3.81% Drivers of NIM change 3.67% 3.60% $ % 3.47% 3.39% 3.32% 2Q20 NIM 65,758 3.31% 3.31% 3.13% Impact of rates on loans (2,684) (0.14) 3.10% Impact of rates on interest-bearing 1,693 0.09 deposits Impact of growth 962 0.05 Impact of PCD loan forgiveness (772) (0.04) 3Q19 4Q19 1Q20 2Q20 3Q20 Net Interest Income Impact of purchase accounting 665 0.03 NIM 1 Adjusted NIM (Excludes All Purchase Accounting) Other changes 249 0.02 3Q20 NIM 65,871 3.32% 1 Purchase accounting adjustments are primarily comprised of loan accretion and deposit premium amortization of $4.0 million and $110 thousand, respectively, in 3Q20, $3.1 million and $263 thousand, respectively, in 2Q20, $ $4.4 million and $423 thousand, respectively, in 1Q20, $5.6 million and $740 thousand, respectively, in 4Q19 and $4.2 million and $1.2 million, respectively, in 8 3Q19.
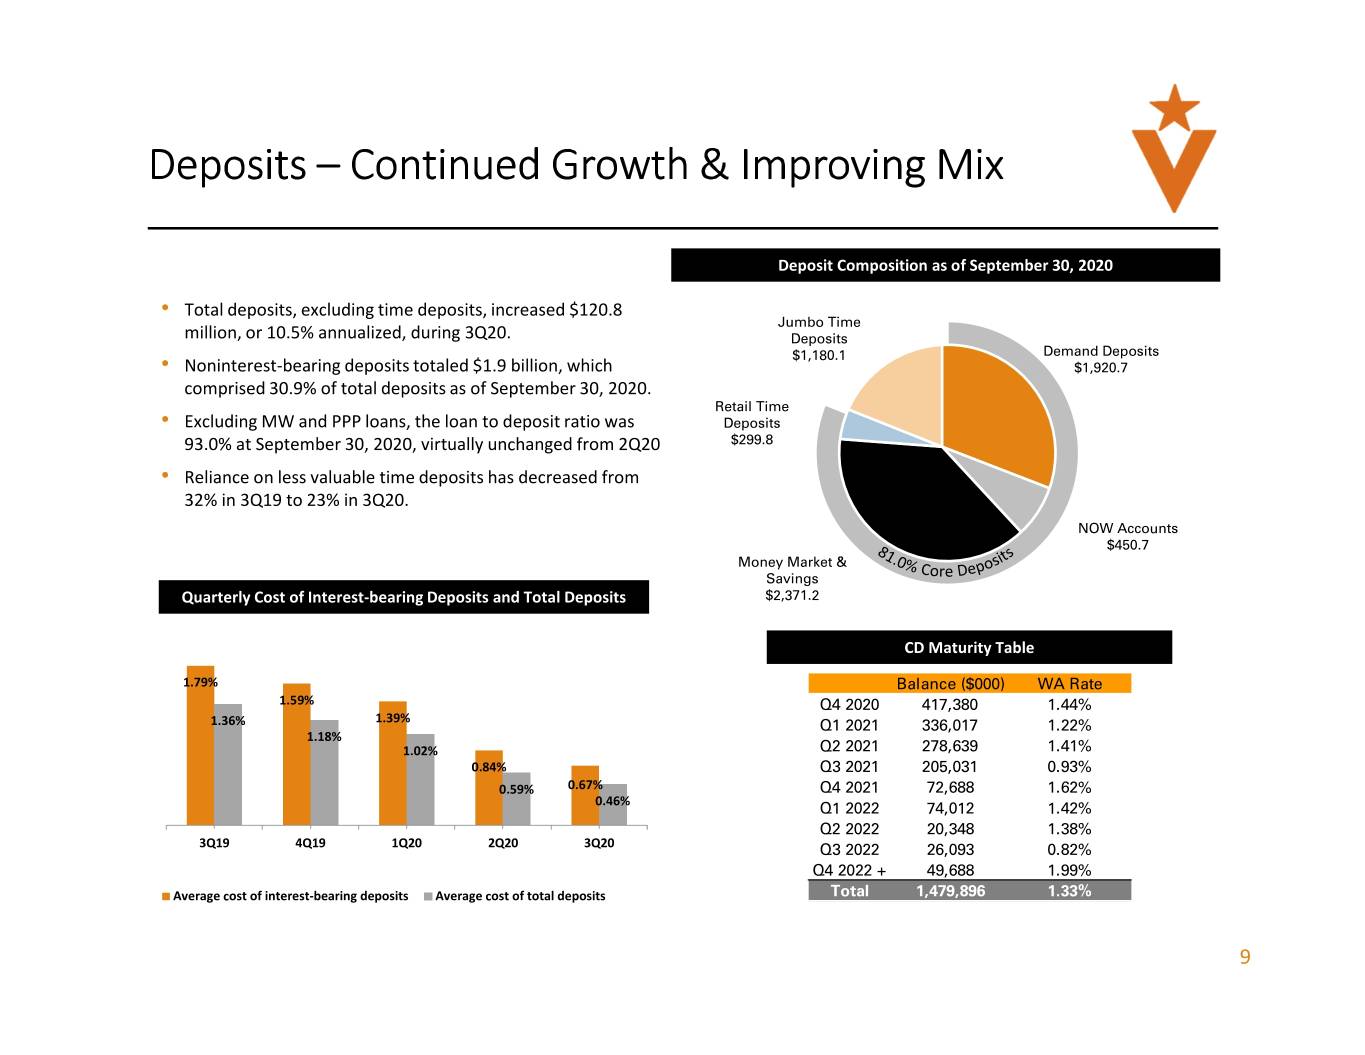
Deposits – Continued Growth & Improving Mix Deposit Composition as of September 30, 2020 • Total deposits, excluding time deposits, increased $120.8 Jumbo Time million, or 10.5% annualized, during 3Q20. Deposits $1,180.1 Demand Deposits • Noninterest-bearing deposits totaled $1.9 billion, which $1,920.7 comprised 30.9% of total deposits as of September 30, 2020. Retail Time • Excluding MW and PPP loans, the loan to deposit ratio was Deposits 93.0% at September 30, 2020, virtually unchanged from 2Q20 $299.8 • Reliance on less valuable time deposits has decreased from 32% in 3Q19 to 23% in 3Q20. NOW Accounts $450.7 Money Market & Savings Quarterly Cost of Interest-bearing Deposits and Total Deposits $2,371.2 CD Maturity Table 1.79% Balance ($000) WA Rate 1.59% Q4 2020 417,380 1.44% 1.39% 1.36% Q1 2021 336,017 1.22% 1.18% 1.02% Q2 2021 278,639 1.41% 0.84% Q3 2021 205,031 0.93% 0.59% 0.67% Q4 2021 72,688 1.62% 0.46% Q1 2022 74,012 1.42% Q2 2022 20,348 1.38% 3Q19 4Q19 1Q20 2Q20 3Q20 Q3 2022 26,093 0.82% Q4 2022 + 49,688 1.99% Average cost of interest-bearing deposits Average cost of total deposits Total 1,479,896 1.33% 9
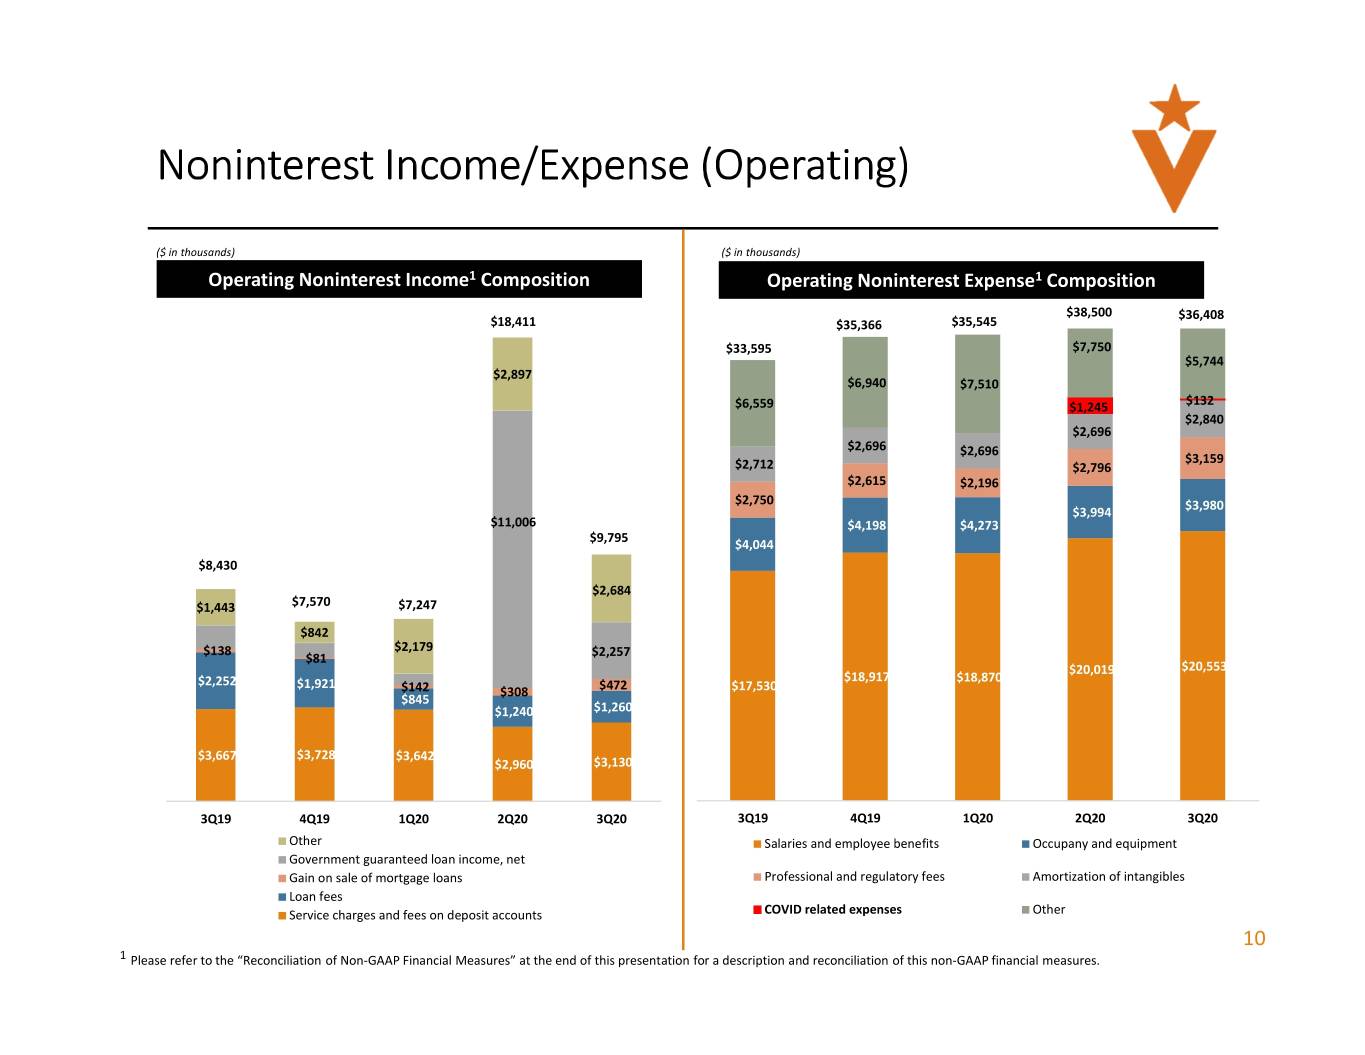
Noninterest Income/Expense (Operating) ($ in thousands) ($ in thousands) Operating Noninterest Income 1 Composition Operating Noninterest Expense 1 Composition $38,500 $36,408 $18,411 $35,366 $35,545 $33,595 $7,750 $5,744 $2,897 $6,940 $7,510 $6,559 $1,245 $132 $2,840 $2,696 $2,696 $2,696 $3,159 $2,712 $2,796 $2,615 $2,196 $2,750 $3,980 $3,994 $11,006 $4,198 $4,273 $9,795 $4,044 $8,430 $2,684 $1,443 $7,570 $7,247 $842 $138 $2,179 $81 $2,257 $20,019 $20,553 $2,252 $1,921 $18,917 $18,870 $142 $308 $472 $17,530 $845 $1,240 $1,260 $3,667 $3,728 $3,642 $2,960 $3,130 3Q19 4Q19 1Q20 2Q20 3Q20 3Q19 4Q19 1Q20 2Q20 3Q20 Other Salaries and employee benefits Occupany and equipment Government guaranteed loan income, net Gain on sale of mortgage loans Professional and regulatory fees Amortization of intangibles Loan fees Service charges and fees on deposit accounts COVID related expenses Other 10 1 Please refer to the “Reconciliation of Non-GAAP Financial Measures” at the end of this presentation for a description and reconciliation of this non-GAAP financial measures.
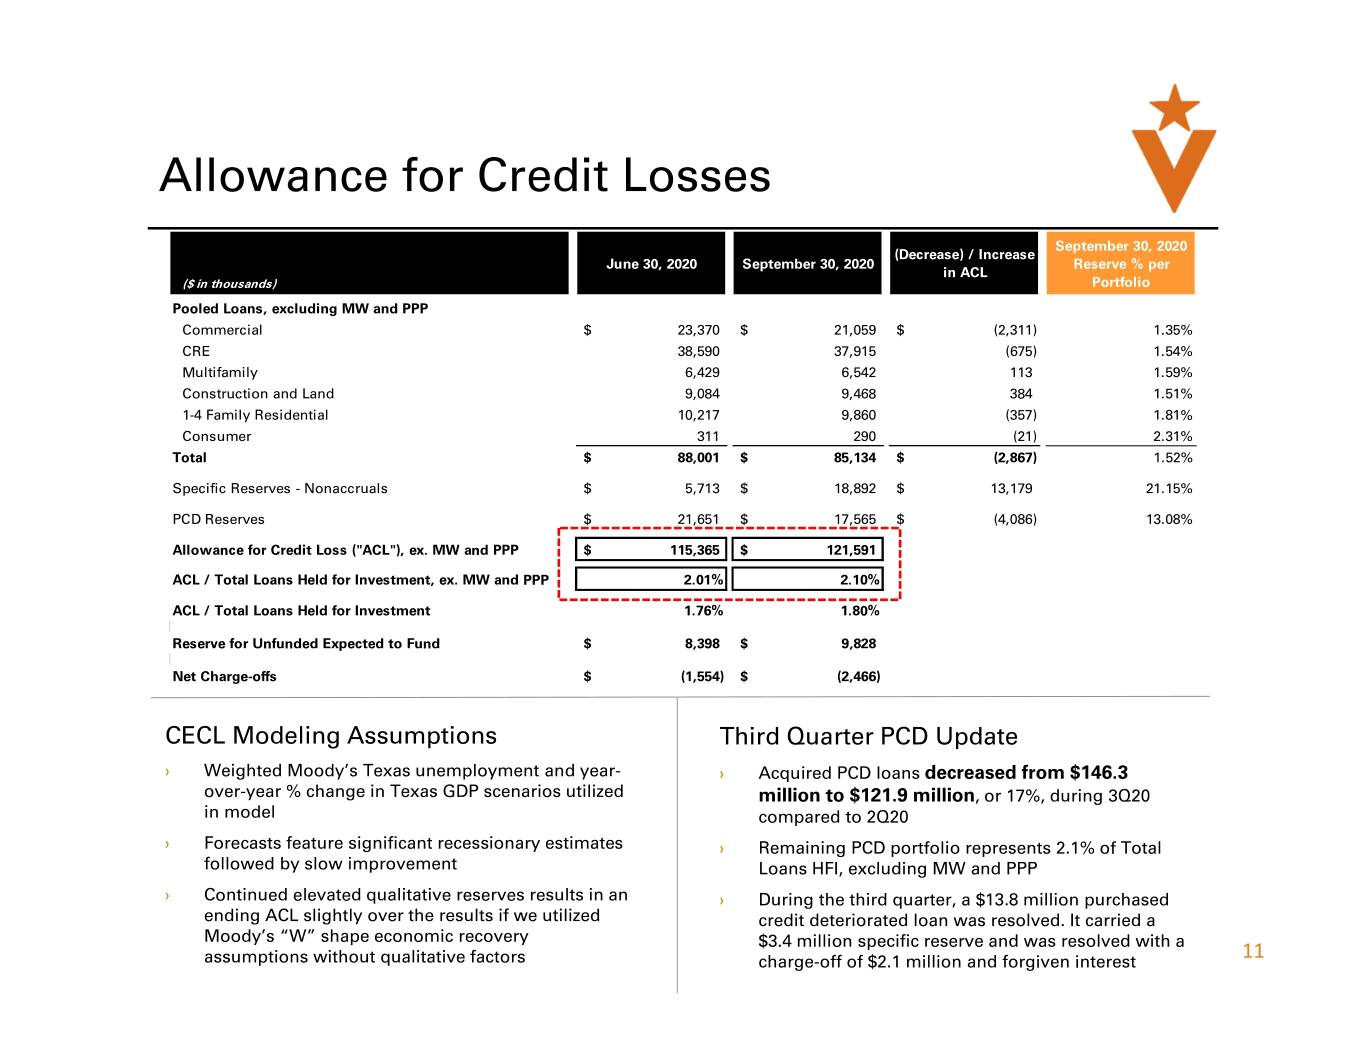
Allowance for Credit Losses September 30, 2020 (Decrease) / Increase June 30, 2020 September 30, 2020 Reserve % per in ACL ($ in thousands) Portfolio Pooled Loans, excluding MW and PPP Commercial $ 23,370 $ 21,059 $ (2,311) 1.35% CRE 38,590 37,915 (675) 1.54% Multifamily 6,429 6,542 113 1.59% Construction and Land 9,084 9,468 384 1.51% 1-4 Family Residential 10,217 9,860 (357) 1.81% Consumer 311 290 (21) 2.31% Total $ 88,001 $ 85,134 $ (2,867) 1.52% Specific Reserves - Nonaccruals $ 5,713 $ 18,892 $ 13,179 21.15% PCD Reserves $ 21,651 $ 17,565 $ (4,086) 13.08% Allowance for Credit Loss ("ACL"), ex. MW and PPP$ 115,365 $ 121,591 ACL / Total Loans Held for Investment, ex. MW and PPP 2.01% 2.10% ACL / Total Loans Held for Investment 1.76% 1.80% Reserve for Unfunded Expected to Fund $ 8,398 $ 9,828 Net Charge-offs $ (1,554) $ (2,466) CECL Modeling Assumptions Third Quarter PCD Update › Weighted Moody’s Texas unemployment and year- › Acquired PCD loans decreased from $146.3 over-year % change in Texas GDP scenarios utilized million to $121.9 million , or 17%, during 3Q20 in model compared to 2Q20 › Forecasts feature significant recessionary estimates › Remaining PCD portfolio represents 2.1% of Total followed by slow improvement Loans HFI, excluding MW and PPP › Continued elevated qualitative reserves results in an › During the third quarter, a $13.8 million purchased ending ACL slightly over the results if we utilized credit deteriorated loan was resolved. It carried a Moody’s “W” shape economic recovery $3.4 million specific reserve and was resolved with a 11 assumptions without qualitative factors charge-off of $2.1 million and forgiven interest

Capital and Liquidity
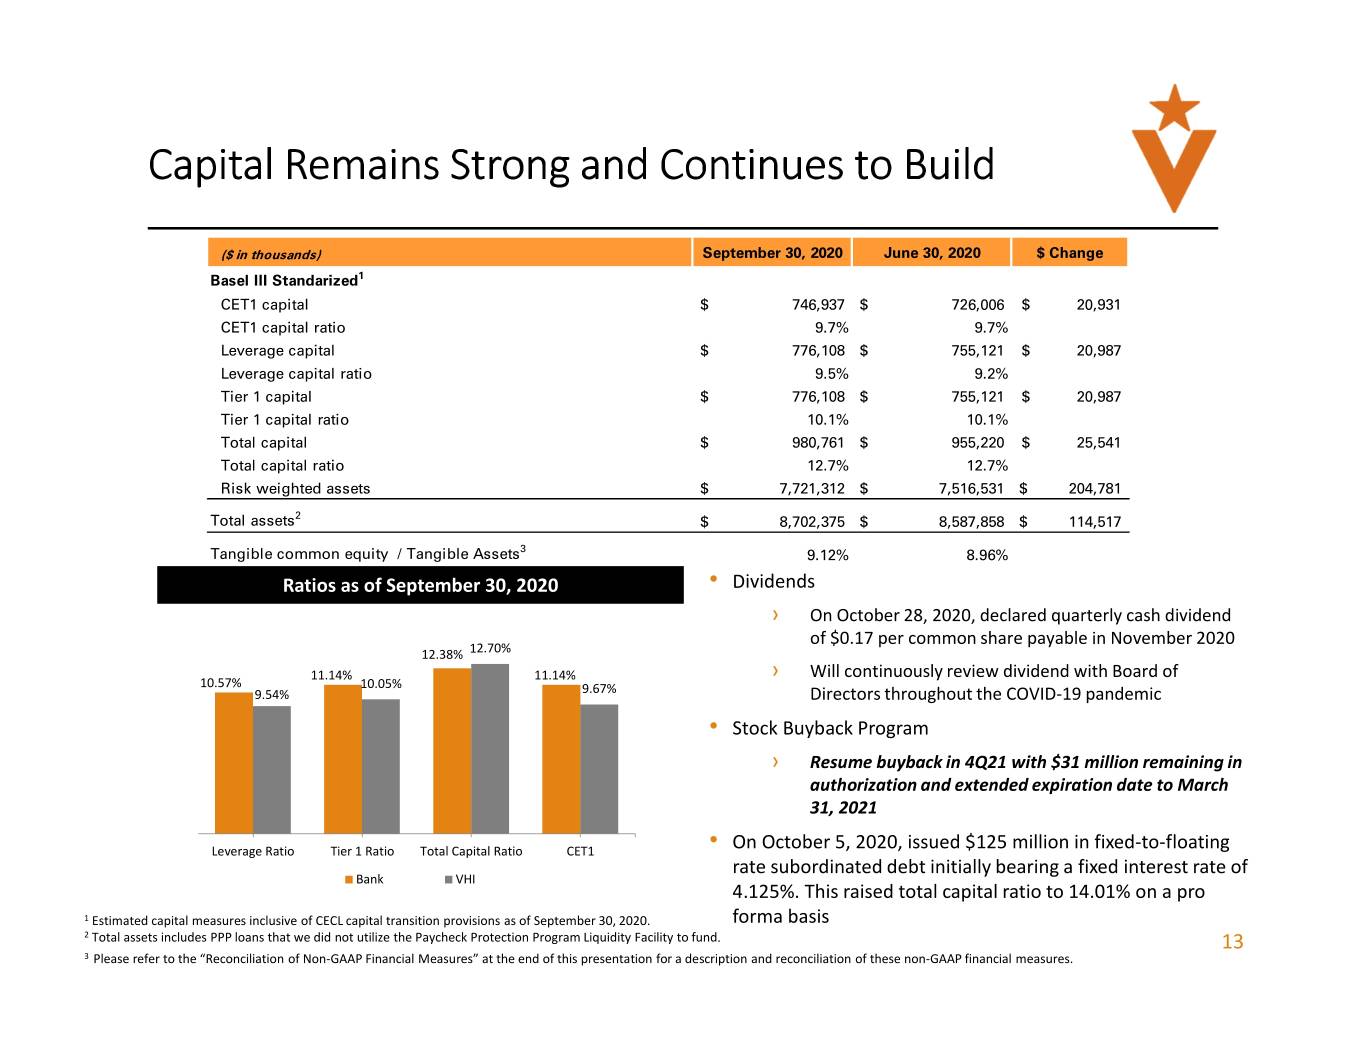
Capital Remains Strong and Continues to Build ($ in thousands) September 30, 2020 June 30, 2020 $ Change Basel III Standarized 1 CET1 capital $ 746,937 $ 726,006 $ 20,931 CET1 capital ratio 9.7% 9.7% Leverage capital $ 776,108 $ 755,121 $ 20,987 Leverage capital ratio 9.5% 9.2% Tier 1 capital $ 776,108 $ 755,121 $ 20,987 Tier 1 capital ratio 10.1% 10.1% Total capital $ 980,761 $ 955,220 $ 25,541 Total capital ratio 12.7% 12.7% Risk weighted assets $ 7,721,312 $ 7,516,531 $ 204,781 Total assets 2 $ 8,702,375 $ 8,587,858 $ 114,517 Tangible common equity / Tangible Assets 3 9.12% 8.96% Ratios as of September 30, 2020 • Dividends › On October 28, 2020, declared quarterly cash dividend of $0.17 per common share payable in November 2020 12.38% 12.70% 11.14% 11.14% › Will continuously review dividend with Board of 10.57% 10.05% 9.54% 9.67% Directors throughout the COVID-19 pandemic • Stock Buyback Program › Resume buyback in 4Q21 with $31 million remaining in authorization and extended expiration date to March 31, 2021 Leverage Ratio Tier 1 Ratio Total Capital Ratio CET1 • On October 5, 2020, issued $125 million in fixed-to-floating rate subordinated debt initially bearing a fixed interest rate of Bank VHI 4.125%. This raised total capital ratio to 14.01% on a pro 1 Estimated capital measures inclusive of CECL capital transition provisions as of September 30, 2020. forma basis 2 Total assets includes PPP loans that we did not utilize the Paycheck Protection Program Liquidity Facility to fund. 13 3 Please refer to the “Reconciliation of Non-GAAP Financial Measures” at the end of this presentation for a description and reconciliation of these non-GAAP financial measures.
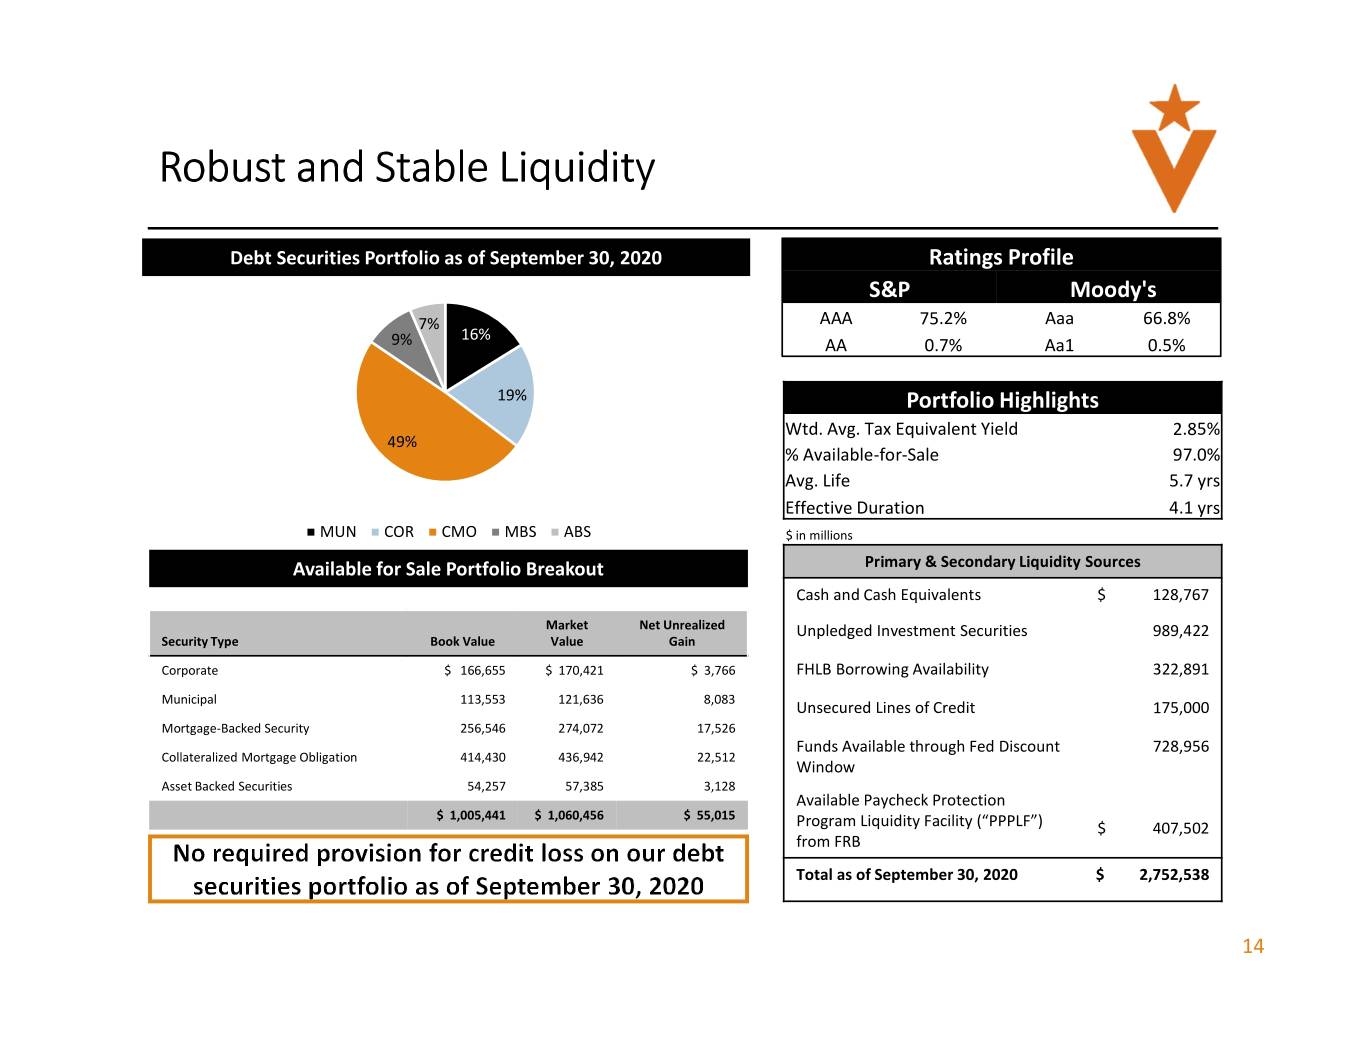
Robust and Stable Liquidity Debt Securities Portfolio as of September 30, 2020 Ratings Profile S&P Moody's 7% AAA 75.2% Aaa 66.8% 16% 9% AA 0.7% Aa1 0.5% 19% Portfolio Highlights Wtd. Avg. Tax Equivalent Yield 2.85% 49% % Available-for-Sale 97.0% Avg. Life 5.7 yrs Effective Duration 4.1 yrs MUN COR CMO MBS ABS $ in millions Available for Sale Portfolio Breakout Primary & Secondary Liquidity Sources Cash and Cash Equivalents $ 128,767 Market Net Unrealized Unpledged Investment Securities 989,422 Security Type Book Value Value Gain Corporate $ 166,655 $ 170,421 $ 3,766 FHLB Borrowing Availability 322,891 Municipal 113,553 121,636 8,083 Unsecured Lines of Credit 175,000 Mortgage-Backed Security 256,546 274,072 17,526 Funds Available through Fed Discount 728,956 Collateralized Mortgage Obligation 414,430 436,942 22,512 Window Asset Backed Securities 54,257 57,385 3,128 Available Paycheck Protection $ 1,005,441 $ 1,060,456 $ 55,015 Program Liquidity Facility (“PPPLF”) $ 407,502 from FRB Total as of September 30, 2020 $ 2,752,538 14

Credit Outlook
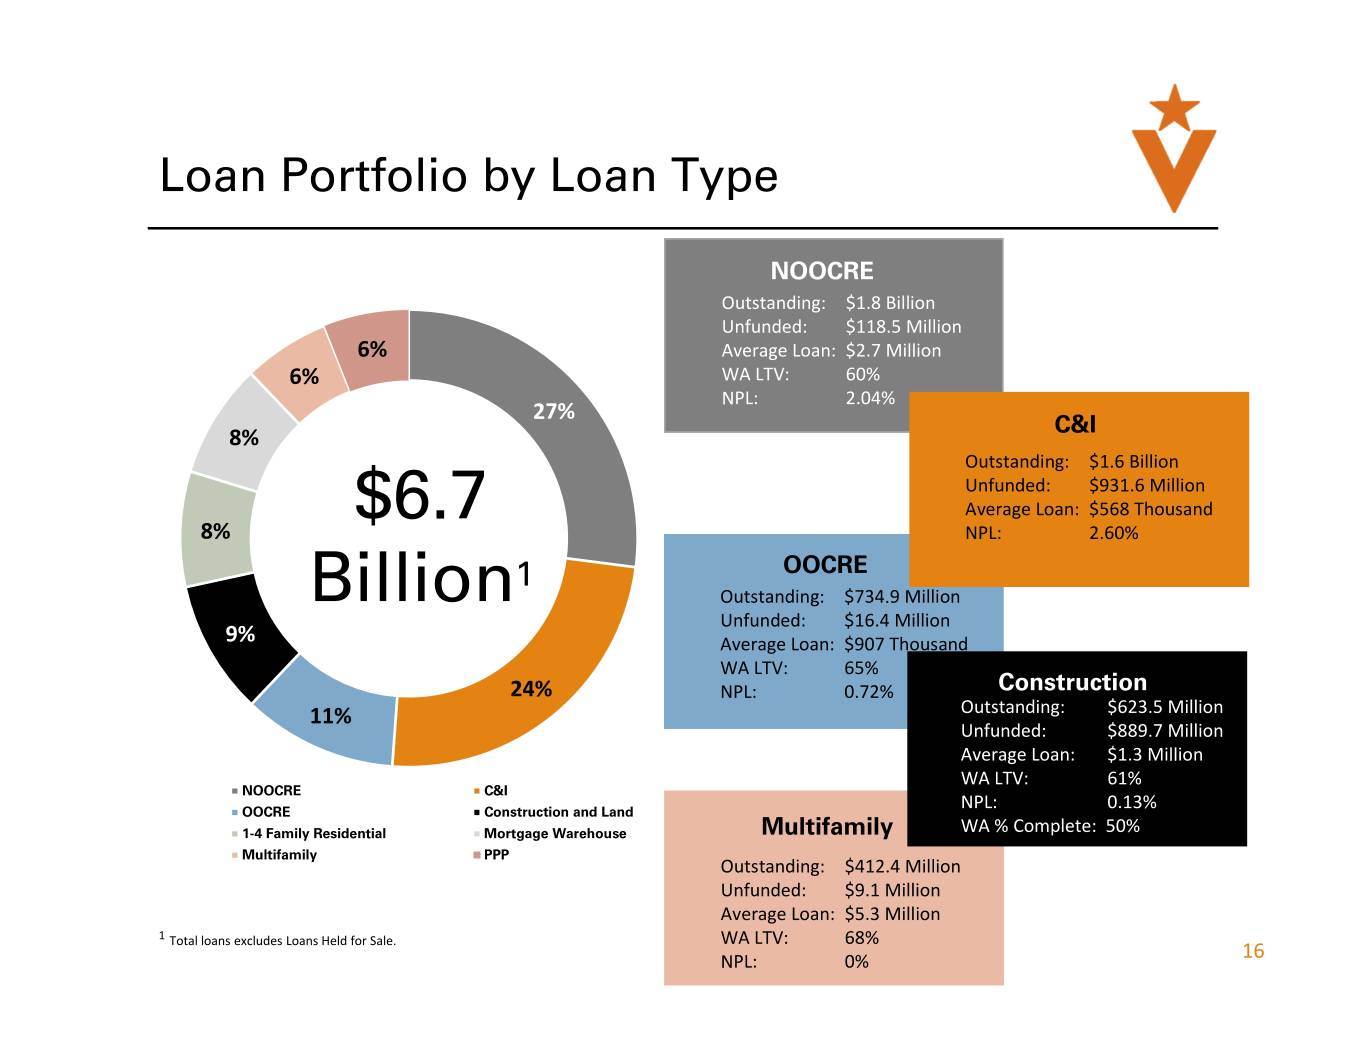
Loan Portfolio by Loan Type NOOCRE Outstanding: $1.8 Billion Unfunded: $118.5 Million 6% Average Loan: $2.7 Million 6% WA LTV: 60% NPL: 2.04% 27% C&I 8% Outstanding: $1.6 Billion Unfunded: $931.6 Million $6.7 Average Loan: $568 Thousand 8% NPL: 2.60% 1 OOCRE Billion Outstanding: $734.9 Million Unfunded: $16.4 Million 9% Average Loan: $907 Thousand WA LTV: 65% 24% NPL: 0.72% Construction 11% Outstanding: $623.5 Million Unfunded: $889.7 Million Average Loan: $1.3 Million WA LTV: 61% NOOCRE C&I NPL: 0.13% OOCRE Construction and Land 1-4 Family Residential Mortgage Warehouse Multifamily WA % Complete: 50% Multifamily PPP Outstanding: $412.4 Million Unfunded: $9.1 Million Average Loan: $5.3 Million 1 Total loans excludes Loans Held for Sale. WA LTV: 68% NPL: 0% 16
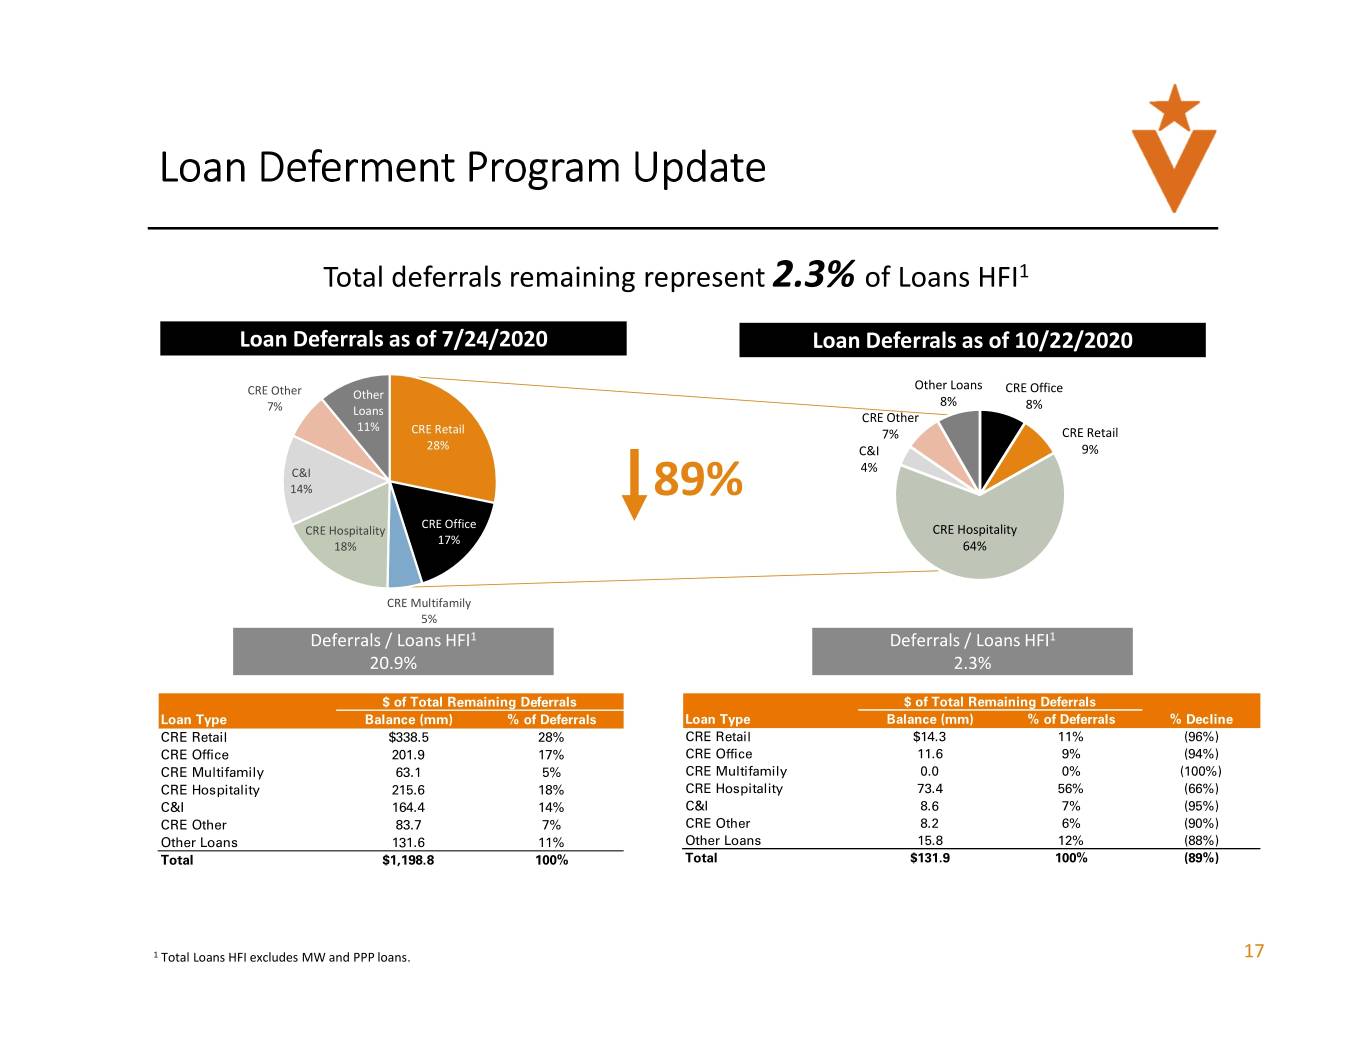
Loan Deferment Program Update Total deferrals remaining represent 2.3% of Loans HFI 1 Loan Deferrals as of 7/24/2020 Loan Deferrals as of 10/22/2020 Other Loans CRE Other Other CRE Office 7% 8% 8% Loans CRE Other 11% CRE Retail 7% CRE Retail 28% C&I 9% C&I 4% 14% 89% CRE Office CRE Hospitality CRE Hospitality 17% 18% 64% CRE Multifamily 5% Deferrals / Loans HFI 1 Deferrals / Loans HFI 1 20.9% 2.3% $ of Total Remaining Deferrals $ of Total Remaining Deferrals Loan Type Balance (mm) % of Deferrals Loan Type Balance (mm) % of Deferrals % Decline CRE Retail $338.5 28% CRE Retail $14.3 11% (96%) CRE Office 201.9 17% CRE Office 11.6 9% (94%) CRE Multifamily 63.1 5% CRE Multifamily 0.0 0% (100%) CRE Hospitality 215.6 18% CRE Hospitality 73.4 56% (66%) C&I 164.4 14% C&I 8.6 7% (95%) CRE Other 83.7 7% CRE Other 8.2 6% (90%) Other Loans 131.6 11% Other Loans 15.8 12% (88%) Total $1,198.8 100% Total $131.9 100% (89%) 1 Total Loans HFI excludes MW and PPP loans. 17
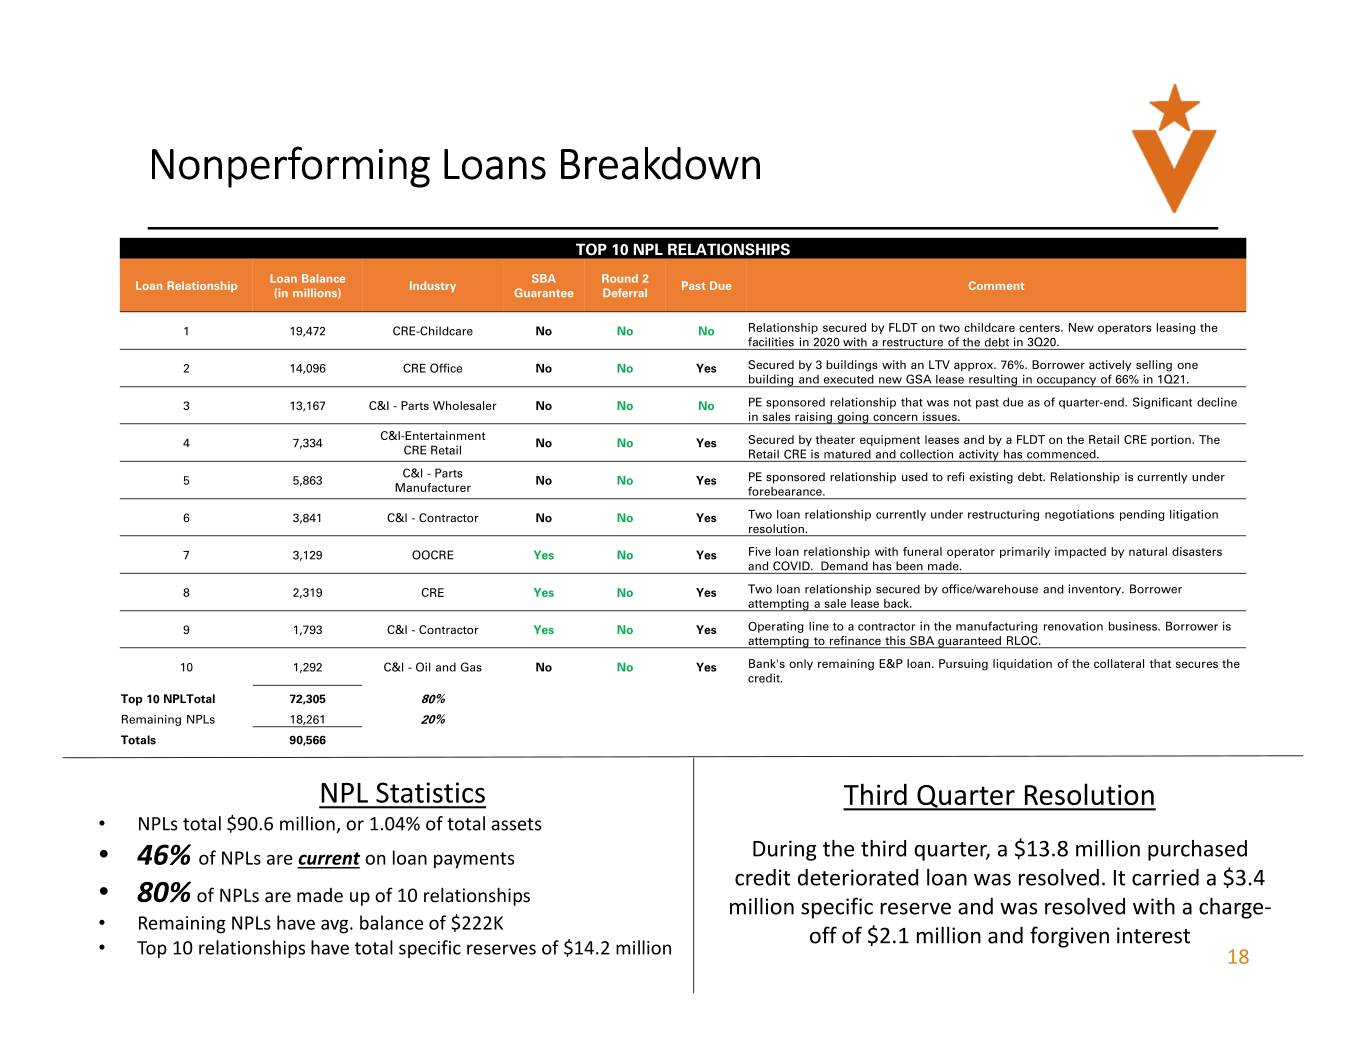
Nonperforming Loans Breakdown TOP 10 NPL RELATIONSHIPS Loan Balance SBA Round 2 Loan Relationship Industry Past Due Comment (in millions) Guarantee Deferral 1 19,472 CRE-Childcare No No No Relationship secured by FLDT on two childcare centers. New operators leasing the facilities in 2020 with a restructure of the debt in 3Q20. 2 14,096 CRE Office No No Yes Secured by 3 buildings with an LTV approx. 76%. Borrower actively selling one building and executed new GSA lease resulting in occupancy of 66% in 1Q21. 3 13,167 C&I - Parts Wholesaler No No No PE sponsored relationship that was not past due as of quarter-end. Significant decline in sales raising going concern issues. C&I-Entertainment 4 7,334 No No Yes Secured by theater equipment leases and by a FLDT on the Retail CRE portion. The CRE Retail Retail CRE is matured and collection activity has commenced. C&I - Parts 5 5,863 No No Yes PE sponsored relationship used to refi existing debt. Relationship is currently under Manufacturer forebearance. 6 3,841 C&I - Contractor No No Yes Two loan relationship currently under restructuring negotiations pending litigation resolution. 7 3,129 OOCRE Yes No Yes Five loan relationship with funeral operator primarily impacted by natural disasters and COVID. Demand has been made. 8 2,319 CRE Yes No Yes Two loan relationship secured by office/warehouse and inventory. Borrower attempting a sale lease back. 9 1,793 C&I - Contractor Yes No Yes Operating line to a contractor in the manufacturing renovation business. Borrower is attempting to refinance this SBA guaranteed RLOC. 10 1,292 C&I - Oil and Gas No No Yes Bank's only remaining E&P loan. Pursuing liquidation of the collateral that secures the credit. Top 10 NPLTotal 72,305 80% Remaining NPLs 18,261 20% Totals 90,566 NPL Statistics Third Quarter Resolution • NPLs total $90.6 million, or 1.04% of total assets • 46% of NPLs are current on loan payments During the third quarter, a $13.8 million purchased credit deteriorated loan was resolved. It carried a $3.4 • 80% of NPLs are made up of 10 relationships million specific reserve and was resolved with a charge- Remaining NPLs have avg. balance of $222K • off of $2.1 million and forgiven interest • Top 10 relationships have total specific reserves of $14.2 million 18
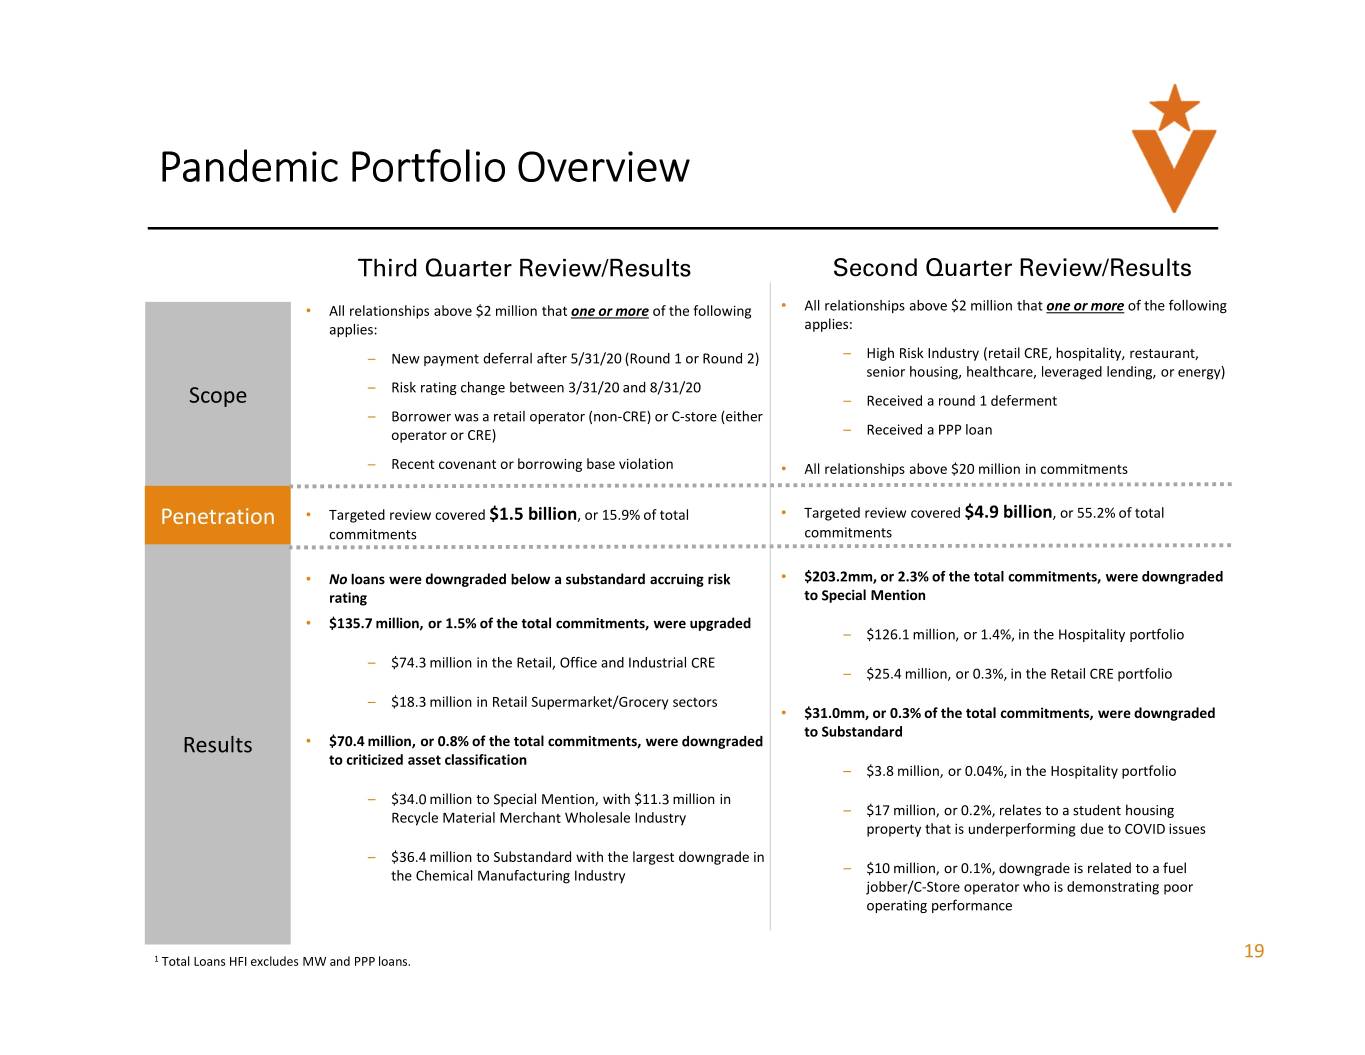
Pandemic Portfolio Overview Third Quarter Review/Results Second Quarter Review/Results • All relationships above $2 million that one or more of the following • All relationships above $2 million that one or more of the following applies: applies: – New payment deferral after 5/31/20 (Round 1 or Round 2) – High Risk Industry (retail CRE, hospitality, restaurant, senior housing, healthcare, leveraged lending, or energy) – Risk rating change between 3/31/20 and 8/31/20 Scope – Received a round 1 deferment – Borrower was a retail operator (non-CRE) or C-store (either operator or CRE) – Received a PPP loan – Recent covenant or borrowing base violation • All relationships above $20 million in commitments Penetration • Targeted review covered $1.5 billion , or 15.9% of total • Targeted review covered $4.9 billion , or 55.2% of total commitments commitments • No loans were downgraded below a substandard accruing risk • $203.2mm, or 2.3% of the total commitments, were downgraded rating to Special Mention • $135.7 million, or 1.5% of the total commitments, were upgraded – $126.1 million, or 1.4%, in the Hospitality portfolio – $74.3 million in the Retail, Office and Industrial CRE – $25.4 million, or 0.3%, in the Retail CRE portfolio – $18.3 million in Retail Supermarket/Grocery sectors • $31.0mm, or 0.3% of the total commitments, were downgraded to Substandard Results • $70.4 million, or 0.8% of the total commitments, were downgraded to criticized asset classification – $3.8 million, or 0.04%, in the Hospitality portfolio – $34.0 million to Special Mention, with $11.3 million in Recycle Material Merchant Wholesale Industry – $17 million, or 0.2%, relates to a student housing property that is underperforming due to COVID issues – $36.4 million to Substandard with the largest downgrade in the Chemical Manufacturing Industry – $10 million, or 0.1%, downgrade is related to a fuel jobber/C-Store operator who is demonstrating poor operating performance 19 1 Total Loans HFI excludes MW and PPP loans.
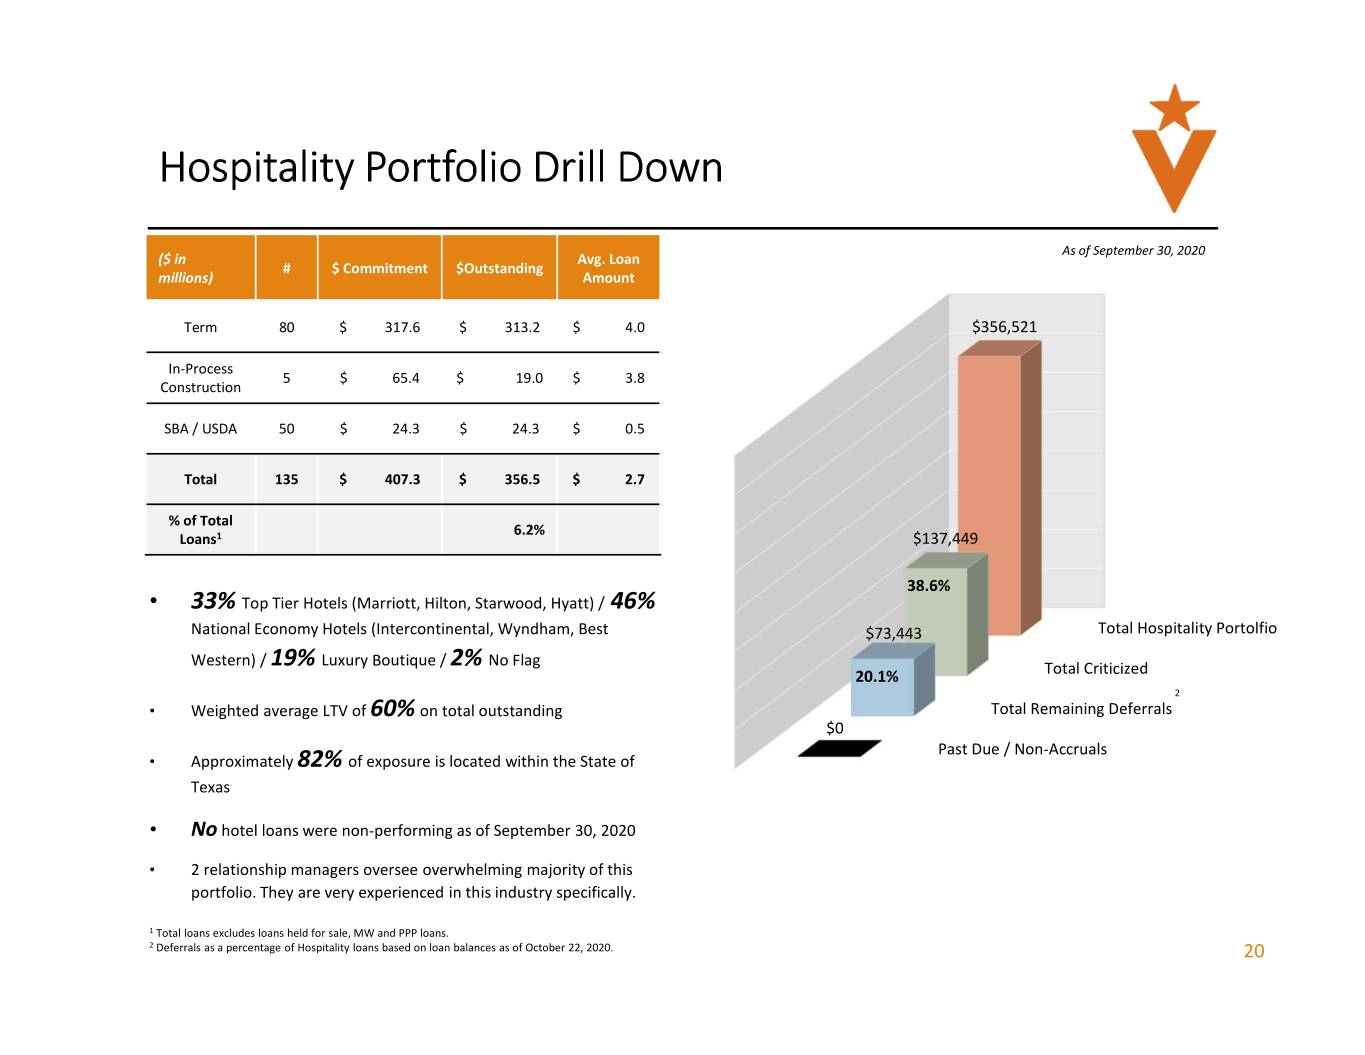
Hospitality Portfolio Drill Down As of September 30, 2020 ($ in Avg. Loan # $ Commitment $Outstanding millions) Amount Term 80 $ 317.6 $ 313.2 $ 4.0 $356,521 In-Process 5 $ 65.4 $ 19.0 $ 3.8 Construction SBA / USDA 50 $ 24.3 $ 24.3 $ 0.5 Total 135 $ 407.3 $ 356.5 $ 2.7 % of Total 6.2% Loans 1 $137,449 38.6% • 33% Top Tier Hotels (Marriott, Hilton, Starwood, Hyatt) / 46% National Economy Hotels (Intercontinental, Wyndham, Best $73,443 Total Hospitality Portolfio Western) / 19% Luxury Boutique / 2% No Flag 20.1% Total Criticized 2 • Weighted average LTV of 60% on total outstanding Total Remaining Deferrals $0 Past Due / Non-Accruals • Approximately 82% of exposure is located within the State of Texas • No hotel loans were non-performing as of September 30, 2020 • 2 relationship managers oversee overwhelming majority of this portfolio. They are very experienced in this industry specifically. 1 Total loans excludes loans held for sale, MW and PPP loans. 2 Deferrals as a percentage of Hospitality loans based on loan balances as of October 22, 2020. 20
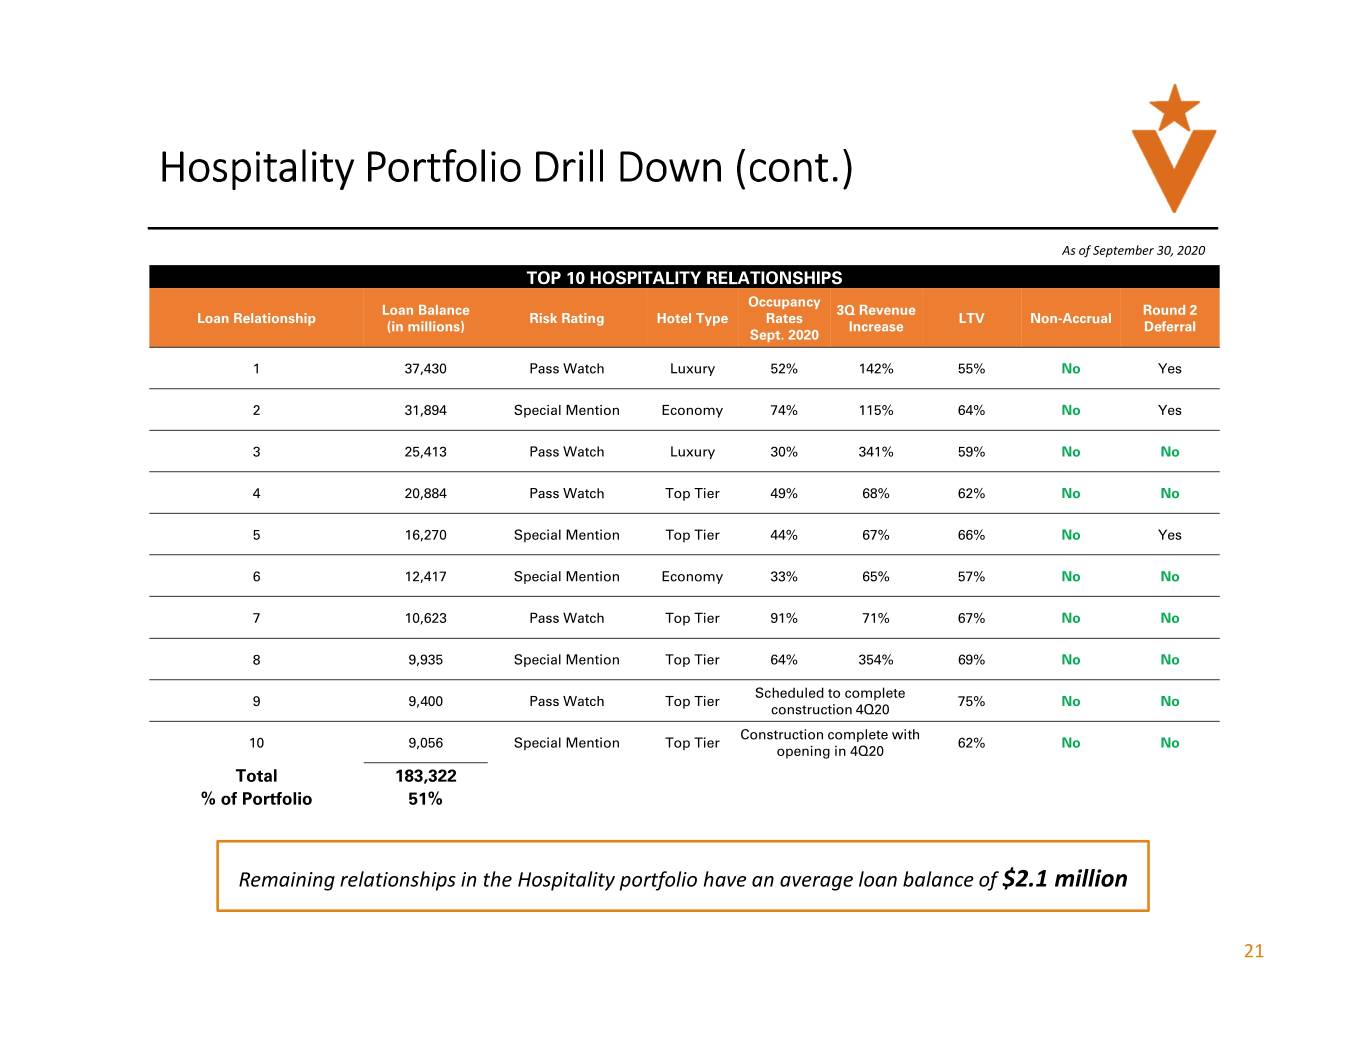
Hospitality Portfolio Drill Down (cont.) As of September 30, 2020 TOP 10 HOSPITALITY RELATIONSHIPS Occupancy Loan Balance 3Q Revenue Round 2 Loan Relationship Risk Rating Hotel Type Rates LTV Non-Accrual (in millions) Increase Deferral Sept. 2020 1 37,430 Pass Watch Luxury 52% 142% 55% No Yes 2 31,894 Special Mention Economy 74% 115% 64% No Yes 3 25,413 Pass Watch Luxury 30% 341% 59% No No 4 20,884 Pass Watch Top Tier 49% 68% 62% No No 5 16,270 Special Mention Top Tier 44% 67% 66% No Yes 6 12,417 Special Mention Economy 33% 65% 57% No No 7 10,623 Pass Watch Top Tier 91% 71% 67% No No 8 9,935 Special Mention Top Tier 64% 354% 69% No No Scheduled to complete 9 9,400 Pass Watch Top Tier 75% No No construction 4Q20 Construction complete with 10 9,056 Special Mention Top Tier 62% No No opening in 4Q20 Total 183,322 % of Portfolio 51% Remaining relationships in the Hospitality portfolio have an average loan balance of $2.1 million 21
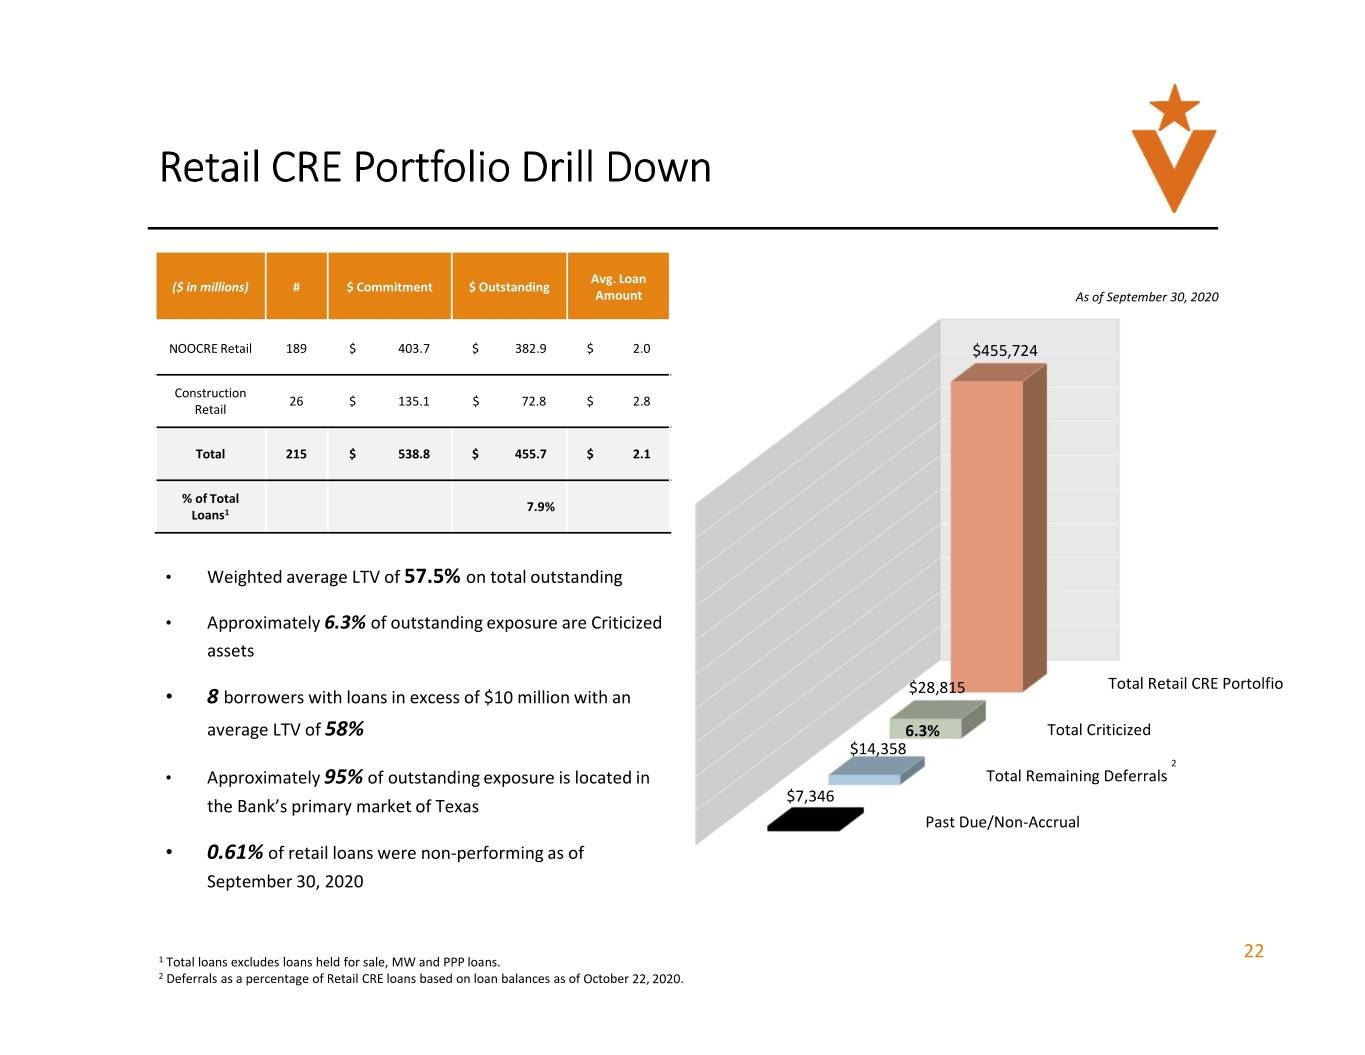
Retail CRE Portfolio Drill Down Avg. Loan ($ in millions) # $ Commitment $ Outstanding Amount As of September 30, 2020 NOOCRE Retail 189 $ 403.7 $ 382.9 $ 2.0 $455,724 Construction 26 $ 135.1 $ 72.8 $ 2.8 Retail Total 215 $ 538.8 $ 455.7 $ 2.1 % of Total 7.9% Loans 1 • Weighted average LTV of 57.5% on total outstanding • Approximately 6.3% of outstanding exposure are Criticized assets $28,815 Total Retail CRE Portolfio • 8 borrowers with loans in excess of $10 million with an average LTV of 58% 6.3% Total Criticized $14,358 2 • Approximately 95% of outstanding exposure is located in Total Remaining Deferrals $7,346 the Bank’s primary market of Texas Past Due/Non-Accrual • 0.61% of retail loans were non-performing as of September 30, 2020 22 1 Total loans excludes loans held for sale, MW and PPP loans. 2 Deferrals as a percentage of Retail CRE loans based on loan balances as of October 22, 2020.
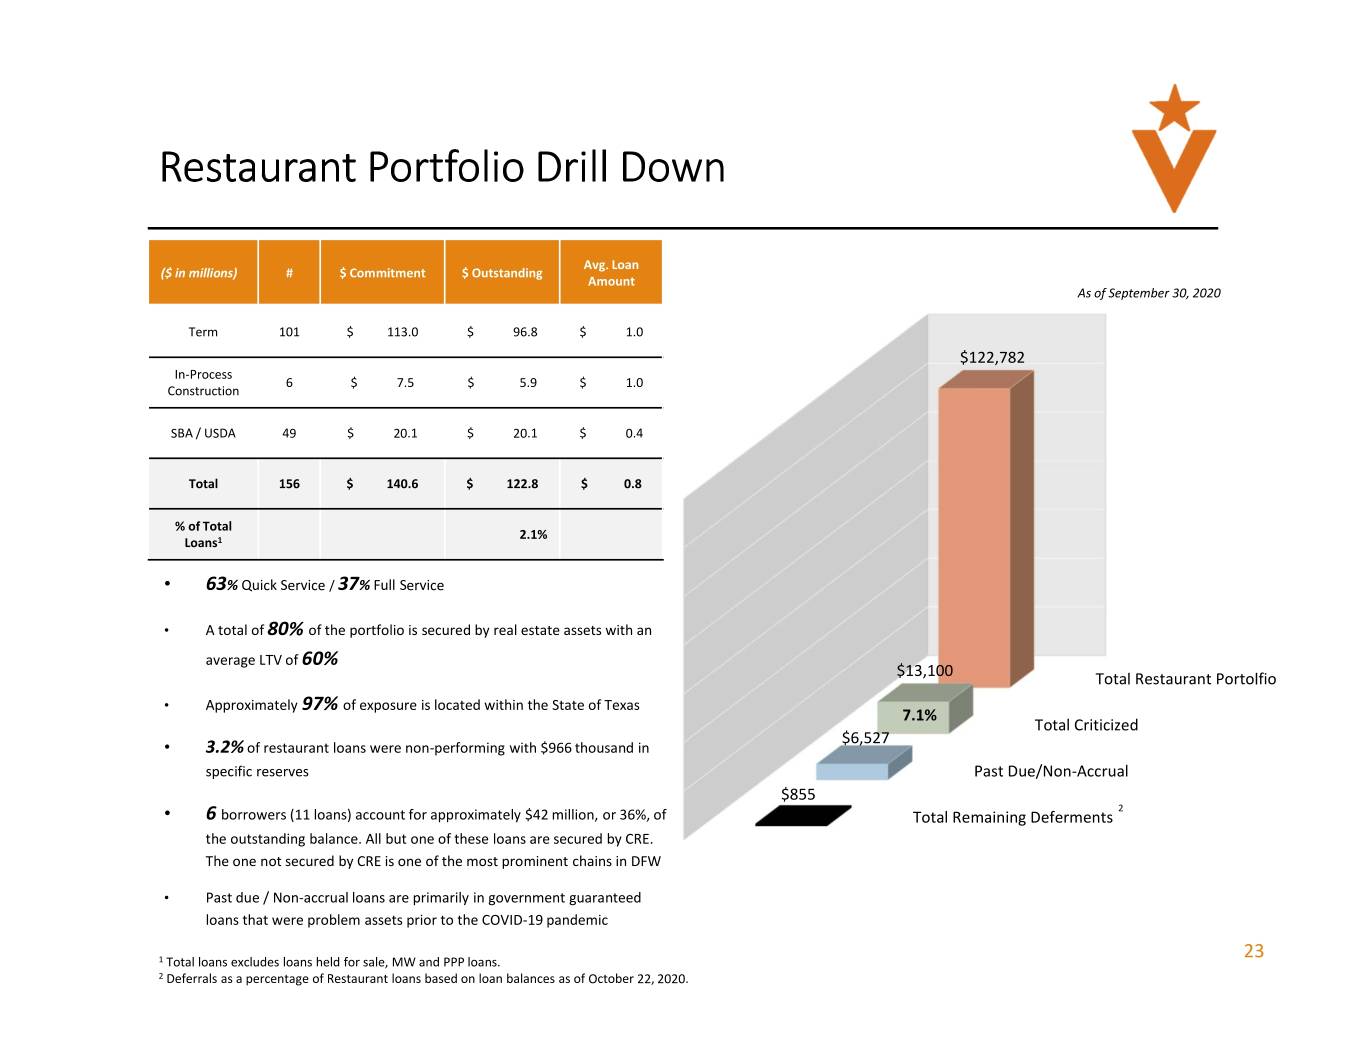
Restaurant Portfolio Drill Down Avg. Loan ($ in millions) # $ Commitment $ Outstanding Amount As of September 30, 2020 Term 101 $ 113.0 $ 96.8 $ 1.0 $122,782 In-Process 6 $ 7.5 $ 5.9 $ 1.0 Construction SBA / USDA 49 $ 20.1 $ 20.1 $ 0.4 Total 156 $ 140.6 $ 122.8 $ 0.8 % of Total 2.1% Loans 1 • 63 % Quick Service / 37 % Full Service • A total of 80% of the portfolio is secured by real estate assets with an average LTV of 60% $13,100 Total Restaurant Portolfio • Approximately 97% of exposure is located within the State of Texas 7.1% Total Criticized $6,527 • 3.2% of restaurant loans were non-performing with $966 thousand in specific reserves Past Due/Non-Accrual $855 2 • 6 borrowers (11 loans) account for approximately $42 million, or 36%, of Total Remaining Deferments the outstanding balance. All but one of these loans are secured by CRE. The one not secured by CRE is one of the most prominent chains in DFW • Past due / Non-accrual loans are primarily in government guaranteed loans that were problem assets prior to the COVID-19 pandemic 23 1 Total loans excludes loans held for sale, MW and PPP loans. 2 Deferrals as a percentage of Restaurant loans based on loan balances as of October 22, 2020.
Closing

Company Overview • Experienced management team – 35 years average banking experience • Strong presence in Dallas and Houston – Texas is experiencing continued strong population inflow – population growth is nearly double the U.S. average – Significant growth opportunities within our footprint • Scarcity value – 3rd largest bank solely focused on major Texas MSAs • Excellent core earnings profile has supported significant reserve build – 1.82% PTPP ROAA 1 and 2.10% ACL / Total Loans HFI for 3Q20 • Strong capital levels 2 – 9.67% common equity tier 1 ratio – 12.70% total risk-based capital ratio • Proactive management of asset quality 2 – Net charge offs to average loans of 0.07% for YTD 2020 – Pandemic portfolio reviews of loan portfolio resulted in downgrades of 2.6% of total commitments – $156 million of COVID-related loan deferrals (2.7% of total loans HFI 3) as of October 15, 2020 • Steady balance sheet growth 2 – Originated 2,199 PPP loans totaling $405.5 million, increasing total loans to $6.7 billion – Total loans HFI 3 grew 7.6% YoY – Non-time deposits increased $120.8 million during 3Q20 – Non-time deposits grew 18.5% YoY • Track record of successfully integrating acquisitions 1 Please refer to “Reconciliation of Non-GAAP Financial Measures” at the end of this presentation for a description and reconciliation of these non-GAAP financial measures. 2 Financial data as of September 30, 2020. 3 Total Loans HFI excludes PPP loans. 25
Supplemental
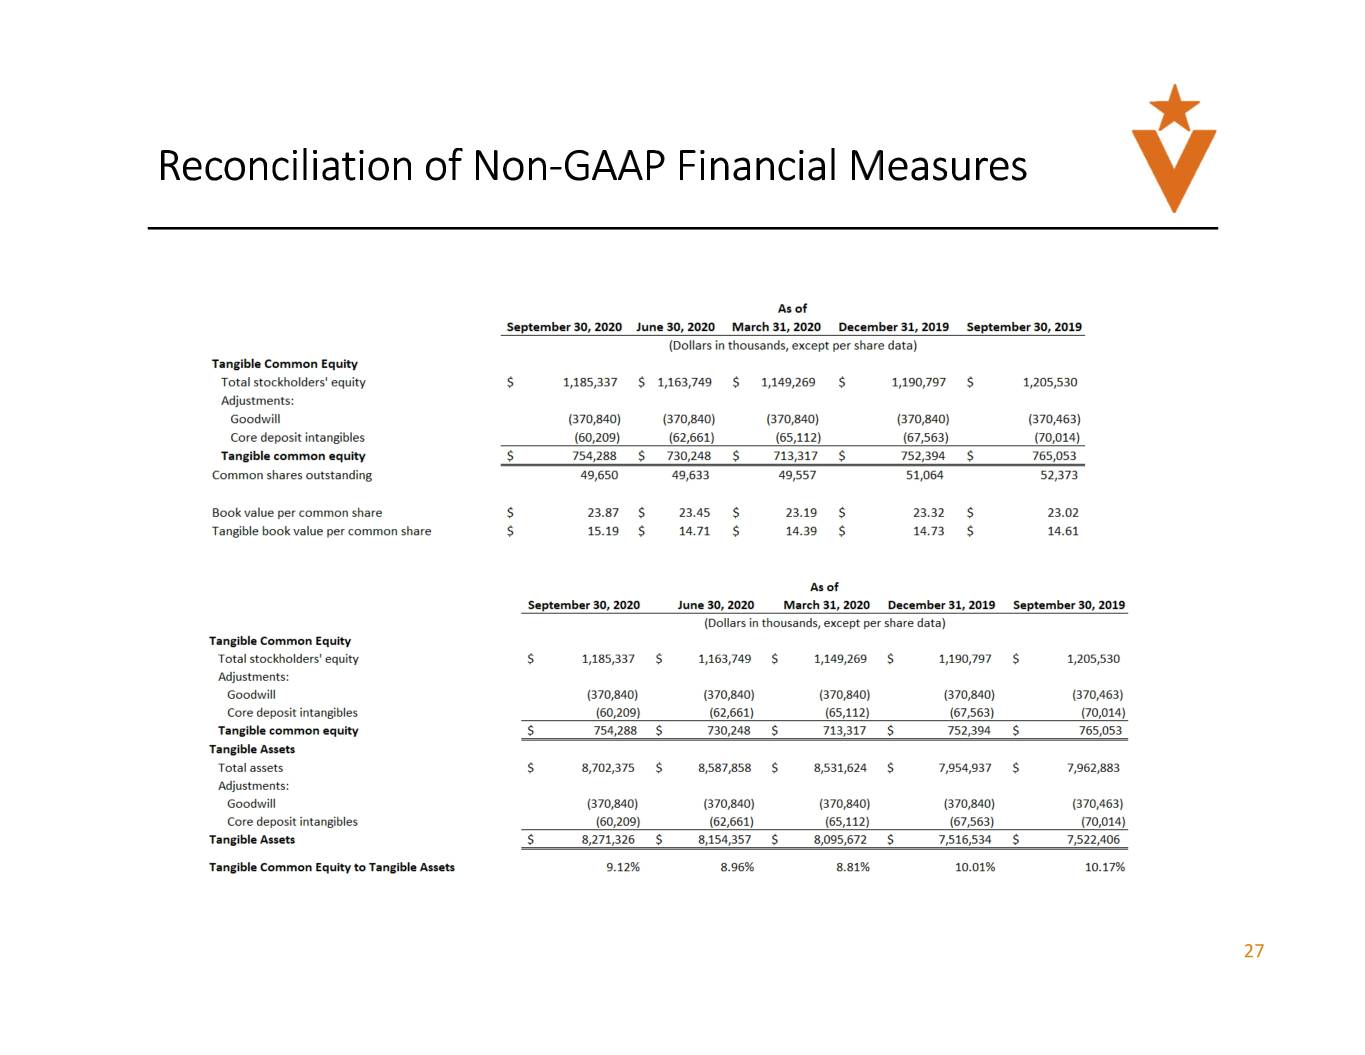
Reconciliation of Non -GAAP Financial Measures 27
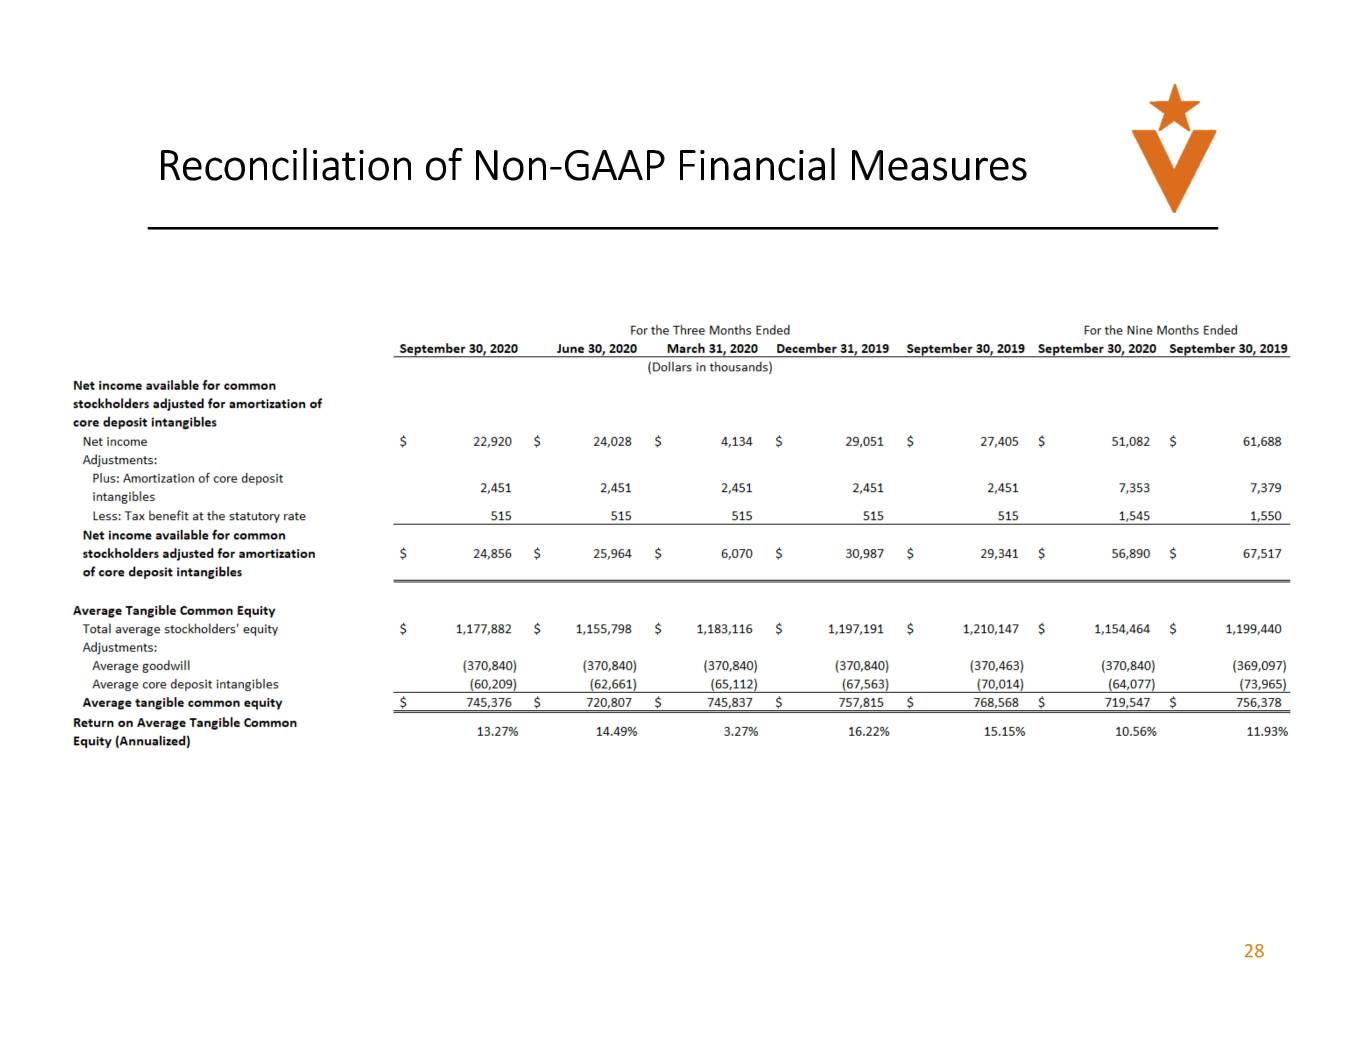
Reconciliation of Non -GAAP Financial Measures 28
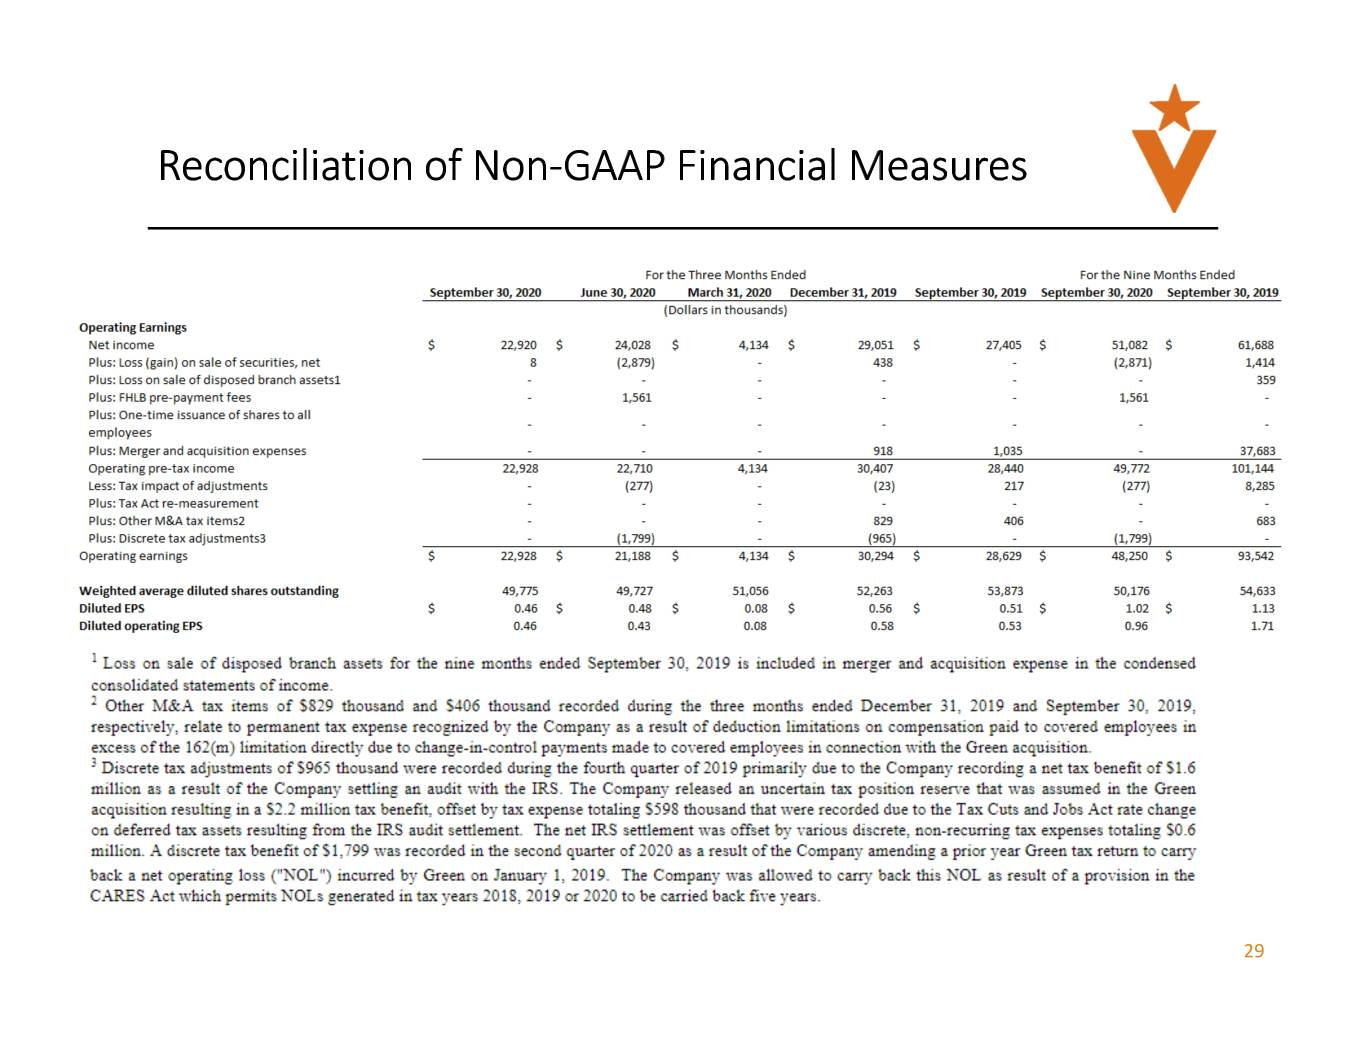
Reconciliation of Non -GAAP Financial Measures 29
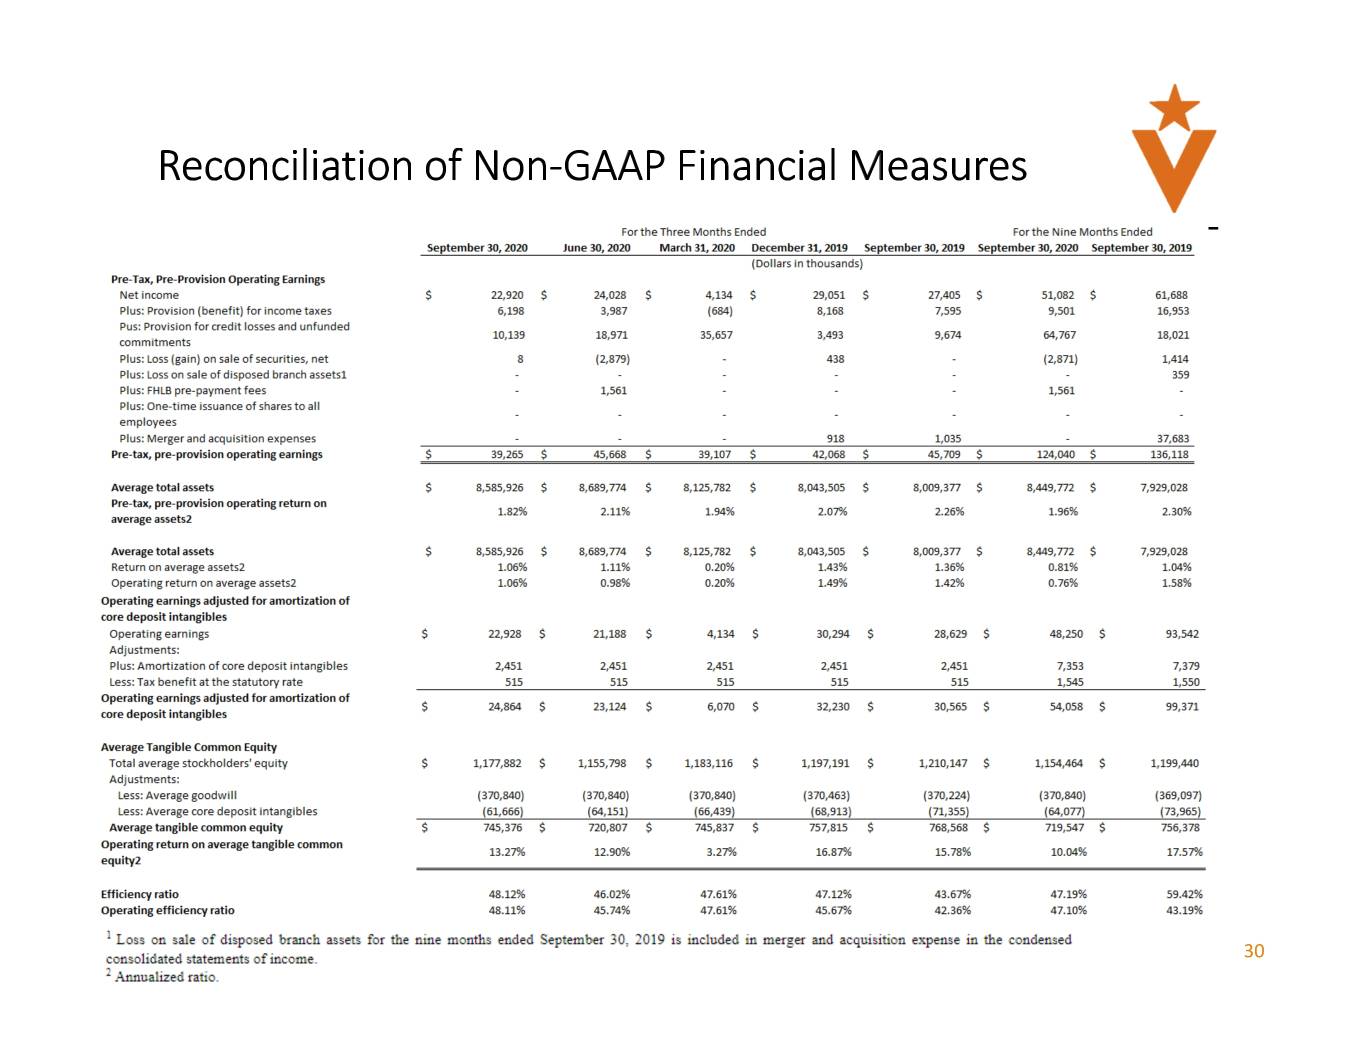
Reconciliation of Non -GAAP Financial Measures 30
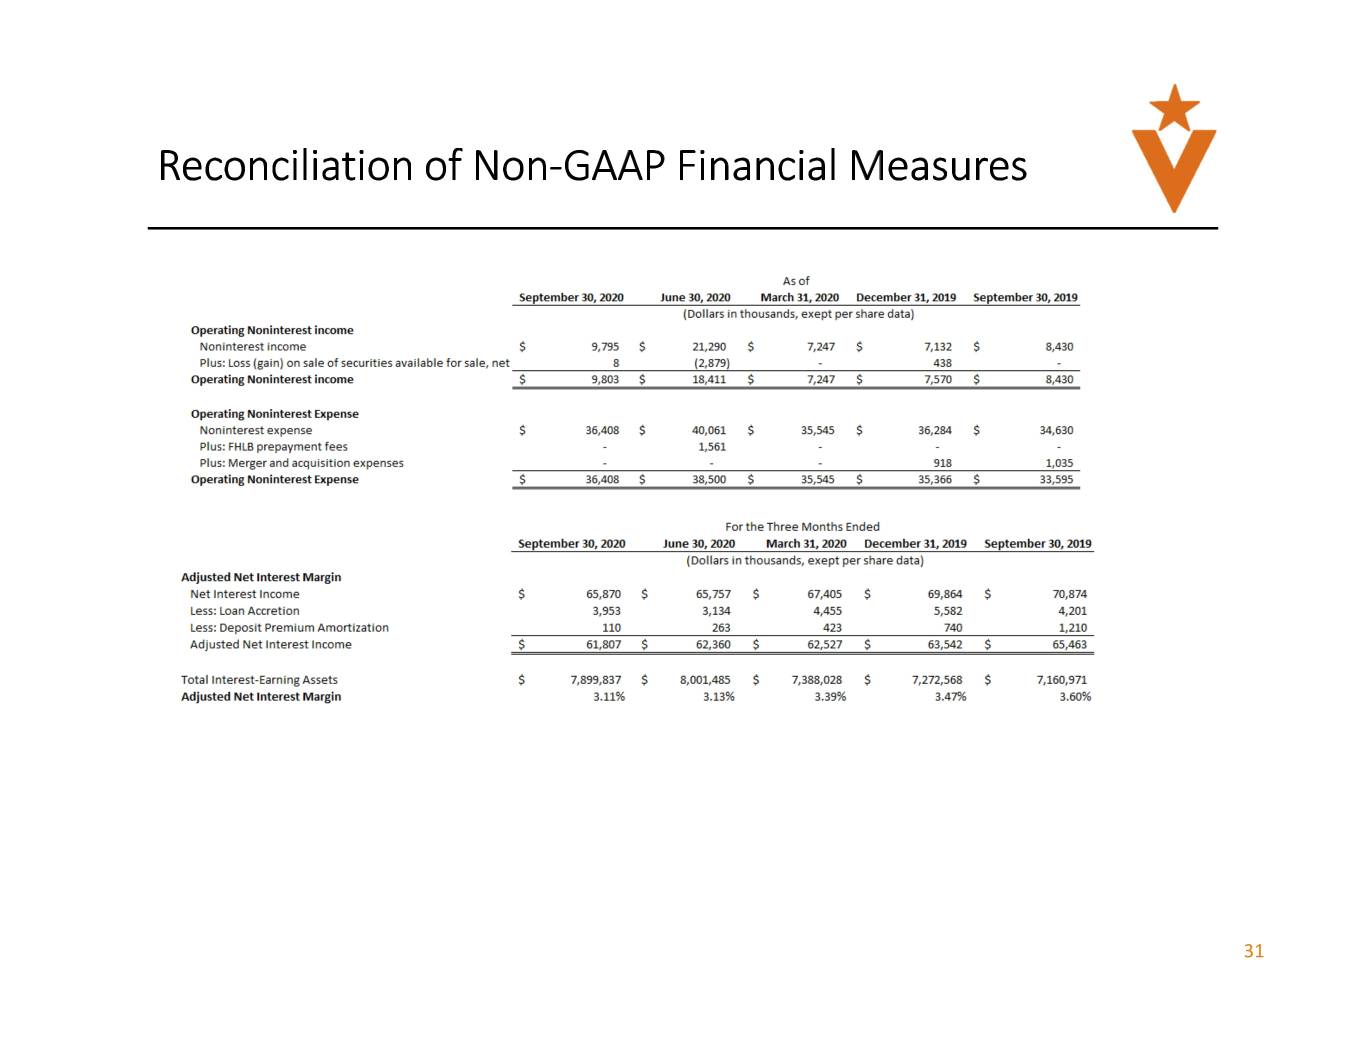
Reconciliation of Non -GAAP Financial Measures 31

V E R I T E X
