Attached files
| file | filename |
|---|---|
| EX-99.1 - EX-99.1 - CATHAY GENERAL BANCORP | d25496dex991.htm |
| 8-K - 8-K - CATHAY GENERAL BANCORP | caty-8k_20201026.htm |
Financial Earnings Results. Third Quarter 2020 October 26, 2020 Exhibit 99.2
Forward Looking Statements This presentation contains forward-looking statements about Cathay General Bancorp and its subsidiaries (collectively referred to herein as the “Company,” “we,” “us,” or “our”) within the meaning of the applicable provisions of the Private Securities Litigation Reform Act of 1995. We intend such forward-looking statements to be covered by the safe harbor provision for forward-looking statements in these provisions. Statements that are not historical or current facts, including statements about beliefs, expectations and future economic performance, are “forward-looking statements” and are based on the information available to, and estimates, beliefs, projections, and assumptions made by, management as of the date on which such statements are first made. Forward-looking statements are not guarantees of future performance and are subject to inherent risks and uncertainties that could cause actual results to differ materially from those anticipated in the statements. These risks and uncertainties include, but are not limited to: local, regional, national and international business, market and economic conditions and events and the impact they may have on us, our customers and our operations, assets and liabilities; the impact on our business, operations, financial condition, liquidity, results of operations, prospects and trading prices of our shares arising out of the COVID-19 pandemic; possible additional provisions for loan losses and charge-offs; credit risks of lending activities and deterioration in asset or credit quality; extensive laws and regulations and supervision that we are subject to, including potential supervisory action by bank supervisory authorities; increased costs of compliance and other risks associated with changes in regulation; compliance with the Bank Secrecy Act and other money laundering statutes and regulations; potential goodwill impairment; liquidity risk; fluctuations in interest rates; risks associated with acquisitions and the expansion of our business into new markets; inflation and deflation; real estate market conditions and the value of real estate collateral; environmental liabilities; our ability to generate anticipated returns from our investments and/or financings in certain tax advantaged-projects; our ability to compete with larger competitors; our ability to retain key personnel; successful management of reputational risk; natural disasters, public health crises (including the occurrence of a contagious disease or illness, such as the COVID-19 pandemic) and geopolitical events; failures, interruptions, or security breaches of our information systems; our ability to adapt our systems to the expanding use of technology in banking; adverse results in legal proceedings; changes in accounting standards or tax laws and regulations; market disruption and volatility; restrictions on dividends and other distributions by laws and regulations and by our regulators and our capital structure; capital level requirements and successfully raising additional capital, if needed, and the resulting dilution of interests of holders of our common stock; and the soundness of other financial institutions. For a discussion of these and other risks that may cause actual results to differ from expectations, please see our Annual Report on Form 10-K (at Item 1A in particular) for the year ended December 31, 2019 and all subsequent reports and filings we make with the Securities and Exchange Commission under the applicable provisions of the Securities Exchange Act of 1934. Given these risks and uncertainties, readers are cautioned not to place undue reliance on any forward-looking statements. Any forward-looking statement speaks only as of the date on which it is first made and, except as required by law, we undertake no obligation to update or review any forward-looking statements to reflect circumstances, developments or events occurring after the date on which the statement is first made or to reflect the occurrence of unanticipated events. The information in this presentation may include financial information determined by methods other than in accordance with accounting principles generally accepted in the United States of America (“GAAP”). Our management uses these non-GAAP measures in its analysis of the Company’s performance. We believe that the presentation of certain non-GAAP measures provides useful supplemental information that is essential to a proper understanding of the operating results of our businesses. These non-GAAP disclosures should not be viewed as a substitute for operating results determined in accordance with GAAP, nor are they necessarily comparable to non-GAAP performance measures that may be presented by other companies.
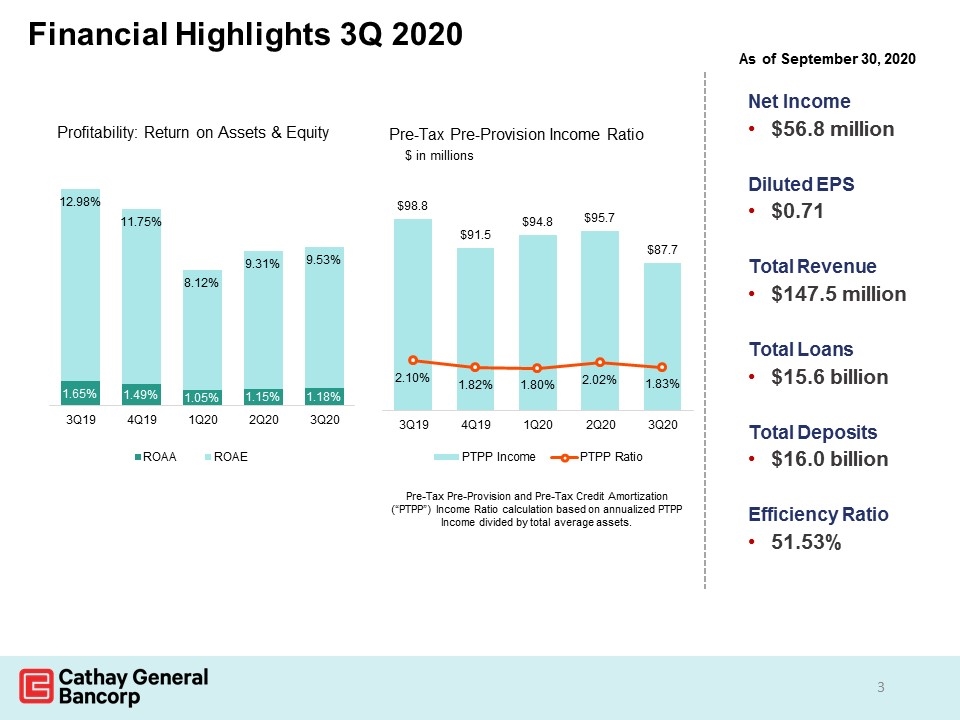
Financial Highlights 3Q 2020 As of September 30, 2020 Net Income $56.8 million Diluted EPS $0.71 Total Revenue $147.5 million Total Loans $15.6 billion Total Deposits $16.0 billion Efficiency Ratio 51.53%
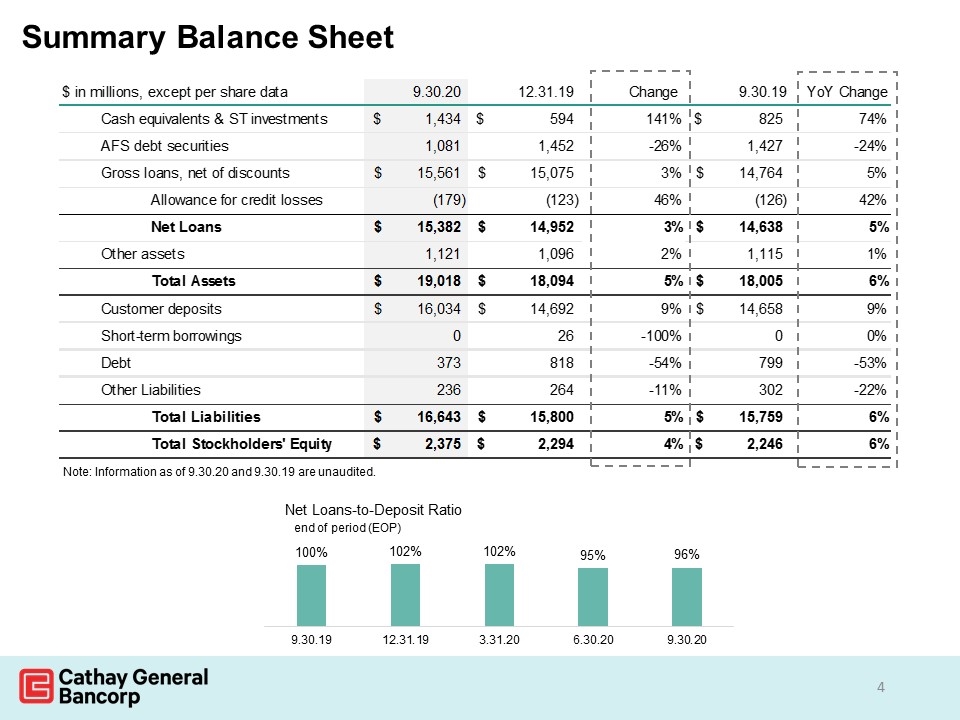
Summary Balance Sheet Note: Information as of 9.30.20 and 9.30.19 are unaudited. $ in millions, except per share data 9.30.20 12.31.19 Change 9.30.19 YoY Change Cash equivalents & ST investments $1,434 $594 1.4141414141414141 $825 0.73818181818181816 AFS debt securities 1081 1452 -0.25550964187327824 1427 -0.2424667133847232 Gross loans, net of discounts $15,561 $15,075 3.2238805970149255E-2 $14,764 5.398266052560282E-2 Allowance for credit losses -179 -123 0.45528455284552843 -126 0.42063492063492064 Net Loans $15,382 $14,952 2.8758694489031567E-2 $14,638 5.0826615657876759E-2 Other assets 1121 1096 2.281021897810219E-2 1115 5.3811659192825115E-3 Total Assets $19,018 $18,094 5.1066651928816181E-2 $18,005 5.6262149402943627E-2 Customer deposits $16,034 $14,692 9.1342227062346862E-2 $14,658 9.3873652612907629E-2 Short-term borrowings 0 26 -1 0 0 Debt 373 818 -0.54400977995110023 799 -0.53316645807259078 Other Liabilities 236 264 -0.10606060606060606 302 -0.2185430463576159 Total Liabilities $16,643 $15,800 5.3354430379746833E-2 $15,759 5.609492988133765E-2 Total Stockholders' Equity $2,375 $2,294 3.5309503051438533E-2 $2,246 5.7435440783615316E-2
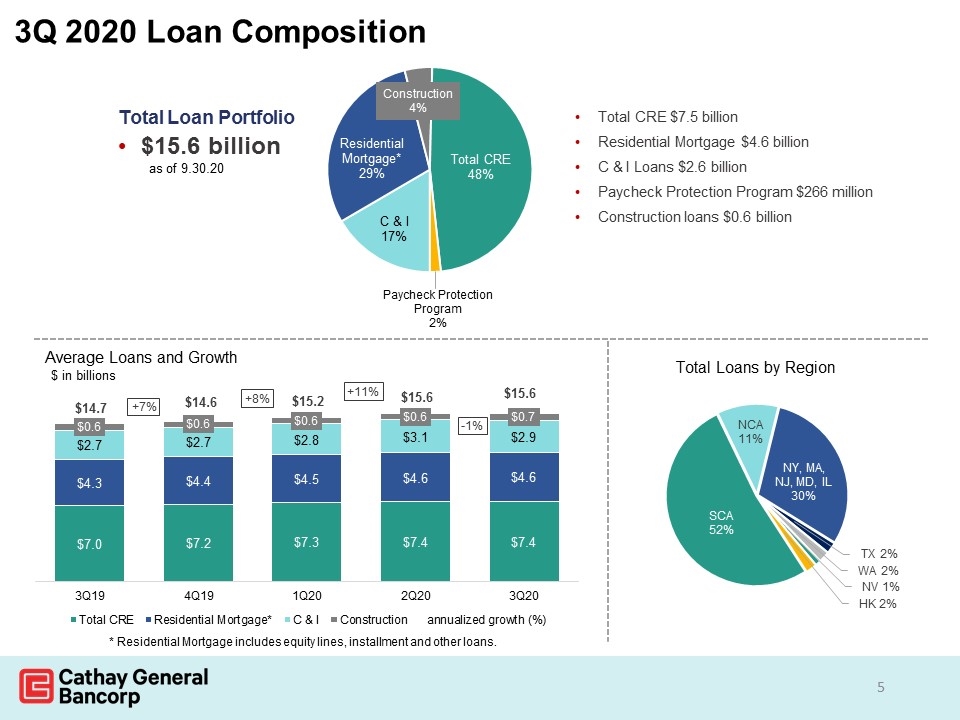
3Q 2020 Loan Composition Total Loan Portfolio $15.6 billion as of 9.30.20 * Residential Mortgage includes equity lines, installment and other loans. Total CRE $7.5 billion Residential Mortgage $4.6 billion C & I Loans $2.6 billion Paycheck Protection Program $266 million Construction loans $0.6 billion
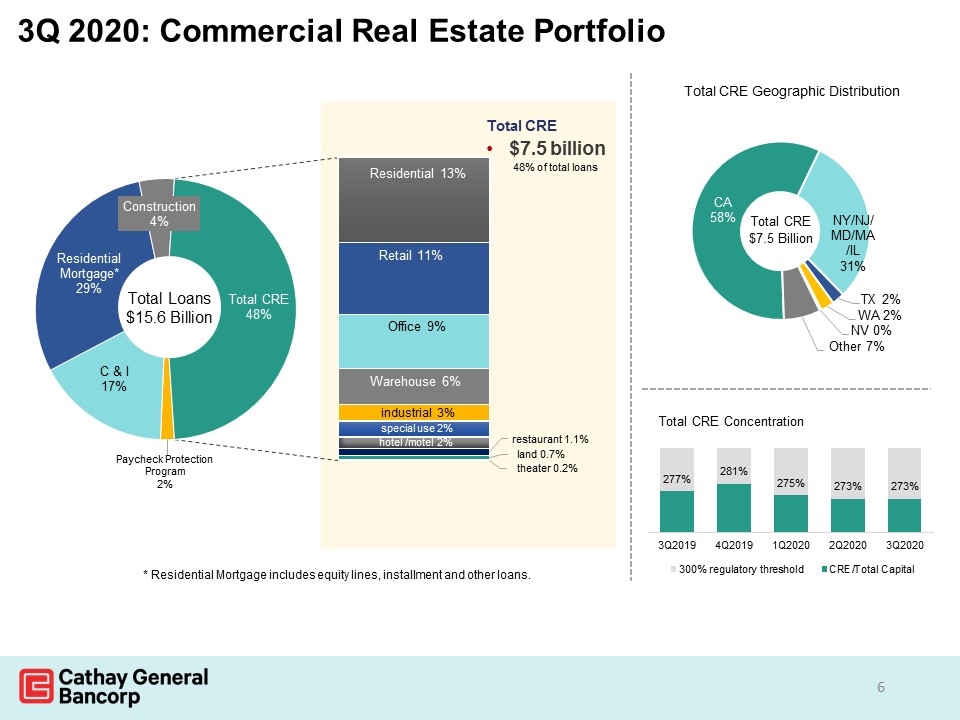
3Q 2020: Commercial Real Estate Portfolio Total CRE $7.5 billion 48% of total loans * Residential Mortgage includes equity lines, installment and other loans.
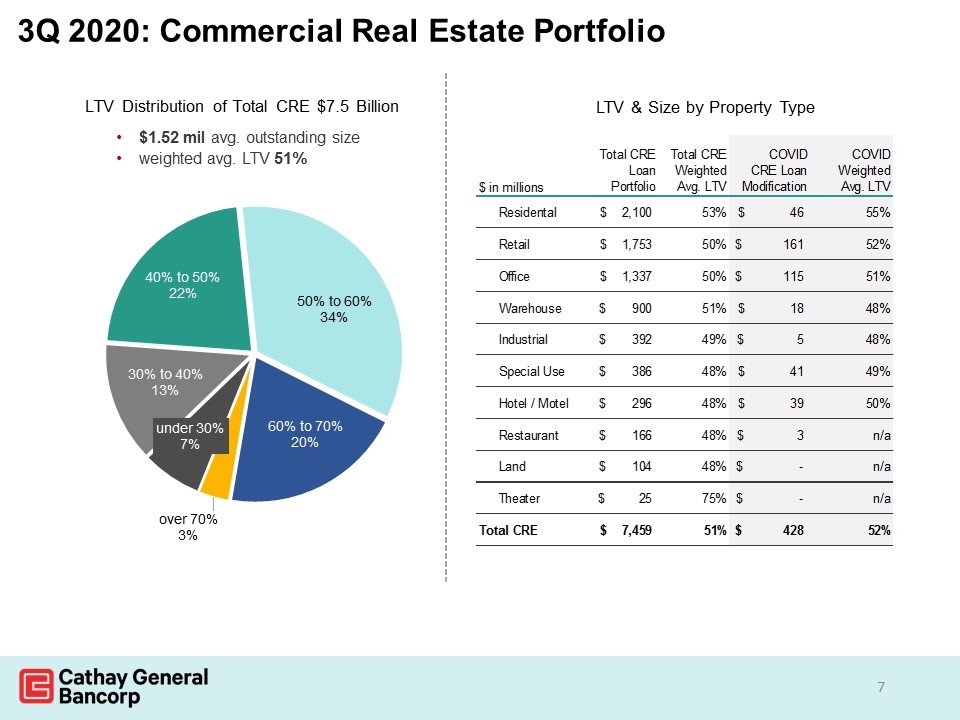
LTV & Size by Property Type 3Q 2020: Commercial Real Estate Portfolio $ in millions Total CRE Loan Portfolio Total CREWeighted Avg. LTV COVID CRE Loan Modification COVID Weighted Avg. LTV Residental $2,100 0.53 $46.43 0.5457874902150367 Retail $1,753 0.50427213797515213 $161.006 0.5205082912885205 Office $1,337 0.49667111895286586 $114.777 0.51301575238290598 Warehouse $900 0.51 $18.001000000000001 0.47553130769260854 Industrial $392 0.49 $5.032 0.47749639544436689 Special Use $386 0.48 $40.991999999999997 0.49 Hotel / Motel $296 0.48323196535636098 $39.098999999999997 0.5 Restaurant $166 0.48208925450458689 $2.7639999999999998 n/a Land $104 0.4795746770430841 $0 n/a Theater $25 0.75 $0 n/a Total CRE $7,459 0.50800000000000001 $428.101 0.51600000000000001
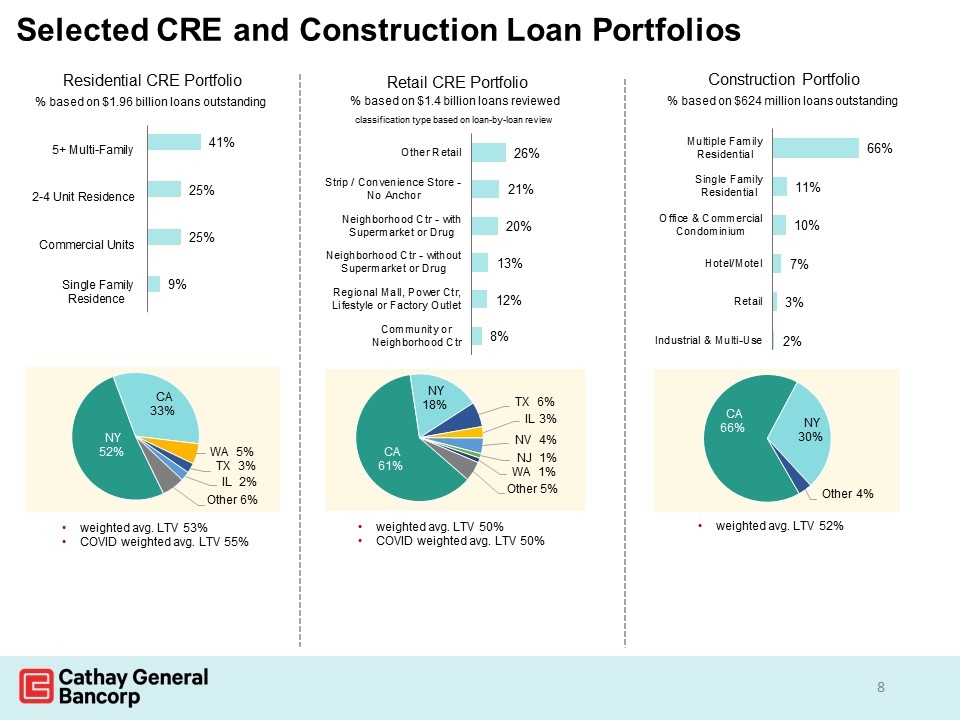
Selected CRE and Construction Loan Portfolios weighted avg. LTV 53% COVID weighted avg. LTV 55% weighted avg. LTV 50% COVID weighted avg. LTV 50% weighted avg. LTV 52%
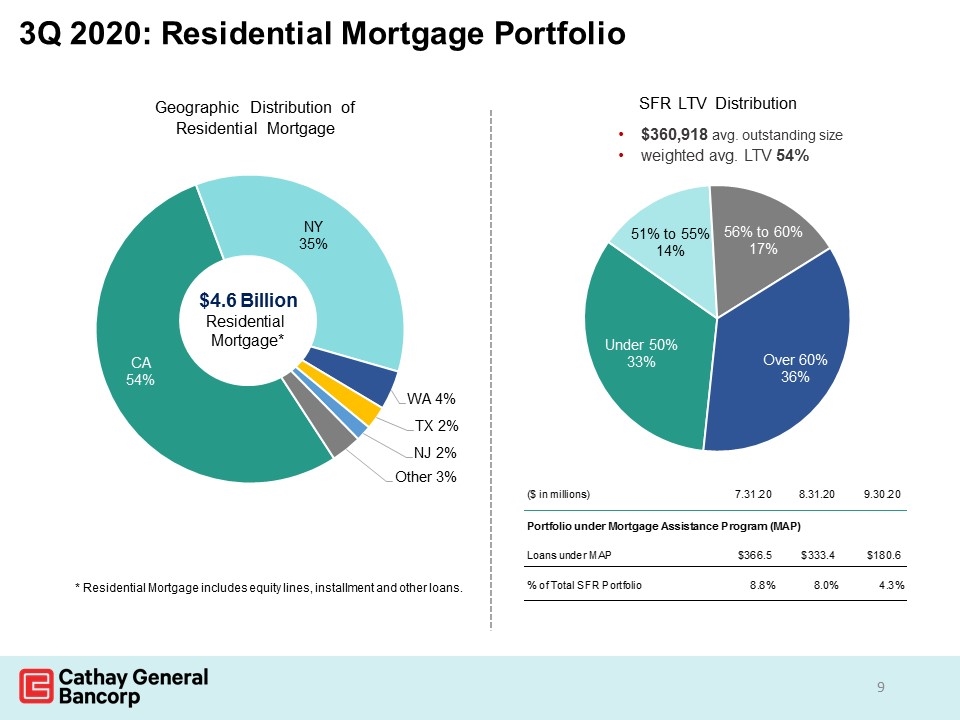
Geographic Distribution of Residential Mortgage 3Q 2020: Residential Mortgage Portfolio * Residential Mortgage includes equity lines, installment and other loans. ($ in millions) 7.31.20 8.31.20 9.30.20 Portfolio under Mortgage Assistance Program (MAP) Loans under MAP $366.5 $333.4 $180.6 % of Total SFR Portfolio 8.8% 7.9699999999999993 4.3%
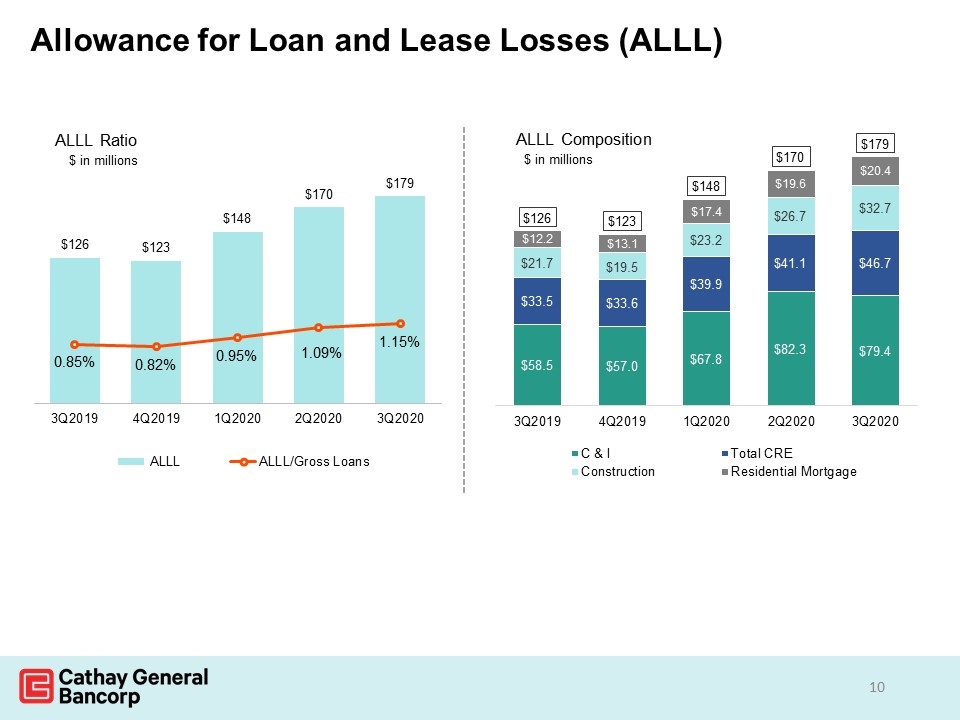
Allowance for Loan and Lease Losses (ALLL)
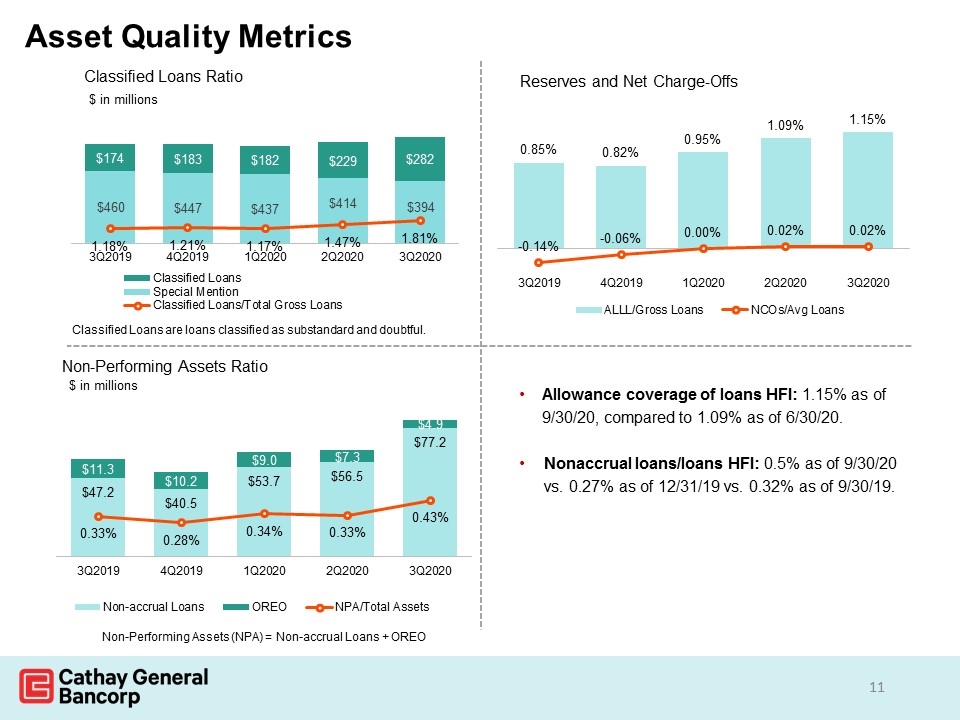
Asset Quality Metrics Allowance coverage of loans HFI: 1.15% as of 9/30/20, compared to 1.09% as of 6/30/20. Nonaccrual loans/loans HFI: 0.5% as of 9/30/20 vs. 0.27% as of 12/31/19 vs. 0.32% as of 9/30/19. Classified Loans are loans classified as substandard and doubtful. Non-Performing Assets (NPA) = Non-accrual Loans + OREO
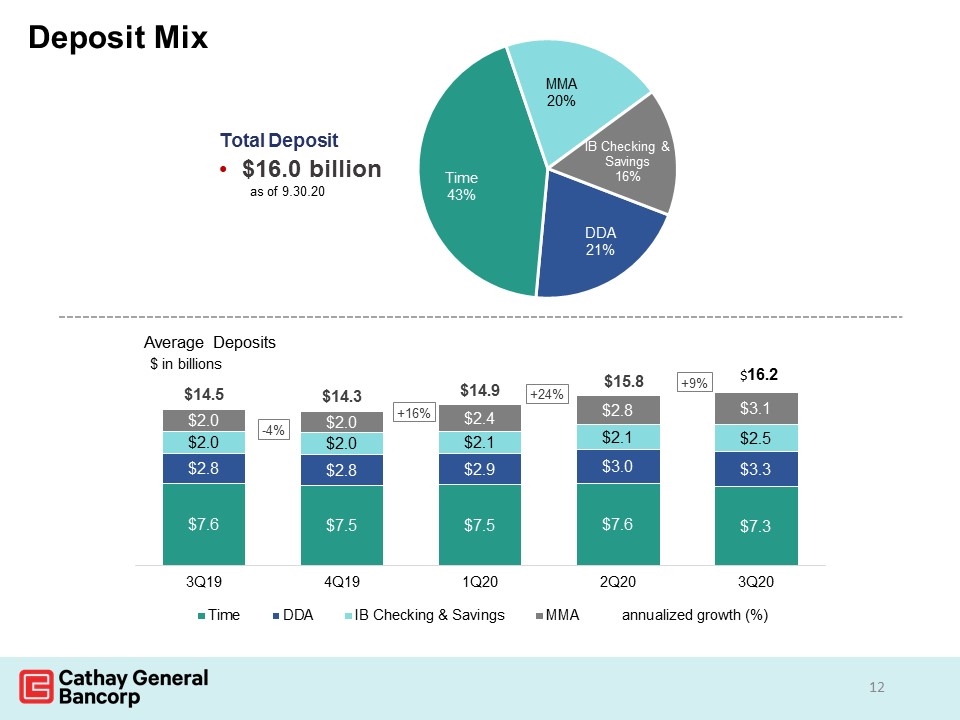
Deposit Mix Total Deposit $16.0 billion as of 9.30.20
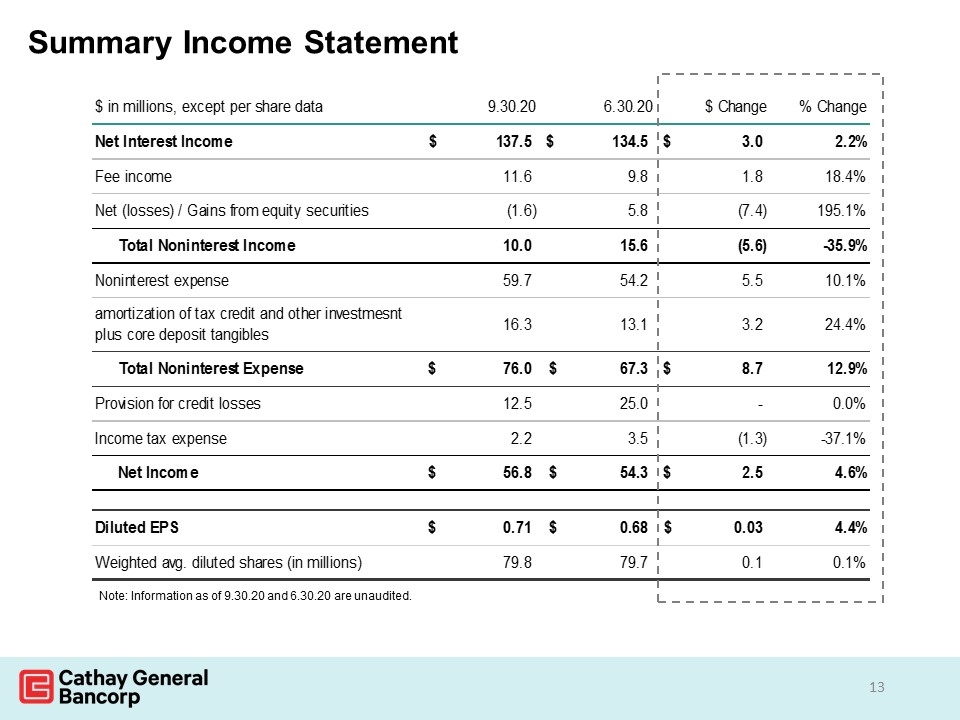
Summary Income Statement Note: Information as of 9.30.20 and 6.30.20 are unaudited. $ in millions, except per share data 9.30.20 6.30.20 $ Change % Change Net Interest Income $137.5 $134.5 $3 2.2% -2.0967651902090486E-2 Fee income 11.6 9.8000000000000007 1.7999999999999989 0.18367346938775497 0.35738753139986296 Net (losses) / Gains from equity securities -1.6 5.8 -7.4 1.9510000000000001 -2.465769877492193 Total Noninterest Income 10 15.600000000000001 -5.6000000000000014 -0.35897435897435903 -0.55220184196269639 Noninterest expense 59.7 54.2 5.5 0.1014760147601476 -0.14829632593185305 amortization of tax credit and other investmesnt plus core deposit tangibles 16.3 13.1 3.2000000000000011 0.24427480916030544 0.28045893279912582 Total Noninterest Expense $76 $67.3 $8.7000000000000028 0.12927191679049038 -8.1950119768916446E-2 Provision for credit losses 12.5 25 0 0.0% 1 Income tax expense 2.2000000000000002 3.5 -1.2999999999999998 -0.37142857142857139 -0.51092102431676345 Net Income $56.8 $54.3 $2.5 4.6% -0.29734999025180342 Diluted EPS $0.71 $0.68 $2.9999999999999916E-2 4.4% -0.28966503653468711 Weighted avg. diluted shares (in millions) 79.8 79.7 9.9999999999994316E-2 .1% -1.081877439852583E-2
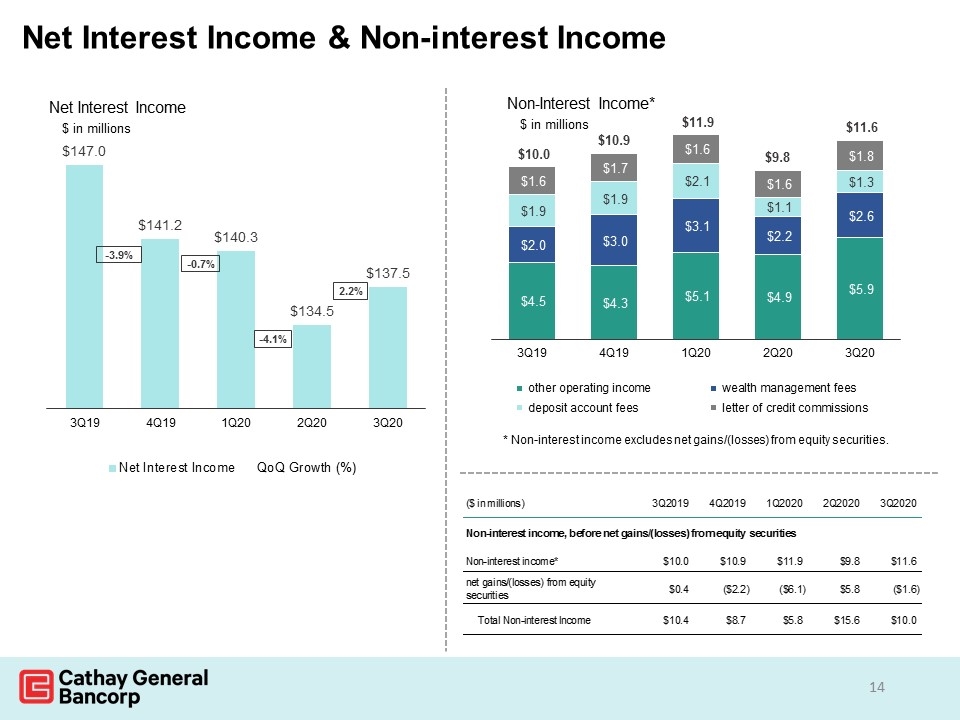
Net Interest Income & Non-interest Income $ in millions Non-Interest Income* * Non-interest income excludes net gains/(losses) from equity securities. Amortization Expense ($ in millions) 3Q2019 4Q2019 1Q2020 2Q2020 3Q2020 Non-interest income, before net gains/(losses) from equity securities Non-interest income* $10.023999999999999 $10.9 $11.888 $9.827 $11.6 net gains/(losses) from equity securities $0.36399999999999999 $-2.1859999999999999 $-6.1020000000000003 $5.7789999999999999 $-1.6 Total Non-interest Income $10.388 $8.6999999999999993 $5.7859999999999996 $15.606 $10
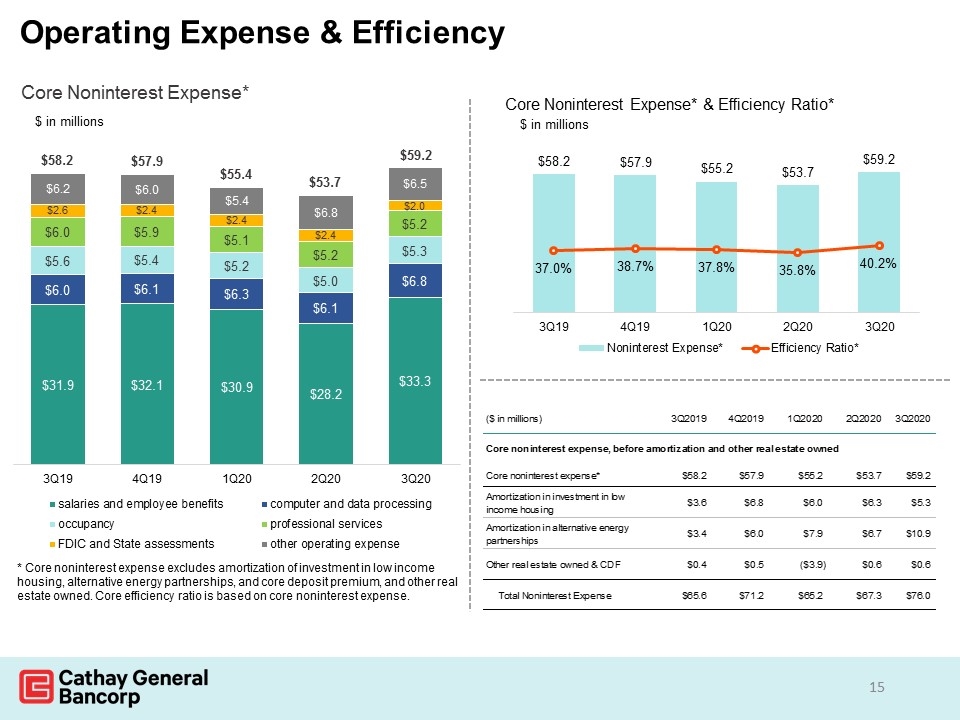
Operating Expense & Efficiency Amortization Expense ($ in millions) 3Q2019 4Q2019 1Q2020 2Q2020 3Q2020 Core noninterest expense, before amortization and other real estate owned Core noninterest expense* $58.220999999999997 $57.920999999999999 $55.195999999999998 $53.7 $59.2 Amortization in investment in low income housing $3.6239050000000002 $6.8091359999999996 $5.9805679999999999 $6.3 $5.3 Amortization in alternative energy partnerships $3.3733019999999998 $6.0129700000000001 $7.9090870000000004 $6.6656490000000002 $10.9 Other real estate owned & CDF $0.36199999999999999 $0.5 $-3.9319999999999999 $0.623 $0.623 Total Noninterest Expense $65.580206999999987 $71.243105999999997 $65.153655000000001 $67.288649000000007 $76.02300000000001
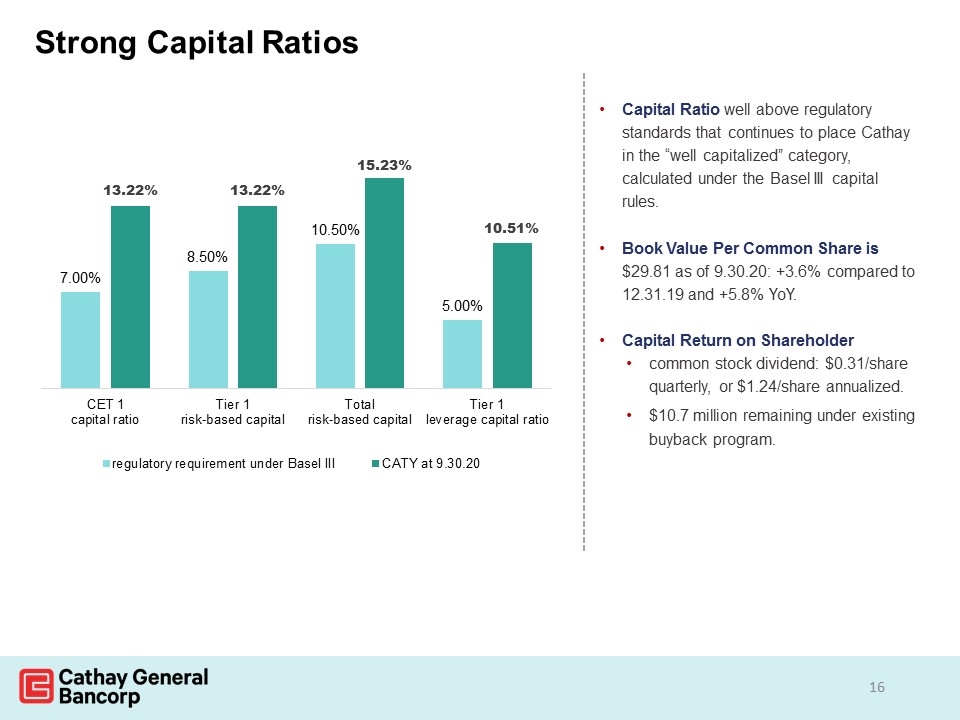
Strong Capital Ratios Capital Ratio well above regulatory standards that continues to place Cathay in the “well capitalized” category, calculated under the Basel III capital rules. Book Value Per Common Share is $29.81 as of 9.30.20: +3.6% compared to 12.31.19 and +5.8% YoY. Capital Return on Shareholder common stock dividend: $0.31/share quarterly, or $1.24/share annualized. $10.7 million remaining under existing buyback program.
