Attached files
| file | filename |
|---|---|
| EX-99.2 - EX-99.2 - WASHINGTON FEDERAL INC | exhibit992sep2020facts.htm |
| EX-99.1 - EX-99.1 - WASHINGTON FEDERAL INC | exhibit991sep2020earni.htm |
| 8-K - 8-K - WASHINGTON FEDERAL INC | wfsl-20201014.htm |

October 2020 Earnings Release Supplemental Information 1

$ Loans % of Total Original LTV * $ Loans % Deferred Loans (CRE Only) ** Currently Loans to Outstanding Deferred Total Portfolios at Outstanding Risk: Accommodation $316 and Food 2.4% 65.5% $72 million 0.6% million Service $58 Retail Trade 0.4% 73.3% _ 0.0% million Arts, $98 Entertainment 0.8% 34.0% $11 million 0.1% million & Recreation $190 Health Care 1.5% 43.5% $2 million 0.0% million At Risk Portfolio $662 5.1% 54.5% $85 million 0.7% Total: million * Represents the average LTV at origination. Individual Loans may vary significantly. Does not represent current LTV due to changing loan amounts and credit profile. ** CRE loans in at risk portfolio total $511 million Conducting ongoing reviews of portfolio and monitoring for potential credit impacts from COVID‐19. 2

$ Loans % of Total Original LTV *$ Loans % Deferred Outstanding Loans Currently Loans to Outstanding Deferred Total Outstanding Other Portfolios: $305 Oil & Gas 2.4% N/A _ 0.0% million Office $145 1.2% 65.2% $8 million 0.1% Owner Occupied million Office $798 Non‐Owner 6.2% 63.6% $5 million 0.0% million Occupied * Represents the average LTV at origination. Individual Loans may vary significantly. Does not represent current LTV due to changing loan amounts and credit profile. 3

Loans Receivable By Risk Rating ($ Amortized Cost) Internally Assigned Grade Pass Special Mention Substandard Total (In thousands, except ratio data) Loan Type Commercial loans Multi‐family$ 1,506,692 $ 13,721 $ 17,827 $ 1,538,240 Commercial real estate 1,681,230 92,184 111,274 1,884,688 Commercial & industrial 1,898,708 64,695 152,109 2,115,512 Construction 1,187,786 61,177 103,450 1,352,413 Land ‐ acquisition & development 137,998 15,573 ‐ 153,571 Total commercial loans 6,412,414 247,350 384,660 7,044,424 Consumer loans Single‐family residential$ 5,270,665 $ 192 $ 23,104 $ 5,293,961 Construction ‐ custom 295,953 ‐ ‐ 295,953 Land ‐ consumer lot loans 101,151 ‐ 243 101,394 HELOC 139,647 ‐ 575 140,222 Consumer 83,304 ‐ 11 83,315 Total consumer loans 5,890,720 192 23,933 5,914,845 Total $ 12,303,134 $ 247,542 $ 408,593 $ 12,959,269 Total grade as a % of total loans as of 9/30/2020 94.9% 1.9% 3.2% Total grade as a % of total loans as of 6/30/2020 95.5% 2.3% 2.2% 4

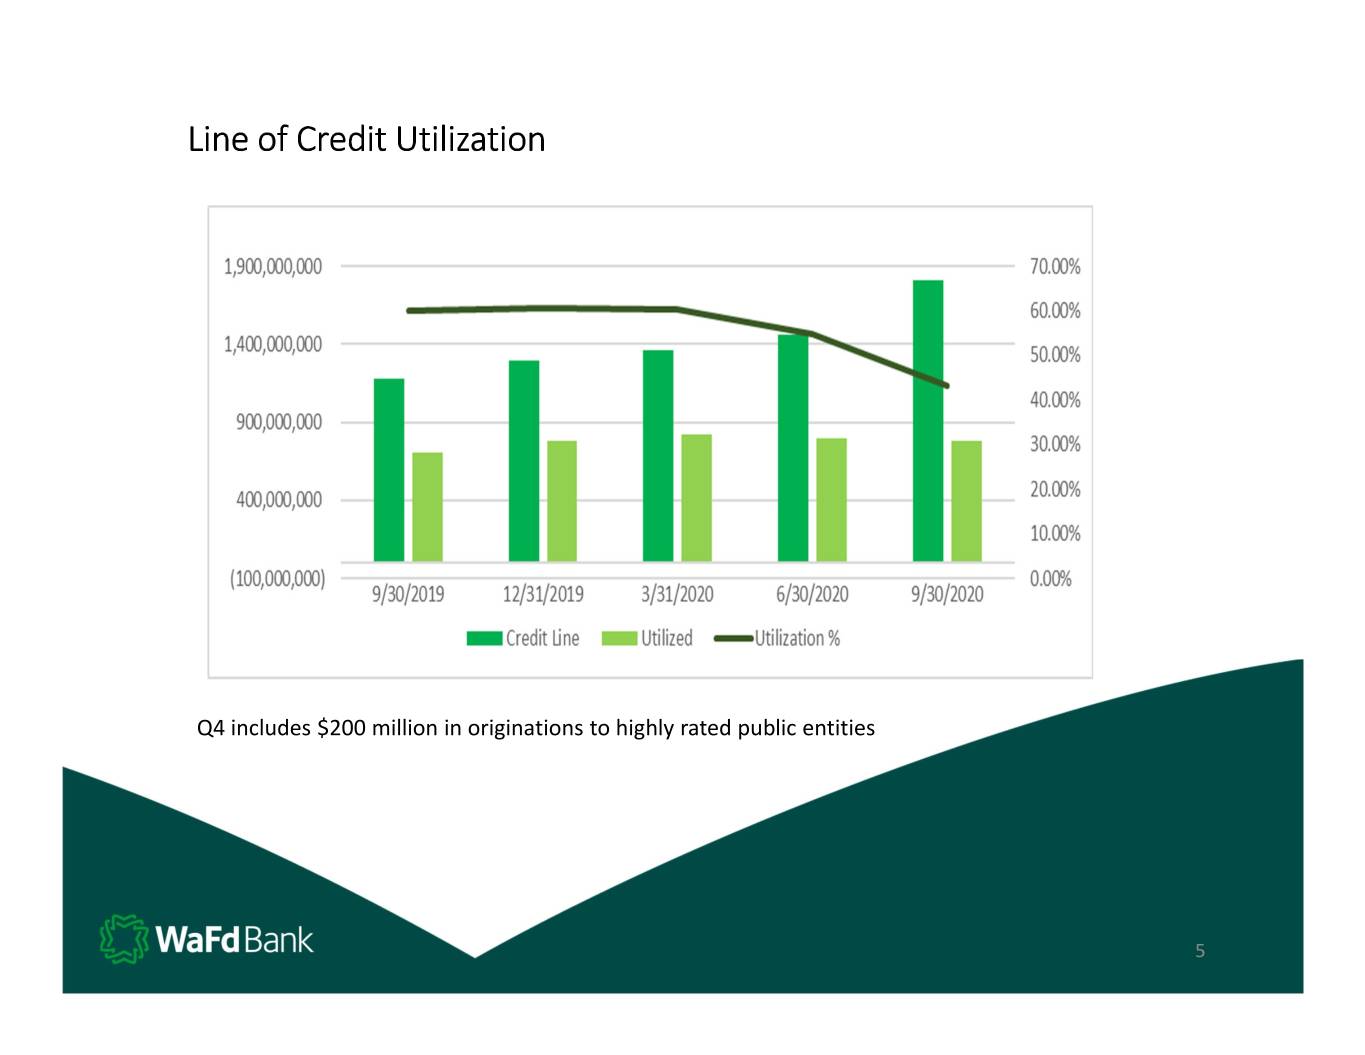
Line of Credit Utilization Q4 includes $200 million in originations to highly rated public entities 5

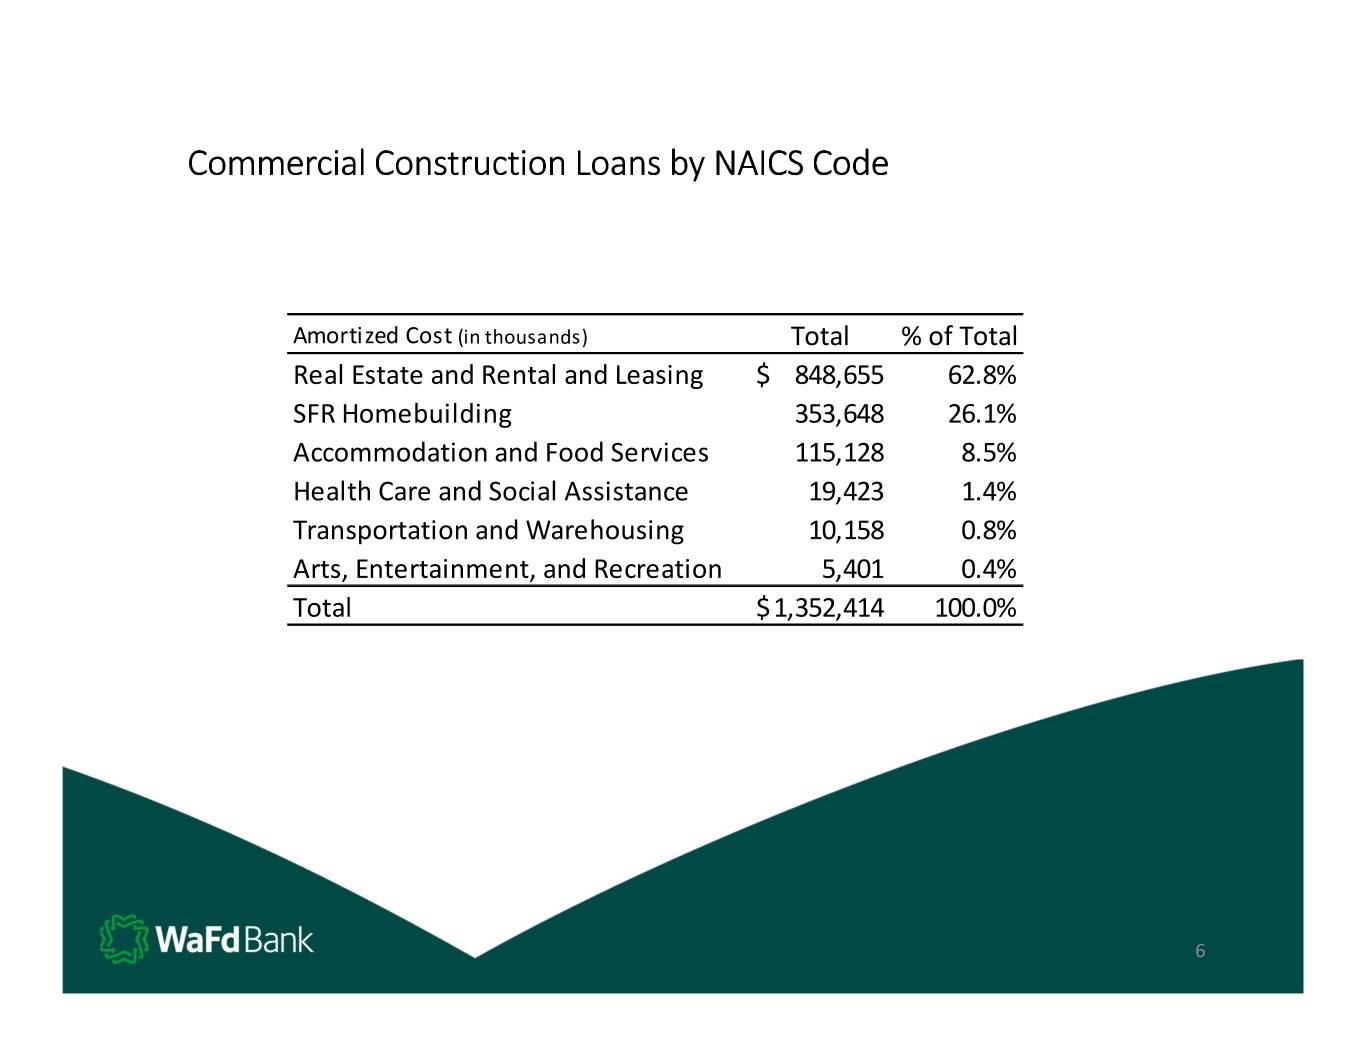
Commercial Construction Loans by NAICS Code Amortized Cost (in thousands) Total % of Total Real Estate and Rental and Leasing$ 848,655 62.8% SFR Homebuilding 353,648 26.1% Accommodation and Food Services 115,128 8.5% Health Care and Social Assistance 19,423 1.4% Transportation and Warehousing 10,158 0.8% Arts, Entertainment, and Recreation 5,401 0.4% Total$ 1,352,414 100.0% 6

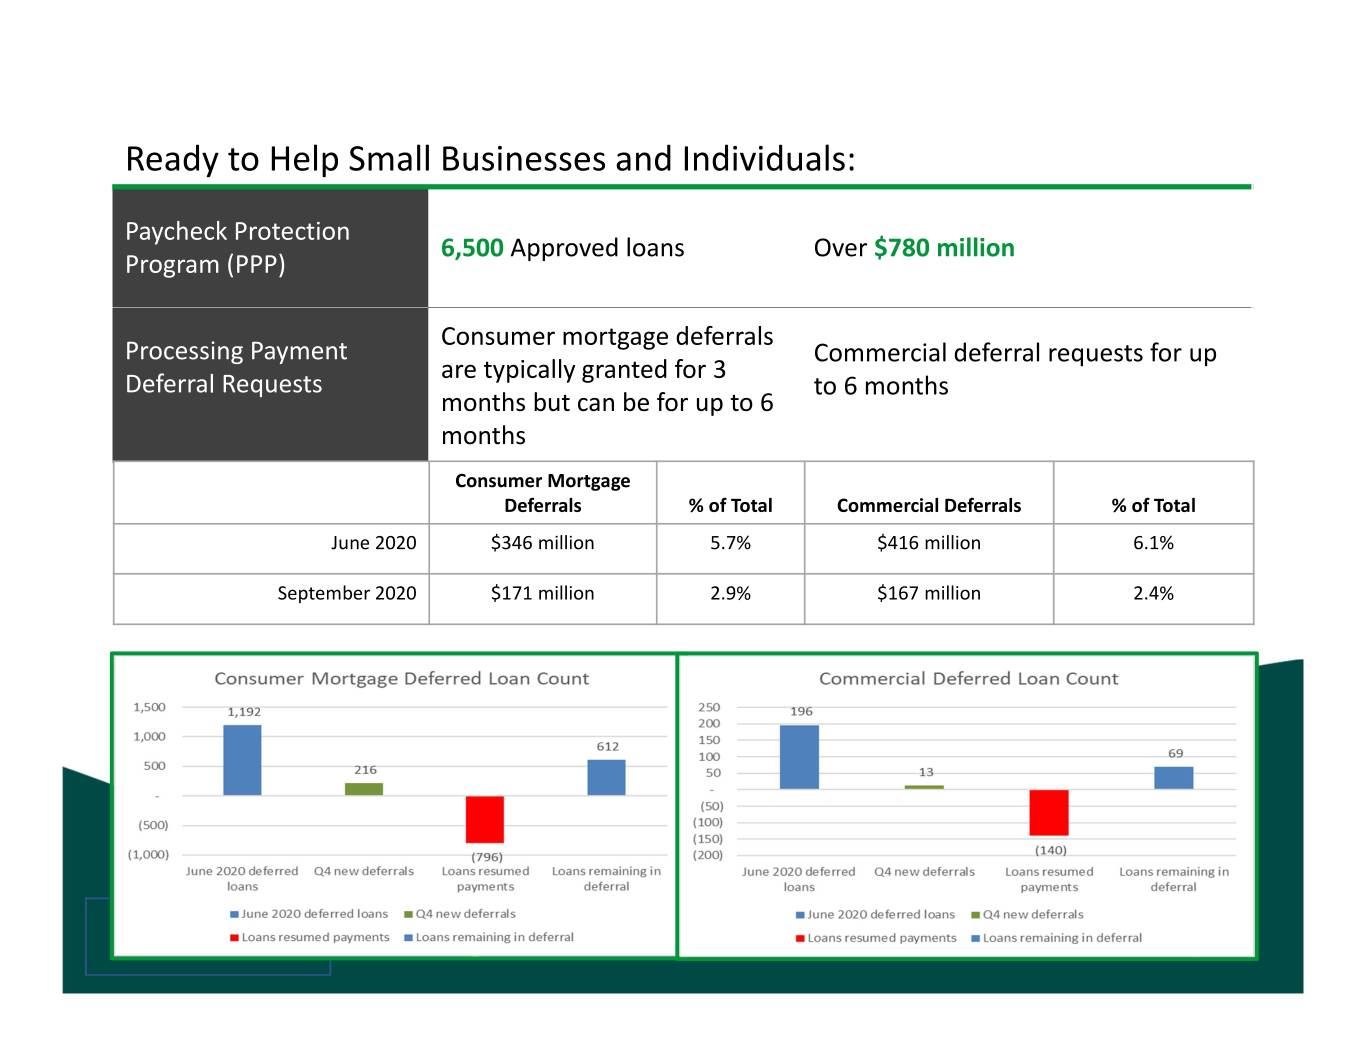
Ready to Help Small Businesses and Individuals: Paycheck Protection 6,500 Approved loans Over $780 million Program (PPP) Consumer mortgage deferrals Processing Payment Commercial deferral requests for up are typically granted for 3 Deferral Requests to 6 months months but can be for up to 6 months Consumer Mortgage Deferrals % of Total Commercial Deferrals % of Total June 2020 $346 million 5.7% $416 million 6.1% September 2020 $171 million 2.9% $167 million 2.4% $171 million 7

Capital Management 1) Bank is very well capitalized with TCE + ACL to TCA ratio at 10.12%, which would rank us as the 28th best capitalized publicly traded bank in the United States 2) Current cash dividend is at $0.22 per quarter which is a 48% payout ratio of the current quarter’s earnings of $0.45. The Company has paid out a cash dividend for 150 consecutive quarters and believes the current dividend is reasonable based on expected earnings going forward but the Board will act in the long‐term interest of shareholders if earnings diminish substantially as a result of COVID‐19 credit costs. 3) The Company's ongoing share repurchase program remains in place; however, management believes that it is prudent to pause repurchases for the time being as it continues to evaluate the extent of the COVID‐19 related economic impact. 8

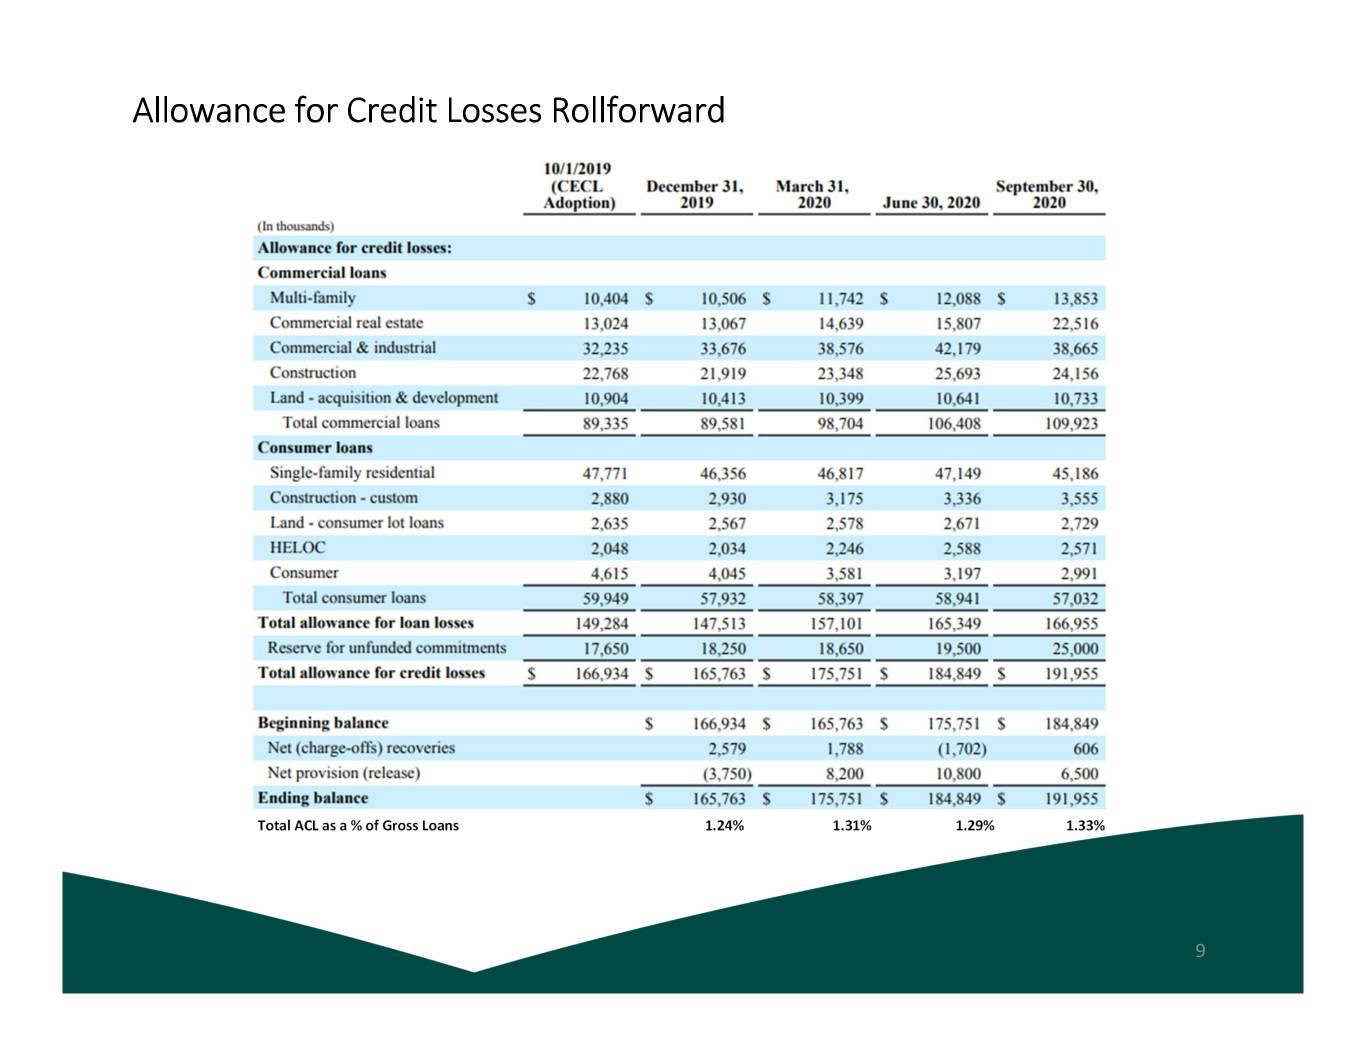
Allowance for Credit Losses Rollforward Total ACL as a % of Gross Loans 1.24% 1.31% 1.29% 1.33% 9

Allowance for Credit Losses Peer Comparison (excluding unfunded commitments) ACL as % of As of June 30, 2020 Loans Columbia Bank 1.55% Western Alliance Bank 1.24% Umpqua Bank 1.57% Banner Bank 1.52% HomeStreet Bank 1.20% Cullen/Frost Bankers 1.39% First Interestate BancSystem 1.46% Washington Trust Bank 1.95% Glacier Bank 1.42% Heritage Bank 1.53% Peer Average 1.48% WaFd Bank 1.28% WaFd Bank (excluding PPP loans with zero ACL) 1.36% WaFd Bank (Commercial Loans) 1.56% WaFd Bank (Commercial Loans excluding PPP loans) 1.74% WaFd Bank (Consumer Loans) 0.96% 10

Single Family Residential Portfolio Current Loan to Value as of June 30, 2020, Average Loan to Value is 39% $989 million $2.4 billion $769 million $67 million $1.4 billion Amount % of Portfolio SFR Delinquencies as of 9/30/2020 $26 million 0.5% Fiscal Year SFR Net Charge Offs (Recoveries) for ($1.2 million) (0.02%) the year‐ended 9/30/2020 11
