Attached files
| file | filename |
|---|---|
| EX-99.1 - PRESS RELEASE - COMMUNITY FINANCIAL CORP /MD/ | exh_991.htm |
| EX-10.2 - EXHIBIT 10.2 - COMMUNITY FINANCIAL CORP /MD/ | exh_102.htm |
| EX-10.1 - EXHIBIT 10.1 - COMMUNITY FINANCIAL CORP /MD/ | exh_101.htm |
| EX-4.1 - EXHIBIT 4.1 - COMMUNITY FINANCIAL CORP /MD/ | exh_41.htm |
| 8-K - FORM 8-K - COMMUNITY FINANCIAL CORP /MD/ | f8k_101420.htm |
Exhibit 99.2

1 Subordinated Debt Investor Presentation September 2020 (NASDAQ: “ T C F C ”)

Disclaimer 2 This investor presentation contains, and future oral and w ritten statements of The Community Financial Corporation (the “ Company” or “TCFC”) and its w holly - ow ned banking subs idiary, Community Bank of the Chesapeake (the “Bank”), and its management may contain, statements about future events that constitute forw ard - looking statements w ithin the meaning of the Private Securities Litigation Reform Act of 1995 . Forw ard - looking statements may be identified by references to a future period or periods or by the use of the w ords "believe," "expect," "anticipate," "intend," "estimate," "assume," "w ill," should," " plan," and other similar terms or expressions . Forw ard - looking statements include, but are not limited to : (i) projections and estimates of revenues, expenses, income or loss, earnings or loss per share, and other financial items, inc luding our estimated financial results for the third quarter of 2020 , (ii) statements of plans, objectives and expectations of the Company or its management, (iii) statements of future economic performance, and (iv) statements of assumptions underlying such statements . Forw ard - looking statements should not be relied on because they involve know n and unknow n risks, uncertainties and other factors, some of w hich are beyond the control of the Company and the Bank . These risks, uncertainties and other factors may cause the actual results, performance, and achievements of the Company and the Bank to be materially different from the anticipated future results, performance or achievements expressed in, or implied by, the forw ard - looking statements . Factors that could cause such differences include, but are not limited to, local, regional, national and international economic conditions, the extent of the impact of the COV ID - 19 pandemic, including the impact of actions taken by governmental and regulatory authorities in response to such pandemic, such as the CA RES Act and the programs established thereunder, and our participation in such programs, volatility of the financial markets, changes in interest rates, regulatory considerations, competition and market expansion opportunities, changes in non - interest expenditures or in the anticipated benefits of such expenditures, the receipt of required regulatory approvals, changes in non - performing assets and charge - offs, changes in tax laws, current or future litigation, regulatory examinations or other legal and/or regulatory actions, the impact of any tariffs, terrorist threats and attacks, acts of w ar or threats thereof or other pandemics . Therefore, the Company can give no assurance that the results contemplated in the forw ard - looking statements w ill be realized . For more information about these factors, please see our reports filed w ith or furnished to the Securities and Exchange Commission (the “ SEC”), including the Company’s most recent Annual Report on Form 10 - K and Quarterly Report on Form 10 - Q on file w ith the SEC, inc luding the sections entitled " Ris k Factors" and " Management's Discussion and Analysis of Financial Condition and Results of Operations . " Any forw ard - looking statements contained in this investor presentation are made as of the date hereof, and the Company undertakes no duty, and spec ifically disclaims any duty, to update or rev ise any such statements, w hether as a result of new information, future events or otherw ise, except as required by applicable law . This investor presentation has been prepared by the Company solely for informational purposes based on its ow n information, as w ell as information from public sources . Certain of the information contained herein may be derived from information provided by industry sources . The Company believes such information is accurate and that the sources from w hich it has been obtained are reliable . How ever, the Company has not independently verified such information and cannot guarantee the accuracy of such information . This investor presentation has been prepared to assist interested parties in making their ow n evaluation of the Company and does not purport to contain all of the information that may be relevant . In all cases, interested parties should conduct their ow n investigation and analysis of the Company and the data set forth in the investor presentation and other information provided by or on behalf of the Company . This investor presentation is not an offer to sell securities and it is not soliciting an offer to buy securities in any state w here the offer or sale is not permitted . Neither the SEC nor any other regulatory body has approved or disapproved of the securities of the Company or passed upon the accuracy or adequacy of this presentation . Any representation to the contrary is a criminal offense . Pro Forma and Projected Information This investor presentation contains certain pro forma and projected information, including projected pro forma information that reflects the Company’s current expectations and assumptions. This pro forma information does not purport to present the results that the Company w ill ultimately realize. Non - GAAP Financials This investor presentation includes certain non - GAA P financ ial measures intended to supplement, not substitute for, comparable GAAP measures and the Company’s reported results prepared in accordance w ith GAAP. Reconciliations of non - GAAP financial measures to GAA P financial measures are provided at the end of the presentation. Numbers in this presentation may not sum due to rounding.

Terms of Proposed Offering 3 Security Subordinated Notes Amount $20 Million Sub Debt Rating BBB - by Kroll Bond Rating Agency Structure Fixed - to - Floating Rate Issuance Type Private Placement with Registration Rights Term 10 Years Call Date 5 Years Use of Proceeds Issuer The Community Financial Corporation (NASDAQ: TCFC) Sole Placement Agent General corporate purposes, to support bank regulatory capital ratios, and potential common stock share repurchases Piper Sandler & Co.

Experienced Leadership Team William J. Pasenelli is President and Chief Executive Officer of The Community Financial Corporation and Vice Chairman and Chief Executive Officer of Community Bank of the Chesapeake. Mr. Pasenelli joined the Bank as Chief Financial Officer in 2000 and was named President of the Bank in 2010, President of The Community Financial Corporation in 2012, Chief Executive Officer in July 2014 and Vice Chairman and Chief Executive Office of Community Bank of the Chesapeake in July 2016. Before joining the Bank, Mr. Pasenelli had been Chief Financial Officer of Acacia Federal Savings Bank, Annandale, Virginia, since 1987. Mr. Pasenelli is a member of the American Institute of Certified Public Accountants and the Greater Washington Society of Certified Public Accountants and other civic groups. Mr. Pasenelli graduated Magna Cum Laude from Duke University with a Bachelor of Arts degree in Management Science. He is a graduate of the National School of Banking James M. Burke serves as Executive Vice President of the Company and President of the Bank. Before his appointment as President of the Bank in 2016, he served as Executive Vice President and Chief Risk Officer. Before joining the Bank in 2005, Mr. Burke served as Executive Vice President and Senior Loan Officer of Mercantile Southern Maryland Bank. Mr. Burke has over 20 years of banking experience. Mr. Burke is the former Chairman of the Board of Directors of University of Maryland Charles Regional Medical Center, Trustee for St. Mary’s Ryken High School, Trustee for Historic Sotterley Plantation and is active in other civic groups . Mr . Burke is a Maryland Bankers School graduate and holds a Bachelor of Arts from High Point University . He is also a graduate of the East Carolina Advanced School of Commercial Lending and attended the Harvard Business School Program on Negotiation Todd L. Capitani serves as Executive Vice President, Chief Financial Officer of the Company and the Bank. Before joining the Bank in 2009, Mr. Capitani served as a Senior Finance Manager at Deloitte Consulting and as Chief Financial Officer at Ruesch International, Inc. Mr. Capitani has over 25 years of experience in corporate finance, controllership and external audit. Mr. Capitani is involved with several local charities, religious and community organizations. Mr. Capitani is a member of the American Institute of Certified Public Accountants and other civic groups. He serves on the Board of Directors for Annmarie Sculpture Garden & Arts Center. Mr. Capitani is a Certified Public Accountant and holds a Bachelor of Arts from the University of California at Santa Barbara. He also attended the Harvard Business School Program on Negotiation and the Yale School of Management Strategic Leadership Conference Talal Tay serves as Executive Vice President, Chief Risk Officer of the Bank. Mr. Tay provides oversight to the compliance department and leadership to the risk, credit, loan review and information security departments. He has worked in the audit and risk areas of financial services for more than 15 years. Prior to joining Community Bank, Mr. Tay held various positions in the audit and risk areas of the financial services industry, including 2 years of international experience with E&Y, specializing in audits of financial institution clients and risk management framework methodologies, and 10 years with Cullen Frost Audit. Mr. Tay earned a bachelor's degree in business marketing from Florida State University and accounting studies from the University of Texas at San Antonio. He has a Certified Anti - Money Laundering Specialist designation. 4

The Community Financial Corporation 5 x The Community Financial Corporation (NASDAQ: TCFC) is the bank holding company for Community Bank of the Chesapeake x $2.1 billion in assets at June 30,2020 and market capitalization of approximately $122 Million (1) x Headquartered in Waldorf, MD with 14 office locations in Maryland and Virginia • 12 Branches: 11 in the Southern Maryland counties of Calvert, Charles and St. Mary’s and 1 in Virginia in the City of Fredericksburg • 4 Loan Production Offices (LPOs): 3 in Maryland (La Plata, Prince Frederick and Leonardtown) and 1 in Virginia (Fredericksburg) (2) x Average branch size of greater than $125 million significantly exceeds industry average x Relationship banking focus; high touch with direct access to senior decision makers x Current platform has capacity to support future organic growth 1) Market data as of 09/25/2020. 2) Two LPOs are located within branch offices.

#1 Market Share Position in Southern Maryland (1) Existing Franchise TCFC (12) Rank Deposit Market Share – Sou Institution (ST) thern Maryl Deposits in Market ($mm) and M a r k e t Share (%) 1 $1 , 60 5 25 . 8 % 2 PNC Financial Services Group Inc. 1 , 21 8 19 . 6 % 3 Bank of America Corp. 1 , 15 8 18 . 7 % 4 Truist (formerly BB&T/Suntrust) 961 15 . 5 % 5 Wesbanco (formerly Old Line Bank) 616 9 . 9 % 6 M&T Bank Corp. 278 4 . 5 % 7 Capital One Financial Corp. 171 2 . 8 % 8 Wells Fargo & Co. 109 1 . 7 % 9 Virginia Partners Bank (MD) 58 0 . 9 % 10 SONABANK 37 0 . 6 % FDIC Deposits in Southern Maryland Fredericksburg, VA market share improve $6,213 d from 3.3% 100% at June 30, x 2019 to 4.2% at June 30, 2020 as deposits increased $21.5 million to $68.2 million x Total FDIC insured deposits in Southern Maryland and Fredericksburg, VA were $7.8 billion at June 30, 2020 1) Source: Federal Deposit Insurance Corporation website. Deposit market share data as of 6/30/20. Southern Maryland includes t he counties of Calvert, Charles, and Saint Mary’s, MD. The Bank also maintains a branch in Fredericksburg, VA. Waldorf La Plata TCFC (12 branches) TCFC (4 LPOs) 6

Significant In - Market Federal Agency Presence x Department of Defense in - market presence: • National Energetics Center – Naval Support Facility at Indian Head (Charles County) • Naval Surface Warfare – Naval Support Facility at Dahlgren (King George County) • Air Force One – Andrews AFB (Prince Georges County) • US Marines – Quantico (Prince William County) • Defense Intelligence Agency & Defense Intelligence Analysis Center – Joint Base Anacostia - Bolling (Prince Georges County) • Naval Air Station Patuxent River (St. Mary’s County) x Additional major in - market Federal Agency presence: • Federal Aviation Administration (FAA) Unmanned Aerial Vehicle (UAV) Drones Program • Homeland Security • FBI & DEA – Quantico (Prince William County) 7

Investment Highlights 8 x More than 30 consecutive years of profitability x Strong, Experienced Management Team positioned for growth x Increased Profitability Momentum in Pre - Tax Pre - Provision income x COVID - 19: • Deferred loans of $264.9 million at June 30, 2020 represent 17.7% of gross loans • 85% of 06 - 30 - 2020 COVID - 19 Deferred Loans (first request deferrals) are scheduled to return to normal payments between October - December 2020 • The Company originated $130 million or 902 U.S. Small Business Administration Payroll Protection Program loans (“PPP Loans”) as of June 30, 2020 • Increased provisions to respond to COVID - 19; reserve/gross loans increased from 0.75% at 12/31/19 to 1.09% at 06/30/2020 x Positioned in Demographically Attractive Markets x Strong Market Share Position in Core Market. The Bank is focused on: • Continuing to improve funding costs • Maintaining expense control discipline • Opportunistic growth from market disruption (e.g., WesBanco – Old Line acquisition) • Increasing market share in Fredericksburg, VA and the Greater Fredericksburg Area

Financial Highlights 9 Highlights x Paid off $23.0 million of 6.25% Sub - debt in February 2020 x Issued $10.6 million of common stock in December 2019 x Improved earnings in 2019 due to changes in the Bank’s funding composition, the control of operating expenses and organic loan growth x 2020 YTD NIM expansion compared to PYTD x Net deferred fees of $3.8 million for PPP loans x 89% or $2.1 million increase to noninterest income YTD Q2 2020 compared to PYTD Q2 2019 x Strong expense control 1) Non - GAAP f inancial measures. Refer to Appendix to this presentation for a reconciliation. 2) Operating results are non - GAAP financial measures. Refer to Appendix to this presentation for a reconciliation. 3) NPLs include nonaccrual loans, loans 90+ days past due and accruing TDRs. NPAs include NPLs and OREO. ($000s except per share) 2016 FY 2017 FY 2018 FY 2019FY At or YTD 6/30/2020 Balance Sheet Total Assets $1,334,257 $1,405,961 $1,689,227 $1,797,536 $2,093,756 Gross Portfolio Loans ("GPLs") 1,088,982 1,150,044 1,346,922 1,454,172 1,492,745 U.S. SBA PPP Loans - - - - 129,384 Deposits 1,038,825 1,106,237 1,429,629 1,511,837 1,670,364 Tangible Common Equity (1) 104,426 109,957 140,841 168,541 176,797 Consolidated Capital (%) Tang. Common Equity / Tang. Assets (1) 7.83 % 7.82 % 8.41 % 9.44 % 8.50 % Leverage Ratio 9.02 8.79 9.50 10.08 9.76 Tier 1 Risk Based Ratio 10.62 10.53 11.23 11.91 11.89 Risk - Based Capital Ratio 13.60 13.40 13.68 14.16 12.94 TBV Per Share (1) 22.54 23.65 25.25 28.57 29.91 Asset Quality (%) NPAs/Assets (3) 1.99 % 1.71 % 2.02 % 1.46 % 1.30 % NCOs/Avg Portfolio Loans 0.10 0.03 0.07 0.16 0.29 NPLs (3 ) + OREO/GPLs + OREO 2.42 2.07 2.51 1.80 1.82 Reserves / NPLs (3) 52.4 71.5 42.3 59.1 69.5 Profitability Net Income $7,331 $7,208 $11,228 $15,272 $6,198 ROAA 0.60 % 0.52 % 0.70 % 0.88 % 0.65 % ROAA (Operating) (2) 0.60 0.78 0.87 0.88 0.65 Pre - tax Pre - Provision ("PTPP") ROAA (1) 1.15 1.26 1.05 1.32 1.57 ROACE 7.09 6.55 7.53 9.32 6.64 ROACE (Operating) (2) 7.09 9.70 9.34 9.32 6.64 PTPP ROACE (1) 13.64 15.80 11.27 14.07 13.91 Net Interest Margin 3.48 3.37 3.43 3.31 3.39 Efficiency Ratio (1) 64.8 60.4 61.5 59.8 51.5 Non - Interest Exp / Avg Assets (Operating) (2) 2.30 2.07 2.11 2.02 1.81 Net Operating Exp / Avg Assets (Operating) (2) 2.00 1.79 1.85 1.71 1.41 Diluted EPS $1.59 $1.56 $2.02 $2.75 $1.05 Diluted EPS (Operating) (2) 1.59 2.31 2.51 2.75 1.05

Loan Composition (12/31/2000) Loan Composition (6/30/2020) (1) 57% 1 – 4 family real estate and consumer loans 84% commercial real estate, residential rentals and commercial & industrial loans Loan Composition Transformation 1) PPP Loans of $129.4 million at 06/30/2020 are excluded from the above balances and metrics due to their temporary nature. 10

$ 9 1 7.7 $ 1,150.0 $1,089.0 $ 1,454.2 $1,346.9 $ 1,492.7 2015Y 2016Y 2017Y 2018Y 2019Y 2020Q2 x U.S. Small Business Administration Payroll Protection Program loans of $129.4 million at June 30, 2020 are excluded from the above balances and metrics due to their temporary nature. x Commercial loan portfolios were 84% of loans at June 30, 2020. Historical Loan Growth Since 2015 ($mm) Loan Composition (06/30/2020) YTD Yield: 4.43% Loan Composition 11

Asset Quality Metrics 12 Dollar values in thousands 6/ 3 0/ 2 020 Nonaccrual Loans $2 2 ,8 9 6 90+ Days Delinquent Accruing - Other Real Estate Owned 3,695 Nonperforming Assets $2 6 ,5 9 1 Restructured Loans $593 Loan Loss Reserve $1 6 ,3 1 9 Asset Quality Ratios (%) NPAs / Assets 1. 3 0 Reserves / Loans / (excluding PPP) 1. 0 9 Reserves / NPLs 69.48 NCOs / Avg. Loans (YTD) 0. 2 9

COVID - 19 Impacts 13 Customer and Employee Impacts x COVID - 19 loan modifications x Participating in U.S. Small Business Administration Paycheck Protection Program x Minimal disruption in customer service levels - - branch lobbies re - opened on June 8, 2020 x Shifted workforce to remote work as needed x Investments in technology platforms during last several years performed well in challenging operating environment x Implemented various HR related aspects of CARES Act and developed response plans for employee illness

US SBA PPP Loans x Originated 963 loans totaling $131 million with an average loan amount of $136,000. At June 30, 2020, there were 902 loans for $129 million x 889 loans or $129 million (98%) were for two - year term x Approximately 80% existing customers / 20% new customers x SBA / U.S. Treasury slow to provide guidance, ambiguity and operational glitches; potential regulatory review and compliance risk x Federal Reserve PPLF Credit Facility provides favorable rate (35bps) and capital treatment COVID - 19 Deferred Loans x The Company’s COVID - 19 deferred loans represent 17.7% of gross portfolio loans at June 30, 2020. All loans at June 30, 2020 were in their first requested deferral period. x Majority of the COVID - 19 deferred loans were granted a six - month interest only or P&I deferral and are scheduled to come off initial deferral period in Q4 2020 x As of August 31, 2020, the Company had $250.3 million of COVID - 19 deferred loans representing 16.8% of gross portfolio loans x Second deferral period loans totaled $18.9 million (six loans) as of September 24, 2020. These loans are scheduled to return to normal payments during the fourth quarter of 2020. x Additional deferral requests will consider customer needs based on impacted industry, borrower and guarantor capacity to service debt and current and additional regulatory guidance 14 COVID - 19 Impacts

COVID - 19 Deferred Loans COVID - Related Loan Deferrals June 30, 2020 COVID - 19 Deferred Loans by Financial Statement Line Interest Loan Deferred % of Number R e c ogn i z e d Scheduled Scheduled Portfolio at Loans at Total of Not Monthly Monthly (dollars in thousands) 06/30/2020 06 / 30 / 202 0 Loans Loans Received Principal Interest Commercial real estate $996,111 $228,117 15 . 28 % 153 $2 , 25 9 $813 $831 Residential first mortgages 165,670 13 , 54 5 0 . 91 % 41 160 40 48 Residential rentals 132,590 8 , 64 3 0 . 58 % 26 110 33 38 Construction and land development 37 , 58 0 - 0 . 00 % - - - - Home equity and second mortgages 33 , 87 3 394 0 . 03 % 5 6 2 1 Commercial loans 63 , 24 9 745 0 . 05 % 7 11 1 3 Consumer loans 1 , 11 7 11 0 . 00 % 3 - - - Commercial equipment 62 , 55 5 13 , 39 5 0 . 90 % 77 11 6 22 1 4 8 Total $1 , 492 , 74 5 $264 , 85 0 17 . 74 % 312 $2 , 66 2 $1 , 11 0 $969 COVID - 19 Deferred Loans - Next Payment Due By Month (dollars in thousands) Deferred Loans at 06/30/2020 % of D e f e rr e d Loans Number of Loans July - 20 $11,629 4 . 4 % 18 August - 20 17 , 53 0 6 . 6 % 21 September - 20 5 , 48 0 2 . 1 % 31 October - 20 96 , 34 9 36 . 4 % 113 79% of Total Deferrals by $ November - 20 113,012 42 . 7 % 99 December - 20 15 , 76 8 6 . 0 % 21 January - 21 5 , 08 1 1 . 9 % 9 Total $264 , 84 9 100 . 0 % 312 ** Gross portfolio loans of $1.493 billion exclude US SBA PPP loans. 15

COVID - Related Loan Deferrals 16 COVID - 19 Deferred Loans COVID - 19 Deferred Loans by NAICS Industry (dollars in thousands) % of Loan Deferrals at # of Portfolio Loans by NAICS Type 06/30/2020 Loans 06 / 30 / 202 0 Real Estate Rental and Leasing $122 , 15 5 93 8 . 18 % Accommodation and Food Services 42 , 78 8 19 2 . 87 % Other Services (except Public Administration) 35 , 11 0 24 2 . 35 % Health Care and Social Assistance 18 , 54 1 32 1 . 24 % Professional, Scientific, and Technical Services 7 , 47 2 13 0 . 50 % Construction 6 , 39 6 24 0 . 43 % Arts, Entertainment, and Recreation 4 , 39 6 5 0 . 29 % Transportation and Warehousing 4 , 38 7 16 0 . 29 % Retail Trade 2 , 12 0 11 0 . 14 % Educational Services 1 , 69 8 3 0 . 11 % Manufacturing 1 , 40 0 6 0 . 09 % Other Industries, Residential Mortgages, Consumer 18 , 38 7 66 1 . 23 % Total $264 , 85 0 312 17 . 74 %

COVID - Related Loan Deferrals COVID - 19 Deferred Loans (Dollars in thousands) Loan Type Balance at 06/30/2020 # of Loans Loan Type Balance at 06/30/20 Real Estate Rental and Leasing Other Services (except Public Administration Lessors of Nonresidential Buildings $98,884 53 Religious Organizations Lessors of Residential Buildings and Dwellings 12,547 18 Civic and Social Organizations Other Activities Related to Real Estate 4,335 8 Other Lessors of Other Real Estate Property 3,506 6 Lessors of Miniwarehouses and Self - Storage Units 1,211 1 H Other 1,672 $1 22,1 Accommodation and Food Services Hotels (except Casino Hotels) and Motels Full - Service Restaurants Caterers Limited - Servic 17

Hotel Lending Exposure Number of Hotels by Flag Outstanding Balance by Flag x 100% of the hotel portfolio is pass rated x $60.3 million, or 4%, of the total loan portfolio x 15 hotels in the loan portfolio • 27 total loans for $60.3 million • 10 PPP loans for $2.1 million • 3 hotels are under construction for $13.4 million • 15 hotel loans for $58.2 million are secured by real estate x 9 hotels on deferral for $41.3 million • 2 hotels deferred I/O for 6 months for $8.2 million • 5 hotels on 6 month P&I deferral for $21.4 million • 1 hotel on 4 month P&I deferral for $8.6 million • 1 hotel on 3 month I/O and 3 month P&I deferral for $3.1 million (was under construction) x Average loan size of $3.0 million per hotel x 64.5% average LTV x No hotels in Washington, DC or Baltimore 15 Hot e ls 18

Hotel Loan Details 19 Brand Name # Hotels # Loans 8/31/2020 Balance Choice Hotels 3 2.5 $14 , 791 , 14 7 IHG 3 5 16 , 973 , 11 0 Best Western 1 2 4 , 464 , 68 0 Affordable Suites 2 3 7 , 148 , 17 4 Marriott 1 1 4 , 220 , 26 5 RLH 1 0.5 1 , 969 , 87 3 Hilton 1 1 2 , 609 , 23 2 Wyndham 1 0.5 2 , 786 , 73 5 Red Roof Inn 1 0.5 1 , 969 , 87 3 Independent 1 1 1 , 254 , 15 8 Total Hotel Loans 15 17 $58 , 187 , 24 8 PPP Loans 10 2 , 143 , 38 1 Total Loans 15 27 $60 , 330 , 62 9 Under Construction 3 $13 , 447 , 79 7

Map of Hotel Loans VIRGINIA MARYLAND D E L A W A R E 95 20
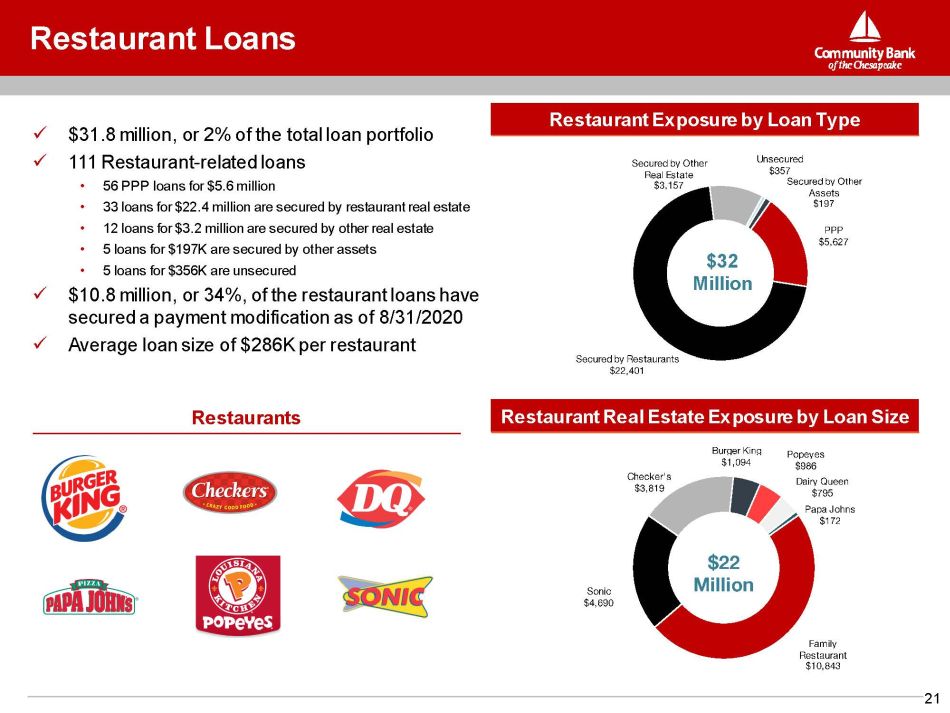
Restaurant Loans x $31.8 million, or 2% of the total loan portfolio x 111 Restaurant - related loans • 56 PPP loans for $5.6 million • 33 loans for $22.4 million are secured by restaurant real estate • 12 loans for $3.2 million are secured by other real estate • 5 loans for $197K are secured by other assets • 5 loans for $356K are unsecured x $10.8 million, or 34%, of the restaurant loans have secured a payment modification as of 8/31/2020 x Average loan size of $286K per restaurant Restaurant Real Estate Exposure by Loan Size Restaurant Exposure by Loan Type R e staura n ts $32 Million 21

Restaurant Loan Details 22 Restaurant Related Loans Count 8/31/2020 Balance Secured by Restaurants Real Estate Count 8/31/2020 Balance PPP 56 $5 , 628 , 64 8 Family Restaurant 19 $10 , 843 , 23 6 Secured by Restaurant Real Estate 33 22 , 400 , 73 1 Sonic 2 4 , 690 , 25 5 Secured by Other Real Estate 12 3 , 156 , 95 4 Checker's 7 3 , 819 , 27 7 Secured by Other Assets 5 197 , 60 1 Burger King 2 1 , 094 , 09 2 Unsecured 5 356 , 55 0 Popeyes 1 986 , 44 9 Restaurant Related Loans Total 111 $31 , 740 , 48 5 Dairy Queen 1 795 , 48 5 Papa Johns 1 171 , 93 6 COVID Deferrals 13 $10 , 766 , 19 5 Total 33 $22 , 400 , 73 1

AAA $ 208,247 AA 24,454 A 2,281 BB - B+ - Total $ 234,982 % AAA 88 . 62 % Security Portfolio June 30, 2020 (dollars in thousands) Fair Value Securities available - for - sale ("AFS") Asset - backed securities issued by GSEs and U.S. Agencies Residential Mortgage Backed Securities ("MBS") $ 30,931 Residential Collateralized Mortgage Obligations ("CMOs") 131 , 93 3 U.S. Agency 1 , 31 1 Asset - backed securities issued by Others: Residential CMOs 320 Student Loan Trusts 25 , 03 0 Callable GSE Agency Bonds - Certificates of Deposit Fixed 250 U.S. government obligations 1 , 49 8 Municipal bonds 43,709 Total securities available - for - sale $ 234,982 Equity securities carried at fair value through income CRA investment fund $ 4,831 Non - marketable equity securities Other equity securities $ 209 x Portfolio’s main purpose is to serve as a source of on balance sheet liquidity x Portfolio supports interest rate risk management x 70% of AFS portfolio is in GSE and U.S. Agency investments. x Student Loan Trusts are 97% guaranteed by U.S. Department of Education x Policy requires all investments AA rated or better at purchase date June 30, 2020 Credit Rating Amount (dollars in thousands) 23

$906.9 $1,106.2 $1,038.8 $1,511.8 $1,429.6 $1,670.4 $144.9 $1 5 9.8 $773.2 $876.4 $947.7 $388.5 $375.6 $142.8 $461.1 $432.8 $494.8 $4 5 1.6 $447.0 $209.4 $394.2 $241.2 $366.5 $356.2 2015Y 2016Y 2017Y Total Interest Bearing Transaction 2018 Y 2019Y 2020 Q 2 Non - Interest Bearing Transaction Time Deposits x Success in increasing transaction deposits, including noninterest bearing deposits, has helped alleviate pressure on cost of funds x Total deposits increased ~$560 million since December 31, 2017 • County First acquisition added ~$200 million in deposits in 2018 • Deposits have increased ~$160 million between Q4 2019 and Q2 2020 x Time deposits steadily decreased as a percentage of deposit funding since 2015 Historical Deposit Growth Since 2015 ($mm) Deposit Composition (06/30/2020) MRQ Cost: 0.48% Deposit Composition 24

12. 3% 20. 7% 18. 7% 6. 4% 2. 6% 4. 0% 2015 Y 2016 Y 2017 Y 2018 Y 2019 Y 2020 Q 2 Wholesale Funds/Assets (%) (1) Increasing Liquidity (1) Wholesale funding excludes Federal Reserve PPPLF facility and includes FHLB advances and brokered deposits. Reciprocal deposits are considered core deposits. Loan totals exclude U.S. SBA PPP Loans x FHLB available collateral at June 30, 2020 was $360 million x On balance sheet cash balances were $146 million x Core deposit growth over last three years has allowed for lower borrowings x Increased liquidity provides more opportunities to lower funding costs over time 101.2% 25 104.8% 104.0% 96.2% 94. 2% 89. 4% 2015Y 2016Y 2017Y 2018Y 2019Y 20 2 0 Q 2 Loans/Deposits (%) (1)

3. 2 1% 3. 3 1% 3. 5 6% 3. 6 8% 3. 6 0% 3 . 48 % 3. 3 7% 3.4 3 % 3. 3 1% 3. 3 9% 1. 5 9% 1. 2 1% 0. 8 8% 0. 7 4% 0.7 5 % 0 . 73 % 0. 8 1% 0.9 9 % 1. 2 2% 0. 7 2% 1.4 3 % 1. 0 5% 0.7 1 % 0. 5 6% 0. 5 6% 0. 8 0% 1. 0 6% 0. 6 4% 0.48% 0.48% 2011 2012 2013 2014 2015 2016 2017 2018 2019 2020YTD Net Interest Margin Cost of Funds Cost of Deposits 26 Net Interest Margin vs. Cost of Funding Cost of Funding and Net Interest Margin

Return on Average Assets (%) PTPP = Pre - tax Pre - provision Income Increasing Profitability – ROAA 0. 6 0% 0. 7 8% 0. 8 8% 0. 6 5% 0 . 60 % 0. 5 2% 0. 7 0% 0. 8 8% 0. 6 5% 1. 1 5% 1. 2 6% 1. 0 5% 0.87% 1. 3 2% 1. 5 7% 2 0 16 2 0 17 2 0 18 2 0 19 2020 YTD O p erating ROA A ( 1 ) Re p orted ROAA PT P P R O AA x The combination of improved expense discipline, continued organic growth and increased noninterest income have produced steady improvement in performance x Closed four of five County First locations during May 2018. Net of one branch (La Plata) added to branch network 1) Operating results are non - GAAP financial measures. Refer to Appendix to this presentation for a reconciliation. 27

Return on Average Common Equity (%) PTPP = Pre - tax Pre - provision Income Increasing Profitability – ROACE 7. 0 9% 1) Operating results are non - GAAP financial measures. Refer to Appendix to this presentation for a reconciliation. 28 9. 7 0% 9. 3 3% 9. 3 2 7. 0 9% 6. 5 5% 7.5 3 % 1 3 .64% 15. 8 0% 1 1 . 27 % 14. 0 7% 15. 9 5% 2 0 16 ( 1 )

68.0% 64.8% 60.4% 61 .5 % 59.8% 51.5% 2015Y 2016Y 2017Y 2018Y 2019Y 2020YTD 2.30% 29 2.13% 1.55% 2.16% 2.10% 2.00% 1.89% 1.79% 1.85% 1.75% 1.71% 1.41% 2015Y 2016Y 2017Y 2018Y 2019Y 2020YTD Re p orted O per a t i ng x Expense control remains a top priority through the COVID - 19 crisis x Increased noninterest income and net interest income in 2020 while maintaining expenses has increased efficiency and PTPP x Ongoing review of operating expense base for specific savings initiatives, including closure of underperforming branches x Efficiency ratio and net operating expense below peer institutions Efficiency & Net Operating Expenses Efficiency Ratio (1) 1) Operating results non - GAAP financial measures. Refer to Appendix to this presentation for a reconciliation. Net Operating Expense / Avg. Assets (1)

Consolidated Regulatory Capital Ratios Leverage Ratio Tier 1 Capital Ratio NOTE: TCE/TA is a non - GAAP financial measure. Refer to Appendix to this presentation for a reconciliation. Total Capital Ratio TCE / TA 13.60% 13.40% 13.68% 14.16% 7.83% 7.82% 8.41 % 9.44% 8.50% 2016 2017 2018 2019 2 0 2 0 Q 2 9.02% 8.79% 9.50% 1 0 .0 8 % 9.76% 2016 2017 2018 2019 2 0 2 0 Q 2 1 0 . 6 2 % 30 1 0 . 5 3 % 1 1 .2 3% 11. 91% 1 1 . 8 9 % 2016 2017 2018 2019 2 0 2 0 Q 2

Bank Regulatory Capital Ratios Leverage Ratio Tier 1 Capital Ratio Total Capital Ratio 1 3 .3 3 % 1 2 .9 5 % 1 3 .3 8 % 1 3 .2 6 % 10.56% 1 0 .0 3 % 1 0 .6 6 % 1 0 .5 9 % 1 2 .4 3 % 31 1 2 .0 4 % 1 2 .5 8 % 12 . 53% 1 1 .6 9 % 2016 2017 2018 2019 2 0 2 0Q 2

Pro Forma Capitalization Table: Holding Company NOTE: TRUPS are represented by two issuances: One $5.0 million security with variable rate of 90 - day LIBOR rate plus 1.70% and a $7.0 million issue with variable rate of 90 - day LIBOR rate plus 2.60%. TCE/TA is a non - GAAP f inancial measure. Refer to Appendix to this presentation for a reconciliation. Assumes $20M subordinated debt issued, 20% risk weighting, 1.50% placement agent’s fee ~50% of net proceeds, or $9.7mm, will be initially retained at the Company with $10.0 million down streamed to Bank A c t u a l Pro Forma (Dollars in thousands) 6 / 30 / 202 0 Adjustments 6 / 30 / 202 0 Regulatory Capital Common Equity Tier 1 Capital $172 , 75 1 $172 , 75 1 TRUPs 12 , 00 0 12 , 00 0 Tier 1 Capital 184 , 75 1 184 , 75 1 ALLL 16 , 37 0 16 , 37 0 Sub Debt -- $20 , 00 0 20 , 00 0 Tier 2 Capital 16 , 37 0 20 , 00 0 36 , 37 0 Total Capital 201 , 12 1 20 , 00 0 221 , 12 1 Total Assets for Regulatory Ratios Risk - Weighted Assets 1 , 553 , 88 4 3 , 94 0 1 , 557 , 82 4 Total Assets For Leverage Ratio 1 , 890 , 54 3 19 , 70 0 1 , 910 , 24 3 TCE / TA Tangible Common Equity 176 , 79 7 176 , 79 7 Tangible Assets 2 , 081 , 11 1 19 , 70 0 2 , 100 , 81 1 Capital Ratios TCE / TA 8 . 50 % 8 . 42 % Leverage Ratio 9.76 9 . 6 7 Tier 1 Ratio 11.89 11 . 8 6 Total Capital Ratio 12.94 14 . 1 9 32

Pro Forma Capitalization Table: Bank Level Assumes $10mm of net proceeds is initially down - streamed to the Bank Assumes 20% risk weighting (Dollars in thousands) Actual Pro For 6/30/2020 Adjustments Regulatory Capital Common Equity Tier 1 Capital $181 , 40 9 $10,000 Tier 1 Capital 181 , 40 9 1 ALLL Sub Debt Tier 2 Capital 16 , 37 0 -- 16, Total Capital Total Assets for Regulatory Ratios Risk - Weighted Assets Total Assets For Leverage Rat Capital Ratios Leverage Rati Tier 1 R T 33

Historical Double Leverage and Interest Coverage NOTE: Assumes $20 million gross subordinated debt issuance with illustrative coupon of 5.00% and $10 million of proceeds downstreamed to the Bank $ in thousands For the Twelve Months Ended Six Months Ended 12 / 31 / 201 6 12 / 31 / 201 7 12/31/2018 12/31/2019 6/30/2020 Double Leverage Investments in Subsidiaries $136,480 $139 , 41 8 $185 , 07 3 $202 , 60 4 $198 , 10 0 Consolidated Equity 104,426 109 , 95 7 154 , 48 2 181 , 49 4 189 , 44 2 Double Leverage Ratio 130.7% 126 . 8 % 119 . 8 % 111 . 6 % 104 . 6 % Proposed Subordinated Debt Offering Downstreamed to Bank $10 , 00 0 Pro Forma Bank - Level Equity Assuming 51% Downstreamed to Bank $208 , 10 0 Pro Forma Double Leverage Ratio 109 . 8 % Interest Coverage Total Deposit Interest $4,695 $5 , 94 6 $10 , 68 2 $15 , 37 8 $4 , 98 1 Other Borrowing Interest 3,447 4 , 23 6 3 , 60 4 3 , 54 1 1 , 11 9 Total Interest Expense 8,142 10 , 18 2 14 , 28 6 18 , 91 9 6 , 10 0 Pre - tax Income 11,747 16 , 36 5 15 , 40 1 20 , 93 7 7 , 27 7 Interest Coverage (including deposit expense) 2.44x 2 . 61 x 2 . 08 x 2 . 11 x 2 . 19 x Interest Coverage (excluding deposit expense) 4.41x 4 . 86 x 5 . 27 x 6 . 91 x 7 . 50 x New Holding Company Subordinated Debt Expense (5.00%) $500 Pro Forma Interest Coverage (including deposit expense) Pro Forma Interest Coverage (excluding deposit expense) 2.03x 5.19x 34

Recent Developments 35 x The Company expects to have a stable Q3, with similar net income and a lower provision than Q2. Balance sheet composition will be very similar to Q2. x Net Interest Income will be stable compared to Q2 due to similar earning asset sizes and minimal margin compression during Q3. x Non - interest expense expected to be at trend, which has been between $9.4 - $9.7 million per quarter. Focused on maintaining efficiency ratios in the low 50s (51.5% YTD Q2) x The loan portfolio continues to be closely monitored • Increases expected in ALLL balance ($16.3 million and 1.09% at Q2) • Q3 provision expected to be between $2.0 - $2.5 million, compared to $3.5 million in Q2 • Stability in non - performing assets. No large charge - offs expected in Q3 for loans or OREO. • Overall trends for COVID - 19 deferral customers appear positive - monitoring hotel and restaurant exposure closely. x Payroll Protection Program Loan forgiveness approvals and recognition of deferred fees not anticipated until Q4 and Q1 2021 x High levels of liquidity and cash and very low FHLB borrowings expected to continue through Q4 x Estimated Q3 balance sheet highlights: • Assets • Loans • Deposits $2.1 billion $1.5 billion (excluding PPP) $1.6 billion
A pp e nd i x 36

Historic Balance Sheet 37 NOTE: TRUPS are represented by two issuances: One $5.0 million security with variable rate of 90 - day LIBOT RATE PLUS 1.70% and a $7.0 million issue with variable rate of 90 - day LIBOR rate plus 2.60% (Dollar in thousands) Year En ded December 31, Assets 2015 2016 2017 2018 2019 Cash and Cash Equivalents $11 , 13 9 $11,263 $15,417 $33 , 03 6 $32 , 46 Available for Sale Securities 35 , 11 6 53,033 68,164 119 , 97 6 208 , 18 Held to Maturity Securities 109 , 42 0 109,247 99,246 96 , 27 1 Other Securities 6 , 93 1 7,235 7,397 8 , 45 8 8 , 32 Total Cash & Securities 162 , 60 6 180,778 190,224 257 , 74 1 248 , 98 Payroll Protection Program ("PPP") Loans – – – – Portfolio Loans Held for Investment 917 , 74 0 1,089,379 1,151,130 1 , 348 , 10 5 1 , 456 , 05 Gross Loans Held for Investment 917 , 74 0 1,089,379 1,151,130 1 , 348 , 10 5 1 , 456 , 05 Loan Loss Reserve ( 8 , 540 ) (9,860) (10,515) ( 10 , 976 ) ( 10 , 942 Loans Held for Sale – – – – Total Net Loans Held for Investment 909 , 20 0 1,079,519 1,140,615 1 , 337 , 12 9 1 , 445 , 10 Real Estate Owned and HFI 9 , 44 9 7,763 9,341 8 , 11 1 7 , 77 Goodwill and Intangible Assets – – – 13 , 64 1 12 , 95 Total Servicing Rights 21 9 128 54 1 8 Fixed Assets 22 , 15 6 22,550 21,391 22 , 92 2 30 , 47 Interest Receivable 3 , 21 8 3,979 4,511 4 , 95 7 5 , 01 Prepaid Expense 42 3 – 351 – Bank - owned Life Insurance 27 , 83 6 28,625 29,398 36 , 29 5 37 , 18 Other Assets 8 , 22 5 10,915 10,076 8 , 41 3 10 , 04 Total Other Assets 61 , 85 8 66,069 65,727 72 , 58 7 82 , 72 Total Assets $1 , 143 , 33 2 $1,334,257 $1,405,961 $1 , 689 , 22 7 $1 , 797 , 53 Liabilities Deposits $906 , 89 9 $1,038,825 $1,106,237 $1 , 429 , 62 9 $1 , 511 , 83 FHLB Borrowings 91 , 61 7 144,559 142,998 55 , 43 6 45 , 37 Trust Preferred (FAS 150) 12 , 00 0 12,000 12,000 12 , 00 0 12 , 00 Subordinated Debt 23 , 00 0 23,000 23,000 23 , 00 0 23 , 00 PPP Liquidity Facility ("PPPLF") Advance – – – – Lease Liabilities - Operating Leases – – – – 8 , 49 Total Debt 126 , 61 7 179,559 177,998 90 , 43 6 88 , 86 Other Liabilities 10 , 03 3 11,447 11,769 14 , 68 0 15 , 34 Total Liabilities $1 , 043 , 54 9 $1,229,831 $1,296,004 $1 , 534 , 74 5 $1 , 616 , 04 Total Equity $99 , 78 3 $104,426 $109,957 $154 , 48 2 $181 , 49 Total Liabilities & Shareholders' Equity $1 , 143 , 33 2 $1,334,257 $1,405,961 $1 , 689 , 22 7 $1 , 797 , 53
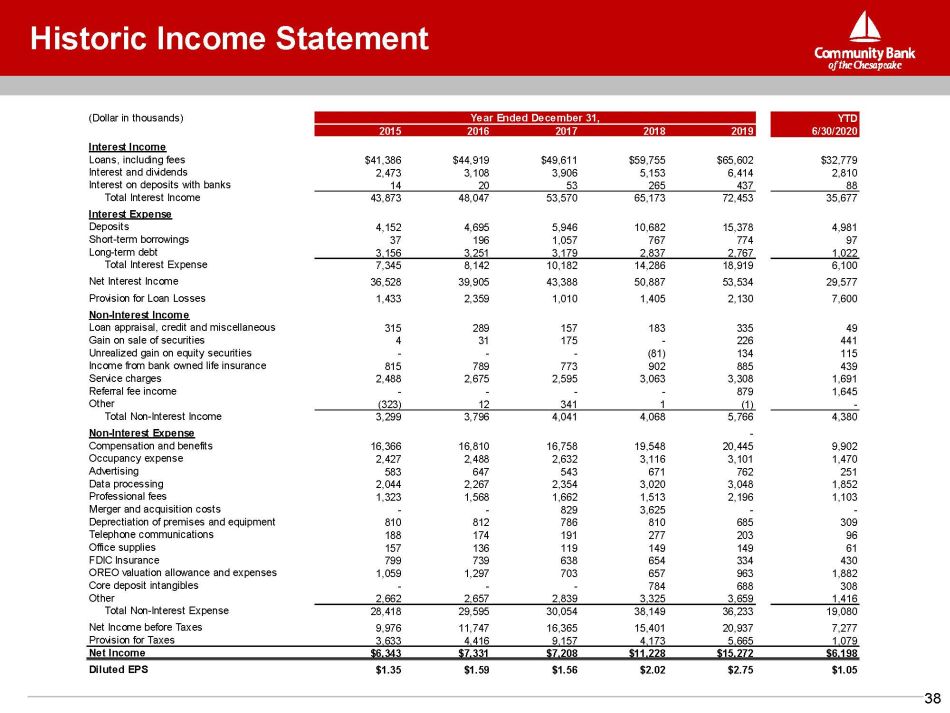
Historic Income Statement 38 (Dollar in thousands) 2015 Year End 2016 ed December 31, 2017 2018 2019 Interest Income Loans, including fees $41 , 38 6 $44 , 91 9 $49 , 61 1 $59 , 75 5 $65 , 60 2 Interest and dividends 2 , 47 3 3 , 10 8 3 , 90 6 5 , 15 3 6 , 41 4 Interest on deposits with banks 1 4 2 0 5 3 26 5 43 7 Total Interest Income 43 , 87 3 48 , 04 7 53 , 57 0 65 , 17 3 72 , 45 3 Interest Expense Deposits 4 , 15 2 4 , 69 5 5 , 94 6 10 , 68 2 15 , 37 8 Short - term borrowings 3 7 19 6 1 , 05 7 76 7 77 4 Long - term debt 3 , 15 6 3 , 25 1 3 , 17 9 2 , 83 7 2 , 76 7 Total Interest Expense 7 , 34 5 8 , 14 2 10 , 18 2 14 , 28 6 18 , 91 9 Net Interest Income 36 , 52 8 39 , 90 5 43 , 38 8 50 , 88 7 53 , 53 4 Provision for Loan Losses 1 , 43 3 2 , 35 9 1 , 01 0 1 , 40 5 2 , 13 0 Non - Interest Income Loan appraisal, credit and miscellaneous 31 5 28 9 15 7 18 3 33 5 Gain on sale of securities 4 3 1 17 5 - 22 6 Unrealized gain on equity securities - - - ( 81 ) 13 4 Income from bank owned life insurance 81 5 78 9 77 3 90 2 88 5 Service charges 2 , 48 8 2 , 67 5 2 , 59 5 3 , 06 3 3 , 30 8 Referral fee income - - - - 87 9 Other ( 323 ) 1 2 34 1 1 ( 1 ) Total Non - Interest Income 3 , 29 9 3 , 79 6 4 , 04 1 4 , 06 8 5 , 76 6 Non - Interest Expense - Compensation and benefits 16 , 36 6 16 , 81 0 16 , 75 8 19 , 54 8 20 , 44 5 Occupancy expense 2 , 42 7 2 , 48 8 2 , 63 2 3 , 11 6 3 , 10 1 Advertising 58 3 64 7 54 3 67 1 76 2 Data processing 2 , 04 4 2 , 26 7 2 , 35 4 3 , 02 0 3 , 04 8 Professional fees 1 , 32 3 1 , 56 8 1 , 66 2 1 , 51 3 2 , 19 6 Merger and acquisition costs - - 82 9 3 , 62 5 - Deprectiation of premises and equipment 81 0 81 2 78 6 81 0 68 5 Telephone communications 18 8 17 4 19 1 27 7 20 3 Office supplies 15 7 13 6 11 9 14 9 14 9 FDIC Insurance 79 9 73 9 63 8 65 4 33 4 OREO valuation allowance and expenses 1 , 05 9 1 , 29 7 70 3 65 7 96 3 Core deposit intangibles - - - 78 4 68 8 Other 2 , 66 2 2 , 65 7 2 , 83 9 3 , 32 5 3 , 65 9 Total Non - Interest Expense 28 , 41 8 29 , 59 5 30 , 05 4 38 , 14 9 36 , 23 3 Net Income before Taxes 9 , 97 6 11 , 74 7 16 , 36 5 15 , 40 1 20 , 93 7 Provision for Taxes 3 , 63 3 4 , 41 6 9 , 15 7 4 , 17 3 5 , 66 5 Net Income $6 , 34 3 $7 , 33 1 $7 , 20 8 $11 , 22 8 $15 , 27 2 Diluted EPS $1 . 3 5 $1 . 5 9 $1 . 5 6 $2 . 0 2 $2 . 7 5

Consistent Shareholder Value Creation NOTE: Tangible book v alue per share is a non - GAAP financial measure. Refer to Appendix for a reconciliation. Additional shares outstanding from the capital raised below impacted year to year comparability of per share book value amounts: • In October 2013, the Company issued 1,591,300 shares of common stock for net proceeds of $27.4 million after commissions and related offering expenses. • In December 2019, the Company issued 312,747 shares of common stock in a priv ate placement offering for net proceeds of $10.6 million after offering expenses. Book value and tangible book value were the same until 2018 upon the acquisition of County First Bank: 39

Non - GAAP Reconciliation Tangible Book Value Per Share & Tangible Common Equity / Tangible Assets ‘‘Tangible book value per share’’ is defined as tangible stockholders’ equity less preferred equity and intangible assets divided by total common shares outstanding . We believe that this measure is important to many investors in the marketplace who are interested in changes from period to period in book value per common share exclusive of changes in intangible assets . (dollars in thousands, except share data) For the Years Ended 2001 2002 2003 2004 2005 2006 2007 2008 2009 2010 2011 Stockholders' Equity $ 25,586 $ 26,873 $ 27,912 $ 31,124 $ 34,578 $ 37,729 $ 48,847 $ 67,114 $ 68,190 $ 71,105 $ 75,454 Intangible Assets - - - - - - - - - - - Preferred Equity - - - - - - - ( 16 , 317 ) (16,317) ( 16 , 317 ) ( 20 , 000 ) Tangible Common Equity $ 25,586 $ 26,873 $ 27,912 $ 31,124 $ 34,578 $ 37,729 $ 48,847 $ 50,797 $ 51,873 $ 54,788 $ 55,454 Shares Outstanding 2,554,218 2 , 564 , 25 2 2,542,314 2,580,444 2 , 641 , 48 7 2,642,288 2,909,974 2 , 947 , 75 9 2,976,041 3,002,616 3 , 026 , 55 7 Tangible Book Value per Share $ 10.02 $ 10 . 4 8 $ 10.98 $ 12.06 $ 13 . 0 9 $ 14.28 $ 16.79 $ 17 . 2 3 $ 17.43 $ 18.25 $ 18 . 3 2 (dollars in thousands, except share data) For the Years Ended For the Period Ended 2012 2013 2014 2015 2016 2017 2018 2019 6/30/2019 6/30/2020 Stockholders' Equity $ 79,047 $ 110,730 $ 116,559 $ 99,783 $ 104,426 $ 109,957 $ 154,482 $ 181,494 $ 163,645 $ 189,442 Intangible Assets - - - - - - ( 13 , 641 ) ( 12 , 953 ) (13,285) (12,645) Preferred Equity (20,000) ( 20 , 000 ) (20,000) - - - - - - - Tangible Common Equity $ 59,047 $ 90,730 $ 96,559 $ 99,783 $ 104,426 $ 109,957 $ 140,841 $ 168,541 $ 150,360 $ 176,797 Total Assets $ 981,639 $1 , 023 , 82 4 $1,082,878 $1,143,332 $1 , 334 , 25 7 $1,405,961 $1,689,227 $1 , 797 , 53 6 $1,756,448 $2,093,756 Intangible Assets - - - - - - ( 13 , 641 ) ( 12 , 953 ) (13,285) (12,645) Tangible Assets $ 981,639 $1 , 023 , 82 4 $1,082,878 $1 , 143 , 33 2 $1 , 334 , 25 7 $1 , 405 , 96 1 $1 , 675 , 58 6 $1 , 784 , 58 3 $1,743,163 $2,081,111 Shares Outstanding 3,052,416 4 , 647 , 40 7 4,702,715 4,645,429 4 , 633 , 86 8 4,649,658 5,577,559 5 , 900 , 24 9 5,582,438 5,911,715 Tangible Book Value per Share $ 19.34 $ 19 . 5 2 $ 20.53 $ 21.48 $ 22 . 5 4 $ 23.65 $ 25.25 $ 28 . 5 7 $ 26.93 $ 29.91 Tangible Common Equity/Tangible Assets 6 . 02 % 8 . 86 % 8 . 92 % 8 . 73 % 7 . 83 % 7 . 82 % 8 . 41 % 9 . 44 % 8 . 63 % 8.50% GAAP Book Value $ 25.90 $ 23.83 $ 24.79 $ 21.48 $ 22.54 $ 23.65 $ 27.70 $ 30.76 $ 29.31 $ 32.05 40

Non - GAAP Reconciliation 41 Efficiency Ratio & Noninterest Expense and Net Operating Expense to Average Assets 1) Net operating expense is non - interest expense offset by non - interest income. ‘‘Efficiency ratio” is defined as recurring non - interest expense less foreclosed real estate (OREO) expenses and valuation allowances, less merger and acquisition costs, less amortization of intangible assets divided by operating revenue. Operating revenue is equal to net interest income plus non - interest income excluding gains and losses on securities and foreclosed real estate. In our judgment, the adjustments made to non - interest expense and operating revenue allow investors and analysts to better assess our operating expenses in relation to our core operating revenue by removing the volatility that is associated with certain one - time items and other discrete items that are unrelated to our core business. “Efficiency ratio as reported” is defined as non - interest expense divided by operating revenue. This is the ratio that appears in the Company’s SEC filings. (dollars in thousands, except share data) For the Years Ended YTD 2015 2016 2017 2018 2019 6 / 30 / 201 9 6 / 30 / 202 0 Non - Interest Expense $ 28,418 $ 29,159 $ 30 , 09 7 $ 38,149 $ 36,233 $ 17,521 $ 19,080 OREO Valuation Allowance & Expenses (1,059) ( 861 ) ( 746 ) ( 657 ) ( 963 ) ( 488 ) ( 1 , 882 ) Merger Costs - - ( 829 ) ( 3 , 625 ) - - - Adjusted Non - Interest Expense (Numerator) $ 27,359 $ 28 , 29 8 $ 28 , 52 2 $ 33 , 86 7 $ 35 , 27 0 $ 17 , 03 3 $ 17 , 19 8 Net Interest Income $ 36,528 $ 39,905 $ 43 , 38 8 $ 50,887 $ 53,534 $ 26,296 $ 29,577 Non - Interest Income 3,299 3 , 36 0 4 , 08 4 4 , 06 8 5 , 76 6 2 , 31 4 4 , 38 0 (Gains)/Losses on OREO Disposals 20 436 ( 43 ) 8 - - - Realized (Gains) Losses on Other Assets 407 ( 12 ) ( 47 ) ( 1 ) 1 - Unrealized (Gains) Losses on Equity Securities - - - 81 ( 134 ) ( 121 ) ( 115 ) Realized (Gains) Losses on Securities (4) ( 31 ) ( 175 ) - ( 226 ) - ( 441 ) Operaing Revenue (Denominator) $ 40,250 $ 43 , 65 8 $ 47 , 20 7 $ 55 , 04 3 $ 58 , 94 1 $ 28 , 48 9 $ 33 , 40 1 Average Assets $1,092,906 $1,229,470 $1 , 376 , 98 3 $1,603,393 $1,743,448 $1,710,253 $1,896,488 Reported Efficiency Ratio 71.4% 67 . 4 % 63 . 4 % 69 . 4 % 61 . 1 % 61 . 2 % 56 . 2 % Efficiency Ratio 68.0% 64 . 8 % 60 . 4 % 61 . 5 % 59 . 8 % 59 . 8 % 51 . 5 % Reported Non - interest Expense/Avg Assets 2.60% 2 . 37 % 2 . 19 % 2 . 38 % 2 . 08 % 2 . 05 % 2 . 01 % Operating Non - interest Expense/Avg Assets 2.50% 2 . 30 % 2 . 07 % 2 . 11 % 2 . 02 % 1 . 99 % 1 . 81 % Reported Net Operating Expense/Avg Assets (1) 2.30% 2 . 10 % 1 . 89 % 2 . 13 % 1 . 75 % 1 . 78 % 1 . 55 % Operating Net Operating Expense/Avg Assets (1) 2.16% 2 . 00 % 1 . 79 % 1 . 85 % 1 . 71 % 1 . 74 % 1 . 41 %

Non - GAAP Reconciliation 42 Operating Metrics – Excluding the Impact of the Tax Cuts and Jobs Act & One - Time Merger Costs During 2017 and 2018, our operating results were impacted by one - time expenses related to our acquisition of County First Bank. During 2017, the Tax Cut and Jobs Act of 2017 had a one - time impact to earnings in the fourth quarter of 2017. We believe that investors would benefit from analyzing our profitability and expense metrics excluding these one - time items. (dollars in thousands, except share data) For the Years Ended YTD 2016 2017 2018 2019 6/30/2019 6/30/2020 Net Income (as reported) $ 7 , 33 1 $ 7,208 $ 11,228 $ 15,272 $ 7,504 $ 6,198 Tax Cuts and Jobs Act (net of tax) - 2 , 74 0 - - - - Merger Costs (net of tax) - 724 2 , 69 3 - - - Non - GAAP Operating Net Income $ 7 , 33 1 $ 10,672 $ 13,921 $ 15,272 $ 7,504 $ 6,198 Reported Return on Average Assets 0 . 60 % 0 . 52 % 0 . 70 % 0 . 88 % 0 . 88 % 0 . 65 % Operating Return on Average Assets 0 . 60 % 0 . 78 % 0 . 87 % 0 . 88 % 0 . 88 % 0 . 65 % Reported Return on Average Common Equity 7 . 09 % 6 . 55 % 7 . 53 % 9 . 32 % 9 . 41 % 6 . 64 % Operating Return on Average Common Equity 7 . 09 % 9 . 70 % 9 . 33 % 9 . 32 % 9 . 41 % 6 . 64 % Reported Diluted Earnings Per Share $ 1 . 5 9 $ 1.56 $ 2.02 $ 2.75 $ 1.35 $ 1.05 Operating Diluted Earnings Per Share $ 1 . 5 9 $ 2.31 $ 2.51 $ 2.75 $ 1.35 $ 1.05 Average Assets $ 1 , 229 , 47 0 $1,376,983 $1,603,393 $1,743,448 $1,710,253 $1,896,488 Average Equity 103 , 39 7 109,979 149,128 163,936 159 , 42 0 186 , 58 0 Weighted Average Common Shares Outstanding 4 , 599 , 50 2 4,629,228 5,550,510 5,560,588 5 , 558 , 98 4 5,890,607

Non - GAAP Reconciliation Pre - Tax Pre - Provision (“PTPP”) Income ROAA and ROACE We believe that pre - tax pre - provision income, which reflects our profitability before income taxes and loan loss provisions, allows investors to better assess our operating income and expenses in relation to our core operating revenue by removing the volatility that is associated with credit provisions and different state income tax rates for comparable institutions. We also believe that during a crisis such as the COVID - 19 pandemic, this information is useful as the impact of the pandemic on the loan loss provisions of various institutions will likely vary based on the geography of the communities served by a particular institution. (dollars in thousands) For the Years Ended Y T D 2016 2017 2018 2019 6/30/2019 6/30/2020 Net Income (as reported) $ 7,331 $ 7 , 20 8 $ 11,228 $ 15,272 $ 7 , 50 4 $ 6,198 Loan Loss Provision 2 , 35 9 1 , 01 0 1 , 40 5 2 , 13 0 875 7 , 60 0 Income Taxes 4 , 41 6 9 , 15 7 4 , 17 3 5 , 66 5 2 , 71 0 1 , 07 9 Non - GAAP PTPP Income $ 14,106 $ 17 , 37 5 $ 16,806 $ 23,067 $ 11 , 08 9 $ 14,877 PTPP ROAA 1 . 15 % 1 . 26 % 1 . 05 % 1 . 32 % 1 . 30 % 1 . 57 % PTPP ROACE 13 . 64 % 15 . 80 % 11 . 27 % 14 . 07 % 13 . 91 % 15 . 95 % Average Assets $ 1,229,471 $ 1,376,983 $ 1,603,393 $ 1,743,448 $ 1,710,253 $ 1,896,488 Average Equity $ 103,397 $ 109 , 97 9 $ 149,128 $ 163,936 $ 159 , 42 0 $ 186,580 43