Attached files
| file | filename |
|---|---|
| 8-K - FORM 8-K - FIRST BANCSHARES INC /MS/ | tm2031372-1_8k.htm |
Exhibit 99.1

September 2020 NASDAQ: FBMS

This IP and certain of our other filings with the Securities and Exchange Commission contain statements that constitute “forward - looking statements” within the meaning of, and subject to the protections of, Section 27A of the Securities Act of 1933, as amended, and Section 21E of the Securities E xch ange Act of 1934, as amended. All statements other than statements of historical fact are forward - looking statements. Such statements can generally be identified by such wor ds as “believes,” “anticipates,” “expects,” “may,” “will,” “assumes,” “should,” “predicts,” “could,” “would,” “intends,” “targets,” “estimates,” “projects,” “plans,” “po ten tial” and other similar words and expressions of the future or otherwise regarding the outlook for the Company’s future business and financial performance and/or the performa nce of the banking industry and economy in general. Prospective investors are cautioned that any such forward - looking statements are not guarantees of future performance and involve known and unknown risks and uncertainties which may cause the actual results, performance or achievements of the Company to be materially different from the future results, performance or achievements expressed or implied by such forward - looking statements. Forward - looking statements are based on the information kn own to, and current beliefs and expectations of, the Company’s management and are subject to significant risks and uncertainties. Actual results may differ m ate rially from those contemplated by such forward - looking statements. Factors that might cause such differences include, but are not limited to: (1) competitive pressures among financial institutions increasing significantly; (2) changes in economic or political conditions, either nationally or locally, particularly in areas in which the Company conducts operations; (3) interest rate risk; (4) changes in applicable laws, rules, or regulations, including changes to statutes, regulations or regulatory policies or p rac tices as a result of, or in response to COVID - 19; (5) risks related to the Company’s recently completed acquisitions, including that the anticipated benefits from the recently com ple ted acquisitions are not realized in the time frame anticipated or at all as a result of changes in general economic and market conditions or other unexpected factors or e ven ts; (6) changes in management’s plans for the future; (7) credit risk associated with our lending activities; (8) changes in interest rates, loan demand, real estate values, or competition; (9) changes in accounting principles, policies, or guidelines; (10) adverse results from current or future litigation, regulatory examinations or other legal and/or regulatory actions, includin g a s a result of the Company’s participation in and execution of government programs related to the COVID - 19 pandemic; ( 11) the impact of the COVID - 19 pandemic on the Company’s assets, business, cash flows, financial condition, liquidity, prospects and results of operations; ( 12) potential increases in the provision for loan losses resulting from the COVID - 19 pandemic; and ( 13) other general competitive, economic, political, and market factors, including those affecting our business, operations, prici ng, products, or services. These and other factors that could cause results to differ materially from those described in the forward - looking statements, as well as a discussion of the risks and uncertainties that may affect our business, can be found in our Annual Report on Form 10 - K and in other filings we make with the Securities and Exc hange Commission, which are available on the SEC’s website, http://www.sec.gov . Undue reliance should not be placed on forward - looking statements. The Company disclaims any obligation to update such facto rs or to publicly announce the results of any revisions to any of the forward - looking statements included herein to reflect future eve nts or developments, except as required by law. Statements about the potential effects of the COVID - 19 pandemic on the Company’s assets, business, liquidity, financial conditio n, prospects, and results of operations may constitute forward - looking statements and are subject to the risks that the actual effects may differ, possibly materially, from what is reflected in these forward - looking statements due to factors and future developments that are uncertain, unpredictable and in many cases beyond our control, inc lud ing the depth, dispersion and duration of the pandemic, actions taken by governmental authorities in response to the pandemic, and the direct and indirect impact of th e p andemic on customers, employees, third parties and the Company. 2 Forward Looking Statement

3 THE FIRST BANCSHARES: BUILDING SHAREHOLDER VALUE

53.9% Q2 ‘ 20 Efficiency Ratio, Operating (1) 16.5% Total Capital Ratio as of June 30, 2020 5 th Largest Bank Headquartered in MS $5.1bn Assets as of June 30, 2020 12 # of Closed Transactions since 2010 (2) 4 Our Company Company Overview 84 Locations in Gulf South: MS, LA, AL, FL & GA 1996 Bank Established in Hattiesburg, MS FBMS Location ( 84 ) PENSACOLA DESTIN GULFPORT HATTIESBURG VALDOSTA BATON ROUGE Source: S&P Global Market Intelligence, Company documents (1) Refer to appendix for “Non - GAAP Reconciliation ” (2) Includes 10 whole bank acquisitions, 1 branch acquisition and 1 mortgage company acquisition 1.75% Q2 ’20 PTPP ROAA, Operating (1) MOBILE JACKSON TALLAHASSEE

Continuity of Leadership through Multiple Business C ycles 5 Jerome Brown Executive VP Community Development 18 years experience Carol Daniel Executive VP Credit Administrator 36 years experience Hayden Mitchell Executive VP Loan Ops & Mortgage 43 years experience Ion Mixon Executive VP Risk Manager 19 years experience Jarrett Nicholson Executive VP Chief Administrative Officer 25 years experience Chris Ryals Executive VP COO 24 years experience M. Ray “Hoppy” Cole, Jr. President/CEO 32 Years of Experience Dee Dee Lowery Executive VP, CFO 28 Years of Experience Responsible for devising and executing a disciplined and successful strategy of organic growth and strategic acquisitions Eric Waldron President Mississippi Region 23 years experience George Noonan President Alabama Region 22 years experience Wade Neth President Florida Region 32 years experience Ronnie Fugarino President Louisiana Region 38 years experience Mit Cole Executive VP Private Banking 10 years experience

$503 $500 $540 $571 $647 $698 $830 $986 $1,080 $1,213 $1,334 $1,821 $181 $181 $370 $447 $447 $447 $827 $1,924 $2,729 $2,729 $3,264 $681 $721 $941 $1,094 $1,145 $1,277 $1,813 $3,004 $3,942 $4,062 $5,085 2010 2011 2012 2013 2014 2015 2016 2017 2018 2019 Q1 '20 Q2 '20 Acquired Organic Mobile New Orleans Baton Rouge Jackson Tallahassee Montgomery Shreveport Columbus New Orleans Mobile Baton Rouge Jackson Tallahassee Montgomery Shreveport Columbus Evolution of Our Franchise December 31, 2009 June 30 , 2020 Total Assets ($mm) – Organic and Acquisitive Growth Source: S&P Global Market Intelligence Data as of 12/31 of each year, respectively; Q2 ‘20 data as of 6/30/20 FBMS Branch (9) FBMS Branch ( 82 ) FBMS LPO (2) 6 Hattiesburg Hattiesburg Destin Valdosta Gulfport Pensacola

Mississippi 30% Alabama 18% Louisiana 15% Florida 23% Georgia 14% Mississippi 30% Alabama 14% Louisiana 18% Florida 21% Georgia 17% Mississippi 73% Alabama 23% Louisiana 4% Mississippi 100% Mississippi 70% Alabama 23% Louisiana 7% Mississippi 100% Improving Geographic Diversification of our Balance Sheet 7 2015 Deposits by State June 30, 2020 Deposits by State Source : S&P Global Market Intelligence, C ompany d ocuments 2009 and 2015 data as of 6/30 2015 Loans by State June 30, 2020 Loans by State 2009 Loans by State 2009 Deposits by State
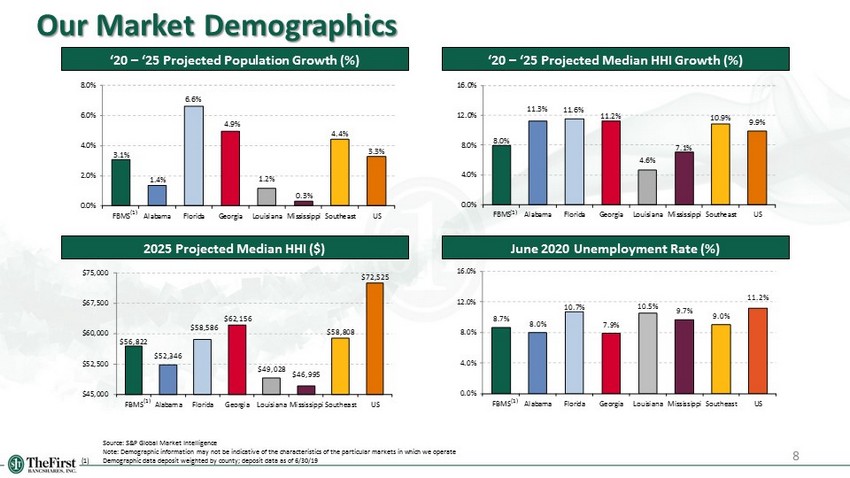
$56,822 $52,346 $58,586 $62,156 $49,028 $46,995 $58,808 $72,525 $45,000 $52,500 $60,000 $67,500 $75,000 FBMS Alabama Florida Georgia Louisiana Mississippi Southeast US 8.0% 11.3% 11.6% 11.2% 4.6% 7.1% 10.9% 9.9% 0.0% 4.0% 8.0% 12.0% 16.0% FBMS Alabama Florida Georgia Louisiana Mississippi Southeast US 3.1% 1.4% 6.6% 4.9% 1.2% 0.3% 4.4% 3.3% 0.0% 2.0% 4.0% 6.0% 8.0% FBMS Alabama Florida Georgia Louisiana Mississippi Southeast US Our Market Demographics 8 Source : S&P Global Market Intelligence Note: Demographic information may not be indicative of the characteristics of the particular markets in which we operate (1) Demographic data deposit weighted by county; deposit data as of 6/30/19 ‘20 – ‘ 25 Projected Population Growth (%) ‘20 – ‘ 25 Projected Median HHI Growth (%) 2025 Projected Median HHI ($) June 2020 Unemployment Rate (%) 8.7% 8.0% 10.7% 7.9% 10.5% 9.7% 9.0% 11.2% 0.0% 4.0% 8.0% 12.0% 16.0% FBMS Alabama Florida Georgia Louisiana Mississippi Southeast US (1) (1) (1) (1)

• Moved as many as practical employees to work by remote access • Increased the frequency of facility janitorial services • Rotated access as much as practical for employees whose function could not be performed remotely • Provided lunch daily to on site personnel to limit their off premise exposure during the day; rotate purchasing our meals from our restaurant clients in each market to help support them during this emergency 9 COVID - 19 Pandemic Response Source: Company documents Data as of 9 /4/20 (1) Total loans as of 6/30/20 excludes $259 million of PPP related loans Customers & Communities Paycheck Protection Program (PPP) Employees • Enacted the Pandemic section of our internal Business Continuity Plan • Restricted access to lobbies to “by appointment only” and maintained full drive thru service • Assisted customers by granting modifications , peaking at $676 million at April 30, 2020 or ~22% of loans; modifications have since declined to $109 million as of September 4, 2020 or 3.7% of loans (1) • Improved and upgraded electronic delivery and execution of documents system wide to limit in person exposure but maintain business volume • Participated actively in the Paycheck Protection Program to assist our commercial customers • As of July 23, we have processed and funded 3,213 loans totaling $264.8 million (~6% of total loans) • Funded loans to a variety of industries including Hotels, Restaurants, Retail, Convenience Stores and Healthcare • A verage loan size of $82,000

10 Credit Highlights Franchise and Management Strength • Gulf South markets remain resilient through the COVID pandemic; unemployment well below national average • 84 locations across 5 states; ranked in the top 10 by deposit market share by county / parish in ~75% of our franchise • Geographically diversified loan portfolio • Experienced, performance driven management team with local market knowledge Granular Loan and Deposit Portfolio • 75% loan - to - deposit ratio • Core funded franchise with 96% core deposits and 0.51% cost of deposits • Increased monitoring of hotel, restaurant and retail portfolio • Prudent credit culture and pristine asset quality in light of deferrals Strong Profitability and Capital Position • Consistent historic improvement in profitability metrics and differentiated sources of revenue • Solid PTPP ROAA (1.75% in Q2 ‘20) to support capital generation and potentially absorb any loan losses • Capital ratios far in excess of well capitalized minimums (Q2 ‘20 CET1 Ratio of 13.1% and Total Capital Ratio of 16.5%) • Q2 ‘20 53.9% efficiency ratio, operating Source: S&P Global Market Intelligence Data as of or for the three months ended 6/30/20

11 Geography Mobile, AL MSA Tallahassee, FL MSA Tallahassee, FL MSA Hammond, LA MSA Destin, FL MSA Valdosta, GA MSA Date Closed March ‘18 April ‘18 November ‘18 March ‘19 November ‘19 April ‘20 Branches 9 5 6 7 6 8 41 Purchase Price Cash & Stock: $60.0M Cash & Stock: $30.5M Cash & Stock: $80.0M All Stock: $86.1M Cash & Stock: $84.3M All Stock: $47.9M -- Assets $398.5M $213.1M $477.1M $375.7M $428.5M $535.7M $2.4B Loans $269.9M $173.1M $331.6M $247.8M $248.9M $394.6M $1.7B Deposits $357.3M $154.2M $428.1M $313.4M $372.3M $475.9M $2.1B Detailed Internal & 3 rd Party Loan Review Target Assets / FBMS Assets ~22% ~10% ~19% ~13% ~12% ~13% Total Gained: Building Franchise Value Six Acquisitions | Closed 2018 – ‘20

12 FINANCIAL RESULTS

$2.5 $3.6 $4.2 $6.3 $8.5 $9.7 $10.6 $21.2 $43.7 $10.8 $17.4 $12.6 $17.6 $13.7 $17.8 $16.7 $21.4 $0.0 $12.0 $24.0 $36.0 $48.0 2011 2012 2013 2014 2015 2016 2017 2018 2019 Q3 '18 Q3 '19 Q4 '18 Q4 '19 Q1 '19 Q1 '20 Q2 ' 19 Q2 '20 EPS Net Income ($mm) $0.82 $1.16 $0.96 $1.19 $1.55 $1.57 $1.11 $1.62 1.75% 2.03% 1.80% 1.93% 1.87% 1.73% 1.79% 1.75% $2.55 13 Pre - tax Pre Provision Income ($mm), Operating (1) PTPP ROAA, Oper. (1) Source: S&P Global Market Intelligence Annual d ata as of 12/31 of each year, respectively; quarterly data as of or for the three months ended each respective quarter (1) Refer to appendix for “Non - GAAP Reconciliation” Historical Performance Over Time Nine Years of Record Earnings

$16.3 $19.1 $22.2 $28.4 $33.4 $37.0 $40.3 $59.2 $84.9 $121.8 $21.7 $30.5 $25.3 $33.4 $27.1 $34.1 $30.8 $39.2 $0.0 $30.0 $60.0 $90.0 $120.0 $150.0 2010 2011 2012 2013 2014 2015 2016 2017 2018 2019 Q3 '18 Q3 '19 Q4 '18 Q4 '19 Q1 ' 19 Q1 '20 Q2 '19 Q2 '20 Net Interest Income Over Time 14 3.74% 3.99% 3.59% 3.44% 3.70% 3.72% 3.71% 3.97% 4 .08% Net Interest Income ($mm) NIM 4 .05 % 3.83% 3.93% 4.06 % 3.89 % 3.93 % 4.07 % 3 .63% 4.00 % Source: S&P Global Market Intelligence Annual d ata as of 12/31 of each year, respectively; quarterly data as of or for the three months ended each respective quarter

15.6% 15.8% 15.2% 9.9% 10.6% 0.0% 5.0% 10.0% 15.0% 20.0% Q2 '19 Q3 '19 Q4 '19 Q1 '20 Q2 '20 15.5% 15.1% 13.7% 9.3% 16.0% 0.0% 5.0% 10.0% 15.0% 20.0% Q2 '19 Q3 '19 Q4 '19 Q1 '20 Q2 '20* 1.39% 1.49% 1.40% 0.89% 0.91% 0.50% 0.75% 1.00% 1.25% 1.50% Q2 '19 Q3 '19 Q4 '19 Q1 '20 Q2 '20 1.39% 1.43% 1.26% 0.83% 1.38% 0.50% 0.75% 1.00% 1.25% 1.50% Q2 '19 Q3 '19 Q4 '19 Q1 '20 Q2 '20* Historical Profitability Trends 15 Source : S&P Global Market Intelligence, Company Documents Data as of or for the three months ended each respective quarter (1) Refer to appendix for “Non - GAAP Reconciliation” * Inclusive of $7.0 million bargain purchase gain Reported ROAA (%) ROAA, Operating (%) (1) Reported ROATCE (%) (1) ROATCE, Operating (%) (1) 2.03% 1.93% 1.87% 1.79% 1.75% PTPP ROAA, Oper. (1)
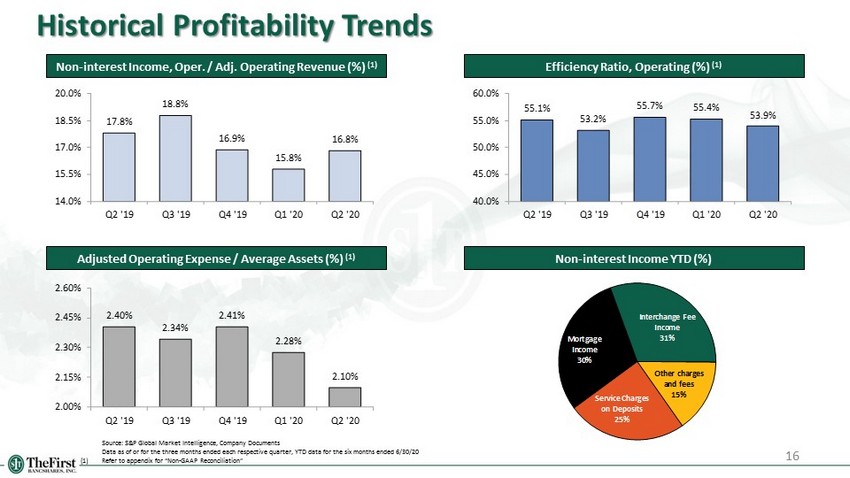
16 Historical Profitability Trends Non - interest Income, Oper. / Adj. Operating Revenue (%) (1) Non - i nterest Income YTD (%) Efficiency Ratio, Operating (%) (1) Adjusted Operating Expense / Average Assets (%) (1) 17.8% 18.8% 16.9% 15.8% 16.8% 14.0% 15.5% 17.0% 18.5% 20.0% Q2 '19 Q3 '19 Q4 '19 Q1 '20 Q2 '20 55.1% 53.2% 55.7% 55.4% 53.9% 40.0% 45.0% 50.0% 55.0% 60.0% Q2 '19 Q3 '19 Q4 '19 Q1 '20 Q2 '20 2.40% 2.34% 2.41% 2.28% 2.10% 2.00% 2.15% 2.30% 2.45% 2.60% Q2 '19 Q3 '19 Q4 '19 Q1 '20 Q2 '20 Source : S&P Global Market Intelligence, Company Documents Data as of or for the three months ended each respective quarter, YTD data for the six months ended 6/30/20 (1) Refer to appendix for “Non - GAAP Reconciliation” Service Charges on Deposits 25% Mortgage Income 30% Interchange Fee Income 31% Other charges and fees 15%

17 Interest Rate Sensitivity • The following table summarizes the forecasted impact on the net interest income given an immediate change in interest rates a t the specified levels based on forecasted assumptions of prepayment speeds, nominal interest rates and loan and deposit repric ing rates • Assumptions are based on current economic conditions, historical interest rate cycles and other factors deemed to be relevant Interest Rate Scenario Net Interest Income ($mm) Dollar Change ($mm) NII @ Risk - Sensitivity Y1 Policy Limits + 400 bps $152.2 $16.4 12.1% (20.0%) + 300 bps 149.9 14.1 10.4% (15.0%) + 200 bps 146.1 10.4 7.6% (10.0%) + 100 bps 141.4 5.7 4.2% (5.0%) Static 135.8 -- -- -- - 100 bps 133.0 (2.8) (2.0%) (5.0%) - 200 bps 131.3 (4.5) (3.3%) (10.0%) Source: Company documents Data as of 6/30/20
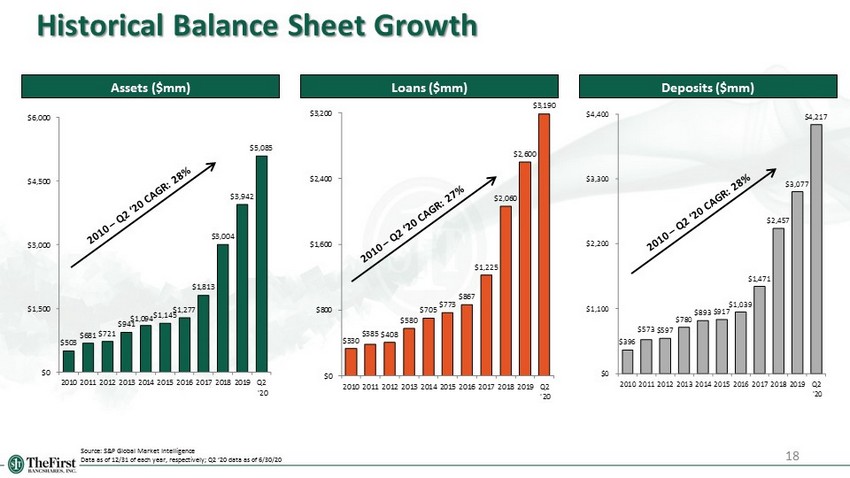
$396 $573 $597 $780 $893 $917 $1,039 $1,471 $2,457 $3,077 $4,217 $0 $1,100 $2,200 $3,300 $4,400 2010 2011 2012 2013 2014 2015 2016 2017 2018 2019 Q2 '20 $330 $385 $408 $580 $705 $773 $867 $1,225 $2,060 $2,600 $3,190 $0 $800 $1,600 $2,400 $3,200 2010 2011 2012 2013 2014 2015 2016 2017 2018 2019 Q2 '20 $503 $681 $721 $941 $1,094 $1,145 $1,277 $1,813 $3,004 $3,942 $5,085 $0 $1,500 $3,000 $4,500 $6,000 2010 2011 2012 2013 2014 2015 2016 2017 2018 2019 Q2 '20 Historical Balance Sheet Growth 18 Assets ($mm) Source: S&P Global Market Intelligence Data as of 12/31 of each year, respectively; Q2 ’20 data as of 6/30/20 Loans ($mm) Deposits ($mm)

$9.00 $10.00 $11.00 $12.00 $13.00 $14.00 $15.00 $16.00 $17.00 $18.00 $19.00 $20.00 $21.00 Source : S&P Global Market Intelligence Note: Assets shown as of next quarter after close; dates are as of transaction close, unless otherwise specified 3/22/2013 $22.0M Equity Offering Assets: $789 million 4/23/2013 Acquired First Baldwin Bancshares, Inc. Assets: $965 million 7/1/2014 Acquired BCB Holding Company, Inc. Assets: $989 million 12/14/2015 Acquired Mortgage Connection, LLC Assets: $1.1 billion 10/24/2016 $63.3M Equity Offering Assets: $1.3 billion 1/1/2017 Acquired Gulf Coast Community Bank Assets: $1.8 billion 1/1/2017 Acquired Iberville Bank Assets: $1.8 billion 10/26/2017 $58.4M Common Stock Offering Assets: $1.8 billion 3/1/2018 Acquired South West Banc Shares, Inc. Assets: $2.3 billion 4/1/2018 Acquired Sunshine Financial, Inc. Assets: $2.5 billion 5/1/2018 $66.0M Subordinated Debt Offering Assets: $2.5 billion 10/31/2018 Acquired FMB Banking Corporation Assets: $3.0 billion 3/2/2019 Acquired FPB Financial Corp. Assets: $3.5 billion 10 /31/2019 Acquired First Florida Bancorp Assets: $3.9 billion 4/3/2020 Acquired SGB Assets: $5.1 billion E XECUTING U PON G ROWTH S TRATEGY T ANGIBLE B OOK V ALUE P ER S HARE G ROWTH 19 Building Upon a Proven Track Record 12/31/19 12/31/18 12/31/17 12/31/16 12/31/15 12/31/14 12/31/13 6/30/20

95.8% 87.3% FBMS Peers 20 Strong Balance Sheet & Earnings Power 14.6% 13.9% FBMS Peers 1.8% 1.5% FBMS Peers 75.7% 89.8% FBMS Peers TCE+ALL / Loans (%) Core Deposits (%) YTD PTPP ROAA, Operating (1) (%) Loans / Deposits (%) 69 bps higher than peers 30 bps higher than peers 14 percentage points lower than peers 8 percentage points higher than peers Source : S&P Global Market Intelligence Note: Peers include all major exchange traded banks headquartered in AL, AR, FL, GA, KY, LA, MS, NC, SC, TN, VA and WV with t ot al assets between $1 bn and $10 bn Data as of or for the three months ended 6/30/20; YTD data for the six months ended 6/30/20 (1 ) Refer to appendix for “Non - GAAP Reconciliation”

21 LOAN & DEPOSIT INFORMATION

C&D 11% 1 - 4 Family 25% Multifamily 4% Owner - Occupied CRE 21% Non Owner - Occupied CRE 16% C&I 18% Consumer & Other 6% Farmland 2% 22 Loan Portfolio Overview Q2 ‘20 Loan Composition Historical Loan Composition Dollars in millions, unless otherwise noted Source : S&P Global Market Intelligence Data as of 12/31 each respective year, respectively; Q2 ‘20 data as of 6/30/20 Loan Portfolio Amount C&D $337 1-4 Family 804 Multifamily 119 Owner-Occupied CRE 660 Non Owner-Occupied CRE 503 C&I 586 Consumer & Other 179 Farmland 74 Gross Loans & Leases $3,190 12.8% 12.5% 14.9% 14.5% 13.8% 29.5% 27.9% 27.0% 25.7% 27.5% 4.3% 3.4% 2.8% 2.6% 2.6% 20.0% 21.7% 21.3% 20.5% 22.6% 12.6% 14.4% 16.7% 17.1% 16.8% 2.4% 2.8% 1.9% 3.3% 2.6% 16.6% 14.8% 13.5% 14.5% 12.7% 1.7% 2.5% 1.9% 1.9% 1.5% 2015 2016 2017 2018 2019 C&D 1-4 Family Multifamily Owner-Occupied CRE Non Owner-Occupied CRE Consumer & Other C&I Farmland • Granular loan portfolio, average loan size is ~$152 thousand • Top 25 loans represent ~6% of total portfolio • De Minimis consumer credit card loans ($2.4 million or 0.1% of total loans) • Limited energy exposure ($19.6 million or 0.6% of total loans) • No Shared National Credits (“SNCs”)

Sector Total Modified % of Total Hotels $39.0 Restaurants 19.2 Retail 6.6 Other 43.9 Total $108.6 3.7 % Hotels $39.0 Restaurants $19.2 Retail $6.6 Other $43.9 23 COVID - 19 Loan Modifications Loan Modifications Resulting from COVID - 19 as of 9/4/20 Loan Modification Trends $40.0 $46.9 $54.0 $39.0 $19.2 $6.6 Hotels Restaurants Retail 4/29/20 9/4/20 (2.6%) (59.1%) (87.8%) DELTA Dollars in millions Source: Company documents (1) Total loans as of 6/30/20 excludes $259 million of PPP related loans $675.6 $489.9 $436.1 $195.7 $108.6 3/15/20 4/30/20 5/31/20 6/30/20 7/23/20 9/4/20 (1) Aggregate Loan Modification Trends Loan Modification Changes in Escalated Monitoring Portfolio Segments
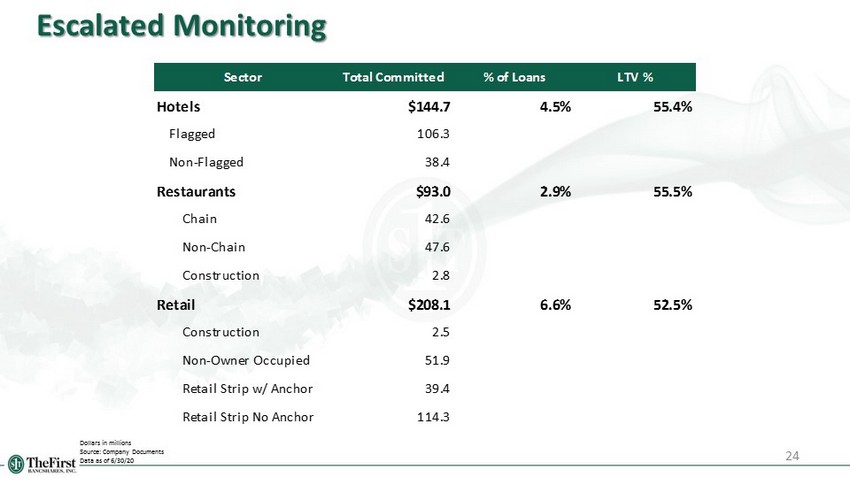
24 Escalated Monitoring Dollars in millions Source : Company Documents Data as of 6 /30/20 Sector Total Committed % of Loans LTV % Hotels $144.7 4.5% 55.4% Flagged 106.3 Non-Flagged 38.4 Restaurants $93.0 2.9% 55.5% Chain 42.6 Non-Chain 47.6 Construction 2.8 Retail $208.1 6.6% 52.5% Construction 2.5 Non-Owner Occupied 51.9 Retail Strip w/ Anchor 39.4 Retail Strip No Anchor 114.3
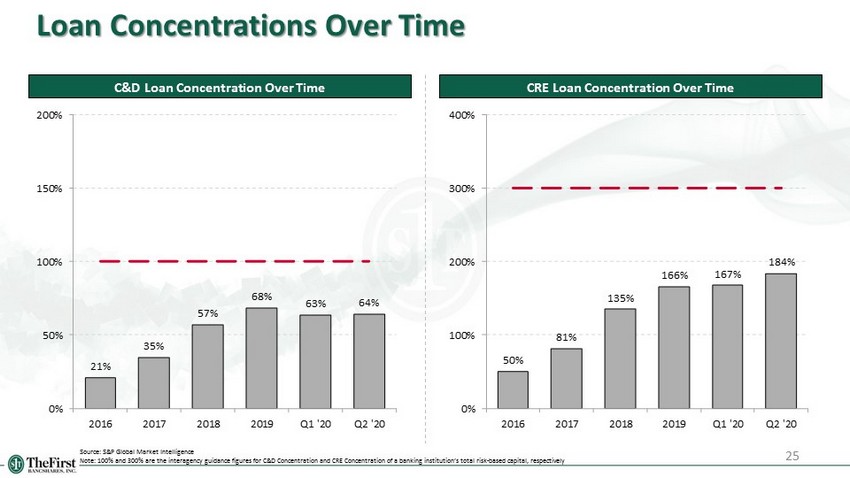
25 Loan Concentrations Over Time C&D Loan Concentration Over Time CRE Loan Concentration Over Time Source: S&P Global Market Intelligence Note: 100% and 300% are the interagency guidance figures for C&D Concentration and CRE Concentration of a banking institution ’s total risk - based capital, respectively 21% 35% 57% 68% 63% 64% 0% 50% 100% 150% 200% 2016 2017 2018 2019 Q1 '20 Q2 '20 50% 81% 135% 166% 167% 184% 0% 100% 200% 300% 400% 2016 2017 2018 2019 Q1 '20 Q2 '20

26 Overview of PPP Activity • As of July 23, 2020, we have processed 3,213 loans totaling $264.8 million with average loan size of $82,000 • Net fees of $10.6 million Dollars in millions Source: Company documents Sector Total PPP Hotels $2.4 Restaurants 27.0 Retail 51.6 Subtotal of Escalated Monitor Loan Portfolio $81.0 Other 183.8 Aggregate Total $264.8

27 Loan Reserves Detail & Nonperforming Assets ALLL / Credit Marks as of June 30, 2020 Dollars in millions Source: Company documents ALLL / Credit Marks Loan Balances ALLL / Credit Mark ALLL / Mark to Loans Acquired Loans Not Incorporated into ALLL Model $903.2 mm $9.4 mm mark 1.0% Acquired Purchased Credit Impaired Loans 27.6 mm 2.1 mm mark 7.6% Loans Incorporated into ALLL Model $2.241 bn $28.1 mm ALLL 1.3% Total Loans $3.172 bn $39.6 mm 1.25% Nonperforming Assets Balances % of Loans + OREO Legacy $19.8 mm 0.6% Acquired 25.9 mm 0.8% Total Nonperforming Assets $45.7 mm 1.4%

28 Asset Quality Over Time NPAs / Loans + OREO (%) NCOs / Average Loans (%) Reserves / NPLs (%) Reserves / Loans (%) Source: S&P Global Market Intelligence Yearly data as of or for the twelve months ended each respective year; quarterly data as of or for the three months ended eac h r espective quarter 1.4% 1.5% 2.0% 2.1% 2.0% 1.6% 2016 2017 2018 2019 Q1 '20 Q2 '20 (0.02%) (0.02%) 0.01% (0.00%) 0.03% 0.04% 2016 2017 2018 2019 Q1 '20 Q2 '20 0.86% 0.67% 0.49% 0.53% 0.80% 0.88% 2016 2017 2018 2019 Q1 '20 Q2 '20 0.86% 0.67% 0.49% 0.53% 0.80% 0.88% 2016 2017 2018 2019 Q1 '20 Q2 '20

29 History of Prudent Credit Culture 15 - Year NCOs / Avg. Loans vs. Banking Industry (%) 0.1% 0.0% 0.3% 0.5% 0.4% 0.3% 0.4% 0.3% 0.0% 0.2% (0.0%) (0.0%) (0.0%) 0.0% (0.0%) 0.0% 0.5% 0.4% 0.6% 1.3% 2.5% 2.5% 1.6% 1.1% 0.7% 0.5% 0.4% 0.5% 0.5% 0.5% 0.5% 0.6% 2005 2006 2007 2008 2009 2010 2011 2012 2013 2014 2015 2016 2017 2018 2019 YTD FBMS Banking Industry Source: S&P Global Market Intelligence, FDIC Yearly data as of or for the twelve months ended each respective year; YTD data as of or for the six months ended 6/30/20

$0.2 $0.2 $0.3 $0.6 $0.7 $0.2 $0.2 $0.3 $0.5 $0.6 $0.3 $0.4 $0.6 $0.9 $1.1 $0.1 $0.1 $0.2 $0.4 $0.5 $0.1 $0.1 $0.1 $0.1 $0.2 $0.9 $1.0 $1.5 $2.5 $3.1 2015 2016 2017 2018 2019 Demand Deposits NOW Accounts Money Market & Savings Retail Time Deposits Jumbo Time Deposits Deposit Portfolio Amount Demand Deposits $1,190 NOW Accounts 1,347 Money Market & Savings 1,002 Retail Time Deposits 499 Jumbo Time Deposits 178 Total Deposits $4,217 Demand Deposits 28% NOW Accounts 32% Money Market & Savings 24% Retail Time Deposits 12% Jumbo Time Deposits 4% 30 Attractive Deposit Portfolio Q2 ‘20 Deposit Composition (1) Historical Deposit Composition ($bn) Cost of Total Deposits Over Time (%) 0.27% 0.27% 0.27% 0.26% 0.29% 0.31% 0.37% 0.37% 0.32% 0.34% 0.36% 0.39% 0.44% 0.48% 0.54% 0.63% 0.67% 0.74% 0.73% 0.68% 0.68% 0.51% Q2 '15 Q4 '15 Q2 '16 Q4 '16 Q2 '17 Q4 '17 Q2 '18 Q4 '18 Q2 '19 Q4 '19 Q2 '20 Dollars in millions unless otherwise noted Source : S&P Global Market Intelligence Annual data as of or for the twelve months ended each respective year; Quarterly data as of or for the three months ended eac h respective quarter; deposit mix as of 6/30/20 (1) Without reclassification • 96% core deposits • 28.2% non - interest bearing demand deposits

31 CAPITAL & LIQUIDITY POSITIONS

32 Capital & Liquidity Position TCE / TA (%) (1) Leverage Ratio (%) Total Risk Based Capital Ratio (%) CET1 Ratio (%) Source: S&P Global Market Intelligence Data as of 12/31 of each year, respectively; Q2 ‘20 data as of 6/30/20 (1) Non - GAAP measure, see reconciliation to closest GAAP measure in appendix 6.2% 11.0% 11.1% 8.7% 9.5% 8.9% 0.0% 5.0% 10.0% 15.0% 20.0% 2015 2016 2017 2018 2019 Q2 '20 8.7% 11.9% 11.7% 10.2% 10.3% 9.2% 0.0% 5.0% 10.0% 15.0% 20.0% 2015 2016 2017 2018 2019 Q2 '20 8.1% 13.8% 14.2% 11.5% 12.5% 13.1% 0.0% 5.0% 10.0% 15.0% 20.0% 2015 2016 2017 2018 2019 Q2 '20 11.9% 15.5% 15.5% 15.6% 15.8% 16.5% 0.0% 5.0% 10.0% 15.0% 20.0% 2015 2016 2017 2018 2019 Q2 '20

Subordinated Notes $65 ACL $28 Trust Preferred $15 Common Equity Tier 1 $419 33 Capital Position Regulatory Capital as of 6/30/20 ($mm) Capital Highlights • Elected to take advantage of delayed implementation of CECL on regulatory capital; CECL implementation to occur upon the earlier of the end of 2020 or the end of the pandemic • Consistent dividend payment history including through the 2008 financial crisis • Subordinated debt financing in the Company’s capital structure as of June 30, 2020 included: − $24 million par value subordinated notes due May 1, 2028; call period begins May 1, 2023; current fixed rate of 5.875% − $42 million par value subordinated notes due May 1, 2033; call period begins May 1, 2028; current fixed rate of 6.400% Tier 1 Capital $434 million Tier 2 Capital $93 million Source : S&P Global Market Intelligence Data as of 6/30/20

Outstanding / Remaining Usage Bank Sources Available Pledged Availability Percentage FHLB Fixed Rate Advances $1,297.0 $216.0 $1,081.0 16.7 % FRB -- -- -- -- Correspondent Fed Funds Lines 70.0 -- 70.0 0.0 Total Bank Funding $1,367.0 $216.0 $1,151.0 15.8 % 34 Strong Liquidity at the Bank U.S. Treasury Securities $9 Government Agencies $100 State & Political Subdivision $390 MBS $399 Other $29 Cash and Cash Equivalents: $ 538 mm Total Available - for - Sale Securities: $927 Held - to - Maturity Securities: $0 Total Cash & Securities: $1,466 Average Rating: AA/Aa2 Weighted Average Life: 4.2 years Effective Duration: 3 .7 years No CLO Securities within the Investment Portfolio AFS Securities Portfolio Bank Funding Sources Dollars in millions Source : S&P Global Market Intelligence Data as of 6/30/20 Liquidity Highlights • As of June 30, the Company’s liquidity ratio was 22.3%, as compared to internal liquidity policy guidelines of 10% • Other liquidity ratios reviewed include the following along with policy guidelines: Policy Policy June 30, 2020 Maximum Compliance Loans to Deposits (including FHLB) 72.9 % 90.0 % In Policy Net non-core Funding Dependency Ratio (3.3) 20.0 In Policy Fed Funds Purchased / Total Assets 0.0 10.0 In Policy FHLB Advances / Total Assets 2.2 20.0 In Policy FRB Advances / Total Assets 0.0 10.0 In Policy Pledged Securities to Total Securities 67.0 90.0 In Policy

35 APPENDIX

Deposits Market Rank Institution ($mm) Share Branches 1 Truist Financial Corp. $33,103 17.43% 339 2 Wells Fargo & Co. 30,280 15.95 233 3 Bank of America Corp. 23,880 12.58 158 4 Synovus Financial Corp. 12,951 6.82 114 5 Ameris Bancorp 8,778 4.62 108 6 United Community Banks Inc. 6,695 3.53 67 7 Regions Financial Corp. 6,437 3.39 111 8 JPMorgan Chase & Co. 5,693 3.00 92 9 South State Corp. 4,694 2.47 50 10 Cadence Bancorp. 3,632 1.91 34 31 First Bancshares Inc. 527 0.28 9 Deposits Market Rank Institution ($mm) Share Branches 1 JPMorgan Chase & Co. $13,672 14.38 120 2 Capital One Financial Corp. 13,317 14.01 100 3 Hancock Whitney Corp. 13,102 13.78 120 4 First Horizon National Corp. 7,890 8.30 63 5 Regions Financial Corp. 7,461 7.85 93 6 Business First Bancshares Inc. 2,723 2.87 40 7 Origin Bancorp Inc. 1,811 1.91 21 8 First Guaranty Bancshares Inc. 1,715 1.80 29 9 Home Bancorp Inc. 1,684 1.77 36 10 Red River Bancshares, Inc. 1,666 1.75 25 24 First Bancshares Inc. 575 0.60 20 Deposits Market Rank Institution ($mm) Share Branches 1 Regions Financial Corp. $17,632 19.73% 201 2 Banco Bilbao Vizcaya Argentaria SA 8,111 9.07 88 3 Wells Fargo & Co. 7,939 8.88 107 4 Synovus Financial Corp. 4,211 4.71 33 5 Truist Financial Corp. 3,740 4.18 70 6 ServisFirst Bancshares Inc. 3,663 4.10 12 7 PNC Financial Services Group Inc. 2,909 3.25 56 8 Cadence Bancorp. 2,585 2.89 25 9 Trustmark Corp. 1,791 2.00 43 10 First Horizon National Corp. 1,436 1.61 14 25 First Bancshares Inc. 632 0.71 17 Deposits Market Rank Institution ($mm) Share Branches 1 Bank of America Corp. $85,391 17.28% 514 2 Wells Fargo & Co. 69,251 14.01 570 3 Truist Financial Corp. 62,857 12.72 668 4 JPMorgan Chase & Co. 38,443 7.78 422 5 Regions Financial Corp. 17,800 3.60 294 6 Toronto-Dominion Bank 14,334 2.90 161 7 Citigroup Inc. 14,172 2.87 54 8 Synovus Financial Corp. 13,207 2.67 96 9 First Horizon National Corp. 11,514 2.33 99 10 PNC Financial Services Group Inc. 11,329 2.29 171 51 First Bancshares Inc. 873 0.18 18 36 Deposit Market Share by State Mississippi Florida Alabama Louisiana Georgia Source: S&P Global Market Intelligence Data as of 6/30/19 Note: Deposits capped at $1.0 bn per branch Deposits Market Rank Institution ($mm) Share Branches 1 Trustmark Corp. $7,070 12.97% 114 2 Regions Financial Corp. 6,543 12.00 120 3 BancorpSouth Bank 5,731 10.51 94 4 Renasant Corp. 3,974 7.29 71 5 Hancock Whitney Corp. 3,511 6.44 39 6 BancPlus Corp. 3,185 5.84 74 7 Community Bancshares of Mississippi Inc. 2,555 4.69 37 8 Citizens National Banc Corp. 1,260 2.31 27 9 First Bancshares Inc. 1,003 1.84 19 10 Planters Holding Co. 935 1.72 20

Deposits Market Rank Institution ($mm) Share Branches 1 JPMorgan Chase & Co. $3,283 20.33% 27 2 Hancock Whitney Corp. 2,890 17.89 29 3 Capital One Financial Corp. 2,671 16.54 21 4 Regions Financial Corp. 1,658 10.26 22 5 First Horizon National Corp. 903 5.59 6 6 Investar Holding Corp. 881 5.45 14 7 Business First Bancshares Inc. 638 3.95 8 8 Red River Bancshares, Inc. 296 1.83 6 9 First Guaranty Bancshares Inc. 268 1.66 5 10 Citizens Bancorp Inc. 267 1.65 7 11 First Bancshares Inc. 246 1.53 11 Deposits Market Rank Institution ($mm) Share Branches 1 Regions Financial Corp. $2,260 31.11 24 2 Hancock Whitney Corp. 841 11.57 7 3 Banco Bilbao Vizcaya Argentaria SA 833 11.47 12 4 PNC Financial Services Group Inc. 676 9.31 10 5 Wells Fargo & Co. 617 8.49 10 6 First Horizon National Corp. 354 4.87 2 7 First Bancshares Inc. 345 4.75 10 8 ServisFirst Bancshares Inc. 337 4.64 2 9 Trustmark Corp. 335 4.61 6 10 BancorpSouth Bank 118 1.63 4 Deposits Market Rank Institution ($mm) Share Branches 1 Regions Financial Corp. $932 16.47% 14 2 Synovus Financial Corp. 570 10.08 8 3 Hancock Whitney Corp. 472 8.34 7 4 Bank of America Corp. 450 7.96 3 5 Wells Fargo & Co. 421 7.44 6 6 Trustmark Corp. 421 7.44 7 7 First Bancshares Inc. 372 6.57 5 8 Southern National Banks Inc. 365 6.44 9 9 Truist Financial Corp. 362 6.40 5 10 Banco Bilbao Vizcaya Argentaria SA 284 5.02 5 Deposits Market Rank Institution ($mm) Share Branches 1 Truist Financial Corp. $2,094 25.26% 9 2 Capital City Bank Group Inc. 1,277 15.40 18 3 Wells Fargo & Co. 1,149 13.85 6 4 Bank of America Corp. 958 11.55 7 5 Home BancShares Inc. 579 6.98 8 6 Regions Financial Corp. 427 5.15 4 7 Prime Meridian Holding Co. 399 4.81 3 8 First Bancshares Inc. 396 4.77 7 9 Hancock Whitney Corp. 350 4.22 3 10 Synovus Financial Corp. 333 4.01 4 37 Deposit Market Share by Select MSAs Tallahassee, FL MSA Gulfport - Biloxi, MS MSA Fort Walton Beach - Destin, FL MSA Mobile, AL MSA Baton Rouge, LA MSA Hattiesburg, MS MSA Deposits Market Rank Institution ($mm) Share Branches 1 Hancock Whitney Corp. $2,694 44.74% 29 2 First Bancshares Inc. 518 8.60 11 3 Peoples Financial Corp. 494 8.20 19 4 BancorpSouth Bank 430 7.13 9 5 Merchants & Marine Bancorp Inc. 421 6.98 9 6 Community Bancshares of Mississippi Inc. 381 6.33 7 7 Regions Financial Corp. 268 4.46 9 8 Wells Fargo & Co. 216 3.59 5 9 First Federal Savings and Loan Association of Pascagoula-Moss Point188 3.13 6 10 Bank of Wiggins 141 2.34 3 Deposits Market Rank Institution ($mm) Share Branches 1 BancorpSouth Bank $598 17.97% 9 2 Trustmark Corp. 486 14.61 9 3 Hancock Whitney Corp. 427 12.84 6 4 Regions Financial Corp. 412 12.39 8 5 First Bancshares Inc. 307 9.22 5 6 PriorityOne Capital Corp. 179 5.37 5 7 Community Bancshares of Mississippi Inc. 154 4.63 2 8 Wells Fargo & Co. 123 3.70 2 9 Citizens National Banc Corp. 104 3.13 3 10 Citizens Corp. 91 2.74 3 Source: S&P Global Market Intelligence Data as of 6/30/19 Note: Deposits capped at $ 1.0 bn per branch

Historical Financials 38 Source : S&P Global Market Intelligence Data as of 12/31 of each year, respectively; quarterly data as of the three months ended each respective quarter (1) Non - GAAP measure, see reconciliation to closest GAAP measure For the Twelve Months Ended, For the Three Months Ended, 2016 2017 2018 2019 3/31/20 6/30/20 Balance Sheet Data: Total Assets $1,277 $1,813 $3,004 $3,942 $4,062 $5,085 Gross Loans 873 1,230 2,065 2,611 2,616 3,190 Securities 256 373 515 792 789 954 Deposits 1,039 1,471 2,457 3,077 3,278 4,217 Tangible Common Equity (1) 139 198 250 355 368 436 Income Statement Data: Interest Income $44.6 $66.1 $100.0 $148.5 $41.6 $45.8 Interest Expense 4.3 6.9 15.1 26.7 7.5 6.6 Net Interest Income 40.3 59.2 84.9 121.8 34.1 39.2 Provision for Loan Losses 0.6 0.5 2.1 3.7 7.1 7.6 Noninterest Income 11.3 14.6 18.1 26.0 6.6 8.5 Noninterest Expense 36.4 48.9 62.4 82.4 23.0 26.3 Income before Income Taxes 14.0 17.6 27.0 56.4 10.0 19.2 Income Tax Expense 3.9 7.0 5.8 12.7 1.7 2.2 Net Income 10.1 10.6 21.2 43.7 8.3 16.9 Net Income, Operating (1) 9.9 16.9 30.0 48.0 8.9 11.2 Performance Ratios: ROAA 0.79 % 0.60 % 0.87 % 1.26 % 0.83 % 1.38 % ROAA, Operating (1) 0.81 0.96 1.23 1.39 0.89 0.91 ROATCE 13.1 7.5 10.4 14.9 10.1 17.0 ROATCE, Operating (1) 8.7 10.0 13.4 15.9 9.9 10.6 Net Interest Margin 3.71 3.83 3.94 4.02 3.93 3.63 Efficiency Ratio 70.2 74.2 71.7 59.1 57.2 50.6 Efficiency Ratio, Operating (1) 69.4 65.2 60.1 55.2 55.4 53.9 Per Share Data: Common Stock Issued and Outstanding 8,991,397 11,165,907 14,830,598 18,802,266 18,851,955 21,395,258 Earnings per Share $1.57 $1.11 $1.62 $2.55 $0.44 $0.79 Earnings per Share, Operating (1) 1.64 1.76 2.29 2.79 0.47 0.52 Tangible book value per share (1) 15.46 17.71 16.88 18.87 19.52 20.40 Dividends Per Share 0.15 0.15 0.20 0.31 0.10 0.10 Asset Quality: Nonperforming Assets / Total Assets 0.98 % 1.00 % 1.40 % 1.37 % 1.27 % 1.01 % Nonperforming Assets / (Loans + OREO) 1.43 1.47 2.03 2.06 1.97 1.60 Allowance for Loan Losses / Total Loans 0.86 0.67 0.49 0.53 0.80 0.88 Allowance for Loan Losses / Nonperforming Loans 122.5 78.4 32.4 29.8 46.5 61.3 Net Loan Charge-offs / Average Loans (0.02) (0.02) 0.01 (0.00) 0.03 0.04 Capital Ratios: Tangible Common Equity / Tangible Assets (1) 11.02 % 11.06 % 8.66 % 9.45 % 9.50 % 8.92 % Tier 1 Leverage Ratio 11.91 11.71 10.15 10.25 9.81 9.18 Common Equity Tier 1 Capital Ratio 13.81 14.23 11.53 12.48 12.69 13.08 Tier 1 Risk-based Ratio 14.73 14.92 12.21 13.02 13.23 13.56 Total Risk-based Capital Ratio 15.46 15.51 15.55 15.81 16.27 16.46
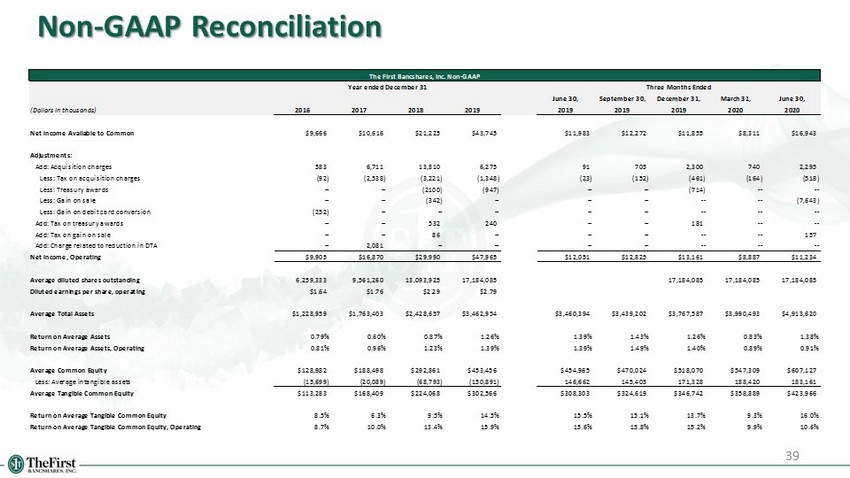
39 Non - GAAP Reconciliation The First Bancshares, Inc. Non-GAAP Year ended December 31 Three Months Ended June 30, September 30, December 31, March 31, June 30, (Dollars in thousands) 2016 2017 2018 2019 2019 2019 2019 2020 2020 Net Income Available to Common $9,666 $10,616 $21,225 $43,745 $11,983 $12,272 $11,855 $8,311 $16,943 Adjustments: Add: Acquisition charges 583 6,711 13,810 6,275 91 705 2,300 740 2,295 Less: Tax on acquisition charges (92) (2,538) (3,221) (1,348) (23) (152) (461) (164) (518) Less: Treasury awards -- -- (2100) (947) -- -- (714) -- -- Less: Gain on sale -- -- (342) -- -- -- -- -- (7,643) Less: Gain on debit card conversion (252) -- -- -- -- -- -- -- -- Add: Tax on treasury awards -- -- 532 240 -- -- 181 -- -- Add: Tax on gain on sale -- -- 86 -- -- -- -- -- 157 Add: Charge related to reduction in DTA -- 2,081 -- -- -- -- -- -- -- Net Income, Operating $9,905 $16,870 $29,990 $47,965 $12,051 $12,825 $13,161 $8,887 $11,234 Average diluted shares outstanding 6,259,333 9,561,260 13,093,925 17,184,085 17,184,085 17,184,085 17,184,085 Diluted earnings per share, operating $1.64 $1.76 $2.29 $2.79 Average Total Assets $1,228,959 $1,763,403 $2,428,657 $3,462,954 $3,460,394 $3,439,202 $3,767,587 $3,990,493 $4,913,620 Return on Average Assets 0.79% 0.60% 0.87% 1.26% 1.39% 1.43% 1.26% 0.83% 1.38% Return on Average Assets, Operating 0.81% 0.96% 1.23% 1.39% 1.39% 1.49% 1.40% 0.89% 0.91% Average Common Equity $128,982 $188,498 $292,861 $453,456 $454,965 $470,024 $518,070 $547,309 $607,127 Less: Average intangible assets (15,699) (20,089) (68,793) (150,891) 146,662 145,405 171,328 188,420 183,161 Average Tangible Common Equity $113,283 $168,409 $224,068 $302,566 $308,303 $324,619 $346,742 $358,889 $423,966 Return on Average Tangible Common Equity 8.5% 6.3% 9.5% 14.5% 15.5% 15.1% 13.7% 9.3% 16.0% Return on Average Tangible Common Equity, Operating 8.7% 10.0% 13.4% 15.9% 15.6% 15.8% 15.2% 9.9% 10.6%

40 Non - GAAP Reconciliation (cont.) The First Bancshares, Inc. Non-GAAP Three Months Ended September 30, December 31, March 31, June 30, September 30, December 31, March 31, June 30, (Dollars in thousands) 2018 2018 2019 2019 2019 2019 2020 2020 Net Interest Income $21,669 $25,270 $27,131 $30,772 $30,459 $33,444 $34,065 $39,180 Non Interest Income 5,074 6,396 5,554 6,716 7,103 7,574 6,474 15,680 Non Interest Expense (19,786) (22,249) (21,893) (20,891) (20,825) (24,960) (23,439) (28,070) Adjustments: Add: Acquisition charges 4,059 4,155 3,179 91 705 2,300 740 2,295 Less: Gain on sale (233) (950) (233) -- -- (714) -- (7,643) Pre-tax Pre Provision Income, Operating $10,783 $12,622 $13,738 $16,688 $17,442 $17,644 $17,840 $21,442 Average Total Assets 2,470,607 2,812,212 3,181,761 3,460,394 3,439,202 3,767,587 3,990,493 4,913,620 Pre-tax Pre Provision Return on Average Assets, Operating 1.75% 1.80% 1.73% 1.93% 2.03% 1.87% 1.79% 1.75%

The First Bancshares, Inc. Non-GAAP Year ended December 31 Three Months Ended June 30, September 30, December 31, March 31, June 30, (Dollars in thousands) 2016 2017 2018 2019 2019 2019 2019 2020 2020 Operating Expense Total non-interest expense $36,862 $55,443 $76,309 $88,569 $20,891 $20,825 $24,960 $23,439 $28,070 Pre-tax non-operating expenses (583) (6,711) (13,810) (6,275) (91) (705) (2,300) (740) (2,295) Adjusted operating expense 36,279 48,732 62,499 82,294 20,800 20,120 22,660 22,699 25,775 Operating Revenue Net interest income, FTE $41,252 $60,365 $85,884 $123,014 $31,040 $30,739 $33,847 $34,526 $39,772 Total non-interest income 11,247 14,362 20,561 26,947 6,716 7,103 7,574 6,474 15,680 Pre-tax non-operating items (252) -- (2,442) (947) -- -- (714) -- (7,643) Adjusted operating revenue 52,247 74,727 104,003 149,014 $37,756 $37,842 $40,707 $41,000 $47,809 Efficiency Ratio, Operating 69.4% 65.2% 60.1% 55.2% 55.1% 53.2% 55.7% 55.4% 53.9% Adjusted operating revenue $52,247 $74,727 $104,003 $149,014 $41,000 $47,809 Less: Adjusted operating expense (36,279) (48,732) (62,499) (82,294) (22,699) (25,775) Less: Provision expense (625) (506) (2,120) (3,738) (7,102) (7,606) Pre-tax income, Operating $15,343 $25,489 $39,384 $62,982 $11,199 $14,428 41 Non - GAAP Reconciliation (cont.)

42 Non - GAAP Reconciliation (cont.) The First Bancshares, Inc. Non-GAAP Three Months Ended June 30, September 30, December 31, March 31, June 30, (Dollars in thousands) 2019 2019 2019 2020 2020 Total non-interest income $6,716 $7,103 $7,574 $6,474 $15,680 Pre-tax non-operating items -- -- (714) -- (7,643) Non-interest income, operating 6,716 7,103 6,860 6,474 8,037 Operating Revenue Net interest income, FTE $31,040 $30,739 $33,847 $34,526 $39,772 Total non-interest income 6,716 7,103 7,574 6,474 15,680 Pre-tax non-operating items -- -- (714) -- (7,643) Adjusted Operating Revenue $37,756 $37,842 $40,707 $41,000 $47,809 Non-interest income, operating / Adjusted Operating Revenue 17.8% 18.8% 16.9% 15.8% 16.8% Operating Expense Total non-interest expense $20,891 $20,825 $24,960 $23,439 $28,070 Pre-tax non-operating expenses (91) (705) (2,300) (740) (2,295) Adjusted operating expense 20,800 20,120 22,660 22,699 25,775 Average Total Assets $3,460,394 $3,439,202 $3,767,587 $3,990,493 $4,913,620 Adjusted Operating Expense / Average Assets 2.40% 2.34% 2.41% 2.28% 2.10%

43 Non - GAAP Reconciliation (cont.) The First Bancshares, Inc. Non-GAAP Year ended December 31 Three Months ended March 31, June 30, (Dollars in thousands) 2015 2016 2017 2018 2019 2020 2020 Total common equity $86,313 $154,527 $222,468 $363,254 $543,658 $555,296 $627,795 Less: Goodwill and other intangibles (15,891) (15,508) (24,670) (112,916) (188,865) (187,927) (191,431) Tangible common equity $70,422 $139,019 $197,798 $250,338 $354,793 $367,369 $436,364 Total assets $1,145,131 $1,277,367 $1,813,238 $3,003,986 $3,941,863 $4,061,801 $5,084,905 Less: Goodwill and other intangibles (15,891) (15,508) (24,670) (112,916) (188,865) (187,927) (191,431) Tangible assets $1,129,240 $1,261,859 $1,788,568 $2,891,070 $3,752,998 $3,873,874 $4,893,474 Tangible common equity / Tangible assets 6.2% 11.0% 11.1% 8.7% 9.5% 9.5% 8.9%