Attached files
| file | filename |
|---|---|
| 8-K - FORM 8-K - Inotiv, Inc. | tm2030956d1_8k.htm |
Exhibit 99.1

H.C. Wainwright Investment Conference September 2020

Forward - looking statements This presentation includes forward - looking statements within the meaning of the Private Securities Litigation Reform Act of 1995 that are subject to risks and uncertainties that could cause actual results to differ materially from those projected. Forward - looking statements can often be identified by words such as: "anticipate," "intend," "plan," "goal," "seek," "believe," "project," "estimate," "expect," "strategy," "future," "likely," " may ," "should," "will" and similar references to future periods. Forward - looking statements may include, but are not limited to, statements regarding our intent, belief or curre nt expectations with respect to ( i ) our strategic plans; (ii) trends in the demand for our products and services; (iii) trends in the industries that consume our pro duc ts and services; (iv) our ability to develop new products and services; (v) our ability to make capital expenditures and finance operations; (vi) global economic conditio ns, especially as they impact our markets; (vii) our cash position; (viii) our ability to successfully integrate the operations and personnel of Seventh Wave, Smithers Ava nza, and Pre - Clinical Research Services; (ix) our ability to effectively manage current expansion efforts and any future expansion or acquisition initiatives undertak en by the Company; (x) our ability to develop and build infrastructure and teams to manage growth and projects; (xi) our ability to continue to retain and hire key ta lent; (xii) our ability to market our services and products under relevant brand names; (xiii) our ability to service our outstanding indebtedness, (xiv) our expec tat ions regarding the volume of new bookings, pricing, gross profit margins and liquidity, (xv) the impact of COVID - 19 on the economy, demand for our services and p roducts and our operations, including the measures taken by governmental authorities to address the pandemic, which may precipitate or exacerbate other risks and/o r u ncertainties, and (xvi) additional risks set forth in the Company’s filings with the Securities and Exchange Commission. Actual results may differ materially fr om those in the forward - looking statements as a result of various factors, including but not limited to the risk factors disclosed in our reports with the SE C, many of which are beyond our control. You should not rely upon forward - looking statements as predictions of future events. Although the Company believes that the expe ctations reflected in the forward - looking statements are reasonable, the Company cannot guarantee that the future results, levels of activity, performance or eve nts and circumstances reflected in the forward - looking statements will be achieved or occur. Any forward - looking statement made by us during the course of our pres entation or in these slides is based only on information currently available to us and speaks only as of the date on which it is made. We undertake no obligation to publicly update any forward - looking statement, whether written or oral, that may be made from time to time, whether as a result of new information, future develo pme nts or otherwise. 2

Company overview • BASi , now doing business as Inotiv • Public company since November 1997 • Listed on Nasdaq stock exchange (BASI) • Fiscal 2017, company began a new strategic plan 3

New strategic plan • Becoming the preferred, “solutions - oriented” contract research organization (CRO) • Reinvention to become a contemporary company • Improve profitability and cash flow 4
Becoming the preferred, “solutions - oriented” CRO • Many biotech firms and clients are seeking solutions - oriented, full service partners to assist in research and product development • By expanding our services across the complete drug discovery & development continuum through internal growth and acquisitions, we believe this will: » Enhance project management skills, client services and communication thereby elevating the client experience » Continue to attract world - class professional talent and scientific & commercial leaders » Elevate strong leadership and platform for growth » Set a new standard for partnered research, effectively reducing the number of competitors 5

Reinvention to a contemporary company Focusing on: • Becoming a partnered, comprehensive drug discovery & development organization • Providing a superlative client experience • Enriching internal expertise and capabilities to span the drug discovery continuum — ranging from small to large molecule therapies to medical devices 6

A contracted drug discovery & development organization Optimization Lead Se l ect i on Preclinical Devel o pm e n t I I I III Drug Discovery Clinical Development • Toxicology • Med Device Toxicology/Surgical Models • Histopathology (+ GLP) • Pathology (+ GLP) • Drug Metabolism & Pharmacokinetics (+ GXP TK & PK Analysis) • Contemporary Bioanalysis • Mechanistic Pharmacology & Toxicology/Biomarker Discovery • Safety Pharmacology/Cardiovascular • Formulation Chemistry • Genetic Toxicology • General Toxicology (GLP) • Developmental & Repro Tox (GLP) • Medical Device Toxicology (GLP) • Method Develop/BioA (GLP) • Safety Pharmacology Battery (GLP) • Biomarker Development • Genetic Toxicology (GLP) • Biotherapeutics bioanalysis (GLP) • Clinical Bioanalysis (GCP) • Clinical Pharmacology/Biomarker (GCP) • Bioequivalence (GXP) • Biotherapeutics bioanalysis (GCP) • Center of Excellence (COE) • Internal Investment in COE • External Partnership 7
Steps to reinvention x Started with BASi platform x Internally added new services and capacity 8 x Development of platform and infrastructure for support services and business development x Added three acquisitions for capacity and additional services x Culturally aligned with our entrepreneurial client base x Assembled new management team

Internal timeline of strategic plan 9 FY 2017 FY 2018 FY 2019 FY 2020 A New Strategic Direction * Develop longer term strategy * Understand market opportunities & potential acquisitions * Focus on creating the best employee experience to reduce turnover and support recruiting efforts * Strategic though t * Ad ditional scientific leadership * Business d evelopment team * World class pathology services * Gr owth in t oxicology business model * Evansville expansion initiated * Investments to address deferred maintenance at all locations * Investments to create the best client experience foundation in all aspects of business * Initiated a contemporary drug discovery strategy & growth plan, including an expansion of discovery DMPK, pharmacology and toxicology to support lead optimization through candidate selection studies * Additional t oxicology capacity * Reproductive t oxicology expertise * Opened new capacity in Evansville and Gaithersburg * New name and branding * St . Louis drug discovery center expansion initiated (DMPK, cell & molecular biology, histology) * New accounting system implemented company wide * Initiated program management function to manage the growing multi - site and - discipline projects * Further u pgrad es to labs and services * Adding s urgical c apabilities and medical device development * Initiated a safety pharmacology offering * Continue evaluating potential acquisitions

Timeline of acquisitions and “building blocks” over past three years • A group of small, niche service providers were brought together to fill a void created by consolidation within the contract research industry: GLP Toxicology GLP Bioanalysis Discovery In Vivo and In Vitro Development and Reproduction Surgical Models • Pharmacology • Toxicology • Drug Metabolism • Rodents • Canines • Swine • Non Human Primates 2017 • Method Development • Method Validation • Sample Analysis 2017 • Invasive Approaches • Wound Healing • Medical Devices • Imaging 2019 • Juvenile Assessments • Fertility • Embryonic Development 2019 2018 10 • Pathology • Pharmacokinetics

Management team 11 Team Member Title Joined Company Robert Leasure , Jr. Chief Executive Officer, President and Director 2017 John Sagartz, DVM, Ph.D., DACVP Chief Strategy Officer and Director July 2018 Stewart Jacobson, DVM, DACVP Senior VP Pathology October 2019 Scott Daniels, Ph.D. Senior VP DMPK March 2019 Philip Downing Senior VP of Preclinicial Services November 1997 Mike Dorato, Ph.D. Senior VP of Toxicology and Pharmacology May 2019 Mike Baim, Ph.D. VP Analytical Operations May 2018 Beth Taylor Chief Financial Officer, VP of Finance March 2020 Joe Flynn Chief Commericial Officer July 2018 William Pitchford Chief Human Resources Officer September 2019 Diane Tutko Francisco, Ph.D. Senior Director, Client Experience May 2020
Improve profitability • Accretive and scalable investments • Internal growth plans to leverage existing direct fixed cost • Take advantage of purchasing opportunities • Reduce business development and customer - acquisition costs as a percentage of revenue • Reduce corporate overhead as a percentage of revenue 12
Recent accomplishments • Managing through coronavirus pandemic and maintaining contracted services • Name change and branding strategy implemented • Growing client base and backlog • Recruiting, building team and maintaining low employee turnover • Internally developing and investing discovery stage services strategy & growth plan • Initiating internal safety pharmacology service offering (strategic gap fill) 13
Recent accomplishments — continued • Significant upgrades in all facilities, including major expansion in Evansville completed in March 2020 • Integration and improvements of recent acquisitions • Focus on developing project management team for multi - site projects • Continued focus on building client experience team (service enhancement) • Implementing new accounting systems throughout the company and one common IT platform 14
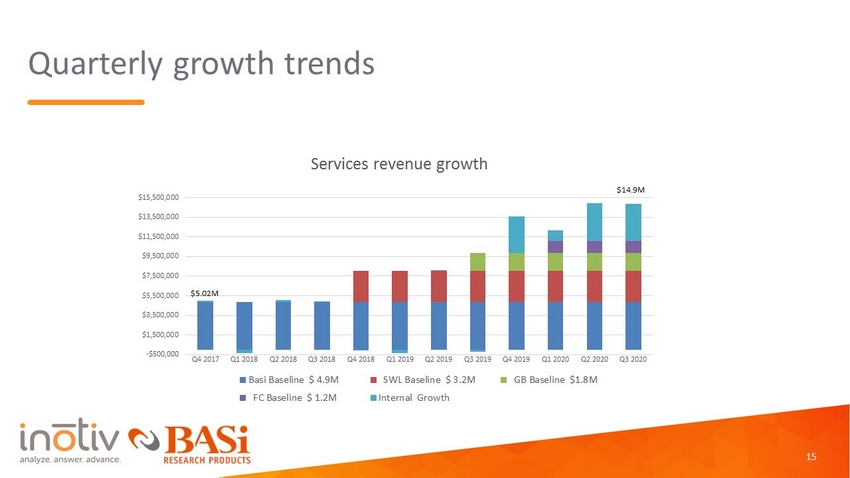
Quarterly growth trends -$500,000 $1,500,000 $3,500,000 $5,500,000 $7,500,000 $9,500,000 $11,500,000 $13,500,000 $15,500,000 Q4 2017 Q1 2018 Q2 2018 Q3 2018 Q4 2018 Q1 2019 Q2 2019 Q3 2019 Q4 2019 Q1 2020 Q2 2020 Q3 2020 Services revenue growth Basi Baseline $ 4.9M SWL Baseline $ 3.2M GB Baseline $1.8M FC Baseline $ 1.2M Internal Growth $5.02M $14.9M 15
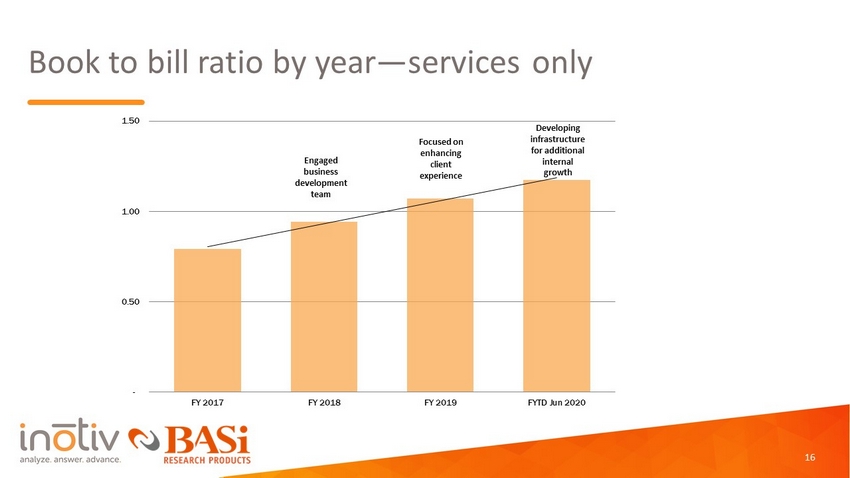
Book to bill ratio by year — services only Engaged business development team Focused on enhancing client experience Developing infrastructure for additional internal growth - 0.50 1.00 1.50 FY 2017 FY 2018 FY 2019 FYTD Jun 2020 16
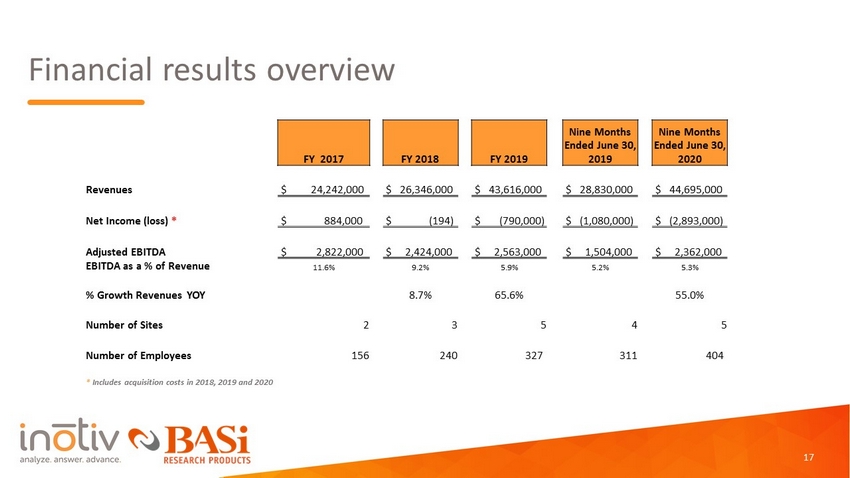
Financial results overview FY 2017 FY 2018 FY 2019 Nine Months Ended June 30, 2019 Nine Months Ended June 30, 2020 Revenues $ 24,242,000 $ 26,346,000 $ 43,616,000 $ 28,830,000 $ 44,695,000 Net Income (loss) * $ 884,000 $ ( 194) $ (790,000) $ (1,080,000) $ (2,893,000) Adjusted EBITDA $ 2,822,000 $ 2,424,000 $ 2,563,000 $ 1,504,000 $ 2,362,000 EBITDA as a % of Revenue 11.6% 9.2% 5.9% 5.2% 5.3% % Growth Revenues YOY 8.7% 65.6% 55.0% Number of Sites 2 3 5 4 5 Number of Employees 156 240 327 311 404 * Includes acquisition costs in 2018, 2019 and 2020 17

Growth financed with debt, stock and seller financing • Acquisitions have met specific needs for opportunities for future financial and operational improvements and accretive sales growth • New services and capacity improvements have been added with capital expenditure investments of $13.6 million from FY 2017 through June 20, 2020, to support internal growth • Investments in new systems and infrastructure to support growth and scalability • Recruiting, acquiring, developing and retaining scientific talent 18
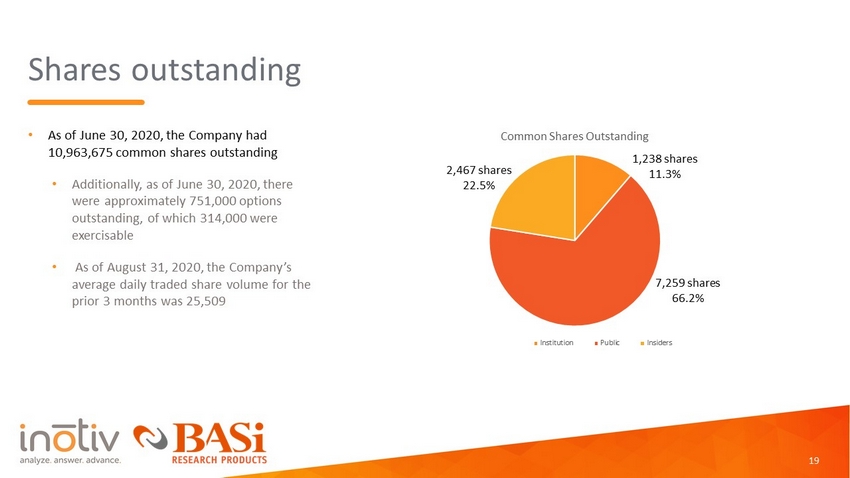
Shares outstanding • As of June 30, 2020, the Company had 10,963,675 common shares outstanding • Additionally, as of June 30, 2020, there were approximately 751,000 options outstanding, of which 314,000 were exercisable • As of August 31, 2020, the Company’s average daily traded share volume for the prior 3 months was 25,509 7,259 shares 66.2% 2,467 shares 22.5 % 19 Common Shares Outstanding Institution Public Insiders 1,238 shares 11.3%
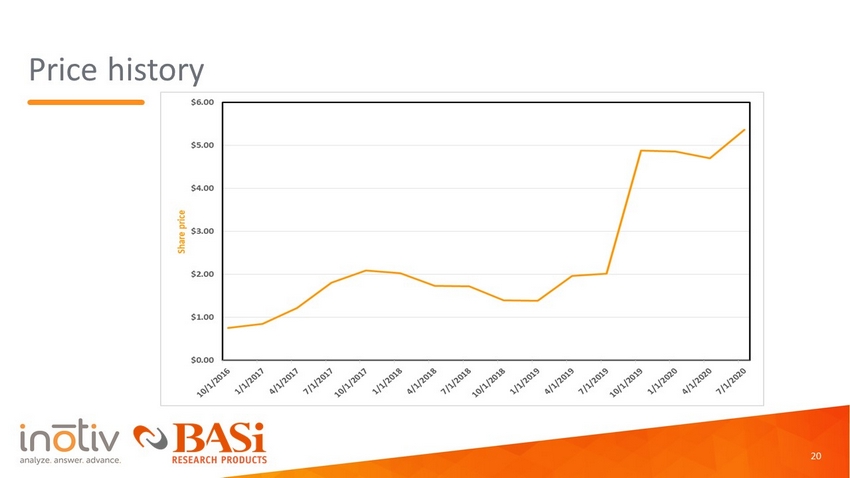
Price history 20

Non - GAAP to GAAP Reconciliation This presentation contains financial measures that are not calculated in accordance with generally accepted accounting principles in the United States ( GAA P). The non - GAAP financial measures are Adjusted EBITDA for the fiscal years ended September 30, 2017, 2018 and 2019 and the nine months ended June 30, 2019 and 2020. Adjusted EBITDA as reported herein refers to a financial performance measure that excludes from net income (loss) income statement line items interest expense and income taxes (benefit) expense, as well as n on - cash charges for depreciation and amortization, stock option (benefit) expense, United Kingdom lease liability reversal benefit, non - recurring acquisition and integration costs and other non - recurring third p arty costs, such as recruiting costs, consulting fees related to the adoption of two accounting standards, and expenses for rebranding and new website launch . The non - GAAP financial information should be considered supplemental to, and not as a substitute for, or superior to, financial measures calculated in accordance with GAAP. Management, however, believes that Adjusted EBITDA, when used in conjunction with the results presented in accordance with GAAP, may provide a more complet e u nderstanding of the Company's results and may facilitate a fuller analysis of the Company's results, particularly in evaluating performance from one period to another . Management has chosen to provide this supplemental information to investors, analysts, and other interested parties to enable th em to perform additional analyses of our results and to illustrate our results giving effect to the non - GAAP adjustments shown in the reconciliation. Management strongly encourages investors to review the Co mpany's consolidated financial statements and publicly filed reports in their entirety and cautions investors that the non - GAAP measures used by the Company may differ from similar measures used by other co mpanies, even when similar terms are used to identify such measures. 2017 2018 2019 2019 2020 GAAP Net loss $ 884,000 $ (194,000) $ (790,000) $ (1,080,000) $ (2,893,000) Add back: Interest expense 375,000 274,000 642,000 426,000 1,085,000 Income taxes (benefit) expense 24,000 (60,000) 4,000 2,000 129,000 Depreciation and amortization 1,520,000 1,875,000 2,673,000 2,037,000 2,747,000 Stock option expense 19,000 134,000 278,000 196,000 380,000 United Kingdom lease liability reversal benefit — — (972,000) (623,000) (208,000) Acquisition and integration costs — 395,000 568,000 394,000 339,000 Other non-recurring, third party costs — — 160,000 152,000 783,000 Adjusted EBITDA $ 2,822,000 $ 2,424,000 $ 2,563,000 $ 1,504,000 $ 2,362,000 Fiscal Year Ended Nine Months Ended September 30, June 30,