Attached files
| file | filename |
|---|---|
| EX-31.1 - EX-31.1 - EGAIN Corp | egan-20200630ex3113ffd24.htm |
| EX-32.2 - EX-32.2 - EGAIN Corp | egan-20200630ex32204322d.htm |
| EX-32.1 - EX-32.1 - EGAIN Corp | egan-20200630ex3218fab9f.htm |
| EX-31.2 - EX-31.2 - EGAIN Corp | egan-20200630ex3120eb720.htm |
| EX-23.1 - EX-23.1 - EGAIN Corp | egan-20200630ex231e12302.htm |
| EX-21.1 - EX-21.1 - EGAIN Corp | egan-20200630ex21174b5de.htm |
| EX-10.8 - EX-10.8 - EGAIN Corp | egan-20200630ex10833955e.htm |
| EX-10.7 - EX-10.7 - EGAIN Corp | egan-20200630ex107a6c1a6.htm |
| EX-10.6 - EX-10.6 - EGAIN Corp | egan-20200630ex106c265a0.htm |
| EX-10.5 - EX-10.5 - EGAIN Corp | egan-20200630ex105d52f14.htm |
| EX-4.2 - EX-4.2 - EGAIN Corp | egan-20200630ex423dec75f.htm |
UNITED STATES
SECURITIES AND EXCHANGE COMMISSION
WASHINGTON, D.C. 20549
FORM 10-K
(Mark One)
⌧ | ANNUAL REPORT PURSUANT TO SECTION 13 OR 15(d) OF THE SECURITIES EXCHANGE ACT OF 1934 |
For the Fiscal Year Ended June 30, 2020
or
◻ | TRANSITION REPORT PURSUANT TO SECTION 13 OR 15(d) OF THE SECURITIES EXCHANGE ACT OF 1934 |
For the transition period from to
Commission File Number: 001-35314
eGain Corporation
(Exact name of registrant as specified in its charter)
Delaware |
| 77-0466366 |
(State or other jurisdiction |
| (I.R.S. Employer |
1252 Borregas Avenue Sunnyvale, California 94089 (Address of principal executive offices, including zip code) (408) 636-4500 (Registrant’s telephone number, including area code) | ||
Securities registered pursuant to Section 12(b) of the Act:
Title of Each Class | Trading Symbol | Name of Each Exchange on Which Registered | |||
Common Stock, par value $0.001 per share | EGAN | Nasdaq Capital Market | |||
Securities registered pursuant to Section 12(g) of the Act: None
Indicate by check mark if the registrant is a well-known seasoned issuer, as defined in Rule 405 of the Securities Act. Yes ◻ No ⌧
Indicate by check mark if the registrant is not required to file reports pursuant to Section 13 or Section 15(d) of the Act. Yes ◻ No ⌧
Indicate by check mark whether the registrant: (1) has filed all reports required to be filed by Section 13 or 15(d) of the Securities Exchange Act of 1934 during the preceding 12 months (or for such shorter period that the registrant was required to file such reports), and (2) has been subject to such filing requirements for the past 90 days: Yes ⌧ No ◻
Indicate by check mark whether the registrant has submitted electronically every Interactive Data File required to be submitted pursuant to Rule 405 of Regulation S-T during the preceding 12 months (or for such shorter period that the registrant was required to submit such files). Yes ⌧ No ◻
Indicate by check mark whether the registrant is a large accelerated filer, an accelerated filer, a non-accelerated filer, smaller reporting company, or an emerging growth company. See the definitions of “large accelerated filer,” “accelerated filer,” “smaller reporting company,” and “emerging growth company” in Rule 12b-2 of the Exchange Act.
Large accelerated filer |
| ◻ |
| Accelerated filer |
| ◻ |
Non-accelerated filer |
| ⌧ |
| Smaller reporting company |
| ⌧ |
Emerging growth company | | ◻ | | | | |
If an emerging growth company, indicate by check mark if the registrant has elected not to use the extended transition period for complying with any new or revised financial accounting standards provided pursuant to Section 13(a) of the Exchange Act. ◻
Indicate by check mark whether the registrant has filed a report on and attestation to its management’s assessment of the effectiveness of its internal control over financial reporting under Section 404(b) of the Sarbanes-Oxley Act (15 U.S.C. 7262(b)) by the registered public accounting firm that prepared or issued its audit report. ◻
Indicate by check mark whether the registrant is a shell company (as defined in Rule 12b-2 of the Exchange Act): Yes ◻ No ⌧.
The aggregate market value of the voting and non-voting common equity held by non-affiliates (based on the closing price on the Nasdaq Capital Market) on December 31, 2019, was approximately $163.8 million. For purposes of the foregoing calculation only, the registrant has included in the shares owned by affiliates the beneficial ownership of voting and non-voting common equity of officers and directors, and affiliated entities, of the registrant and members of their families. Such inclusion shall not be construed as an admission that any such person is an affiliate for any other purpose.
There were 30,909,187 shares of the Registrant’s Common Stock par value $0.001 per share, outstanding on September 10, 2020.
DOCUMENTS INCORPORATED BY REFERENCE
Items 10 (as to directors), 11, 12, 13 and 14 of Part III of this Annual Report on Form 10-K incorporate by reference information from the registrant’s proxy statement to be filed with the Securities and Exchange Commission in connection with the solicitation of proxies for the registrant’s 2020 Annual Meeting of Stockholders.
EGAIN CORPORATION
2020 FORM 10-K
Item |
|
|
| Page |
|---|---|---|---|---|
| | | | |
|
|
|
| |
|
| 3 | ||
| |
| 12 | |
| |
| 28 | |
| |
| 28 | |
| |
| 28 | |
| |
| 28 | |
|
| |
| |
|
| 29 | ||
| |
| 31 | |
| Management’s Discussion and Analysis of Financial Condition and Results of Operations |
| 32 | |
| |
| 46 | |
| |
| 47 | |
| Changes In and Disagreements With Accountants on Accounting and Financial Disclosure |
| 77 | |
| |
| 77 | |
| |
| 77 | |
|
| |
| |
| |
| 78 | |
| |
| 78 | |
| Security Ownership of Certain Beneficial Owners and Management and Related Stockholder Matters |
| 78 | |
| Certain Relationships and Related Transactions and Director Independence |
| 79 | |
| |
| 79 | |
|
| |
| |
| |
| 80 | |
| | | 82 | |
|
| |
| 83 |
2
ITEM 1. |
This Annual Report on Form 10-K contains forward-looking statements within the meaning of the Private Securities Litigation Reform Act of 1995. These statements may be identified by the use of the words such as “anticipates,” “believes,” “continue,” “could,” “would,” “estimates,” “expects,” “intends,” “may,” “might,” “plans,” “potential,” “should,” or “will” and similar expressions or the negative of those terms. The forward-looking statements include, but are not limited to, statements regarding: the impact of the COVID-19 pandemic on our business, employees and customers; our SaaS only business model and our belief that it affords recurring revenue visibility, more predictability and 50% faster time to value to SaaS clients; our belief that SaaS revenue better reflects business momentum; expectations regarding our revenue, including visibility and predictability; our beliefs regarding the value of our platform; the opportunities afforded by automation of contact centers, innovation in cloud and growing API economy; our business strategies; the effect of changes in macroeconomic factors beyond our control; our ability to predict subscription renewals or upgrade rates; our lengthy sales cycles and the difficulty in predicting timing of sales or delays; competition in the markets in which we do business and our competitive advantages; our expectations regarding the composition of our customers and the result of a loss of a significant customer; our beliefs regarding our prospects for our business; the adequacy of our capital resources and our ability to raise additional financing; the development and expansion of our strategic and third party distribution partnerships and relationships with systems integrators; legal liability or the effect of negative publicity for the services provided to consumers through our technology platforms; our ability to compete; the operational integrity and maintenance of our systems; the effect of unauthorized access to a customer’s data or our data or our IT systems and cybersecurity attacks; the uncertainty of demand for our products; our beliefs regarding the attributes and anticipated customer benefits of our products; the actual mix in new business between subscription and license transactions; our ability to increase the profitability of our recurring products and services; our ability to increase revenue as a result of the increased investment in sales and marketing; our ability to hire additional personnel and retain key personnel; our ability to expand and improve our sales performance and marketing activities; our ability to manage our expenditures and estimate future expenses, revenue, and operational requirements; the effect of changes to management judgments and estimates; the impact of any modification to our pricing practices in the future; our beliefs regarding our international operations; our ability to timely adapt and comply with changing European regulatory and political environments; uncertainty relating to the implementation and effect of Brexit; the effect of recent changes in U.S. tax legislation; the effect of compliance with California privacy laws and regulations on our business and our customers; our inability to successfully detect weaknesses or errors in our internal controls; our ability to take adequate precautions against claims or lawsuits made by third parties, including alleged infringement of proprietary rights; the potential impact of foreign currency fluctuations; the impact of accounting pronouncements and our critical accounting policies, judgments, estimates, models and assumptions on our financial results; and our expectations with respect to revenue, cost of revenue, expenses and other financial metrics.
Forward-looking statements are subject to risks and uncertainties that could cause actual results to differ materially from those expected. These risks and uncertainties include, but are not limited to, those risks discussed in Item 1A “Risk Factors” in this report, as well as the effect of the COVID-19 pandemic on our business; our ability to manage our business plans, strategies and outlooks and any business-related forecasts or projections; our ability to effectively implement and improve our current products; our ability to innovate and respond to rapid technological change and competitive challenges; customer acceptance of our existing and future products; the impact of new legislation or regulations, or of judicial decisions, on our business; legal and regulatory uncertainties and other risks related to protection of our intellectual property assets; our ability to compete against third parties; the success of our partnerships; our ability to obtain capital when needed; the economic environment; our history of operating losses; our ability to manage future growth; the market price of our common stock; and foreign currency fluctuations. These forward looking statements speak only as of the date hereof. We expressly disclaim any obligation or undertaking to update any forward-looking statements contained herein to reflect any change in our expectations with regard thereto or any change in events, conditions or circumstances on which any such statement is based.
All references to “eGain”, the “Company”, “our”, “we” or “us” mean eGain Corporation and its subsidiaries, except where it is clear from the context that such terms mean only this parent company and exclude subsidiaries.
eGain and the eGain® are trademarks of eGain Corporation. We also refer to trademarks of other corporations and organizations in this report
3
Overview
eGain automates customer engagement with an innovative Software as a service (SaaS) platform, powered by deep digital, Artificial intelligence (AI), and knowledge capabilities. We are headquartered in the United States. We also operate in United Kingdom and India. We sell mostly to large enterprises across financial services, telecommunications, retail, government, healthcare, and utilities. With our mantra of AX + BX + CX = DX™, we guide clients to effortless Digital experience (DX) by holistically optimizing Agent experience (AX), Business experience (BX) and Customer experience (CX). One hundred fifty leading brands use eGain cloud software to improve customer satisfaction, empower agents, reduce service cost and boost sales.
Industry Background
Introduction
Customer relationship management (CRM) tools are not designed to serve as systems of engagement because they are primarily systems of record. They do not offer rich applications to engage customers across digital touch points, nor do they escalate conversations with context across self-service to agent assistance. Furthermore, CRM systems mostly view knowledge management as traditional document management - a big content model that does not work the personalized, media-rich, and content-heavy digital world. Frontline agents, in the CRM worldview, are supposed to have super-human capacity to retain and routinely refresh all relevant knowhow across complex, expanding product portfolios and compliance-heavy processes. Finally, the concept of in-band guidance for customer self-service and agent assistance is foreign to CRM systems. The reality of CRM desktops in contact centers today, we believe, is that agents ignore 90% of the data piled up their application screens—most of which is hidden behind multiple tabs. According to Gartner, 84% of agents surveyed are not satisfied with their desktop tools. It is time to reimagine the Agent Experience.
Digital Economy Demands Modern Software
In a world selling commoditized products to information-rich customers short on time, smart engagement must automate the routine and augment the interesting across agent, business and customer. Therefore, businesses are increasingly seeking digital-first, modern software platforms to layer on top of their traditional systems like CRM, contact centers, and content management. Customer engagement platforms must be designed to be systems of engagement, enabling rapid innovation, delivering quick value and integrating with systems of record across the enterprise. Agile, comprehensive, scalable, and cost-effective, they must demonstrably automate customer self-service, empower agents and easily orchestrate contact center operation in an omnichannel environment.
AI-Knowledge Powered Customer Engagement Automation
Energized by big-data, cloud-computing and open-source technologies in a digital world, AI-Knowledge can deliver transformational value, within a digital-first, omnichannel customer interaction framework. Smart, connected experiences can be automated to successfully resolve majority of customer interactions in most B2C businesses. The pressing challenge for solution buyers, however, is to separate the wheat from the chaff as they look for trusted, innovative and aligned partners. They seek sustained product leadership, at-scale proof points and no-risk trials.
Contact Centers are the Battleground
Contact centers offer a significant opportunity to automate customer engagement. Globally, there are close to 15 million contact center agents. Time-starved customers consuming complex products and grappling with marketing offers generate stubbornly high levels of customer contact. Furthermore, contact centers worldwide are undergoing a technology refresh cycle from on-premise voice-centric models to cloud-based omnichannel platforms. This transition affords businesses the opportunity to reimagine and design new customer contact strategies to drive digital-first automation, fueled by AI-Knowledge.
4
Customer Engagement Automation is a Large, Growing Market
Businesses are investing heavily in digital transformation, with customer engagement as a top priority. Ease of innovation in cloud and a growing Application programming interface (API) economy present exciting capability to connect, solve, and optimize. This is both an opportunity and a challenge. As predicted by industry analysts, the number of customer interactions involving emerging technology such as machine-learning applications, chatbots, or mobile messaging is increasing every day. To effectively harness such novel capabilities, businesses are looking toward innovative platform providers with proof at scale to guide them on their automation journey.
The eGain Approach and Benefits
What Customers Want
Technology acceleration notwithstanding, human needs for customer engagement and service change slowly. We believe what customers want is help in three categories: information, transaction, and situational. A given customer contact can morph across these categories as the conversation develops. Therefore, it is critical that an effective solution optimization customer contact across these three categories seamlessly and with context —accounting for machine-human hand-offs, channel switching, multimodal interaction, and conversational pause-and-resume. During these interactions, we believe customers increasingly want to be guided, even anticipated. Siloed solutions like transactional, simplistic chatbots without contextual escalation and supporting knowledge tend to disappoint consumers even more than non-existent self-service options.
The eGain Solution is Comprehensive
eGain offers a comprehensive, unified cloud software solution to automate, augment and orchestrate customer engagement in a digital world. Our feature-rich portfolio of applications empowers businesses to holistically connect, flexibly solve, and continuously optimize the experience for agents, businesses and customers. Our solution experts and partners guide clients by aligning with their strategic priorities and demonstrating quick value across a series of agile sprints.
Digital-First, Omnichannel Desktop Connect
First, our solution offers comprehensive, scalable capabilities for digital-first, omnichannel interaction within a modern, purpose-built desktop. Rich applications, optimized for productivity, proactively guide agents to efficiently interact with customers using messaging, Short message service (SMS), chat, email, social media, phone, video, fax, and letter. Agents do not have to remember complex product details and detailed process steps. Process compliance is built into the solution.
AI and Knowledge Solve
Next, our solution offers powerful AI and knowledge applications for virtual assistance for customers and agents. These applications enable businesses to centralize knowledge, policies, procedures, and best-practices, while delivering guided, personalized solutions to customers and agents. Our AI and knowledge applications deliver compelling value through large-scale self-service automation. Further, these applications ensure that all agents effectively resolve all contact types, regardless of product or procedure. Correct, compliant, and consistent responses across touchpoints - automated and assisted - boost customer satisfaction. First contact resolution surges and agent time to competency drops.
Analytics and Machine Learning Optimize
Our analytics solution enables clients to measure, manage and orchestrate their omnichannel service operations. In addition, our machine learning service led by our digital optimization experts helps clients generate product improvement and customer preference insights from customer conversations and journey events, while spotting opportunities to improve experience and automate processes.
5
Open, Secure APIs and Third-Party Connectors Deliver Quick Value
Our open, secure platform APIs enable clients and partners to extend and enhance our solutions and to integrate with enterprise assets to enable a single view of the customer. Our certified integration with platforms such as those from Avaya, Amazon, Cisco, Salesforce, and Microsoft enable clients to leverage existing systems of record and communication.
Compelling Benefits
We believe our solution delivers transformational value. Specifically, we help businesses:
| o | Enhance customer experience with digital-first, omnichannel service. |
| o | Reduce operating costs through self-service automation, improved first contact resolution, and compressed agent time-to-competence. |
| o | Ensure compliance with regulations, policies, procedures, and best practices even as clients expand their product portfolio and serviced customer segments. This benefit is particularly sought after in regulated sectors like financial services and healthcare, as well as government. |
| o | Deliver rich, primary insights to enhance products and design new offerings. Analyzing and learning from customer conversations provides a unique tool to quickly respond to customer dissatisfaction or agent challenges, while generating ideas for product innovation and process automation. |
Competitive Strengths
Comprehensive Omnichannel Platform with Rich Apps and Purpose-built APIs
The eGain solution is a comprehensive omnichannel solution for the customer engagement market, with AI and knowledge applications at its core. We unlock the full power of our cloud platform with extensive APIs through a developer portal to enable digital engagement, knowledge management, and decision support capabilities for clients and partners in a way that is unique in the market.
Enterprise-Grade, Secure Cloud Service with Differentiated Offerings
Our cloud offering is secure, scalable and offers unique capabilities. With respect to security and certification, we offer SOC2, PCI, HIPAA, and GDPR certification. Two of the largest federal tax services, one in North America and the other in Europe, use eGain solutions served from the eGain Cloud. Furthermore, we offer an “Always On” capability for businesses who cannot afford to be down at any time, day or night, for scheduled maintenance downtime. Finally, we offer service credits in the event of non-adherence to contracted service levels.
Transformative Value at Scale Across Diversified Customer Base
Our solution delivers transformative value at scale today across a diversified customer base. We believe that our understanding of the customer need and our ability to fulfil it at scale and with enterprise-grade sophistication is unmatched. From over a hundred thousand users at a healthcare client using our solution on a 24x7 basis to a P&C insurer with fifteen thousand contact center advisors and thirty-thousand field agents, we are the preferred choice for large brands looking to automate customer engagement.
Market-leading Innovation with a Risk-free Trail Model
We are consistently seen as product leaders in digital engagement and knowledge management by leading analysts. For over twenty years, we have anticipated technology and market trends. We anticipated the need for AI in customer service early and developed an omnichannel customer engagement hub years ahead of competition. With a relentless focus on the customer engagement automation, we continue to add capabilities to enhance our clients’ investment in eGain. For example, to enable our clients to serve their customers across all channels, our messaging hub out of the box connects with Apple Business Chat, Facebook Messenger, Google Business Messaging, SMS and WhatsApp. Our third-generation
6
virtual assistant - powered by AI, machine learning, and knowledge applications - seamlessly layers across our omnichannel platform. Our knowledge and AI solutions lead the market.
Not only do we innovate quicker than others, we stand behind our claim with a unique Innovation in 30 Days™ offer—a 30-day guided production pilot in the eGain Cloud – at no cost and with no strings attached.
Leveraged Go-to-market Strategy with a Growing Partner Ecosystem
We take our solutions to market through a partner-leveraged enterprise sales model. We started our Original equipment manufacturing (OEM) partnership journey with Cisco several years ago. Through Cisco’s partner ecosystem and direct sales network, we also resell cloud-based, eGain-branded solutions.
In fiscal year 2020, we announced our cloud-based OEM partnership with Avaya for our digital connect portfolio. We are now building an active pipeline with Avaya field sales and their partners.
Finally, we partner with Amazon Connect, a disruptive cloud-based contact center solution. Our integrated proposition delivers the best of omnichannel capabilities powered by AI, Knowledge and Analytics.
Customers
We mostly sell to large enterprises, which we define as businesses with over a billion dollars in annual revenue or government organizations. Approximately 90% of our annual recurring cloud revenue for fiscal year 2020 came from such large enterprises.
We focus on the following verticals: financial services, telco, retail, government, health care and utilities. For fiscal year 2020, domestic and international revenue accounted for 62% and 38% of total revenue.
One of our largest customers, who is also a partner, accounted for 18% of total revenue in fiscal year 2020.
Competition
We compete with application software providers, including Genesys Telecommunications, LivePerson, Moxie Software, Verint, Nuance, and Oracle. In addition, we engage in partnerships with some of our competitors, including Salesforce, Microsoft, and ServiceNow.
The market that we compete in is highly competitive and some of our competitors may have longer operating histories, greater economies of scale, greater financial resources, greater engineering and technical resources, greater sales and marketing resources, stronger strategic partnerships and distribution channels, larger user bases, products and services with different functions and feature sets and greater brand recognition than we have. We believe the principal competitive factors in our market include the following:
| o | proven track record of customer success; |
| o | speed and ease of implementation; |
| o | product functionality; |
| o | financial stability and viability of the vendor; |
| o | product adoption; |
| o | ease of use and rates of user adoption; |
| o | low total cost of ownership and demonstrable cost-effective benefits for customers; |
| o | performance, security, scalability, flexibility and reliability of the service; |
| o | whether the software is delivered via the cloud or on-premises; |
7
| o | ease of integration with existing applications; |
| o | quality of customer support; |
| o | availability and quality of implementation, consulting and training services; and |
| o | vendor reputation and brand awareness. |
Growth Strategy
We are investing in multiple programs to accelerate growth.
Invest in Direct Sales and Marketing
We are enhancing our digital marketing to boost brand awareness, based on client success, product leadership and no-risk trial offers. To complement our marketing investment, we are significantly expanding our field sales team to increase high-touch presence in target accounts.
Develop New Partner Relationships
We are developing new partnerships with complementary platform providers (with large customer bases) to enhance their proposition with our AI Knowledge powered customer engagement capabilities. We have hired a new head of Business Development to lead a team to develop and operationalize such new partnerships.
Land and Expand in the Enterprise
With the sustained progress we have made in customer success, we see a replicable pattern emerging: land enterprise logos with a limited footprint in one business unit, demonstrate business value, and then expand in the enterprise. We are increasing the value of investment in eGain for our clients by deeply integrating our capabilities via our enhanced APIs with enterprise assets like enterprise collaboration platforms, CRM systems, transaction and billing, and content sources.
Migrate Our Remaining Legacy Customers to eGain Cloud
We offer an attractive proposition to our remaining on-premise customers to move to the eGain Cloud where we subsidize the migration service cost in exchange for their multi-year commitment to the eGain Cloud. We expect to substantially migrate most remaining on-premise clients to the eGain Cloud by the end of fiscal year 2021.
Maintain Platform Innovation Leadership
Innovation is in our DNA. We are developing vertical solutions on our platform to better acquire and serve customers. We continue to enhance our core capabilities to improve usability and personalization.
Selectively Pursue Acquisitions
From time to time, we pursue inorganic strategies to strengthen our product portfolio. In 2014 we acquired Exony Limited, a provider of advanced contact center analytics software. Moving forward, we will look for strategic acquisitions that we believe will deliver compelling value faster than organic options.
8
Sales and Marketing
Sales Strategy
Our sales strategy is to pursue targeted accounts, mostly B2C enterprises, through a combination of our direct sales force and partners. These enterprises typically have thousands of customer service agents in their contact centers and, in the aggregate, communicate with billions of customers each year. We utilize thought leadership and other marketing events to demonstrate our leadership position in the customer engagement software market and highlight our customer successes.
Our direct sales force is organized into teams that include field sales representatives and sales consultants. Our direct sales force is complemented by lead generation representatives and sales development representatives.
We also complement our direct effort with sales alliances.
Marketing and Partner Strategy
Our marketing strategy is to build our brand around innovative and robust products trusted by leading enterprises. We accomplish this via public relations, analyst relations, marketing communications and demand generation. We employ a wide range of marketing avenues to deliver our message, including print and digital, targeted electronic and postal mailing, email newsletters, and a variety of trade shows, seminars, webinars, and interest groups.
Our marketing group produces sales tools, including product collateral, customer case studies, demonstrations, and presentations. In addition, the group performs market analyses and customer reviews to identify and develop key partnership opportunities and product capabilities.
We believe that our partners help extend the breadth and depth of our product offerings, drive market penetration, and augment our professional service capabilities. We believe these relationships are important to delivering successful, integrated products and services to our customers. Our partner portal, eGain Econet™, provides comprehensive sales, support and services information for channel partners.
Subscription Services
Our subscription services provide customers with access to our software on a cloud-based platform that we manage and offer on a subscription basis. These subscription services allow our customers to easily consume our product innovation without dealing with infrastructure, installation and ongoing administration. We generally offer these services through a 36-month contract, with pricing based on the number of agents or self-service sessions.
Professional Services
Our worldwide professional services organization provides consulting, implementation and training services to deliver business value, drive customer success and build customer loyalty.
| o | Consulting and Implementation Services. Our offering includes rapid implementation services, platform-based solution extension, and systems integration services. Our consultants work with customers to understand their requirements, analyze their business needs, and implement effective solutions. We provide these services independently or in partnership with systems integrators who have developed expertise on our platform. |
| o | Training Services. We provide comprehensive training options to customers and partners. Training programs are offered either online (remote training) or in-person at the customer site. We also offer complementary e-learning through our eGain University education portal to our customers and partners. |
9
Customer Support
We offer 24 x 7 customer support via online and phone channels worldwide under support agreements. Our customer support centers are in California, United Kingdom, and India.
Research and Development
The market for our products changes rapidly and is characterized by evolving industry standards, swift changes in customer requirements, and frequent product introductions.
We continuously analyze market and customer requirements and evaluate external technology that we believe will enhance our competitiveness, increase our lifetime customer value and expand our target market. Our product roadmap effectively combines build, partner and buy options. [The last company we acquired was Exony Limited, a UK-based leader in enterprise contact center analytics software, in August 2014.]
Intellectual Property
We regard our intellectual property as critical to our success. We rely on intellectual property and other laws, in addition to confidentiality procedures and licensing arrangements, to protect the proprietary aspects of our technology and business.
As of June 30, 2020, we had 11 issued patents in the United States. In addition, we have a number of pending patent applications in the United States, including one provisional filing and several non-provisional filings. Our issued U.S. patents expire at various times between 2029 and 2035.
We continually assess the strength of our intellectual property protection for those aspects of our technology that we believe constitute innovations providing significant competitive advantages. Future applications may or may not receive the issuance of valid patents or registered trademarks.
We routinely require our employees, customers, and potential business partners to enter into confidentiality and nondisclosure agreements before we disclose any sensitive aspects of our products, technology, or business plans. In addition, we require employees to agree to surrender to us any proprietary information, inventions or other intellectual property they generate or come to possess while employed by us. Despite our efforts to protect our proprietary rights through confidentiality and license agreements, unauthorized parties may attempt to copy or otherwise obtain and use our products or technology. These precautions may not prevent misappropriation or infringement of our intellectual property. In addition, some of our license agreements with certain customers and partners require us to place the source code for our products into escrow. These agreements typically provide that some party will have a limited, non-exclusive right to access and use this code as authorized by the license agreement if there is a bankruptcy proceeding instituted by or against us, or if we materially breach a contractual commitment to provide support and maintenance to the party.
Employees
As of June 30, 2020, we had 522 full-time employees, of which 179 were in product development, 197 in services and support, 89 in sales and marketing, and 57 in finance and administration.
None of our employees are covered by collective bargaining agreements. While we believe our relations with our employees are good, our future performance depends largely upon the continued service of our key technical, sales and marketing, and senior management personnel, none of whom are bound by employment agreements requiring service for a defined period of time.
10
Available Information
We were incorporated in Delaware in September 1997, and our website is located at www.egain.com. We make available free of charge on our website our annual reports on Form 10-K, quarterly reports on Form 10-Q, current reports on Form 8-K and amendments to those reports, as soon as reasonably practicable after we electronically file or furnish such materials to the Securities and Exchange Commission. Our website and the information contained therein or connected thereto are not intended to be incorporated into this Annual Report on Form 10-K.
Information About Our Executive Officers
The following table sets forth information regarding eGain’s executive officers as of September 11, 2020:
Name |
| Age |
| Position |
Ashutosh Roy |
| 54 |
| Chief Executive Officer and Chairman |
Eric Smit |
| 58 |
| Chief Financial Officer |
Promod Narang |
| 62 |
| Senior Vice President of Products and Engineering |
Todd Woodstra |
| 58 |
| Senior Vice President of Global Sales |
Ashutosh Roy co-founded eGain and has served as Chief Executive Officer and a Director of eGain since September 1997 and as President since October 1, 2003. From May 1995 through April 1997, Mr. Roy served as Chairman of WhoWhere? Inc., an Internet-services company co-founded by Mr. Roy. From June 1994 to April 1995, Mr. Roy worked at Parsec Technologies, a call center company based in New Delhi, India, which he co-founded. From August 1988 to August 1992, Mr. Roy worked as a software engineer at Digital Equipment Corporation. Mr. Roy holds a B.S. in Computer Science from the Indian Institute of Technology, New Delhi, a Master’s degree in Computer Science from Johns Hopkins University and a M.B.A. from Stanford University. Mr. Roy’s qualifications to serve on our Board of Directors include his industry experience and deep knowledge of eGain from his position as a founder of our Company and as our Chief Executive Officer for over 20 years.
Eric Smit has served as Chief Financial Officer since August 2002. Prior to that, Mr. Smit served in a variety of roles at eGain, including Vice President, Operations from April 2001 to July 2002, Vice President, Finance and Administration from June 1999 to April 2001, and Director of Finance from June 1998 to June 1999. From December 1996 to May 1998, Mr. Smit served as Director of Finance for WhoWhere? Inc., an Internet services company. From April 1993 to November 1996, Mr. Smit served as Vice President of Operations and Chief Financial Officer of Velocity Incorporated, a software game developer and publishing company. Mr. Smit holds a Bachelor of Commerce in Accounting from Rhodes University, South Africa.
Promod Narang has served as Senior Vice President of Products and Engineering since March 2000. Mr. Narang joined eGain in October 1998, and served as Director of Engineering prior to assuming his current position. Prior to joining eGain, Mr. Narang served as President of VMpro, a system software consulting company, from September 1987 to October 1998. Mr. Narang holds a Bachelor of Science in Computer Science from Wayne State University.
Todd Woodstra has served as Senior Vice President of Global Sales since August 2017. Prior to joining eGain, Mr. Woodstra was the Senior Vice President of Enterprise/Channels at Sparks Compass, a real time data analytics platform company, and the Senior Vice President of Enterprise Sales for Interactions LLC from January 2015 to February 2017, where he led enterprise customer sales focused on virtual assistant solutions. From November 2009 to July 2014, Mr. Woodstra was Vice President of Global Channel and Partner Alliances for Nuance Communications where he managed and executed business in channels and commercial enterprise, self-service, mobile, collaboration, unified communications, natural language speech recognition, voice biometrics, gesture technologies, inbound/outbound notification and voice-to-text transcription. Mr. Woodstra holds a Bachelor of Arts in Business Administration, Management Information Systems from California State University, San Bernardino
11
The risks and uncertainties described below are not the only ones facing us. Other events that we do not currently anticipate or that we currently deem immaterial also may affect our results of operations, cash flows and financial condition.
Risks Related to Our Business and Strategy
Our business is influenced by a range of factors that are beyond our control and that we have no comparative advantage in forecasting.
| ● | general economic and business conditions; |
| ● | currency exchange rate fluctuations; |
| ● | the overall demand for enterprise software and services; |
| ● | customer acceptance of cloud-based solutions; |
| ● | governmental budgetary constraints or shifts in government spending priorities; and |
| ● | general political developments. |
The global economic climate continues to influence our business. This includes items such as a general tightening in the credit markets, lower levels of liquidity, increases in the rates of default and bankruptcy, and extreme volatility in credit, equity and fixed income markets. These macroeconomic developments negatively affected, and could continue to negatively affect, our business, operating results or financial condition which, in turn, could adversely affect our stock price. A general weakening of, and related declining corporate confidence in, the global economy or the curtailment in government or corporate spending could cause current or potential customers to reduce their technology budgets or be unable to fund software or services purchases, which could cause customers to delay, decrease or cancel purchases of our products and services or cause customers to not pay us or to delay paying us for previously purchased products and services.
We face risks related to health epidemic, including the COVID-19 pandemic, which could have a material adverse effect on our business, financial condition and results of operations.
We face various risks, related to public health issues, including epidemics, pandemics, and other outbreaks, including the recent pandemics of respiratory illness caused by a novel coronavirus known as COVID-19, which the World Health Organization characterized as a pandemic in March 2020. The impact of COVID-19, including changes in consumer and business behavior, pandemic fears and market downturns and restrictions on business and individual activities, has created significant volatility in the global economy and led to reduced economic activity.
The pandemic has resulted in government authorities implementing numerous measures to try to contain the virus, such as travel bans and restrictions, quarantines, shelter-in-place or stay-at-home orders, and business shutdowns. For example, employees at our headquarters located in Sunnyvale, California, are currently subject to a shelter-in-place order from the local government. Our offices in India and United Kingdom have also been impacted by COVID-19 and have been subject to various measures implemented by local government to reduce the spread of COVID-19. These measures may adversely impact our employees and operations and the operations of our customers and third-party distribution partners, and may negatively impact our sales and marketing activities. These measures by government authorities may remain in place for a significant period of time and they are likely to continue to adversely affect our sales and marketing activities and our business, financial condition and results of operations.
The spread of COVID-19 has caused us to modify our business practices (including employee travel, mandating that all non-essential personnel in our headquarters work from home, temporary closures of our offices, and cancellation of physical participation in sales activities, meetings, events and conferences), and we may take further actions as may be required by government authorities, or that we determine are in the best interests of our employees and customers. There is no certainty that such actions will be sufficient to mitigate the risks posed by the virus or otherwise be satisfactory to government authorities. In addition, we face additional risks and challenges related to having a portion of our workforce working from home, including added pressure on our IT systems and the security of our network, and new challenges as
12
our team adjust to online collaboration. If significant portions of our workforce are unable to work effectively, including due to illness, quarantines, social distancing, government actions or other restrictions in connection with the COVID-19 pandemic, our operations will be impacted.
The extent to which the COVID-19 pandemic impacts our business, prospects and results of operations will depend on future developments, which are highly uncertain and cannot be predicted, including, but not limited to, the duration and spread of the pandemic, its severity, the actions to contain the virus or treat its impact, and how quickly and to what extent normal economic and operating activities can resume. The COVID-19 pandemic could cause fluctuations in foreign currency markets, impact the availability of future borrowings and our ability to access capital, increase the cost of borrowings, increase credit risks of our customers, negatively affect our liquidity and the liquidity and stability of markets of our securities. Even after the COVID-19 pandemic has subsided, we may continue to experience an adverse impact to our business and the value of our securities as a result of its global economic impact, including any recession that has occurred or may occur in the future.
There are no comparable recent events which may provide guidance as to the effect of the spread of COVID-19 and a pandemic, and, as a result, the ultimate impact of COVID-19 pandemic or a similar health epidemic is highly uncertain and subject to change. We do not yet know the full extent of COVID-19’s impact on our business, our operations, or the global economy as a whole. However, the effects could have a material impact on our results of operations, and we will continue to monitor the situation closely.
Our revenue and operating results have fluctuated in the past and are likely to fluctuate in the future, and because we recognize revenue from subscriptions over a period of time, downturns in revenue may not be immediately reflected in our operating results.
Because we recognize revenue when we have satisfied performance obligations to customers in connection with our sales contracts, most of our revenue each quarter results from recognition of deferred revenue related to agreements entered into during previous quarters. Consequently, declines in new or renewed subscription agreements and maintenance agreements that occur in one quarter will largely be felt in future quarters, both because we may be unable to generate sufficient new revenue to offset the decline and because we may be unable to adjust our operating costs and capital expenditures to align with the changes in revenue. In addition, our subscription model makes it more difficult for us to increase our revenue rapidly in any period, because revenue from new customers must be recognized over the applicable subscription term. It is difficult to forecast the expediency of the transition of our license customers to our cloud delivery model. Accordingly, we believe that period-to-period comparisons of our results of operations should not be relied upon as definitive indicators of future performance.
Other factors that may cause our revenue and operating results to fluctuate include:
| ● | timing of customer budget cycles; |
| ● | the priority our customers place on our products compared to other business investments; |
| ● | size, timing and contract terms of new customer contracts, and unpredictable and often lengthy sales cycles; |
| ● | reduced renewals; |
| ● | competitive factors, including new product introductions, upgrades and discounted pricing or special payment terms offered by our competitors, as well as strategic actions by us or our competitors, such as acquisitions, divestitures, spin-offs, joint ventures, strategic investments or changes in business strategy; |
| ● | technical difficulties, errors or service interruptions in our solutions that may cause customer dissatisfaction with our solutions; |
| ● | consolidation among our customers, which may alter their buying patterns, or business failures that may reduce demand for our solutions; |
| ● | operating expenses associated with expansion of our sales force or business, and our product development efforts; |
| ● | cost, timing and management efforts related to the introduction of new features to our solutions; |
13
| ● | our ability to obtain, maintain and protect our intellectual property rights and adequately safeguard the information imported to our solutions or otherwise provided to us by our customers; and |
| ● | extraordinary expenses such as impairment charges, litigation or other payments related to settlement of disputes. |
Any of these developments may adversely affect our revenue, operating results and financial condition. Furthermore, we maintain an allowance for doubtful accounts for estimated losses resulting from the inability of our customers to make required payments. In such cases, we may be required to defer revenue recognition on sales to affected customers. In the future, we may have to record additional reserves or write-offs, or defer revenue on sales transactions, which could negatively impact our financial results.
We cannot accurately predict subscription renewal rates and the impact these rates may have on our future revenue and operating results.
Even though our subscription contracts are typically structured for auto-renewals, we do allow our customers to elect not to renew their subscriptions for our service after the expiration of their initial subscription period, which is typically 12 to 36 months, and some customers have elected not to renew. In addition, our customers may choose to renew for fewer subscriptions (in quantity or products) or renew for shorter contract lengths. We cannot accurately predict renewal rates given our varied customer base of enterprise and small and medium size business customers and the number of multiyear subscription contracts. Our renewal rates may decline or fluctuate as a result of a number of factors, including customer dissatisfaction with our service, decreases in customers’ spending levels, decreases in the number of users at our customers, pricing changes and general economic conditions. If our customers do not renew their subscriptions for our service or reduce the number of paying subscriptions at the time of renewal, our revenue will decline, and our business will suffer.
Our future success also depends in part on our ability to sell additional features and services, more subscriptions or enhanced editions of our service to our current customers. This may also require increasingly sophisticated and costly sales efforts that are targeted at senior management. Similarly, the rate at which our customers purchase new or enhanced services depends on a number of factors, including general economic conditions and our customers’ reactions to price changes related to these additional features and services. If our efforts to upsell to our customers are not successful and negative reaction occurs, our business may suffer.
Our lengthy sales cycles and the difficulty in predicting timing of sales or delays may impair our operating results.
The long sales cycle for our products may cause license and subscription revenue and operating results to vary significantly from period to period. The sales cycle for our products can be six months or more and varies substantially from customer to customer. Because we sell complex and deeply integrated solutions, it can take many months of customer education to secure sales. Since our potential customers may evaluate our products before, if ever, executing definitive agreements, we may incur substantial expenses and spend significant management and legal effort in connection with a potential customer.
Our multi-product offering and the increasingly complex needs of our customers contribute to a longer and unpredictable sales cycle. Consequently, we often face difficulty predicting the quarter in which expected sales will actually occur. This contributes to the uncertainty and fluctuations in our future operating results. In particular, the corporate decision-making and approval process of our customers and potential customers has become more complicated. This has caused our average sales cycle to further increase and, in some cases, has prevented the closure of sales that we believed were likely to close.
Because we depend on a relatively small number of customers for a substantial portion of our revenue, the loss of any of these customers or our failure to attract new significant customers could adversely impact our revenue and harm our business.
We have in the past and expect in the future to derive a substantial portion of our revenue from sales to a relatively small number of customers. The composition of these customers has varied in the past, and we expect that it will continue to vary over time. The loss of any significant customer or a decline in business with any significant customer would materially and adversely affect our financial condition and results of operations.
14
The market for customer engagement software is intensely competitive, and our business will be adversely affected if we are unable to successfully compete.
The market for customer engagement software is intensely competitive. Other than product innovation and existing customer relationships, there are no substantial barriers to entry in this market, and established or new entities may enter this market in the future. While software internally developed by enterprises represents indirect competition, we also compete directly with packaged application software vendors, including Genesys Telecommunications, LivePerson, Inc., and Moxie Software, Inc. In addition, we face actual or potential competition from larger software companies such as Microsoft Corporation, Oracle Corporation, and similar companies that may attempt to sell customer engagement software to their installed base.
We believe competition will continue to be fierce as current competitors increase the sophistication of their offerings and as new participants enter the market. Many of our current and potential competitors have longer operating histories, larger customer bases, broader brand recognition, and significantly greater financial, marketing and other resources. With more established and better-financed competitors, these companies may be able to undertake more extensive marketing campaigns, adopt more aggressive pricing policies, and make more attractive offers to businesses to induce them to use their products or services. If we are unable to compete successfully, our business will be adversely affected.
If we fail to expand and improve our sales performance and marketing activities, or retain our sales and marketing personnel, we may be unable to grow our business, which could negatively impact our operating results and financial condition.
Expansion and growth of our business is dependent on our ability to expand our sales force and on the ability of our sales force to increase sales. If we are not able to effectively develop and maintain awareness of our products in a cost-effective manner, we may not achieve widespread acceptance of our existing and future products. This may result in a failure to expand and attract new customers and enhance relationships with existing customers. This may impede our efforts to improve operations in our other areas and may result in declines in the market price of our common stock.
Due to the complexity of our customer engagement hub platform and related products and services, we must utilize highly trained sales personnel to educate prospective customers regarding the use and benefits of our products and services as well as provide effective customer support. If we have turnover in our sales and marketing teams, we may not be able to successfully compete with our competitors, and our results of operations and financial condition may be harmed.
Our failure to maintain, develop or expand strategic and third-party distribution channels would impede our revenue growth.
Our success and future growth depend in part upon the skills, experience, performance and continued service of our distribution partners, including software and hardware vendors and resellers. Our distribution partners engage with us in a number of ways, including assisting us to identify prospective customers, distributing our products and services in geographies where we do not have a physical presence and distributing our products and services where they are considered complementary to other products of the partner or third-party products distributed by the partner. We believe that our future success depends in part upon our ability to develop, maintain and expand strategic, long-term and profitable partnerships and reseller relationships. If we are unable to do so for any reason, including as a result of any change in the leadership of our distribution partners, or if any existing or future distribution partners fail to successfully market, resell, implement or support our products for their customers, or if distribution partners represent multiple providers and devote greater resources to market, resell, implement and support competing products and services, our future revenue growth could be impeded. Our failure to develop, maintain and expand relationships with systems integrators could harm our business.
We sometimes rely on systems integrators to recommend our products to their customers and to install and support our products for their customers. We likewise depend on broad market acceptance by these system integrators of our product and service offerings. Our agreements generally do not prohibit competitive offerings and systems integrators may develop market or recommend software applications that compete with our products. Moreover, if these firms fail to implement our products successfully for their customers, we may not have the resources to implement our products on the schedule required by their customers. To the extent we devote resources to these relationships and the partnerships do not proceed
15
as anticipated or provide revenue or other results as anticipated, our business may be harmed. Once partnerships are forged, there can be no guarantee that such relationships will be renewed in the future or available on acceptable terms. If we lose strategic third-party relationships, fail to renew or develop new relationships, or fail to fully exploit revenue opportunities within such relationships, our results of operations and future growth may suffer.
Difficulties and delays in customers implementing our products could harm our revenue and margins.
We generally recognize revenue upon the transfer of control of promised services to our customers in the amount that is commensurate with the consideration that we expect to receive in exchange for those services. If an arrangement requires significant customization or implementation services from us, recognition of the associated license or subscription and service revenue could be delayed. The timing of the commencement and completion of these services is subject to factors that may be beyond our control, as this process may require access to the customer’s facilities and coordination with the customer’s personnel after delivery of the software. In addition, customers could cancel or delay product implementations. Implementation typically involves working with sophisticated software, computing and communications systems. If we experience difficulties with implementation or do not meet project milestones in a timely manner, we could be obligated to devote more customer support, engineering and other resources to a particular project. Some customers may also require us to develop customized features or capabilities. If new or existing customers cancel or have difficulty deploying our products or require significant amounts of our professional services, support, or customized features, revenue recognition could be cancelled or further delayed and our costs could increase, causing increased variability in our operating results.
We conduct a significant portion of our business and operations outside of the United States, which exposes us to additional risks that may not exist in the United States. These risks in turn could cause our operating results and financial condition to suffer.
We derived 38% and 44% of our revenue from international sales during the fiscal years ended June 30, 2020 and 2019, respectively. In addition to those discussed elsewhere in this section, our international sales operations are subject to a number of specific risks, such as:
| ● | general economic conditions in each country or region in which we do or plan to do business; |
| ● | foreign currency fluctuations and imposition of exchange controls; |
| ● | changes in data privacy laws including GDPR; |
| ● | difficulty and costs in staffing and managing our international operations; |
| ● | difficulties in collecting accounts receivable and longer collection periods; |
| ● | health or similar issues, such as a pandemic or epidemic; |
| ● | various trade restrictions and tax consequences; |
| ● | hostilities in various parts of the world; and |
| ● | reduced intellectual property protections in some countries. |
As of June 30, 2020 approximately 48% of our workforce was employed in India. Of our employees in India, 47% are allocated to research and development. Although the movement of certain operations internationally was principally motivated by cost cutting, the continued management of these remote operations requires significant management attention and financial resources that could adversely affect our operating performance. In addition, with the significant increase in the numbers of foreign businesses that have established operations in India, the competition to attract and retain employees there has increased significantly. As a result of the increased competition for skilled workers, we experienced increased compensation costs and expect these costs to increase in the future. Our reliance on our workforce in India makes us particularly susceptible to disruptions in the business environment in that region. In particular, sophisticated telecommunications links, high-speed data communications with other eGain offices and customers, and overall consistency and stability of our business infrastructure are vital to our day-to-day operations, and any impairment of such
16
infrastructure will cause our financial condition and results to suffer. In addition, the maintenance of stable political relations between the United States, the European Union and India are also of great importance to our operations.
Any of these risks could have a significant impact on our product development, customer support, or professional services. To the extent the benefit of maintaining these operations abroad does not exceed the expense of establishing and maintaining such activities, our operating results and financial condition will suffer.
Unplanned system interruptions and capacity constraints and failure to effect efficient transmission of customer communications and data over the Internet could harm our business and reputation.
Our customers have in the past experienced some interruptions with eGain cloud operations. We believe that these interruptions will continue to occur from time to time. These interruptions could be due to hardware and operating system failures. As a result, our business will suffer if we experience frequent or long system interruptions that result in the unavailability or reduced performance of our hosted operations or reduce our ability to provide remote management services. We expect to experience occasional temporary capacity constraints due to sharply increased traffic or other Internet-wide disruptions, which may cause unanticipated system disruptions, slower response times, impaired quality, and degradation in levels of customer service. If this were to continue to happen, our business and reputation could be seriously harmed.
The growth in the use of the Internet has caused interruptions and delays in accessing the Internet and transmitting data over the Internet. Interruptions also occur due to systems burdens brought on by unsolicited bulk email or “Spam,” malicious service attacks, denial of service attacks and hacking into operating systems, viruses, worms and a “Trojan” horse, the proliferation of which is beyond our control and may seriously impact our and our customers’ businesses.
Because we provide cloud-based software, interruptions or delays in Internet transmissions will harm our customers’ ability to receive and respond to online interactions. Therefore, our market depends on ongoing improvements being made to the entire Internet infrastructure to alleviate overloading and congestion.
Our success largely depends on the efficient and uninterrupted operation of our computer and communications hardware and network systems. A significant amount of our computer and communications systems are located in Sunnyvale, California. Due to our location, our systems and operations are vulnerable to damage or interruption from fire, earthquake, power loss, telecommunications failure and similar events. Customer data that we store in third party data centers may also be vulnerable to damage or interruption from floods, fires, earthquake, power loss, telecommunications failures and similar events. Any damage to, or failure of, our systems generally could result in interruptions in our service. Interruptions in our service may reduce our revenue, cause us to issue credits or pay penalties, cause customers to terminate their subscriptions and adversely affect our renewal rate and our ability to attract new customers.
We maintain a business continuity plan for our customers in the event of an outage. We maintain other co-locations for the purpose of disaster recovery as well as maintaining backups of our customer’s information. We provide premium disaster recovery and standard disaster recovery to our customers. If a customer opts not to pay for premium disaster recovery, we will only assure that their data is available within 72 hours. This delay could cause severe disruptions to our customers’ customers and may result in customer termination of our solutions. Our premium disaster recovery service provides for an alternative data center and a return to operations within one business day.
We have entered into service agreements with some of our customers that require minimum performance standards, including standards regarding the availability and response time of our remote management services. If we fail to meet these standards, our customers could terminate their relationships with us, and we could be subject to contractual refunds and service credits to, and exposure to claims for losses by, customers. Any unplanned interruption of services may harm our ability to attract and retain customers.
17
Software errors could be costly and time-consuming for us to correct, and could harm our reputation and impair our ability to sell our solutions.
Our solutions are based on complex software that may contain errors, or “bugs,” that could be costly to correct, harm our reputation and impair our ability to sell our solutions to new customers. Moreover, customers relying on our solutions may be more sensitive to such errors, and potential security vulnerabilities and business interruptions for these applications. If we incur substantial costs to correct any errors of this nature, our operating margins could be adversely affected. Because our customers depend on our solutions for critical business functions, any service interruptions could result in lost or delayed market acceptance and lost sales, higher service-level credits and warranty costs, diversion of development resources and product liability suits.
The terms we agree to in our Service Level Agreements or other contracts may result in increased costs or liabilities, which would in turn affect our results of operations.
Our Service Level Agreements provide for service credits for system unavailability, and in some cases, indemnities for loss, damage or costs resulting from use of our system. If we were required to provide any of these in a material way, our results of operations would suffer.
If we are unable to increase the profitability of subscription revenue, if we experience significant customer attrition, or if we are required to delay recognition of revenue, our operating results could be adversely affected.
We have invested, and expect to continue to invest, substantial resources to expand, market, implement and refine our cloud offerings. Our subscription services have generally generated much lower short-term gross margins than our traditional perpetual license sales. If we are unable to increase the volume of our subscription business to offset the lower margins, we may not be able to achieve sustained profitability.
Factors that could harm our ability to improve our gross margins, which may affect our operating profitability, include:
| ● | increased costs to license and maintain third party software embedded in our software applications or the cost to create or substitute such third-party software if it can no longer be licensed on commercially reasonable terms; |
| ● | our inability to maintain or increase the prices customers pay for our products and services based on competitive pricing pressures and general economic conditions limiting customer demand; |
| ● | increased cost of third-party services providers, including data centers for our cloud operations and professional services contractors performing implementation and technical support services to cloud customers; |
| ● | customer contractual requirements that delay revenue recognition until customer implementations commence production operations or customer-specific requirements are met; |
| ● | significant attrition as customers decide for their own economic or other reasons to not renew their subscription contracts when they are up for renewal negatively impacting the efficiency of our data centers and leading to the costs being spread over fewer customers negatively impacting gross margin; and |
| ● | the inability to implement, or delays in implementing, technology-based efficiencies and efforts to streamline and consolidate processes to reduce operating costs. |
We depend on broad market acceptance of our applications and of our business model. If our expectations regarding the market for our applications are not met, our business could be seriously harmed.
We depend on the widespread acceptance and use of our applications as an effective solution for businesses seeking to manage high volumes of customer interactions across multiple channels, including Web, phone, email, print and in-person. While we believe the potential to be very large, we cannot accurately estimate the size or growth rate of the potential market for such product and service offerings generally, and we do not know whether our products and services in particular will achieve broad market acceptance. The market for customer engagement software is rapidly evolving, and concerns over the security and reliability of online transactions, the privacy of users and quality of service or other issues may inhibit the growth of the Internet and commercial online services. If the market for our applications fails to grow or grows more slowly than we currently anticipate, our business will be seriously harmed.
18
Furthermore, our business model is premised on business assumptions that are still evolving. Our business model assumes that both customers and companies will increasingly elect to communicate through multiple channels, as well as demand integration of the online channels into the traditional telephone-based call center. If any of these assumptions is incorrect or if customers and companies do not adopt digital technology in a timely manner, our business will be seriously harmed and our stock price will decline.
We may be unable to respond to the rapid technological change and changing customer preferences in the online sales, marketing, customer service, and/or online consumer services industries and this may cause our business to suffer.
If we are unable, for technological, legal, financial or other reasons, to adapt in a timely manner to changing market conditions in the online sales, marketing, customer service and/or e-commerce industry or our customers’ or Internet users’ requirements or preferences, our business, results of operations and financial condition would be materially and adversely affected. Business on the Internet is characterized by rapid technological change. In addition, the market for online sales, marketing, customer service and expert advice solutions is relatively new. Changes in customer and Internet user requirements and preferences, frequent new product and service introductions embodying new technologies and the emergence of new industry standards and practices such as but not limited to security standards could render our services and our proprietary technology and systems obsolete. The rapid evolution of these products and services will require that we continually improve the performance, features and reliability of our services. Our success will depend, in part, on our ability to:
| ● | enhance the features and performance of our services; |
| ● | develop and offer new services that are valuable to companies doing business online as well as Internet users; and |
| ● | respond to technological advances and emerging industry standards and practices in a cost-effective and timely manner. |
If any of our new services, including upgrades to our current services, do not meet our customers’ or Internet users’ expectations, our business may be harmed. Updating our technology may require significant additional capital expenditures and could materially and adversely affect our business, results of operations and financial condition.
If new services require us to grow rapidly, this could place a significant strain on our managerial, operational, technical and financial resources. In order to manage our growth, we could be required to implement new or upgraded operating and financial systems, procedures and controls. Our failure to expand our operations in an efficient manner could cause our expenses to grow, our revenue to decline or grow more slowly than expected and could otherwise have a material adverse effect on our business, results of operations and financial condition.
We may need to license third-party technologies and may be unable to do so on commercially reasonable terms or in a timely manner.
To the extent we need to license third-party technologies, we may be unable to do so on commercially reasonable terms or at all. In addition, we may fail to successfully integrate any licensed technology into our products or services. Third-party licenses may expose us to increased risks, including risks associated with the integration of new technology, the diversion of resources from the development of our own proprietary technology, and our inability to generate revenue from new technology sufficient to offset associated acquisition and maintenance costs. Our inability to obtain and successfully integrate any of these licenses could delay product and service development until equivalent technology can be identified, licensed and integrated. This in turn would harm our business and operating results.
19
We may be unable to respond to the rapid technological change and changing customer preferences in the online sales, marketing, customer service, and/or online consumer services industries and this may cause our business to suffer.
If we are unable, for technological, legal, financial or other reasons, to adapt in a timely manner to changing market conditions in the online sales, marketing, customer service and/or e-commerce industry or our customers’ or Internet users’ requirements or preferences, our business, results of operations and financial condition would be materially and adversely affected. Business on the Internet is characterized by rapid technological change. In addition, the market for online sales, marketing, customer service and expert advice solutions is relatively new. Changes in customer and Internet user requirements and preferences, frequent new product and service introductions embodying new technologies and the emergence of new industry standards and practices such as but not limited to security standards could render our services and our proprietary technology and systems obsolete. The rapid evolution of these products and services will require that we continually improve the performance, features and reliability of our services. Our success will depend, in part, on our ability to:
| ● | enhance the features and performance of our services; |
| ● | develop and offer new services that are valuable to companies doing business online as well as Internet users; and |
| ● | respond to technological advances and emerging industry standards and practices in a cost-effective and timely manner. |
If any of our new services, including upgrades to our current services, do not meet our customers’ or Internet users’ expectations, our business may be harmed. Updating our technology may require significant additional capital expenditures and could materially and adversely affect our business, results of operations and financial condition.
If new services require us to grow rapidly, this could place a significant strain on our managerial, operational, technical and financial resources. In order to manage our growth, we could be required to implement new or upgraded operating and financial systems, procedures and controls. Our failure to expand our operations in an efficient manner could cause our expenses to grow, our revenue to decline or grow more slowly than expected and could otherwise have a material adverse effect on our business, results of operations and financial condition.
Our offshore product development, support and professional services may prove difficult to manage or may not allow us to realize our cost reduction goals, produce effective new solutions and provide professional services to drive growth.
We use offshore resources to perform new product and services development and provide support and professional consulting efforts, which requires detailed technical and logistical coordination. We must ensure that our international resources and personnel are aware of and understand development specifications and customer support, as well as implementation and configuration requirements and that they can meet applicable timelines. If we are unable to maintain acceptable standards of quality in support, product development and professional services, our attempts to reduce costs and drive growth through new products and margin improvements in technical support and professional services may be negatively impacted, which would adversely affect our results of operations. Outsourcing services to offshore providers may expose us to misappropriation of our intellectual property or that of our customers, or make it more difficult to defend intellectual property rights in our technology.
If we are unable to hire and retain key personnel, our business and results of operations would be negatively affected.
Our success will depend in large part on the skills, experience and performance of our senior management, engineering, sales, marketing and other key personnel. The loss of the services of any of our senior management or other key personnel, including our Chief Executive Officer and co-founder, Ashutosh Roy, could harm our business. Additionally, attrition in the Indian workforce on which we rely for research and development could have significant negative effects on us and our results of operations. If we cannot hire and retain qualified personnel, our ability to expand our business would be impaired and our results of operations would suffer.
20
We may not be able to realize the benefits of offering the limited, free “Innovation in 30 days” version of our service.
We offer a limited version of our subscription service to customers or potential customers free of charge (known as “Innovation in 30 days”) in order to promote usage, brand and product awareness, and adoption, and we invest time and resources for such initial engagements without compensation from the customers. Some customers never enter into a definitive contract for our paid subscription service despite the time and effort we may have expended on such initiatives. To the extent that these customers do not become paying customers, we will not realize the intended benefits of this marketing effort, and our ability to grow our business and revenue may be harmed.
We may not be able to raise additional capital on acceptable terms, if at all, or without dilution to our stockholders which could limit our ability to grow our business and expand our operations.
Our working capital requirements in the foreseeable future are subject to numerous risks and will depend on a variety of factors. We may seek additional funding to finance our operations or should we make acquisitions. We may also need to secure additional financing due to unforeseen or unanticipated market conditions. We may try to raise additional funds through public or private financings, strategic relationships, or other arrangements. Such financing may be difficult to obtain on terms acceptable to us, if at all. If we raise additional funds through the issuance of equity or convertible securities, then the issuance could result in substantial dilution to existing stockholders. If we raise additional funds through the issuance of debt securities or preferred stock, these new securities would have rights, preferences, and privileges senior to those of the holders of our common stock. In addition, the terms of these securities could impose restrictions on our operations. If we are not able to raise additional funds on terms acceptable to us, if and when needed, our ability to fund our operations, take advantage of opportunities, and develop or expand our business could be significantly limited.
Our reserves may be insufficient to cover receivables we are unable to collect.
We assume a certain level of credit risk with our customers in order to do business. Conditions affecting any of our customers could cause them to become unable or unwilling to pay us in a timely manner, or at all, for products or services we have already provided them. In the past, we have experienced collection delays from certain customers, and we cannot predict whether we will continue to experience similar or more severe delays in the future. Although we have established reserves to cover losses due to delays or inability to pay, there can be no assurance that such reserves will be sufficient to cover our losses. If losses due to delays or inability to pay are greater than our reserves, it could harm our business, operating results and financial condition.
21
If we acquire companies or technologies, we may not realize the expected business benefits, the acquisitions could prove difficult to integrate, disrupt our business and adversely affect our operations.
As part of our business strategy, we periodically make investments in, or acquisitions of, complementary businesses, joint ventures, services and technologies and intellectual property rights, and we expect that we will continue to make such investments and acquisitions in the future. Acquisitions and investments involve numerous risks, including:
| ● | the potential failure to achieve the expected benefits of the combination or acquisition; |
| ● | difficulties in and the cost of integrating operations, technologies, services and personnel; |
| ● | diversion of financial and managerial resources from existing operations; |
| ● | risks of entering new markets in which we have little or no experience or where competitors may have stronger market positions; |
| ● | potential write-offs of acquired assets or investments, and potential financial and credit risks associated with acquired customers; |
| ● | potential loss of key employees; |
| ● | inability to generate sufficient revenue to offset acquisition or investment costs; |
| ● | the inability to maintain relationships with customers and partners of the acquired business; |
| ● | the difficulty of transitioning the acquired technology onto our existing platforms and maintaining the security standards consistent with our other services for such technology; |
| ● | potential unknown liabilities associated with the acquired businesses; |
| ● | unanticipated expenses related to acquired technology and its integration into existing technology; |
| ● | negative impact to our results of operations because of the depreciation and amortization of amounts related to acquired intangible assets, fixed assets and deferred compensation, and the loss of acquired deferred revenue and unbilled deferred revenue; |
| ● | delays in customer purchases due to uncertainty related to any acquisition; |
| ● | the need to implement controls, procedures and policies at the acquired company; |
| ● | challenges caused by distance, language and cultural differences; |
| ● | in the case of foreign acquisitions, the challenges associated with integrating operations across different cultures and languages and any currency and regulatory risks associated with specific countries; and |
| ● | the tax effects of any such acquisitions. |
We may be subject to legal liability and/or negative publicity for the services provided to consumers through our technology platforms.
Our technology platforms enable representatives of our customers as well as individual service providers to communicate with consumers and other persons seeking information or advice on the Internet. The law relating to the liability of online platform providers such as us for the activities of users of their online platforms is often challenged in the U.S. and internationally. We may be unable to prevent users of our technology platforms from providing negligent, unlawful or inappropriate advice, information or content through our technology platforms, or from behaving in an unlawful manner, and we may be subject to allegations of civil or criminal liability for negligent, fraudulent, unlawful or inappropriate activities carried out by users of our technology platforms.
Claims could be made against online services companies under both U.S. and foreign law such as fraud, defamation, libel, invasion of privacy, negligence, copyright or trademark infringement, or other theories based on the nature and content of the materials disseminated by users of our technology platforms. In addition, domestic and foreign legislation has been proposed that could prohibit or impose liability for the transmission over the Internet of certain types of information. Our
22
defense of any of these actions could be costly and involve significant time and attention of our management and other resources.
The Digital Millennium Copyright Act (DMCA) is intended, among other things, to reduce the liability of online service providers for listing or linking to third-party web properties that include materials that infringe copyrights or rights of others. Additionally, portions of The Communications Decency Act (CDA) are intended to provide statutory protections to online service providers who distribute third party content. A safe harbor for copyright infringement is also available under the DMCA to certain online service providers that provide specific services, if the providers take certain affirmative steps as set forth in the DMCA. Certain questions regarding the safe harbor under the DMCA and the CDA have yet to be litigated, and we cannot guarantee that we will meet the safe harbor requirements of the DMCA or of the CDA. If we are not covered by a safe harbor, for any reason, we could be exposed to claims, which could be costly and time-consuming to defend.
If our cybersecurity systems or the systems of our vendors, partners and suppliers are breached and unauthorized access is obtained to a customer’s data or our data or IT systems, our service may be perceived as not being secure, customers may curtail or stop using our service and we may incur significant legal and financial exposure and liabilities.
Our service involves the storage and transmission of customers’ proprietary information, and security breaches could expose us to a risk of loss of this information, loss of access, litigation and possible liability. These security measures may be breached as a result of third-party action, including intentional misconduct by computer hackers (which may involve nation states and individuals sponsored by them), employee error, malfeasance or otherwise and result in someone obtaining unauthorized access to our customers’ data or our data, including our intellectual property and other confidential business information, or our IT systems. Additionally, third parties may attempt to fraudulently induce employees or customers into disclosing sensitive information such as user names, passwords or other information in order to gain access to our customers’ data or our data or IT systems.
Employees or contractors have introduced vulnerabilities in, and enabled the exploitation of, our IT environments in the past and may do so in the future. These cybersecurity attacks threaten to misappropriate our proprietary information, cause interruptions of our IT services and commit fraud. Because the techniques used to obtain unauthorized access, or to sabotage systems, change frequently and generally are not recognized until launched against a target, we may be unable to anticipate these techniques or to implement adequate preventative measures. Further, if unauthorized access or sabotage remains undetected for an extended period of time, the effects of such breach could be exacerbated.
In addition, our customers may authorize third party access to their customer data located in our cloud environment. Because we do not control the transmissions between customer authorized third parties, or the processing of such data by customer authorized third parties, we cannot ensure the integrity or security of such transmissions or processing.
Cybersecurity attacks could require significant expenditures of our capital and diversion of our resources. If these attacks are successful, they could result in the theft of proprietary, personally identifiable, confidential and sensitive information of ours, our employees, our customers and our business partners, and could materially disrupt business for us, our customers and our business partners. A successful cybersecurity attack involving our data center, network or software products could also negatively impact the market perception of the effectiveness of our products or lead to contractual disputes, litigation or government regulatory action against us, any of which could materially adversely affect our business, reputation and resulting operations.
Changes in the European regulatory environment regarding privacy and data protection regulations, such as the European Union’s General Data Protection Regulation (GDPR), could expose us to risks of noncompliance and costs associated with compliance.
We have in the past relied on adherence to the U.S. Department of Commerce’s Safe Harbor Privacy Principles and compliance with the U.S.-European Union (EU) and U.S. - Swiss Safe Harbor Frameworks as agreed to and set forth by the U.S. Department of Commerce, and the EU and Switzerland, which established a means for legitimating the transfer of personally identifiable information (PII) by U.S. companies doing business in Europe from the European Economic Area (EEA) to the U.S. As a result of the October 6, 2015 EU Court of Justice (ECJ), opinion in Case C-362/14 (Schrems
23
v. Data Protection Commissioner) regarding the adequacy of the U.S.-EU Safe Harbor Framework, the U.S. – EU Safe Harbor Framework is no longer deemed to be a valid method of compliance with restrictions set forth in European law regarding the transfer of data outside of the EEA requiring us to rely on alternative mechanisms permitted under European law, such as consent and EU-specified standard contractual clauses. The U.S. - EU Safe Harbor was replaced with the EU-U.S. Privacy Shield (Privacy Shield) in July 2016 and, starting on August 1, 2016, the Privacy Shield was made available to companies for self-certification. We have self-certified with the Privacy Shield. Nevertheless, some of the mechanisms permitting transfer of data from the EU to the U.S. have been subject to challenges, whose outcomes remain uncertain.
Furthermore, on May 25, 2018, the EU’s GDPR became enforceable, imposing new obligations directly on us as both a data controller and a data processor, as well as on many of our customers. It is possible that these new laws may be interpreted or applied in a manner that is adverse to us, unforeseen, or otherwise inconsistent with our practices or that we may not adequately adapt our internal policies and/or procedures to evolving regulations, any of which could result in litigation, regulatory investigations and potential legal liability (including potential liability exposure through higher potential penalties for non-compliance), require us to make changes to our services to enable us and/or our customers to meet the new legal requirements, in case we have to change locations of data centers to meet privacy laws, increased requirements for customers to buy add-ons to meet additional requirements imposed by new laws, require us to change our practices in a manner adverse to our business or limit access to our products and services in certain countries. Compliance with existing, proposed and recently enacted laws (including implementation of the privacy and process enhancements called for under GDPR) and regulations can be costly; any failure to comply with these regulatory standards could subject us to legal and reputational risks.
We may be unsuccessful in establishing legitimate means of transferring data from the EEA, we may experience hesitancy, reluctance, or refusal by European or multi-national customers to continue to use our services due to the potential risk exposure to such customers as a result of the ECJ ruling or the implementation of GDPR, and we and our customers are at risk of enforcement actions taken by an EU data protection authority until such point in time that we ensure that all data transfers to us from the EEA are legitimized. We may find it necessary to establish systems to maintain EU-origin data in the EEA, which may involve substantial expense and distraction from other aspects of our business. We publicly post our privacy policies and practices concerning our processing, use and disclosure of PII. Our publication of our privacy policy and other statements we publish that provide promises and assurances about privacy and security can subject us to potential governmental action if they are found to be deceptive or misrepresentative of our practices. Further, the costs of compliance with, and other burdens imposed by, such laws, regulations and policies that are applicable to us may limit the use and adoption of our products and solutions and could have a material adverse impact on our results of operations.
Privacy concerns and laws, evolving regulation of cloud computing, cross-border data transfer restrictions and other domestic or foreign regulations may limit the use and adoption of our solutions and adversely affect our business.
Regulation related to the provision of services on the Internet is increasing, as federal, state and foreign governments continue to adopt new laws and regulations addressing data privacy and the collection, processing, storage and use of personal information. Further, laws are increasingly aimed at the use of personal information for marketing purposes, such as the EU’s e-Privacy Directive (which is set to be replaced in the coming months by a new EU e-Privacy Regulation which will have a “direct effect” in each EU Member State), and the country-specific regulations that implement that directive. A recent decision by the European Court of Justice invalidated the US-EU Privacy Shield program as a protection for cross-border data transfers out of the European Union. Such laws, decisions, and regulations are subject to differing interpretations and may be inconsistent among jurisdictions. These and other requirements could reduce demand for our solutions or restrict our ability to store and process data or, in some cases, impact our ability to offer our services and solutions in certain locations.
In the U.S., California enacted the California Consumer Privacy Act (CCPA) on June 28, 2018, which went into effect on January 1, 2020. The CCPA gives California residents expanded rights to access and delete their personal information, opt out of certain personal information sharing and receive detailed information about how their personal information is used. The CCPA provides for civil penalties for violations, as well as a private right of action for data breaches that is expected to increase data breach litigation. New York enacted the Stop Hacks and Improve Electronic Data Security Act (SHIELD Act), which became effective March 2020 and requires companies with data relating to New Yorkers to adopt
24
comprehensive cybersecurity programs. These statutes may increase our compliance costs and potential liability. Some observers have noted that the CCPA and the SHIELD Act could mark the beginning of a trend toward more stringent privacy legislation in the U.S., which could increase our potential liability and adversely affect our business.
In addition to government activity, privacy advocacy and other industry groups have established or may establish new self-regulatory standards that may place additional burdens on us. Our customers expect us to meet voluntary certification or other standards established by third parties, such as TRUSTe. If we are unable to maintain these certifications or meet these standards, it could adversely affect our ability to provide our solutions to certain customers and could harm our business.
The costs of compliance with and other burdens imposed by laws, regulations and standards may limit the use and adoption of our service and reduce overall demand for it, or lead to significant fines, penalties or liabilities for any noncompliance.
Furthermore, concerns regarding data privacy may cause our customers’ customers to resist providing the data necessary to allow our customers to use our service effectively. Even the perception that the privacy of personal information is not satisfactorily protected or does not meet regulatory requirements could inhibit sales of our products or services, and could limit adoption of our subscription solution.
Industry-specific regulation is evolving and unfavorable industry-specific laws, regulations or interpretive positions could limit our ability to provide services and harm our business.
Our customers and potential customers conduct business in a variety of industries, including financial services, the public sector, healthcare and telecommunications. Regulators in certain industries have adopted and may in the future adopt regulations or interpretive positions regarding the use of cloud computing and other outsourced services. The costs of compliance with, and other burdens imposed by, industry-specific laws, regulations and interpretive positions may limit customers’ use and adoption of our services and reduce overall demand for our services. For example, some financial services regulators have imposed guidelines for use of cloud computing services that mandate specific controls or require financial services enterprises to obtain regulatory approval prior to outsourcing certain functions. If we are unable to comply with these guidelines or controls, or if our customers are unable to obtain regulatory approval to use our service where required, our business may be harmed. In addition, an inability to satisfy the standards of certain voluntary third-party certification bodies that our customers may expect, such as an attestation of compliance with the PCI Data Security Standards, may have an adverse impact on our business. If we are unable to achieve or maintain these industry-specific certifications or other requirements or standards relevant to our customers, it could adversely affect our ability to provide our services to certain customers and harm our business.
In some cases, industry-specific laws, regulations or interpretive positions may also apply directly to us as a service provider. Any failure or perceived failure by us to comply with such requirements could have an adverse impact on our business.
Changes to current accounting policies could have a significant effect on our reported financial results or the way in which we conduct our business.
Generally accepted accounting principles and the related accounting pronouncements, implementation guidelines and interpretations for some of our significant accounting policies are highly complex and require subjective judgments and assumptions. Some of our more significant accounting policies that could be affected by changes in the accounting rules and the related implementation guidelines and interpretations include:
| ● | recognition of revenue; |
| ● | contingencies and litigation; and |
| ● | accounting for income taxes. |
Changes in these or other rules, or scrutiny of our current accounting practices, or a determination that our judgments or assumptions in the application of these accounting principles were incorrect, could have a significant adverse effect on our reported operating results or the way in which we conduct our business.
25
Continued uncertainty surrounding the implementation and effect of Brexit may cause increased economic volatility, affecting our operations and business.
In March 2017, the UK served notice to the European Council under Article 50 of the Treaty of Lisbon to withdraw membership from the EU. Such exit (Brexit) could cause disruptions to, and create uncertainty surrounding, our business in the UK and EU, including affecting our relationships with our existing and future customers, suppliers, and employees. As a result, Brexit could have an adverse effect on our future business, financial results, and operations. The UK formally left the EU on January 31, 2020, and is now in a transition period through December 31, 2020. Although the UK will remain in the EU single market and customs union during the transition period, the long-term nature of the UK’s relationship with the EU is unclear and there is considerable uncertainty about whether any agreement will be reached and implemented. The political and economic instability created by Brexit has caused and may continue to cause significant volatility in global financial markets and uncertainty regarding the regulation of data protection in the UK. In particular, although the UK enacted a Data Protection Act in May 2018 that is consistent with the EU General Data Protection Regulation, uncertainty remains regarding how data transfers to and from the UK will be regulated. Brexit could also have the effect of disrupting the free movement of goods, services, and people between the UK, the EU, and elsewhere. Brexit could lead to legal uncertainty and potentially divergent national laws and regulations as the UK determines which EU laws to replace or replicate. Further, uncertainty around these and related issues could lead to adverse effects on the economy of the UK and the other economies in which we operate. There can be no assurance that any or all of these events will not have a material adverse effect on our business operations, results of operations and financial condition.
Risks Related to Intellectual Property
We have been and may in the future be sued by third parties for various claims including alleged infringement of proprietary rights that can be time-consuming, incur substantial costs and divert the attention of management, which could adversely affect our operations and cash flow.
We are involved in various legal matters arising from the normal course of business activities. These may include claims, suits, and other proceedings involving alleged infringement of third-party patents and other intellectual property rights, and commercial, labor and employment, and other matters.
The software and Internet industries are characterized by the existence of a large number of patents, trademarks and copyrights and by frequent litigation based on allegations of infringement or other violations of intellectual property rights. We have received and may receive in the future communications from third parties claiming that we or our customers have infringed the intellectual property rights of others. In addition we have been, and may in the future be, sued by third parties for alleged infringement of their claimed proprietary rights. Our technologies and those of our customers may be subject to injunction if they are found to infringe the rights of a third party or we may be required to pay damages, or both. Many of our agreements require us to indemnify our customers for third-party intellectual property infringement claims, which would increase the cost to us of an adverse ruling on such a claim.
The outcome of any litigation, regardless of its merits, is inherently uncertain. Any claims and lawsuits, and the disposition of such claims and lawsuits, could be time-consuming and expensive to resolve, divert management attention from executing our business plan, lead to attempts on the part of other parties to pursue similar claims and, in the case of intellectual property claims, require us to change our technology, change our business practices or pay monetary damages, or enter into short- or long-term royalty or licensing agreements.
Any adverse determination related to intellectual property claims or other litigation could prevent us from offering our service to customers, could be material to our financial condition or cash flows, or both, or could otherwise adversely affect our operating results. In addition, depending on the nature and timing of any such dispute, a resolution of a legal matter could materially affect our future results of operation or cash flows or both.
26
We rely on trademark, copyright, trade secret laws, contractual restrictions and patent rights to protect our intellectual property and proprietary rights and, if these rights are impaired, then our ability to generate revenue will be harmed.
If we fail to protect our intellectual property rights adequately, our competitors might gain access to our technology, and our business might be harmed. In addition, defending our intellectual property rights might entail significant expense. Any of our trademarks or other intellectual property rights may be challenged by others or invalidated through administrative process or litigation. While we have some U.S. patents and pending U.S. patent applications, we may be unable to obtain patent protection for the technology covered in our patent applications. In addition, our existing patents and any patents issued in the future may not provide us with competitive advantages, or may be successfully challenged by third parties. Furthermore, legal standards relating to the validity, enforceability and scope of protection of intellectual property rights are uncertain. Effective patent, trademark, copyright and trade secret protection may not be available to us in every country in which our service is available. The laws of some foreign countries may not be as protective of intellectual property rights as those in the U.S., and mechanisms for enforcement of intellectual property rights may be inadequate. Accordingly, despite our efforts, we may be unable to prevent third parties from infringing upon or misappropriating our intellectual property.
We might be required to spend significant resources to monitor and protect our intellectual property rights. We may initiate claims or litigation against third parties for infringement of our proprietary rights or to establish the validity of our proprietary rights. Any litigation, whether or not it is resolved in our favor, could result in significant expense to us and divert the efforts of our technical and management personnel.
Our failure or inability to develop non-infringing technology or license proprietary rights on a timely basis would harm our business.
We may be subject to legal proceedings and claims from time to time in the ordinary course of our business, including claims of alleged infringement of the patents and other intellectual property rights of third parties. Our products may infringe issued patents that may relate to our products because patent applications in the United States are not publicly disclosed until the patent is issued, and hence applications may have been filed which relate to our software products. Intellectual property litigation is expensive, time consuming, and could divert management’s attention away from running our business. Litigation could also require us to develop non-infringing technology or enter into royalty or license agreements. These royalty or license agreements, if required, may not be available on acceptable terms, if at all, in the event of a successful claim of infringement.
Risks Related to Our Common Stock
Our stock price has demonstrated volatility and continued market conditions may cause declines or fluctuations.
The price at which our common stock trades has been and will likely continue to be highly volatile and show wide fluctuations due to factors such as the following:
| ● | transition to a subscription revenue model; |
| ● | concerns related to liquidity of our stock; |
| ● | actual or anticipated fluctuations in our operating results, our ability to meet announced or anticipated profitability goals and changes in or failure to meet securities analysts’ expectations; |
| ● | announcements of technological innovations and/or the introduction of new services by us or our competitors; |
| ● | developments with respect to intellectual property rights and litigation, regulatory scrutiny and new legislation; |
| ● | conditions and trends in the Internet and other technology industries; and |
| ● | general market and economic conditions. |
27
Furthermore, the stock market has experienced significant price and volume fluctuations that have affected the market prices for the common stock of technology companies, regardless of the specific operating performance of the affected company. These broad market fluctuations may cause the market price of our common stock to decline.
Our insiders who are significant stockholders have the ability to exercise significant control over matters requiring stockholder approval, including the election of our board of directors, and may have interests that conflict with those of other stockholders.
Our directors and executive officers, together with their affiliates and members of their immediate families, beneficially owned, in the aggregate, approximately 32% of our outstanding capital stock as of June 30, 2020, of which our Chief Executive Officer, Ashutosh Roy, beneficially owned approximately 28% as of such date. As a result of these concentrated holdings, Mr. Roy individually or together with this group has the ability to exercise significant control over most matters requiring our stockholders’ approval, including the election and removal of directors and the approval of significant corporate transactions, such as a merger or sale of our company or its assets.
UNRESOLVED STAFF COMMENTS |
None.
PROPERTIES |
We lease all facilities used in our business as of June 30, 2020. The following table summarizes our principal properties:
|
| |
| Approximate Square |
| Lease Expiration |
Location | | Principal Use | | Footage | | Date |
Sunnyvale, California |
| Corporate Headquarters |
| 42,541 |
| 2022 |
Newbury, England | | Corporate Office – Europe, Middle East, & Africa | | 14,090 | | 2024 |
Pune, India |
| Corporate Office – Asia Pacific |
| 33,262 |
| 2021 |
In the ordinary course of business, we are involved in various legal proceedings and claims related to alleged infringement of third-party patents and other intellectual property rights, commercial, corporate and securities, labor and employment, wage and hour, and other claims. We have been, and may in the future be, put on notice and/or sued by third parties for alleged infringement of their proprietary rights, including patent infringement.
We evaluate all claims and lawsuits with respect to their potential merits, our potential defenses and counterclaims, settlement or litigation potential and the expected effect on us. Our technologies may be subject to injunction if they are found to infringe the rights of a third party. In addition, our agreements require us to indemnify our customers for third-party intellectual property infringement claims, which could increase the cost to us of an adverse ruling on such a claim.
Not applicable.
28
MARKET FOR REGISTRANT’S COMMON EQUITY, RELATED STOCKHOLDER MATTERS AND ISSUER PURCHASES OF EQUITY SECURITIES |
Market Information
Our common stock is traded on the Nasdaq Capital Market under the symbol “EGAN”.
Holders
As of September 10, 2020, there were approximately 143 stockholders of record.
Dividends
We have never declared or paid any cash dividends on our common stock. We currently anticipate that we will retain all available funds for use in the operation of our business and do not intend to pay any cash dividends in the foreseeable future.
Stock Performance Graph
The following shall not be deemed incorporated by reference into any of our other filings under the Securities Exchange Act of 1934, as amended, or the Securities Act of 1933, as amended.
The graph below compares the cumulative total stockholder return on our common stock with the cumulative total return on the Standard & Poor’s 500 Index and the Nasdaq Composite Total Return Index for each of the last five fiscal years ended June 30, 2020, assuming an initial investment of $100. Data for the Standard & Poor’s 500 Index and the Nasdaq Composite Total Return Index assume no dividends.
29
The comparisons in the graph below are based upon historical data and are not indicative of, nor intended to forecast, future performance of our common stock.
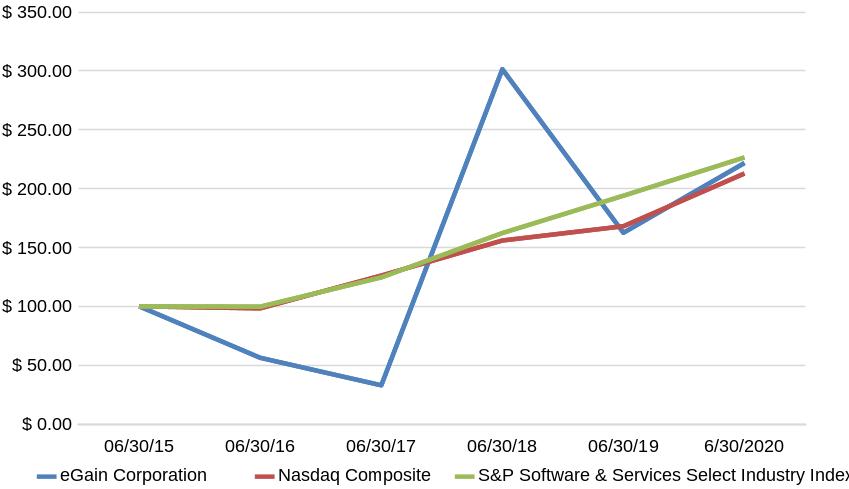
| 06/30/15 | 06/30/16 | 06/30/17 | 06/30/18 | 06/30/19 | 6/30/2020 |
eGain Corporation | $ 100.00 | $ 56.29 | $ 32.93 | $ 301.40 | $ 162.48 | $ 221.76 |
Nasdaq Composite | $ 100.00 | $ 98.32 | $ 126.14 | $ 155.91 | $ 168.04 | $ 212.83 |
S&P Software & Services Select Industry Index | $ 100.00 | $ 99.74 | $ 124.57 | $ 162.25 | $ 193.96 | $ 226.46 |
Equity Compensation Plan Information
See Item 12 of Part III of this Annual Report regarding information about securities authorized for issuance under our equity compensation plan.
30
SELECTED FINANCIAL DATA |
The selected consolidated financial data should be read in conjunction with the information under “Item 7. Management’s Discussion and Analysis of Financial Condition and Results of Operations,” our consolidated financial statements and the related notes which are included in “Item 8. Financial Statements and Supplementary Data.”
| | Year ended June 30, | |||||||||||||
| | 2020 | | 2019 | | 2018 | | 2017 | | 2016 | |||||
| | (in thousands, except per share information) | |||||||||||||
Revenue: |
| |
|
| | | | |
|
| |
|
| |
|
Subscription | | $ | 66,129 | | $ | 60,013 | | $ | 51,352 | | $ | 48,142 | | $ | 57,249 |
Professional services | |
| 6,600 | | | 7,219 | |
| 9,955 | |
| 10,073 | |
| 12,126 |
Total revenue | |
| 72,729 | | | 67,232 | |
| 61,307 | |
| 58,215 | |
| 69,375 |
Cost of revenue: | | | | | | | | | | | | | | | |
Cost of subscription | |
| 14,398 | | | 14,976 | |
| 13,152 | |
| 12,006 | |
| 12,430 |
Cost of professional services | |
| 6,683 | | | 6,865 | |
| 9,184 | |
| 9,193 | |
| 11,259 |
Total cost of revenue | |
| 21,081 | | | 21,841 | |
| 22,336 | |
| 21,199 | |
| 23,689 |
Gross profit | |
| 51,648 | | | 45,391 | |
| 38,971 | |
| 37,016 | |
| 45,686 |
Operating expenses: | |
| | | | | |
| | |
| | |
| |
Research and development | |
| 16,638 | | | 14,369 | |
| 14,711 | |
| 13,753 | |
| 16,063 |
Sales and marketing | |
| 19,623 | | | 17,302 | |
| 17,681 | |
| 20,436 | |
| 27,722 |
General and administrative | |
| 7,981 | | | 8,198 | |
| 7,567 | |
| 6,552 | |
| 7,774 |
Total operating expenses | |
| 44,242 | | | 39,869 | |
| 39,959 | |
| 40,741 | |
| 51,559 |
Income (loss) from operations | |
| 7,406 | | | 5,522 | |
| (988) | |
| (3,725) | |
| (5,873) |
Interest income (expense), net | |
| 395 | | | (319) | |
| (983) | |
| (1,730) | |
| (1,958) |
Other income (expense), net | |
| 185 | | | (202) | |
| (206) | |
| (32) | |
| 728 |
Income (loss) before income benefit (provision) | |
| 7,986 | | | 5,001 | |
| (2,177) | |
| (5,487) | |
| (7,103) |
Income tax benefit (provision) | |
| (778) | | | (833) | |
| 186 | |
| (533) | |
| 863 |
Net income (loss) | | $ | 7,208 | | $ | 4,168 | | $ | (1,991) | | $ | (6,020) | | $ | (6,240) |
Per share information: | |
| | | | | |
| | |
| | |
| |
Earnings (loss) per share: | | | | | | | | | | | | | | | |
Basic | | $ | 0.24 | | $ | 0.15 | | $ | (0.07) | | $ | (0.22) | | $ | (0.23) |
Diluted | | $ | 0.23 | | $ | 0.14 | | $ | (0.07) | | $ | (0.22) | | $ | (0.23) |
Weighted-average shares used in computation: | |
| | | | | | | | | | | | | |
Basic | | | 30,620 | | | 28,579 | |
| 27,333 | |
| 27,108 | |
| 27,056 |
Diluted | |
| 31,956 | | | 30,363 | |
| 27,333 | |
| 27,108 | |
| 27,056 |
Below is a summary of stock-based compensation included in the costs and expenses above: | |
| | | | | |
| | |
| | |
| |
Cost of revenue | | $ | 205 | | $ | 323 | | $ | 323 | | $ | 131 | | $ | 249 |
Research and development | | $ | 706 | | $ | 519 | | $ | 493 | | $ | 281 | | $ | 472 |
Sales and marketing | | $ | 551 | | $ | 313 | | $ | 341 | | $ | 80 | | $ | 169 |
General and administrative | | $ | 399 | | $ | 468 | | $ | 538 | | $ | 175 | | $ | 298 |
| | | | | | | | | | | | | | | |
| | As of June 30, | |||||||||||||
| | 2020 | | 2019 | | 2018 | | 2017 | | 2016 | |||||
Consolidated Balance Sheet Data: |
|
| |
| | | |
| |
|
| |
|
| |
Cash, cash equivalents and short-term investments (including restricted cash) | | $ | 46,615 | | $ | 31,867 | | $ | 11,504 | | $ | 10,633 | | $ | 11,785 |
Working capital | | $ | 21,355 | | $ | 13,895 | | $ | (8,023) | | $ | (7,680) | | $ | (886) |
Total assets | | $ | 93,705 | | $ | 73,754 | | $ | 39,622 | | $ | 39,751 | | $ | 48,063 |
Deferred revenue | | $ | 41,470 | | $ | 36,489 | | $ | 26,197 | | $ | 23,219 | | $ | 15,717 |
Long-term debt (bank borrowings and capital lease obligations) | | $ | — | | $ | — | | $ | 8,941 | | $ | 14,844 | | $ | 20,376 |
31
ITEM 7. | MANAGEMENT’S DISCUSSION AND ANALYSIS OF FINANCIAL CONDITION AND RESULTS OF OPERATIONS |
The following discussion of eGain’s financial condition and results of operations should be read together with the consolidated financial statements and related notes in this Annual Report on Form 10-K. This discussion may contain forward-looking statements based upon current expectations that involve risks and uncertainties. These risks and uncertainties may cause actual results to differ materially from those discussed in the forward-looking statements.
Overview
eGain automates customer engagement with an innovative Software as a service (SaaS) platform, powered by deep digital, Artificial intelligence (AI), and knowledge capabilities. We are headquartered in the United States. We also operate in United Kingdom and India. We sell mostly to large enterprises across financial services, telecommunications, retail, government, healthcare, and utilities. With our mantra of AX + BX + CX = DX™, we guide clients to effortless Digital experience (DX) by holistically optimizing Agent experience (AX), Business experience (BX) and Customer experience (CX). One hundred fifty leading brands use eGain cloud software to improve customer satisfaction, empower agents, reduce service cost and boost sales.
We have transitioned from a hybrid model, where we sold both SaaS and perpetual license solutions, to a SaaS only business model. Today, we only sell SaaS to new clients and are actively migrating our remaining perpetual license clients to SaaS. As we continue to migrate our legacy perpetual license clients to SaaS, we expect our legacy revenue, primarily comprising annual maintenance and support fees for legacy perpetual license clients to continue to decline.
We believe our go-forward SaaS business model affords us recurring revenue visibility and more predictability. Fiscal year 2019 affirmed our view that SaaS clients adopt our product innovation much faster than the perpetual license model and get better service levels. We believe SaaS clients enjoy up to 50% faster time to value from their eGain investment.
COVID-19
In December 2019, a novel strain of coronavirus (COVID-19) was first reported in Wuhan, China. In March 2020, the World Health Organization characterized the outbreak of COVID-19 as a global pandemic, and the virus continues to spread in areas where we operate and sell our products and services. Several public health organizations have recommended, and many local governments have implemented, certain measures to slow and limit the transmission of COVID-19, including shelter-in-place and social distancing orders, which has resulted in a significant deterioration of economic conditions in the countries in which we operate.
The impact of COVID-19 and the related disruptions caused to the global economy and our business did not have a material adverse impact on our business during the quarter ended June 30, 2020. However, the spread of the COVID-19 virus caused us to modify our business practices, including implementing work-from-home policies and restricting travel by our employees, among other things.
In response to the outbreak of COVID-19, we have taken the following measures to date:
| ● | Implemented work-from-home and social distancing policies throughout our organization; |
| ● | Suspended all employee travel; |
| ● | Cancelled certain sales and marketing events; and |
| ● | Looked to our customer’s needs to best support their operations during this crisis. |
The effect of the COVID-19 pandemic, may not be fully reflective in our results of operations and overall financial performance until further periods, if at all. The impact, if any, of operational changes we may implement is uncertain, but changes we have implemented as of the filing date have not affected and are not expected to affect our ability to maintain operations. We will continuously monitor the situation to determine what actions may be necessary or appropriate to address the impact of the COVID-19 pandemic, which may include actions mandated or recommended by
32
federal, state or local government authorities. See our “Risk Factors” for further discussion of the possible impact of the COVID-19 pandemic on or business.
Key Financial Measures
We monitor the key financial performance measures set forth below as well as cash and cash equivalents and available debt capacity, which are discussed in Liquidity and Capital Resources, to help us evaluate trends, establish budgets, measure the effectiveness of our sales and marketing efforts and assess operational effectiveness and efficiencies.
SaaS Revenues
With our transition to a SaaS only business model, we believe SaaS revenue better reflects our business momentum and to analyze progress and thus, we disaggregate our subscription revenue growth between:
| ● | SaaS revenue, which is defined as revenue from cloud delivery arrangements, term licenses and embedded OEM royalties and associated support; and |
| ● | Legacy revenue, which is defined as revenue from license, maintenance and support contracts on perpetual license arrangements that we no longer sell. |
The following table presents a break out of subscription revenue between SaaS and legacy revenues for each of the following periods:
| | Fiscal Year Ended June 30 | | | | | | ||||
|
| 2020 |
| 2019 | | Change | | ||||
Revenue | | (in thousands, except percentages) | |||||||||
SaaS revenue | | $ | 56,793 | | $ | 44,788 | | $ | 12,005 | 27 | % |
Legacy revenue | |
| 9,336 | |
| 15,225 | | | (5,889) | (39) | % |
Total subscription revenue | | $ | 66,129 | | $ | 60,013 | | $ | 6,116 | | |
As we continue to migrate our legacy perpetual license clients to SaaS, we expect our legacy revenue to continue to decline.
SaaS and Professional Services Revenue
As we continue to shift to a SaaS only business model, substantially all of professional services revenue is now generated from our SaaS customer base. We believe the combination of SaaS and professional services revenue is a useful measure to value our business on a forward-looking basis.
The following table presents total SaaS and professional services revenue for each of the following periods:
| | Fiscal Year Ended June 30 | | | | |
| ||||
|
| 2020 |
| 2019 |
| Change | | ||||
Revenue | | (in thousands, except percentages) | |||||||||
SaaS | | $ | 56,793 | | $ | 44,788 | | $ | 12,005 | 27 | % |
Professional services | |
| 6,600 | |
| 7,219 | |
| (619) | (9) | % |
Total SaaS and professional services revenue | | $ | 63,393 | | $ | 52,007 | | $ | 11,386 | | |
33
Non-GAAP Operating Income
Non-GAAP operating income is defined as operating income, adjusted for the impact of stock-based compensation expense and amortization of acquired intangible assets.
Management believes that it is useful to exclude certain non-cash charges and non-core operational charges from non-GAAP operating income because (i) the amount of such expenses in any specific period may not directly correlate to the underlying performance of our business operations; and (ii) such expenses can vary significantly between periods as a result of the timing of new stock-based awards and acquisitions. The presentation of the non-GAAP financial measures is not intended to be considered in isolation, or as a substitute for, or superior to, the financial information prepared and presented in accordance with generally accepted accounting principles in the United States of America (GAAP).
The following table presents a reconciliation of GAAP income from operations to non-GAAP income from operations for each of the following periods:
| | Fiscal Year Ended June 30 | ||||
|
| 2020 |
| 2019 | ||
Income from operations | | $ | 7,406 | | $ | 5,522 |
Add: | | | | | | |
Stock-based compensation | | | 1,861 | | | 1,623 |
Amortization of intangible assets | | | 268 | | | 438 |
Non-GAAP income from operations | | $ | 9,535 | | $ | 7,583 |
Critical Accounting Policies and Estimates
Management’s Discussion and Analysis of Financial Condition and Results of Operations discusses our consolidated financial statements, which have been prepared in accordance with accounting principles generally accepted in the United States. The preparation of these financial statements requires management to make estimates and assumptions that affect the reported amounts of assets and liabilities and the disclosure of contingent assets and liabilities at the date of the financial statements and the reported amounts of revenue and expenses during the reporting period.
We believe that the assumptions and estimates associated with revenue recognition, stock-based compensation, allowance for doubtful accounts, the valuation of goodwill and intangible assets, the valuation of deferred tax allowance, and legal contingencies have the greatest potential impact on our consolidated financial statements. We evaluate these estimates on an ongoing basis. Management bases its estimates and judgments on historical experience and on various other factors that are believed to be reasonable under the circumstances, the results of which form the basis for making judgments about the carrying values of assets and liabilities that are not readily apparent from other sources. Actual results may differ from these estimates under different assumptions or conditions.
Sources of Revenues
Our revenue is comprised of two categories, subscription and professional services. Subscription includes SaaS revenue and legacy revenue. SaaS revenue includes revenue from cloud delivery arrangements, term licenses and embedded OEM royalties and associated support. Legacy revenue is associated with license, maintenance and support contracts on perpetual license arrangements that we no longer sell. Professional services include consulting, implementation and training.
Subscription Revenue
For our cloud delivery arrangements, our maintenance and support arrangements and our term license subscriptions that incorporate substantial cloud functionality, the combined performance obligation is recognized ratably over the contract term as the obligation is delivered. For contracts involving distinct software licenses, the license performance obligation is satisfied at a point in time when control is transferred to the customer.
34
We typically invoice our customers in advance upon execution of the contract or subsequent renewals. Invoiced amounts are recorded in accounts receivable, deferred revenue or revenue, depending on when control is transferred to our customers based on each arrangement.
The Company has a royalty revenue agreement with a customer related to the Company’s embedded intellectual property. Under the terms of the agreement, the customer is to provide a combined fixed fee, per agent, for each software license sold containing the embedded software to the Company. These embedded OEM royalties are included as subscription revenue. Under Topic 606-10-55-65 revenue guidance (Topic 606), since these arrangements are for sales-based licenses of intellectual property, the Company recognizes revenue only as the subsequent sale occurs. However, since such sales are reported by the customer with a quarter in arrears, such revenue is recognized at the time it is reported and paid by the customer given that any estimated variable consideration would have to be fully constrained due to the unpredictability of such estimate and the unavoidable risk that it may lead to significant revenue reversals.
Professional Services Revenue
Professional services revenue includes system implementation, consulting and training. The transaction price is allocated to various performance obligations based on their stand-alone selling prices. Revenue allocated to each performance obligation is recognized as work is performed. Our consulting and implementation service contracts are bid either on a time-and-materials basis or on a fixed-fee basis. Fixed fees are generally paid on milestone billing at pre-determined points in the contract. Amounts that have been invoiced are recorded in accounts receivable and in deferred revenue or revenue, depending on whether transfer of control to customers has occurred.
Training revenue that meets the criteria to be accounted for separately is recognized when training is provided.
Remaining Performance Obligations
Remaining performance obligations represent contracted revenues that have not yet been recognized, and include billed deferred revenues, consisting of amounts invoiced to customers whether collected or uncollected which have not been recognized as revenues, as well as unbilled amounts that will be invoiced and recognized as revenues in future periods. The transaction price allocated to the remaining performance obligations are influenced by a variety of factors, including seasonality, timing of renewals, average contract terms and foreign currency rates. As of June 30, 2020, our remaining performance obligations were $68.6 million of which we expect to recognize $47.3 million and $21.3 million as revenue within one year and beyond one year, respectively.
We expect our remaining performance obligations to change quarterly for several reasons including the timing of new contracts and renewals, duration and size of our subscription and support arrangements, variable billing cycles and foreign exchange rate fluctuation. We typically issue renewal invoices in advance of the renewal service period. Depending on timing, the initial invoice and subsequent renewal invoices may occur in different quarters. This may result in an increase or decrease to our accounts receivable and deferred revenue.
Costs Capitalized to Obtain Revenue Contracts
Under Topic 606, we capitalize incremental costs to obtain non-cancelable subscription and maintenance and support revenue contracts with amortization periods that may extend longer than the non-cancelable subscription and maintenance and support revenue contract terms.
We capitalize incremental costs of obtaining a non-cancelable subscription and maintenance and support revenue contract with amortization periods of one year or more. The capitalized amounts consist primarily of sales commissions paid to our direct sales force. Capitalized amounts also include (i) amounts paid to employees other than the direct sales force who earn incentive payouts under annual compensation plans that are tied to the value of contracts acquired and (ii) the associated payroll taxes and fringe benefit costs associated with the payments to our employees.
Costs capitalized related to new revenue contracts are generally deferred and amortized on a straight-line basis over a period of benefit that we estimate to be five years. We determine the period of benefit by taking into consideration the
35
period from initial contract through renewal, which constitutes the length of our customer relationship or customer life. Amortization of costs capitalized related to new revenue contracts is included as a component of sales and marketing expense in our operating results. Under Topic 605, we capitalized only commissions earned on initial software and support sales which were amortized ratably over the initial contract period averaging two years.
Stock-Based Compensation
We account for stock-based compensation in accordance with Accounting Standards Codification (ASC) 718, Compensation — Stock Compensation. Under the fair value recognition provisions of ASC 718, stock-based compensation cost is measured at the grant date based on the fair value of the award and is recognized as an expense over the vesting period. Determining the fair value of the stock-based awards at the grant date requires significant judgment and the use of estimates, particularly surrounding Black-Scholes valuation assumptions such as stock price volatility and expected option lives. We determine the appropriate measure of expected volatility by reviewing historic volatility in the share price of our common stock, as adjusted for certain events that management deems to be non-recurring and non-indicative of future events. We base our estimate of expected life on the historical exercise behavior, cancellations of all past option grants made by us during the time period in which our common stock has been publicly traded, the contractual term, the vesting period and the expected remaining term of the option. Based on our historical experience of option pre-vesting cancellations, we have assumed an annualized 11.77% forfeiture rate for our options. We record additional expense if the actual forfeiture rate is lower than we estimated and record a recovery of prior expense if the actual forfeiture rate is higher than what we estimated.
Goodwill and Other Intangible Assets
We review goodwill annually for impairment or sooner whenever events or changes in circumstances indicate that it may be impaired. These events or circumstances could include a significant change in the business climate, legal factors, operating performance indicators, competition, or sale or disposition of a significant portion of a reporting unit. In addition, we evaluate purchased intangible assets to determine that all such assets have determinable lives. We operate under a single reporting unit and accordingly, all of our goodwill is associated with the entire company. We had no impairment for fiscal years ended June 30, 2020 and 2019.
Accounts Receivable and Allowance for Doubtful Accounts
We extend unsecured credit to customers on a regular basis. Our accounts receivable is derived from revenue earned from customers and are not interest bearing. We also maintain an allowance for doubtful accounts to reserve for potential uncollectible trade receivables. We review our trade receivables by aging category to identify specific customers with known disputes or collectability issues. We exercise judgment when determining the adequacy of these reserves as we evaluate historical bad debt trends, general economic conditions in the U.S. and internationally, and changes in customer financial conditions. If we make different judgments or utilize different estimates, then material differences may result in additional reserves for trade receivables, which would be reflected by charges in general and administrative expenses for any period presented. We write-off a receivable after all collection efforts have been exhausted and the amount is deemed uncollectible.
As described in Note 1 of Notes to Consolidated Financial Statements included in Item 8 Financial Statements and Supplementary Data of this Annual Report, certain Company contracts have contractual billings which do not coincide with revenue recognized on the contract. Unbilled accounts receivables are recorded when revenue recognized on the contract exceeds billings, pursuant to contract provisions, and become billable at contractually specified dates.
Tax Legislation
On December 22, 2017, the U.S. government enacted comprehensive tax legislation commonly referred to as the Tax Cuts and Jobs Act (Tax Act). The Tax Act revised the taxation of U.S. and multinational corporations which significantly reduced the statutory corporate U.S. federal income tax rate from 35% to 21%, imposed limitations on the ability of corporations to deduct interest expense and made taxation changes on U.S. multinational corporation’s foreign operations. The provisions of the Tax Act are complex and likely will be subject to regulatory and administrative guidance. The Tax Act includes a provision to tax global intangible low-taxed income (GILTI) of foreign subsidiaries and a base erosion anti-
36
abuse tax (BEAT) measure that taxes certain payments between a U.S. corporation and its foreign subsidiaries. For the fiscal year ended June 30, 2020, we have $3.2 million of GILTI income inclusion and used our net operating losses to offset our taxable income. For the fiscal year ended June 30, 2020, we did not incur any BEAT tax.
Fiscal Year 2020 Compared with Fiscal Year 2019
Our effective tax rate for fiscal years 2020 and 2019 was a tax provision rate of 9.7% and 16.7%, respectively. The change in our effective tax rate for fiscal year 2020 as compared to fiscal year 2019 was primarily due to the expiration of tax attributes, the change in valuation allowance, foreign rate differential, stock-based compensation and the research and development tax credit.
The income before income tax provision between the U.S. and foreign countries impacted our effective tax rate as a result of the geographic distribution and customer demand related to our products and services. In fiscal year 2020, our U.S. and foreign income before our income tax provision was $5.3 million and $2.7 million, respectively. In fiscal year 2019, our U.S. and foreign income before our income tax provision was $2.9 million and $2.1 million, respectively.
Deferred Tax Valuation Allowance
When we prepare our consolidated financial statements, we estimate our income tax liability for each of the various jurisdictions where we conduct business. This requires us to estimate our actual current tax exposure and to assess temporary differences that result from differing treatment of certain items for tax and accounting purposes. The net deferred tax assets are reduced by a valuation allowance if, based upon weighted available evidence, it is more likely than not that some or all of the deferred tax assets will not be realized. We make significant judgments to determine our provision for income taxes, our deferred tax assets and liabilities and any valuation allowance to be recorded against our net deferred tax assets. As of June 30, 2020, we had a valuation allowance of approximately $48.7 million of which approximately $42.6 million was attributable to U.S. and state net operating losses and domestic research and development credit carryforwards.
We apply ASC 740, Income Taxes, in determining any uncertain tax positions. The guidance seeks to reduce the diversity in practice associated with certain aspects of measurement and recognition in accounting for income taxes and prescribes a recognition threshold and measurement attribute for the financial statement recognition and measurement of a tax position that an entity takes or expects to take in a tax return. Additionally, ASC 740 provides guidance on de-recognition, classification, interest and penalties, accounting in interim periods, disclosure and transition. Under ASC 740, an entity may only recognize or continue to recognize tax positions that meet a “more likely than not” threshold. In accordance with our accounting policy, we recognize accrued interest and penalties related to unrecognized tax benefits as a component of other income (expense), net in the consolidated statements of operations.
We consider the earnings of certain non-U.S. subsidiaries to be indefinitely invested outside the United States, on the basis of estimates, that future domestic cash generation will be sufficient to meet future domestic cash needs and our specific plans for reinvestments of those subsidiary earnings. We have not recorded a deferred tax liability related to the U.S. state income taxes and foreign withholding taxes on approximately $17.1 million of undistributed earnings of foreign subsidiaries indefinitely invested outside the United States. If we decide to repatriate the foreign earnings, we would need to adjust our income tax provision in the period we determined that the earnings will no longer be indefinitely invested outside the United States.
Fair Value of Financial Instruments
Our financial instruments consist of cash and cash equivalents, restricted cash, accounts receivable, accounts payable and accrued liabilities. We do not have any derivative financial instruments. We believe the reported carrying amounts of these financial instruments approximate fair value, based upon their short-term nature and comparable market information available at the respective balance sheet dates.
37
Results of Operations
The following table sets forth certain items reflected in our consolidated statements of operations expressed as a percent of total revenue for the periods indicated:
|
| 2020 | |
| 2019 | |
Revenue: |
| | | | | |
Subscription |
| 91 | % | | 89 | % |
Professional services |
| 9 | | | 11 | |
Total revenue |
| 100 | | | 100 | |
Cost of revenue: | | | | | | |
Cost of subscription |
| 20 | | | 22 | |
Cost of professional services |
| 9 | | | 10 | |
Total cost of revenue |
| 29 | | | 32 | |
Gross profit |
| 71 | | | 68 | |
Operating Expenses: |
| | | | | |
Research and development |
| 23 | | | 21 | |
Sales and marketing |
| 27 | | | 26 | |
General and administrative |
| 11 | | | 13 | |
Total operating expenses |
| 61 | | | 60 | |
Income from operations |
| 10 | % | | 8 | % |
Revenue
We classify our revenue into two categories; subscription and professional services revenue. We further break down subscription revenue into SaaS revenue and legacy revenue, with SaaS revenue being a key metric.
The following table presents our subscription and professional services revenue during the fiscal years indicated:
| | Fiscal Year Ended June 30, | | | | | | ||||
|
| 2020 |
| 2019 | | Change | | ||||
Revenue | | (in thousands, except percentages) | |||||||||
Subscription | | $ | 66,129 | | $ | 60,013 | | $ | 6,116 | 10 | % |
Professional services | |
| 6,600 | |
| 7,219 | | | (619) | (9) | % |
Total revenue | | $ | 72,729 | | $ | 67,232 | | $ | 5,497 | | |
Total Revenue
Total revenue increased $5.5 million during the fiscal year ended June 30, 2020, from the comparable period in 2019, largely due to increased revenues from SaaS of $12 million in fiscal year 2020. This increase was partially offset by a decline in our legacy revenue as we continue to migrate legacy perpetual license customers to our SaaS model and a decline in professional service revenue as we continue to see a reduction in time required for an average implementation project, as a result of the improvements to our product deployment process.
Our revenue was impacted by foreign exchange rate fluctuation between the U.S. Dollar, Euro, and British Pound. We recalculate our current period results using the comparable prior period exchange rates to exclude the impact of foreign exchange rate fluctuation. Foreign exchange rate fluctuation resulted in a decrease of $722,000 and a decrease of $1.2 million in total revenue during the fiscal years ended June 30, 2020 and 2019, respectively.
38
Subscription Revenue
SaaS Revenue
| | Fiscal Year Ended June 30, | | | | | | ||||
|
| 2020 |
| 2019 |
| Change | | ||||
Revenue | | (in thousands, except percentages) | |||||||||
SaaS revenue | | $ | 56,793 | | $ | 44,788 | | $ | 12,005 | 27 | % |
Percentage of total revenue | |
| 78 | % |
| 67 | % | | | | |
SaaS revenue includes revenue from cloud delivery arrangements, term licenses and embedded OEM royalties and associated support. Revenues from SaaS increased by $12 million during the fiscal year ended June 30, 2020, as compared to the comparable period in 2019.
SaaS revenue was $56.8 million and $44.8 million during the fiscal years ended June 30, 2020 and 2019, respectively, which represented an increase of 27% or $12 million. SaaS revenue represents 78% and 67% of total revenue for the fiscal years ended June 30, 2020 and 2019, respectively.
Excluding a decrease of $493,000 due to foreign exchange rate fluctuation, SaaS revenue increased by $12.5 million during the fiscal year ended June 30, 2020, as compared to the comparable period in 2019. In connection with our SaaS transition, we are actively migrating our remaining perpetual license clients to SaaS and continue to sell SaaS to new customers. We expect our SaaS revenue to increase in future periods.
Legacy Revenue
| | Fiscal Year Ended June 30, | | | | | | ||||
|
| 2020 |
| 2019 |
| Change | | ||||
Revenue | | (in thousands, except percentages) | |||||||||
Legacy revenue | | $ | 9,336 | | $ | 15,225 | | $ | (5,889) | (39) | % |
Percentage of total revenue | |
| 13 | % |
| 23 | % |
| | | |
Legacy revenue is associated with license, maintenance and support contracts on perpetual license arrangements that we no longer sell. We experienced a decrease of $5.9 million for the fiscal year ended June 30, 2020. This decrease was primarily due to our focus on migrating our legacy customers to SaaS. We expect these legacy fees to continue to decline in future periods.
Legacy revenue was $9.3 million and $15.2 million during the fiscal years ended June 30, 2020 and 2019, respectively, which represented a decrease of 39% or $5.9 million. Legacy revenue represents 13% and 23% of total revenue for the fiscal years ended June 30, 2020 and 2019, respectively.
Excluding a decrease of $153,000 due to foreign exchange rate fluctuation, legacy revenue decreased by $5.7 million during the fiscal year ended June 30, 2020, as compared to the comparable period in 2019.
Professional Services Revenue
| | Fiscal Year Ended June 30, | | | | | | ||||
| | 2020 |
| 2019 |
| Change | | ||||
Revenue | | (in thousands, except percentages) | |||||||||
Professional services revenue | | $ | 6,600 | | $ | 7,219 | | $ | (619) | (9) | % |
Percentage of total revenue | |
| 9 | % |
| 11 | % |
| | | |
39
Professional services revenue includes consulting, implementation and training. Revenues from professional services decreased by $619,000 during the fiscal year ended June 30, 2020. These decreases were primarily due to continued improvements in our product deployment process resulting in a reduction in the time required for an average implementation project. As we continue to onboard new customers and migrate legacy customers to SaaS, we expect the time required for product deployment and implementation projects to decrease further.
Professional services revenue was $6.6 million during the fiscal year ended June 30, 2020, which represented a decrease of 9% or $619,000 from the comparable period in 2019. Professional services revenue represents 9% and 11% of total revenue for the fiscal years ended June 30, 2020 and 2019, respectively.
Excluding a decrease of $76,000 due to foreign exchange rate fluctuation, professional services revenues decreased by $543,000 during the fiscal year ended June 30, 2020, as compared to the comparable period in 2019.
Revenue by Geography
| | Fiscal Year Ended June 30, | | | | | | ||||
|
| 2020 |
| 2019 | | Change | | ||||
Revenue | | (in thousands, except percentages) | |||||||||
Domestic | | $ | 44,813 | | $ | 37,435 | | $ | 7,378 | 20 | % |
International | |
| 27,916 | |
| 29,797 | | | (1,881) | (6) | % |
Total revenue | | $ | 72,729 | | $ | 67,232 | | $ | 5,497 | | |
Revenue from domestic sales increased by 20% from $37.4 million during the fiscal year ended June 30, 2019 to $44.8 million during the fiscal year ended June 30, 2020 due to increases of (i) $11.6 million in SaaS revenue and (ii) $136,000 in professional services; offset by a decrease of $4.4 million in legacy revenue.
Revenue from international sales decreased by 6% from $29.8 million during the fiscal year ended June 30, 2019 to $27.9 million during the fiscal year ended June 30, 2020 due to decreases of (i) $1.5 million in legacy revenue and (ii) $756,000 in professional services revenue; offset by an increase of $381,000 in SaaS revenue.
Cost of Revenue
| | Fiscal Year Ended June 30, | | | | | | ||||
| | 2020 |
| 2019 |
| Change | | ||||
Cost of revenue | | (in thousands, except percentages) | |||||||||
Subscription | | $ | 14,398 | | $ | 14,976 | | $ | (578) | (4) | % |
Professional services | |
| 6,683 | |
| 6,865 | | | (182) | (3) | % |
Total cost of revenue | | $ | 21,081 | | $ | 21,841 | | $ | (760) | | |
Percentage of total revenue | |
| 29 | % |
| 32 | % |
| | | |
Gross margin | |
| 71 | % |
| 68 | % |
| | | |
Subscription
Cost of subscription revenues consist primarily of expenses related to our cloud services and support provided to customers. These expenses are comprised of cloud computing costs, personnel-related costs directly associated with cloud operations, and customer support, including salaries, benefits, bonuses and stock-based compensation and allocated overhead.
Cost of subscription revenues decreased by $578,000 during the fiscal year ended June 30, 2020. The decrease is primarily due to a decrease in personnel related costs of $1.1 million during the fiscal year ended June 30, 2020, from the comparable period in 2019, partially offset by an increase in cloud computing costs of $576,000 during the fiscal year ended June 30, 2020.
40
Excluding a decrease of $106,000 due to foreign exchange rate fluctuation, cost of subscription revenues decreased by $472,000 during the fiscal year ended June 30, 2020, from the comparable period in 2019. Excluding any future foreign exchange rate fluctuation, we expect our cost of subscription revenue to increase in absolute dollar terms as revenues increase but expect subscription revenue gross margins to improve or remain relatively consistent.
Professional Services
Cost of professional services consists primarily of personnel-related costs directly associated with our professional services and training departments, including salaries, benefits, bonuses, and stock-based compensation and allocated overhead.
Cost of professional services decreased $182,000 during the fiscal year ended June 30, 2020 from the comparable period in 2019. This decrease is primarily due to a decrease in outside consulting costs of $196,000 for the fiscal year ended June 30, 2020, partially offset by an increase in personnel-related costs of $101,000 during the fiscal year ended June 30, 2020.
Excluding a decrease of $86,000 due to foreign exchange rate fluctuation, cost of professional services revenue decreased by $96,000 for the fiscal year ended June 30, 2020, from the comparable period in 2019.
Operating Expenses
Research and Development
| | Fiscal Year Ended June 30, | | | | | | ||||
| | 2020 |
| 2019 |
| Change | | ||||
| | (in thousands, except percentages) | |||||||||
Research and development |
| $ | 16,638 |
| $ | 14,369 |
| $ | 2,269 | 16 | % |
Percentage of total revenue | |
| 23 | % |
| 21 | % |
| | | |
Research and development expense primarily consists of personnel-related expenses directly associated with our engineering, product management and development, and quality assurance staff. Included in these costs are salaries, benefits, bonuses, stock-based compensation and allocated overhead. Research and development expense also includes outside consulting services contracted for research and development, and amortization of intangible assets.
Research and development expense increased 16% to $16.6 million during the fiscal year ended June 30, 2020, from $14.4 million in the comparable period in 2019. Excluding a decrease of $160,000 due to foreign exchange rate fluctuation between the U.S. Dollar, Euro, British Pound and Indian Rupee, research and development expense increased primarily due to increases of (i) $2.5 million in personnel-related costs and (ii) $69,000 in outside consulting costs; principally offset by a decrease of $170,000 from intangible asset amortization.
Excluding any future foreign exchange rate fluctuation, we expect our research and development expense to increase in future periods based on our product development plans.
Sales and Marketing
| | Fiscal Year Ended June 30, | | | | | | ||||
| | 2020 |
| 2019 |
| Change | | ||||
| | (in thousands, except percentages) | |||||||||
Sales and marketing |
| $ | 19,623 |
| $ | 17,302 |
| $ | 2,321 | 13 | % |
Percentage of total revenue | |
| 27 | % |
| 26 | % |
| | | |
Sales and marketing expense primarily consists of personnel-related expenses directly associated with our sales, marketing and business development staff. Included in these costs are salaries, benefits, bonuses, and stock-based compensation and allocated overhead. Sales and marketing expenses also include amortization of commissions paid to our sales staff, lead generation activities, advertising, trade show and other promotional costs and, to a lesser extent, occupancy costs and related overhead.
41
Sales and marketing expenses increased 13% to $19.6 million during the fiscal year ended June 30, 2020, from $17.3 million in the comparable period in 2019. Excluding a decrease of $171,000 due to foreign exchange rate fluctuation between the U.S. Dollar, Euro, British Pound and Indian Rupee, sales and marketing expense increased primarily due to increases of (i) $2.5 million in personnel-related costs and (ii) $205,000 outside consulting services; partially offset by a decrease of $179,000 in marketing program costs.
Excluding any future foreign exchange rate fluctuation, we expect our sales and marketing expense to increase as a percentage of total revenue in future quarters based on our current business plan.
General and Administrative
| | Fiscal Year Ended June 30, | | | | | | ||||
| | 2020 |
| 2019 |
| Change | | ||||
| | (in thousands, except percentages) | |||||||||
General and administrative |
| $ | 7,981 |
| $ | 8,198 |
| $ | (217) | (3) | % |
Percentage of total revenue | |
| 11 | % |
| 13 | % |
| | | |
General and administrative expense primarily consists of personnel-related expenses directly associated with our finance, human resources, administrative and legal personnel. Included in these costs are salaries, benefits, bonuses, and stock-based compensation and allocated overhead. General and administrative expenses also include fees for professional services, provision for doubtful accounts and, to a lesser extent, occupancy costs and related overhead.
General and administrative expense decreased 3% to $8 million during the fiscal year ended June 30, 2020, from $8.2 million in the comparable period in 2019. Excluding a decrease of $61,000 due to foreign exchange rate fluctuation between the U.S. Dollar, Euro, British Pound and Indian Rupee, general and administrative expense decreased primarily due to decreases of (i) $290,000 in legal expenses; (ii) $131,000 in accounting, audit, and administrative expenses; and (iii) $31,000 in outside consulting costs; partially offset by increases of (a) $224,000 in personnel-related expenses; and (b) $70,000 in bad debt expenses.
Excluding any future foreign exchange rate fluctuation, we expect our general and administrative expense to increase or remain relatively consistent as a percentage of total revenue in future periods based on our current business plan.
Stock-Based Compensation
Stock-based compensation expense is accounted for in accordance with the provisions of the accounting guidance which requires the measurement and recognition of compensation expense for all equity-based payment awards made to employees, members of our board of directors and consultants, based upon the grant-date fair value of those awards. We value our share-based payments under ASC 718, and record compensation expense for all share-based payments made to employees based on the fair value at the date of the grant.
The effect of recording stock-based compensation for fiscal year 2020 and 2019 is as follows:
| | Fiscal Year Ended June 30, | ||||
| | 2020 |
| 2019 | ||
Stock-based compensation by type of award | | (in thousands) | ||||
Stock options |
| $ | 1,567 |
| $ | 1,318 |
Employee stock purchase plan | |
| 294 | |
| 305 |
Total stock-based compensation | | $ | 1,861 | | $ | 1,623 |
Determining the fair value of the equity-based payment awards at the grant date required significant judgment and the use of estimates, particularly surrounding the Black-Scholes valuation assumptions such as stock price volatility and expected option term.
42
Below is a summary of stock-based compensation included in the cost and expenses:
| | Fiscal Year Ended June 30, | | | | | | ||||
| | 2020 |
| 2019 |
| Change | | ||||
| | (in thousands, except percentages) | |||||||||
Cost of revenue |
| $ | 205 |
| $ | 323 |
| $ | (118) | (37) | % |
Research and development | |
| 706 | |
| 519 | |
| 187 | 36 | % |
Sales and marketing | |
| 551 | |
| 313 | |
| 238 | 76 | % |
General and administrative | |
| 399 | |
| 468 | |
| (69) | (15) | % |
Total stock-based compensation | | $ | 1,861 | | $ | 1,623 | | $ | 238 | 15 | % |
The increase in our stock-based compensation expense in fiscal year 2020 compared to fiscal year 2019 was primarily due to an increase in option grant activity.
We expect our stock-based compensation expense to increase or remain relatively constant in fiscal year 2021.
Income from Operations
| | Fiscal Year Ended June 30, | | | | | | ||||
| | 2020 |
| 2019 |
| Change | | | |||
| | (in thousands, except percentages) | |||||||||
Income from operations |
| $ | 7,406 |
| $ | 5,522 |
| $ | 1,884 | | |
Operating margin | |
| 10 | % |
| 8 | % |
| | | |
Results from operations was income of $7.4 million in fiscal year 2020, compared to $5.5 million in fiscal year 2019. We recorded a positive operating margin of 10% in fiscal year 2020, and 8% in fiscal year 2019.
The increase in operating income in fiscal year 2020 was primarily due to the growth of our cloud delivery business and the decline of costs associated with professional services, as we focused to reduce the time involved in implementation projects. During the fiscal year ended June 30, 2020, SaaS revenue increased by $12 million to $56.8 million compared to $44.8 million in fiscal year 2019.
Excluding a decrease from foreign exchange fluctuation of $584,000 the increase in total costs and operating expenses in fiscal year 2020 was primarily due to increases of (i) $4.3 million in personnel-related expenses; (ii) $576,000 in cloud computing costs; (iii) $70,000 in bad debt expenses; and (iv) $54,000 in outside consulting costs; partially offset by a decrease of (a) $290,000 in legal expenses; (b) $179,000 in marketing program costs; (c) $170,000 in intangible asset amortization; and (d) $131,000 in accounting, audit and administrative services.
Interest Income (Expense), Net
Interest income (expense), net consists primarily of interest earned on money market funds. Interest income (expense), net was income of $395,000 and expense of $319,000 in the fiscal years ended June 30, 2020 and 2019, respectively. In fiscal year 2020 we recognized interest income primarily due to interest earned on money market funds invested from our follow-on public offering from fiscal year 2019. We expect interest income to remain relatively constant in future periods.
Other Income (Expense), Net
Other income (expense), net was income of $185,000 and expense of $202,000 for the fiscal years ended June 30, 2020 and 2019, respectively. Other income (expense), net primarily included foreign exchange rate fluctuations on international trade receivables.
43
Income Tax Provision
Provision for income taxes consists of federal, state and foreign income taxes. Due to the current economic state of the U.S. economy, expiring tax attributes and uncertainty of future profitability, we maintain a valuation allowance against U.S. deferred tax assets as of June 30, 2020. We consider all available evidence, both positive and negative, including but not limited to earnings history, projected future outcomes, industry and market trends and the nature of each of the deferred tax assets. We recorded an income tax provision of $778,000 and $833,000 in the fiscal years ended June 30, 2020 and 2019, respectively, due to income taxes in profitable jurisdictions outside of the United States.
New Accounting Pronouncements
For information with respect to recent accounting pronouncements and the impact of these pronouncements on our consolidated financial statements, see Note 1 of Notes to Consolidated Financial Statements included in Item 8 Financial Statements and Supplementary Data of this Annual Report.
Liquidity and Capital Resources
Overview
At June 30, 2020, our principal sources of liquidity were cash and cash equivalents, and accounts receivable totaling $69.3 million. Our cash, cash equivalents and restricted cash were $46.6 million and $31.9 million as of June 30, 2020 and 2019, respectively.
Our working capital was $21.4 million as of June 30, 2020 compared to $13.9 million as of June 30, 2019. As of June 30, 2020, our deferred revenue was $41.5 million as compared to $36.5 million as of June 30, 2019.
In 2019, we sold 2.1 million shares of our common stock in a follow-on public offering. Shares were offered at a public offering price of $11.00 per share and we raised an aggregate $23.6 million before underwriter’s commission and expenses of $1.9 million.
Based upon our current business plan, we believe that existing capital resources will enable us to maintain current and planned operations for at least the next 12 months. From time to time, however, we may consider opportunities for raising additional capital. We can make no assurances that such opportunities will be available to us on economic terms we consider favorable, if at all.
Our expectations as to our future cash flows and our future cash balances are subject to a number of assumptions, including assumptions regarding anticipated increases in our revenue, our ability to retain existing customers and customer purchasing and payment patterns, many of which are beyond our control.
Cash Flows
For the fiscal years ended June 30, 2020 and 2019, our cash flows were as follows (in thousands):
| Fiscal Year Ended June 30, | ||||
| 2020 |
| 2019 | ||
Net cash provided by operating activities | $ | 14,058 | | $ | 6,954 |
Net cash used in investing activities | | (514) | | | (398) |
Net cash provided by financing activities | | 1,410 | | | 13,773 |
Cash provided by operating activities mainly consists of net income adjusted for non-cash expense items such as depreciation and amortization, expense associated with stock-based awards, the timing of employee related costs including costs capitalized to obtain revenue contracts, amortization of right-of-use assets, and changes in operating assets and liabilities during the year.
44
Cash provided by operating activities increased by $7.1 million during the fiscal year ended June 30, 2020, driven primarily by the timing of prepayments received from customers for new cloud arrangements and the renewal of existing cloud and support arrangements, which is our largest source of operating cash flows, as well as higher net income.
Net cash used in investing activities increased by $116,000 during the fiscal year ended June 30, 2020, driven primarily by activities related to the purchase of equipment for new employees and facility expenditures. Historically, cash used in investing activities has been used to purchase equipment and software to support our business and growth.
Net cash provided by financing activities decreased by $12.4 million during the fiscal year ended June 30, 2020, driven primarily by net proceeds received from the sale of our common stock in a follow-on public offering in fiscal year 2019; partially offset by an increase in bank borrowing payments in fiscal year 2019. Cash provided by financing activities in fiscal year 2020 principally consisted of proceeds from employee stock plans.
Commitments
Our principal commitments consist of obligations under leases for office space. Lease agreements are evaluated to determine whether an arrangement is or contains a lease in accordance with ASC 842, Leases.
The following table summarizes our contractual obligations as of June 30, 2020 and the effect such obligations are expected to have on its liquidity and cash flow in future periods (in thousands):
| | Payments Due by Period | |||||||||||||
| | | | | | | | | | | | | | ||
| | Total | | Less than 1 Year | | 1 - 3 Years | | 3 - 5 Years | | More than 5 Years | |||||
Operating leases |
| | 3,280 |
| | 1,858 |
| | 1,358 |
| | 64 |
| | — |
Total | | $ | 3,280 | | $ | 1,858 | | $ | 1,358 | | $ | 64 | | $ | — |
Off-Balance Sheet Arrangements
As of June 30, 2020, we had no significant off-balance sheet arrangements as defined in Item 303(a)(4) of Regulation S-K.
45
QUANTITATIVE AND QUALITATIVE DISCLOSURES ABOUT MARKET RISK |
Foreign Currency Exchange Risk
We develop products in the United States and India and sell these products in the United States and internationally. Generally, international sales are made in local currency. As a result, our financial results could be affected by factors such as changes in foreign currency exchange rates or weak economic conditions in foreign markets. Identifiable assets denominated in foreign currency as of June 30, 2020 and 2019 totaled approximately $17.7 million and $14.2 million. A 10% increase in the value of the dollar relative to other currencies would decrease the value of these assets by $1.8 million and $1.4 million respectively, as of June 30, 2020 and 2019. We do not currently use derivative instruments to hedge against foreign exchange risk. As such we are exposed to market risk from fluctuations in foreign currency exchange rates, principally from the exchange rate between the U.S. dollar and the Euro, the British pound and the Indian rupee. An unfavorable change in the foreign currency exchange rates may cause an adverse effect on our financial position or results of operations.
Interest Rate Risk
Our exposure to market risk for changes in interest rates relates primarily to interest earned on our cash and cash equivalents. The primary objective of our investment activities is to preserve our capital to fund operations. We also seek to maximize income from our investments without assuming significant risk. Our investment policy provides for investments in short-term, low-risk, investment-grade debt instruments. These investments are subject to interest rate risk and will decrease in value if market interest rates increase.
We currently do not hedge interest rate exposure, and we do not have any foreign currency or other derivative financial instruments. To date, we have not experienced a loss of principal on any of our investments. Although we currently expect that our ability to access or liquidate these investments as needed to support our business activities will continue, we cannot ensure that this will not change. We believe that, if market interest rates were to change immediately and uniformly by 10% from levels as of June 30, 2020 and 2019, the impact on the fair value of these securities or our cash flows or income would not be material.
46
ITEM 8. |
eGain Corporation
Consolidated Financial Statements
As of June 30, 2020 and 2019 and for the years ended June 30, 2020 and 2019
Index to Consolidated Financial Statements
47
REPORT OF INDEPENDENT REGISTERED PUBLIC ACCOUNTING FIRM
Board of Directors and Stockholders
eGain Corporation
Sunnyvale, California
Opinion on the Financial Statements
We have audited the accompanying consolidated balance sheets of eGain Corporation and subsidiaries (the “Company”) as of June 30, 2020 and 2019, and the related consolidated statements of operations, comprehensive income, stockholders’ equity, and cash flows for each of the two years in the period ended June 30, 2020 and the related notes and financial statement schedule listed in the index to this Annual Report on Form 10-K at Part IV Item 15(a)(2) (collectively referred to as the “consolidated financial statements”). In our opinion, the consolidated financial statements present fairly, in all material respects, the consolidated financial position of the Company as of June 30, 2020 and 2019, and the consolidated results of its operations and its cash flows for each of the two years in the period ended June 30, 2020, in conformity with accounting principles generally accepted in the United States of America.
Change in Accounting Principle
As discussed in Note 1 to the consolidated financial statements, the Company changed its method of accounting for leases in fiscal year ended June 30, 2020 due to the adoption of the new lease standard.
Basis for Opinion
These consolidated financial statements are the responsibility of the Company’s management. Our responsibility is to express an opinion on the Company’s consolidated financial statements based on our audits. We are a public accounting firm registered with the Public Company Accounting Oversight Board (United States) (PCAOB) and are required to be independent with respect to the Company in accordance with the U.S. federal securities laws and the applicable rules and regulations of the Securities and Exchange Commission and the PCAOB.
We conducted our audits in accordance with the standards of the PCAOB. Those standards require that we plan and perform the audit to obtain reasonable assurance about whether the consolidated financial statements are free of material misstatement, whether due to error or fraud. The Company is not required to have, nor were we engaged to perform, an audit of its internal control over financial reporting. As part of our audits, we are required to obtain an understanding of internal control over financial reporting, but not for the purpose of expressing an opinion on the effectiveness of the Company's internal control over financial reporting. Accordingly, we express no such opinion.
Our audits included performing procedures to assess the risks of material misstatement of the consolidated financial statements, whether due to error or fraud, and performing procedures that respond to those risks. Such procedures included examining, on a test basis, evidence regarding the amounts and disclosures in the consolidated financial statements. Our audits also included evaluating the accounting principles used and significant estimates made by management, as well as evaluating the overall presentation of the consolidated financial statements. We believe that our audits provide a reasonable basis for our opinion.
/s/ BPM LLP
We have served as the Company’s auditor since 2008.
San Jose, California
September 11, 2020
48
(in thousands, except per share amounts)
| | June 30, | ||||
|
| 2020 |
| 2019 | ||
ASSETS |
| | | | | |
Current assets: |
| | | | | |
Cash and cash equivalents | | $ | 46,609 | | $ | 31,860 |
Restricted cash | |
| 6 | |
| 7 |
Accounts receivable, less allowance for doubtful accounts of $384 and $320 as of June 30, 2020 and 2019, respectively | |
| 22,708 | |
| 20,411 |
Costs capitalized to obtain revenue contracts, net | |
| 1,066 | |
| 740 |
Prepaid expenses | | | 2,514 | | | 2,517 |
Other current assets | |
| 617 | |
| 1,054 |
Total current assets | |
| 73,520 | |
| 56,589 |
Property and equipment, net | |
| 713 | |
| 525 |
Operating lease right-of-use assets (Note 8) | | | 2,962 | | | — |
Costs capitalized to obtain revenue contracts, net of current portion | |
| 2,380 | |
| 1,777 |
Intangible assets, net | | | 26 | | | 294 |
Goodwill | |
| 13,186 | |
| 13,186 |
Other assets | |
| 918 | |
| 1,383 |
Total assets | | $ | 93,705 | | $ | 73,754 |
LIABILITIES AND STOCKHOLDERS' EQUITY | |
| | |
| |
Current liabilities: | |
| | |
| |
Accounts payable | | $ | 2,429 | | $ | 4,173 |
Accrued compensation | |
| 7,916 | |
| 5,480 |
Accrued liabilities | |
| 3,423 | |
| 2,353 |
Operating lease liabilities (Note 8) | | | 1,753 | | | — |
Deferred revenue | |
| 36,644 | |
| 30,688 |
Total current liabilities | |
| 52,165 | |
| 42,694 |
Deferred revenue, net of current portion | |
| 4,826 | |
| 5,801 |
Operating lease liabilities, net of current portion (Note 8) | | | 1,385 | | | — |
Other long-term liabilities | |
| 688 | |
| 952 |
Total liabilities | |
| 59,064 | |
| 49,447 |
Commitments and contingencies (Note 9) | |
| | |
| |
Stockholders' equity: | |
| | |
| |
Common stock, $0.001 par value - authorized: 50,000 shares; outstanding: 30,821 and 30,478 shares as of June 30, 2020 and 2019, respectively | |
| 31 | |
| 31 |
Additional paid-in capital | |
| 374,399 | |
| 371,099 |
Notes receivable from stockholders | |
| (90) | |
| (88) |
Accumulated other comprehensive loss | |
| (1,631) | |
| (1,459) |
Accumulated deficit | |
| (338,068) | |
| (345,276) |
Total stockholders' equity | |
| 34,641 | |
| 24,307 |
Total liabilities and stockholders' equity | | $ | 93,705 | | $ | 73,754 |
The accompanying notes are an integral part of these consolidated financial statements.
49
EGAIN CORPORATION
CONSOLIDATED STATEMENTS OF OPERATIONS
(in thousands, except per share information)
| | Years Ended June 30, | ||||
|
| 2020 |
| 2019 | ||
Revenue: | | | | | | |
Subscription | | $ | 66,129 | | $ | 60,013 |
Professional services | |
| 6,600 | |
| 7,219 |
Total revenue | |
| 72,729 | |
| 67,232 |
Cost of revenue: | | | | | | |
Cost of subscription | |
| 14,398 | |
| 14,976 |
Cost of professional services | |
| 6,683 | |
| 6,865 |
Total cost of revenue | |
| 21,081 | |
| 21,841 |
Gross profit | |
| 51,648 | |
| 45,391 |
Operating expenses: | |
| | |
| |
Sales and marketing | |
| 19,623 | |
| 17,302 |
Research and development | |
| 16,638 | |
| 14,369 |
General and administrative | |
| 7,981 | |
| 8,198 |
Total operating expenses | |
| 44,242 | |
| 39,869 |
Income from operations | |
| 7,406 | |
| 5,522 |
Interest income (expense), net | |
| 395 | |
| (319) |
Other income (expense), net | |
| 185 | |
| (202) |
Income before income tax provision | |
| 7,986 | |
| 5,001 |
Income tax provision | |
| (778) | |
| (833) |
Net income | | $ | 7,208 | | $ | 4,168 |
Per share information: | |
| | |
| |
Earnings per share: | | | | | | |
Basic | | $ | 0.24 | | $ | 0.15 |
Diluted | | $ | 0.23 | | $ | 0.14 |
Weighted-average shares used in computation: | | | | | | |
Basic | | $ | 30,620 | | $ | 28,579 |
Diluted | | $ | 31,956 | | $ | 30,363 |
Below is a summary of stock-based compensation included in the costs and expenses above: | | | | | | |
Cost of revenue | | $ | 205 | | $ | 323 |
Research and development | | $ | 706 | | $ | 519 |
Sales and marketing | | $ | 551 | | $ | 313 |
General and administrative | | $ | 399 | | $ | 468 |
The accompanying notes are an integral part of these consolidated financial statements.
50
EGAIN CORPORATION
CONSOLIDATED STATEMENTS OF COMPREHENSIVE INCOME
(in thousands)
| | Years Ended June 30, | ||||
|
| 2020 |
| 2019 | ||
Net income | | $ | 7,208 | | $ | 4,168 |
Other comprehensive income, net of taxes: | |
| | |
| |
Foreign currency translation adjustments | |
| (172) | |
| 159 |
Total comprehensive income | | $ | 7,036 | | $ | 4,327 |
The accompanying notes are an integral part of these consolidated financial statements.
51
EGAIN CORPORATION
CONSOLIDATED STATEMENTS OF STOCKHOLDERS’ EQUITY
(in thousands)
| | | | | | | | | | | | | | | | | | | | | |
|
| |
| | |
| | |
| Notes |
| Accumulated |
| | |
| | Total | |||
| | | | | | | Additional | | Receivable | | Other | | | | | Stockholders' | |||||
| | Common Stock | | Paid-in | | From | | Comprehensive | | Accumulated | | Equity | |||||||||
| | Shares | | Amount | | Capital | | Stockholders | | Loss | | Deficit | | (Deficit) | |||||||
BALANCES AS OF JULY 1, 2018 | | 27,667 | | | 28 | | | 346,222 | | | (85) | | | (1,618) | | | (353,260) | | | (8,713) | |
Cumulative-effect adjustment upon the modified retrospective adoption of ASU No. 2014-09 | | — | | | — | | | — | | | — | | | — | | | 3,816 | | | 3,816 | |
Interest on stockholder notes | | — | |
| — | |
| — | |
| (3) | |
| — | |
| — | |
| (3) | |
Issuance of common stock upon exercise of stock options | | 592 | |
| 1 | |
| 1,114 | |
| — | |
| — | |
| — | |
| 1,115 | |
Issuance of common stock in connection with employee purchase plans | | 70 | | | — | | | 422 | | | — | | | — | | | — | | | 422 | |
Issuance of common stock from public offering, net of issuance costs | | 2,149 | | | 2 | | | 21,718 | | | — | | | — | | | — | | | 21,720 | |
Stock-based compensation | | — | |
| — | |
| 1,623 | |
| — | |
| — | |
| — | |
| 1,623 | |
Foreign currency translation adjustments | | — | |
| — | |
| — | | | — | | | 159 | | | — | | | 159 | |
Net Income | | — | |
| — | |
| — | |
| — | |
| — | |
| 4,168 | |
| 4,168 | |
BALANCES AS OF JUNE 30, 2019 |
| 30,478 | | | 31 | | | 371,099 | | | (88) | | | (1,459) | | | (345,276) | | | 24,307 | |
Interest on stockholder notes | | — | |
| — | |
| — | |
| (2) | |
| — | |
| — | |
| (2) | |
Issuance of common stock upon exercise of stock options | | 210 | |
| — | |
| 543 | |
| — | |
| — | |
| — | |
| 543 | |
Issuance of common stock in connection with employee stock purchase plan | | 133 | | | — | | | 867 | | | — | | | — | | | — | | | 867 | |
True-up of issuance costs related to public offering | | — | |
| — | |
| 29 | |
| — | |
| — | |
| — | |
| 29 | |
Stock-based compensation | | — | |
| — | |
| 1,861 | |
| — | |
| — | |
| — | |
| 1,861 | |
Foreign currency translation adjustments | | — | | | — | | | — | | | — | | | (172) | | | — | | | (172) | |
Net income | | — | |
| — | |
| — | |
| — | |
| — | |
| 7,208 | |
| 7,208 | |
BALANCES AS OF JUNE 30, 2020 |
| 30,821 | | $ | 31 | | $ | 374,399 | | $ | (90) | | $ | (1,631) | | $ | (338,068) | | $ | 34,641 | |
The accompanying notes are an integral part of these consolidated financial statements.
52
CONSOLIDATED STATEMENTS OF CASH FLOWS
(in thousands)
| | Years Ended June 30, | ||||
|
| 2020 |
| 2019 | ||
Cash flows from operating activities: |
| | | | | |
Net income | | $ | 7,208 | | $ | 4,168 |
Adjustments to reconcile net income to net cash provided by operating activities: | |
| | |
| |
Amortization of intangible assets | | | 268 | | | 438 |
Amortization of costs capitalized to obtain revenue contracts | |
| 842 | |
| 663 |
Amortization of deferred financing costs | | | — | | | 241 |
Amortization of right-of-use assets | | | 1,540 | | | — |
Depreciation and amortization | |
| 304 | |
| 362 |
Provision for doubtful accounts | |
| 317 | |
| 253 |
Deferred income taxes | | | 261 | | | 357 |
Stock-based compensation | |
| 1,861 | |
| 1,623 |
(Gain) loss on disposal of property and equipment | | | (1) | | | 51 |
Changes in operating assets and liabilities: | |
| | |
| |
Accounts receivable | |
| (2,882) | |
| (13,270) |
Costs capitalized to obtain revenue contracts | |
| (1,812) | |
| (809) |
Prepaid expenses | |
| (122) | |
| (156) |
Other current assets | | | 401 | | | (774) |
Other non-current assets | |
| 175 | |
| (31) |
Accounts payable | |
| (1,740) | |
| 278 |
Accrued compensation | |
| 2,525 | |
| 159 |
Accrued liabilities | |
| 1,105 | |
| (240) |
Deferred revenue | |
| 5,272 | |
| 13,673 |
Operating lease liabilities | | | (1,640) | | | — |
Other long-term liabilities | |
| 176 | |
| (32) |
Net cash provided by operating activities | |
| 14,058 | |
| 6,954 |
Cash flows from investing activities: | |
| | |
| |
Purchases of property and equipment | |
| (514) | |
| (398) |
Net cash used in investing activities | |
| (514) | |
| (398) |
Cash flows from financing activities: | |
| | |
| |
Payments on bank borrowings | |
| (31) | |
| (16,901) |
Proceeds from bank borrowings | |
| 31 | |
| 7,459 |
Payments on capital lease obligations | |
| — | |
| (42) |
Proceeds from exercise of stock options | | | 543 | | | 1,115 |
Proceeds from employee stock purchase plan | | | 867 | | | 422 |
Proceeds from follow-on public offering, net of issuance costs | |
| — | |
| 21,720 |
Net cash provided by financing activities | |
| 1,410 | |
| 13,773 |
Effect of exchange rate differences on cash and cash equivalents | |
| (206) | |
| 34 |
Net increase in cash, cash equivalents and restricted cash | |
| 14,748 | |
| 20,363 |
Cash, cash equivalents and restricted cash at beginning of year | |
| 31,867 | |
| 11,504 |
Cash, cash equivalents and restricted cash at end of year | | $ | 46,615 | | $ | 31,867 |
| |
| | |
| |
Supplemental cash flow disclosures: | |
| | |
| |
Cash paid for interest | | $ | 2 | | $ | 230 |
Cash paid for taxes | | $ | 374 | | $ | 237 |
Non-cash items: | |
| | |
| |
Purchases of equipment through trade accounts payable | | $ | 10 | | $ | 4 |
The accompanying notes are an integral part of these consolidated financial statements.
53
EGAIN CORPORATION
NOTES TO CONSOLIDATED FINANCIAL STATEMENTS
1. SUMMARY OF BUSINESS AND SIGNIFICANT ACCOUNTING POLICIES
Organization and Nature of Business
eGain Corporation (“eGain”, the “Company”, “our”, “we” or “us”) is a leading provider of cloud-based customer engagement software with operations in the United States, United Kingdom and India. We help B2C brands operationalize digital customer engagement strategy. Our suite includes rich applications for digital interaction, knowledge management, and AI-based process guidance. We also provide advanced, integrated analytics for contact centers and digital properties to holistically measure, manage and optimize resources. We believe the benefits of our products include reduced customer effort, customer satisfaction, connected service processes, converted upsell opportunities, and improved compliance—across mobile, social, web, and phone. Hundreds of global enterprises rely on eGain to transform fragmented customer service systems into unified Customer Engagement Hubs.
Principles of Consolidation
The consolidated financial statements include the accounts of eGain and our wholly-owned subsidiaries, eGain Communications Ltd., Exony Limited (Exony), eGain Communications Pvt. Ltd., eGain Communications (SA), eGain France S.A.R.L, Netherlands (eGain Communications B.V.) and eGain Deutschland GmbH. All significant intercompany balances and transactions have been eliminated.
Follow-On Public Offering
In March 2019, we completed a follow-on public offering, in which we issued 2.0 million shares of our common stock at a public offering price of $11.00 per share. In April 2019, the underwriters exercised an over-allotment option to purchase 149,000 additional shares of our common stock. As of June 30, 2019, we received net proceeds of $21.7 million after deducting underwriting discounts and commissions of $1.6 million and other offering expenses of $282,000.
Business Combinations
Business combinations are accounted for at fair value under the purchase method of accounting. Acquisition costs are expensed as incurred and recorded in general and administrative expenses and changes in deferred tax asset valuation allowances and income tax uncertainties after the acquisition date affect income tax expense. The accounting for business combinations requires estimates and judgment as to expectations for future cash flows of the acquired business, and the allocation of those cash flows to identifiable intangible assets, in determining the estimated fair value for assets acquired and liabilities assumed. The fair values assigned to tangible and intangible assets acquired and liabilities assumed are based on management’s estimates and assumptions, as well as other information compiled by management, including valuations that utilize customary valuation procedures and techniques. If the actual results differ from the estimates and judgments used in these estimates, the amounts recorded in the consolidated financial statements could result in a possible impairment of the intangible assets and goodwill, or require acceleration of the amortization expense of finite-lived intangible assets.
54
Use of Estimates
The preparation of consolidated financial statements in conformity with accounting principles generally accepted in the United States of America requires management to make estimates and assumptions that affect the reported amounts of assets and liabilities, the disclosure of contingent assets and liabilities at the date of the consolidated financial statements and the reported amounts of revenue and expenses during the reporting period. The estimates are based upon information available as of the date of the consolidated financial statements. Actual results could differ from those estimates.
We evaluate our significant estimates, including those related to revenue recognition, provision for doubtful accounts, valuation of stock-based compensation, valuation of long-lived assets, valuation of deferred tax assets, and litigation, among others. We base our estimates on historical experience and on various other assumptions that are believed to be reasonable under the circumstances, the results of which form the basis for making judgments about the carrying values of assets and liabilities that are not readily apparent from other sources. We refer to accounting estimates of this type as “critical accounting estimates.”
Foreign Currency
The functional currency of each of our international subsidiaries is the local currency of the country in which it operates. Assets and liabilities of our foreign subsidiaries are translated at month-end exchange rates, and revenue and expenses are translated at the average monthly exchange rates. The resulting cumulative translation adjustments are recorded as a component of accumulated other comprehensive income. Foreign currency transaction gains and losses are included in “other income (expense), net” in the consolidated statements of operations, and resulted in a loss of $172,000 and $149,000, in fiscal years 2020 and 2019, respectively.
Cash and Cash Equivalents, Restricted Cash and Investments
We consider all highly liquid investments with an original purchase to maturity date of three months or less to be cash equivalents. Time deposits held for investments that are not debt securities are included in short-term investments in the consolidated balance sheets. Investments in time deposits with original maturities of more than three months but remaining maturities of less than one year are considered short-term investments. Investments held with the intent to reinvest or hold for longer than a year, or with remaining maturities of one year or more, are considered long-term investments. As of June 30, 2020 and 2019 we did not have any short-term or long-term investments.
Cash earmarked for a specific purpose and therefore not available for immediate and general use by the Company is considered restricted cash. Expected usage of restricted cash within one year is classified as a current asset; expected usage more than a year is considered a non-current asset. As of June 30, 2020 and 2019, our restricted cash was nominal.
Fair Value of Financial Instruments
Our financial instruments consist of cash and cash equivalents, restricted cash, accounts receivable, accounts payable and accrued liabilities. We do not have any derivative financial instruments. We believe the reported carrying amounts of these financial instruments approximate fair value, based upon their short-term nature and comparable market information available at the respective balance sheet dates.
Concentration of Credit Risk
Financial instruments that subject us to concentrations of credit risk consist principally of cash and cash equivalents and trade accounts receivable. Cash and cash equivalents and investments are deposited with high credit quality institutions. We are exposed to credit risk in the event of default by these institutions to the extent of the amount recorded on the balance sheet. We invest excess cash primarily in money market funds, which are highly liquid securities that bear minimal risk. In addition, we have investment policies and procedures that are reviewed periodically to minimize credit risk. Our cash, cash equivalents and restricted cash were $46.6 million as of June 30, 2020 and exceeded the FDIC (Federal Deposit Insurance Corporation) limits.
55
Our customer base extends across many different industries and geographic regions. Revenue is allocated to individual countries and geographic region by customer, based on where the product is shipped to and location of services performed. Cisco Systems, Inc. accounted for 18% and 17% of total revenue in fiscal years 2020 and 2019, respectively.
We perform ongoing credit evaluations of our customers with outstanding receivables and generally do not require collateral. In addition, we established an allowance for doubtful accounts based upon factors surrounding the credit risk of customers, historical trends and other information. One partner and customer accounted for 23% and 18% of accounts receivable as of June 30, 2020, respectively. Three customers accounted for 18%, 16%, and 15% of accounts receivable as of June 30, 2019.
Accounts Receivable and Allowance for Doubtful Accounts
We extend unsecured credit to our customers on a regular basis. Our accounts receivable are derived from revenue earned from customers and are not interest bearing. We also maintain an allowance for doubtful accounts to reserve for potential uncollectible trade receivables. We review our trade receivables by aging category to identify specific customers with known disputes or collectibility issues. We exercise judgment when determining the adequacy of these reserves as we evaluate historical bad debt trends, general economic conditions in the U.S. and internationally, and changes in customer financial conditions. If we made different judgments or utilized different estimates, material differences may result in additional reserves for trade receivables, which would be reflected by charges in general and administrative expenses for any period presented. We write off a receivable after all collection efforts have been exhausted and the amount is deemed uncollectible.
In certain Company contracts, contractual billings do not coincide with revenue recognized on the contract. Unbilled accounts receivables are recorded when revenue recognized on the contract exceeds billings, pursuant to contract provisions, and become billable upon certain criteria being met. Unbilled accounts receivables, for which the Company has the unconditional right to consideration, totaled $1.7 million and $1.4 million as of June 30, 2020 and 2019, respectively, and are included in the accounts receivable balance.
Property and Equipment
Property and equipment are stated at cost, net of accumulated depreciation and amortization. Depreciation is computed using the straight-line method over the estimated useful life of the respective assets, which typically is between three or five years. Leasehold improvements and leased equipment are depreciated on a straight-line basis over the shorter of the lease term or useful life of the asset, which is typically three to five years.
Goodwill and Other Intangible Assets
We review goodwill annually for impairment or sooner whenever events or changes in circumstances indicate that it may be impaired. These events or circumstances could include a significant change in the business climate, legal factors, operating performance indicators, competition, or sale or disposition of a significant portion of a reporting unit. In addition, we evaluate purchased intangible assets to determine that all such assets have determinable lives. We operate under a single reporting unit and accordingly, all of our goodwill is associated with the entire company. We had no impairment for fiscal years ended June 30, 2020 and 2019.
Impairment of Long-Lived Assets
We review long-lived assets for impairment, including property and equipment, whenever events or changes in business circumstances indicate that the carrying amounts of the assets may not be fully recoverable. An impairment loss is recognized when estimated undiscounted future cash flows expected to result from the use of the asset and its eventual disposition is less than its carrying amount. During fiscal years 2020 and 2019, we did not have any such losses.
56
Deferred Revenue
Deferred revenue primarily consists of payments received in advance of revenue recognition from cloud, term and ratable licenses, and maintenance and support services and is recognized as the revenue recognition criteria are met. We generally invoice customers in annual or quarterly installments. The deferred revenue balance does not represent the total contract value of annual or multi-year, non-cancelable cloud or maintenance and support agreements. Deferred revenue is influenced by several factors, including seasonality, the compounding effects of renewals, invoice duration, invoice timing and new business linearity within the quarter.
Deferred revenue that will be recognized during the succeeding twelve-month period is recorded as current deferred revenue and the remaining portion is recorded as noncurrent.
Cost Capitalized to Obtain Revenue Contracts
Under Topic 606, we capitalize incremental costs of obtaining non-cancelable subscription and support revenue contracts. The capitalized amounts consist primarily of sales commissions paid to our direct sales force. Capitalized amounts also include (i) amounts paid to employees other than the direct sales force who earn incentive payouts under annual compensation plans that are tied to the value of contracts acquired and (ii) the associated payroll taxes and fringe benefit costs associated with the payments to our employees.
Costs capitalized related to new revenue contracts are generally deferred and amortized on a straight-line basis over a period of benefit that we estimate to be five years. We determine the period of benefit by taking into consideration the historical and expected durations of our customer contracts, the expected useful lives of our technologies, and other factors. Commissions for renewal contracts relating to our cloud-based arrangements are expensed when incurred, as we do not consider renewal contracts to be commensurate with initial customer contracts. Historically, any commission associated with renewals have been immaterial. Amortization of costs to obtain revenue contracts is included as a component of sales and marketing expenses in our consolidated statements of operations.
During the fiscal year ended June 30, 2020 and 2019, we capitalized $1.8 million and $809,000 of costs to obtain revenue contracts, respectively, and amortized $842,000 and $663,000 to sales and marketing expense, respectively. Capitalized costs to obtain revenue contracts, net were $3.4 million and $2.5 million as of June 30, 2020 and June 30, 2019, respectively.
Deferred Financing Costs
Costs relating to obtaining the credit agreement (as amended from time to time, Credit Agreement) with Wells Fargo Bank, National Association, as administrative agent (Wells Fargo) were capitalized and amortized over the term of the related debt using the effective interest method. We capitalized deferred financing costs of $981,000 in connection with our term loan that has since been fully amortized. As of June 30, 2020, all financing costs have been charged to operations as interest expense in the prior fiscal year, in connection with the repayment of the term loan. No amortization of deferred financing costs was recorded to interest expense in fiscal year 2020. Amortization of deferred financing costs recorded as interest expense was $241,000 in fiscal year 2019.
Leases
Lease agreements are evaluated to determine whether an arrangement is or contains a lease in accordance with ASC 842, Leases.
Operating leases are included in operating lease right-of-use (ROU) assets, current operating lease liabilities, and noncurrent operating lease liabilities in the consolidated financial statements. ROU assets represent the Company’s right to use leased assets over the agreed upon term. Lease liabilities represent the Company’s contractual obligation to make lease payments over the lease term.
For operating leases, ROU assets and lease liabilities are recognized at the commencement date of the lease. The lease liability is measured as the present value of the lease payments over the lease term, using the rate implicit in the lease if readily determinable. If the rate implicit in the lease cannot be readily determined, the Company uses its incremental
57
borrowing rate at lease commencement. The operating lease right-of-use assets are calculated as the present value of the remaining lease payments plus unamortized initial direct costs and any prepayments, less unamortized lease incentives received.
Operating leases typically include non-lease components such as common-area maintenance costs. We have elected to include non-lease components with lease payments for the purpose of calculating lease right-of-use assets and liabilities, to the extent that they are fixed. Non-lease component payments that are not fixed are expensed as incurred as variable lease payments.
Lease terms may include renewal or extension options to the extent they are reasonably certain to be exercised. The assessment of whether renewal or extension options are reasonably certain to be exercised is made at lease commencement. Factors considered in determining whether an option is reasonably certain of exercise include, but are not limited to, the value of any leasehold improvements, the value of renewal rates compared to market rates, and the presence of factors that would cause a significant economic penalty to the Company if the option were not exercised. Lease expense is recognized on a straight-line basis over the lease term. The Company has elected not to recognize right-of-use assets and obligations for leases with an initial term of twelve months or less, and has applied a capitalization threshold to recognize a lease on the balance sheet. The expense associated with short-term leases and leases that do not meet the Company’s capitalization threshold are recorded to lease expense in the period it is incurred.
Software Development Costs
We account for software development costs in accordance with ASC 985, Software, for costs of the software to be sold, leased or marketed, whereby costs for the development of new software products and substantial enhancements to existing software products are included in research and development expense as incurred until technological feasibility has been established, at which time any additional costs are capitalized. Technological feasibility is established upon completion of a working model. To date, software development costs incurred in the period between achieving technological feasibility and general availability of software have not been material and have been charged to operations as incurred.
Advertising Costs
We expense advertising costs as incurred. Total advertising expenses for the fiscal years ended June 30, 2020 and 2019 were $221,000 and $150,000, respectively.
Stock-Based Compensation
We account for stock-based compensation in accordance with ASC 718, Compensation—Stock Compensation. Determining the fair value of the stock-based awards at the grant date requires significant judgment and the use of estimates, particularly surrounding Black-Scholes valuation assumptions such as stock price volatility and expected option term. Stock-based compensation expense for employee and non-employee awards is recognized as expense over the vesting period. Fair value for employee awards is measured as of the grant date. Fair value for non-employee awards is measured as of the grant date and is subsequently remeasured each reporting period.
Income Taxes
Income taxes are accounted for using the asset and liability method in accordance with ASC 740, Income Taxes. Under this method, deferred tax liabilities and assets are recognized for the estimated future tax consequences attributable to differences between the financial statement carrying amounts of existing assets and liabilities and their respective tax bases. For the legacy eGain business in the United States, based upon the weight of available evidence, which includes our historical operating performance, our future investment plans, and the uncertainty in the current market environment due to COVID-19, we have provided a full valuation allowance against our net deferred tax assets. For the legacy eGain business in the United Kingdom, based on the positive evidence, the Company has determined it would be able to utilize the deferred tax assets and does not have a valuation allowance against the deferred tax assets. The remaining eGain foreign operations as well as Exony’s business have historically been profitable and we believe it is more likely than not that those assets will be realized. Our tax provision primarily relates to foreign activities as well as state income taxes. Our income
58
tax rate differs from the statutory tax rates primarily due to the utilization of net operating loss carry-forwards which had previously been valued against as well as our foreign operations.
On December 22, 2017, the U.S. government enacted comprehensive tax legislation commonly referred to as the Tax Cuts and Jobs Act (Tax Act). The Tax Act revised the taxation of U.S. and multinational corporations which significantly reduced the statutory corporate U.S. federal income tax rate from 35% to 21%, imposed limitations on the ability of corporations to deduct interest expense and made taxation changes on U.S. multinational corporation’s foreign operations. The provisions of the Tax Act are complex and likely will be subject to regulatory and administrative guidance. The Tax Act includes a provision to tax global intangible low-taxed income (GILTI) of foreign subsidiaries and a base erosion anti-abuse tax (BEAT) measure that taxes certain payments between a U.S. corporation and its foreign subsidiaries. For the fiscal year ended June 30, 2020, we have $3.2 million of GILTI income inclusion and used our net operating losses to offset our taxable income. For the fiscal year ended June 30, 2020, we did not incur any BEAT tax.
We account for uncertain tax positions according to the provisions of ASC 740. ASC 740 contains a two-step approach for recognizing and measuring uncertain tax positions. Tax positions are evaluated for recognition by determining if the weight of available evidence indicates that it is probable that the position will be sustained on audit, including resolution of related appeals or litigation. Tax benefits are then measured as the largest amount which is more than 50% likely of being realized upon ultimate settlement. We consider many factors when evaluating and estimating tax positions and tax benefits, which may require periodic adjustments and which may not accurately anticipate actual outcomes.
As of June 30, 2020, we have completed a 382 study under Section 382 of the Internal Revenue Code, and have determined there was no loss of NOLs as a result of these changes. Utilization of the NOL or tax credit carryforwards to offset future taxable income and taxes, respectively, are subject to an annual limitation under the Internal Revenue Code of 1986 and similar state provisions, which is determined by first multiplying the value of the Company’s stock at the time of the ownership change by the applicable long-term, tax-exempt rate, and then could be subject to additional adjustments such as built in gain or built in loss, as required. Any limitation may result in expiration of all or a portion of its NOL and or tax credit carryforwards before utilization.
Comprehensive Income
We report comprehensive income and its components in accordance with ASC 220, Comprehensive Income. Under the accounting standards, comprehensive loss includes all changes in equity during a period except those resulting from investments by or distributions to owners. Total comprehensive income for each of the two years in the period ended June 30, 2020 is shown in the accompanying statements of comprehensive income. Accumulated other comprehensive income presented in the accompanying consolidated balance sheets as of June 30, 2020 and 2019 consist of accumulated foreign currency translation adjustments.
Net Income Per Common Share
Basic net income per common share is computed using the weighted-average number of shares of common stock outstanding. In periods where net income is reported, the weighted average number of shares is increased by warrants and options in the money to calculate diluted net income per common share.
The following table represents the calculation of basic and diluted net income per common share (in thousands, except per share data):
| | Years Ended June 30, | ||||
|
| 2020 |
| 2019 | ||
Net income applicable to common stockholders | | $ | 7,208 | | $ | 4,168 |
Basic net income per common share | | $ | 0.24 | | $ | 0.15 |
Weighted average common shares used in computing basic net income per common share | |
| 30,620 | |
| 28,579 |
Effect of dilutive common equivalents outstanding | |
| 1,336 | |
| 1,784 |
Weighted average common shares used in computing diluted net income per common share | |
| 31,956 | |
| 30,363 |
Diluted net income per common share | | $ | 0.23 | | $ | 0.14 |
59
Weighted average options to purchase 613,643 and 256,538 shares of common stock as of June 30, 2020 and 2019, respectively, were not included in the computation of diluted net income per common share due to their anti-dilutive effect. Such securities could have a dilutive effect in future periods.
Segment Information
We operate in one segment, the development, license, implementation and support of our customer service infrastructure software solutions. Operating segments are identified as components of an enterprise for which discrete financial information is available and regularly reviewed by our chief operating decision-maker in order to make decisions about resources to be allocated to the segment and assess its performance. Our chief operating decision-makers under ASC 280, Segment Reporting, are our executive management team. Our chief operating decision-makers review financial information presented on a consolidated basis for purposes of making operating decisions and assessing financial performance. Information relating to our geographic areas for the fiscal years ended June 30, 2020 and 2019 is as follows (in thousands):
|
| | |
| Operating |
| | | |
| | Total | | Income | | Long-Lived | |||
| | Revenue | | (Loss) | | Assets | |||
Year ended June 30, 2020: |
| | | | | | | | |
North America | | $ | 44,813 | | $ | 890 | | $ | 401 |
Europe, Middle East, & Africa | |
| 27,916 | |
| 11,944 | |
| 90 |
Asia Pacific | |
| — | |
| (5,428) | |
| 222 |
| | $ | 72,729 | | $ | 7,406 | | $ | 713 |
Year ended June 30, 2019: | |
| | |
| | |
| |
North America | | $ | 37,435 | | $ | 359 | | $ | 206 |
Europe, Middle East, & Africa | |
| 29,797 | |
| 10,290 | |
| 112 |
Asia Pacific | |
| — | |
| (5,127) | |
| 207 |
| | $ | 67,232 | | $ | 5,522 | | $ | 525 |
For the purposes of entity-wide geographic area disclosures, we define long-lived assets as hard assets that cannot be easily removed, such as property and equipment.
Recent Accounting Pronouncements
Pronouncements Not Yet Adopted
In August 2018, the Financial Accounting Standards Board (FASB) issued ASU 2018-15, Intangibles—Goodwill and Other—Internal-Use Software (Subtopic 350-40). This update requires a customer in a cloud computing service arrangement to follow the internal-use software guidance to determine which implementation costs to recognize and defer as an asset. This update is effective for fiscal years beginning after December 15, 2019 (our fiscal year 2021). We are currently evaluating the impact of this update on our consolidated financial statements and related disclosures.
In December 2019, FASB issued ASU 2019-12, Income Taxes (Topic 740): Simplifying the Accounting for Income Taxes. This update simplifies the accounting for income taxes. This update is effective for fiscal years beginning after December 15, 2020 (our fiscal year 2022). We are currently evaluating the impact of this update on our consolidated financial statements and related disclosures.
Pronouncements Recently Adopted
In February 2018, the FASB issued ASU 2018-02, Income Statement-Reporting Comprehensive Income (Topic 220): Reclassification of Certain Tax Effects from Accumulated Other Comprehensive Income. This update provides the option to reclassify tax effects to retained earnings relating to items in accumulated other comprehensive income that the FASB refers to as having been stranded in accumulated other comprehensive income as a result of the U.S. Tax Act.
60
We adopted this guidance as of our first quarter of fiscal year 2020 without a significant impact on our consolidated financial statements.
In June 2018, the FASB issued ASU 2018-07, Compensation—Stock Compensation (Topic 718)—Improvements to Nonemployee Share-Based Payment Accounting. This update expands the scope of Topic 718, Compensation—Stock Compensation, to include share-based awards granted to non-employees in exchange for goods or services. The accounting for employees and non-employees will be substantially aligned. We adopted this guidance as of our first quarter of fiscal year 2020 without a significant impact on our consolidated financial statements.
In July 2018, the FASB issued ASU No. 2018-11, Leases (Topic 842): Targeted Improvements, which provides an alternative transition method by allowing companies to initially apply the new leases guidance at the adoption date and recognize a cumulative-effect adjustment to the opening balance of retained earnings in the period of adoption. We adopted this guidance as of our first quarter of fiscal year 2020.
In February 2019, the FASB issued ASU No. 2019-01 Leases (Topic 842) Codification Improvements, which aligns the guidance for fair value of the underlying asset by lessors that are not manufacturers or dealers in Topic 842 with that of existing guidance. As a result, the fair value of the underlying asset at lease commencement is its cost. We adopted this guidance as of our first quarter of fiscal year 2020.
Leases
Effective July 1, 2019, the Company adopted the provisions and expanded disclosure requirements described in Topic 842. The Company adopted the standard under a modified retrospective approach, using the provision of ASU 2018-11, Leases (Topic 842) Targeted Improvements, which allows for the adoption of Topic 842 to be applied at the beginning of the fiscal year of adoption. As a result, the consolidated balance sheet and statement of operations for prior periods are not comparable to fiscal year 2020. In addition, the Company elected the package of practical expedients permitted under the transition guidance, which among other things, allowed the Company to not reassess prior conclusions on lease classifications or initial direct costs, or on whether contracts are or contain a lease. The Company did not use hindsight when determining the lease term.
Upon adoption, operating leases are now reported on the consolidated balance sheet, which has materially increased total assets and liabilities. As a result, the Company recorded operating lease right-of-use assets of approximately $4.5 million and corresponding operating lease liabilities of $4.8 million on its opening consolidated balance sheet.
| | Balance as of | | Adjustments due | | Balance as of | |||
Balance sheet captions: | | | | | | | | | |
Prepaid expenses | | | 2,517 | | | (114) | 1 | | 2,403 |
Total current assets | | | 56,589 | | | (114) | 1 | | 56,475 |
Operating lease right-of-use assets (Note 8) | | | — | | | 4,494 | 1,2,3 | | 4,494 |
Total assets | | | 73,754 | | | 4,380 | 1,2,3 | | 78,134 |
Accrued liabilities | | | 2,353 | | | (143) | 3 | | 2,210 |
Operating lease liabilities (Note 8) | | | — | | | 1,653 | 4 | | 1,653 |
Total current liabilities | | | 42,694 | | | 1,510 | 3, 4 | | 44,204 |
Operating lease liabilities, net of current portion (Note 8) | | | — | | | 3,104 | 4 | | 3,104 |
Other long-term liabilities | | | 952 | | | (234) | 4 | | 718 |
Total liabilities | | | 49,447 | | | 4,380 | 3,4 | | 53,827 |
Total liabilities and stockholders' equity | | | 73,754 | | | 4,380 | 3,4 | | 78,134 |
| 1. | Represents prepaid rent reclassified to operating lease right-of-use assets. |
| 2. | Represents capitalization of operating lease right-of-use assets. |
| 3. | Represents reclassification of deferred rent reclassified to operating lease right-of-use assets. |
| 4. | Represents recognition of operating lease liabilities. |
61
Revenue Recognition
Revenue Recognition Policy
Our revenue is comprised of two categories including subscription and professional services. Subscription includes SaaS revenue and legacy revenue. SaaS includes revenue from cloud delivery arrangements, term licenses and embedded OEM royalties and associated support. Legacy revenue is associated with license, maintenance and support contracts on perpetual license arrangements that we no longer sell. Professional services includes consulting, implementation and training.
Significant Judgment Applied in the Determination of Revenue Recognition
We enter into contractual arrangements with customers that may include promises to transfer multiple services, such as subscription, support and professional services. With respect to our business, a performance obligation is a promise to transfer a service to a customer that is distinct. Significant judgment is required to determine whether services are distinct
performance obligations that should be accounted for separately or combined as one unit of accounting. Additionally, significant judgment is required to determine the timing of revenue recognition.
We allocate the transaction price to each performance obligation on a relative standalone selling price basis (SSP). The SSP is the price at which we would sell a promised service separately to one of our customers. Judgment is required to determine the SSP for each distinct performance obligation.
We determine the SSP by considering our pricing objectives in relation to market demand. Consideration is placed based on our history of discounting prices, size and volume of transactions involved, customer demographics and geographic locations, price lists, contract prices and our market strategy.
Determination of Revenue Recognition
Under Topic 606, we recognize revenue upon the transfer of control of promised services to our customers in the amount that is commensurate with the consideration that we expect to receive in exchange for those services. If consideration includes a variable amount in the arrangement, such as service level credits or contingent fees, then we include an estimate of the amount that we expect to receive for the total transaction price.
The amount of revenue that we recognize is based on (i) identifying the contract with a customer; (ii) identifying the performance obligations in the contract; (iii) determining the transaction price; (iv) allocating the transaction price to the performance obligations in the contract on a relative SSP basis; and (v) recognizing revenue when, or as, we satisfy each performance obligation in the contract typically through delivery or when control is transferred to the customer.
Subscription Revenue
The following customer arrangements are recognized ratably over the contract term as the performance obligations are delivered:
| ● | Cloud delivery arrangements; |
| ● | Maintenance and support arrangements; and |
| ● | Term license subscriptions which incorporate on-premise software licenses and substantial cloud functionality that are not distinct in the context of our arrangements as such are considered highly interrelated and represent a single combined performance obligation. |
For contracts involving distinct software licenses, the license performance obligation is satisfied at a point in time when control is transferred to the customer.
62
We typically invoice our customers in advance upon execution of the contract or subsequent renewals with payment terms between 30 and 45 days. Invoiced amounts are recorded in accounts receivable, deferred revenue or revenue, depending if control transferred to our customers based on each arrangement.
The Company has a royalty revenue agreement with a customer related to the Company’s embedded intellectual property. Under the terms of the agreement, the customer is to provide a combined fixed fee, per agent, for each software license sold containing the embedded software to the Company. These embedded OEM royalties are included as subscription revenue. Under Topic 606 revenue guidance, since these arrangements are for sales-based licenses of intellectual property, for which the guidance in paragraph ASC 606-10-55-65 applies, the Company recognizes revenue only as the subsequent sale occurs. However, the Company notes that such sales are reported by the customer with a quarter in arrears, such revenue is recognized at the time it is reported and paid by the customer given that any estimated variable consideration would have to be fully constrained due to the unpredictability of such estimate and the unavoidable risk that it may lead to significant revenue reversals.
Professional Services Revenue
Professional services revenue includes system implementation, consulting and training. The transaction price is allocated to various performance obligations based on their stand-alone selling prices. Revenue allocated to each performance obligation is recognized at the earlier of satisfaction of discrete performance obligations, or as work is performed on a time and material basis. Our consulting and implementation service contracts are bid either on a time-and-materials basis or on a fixed-fee basis. Fixed fees are generally paid upon milestone billing or acceptance at pre-determined points in the contract. Amounts that have been invoiced are recorded in accounts receivable and in deferred revenue or revenue, depending on whether transfer of control to customers has occurred.
Training revenue that meets the criteria to be accounted for separately is recognized when training is provided.
2. BALANCE SHEET COMPONENTS
Property and equipment consists of the following:
| | As of June 30, | ||||
|
| 2020 |
| 2019 | ||
| | (in thousands) | ||||
Computers and equipment | | $ | 3,324 | | $ | 3,741 |
Furniture and fixtures | |
| 940 | |
| 1,077 |
Leasehold improvements | |
| 554 | |
| 542 |
Total | |
| 4,818 | |
| 5,360 |
Accumulated depreciation and amortization | |
| (4,105) | |
| (4,835) |
Property and equipment, net | | $ | 713 | | $ | 525 |
Depreciation and amortization expense was $304,000 and $362,000 for the fiscal years ended June 30, 2020 and 2019, respectively. Disposed fixed assets, which were substantially fully-depreciated, were $920,000 and $3.6 million for the years ended June 30, 2020, and 2019, respectively.
Accrued compensation consists of the following:
| | As of June 30, | ||||
|
| 2020 |
| 2019 | ||
| | (in thousands) | ||||
Accrued bonuses | | $ | 3,223 | | $ | 2,362 |
Accrued vacation | |
| 2,235 | |
| 1,840 |
Payroll and other employee related costs | |
| 1,745 | |
| 1,043 |
Accrued commissions | |
| 713 | |
| 235 |
Accrued compensation | | $ | 7,916 | | $ | 5,480 |
63
Accrued liabilities consists of the following:
| | As of June 30, | ||||
|
| 2020 |
| 2019 | ||
| | (in thousands) | ||||
Customer advances | | $ | 471 | | $ | 294 |
Sales tax payable | | | 672 | | | 411 |
VAT liability | |
| 848 | |
| 717 |
Accrued other liabilities | |
| 1,432 | |
| 931 |
Accrued liabilities | | $ | 3,423 | | $ | 2,353 |
3. REVENUE RECOGNITION
Disaggregation of Revenue
The following table presents our subscription and professional services revenue during the fiscal years ended June 30, 2020 and 2019, respectively:
| | Fiscal Year Ended June 30, | ||||
| | 2020 | | 2019 | ||
| | (in thousands) | ||||
Revenue: | | | | | | |
SaaS | | $ | 56,793 | | $ | 44,788 |
Legacy revenue | | | 9,336 | | | 15,225 |
Total subscription | | | 66,129 | | | 60,013 |
Professional services | | | 6,600 | | | 7,219 |
Total revenue | | $ | 72,729 | | $ | 67,232 |
The following table presents our revenue by geography. Revenue by geography is generally determined on the region of our contracting entity rather than the region of our customer. The relative proportion of our total revenues between each geographic region as presented in the table below was materially consistent across each of our operating segments’ revenues for the periods presented.
| | Fiscal Year Ended June 30, | ||||
| | 2020 | | 2019 | ||
| | (in thousands) | ||||
Revenue: | | | | | | |
North America | | $ | 44,813 | | $ | 37,435 |
EMEA | | | 27,916 | | | 29,797 |
Total Revenue | | $ | 72,729 | | $ | 67,232 |
Contract Balances
Contract assets, if any, consist of unbilled receivables for completed performance obligations which have not been invoiced, and for which we do not have an unconditional right to consideration. Contract liabilities consist of deferred revenue for which we have an obligation to transfer services to customers and have received consideration in advance or the amount is due from customers. Once the obligations are fulfilled, then deferred revenue is recognized to revenue in the respective period.
There were no contract assets for the years ended June 30, 2020 and 2019.
64
The following table presents the changes in contract liabilities (in thousands):
|
| Balance as of July 1, 2019 |
| Additions | | Deductions | | Balance as of June 30, 2020 | ||||
Contract liabilities: | | | | | | | | | | | | |
Deferred revenue | | | 30,688 | | | 78,381 | | | (72,425) | | | 36,644 |
Deferred revenue, net of current portion | |
| 5,801 | |
| — | |
| (975) | |
| 4,826 |
With respect to deferred revenue balances as of June 30, 2019, $32.5 million was recognized to revenue during fiscal year ended June 30, 2020.
Remaining Performance Obligations
Remaining performance obligations represent contracted revenues that had not yet been recognized, and include deferred revenues, invoices that have been issued to customers but were uncollected and have not been recognized as revenues, and amounts that will be invoiced and recognized as revenues in future periods. The transaction price allocated to the remaining performance obligation is influenced by a variety of factors, including seasonality, timing of renewals, average contract terms and foreign currency rates. As of June 30, 2020, our remaining performance obligations were $68.6 million of which we expect to recognize $47.3 million and $21.3 million as revenue within one year and beyond one year, respectively.
4. BANK BORROWINGS
On January 27, 2017, we entered into Amendment Number Two to the Credit Agreement, which further amended the Credit Agreement with Wells Fargo and the lenders party thereto dated November 21, 2014 (as amended, the Credit Agreement). The loan was secured by substantially all of our assets.
Our Credit Agreement and the obligations under the agreement matured on November 21, 2019. All remaining principal was paid prior to that date and all remaining deferred financing costs have been amortized to interest expense.
5. INCOME TAXES
Income before income tax provision consisted of the following (in thousands):
| | Fiscal Year Ended June 30, | ||||
|
| 2020 |
| 2019 | ||
United States |
| $ | 5,260 | | $ | 2,904 |
Foreign |
| | 2,726 | |
| 2,097 |
Income before income tax provision | | $ | 7,986 | | $ | 5,001 |
65
The following table reconciles the federal statutory tax rate to the effective tax rate of the income tax provision:
| | | Fiscal Year Ended June 30, | | |||
|
| | 2020 |
| | 2019 |
|
| | | | | | | |
Federal statutory income tax rate |
| | 21.0 | % | | 21.0 | % |
Current state taxes, net of federal benefit |
| | 3.3 |
| | 2.6 | |
Foreign rate differential |
| | (0.6) |
| | 3.6 | |
Research and development credits |
| | (0.6) | | | (7.5) | |
Foreign withholding tax |
| | 1.2 |
| | 0.5 | |
Stock-based compensation | | | (0.3) | | | (12.1) | |
Deferred return to provision | | | 0.7 | | | — | |
Other items |
| | 0.5 |
| | 9.0 | |
Net change in valuation allowance | | | (71.5) | | | (7.3) | |
Foreign income | | | 8.5 | | | 6.9 | |
Expiration of tax attributes |
| | 47.5 |
| | — | |
Effective tax rate |
| | 9.7 | % | | 16.7 | % |
The components of the income tax provision are as follows (in thousands):
| | Fiscal Year Ended June 30, | ||||
|
| 2020 |
| 2019 | ||
Current provision (benefit): |
| | | | | |
Foreign | | $ | 401 | | $ | 454 |
Federal | | | (12) | | | (62) |
State | |
| 128 | |
| 84 |
Total current: | |
| 517 | |
| 476 |
Deferred: | |
| | |
| |
Federal | | | 62 | | | 62 |
Foreign | |
| 199 | |
| 295 |
Total deferred: | |
| 261 | |
| 357 |
Income tax provision | | $ | 778 | | $ | 833 |
As of June 30, 2020, we had federal and state net operating loss carryforwards of approximately $163.6 million and $12.3 million, respectively. The net operating loss carryforwards will expire at various dates beginning in fiscal year ending June 30, 2021, if not utilized. We also had federal research and development credit carryforwards of approximately $3.5 million as of June 30, 2020, which will expire at various dates beginning in fiscal year ending June 30, 2021, if not utilized. The California research and development credit carryforwards are approximately $5.2 million as of June 30, 2020 and have an indefinite carryover period.
As of June 30, 2020, we have completed a 382 study under Section 382 of the Internal Revenue Code, and have determined there was no loss of NOLs as a result of these changes. Utilization of the NOL or tax credit carryforwards to offset future taxable income and taxes, respectively, are subject to an annual limitation under the Internal Revenue Code of 1986 and similar state provisions, which is determined by first multiplying the value of the Company’s stock at the time of the ownership change by the applicable long-term, tax-exempt rate, and then could be subject to additional adjustments such as built in gain or built in loss, as required. Any limitation may result in expiration of all or a portion of its NOL and or tax credit carryforwards before utilization.
Deferred tax assets and liabilities reflect the net tax effects of net operating loss and credit carryforwards and of temporary differences between the carrying amounts of assets and liabilities for financial reporting and the amounts used for income tax purposes.
66
Significant components of our deferred tax assets and liabilities for federal, state and foreign income taxes are as follows (in thousands):
| | As of June 30, | ||||
|
| 2020 |
| 2019 | ||
Deferred tax assets: | | | | | | |
Net operating loss carryforwards | | $ | 35,105 | | $ | 44,244 |
Research credits | |
| 7,525 | |
| 7,353 |
Deferred revenue | |
| 2,483 | |
| 1,596 |
Stock-based compensation | |
| 1,100 | |
| 802 |
Accruals and reserves | |
| 2,898 | |
| 1,044 |
Lease liability | | | 542 | | | — |
Other | |
| 56 | |
| 163 |
Gross deferred tax assets | |
| 49,709 | |
| 55,202 |
Less valuation allowance | |
| (48,700) | |
| (54,445) |
Net deferred tax assets | | $ | 1,009 | | $ | 757 |
Gross deferred tax liabilities | | | | | | |
Right-of-use asset | | $ | (500) | | $ | — |
Fixed assets | | | (20) | | | — |
Gross deferred tax liabilities | | | (520) | | | — |
Total deferred tax assets, net * | | $ | 489 | | $ | 757 |
| | | | | | |
*included in other assets on balance sheet | | | | | | |
ASC 740, Income Taxes, provides for the recognition of deferred tax assets if realization of such assets is more likely than not. For the legacy eGain business in the United States, based upon the weight of available evidence, which includes our historical operating performance and the reported cumulative net losses in prior years, we have provided a full valuation allowance against our U.S. net deferred tax assets. With respect to our foreign operations, we expect to utilize the deferred tax assets and have not placed a valuation allowance against them. Our tax provision primarily relates to foreign activities as well as state income taxes. Our income tax rate differs from the statutory tax rates primarily due to the utilization of net operating loss carryforwards which had previously been valued against, change in valuation allowance, stock-based compensation, research and development credits, and our foreign operations.
The net valuation allowance decreased by $5.7 million and $2.7 million for the fiscal years ended June 30, 2020 and 2019, respectively.
We have not provided for taxes on $17.1 million of undistributed earnings of our foreign subsidiaries as of June 30, 2020. It is our intention to reinvest such undistributed earnings indefinitely in our foreign subsidiaries. If we distribute these earnings, in the form of dividends or otherwise, we would be subject to withholding taxes payable to the foreign jurisdiction.
67
Uncertain Tax Positions
The aggregate changes in the balance of our gross unrecognized tax benefits during fiscal years 2020 and 2019 were as follows (in thousands):
| | Fiscal Year Ended June 30, | ||||
|
| 2020 |
| 2019 | ||
Beginning balance | | $ | 1,665 | | $ | 1,578 |
Increases in balances related to tax positions taken during current periods | |
| 26 | |
| 87 |
Ending balance | | $ | 1,691 | | $ | 1,665 |
There is no amount of unrecognized tax benefit, if recognized currently, that would impact the Company’s effective tax rate as of June 30, 2020 and 2019, respectively. No accrued interest and penalties have been recognized in the tax provision related to unrecognized tax benefits.
We do not anticipate the amount of existing unrecognized tax benefit to significantly increase or decrease during the next twelve months. Our policy is to record interest and penalties related to unrecognized tax benefits as income tax expense.
We file income tax returns in the United States as well as various state and foreign jurisdictions. In these jurisdictions, tax years between 2001 and 2019 remain subject to examination by the appropriate governmental agencies due to tax loss carryovers from those years.
6. STOCKHOLDERS’ EQUITY
Common Stock
We have reserved shares of common stock for issuance as of June 30, 2020 as follows:
|
| Reserved |
| | Stock |
| | Options |
Stock options outstanding |
| 2,885,966 |
Stock available for future grants or issuance: |
| |
2005 Stock Incentive Plan | | 1,073,386 |
2005 Management Stock Option Plan | | 68,649 |
2017 Employee Stock Purchase Plan | | 773,483 |
Total reserved shares of common stock for issuance |
| 4,801,484 |
Preferred Stock
We are authorized to issue 5,000,000 shares of preferred stock with a par value of $0.001 per share, and no shares of preferred stock are outstanding. Our board of directors has the authority, without further action by our stockholders, to issue up to 5,000,000 shares of preferred stock in one or more series and to fix the rights, preferences, privileges and restrictions thereof. These rights, preferences and privileges could include dividend rights, conversion rights, voting rights, terms of redemption, liquidation preferences, sinking fund terms and the number of shares constituting any series or the designation of such series, any or all of which may be greater than the rights of the common stock.
68
2005 Management Stock Option Plan
In May 2005, our board of directors adopted the 2005 Management Stock Option Plan (2005 Management Plan) which provides for the grant of non-statutory stock options to directors, officers and key employees of eGain and its subsidiaries. Our board extended the expiration date of the 2005 Management Plan to September 30, 2024. Options under the 2005 Management Plan are granted at a price not less than 100% of the fair market value of the common stock on the date of grant. Options granted under the 2005 Management Plan are subject to eGain’s right of repurchase, whose right shall lapse with respect to one-forty-eighth (1/48th) of the shares granted to a director, officer or key employee for each month of continuous service provided by such director, officer or key employee to eGain. The options granted under this plan are exercisable for up to ten years from the date of grant.
The following table represents the activity under the 2005 Management Plan:
|
| Shares |
| |
| | |
| | Available for | | Options | | Weighted | |
| | Grant | | Outstanding | | Average Price | |
Balance as of June 30, 2018 |
| 68,649 | | 1,492,125 | | $ | 3.51 |
Options Granted |
| — | | — | | $ | — |
Options Exercised |
| — | | (174,399) | | $ | 3.12 |
Options Forfeited / Expired |
| — | | — | | $ | — |
Balance as of June 30, 2019 |
| 68,649 | | 1,317,726 | | $ | 3.56 |
Options Granted | | — | | — | | $ | — |
Options Exercised | | — | | (39,209) | | $ | 2.89 |
Options Forfeited / Expired | | — | | — | | $ | — |
Balance as of June 30, 2020 | | 68,649 | | 1,278,517 | | $ | 3.58 |
2005 Stock Incentive Plan
In March 2005, our board of directors adopted the 2005 Stock Incentive Plan which provides for the grant of stock options to eGain’s employees, officers, directors and consultants. Our board extended the expiration date of the 2005 Stock Incentive Plan to September 30, 2024 and made certain other changes. Options granted under the 2005 Stock Incentive Plan are non-qualified stock options. Non-qualified stock options may be granted to employees with exercise prices of no less than the fair value of the common stock on the date of grant. The options generally vest ratably over a period of four years and expire no later than ten years from the date of grant.
The following table represents the activity under the 2005 Stock Incentive Plan:
|
| Shares |
| |
| Weighted | |
| | Available for | | Options | | Average | |
| | Grant | | Outstanding | | Price | |
Balance as of June 30, 2018 |
| 588,654 | | 1,680,734 | | $ | 2.90 |
Options Granted |
| (334,500) | | 334,500 | | $ | 9.58 |
Options Exercised |
| — | | (418,078) | | $ | 1.37 |
Options Forfeited / Expired |
| 93,549 | | (93,549) | | $ | 5.26 |
Balance as of June 30, 2019 |
| 347,703 | | 1,503,607 | | $ | 4.67 |
Shares Added | | 1,000,000 | | — | | $ | — |
Options Granted | | (350,125) | | 350,125 | | $ | 8.29 |
Options Exercised | | — | | (170,475) | | $ | 2.52 |
Options Forfeited / Expired | | 75,808 | | (75,808) | | $ | 6.40 |
Balance as of June 30, 2020 | | 1,073,386 | | 1,607,449 | | $ | 5.60 |
No shares were granted to consultants during the fiscal year ended June 30, 2020.
69
The following table summarizes information about stock options outstanding and exercisable under all stock option plans as of June 30, 2020:
| | | Options Outstanding | | Options Exercisable | ||||||||
| | | | | Weighted | | | | | | | | |
| Range of | | | | Average | | Weighted | | | | Weighted | ||
| Exercise | | Number of | | Remaining | | Average | | Number of | | Average | ||
| Prices |
| Shares |
| Contractual Life |
| Exercise Price |
| Shares |
| Exercise Price | ||
| $1.2-$2.13 | | 174,656 | | 5.93 | | $ | 1.73 | | 135,117 | | $ | 1.72 |
| $2.5-$2.5 | | 1,290,001 | | 6.26 | | $ | 2.50 | | 961,824 | | $ | 2.50 |
| $3.4-$5.28 | | 438,341 | | 4.71 | | $ | 4.26 | | 346,544 | | $ | 4.49 |
| $5.31-$6.65 | | 350,688 | | 5.40 | | $ | 6.32 | | 289,726 | | $ | 6.30 |
| $7.1-$7.96 | | 314,755 | | 8.71 | | $ | 7.86 | | 73,620 | | $ | 7.92 |
| $8.2-$12.15 | | 242,825 | | 8.86 | | $ | 10.17 | | 63,003 | | $ | 10.89 |
| $12.8-$12.8 | | 3,000 | | 7.96 | | $ | 12.80 | | 1,500 | | $ | 12.80 |
| $13.4-$13.4 | | 1,000 | | 3.36 | | $ | 13.40 | | 1,000 | | $ | 13.40 |
| $13.75-$13.75 | | 67,150 | | 8.04 | | $ | 13.75 | | 32,175 | | $ | 13.75 |
| $14.4-$14.4 | | 3,550 | | 8.12 | | $ | 14.40 | | 1,627 | | $ | 14.40 |
| $1.2-$14.4 | | 2,885,966 | | 6.43 | | $ | 4.71 | | 1,906,136 | | $ | 4.08 |
The summary of options vested and exercisable as of June 30, 2020 comprised:
| | |
| |
| | |
| Weighted | |
| | | | | | | | | Average | |
| | | | Weighted | | Aggregate | | Remaining | ||
| | Number of | | Average | | Intrinsic | | Contractual | ||
| | Shares | | Exercise Price | | Value | | Term | ||
Options outstanding |
| 2,885,966 | | $ | 4.71 | | $ | 18,749,416 | | 6.43 |
Fully vested and expected to vest options |
| 2,764,982 | | $ | 4.61 | | $ | 18,223,187 | | 6.35 |
Options exercisable |
| 1,906,136 | | $ | 4.08 | | $ | 13,523,577 | | 5.58 |
The aggregate intrinsic value in the preceding table represents the total intrinsic value based on stock options with a weighted average exercise price less than our closing stock price of $11.11 as of June 30, 2020 that would have been received by the option holders, had they exercised their options on June 30, 2020. The total intrinsic value of stock options exercised during fiscal years 2020 and 2019 was $1.3 million and $4.5 million, respectively.
Stock-Based Compensation
We account for stock-based compensation in accordance with ASC 718, Compensation—Stock Compensation. Under the fair value recognition provisions of ASC 718, stock-based compensation cost is measured at the grant date based on the fair value of the award and is recognized as expense over the vesting period. Stock-based compensation expense consists of expenses for stock options and our employee stock purchase plan (ESPP).
2017 Employee Stock Purchase Plan
In October 2017, our board of directors adopted the 2017 Employee Stock Purchase Plan (ESPP) which provided eligible employees the option purchase the Company’s common stock through payroll deductions at a price equal to 85% of the lower of the fair market value at the entry date of the applicable offering period or at the end of each applicable purchasing period. The offering period, meaning a period with respect to which the right to purchase shares of our common stock may be granted under the ESPP, will not exceed twenty-seven months and consist of a series of six-month purchase periods. Eligible employees may join the ESPP at the beginning of any six-month purchase period. Under the terms of the ESPP, employees can choose to have between 1% and 15% of their base earnings withheld to purchase the Company’s common stock.
70
Determining the fair value of the stock-based awards at the grant date requires significant judgment and the use of estimates, particularly surrounding Black-Scholes valuation assumptions such as stock price volatility and expected option term.
The table below summarizes the effect of stock-based compensation (in thousands):
| | Fiscal Year Ended June 30, | ||||
|
| 2020 |
| 2019 | ||
Non-cash stock-based compensation expense | | $ | (1,861) | | $ | (1,623) |
Income tax expense | |
| (56) | |
| — |
Net income effect | | $ | (1,917) | | $ | (1,623) |
The Company recognized $56,000 of tax expense related to stock-based compensation expense for eGain UK and Exony for the fiscal year ended June 30, 2020. The tax effect related to stock-based compensation in 2019 was nominal. There is no income tax effect that has been recognized relating to the stock-based compensation expense in the US due to full valuation allowance.
Total stock-based compensation includes expense related to non-employee awards of $120,000 and $138,000 during the fiscal years ended June 30, 2020 and 2019, respectively.
Total stock-based compensation includes expense related to the ESPP of $294,000 and $305,000 during the fiscal year ended June 30, 2020 and 2019, respectively.
We utilized the Black-Scholes valuation model for estimating the fair value of the stock-based compensation of options granted. All shares of our common stock issued pursuant to our stock option plans are only issued out of an authorized reserve of shares of common stock, which were previously registered with the Securities and Exchange Commission on a registration statement on Form S-8.
During the fiscal years ended June 30, 2020 and 2019, there were 350,125 and 334,500 options granted, respectively, with a weighted average fair value of $4.50 and $5.17, per share, respectively.
We used the following assumptions:
| | Fiscal Year Ended June 30, | | ||||
|
| | 2020 |
| | 2019 |
|
Dividend yield |
| | — | | | — | |
Expected volatility |
| | 70 | % | | 68 | % |
Average risk-free interest rate |
| | 1.37 | % | | 2.61 | % |
Expected life (in years) |
| | 4.33 | | | 4.36 | |
The fair value of the ESPP stock purchase right is estimated on the date of grant using the following weighted-average assumptions:
| | Fiscal Year Ended June 30, | | ||||
| | 2020 | | 2019 | | ||
Expected term (in years) | | | 0.50 | | | 0.48 | |
Volatility | | | 65 | % | | 87 | % |
Expected dividend | | | — | | | — | |
Risk-free interest rate | | | 1.88 | % | | 2.45 | % |
Fair Value of grants per share | | $ | 2.97 | | $ | 2.92 | |
During the fiscal year ended June 30, 2020, employees were granted the right to purchase an aggregate of 127,464 shares under the ESPP, and compensation expense related to those purchase rights for the fiscal year ended June 30, 2020 was $294,000. During the fiscal year ended June 30, 2020, 133,533 shares were purchased and 773,483 shares remain available to be purchased pursuant to the 2017 ESPP.
71
As of June 30, 2020 unrecognized compensation expense related to purchase rights that will be recognized over a weighted average period of 0.4 years was $172,000.
The dividend yield of zero is based on the fact that we have never paid cash dividends and have no present intention to pay cash dividends. We determined the appropriate measure of expected volatility by reviewing historic volatility in the share price of our common stock, as adjusted for certain events that management deemed to be non-recurring and non-indicative of future events. The risk-free interest rate is derived from the average U.S. Treasury Strips rate.
We base our estimate of expected life of a stock option on the historical exercise behavior, and cancellations of all past option grants made by the Company during the time period which its common stock has been publicly traded, the contractual term of the option, the vesting period and the expected remaining term of the outstanding options.
In accordance with Accounting Standards Updates (ASU) 2016-09, Compensation—Stock Compensation: Improvements to Employee Share-Based Accounting, we elected to continue to estimate forfeitures in the calculation of stock-based compensation expense.
Total compensation cost, net of forfeitures, for all options granted but not yet vested as of June 30, 2020 was $1.2 million which is expected to be recognized over the weighted average period of 1.13 years.
7. INTANGIBLE ASSETS
Intangible assets are amortized over the estimated lives, as follows (in thousands, except expected life):
| | | | | | | | | | | | | |
| | Gross | | | | | | | | | | Consolidated | |
| | Carrying | | Accumulated | | Net Balance | | | | Statements of Operations | |||
Intangible Asset |
| Amount |
| Amortization |
| June 30, 2020 |
| Life |
| Category | |||
Customer relationships - maintenance contracts | |
| 1,610 | |
| (1,584) | |
| 26 |
| 6 | | Cost of recurring |
| | $ | 1,610 | | $ | (1,584) | | $ | 26 | | | | |
| | | | | | | | | | | | | |
| | Gross | | | | | | | | | | Consolidated | |
| | Carrying | | Accumulated | | Net Balance | | | | Statements of Operations | |||
Intangible Asset |
| Amount |
| Amortization |
| June 30, 2019 |
| Life |
| Category | |||
Customer relationships - maintenance contracts | |
| 1,610 | |
| (1,316) | |
| 294 |
| 6 | | Cost of recurring |
| | $ | 1,610 | | $ | (1,316) | | $ | 294 | | | | |
Amortization expense related to the above intangible assets for fiscal year ended June 30, 2020 and 2019 was $268,000 and $438,000, respectively.
8. LEASES
We lease our office facilities under non-cancelable operating leases that expire on various dates through fiscal year 2024. Additionally, we are the sublessor for certain office space. All of our office leases are classified as operating leases with lease expense recognized on a straight-line basis over the lease term. Lease right-of-use assets and liabilities are recognized at the commencement date at the present value of lease payments over the lease term. As our leases do not provide an implicit rate, we use our incremental borrowing rate based on information available at the commencement date in determining the present value of lease payments.
72
The following table presents information about leases on our consolidated balance sheet (in thousands):
| | As of June 30, 2020 | |
Assets: | | | |
Operating lease right-of-use assets | | $ | 2,962 |
Liabilities: | | | |
Operating lease liabilities | |
| 1,753 |
Operating lease liabilities, net of current portion | |
| 1,385 |
The following table presents information about the weighted average lease term and discount rate as follows:
|
| As of June 30, 2020 | | |
Weighted average remaining lease term (in years) | | | 2.01 | |
Weighted average discount rate | | | 4.81 | % |
The following table presents information about leases on our consolidated statement of operations (in thousands):
| | Fiscal Year Ended | |
| | June 30, 2020 | |
Operating lease expense | | $ | 1,726 |
Short-term lease expense | | | 13 |
Sublease income | | | 618 |
The following table presents supplemental cash flow information about our leases (in thousands):
| | Fiscal Year Ended | |
| | June 30, 2020 | |
Operating cash outflows from operating leases | | $ | 1,809 |
Right-of-use assets obtained in exchange for new operating lease liabilities | | | — |
As of June 30, 2020, remaining maturities of lease liabilities are as follows (in thousands):
Fiscal Period: | | | |
Fiscal 2021 | | $ | 1,858 |
Fiscal 2022 | | | 1,165 |
Fiscal 2023 | |
| 193 |
Fiscal 2024 | |
| 64 |
Fiscal 2025 | | | — |
Thereafter | | | — |
Total minimum lease payments | | | 3,280 |
Less: Imputed interest | | | (142) |
Total | | $ | 3,138 |
73
9. COMMITMENTS AND CONTINGENCIES
Employee benefit plans
Defined Contribution Plans
We sponsor an employee savings and retirement plan, the 401(k) Plan, as allowed under Section 401(k) of the Internal Revenue Code. The 401(k) Plan is available to all domestic employees who meet minimum age and service requirements, and provides employees with tax deferred salary deductions and alternative investment options. Employees may contribute up to 60% of their salary, subject to certain limitations. We, at the discretion of our board of directors, may contribute to the 401(k) Plan. In fiscal years 2020 and 2019, we contributed approximately $463,000 and $464,000 to the 401(k) Plan, respectively. We also have a defined contribution plan related to our foreign subsidiaries. Amounts expensed under this plan were $466,000 and $441,000, for the fiscal years ended June 30, 2020 and 2019, respectively.
Gratuity Plan—India
In accordance with Gratuity Act of 1972, we sponsor a defined benefit plan (Gratuity Plan) for all of our India employees. The Gratuity Plan is required by local law, which provides a lump sum payment to vested employees upon retirement or termination of employment in an amount based on each employee’s salary and duration of employment with the Company. The Gratuity Plan benefit cost for the year is calculated on an actuarial basis. Current service costs and actuarial gains or losses, or prior service cost, for the Gratuity Plan were insignificant for the fiscal years 2020 and 2019.
Warranty
We generally warrant that the program portion of our software will perform substantially in accordance with certain specifications for a period up to one year from the date of delivery. Our liability for a breach of this warranty is either a return of the license fee or providing a fix, patch, work-around or replacement of the software.
We also provide standard warranties against and indemnification for the potential infringement of third party intellectual property rights to our customers relating to the use of our products, as well as indemnification agreements with certain officers and employees under which we may be required to indemnify such persons for liabilities arising out of their duties to us. The terms of such obligations vary. Generally, the maximum obligation is the amount permitted by law.
Historically, costs related to these warranties have not been significant. However, we cannot guarantee that a warranty reserve will not become necessary in the future.
Indemnification
We have agreed to indemnify our directors and executive officers for costs associated with any fees, expenses, judgments, fines and settlement amounts incurred by any of these persons in any action or proceeding to which any of those persons is, or is threatened to be, made a party by reason of the person’s service as a director or officer, including any action by us, arising out of that person’s services as our director or officer or that person’s services provided to any other company or enterprise at our request.
Transfer Pricing
We have received transfer-pricing assessments from tax authorities with regard to transfer pricing issues for certain fiscal years, which we have appealed with the appropriate authority. We review the status of each significant matter and assess its potential financial exposure. We believe that such assessments are without merit and would not have a significant impact on our consolidated financial statements.
74
Contractual Obligations and Commitments
Contractual agreements with third parties consist of software licenses, maintenance and support for our operations. As of June 30, 2020, we have paid all non-cancelable contractual agreements related to these software licenses. As of June 30, 2019, future payments for non-cancelable contractual agreements was $1.3 million.
We have no significant commitments related to co-location services for cloud operations as of June 30, 2020 and 2019.
10. LITIGATION
In the ordinary course of business, we are involved in various legal proceedings and claims related to alleged infringement of third-party patents and other intellectual property rights, commercial, corporate and securities, labor and employment, wage and hour, and other claims that are not expected to have a material impact. We have been, and may in the future be, put on notice and/or sued by third parties for alleged infringement of their proprietary rights, including patent infringement.
We evaluate all claims and lawsuits with respect to their potential merits, our potential defenses and counterclaims, settlement or litigation potential and the expected effect on us. Our technologies may be subject to injunction if they are found to infringe the rights of a third party. In addition, our agreements require us to indemnify our customers for third-party intellectual property infringement claims, which could increase the cost to us of an adverse ruling on such a claim.
11. FAIR VALUE MEASUREMENT
ASC 820, Fair Value Measurement and Disclosures, defines fair value, establishes a framework for measuring fair value of assets and liabilities, and expands disclosures about fair value measurements. Fair value is defined as the exchange price that would be received for an asset or paid to transfer a liability in the principal or most advantageous market for the assets or liabilities in an orderly transaction between market participants on the measurement date. Subsequent changes in fair value of these financial assets and liabilities are recognized in earnings or other comprehensive income when they occur. ASC 820 applies whenever other statements require or permit assets or liabilities to be measured at fair value.
ASC 820 includes a fair value hierarchy, of which the first two are considered observable and the last unobservable, that is intended to increase the consistency and comparability in fair value measurements and related disclosures. Valuation techniques used to measure fair value must maximize the use of observable inputs and minimize the use of unobservable inputs. Observable inputs reflect assumptions market participants would use in pricing an asset or liability based on market data obtained from independent sources while unobservable inputs reflect a reporting entity’s pricing based upon their own market assumptions.
The fair value hierarchy consists of the following three levels:
Level 1 – instrument valuations are obtained from real-time quotes for transactions in active exchange markets involving identical assets.
Level 2 – instrument valuations are obtained from readily-available pricing sources for comparable instruments.
Level 3 – instrument valuations are obtained without observable market value and require a high level of judgment to determine the fair value.
Our money market funds are measured at fair value on a recurring basis based on quoted market prices in active markets and are classified as level 1 within the fair value hierarchy. As of June 30, 2020 and 2019, cash equivalents classified as level 1 instruments were measured at $41.8 million and $29.2 million, respectively.
75
12. QUARTERLY FINANCIAL DATA (Unaudited)
Following is a summary of quarterly operating results and share data for the years ended June 30, 2020 and 2019, respectively:
| | 1st Quarter | | 2nd Quarter | | 3rd Quarter | | 4th Quarter | | Fiscal Year | |||||
| | (in thousands, except per share data) | |||||||||||||
Fiscal 2020 |
| | |
| | |
| | |
| | |
| | |
Revenue | | $ | 17,190 | | $ | 18,155 | | $ | 18,354 | | $ | 19,030 | | $ | 72,729 |
Gross profit | | $ | 11,875 | | $ | 12,911 | | $ | 12,854 | | $ | 14,007 | | $ | 51,648 |
Income from operations | | $ | 1,095 | | $ | 2,002 | | $ | 1,757 | | $ | 2,553 | | $ | 7,406 |
Net income | | $ | 1,217 | | $ | 1,973 | | $ | 1,867 | | $ | 2,151 | | $ | 7,208 |
Basic net income per share | | $ | 0.04 | | $ | 0.06 | | $ | 0.06 | | $ | 0.07 | | $ | 0.24 |
Diluted net income per share | | $ | 0.04 | | $ | 0.06 | | $ | 0.06 | | $ | 0.07 | | $ | 0.23 |
| |
| | |
| | |
| | |
| | |
| |
Fiscal 2019 |
| | |
| | |
| | |
| | |
| | |
Revenue | | $ | 15,701 | | $ | 17,704 | | $ | 17,004 | | $ | 16,823 | | $ | 67,232 |
Gross profit | | $ | 10,466 | | $ | 12,162 | | $ | 11,707 | | $ | 11,056 | | $ | 45,391 |
Income from operations | | $ | 753 | | $ | 2,129 | | $ | 1,789 | | $ | 851 | | $ | 5,522 |
Net income | | $ | 604 | | $ | 2,000 | | $ | 1,398 | | $ | 166 | | $ | 4,168 |
Basic net income per share | | $ | 0.02 | | $ | 0.07 | | $ | 0.05 | | $ | 0.01 | | $ | 0.15 |
Diluted net income per share | | $ | 0.02 | | $ | 0.07 | | $ | 0.05 | | $ | 0.01 | | $ | 0.14 |
76
CHANGES IN AND DISAGREEMENTS WITH ACCOUNTANTS ON ACCOUNTING AND FINANCIAL DISCLOSURE |
None.
CONTROLS AND PROCEDURES |
Evaluation of Disclosure Controls and Procedures.
We maintain “disclosure controls and procedures,” as such term is defined in Rule 13a-15(e) under the Securities Exchange Act of 1934 (Exchange Act), that are designed to ensure that information required to be disclosed by us in reports that we file or submit under the Exchange Act is recorded, processed, summarized, and reported within the time periods specified in Securities and Exchange Commission rules and forms, and that such information is accumulated and communicated to our management, including our Chief Executive Officer and Chief Financial Officer, as appropriate, to allow timely decisions regarding required disclosure. In designing and evaluating our disclosure controls and procedures, management recognized that disclosure controls and procedures, no matter how well conceived and operated, can provide only reasonable, not absolute, assurance that the objectives of the disclosure controls and procedures are met. Our disclosure controls and procedures have been designed to meet reasonable assurance standards. Additionally, in designing disclosure controls and procedures, our management necessarily was required to apply its judgment in evaluating the cost-benefit relationship of possible disclosure controls and procedures. The design of any disclosure controls and procedures also is based in part upon certain assumptions about the likelihood of future events, and there can be no assurance that any design will succeed in achieving its stated goals under all potential future conditions.
Based on their evaluation as of the end of the period covered by this Annual Report on Form 10-K, our Chief Executive Officer and Chief Financial Officer have concluded that, as of June 30, 2020, our disclosure controls and procedures were effective at the reasonable assurance level.
Changes in Internal Controls.
There was no change in our internal control over financial reporting (as defined in Rule 13a-15(f) under the Exchange Act) that occurred during our last fiscal quarter that has materially affected, or is reasonably likely to materially affect, our internal control over financial reporting.
Management’s Annual Report on Internal Control Over Financial Reporting.
Our management is responsible for establishing and maintaining adequate internal control over financial reporting, as such term is defined in Exchange Act Rules 13a-15(f). Because of its inherent limitations, internal control over financial reporting may not prevent or detect misstatements. Projections of any evaluation of the effectiveness to future periods are subject to the risk that controls may become inadequate because of changes in conditions, or that the degree of compliance with the policies or procedures may deteriorate. Our management, with the participation of our Chief Executive Officer and Chief Financial Officer, conducted an evaluation of the effectiveness of our internal control over financial reporting based on the framework in Internal Control—Integrated Framework (2013) issued by the Committee of Sponsoring Organizations of the Treadway Commission. Based on our evaluation under the framework in Internal Control—Integrated Framework (2013), our management concluded that our internal control over financial reporting was effective as of June 30, 2020.
OTHER INFORMATION |
None.
77
DIRECTORS, EXECUTIVE OFFICERS AND CORPORATE GOVERNANCE |
The information required by this item (with respect to our Directors) is incorporated by reference from the information under the heading “Election of Directors” contained in eGain’s definitive Proxy Statement to be filed with the Securities and Exchange Commission in connection with the solicitation of proxies for eGain’s 2020 Annual Meeting of Stockholders (Proxy Statement).
Certain information required by this item concerning executive officers is set forth in Part I, Item 1 of this report under the caption “Information About Our Executive Officers” and is incorporated herein by reference.
The information contained under the caption “Section 16(a) Beneficial Ownership Reporting Compliance” in the Proxy Statement is incorporated herein by reference.
EXECUTIVE COMPENSATION |
The information contained under the headings “Executive Compensation” and “Compensation Committee Report” and under the captions “Director Compensation” in the Proxy Statement is incorporated herein by reference.
SECURITY OWNERSHIP OF CERTAIN BENEFICIAL OWNERS AND MANAGEMENT AND RELATED STOCKHOLDER MATTERS |
The information contained under the heading “Security Ownership of Certain Beneficial Owners and Management” in the Proxy Statement is incorporated herein by reference.
The following table summarizes our equity compensation plans as of June 30, 2020:
|
| |
| | |
| Number of securities |
| | Number of | | | | | remaining available for |
| | securities to be | | Weighted-average | | future issuance under | |
| | issued upon exercise | | exercise price of | | equity compensation | |
| | of outstanding | | outstanding options | | plans (excluding securities | |
| | options and rights | | and rights | | reflected in column (a)) | |
Plan Category | | (a) | | (b) | | (c) | |
Equity compensation plans approved by security holders | | |
| | |
| |
2005 Stock Incentive Plan |
| 1,607,449 | | $ | 5.60 |
| 1,073,386 |
Equity compensation plans not approved by security holders | | | |
| |
| |
2005 Management Stock Option Plan |
| 1,278,517 | | $ | 3.58 |
| 68,649 |
Total |
| 2,885,966 | | $ | 4.71 |
| 1,142,035 |
78
Equity Compensation Plans Not Approved By Security Holders
2005 Management Stock Option Plan
In May 2005, our board of directors adopted the 2005 Management Stock Option Plan (2005 Management Plan), pursuant to which the Compensation Committee may grant non-qualified stock options to purchase up to 962,400 shares of eGain common stock, at an exercise price of not less than 100% of the fair market value of such common stock, to directors, officers and key employees of the Company and its subsidiaries. Options granted under the 2005 Management Plan are subject to vesting as determined by the Compensation Committee. The options are exercisable for up to ten years from the date of grant.
Our board of directors approved an increase of 500,000 shares of common stock authorized for issuance under the 2005 Management Plan in November 2007 and another increase of 500,000 shares of common stock authorized for issuance under the 2005 Management Plan in September 2011.
In September 2014, our board of directors approved an amendment to the 2005 Management Plan that increased the number of shares of common stock reserved for issuance by 1,000,000 shares from 1,962,400 shares to 2,962,400 shares and extended the expiration date of the of the 2005 Management Plan to September 30, 2024.
CERTAIN RELATIONSHIPS AND RELATED TRANSACTIONS AND DIRECTOR INDEPENDENCE |
The information contained under the captions “Related Party Transactions” and “Director Independence” in the Proxy Statement is incorporated herein by reference.
PRINCIPAL ACCOUNTING FEES AND SERVICES |
The information contained under the heading “Ratification of Independent Registered Public Accounting Firm” in the Proxy Statement is incorporated herein by reference.
79
EXHIBITS AND FINANCIAL STATEMENT SCHEDULES |
| (a) | 1. Financial Statements |
See Index to Consolidated Financial Statements in Item 8 of this report.
2. Financial Statement Schedule
The following schedule, which is filed as part of this Form 10-K: Schedule II—Valuation and Qualifying Accounts for the fiscal years ended June 30, 2020 and 2019.
SCHEDULE II—VALUATION AND QUALIFYING ACCOUNTS
Years Ended June 30, 2020 and 2019
(in thousands)
| | | | | | | | Amounts | | | | |
|
| Balance at |
| Additions |
| Written Off, |
| | ||||
| | Beginning of | | Charged to | | Net of | | Balance at | ||||
| | Period | | Expense | | Recoveries | | End of Period | ||||
Allowance for Doubtful Accounts: |
| | | | | | | | | | | |
Year ended June 30, 2020 | | $ | 320 | | $ | 317 | | $ | (253) | | $ | 384 |
Year ended June 30, 2019 | | $ | 256 | | $ | 253 | | $ | (189) | | $ | 320 |
All other financial statement schedules have been omitted because they are not applicable or not required or because the information in included elsewhere in the Consolidated Financial Statements or the Notes thereto.
3. Exhibits
See Item 15(b) of this report.
All other schedules have been omitted since they are either not required, not applicable or the information has been included in the consolidated financial statements or notes thereto.
| (b) | Exhibits |
The exhibits listed below are filed or incorporated by reference herein. Each management contract or compensatory plan or arrangement required to be filed has been identified.
Exhibit |
| Description of Exhibits |
| ||
3(i).1 | ||
| ||
3(i).2 | ||
| ||
3(ii) | ||
| ||
4.1 | ||
| ||
4.2 | Description of Securities Registered Pursuant to Section 12 of the Securities Exchange Act of 1934. | |
|
80
10.1# | ||
| ||
| ||
10.2# | ||
| ||
10.3# | ||
| ||
10.4# | ||
| ||
10.5# | ||
| ||
10.6 | ||
| ||
10.7 | ||
| ||
10.8 | ||
| | |
10.9 | ||
| | |
10.11 | | |
| | |
21.1 | ||
| | |
23.1 | | Consent of BPM LLP, Independent Registered Public Accounting Firm. |
| | |
31.1 | | |
| | |
31.2 | | |
| | |
32.1* | | |
| | |
32.2* | | |
| | |
101.INS | | XBRL Instance Document |
| | |
101.SCH | | XBRL Taxonomy Extension Schema Document |
| | |
101.CAL | | XBRL Taxonomy Extension Calculation Linkbase Document |
| | |
101.DEF | | XBRL Taxonomy Extension Definition Linkbase Document |
| | |
101.LAB | | XBRL Taxonomy Extension Label Linkbase Document |
| | |
101.PRE | | XBRL Taxonomy Extension Presentation Linkbase Document |
# | Indicates management contract or compensatory plan or arrangement. |
81
* | This exhibit is not deemed “filed” with the Securities and Exchange Commission and is not to be incorporated by reference into any filing of the Registrant under the Securities Act of 1933 or the Securities Exchange Act of 1934, whether made before or after date hereof and irrespective of any general incorporation language contained in such filing. |
(c) | Financial Statements |
Reference is made to Item 15(a)(2) above.
ITEM 16. |
Not applicable.
82
Pursuant to the requirements of Section 13 or 15(d) of the Securities Exchange Act of 1934, the registrant has duly caused this report to be signed on its behalf by the undersigned, thereunto duly authorized.
|
| eGain Corporation | ||
| | | | |
Date: September 11, 2020 |
| By: |
| /s/ ASHUTOSH ROY |
|
|
|
| Chief Executive Officer |
KNOW ALL MEN BY THESE PRESENT, that each person whose signature appears below constitutes and appoints Ashutosh Roy and Eric Smit, and each of them, his true and lawful attorneys-in-fact and agents, each with full power of substitution and resubstitution, for him and in his name, place, and stead, in any and all capacities, to sign any and all amendments to this annual report, and to file the same, with exhibits thereto and other documents in connection therewith, with the Securities and Exchange Commission, granting unto said attorneys-in-fact and agents, and each of them, full power and authority to do and perform each and every act and thing requisite and necessary to be done, as fully to all intents and purposes as he might or could do in person, hereby ratifying and confirming all that each of said attorneys-in-fact and agents or their substitute or substitutes may lawfully do or cause to be done by virtue hereof.
Pursuant to the requirements of the Securities Exchange Act of 1934, as amended, this report has been signed below by the following persons on behalf of the Registrant and in the capacities and on the dates indicated.
Name |
| Title |
| Date |
|---|---|---|---|---|
| | | | |
/s/ ASHUTOSH ROY |
| Chief Executive Officer and Director |
| September 11, 2020 |
Ashutosh Roy |
|
| ||
| | | | |
/s/ ERIC N. SMIT | | Chief Financial Officer | | September 11, 2020 |
Eric N. Smit | | (Duly Authorized Officer and Principal Financial | | |
| | | | |
/s/ CHRISTINE RUSSELL |
| Director |
| September 11, 2020 |
Christine Russell |
|
| ||
| | | | |
/s/ GUNJAN SINHA |
| Director |
| September 11, 2020 |
Gunjan Sinha |
|
| ||
| | | | |
/s/ PHIROZ P. DARUKHANAVALA |
| Director |
| September 11, 2020 |
Phiroz P. Darukhanavala |
|
| ||
| | | | |
/s/ BRETT SHOCKLEY | | Director |
| September 11, 2020 |
Brett Shockley |
|
| ||
| | | | |
83