Attached files
| file | filename |
|---|---|
| 8-K - FORM 8-K - TELLURIAN INC. /DE/ | tm2030136-1_8k.htm |
Exhibit 99.1

Corporate Presentation September 2020
Cautionary statements The information in this presentation includes “forward - looking statements” within the meaning of Section 27A of the Securities Act of 1933, as amended, and Section 21E of the Securities Exchange Act of 1934, as amended. All statements other than statements of historical fact are forward - looking statements. The words “anticipate,” “assume,” “believe,” “budget,” “estimate,” “expect,” “forecast,” “initial,” “intend,” “may,” “model,” “plan,” “potential,” “project,” “should,” “will,” “would,” and similar expressions are intended to identify forward - looking statements. The forward - looking statements in this presentation relate to, among other things, future contracts and contract terms, expected partners and customers, the parties’ ability to complete contemplated transactions (including, where applicable, to enter into definitive agreements related to those transactions), margins, returns and payback periods, future cash flows, production, delivery of LNG, liquefaction and regasification capacity additions, infrastructure growth, equity values, future costs, prices, financial results, liquidity and financing, including project financing, reaching FID, future demand and supply affecting LNG and general energy markets and other aspects of our business and our prospects and those of other industry participants. Our forward - looking statements are based on assumptions and analyses made by us in light of our experience and our perception of historical trends, current conditions, expected future developments, and other factors that we believe are appropriate under the circumstances. These statements are subject to numerous known and unknown risks and uncertainties which may cause actual results to be materially different from any future results or performance expressed or implied by the forward - looking statements. These risks and uncertainties include those described in the “Risk Factors” section of our Annual Report on Form 10 - K for the fiscal year ended December 31, 2019, and our other filings with the Securities and Exchange Commission, which are incorporated by reference in this presentation. Many of the forward - looking statements in this presentation relate to events or developments anticipated to occur numerous years in the future, which increases the likelihood that actual results will differ materially from those indicated in such forward - looking statements. Projected future cash flows as set forth herein may differ from cash flows determined in accordance with GAAP. We may not be able to complete the anticipated transactions described in the presentation. FID is subject to the completion of financing arrangements that may not be completed within the time frame expected or at all. Achieving FID will require substantial amounts of financing in addition to that contemplated by the agreements between Tellurian and each of Total and Petronet LNG discussed in this presentation, and Tellurian believes that it may enter into discussions with potential sources of such financing and Total and Petronet LNG in order to achieve commercial terms acceptable to all parties. Accordingly, each of the final agreements may have terms that differ significantly from those described in the presentation. The differences may significantly affect the projected financial information included in this presentation. The financial information included on slides 3, 4, 5, 6, 14, 18, 19, 20, 22, and 23 is meant for illustrative purposes only and does not purport to show estimates of actual future financial performance. The information on those slides assumes the completion of certain acquisition, financing and other transactions. Such transactions may not be completed on the assumed terms or at all. Actual commodity prices may vary materially from the commodity prices assumed for the purposes of the illustrative financial performance information. Estimates of “resources” and other non - proved reserves are subject to substantially greater risk than are estimates of proved reserves. The forward - looking statements made in or in connection with this presentation speak only as of the date hereof. Although we may from time to time voluntarily update our prior forward - looking statements, we disclaim any commitment to do so except as required by securities laws. Forward - looking statements 2

Notes: (1) EPC guaranteed capacity of 24.1 mtpa ; expected production of 27.6 mtpa . (2) See assumptions discussed in notes 2 and 3 on slide 22. . (3) NPV of $5 - 7 cash flow per share at commercial operations in 2026 discounted at 15% for the 40 - year life of the plant and assuming no terminal value. Tellurian value proposition (Nasdaq: TELL) Developing a global natural gas business around Driftwood LNG (“DWLNG”) 3 Driftwood LNG: a 27.6 mtpa LNG export terminal in Louisiana (1) Haynesville gas production: current asset 1.2 Tcf of resource; production 46 mmcf /d Pioneering management team that has built ~18% of global LNG capacity Deliver cleaner air, reduce carbon emissions & slow the pace of climate change Our business Tellurian investment case ~$2 bn of FCF at full operations of Driftwood LNG (2) ~$5 - $7 annual cash flow per share to TELL shareholders (2) Implied equity value of ~$14 - 19/share at FID (3)

Houston Gillis Haynesville Gas production FOB LNG < $3.50 Driftwood LNG Driftwood Pipeline Driftwood plans to deliver LNG < $3.50/ mmBtu 4 Supply gas < $3.50/ mmBtu FOB LNG price < $2.00 gas delivery + < $0.75 opex + < $0.75 debt service Low capital cost, low operating cost, integrated JV Fully integrated low - cost project ~$1,000/ tonne including LNG terminal, Driftwood pipeline, and upstream gas Haynesville gas is lower cost than Henry Hub < $2.00/ mmBtu gas delivered to plant regardless of Henry Hub market index price Partnership model ensures interest alignment JV partners own their share of the LNG at cost

Integrated model avoids price volatility Driftwood LNG is lower cost and has less price volatility than other LNG price indexes 5 Over a 10 - yr cycle, integrated Driftwood FOB price would have been ~40% less expensive than JKM netback or Henry Hub SPA - linked LNG 2010 - 2020 average LNG price $/ mmBtu JKM netback (1) $8.18 Henry Hub ($2.25 SPA) (2) $5.97 Driftwood FOB (3) $3.50 $8.18 $5.97 $3.50 $0.00 $2.00 $4.00 $6.00 $8.00 $10.00 JKM Henry Hub ($2.25 SPA) Driftwood FOB $/ mmBtu 2010 - 2020 average LNG price Sources: Bloomberg, Tellurian Research. Notes: (1) Reflects monthly JKM index less $1.75/ mmBtu of shipping. (2) SPA reflects a traditional U.S. Gulf Cost SPA with Henry Hub * 115% + fixed $2.25/ mmBtu liquefaction fee. (3) Projected Driftwood FOB price based on assumptions on slides 4 & 18.
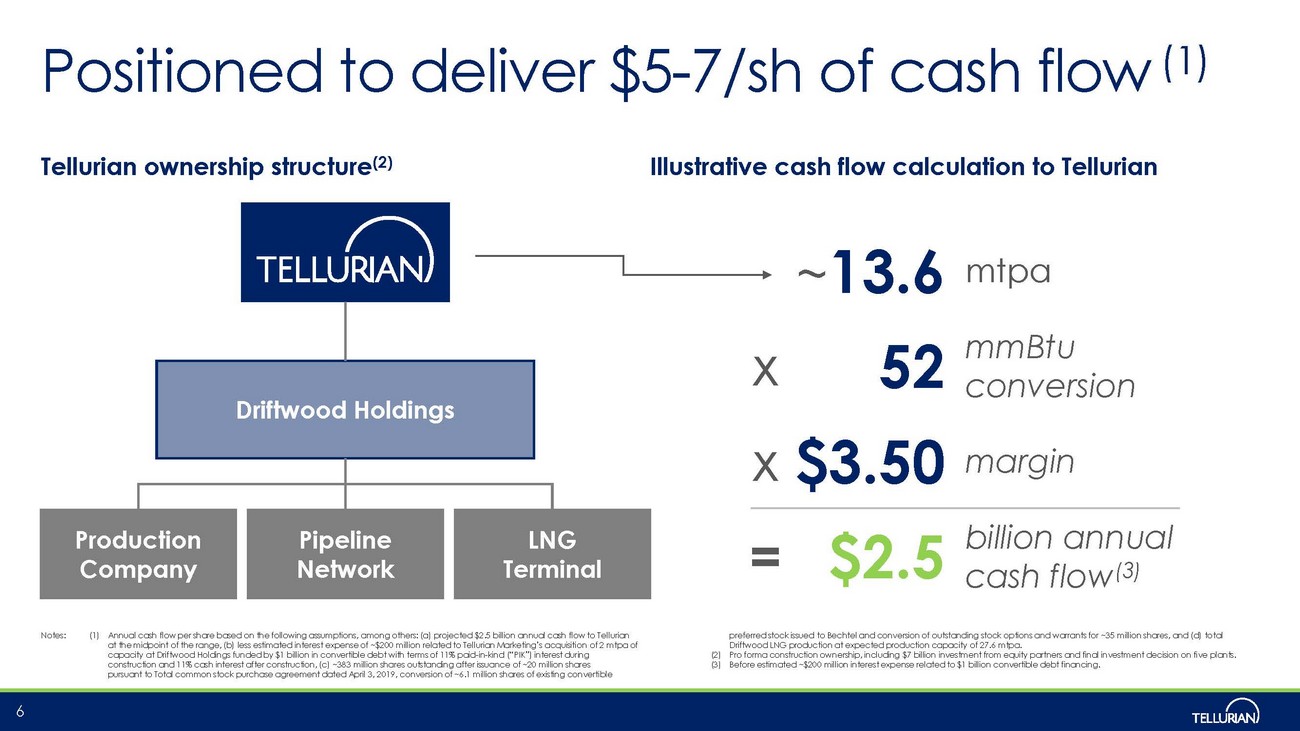
~ 13.6 mtpa x 52 mmBtu conversion x $3.50 margin = $2.5 billion annual cash flow (3) Tellurian ownership structure (2) Illustrative cash flow calculation to Tellurian Notes: (1) Annual cash flow per share based on the following assumptions, among others: (a) projected $2.5 billion annual cash flow to T ell urian at the midpoint of the range, (b) less estimated interest expense of ~$200 million related to Tellurian Marketing’s acquisiti on of 2 mtpa of capacity at Driftwood Holdings funded by $1 billion in convertible debt with terms of 11% paid - in - kind (“PIK”) interest during construction and 11% cash interest after construction, (c) ~383 million shares outstanding after issuance of ~20 million shar es pursuant to Total common stock purchase agreement dated April 3, 2019, conversion of ~6.1 million shares of existing converti bl e preferred stock issued to Bechtel and conversion of outstanding stock options and warrants for ~35 million shares, and (d) to ta l Driftwood LNG production at expected production capacity of 27.6 mtpa . (2) Pro forma construction ownership, including $7 billion investment from equity partners and final investment decision on fi ve plants. (3) Before estimated ~$200 million interest expense related to $1 billion convertible debt financing. 6 Production Company Pipeline Network LNG Terminal Driftwood Holdings Positioned to deliver $5 - 7/ sh of cash flow (1)

Haynesville value rises with Henry Hub Price volatility also proves value of upstream integration 7 Haynesville Shale & Tellurian acreage Rising Henry Hub prices call for additional supply Houston, TX Driftwood LNG Texas Louisiana Haynesville / Bossier Shale U.S. Gulf Coast $0.00 $1.00 $2.00 $3.00 $4.00 $5.00 2018 2019 2020 2021 2022 2023 $/ mmBtu Historic Price Fwd Price Fwd Price 6-months prior Tellurian holds 10,260 net acres in the Haynesville (1) 1.2 Tcf resource base 46 mmcf /d current production; 71 producing wells (21 operated) Haynesville targets have 140+ Tcf resource potential = Tellurian acreage Sources: MarketView, Tellurian Research. Notes: (1) As of end of 2Q 2020.

Premier site Fully - wrapped EPC contract All permits secured Financing Construction Driftwood LNG progress & catalyst roadmap 8 LNG market recovery ▪ LNG demand recovery from COVID - 19 ▪ JKM > $5/ mmBtu Commercial progress ▪ Henry Hub volatility shows value of upstream ▪ ~$1,000/ tonne capital costs for integrated project Phase I FID ▪ Announce new commercial agreements ▪ Secure project financing Driftwood LNG is shovel ready 2020 - 21 value creation catalysts Breaking news now

LNG market recovering from June bottom Sources: IHS CERA, Tellurian analysis. 9 Monthly global LNG trade and capacity million tonnes/month 35.3 25 27 29 31 33 35 37 39 Jan Feb Mar Apr May Jun Jul Aug Sep Oct Nov Dec 2020E LNG trade LNG production capacity at year end Expected % increase over prior year end million tonnes /month production capacity 36.3 37.3 37.8 2019 2020 2021 2020E export capacity 2019 LNG trade 2.8% 1.3%

China and India LNG demand resilient China and India LNG imports up ~8% and ~21%, respectively, through July YoY Source: IHS Markit. 10 Chinese LNG imports Indian LNG imports million tonnes/month million tonnes/month 6.6 4.4 4.4 4.3 4.7 4.8 4.8 5.3 5.0 4.2 6.4 6.4 6.3 4.1 4.4 5.3 5.8 5.1 5.5 0 1 2 3 4 5 6 7 Jan Feb Mar Apr May Jun Jul Aug Sep Oct Nov Dec 2019 2020 1.7 1.5 1.8 2.1 2.0 1.9 2.4 2.0 1.9 2.1 2.0 2.2 2.3 2.8 2.4 1.5 1.9 2.3 2.7 0 1 2 3 4 5 6 7 Jan Feb Mar Apr May Jun Jul Aug Sep Oct Nov Dec 2019 2020

Global increase in natural gas prices Strong recovery from low prices in April Source: MarketView. 11 JKM - Asia TTF - Europe Henry Hub - USA $2 $3 $4 $5 $6 $7 Oct-20 Feb-21 Jun-21 Oct-21 Feb-22 Jun-22 Oct-22 Feb-23 Jun-23 Oct-23 August Forwards April Forwards $2 $3 $4 $5 $6 $7 Oct-20 Feb-21 Jun-21 Oct-21 Feb-22 Jun-22 Oct-22 Feb-23 Jun-23 Oct-23 August Forwards April Forwards $2 $3 $4 $5 $6 $7 Oct-20 Feb-21 Jun-21 Oct-21 Feb-22 Jun-22 Oct-22 Feb-23 Jun-23 Oct-23 August forwards April Forwards 31% price increase

Entering 5 - year starvation; expect rising price Sources: Wood Mackenzie, Tellurian analysis. Note: (1) Capacity additions for projects that have reached FID only. 12 13 4 (0) 5 8 26 29 30 39 22 10 4 10 11 18 34 1 (5) -- (14) 2011 2012 2013 2014 2015 2016 2017 2018 2019 2020 2021 2022 2023 2024 2025 2026 2027 2028 2029 2030 ~146 mtpa capacity additions 8.3% per annum Limited capacity additions (1) 0.8% per annum Global liquefaction capacity additions (mtpa) ~53 mtpa capacity additions 2.3% per annum ~30 mtpa capacity additions 1.6% per annum $14.04 $15.12 $16.54 $13.85 $7.45 $5.73 $7.13 $9.74 $5.49 JKM annual average: Expected delays
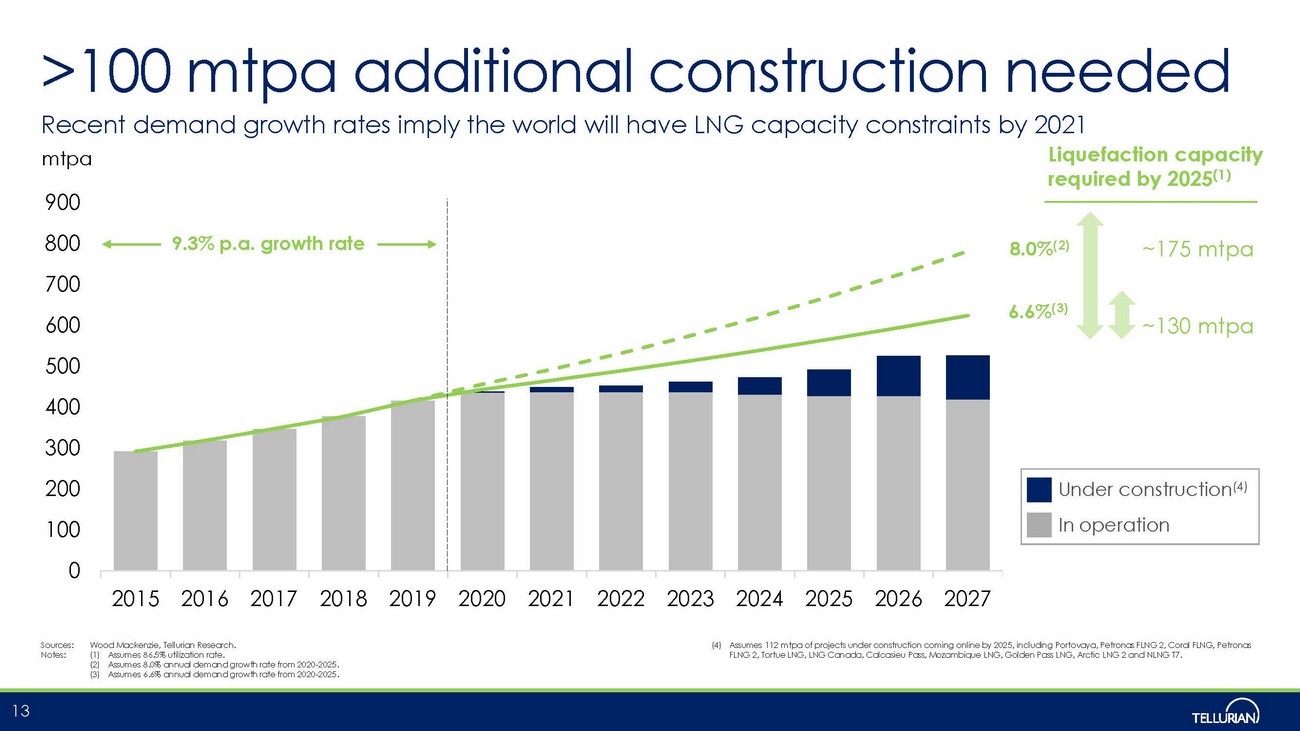
>100 mtpa additional construction needed Recent demand growth rates imply the world will have LNG capacity constraints by 2021 Sources: Wood Mackenzie, Tellurian Research. Notes: (1) Assumes 86.5% utilization rate. (2) Assumes 8.0% annual demand growth rate from 2020 - 2025. (3) Assumes 6.6% annual demand growth rate from 2020 - 2025. (4) Assumes 112 mtpa of projects under construction coming online by 2025, including Portovaya , Petronas FLNG 2, Coral FLNG, Petronas FLNG 2, Tortue LNG, LNG Canada, Calcasieu Pass, Mozambique LNG, Golden Pass LNG, Arctic LNG 2 and NLNG T7. 13 Liquefaction capacity required by 2025 (1) 8.0% (2) 6.6% (3) ~130 mtpa ~175 mtpa mtpa Under construction (4) In operation 0 100 200 300 400 500 600 700 800 900 2015 2016 2017 2018 2019 2020 2021 2022 2023 2024 2025 2026 2027 9.3% p.a. growth rate

Key investment highlights x Driftwood LNG is shovel ready, all permits secured x Engineering ~30% complete, >$150 mm invested in EPC x Phase I low - cost capital ~$1,000/ tonne x LNG delivered FOB U.S. Gulf Coast <$3.50/ mmBtu to maximize margins in growing LNG market x Premier management team with performance track record 14

Social media Contact us ▪ Matt Phillips Director, Investor Relations & Finance +1 832 320 9331 matthew.phillips@tellurianinc.com ▪ Joi Lecznar SVP, Public Affairs & Communication +1 832 962 4044 joi.lecznar@tellurianinc.com 15 @TellurianLNG ▪ Johan Yokay Manager, Investor Relations & Finance +1 832 320 9327 johan.yokay@tellurianinc.com

Appendix: Driftwood LNG Project & Financial Details 16
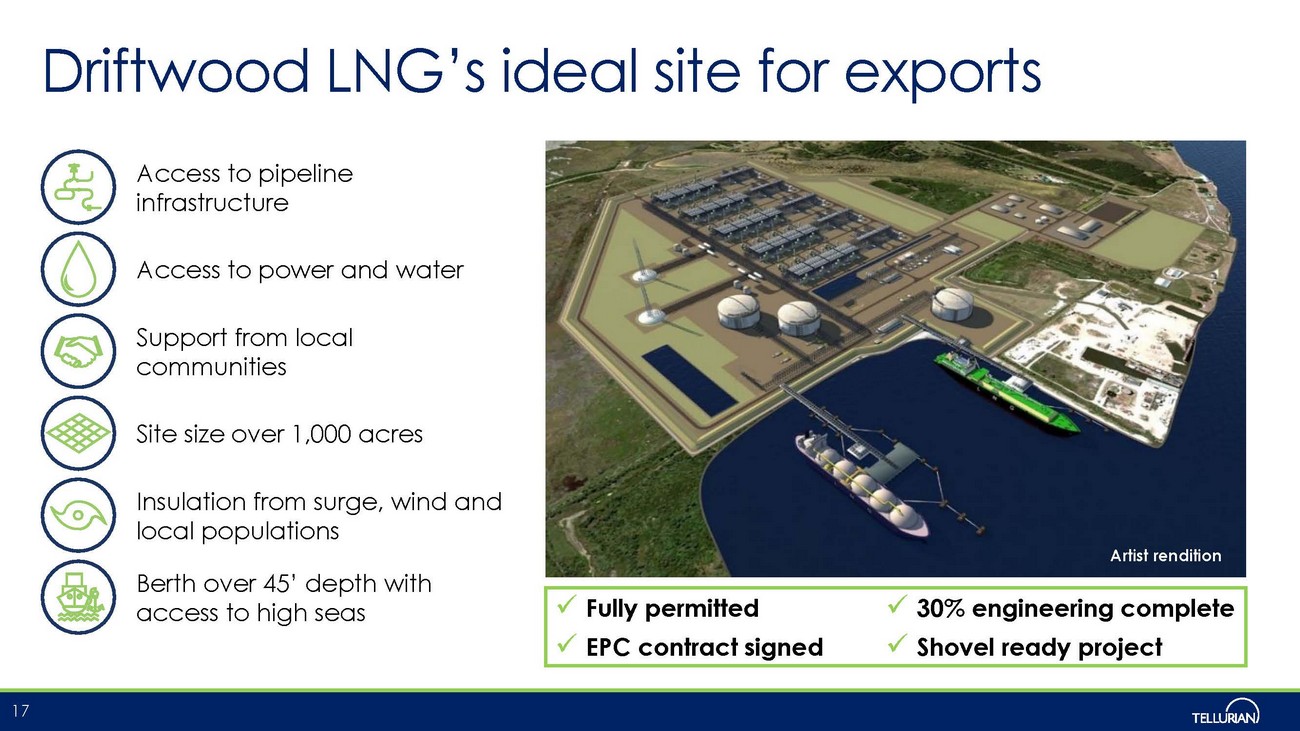
Driftwood LNG’s ideal site for exports 17 Access to power and water Berth over 45’ depth with access to high seas Support from local communities Access to pipeline infrastructure Site size over 1,000 acres Insulation from surge, wind and local populations Artist rendition x Fully permitted x 30% engineering complete x EPC contract signed x Shovel ready project
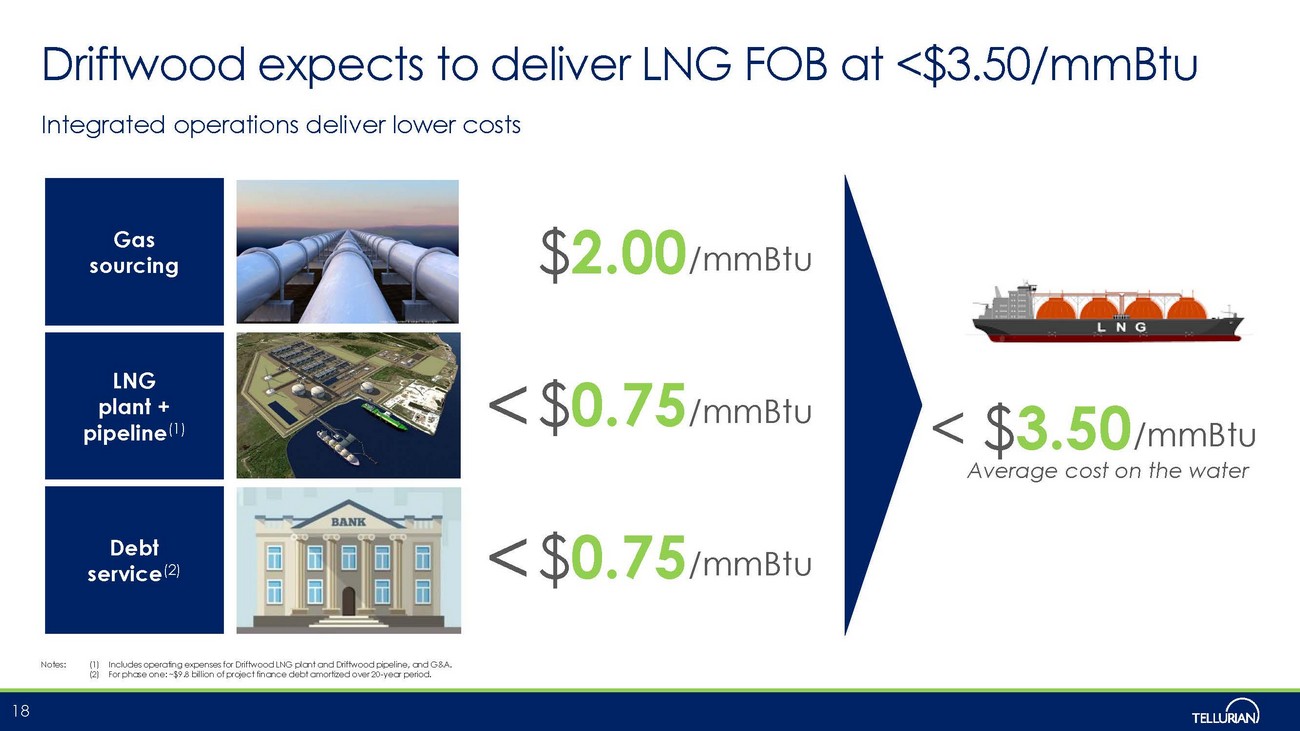
Driftwood expects to deliver LNG FOB at <$3.50/ mmBtu Integrated operations deliver lower costs Notes: (1) Includes operating expenses for Driftwood LNG plant and Driftwood pipeline, and G&A. (2) For phase one: ~$9.8 billion of project finance debt amortized over 20 - year period. 18 Gas sourcing LNG plant + pipeline (1) Debt service (2) $ 2.00 /mmBtu < $ 0.75 /mmBtu < $ 0.75 /mmBtu < $ 3.50 /mmBtu Average cost on the water

Driftwood LNG and pipeline capital for Phase I Notes: (1) Owner’s cost for Driftwood LNG terminal construction. (2) Other includes pre - FID development costs and G&A during construction. (3) Based on Phase I EPC guaranteed capacity of 14.5 mtpa EPC. (Phase I expected production is 16.6 mtpa ). 19 Uses ($ bn) Sources ($ bn) Driftwood LNG terminal $10.6 Owner’s cost (1) 1.8 Driftwood pipeline, upstream, & other (2) 2.6 Cost/tonne ($/ tonne ) (3) $1,042 Financing costs and interest 1.8 Total Uses $16.8 Driftwood partner equity $6.0 Tellurian pre - FID work contribution 0.6 Cash flow from cargo ramp - up 0.5 Debt 9.8 Total Sources $16.8 $ in billions, unless otherwise noted At ~$1,000/tonne, Driftwood is among the lowest - cost global LNG projects
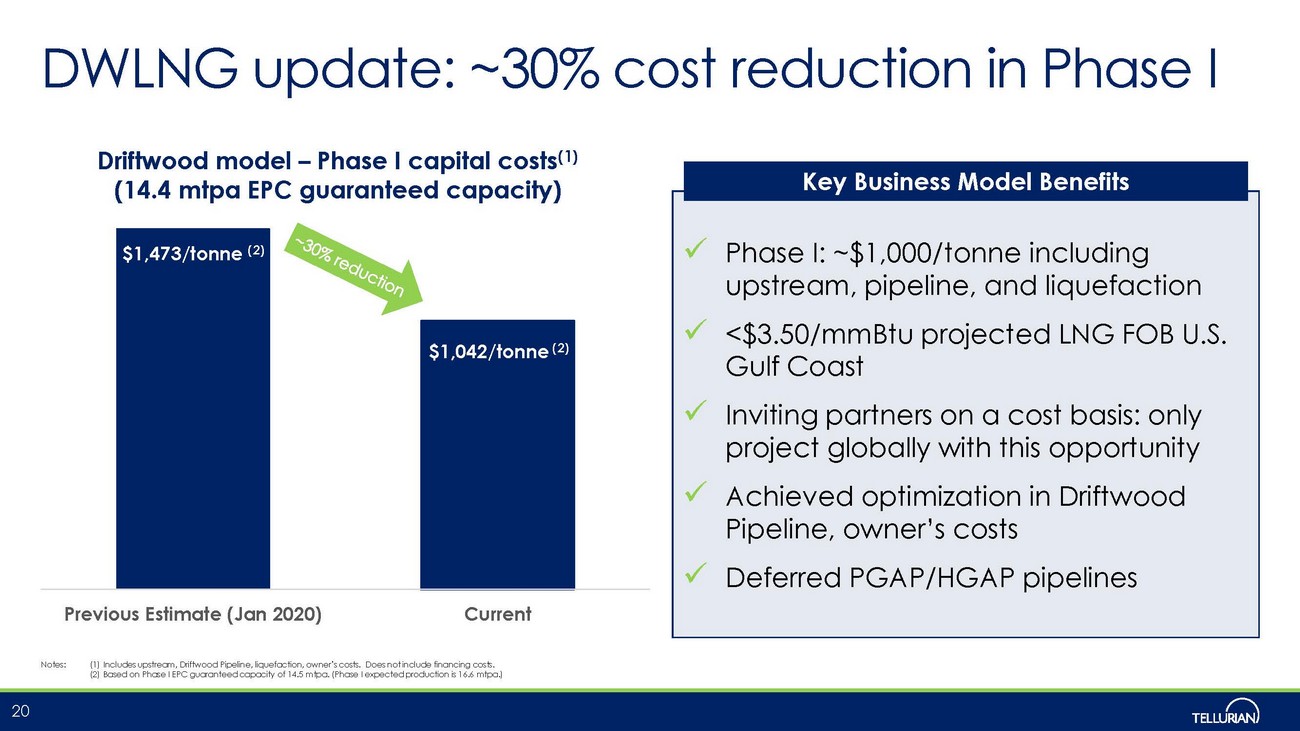
DWLNG update: ~30% cost reduction in Phase I 20 Previous Estimate (Jan 2020) Current x Phase I: ~$1,000/ tonne including upstream, pipeline, and liquefaction x <$3.50/ mmBtu projected LNG FOB U.S. Gulf Coast x Inviting partners on a cost basis: only project globally with this opportunity x Achieved optimization in Driftwood Pipeline, owner’s costs x Deferred PGAP/HGAP pipelines Key Business Model Benefits Driftwood model – Phase I capital costs (1) (14.4 mtpa EPC guaranteed capacity) $1,473/ tonne (2) $1,042/ tonne (2) Notes: (1) Includes upstream, Driftwood Pipeline, liquefaction, owner’s costs. Does not include financing costs. (2) Based on Phase I EPC guaranteed capacity of 14.5 mtpa . (Phase I expected production is 16.6 mtpa .)

$700 $490 $500 $380 ~$550 $710 $500 $510 $390 ~ $560 Stage 1 Stage 2 Stage 3 Stage 4 Total Bechtel LSTK secures project execution Leading LNG EPC contractor ― 44 LNG trains delivered to 18 customers in 9 countries ― ~30% of global LNG liquefaction capacity (>125 mtpa) Tellurian and Bechtel relationship ― 16 trains (1) delivered with Tellurian’s executive team ― Invested $50 million in Tellurian Inc. Price refresh in April 2019 resulted in ~2% increase after ~24 months Sources: Tellurian - Bechtel agreements; Bechtel website. Note: (1) Includes all trains from Sabine Pass LNG, Corpus Christi LNG, Atlantic LNG, QCLNG and ELNG. 21 Capacity (mtpa) 11.0 5.5 5.5 5.5 27.6 Plants 1&2 Plant 3 Plant 4 Plant 5 Increase from price refresh Driftwood EPC contract costs ($ per tonne)

Base case 3 Plants 5 Plants USGC netback ($/mmBtu) Cost of LNG (1) ($/mmBtu) Margin ($/mmBtu) Cash flows (2)(3)(4) $ millions ($ per share) Tellurian capacity based on 27.6 mtpa production profile 6.6 mtpa 13.6 mtpa $5.00 $3.50 $1.50 $340 ($0.89) $880 ($2.30) $7.00 $3.50 $3.50 $1,030 ($2.69) $2,300 ($6.00) $9.00 $3.50 $5.50 $1,710 ($4.46) $3,710 ($9.68) $11.00 $3.50 $7.50 $2,400 ($6.26) $5,130 ($13.38) Value to Tellurian Inc. Every $1.00 reduction in gas costs or increase in LNG price adds $1.85/share in cash flow in 5 - plant case 22 Notes: (1) $3.50/ mmBtu cost of LNG FOB Gulf Coast assumes $2.00/ mmBtu cost of gas at Driftwood LNG terminal. (2) Annual cash flow equals the margin multiplied by 52 mmBtu per tonne ; does not reflect potential impact of management fees paid to Tellurian nor G&A. (3) Annual cash flow per share based on ~383 million shares outstanding after issuance of ~20 million shares pursuant to Total common stock purchase agreement dated April 3, 2019, conversion of ~6.1 million shares of existing convertible preferred stock issue d to Bechtel and conversion of outstanding stock options and warrants for ~35 million shares. (4) Assumes Tellurian Marketing acquires 2 mtpa of capacity at Driftwood Holdings, financed by $1 billion in convertible debt funding with 11% paid - in - kind (“PIK”) interest during construction and 11% cash interest after construction.
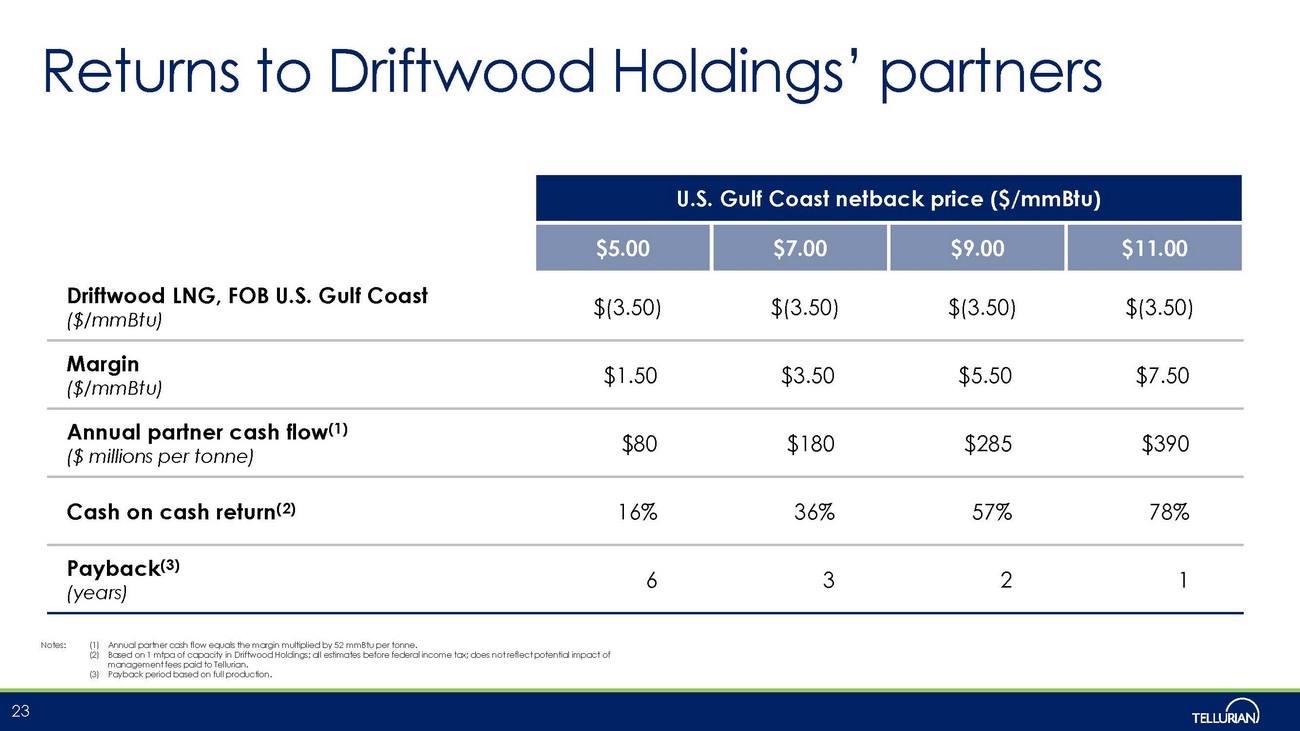
U.S. Gulf Coast netback price ($/mmBtu) $5.00 $7.00 $9.00 $11.00 Driftwood LNG, FOB U.S. Gulf Coast ($/mmBtu) $(3.50) $(3.50) $(3.50) $(3.50) Margin ($/mmBtu) $1.50 $3.50 $5.50 $7.50 Annual partner cash flow (1) ($ millions per tonne) $80 $180 $285 $390 Cash on cash return (2) 16% 36% 57% 78% Payback (3) (years) 6 3 2 1 Returns to Driftwood Holdings’ partners Notes: (1) Annual partner cash flow equals the margin multiplied by 52 mmBtu per tonne . (2) Based on 1 mtpa of capacity in Driftwood Holdings; all estimates before federal income tax; does not reflect potential impact of management fees paid to Tellurian. (3) Payback period based on full production. 23

Meg Gentle President and CEO ▪ Joined Tellurian as President and CEO in 2016 ▪ Prior experience at Cheniere Energy, Inc. in a variety of roles, including SVP Strategy & Planning, CFO, and Executive Vice President - Marketing ▪ Conducted international business development and strategic planning for Anadarko Petroleum Corporation, and energy market analysis for Pace Global Energy Services ▪ Bachelor of Arts in Economics & International Affairs from James Madison University and MBA from Rice University Keith Teague Chief Operating Officer ▪ Joined Tellurian as Executive Vice President and Chief Operating Officer in 2016 ▪ Prior experience at Cheniere in a variety of roles, most recently as Executive Vice President, Asset Group ▪ Served as Director of Strategic Planning for the CMS Panhandle Companies and began his career with Texas Eastern Transmission Corporation ▪ Bachelor of Science in Civil Engineering from Louisiana Tech University and MBA from Louisiana State University 24 Unique opportunity led by experienced management team Charif Souki Executive Chairman of the Board, Co - Founder ▪ Founded Cheniere Energy, Inc. in 1996 ▪ Prior to Cheniere, Charif was an investment banker ▪ Serves on the board of trustees of the American University of Beirut and as a member of the Advisory Board of the Center on Global Energy Policy at Columbia University ▪ Bachelor of Arts from Colgate University and MBA from Columbia University Martin Houston Vice Chairman, Co - Founder ▪ Former COO and member of the board of directors at BG Group, retiring after 32 years ▪ Managed all forms of enterprise in the energy industry, has established a strong external reputation in the international gas business and serves various roles across several companies including Chairman of global energy group at Moelis & Co. ▪ Bachelor’s degree in geology from Newcastle University and a Master’s degree in petroleum geology from Imperial College London

Total Driftwood equity investment and SPA Tellurian Marketing investment in Driftwood Tellurian commercial progress ▪ On July 10, 2019, Total agreed to make a $500 million equity investment in Driftwood project and to purchase 1 mtpa of LNG ▪ Total also agreed to purchase 1.5 mtpa of LNG from Tellurian Marketing’s LNG offtake volumes from the Driftwood LNG export terminal ― FOB, minimum term of 15 years ― Price based on Platts Japan Korea Marker (“JKM”) ▪ Tellurian Marketing to purchase an equity interest (2) in Driftwood project and 2 mtpa of LNG with anticipated private equity funding ― Tellurian’s LNG volumes from Driftwood project will increase to 13.6 mtpa at full development Notes: (1) Common stock purchase agreement executed with Total Delaware, Inc. at $10.064/share. (2) Tellurian Marketing to purchase 7.2% equity interest in Driftwood project. 25 ▪ Total to purchase ~20 million additional shares in Tellurian for $200 million upon (1) : ― Final investment decision (“FID”) ― Tellurian’s purchase of 7.2% of Driftwood equity Common stock purchase agreement with Total ▪ On September 21, 2019, Tellurian and Petronet LNG Limited INDIA (“ Petronet LNG”) signed a memorandum of understanding (“MOU”) for up to five million tonnes per annum (“ mtpa ”) of liquefied natural gas (“LNG”) through an equity investment in Driftwood Tellurian MOU with Petronet
Appendix: LNG & ESG 26

Global energy needs require natural gas Sources: BP Statistical Review of World Energy, Tellurian Research Note: (1) Based on total 2018 energy demand for non - OECD countries and 0.855 mtpa LNG per 1 million tonnes oil equivalent. 27 7.0 4.0 4.3 0.6 2.3 0.9 31% 23% 19% 6% 7% 24% 15% 15% 0% 5% 10% 15% 20% 25% 30% 35% - 1 2 3 4 5 6 7 8 U.S. Europe JKT India China Rest of Asia Tonnes oil equivalent/capita 2030 target for gas’ share in both India and China’s energy mix Gas’ share of 2018 total energy mix 2018 energy consumption per capita The shifting landscape of energy consumption Drivers of shifting landscape ▪ Non - OECD energy consumption growth rate was ~13x that of OECD’s over the past decade ▪ Despite massive energy growth, natural gas is just 22% of non - OECD’s energy mix, while coal’s share is 36% ― If gas moved to just 25%, over 200 mtpa of LNG would be required to meet demand (1) ▪ Population and economic growth to encourage further energy consumption growth in Asia ▪ 9 of 10 world’s most polluted cities located in just two Asian countries (India & China) ▪ A drive towards cleaner energy sources will require both natural gas and renewables

▪ Infrastructure : ― ~2x growth in India’s pipeline grid by 2025 ― ~2x growth in India’s regas capacity by 2025 ― ~1.5x growth in China’s pipeline grid by 2025 ― ~2x growth in China’s regas capacity by 2025 ▪ Policy : ― India and China’s infrastructure growth allows each to remain on track to reach their targets of 15% for gas’ share in the energy mix by 2030 ▪ Latent demand : ― India and China’s total latent demand for cleaner energy is equivalent to ~885 mtpa (3) China & India: ~90 mtpa growth potential Sources: BP Statistical Review of Energy, WoodMac, SIA, Tellurian Research. Notes: (1) Based on WoodMac’s LNG demand outlook for both India and China. (2) Based on existing, firm and likely regas capacity in addition to downstream pipeline infrastructure projects, per project s ponsors. (3) Based on 2018 coal - fired power generation. 28 LNG demand growth (2019 - 2025) Key growth drivers 15.3 45.5 India 21.0 43.3 China mtpa Based on consultant forecast (1) Based on existing and planned infrastructure (2)

19 21 32 36 14 19 23 15 8 7 15 28 75 41 48 70 153 2018 2020 2025 2030 Incremental supply required for 15% target Uncontracted LNG Contracted LNG Indigenous Production India’s targets suggest even higher gas use ▪ Prime Minister Modi has set a target of 15% for natural gas’ share of India’s energy mix by 2030 ▪ ~$100 billion in energy infrastructure investment currently underway (2) ▪ Industrial use will lead gas demand growth as India seeks food security for ~1.3 billion people ― India seeks to become a self - reliant supplier of urea, triggering a revival of closed fertilizer plants and the conversion of naphtha - based plants to gas ▪ India’s build - out of city gas distribution networks is expected to connect an incremental ~35 million homes to the national gas grid India natural gas demand – primary sources India’s gas demand drivers Sources: Wood Mackenzie, BP Energy Outlook 2019 Edition. Notes: (1) Based on BP Energy Outlook’s estimate of India’s total primary energy consumption and Prime Minister Narendra Modi’s 15% target for natural gas’ share of India’s total primary energy consumption by 2030; 52.17 mmBtu per tonne of LNG. (2) Per India Oil Minister Dharmendra Pradhan. 29 (1) mtpa

India is rapidly building out gas infrastructure Sharp increase in LNG and gas - related infrastructure will tap into significant latent gas demand Sources: Wood Mackenzie, BP Energy Outlook 2019 Edition, Tellurian Research. 30 India’s emerging regas & gas transport infrastructure India’s regasification capacity buildout 38 57 57 19 12 21 57 69 78 Today 2025 2030 Existing Under construction Likely in-service mtpa
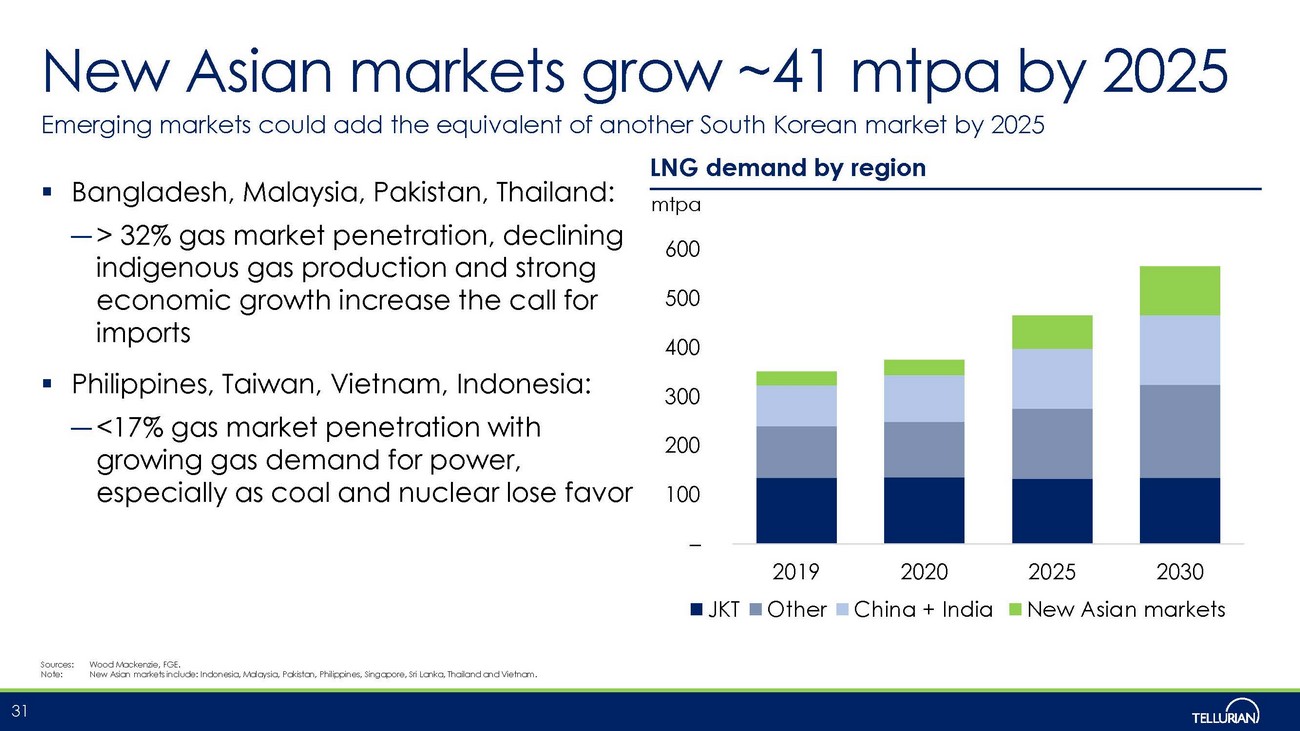
New Asian markets grow ~41 mtpa by 2025 Emerging markets could add the equivalent of another South Korean market by 2025 ▪ Bangladesh, Malaysia, Pakistan, Thailand: ― > 32% gas market penetration, declining indigenous gas production and strong economic growth increase the call for imports ▪ Philippines, Taiwan, Vietnam, Indonesia: ― <17% gas market penetration with growing gas demand for power, especially as coal and nuclear lose favor Sources: Wood Mackenzie, FGE. Note: New Asian markets include: Indonesia, Malaysia, Pakistan, Philippines, Singapore, Sri Lanka, Thailand and Vietnam. 31 – 100 200 300 400 500 600 2019 2020 2025 2030 JKT Other China + India New Asian markets LNG demand by region mtpa
Environmental and social leadership ▪ Provide an outlet for currently flared natural gas in the U.S. ▪ Replace coal and oil in emerging markets to reduce carbon emissions and improve air quality ▪ Facilitate growth of renewables by providing energy reliability Driftwood LNG project expected to reduce lifecycle carbon emissions and support local communities 32 Lifecycle emission reduction Sustainable development ▪ Liquefaction facility to have near zero methane emissions ▪ Use the latest equipment, technology and monitoring systems to minimize emissions ▪ Conduct green completions in upstream operations ▪ Extensive community outreach and support programs ▪ Create 350 permanent and 6,400 construction jobs ▪ Fund climate change research at Columbia University Social engagement

LNG’s role in the energy transition 33 Today: Reduce carbon intensity, improve air quality Future: Net zero carbon emissions Carbon capture, utilization and storage Carbon offsets Facilitates coal - to - gas switching Supports growth of renewables ▪ Increasingly cost - competitive with coal ▪ Reduces carbon emissions by up to 50% ▪ Reduces SOx, NOx and particulate matter ▪ Grid reliability ▪ Seasonal storage ▪ High - temperature heat for industry ▪ Winter heating for buildings Cleaner heavy transportation fuel ▪ Long - haul LNG trucking in areas without electrification ▪ LNG - powered vessels support IMO 2020 compliance