Attached files
| file | filename |
|---|---|
| EX-99.4 - EXHIBIT 99.4 - PHOTRONICS INC | brhc10014680_ex99-4.htm |
| EX-99.3 - EXHIBIT 99.3 - PHOTRONICS INC | brhc10014680_ex99-3.htm |
| EX-99.2 - EXHIBIT 99.2 - PHOTRONICS INC | brhc10014680_ex99-2.htm |
| EX-99.1 - EXHIBIT 99.1 - PHOTRONICS INC | brhc10014680_ex99-1.htm |
| 8-K - 8-K - PHOTRONICS INC | brhc10014680_8k.htm |
Exhibit 99.5

Photronics, Inc. Q3 2020 Financial Results Conference CallAugust 27, 2020
Safe Harbor Statement 2 This presentation and some of our comments may contain projections or other
forward-looking statements regarding future events, our future financial performance, and/or the future performance of the industry. These statements are predictions, and contain risks and uncertainties. Actual events or results may differ
materially from those presented. These statements include words like “anticipate”, “believe”, “estimate”, “expect”, “forecast”, “may”, “plan”, “project”, “in our view” or the negative thereto. We cannot guarantee the accuracy of any forecasts
or estimates, and we are not obligated to update any forward-looking statements if our expectations change. If you would like more information on the risks involved in forward-looking statements, please see the documents we file from time to
time with the Securities and Exchange Commission.
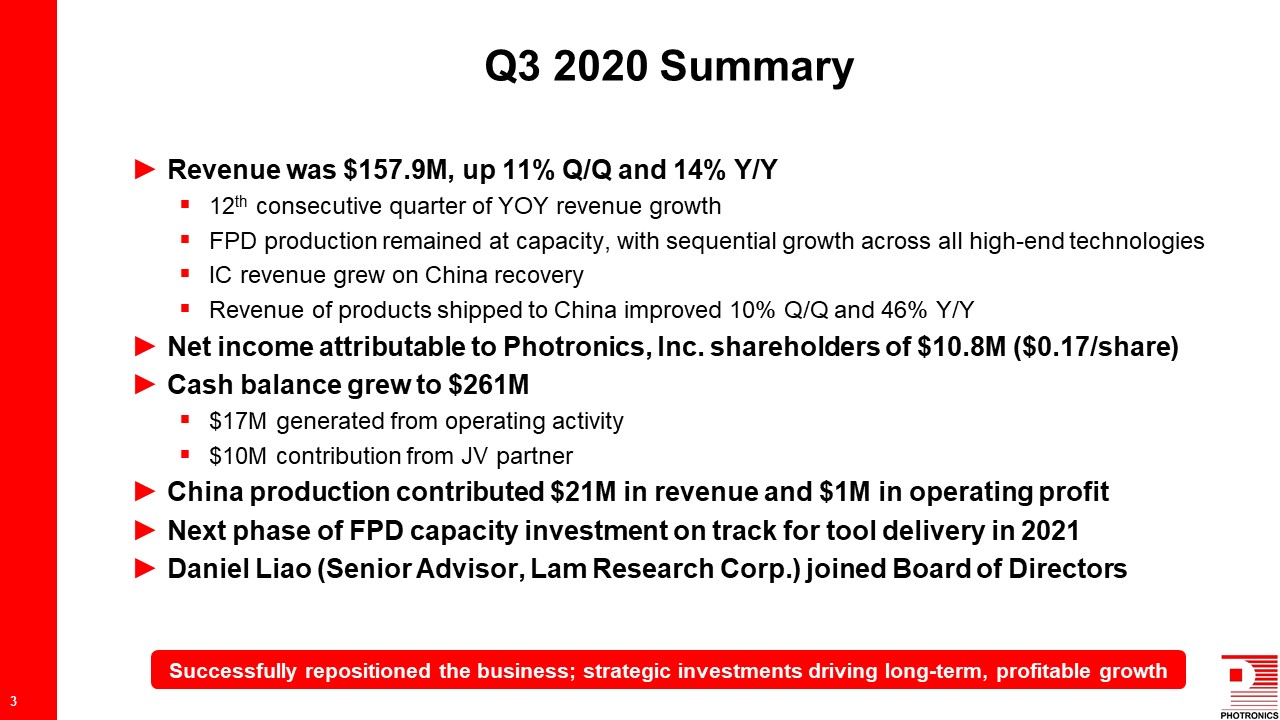
Revenue was $157.9M, up 11% Q/Q and 14% Y/Y12th consecutive quarter of YOY revenue growthFPD production
remained at capacity, with sequential growth across all high-end technologiesIC revenue grew on China recoveryRevenue of products shipped to China improved 10% Q/Q and 46% Y/YNet income attributable to Photronics, Inc. shareholders of $10.8M
($0.17/share)Cash balance grew to $261M$17M generated from operating activity$10M contribution from JV partnerChina production contributed $21M in revenue and $1M in operating profitNext phase of FPD capacity investment on track for tool
delivery in 2021Daniel Liao (Senior Advisor, Lam Research Corp.) joined Board of Directors Q3 2020 Summary 3 Successfully repositioned the business; strategic investments driving long-term, profitable growth

$M (except EPS) Q320 Q220 Q/Q Q319 Y/Y Revenue $ 157.9 $ 142.8 11% $ 138.1 14% Gross
Profit $ 37.7 $ 30.4 24% $ 30.6 23% Gross Margin 23.9% 21.3% 260 bps 22.1% 180 bps Operating Income $ 19.9 $ 12.7 57% $ 13.4 49% Operating Margin 12.6% 8.9% 370 bps 9.7% 290 bps Other income (expense) ($ 2.1) ($
1.0) ($ 1.2) ($ 0.3) ($ 1.8) Income tax provision $ 4.9 $ 3.8 $ 1.2 $ 3.2 $ 1.7 Minority interest $ 2.1 $ 1.7 $ 0.4 $ 3.5 ($ 1.4) Net Income* $ 10.8 $ 6.3 71% $ 6.3 70% Diluted EPS* $ 0.17 $ 0.10 $ 0.07 $ 0.10 $
0.07 Days in quarter 91 91 - 91 - Gross and operating margin moved up with revenue (operating leverage, cost controls)China operations contributed $1.0M to operating incomeOther income / (expense) primarily due to FX gain /
(loss)Minority interest includes IC JVs in Taiwan and China Income Statement Summary 4 *Net income attributable to Photronics, Inc. shareholders
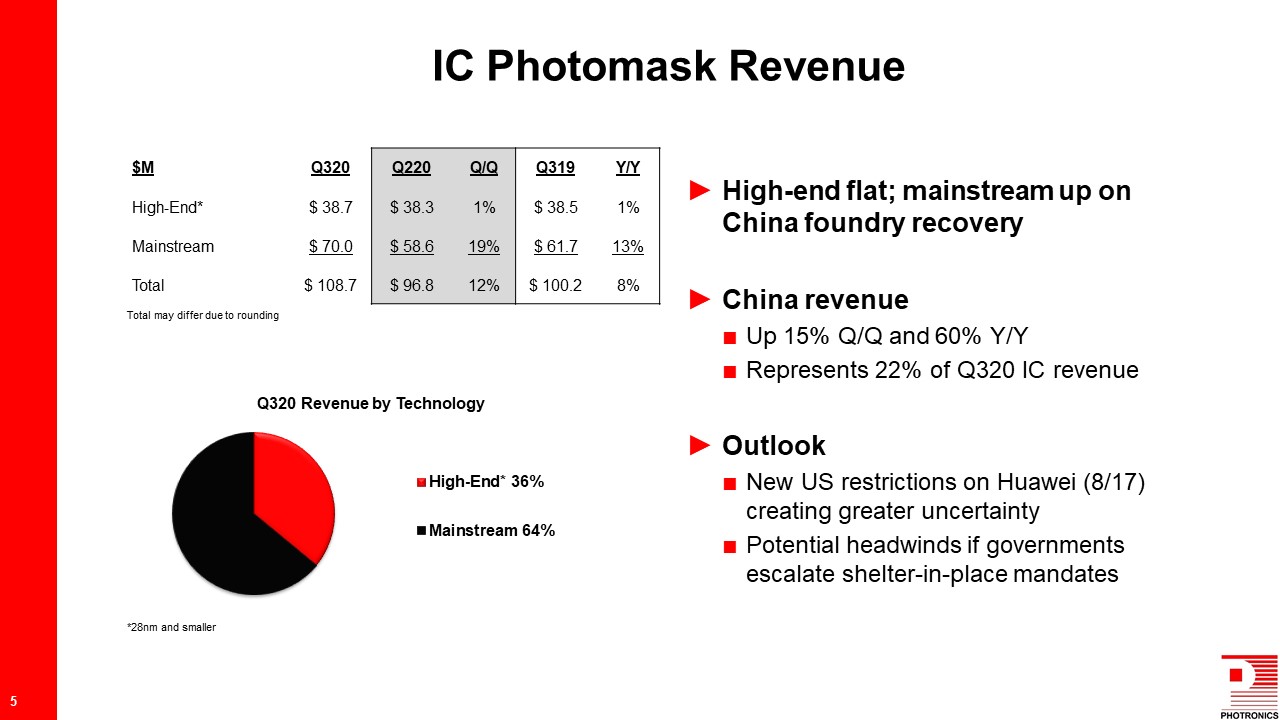
High-end flat; mainstream up on China foundry recoveryChina revenue Up 15% Q/Q and 60% Y/YRepresents
22% of Q320 IC revenueOutlookNew US restrictions on Huawei (8/17) creating greater uncertaintyPotential headwinds if governments escalate shelter-in-place mandates $M Q320 Q220 Q/Q Q319 Y/Y High-End* $ 38.7 $ 38.3 1% $
38.5 1% Mainstream $ 70.0 $ 58.6 19% $ 61.7 13% Total $ 108.7 $ 96.8 12% $ 100.2 8% IC Photomask Revenue 5 *28nm and smaller Total may differ due to rounding
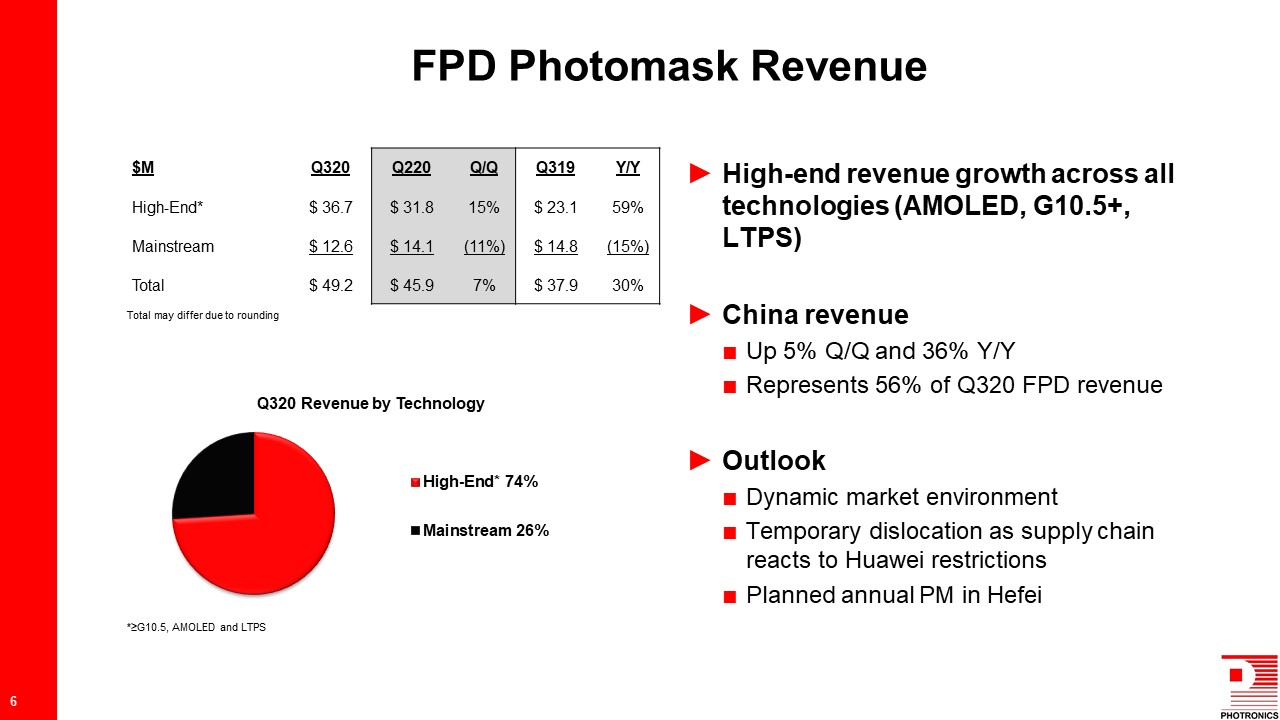
High-end revenue growth across all technologies (AMOLED, G10.5+, LTPS)China revenue Up 5% Q/Q and 36%
Y/YRepresents 56% of Q320 FPD revenueOutlookDynamic market environmentTemporary dislocation as supply chain reacts to Huawei restrictionsPlanned annual PM in Hefei $M Q320 Q220 Q/Q Q319 Y/Y High-End* $ 36.7 $ 31.8 15% $
23.1 59% Mainstream $ 12.6 $ 14.1 (11%) $ 14.8 (15%) Total $ 49.2 $ 45.9 7% $ 37.9 30% FPD Photomask Revenue 6 *≥G10.5, AMOLED and LTPS Total may differ due to rounding
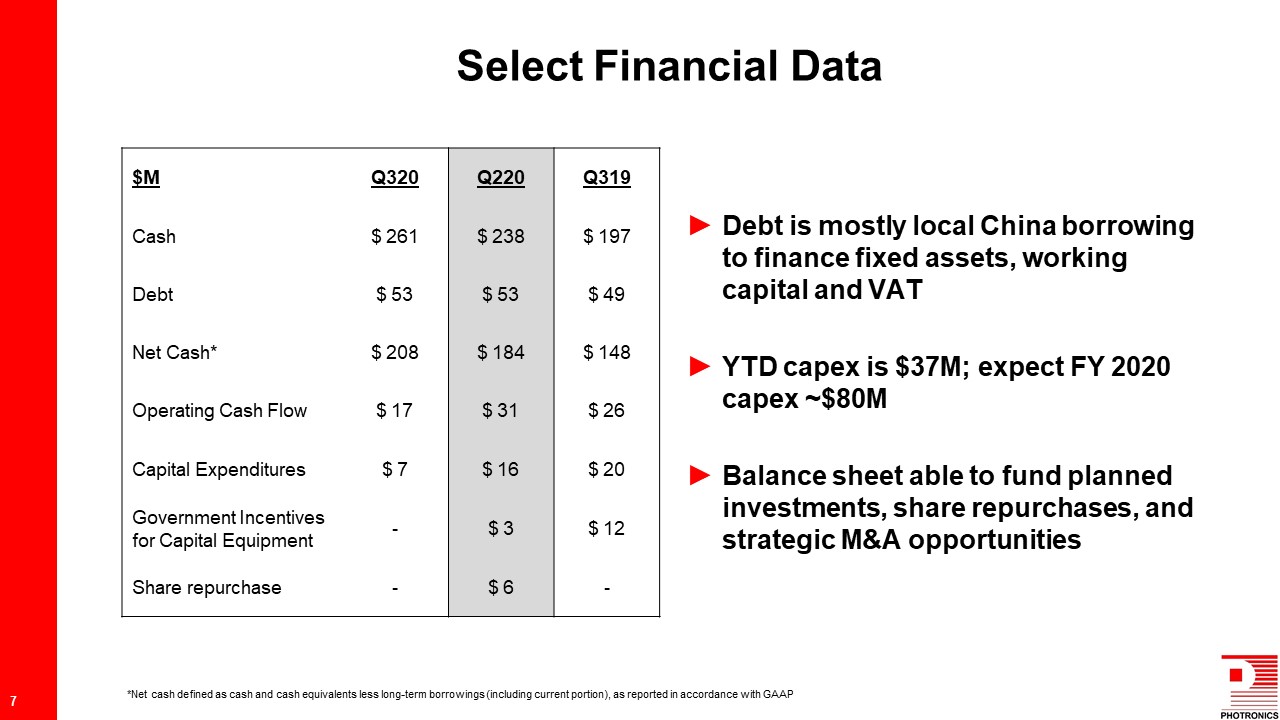
$M Q320 Q220 Q319 Cash $ 261 $ 238 $ 197 Debt $ 53 $ 53 $ 49 Net Cash* $ 208 $ 184 $
148 Operating Cash Flow $ 17 $ 31 $ 26 Capital Expenditures $ 7 $ 16 $ 20 Government Incentives for Capital Equipment - $ 3 $ 12 Share repurchase - $ 6 - Debt is mostly local China borrowing to finance fixed assets, working
capital and VATYTD capex is $37M; expect FY 2020 capex ~$80MBalance sheet able to fund planned investments, share repurchases, and strategic M&A opportunities Select Financial Data 7 *Net cash defined as cash and cash equivalents less
long-term borrowings (including current portion), as reported in accordance with GAAP

Revenue ($M) $148 - $158 Operating Margin 10% - 14% Taxes ($M) $4 - $5 EPS $0.12 -
$0.19 Diluted Shares (M) ~65 Huawei restrictions creates uncertainty across IC & FPD supply chainsAnnual PM planned for Hefei plantFocus on expanding margins and improving cash flowsPotential geopolitical headwind due to coronavirus
reaction and trade policy decisions Q420 Guidance 8

Thank you for your interest! For Additional Information:R. Troy Dewar, CFAVice President, Investor
Relations203.740.5610tdewar@photronics.com

Appendix
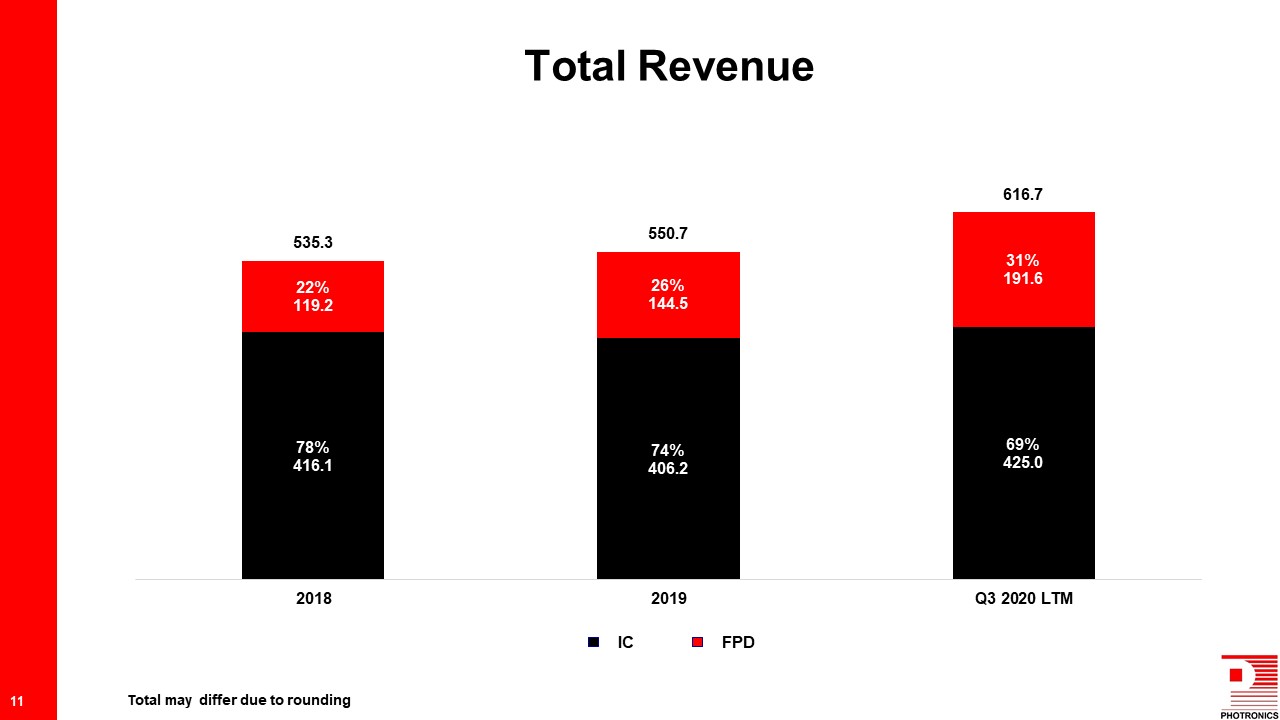
Total Revenue 11 IC FPD Total may differ due to rounding

IC Photomask Revenue 12 Mainstream High-End High-End: 28nm and smaller; total may differ due to
rounding
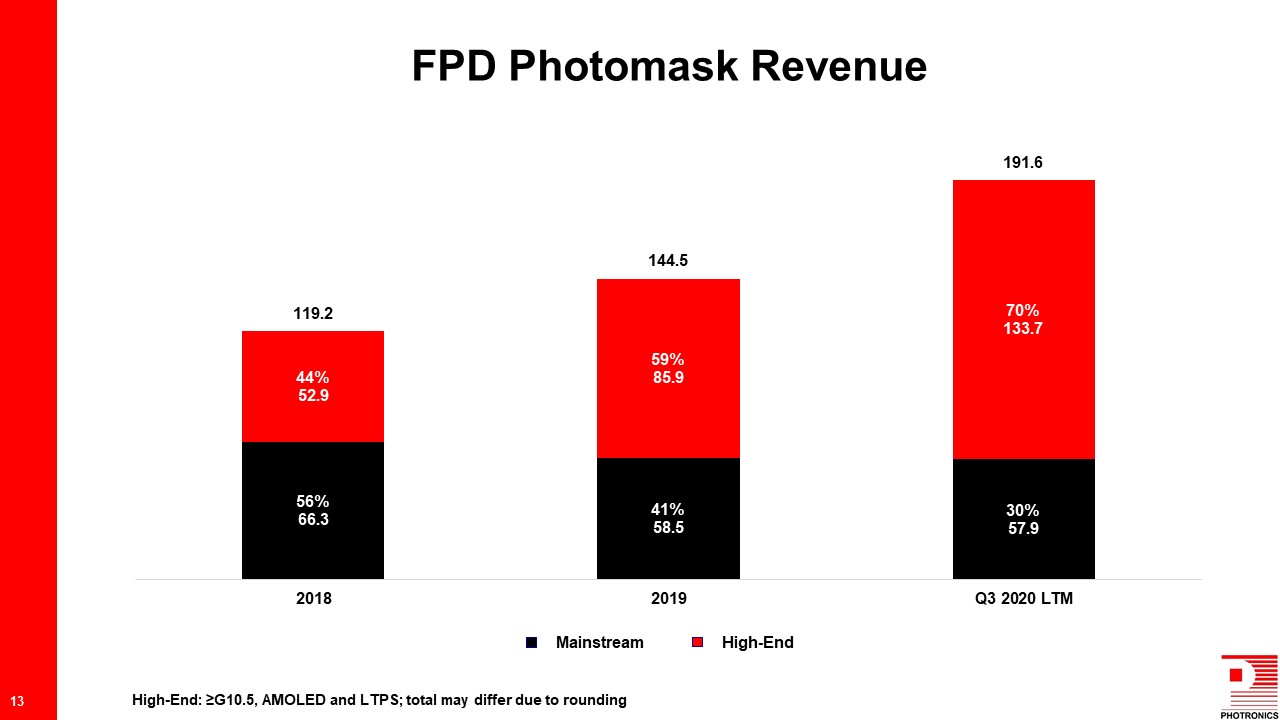
FPD Photomask Revenue 13 Mainstream High-End High-End: ≥G10.5, AMOLED and LTPS; total may
differ due to rounding