Attached files
| file | filename |
|---|---|
| EX-99.2 - EX-99.2 - DEERE & CO | de-20200821xex99d2.htm |
| EX-99.1 - EX-99.1 - DEERE & CO | de-20200821xex99d1.htm |
| 8-K - 8-K - DEERE & CO | de-20200821x8k.htm |
Exhibit 99.3
| 3Q 2020 Earnings Call 21 August 2020 22 |
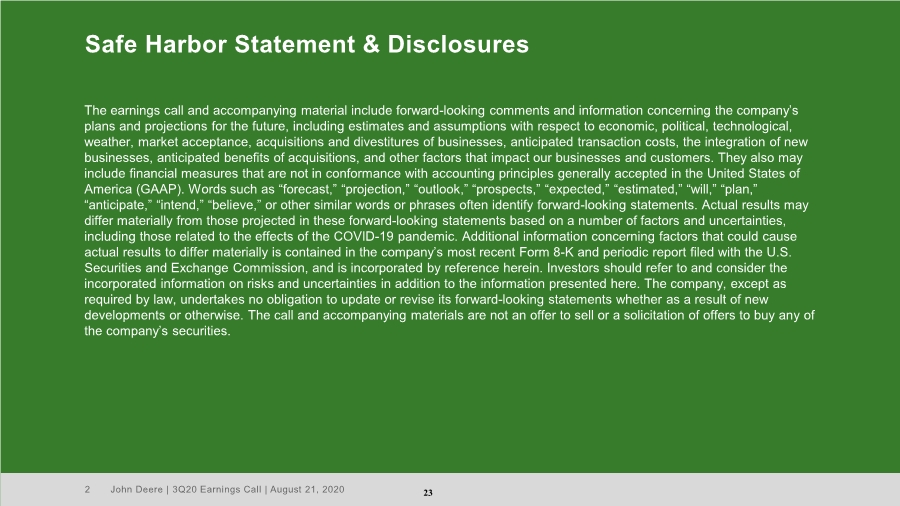
| John Deere | 3Q20 Earnings Call | August 21, 2020 2 Safe Harbor Statement & Disclosures The earnings call and accompanying material include forward-looking comments and information concerning the company’s plans and projections for the future, including estimates and assumptions with respect to economic, political, technological, weather, market acceptance, acquisitions and divestitures of businesses, anticipated transaction costs, the integration of new businesses, anticipated benefits of acquisitions, and other factors that impact our businesses and customers. They also may include financial measures that are not in conformance with accounting principles generally accepted in the United States of America (GAAP). Words such as “forecast,” “projection,” “outlook,” “prospects,” “expected,” “estimated,” “will,” “plan,” “anticipate,” “intend,” “believe,” or other similar words or phrases often identify forward-looking statements. Actual results may differ materially from those projected in these forward-looking statements based on a number of factors and uncertainties, including those related to the effects of the COVID-19 pandemic. Additional information concerning factors that could cause actual results to differ materially is contained in the company’s most recent Form 8-K and periodic report filed with the U.S. Securities and Exchange Commission, and is incorporated by reference herein. Investors should refer to and consider the incorporated information on risks and uncertainties in addition to the information presented here. The company, except as required by law, undertakes no obligation to update or revise its forward-looking statements whether as a result of new developments or otherwise. The call and accompanying materials are not an offer to sell or a solicitation of offers to buy any of the company’s securities. 23 |
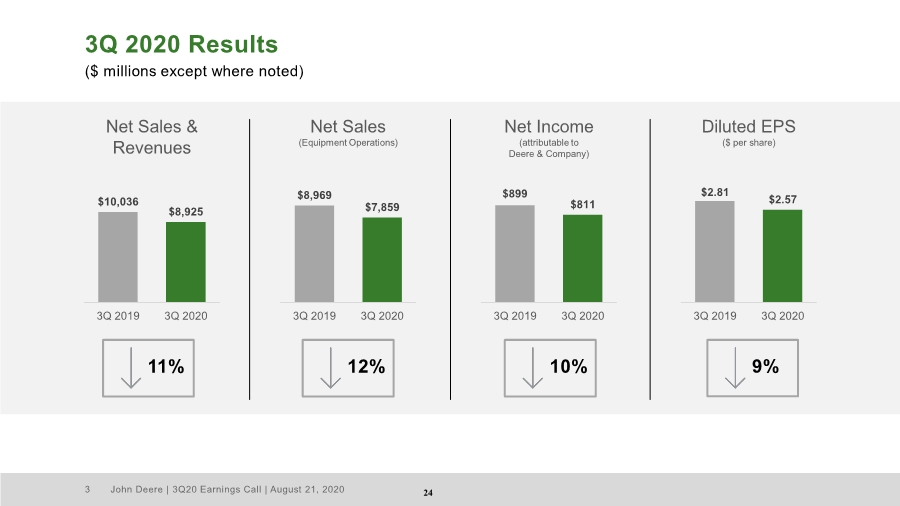
| John Deere | 3Q20 Earnings Call | August 21, 2020 3 3Q 2020 Results ($ millions except where noted) $10,036 $8,925 3Q 2019 3Q 2020 $8,969 $7,859 3Q 2019 3Q 2020 $899 $811 3Q 2019 3Q 2020 $2.81 $2.57 3Q 2019 3Q 2020 12% Net Sales & Revenues Net Sales (Equipment Operations) Net Income (attributable to Deere & Company) Diluted EPS ($ per share) 11% 10% 9% 24 |
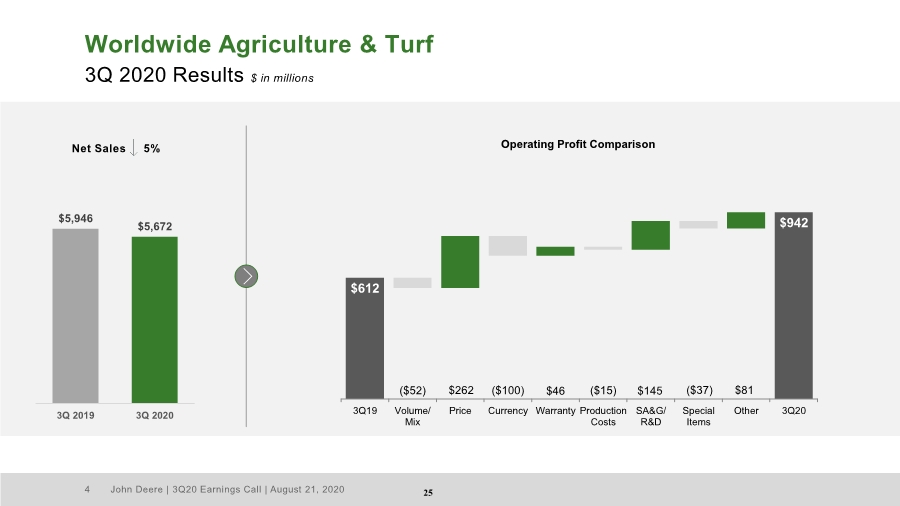
| John Deere | 3Q20 Earnings Call | August 21, 2020 4 Worldwide Agriculture & Turf 3Q 2020 Results $ in millions $5,946 $5,672 3Q 2019 3Q 2020 Net Sales 5% $942 ($52)($37) $81 $612 $262 ($100) $46 ($15) $145 3Q19 Volume/ Mix Price Currency Warranty Production Costs SA&G/ R&D Special Items Other 3Q20 Operating Profit Comparison 25 |
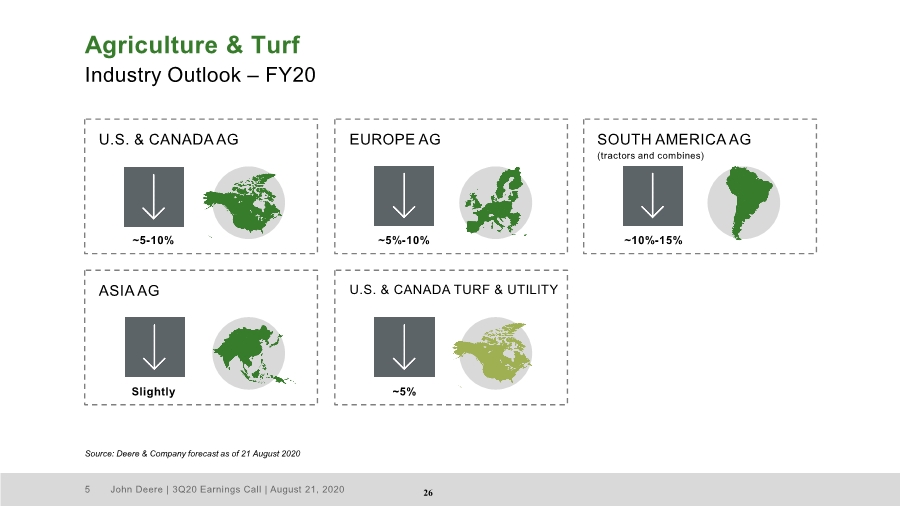
| John Deere | 3Q20 Earnings Call | August 21, 2020 5 Agriculture & Turf Industry Outlook – FY20 Source: Deere & Company forecast as of 21 August 2020 U.S. & CANADA AG EUROPE AG SOUTH AMERICA AG (tractors and combines) ASIA AG U.S. & CANADA TURF & UTILITY ~5-10% ~5%-10% ~10%-15% ~5% Slightly 26 |
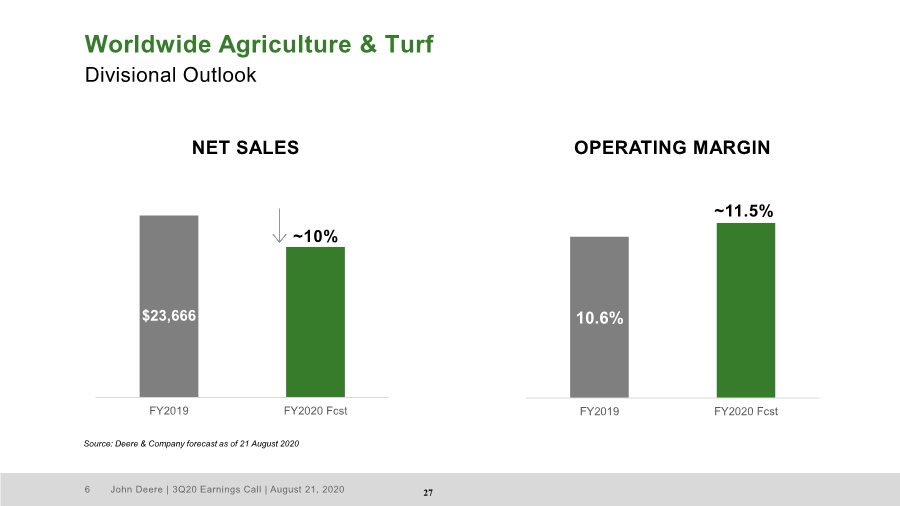
| John Deere | 3Q20 Earnings Call | August 21, 2020 6 10.6% FY2019 FY2020 Fcst Worldwide Agriculture & Turf Divisional Outlook $23,666 FY2019 FY2020 Fcst NET SALES ~11.5% OPERATING MARGIN Source: Deere & Company forecast as of 21 August 2020 ~10% 27 |
| John Deere | 3Q20 Earnings Call | August 21, 2020 7 Smart Industrial Operating Model PRODUCTION SYSTEMS TECHNOLOGY STACK LIFECYCLE SOLUTIONS 28 |

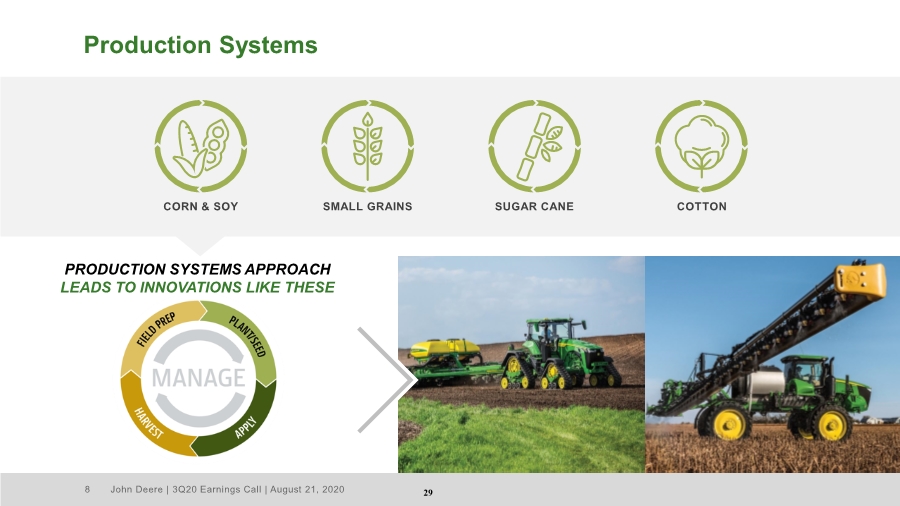
| John Deere | 3Q20 Earnings Call | August 21, 2020 8 Production Systems PRODUCTION SYSTEMS APPROACH LEADS TO INNOVATIONS LIKE THESE CORN & SOY SMALL GRAINS SUGAR CANE COTTON 29 |
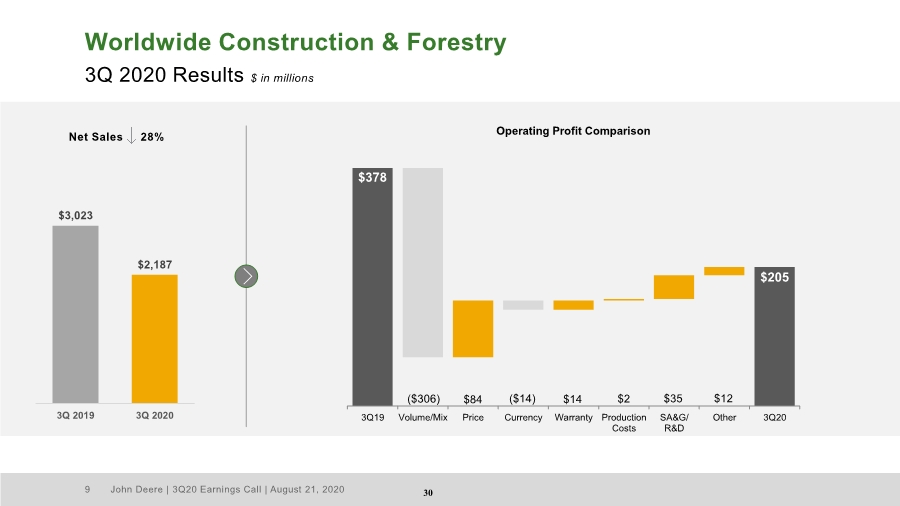
| John Deere | 3Q20 Earnings Call | August 21, 2020 9 Worldwide Construction & Forestry 3Q 2020 Results $ in millions $3,023 $2,187 3Q 2019 3Q 2020 Net Sales 28% $205 ($306) $14 $2 $35 $378 $84 ($14) $12 3Q19 Volume/Mix Price Currency Warranty Production Costs SA&G/ R&D Other 3Q20 Operating Profit Comparison 30 |
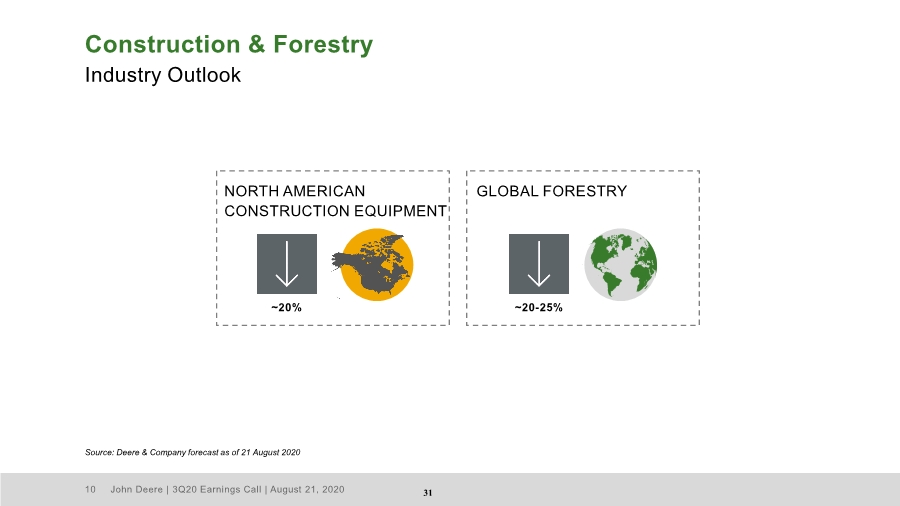
| John Deere | 3Q20 Earnings Call | August 21, 2020 10 Construction & Forestry Industry Outlook Source: Deere & Company forecast as of 21 August 2020 NORTH AMERICAN CONSTRUCTION EQUIPMENT GLOBAL FORESTRY ~20% ~20-25% 31 |
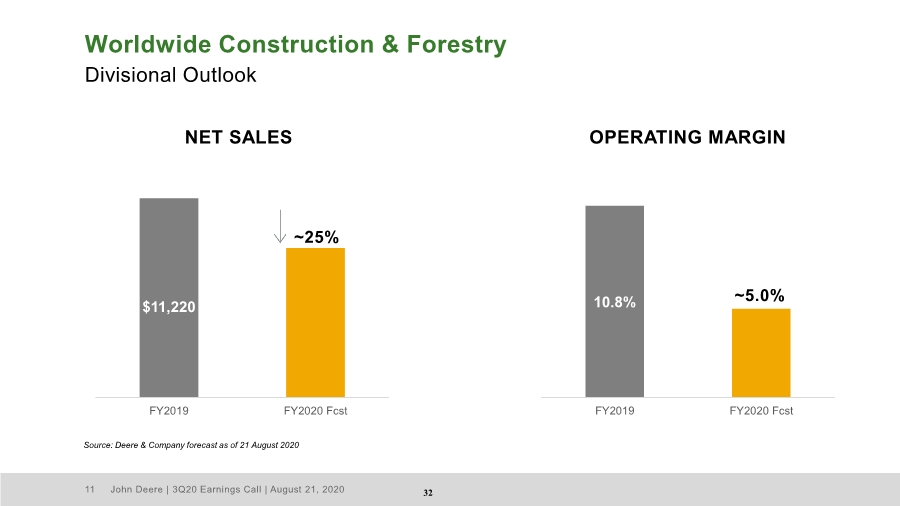
| John Deere | 3Q20 Earnings Call | August 21, 2020 11 10.8% FY2019 FY2020 Fcst Worldwide Construction & Forestry Divisional Outlook Source: Deere & Company forecast as of 21 August 2020 $11,220 FY2019 FY2020 Fcst NET SALES ~5.0% OPERATING MARGIN ~25% 32 |
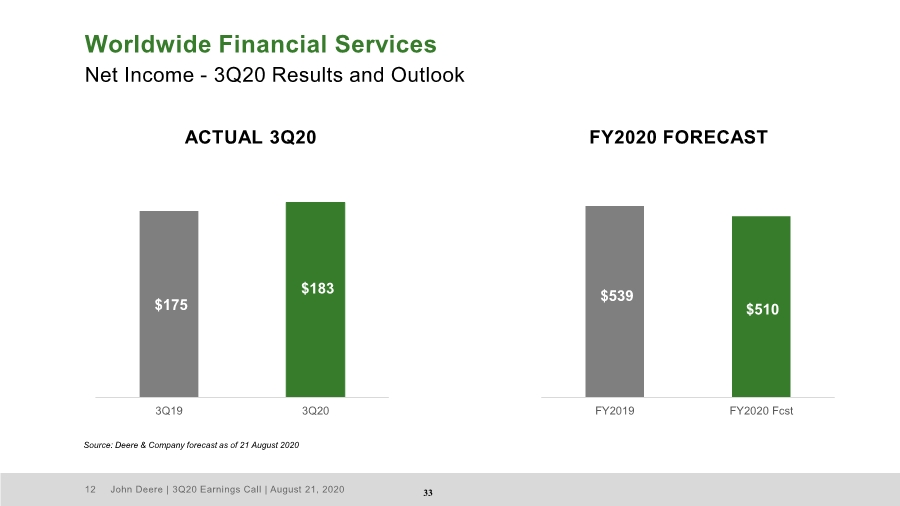
| John Deere | 3Q20 Earnings Call | August 21, 2020 12 Worldwide Financial Services Net Income - 3Q20 Results and Outlook Source: Deere & Company forecast as of 21 August 2020 $175 $183 3Q19 3Q20 ACTUAL 3Q20 FY2020 FORECAST $539 $510 FY2019 FY2020 Fcst 33 |
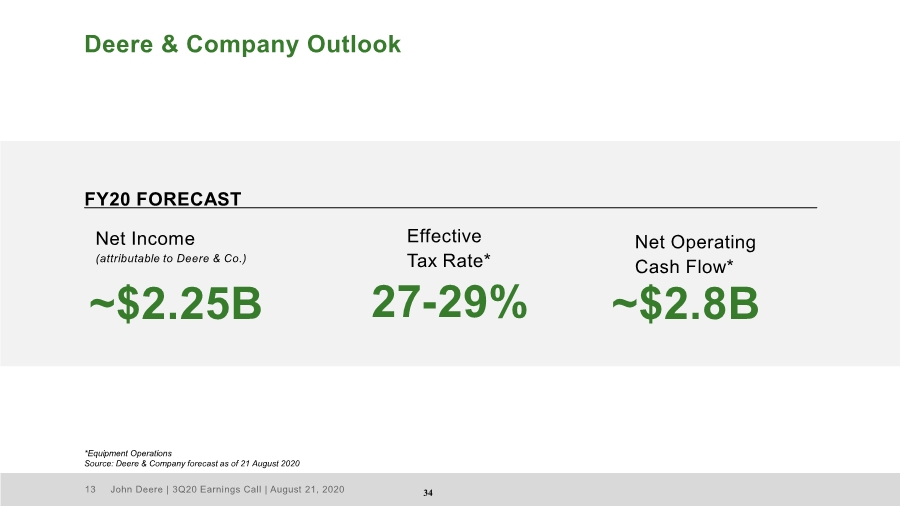
| John Deere | 3Q20 Earnings Call | August 21, 2020 13 Deere & Company Outlook Effective Tax Rate* Net Income (attributable to Deere & Co.) 27-29% ~$2.25B FY20 FORECAST Net Operating Cash Flow* ~$2.8B *Equipment Operations Source: Deere & Company forecast as of 21 August 2020 34 |
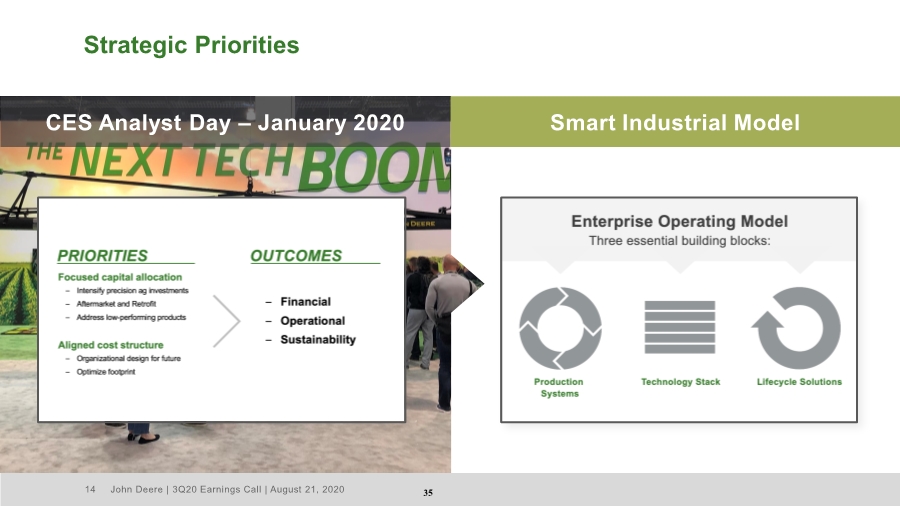
| John Deere | 3Q20 Earnings Call | August 21, 2020 14 Strategic Priorities CES Analyst Day – January 2020 Smart Industrial Model 35 |
| John Deere | 3Q20 Earnings Call | August 21, 2020 15 Appendix 36 |
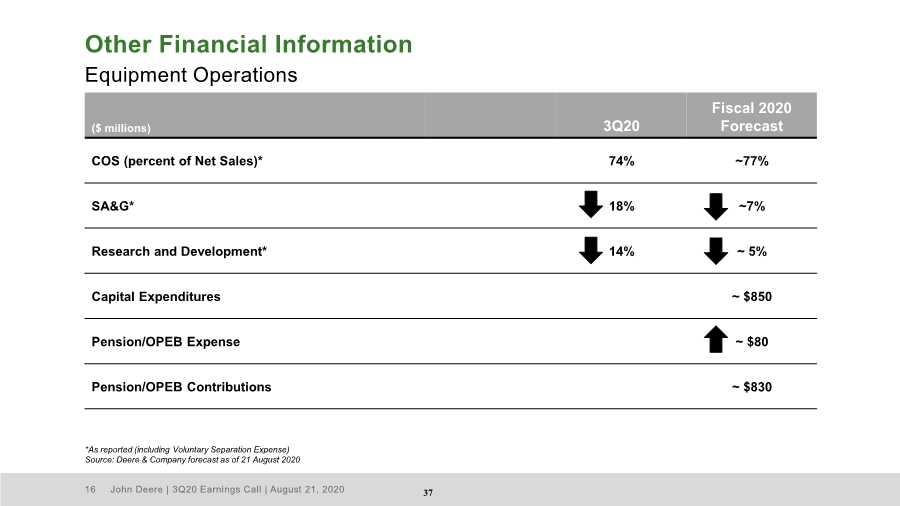
| John Deere | 3Q20 Earnings Call | August 21, 2020 16 ($ millions) 3Q20 Fiscal 2020 Forecast COS (percent of Net Sales)* 74% ~77% SA&G* 18% ~7% Research and Development* 14% ~ 5% Capital Expenditures ~ $850 Pension/OPEB Expense ~ $80 Pension/OPEB Contributions ~ $830 Other Financial Information Equipment Operations *As reported (including Voluntary Separation Expense) Source: Deere & Company forecast as of 21 August 2020 37 |
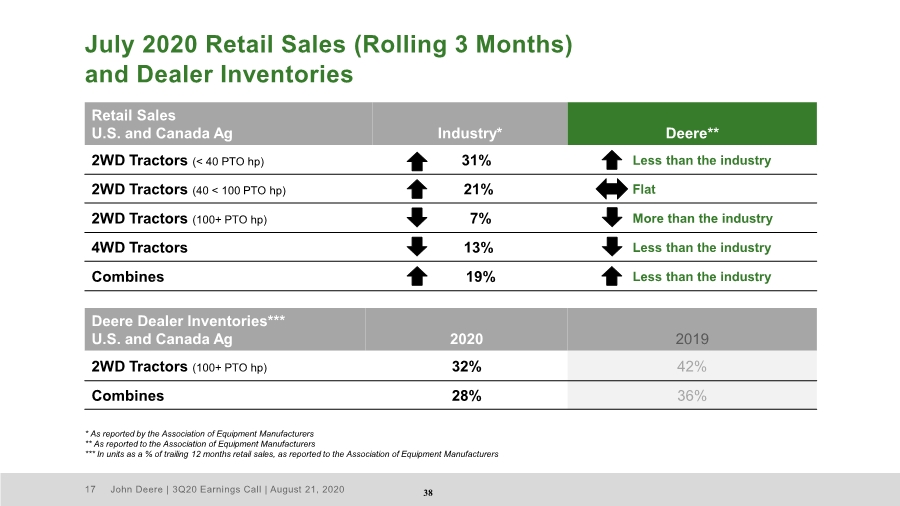
| John Deere | 3Q20 Earnings Call | August 21, 2020 17 July 2020 Retail Sales (Rolling 3 Months) and Dealer Inventories Retail Sales U.S. and Canada Ag Industry* Deere** 2WD Tractors (< 40 PTO hp) 31% Less than the industry 2WD Tractors (40 < 100 PTO hp) 21% Flat 2WD Tractors (100+ PTO hp) 7% More than the industry 4WD Tractors 13% Less than the industry Combines 19% Less than the industry Deere Dealer Inventories*** U.S. and Canada Ag 2020 2019 2WD Tractors (100+ PTO hp) 32% 42% Combines 28% 36% * As reported by the Association of Equipment Manufacturers ** As reported to the Association of Equipment Manufacturers *** In units as a % of trailing 12 months retail sales, as reported to the Association of Equipment Manufacturers 38 |
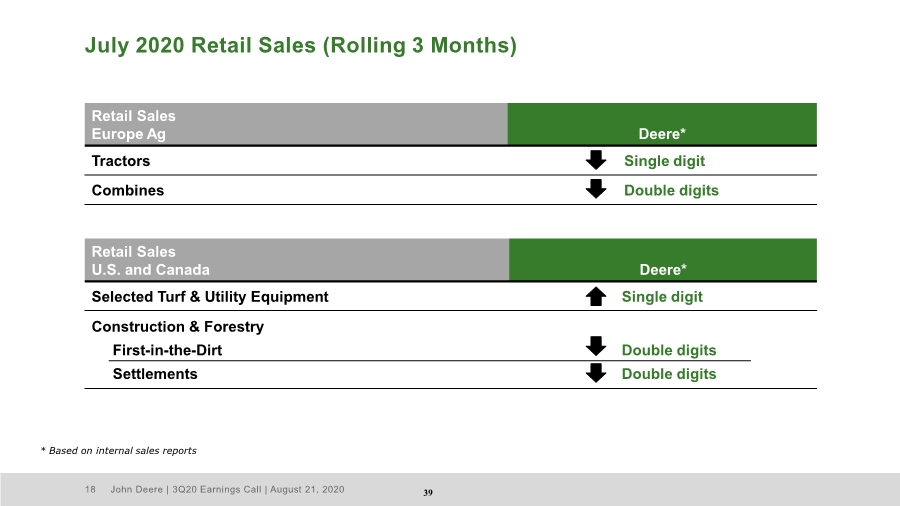
| John Deere | 3Q20 Earnings Call | August 21, 2020 18 Retail Sales U.S. and Canada Deere* Selected Turf & Utility Equipment Single digit Construction & Forestry First-in-the-Dirt Settlements Double digits Double digits July 2020 Retail Sales (Rolling 3 Months) Retail Sales Europe Ag Deere* Tractors Single digit Combines Double digits * Based on internal sales reports 39 |
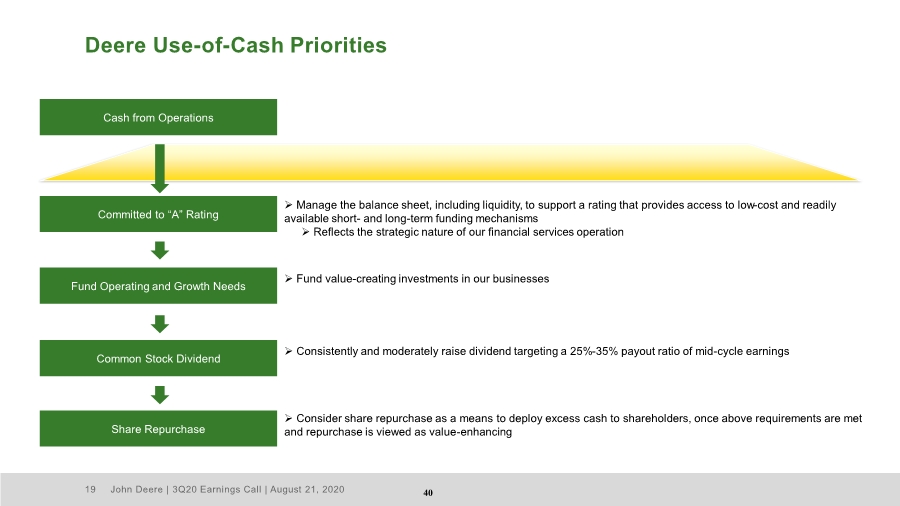
| John Deere | 3Q20 Earnings Call | August 21, 2020 19 Deere Use-of-Cash Priorities ➢ Manage the balance sheet, including liquidity, to support a rating that provides access to low-cost and readily available short- and long-term funding mechanisms ➢ Reflects the strategic nature of our financial services operation Committed to “A” Rating Cash from Operations Fund Operating and Growth Needs Common Stock Dividend Share Repurchase ➢ Fund value-creating investments in our businesses ➢ Consistently and moderately raise dividend targeting a 25%-35% payout ratio of mid-cycle earnings ➢ Consider share repurchase as a means to deploy excess cash to shareholders, once above requirements are met and repurchase is viewed as value-enhancing 40 |
| John Deere | 3Q20 Earnings Call | August 21, 2020 20 Deere & Company’s 4Q 2020 earnings call is scheduled for 9:00 a.m. central time on Wednesday, 25 November 2020. 41 |

| 42 |