Attached files
| file | filename |
|---|---|
| 8-K - 8-K - ZIONS BANCORPORATION, NATIONAL ASSOCIATION /UT/ | zions-20200818.htm |

Investor Update Third Quarter 2020 August 2020
Forward-Looking Statements; Use of Non-GAAP Financial Measures Forward Looking Information These materials include “forward-looking statements” as that term is defined in the Private Securities Litigation Reform Act of 1995. These statements are based on management’s current expectations and assumptions regarding future events or determinations, all of which are subject to known and unknown risks, uncertainties and other factors that may cause our actual results, performance or achievements, market trends, industry results or regulatory outcomes to differ materially from those expressed or implied by such forward-looking statements. Without limiting the foregoing, the words “forecasts,” “targets,” anticipates,” “believes,” “can,” “continue,” “could,” “estimates,” “expects,” “intends,” “may,” “might,” “plans,” “projects,” “should,” “would,” “targets,” “will” and the negative thereof and similar words and expressions are intended to identify forward-looking statements. Forward-looking statements by their nature address matters that are, to different degrees, uncertain, such as statements about future financial and operating results. Actual results and outcomes may differ materially from those presented, either expressed or implied, in these materials. Important risk factors that may cause such material differences include, but are not limited to, the effects of the spread of the virus commonly referred to as the coronavirus or COVID-19 (and other potentially similar pandemic situations) and associated impacts on general economic conditions on, among other things, our customers’ ability to make timely payments on obligations, fee income revenue due to reduced loan origination activity and card swipe income, operating expense due to alternative approaches to doing business, and so forth; the Bank’s ability to meet operating leverage goals; the rate of change of interest-sensitive assets and liabilities relative to changes in benchmark interest rates; the ability of the Bank to upgrade its core deposit system and implement new digital products in order to remain competitive; risks associated with information security, such as systems breaches and failures; and legislative, regulatory and economic developments. These risks, as well as other factors, are discussed in the Bank’s most recent Annual Report on Form 10-K and Quarterly Report on Form 10-Q, filed with the Securities and Exchange Commission (SEC) and available at the SEC’s Internet site (https://www.sec.gov/). In addition, you may obtain documents filed with the SEC by the Bank free of charge by contacting: Investor Relations, Zions Bancorporation, N.A., One South Main Street, 11th Floor, Salt Lake City, Utah 84133, (801) 844-7637. We caution you against undue reliance on forward-looking statements, which reflect our views only as of the date they are made. Except as may be required by law, Zions Bancorporation, N.A. specifically disclaims any obligation to update any factors or to publicly announce the result of revisions to any of the forward-looking statements included herein to reflect future events or developments. Use of Non-GAAP Financial Measures: This document contains several references to non-GAAP measures, including pre-provision net revenue and the “efficiency ratio,” which are common industry terms used by investors and financial services analysts. Certain of these non-GAAP measures are key inputs into Zions’ management compensation and are used in Zions’ strategic goals that have been and may continue to be articulated to investors. Therefore, the use of such non-GAAP measures are believed by management to be of substantial interest to the consumers of these financial disclosures and are used prominently throughout the disclosures. A full reconciliation of the difference between such measures and GAAP financials is provided within the document, and users of this document are encouraged to carefully review this reconciliation. 2
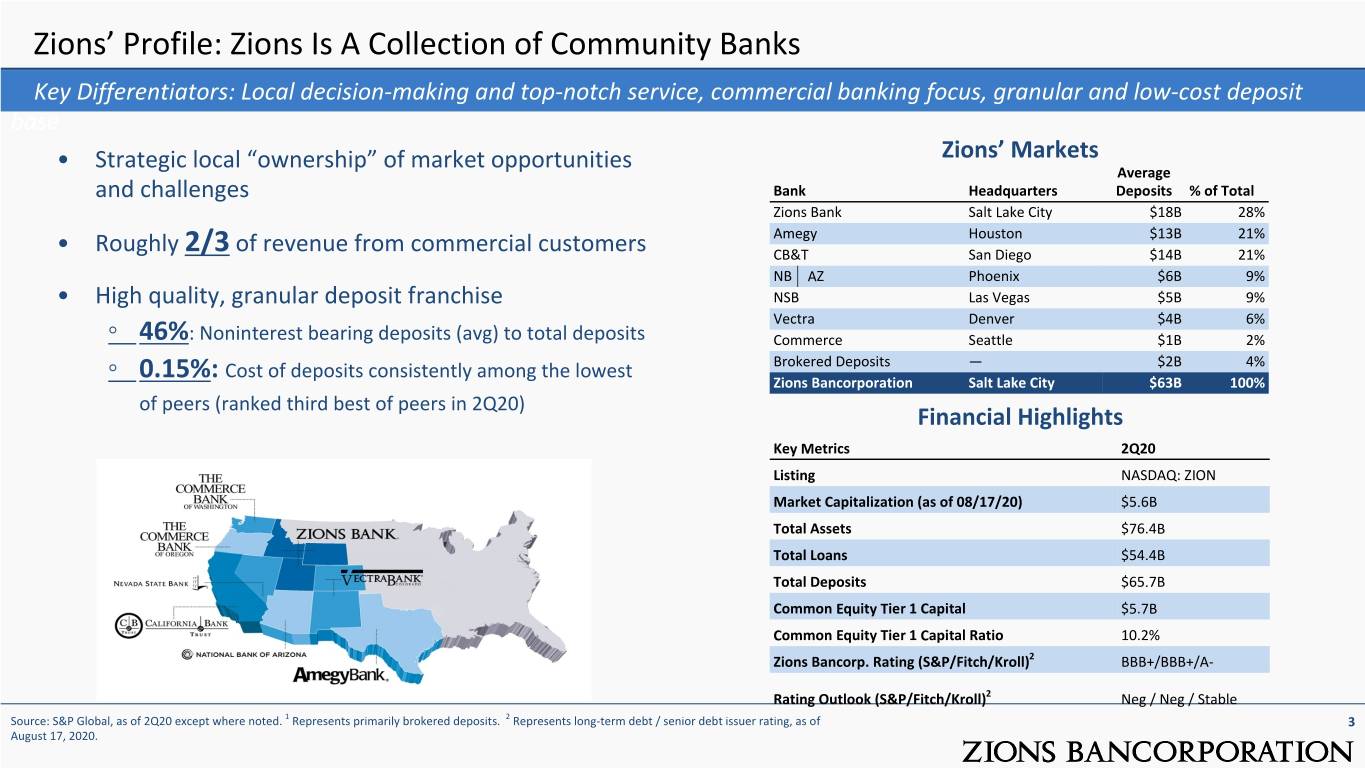
Zions’ Profile: Zions Is A Collection of Community Banks Key Differentiators: Local decision-making and top-notch service, commercial banking focus, granular and low-cost deposit base Zions’ Markets • Strategic local “ownership” of market opportunities Average and challenges Bank Headquarters Deposits % of Total Zions Bank Salt Lake City $18B 28% Amegy Houston $13B 21% • Roughly 2/3 of revenue from commercial customers CB&T San Diego $14B 21% NB│AZ Phoenix $6B 9% • High quality, granular deposit franchise NSB Las Vegas $5B 9% Vectra Denver $4B 6% ◦46%: Noninterest bearing deposits (avg) to total deposits Commerce Seattle $1B 2% Cost of deposits consistently among the lowest Brokered Deposits — $2B 4% ◦0.15%: Zions Bancorporation Salt Lake City $63B 100% of peers (ranked third best of peers in 2Q20) Financial Highlights Key Metrics 2Q20 Listing NASDAQ: ZION Market Capitalization (as of 08/17/20) $5.6B Total Assets $76.4B Total Loans $54.4B Total Deposits $65.7B Common Equity Tier 1 Capital $5.7B Common Equity Tier 1 Capital Ratio 10.2% Zions Bancorp. Rating (S&P/Fitch/Kroll)2 BBB+/BBB+/A- Rating Outlook (S&P/Fitch/Kroll)2 Neg / Neg / Stable Source: S&P Global, as of 2Q20 except where noted. 1 Represents primarily brokered deposits. 2 Represents long-term debt / senior debt issuer rating, as of 3 August 17, 2020.
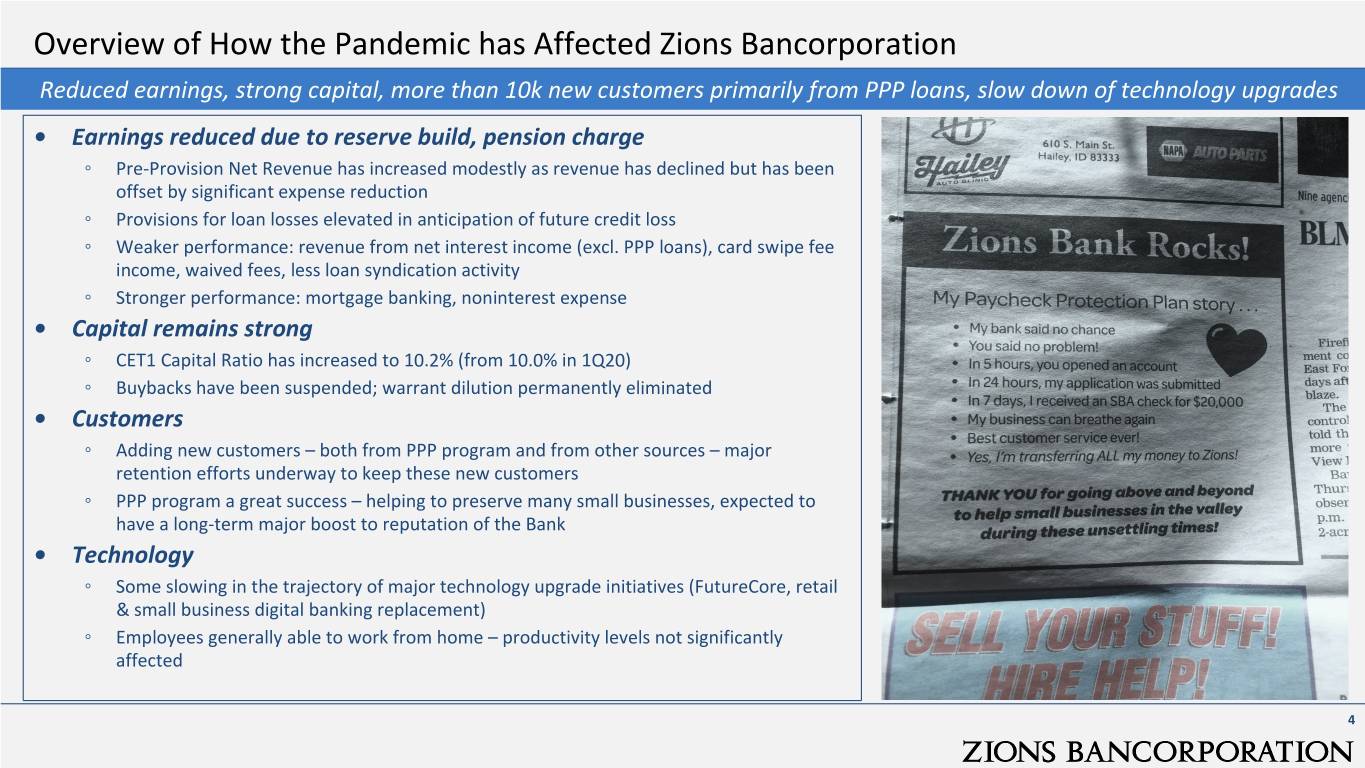
Overview of How the Pandemic has Affected Zions Bancorporation Reduced earnings, strong capital, more than 10k new customers primarily from PPP loans, slow down of technology upgrades • Earnings reduced due to reserve build, pension charge ◦ Pre-Provision Net Revenue has increased modestly as revenue has declined but has been offset by significant expense reduction ◦ Provisions for loan losses elevated in anticipation of future credit loss ◦ Weaker performance: revenue from net interest income (excl. PPP loans), card swipe fee income, waived fees, less loan syndication activity ◦ Stronger performance: mortgage banking, noninterest expense • Capital remains strong ◦ CET1 Capital Ratio has increased to 10.2% (from 10.0% in 1Q20) ◦ Buybacks have been suspended; warrant dilution permanently eliminated • Customers ◦ Adding new customers – both from PPP program and from other sources – major retention efforts underway to keep these new customers ◦ PPP program a great success – helping to preserve many small businesses, expected to have a long-term major boost to reputation of the Bank • Technology ◦ Some slowing in the trajectory of major technology upgrade initiatives (FutureCore, retail & small business digital banking replacement) ◦ Employees generally able to work from home – productivity levels not significantly affected 4
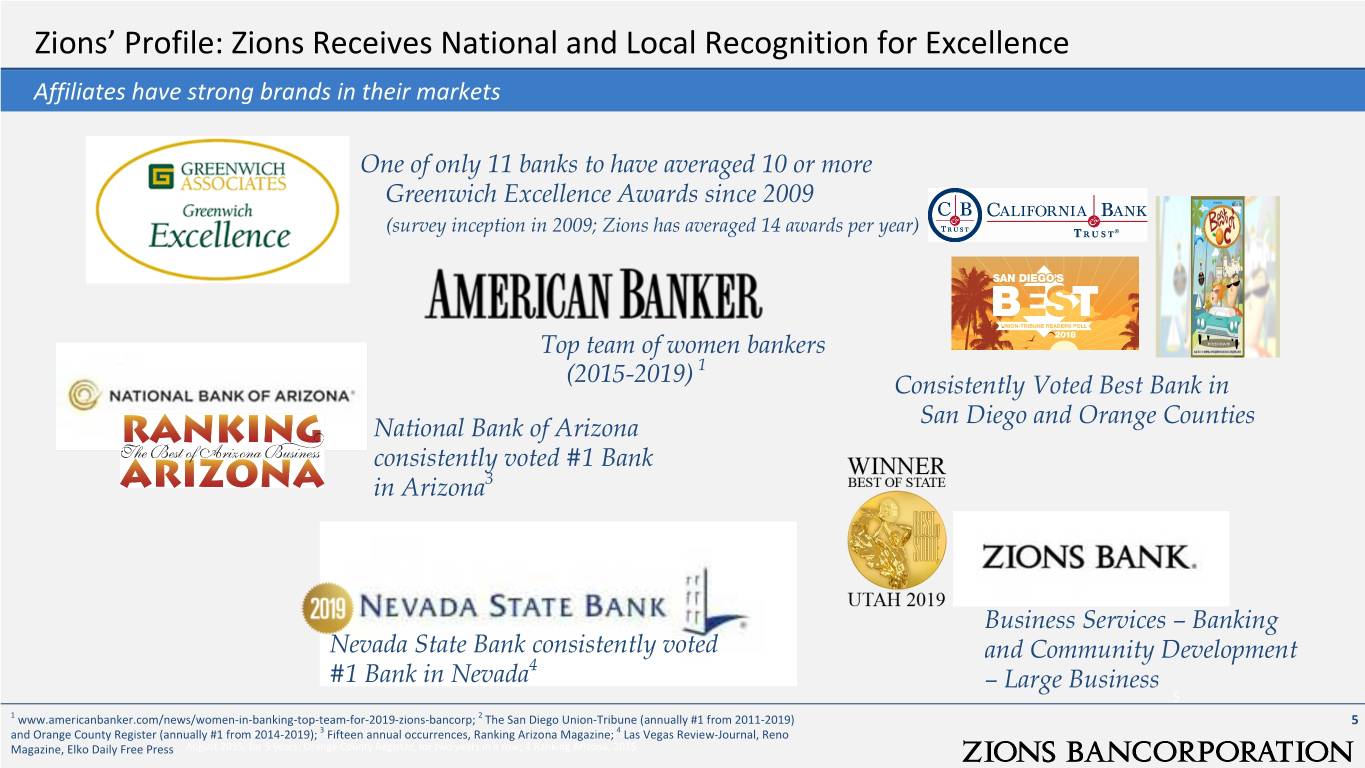
Zions’ Profile: Zions Receives National and Local Recognition for Excellence Affiliates have strong brands in their markets One of only 11 banks to have averaged 10 or more Greenwich Excellence Awards since 2009 (survey inception in 2009; Zions has averaged 14 awards per year) Top team of women bankers 1 (2015-2019) Consistently Voted Best Bank in San Diego and Orange Counties National Bank of Arizona consistently voted #1 Bank in Arizona3 Business Services – Banking Nevada State Bank consistently voted and Community Development 4 #1 Bank in Nevada – Large Business 5 1 www.americanbanker.com/news/women-in-banking-top-team-for-2019-zions-bancorp; 2 The San Diego Union-Tribune (annually #1 from 2011-2019) 5 and Orange County Register (annually #1 from 2014-2019); 1. One of five winning teams, 2015, Zions Bank; 2. exim.gov, April 24, 2014; 3.Readers of the San Diego Union-Tribune, 3 Fifteen annual occurrences, Ranking Arizona Magazine; 4 Las Vegas Review-Journal, Reno Magazine, Elko Daily Free Press August 2015, for 5 years; Orange County Register, for two years in a row; 4.Ranking Arizona, 2015
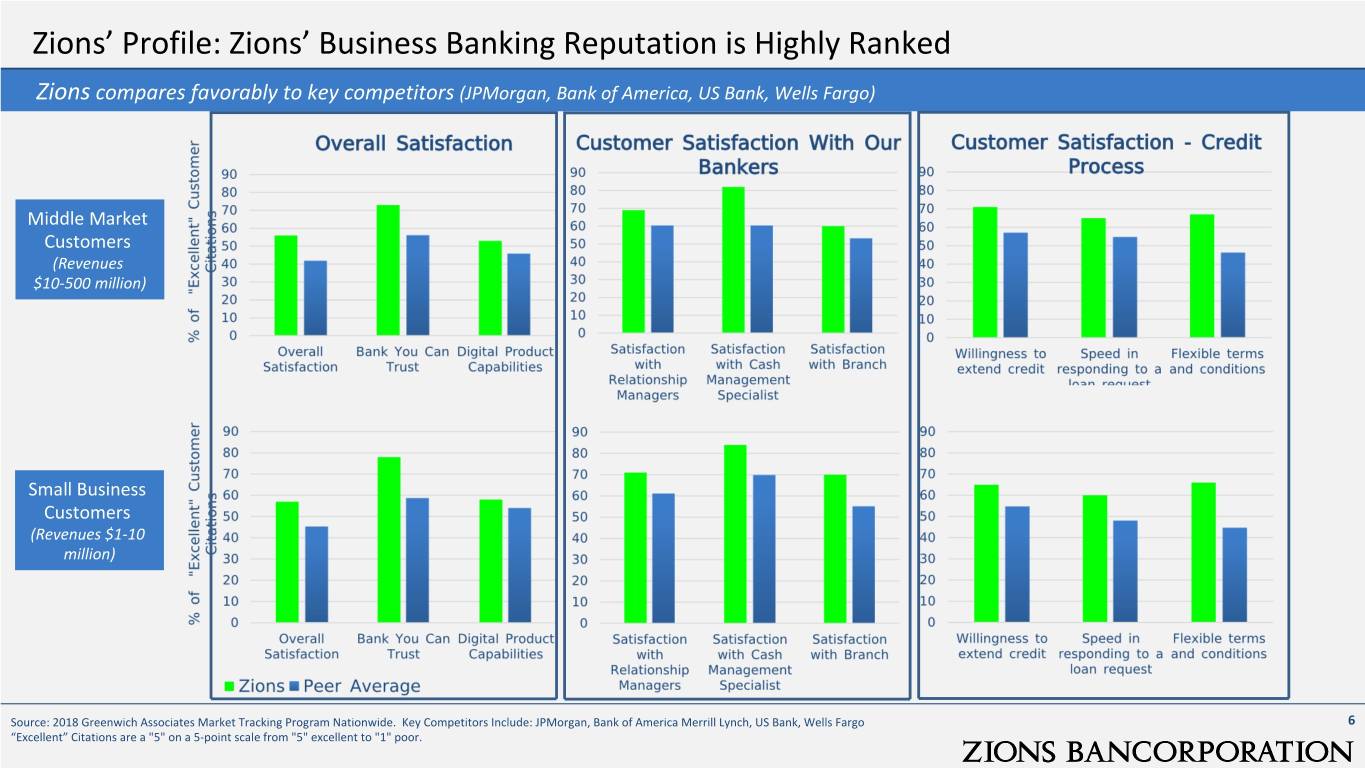
Zions’ Profile: Zions’ Business Banking Reputation is Highly Ranked Zions compares favorably to key competitors (JPMorgan, Bank of America, US Bank, Wells Fargo) Middle Market Customers (Revenues $10-500 million) Small Business Customers (Revenues $1-10 million) Source: 2018 Greenwich Associates Market Tracking Program Nationwide. Key Competitors Include: JPMorgan, Bank of America Merrill Lynch, US Bank, Wells Fargo 6 “Excellent” Citations are a "5" on a 5-point scale from "5" excellent to "1" poor.
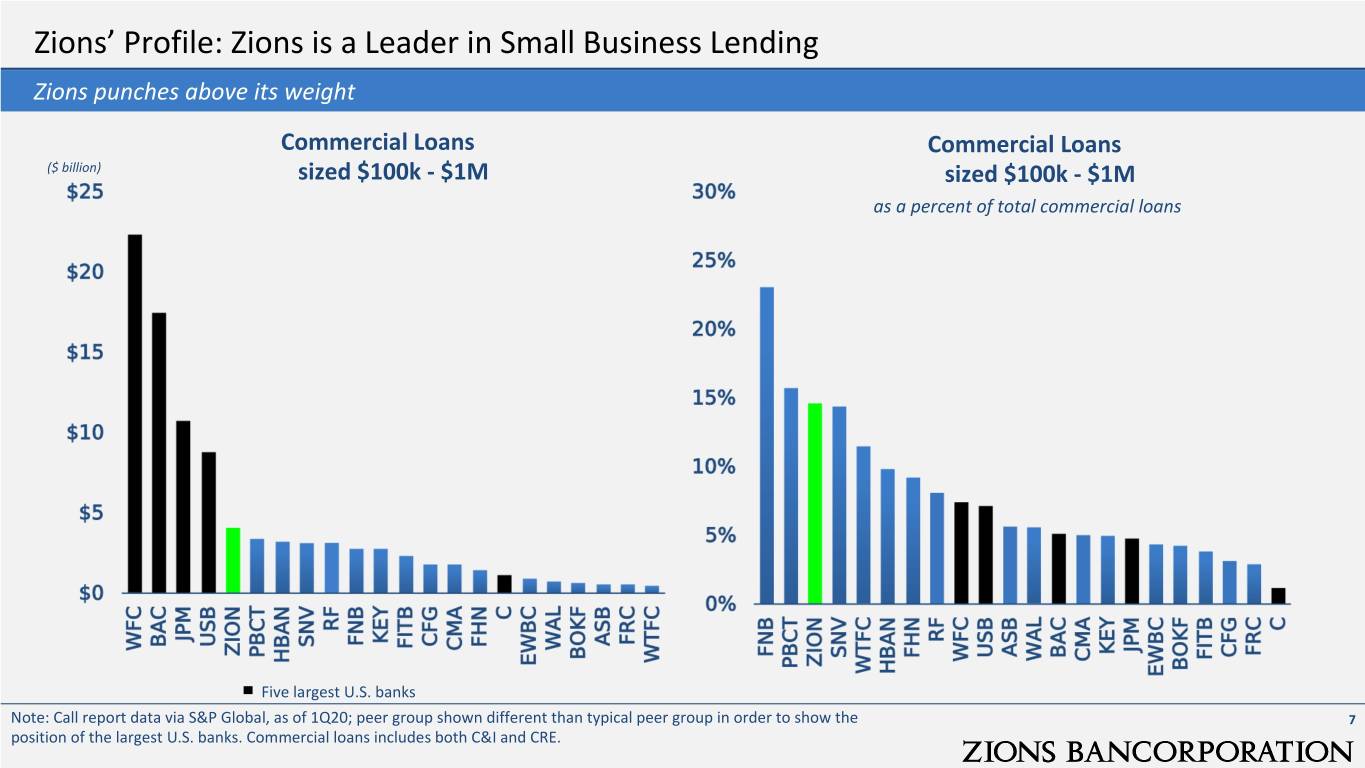
Zions’ Profile: Zions is a Leader in Small Business Lending Zions punches above its weight Commercial Loans Commercial Loans ($ billion) sized $100k - $1M sized $100k - $1M as a percent of total commercial loans Five largest U.S. banks Note: Call report data via S&P Global, as of 1Q20; peer group shown different than typical peer group in order to show the 7 position of the largest U.S. banks. Commercial loans includes both C&I and CRE.
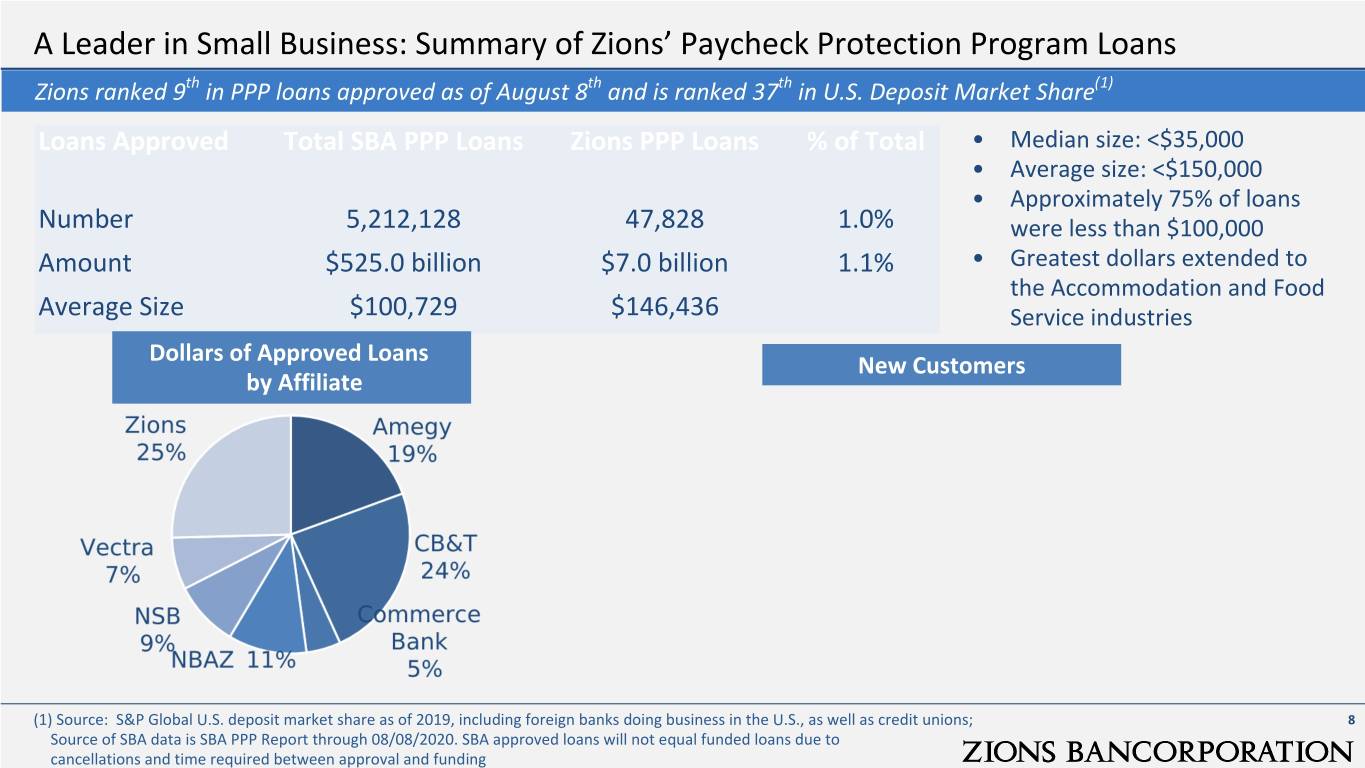
A Leader in Small Business: Summary of Zions’ Paycheck Protection Program Loans Zions ranked 9th in PPP loans approved as of August 8th and is ranked 37th in U.S. Deposit Market Share(1) Loans Approved Total SBA PPP Loans Zions PPP Loans % of Total • Median size: <$35,000 • Average size: <$150,000 • Approximately 75% of loans Number 5,212,128 47,828 1.0% were less than $100,000 Amount $525.0 billion $7.0 billion 1.1% • Greatest dollars extended to the Accommodation and Food Average Size $100,729 $146,436 Service industries Dollars of Approved Loans New Customers by Affiliate (1) Source: S&P Global U.S. deposit market share as of 2019, including foreign banks doing business in the U.S., as well as credit unions; 8 Source of SBA data is SBA PPP Report through 08/08/2020. SBA approved loans will not equal funded loans due to cancellations and time required between approval and funding
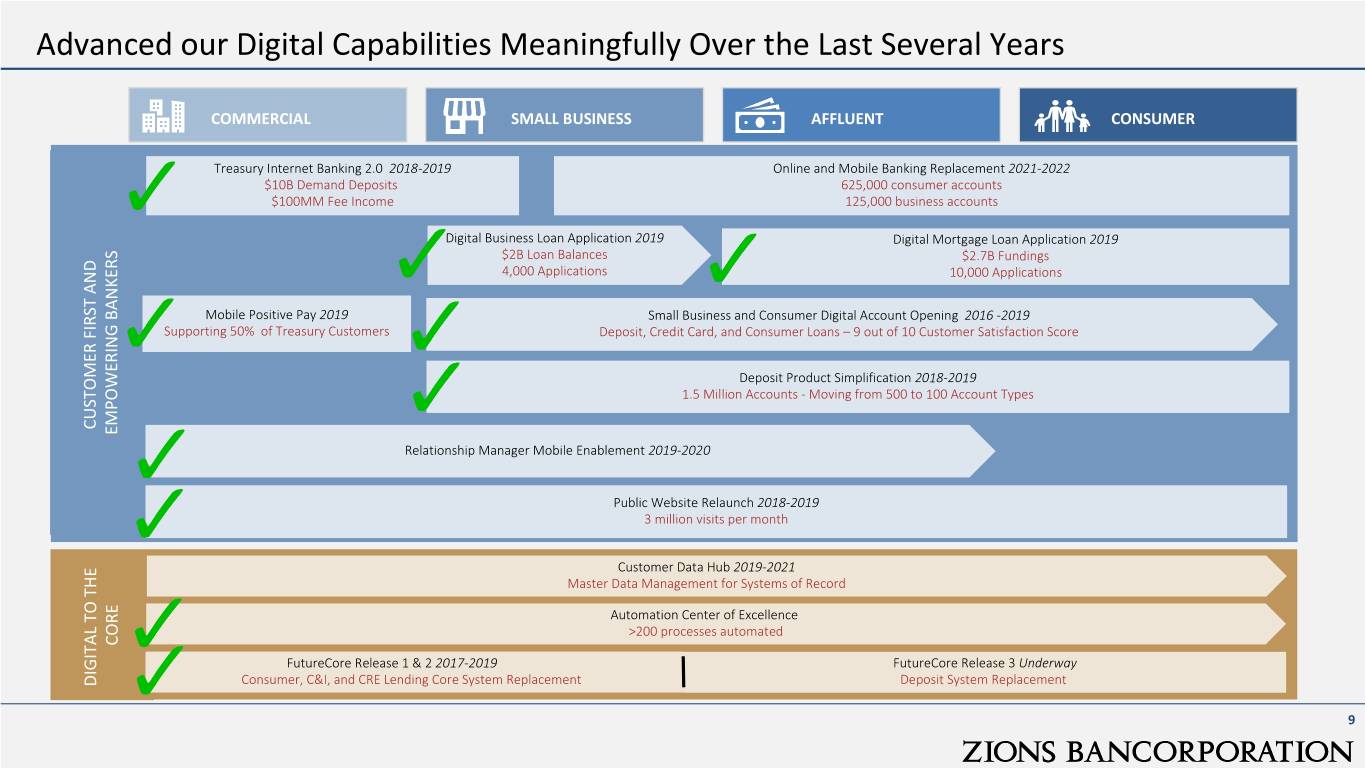
Advanced our Digital Capabilities Meaningfully Over the Last Several Years COMMERCIAL SMALL BUSINESS AFFLUENT CONSUMER Treasury Internet Banking 2.0 2018-2019 Online and Mobile Banking Replacement 2021-2022 $10B Demand Deposits 625,000 consumer accounts $100MM Fee Income 125,000 business accounts Digital Business Loan Application 2019 Digital Mortgage Loan Application 2019 $2B Loan Balances $2.7B Fundings 4,000 Applications 10,000 Applications Mobile Positive Pay 2019 Small Business and Consumer Digital Account Opening 2016 -2019 Supporting 50% of Treasury Customers Deposit, Credit Card, and Consumer Loans – 9 out of 10 Customer Satisfaction Score Deposit Product Simplification 2018-2019 1.5 Million Accounts - Moving from 500 to 100 Account Types CUSTOMER FIRST AND EMPOWERING BANKERS Relationship Manager Mobile Enablement 2019-2020 Public Website Relaunch 2018-2019 3 million visits per month Customer Data Hub 2019-2021 Master Data Management for Systems of Record Automation Center of Excellence >200 processes automated CORE FutureCore Release 1 & 2 2017-2019 FutureCore Release 3 Underway DIGITAL TO THE Consumer, C&I, and CRE Lending Core System Replacement Deposit System Replacement 9
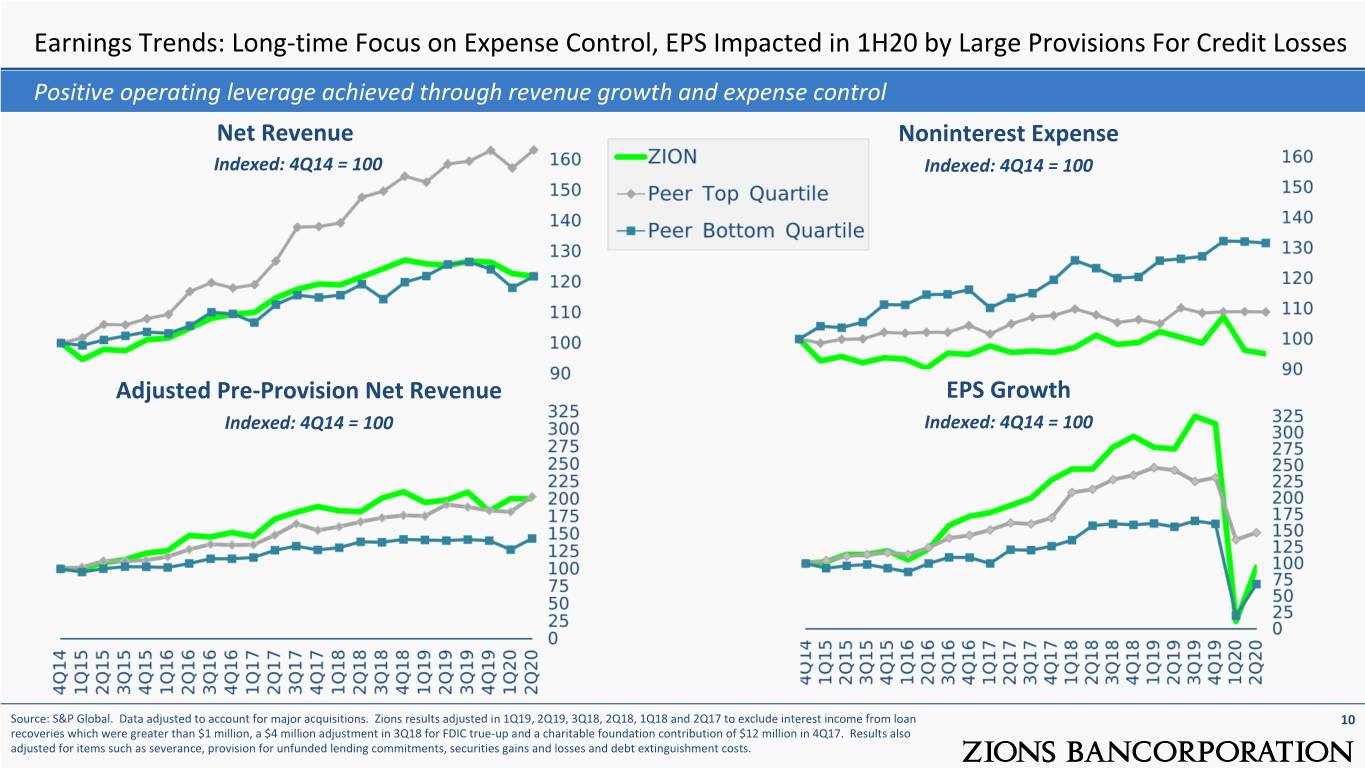
Earnings Trends: Long-time Focus on Expense Control, EPS Impacted in 1H20 by Large Provisions For Credit Losses Positive operating leverage achieved through revenue growth and expense control Net Revenue Noninterest Expense Indexed: 4Q14 = 100 Indexed: 4Q14 = 100 Adjusted Pre-Provision Net Revenue EPS Growth Indexed: 4Q14 = 100 Indexed: 4Q14 = 100 Source: S&P Global. Data adjusted to account for major acquisitions. Zions results adjusted in 1Q19, 2Q19, 3Q18, 2Q18, 1Q18 and 2Q17 to exclude interest income from loan 10 recoveries which were greater than $1 million, a $4 million adjustment in 3Q18 for FDIC true-up and a charitable foundation contribution of $12 million in 4Q17. Results also adjusted for items such as severance, provision for unfunded lending commitments, securities gains and losses and debt extinguishment costs.
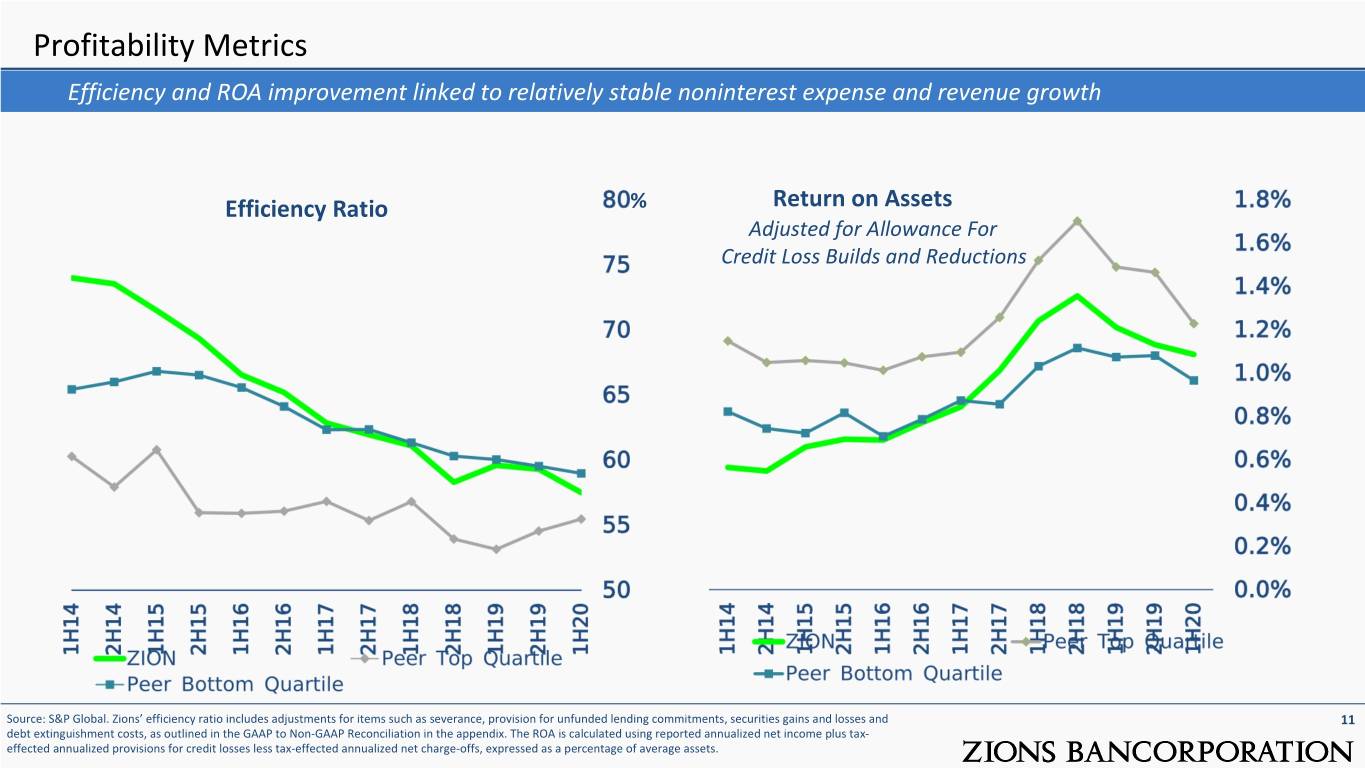
Profitability Metrics Efficiency and ROA improvement linked to relatively stable noninterest expense and revenue growth Efficiency Ratio % Return on Assets Adjusted for Allowance For Credit Loss Builds and Reductions Source: S&P Global. Zions’ efficiency ratio includes adjustments for items such as severance, provision for unfunded lending commitments, securities gains and losses and 11 debt extinguishment costs, as outlined in the GAAP to Non-GAAP Reconciliation in the appendix. The ROA is calculated using reported annualized net income plus tax- effected annualized provisions for credit losses less tax-effected annualized net charge-offs, expressed as a percentage of average assets.
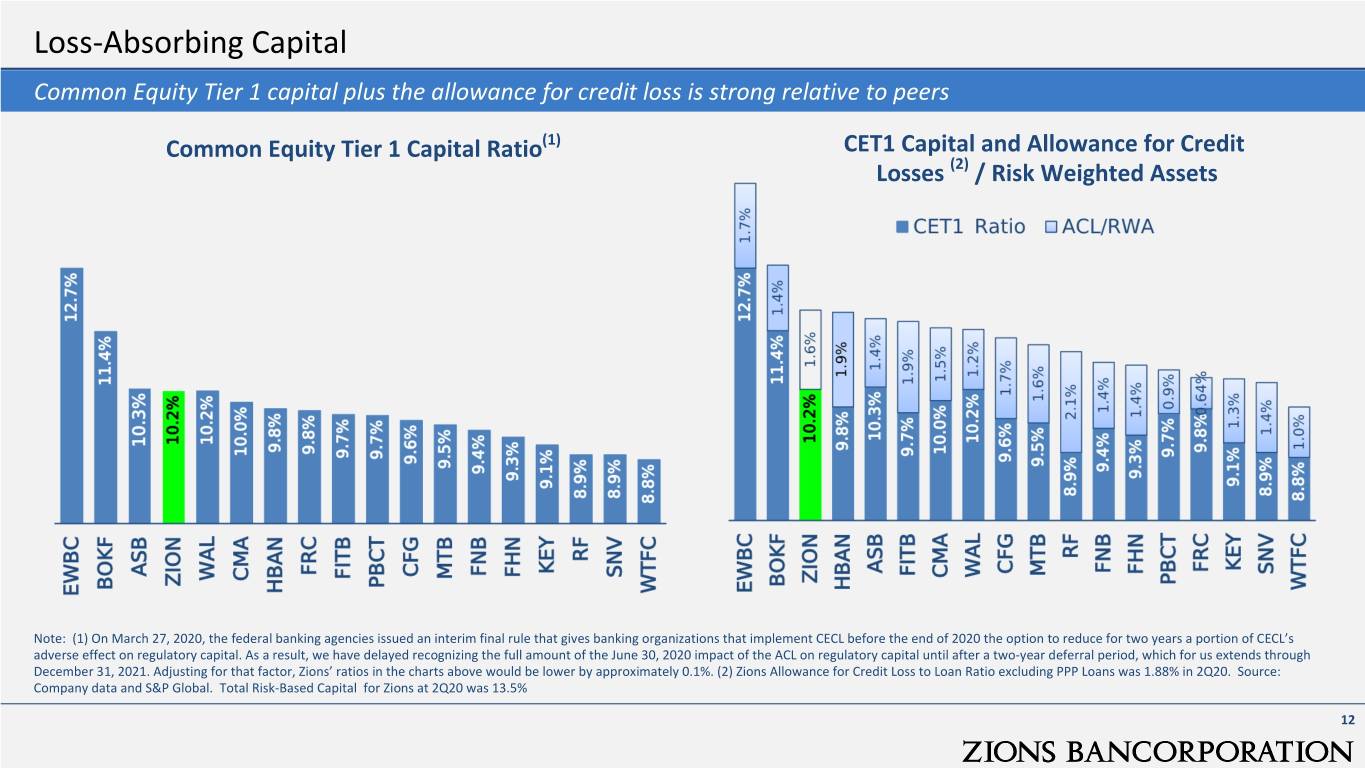
Loss-Absorbing Capital Common Equity Tier 1 capital plus the allowance for credit loss is strong relative to peers Common Equity Tier 1 Capital Ratio(1) CET1 Capital and Allowance for Credit Losses (2) / Risk Weighted Assets Note: (1) On March 27, 2020, the federal banking agencies issued an interim final rule that gives banking organizations that implement CECL before the end of 2020 the option to reduce for two years a portion of CECL’s adverse effect on regulatory capital. As a result, we have delayed recognizing the full amount of the June 30, 2020 impact of the ACL on regulatory capital until after a two-year deferral period, which for us extends through December 31, 2021. Adjusting for that factor, Zions’ ratios in the charts above would be lower by approximately 0.1%. (2) Zions Allowance for Credit Loss to Loan Ratio excluding PPP Loans was 1.88% in 2Q20. Source: Company data and S&P Global. Total Risk-Based Capital for Zions at 2Q20 was 13.5% 12
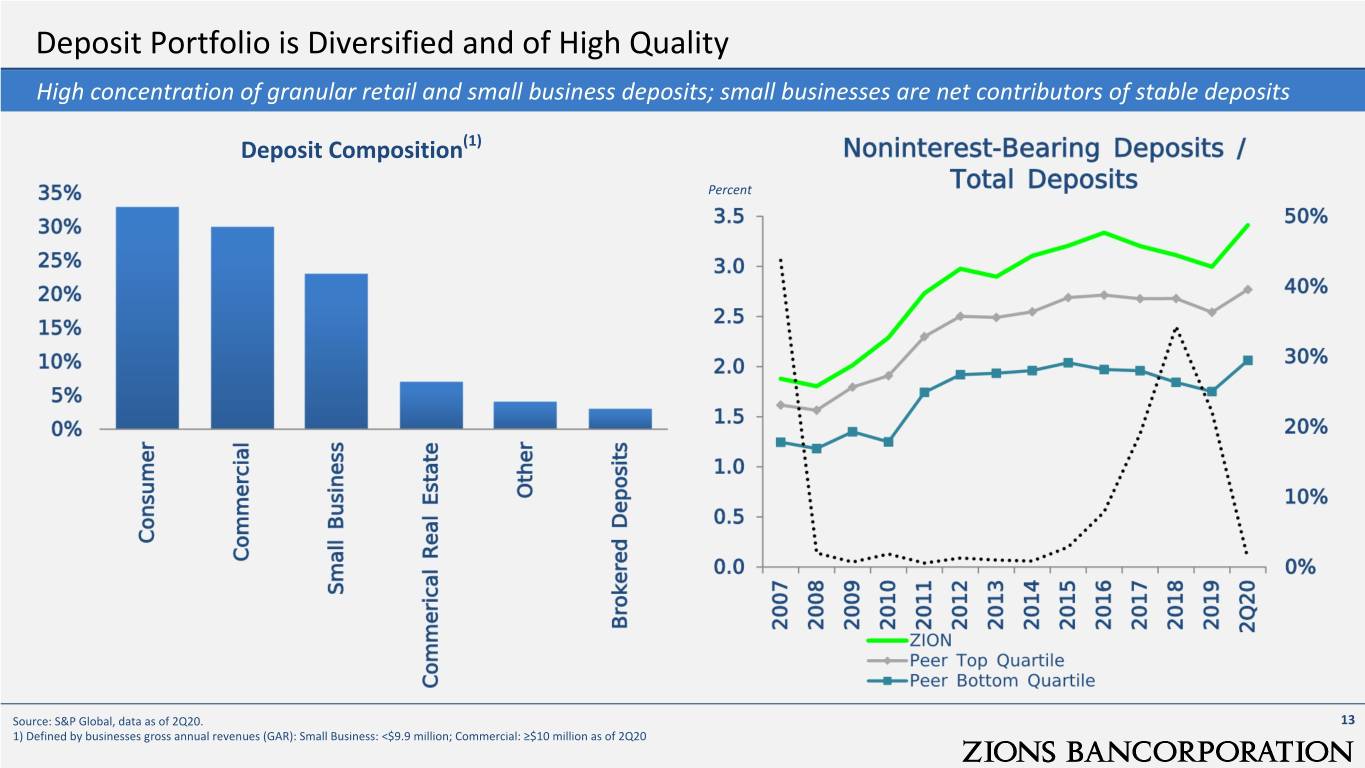
Deposit Portfolio is Diversified and of High Quality High concentration of granular retail and small business deposits; small businesses are net contributors of stable deposits Deposit Composition(1) Percent Source: S&P Global, data as of 2Q20. 13 1) Defined by businesses gross annual revenues (GAR): Small Business: <$9.9 million; Commercial: ≥$10 million as of 2Q20
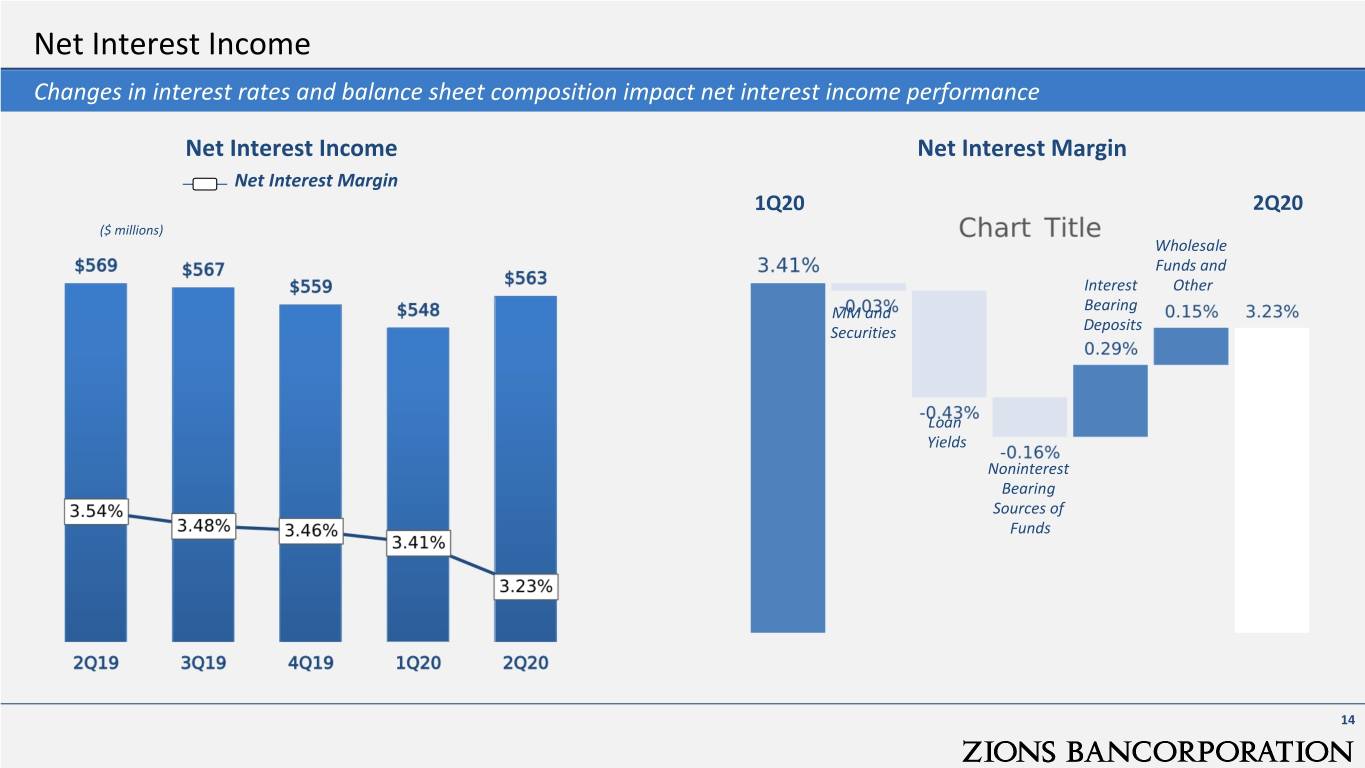
Net Interest Income Changes in interest rates and balance sheet composition impact net interest income performance Net Interest Income Net Interest Margin Net Interest Margin 1Q20 2Q20 ($ millions) Wholesale Funds and Interest Other MM and Bearing Securities Deposits Loan Yields Noninterest Bearing Sources of Funds 14
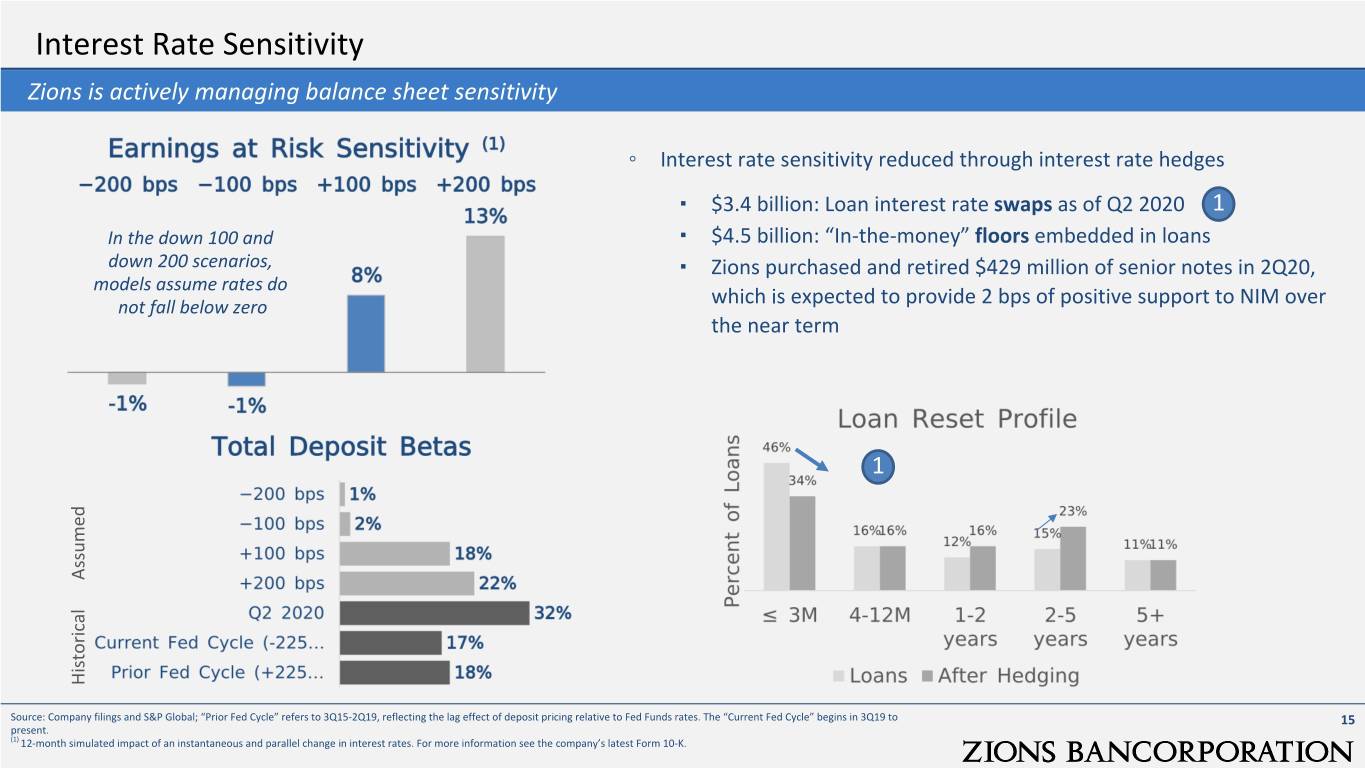
Interest Rate Sensitivity Zions is actively managing balance sheet sensitivity ◦ Interest rate sensitivity reduced through interest rate hedges ▪ $3.4 billion: Loan interest rate swaps as of Q2 2020 1 In the down 100 and ▪ $4.5 billion: “In-the-money” floors embedded in loans down 200 scenarios, ▪ Zions purchased and retired $429 million of senior notes in 2Q20, models assume rates do not fall below zero which is expected to provide 2 bps of positive support to NIM over the near term 1 Assumed Historical Source: Company filings and S&P Global; “Prior Fed Cycle” refers to 3Q15-2Q19, reflecting the lag effect of deposit pricing relative to Fed Funds rates. The “Current Fed Cycle” begins in 3Q19 to 15 present. (1) 12-month simulated impact of an instantaneous and parallel change in interest rates. For more information see the company’s latest Form 10-K.
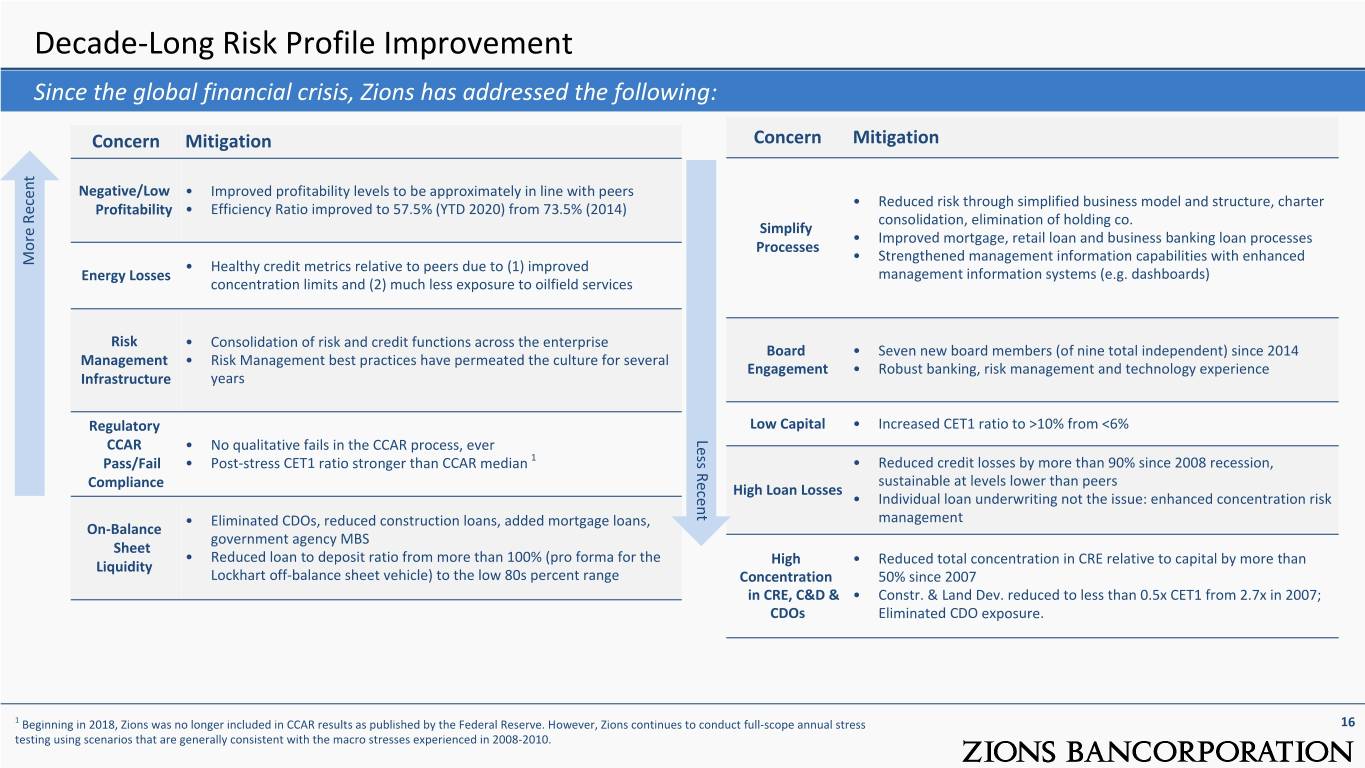
Decade-Long Risk Profile Improvement Since the global financial crisis, Zions has addressed the following: Concern Mitigation Concern Mitigation M Negative/Low • Improved profitability levels to be approximately in line with peers • Reduced risk through simplified business model and structure, charter or Profitability • Efficiency Ratio improved to 57.5% (YTD 2020) from 73.5% (2014) consolidation, elimination of holding co. e Simplify • Improved mortgage, retail loan and business banking loan processes Processes Re • Strengthened management information capabilities with enhanced More Recent • Healthy credit metrics relative to peers due to (1) improved ce Energy Losses management information systems (e.g. dashboards) nt concentration limits and (2) much less exposure to oilfield services Risk • Consolidation of risk and credit functions across the enterprise Board • Seven new board members (of nine total independent) since 2014 Management • Risk Management best practices have permeated the culture for several Engagement • Robust banking, risk management and technology experience Infrastructure years Regulatory Low Capital • Increased CET1 ratio to >10% from <6% CCAR • No qualitative fails in the CCAR process, ever Less Recent Pass/Fail • Post-stress CET1 ratio stronger than CCAR median 1 • Reduced credit losses by more than 90% since 2008 recession, sustainable at levels lower than peers Compliance High Loan Losses • Individual loan underwriting not the issue: enhanced concentration risk • Eliminated CDOs, reduced construction loans, added mortgage loans, management On-Balance government agency MBS Sheet • Reduced loan to deposit ratio from more than 100% (pro forma for the High • Reduced total concentration in CRE relative to capital by more than Liquidity Lockhart off-balance sheet vehicle) to the low 80s percent range Concentration 50% since 2007 in CRE, C&D & • Constr. & Land Dev. reduced to less than 0.5x CET1 from 2.7x in 2007; CDOs Eliminated CDO exposure. 1 Beginning in 2018, Zions was no longer included in CCAR results as published by the Federal Reserve. However, Zions continues to conduct full-scope annual stress 16 testing using scenarios that are generally consistent with the macro stresses experienced in 2008-2010.
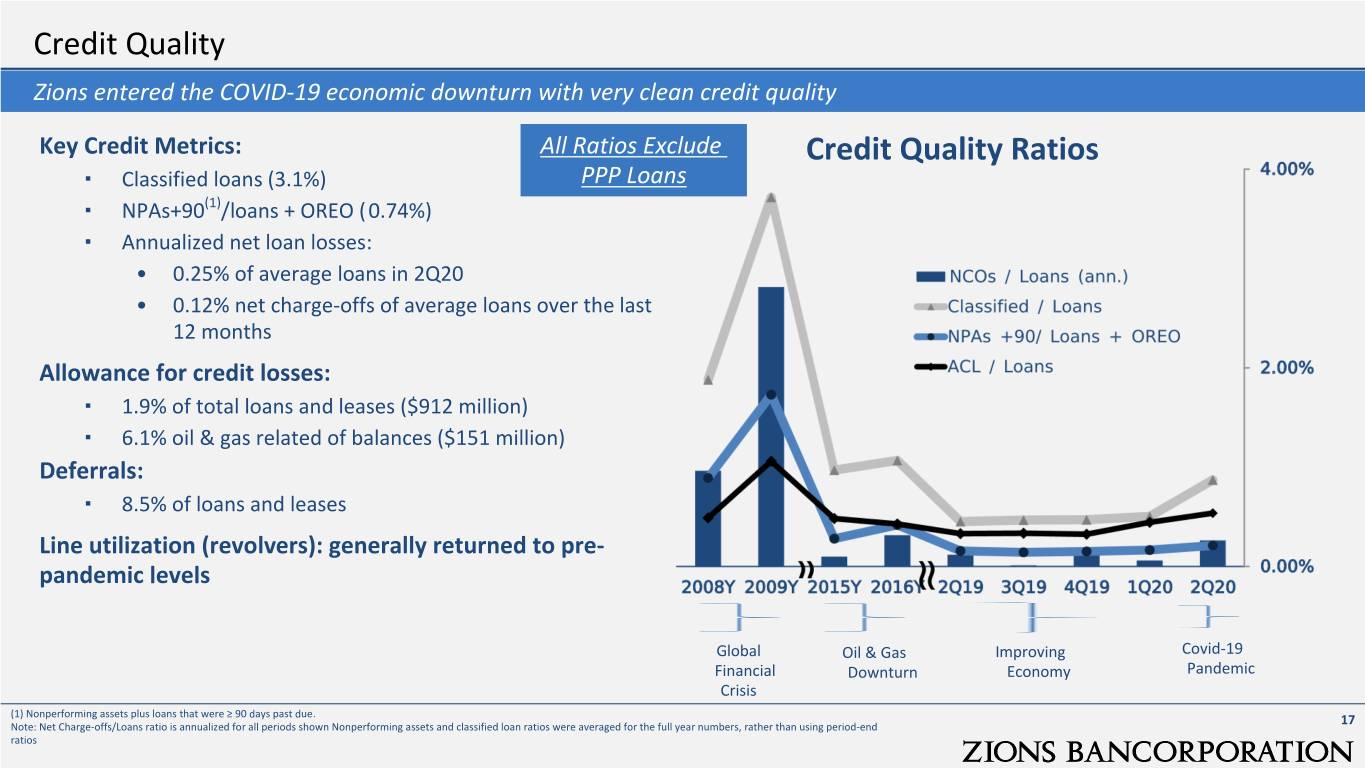
Credit Quality Zions entered the COVID-19 economic downturn with very clean credit quality Key Credit Metrics: All Ratios Exclude Credit Quality Ratios ▪ Classified loans (3.1%) PPP Loans (1) ▪ NPAs+90 /loans + OREO ( 0.74%) ▪ Annualized net loan losses: • 0.25% of average loans in 2Q20 • 0.12% net charge-offs of average loans over the last 12 months Allowance for credit losses: ▪ 1.9% of total loans and leases ($912 million) ▪ 6.1% oil & gas related of balances ($151 million) Deferrals: ▪ 8.5% of loans and leases Line utilization (revolvers): generally returned to pre- pandemic levels Global Oil & Gas Improving Covid-19 Financial Downturn Economy Pandemic Crisis (1) Nonperforming assets plus loans that were ≥ 90 days past due. Note: Net Charge-offs/Loans ratio is annualized for all periods shown Nonperforming assets and classified loan ratios were averaged for the full year numbers, rather than using period-end 17 ratios
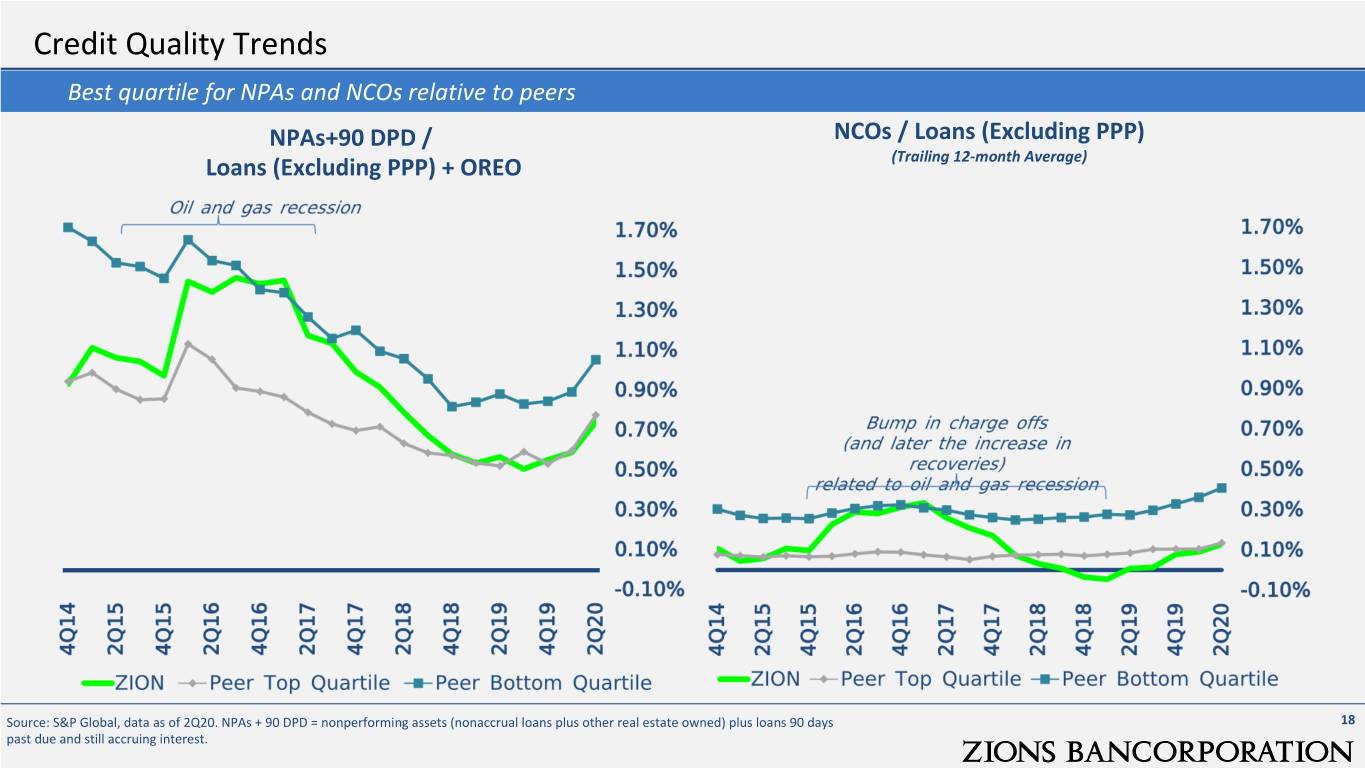
Credit Quality Trends Best quartile for NPAs and NCOs relative to peers NPAs+90 DPD / NCOs / Loans (Excluding PPP) Loans (Excluding PPP) + OREO (Trailing 12-month Average) Source: S&P Global, data as of 2Q20. NPAs + 90 DPD = nonperforming assets (nonaccrual loans plus other real estate owned) plus loans 90 days 18 past due and still accruing interest.
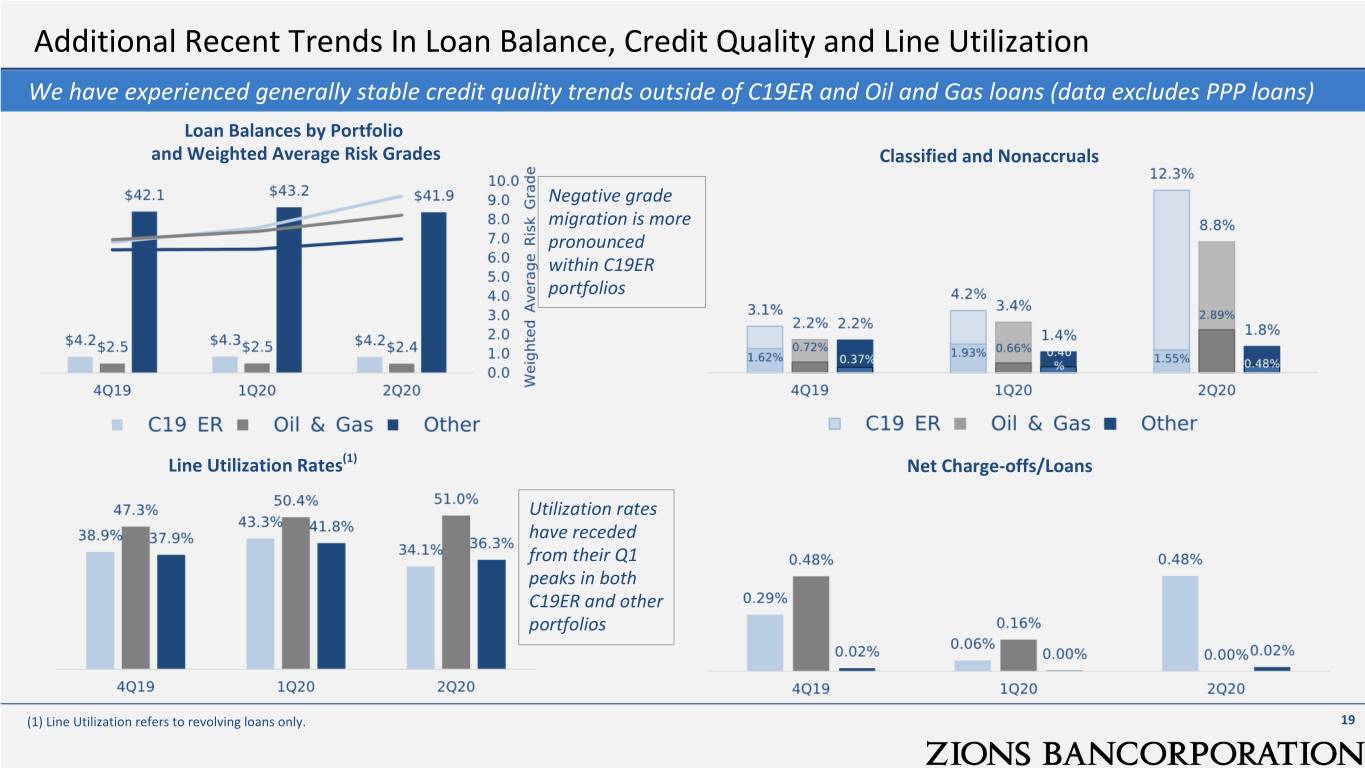
Additional Recent Trends In Loan Balance, Credit Quality and Line Utilization We have experienced generally stable credit quality trends outside of C19ER and Oil and Gas loans (data excludes PPP loans) Loan Balances by Portfolio and Weighted Average Risk Grades Classified and Nonaccruals Negative grade migration is more pronounced within C19ER portfolios Line Utilization Rates(1) Net Charge-offs/Loans Utilization rates have receded from their Q1 peaks in both C19ER and other portfolios (1) Line Utilization refers to revolving loans only. 19
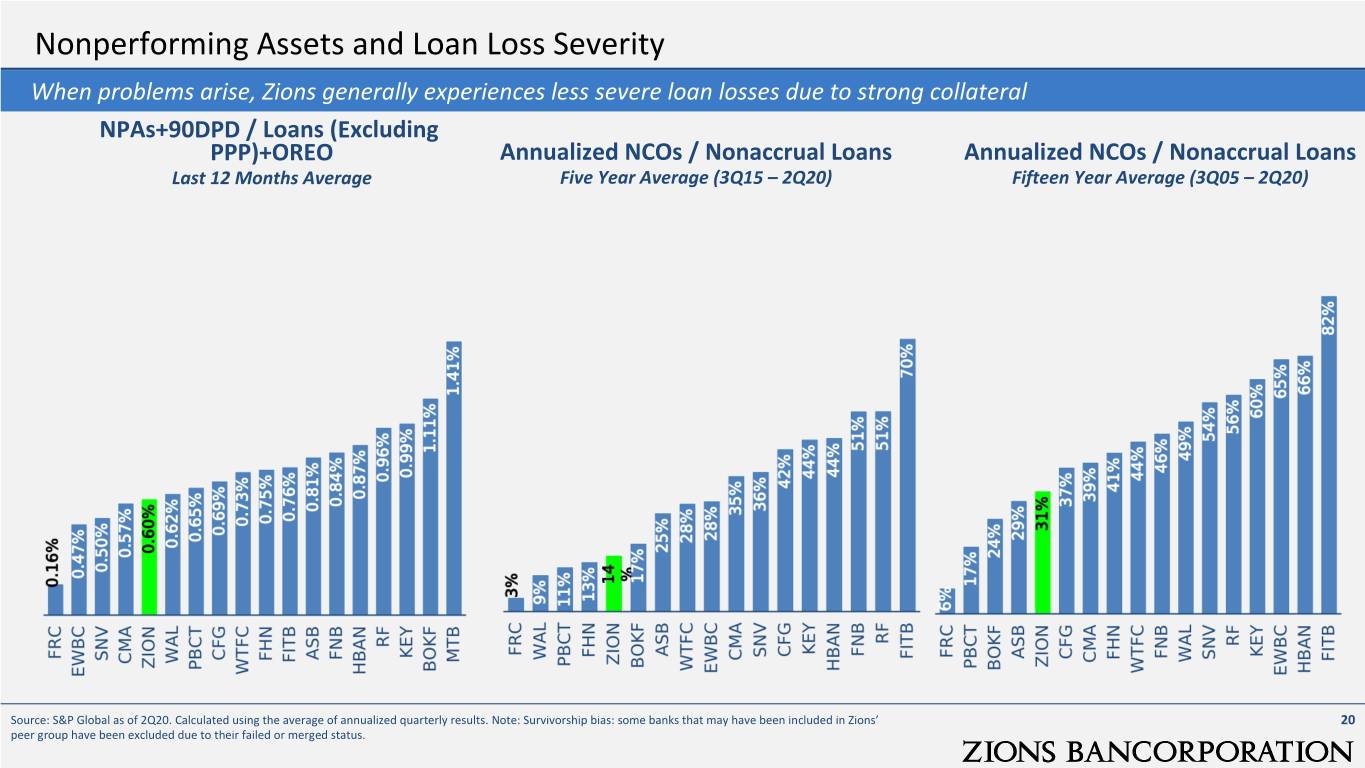
Nonperforming Assets and Loan Loss Severity When problems arise, Zions generally experiences less severe loan losses due to strong collateral NPAs+90DPD / Loans (Excluding PPP)+OREO Annualized NCOs / Nonaccrual Loans Annualized NCOs / Nonaccrual Loans Last 12 Months Average Five Year Average (3Q15 – 2Q20) Fifteen Year Average (3Q05 – 2Q20) Source: S&P Global as of 2Q20. Calculated using the average of annualized quarterly results. Note: Survivorship bias: some banks that may have been included in Zions’ 20 peer group have been excluded due to their failed or merged status.
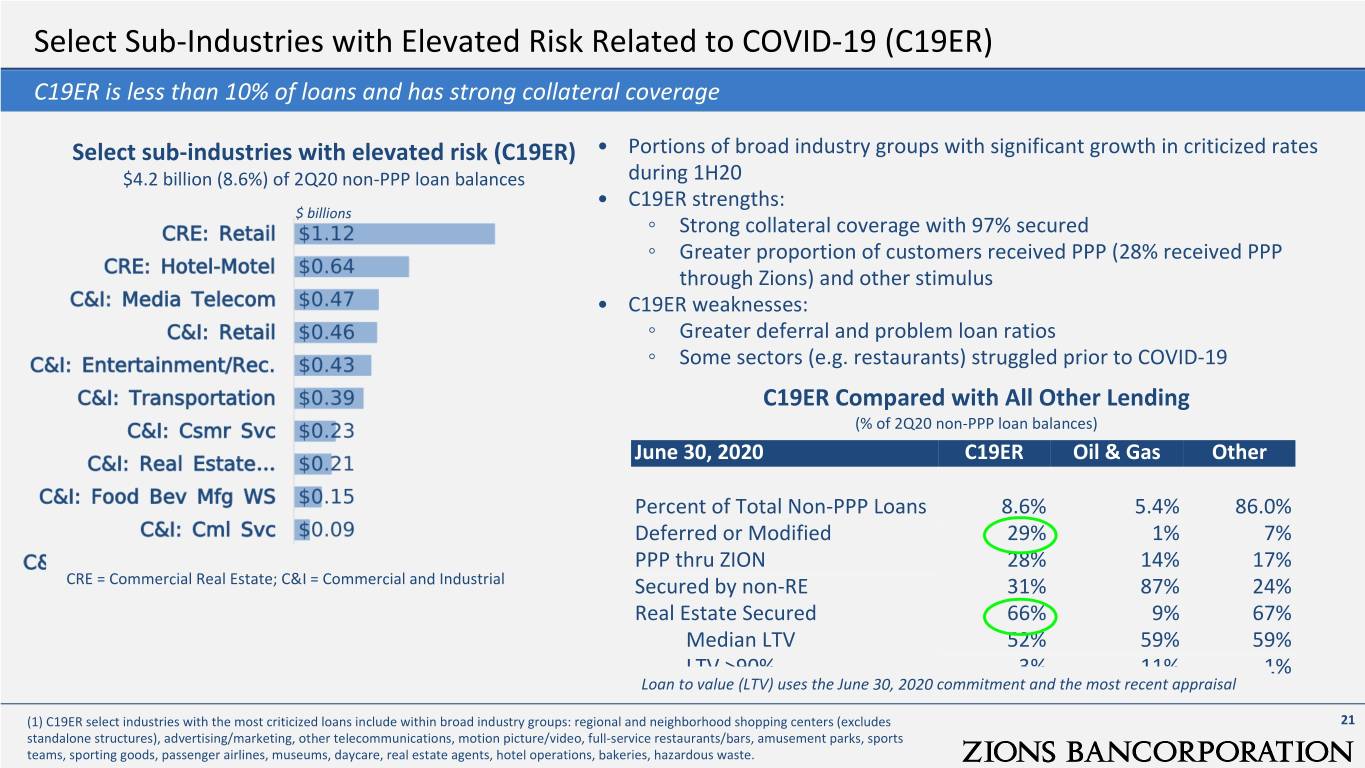
Select Sub-Industries with Elevated Risk Related to COVID-19 (C19ER) C19ER is less than 10% of loans and has strong collateral coverage Select sub-industries with elevated risk (C19ER) • Portions of broad industry groups with significant growth in criticized rates $4.2 billion (8.6%) of 2Q20 non-PPP loan balances during 1H20 • C19ER strengths: $ billions ◦ Strong collateral coverage with 97% secured ◦ Greater proportion of customers received PPP (28% received PPP through Zions) and other stimulus • C19ER weaknesses: ◦ Greater deferral and problem loan ratios ◦ Some sectors (e.g. restaurants) struggled prior to COVID-19 C19ER Compared with All Other Lending (% of 2Q20 non-PPP loan balances) June 30, 2020 C19ER Oil & Gas Other Percent of Total Non-PPP Loans 8.6% 5.4% 86.0% Deferred or Modified 29% 1% 7% PPP thru ZION 28% 14% 17% CRE = Commercial Real Estate; C&I = Commercial and Industrial Secured by non-RE 31% 87% 24% Real Estate Secured 66% 9% 67% Median LTV 52% 59% 59% LTV >90% 3% 11% 1% Loan to value (LTV) uses the June 30, 2020 commitment and the most recent appraisal (1) C19ER select industries with the most criticized loans include within broad industry groups: regional and neighborhood shopping centers (excludes 21 standalone structures), advertising/marketing, other telecommunications, motion picture/video, full-service restaurants/bars, amusement parks, sports teams, sporting goods, passenger airlines, museums, daycare, real estate agents, hotel operations, bakeries, hazardous waste.
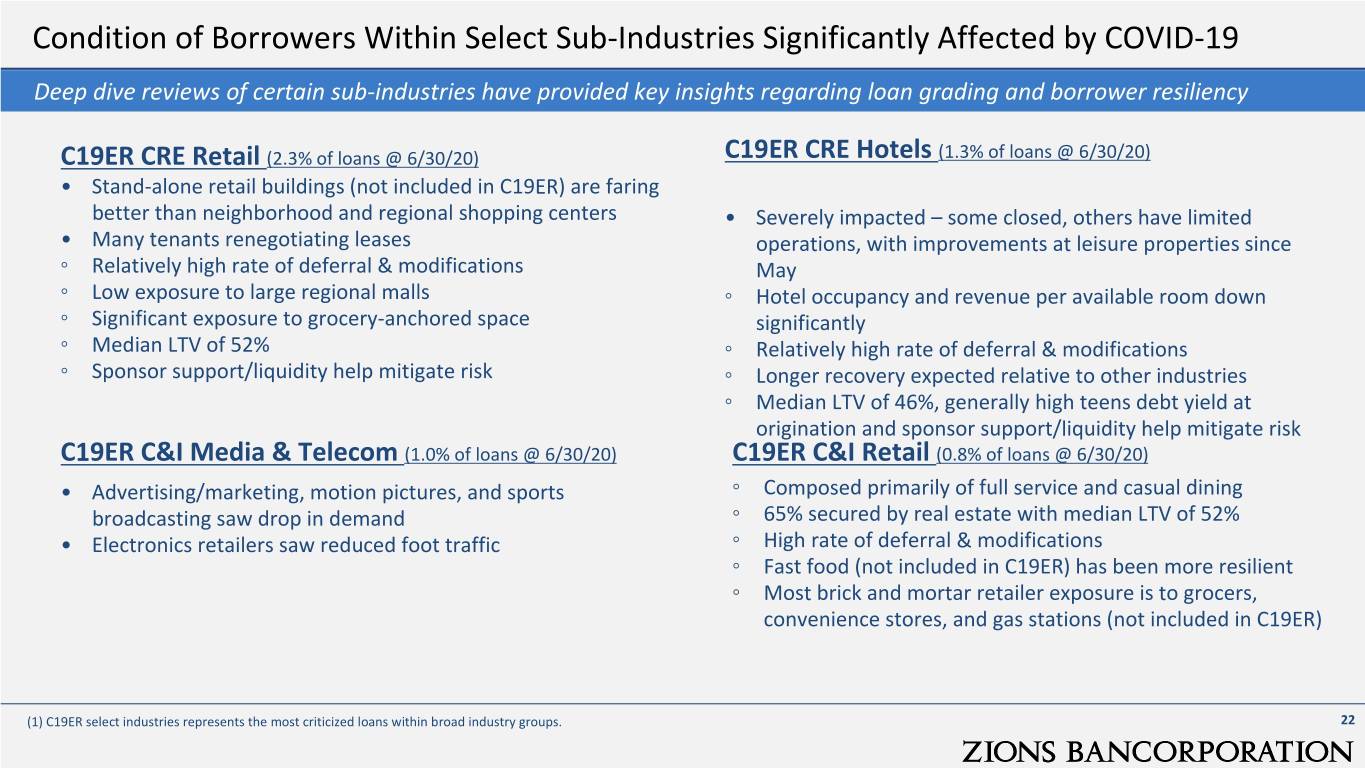
Condition of Borrowers Within Select Sub-Industries Significantly Affected by COVID-19 Deep dive reviews of certain sub-industries have provided key insights regarding loan grading and borrower resiliency C19ER CRE Retail (2.3% of loans @ 6/30/20) C19ER CRE Hotels (1.3% of loans @ 6/30/20) • Stand-alone retail buildings (not included in C19ER) are faring better than neighborhood and regional shopping centers • Severely impacted – some closed, others have limited • Many tenants renegotiating leases operations, with improvements at leisure properties since ◦ Relatively high rate of deferral & modifications May ◦ Low exposure to large regional malls ◦ Hotel occupancy and revenue per available room down ◦ Significant exposure to grocery-anchored space significantly ◦ Median LTV of 52% ◦ Relatively high rate of deferral & modifications ◦ Sponsor support/liquidity help mitigate risk ◦ Longer recovery expected relative to other industries ◦ Median LTV of 46%, generally high teens debt yield at origination and sponsor support/liquidity help mitigate risk C19ER C&I Media & Telecom (1.0% of loans @ 6/30/20) C19ER C&I Retail (0.8% of loans @ 6/30/20) • Advertising/marketing, motion pictures, and sports ◦ Composed primarily of full service and casual dining broadcasting saw drop in demand ◦ 65% secured by real estate with median LTV of 52% • Electronics retailers saw reduced foot traffic ◦ High rate of deferral & modifications ◦ Fast food (not included in C19ER) has been more resilient ◦ Most brick and mortar retailer exposure is to grocers, convenience stores, and gas stations (not included in C19ER) (1) C19ER select industries represents the most criticized loans within broad industry groups. 22
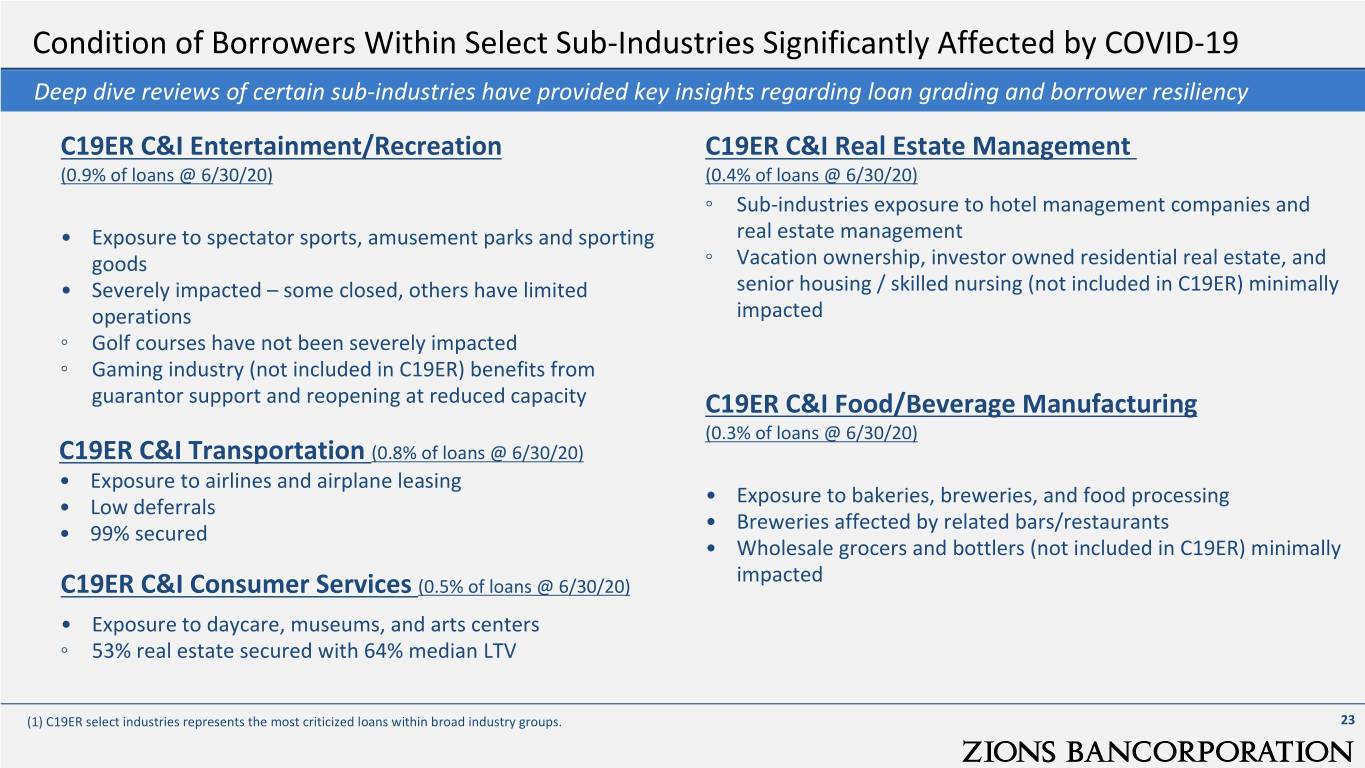
Condition of Borrowers Within Select Sub-Industries Significantly Affected by COVID-19 Deep dive reviews of certain sub-industries have provided key insights regarding loan grading and borrower resiliency C19ER C&I Entertainment/Recreation C19ER C&I Real Estate Management (0.9% of loans @ 6/30/20) (0.4% of loans @ 6/30/20) ◦ Sub-industries exposure to hotel management companies and • Exposure to spectator sports, amusement parks and sporting real estate management goods ◦ Vacation ownership, investor owned residential real estate, and • Severely impacted – some closed, others have limited senior housing / skilled nursing (not included in C19ER) minimally operations impacted ◦ Golf courses have not been severely impacted ◦ Gaming industry (not included in C19ER) benefits from guarantor support and reopening at reduced capacity C19ER C&I Food/Beverage Manufacturing (0.3% of loans @ 6/30/20) C19ER C&I Transportation (0.8% of loans @ 6/30/20) • Exposure to airlines and airplane leasing • Exposure to bakeries, breweries, and food processing • Low deferrals • Breweries affected by related bars/restaurants • 99% secured • Wholesale grocers and bottlers (not included in C19ER) minimally impacted C19ER C&I Consumer Services (0.5% of loans @ 6/30/20) • Exposure to daycare, museums, and arts centers ◦ 53% real estate secured with 64% median LTV (1) C19ER select industries represents the most criticized loans within broad industry groups. 23
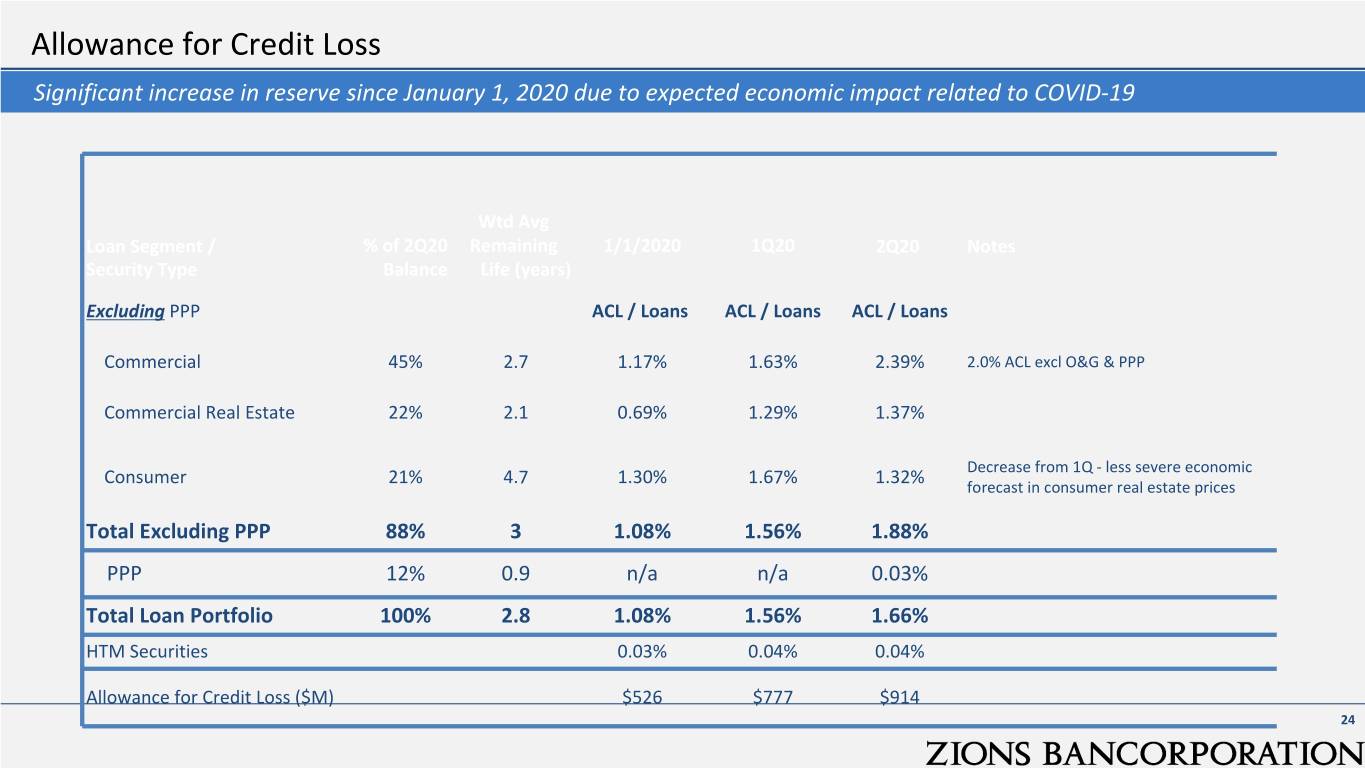
Allowance for Credit Loss Significant increase in reserve since January 1, 2020 due to expected economic impact related to COVID-19 Wtd Avg Loan Segment / % of 2Q20 Remaining 1/1/2020 1Q20 2Q20 Notes Security Type Balance Life (years) Excluding PPP ACL / Loans ACL / Loans ACL / Loans Commercial 45% 2.7 1.17% 1.63% 2.39% 2.0% ACL excl O&G & PPP Commercial Real Estate 22% 2.1 0.69% 1.29% 1.37% Decrease from 1Q - less severe economic Consumer 21% 4.7 1.30% 1.67% 1.32% forecast in consumer real estate prices Total Excluding PPP 88% 3 1.08% 1.56% 1.88% PPP 12% 0.9 n/a n/a 0.03% Total Loan Portfolio 100% 2.8 1.08% 1.56% 1.66% HTM Securities 0.03% 0.04% 0.04% Allowance for Credit Loss ($M) $526 $777 $914 24
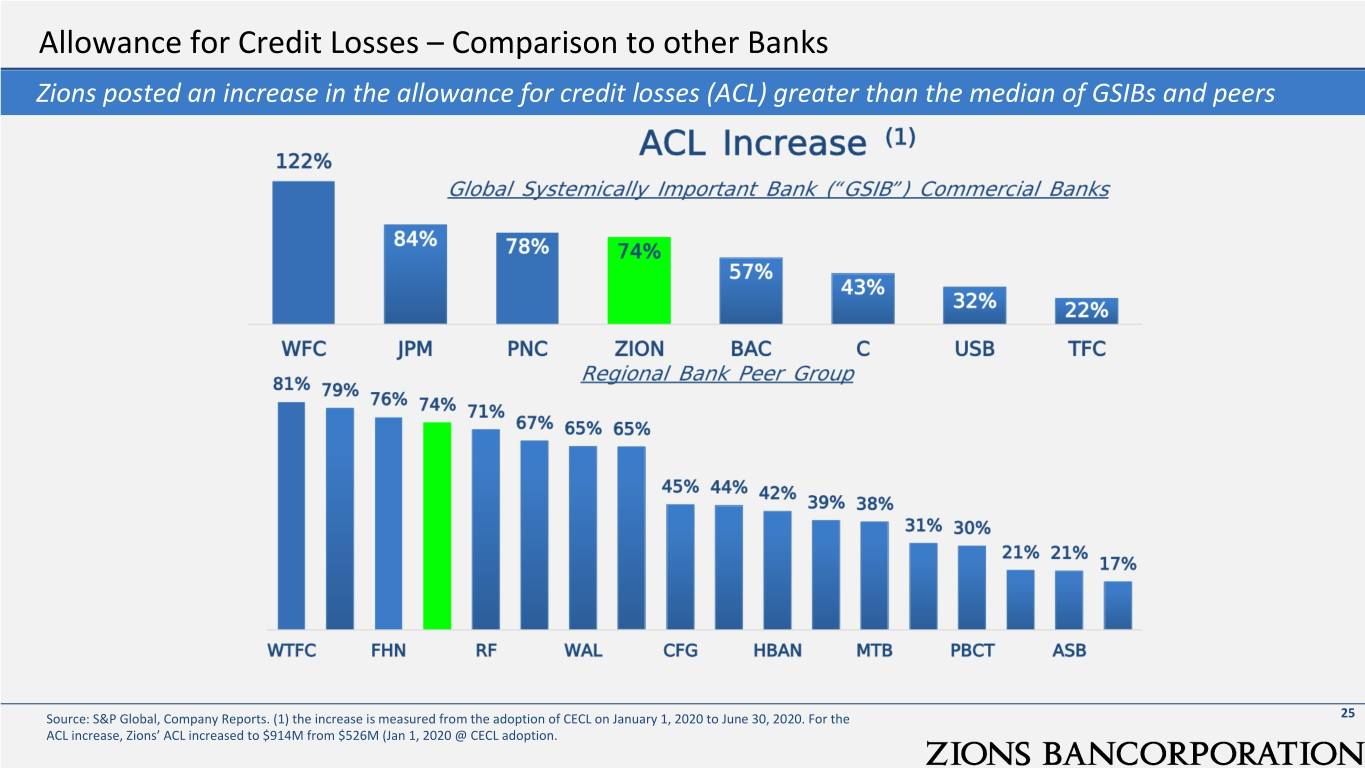
Allowance for Credit Losses – Comparison to other Banks Zions posted an increase in the allowance for credit losses (ACL) greater than the median of GSIBs and peers Source: S&P Global, Company Reports. (1) the increase is measured from the adoption of CECL on January 1, 2020 to June 30, 2020. For the 25 ACL increase, Zions’ ACL increased to $914M from $526M (Jan 1, 2020 @ CECL adoption.
Appendix • Company Abbreviation Key • 2Q20 Financial Results Summary • Loan Growth by Brand and Loan Type • Oil and Gas Portfolio Detail • Mortgage Fee Income Update • GAAP to Non-GAAP Reconciliation 26
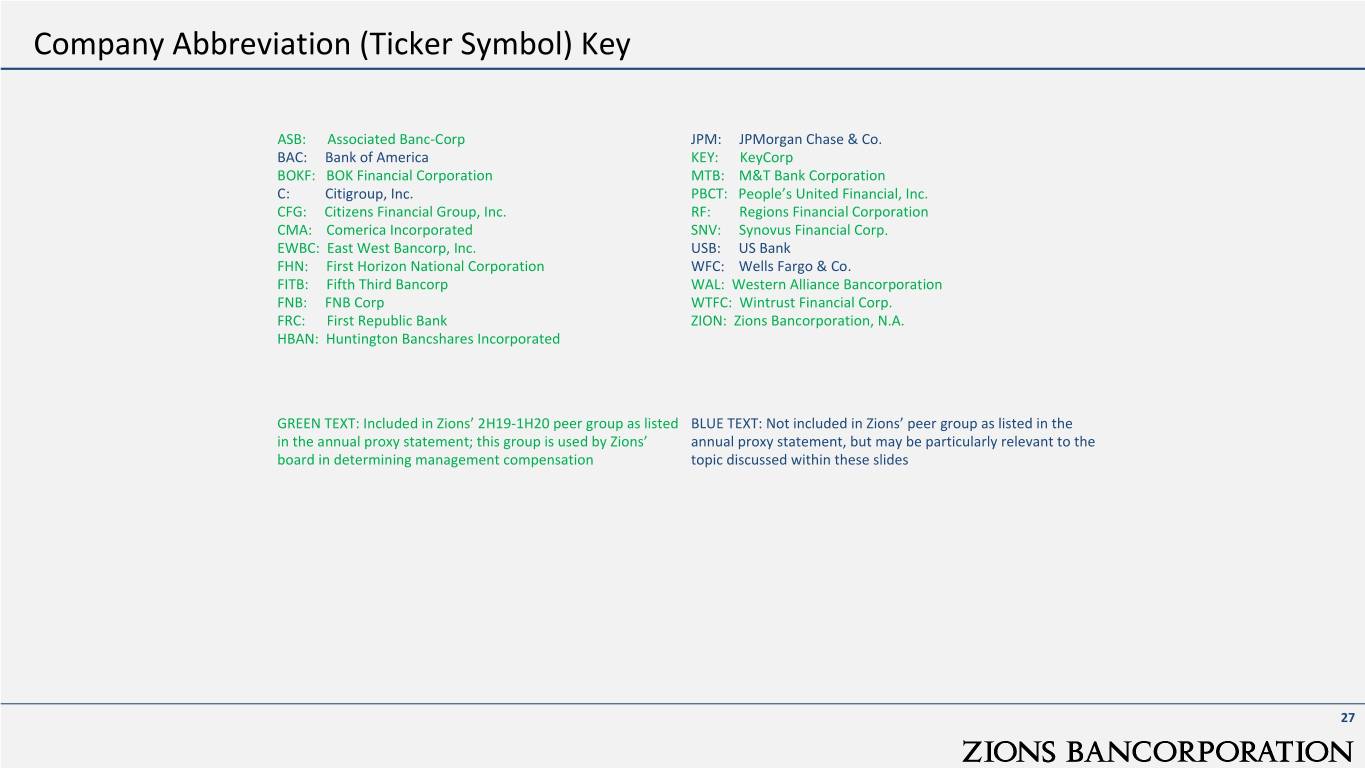
Company Abbreviation (Ticker Symbol) Key ASB: Associated Banc-Corp JPM: JPMorgan Chase & Co. BAC: Bank of America KEY: KeyCorp BOKF: BOK Financial Corporation MTB: M&T Bank Corporation C: Citigroup, Inc. PBCT: People’s United Financial, Inc. CFG: Citizens Financial Group, Inc. RF: Regions Financial Corporation CMA: Comerica Incorporated SNV: Synovus Financial Corp. EWBC: East West Bancorp, Inc. USB: US Bank FHN: First Horizon National Corporation WFC: Wells Fargo & Co. FITB: Fifth Third Bancorp WAL: Western Alliance Bancorporation FNB: FNB Corp WTFC: Wintrust Financial Corp. FRC: First Republic Bank ZION: Zions Bancorporation, N.A. HBAN: Huntington Bancshares Incorporated GREEN TEXT: Included in Zions’ 2H19-1H20 peer group as listed BLUE TEXT: Not included in Zions’ peer group as listed in the in the annual proxy statement; this group is used by Zions’ annual proxy statement, but may be particularly relevant to the board in determining management compensation topic discussed within these slides 27
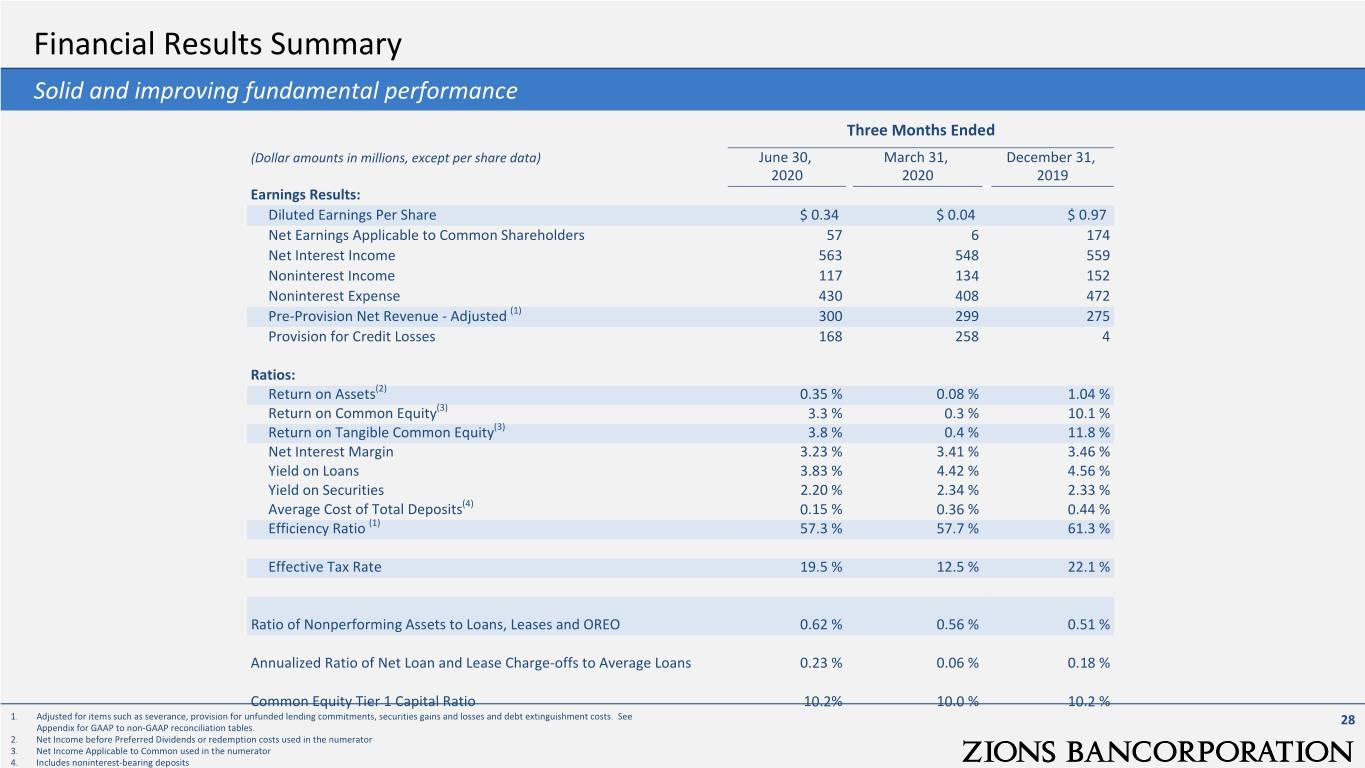
Financial Results Summary Solid and improving fundamental performance Three Months Ended (Dollar amounts in millions, except per share data) June 30, March 31, December 31, 2020 2020 2019 Earnings Results: Diluted Earnings Per Share $ 0.34 $ 0.04 $ 0.97 Net Earnings Applicable to Common Shareholders 57 6 174 Net Interest Income 563 548 559 Noninterest Income 117 134 152 Noninterest Expense 430 408 472 Pre-Provision Net Revenue - Adjusted (1) 300 299 275 Provision for Credit Losses 168 258 4 Ratios: Return on Assets(2) 0.35 % 0.08 % 1.04 % Return on Common Equity(3) 3.3 % 0.3 % 10.1 % Return on Tangible Common Equity(3) 3.8 % 0.4 % 11.8 % Net Interest Margin 3.23 % 3.41 % 3.46 % Yield on Loans 3.83 % 4.42 % 4.56 % Yield on Securities 2.20 % 2.34 % 2.33 % Average Cost of Total Deposits(4) 0.15 % 0.36 % 0.44 % Efficiency Ratio (1) 57.3 % 57.7 % 61.3 % Effective Tax Rate 19.5 % 12.5 % 22.1 % Ratio of Nonperforming Assets to Loans, Leases and OREO 0.62 % 0.56 % 0.51 % Annualized Ratio of Net Loan and Lease Charge-offs to Average Loans 0.23 % 0.06 % 0.18 % Common Equity Tier 1 Capital Ratio 10.2% 10.0 % 10.2 % 1. Adjusted for items such as severance, provision for unfunded lending commitments, securities gains and losses and debt extinguishment costs. See 28 Appendix for GAAP to non-GAAP reconciliation tables. 2. Net Income before Preferred Dividends or redemption costs used in the numerator 3. Net Income Applicable to Common used in the numerator 4. Includes noninterest-bearing deposits
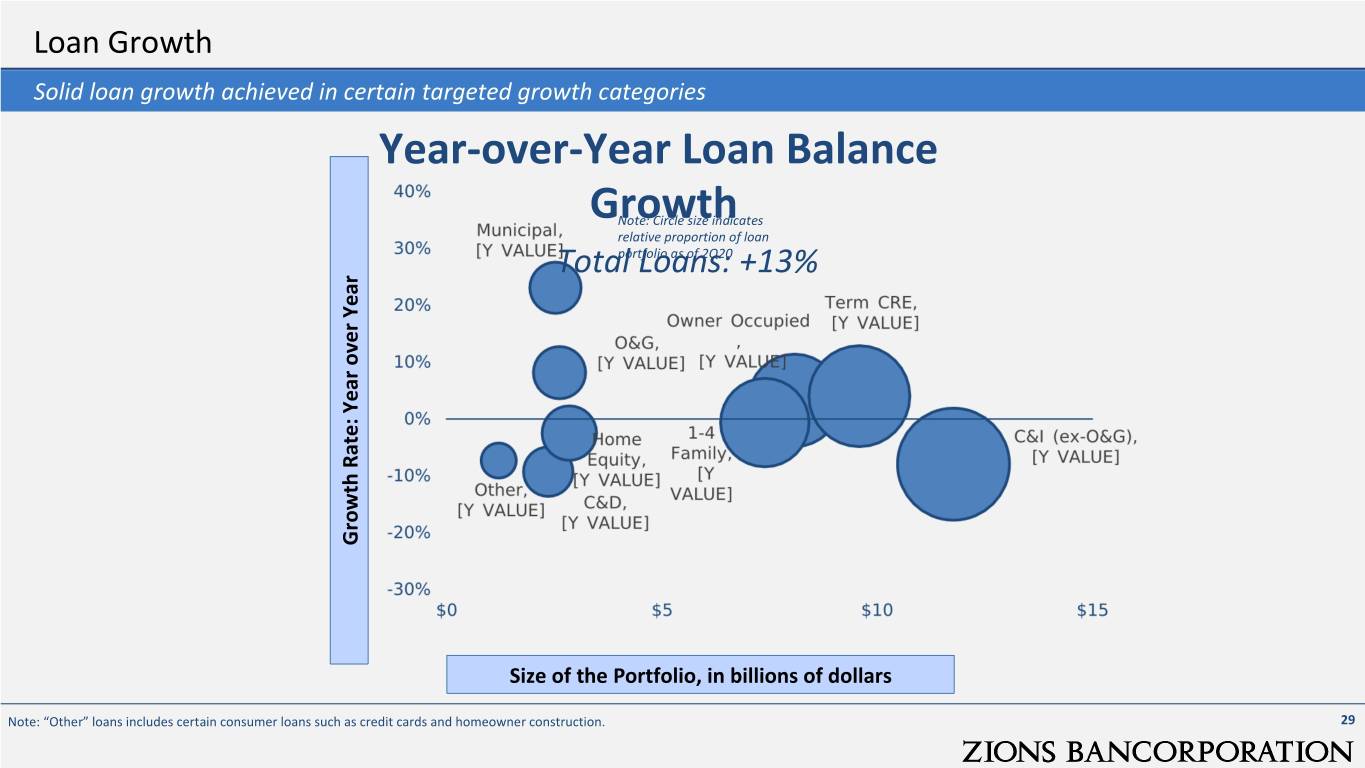
Loan Growth Solid loan growth achieved in certain targeted growth categories Year-over-Year Loan Balance GrowthNote: Circle size indicates relative proportion of loan Total Loans: +13%portfolio as of 2Q20 Growth Rate: Year over Year Size of the Portfolio, in billions of dollars Note: “Other” loans includes certain consumer loans such as credit cards and homeowner construction. 29
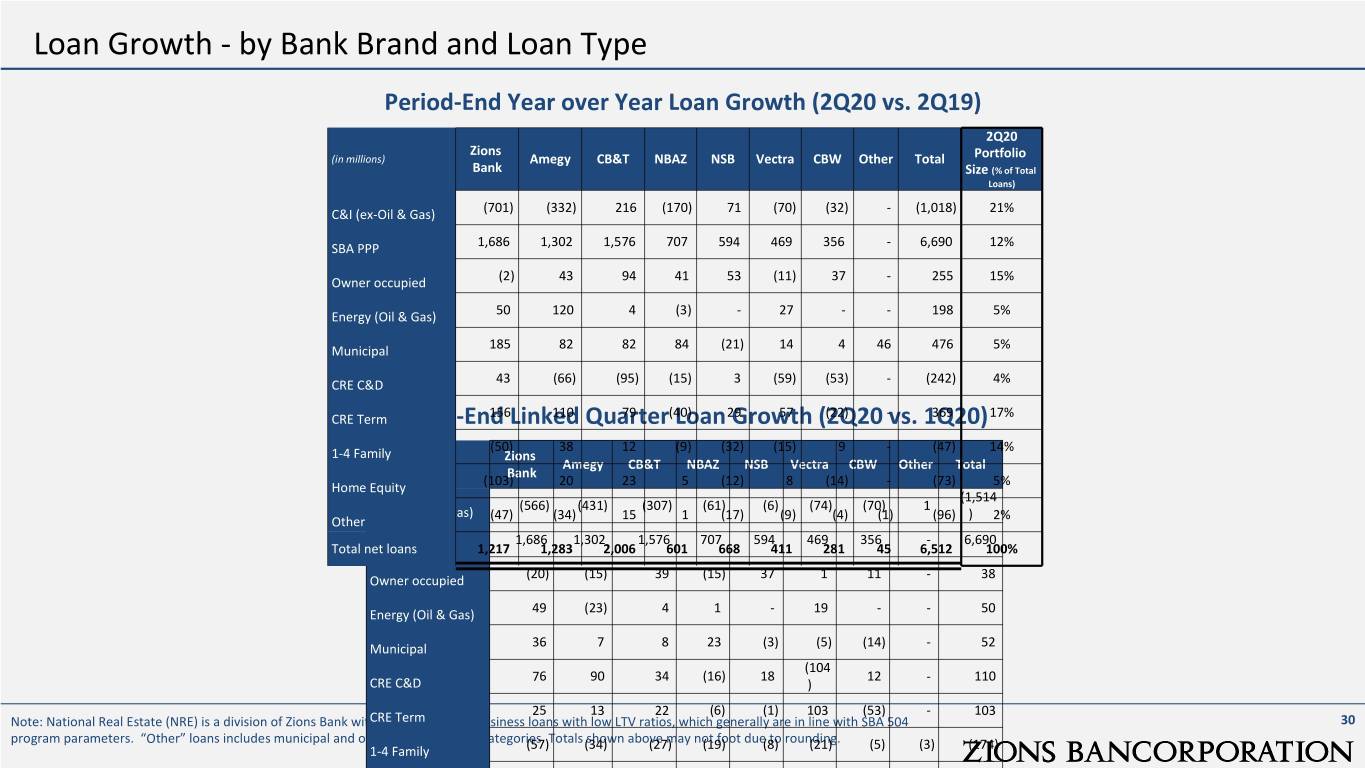
Loan Growth - by Bank Brand and Loan Type Period-End Year over Year Loan Growth (2Q20 vs. 2Q19) 2Q20 Zions (in millions) Amegy CB&T NBAZ NSB Vectra CBW Other Total Portfolio Bank Size (% of Total Loans) C&I (ex-Oil & Gas) (701) (332) 216 (170) 71 (70) (32) - (1,018) 21% SBA PPP 1,686 1,302 1,576 707 594 469 356 - 6,690 12% Owner occupied (2) 43 94 41 53 (11) 37 - 255 15% Energy (Oil & Gas) 50 120 4 (3) - 27 - - 198 5% Municipal 185 82 82 84 (21) 14 4 46 476 5% CRE C&D 43 (66) (95) (15) 3 (59) (53) - (242) 4% CRE TermPeriod-End Linked Quarter Loan Growth (2Q20 vs. 1Q20) 156 110 79 (40) 29 57 (22) - 369 17% (50) 38 12 (9) (32) (15) 9 - (47) 14% 1-4 Family Zions (in millions) Amegy CB&T NBAZ NSB Vectra CBW Other Total Bank Home Equity (103) 20 23 5 (12) 8 (14) - (73) 5% (1,514 (566) (431) (307) (61) (6) (74) (70) 1 C&I (ex-Oil & Gas) ) Other (47) (34) 15 1 (17) (9) (4) (1) (96) 2% 1,686 1,302 1,576 707 594 469 356 - 6,690 Total net loansSBA PPP 1,217 1,283 2,006 601 668 411 281 45 6,512 100% Owner occupied (20) (15) 39 (15) 37 1 11 - 38 Energy (Oil & Gas) 49 (23) 4 1 - 19 - - 50 Municipal 36 7 8 23 (3) (5) (14) - 52 (104 76 90 34 (16) 18 12 - 110 CRE C&D ) 25 13 22 (6) (1) 103 (53) - 103 Note: National Real Estate (NRE) is a division of Zions Bank with a focus on small business loans with low LTV ratios, which generally are in line with SBA 504 CRE Term 30 program parameters. “Other” loans includes municipal and other consumer loan categories. Totals shown above may not foot due to rounding. 1-4 Family (57) (34) (27) (19) (8) (21) (5) (3) (174) Home Equity (48) (8) (17) (9) (10) (11) 1 - (102) Other (14) (30) 1 (2) (9) 3 (1) 1 (51) Total net loans 1,167 871 1,333 603 612 380 237 (1) 5,202
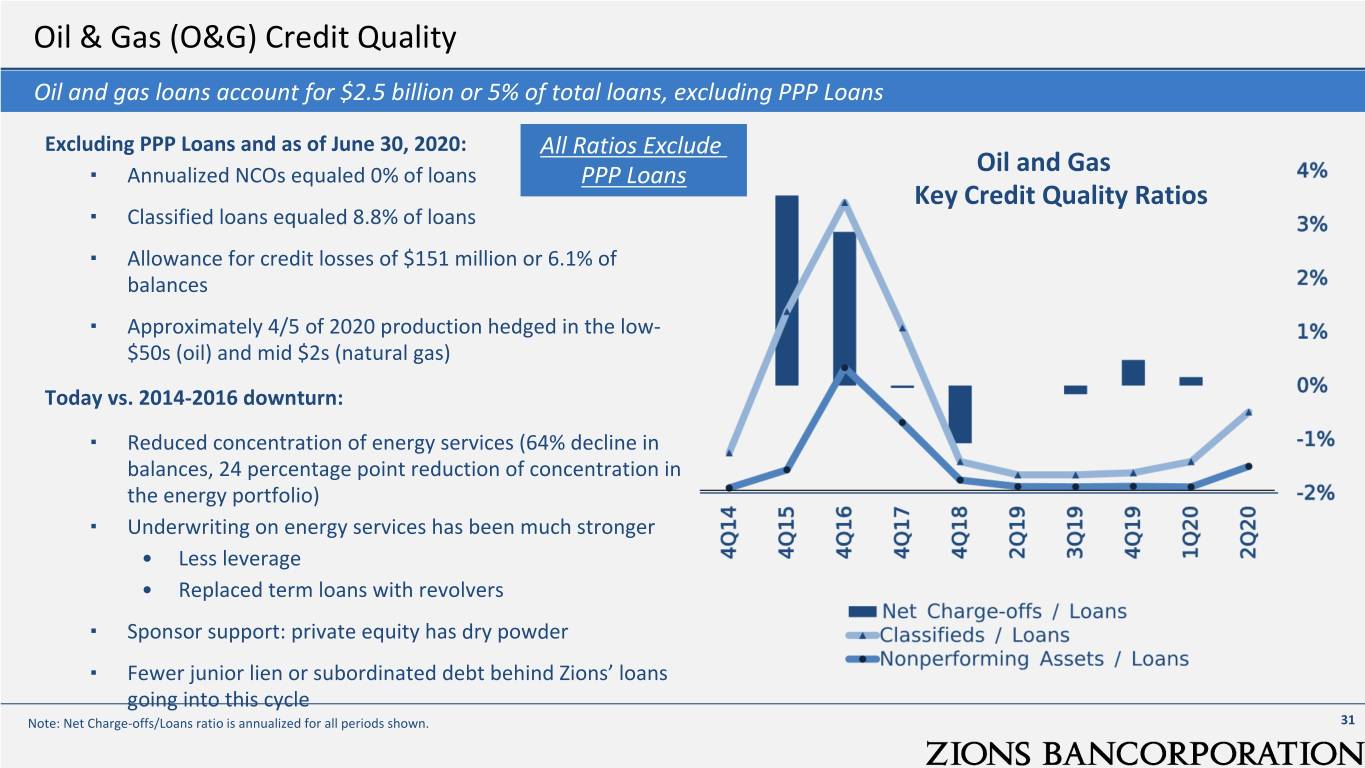
Oil & Gas (O&G) Credit Quality Oil and gas loans account for $2.5 billion or 5% of total loans, excluding PPP Loans Excluding PPP Loans and as of June 30, 2020: All Ratios Exclude Oil and Gas ▪ Annualized NCOs equaled 0% of loans PPP Loans Key Credit Quality Ratios ▪ Classified loans equaled 8.8% of loans ▪ Allowance for credit losses of $151 million or 6.1% of balances ▪ Approximately 4/5 of 2020 production hedged in the low- $50s (oil) and mid $2s (natural gas) Today vs. 2014-2016 downturn: ▪ Reduced concentration of energy services (64% decline in balances, 24 percentage point reduction of concentration in the energy portfolio) ▪ Underwriting on energy services has been much stronger • Less leverage • Replaced term loans with revolvers ▪ Sponsor support: private equity has dry powder ▪ Fewer junior lien or subordinated debt behind Zions’ loans going into this cycle Note: Net Charge-offs/Loans ratio is annualized for all periods shown. 31
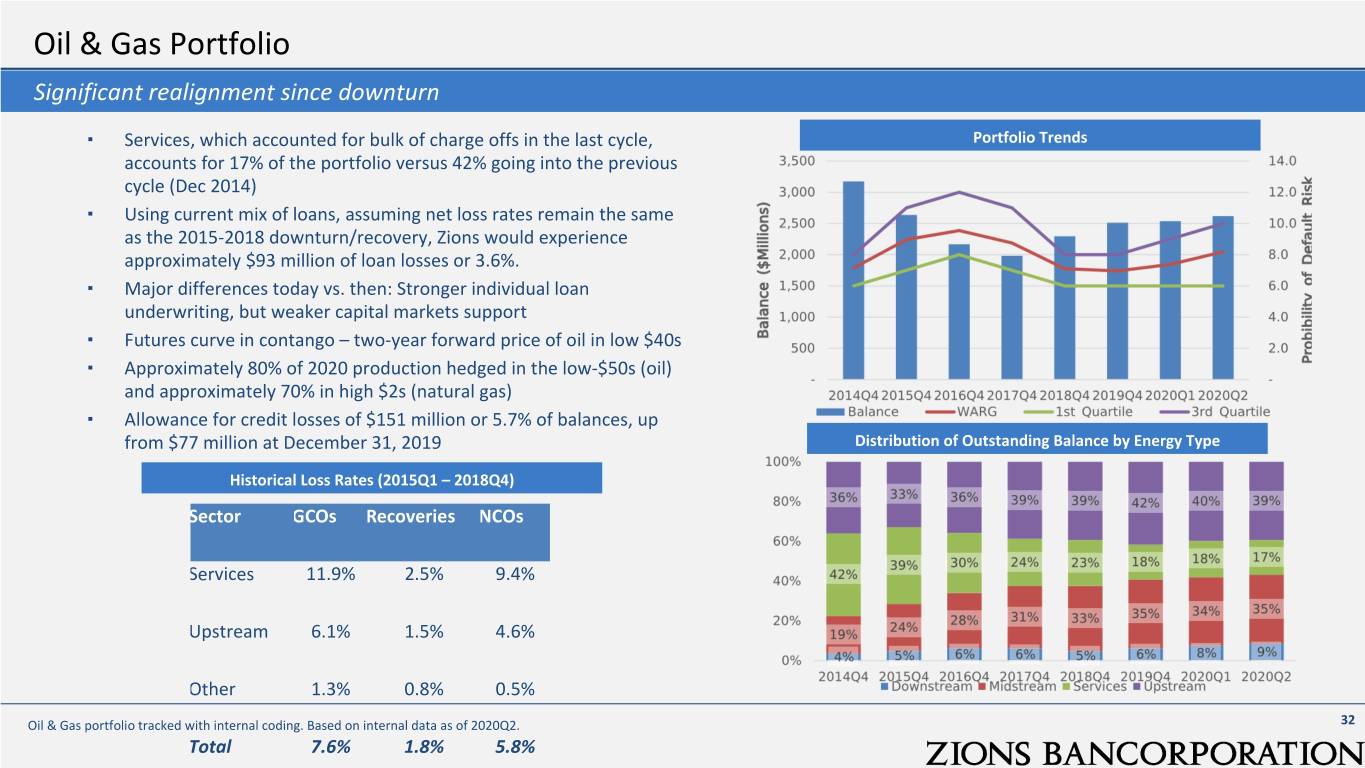
Oil & Gas Portfolio Significant realignment since downturn ▪ Services, which accounted for bulk of charge offs in the last cycle, Portfolio Trends accounts for 17% of the portfolio versus 42% going into the previous cycle (Dec 2014) ▪ Using current mix of loans, assuming net loss rates remain the same as the 2015-2018 downturn/recovery, Zions would experience approximately $93 million of loan losses or 3.6%. ▪ Major differences today vs. then: Stronger individual loan underwriting, but weaker capital markets support ▪ Futures curve in contango – two-year forward price of oil in low $40s ▪ Approximately 80% of 2020 production hedged in the low-$50s (oil) and approximately 70% in high $2s (natural gas) ▪ Allowance for credit losses of $151 million or 5.7% of balances, up from $77 million at December 31, 2019 Distribution of Outstanding Balance by Energy Type Historical Loss Rates (2015Q1 – 2018Q4) Sector GCOs Recoveries NCOs Services 11.9% 2.5% 9.4% Upstream 6.1% 1.5% 4.6% Other 1.3% 0.8% 0.5% Oil & Gas portfolio tracked with internal coding. Based on internal data as of 2020Q2. 32 Total 7.6% 1.8% 5.8%
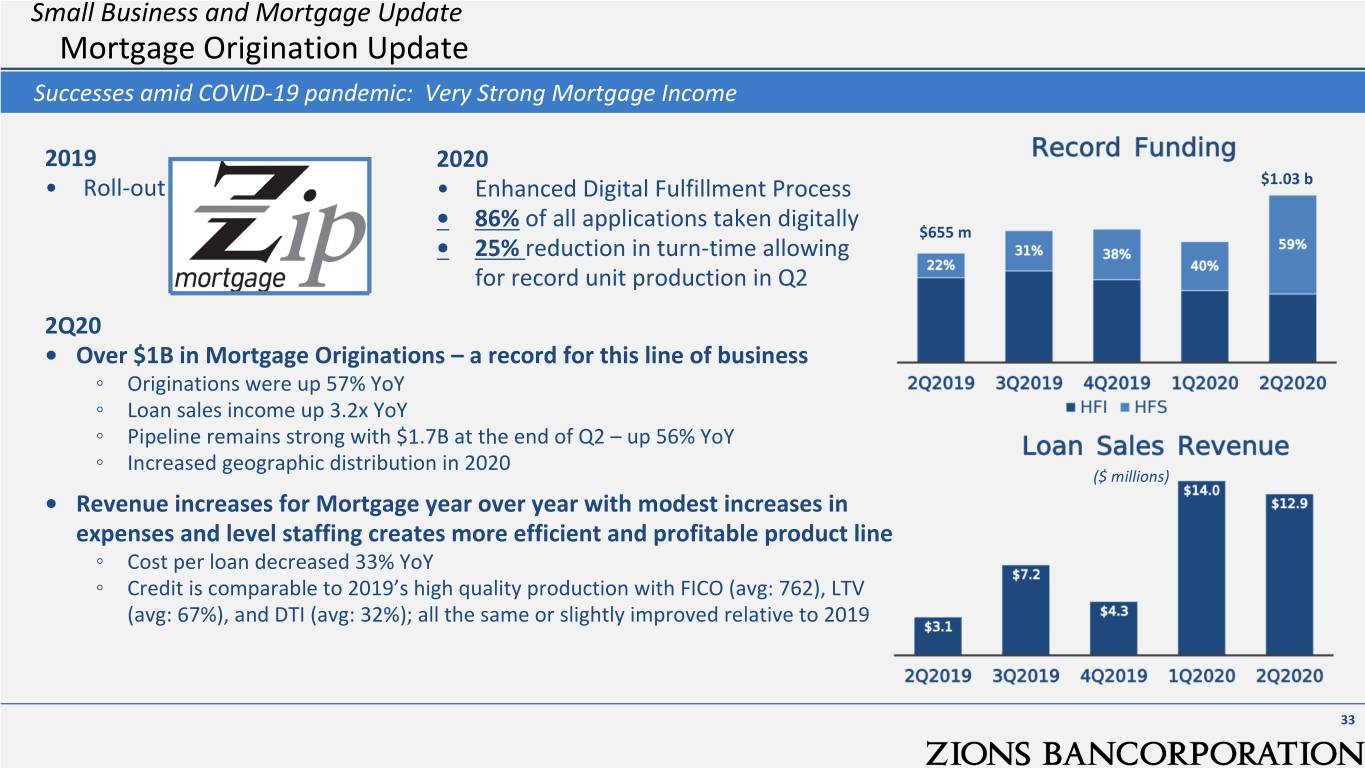
Small Business and Mortgage Update Mortgage Origination Update Successes amid COVID-19 pandemic: Very Strong Mortgage Income 2019 2020 • Roll-out • Enhanced Digital Fulfillment Process $1.03 b • 86% of all applications taken digitally $655 m • 25% reduction in turn-time allowing for record unit production in Q2 2Q20 • Over $1B in Mortgage Originations – a record for this line of business ◦ Originations were up 57% YoY ◦ Loan sales income up 3.2x YoY ◦ Pipeline remains strong with $1.7B at the end of Q2 – up 56% YoY Increased geographic distribution in 2020 ◦ ($ millions) • Revenue increases for Mortgage year over year with modest increases in expenses and level staffing creates more efficient and profitable product line ◦ Cost per loan decreased 33% YoY ◦ Credit is comparable to 2019’s high quality production with FICO (avg: 762), LTV (avg: 67%), and DTI (avg: 32%); all the same or slightly improved relative to 2019 33
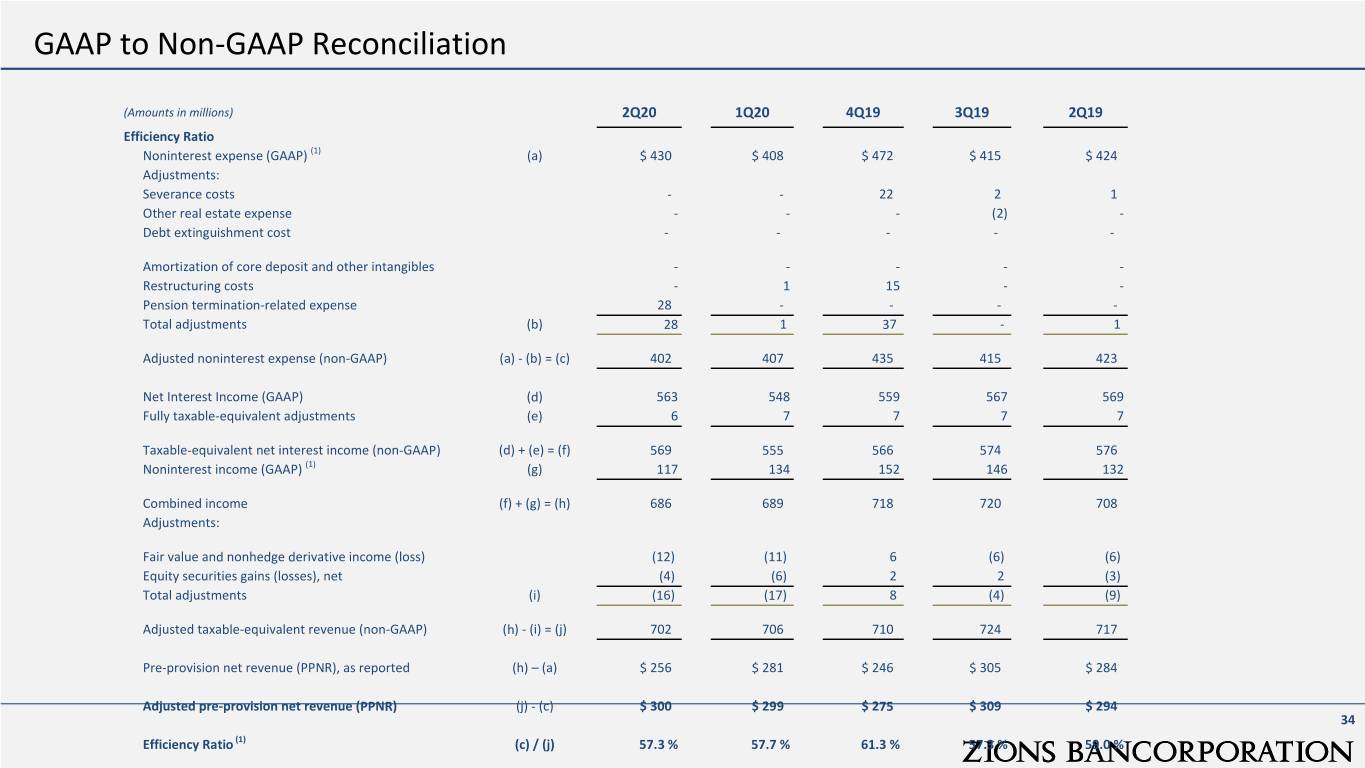
GAAP to Non-GAAP Reconciliation (Amounts in millions) 2Q20 1Q20 4Q19 3Q19 2Q19 Efficiency Ratio Noninterest expense (GAAP) (1) (a) $ 430 $ 408 $ 472 $ 415 $ 424 Adjustments: Severance costs - - 22 2 1 Other real estate expense - - - (2) - Debt extinguishment cost - - - - - Amortization of core deposit and other intangibles - - - - - Restructuring costs - 1 15 - - Pension termination-related expense 28 - - - - Total adjustments (b) 28 1 37 - 1 Adjusted noninterest expense (non-GAAP) (a) - (b) = (c) 402 407 435 415 423 Net Interest Income (GAAP) (d) 563 548 559 567 569 Fully taxable-equivalent adjustments (e) 6 7 7 7 7 Taxable-equivalent net interest income (non-GAAP) (d) + (e) = (f) 569 555 566 574 576 Noninterest income (GAAP) (1) (g) 117 134 152 146 132 Combined income (f) + (g) = (h) 686 689 718 720 708 Adjustments: Fair value and nonhedge derivative income (loss) (12) (11) 6 (6) (6) Equity securities gains (losses), net (4) (6) 2 2 (3) Total adjustments (i) (16) (17) 8 (4) (9) Adjusted taxable-equivalent revenue (non-GAAP) (h) - (i) = (j) 702 706 710 724 717 Pre-provision net revenue (PPNR), as reported (h) – (a) $ 256 $ 281 $ 246 $ 305 $ 284 Adjusted pre-provision net revenue (PPNR) (j) - (c) $ 300 $ 299 $ 275 $ 309 $ 294 34 Efficiency Ratio (1) (c) / (j) 57.3 % 57.7 % 61.3 % 57.3 % 59.0 %
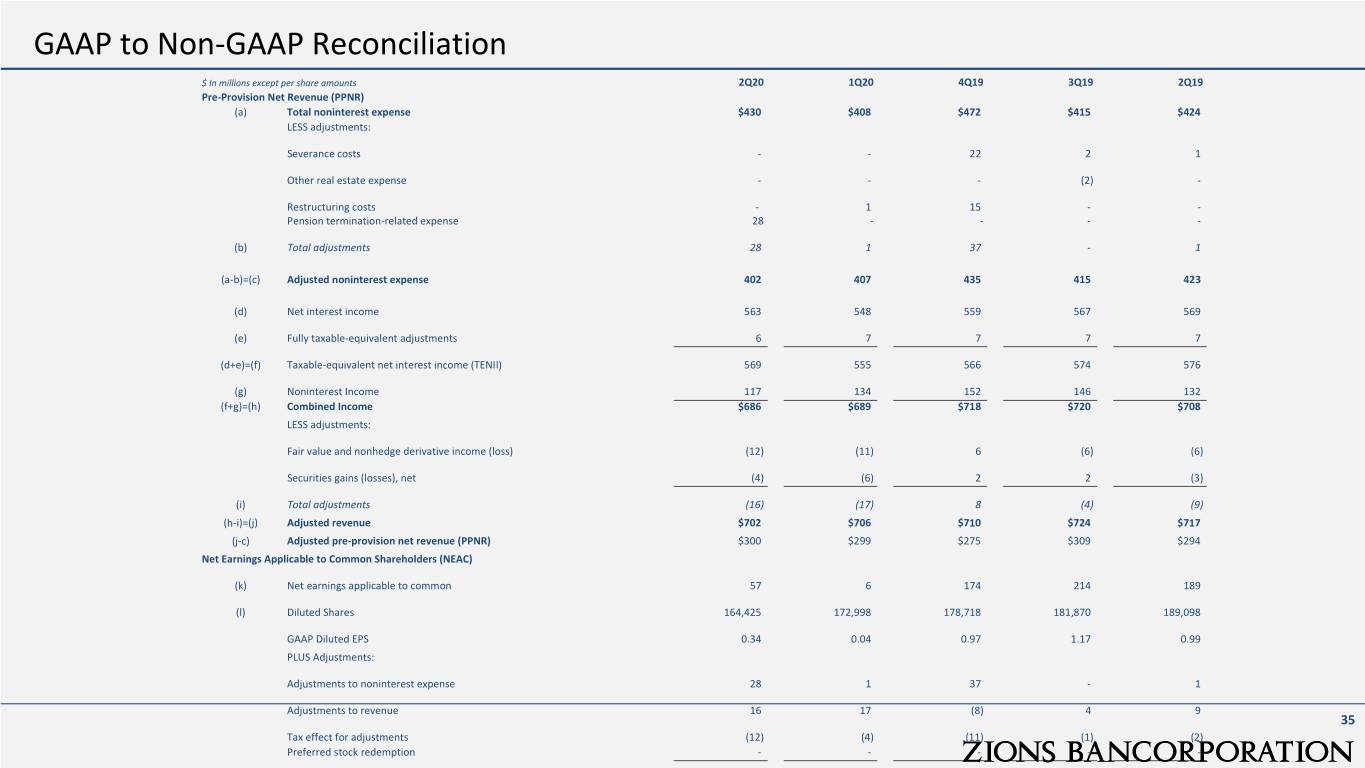
GAAP to Non-GAAP Reconciliation $ In millions except per share amounts 2Q20 1Q20 4Q19 3Q19 2Q19 Pre-Provision Net Revenue (PPNR) (a) Total noninterest expense $430 $408 $472 $415 $424 LESS adjustments: Severance costs - - 22 2 1 Other real estate expense - - - (2) - Restructuring costs - 1 15 - - Pension termination-related expense 28 - - - - (b) Total adjustments 28 1 37 - 1 (a-b)=(c) Adjusted noninterest expense 402 407 435 415 423 (d) Net interest income 563 548 559 567 569 (e) Fully taxable-equivalent adjustments 6 7 7 7 7 (d+e)=(f) Taxable-equivalent net interest income (TENII) 569 555 566 574 576 (g) Noninterest Income 117 134 152 146 132 (f+g)=(h) Combined Income $686 $689 $718 $720 $708 LESS adjustments: Fair value and nonhedge derivative income (loss) (12) (11) 6 (6) (6) Securities gains (losses), net (4) (6) 2 2 (3) (i) Total adjustments (16) (17) 8 (4) (9) (h-i)=(j) Adjusted revenue $702 $706 $710 $724 $717 (j-c) Adjusted pre-provision net revenue (PPNR) $300 $299 $275 $309 $294 Net Earnings Applicable to Common Shareholders (NEAC) (k) Net earnings applicable to common 57 6 174 214 189 (l) Diluted Shares 164,425 172,998 178,718 181,870 189,098 GAAP Diluted EPS 0.34 0.04 0.97 1.17 0.99 PLUS Adjustments: Adjustments to noninterest expense 28 1 37 - 1 Adjustments to revenue 16 17 (8) 4 9 35 Tax effect for adjustments (12) (4) (11) (1) (2) Preferred stock redemption - - - - - (m) Total adjustments 32 14 18 3 8 (k+m)=(n) Adjusted net earnings applicable to common (NEAC) 89 20 192 217 197 (n)/(l) Adjusted EPS 0.54 0.12 1.07 1.19 1.04 (o) Average assets 75,914 70,205 69,575 70,252 69,855 (p) Average tangible common equity 6,016 5,910 5,852 5,988 5,974 Profitability (n)/(o) Adjusted Return on Assets (annualized) 0.47% 0.11% 1.09% 1.23% 1.13% (n)/(p) Adjusted Return on Tangible Common Equity (annualized) 5.9% 1.4% 13.0% 14.4% 13.1% (c)/(j) Efficiency Ratio 57.3% 57.7% 61.3% 57.3% 59.0%
