Attached files
| file | filename |
|---|---|
| EX-99.1 - PRESS RELEASE - Vertex Energy Inc. | ex99-1.htm |
| 8-K - CURRENT REPORT - Vertex Energy Inc. | vtnr-8k_081120.htm |
Exhibit 99.2

August 11, 2020 2Q20 Conference Call

Disclaimer This document may contain forward - looking statements including words such as “may,” “can,” “could,” “should,” “predict,” “aim,” “potential,” “continue,” “opportunity,” “intend,” “goal,” “estimate,” “expect,” “expectations,” “project,” “projections,” “plans,” “anticipates,” “believe,” “think,” “confident,” “scheduled,” or similar expressions, as well as information about management’s view of Vertex Energy’s future expectations, plans and prospects, within the safe harbor provisions under the Private Securities Litigation Reform Act of 1995 . These statements involve known and unknown risks, uncertainties and other factors which may cause the results of Vertex Energy, its divisions and concepts to be materially different than those expressed or implied in such statements . These risk factors and others are included from time to time in documents Vertex Energy files with the Securities and Exchange Commission, including, but not limited to, its Form 10 - Ks, Form 10 - Qs and Form 8 - Ks , available at the SEC’s website at www . sec . gov . Other unknown or unpredictable factors also could have material adverse effects on Vertex Energy’s future results . The forward - looking statements included in this presentation are made only as of the date hereof . Vertex Energy cannot guarantee future results, levels of activity, performance or achievements . Accordingly, you should not place undue reliance on these forward - looking statements . Finally, Vertex Energy undertakes no obligation to update these statements after the date of this presentation, except as required by law, and also undertakes no obligation to update or correct information prepared by third parties that are not paid for by Vertex Energy . Industry Information Information regarding market and industry statistics contained in this presentation is based on information available to us that we believe is accurate . It is generally based on publications that are not produced for investment or economic analysis . 2

2Q20 Business Update

Post COVID - 19: Charting a Path Toward Recovery Following a challenging 2Q20, business has stabilized during July 2020 4 Less availability of feedstock for refineries Less used motor oil produced Less demand for refined products Less commercial and consumer traffic COVID - 19 Travel Restrictions 2Q20 July 2020 Marrero and Heartland operating near peak capacity UMO feedstock availability recovering Demand conditions soft, but improving Vehicle miles traveled gradually recovering Broad - based cost reductions

Key Financial Metrics Second Quarter 2020 5 Total Revenues ($MM) Gross Profit ($MM) Operating Income (Loss) ($MM) Net Income (Loss) Attributable to Vertex (1) ($MM) (1) Second quarter 2020 and TTM 2Q20 results exclude the impact of the Tensile transaction $43.6 $21.4 $175.4 $138.0 2Q19 2Q20 TTM 2Q19 TTM 2Q20 $7.1 ($0.8) $24.5 $25.5 2Q19 2Q20 TTM 2Q19 TTM 2Q20 ($0.7) ($8.5) ($4.8) ($7.0) 2Q19 2Q20 TTM 2Q19 TTM 2Q20 ($0.4) ($8.9) ($7.9) ($5.9) 2Q19 2Q20 TTM 2Q19 TTM 2Q20

Adjusted EBITDA Bridge Narrowing product spreads drove the y/y decline in performance 6 2Q19 vs. 2Q20 Adj. EBITDA Bridge ($MM)

UMO Collections Are Steadily Recovering Collections levels improved exiting 2Q20 7 Total UMO Feedstock Supply (UMO Gallons in Millions) > Total feedstock supply declined 35% y/y in 2Q20 due to COVID - 19 UMO Feedstock Supply > VMT rebounded on a month - over - month basis in May, although driving levels remain 25% below prior - year levels VMT a Relevant Indicator > Direct collections troughed in April and have recovered into June Direct Collections U.S. Vehicle Miles Traveled Rebounded In May 2020 (Millions of Road Vehicle Miles Traveled) (1) (1) Source: US DOT (August 2020) Direct UMO Collections By Month (2019 vs. 2020 Y/Y % Change) 23.1 15.1 86.4 74.8 2Q19 2Q20 TTM 2Q19 TTM 2Q20 21% 22% - 5% - 34% - 29% 1% January February March April May June 272 282 286 281 296 287 272 284 261 274 254 232 220 168 213

Refining System Update Production levels rebounded during July 2020 8 (1) Utilization defined as total refinery throughputs divided by nameplate capacity of the refinery Marrero Refinery Capacity Utilization Rate (1) Heartland Refinery Capacity Utilization Rate (1) > 34 days of planned, extended maintenance that concluded in mid - June 2020; Operated near peak capacity in July 2020 Marrero Update > Solid utilization, given UMO feedstock constraints; Operated near peak capacity in July 2020 Heartland Update 103% 62% 97% 85% 2Q19 2Q20 TTM 2Q19 TTM 2Q20 97% 78% 103% 98% 2Q19 2Q20 TTM 2Q19 TTM 2Q20

Operational Priorities Key areas of management focus 9 UMO Availability > Management has expanded its collection network, ensuring increased availability of feedstock to support its refining operations during 3Q20 > Street pricing remains challenged; as we see driving activity increase, we expect to see more rational UMO pricing Refining Utilization > In 2Q20, both Marrero and Heartland operated at reduced rates due to poor UMO availability > During July 2020, both refineries operated near peak utilization, allowing us to capture increased economies of scale Cost Reductions > Focused on reductions in contract labor, together with reductions in plant operating costs. > SG&A declined more than 10% y/y in 2Q20 > Management expects to realize approximately $1 to $2 million in additional, annualized cost reductions during the second half of 2020. Asset Optimization > In 2Q20, we invested in several initiatives designed to grow our market presence as a collector and recycler of used automotive waste streams. > We expect to provide an update on these activities during 4Q20 Capital Discipline > Given current market volatility, Vertex remains focused on conserving available liquidity to support the long - term growth of the business, while investing in core operational improvements > As of June 30, 2020, the Company had total cash and available liquidity of $19.6 million, versus $20.2 million as of March 31, 2020
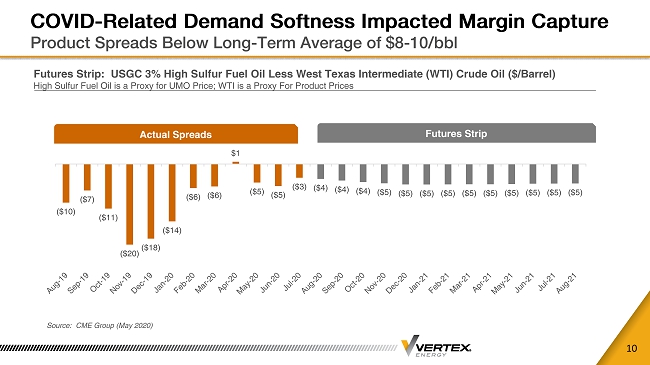
COVID - Related Demand Softness Impacted Margin Capture Product Spreads Below Long - Term Average of $8 - 10/ bbl 10 Futures Strip: USGC 3% High Sulfur Fuel Oil Less West Texas Intermediate (WTI) Crude Oil ($/Barrel) High Sulfur Fuel Oil is a Proxy for UMO Price; WTI is a Proxy For Product Prices Source: CME Group (May 2020) ($10) ($7) ($11) ($20) ($18) ($14) ($6) ($6) $1 ($5) ($5) ($3) ($4) ($4) ($4) ($5) ($5) ($5) ($5) ($5) ($5) ($5) ($5) ($5) ($5) Actual Spreads Futures Strip

Balance Sheet Update Approximately $20 Million In Cash And Availability On Term Loan 11 (1) Included in total cash amounts is the SPV amounts of Myrtle Grove and Heartland which are $ 8 . 4 million and $ 2 . 2 million, respectively, which are limited to use by each respective SPV . (2) Net cash positive reflects the difference between cash - on - hand and term debt Cash & Available Liquidity $MM (1) Net Debt vs. TTM Adj. EBITDA (1) > 2Q20 cash and available liquidity increased by $16.1 million y/y > Focused on capital conservation given near - term market challenges Adequate Cash & Liquidity Net Cash Positive 4.4 x 5.9 x 1.2 x 2Q19 3Q19 4Q19 1Q20 2Q20 Net Cash Positive $3.5 $5.8 $7.9 $20.3 $19.6 2Q19 3Q19 4Q19 1Q20 2Q20

APPENDIX

Corporate Overview Vertically - Integrated Specialty Refiner of Alternative Feedstocks 13 > ~100 collection trucks > Operations in 15 states > Internal collections strategy Collections Operations > Middle distillates and high - purity base oils > Marrero (LA) - Marine Fuel production > Heartland (OH) - Base oil production > Baytown (TX) – Houston ship channel terminal Refining Operations Executive Summary > Established producer of petroleum - based specialty products from recycled used motor oils and petrochemical streams > Own and operate one of the largest independent used motor oil collections (UMO) operations in the United States (1) > Produce/market IMO - compliant marine fuels, Group II & III Base Oils and fuel blend stocks for industrial applications > Proven track record of safe, reliable operations that optimize utilization at owned production facilities > Major ongoing capital projects offer potential to increase production of high - value specialty products > Experienced management team w/ high insider ownership (1) Vertex Energy owns/operates one of the largest used motor oil (UMO) collection and aggregation networks in the United Sta tes

Used Motor Oil Recycling Value Chain Direct and Third - Party UMO Collections Used As Refining Feedstock 14 UMO Generators Collectors Aggregators Processors Consumers Oil Change Shops, Car Dealerships 1.3 billion gal/ yr U.S. – fragmented industry Collect UMO to self - process or for sale Refined into higher - value finished products Consume middle distillates, base oils

We Own Advantaged Refining Assets In Strategic Markets Vertically Integrated Model Processes Collected UMO as Feedstock 15 > 4,800 bpd nameplate capacity > Feedstock: UMO > Production: Middle distillates > Opportunity: Demand for IMO - compliant marine fuel Marrero Refinery Marrero, Louisiana > 1,500 bpd nameplate capacity > Feedstock: UMO > Production: Group II+ base oil > Opportunity: Global transition to higher - purity base oils Heartland Refinery Columbus, Ohio > Waterfront facility w/ 100,000 barrels of storage on - site > Refining supply / distribution > Strategically located on the Houston ship channel Baytown Terminal Baytown, Texas Refining Operations Overview > Direct and third - party collections of UMO provide the feedstock for both Marrero and Heartland > Marrero and Heartland operating near peak utilization given strong demand for middle distillates and Group II base oils > Production slate includes middle distillates, base oils, asphalt, condensate and fuel oil (1) (bpd) barrels per day

We Are Focused On High - Grading Our Production Slate Multi - Year Transition From Commodity To Branded Products 16 Realized Gross Margin Capture Product Portfolio Evolution Commodity Products Specialty Products Vacuum Gas Oil IMO Marine Fuels High Purity Base Oils Niche Lubricants

CAFE Standards Drive Demand For Higher Purity Base Oils Corporate Average Fleet Economy (CAFE) Standard Requires Lower Emissions 17 Executive Summary Drivers of Group II+/III Demand CAFE Standard Fuel Economy By Year 6% CAGR In Required MPG Fuel Economy > CAFE standard requires increased fuel economy and lower emissions > Lower viscosity lubricants yield better fuel economy and lower emissions > High purity base oils are the primary base stock for premium synthetic lubricants used in CAFE - compliant higher performance engines > Base oil production from UMO is more efficient than from crude oil > Electrification of vehicle fleet is a long - term factor, but not material to the forecast until after 2030 North American Base Oil Capacity Shift (1) Trend Toward Higher Viscosity Base Oil Capacity 2% 56% 21% 21% 6% 23% 54% 17% Re-refined Group I Group II and III Naphthenic 2008 2018 (1) Source: LNG Lubricants Industry Factbook (2018 - 2019) 35 41 55 CY 2017 CY 2021 CY 2025

Compelling Investment Thesis Favorable Underlying Fundamentals, High - Return Organic Growth Projects 18 > Increased global demand for compliant low - sulfur marine fuels > Multi - year transition toward higher - viscosity, higher - margin Group II and III base oils Strong Underlying Market Trends > Bunker One partnership provides surety of offtake for 100% of Marrero refinery VGO production thru 2029 > Net profit - sharing agreement at all North American ports where Bunker One sells marine fuel Bunker One Partnership > Leading UMO collector consolidating fragmented industry > 20%+ y/y growth in direct collections in 2019 > Focused on growing cost - advantaged direct collections vs. third - party supply UMO Collections Growth > Focused on increasing production of IMO - compliant marine fuels and high purity base oils > Tensile has committed up to $34 million of capital to support growth of SPVs High - Return Capital Projects y > Led by founder/CEO Ben Cowart > Senior leadership with decades of UMO and industry - relevant experience > High insider ownership aligns management and investor interests Aligning Investor Interests #1 #2 #3 #4 #5
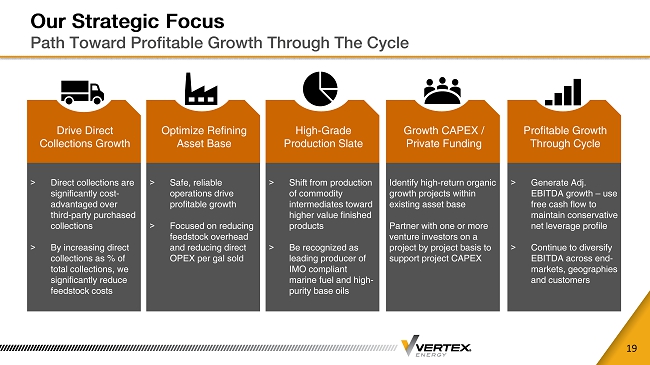
Our Strategic Focus Path Toward Profitable Growth Through The Cycle 19 > Direct collections are significantly cost - advantaged over third - party purchased collections > By increasing direct collections as % of total collections, we significantly reduce feedstock costs Drive Direct Collections Growth > Safe, reliable operations drive profitable growth > Focused on reducing feedstock overhead and reducing direct OPEX per gal sold Optimize Refining Asset Base > Shift from production of commodity intermediates toward higher value finished products > Be recognized as leading producer of IMO compliant marine fuel and high - purity base oils High - Grade Production Slate Identify high - return organic growth projects within existing asset base Partner with one or more venture investors on a project by project basis to support project CAPEX Growth CAPEX / Private Funding y > Generate Adj. EBITDA growth – use free cash flow to maintain conservative net leverage profile > Continue to diversify EBITDA across end - markets, geographies and customers Profitable Growth Through Cycle