Attached files
| file | filename |
|---|---|
| EX-32.2 - EXHIBIT 32.2 - Vertex Energy Inc. | a09302018-ex322.htm |
| EX-32.1 - EXHIBIT 32.1 - Vertex Energy Inc. | a09302018-ex321.htm |
| EX-31.2 - EXHIBIT 31.2 - Vertex Energy Inc. | a09302018-ex312.htm |
| EX-31.1 - EXHIBIT 31.1 - Vertex Energy Inc. | a09302018-ex311.htm |
UNITED STATES
SECURITIES AND EXCHANGE COMMISSION
Washington, D.C. 20549
FORM 10-Q
þ QUARTERLY REPORT PURSUANT TO SECTION 13 OR 15(d) OF
THE SECURITIES EXCHANGE ACT OF 1934
For the fiscal quarter ended September 30, 2018
¨ TRANSITION REPORT PURSUANT TO SECTION 13 OR 15(d) OF THE SECURITIES EXCHANGE ACT OF 1934
FOR THE TRANSITION PERIOD FROM _____________ TO _____________
Commission File Number 001-11476
———————
VERTEX ENERGY, INC.
(Exact name of registrant as specified in its charter)
———————
NEVADA | 94-3439569 |
(State or other jurisdiction of | (I.R.S. Employer Identification No.) |
incorporation or organization) | |
1331 GEMINI STREET, SUITE 250 HOUSTON, TEXAS | 77058 |
(Address of principal executive offices) | (Zip Code) |
Registrant's telephone number, including area code: 866-660-8156
Indicate by check mark whether the registrant (1) has filed all reports required to be filed by Section 13 or 15(d) of the Securities Exchange Act of 1934 during the preceding 12 months (or for such shorter period that the registrant was required to file such reports), and (2) has been subject to such filing requirements for the past 90 days. Yes ý No ¨
Indicate by check mark whether the registrant has submitted electronically every Interactive Data File required to be submitted pursuant to Rule 405 of Regulation S-T (§232.405 of this chapter) during the preceding 12 months (or for such shorter period that the registrant was required to submit such files). Yes ý No ¨
Indicate by check mark whether the registrant is a large accelerated filer, an accelerated filer, a non-accelerated filer, a smaller reporting company, or an emerging growth company. See the definitions of “large accelerated filer,” “accelerated filer” and “smaller reporting company” and "emerging growth company" in Rule 12b-2 of the Exchange Act.
Large accelerated filer ¨ | Accelerated filer ¨ |
Non-accelerated filer ¨ | Smaller reporting company ý |
Emerging growth ¨ | |
If an emerging growth company, indicate by check mark if the registrant has elected not to use the extended transition period for complying with any new or revised financial accounting standards provided pursuant to Section 13(a) of the Exchange Act. ¨
Indicate by check mark whether the registrant is a shell company (as defined in Rule 12b-2 of the Exchange Act.
Yes ¨ No ý
State the number of shares of the issuer’s common stock outstanding, as of the latest practicable date: 40,007,520 shares of common stock are issued and outstanding as of November 5, 2018.
TABLE OF CONTENTS
Page | |||
PART I | |||
Item 1. | |||
Item 2 | |||
Item 3. | |||
Item 4. | |||
PART II | |||
Item 1. | |||
Item 1A. | |||
Item 2. | |||
Item 3. | |||
Item 4. | |||
Item 5. | |||
Item 6. | |||
PART I – FINANCIAL INFORMATION
Item 1. Financial Statements
VERTEX ENERGY, INC.
CONSOLIDATED BALANCE SHEETS
(UNAUDITED)
September 30, 2018 | December 31, 2017 | ||||||
ASSETS | |||||||
Current assets | |||||||
Cash and cash equivalents | $ | 1,840,345 | $ | 1,105,787 | |||
Accounts receivable, net | 14,380,264 | 11,288,991 | |||||
Federal income tax receivable | 137,212 | — | |||||
Inventory | 6,646,171 | 6,304,842 | |||||
Prepaid expenses | 3,973,105 | 1,771,832 | |||||
Total current assets | 26,977,097 | 20,471,452 | |||||
Noncurrent assets | |||||||
Fixed assets, at cost | 66,781,807 | 65,237,652 | |||||
Less accumulated depreciation | (18,671,219 | ) | (16,617,824 | ) | |||
Fixed assets, net | 48,110,588 | 48,619,828 | |||||
Goodwill and other intangible assets, net | 13,210,821 | 14,499,354 | |||||
Federal income tax receivable | 137,211 | 274,423 | |||||
Other assets | 694,059 | 440,417 | |||||
TOTAL ASSETS | $ | 89,129,776 | $ | 84,305,474 | |||
LIABILITIES, TEMPORARY EQUITY, AND EQUITY | |||||||
Current liabilities | |||||||
Accounts payable and accrued expenses | $ | 9,805,852 | $ | 10,318,738 | |||
Dividends payable | 479,311 | 420,713 | |||||
Capital leases-current | 92,900 | — | |||||
Current portion of long-term debt, net of unamortized finance costs | 2,167,171 | 1,616,926 | |||||
Derivative commodity liability | 601,534 | — | |||||
Revolving note | 5,999,733 | 4,591,527 | |||||
Total current liabilities | 19,146,501 | 16,947,904 | |||||
Long-term liabilities | |||||||
Long-term debt, net of unamortized finance costs | 14,483,702 | 13,531,179 | |||||
Capital leases-long-term | 322,538 | — | |||||
Contingent consideration | 108,564 | 236,680 | |||||
Derivative warrant liability | 4,370,379 | 2,245,408 | |||||
Total liabilities | 38,431,684 | 32,961,171 | |||||
COMMITMENTS AND CONTINGENCIES (Note 3) | — | — | |||||
TEMPORARY EQUITY | |||||||
Series B Convertible Preferred Stock, $0.001 par value per share; 10,000,000 shares designated, 3,551,549 and 3,427,597 shares issued and outstanding at September 30, 2018 and December 31, 2017, respectively with a liquidation preference of $11,009,802 and $10,625,551 at September 30, 2018 and December 31, 2017, respectively. | 8,432,160 | 7,190,467 | |||||
Series B1 Convertible Preferred Stock, $0.001 par value per share; 17,000,000 shares designated, 11,074,331 and 13,151,989 shares issued and outstanding at September 30, 2018 and December 31, 2017, respectively with a liquidation preference of $17,275,956 and $20,517,103 at September 30, 2018 and December 31, 2017, respectively. | 14,387,804 | 15,769,478 | |||||
Total Temporary Equity | 22,819,964 | 22,959,945 | |||||
F-1
September 30, 2018 | December 31, 2017 | ||||||
EQUITY | |||||||
50,000,000 of total Preferred shares authorized: | |||||||
Series A Convertible Preferred Stock, $0.001 par value; 5,000,000 shares designated, 419,859 and 453,567 shares issued and outstanding at September 30, 2018 and December 31, 2017, respectively with a liquidation preference of $625,590 and $675,815 at September 30, 2018 and December 31, 2017, respectively. | 420 | 454 | |||||
Series C Convertible Preferred Stock, $0.001 par value; 44,000 shares designated, 31,568 shares issued and outstanding at December 31, 2017, with a liquidation preference of $3,156,800 at December 31, 2017. | — | 32 | |||||
Common stock, $0.001 par value per share; 750,000,000 shares authorized; 38,840,890 and 32,658,176 shares issued and outstanding at September 30, 2018 and December 31, 2017, respectively. | 38,841 | 32,658 | |||||
Additional paid-in capital | 72,974,146 | 67,768,509 | |||||
Accumulated deficit | (45,508,871 | ) | (39,816,300 | ) | |||
Total Vertex Energy, Inc. stockholders' equity | 27,504,536 | 27,985,353 | |||||
Non-controlling interest | 373,592 | 399,005 | |||||
Total Equity | 27,878,128 | 28,384,358 | |||||
TOTAL LIABILITIES, TEMPORARY EQUITY, AND EQUITY | $ | 89,129,776 | $ | 84,305,474 | |||
See accompanying notes to the consolidated financial statements
F-2
VERTEX ENERGY, INC.
CONSOLIDATED STATEMENTS OF OPERATIONS
(UNAUDITED)
Three Months Ended September 30, | Nine Months Ended September 30, | |||||||||||||||
2018 | 2017 | 2018 | 2017 | |||||||||||||
Revenues | $ | 50,632,948 | $ | 32,470,451 | $ | 138,918,913 | $ | 104,153,844 | ||||||||
Cost of revenues (exclusive of depreciation and amortization shown separately below) | 42,593,367 | 28,696,461 | 114,434,776 | 90,864,044 | ||||||||||||
Gross profit | 8,039,581 | 3,773,990 | 24,484,137 | 13,289,800 | ||||||||||||
Operating expenses: | ||||||||||||||||
Selling, general and administrative expenses | 5,658,659 | 5,690,761 | 16,668,692 | 16,280,495 | ||||||||||||
Depreciation and amortization | 1,806,839 | 1,697,821 | 5,234,014 | 4,942,911 | ||||||||||||
Total operating expenses | 7,465,498 | 7,388,582 | 21,902,706 | 21,223,406 | ||||||||||||
Income (loss) from operations | 574,083 | (3,614,592 | ) | 2,581,431 | (7,933,606 | ) | ||||||||||
Other income (expense): | ||||||||||||||||
Interest income | — | 1,519 | 659 | 5,748 | ||||||||||||
Gain (loss) on sale of assets | — | 25,693 | 51,523 | (13,806 | ) | |||||||||||
Gain (loss) on change in value of derivative warrant liability | (2,169,133 | ) | 1,371,461 | (2,124,971 | ) | 2,676,902 | ||||||||||
Interest expense | (798,800 | ) | (733,459 | ) | (2,448,771 | ) | (2,688,394 | ) | ||||||||
Total other income (expense) | (2,967,933 | ) | 665,214 | (4,521,560 | ) | (19,550 | ) | |||||||||
Income (loss) before income tax | (2,393,850 | ) | (2,949,378 | ) | (1,940,129 | ) | (7,953,156 | ) | ||||||||
Income tax benefit (expense) | — | — | — | — | ||||||||||||
Net income (loss) | (2,393,850 | ) | (2,949,378 | ) | (1,940,129 | ) | (7,953,156 | ) | ||||||||
Net income (loss) attributable to non-controlling interest | (105,970 | ) | 34,554 | 76,305 | 94,690 | |||||||||||
Net income (loss) attributable to Vertex Energy, Inc. | (2,287,880 | ) | (2,983,932 | ) | (2,016,434 | ) | (8,047,846 | ) | ||||||||
Accretion of discount on Series B and B-1 Preferred Stock | (515,698 | ) | (424,480 | ) | (1,444,376 | ) | (1,267,778 | ) | ||||||||
Accrual of dividends on Series B and B-1 Preferred Stock | (1,831,794 | ) | (420,713 | ) | (3,191,217 | ) | (1,256,921 | ) | ||||||||
Net income (loss) available to common shareholders | $ | (4,635,372 | ) | $ | (3,829,125 | ) | $ | (6,652,027 | ) | $ | (10,572,545 | ) | ||||
Income (loss) per common share | ||||||||||||||||
Basic | $ | (0.13 | ) | $ | (0.12 | ) | $ | (0.20 | ) | $ | (0.32 | ) | ||||
Diluted | $ | (0.13 | ) | $ | (0.12 | ) | $ | (0.20 | ) | $ | (0.32 | ) | ||||
Shares used in computing earnings per share | ||||||||||||||||
Basic | 35,144,113 | 32,655,135 | 33,843,721 | 32,651,961 | ||||||||||||
Diluted | 35,144,113 | 32,655,135 | 33,843,721 | 32,651,961 | ||||||||||||
See accompanying notes to the consolidated financial statements
F-3
VERTEX ENERGY, INC.
CONSOLIDATED STATEMENTS OF CASH FLOWS
NINE MONTHS ENDED SEPTEMBER 30, 2018 AND 2017 (UNAUDITED)
Nine Months Ended | |||||||
September 30, 2018 | September 30, 2017 | ||||||
Cash flows from operating activities | |||||||
Net income (loss) | $ | (1,940,129 | ) | $ | (7,953,156 | ) | |
Adjustments to reconcile net loss to cash provided by (used in) operating activities | |||||||
Stock based compensation expense | 494,779 | 460,475 | |||||
Depreciation and amortization | 5,234,014 | 4,942,911 | |||||
(Gain) loss on sale of assets | (51,523 | ) | 13,806 | ||||
(Increase) decrease in fair value of derivative warrant liability | 2,124,971 | (2,676,902 | ) | ||||
Loss on commodity derivative contracts | 1,859,234 | — | |||||
Net cash settlements on commodity derivatives | (2,386,897 | ) | — | ||||
Amortization of debt discount and deferred costs | 474,360 | 571,635 | |||||
Changes in operating assets and liabilities | |||||||
Accounts receivable | (3,091,273 | ) | 2,054,774 | ||||
Inventory | (341,329 | ) | (195,977 | ) | |||
Prepaid expenses | (1,072,076 | ) | (65,603 | ) | |||
Accounts payable, accrued expenses, and other liabilities | (641,003 | ) | 329,959 | ||||
Other assets | (253,642 | ) | 129,500 | ||||
Net cash provided by (used in) operating activities | 409,486 | (2,388,578 | ) | ||||
Cash flows from investing activities | |||||||
Acquisition of SES | (269,826 | ) | — | ||||
Acquisition of Acadiana | — | (710,350 | ) | ||||
Acquisition of Nickco | — | (1,126,730 | ) | ||||
Acquisition of Ygriega | — | (162,500 | ) | ||||
Purchase of fixed assets | (1,813,904 | ) | (1,842,237 | ) | |||
Proceeds from sale of fixed assets | 6,848 | 297,718 | |||||
Net cash used in investing activities | (2,076,882 | ) | (3,544,099 | ) | |||
Cash flows from financing activities | |||||||
Payments on capital leases | (34,660 | ) | — | ||||
Payment of debt issuance costs | — | (1,718,090 | ) | ||||
Line of credit (payments) proceeds, net | 1,408,206 | 1,012,444 | |||||
Proceeds from note payable | 4,024,964 | 16,570,929 | |||||
Payments on note payable | (2,996,556 | ) | (12,013,925 | ) | |||
Net cash provided by financing activities | 2,401,954 | 3,851,358 | |||||
Net change in cash, cash equivalents and restricted cash | 734,558 | (2,081,319 | ) | ||||
Cash, cash equivalents, and restricted cash at beginning of the period | 1,105,787 | 3,206,158 | |||||
Cash, cash equivalents, and restricted cash at end of period | $ | 1,840,345 | $ | 1,124,839 | |||
F-4
SUPPLEMENTAL INFORMATION | |||||||
Cash paid for interest | $ | 2,034,275 | $ | 1,328,401 | |||
Cash paid for taxes | $ | — | $ | — | |||
NON-CASH INVESTING AND FINANCING TRANSACTIONS | |||||||
Conversion of Series A Preferred Stock into common stock | $ | 34 | $ | 36 | |||
Conversion of Series B-1 Preferred Stock into common stock | $ | 4,616,354 | $ | 119,440 | |||
Accretion of discount on Series B and B-1 Preferred Stock | $ | 1,444,376 | $ | 1,267,778 | |||
Dividends-in-kind accrued on Series B and B-1 Preferred Stock | $ | 3,191,217 | $ | 1,256,920 | |||
Equipment acquired under capital leases | $ | 450,098 | $ | — | |||
Contingent consideration on Nickco acquisition | $ | — | $ | 236,680 | |||
Common restricted shares for Nickco acquisition | $ | — | $ | 474,000 | |||
Return of common shares for sale escrow | $ | — | $ | 1,109 | |||
See accompanying notes to the consolidated financial statements
F-5
VERTEX ENERGY, INC.
NOTES TO CONSOLIDATED FINANCIAL STATEMENTS
SEPTEMBER 30, 2018
(UNAUDITED)
NOTE 1. BASIS OF PRESENTATION AND NATURE OF OPERATIONS
The accompanying unaudited consolidated interim financial statements of Vertex Energy, Inc. (the "Company" or "Vertex Energy") have been prepared in accordance with accounting principles generally accepted in the United States of America and the rules of the Securities and Exchange Commission ("SEC") and should be read in conjunction with the audited consolidated financial statements and notes thereto for the year ended December 31, 2017, contained in the Company's annual report, as filed with the SEC on Form 10-K on March 7, 2018 (the "Form 10-K"). The December 31, 2017 balance sheet was derived from the audited financial statements of our 2017 Form 10-K. In the opinion of management all adjustments, consisting of normal recurring adjustments necessary for a fair presentation of financial position and the results of operations for the interim periods presented, have been reflected herein. The results of operations for interim periods are not necessarily indicative of the results to be expected for the full year. Notes to the consolidated financial statements which would substantially duplicate the disclosures contained in the audited consolidated financial statements for the most recent fiscal year 2017 as reported in Form 10-K have been omitted.
NOTE 2. SUMMARY OF CRITICAL ACCOUNTING POLICIES AND ESTIMATES
Cash, Cash Equivalents and Restricted Cash
The Company considers all highly liquid investments with an original maturity of three months or less to be cash equivalents.
Inventory
Inventories of products consist of feedstocks, refined petroleum products and recovered ferrous and non-ferrous metals and are reported at the lower of cost or market. Cost is determined using the first-in, first-out (“FIFO”) method. The Company reviews its inventory commodities whenever events or circumstances indicate that the value may not be recoverable.
Impairment of long-lived assets
The Company evaluates the carrying value and recoverability of its long-lived assets when circumstances warrant such evaluation by applying the provisions of the Financial Accounting Standards Board Accounting Standards Codification ("FASB ASC") regarding long-lived assets. It requires that long-lived assets be reviewed for impairment whenever events or changes in circumstances indicate that the carrying amount of an asset may not be recoverable through the estimated undiscounted cash flows expected to result from the use and eventual disposition of the assets. Whenever any such impairment exists, an impairment loss will be recognized for the amount by which the carrying value exceeds the fair value. The Company determined that no long-lived asset impairment existed at September 30, 2018.
F-6
Fair value of financial instruments
Under the FASB ASC, we are permitted to elect to measure financial instruments and certain other items at fair value, with the change in fair value recorded in earnings. We elected not to measure any eligible items using the fair value option. Consistent with the Fair Value Measurement Topic of the FASB ASC, we implemented guidelines relating to the disclosure of our methodology for periodic measurement of our assets and liabilities recorded at fair market value.
Fair value is defined as the price that would be received to sell an asset or paid to transfer a liability in an orderly transaction between market participants at the measurement date. A three-tier fair value hierarchy prioritizes the inputs used in measuring fair value. The hierarchy gives the highest priority to unadjusted quoted prices in active markets for identical assets or liabilities (level 1 measurements) and the lowest priority to unobservable inputs (level 3 measurements). These tiers include:
• | Level 1, defined as observable inputs such as quoted prices for identical instruments in active markets; |
• | Level 2, defined as inputs other than quoted prices in active markets that are either directly or indirectly observable such as quoted prices for similar instruments in active markets or quoted prices for identical or similar instruments in markets that are not active; and |
• | Level 3, defined as unobservable inputs in which little or no market data exists, therefore requiring an entity to develop its own assumptions, such as valuations derived from valuation techniques in which one or more significant inputs or significant value drivers are unobservable. |
Our Level 1 assets primarily include our cash and cash equivalents. Valuations are obtained from readily available pricing sources for market transactions involving identical assets or liabilities. The carrying amounts of accounts receivable, accounts payable and accrued liabilities approximate their fair values due to the immediate or short-term maturities of these financial instruments.
Our Level 2 liabilities include our marked to market changes in the estimated value of our open derivative contracts held at the balance sheet date.
Our Level 3 liabilities include our marked to market changes in the estimated value of our derivative warrants issued in connection with our Series B Preferred Stock and Series B1 Preferred Stock.
The Company estimates the fair values of the crude oil swaps and collars based on published forward commodity price curves for the underlying commodity as of the date of the estimate for which published forward pricing is readily available. The determination of the fair values above incorporates various factors including the impact of the Company's non-performance risk and the credit standing of the counterparty involved in the Company's derivative contracts. In addition, the Company routinely monitors the creditworthiness of its counterparty.
Nonfinancial assets and liabilities measured at fair value on a nonrecurring basis include certain nonfinancial assets and liabilities as may be acquired in a business combination and thereby measured at fair value.
Income Taxes
The Company accounts for income taxes in accordance with the FASB ASC Topic 740. The Company records a valuation allowance against net deferred tax assets if, based upon the available evidence, it is more likely than not that some or all of the deferred tax assets will not be realized. The ultimate realization of deferred tax assets is dependent upon the generation of future taxable income and when temporary differences become deductible. The Company considers, among other available information, uncertainties surrounding the recoverability of deferred tax assets, scheduled reversals of deferred tax liabilities, projected future taxable income, and other matters in making this assessment.
As part of the process of preparing its consolidated financial statements, the Company is required to estimate its income taxes in each of the jurisdictions in which it operates. This process requires the Company to estimate its actual current tax liability and to assess temporary differences resulting from differing book versus tax treatment of items, such as deferred revenue, compensation and benefits expense and depreciation. These temporary differences result in deferred tax assets and liabilities, which are included within the Company’s consolidated balance sheets. Significant management judgment is required in determining the Company’s provision for income taxes, its deferred tax assets and liabilities and any valuation allowance recorded against its net deferred tax assets. If actual results differ from these estimates or the Company adjusts these estimates in future periods, the Company may need to adjust its valuation allowance, which could materially impact the Company’s consolidated financial position and results of operations.
F-7
Tax contingencies can involve complex issues and may require an extended period of time to resolve. Changes in the level of annual pre-tax income can affect the Company’s overall effective tax rate. Furthermore, the Company’s interpretation of complex tax laws may impact its recognition and measurement of current and deferred income taxes.
Derivative Transactions
All derivative instruments are recorded on the accompanying balance sheets at fair value. These derivative transactions are not designated as cash flow hedges under FASB ASC 815, Derivatives and Hedges. Accordingly, these derivative contracts are marked-to-market and any changes in the estimated value of derivative contracts held at the balance sheet date are recognized in the accompanying statements of operations as net gain or loss on derivative contracts. The derivative assets or liabilities are classified as either current or noncurrent assets or liabilities based on their anticipated settlement date. The Company nets derivative assets and liabilities for counterparties where it has a legal right of offset.
In accordance with ASC 815-40-25 and ASC 815-10-15, Derivatives and Hedging and ASC 480-10-25, Liabilities-Distinguishing from Equity, convertible preferred shares are accounted for net, outside of shareholders' equity and warrants are accounted for as liabilities at their fair value during periods where they can be net cash settled in case of a change in control transaction. The warrants are accounted for as a liability at their fair value at each reporting period. The value of the derivative warrant liability will be re-measured at each reporting period with changes in fair value recorded in earnings. To derive an estimate of the fair value of these warrants, a Dynamic Black Scholes model is utilized which computes the impact of a possible change in control transaction upon the exercise of the warrant shares. This process relies upon inputs such as shares outstanding, our quoted stock prices, strike price and volatility assumptions to dynamically adjust the payoff of the warrants in the presence of the dilution effect.
Debt Issuance Costs
The Company follows the accounting guidance of ASC 835-30, Interest-Imputation of Interest, which requires that debt issuance costs related to a recognized debt liability be reported on the Consolidated Balance Sheet as a direct reduction from the carrying amount of that debt liability.
Reclassification of Prior Year Presentation
Certain prior period amounts have been reclassified to conform to current period presentation. These reclassifications had no effect on the reported results of operations.
Recently Issued Accounting Pronouncements
In May 2014, the FASB issued ASU No. 2014-09, Revenue from Contracts with Customers, which supersedes nearly all existing revenue recognition guidance under U.S. GAAP. The core principle of ASU No. 2014-09 is to recognize revenues when promised goods or services are transferred to customers in an amount that reflects the consideration to which an entity expects to be entitled for those goods or services. ASU No. 2014-09 defines a five step process to achieve this core principle and, in doing so, more judgment and estimates may be required under existing U.S. GAAP. The standard is effective for annual periods beginning after December 15, 2016, and interim periods therein, using either of the following transition methods: (i) a full retrospective approach reflecting the application of the standard in each prior reporting period with the option to elect certain practical expedients, or (ii) a retrospective approach with the cumulative effect of initially adopting ASU No. 2014-09 recognized at the date of adoption (which includes additional footnote disclosures). In July 2015, the FASB issued ASU No. 2015-14 which delayed the effective date of ASU No. 2014-09 by one year (effective for annual periods beginning after December 15, 2017). The Company adopted ASU 2014-09 in the first quarter of fiscal 2018 using the modified retrospective method. The adoption of the standard did not have a material impact on our revenue recognition policies, and the Company has concluded that the most significant impact of the standard relates to the incremental disclosures required.
In February 2016, the FASB issued ASU No. 2016-02, Leases, which requires lessees to recognize the following for all leases (with the exception of short-term leases) at the commencement date: (1) a lease liability, which is a lessee’s obligation to make lease payments arising from a lease, measured on a discounted basis; and (2) a right-of-use asset, which is an asset that represents the lessee’s right to use, or control the use of, a specified asset for the lease term. Under ASU No. 2016-02, lessor accounting is largely unchanged. ASU No. 2016-02 is effective for fiscal years beginning after December 15, 2018 with early application permitted. In February 2018, FASB issued ASU 2018-01, Leases (Topic 842): Land Easement Practical Expedient for Transition to Topic 842. The amendment clarifies that land easements are within the scope of the new leases standard (ASC 842) and introduces a new transition practical expedient allowing a company to not assess whether existing and expired land easements that were not previously accounted for as leases under current US GAAP (ASC 840) are or contain leases under ASC 842.
F-8
In July 2018, FASB issued ASU 2018-10, Codification Improvements to Topic 842, Leases. The amendment provides improvements that clarify specific aspects of the guidance in ASU 2016-02. In August 2018, FASB issued ASU 2018-11, Leases (Topic 842): Targeted Improvements. The amendment provides entities with an additional (and optional) transition method to adopt the new leases standard and provides lessors with a practical expedient, by class of underlying asset, to not separate non-lease components from the associated lease component and, instead, to account for those components as a single component if certain criteria are met. To date, certain personnel have attended technical training concerning this new standard and management is currently reviewing our various leases to identify those affected. The Company is also continuing to evaluate transition considerations such as whether to elect practical expedients, use of hindsight, and comparative reporting periods.
NOTE 3. CONCENTRATIONS, SIGNIFICANT CUSTOMERS, COMMITMENTS AND CONTINGENCIES
At September 30, 2018 and 2017 and for each of the nine months then ended, the Company’s revenues and receivables were comprised of the following customer concentrations:
Nine Months Ended September 30, 2018 | Nine Months Ended September 30, 2017 | ||||||
% of Revenues | % of Receivables | % of Revenues | % of Receivables | ||||
Customer 1 | 37% | 37% | 9% | 23% | |||
Customer 2 | —% | —% | 19% | —% | |||
Customer 3 | 8% | 3% | 13% | 3% | |||
Customer 4 | 8% | 5% | 10% | 7% | |||
At September 30, 2018 and 2017 and for each of the nine months then ended, the Company's segment revenues were comprised of the following customer concentrations:
% of Revenue by Segment | % Revenue by Segment | ||||||||||
Nine Months Ended September 30, 2018 | Nine Months Ended September 30, 2017 | ||||||||||
Black Oil | Refining | Recovery | Black Oil | Refining | Recovery | ||||||
Customer 1 | 100% | —% | —% | 100% | —% | —% | |||||
Customer 2 | —% | —% | —% | 100% | —% | —% | |||||
Customer 3 | 100% | —% | —% | 100% | —% | —% | |||||
Customer 4 | —% | 100% | —% | —% | 100% | —% | |||||
The Company had no vendors that represented 10% of total purchases or payables for the three and nine months ended September 30, 2018 and 2017.
The Company’s revenue, profitability and future rate of growth are substantially dependent on prevailing prices for petroleum-based products. Historically, the energy markets have been very volatile, and there can be no assurance that these prices will not be subject to wide fluctuations in the future. A substantial or extended decline in such prices could have a material adverse effect on the Company’s financial position, results of operations, cash flows, access to capital, and the quantities of petroleum-based products that the Company can economically produce.
Business commitment:
On June 5, 2016, Vertex Energy and Penthol C.V. (“Penthol”) of the Netherlands aka Penthol LLC (a Penthol subsidiary in the United States) reached an agreement for Vertex Energy to act as Penthol’s exclusive agent to provide marketing, sales, and logistical duties of Group III base oil from the United Arab Emirates to the United States. The start-up date was July 25, 2016, with a 5 year term through 2021 and the product ships via truck, rail and barge.
F-9
Litigation:
The Company, in its normal course of business, is involved in various claims and legal action. In the opinion of management, the outcome of these claims and actions will not have a material adverse impact upon the financial position of the Company. We are currently party to the following material litigation proceedings:
Vertex Refining LA, LLC ("Vertex Refining LA"), the wholly-owned subsidiary of Vertex Operating, LLC, our wholly-owned subsidiary ("Vertex Operating") was named as a defendant, along with numerous other parties, in five lawsuits filed on or about February 12, 2016, in the Second Parish Court for the Parish of Jefferson, State of Louisiana, Case No. 121749, by Russell Doucet et. al., Case No. 121750, by Kendra Cannon et. al., Case No. 121751, by Lashawn Jones et. al., Case No. 121752, by Joan Strauss et. al. and Case No. 121753, by Donna Allen et. al. The suits relate to alleged noxious and harmful emissions from our facility located in Marrero, Louisiana. The suits seek damages for physical and emotional injuries, pain and suffering, medical expenses and deprivation of the use and enjoyment of plaintiffs’ homes. We intend to vigorously defend ourselves and oppose the relief sought in the complaints, provided that at this stage of the litigation, the Company has no basis for determining whether there is any likelihood of material loss associated with the claims and/or the potential and/or the outcome of the litigation.
E-Source Holdings, LLC ("E-Source"), the wholly-owned subsidiary of Vertex Operating, was named as a defendant (along with Motiva Enterprises, LLC, ("Motiva")) in a lawsuit filed in the Sixtieth (60th) Judicial District, Jefferson County, Texas, on April 22, 2015. Pursuant to the lawsuit, Whole Environmental, Inc. ("Whole"), made certain allegations against E-Source and Motiva. In July 2018, the parties entered into a confidential settlement agreement and settled all previously pending claims. The settlement did not have a material impact on the consolidated financial statements.
NOTE 4. REVENUES
Revenue Recognition
We account for a contract when it has approval and commitment from both parties, the rights of the parties are identified, payment terms are identified, the contract has commercial substance and collectability of consideration is probable. Revenue is recognized when our performance obligations under the terms of a contract with our customers are satisfied. Recognition occurs when the Company transfers control by completing the specified services at the point in time the customer benefits from the services performed or once our products are delivered. Revenue is measured as the amount of consideration we expect to receive in exchange for completing our performance obligations. Sales tax and other taxes we collect with revenue-producing activities are excluded from revenue. In the case of contracts with multiple performance obligations, the Company allocates the transaction price to each performance obligation based on the relative stand-alone selling prices of the various goods and/or services encompassed by the contract. We do not have any material significant payment terms, as payment is generally due within 30 days after the performance obligation has been satisfactorily completed. The Company has elected the practical expedient to recognize the incremental costs of obtaining a contract as an expense when incurred if the amortization period of the asset that we otherwise would have recognized is one year or less. In applying the guidance in Topic 606, there were no judgments or estimates made that the Company deems significant.
For time to time, our fuel oil customers in our black oil segment may request that we store product which they purchase from us in our facilities. We recognize revenues for these “bill and hold” sales once the following criteria have been met: (1) there is a substantive reason for the arrangement, (2) the product is segregated and identified as the customer's asset, (3) the product is ready for delivery to the customer, and (4) we cannot use the product or direct it to another customer.
Disaggregation of Revenue
The following table presents our revenues disaggregated by revenue source:
F-10
Three Months Ended September 30, 2018 | |||||||||||||||
Black Oil | Refining & Marketing | Recovery | Total | ||||||||||||
Primary Geographical Markets | |||||||||||||||
Northern United States | $ | 12,361,348 | $ | — | $ | — | $ | 12,361,348 | |||||||
Southern United States | 28,038,716 | 7,313,630 | 2,919,254 | 38,271,600 | |||||||||||
$ | 40,400,064 | $ | 7,313,630 | $ | 2,919,254 | $ | 50,632,948 | ||||||||
Sources of Revenue | |||||||||||||||
Petroleum products | $ | 40,400,064 | $ | 7,313,630 | $ | 547,184 | $ | 48,260,878 | |||||||
Metals | — | — | 2,372,070 | 2,372,070 | |||||||||||
Total revenues | $ | 40,400,064 | $ | 7,313,630 | $ | 2,919,254 | $ | 50,632,948 | |||||||
Nine Months Ended September 30, 2018 | |||||||||||||||
Black Oil | Refining & Marketing | Recovery | Total | ||||||||||||
Primary Geographical Markets | |||||||||||||||
Northern United States | $ | 31,314,405 | $ | — | $ | — | $ | 31,314,405 | |||||||
Southern United States | 79,792,036 | 17,381,741 | 10,430,731 | 107,604,508 | |||||||||||
$ | 111,106,441 | $ | 17,381,741 | $ | 10,430,731 | $ | 138,918,913 | ||||||||
Sources of Revenue | |||||||||||||||
Petroleum products | $ | 111,106,441 | $ | 17,381,741 | $ | 1,607,596 | $ | 130,095,778 | |||||||
Metals | — | — | 8,823,135 | 8,823,135 | |||||||||||
Total revenues | $ | 111,106,441 | $ | 17,381,741 | $ | 10,430,731 | $ | 138,918,913 | |||||||
Three Months Ended September 30, 2017 | |||||||||||||||
Black Oil | Refining & Marketing | Recovery | Total | ||||||||||||
Primary Geographical Markets | |||||||||||||||
Northern United States | $ | 7,770,262 | $ | — | $ | — | $ | 7,770,262 | |||||||
Southern United States | 17,588,055 | 4,856,520 | 2,255,614 | 24,700,189 | |||||||||||
$ | 25,358,317 | $ | 4,856,520 | $ | 2,255,614 | $ | 32,470,451 | ||||||||
Sources of Revenue | |||||||||||||||
Petroleum products | $ | 25,358,317 | $ | 4,856,520 | $ | 284,526 | $ | 30,499,363 | |||||||
Metals | — | — | 1,971,088 | 1,971,088 | |||||||||||
Total revenues | $ | 25,358,317 | $ | 4,856,520 | $ | 2,255,614 | $ | 32,470,451 | |||||||
F-11
Nine Months Ended September 30, 2017 | |||||||||||||||
Black Oil | Refining & Marketing | Recovery | Total | ||||||||||||
Primary Geographical Markets | |||||||||||||||
Northern United States | $ | 22,305,861 | $ | — | $ | — | $ | 22,305,861 | |||||||
Southern United States | 55,240,941 | 15,436,919 | 11,170,123 | 81,847,983 | |||||||||||
$ | 77,546,802 | $ | 15,436,919 | $ | 11,170,123 | $ | 104,153,844 | ||||||||
Sources of Revenue | |||||||||||||||
Petroleum products | $ | 77,546,802 | $ | 15,436,919 | $ | 6,389,229 | $ | 99,372,950 | |||||||
Metals | — | — | 4,780,894 | 4,780,894 | |||||||||||
Total revenues | $ | 77,546,802 | $ | 15,436,919 | $ | 11,170,123 | $ | 104,153,844 | |||||||
Petroleum products- We derive a majority of our revenues from the sale of recovered/re-refined petroleum products, which include Base Oil, VGO (Vacuum Gas Oil), Pygas, Gasoline, Cutterstock and Fuel Oils.
Metals- Consist of recoverable ferrous and non-ferrous recyclable metals from manufacturing and consumption. Scrap metal can be recovered from pipes, barges, boats, building supplies, surplus equipment, tanks, and other items consisting of metal composition. These materials are segregated, processed, cut-up and sent back to a steel mill for re-purposing.
NOTE 5. ACCOUNTS RECEIVABLE
Accounts receivable, net, consists of the following at September 30, 2018 and December 31, 2017:
September 30, 2018 | December 31, 2017 | ||||||
Accounts receivable trade | $ | 15,672,859 | $ | 12,925,059 | |||
Allowance for doubtful accounts | (1,292,595 | ) | (1,636,068 | ) | |||
Accounts receivable trade, net | $ | 14,380,264 | $ | 11,288,991 | |||
Accounts receivable trade represents amounts due from customers. Accounts receivable trade are recorded at invoiced amounts, net of reserves and allowances and do not bear interest. The Company uses its best estimate to determine the required allowance for doubtful accounts based on a variety of factors, including the length of time receivables are past due, economic trends and conditions affecting its customer base, significant one-time events and historical write-off experience. Specific provisions are recorded for individual receivables when we become aware of a customer’s inability to meet its financial obligations. The Company reviews the adequacy of its reserves and allowances quarterly.
Receivable balances greater than 30 days past due are individually reviewed for collectability and if deemed uncollectible, are charged off against the allowance accounts after all means of collection have been exhausted and the potential for recovery is considered remote. The Company does not have any significant off balance sheet credit exposure related to its customers.
NOTE 6. LINE OF CREDIT AND LONG-TERM DEBT
F-12
Credit and Guaranty Agreement and Revolving Credit Facility with Encina Business Credit, LLC
Effective February 1, 2017, we, Vertex Operating, and substantially all of our other operating subsidiaries, other than E-Source Holdings, LLC ("E-Source"), entered into a Credit Agreement (the “EBC Credit Agreement”) with Encina Business Credit, LLC as agent (the “Agent” or “EBC”) and Encina Business Credit SPV, LLC and CrowdOut Capital LLC as lenders thereunder (the “EBC Lenders”). Pursuant to the EBC Credit Agreement, and the terms thereof, the EBC Lenders agreed to loan us up to $20 million, provided that the amount outstanding under the EBC Credit Agreement at any time cannot exceed 50% of the value of the operating plant facilities and related machinery and equipment owned by us (not including E-Source).
Amounts borrowed under the EBC Credit Agreement bear interest at 12%, 13% or 14% per annum, based on the ratio of (a) (i) consolidated EBITDA for such applicable period minus (ii) capital expenditures made during such period, minus (iii) the aggregate amount of income taxes paid in cash during such period (but not less than zero) to (b) the sum of (i) debt service charges plus (ii) the aggregate amount of all dividend or other distributions paid on capital stock in cash for the most recently completed 12 month period (which ratio falls into one of the three following tiers: less than 1 to 1; from 1 to 1 to less than 1.45 to 1; or equal to or greater than 1.45 to 1, which together with the value below, determines which interest rate is applicable) and average availability under the Revolving Credit Agreement (defined below) (which falls into two tiers: less than $2.5 million and greater than or equal to $2.5 million, which together with the calculation above, determines which interest rate is applicable), as described in greater detail in the EBC Credit Agreement (increasing by 2% per annum upon the occurrence of an event of default). Interest on amounts borrowed under the EBC Credit Agreement is payable by us in arrears, on the first business day of each month, beginning on the first business day of the first full month following the closing, together with required $75,000 monthly principal repayments. We also have the right to make voluntary repayments of the amount owed under the EBC Credit Agreement in amounts equal to or greater than $100,000, from time to time. The interest rate is 12% at September 30, 2018.
The EBC Credit Agreement terminates on February 1, 2020, on which date we are required to repay the outstanding balance owed thereunder and any accrued and unpaid interest thereon.
The amounts borrowed under the EBC Credit Agreement are guaranteed by us and our subsidiaries, other than E-Source, pursuant to a Guaranty and Security Agreement (the “Guaranty and Security Agreement”), whereby we also pledged substantially all of our assets and all of the securities of our subsidiaries (other than E-Source) as collateral securing the amount due under the terms of the EBC Credit Agreement. We also provided EBC mortgages on our Marrero, Louisiana, and Columbus, Ohio facilities to secure the repayment of outstanding amounts and agreed to provide mortgages on certain other real property to be delivered post-closing. The post-closing mortgage properties provided were in Baytown, Pflugerville and Corpus Christi, Texas.
The EBC Credit Agreement contains customary representations, warranties and requirements for the Company to indemnify the EBC Lenders and their affiliates. The EBC Credit Agreement also includes various covenants (positive and negative) binding upon the Company, including, prohibiting us from undertaking acquisitions or dispositions unless they meet the criteria set forth in the EBC Credit Agreement, not incurring any capital expenditures in an amount exceeding $3 million in any fiscal year that the EBC Credit Agreement is in place, and requiring us to maintain at least $2.5 million of borrowing availability under the Revolving Credit Agreement (defined below) in any 30 day period.
The EBC Credit Agreement includes customary events of default for facilities of a similar nature and size as the EBC Credit Agreement, including if an event of default occurs under any agreement evidencing $500,000 or more of indebtedness of the Company; we fail to make any payment when due under any material agreement; subject to certain exceptions, any judgment is entered against the Company in an amount exceeding $500,000; and also provides that an event of default occurs if a change in control of the Company occurs, which includes if (a) Benjamin P. Cowart, the Company’s Chief Executive Officer, Chairman of the Board and largest shareholder and Chris Carlson, the Chief Financial Officer of the Company, cease to own and control legally and beneficially, collectively, either directly or indirectly, equity securities in Vertex Energy, Inc., representing more than 15% of the combined voting power of all securities entitled to vote for members of the board of directors or equivalent on a fully-diluted basis, (b) the acquisition of ownership, directly or indirectly, beneficially or of record, by any person or group of securities representing more than 30% of the aggregate ordinary voting power represented by the issued and outstanding securities of Vertex Energy, Inc., or (c) during any period of 12 consecutive months, a majority of the members of the board of directors of the Company cease to be composed of individuals (i) who were members of that board or equivalent governing body on the first day of such period, (ii) whose election or nomination to that board or equivalent governing body was approved by individuals referred to in clause (i) above constituting at the time of such election or nomination at least a majority of that
F-13
board or equivalent governing body or (iii) whose election or nomination to that board or other equivalent governing body was approved by individuals referred to in clauses (i) and (ii) above constituting at the time of such election or nomination at least a majority of that board or equivalent governing body (collectively “Events of Default”). An event of default under the Revolving Credit Agreement (defined below), is also an event of default under the EBC Credit Agreement.
Effective February 1, 2017, we, Vertex Operating and substantially all of our operating subsidiaries, other than E-Source, entered into a Revolving Credit Agreement (the “Revolving Credit Agreement” and together with the EBC Credit Agreement, the "Credit Agreements") with Encina Business Credit SPV, LLC as lender (“Encina”) and EBC as the administrative agent. Pursuant to the Revolving Credit Agreement, and the terms thereof, Encina agreed to loan us, on a revolving basis, up to $10 million, subject to the terms of the Revolving Credit Agreement and certain lending ratios set forth therein, which provide that the amount outstanding thereunder cannot exceed an amount equal to the total of (a) the lesser of (A) the value (as calculated in the Revolving Credit Agreement) of our inventory which are raw materials or finished goods that are merchantable and readily saleable to the public in the ordinary course of our business (“EBC Eligible Inventory”), net of certain inventory reserves, multiplied by 85% of the appraised value of EBC Eligible Inventory, or (B) the value (as calculated in the Revolving Credit Agreement) of EBC Eligible Inventory, net of certain inventory reserves, multiplied by 65%, subject to a ceiling of $4 million, plus (b) the face amount of certain accounts receivables (net of certain reserves applicable thereto) multiplied by 85% (subject to adjustment as provided in the Revolving Credit Agreement); minus (c) the then-current amount of certain reserves that the agent may determine necessary for the Company to maintain. At September 30, 2018, the maximum amount available to be borrowed was $4,000,267, based on the above borrowing base calculation.
Amounts borrowed under the Revolving Credit Agreement bear interest, subject to the terms of the Revolving Credit Agreement, at the one month LIBOR interest rate then in effect, subject to a floor of 0.25% (which interest rate is currently approximately 2.10% per annum), plus an additional 6.50% per annum (increasing by 2% per annum upon the occurrence of an event of default), provided that under certain circumstances amounts borrowed bear interest at the higher of (a) the “prime rate”; (b) the Federal Funds Rate, plus 0.50%; and (c) the LIBOR Rate for a one month interest period, plus 1.00%. Interest on amounts borrowed under the Revolving Credit Agreement is payable by us in arrears, on the first business day of each month, beginning on the first business day of the first full month following the closing.
The Revolving Credit Agreement terminates on February 1, 2020, on which date we are required to repay the outstanding balance owed thereunder and any accrued and unpaid interest thereon. Borrowings under a revolving credit agreement that contain a subjective acceleration clause and also require a borrower to maintain a lockbox with the lender (whereby lockbox receipts may be applied to reduce the amount outstanding under the revolving credit agreement) are considered short-term obligations. As a result, the debt is classified as a current liability at September 30, 2018.
The amounts borrowed under the Revolving Credit Agreement are guaranteed by us and our subsidiaries, other than E-Source, pursuant to a separate Guaranty and Security Agreement, similar to the EBC Credit Agreement, described in greater detail above. We also provided Encina mortgages on our Marrero, Louisiana, and Columbus, Ohio facilities to secure the repayment of outstanding amounts.
The Revolving Credit Agreement contains customary representations, warranties and requirements for the Company to indemnify Encina and its affiliates. The Revolving Credit Agreement also includes various covenants (positive and negative) binding upon the Company, including, prohibiting us from undertaking acquisitions or dispositions unless they meet the criteria set forth in the Revolving Credit Agreement, not incurring any capital expenditures in amount exceeding $3 million in any fiscal year that the Revolving Credit Agreement is in place, and requiring us to maintain at least $2.5 million of borrowing availability under the Revolving Credit Agreement in any 30 day period.
The Revolving Credit Agreement includes customary events of default for facilities of a similar nature and size as the Revolving Credit Agreement, including the same Events of Default as are described above under the description of the EBC Credit Agreement.
The principal balances of the EBC Credit Agreement and the Revolving Credit Agreement as of September 30, 2018 are $15,575,000 and $5,999,733, respectively.
F-14
Texas Citizens Bank Loan Agreement
The Company had notes payable to Texas Citizens Bank bearing interest at 5.50% per annum, maturing on January 7, 2020. The balances of the notes payable was $834,283 at December 31, 2017. The note was paid off during the quarter ended September 30, 2018.
Insurance Premiums
The Company financed insurance premiums through various financial institutions bearing interest rates from 4.00% to 4.52%. All such premium finance agreements have maturities of less than one year and have a balance of $1,841,083 at September 30, 2018 and $803,392 at December 31, 2017.
Capital Leases
On March 1, 2018, the Company obtained one capital lease. Payments are $908 per month for three years and the amount of the capital lease obligation has been reduced to $24,829 at September 30, 2018.
On May 29, 2018, the Company obtained one capital lease. Payments are $26,305 per quarter for four years and the amount of the capital lease obligation has been reduced to $390,609 at September 30, 2018.
The Company's outstanding debt facilities as of September 30, 2018 and December 31, 2017 are summarized as follows:
Creditor | Loan Type | Origination Date | Maturity Date | Loan Amount | Balance on September 30, 2018 | Balance on December 31, 2017 | ||||||||||
Encina Business Credit, LLC | Term Loan | February 1, 2017 | February 1, 2020 | $ | 20,000,000 | $ | 15,575,000 | $ | 14,750,000 | |||||||
Encina Business Credit SPV, LLC | Revolving Note | February 1, 2017 | February 1, 2020 | $ | 10,000,000 | 5,999,733 | 4,591,527 | |||||||||
Tetra Capital Lease | Capital Lease | May, 2018 | May, 2022 | $ | 419,690 | 390,609 | — | |||||||||
Well Fargo Equipment Lease | Capital Lease | March, 2018 | March, 2021 | $ | 30,408 | 24,829 | — | |||||||||
Texas Citizens Bank | Term Note | January, 2015 | January, 2020 | $ | 2,045,500 | — | 834,283 | |||||||||
Various institutions | Insurance premiums financed | Various | < 1 year | $ | 2,902,428 | 1,841,083 | 803,392 | |||||||||
Total | 23,831,254 | 20,979,202 | ||||||||||||||
Deferred finance cost, net | (765,210 | ) | (1,239,570 | ) | ||||||||||||
Total, net of deferred finance costs | $ | 23,066,044 | $ | 19,739,632 | ||||||||||||
F-15
Future contractual maturities of notes payable as of September 30, 2018 are summarized as follows:
Creditor | Year 1 | Year 2 | Year 3 | Year 4 | Year 5 | Thereafter | |||||||||||||||||
Encina Business Credit, LLC | $ | 900,000 | $ | 14,675,000 | $ | — | $ | — | $ | — | $ | — | |||||||||||
Encina Business Credit SPV, LLC | 5,999,733 | — | — | — | — | — | |||||||||||||||||
Tetra Capital Lease | 82,969 | 88,743 | 94,919 | 123,978 | — | — | |||||||||||||||||
Well Fargo Equipment Lease | 9,931 | 10,413 | 4,485 | — | — | — | |||||||||||||||||
Various institutions | 1,841,083 | — | — | — | — | — | |||||||||||||||||
Totals | 8,833,716 | 14,774,156 | 99,404 | 123,978 | — | — | |||||||||||||||||
Deferred finance costs, net | (573,912 | ) | (191,298 | ) | — | — | — | — | |||||||||||||||
Totals, net of deferred finance costs | $ | 8,259,804 | $ | 14,582,858 | $ | 99,404 | $ | 123,978 | $ | — | $ | — | |||||||||||
NOTE 7. EARNINGS PER SHARE
Basic earnings per share includes no dilution and is computed by dividing income available to common shareholders by the weighted average number of common shares outstanding for the periods presented. Diluted earnings per share reflects the potential dilution of securities that could share in the earnings of an entity, such as convertible preferred stock, stock options, warrants or convertible securities. Due to their anti-dilutive effect, the calculation of diluted earnings per share for the three months ended September 30, 2018 and 2017 excludes: 1) options to purchase 3,438,837 and 3,030,249 shares, respectively, of common stock, 2) warrants to purchase 7,353,056 and 7,353,061 shares, respectively, of common stock, 3) Series B Preferred Stock which is convertible into 3,551,549 and 3,376,938 shares, respectively, of common stock, and 4) Series B1 Preferred Stock which is convertible into 11,074,331 and 12,862,572 shares, respectively, of common stock, 5) Series A Preferred Stock which is convertible into 419,859 and 456,608 shares, respectively, of common stock, and 6) Series C Preferred Stock, which was convertible into 3,156,800 shares of common stock as of September 30, 2017. Due to their anti-dilutive effect, the calculation of diluted earnings per share for the nine months ended September 30, 2018 and 2017 excludes: 1) options to purchase 3,438,837 and 3,030,249 shares, respectively, of common stock, 2) warrants to purchase 7,353,056 and 7,353,061 shares, respectively, of common stock, 3) Series B Preferred Stock which is convertible into 3,499,059 and 3,376,938 shares, respectively, of common stock, 4) Series B1 Preferred Stock which is convertible into 13,105,989 and 12,862,572 shares, respectively, of common stock, 5) Series A Preferred Stock which is convertible into 419,859 and 456,608 shares, respectively, of common stock, and 6) Series C Preferred Stock, which was convertible into 3,156,800 shares of common stock as of September 30, 2017.
F-16
The following is a reconciliation of the numerator and denominator for basic and diluted earnings per share for the three and nine months ended September 30, 2018 and 2017:
Three Months Ended September 30, | Nine Months Ended September 30, | ||||||||||||||
2018 | 2017 | 2018 | 2017 | ||||||||||||
Basic Earnings per Share | |||||||||||||||
Numerator: | |||||||||||||||
Net loss available to common shareholders | $ | (4,635,372 | ) | $ | (3,829,125 | ) | $ | (6,652,027 | ) | $ | (10,572,545 | ) | |||
Denominator: | |||||||||||||||
Weighted-average shares outstanding | 35,144,113 | 32,655,135 | 33,843,721 | 32,651,961 | |||||||||||
Basic earnings per share | $ | (0.13 | ) | $ | (0.12 | ) | $ | (0.20 | ) | $ | (0.32 | ) | |||
Diluted Earnings per Share | |||||||||||||||
Numerator: | |||||||||||||||
Net loss available to common shareholders | $ | (4,635,372 | ) | $ | (3,829,125 | ) | $ | (6,652,027 | ) | $ | (10,572,545 | ) | |||
Denominator: | |||||||||||||||
Weighted-average shares outstanding | 35,144,113 | 32,655,135 | 33,843,721 | 32,651,961 | |||||||||||
Effect of dilutive securities | |||||||||||||||
Stock options and warrants | — | — | — | — | |||||||||||
Preferred Stock A | — | — | — | — | |||||||||||
Diluted weighted-average shares outstanding | 35,144,113 | 32,655,135 | 33,843,721 | 32,651,961 | |||||||||||
Diluted earnings (loss) per share | $ | (0.13 | ) | $ | (0.12 | ) | $ | (0.20 | ) | $ | (0.32 | ) | |||
F-17
NOTE 8. COMMON STOCK
The total number of authorized shares of the Company’s common stock is 750,000,000 shares, $0.001 par value per share. As of September 30, 2018, there were 38,840,890 common shares issued and outstanding.
During the nine months ended September 30, 2018, the Company issued 6,182,473 shares of common stock in connection with the conversion of Series B1, Series B, Series C, and Series A Convertible Preferred Stock, pursuant to the terms of such securities. In addition, the Company issued 241 shares of common stock in connection with the cashless exercise of options.
F-18
NOTE 9. PREFERRED STOCK AND DETACHABLE WARRANTS
The total number of authorized shares of the Company’s preferred stock is 50,000,000 shares, $0.001 par value per share. The total number of designated shares of the Company’s Series A Convertible Preferred Stock is 5,000,000 (“Series A Preferred”). The total number of designated shares of the Company’s Series B Convertible Preferred Stock is 10,000,000. The total number of designated shares of the Company’s Series B1 Convertible Preferred Stock is 17,000,000. The number of designated shares of the Company's Series C Convertible Preferred Stock is 44,000. As of September 30, 2018 and December 31, 2017, there were 419,859 shares and 453,567 shares of Series A Preferred Stock issued and outstanding, respectively. As of September 30, 2018 and December 31, 2017, there were 3,551,549 and 3,427,597 shares of Series B Preferred Stock issued and outstanding, respectively. As of September 30, 2018 and December 31, 2017, there were 11,074,331 and 13,151,989 shares of Series B1 Preferred Stock issued and outstanding, respectively. As of September 30, 2018, there were no shares of Series C Preferred Stock issued and outstanding. As of December 31, 2017, there were 31,568 shares of Series C Preferred Stock issued and outstanding.
Series B Preferred Stock and Temporary Equity
Dividends on our Series B Preferred Stock accrue at an annual rate of 6% of the original issue price of the preferred stock ($3.10 per share), subject to increase under certain circumstances, and are payable on a quarterly basis. The dividends are payable by the Company, at the Company’s election, in registered common stock of the Company (if available), cash or in-kind in Series B Preferred Stock at $3.10 per share.
The Company has the option to redeem the outstanding shares of Series B Preferred Stock at $3.10 per share, plus any accrued and unpaid dividends on such Series B Preferred Stock redeemed, at any time beginning on June 24, 2017, and the Company is required to redeem the Series B Preferred Stock at $3.10 per share, plus any accrued and unpaid dividends, on June 24, 2020. Notwithstanding either of the foregoing, the Series B Preferred Stock may not be redeemed unless and until amounts outstanding under the Company’s senior credit facility have been paid in full.
The Warrants issued in connection with the Series B Preferred Stock (Series B Warrants) were initially valued using the Dynamic Black Scholes Merton formula pricing model that computes the impact of share dilution upon the exercise of the warrant shares at $7,028,067. In accordance with ASC 815-40-25 and ASC 815-10-15 Derivatives and Hedging and ASC 480-10-25 Liabilities-Distinguishing Liabilities from Equity, the convertible preferred shares are accounted for net outside of stockholders’ equity with the Warrants accounted for as liabilities at their fair value. The initial value assigned to the derivative warrant liability was recognized through a corresponding discount to the Series B Preferred Stock. The value of the derivative warrant liability will be re-measured at each reporting period with changes in fair value recorded in earnings. The initial valuation of the warrants resulted in a beneficial conversion feature on the convertible preferred stock of $5,737,796. The amounts related to the warrant discount and beneficial conversion feature will be accreted over the term as a deemed dividend. Fees in the amount of $1.4 million relating to the stock placement were netted against proceeds.
The following table represents the activity related to the Series B Preferred Stock, classified as Temporary Equity on the accompanying Consolidated Balance Sheet, during the nine months ended September 30, 2018 and 2017:
2018 | 2017 | ||||||
Balance at beginning of period | $ | 7,190,467 | $ | 5,676,467 | |||
Less: conversions of shares to common | (62,962 | ) | — | ||||
Plus: discount accretion | 815,373 | 643,458 | |||||
Plus: dividends in kind | 489,282 | 492,599 | |||||
Balance at end of period | $ | 8,432,160 | $ | 6,812,524 | |||
The Series B Warrants and Series B1 Warrants were revalued at September 30, 2018 and December 31, 2017 using the Dynamic Black Scholes model that computes the impact of a possible change in control transaction upon the exercise of the warrant shares at approximately $4,370,379 and $2,245,408, respectively. At September 30, 2018, the Series B Warrants and Series B1 Warrants were valued at approximately $1,357,079 and $3,013,300, respectively. The Dynamic Black Scholes Merton inputs used were: expected dividend rate of 0%, expected volatility of 76%-100%, risk free interest rate of 2.85% (Series B Warrants) and 2.95% (Series B1 Warrants), and expected term of 2.22 years (Series B Warrants) and 3.61 years (Series B1 Warrants).
At September 30, 2018 and December 31, 2017, a total of $165,162 and $139,186 of dividends were accrued on our outstanding Series B Preferred Stock, respectively. During the three months ended September 30, 2018 and 2017, we paid dividends in-kind in additional shares of Series B Preferred Stock of $162,719 and $139,186, respectively.
F-19
Series B1 Preferred Stock and Temporary Equity
Dividends on our Series B1 Preferred Stock accrue at an annual rate of 6% of the original issue price of the preferred stock ($1.56 per share), subject to increases if certain EBITDA thresholds are not met, and are payable on a quarterly basis. The dividends are payable by the Company, at the Company’s election, in registered common stock of the Company (if available), cash, or in-kind in Series B1 Preferred Stock at $1.56 per share. At March 31, 2018, and June 30, 2018, the EBITDA thresholds were not met resulting in a 9% dividend rate. At September 30, 2018, the EBITDA thresholds expired and the dividend rate of the Series B1 Preferred Stock returned to 6%.
The Company has the option to redeem the outstanding shares of Series B1 Preferred Stock at $1.72 per share, plus any accrued and unpaid dividends on such Series B1 Preferred Stock redeemed, at any time beginning on June 24, 2017, and the Company is required to redeem the Series B1 Preferred Stock at $1.56 per share, plus any accrued and unpaid dividends, on June 24, 2020. Notwithstanding either of the foregoing, the Series B1 Preferred Stock may not be redeemed unless and until amounts outstanding under the Company’s senior credit facility have been paid in full.
The Warrants issued in connection with the Series B1 Preferred Stock offering (Series B1 Warrants) were initially valued using the Dynamic Black Scholes Merton formula pricing model that computes the impact of share dilution upon the exercise of the May 2016 Warrant shares at $2,867,264. In accordance with ASC 815-40-25 and ASC 815-10-15 Derivatives and Hedging and ASC 480-10-25 Liabilities-Distinguishing Liabilities from Equity, the convertible Series B1 Preferred Stock shares are accounted for net outside of stockholders’ equity at $14,387,804 with the May 2016 Warrants accounted for as liabilities at their fair value. The initial value assigned to the derivative warrant liability was recognized through a corresponding discount to the Series B1 Preferred Stock. The value of the derivative warrant liability will be re-measured at each reporting period with changes in fair value recorded in earnings. This initial valuation of the warrants resulted in a beneficial conversion feature on the convertible preferred stock of $2,371,106. The amounts related to the warrant discount and beneficial conversion feature will be accreted over the term as a deemed dividend. Fees in the amount of $0.6 million relating to the stock placement were netted against proceeds.
The following table represents the activity related to the Series B1 Preferred Stock, classified as Temporary Equity on the accompanying Consolidated Balance Sheet, for the nine months ended September 30, 2018, and 2017:
2018 | 2017 | ||||||
Balance at beginning of period | $ | 15,769,478 | $ | 13,927,788 | |||
Less: conversions of shares to common | (3,746,917 | ) | (86,467 | ) | |||
Plus: dividends-in-kind | 1,736,240 | 848,082 | |||||
Plus: discount accretion | 629,003 | 591,347 | |||||
Balance at end of period | $ | 14,387,804 | $ | 15,280,750 | |||
As of September 30, 2018 and December 31, 2017, respectively, a total of $314,149 and $276,144 of dividends were accrued on our outstanding Series B1 Preferred Stock. During the three months ended September 30, 2018 and 2017, we paid dividends in-kind in additional shares of Series B Preferred Stock of $460,035 and $276,144, respectively.
The following is an analysis of changes in the derivative liability for the nine months ended September 30:
Level Three Roll-Forward | |||||||
2018 | 2017 | ||||||
Balance at beginning of period | $ | 2,245,408 | $ | 4,365,992 | |||
Change in valuation of warrants | 2,124,971 | (2,676,902 | ) | ||||
Balance at end of period | $ | 4,370,379 | $ | 1,689,090 | |||
F-20
NOTE 10. SEGMENT REPORTING
The Company’s reportable segments include the Black Oil, Refining & Marketing and Recovery divisions. Segment information for the three and nine months ended September 30, 2018 and 2017 is as follows:
THREE MONTHS ENDED SEPTEMBER 30, 2018 | ||||||||||||||||
Black Oil | Refining & Marketing | Recovery | Total | |||||||||||||
Revenues | $ | 40,400,064 | $ | 7,313,630 | $ | 2,919,254 | $ | 50,632,948 | ||||||||
Income (loss) from operations | $ | 1,769,439 | $ | (418,482 | ) | $ | (776,874 | ) | $ | 574,083 | ||||||
THREE MONTHS ENDED SEPTEMBER 30, 2017 | ||||||||||||||||
Black Oil | Refining & Marketing | Recovery | Total | |||||||||||||
Revenues | $ | 25,358,317 | $ | 4,856,520 | $ | 2,255,614 | $ | 32,470,451 | ||||||||
Income (loss) from operations | $ | (2,769,027 | ) | $ | (708,175 | ) | $ | (137,390 | ) | $ | (3,614,592 | ) | ||||
NINE MONTHS ENDED SEPTEMBER 30, 2018 | ||||||||||||||||
Black Oil | Refining & Marketing | Recovery | Total | |||||||||||||
Revenues | $ | 111,106,441 | $ | 17,381,741 | $ | 10,430,731 | $ | 138,918,913 | ||||||||
Income (loss) from operations | $ | 3,979,619 | $ | (1,119,522 | ) | $ | (278,666 | ) | $ | 2,581,431 | ||||||
NINE MONTHS ENDED SEPTEMBER 30, 2017 | ||||||||||||||||
Black Oil | Refining & Marketing | Recovery | Total | |||||||||||||
Revenues | $ | 77,546,802 | $ | 15,436,919 | $ | 11,170,123 | $ | 104,153,844 | ||||||||
Income (loss) from operations | $ | (6,816,027 | ) | $ | (920,726 | ) | $ | (196,853 | ) | $ | (7,933,606 | ) | ||||
NOTE 11. INCOME TAXES
Our effective tax rate of 0% on pretax income differs from the U.S. federal income tax rate of 21% because of the change in our valuation allowance.
The year to date loss at September 30, 2018 put the Company in an accumulated loss position for the cumulative 12 quarters then ended. For tax reporting purposes, we have net operating losses ("NOLs") of approximately $57.5 million as of September 30, 2018 that are available to reduce future taxable income. In determining the carrying value of our net deferred tax asset, the Company considered all negative and positive evidence. The Company has generated a pre-tax loss of approximately $2.0 million from January 1, 2018 through September 30, 2018.
F-21
NOTE 12. COMMODITY DERIVATIVE INSTRUMENTS
The Company utilizes derivative instruments to manage its exposure to fluctuations in the underlying commodity prices of its inventory. The Company's management sets and implements hedging policies, including volumes, types of instruments and counterparties, to support oil prices at targeted levels and manage its exposure to fluctuating prices.
The Company’s derivative instruments consist of swap and futures arrangements for oil. In a commodity swap agreement, if the agreed-upon published third-party index price (“index price”) is lower than the swap fixed price, the Company receives the difference between the index price and the swap fixed price. If the index price is higher than the swap fixed price, the Company pays the difference. For futures arrangements, the Company receives the difference positive or negative between an agreed-upon strike price and the market price.
The mark-to-market effects of these contracts as of September 30, 2018, are summarized in the following table. The Company held no open contracts at December 31, 2017. The notional amount is equal to the total net volumetric derivative position during the period indicated. The fair value of the crude oil swap agreements is based on the difference between the strike price and the New York Mercantile Exchange futures price for the applicable trading months.
Contract Type | Contract Period | Weighted Average Strike Price (Barrels) | Remaining Volume (Barrels) | Fair Value | |||||
Swap | Sep. 2018- Dec. 2018 | $ | 69.93 | 120,000 | $ | 740,200 | |||
Swap | Sep. 2018- Jan. 2019 | $ | 98.79 | 20,000 | $ | (431,894 | ) | ||
Futures | Sep. 2018- Dec. 2018 | $ | 95.43 | 100,000 | $ | (874,440 | ) | ||
Futures | Sep. 2018- Nov. 2018 | $ | 73.25 | 10,000 | $ | (35,400 | ) | ||
The carrying values of the Company's derivatives positions and their locations on the consolidated balance sheets as of September 30, 2018 are presented in the table below.
Balance Sheet Classification | Contract Type | 2018 | ||
Crude oil swaps | $ | 308,306 | ||
Crude oil futures | (909,840 | ) | ||
Derivative commodity liability | $ | (601,534 | ) | |
For the three and nine months ended September 30, 2018, we recognized $647,149 and $1,859,234 loss on commodity derivative contracts on the consolidated statements of operations as part of our costs of revenues, respectively.
NOTE 12. ASSET PURCHASE
On April 30, 2018, the Company entered into and closed an Asset Purchase Agreement (the "APA") with Specialty Environmental Services ("SES") pursuant to which the Company agreed to buy substantially all of SES's customer relations, vehicles, equipment, supplies and tools in Texas for an aggregate purchase price of $269,826. We recognized most of the consideration in tangible and intangible assets as of the purchase date.
F-22
NOTE 13. SUBSEQUENT EVENTS
Issuance of Series B and B1 Preferred Stock Shares In-Kind and Common Stock
We paid the accrued dividends on our Series B Preferred Stock and Series B1 Preferred Stock, which were accrued as of September 30, 2018, in-kind by way of the issuance of 53,278 restricted shares of Series B Preferred Stock pro rata to each of the then holders of our Series B Preferred Stock in October 2018 and the issuance of 166,630 shares of common stock (at a conversion price of $1.55 per share, as calculated as provided in the designation) pro rata to each of the then holders of our Series B1 Preferred Stock, other than those due to an affiliate of Mr. Benjamin P. Cowart, our Chief Executive Officer and Chairman, whose affiliated entity was issued 567 shares of restricted Series B Preferred Stock in lieu of common stock, because of the 9.99% beneficial ownership limitation in the designation in October 2018. If converted in full, the 53,278 shares of Series B Preferred Stock would convert into 53,278 shares of common stock and the 567 shares of Series B1 Preferred Stock would convert into 567 shares of common stock.
Conversion of Series B1 Preferred Stock
On October 4, 2018, a holder of shares of Series B1 Preferred Stock converted 1,000,000 shares of our Series B1 Preferred Stock into 1,000,000 shares of our common stock, pursuant to the terms of such Series B1 Preferred Stock.
F-23
Item 2. Management’s Discussion and Analysis of Financial Condition and Results of Operations
CAUTIONARY STATEMENT REGARDING FORWARD-LOOKING INFORMATION
This Report contains forward-looking statements within the meaning of Section 27A of the Securities Act of 1933, as amended, and Section 21E of the Securities Exchange Act of 1934, as amended. In some cases, you can identify forward-looking statements by the following words: “anticipate,” “believe,” “continue,” “could,” “estimate,” “expect,” “intend,” “may,” “ongoing,” “plan,” “potential,” “predict,” “project,” “should,” or the negative of these terms or other comparable terminology, although not all forward-looking statements contain these words. Forward-looking statements are not a guarantee of future performance or results, and will not necessarily be accurate indications of the times at, or by, which such performance or results will be achieved. Forward-looking statements are based on information available at the time the statements are made and involve known and unknown risks, uncertainties and other factors that may cause our results, levels of activity, performance or achievements to be materially different from the information expressed or implied by the forward-looking statements in this Report. These factors include:
• | risks associated with our outstanding credit facilities, including amounts owed, restrictive covenants, security interests thereon and our ability to repay such facilities and amounts due thereon when due; |
• | the level of competition in our industry and our ability to compete; |
• | our ability to respond to changes in our industry; |
• | the loss of key personnel or failure to attract, integrate and retain additional personnel; |
• | our ability to protect our intellectual property and not infringe on others’ intellectual property; |
• | our ability to scale our business; |
• | our ability to maintain supplier relationships and obtain adequate supplies of feedstocks; |
• | our ability to obtain and retain customers; |
• | our ability to produce our products at competitive rates; |
• | our ability to execute our business strategy in a very competitive environment; |
• | trends in, and the market for, the price of oil and gas and alternative energy sources; |
• | our ability to maintain our relationship with KMTEX; |
• | the impact of competitive services and products; |
• | our ability to integrate acquisitions; |
• | our ability to complete future acquisitions; |
• | our ability to maintain insurance; |
• | potential future litigation, judgments and settlements; |
• | rules and regulations making our operations more costly or restrictive; |
• | changes in environmental and other laws and regulations and risks associated with such laws and regulations; |
• | economic downturns both in the United States and globally; |
• | risk of increased regulation of our operations and products; |
• | negative publicity and public opposition to our operations; |
• | disruptions in the infrastructure that we and our partners rely on; |
1
• | an inability to identify attractive acquisition opportunities and successfully negotiate acquisition terms; |
• | our ability to effectively integrate acquired assets, companies, employees or businesses; |
• | liabilities associated with acquired companies, assets or businesses; |
• | interruptions at our facilities; |
• | required earn-out payments and other contingent payments we are required to make; |
• | unexpected changes in our anticipated capital expenditures resulting from unforeseen required maintenance, repairs, or upgrades; |
• | our ability to acquire and construct new facilities; |
• | certain events of default which have occurred under our debt facilities and previously been waived; |
• | prohibitions on borrowing and other covenants of our debt facilities; |
• | our ability to effectively manage our growth; |
• | the lack of capital available on acceptable terms to finance our continued growth; and |
• | other risk factors included under “Risk Factors” in our latest Annual Report on Form 10-K. |
You should read the matters described in, and incorporated by reference in, “Risk Factors” and the other cautionary statements made in this Report, and incorporated by reference herein, as being applicable to all related forward-looking statements wherever they appear in this Report. We cannot assure you that the forward-looking statements in this Report will prove to be accurate and therefore prospective investors are encouraged not to place undue reliance on forward-looking statements. Other than as required by law, we undertake no obligation to update or revise these forward-looking statements, even though our situation may change in the future.
This information should be read in conjunction with the interim unaudited financial statements and the notes thereto included in this Quarterly Report on Form 10-Q, and the audited financial statements and notes thereto and "Part II", "Item 7, Management’s Discussion and Analysis of Financial Condition and Results of Operations" contained in our Annual Report on Form 10-K for the year ended December 31, 2017, filed with the Securities and Exchange Commission on March 7, 2018 (the "Annual Report").
Certain capitalized terms used below and otherwise defined below, have the meanings given to such terms in the footnotes to our unaudited consolidated financial statements included above under “Part I - Financial Information” - “Item 1. Financial Statements”.
In this Quarterly Report on Form 10-Q, we may rely on and refer to information regarding the refining, re-refining, used oil and oil and gas industries in general from market research reports, analyst reports and other publicly available information. Although we believe that this information is reliable, we cannot guarantee the accuracy and completeness of this information, and we have not independently verified any of it.
Please see the “Glossary of Selected Terms” incorporated by reference hereto as Exhibit 99.1, for a list of abbreviations and definitions used throughout this Report.
2
Unless the context requires otherwise, references to the “Company,” “we,” “us,” “our,” “Vertex”, “Vertex Energy” and “Vertex Energy, Inc.” refer specifically to Vertex Energy, Inc. and its consolidated subsidiaries.
In addition, unless the context otherwise requires and for the purposes of this report only:
• | “Exchange Act” refers to the Securities Exchange Act of 1934, as amended; |
• | “SEC” or the “Commission” refers to the United States Securities and Exchange Commission; and |
• | “Securities Act” refers to the Securities Act of 1933, as amended. |
Where You Can Find Other Information
We file annual, quarterly, and current reports, proxy statements and other information with the Securities and Exchange Commission (“SEC”). Our SEC filings are available to the public over the Internet at the SEC’s website at www.sec.gov and are available for download, free of charge, soon after such reports are filed with or furnished to the SEC, on the “Investor Relations,” “SEC Filings” page of our website at www.vertexenergy.com. Information on our website is not part of this Report, and we do not desire to incorporate by reference such information herein. You may also read and copy any documents we file with the SEC at the SEC’s Public Reference Room at 100 F Street N.E., Washington, D.C. 20549. You can also obtain copies of the document upon the payment of a duplicating fee to the SEC. Please call the SEC at 1-800-SEC-0330 for further information on the operation of the Public Reference Room. The SEC maintains an Internet site that contains reports, proxy and information statements, and other information regarding issuers that file electronically with the SEC like us. Copies of documents filed by us with the SEC are also available from us without charge, upon oral or written request to our Secretary, who can be contacted at the address and telephone number set forth on the cover page of this Report.
Corporate History:
We were formed as a Nevada corporation on May 14, 2008. Pursuant to an Amended and Restated Agreement and Plan of Merger dated May 19, 2008, by and between Vertex Holdings, L.P. (formerly Vertex Energy, L.P.), a Texas limited partnership (“Holdings”), us, World Waste Technologies, Inc., a California corporation (“WWT” or “World Waste”), Vertex Merger Sub, LLC, a California limited liability company and our wholly-owned subsidiary (“Merger Subsidiary”), and Benjamin P. Cowart, our Chief Executive Officer, as agent for our shareholders (as amended from time to time, the “Merger Agreement”). Effective on April 16, 2009, World Waste merged with and into Merger Subsidiary, with Merger Subsidiary continuing as the surviving corporation and becoming our wholly-owned subsidiary (the “Merger”). In connection with the Merger, (i) each outstanding share of World Waste common stock was canceled and exchanged for 0.10 shares of our common stock; (ii) each outstanding share of World Waste Series A preferred stock was canceled and exchanged for 0.4062 shares of our Series A preferred stock; and (iii) each outstanding share of World Waste Series B preferred stock was canceled and exchanged for 11.651 shares of our Series A Convertible Preferred Stock.
Description of Business Activities:
We are an environmental services company that recycles industrial waste streams and off-specification commercial chemical products. Our primary focus is recycling used motor oil and other petroleum by-products. We are engaged in operations across the entire petroleum recycling value chain including collection, aggregation, transportation, storage, re-refinement, and sales of aggregated feedstock and re-refined products to end users. We operate in three divisions: Black Oil, Refining and Marketing, and Recovery.
We currently provide our services in 15 states, primarily in the Gulf Coast, Midwest and Mid-Atlantic regions of the United States. For the rolling twelve month period ending September 30, 2018, we aggregated approximately 102.3 million gallons of used motor oil and other petroleum by-product feedstocks and managed the re-refining of approximately 79.4 million gallons of used motor oil with our proprietary vacuum gas oil ("VGO") and Base Oil processes.
Our Black Oil division collects and purchases used motor oil directly from third-party generators, aggregates used motor oil from an established network of local and regional collectors, and sells used motor oil to our customers for use as a feedstock or replacement fuel for industrial burners. We operate a refining facility that uses our proprietary TCEP (which is currently not in operation) and we also utilize third-party processing facilities. We also acquired our Marrero, Louisiana facility, which facility re-refines used motor oil and also produces VGO and our Myrtle Grove re-refining complex in Belle Chasse, Louisiana in May 2014.
3
Our Refining and Marketing division aggregates and manages the re-refinement of used motor oil and other petroleum by-products and sells the re-refined products to end customers.
Our Recovery division includes a generator solutions company for the proper recovery and management of hydrocarbon streams as well as metals which include transportation, dismantling, demolition, decommission and marine salvage services at industrial facilities throughout the Gulf Coast.
Black Oil Division
Our Black Oil division is engaged in operations across the entire used motor oil recycling value chain including collection, aggregation, transportation, storage, refinement, and sales of aggregated feedstock and re-refined products to end users. We collect and purchase used oil directly from generators such as oil change service stations, automotive repair shops, manufacturing facilities, petroleum refineries, and petrochemical manufacturing operations. We own a fleet of 35 collection vehicles, which routinely visit generators to collect and purchase used motor oil. We also aggregate used oil from a diverse network of approximately 50 suppliers who operate similar collection businesses to ours.
We manage the logistics of transport, storage and delivery of used oil to our customers. We own a fleet of 18 transportation trucks and more than 150 aboveground storage tanks with over 7.3 million gallons of storage capacity. These assets are used by both the Black Oil division and the Refining and Marketing division. In addition, we also utilize third parties for the transportation and storage of used oil feedstocks. Typically, we sell used oil to our customers in bulk to ensure efficient delivery by truck, rail, or barge. In many cases, we have contractual purchase and sale agreements with our suppliers and customers, respectively. We believe these contracts are beneficial to all parties involved because it ensures that a minimum volume is purchased from collectors and generators, a minimum volume is sold to our customers, and we are able to minimize our inventory risk by a spread between the costs to acquire used oil and the revenues received from the sale and delivery of used oil. We have historically used our proprietary TCEP technology to re-refine used oil into marine fuel cutterstock and a higher-value feedstock for further processing (we are currently utilizing TCEP to pre-treat our used motor oil feedstock prior to shipping to our facility in Marrero, Louisiana; but have not operated our TCEP for the purpose of producing finished cutterstock since the third quarter of fiscal 2015, due to market conditions). In addition, at our Marrero, Louisiana facility we produce a Vacuum Gas Oil (VGO) product that is sold to refineries as well as to the marine fuels market. At our Columbus, Ohio facility (Heartland Petroleum) we produce a base oil product that is sold to lubricant packagers and distributors.
Refining and Marketing Division
Our Refining and Marketing division is engaged in the aggregation of feedstock, re-refining it into higher value-end products, and selling these products to our customers, as well as related transportation and storage activities. We aggregate a diverse mix of feedstocks including used motor oil, petroleum distillates, transmix and other off-specification chemical products. These feedstock streams are purchased from pipeline operators, refineries, chemical processing facilities and third-party providers, and are also transferred from our Black Oil division. We have a toll-based processing agreement in place with KMTEX to re-refine feedstock streams, under our direction, into various end products that we specify. KMTEX uses industry standard processing technologies to re-refine our feedstocks into pygas, gasoline blendstock and marine fuel cutterstock. We sell all of our re-refined products directly to end-customers or to processing facilities for further refinement.
Recovery Division
The Recovery division is a generator solutions company for the proper recovery and management of hydrocarbon streams. The Recovery division also provides industrial dismantling, demolition, decommissioning, investment recovery and marine salvage services in industrial facilities. The Company (through this division) owns and operates a fleet of thirteen trucks and heavy equipment used for processing, shipping and handling of reusable process equipment and other scrap commodities.
Thermal Chemical Extraction Process
We own the intellectual property for our patented TCEP. TCEP is a technology which utilizes thermal and chemical dynamics to extract impurities from used oil which increases the value of the feedstock. We intend to continue to develop our TCEP technology and design with the goal of producing additional re-refined products, including lubricating base oil.
TCEP differs from conventional re-refining technologies, such as vacuum distillation and hydrotreatment, by relying more heavily on chemical processes to remove impurities rather than temperature and pressure. Therefore, the capital requirements to build a TCEP plant are typically much less than a traditional re-refinery because large feed heaters, vacuum distillation columns, and a hydrotreating unit are not required. The end product currently produced by TCEP is used as fuel oil cutterstock. Conventional
4
re-refineries produce lubricating base oils or product grades slightly lower than base oil that can be used as industrial fuels or transportation fuel blendstocks.
We currently estimate the cost to construct a new, fully-functional, commercial facility using our TCEP technology, with annual processing capacity of between 25 and 50 million gallons at another location would be approximately $10 - $15 million, which could fluctuate based on throughput capacity. The facility infrastructure would require additional capitalized expenditures which would depend on the location and site specifics of the facility. We are currently utilizing TCEP to pre-treat our used motor oil feedstocks prior to shipping them to our facility in Marrero, Louisiana; but have not operated our TCEP for the purpose of producing finished cutterstock since the third quarter of fiscal 2015, due to market conditions. As such, we currently have no plans to construct additional TCEP facilities.
Products and Services
We generate substantially all of our revenue from the sale of six product categories. All of these products are commodities that are subject to various degrees of product quality and performance specifications.
Used Motor Oil
Used motor oil is a petroleum-based or synthetic lubricant that contains impurities such as dirt, sand, water, and chemicals.
Fuel Oil
Fuel oil is a distillate fuel which is typically blended with lower quality fuel oils. The distillation of used oil and other petroleum by-products creates a fuel with low viscosity, as well as low sulfur, ash, and heavy metal content, making it an ideal blending agent.
Pygas
Pygas, or pyrolysis gasoline, is a product that can be blended with gasoline as an octane booster or that can be distilled and separated into its components, including benzene and other hydrocarbons.
Gasoline Blendstock
Gasoline blendstock includes Naphthas and various distillate products used for blending or compounding into finished motor gasoline. These components can include reformulated gasoline blendstock for oxygenate blending (RBOB) but exclude oxygenates (alcohols and ethers), butane, and pentanes plus.
Base Oil
An oil to which other oils or substances are added to produce a lubricant. Typically the main substance in lubricants and base oils is refined from crude oil.
Scrap Metal(s)
Consists of recoverable ferrous and non-ferrous recyclable metals from manufacturing and consumption. Scrap metal can be recovered from pipes, barges, boats, building supplies, surplus equipment, tanks, and other items consisting of metal composition. These materials are segregated, processed, cut-up and sent back to a steel mill for re-purposing.
5
6
RESULTS OF OPERATIONS
Description of Material Financial Line Items:
Revenues
We generate revenues from three existing operating divisions as follows:
BLACK OIL - Revenues from our Black Oil division are comprised primarily of product sales from our re-refineries and feedstock sales (used motor oil) which are purchased from generators of used motor oil such as oil change shops and garages, as well as a network of local and regional suppliers. Volumes are consolidated for efficient delivery and then sold to third-party re-refiners and fuel oil blenders for the export market. In addition, through used oil re-refining, we re-refine used oil into different commodity products. Through the operations at our Marrero, Louisiana facility, we produce a Vacuum Gas Oil (VGO) product from used oil re-refining which is then sold via barge to crude refineries to be utilized as an intermediate feedstock in the refining process. Through the operations at our Columbus, Ohio facility we produce a base oil finished product which is then sold via truck or rail car to end users for blending, packaging and marketing of lubricants.
REFINING AND MARKETING - The Refining and Marketing division generates revenues relating to the sales of finished products. The Refining and Marketing division gathers hydrocarbon streams in the form of petroleum distillates, transmix and other chemical products that have become off-specification during the transportation or refining process. These feedstock streams are purchased from pipeline operators, refineries, chemical processing facilities and third-party providers, and then processed at a third-party facility under our direction. The end products are typically three distillate petroleum streams (gasoline blendstock, pygas and fuel oil cutterstock), which are sold to major oil companies or to large petroleum trading and blending companies. The end products are delivered by barge and truck to customers.
RECOVERY - The Recovery division is a generator solutions company for the proper recovery and management of hydrocarbon streams. This division also provides dismantling, demolition, decommission and marine salvage services at industrial facilities. We own and operate a fleet of trucks and other vehicles used for shipping and handling equipment and scrap materials.
Our revenues are affected by changes in various commodity prices including crude oil, natural gas, #6 oil and metals.
Cost of Revenues
BLACK OIL - Cost of revenues for our Black Oil division are comprised primarily of feedstock purchases from a network of providers. Other cost of revenues include processing costs, transportation costs, purchasing and receiving costs, analytical assessments, brokerage fees and commissions, and surveying and storage costs.
REFINING AND MARKETING - The Refining and Marketing division incurs cost of revenues relating to the purchase of feedstock, purchasing and receiving costs, and inspection and processing of the feedstock into gasoline blendstock, pygas and fuel oil cutter by a third party. Cost of revenues also includes broker’s fees, inspection and transportation costs.
RECOVERY - The Recovery division incurs cost of revenues relating to the purchase of hydrocarbon products, purchasing and receiving costs, inspection, demolition and transporting of metals and other salvage and materials. Cost of revenues also includes broker’s fees, inspection and transportation costs.
Our cost of revenues are affected by changes in various commodity indices, including crude oil, natural gas, #6 oil and metals. For example, if the price for crude oil increases, the cost of solvent additives used in the production of blended oil products, and fuel cost for transportation cost from third party providers will generally increase. Similarly, if the price of crude oil falls, these costs may also decline.
General and Administrative Expenses
Our general and administrative expenses consist primarily of salaries and other employee-related benefits for executive, administrative, legal, financial, and information technology personnel, as well as outsourced and professional services, rent, utilities, and related expenses at our headquarters, as well as certain taxes.
7
Depreciation and Amortization Expenses
Our depreciation and amortization expenses are primarily related to the property, plant and equipment and intangible assets acquired in connection with the Vertex Holdings, L.P. (formerly Vertex Energy, L.P.), a Texas limited partnership (“Holdings”), E-Source Holdings, LLC (“E-Source”), Omega Refining, LLC's (“Omega Refining”) and Warren Ohio Holdings Co., LLC, f/k/a Heartland Group Holdings, LLC (“Heartland”), Acadiana, Nickco and Ygriega acquisitions, described in greater detail in the Annual Report.
8
RESULTS OF OPERATIONS FOR THE THREE MONTHS ENDED SEPTEMBER 30, 2018 COMPARED TO THE THREE MONTHS ENDED SEPTEMBER 30, 2017
Set forth below are our results of operations for the three months ended September 30, 2018 as compared to the same period in 2017.
Three Months Ended September 30, | $ Change - Favorable (Unfavorable) | % Change - Favorable (Unfavorable) | ||||||||||||
2018 | 2017 | |||||||||||||
Revenues | $ | 50,632,948 | $ | 32,470,451 | $ | 18,162,497 | 56 | % | ||||||
Cost of revenues (exclusive of depreciation and amortization shown separately below) | 42,593,367 | 28,696,461 | (13,896,906 | ) | (48 | )% | ||||||||
Gross profit | 8,039,581 | 3,773,990 | 4,265,591 | 113 | % | |||||||||
Selling, general and administrative expenses | 5,658,659 | 5,690,761 | 32,102 | 1 | % | |||||||||
Depreciation and amortization | 1,806,839 | 1,697,821 | (109,018 | ) | (6 | )% | ||||||||
Total operating expenses | 7,465,498 | 7,388,582 | (76,916 | ) | (1 | )% | ||||||||
Income (loss) from operations | 574,083 | (3,614,592 | ) | 4,188,675 | 116 | % | ||||||||
Other income (expense): | ||||||||||||||
Interest income | — | 1,519 | (1,519 | ) | (100 | )% | ||||||||
Gain (loss) on asset sales | — | 25,693 | (25,693 | ) | (100 | )% | ||||||||
Gain (loss) on change in value of derivative liability | (2,169,133 | ) | 1,371,461 | (3,540,594 | ) | (258 | )% | |||||||
Interest expense | (798,800 | ) | (733,459 | ) | (65,341 | ) | (9 | )% | ||||||
Total other income (expense) | (2,967,933 | ) | 665,214 | (3,633,147 | ) | (546 | )% | |||||||
Income (loss) before income tax | (2,393,850 | ) | (2,949,378 | ) | 555,528 | 19 | % | |||||||
Income tax benefit (expense) | — | — | — | — | % | |||||||||
Net income (loss) | (2,393,850 | ) | (2,949,378 | ) | 555,528 | 19 | % | |||||||
Net income (loss) attributable to non-controlling interest | (105,970 | ) | 34,554 | (140,524 | ) | (407 | )% | |||||||
Net income (loss) attributable to Vertex Energy, Inc. | $ | (2,287,880 | ) | $ | (2,983,932 | ) | $ | 696,052 | 23 | % | ||||
Our revenues and cost of revenues are significantly impacted by fluctuations in commodity prices; increases in commodity prices typically result in increases in revenue and cost of revenues. Our gross profit is to a large extent a function of the market discount we are able to obtain in purchasing feedstock, as well as how efficiently management conducts operations.
Total revenues increased by 56% for the three months ended September 30, 2018, compared to the same period in 2017, due primarily to higher commodity prices during the three months ended September 30, 2018, compared to the same period in 2017. Total volume increased 6% during the three months ended September 30, 2018 compared to the same period in 2017. Volumes were impacted as a result of a turnaround at our Marrero facility during the period in 2018. Gross profit increased by 113% for the three months ended September 30, 2018 compared to the three months ended September 30, 2017. This increase was the result of our overall revenue improving due to higher commodity prices, a slight increase in volumes at our refining facilities and closer management of our costs and spreads during the period.
Additionally, our per barrel margin increased 100% for the three months ended September 30, 2018, relative to the three months ended September 30, 2017. This increase was a result of increased revenues and improvements in our product spreads related to increases in commodity prices, better management of our costs and spreads during the three months ended September 30, 2018,
9
compared to the same period during 2017. The 48% increase in cost of revenues for the three months ended September 30, 2018 compared to the three months ended September 30, 2017 is mainly a result of the increase in commodity prices and overhead operating expenses during the period.
Each of our segments’ income (loss) from operations during the three months ended September 30, 2018 and 2017 was as follows:
Three Months Ended September 30, | $ Change - Favorable (Unfavorable) | % Change - Favorable (Unfavorable) | ||||||||||||
Black Oil Segment | 2018 | 2017 | ||||||||||||
Total revenue | $ | 40,400,064 | $ | 25,358,317 | $ | 15,041,747 | 59 | % | ||||||
Total cost of revenue (exclusive of depreciation and amortization shown separately below) | 32,550,126 | 22,016,825 | (10,533,301 | ) | (48 | )% | ||||||||
Gross profit (loss) | 7,849,938 | 3,341,492 | 4,508,446 | 135 | % | |||||||||
Selling general and administrative expense | 4,732,453 | 4,833,256 | 100,803 | 2 | % | |||||||||
Depreciation and amortization | 1,348,046 | 1,277,263 | (70,783 | ) | (6 | )% | ||||||||
Income (loss) from operations | $ | 1,769,439 | $ | (2,769,027 | ) | $ | 4,538,466 | 164 | % | |||||
Refining Segment | ||||||||||||||
Total revenue | $ | 7,313,630 | $ | 4,856,520 | $ | 2,457,110 | 51 | % | ||||||
Total cost of revenue (exclusive of depreciation and amortization shown separately below) | 7,044,218 | 4,850,354 | (2,193,864 | ) | (45 | )% | ||||||||
Gross profit (loss) | 269,412 | 6,166 | 263,246 | 4,269 | % | |||||||||
Selling general and administrative expense | 431,969 | 461,391 | 29,422 | 6 | % | |||||||||
Depreciation and amortization | 255,925 | 252,950 | (2,975 | ) | (1 | )% | ||||||||
Income (loss) from operations | $ | (418,482 | ) | $ | (708,175 | ) | $ | 289,693 | 41 | % | ||||
Recovery Segment | ||||||||||||||
Total revenue | $ | 2,919,254 | $ | 2,255,614 | $ | 663,640 | 29 | % | ||||||
Total cost of revenue (exclusive of depreciation and amortization shown separately below) | 2,999,023 | 1,829,282 | (1,169,741 | ) | (64 | )% | ||||||||
Gross profit (loss) | (79,769 | ) | 426,332 | (506,101 | ) | (119 | )% | |||||||
Selling general and administrative expense | 494,237 | 396,114 | (98,123 | ) | (25 | )% | ||||||||
Depreciation and amortization | 202,868 | 167,608 | (35,260 | ) | (21 | )% | ||||||||
Income (loss) from operations | $ | (776,874 | ) | $ | (137,390 | ) | $ | (639,484 | ) | (465 | )% | |||
Our Black Oil division's volume increased approximately 6% during the three months ended September 30, 2018 compared to the same period in 2017. This increase was due to improved operations at our plants, improved pricing for our finished products and increases in growth throughout our collection network. Volumes collected through our H&H Oil, L.P. (“H&H Oil”)(based in Houston, Austin and Corpus Christi, Texas) and Heartland (based in Ohio and West Virginia) collection facilities increased 14% during the three months ended September 30, 2018 compared to the same period in 2017. One of our key initiatives continues to be a focus on growing our own volumes of collected material and displacing the third party oil processed in our facilities.
Overall volumes of product sold increased 6% for the three months ended September 30, 2018 versus the same period in 2017. This is important for our business as it illustrates our reach into the market.
In addition, commodity prices increased approximately 36% for the three months ended September 30, 2018, compared to the same period in 2017. For example, the average posting (U.S. Gulfcoast Residual Fuel No. 6 3%) for the three months ended September 30, 2018 increased $19.42 per barrel from a three month average of $46.37 for the three months ended September 30, 2017 to $65.79 per barrel for the three months ended September 30, 2018.
10
Overall volume for the Refining and Marketing division decreased 7% during the three months ended September 30, 2018 as compared to the same period in 2017. Our fuel oil cutter volumes increased 78% for the three months ended September 30, 2018, compared to the same period in 2017. Our pygas volumes decreased 34% for the three months ended September 30, 2018 as compared to the same period in 2017. These were a result of decreases in volumes of feedstock to process.
Our Recovery division includes the business operations of Vertex Recovery Management. Revenues for this division increased 29% as a result of increased volumes and commodity prices, during the three months ended September 30, 2018, compared to the same period in 2017. Volumes of petroleum products acquired in our Recovery business were up 165% during the three months ended September 30, 2018, compared to the same period during 2017. This division periodically participates in project work that is not ongoing thus we expect to see fluctuations in revenue and gross profit from this division from period to period.
Overall gross profit increased 113% and our margin per barrel increased approximately 100% for the three months ended September 30, 2018, compared to the same period in 2017. This increase was largely a result of increased commodity prices, slightly increased volumes processed through our facilities along with the improvement in spread related to higher finished product values and controlling feedstock costs and operational expenses during the quarter.
We had selling, general, and administrative expenses of $5,658,659 for the three months ended September 30, 2018, compared to $5,690,761 of selling, general, and administrative expenses for the prior year’s period, an decrease of $32,102 from the prior period.
We had income from operations of $574,083 for the three months ended September 30, 2018, compared to a loss from operations of $3,614,592 for the three months ended September 30, 2017, an increase of $4,188,675 or 116% from the prior year’s three-month period. The increase was due to an increase in revenues resulting from improved market conditions, improvements in commodity prices, and higher volumes at our refining facilities; which translated into an overall improvement in our gross profit.
We also had interest expense of $798,800 for the three months ended September 30, 2018, compared to interest expense of $733,459 for the three months ended September 30, 2017, an increase in interest expense of $65,341 or 9% from the prior period due to a greater amount of debt outstanding during the three months ended September 30, 2018 related to investments being made at our refining facilities.
We had a $2,169,133 loss on change in value of derivative liability for the three months ended September 30, 2018, in connection with certain warrants granted in June 2015 and May 2016, as described in greater detail in "Note 9. Preferred Stock and Detachable Warrants" to the unaudited consolidated financial statements included herein under "Part I"-"Item 1 Financial Statements" compared to a gain on change in the value of our derivative liability of $1,371,461 in the prior year's period. This change was mainly due to fluctuation in the market price of our common stock.
We had a net loss of $2,393,850 for the three months ended September 30, 2018, compared to a net loss of $2,949,378 for the three months ended September 30, 2017, a decrease in net loss of $555,528 or 19% from the prior period for the reasons described above. The majority of our net loss for the three months ended September 30, 2018, was attributable to the non-cash loss on change in value of derivative liability.
During the three months ended September 30, 2018 and 2017, the processing costs for our Refining and Marketing division located at KMTEX were $631,261 and $578,695, respectively. In addition, we have provided the results of operations for this segment of our business below during the same three month periods.
Three Months Ended September 30, | ||||||
Refining and Marketing | ||||||
2018 | 2017 | |||||
Revenues | $ | 7,313,630 | $ | 4,856,520 | ||
Loss from operations | $ | (418,482 | ) | $ | (708,175 | ) |
11
RESULTS OF OPERATIONS FOR THE NINE MONTHS ENDED SEPTEMBER 30, 2018 COMPARED TO THE NINE MONTHS ENDED SEPTEMBER 30, 2017
Set forth below are our results of operations for the nine months ended September 30, 2018 as compared to the same period in 2017.
Nine Months Ended September 30, | $ Change - Favorable (Unfavorable) | % Change - Favorable (Unfavorable) | ||||||||||||||
2018 | 2017 | |||||||||||||||
Revenues | $ | 138,918,913 | $ | 104,153,844 | $ | 34,765,069 | 33 | % | ||||||||
Cost of Revenues (exclusive of depreciation shown separately below) | 114,434,776 | 90,864,044 | (23,570,732 | ) | (26 | )% | ||||||||||
Gross Profit | 24,484,137 | 13,289,800 | 11,194,337 | 84 | % | |||||||||||
Selling, general and administrative expenses | 16,668,692 | 16,280,495 | (388,197 | ) | (2 | )% | ||||||||||
Depreciation and amortization | 5,234,014 | 4,942,911 | (291,103 | ) | (6 | )% | ||||||||||
Income (loss) from operations | 2,581,431 | (7,933,606 | ) | 10,515,037 | 133 | % | ||||||||||
Interest Income | 659 | 5,748 | (5,089 | ) | (89 | )% | ||||||||||
Gain (loss) on sale of assets | 51,523 | (13,806 | ) | 65,329 | 473 | % | ||||||||||
Gain (loss) on change in value of derivative liability | (2,124,971 | ) | 2,676,902 | (4,801,873 | ) | (179 | )% | |||||||||
Interest expense | (2,448,771 | ) | (2,688,394 | ) | 239,623 | 9 | % | |||||||||
Total other income (expense) | (4,521,560 | ) | (19,550 | ) | (4,502,010 | ) | (23,028 | )% | ||||||||
Income (loss) before income taxes | (1,940,129 | ) | (7,953,156 | ) | 6,013,027 | 76 | % | |||||||||
Income tax (expense) benefit | — | — | — | — | % | |||||||||||
Net income (loss) | (1,940,129 | ) | (7,953,156 | ) | 6,013,027 | 76 | % | |||||||||
Net income (loss) attributable to non-controlling interest | 76,305 | 94,690 | (18,385 | ) | (19 | )% | ||||||||||
Net income (loss) attributable to Vertex Energy, Inc. | $ | (2,016,434 | ) | $ | (8,047,846 | ) | $ | 6,031,412 | 75 | % | ||||||
12
Each of our segments’ gross profit (loss) during the nine months ended September 30, 2018 and 2017 was as follows:
Nine Months Ended September 30, | $ Change - Favorable (Unfavorable) | % Change - Favorable (Unfavorable) | ||||||||||||||
Black Oil Segment | 2018 | 2017 | ||||||||||||||
Total revenue | $ | 111,106,441 | $ | 77,546,802 | $ | 33,559,639 | 43 | % | ||||||||
Total cost of revenue (exclusive of depreciation and amortization shown separately below) | 89,244,032 | 66,853,881 | (22,390,151 | ) | (33 | )% | ||||||||||
Gross profit (loss) | 21,862,409 | 10,692,921 | 11,169,488 | 104 | % | |||||||||||
Selling, general and administrative expense | 13,909,868 | 13,755,566 | (154,302 | ) | (1 | )% | ||||||||||
Depreciation and amortization | 3,972,922 | 3,753,382 | (219,540 | ) | (6 | )% | ||||||||||
Income (loss) from operations | $ | 3,979,619 | $ | (6,816,027 | ) | $ | 10,795,646 | 158 | % | |||||||
Refining Segment | ||||||||||||||||
Total revenue | $ | 17,381,741 | $ | 15,436,919 | $ | 1,944,822 | 13 | % | ||||||||
Total cost of revenue (exclusive of depreciation and amortization shown separately below) | 16,318,259 | 14,202,323 | (2,115,936 | ) | (15 | )% | ||||||||||
Gross profit | 1,063,482 | 1,234,596 | (171,114 | ) | (14 | )% | ||||||||||
Selling, general and administrative expense | 1,416,927 | 1,407,590 | (9,337 | ) | (1 | )% | ||||||||||
Depreciation and amortization | 766,077 | 747,732 | (18,345 | ) | (2 | )% | ||||||||||
Income (loss) from operations | $ | (1,119,522 | ) | $ | (920,726 | ) | $ | (198,796 | ) | (22 | )% | |||||
Recovery Segment | ||||||||||||||||
Total revenue | $ | 10,430,731 | $ | 11,170,123 | $ | (739,392 | ) | (7 | )% | |||||||
Total cost of revenue (exclusive of depreciation and amortization shown separately below) | 8,872,485 | 9,807,840 | 935,355 | 10 | % | |||||||||||
Gross profit | 1,558,246 | 1,362,283 | 195,963 | 14 | % | |||||||||||
Selling, general and administrative expense | 1,341,897 | 1,117,339 | (224,558 | ) | (20 | )% | ||||||||||
Depreciation and amortization | 495,015 | 441,797 | (53,218 | ) | (12 | )% | ||||||||||
Income (loss) from operations | $ | (278,666 | ) | $ | (196,853 | ) | $ | (81,813 | ) | (42 | )% | |||||
Our revenues and cost of revenues are significantly impacted by fluctuations in commodity prices; increases in commodity prices typically result in increases in revenue and cost of revenues. Our gross profit is to a large extent a function of the market discount we are able to obtain in purchasing feedstock, as well as how efficiently management conducts operations.
Total revenues increased by 33% for the nine months ended September 30, 2018 compared to the same period in 2017, due primarily to higher commodity prices and increased volumes at our refineries, during the nine months ended September 30, 2018 compared to the prior period. Total volume decreased 2% during the nine months ended September 30, 2018 compared to the same period in 2017. Volumes were impacted as a result of turnarounds at each of our facilities during the 2018 period, as well as volumes being impacted by extensive turnarounds at some of our suppliers that delayed volumes of feedstock into our Refining & Marketing division. Gross profit increased by 84% for the nine months ended September 30, 2018 compared to the nine months ended September 30, 2017. This increase was the result of our overall revenue improving due to higher commodity prices, and closer management of our costs and spreads during the period. In our collection division we have continued to grow volumes organically. As a result of higher commodity pricing we have transitioned to a pay for oil program at our collection division.
Additionally, our per barrel margin increased 87% for the nine months ended September 30, 2018, relative to the nine months ended September 30, 2017. This increase was a result of increased revenues and improvements in our finished product spreads related to increases in our product values during the nine months ended September 30, 2018, compared to the same period during 2017. The 26% increase in cost of revenues for the nine months ended September 30, 2018, compared to the nine months ended September 30, 2017, is mainly a result of the increase in commodity prices and shift to a pay for oil program implemented through our collections.
13
Our Black Oil division's volume increased approximately 4% during the nine months ended September 30, 2018, compared to the same period in 2017. This increase was due to the increased amount of volume managed through our facilities. The increase is related to investments we have made in our facilities to improve efficiency and overall production. Volumes collected through our H&H Oil and Heartland collection facilities increased 16% during the nine months ended September 30, 2018, compared to the same period in 2017. One of our key initiatives continues to be a focus on growing our own volumes of collected material and displacing the third party oil processed in our facilities.
Overall volumes of product sold decreased 2% for the nine months ended September 30, 2018, versus the same period in 2017. This is important for our business as it illustrates our reach into the market.
In addition, commodity prices increased approximately 32% for the nine months ended September 30, 2018, compared to the same period in 2017. For example, the average posting (U.S. Gulfcoast Residual Fuel No. 6 3%) for the nine months ended September 30, 2018, increased $15.99 per barrel from a nine month average of $45.09 for the nine months ended September 30, 2017, to $61.08 per barrel for the nine months ended September 30, 2018.
Overall volume for the Refining and Marketing division decreased 18% during the nine months ended September 30, 2018 as compared to the same period in 2017. This division experienced an increase in production of 3% for its gasoline blendstock for the nine months ended September 30, 2018, compared to the same period in 2017. Our fuel oil cutter volumes increased 16% for the nine months ended September 30, 2018, compared to the same period in 2017. Our pygas volumes decreased 35% for the nine months ended September 30, 2018 as compared to the same period in 2017. These changes were a result of decreases in volumes of feedstock to process from facilities that were undergoing extensive and delayed turnarounds that impacted the volume of product being shipped out.
Our Recovery division includes the business operations of Vertex Recovery Management. Revenues for this division decreased 7% as a result of lower volumes compared to the same period in 2017. Volumes of petroleum products acquired, in our Recovery business were down 19% during the nine months ended September 30, 2018, compared to the same period during 2017. This division periodically participates in project work that is not ongoing thus we expect to see fluctuations in revenue and gross profit from this division from period to period.
Overall gross profit increased 84% and our margin per barrel increased approximately 87% for the nine months ended September 30, 2018, compared to the same period in 2017. This increase was largely a result of increased volumes at our refineries along with the increase in value of our finished products as a result of improved commodity pricing.
The following table sets forth the high and low spot prices during the nine months ended September 30, 2018, for our key benchmarks.
2018 | ||||||||||||
Benchmark | High | Date | Low | Date | ||||||||
U.S. Gulfcoast No. 2 Waterborne (dollars per gallon) | $ | 2.27 | September 28 | $ | 1.64 | February 12 | ||||||
U.S. Gulfcoast Unleaded 87 Waterborne (dollars per gallon) | $ | 2.15 | September 28 | $ | 1.71 | February 12 | ||||||
U.S. Gulfcoast Residual Fuel No. 6 3% (dollars per barrel) | $ | 70.59 | September 28 | $ | 51.30 | February 9 | ||||||
NYMEX Crude oil (dollars per barrel) | $ | 74.11 | July 10 | $ | 59.19 | February 13 | ||||||
Reported in Platt's US Marketscan (Gulf Coast) | ||||||||||||
14
The following table sets forth the high and low spot prices during the nine months ended September 30, 2017, for our key benchmarks.
2017 | ||||||||||||
Benchmark | High | Date | Low | Date | ||||||||
U.S. Gulfcoast No. 2 Waterborne (dollars per gallon) | $ | 1.66 | September 25 | $ | 1.22 | June 23 | ||||||
U.S. Gulfcoast Unleaded 87 Waterborne (dollars per gallon) | $ | 2.06 | August 31 | $ | 1.41 | June 22 | ||||||
U.S. Gulfcoast Residual Fuel No. 6 3% (dollars per barrel) | $ | 50.44 | September 15 | $ | 39.42 | June 21 | ||||||
NYMEX Crude oil (dollars per barrel) | $ | 54.45 | February 23 | $ | 42.53 | June 21 | ||||||
Reported in Platt's US Marketscan (Gulf Coast) | ||||||||||||
We saw a significant rise during the first nine months of 2018, in each of the benchmark commodities we track compared to the same period in 2017.
Our margins are a function of the difference between what we are able to pay for raw materials and the market prices for the range of products produced. The various petroleum products produced are typically a function of crude oil indices and are quoted on multiple exchanges such as the New York Mercantile Exchange ("NYMEX"). These prices are determined by a global market and can be influenced by many factors, including but not limited to supply/demand, weather, politics, and global/regional inventory levels. As such, we cannot provide any assurances regarding results of operations for any future periods, as numerous factors outside of our control affect the prices paid for raw materials and the prices (for the most part keyed to the NYMEX) that can be charged for such products. Additionally, for the near term, results of operations will be subject to further uncertainty, as the global markets and exchanges, including the NYMEX, continue to experience volatility.
As our competitors bring new technologies to the marketplace, which will likely enable them to obtain higher values for the finished products created through their technologies from purchased black oil feedstock, we anticipate that they will be able to pay more for feedstock due to the additional value received from their finished product (i.e., as their margins increase, they are able to increase the prices they are willing to pay for feedstock). If we are not able to continue to refine and improve our technologies and gain efficiencies in our technologies, we could be negatively impacted by the ability of our competitors to bring new processes to market which compete with our processes, as well as their ability to outbid us for feedstock supplies. Additionally, if we are forced to pay more for feedstock, our cash flows will be negatively impacted and our margins will decrease.
We had selling, general, and administrative expenses of $16,668,692 for the nine months ended September 30, 2018, compared to $16,280,495 of selling, general, and administrative expenses for the prior year's period, an increase of $388,197 or 2%. This increase is primarily due to the additional selling, general and administrative expenses incurred by new business lines and acquisitions.
We had income from operations of $2,581,431 for the nine months ended September 30, 2018, compared to a loss from operations of $7,933,606 for the nine months ended September 30, 2017, an increase of $10,515,037 or 133% from the prior year’s nine-month period. The increase was mainly due to an increase in overall gross profit for the nine months ended September 30, 2018.
We had interest expense of $2,448,771 for the nine months ended September 30, 2018, compared to interest expense of $2,688,394 for the nine months ended June 30, 2017, a decrease in interest expense of $239,623 or 9% due to the immediate recognition of unaccreted discounts upon the termination of the debt facilities with Goldman Sachs (our prior senior lender), a prior note holder and a prior lender and the refinancing with Encina, all of which occurred during the nine months ended September 30, 2017.
We had a gain on the sale of assets of $51,523 for the nine months ended September 30, 2018 compared to a loss on the sale of assets of $13,806 for the nine months ended September 30, 2017, mainly related to the sale of certain E-Source assets.
We had a $2,124,971 loss on change in value of derivative liability for the nine months ended September 30, 2018, in connection with certain warrants granted in June 2015 and May 2016, as described in greater detail in "Note 9. Preferred Stock and Detachable Warrants" to the unaudited consolidated financial statements included herein under "Part I"-"Item 1 Financial Statements" compared to a gain on change in the value of our derivative liability of $2,676,902 in the prior year's period. This change was mainly due to a fluctuation in the market price of our common stock.
15
We had net loss of $1,940,129 for the nine months ended September 30, 2018, compared to a net loss of $7,953,156 for the nine months ended September 30, 2017, a decrease in net loss of $6,013,027 or 76% from the prior period for the reasons described above. The majority of our net loss for the nine months ended September 30, 2018, was attributable to the non-cash loss on change in value of derivative liability and interest expense, as discussed above.
During the nine months ended September 30, 2018 and 2017, the processing costs for our Refining and Marketing division located at KMTEX were $1,573,152 and $1,829,576, respectively. In addition, we have provided the results of operations for this segment of our business below during the same nine month period.
Nine Months Ended | ||||||
Refining and Marketing | ||||||
2018 | 2017 | |||||
Revenues | $ | 17,381,741 | $ | 15,436,919 | ||
Loss from operations | $ | (1,119,522 | ) | $ | (920,726 | ) |
16
Set forth below, we have disclosed a quarter-by-quarter summary of our statements of operations for the first, second and third quarters of 2018, fiscal year 2017 and the fourth and third quarters of 2016.
Fiscal 2018 | Fiscal 2017 | Fiscal 2016 | |||||||||||||||||||||||||||||||||
Third | Second | First | Fourth | Third | Second | First | Fourth | Third | |||||||||||||||||||||||||||
Quarter | Quarter | Quarter | Quarter | Quarter | Quarter | Quarter | Quarter | Quarter | |||||||||||||||||||||||||||
Revenues | $ | 50,632,948 | $ | 46,917,770 | $ | 41,368,195 | $ | 41,345,248 | $ | 32,470,451 | $ | 36,912,779 | $ | 34,770,614 | $ | 31,055,936 | $ | 28,461,930 | |||||||||||||||||
Cost of Revenues (exclusive of depreciation and amortization shown separately below) | 42,593,367 | 36,796,258 | 35,045,151 | 33,362,445 | 28,696,461 | 31,466,029 | 30,701,554 | 25,954,677 | 22,552,232 | ||||||||||||||||||||||||||
Gross Profit (loss) | 8,039,581 | 10,121,512 | 6,323,044 | 7,982,803 | 3,773,990 | 5,446,750 | 4,069,060 | 5,101,259 | 5,909,698 | ||||||||||||||||||||||||||
Selling, general and administrative expenses | 5,658,659 | 5,364,591 | 5,645,442 | 5,405,047 | 5,690,761 | 5,359,897 | 5,229,837 | 4,869,257 | 5,025,221 | ||||||||||||||||||||||||||
Depreciation and amortization | 1,806,839 | 1,733,076 | 1,694,099 | 1,700,413 | 1,697,821 | 1,645,030 | 1,600,060 | 1,569,414 | 1,560,562 | ||||||||||||||||||||||||||
Total operating expenses | 7,465,498 | 7,097,667 | 7,339,541 | 7,105,460 | 7,388,582 | 7,004,927 | 6,829,897 | 6,438,671 | 6,585,783 | ||||||||||||||||||||||||||
Income (loss) from operations | 574,083 | 3,023,845 | (1,016,497 | ) | 877,343 | (3,614,592 | ) | (1,558,177 | ) | (2,760,837 | ) | (1,337,412 | ) | (676,085 | ) | ||||||||||||||||||||
Other income (expense): | |||||||||||||||||||||||||||||||||||
Interest income | — | 659 | — | — | 1,519 | 2,277 | 1,952 | 1,522 | 1,490 | ||||||||||||||||||||||||||
Gain (loss) on change in value of warrant derivative liability | (2,169,133 | ) | 475,913 | (431,751 | ) | (556,318 | ) | 1,371,461 | 384,769 | 920,672 | (674,309 | ) | 1,065,217 | ||||||||||||||||||||||
Gain (loss) on sale of assets | — | 8,843 | 42,680 | 14,251 | 25,693 | (26,399 | ) | (13,100 | ) | (1,323 | ) | (68,799 | ) | ||||||||||||||||||||||
Interest expense | (798,800 | ) | (847,456 | ) | (802,515 | ) | (794,668 | ) | (733,459 | ) | (618,448 | ) | (1,336,487 | ) | (373,900 | ) | (399,545 | ) | |||||||||||||||||
Total other income (expense) | (2,967,933 | ) | (362,041 | ) | (1,191,586 | ) | (1,336,735 | ) | 665,214 | (257,801 | ) | (426,963 | ) | (1,048,010 | ) | 598,363 | |||||||||||||||||||
Income (loss) before income taxes | (2,393,850 | ) | 2,661,804 | (2,208,083 | ) | (459,392 | ) | (2,949,378 | ) | (1,815,978 | ) | (3,187,800 | ) | (2,385,422 | ) | (77,722 | ) | ||||||||||||||||||
Income tax benefit (expense) | — | — | — | 274,423 | — | — | — | — | — | ||||||||||||||||||||||||||
Net income (loss) | (2,393,850 | ) | 2,661,804 | (2,208,083 | ) | (184,969 | ) | (2,949,378 | ) | (1,815,978 | ) | (3,187,800 | ) | (2,385,422 | ) | (77,722 | ) | ||||||||||||||||||
Net income (loss) attributable to non-controlling interest | (105,970 | ) | 131,736 | 50,539 | 200,418 | 34,554 | 51,528 | 8,607 | 13,372 | 30,234 | |||||||||||||||||||||||||
Net income (loss) | $ | (2,287,880 | ) | $ | 2,530,068 | $ | (2,258,622 | ) | $ | (385,387 | ) | $ | (2,983,932 | ) | $ | (1,867,506 | ) | $ | (3,196,407 | ) | $ | (2,398,794 | ) | $ | (107,956 | ) | |||||||||
17
The graph below charts our total quarterly revenue over time from September 30, 2016 to September 30, 2018:
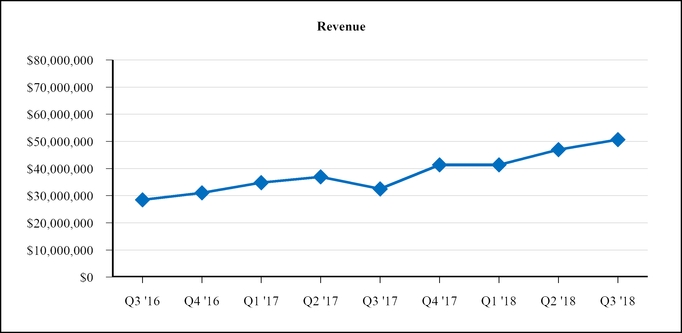
In the table below, we have disclosed a quarter-by-quarter summary of our gross profit by segment for the first, second, and third quarters of 2018, fiscal year 2017 and the fourth and third quarters of 2016.
GROSS PROFIT BY SEGMENT BY QUARTER | |||||||||||||||||||||||||||||||||||
Fiscal 2018 | Fiscal 2017 | Fiscal 2016 | |||||||||||||||||||||||||||||||||
Third | Second | First | Fourth | Third | Second | First | Fourth | Third | |||||||||||||||||||||||||||
Quarter | Quarter | Quarter | Quarter | Quarter | Quarter | Quarter | Quarter | Quarter | |||||||||||||||||||||||||||
Black Oil | |||||||||||||||||||||||||||||||||||
Revenues | $ | 40,400,064 | $ | 38,469,131 | $ | 32,237,246 | $ | 30,441,750 | $ | 25,358,317 | $ | 27,384,402 | $ | 24,804,083 | $ | 23,757,821 | $ | 22,907,235 | |||||||||||||||||
Cost of revenues | 32,550,126 | 29,723,927 | 26,969,978 | 24,323,240 | 22,016,825 | 22,967,478 | 21,869,577 | 19,294,872 | 17,881,933 | ||||||||||||||||||||||||||
Gross profit | $ | 7,849,938 | $ | 8,745,204 | $ | 5,267,268 | $ | 6,118,510 | $ | 3,341,492 | $ | 4,416,924 | $ | 2,934,506 | $ | 4,462,949 | $ | 5,025,302 | |||||||||||||||||
Refining & Marketing | |||||||||||||||||||||||||||||||||||
Revenues | $ | 7,313,630 | $ | 4,392,870 | $ | 5,675,241 | $ | 4,660,406 | $ | 4,856,520 | $ | 5,186,358 | $ | 5,394,041 | $ | 3,168,730 | $ | 4,436,111 | |||||||||||||||||
Cost of revenues | 7,044,218 | 4,034,509 | 5,239,532 | 4,222,872 | 4,850,354 | 4,704,353 | 4,647,616 | 2,918,793 | 3,635,211 | ||||||||||||||||||||||||||
Gross profit | $ | 269,412 | $ | 358,361 | $ | 435,709 | $ | 437,534 | $ | 6,166 | $ | 482,005 | $ | 746,425 | $ | 249,937 | $ | 800,900 | |||||||||||||||||
Recovery | |||||||||||||||||||||||||||||||||||
Revenues | $ | 2,919,254 | $ | 4,055,769 | $ | 3,455,708 | $ | 6,243,092 | $ | 2,255,614 | $ | 4,342,019 | $ | 4,572,490 | $ | 4,129,385 | $ | 1,118,584 | |||||||||||||||||
Cost of revenues | 2,999,023 | 3,037,821 | 2,835,641 | 4,816,333 | 1,829,282 | 3,794,197 | 4,184,361 | 3,741,012 | 1,035,088 | ||||||||||||||||||||||||||
Gross profit (loss) | $ | (79,769 | ) | $ | 1,017,948 | $ | 620,067 | $ | 1,426,759 | $ | 426,332 | $ | 547,822 | $ | 388,129 | $ | 388,373 | $ | 83,496 | ||||||||||||||||
18
Liquidity and Capital Resources
The success of our current business operations has become dependent on repairs and maintenance to our facilities and our ability to make routine capital expenditures, as well as our ability to manage our margins which are a function of the difference between what we are able to pay or charge for raw materials and the market prices for the range of products produced. We also must maintain relationships with feedstock suppliers and end-product customers, and operate with efficient management of overhead costs. Through these relationships, we have historically been able to achieve volume discounts in the procurement of our feedstock, thereby increasing the margins of our segments’ operations. The resulting operating cash flow is crucial to the viability and growth of our existing business lines.
We had total assets of $89,129,776 as of September 30, 2018, compared to $84,305,474 at December 31, 2017. The increase was mainly due to higher accounts receivable, prepaid expenses and inventory levels during the nine months ended September 30, 2018, offset by a decrease in intangibles assets.
We had total current liabilities of $19,146,501 as of September 30, 2018, compared to $16,947,904 at December 31, 2017.
We had total liabilities of $38,431,684 as of September 30, 2018, including long-term debt of $14,483,702. This increase was largely due to the increase in outstanding debt as of September 30, 2018.
We had working capital of $7,830,596 as of September 30, 2018, compared to working capital of $3,523,548 as of December 31, 2017. The improvement in working capital from December 31, 2017 to September 30, 2018, is due to the reasons described above.
Our future operating cash flows will vary based on a number of factors, many of which are beyond our control, including commodity prices, the cost of recovered oil, and the ability to turn our inventory. Other factors that have affected and are expected to continue to affect earnings and cash flow are transportation, processing, and storage costs. Over the long term, our operating cash flows will also be impacted by our ability to effectively manage our administrative and operating costs. Additionally, we may incur capital expenditures related to new TCEP facilities in the future, in the event oil prices increase to a point necessary to make TCEP economically feasible and we determine, funding permitted, to construct additional TCEP facilities.
The Company financed insurance premiums through various financial institutions bearing interest rates from 4.00% to 4.52%. All of such premium finance agreements have maturities of less than one year and have a balance of $1,841,083 at September 30, 2018.
The Company's outstanding debt facilities as of September 30, 2018 and December 31, 2017 are summarized as follows:
Creditor | Loan Type | Origination Date | Maturity Date | Loan Amount | Balance on September 30, 2018 | Balance on December 31, 2017 | ||||||||||
Encina Business Credit, LLC | Term Loan | February 1, 2017 | February 1, 2020 | $ | 20,000,000 | $ | 15,575,000 | $ | 14,750,000 | |||||||
Encina Business Credit SPV, LLC | Revolving Note | February 1, 2017 | February 1, 2020 | $ | 10,000,000 | 5,999,733 | 4,591,527 | |||||||||
Tetra Capital Lease | Capital Lease | May, 2018 | May, 2022 | $ | 419,690 | 390,609 | — | |||||||||
Well Fargo Equipment Lease | Capital Lease | March, 2018 | March, 2021 | $ | 30,408 | 24,829 | — | |||||||||
Texas Citizens Bank | Term Note | January, 2015 | January, 2020 | $ | 2,045,500 | — | 834,283 | |||||||||
Various institutions | Insurance premiums financed | Various | < 1 year | $ | 2,902,428 | 1,841,083 | 803,392 | |||||||||
Total | 23,831,254 | 20,979,202 | ||||||||||||||
Deferred finance costs, net | (765,210 | ) | (1,239,570 | ) | ||||||||||||
Total, net of deferred finance costs | $ | 23,066,044 | $ | 19,739,632 | ||||||||||||
19
Future contractual maturities of notes payable are summarized as follows:
Creditor | Year 1 | Year 2 | Year 3 | Year 4 | Year 5 | Thereafter | |||||||||||||||||
Encina Business Credit, LLC | $ | 900,000 | $ | 14,675,000 | $ | — | $ | — | $ | — | $ | — | |||||||||||
Encina Business Credit SPV, LLC | 5,999,733 | — | — | — | — | — | |||||||||||||||||
Tetra Capital Lease | 82,969 | 88,743 | 94,919 | 123,978 | — | — | |||||||||||||||||
Well Fargo Equipment Lease | 9,931 | 10,413 | 4,485 | — | — | — | |||||||||||||||||
Various institutions | 1,841,083 | — | — | — | — | — | |||||||||||||||||
Totals | 8,833,716 | 14,774,156 | 99,404 | 123,978 | — | — | |||||||||||||||||
Deferred finance costs, net | (573,912 | ) | (191,298 | ) | — | — | — | — | |||||||||||||||
Totals, net of deferred finance costs | $ | 8,259,804 | $ | 14,582,858 | $ | 99,404 | $ | 123,978 | $ | — | $ | — | |||||||||||
Credit and Guaranty Agreement and Revolving Credit Facility with Encina Business Credit, LLC
Effective February 1, 2017, we, Vertex Operating, and substantially all of our other operating subsidiaries, other than E-Source, entered into a Credit Agreement (the “EBC Credit Agreement”) with Encina Business Credit, LLC as agent (the “Agent” or “EBC”) and Encina Business Credit SPV, LLC and CrowdOut Capital LLC as lenders thereunder (the “EBC Lenders”). Pursuant to the EBC Credit Agreement, and the terms thereof, the EBC Lenders agreed to loan us up to $20 million, provided that the amount outstanding under the EBC Credit Agreement at any time cannot exceed 50% of the value of the operating plant facilities and related machinery and equipment owned by us (not including E-Source).
A total of $12 million was loaned to us by the EBC Lenders on February 1, 2017 pursuant to the terms of the EBC Credit Agreement, and a total of an additional $8 million in funding could be requested by us from the EBC Lenders, from time to time, subject to the terms of the EBC Credit Agreement, and the conditions for lending set forth therein, subject to a minimum of $500,000, or a multiple of $100,000 above such amount, being requested at any time.
Amounts borrowed under the EBC Credit Agreement bear interest at 12%, 13% or 14% per annum, based on the ratio of (a) (i) consolidated EBITDA for such applicable period minus (ii) capital expenditures made during such period, minus (iii) the aggregate amount of income taxes paid in cash during such period (but not less than zero) to (b) the sum of (i) debt service charges plus (ii) the aggregate amount of all dividend or other distributions paid on capital stock in cash for the most recently completed 12 month period (which ratio falls into one of the three following tiers: less than 1 to 1; from 1 to 1 to less than 1.45 to 1; or equal to or greater than 1.45 to 1, which together with the value below, determines which interest rate is applicable) and average availability under the Revolving Credit Agreement (defined below) (which falls into two tiers: less than $2.5 million and greater than or equal to $2.5 million, which together with the calculation above, determines which interest rate is applicable), as described in greater detail in the EBC Credit Agreement (increasing by 2% per annum upon the occurrence of an event of default). Interest on amounts borrowed under the EBC Credit Agreement is payable by us in arrears, on the first business day of each month, beginning on the first business day of the first full month following the closing, together with required $75,000 monthly principal repayments. We also have the right to make voluntary repayments of the amount owed under the EBC Credit Agreement in amounts equal to or greater than $100,000, from time to time. The interest rate is 12% at September 30, 2018.
The EBC Credit Agreement terminates on February 1, 2020, on which date we are required to repay the outstanding balance owed thereunder and any accrued and unpaid interest thereon.
We agreed to pay the agent certain fees in connection with the EBC Credit Agreement, including a fee equal to 0.5% of a portion of the undrawn portion of the EBC Credit Agreement per annum (equal to $30,000 at closing) and a termination fee, in the event the EBC Credit Agreement terminates prior to the maturity date thereof (or we reduce the amount available for loans thereunder), equal to 2% of the amount repaid (or the reduction in the amount available under the EBC Credit Agreement). Notwithstanding the above, during the period beginning six months prior to the maturity date and ending on the maturity date, no early termination fee is due if we provide prior written notice to the agent at least ninety (90) days prior to the applicable termination date.
The amounts borrowed under the EBC Credit Agreement are guaranteed by us and our subsidiaries, other than E-Source, pursuant to a Guaranty and Security Agreement (the “Guaranty and Security Agreement”), whereby we also pledged substantially
20
all of our assets and all of the securities of our subsidiaries (other than E-Source) as collateral securing the amount due under the terms of the EBC Credit Agreement. We also provided EBC mortgages on our Marrero, Louisiana, and Columbus, Ohio facilities to secure the repayment of outstanding amounts and agreed to provide mortgages on certain other real property to be delivered post-closing. The post-closing mortgage properties provided were in Baytown, Pflugerville and Corpus Christi, Texas.
We agreed to use the proceeds raised under the EBC Credit Agreement for working capital, capital expenditures, general corporate purposes and to refinance the prior credit agreements, and subject to the terms of the EBC Credit Agreement, to finance permitted acquisitions.
The EBC Credit Agreement contains customary representations, warranties and requirements for the Company to indemnify the EBC Lenders and their affiliates. The EBC Credit Agreement also includes various covenants (positive and negative) binding upon the Company, including, prohibiting us from undertaking acquisitions or dispositions unless they meet the criteria set forth in the EBC Credit Agreement, not incurring any capital expenditures in an aggregate amount exceeding $3 million in any fiscal year that the EBC Credit Agreement is in place, and requiring us to maintain at least $2.5 million of borrowing availability under the Revolving Credit Agreement (defined below) in any 30 day period.
We are required to repay the amounts borrowed under the EBC Credit Agreement in the event we complete any disposition of assets or securities, receive any funds in connection with any insurance proceeds, and/or upon the occurrence of certain other events, subject to certain exceptions described in the EBC Credit Agreement. Additionally, commencing with the first full fiscal month after which the initial principal amount of the loans advanced under the EBC Credit Agreement is equal to or greater than $17 million and for each fiscal quarter thereafter, we are required to prepay the amount due under the EBC Credit Agreement in an amount equal to 50% of our cash flow, less principal payments (including voluntary repayments) made under the EBC Credit Agreement, approved capital expenditures and certain other approved expenses.
The EBC Credit Agreement includes customary events of default for facilities of a similar nature and size as the EBC Credit Agreement, including if an event of default occurs under any agreement evidencing $500,000 or more of indebtedness of the Company; we fail to make any payment when due under any material agreement; subject to certain exceptions, any judgment is entered against the Company in an amount exceeding $500,000; and also provides that an event of default occurs if a change in control of the Company occurs, which includes if (a) Benjamin P. Cowart, the Company’s Chief Executive Officer, Chairman of the Board and largest shareholder and Chris Carlson, the Chief Financial Officer of the Company, cease to own and control legally and beneficially, collectively, either directly or indirectly, equity securities in Vertex Energy, Inc., representing more than 15% of the combined voting power of all securities entitled to vote for members of the board of directors or equivalent on a fully-diluted basis, (b) the acquisition of ownership, directly or indirectly, beneficially or of record, by any person or group of securities representing more than 30% of the aggregate ordinary voting power represented by the issued and outstanding securities of Vertex Energy, Inc., or (c) during any period of 12 consecutive months, a majority of the members of the board of directors of the Company cease to be composed of individuals (i) who were members of that board or equivalent governing body on the first day of such period, (ii) whose election or nomination to that board or equivalent governing body was approved by individuals referred to in clause (i) above constituting at the time of such election or nomination at least a majority of that board or equivalent governing body, or (iii) whose election or nomination to that board or other equivalent governing body was approved by individuals referred to in clauses (i) and (ii) above constituting at the time of such election or nomination at least a majority of that board or equivalent governing body (collectively “Events of Default”). An event of default under the Revolving Credit Agreement (defined below), is also an event of default under the EBC Credit Agreement.
Effective February 1, 2017, we, Vertex Operating and substantially all of our operating subsidiaries, other than E-Source, entered into a Revolving Credit Agreement (the “Revolving Credit Agreement”) with Encina Business Credit SPV, LLC as lender (“Encina”) and EBC as the administrative agent. Pursuant to the Revolving Credit Agreement, and the terms thereof, Encina agreed to loan us, on a revolving basis, up to $10 million, subject to the terms of the Revolving Credit Agreement and certain lending ratios set forth therein, which provide that the amount outstanding thereunder cannot exceed an amount equal to the total of (a) the lesser of (A) the value (as calculated in the Revolving Credit Agreement) of our inventory which are raw materials or finished goods that are merchantable and readily saleable to the public in the ordinary course of our business (“EBC Eligible Inventory”), net of certain inventory reserves, multiplied by 85% of the appraised value of EBC Eligible Inventory, or (B) the value (as calculated in the Revolving Credit Agreement) of EBC Eligible Inventory, net of certain inventory reserves, multiplied by 65%, subject to a ceiling of $4 million, plus (b) the face amount of certain accounts receivables (net of certain reserves applicable thereto) multiplied by 85% (subject to adjustment as provided in the Revolving Credit Agreement); minus (c) the then-current amount of certain reserves that the agent may determine necessary for the Company to maintain. At September 30, 2018, the maximum amount available to be borrowed was $4,000,267, based on the above borrowing base calculation.
Amounts borrowed under the Revolving Credit Agreement bear interest, subject to the terms of the Revolving Credit Agreement, at the one month LIBOR interest rate then in effect, subject to a floor of 0.25% (which interest rate is currently
21
approximately 2.10% per annum), plus an additional 6.50% per annum (increasing by 2% per annum upon the occurrence of an event of default), provided that under certain circumstances amounts borrowed bear interest at the higher of (a) the “prime rate”; (b) the Federal Funds Rate, plus 0.50%; and (c) the LIBOR Rate for a one month interest period, plus 1.00%. Interest on amounts borrowed under the Revolving Credit Agreement is payable by us in arrears, on the first business day of each month, beginning on the first business day of the first full month following the closing.
The Revolving Credit Agreement terminates on February 1, 2020, on which date we are required to repay the outstanding balance owed thereunder and any accrued and unpaid interest thereon.
We agreed to pay the agent certain fees in connection with the Revolving Credit Agreement, including a commitment fee equal to 0.5% per annum, multiplied by the actual daily amount by which the amount outstanding under the Revolving Credit Agreement is less than the $10 million aggregate commitment thereunder during the immediately preceding quarter, payable monthly in arrears and a termination fee, in the event the Revolving Credit Agreement terminates prior to the maturity date thereof (or we reduce the amount available for loans thereunder), equal to 2% of the aggregate commitment amount (or the reduction in such amount) if terminated prior to the one year anniversary of our entry into the Revolving Credit Agreement, 1% of the aggregate commitment amount (or reduction in such amount) if terminated between the one year anniversary and two year anniversary of our entry into the Revolving Credit Agreement and 0.5% of the aggregate commitment amount (or reduction in such amount) if terminated after the two year anniversary of our entry into the Revolving Credit Agreement. Notwithstanding the above, during the period beginning six months prior to the maturity date and ending on the maturity date, no early termination fee is due if we provide prior written notice to the agent at least ninety (90) days prior to the applicable termination date.
We can request funds from time to time under the terms of the Revolving Credit Agreement, subject to us requesting a minimum of $500,000 ($100,000 upon certain events), or a multiple of $100,000 above such amount.
The amounts borrowed under the Revolving Credit Agreement are guaranteed by us and our subsidiaries other than E-Source pursuant to a separate Guaranty and Security Agreement, similar to the EBC Credit Agreement, described in greater detail above. We also provided Encina mortgages on our Marrero, Louisiana, and Columbus, Ohio facilities to secure the repayment of outstanding amounts.
We agreed to use the proceeds raised under the Revolving Credit Agreement for working capital, capital expenditures, general corporate purposes and to refinance the prior credit agreements.
The Revolving Credit Agreement contains customary representations, warranties and requirements for the Company to indemnify Encina and its affiliates. The Revolving Credit Agreement also includes various covenants (positive and negative) binding upon the Company, including, prohibiting us from undertaking acquisitions or dispositions unless they meet the criteria set forth in the Revolving Credit Agreement, not incurring any capital expenditures in an aggregate amount exceeding $3 million in any fiscal year that the Revolving Credit Agreement is in place, and requiring us to maintain at least $2.5 million of borrowing availability under the Revolving Credit Agreement in any 30 day period.
We are required to repay the amounts borrowed under the Revolving Credit Agreement in the event we complete any disposition of assets or securities, receive any funds in connection with any insurance proceeds, and/or in certain other events, subject to certain exceptions described in the Revolving Credit Agreement.
The Revolving Credit Agreement includes customary events of default for facilities of a similar nature and size as the Revolving Credit Agreement, including the same Events of Default as are described above under the description of the EBC Credit Agreement.
A total of $11,282,537 of the amount initially borrowed under the EBC Credit Agreement and Revolving Credit Agreement was used to repay amounts owed under our previous financing arrangements.
The principal balances of the EBC Credit Agreement and the Revolving Credit Agreement as of September 30, 2018 are $15,575,000 and $5,999,733, respectively.
Amendments to Credit Agreements
On December 15, 2017, we and Vertex Operating, entered into (a) a First Amendment to Credit Agreement, with the Agent, and lender party thereto; and (b) a Second Amendment to the Revolving Credit Agreement, with the Agent, and the lenders party thereto (collectively, the “Credit Agreement Amendments”).
22
The Credit Agreement Amendments amended the Credit Agreements to decrease the required minimum availability under the Credit Agreements to $1.5 million for periods prior to December 31, 2017 (effective as of November 5, 2017) and $2.5 million thereafter. Previously the Company was required to maintain minimum availability of at least $2.5 million at all times.
Need for additional funding
Our re-refining business will require significant capital to design and construct any new facilities. The facility infrastructure would be an additional capitalized expenditure to these process costs and would depend on the location and site specifics of the facility.
Management believes that the amount available under our EBC Credit Agreement and Revolving Credit Agreement, in addition to projected earnings over the next couple of years, will provide sufficient liquidity to fund our operations for the foreseeable future. If it is necessary, we will seek additional financing for future operations, acquisitions or other future developments and to repay amounts owed to our creditors or to redeem our outstanding preferred securities. The required funds may be raised through the sale of common stock, preferred stock, debt, or convertible debt, which may include the grant of warrants. Our inability to obtain sufficient funds from external sources when such funds are needed will have a material adverse effect on our plan of operations, results of operations and financial condition.
Additionally, as part of our ongoing efforts to maintain a capital structure that is closely aligned with what we believe to be the potential of our business and goals for future growth, which is subject to cyclical changes in commodity prices, we will be exploring additional sources of external liquidity. The receptiveness of the capital markets to an offering of debt or equities cannot be assured and may be negatively impacted by, among other things, debt maturities, current market conditions, and potential stockholder dilution. The sale of additional securities, if undertaken by us and if accomplished, may result in dilution to our shareholders. However, such future financing may not be available in amounts or on terms acceptable to us, or at all.
In addition to the above, we may also seek to acquire additional businesses or assets. In addition, the Company could consider selling assets if a more strategic acquisition presents itself. Finally, in the event we deem such transaction in our best interest, we may enter into a business combination or similar transaction in the future.
There is currently only a limited market for our common stock, and as such, we anticipate that such market will be illiquid, sporadic and subject to wide fluctuations in response to several factors moving forward, including, but not limited to:
(1) | actual or anticipated variations in our results of operations; |
(2) | the market for, and volatility in, the market for oil and gas; |
(3) | our ability or inability to generate new revenues; and |
(4) | the number of shares in our public float. |
Furthermore, because our common stock is traded on the NASDAQ Capital Market, our stock price may be impacted by factors that are unrelated or disproportionate to our operating performance. These market fluctuations, as well as general economic, political and market conditions, such as recessions, interest rates or international currency fluctuations may adversely affect the market price of our common stock. Additionally, at present, we have a limited number of shares in our public float, and as a result, there could be extreme fluctuations in the price of our common stock.
We believe that our stock prices (bid, ask and closing prices) may not relate to the actual value of our company, and may not reflect the actual value of our common stock. Shareholders and potential investors in our common stock should exercise caution before making an investment in our common stock, and should not rely on the publicly quoted or traded stock prices in determining our common stock value, but should instead determine the value of our common stock based on the information contained in our public reports, industry information, and those business valuation methods commonly used to value private companies.
23
Cash flows for the nine months ended September 30, 2018 compared to the nine months ended September 30, 2017:
Nine Months Ended September 30, | ||||||||
2018 | 2017 | |||||||
Beginning cash, cash equivalents and restricted cash | $ | 1,105,787 | $ | 3,206,158 | ||||
Net cash provided by (used in): | ||||||||
Operating activities | 409,486 | (2,388,578 | ) | |||||
Investing activities | (2,076,882 | ) | (3,544,099 | ) | ||||
Financing activities | 2,401,954 | 3,851,358 | ||||||
Net increase (decrease) in cash, cash equivalents and restricted cash | 734,558 | (2,081,319 | ) | |||||
Ending cash, cash equivalents and restricted cash | $ | 1,840,345 | $ | 1,124,839 | ||||
Net cash provided by operating activities was $409,486 for the nine months ended September 30, 2018, as compared to net cash used in operating activities of $2,388,578 during the corresponding period in 2017. Our primary sources of liquidity are cash flows from our operations and the availability to borrow funds under our credit and loan facilities, as well as private sales of securities. The primary reason for the increase in cash provided by operating activities for the nine month period ended September 30, 2018, compared to the same period in 2017, was the improvement in operations.
Investing activities used cash of $2,076,882 for the nine months ended September 30, 2018, as compared to having used $3,544,099 of cash during the corresponding period in 2017 due mainly to acquisitions completed during 2017.
Financing activities provided cash of $2,401,954 for the nine months ended September 30, 2018, as compared to providing cash of $3,851,358 during the corresponding period in 2017. The financing activities for the nine months ended September 30, 2018 were comprised of note proceeds of approximately $4.0 million, offset by approximately $3.0 million used to pay down our long-term debt, and $1.4 million of proceeds on our line of credit. The financing activities for the nine months ended September 30, 2017 were comprised of net payments of debt issuance costs of approximately $1.7 million, and note proceeds of approximately $16.5 million (in connection with our entry into the EBC Credit Agreement and Revolving Credit Agreement), offset by approximately $12.0 million used to pay down our long-term debt (relating to amounts paid on our previous financing agreements).
Critical Accounting Policies and Use of Estimates
Our financial statements are prepared in accordance with U.S. GAAP. The preparation of these financial statements requires management to make estimates and judgments that affect the reported amounts of assets, liabilities, revenues and expenses. Management regularly evaluates its estimates and judgments, including those related to revenue recognition, goodwill, intangible assets, long-lived assets valuation, and legal matters. Actual results may differ from these estimates. (See Note 1 to the financial statements included herein).
Revenue Recognition
Revenue for contracts for each of our divisions is recognized when it has approval and commitment from both parties, the rights of the parties are identified, payment terms are identified, the contract has commercial substance and collectability of consideration is probable. Revenue is recognized when our performance obligations under the terms of a contract with our customers are satisfied. Recognition occurs when the Company transfers control by completing the specified services at the point in time the customer benefits from the services performed or once our products are delivered. Revenue is measured as the amount of consideration we expect to receive in exchange for completing our performance obligations.
24
Business Combinations
The Company accounts for business combinations using the acquisition method of accounting. The results of operations for the acquired entities are included in the Company’s consolidated financial results from their associated acquisition dates. The Company allocates the purchase price of acquisitions to the tangible assets, liabilities, and identifiable intangible assets acquired based on their estimated fair values. A portion of purchase price for our acquisitions is contingent upon the realization of certain operating results. The fair values assigned to identifiable intangible assets acquired and contingent consideration were determined by management or a third party specialist depending on the significance. If the purchase price is under the fair value of the identified assets and liabilities, a bargain purchase is recognized and included in income from continuing operations.
Fair value of financial instruments
Under the Financial Accounting Standards Board Accounting Standards Codification (“FASB ASC”), we are permitted to elect to measure financial instruments and certain other items at fair value, with the change in fair value recorded in earnings. We elected not to measure any eligible items using the fair value option. Consistent with the Fair Value Measurement Topic of the FASB ASC, we implemented guidelines relating to the disclosure of our methodology for periodic measurement of our assets and liabilities recorded at fair market value.
Fair value is defined as the price that would be received to sell an asset or paid to transfer a liability in an orderly transaction between market participants at the measurement date. A three-tier fair value hierarchy prioritizes the inputs used in measuring fair value. The hierarchy gives the highest priority to unadjusted quoted prices in active markets for identical assets or liabilities (level 1 measurements) and the lowest priority to unobservable inputs (level 3 measurements). These tiers include:
• | Level 1, defined as observable inputs such as quoted prices for identical instruments in active markets; |
• | Level 2, defined as inputs other than quoted prices in active markets that are either directly or indirectly observable such as quoted prices for similar instruments in active markets or quoted prices for identical or similar instruments in markets that are not active; and |
• | Level 3, defined as unobservable inputs in which little or no market data exists, therefore requiring an entity to develop its own assumptions, such as valuations derived from valuation techniques in which one or more significant inputs or significant value drivers are unobservable. |
Our Level 1 assets primarily include our cash and cash equivalents. Valuations are obtained from readily available pricing sources for market transactions involving identical assets or liabilities.
Impairment of long-lived assets
The Company evaluates the carrying value and recoverability of its long-lived assets when circumstances warrant such evaluation by applying the provisions of the FASB ASC regarding long-lived assets. It requires that long-lived assets be reviewed for impairment whenever events or changes in circumstances indicate that the carrying amount of an asset may not be recoverable through the estimated undiscounted cash flows expected to result from the use and eventual disposition of the assets. Whenever any such impairment exists, an impairment loss will be recognized for the amount by which the carrying value exceeds the fair value. The Company determined that no long-lived asset impairment existed at September 30, 2018.
Derivative liabilities
In accordance with ASC 815-40-25 and ASC 815-10-15 Derivatives and Hedging and ASC 480-10-25 Liabilities-Distinguishing from Equity, convertible preferred shares are accounted for net, outside of shareholders' equity and warrants are accounted for as liabilities at their fair value during periods where they can be net cash settled in case of a change in control transaction. The warrants are accounted for as a liability at their fair value at each reporting period. The value of the derivative warrant liability will be re-measured at each reporting period with changes in fair value recorded as earnings. To derive an estimate of the fair value of these warrants, a Dynamic Black Scholes model is utilized that computes the impact of a possible change in control transaction upon the exercise of the warrant shares. This process relies upon inputs such as shares outstanding, estimated stock prices, strike price and volatility assumptions to dynamically adjust the payoff of the warrants in the presence of the dilution effect.
25
Preferred Stock Classification
A mandatorily redeemable financial instrument shall be classified as a liability unless the redemption is required to occur only upon the liquidation or termination of the reporting entity. A financial instrument issued in the form of shares is mandatorily redeemable if it embodies an unconditional obligation requiring the issuer to redeem the instrument by transferring its assets at a specified or determinable date (or dates) or upon an event certain to occur. A financial instrument that embodies a conditional obligation to redeem the instrument by transferring assets upon an event not certain to occur becomes mandatorily redeemable-and, therefore, becomes a liability-if that event occurs, the condition is resolved, or the event becomes certain to occur. The Series B Preferred Stock requires the Company to redeem such preferred stock on the fifth anniversary of the issuance of the Series B Preferred stock and the Series B1 Preferred Stock requires the Company to redeem such preferred stock on the same date as the Series B Preferred Stock. SEC reporting requirements provide that any possible redemption outside of the control of the Company requires the preferred stock to be classified outside of permanent equity.
Market Risk
Our revenues and cost of revenues are affected by fluctuations in the value of energy related products. We attempt to mitigate much of the risk associated with the volatility of relevant commodity prices by using our knowledge of the market to obtain feedstock at attractive costs, by efficiently managing the logistics associated with our products, by turning our inventory over quickly and by selling our products into markets where we believe we can achieve the greatest value.
26
Item 3. Quantitative and Qualitative Disclosures about Market Risk
We are exposed to interest rate risks primarily through borrowings under various bank facilities. Interest on these facilities is based upon variable interest rates using LIBOR or Prime as the base rate.
At September 30, 2018, the Company had approximately $16.7 million of variable-rate term debt outstanding. At this borrowing level, a hypothetical relative increase of 10% in interest rates would have an unfavorable but insignificant impact on the Company’s pre-tax earnings and cash flows. The primary interest rate exposure on variable-rate debt is based on the LIBOR rate (2.10% at September 30, 2018) plus 6.50% per year.
We are exposed to market risks related to the volatility of crude oil and refined oil products. Our financial results can be significantly affected by changes in these prices which are driven by global economic and market conditions. We attempt to mitigate much of the risk associated with the volatility of relevant commodity prices by using our knowledge of the market to obtain feedstock at attractive costs, by efficiently managing the logistics associated with our products, by turning our inventory over quickly, and by selling our products into markets where we believe we can achieve the greatest value.
27
Item 4. Controls and Procedures
Evaluation of Disclosure Controls and Procedures
We have established and maintain a system of disclosure controls and procedures that are designed to provide reasonable assurance that information required to be disclosed in our reports filed with the SEC pursuant to the Exchange Act, is recorded, processed, summarized and reported within the time periods specified in the rules and forms of the Commission and that such information is accumulated and communicated to our management, including our Chief Executive Officer (CEO) and Chief Financial Officer (CFO), as appropriate, to allow timely decisions regarding required disclosures.
Management, with the participation of our CEO and CFO, evaluated the effectiveness of the design and operation of our disclosure controls and procedures (as defined in Rules 13a-15(e) and 15d-15(e) of the Exchange Act) as of the end of the period covered by this report. As of September 30, 2018, based on the evaluation of these disclosure controls and procedures, and in light of the material weakness we found in our internal controls over financial reporting, our CEO and CFO have concluded that our disclosure controls and procedures were not effective to provide reasonable assurance that information required to be disclosed in our reports filed with the Securities and Exchange Commission pursuant to the Exchange Act, is recorded properly, processed, summarized and reported within the time periods specified in the rules and forms of the Commission and that such information is accumulated and communicated to our management, including our CEO and CFO, as appropriate, to allow timely decisions regarding required disclosures.
A material weakness is a deficiency, or a combination of deficiencies, in internal control over financial reporting, such that there is a reasonable possibility that a material misstatement of a company's annual or interim financial statements will not be prevented or detected on a timely basis as described in the following paragraph.
During the third quarter of 2018, we entered into a sale transaction in which we recognized the revenue in accordance with the bill and hold criteria under ASC 606. The Company did not have inventory controls associated with having client's inventory on site at quarter end. As a result, the Company did not design and maintain effective controls to assess the risks of misstatement, and therefore the appropriateness of inventory recognition, associated with fuel oil inventory transfers outside of our standard production. The Company is in the process of updating its controls related to the accuracy, cut-off, and completeness of inventory transactions related to certain fuel oil arrangements.
Changes in Internal Control Over Financial Reporting
We regularly review our system of internal control over financial reporting to ensure we maintain an effective internal control environment. There were no changes in our internal control over financial reporting that occurred during the period covered by this Quarterly Report on Form 10-Q that have materially affected, or are reasonably likely to materially affect, our internal control over financial reporting.
28
PART II – OTHER INFORMATION
Item 1. Legal Proceedings
From time to time, we may become party to litigation or other legal proceedings that we consider to be a part of the ordinary course of our business.
Vertex Refining LA, LLC, the wholly-owned subsidiary of Vertex Operating, was named as a defendant, along with numerous other parties, in five lawsuits filed on or about February 12, 2016, in the Second Parish Court for the Parish of Jefferson, State of Louisiana, Case No. 121749, by Russell Doucet et. al., Case No. 121750, by Kendra Cannon et. al., Case No. 121751, by Lashawn Jones et. al., Case No. 121752, by Joan Strauss et. al. and Case No. 121753, by Donna Allen et. al. The suits relate to alleged noxious and harmful emissions from our facility located in Marrero, Louisiana. The suits seek damages for physical and emotional injuries, pain and suffering, medical expenses and deprivation of the use and enjoyment of plaintiffs’ homes. We intend to vigorously defend ourselves and oppose the relief sought in the complaints, provided that at this stage of the litigation, the Company has no basis for determining whether there is any likelihood of material loss associated with the claims and/or the potential and/or the outcome of the litigation.
E-Source, a wholly-owned subsidiary of Vertex Operating, was named as a defendant (along with Motiva Enterprises, LLC, ("Motiva")) in a lawsuit filed in the Sixtieth (60th) Judicial District, Jefferson County, Texas, on April 22, 2015. Pursuant to the lawsuit, Whole Environmental, Inc. ("Whole"), made certain allegations against E-Source, and Motiva. In July 2018, the parties entered into a confidential settlement agreement and settled all previously pending claims.
29
Item 1A. Risk Factors
There have been no material changes from the risk factors previously disclosed in Part I, Item 1A of the Company’s Annual Report on Form 10-K for the year ended December 31, 2017, filed with the Commission on March 7, 2018, under the heading “Risk Factors”, and investors should review the risks provided in the Form 10-K, prior to making an investment in the Company. The business, financial condition and operating results of the Company can be affected by a number of factors, whether currently known or unknown, including but not limited to those described in the Form 10-K for the year ended December 31, 2017, under “Risk Factors”, any one or more of which could, directly or indirectly, cause the Company’s actual financial condition and operating results to vary materially from past, or from anticipated future, financial condition and operating results. Any of these factors, in whole or in part, could materially and adversely affect the Company’s business, financial condition, operating results and stock price.
30
Item 2. Recent Sales of Unregistered Securities
For the period from April 1, 2018 to June 30, 2018, a total of approximately $162,719 of dividends accrued on our outstanding Series B Preferred Stock and for the period from April 1, 2018 to June 30, 2018, a total of approximately $460,035 of dividends accrued on our outstanding Series B1 Preferred Stock. We chose to pay such dividends in-kind by way of the issuance of 52,490 restricted shares of Series B Preferred Stock pro rata to each of the then holders of our Series B Preferred Stock in July 2018 and the issuance of 294,894 restricted shares of Series B1 Preferred Stock pro rata to each of the then holders of our Series B1 Preferred Stock in July 2018. If converted in full, the 52,490 shares of Series B Preferred Stock would convert into 52,490 shares of common stock and the 294,894 shares of Series B1 Preferred Stock would convert into 294,894 shares of common stock.
For the period from July 1, 2018 to September 30, 2018, a total of approximately $165,162 of dividends accrued on our outstanding Series B Preferred Stock and for the period from July 1, 2018 to September 30, 2018, a total of approximately $314,149 of dividends accrued on our outstanding Series B1 Preferred Stock. We chose to pay such dividends on the Series B Preferred Stock in-kind by way of the issuance of 53,278 restricted shares of Series B Preferred Stock pro rata to each of the then holders of our Series B Preferred Stock in October 2018. We chose to pay such dividends on the Series B1 Preferred Stock by way of the issuance of 166,630 shares of common stock (at a conversion price of $1.55 per share, as calculated as provided in the Designation) pro rata to each of the then holders of our Series B1 Preferred Stock, other than those due to an affiliate of Mr. Benjamin P. Cowart, our Chief Executive Officer and Chairman, whose affiliated entity was issued 567 shares of restricted Series B1 Preferred Stock in lieu of common stock, because the designation of the Series B1 Convertible Preferred Stock (the “Designation”) includes a 9.99% beneficial ownership limitation preventing the issuance of any shares of common stock to any holder thereunder if such issuance would result in such holder exceeding beneficial ownership of 9.99% of the Company’s outstanding common stock, and Mr. Cowart already beneficially owns greater than 9.99% of our outstanding common stock. If converted in full, the 53,278 shares of Series B Preferred Stock would convert into 53,278 shares of common stock and the 567 shares of Series B1 Preferred Stock would convert into 567 shares of common stock.
As the issuance of the Series B Preferred Stock, Series B1 Preferred Stock and common stock in-kind in satisfaction of the dividends did not involve a “sale” of securities under Section 2(a)(3) of the Securities Act, we believe that no registration of such securities, or exemption from registration for such securities, was required under the Securities Act. Notwithstanding the above, to the extent such shares are deemed “sold or offered”, we claim an exemption from registration pursuant to Section 4(a)(2) and/or Rule 506 of Regulation D of the Securities Act, since the transaction did not involve a public offering, the recipients were “accredited investors”, and acquired the securities for investment only and not with a view towards, or for resale in connection with, the public sale or distribution thereof. The securities are subject to transfer restrictions, and the certificates evidencing the securities contain an appropriate legend stating that such securities have not been registered under the Securities Act and may not be offered or sold absent registration or pursuant to an exemption therefrom. The securities were not registered under the Securities Act and such securities may not be offered or sold in the United States absent registration or an exemption from registration under the Securities Act and any applicable state securities laws.
On July 27, 2018, the holder of shares of Series C Convertible Preferred Stock of the Company converted 16,675 shares of our Series C Convertible Preferred Stock into 1,667,500 shares of our common stock, pursuant to the terms of such Series C Convertible Preferred Stock.
On August 2, 2018, a holder of shares of Series C Convertible Preferred Stock of the Company converted 16,675 shares of our Series C Convertible Preferred Stock into 1,667,500 shares of our common stock, pursuant to the terms of such Series C Convertible Preferred Stock.
On September 5, 2018, two holders of shares of Series C Convertible Preferred Stock of the Company converted 14,893 shares of our Series C Convertible Preferred Stock into 1,489,300 shares of our common stock, pursuant to the terms of such Series C Convertible Preferred Stock.
On September 17, 2018, three affiliated holders of our Series B1 Convertible Preferred Stock, converted 1,326,552 shares of our Series B1 Convertible Preferred Stock which they held into 1,326,552 shares of our common stock.
On September 21, 2018, Prescott Group Aggressive Small Cap Master Fund, G.P., a greater than 5% shareholder of our common stock and a holder of our Series B1 Convertible Preferred Stock, converted 1,000,000 shares of our Series B1 Convertible Preferred Stock which it held into 1,000,000 shares of our common stock.
On October 4, 2018, Prescott Group Aggressive Small Cap Master Fund, G.P. converted 1,000,000 shares of our Series B1 Convertible Preferred Stock which it held into 1,000,000 shares of our common stock.
31
We claim an exemption from registration provided by Section 3(a)(9) of the Securities Act for such issuances, as the securities were exchanged by us with our existing security holders in transactions where no commission or other remuneration was paid or given directly or indirectly for soliciting such exchange.
As a result of the conversions and other transactions described above, there are 419,859 outstanding shares of Series A Convertible Preferred Stock, which if converted in full, would convert into 419,859 shares of common stock; 3,604,827 outstanding shares of Series B Convertible Preferred Stock, which if converted in full, would convert into 3,604,827 shares of common stock; 10,074,898 outstanding shares of Series B1 Convertible Preferred Stock, which if converted in full, would convert into 10,074,898 shares of common stock as of the date of this filing, and no outstanding shares of Series C Convertible Preferred Stock.
Use of Proceeds From Sale of Registered Securities
None.
Issuer Purchases of Equity Securities
None.
Item 3. Defaults Upon Senior Securities
None.
Item 4. Mine Safety Disclosures
Not applicable.
Item 5. Other Information.
None.
32
Item 6. Exhibits
See the Exhibit Index following the signature page to this Quarterly Report on Form 10-Q for a list of exhibits filed or furnished with this report, which Exhibit Index is incorporated herein by reference.
33
EXHIBIT INDEX | |||||||||||||||
Incorporated by Reference | |||||||||||||||
Exhibit Number | Description of Exhibit | Filed or Furnished Herewith | Form | Exhibit | Filing Date/Period End Date | File No. | |||||||||
31.1 | X | ||||||||||||||
31.2 | X | ||||||||||||||
32.1 | X | ||||||||||||||
32.2 | X | ||||||||||||||
99.1 | 10-K | 99.1 | 12/31/2012 | 001-11476 | |||||||||||
101.INS | XBRL Instance Document | X | |||||||||||||
101.SCH | XBRL Taxonomy Extension Schema Document | X | |||||||||||||
101.CAL | XBRL Taxonomy Extension Calculation Linkbase Document | X | |||||||||||||
101.DEF | XBRL Taxonomy Extension Definition Linkbase Document | X | |||||||||||||
101.LAB | XBRL Taxonomy Extension Label Linkbase Document | X | |||||||||||||
101.PRE | XBRL Taxonomy Extension Presentation Linkbase Document | X | |||||||||||||
* Filed herewith.
** Furnished herewith.
SIGNATURES
Pursuant to the requirements of the Securities Exchange Act of 1934, the registrant has duly caused this Report to be signed on its behalf by the undersigned, hereunto duly authorized.
34
VERTEX ENERGY, INC. | |
Date: November 5, 2018 | By: /s/ Benjamin P. Cowart |
Benjamin P. Cowart | |
Chief Executive Officer | |
(Principal Executive Officer) | |
Date: November 5, 2018 | By: /s/ Chris Carlson |
Chris Carlson | |
Chief Financial Officer | |
(Principal Financial/Accounting Officer) | |
35