Attached files
| file | filename |
|---|---|
| EX-99.1 - EXHIBIT 99.1 - New Senior Investment Group Inc. | a52262829ex99_1.htm |
| 8-K - NEW SENIOR INVESTMENT GROUP INC. 8-K - New Senior Investment Group Inc. | a52262829.htm |
Exhibit 99.2

Company Update August 7, 2020 Pioneer Valley LodgeNorth Logan, UT

Forward-Looking Statements, Non-GAAP and Other Information 1 IN GENERAL. This disclaimer applies to
this document and the verbal or written comments of any person presenting it. This document, taken together with any such verbal or written comments, is referred to herein as the “Presentation.” Throughout this Presentation, New Senior
Investment Group Inc. (NYSE: SNR) is referred to as “New Senior,” the “Company,” “SNR” or “we.”FORWARD-LOOKING STATEMENTS. Certain information in this Presentation may constitute “forward-looking statements” within the meaning of the Private
Securities Litigation Reform Act of 1995, including without limitation statements regarding expectations with respect to the potential range of 2020 financial results, the expected impact of the COVID-19 pandemic on our business, liquidity,
properties, operators and the health systems and populations that we serve; the cost and effectiveness of measures we have taken to respond to the COVID-19 pandemic, including health and safety protocols and system capacity enhancements that
are intended to limit the transmission of COVID-19 at our properties; and our expected occupancy rates and operating expenses. These statements are not historical facts. They represent management’s current expectations regarding future events
and are subject to a number of risks and uncertainties, many of which are beyond our control, that could cause actual results to differ materially from those described in the forward-looking statements. These risks and uncertainties include,
but are not limited to, risks and uncertainties relating to the continuing impact of COVID-19 on our operations and the operation of our facilities, including ongoing cases at certain of our facilities, the speed, geographic reach and duration
of the COVID-19 pandemic; the legal, regulatory and administrative developments that occur at the federal, state and local levels; the efficacy of our operators’ infectious disease protocols and prevention efforts; the broader impact of the
pandemic on local economies and labor markets; and the overall demand for our communities in the recovery period following the pandemic, our ability to successfully manage the asset management by third parties, and market conditions generally
which affect demand and supply for senior housing. We believe that the adverse impact that COVID-19 will have on the future operations and financial results at our communities will depend upon many factors, most of which are beyond our ability
to control or predict. Accordingly, you should not place undue reliance on any forward-looking statements contained herein. For a discussion of these and other risks and important factors that could affect such forward-looking statements, see
the sections entitled “Risk Factors” and “Management’s Discussion and Analysis of Financial Condition and Results of Operations” in the Company’s most recent annual and quarterly reports filed with the Securities and Exchange Commission, which
are available on the Company’s website (www.newseniorinv.com). New risks and uncertainties emerge from time to time, and it is not possible for us to predict or assess the impact of every factor that may cause our results to differ materially
from those anticipated by any forward-looking statements. Forward-looking statements contained herein, and all statements made in this Presentation, speak only as of the date of this Presentation, and the Company expressly disclaims any duty or
obligation to release publicly any updates or revisions to any statements contained herein to reflect any change in the Company’s expectations with regard thereto or change in events, conditions or circumstances on which any statement is
based.NON-GAAP FINANCIAL INFORMATION. This Presentation includes information based on financial measures that are not recognized under generally accepted accounting principles (“GAAP”), such as NOI, cash NOI, adjusted same store cash NOI,
Normalized FFO, AFFO and Normalized FAD. You should use non‐GAAP information in addition to, and not as an alternative to, financial information prepared in accordance with GAAP. See the end of this Presentation for reconciliations to the most
comparable GAAP measures and an explanation of each of our non-GAAP measures. Our non-GAAP measures may not be identical or comparable to measures with the same name presented by other companies due to differences in calculation, capital
structure or other factors. PAST PERFORMANCE. In all cases where historical results are presented or past performance is described, we note that past performance is not a reliable indicator of future results and performance.GLOSSARY. See the
Glossary at the end of this Presentation for an explanation of various terms used herein.

Table of Contents SECTIONS PAGES I. Executive Summary & Company Overview 4 –
7 II. COVID-19 Situation Update 9 – 11 III. Financial Update 13 – 20 IV. Reconciliations and Glossary 22 – 27 2

Executive Summary & Company Overview Madison EstatesSan Antonio, TX

Executive Summary 4 New Senior Investment Group Inc. (NYSE: SNR) is the only U.S. pure play,
publicly-traded senior living REITPortfolio comprised of 102 Independent Living (IL) properties and one NNN leased property across 36 statesNearly five months since our first confirmed case, the COVID-19 pandemic continues to impact our
businessOur top priority continues to be the health and safety of our residents and associates around the countryAs of August 5, our operators have reported 19 currently active cases across 10 properties (or 10% of the portfolio)In mid-March,
our operators began implementing restrictions within our properties to address COVID-19While necessary, we understood that these actions would result in lower move-ins and higher expensesIn recent months, the focus shifted to beginning to
safely lift restrictions within our properties in a phased approachTo date, our overall financial results have been better than we had expected at the onset of the pandemicWhile occupancy continues to decline, the trends have slowly improved
due to continued move-ins & lower move-outsAs occupancy has declined, our operators have been able to tightly manage expenses such as supplies and laborInterest savings from significant declines in LIBOR have offset declines in NOIAs a
result, 2Q20 AFFO per share was $0.19, an increase of $0.02 QoQ 2Q20 total same store cash NOI decreased 3.1% YoY and increased 0.4% QoQBased on first half results and recent trends, we are now providing expectations for full year 2020
resultsFull year 2020 total same store cash NOI to decline 4.5% to 7.5% compared to full year 2019 (including NNN lease) Full year 2020 AFFO per share range of $0.67 to $0.71These estimates for full year 2020 results are based on a number of
assumptions that are subject to change and many of which are outside of our control, particularly those that relate to the ongoing pandemic
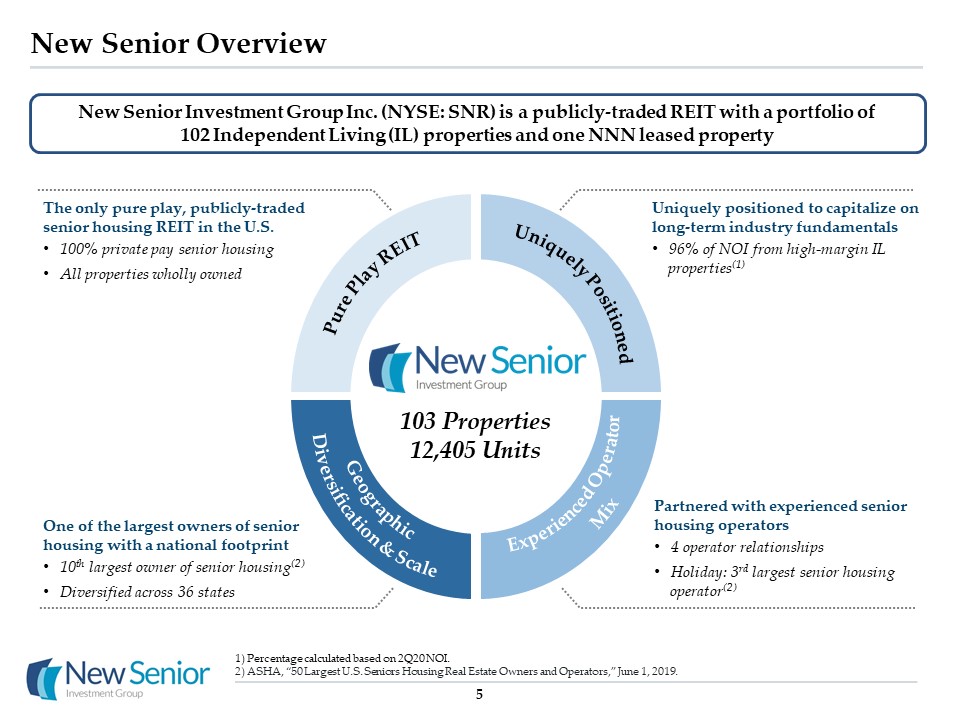
New Senior Overview New Senior Investment Group Inc. (NYSE: SNR) is a publicly-traded REIT with a
portfolio of 102 Independent Living (IL) properties and one NNN leased property Pure Play REIT Uniquely Positioned Geographic Diversification & Scale Experienced Operator Mix Uniquely positioned to capitalize on
long-term industry fundamentals96% of NOI from high-margin IL properties(1) The only pure play, publicly-traded senior housing REIT in the U.S.100% private pay senior housingAll properties wholly owned Partnered with experienced senior
housing operators4 operator relationships Holiday: 3rd largest senior housing operator(2) One of the largest owners of senior housing with a national footprint10th largest owner of senior housing(2)Diversified across 36 states Percentage
calculated based on 2Q20 NOI.ASHA, “50 Largest U.S. Seniors Housing Real Estate Owners and Operators,” June 1, 2019. 103 Properties12,405 Units 5

Geographically Diversified Portfolio Portfolio of 103 properties located in 36 different
statesProperties located in markets with favorable demographic trends Properties predominately located outside of major metropolitan areas65% of NOI generated from properties located in secondary and tertiary markets(1) 6 Top Markets and
States National Footprint As defined by National Investment Center for Seniors Housing & Care (NIC); Tertiary markets include Additional markets and markets not covered by NIC.Percentages calculated based on 2Q20
NOI. Top
5 States Properties % of NOI(2) California 9 11% North Carolina 8 10% Florida 9 9% Pennsylvania 5 8% Oregon 8 7% Markets(1) Properties % of NOI(2) Primary 32 35% Secondary 32 32% Tertiary 39 33% Managed IL
PropertiesNNN Lease

7 Recent Company Updates The Company has evolved significantly since 2019 and is now focused on
navigating through the pandemic Completed internalization of managementProvided public earnings guidance for first timeCompleted relocation of headquarters January & February 2019 Completed transitions of nine AL/MC properties to new
operatorsClosed on the sale of one underperforming AL/MC propertyCompleted external hires, finalizing internal management team March & April 2019 Closed on the sale of a second underperforming AL/MC propertyContinued corporate governance
improvements including appointment of new independent directorExecuted interest rate swap to increase fixed rate debt exposure May & June 2019 Signed agreement to sell entire AL/MC portfolio for a gross sale price of $385 million October
2019 Closed sale of AL/MC portfolioRepaid ~$360 million of debtCompleted ~$400 million of refinancing activity, resulting in lower debt costs and an extension of debt maturities by two years Reported 2019 earnings and announced 2020
guidance February 2020 Reported 1Q earnings consistent with initial 2020 guidance1Q total same store NOI up 0.1% YoY Withdrew full year 2020 guidance due to uncertainty from pandemicReduced dividend by 50% to preserve liquidity May
2020 January 21, 2020 First COVID-19 case in US August 5, 2020(1)4.8 million COVID-19 cases in US 1Q 2019 2Q 2019 4Q 2019 1Q 2020 3Q 2020 2Q 2020 Increased frequency of communication throughout the COVID-19 pandemic Reported 2Q
earnings and announced expectations for full year 2020 2Q total same store NOI down 3.1% YoY June – August 2020 National data per Johns Hopkins University.
COVID-19 Situation Update Copley PlaceCopley, OH

Known COVID-19 Cases & Status Table based on 29 properties with resident cases only, and does not
include 16 properties with at least one associate case but no resident case.Residents are generally deemed “recovered” when, per CDC guidelines, either (1) two negative test results received or (2) no fever for at least 72 hours (without use of
fever-reducing medicine), other symptoms have improved, and at least 14 days have passed since the date of a positive test. As of August 5, our operators reported 19 currently active cases across 10 properties (13 residents / 6 associates)The
13 active resident cases represent 0.1% of our total current resident populationAs of August 5, 45 total properties (44% of our portfolio) have reported at least one resident or associate caseOf the 45 properties with cases, only 14 have
reported over 3 cases, a signal that protocols appear effective at limiting the spread of the virus within our properties56% of the properties in our portfolio have not reported a single resident or associate case 9 SNR Reported Positive
COVID-19 Resident Cases(1) Breakdown of COVID-19 Impacted Properties Resident Cases Properties Active Recovered(2) Deceased Total IL: Properties with active cases 6 13 3 3 19 IL: Properties with previously active
cases 22 - 52 15 67 IL: Total properties with positive cases reported 28 13 55 18 86 CCRC 1 - 55 14 69 Total Portfolio 29 13 110 32 155 103 Properties 58 properties with no reported cases 31 properties with
1 – 3 reported cases 14 properties with 4+ reported cases

Trend of New COVID-19 Cases Since the start of the pandemic, the weekly number of new cases in our
properties has remained relatively lowAverage of 6 new cases per week (excluding our one CCRC in downtown Philadelphia)We believe this is a result of early closure of properties and effective operator protocolsIn July, as the rate of new cases
across the U.S. and in SNR counties increased significantly, our portfolio experienced an uptick in new cases as wellLatest national data suggests rate of daily new cases is slowing in the “hotspot” states of FL, CA, TX, and AZ 10 Trend of
New COVID-19 Cases(1) National data per Johns Hopkins University as of 8/5/20 and based on trailing 7-day average. SNR New Weekly Cases U.S. / SNR Counties New Daily Cases
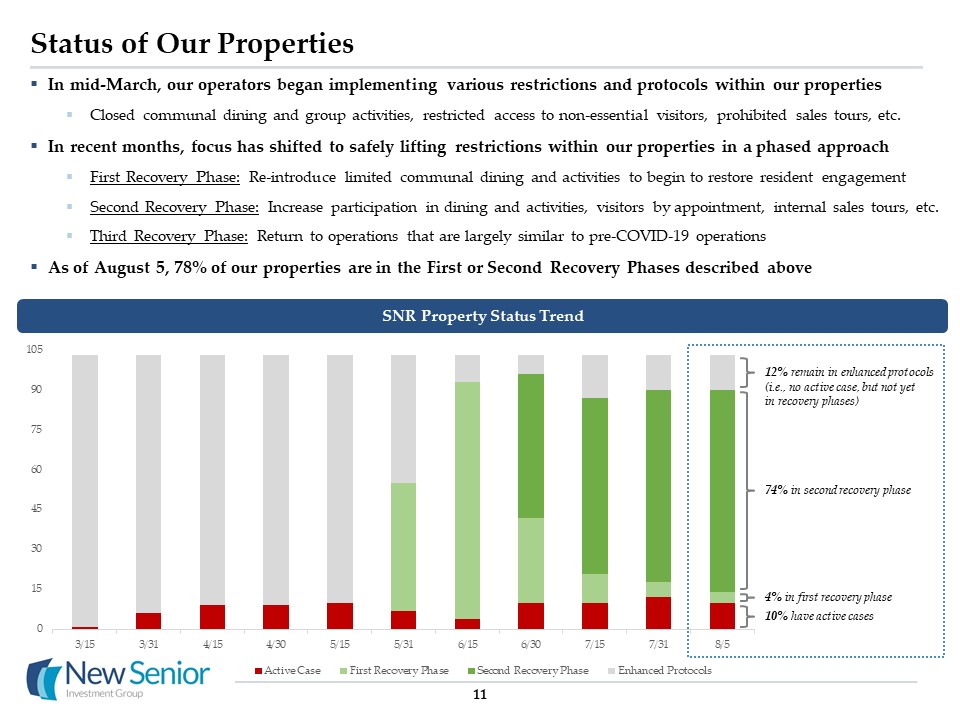
11 Status of Our Properties In mid-March, our operators began implementing various restrictions and
protocols within our propertiesClosed communal dining and group activities, restricted access to non-essential visitors, prohibited sales tours, etc.In recent months, focus has shifted to safely lifting restrictions within our properties in a
phased approachFirst Recovery Phase: Re-introduce limited communal dining and activities to begin to restore resident engagementSecond Recovery Phase: Increase participation in dining and activities, visitors by appointment, internal sales
tours, etc.Third Recovery Phase: Return to operations that are largely similar to pre-COVID-19 operationsAs of August 5, 78% of our properties are in the First or Second Recovery Phases described above SNR Property Status Trend 12%
remain in enhanced protocols(i.e., no active case, but not yet in recovery phases) 74% in second recovery phase 4% in first recovery phase 10% have active cases

Financial Update The JeffersonMiddleton, WI

Key Observations From COVID-19 Impact To Date 13 Occupancy:Modest COVID-19 Case Count & Improving
Occupancy Trend Expenses:IL Portfolio Benefiting from Flexible Expense Structure Earnings:Interest & G&A Savings Offsetting NOI Decline No healthcare component in IL, which results in fewer interactions between residents and
staffOnly 14% of our properties have reported over 3 casesOur properties are located primarily in secondary and tertiary markets, which have generally seen a lower level of casesAlmost 80% of our properties are in a Recovery Phase and have
lifted certain restrictionsOccupancy declines have improved as operators adopted new leasing strategies and have seen continued demand from our target IL resident demographic With no healthcare component, IL benefits from a more flexible
expense structureOperators have been able to successfully tighten occupancy-related expenses such as supplies and labor, and additional line items such as marketing and maintenanceCOVID-19 expenses have been much lower than initially
expectedThese favorable expense trends have helped offset lower revenue from occupancy declines 48% of our debt is floating rateSignificant interest rate volatility since the start of the pandemicSavings from lower interest rates have helped
offset the NOI declines that we have experiencedAt the same time, we have taken steps to reduce our corporate G&A costs As a result, our NOI declines due to the pandemic have been offset by lower interest expense and G&A savingsWe also
halted discretionary capital expenditures, but expect to ramp up spend as properties continue to recover 1 2 3 The COVID-19 pandemic has had a disproportionate impact on seniors, the cohort our properties serveOur operators took early
action to limit access at our properties and secure supplies to ensure the safety of residents/staffNow, several months into the pandemic, we are sharing our observations about how the business has performed The situation remains fluid and it
is not clear whether these trends will continue or evolve as we get farther into the pandemic

Summary of 2Q 2020 Results & July Trends 14 Ending occupancy down 250bps sequentially from 1Q20
to 2Q20; July down 430bps since February (pandemic start) Move-ins and leads have both trended upward since April low point but remain below historical levelsMove-outs in July were higher than historical levels following three months of lower
volume; July ending occupancy declined 50bps from June Occupancy 2Q20 total same store cash NOI down 3.1% YoY and up 0.4% QoQ 2Q20 cash interest expense down 18% or $3.3 million vs 1Q20 2Q20 AFFO of $0.19 per share, up $0.02 per share vs 1Q20
mainly driven by interest savings NOI & AFFO 2Q20 expenses down 1.7% YoY and down 4.5% QoQ, driven by occupancy declines and operating expense savingsExcluding COVID-19 expenses, 2Q20 expenses down 4.6% YoY and down 6.5% QoQ COVID-19
expenses below initial expectations due to lower cost for meal delivery supplies and less temporary labor Operating Expenses 2Q20 was the first full quarter where COVID-19 impacted the Company’s financial results 2Q20 total same store cash
NOI was better than expected at the start of the pandemicOccupancy declines offset by significantly lower operating expenses; COVID-19 expenses lower than expected 2Q20 AFFO results significantly better than expected (up 12% vs 1Q20)48% of debt
is floating rate and sharp decline in LIBOR has resulted in significantly lower interest expense

Year-to-Date Results 1H19 1H20 YoY 87.1% 86.0% (110bps) 88.9% 84.9% (400bps) $2,692
$2,706 0.5% 40.7% 40.3% (40bps) $68,582 $67,395 (1.7%) $68,582 $69,365 1.1% $2,849 $2,927 2.7% $71,430 $70,321 (1.6%) $71,430 $72,292 1.2% $0.32 $0.36 12.5% 15 Financial Results – 2Q 2020 Same store
cash NOI decreased 3.1% YoY and increased 0.4% QoQIL average occupancy decreased 220bps YoY and QoQ, and RevPOR growth decelerated to +0.2% YoYExcluding $1.5mm of COVID-19 expenses, same store cash NOI increased 0.9% YoY and increased 3.1%
QoQ2Q20 AFFO per share was $0.19, up $0.02 vs 1Q20 and $0.03 vs 2Q19 mainly driven by interest savings ($ in thousands) Quarterly Results 2Q19 1Q20 2Q20 QoQ YoY Average
Occupancy 87.1% 87.1% 84.9% (220bps) (220bps) Ending Occupancy 88.9% 87.4% 84.9% (250bps) (400bps) RevPOR $2,701 $2,706 $2,707 - 0.2% Margin 41.3% 39.7% 40.9% 120bps (40bps) IL NOI (102 Properties) $34,936 $33,637
$33,758 0.4% (3.4%) Excluding COVID-19 Expenses $34,936 $34,137 $35,228 3.2% 0.8% Watermark (1 Property) $1,437 $1,450 $1,477 1.8% 2.8% Total Same Store (103 Properties) $36,373 $35,087 $35,234 0.4% (3.1%)
Excluding COVID-19 Expenses $36,373 $35,587 $36,705 3.1% 0.9% AFFO Per Share $0.16 $0.17 $0.19 11.8% 18.8%

Lead and Move-in Trends 16 Monthly Lead Trends Monthly Move-In Trends +62% +119% Since hitting a
low point in April, leads have continued to trend upward over the past 3 monthsJune leads saw a significant increase vs May, as third-party referral and website leads continued to recoverJuly leads increased 6% vs June, were up 62% vs the April
low, but still trailed July 2019 by 20%Move-ins fell sharply in March and April, but have trended back to pre-COVID-19 levels in the past 3 monthsJune move-ins were flat vs May, as volume stalled in the second half of the month with the
resurgence in U.S. cases July move-ins increased 29% vs June, were up 119% vs the April low, but still trailed July 2019 by 15%Unclear how current spike in cases across the U.S. will impact leads and near-term demand for senior housing

Move-Out and Occupancy Trends 17 Monthly Move-Out Trends Monthly Ending Occupancy Trends (Decline in
bps) +28% Move-out volume remained below historical level throughout 2Q20, but trended slightly higher each monthJuly move-outs increased for a third consecutive month and were up 8% vs historical averagePreliminary August move-outs are
trending slightly below elevated July levelMonthly occupancy declines slowed in May, June and July (-60bps) compared to March and April (-125bps)May and June benefited from lower move-outs and increased move-in volumeJuly driven by continued
improvement in move-in volume and partially offset by elevated move-outs - -130 -120 -60 -70 -50 Avg decline: -60bps Avg decline: -125bps 88.7% 88.7% 87.4% 86.2% 85.6% 84.9% 84.4% Occupancy

18 Expense – Trends With no healthcare exposure, our IL portfolio has benefited significantly from
favorable expense trendsOperators were able to tightly manage supplies and labor costs as occupancy declined, and saw material savings in other line items such as maintenance and marketingCOVID-19 expenses have been lower than originally
expected (minimal incremental labor costs, lower supply costs, etc.)Total 2Q20 expenses declined 4.5% vs 1Q20, as incremental COVID-19 expenses were more than offset by reductions in other operating expensesAs a result, margins remained stable
in 2Q20 despite occupancy loss and incremental COVID-19 expenses 2Q20 Expenses Vs 1Q20 Expenses 1Q 2Q 3Q 4Q Historical Operating Margins $51.1mm $48.8mm Total expenses down 4.5% QoQ

Capital Structure, Debt Maturities & Liquidity(1) All information is presented as of 6/30/2020.
Total cash interest expense for 2Q20 was $14.4 million and 1Q20 was $17.7 million, which excludes deferred financing costs. 1Q20 includes interest expense on debt repaid upon the sale of the AL/MC portfolio (classified as discontinued
operations). 2022 maturity (secured loan) has two, 1-year extension options with the payment of a 12.5bps extension fee. 19 Amounts % of Total W.A. Maturity in Years 2Q Interest Rate Fixed $815 52% 5.0
years 4.4% Floating 750 48% 6.1 years 2.4% Total Debt $1,565 100% 5.8 years 3.4% As of June 30, the Company had $1.6 billion of debt 48% floating / 52% fixed rate debtLIBOR has declined from 173bps on January 2, 2020 to 15bps on
August 5, 2020As a result, 2Q20 cash interest expense is down 18% or $3.3 million vs 1Q20(2)$102.3 million of cash and cash equivalentsCompany repaid $40 million of its $100 million revolver balance, which was drawn in 1Q20 No significant debt
maturities until 2024 Capital Structure Debt Maturity & Amortization Schedule ($ in millions) ($ in millions) (3) 2020 LIBOR To Date 1Q20 average of 165bps2Q20 average of 50bpsAs of 8/5/20, spot rate of 15bps

Full Year 2020 Expectations 20 Based on first half results and current trends, we are providing
expectations for full year 2020 results Full year 2020 total same store cash NOI: down 4.5% to 7.5% YoY (includes NNN lease)First half of 2020 benefited from a strong 1Q20 – total same store cash NOI for the first half of 2020 was down 1.6%
YoYSecond half of 2020 expected to be impacted by lower IL occupancy starting point (down 400bps vs prior year)Full year 2020 AFFO per share: $0.67 to $0.71 (unchanged from pre-COVID-19 estimate at the start of 2020) Lower NOI offset by lower
interest expense due to decline in LIBOR and lower G&AInterest Expense: 48% of debt ($0.8 billion) is floating rate; expect to continue to benefit from lower LIBOR G&A: Initiatives in place to reduce G&A 1Q20 2Q20 1H20 FY
2020 Expectations Total Same Store Cash NOI Up 0.1% YoY Down 3.1% YoY Down 1.6% YoY Down 4.5% to 7.5% YoY AFFO Per Share $0.17 $0.19 $0.36 $0.67 to $0.71 2020 Expectations

Reconciliations & Glossary Marion WoodsOcala, FL

Full Year 2020 Expectations – Non-GAAP Reconciliation 22 Low High Net loss attributable to common
stockholders ($0.11) ($0.07) Gain on sale of assets (0.24) (0.24) Depreciation & amortization 0.79 0.79 FFO $0.44 $0.48 Compensation expense related to transition awards 0.02 0.02 Loss on extinguishment of
debt 0.11 0.11 Acquisition, transaction & integration expense 0.02 0.02 Normalized FFO $0.59 $0.63 Amortization of deferred financing costs 0.04 0.04 Amortization of deferred community fees &
other (0.02) (0.02) Amortization of equity-based compensation 0.06 0.06 AFFO $0.67 $0.71 Full Year 2020 Per Share Reconciliation (Shares in millions) The Company’s expectations are based on a number of other assumptions that are
subject to change and many of which are outside the control of the Company. If actual results vary from these assumptions, the Company’s expectations may change. There can be no assurance that the Company will achieve these results.

2Q20 2Q19 Managed IL Properties Other Properties Total Managed IL Properties Other
Properties Total Same Store Cash NOI (excluding COVID-19 related expenses) $ 35,228 $ 1,477 $ 36,704 $ 34,936 $ 1,437 $ 36,373 COVID-19 related expenses (1,470) - (1,470) - - - Same Store Cash
NOI 33,758 1,477 35,234 34,936 1,437 36,373 Non-Same Store Cash NOI - - - - (378) (378) Straight-line rental revenue - 108 108 - 147 147 Amortization of deferred community fees and other(2) 434 (2) 432
(472) 40 (432) Segment / Total NOI $ 34,191 $ 1,582 $ 35,773 $ 34,464 $ 1,247 $ 35,711 Interest expense (15,281) (19,570) Depreciation and amortization (16,782)
(16,987) General and administrative expense (5,894) (5,359) Acquisition, transaction & integration expense (19) (174) Loss on extinguishment of debt - (335) Other income (expense)
(433) (62) Income tax expense (22) (37) Loss on sale of real estate - (122) Loss from continuing operations (2,658) (6,935) Loss from discontinued operations -
(2,651) Discontinued operations, net - (2,651) Net income (loss) $ (2,658) $ (9,586) Deemed dividend on redeemable preferred stock (599) (599) Net income (loss) attributable to
common stockholders $ (3,257) $ (10,185) NOI Reconciliation – 2Q 2020 Year-over-Year(1) 23 Totals may not sum due to rounding.Includes amortization of deferred community fees and other, which includes the net change in deferred
community fees and other rent discounts or incentives. ($ in thousands)
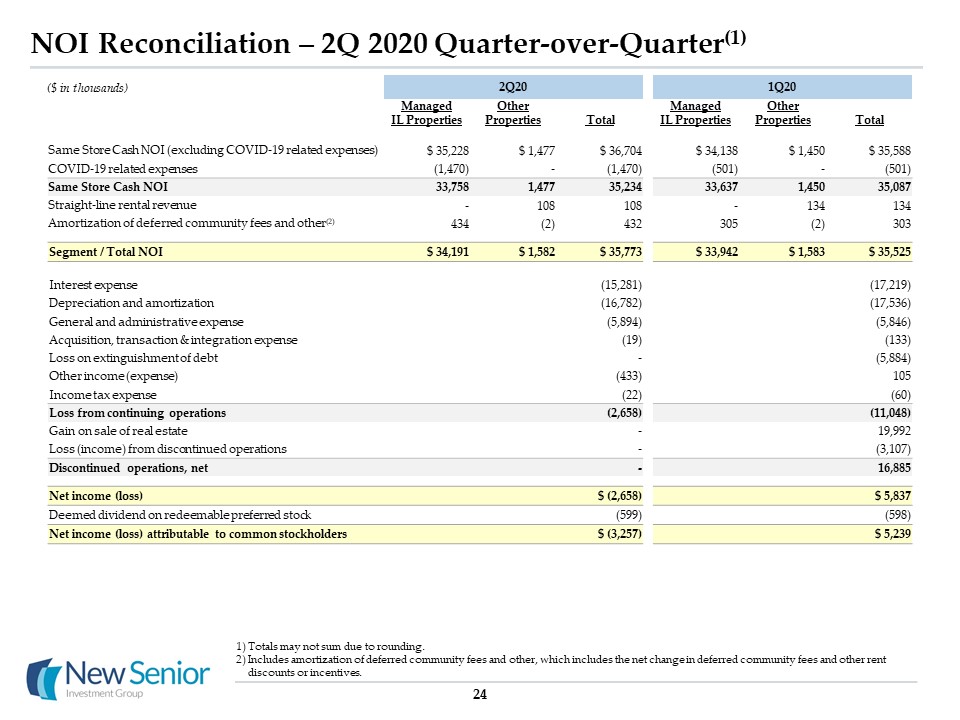
NOI Reconciliation – 2Q 2020 Quarter-over-Quarter(1) 24 Totals may not sum due to rounding.Includes
amortization of deferred community fees and other, which includes the net change in deferred community fees and other rent discounts or incentives. 2Q20 1Q20 Managed IL Properties Other Properties Total Managed IL
Properties Other Properties Total Same Store Cash NOI (excluding COVID-19 related expenses) $ 35,228 $ 1,477 $ 36,704 $ 34,138 $ 1,450 $ 35,588 COVID-19 related expenses (1,470) - (1,470) (501) - (501) Same
Store Cash NOI 33,758 1,477 35,234 33,637 1,450 35,087 Straight-line rental revenue - 108 108 - 134 134 Amortization of deferred community fees and other(2) 434 (2) 432 305 (2) 303 Segment /
Total NOI $ 34,191 $ 1,582 $ 35,773 $ 33,942 $ 1,583 $ 35,525 Interest expense (15,281) (17,219) Depreciation and amortization (16,782) (17,536) General and administrative expense
(5,894) (5,846) Acquisition, transaction & integration expense (19) (133) Loss on extinguishment of debt - (5,884) Other income (expense) (433) 105 Income tax expense (22)
(60) Loss from continuing operations (2,658) (11,048) Gain on sale of real estate - 19,992 Loss (income) from discontinued operations - (3,107) Discontinued operations, net
- 16,885 Net income (loss) $ (2,658) $ 5,837 Deemed dividend on redeemable preferred stock (599) (598) Net income (loss) attributable to common stockholders $ (3,257) $
5,239 ($ in thousands)

GAAP Reconciliation of FFO, Normalized FFO, AFFO and Normalized FAD 25 Primarily includes insurance
recoveries and casualty related charges.Includes amortization of deferred community fees and other, which includes the net change in deferred community fees and other rent discounts or incentives. 2Q20 Net loss attributable to common
stockholders $ (3,257) Add (Deduct): Depreciation and amortization 16,782 FFO $ 13,525 FFO per Diluted Share $ 0.16 Acquisition, transaction and integration expense 19 Compensation expense related to transition
awards 295 Other income(1) 461 Normalized FFO $ 14,300 Normalized FFO per Diluted Share $ 0.17 Straight-line rent (108) Amortization of deferred financing costs 872 Amortization of deferred community fees and
other(2) (432) Amortization of equity-based compensation 1,428 AFFO $ 16,060 AFFO per Diluted Share $ 0.19 Routine capital expenditures (788) Normalized FAD $ 15,272 Normalized FAD per Diluted Share $ 0.18 Weighted
average diluted shares outstanding 82,752 ($ and shares in thousands, except per share data)

Glossary Cash NOI MarginCash NOI margin is equal to Cash NOI divided by Cash Revenue.Discontinued
OperationsDiscontinued operations consists of 28 AL/MC properties that represented the entire Managed AL/MC Properties segment prior to the fourth quarter of 2019 and were classified as discontinued operations as of December 31, 2019. The
properties were subsequently sold in February 2020. EBITDARMEBITDARM is a non-GAAP measure that represents earnings before interest, taxes, depreciation, amortization, rent and management fees for the period stated unless otherwise noted. We
use EBITDARM in determining coverage and as a supplemental measure of the ability of the property to generate sufficient liquidity to meet related obligations to us. For our triple net lease portfolio, all facility financial performance data
was derived solely from information provided by operators/tenants without independent verification by us. EBITDARM does not represent net income or cash flow from operations and should not be considered an alternative to those indications.
EBITDARM CoverageFacility EBITDARM divided by the aggregate of base rent and any additional rent due to us for the same period. EBITDARM coverage is a supplemental measure of a property’s ability to generate cash flows for the operator/tenant
(not for us) to meet the operator’s/tenant’s related rent and other obligations to us. Enterprise ValueEnterprise value is equal to market capitalization plus carrying value of mortgage notes payable, minus cash. FFO, Normalized FFO, AFFO and
Normalized FADWe use Funds From Operations ("FFO") and Normalized FFO as supplemental measures of our operating performance. We use the National Association of Real Estate Investment Trusts ("NAREIT") definition of FFO. NAREIT defines FFO as
GAAP net income (loss) attributable to common stockholders, which includes loss from discontinued operations, excluding gains (losses) from sales of depreciable real estate assets and impairment charges of depreciable real estate, plus real
estate depreciation and amortization, and after adjustments for unconsolidated entities and joint ventures to reflect FFO on the same basis. FFO does not account for debt principal payments and is not intended as a measure of a REIT’s ability
to satisfy such payments or any other cash requirements. FFO, Normalized FFO, AFFO and Normalized FAD (continued)Normalized FFO, as defined below, measures the financial performance of our portfolio of assets excluding items that, although
incidental to, are not reflective of the day-to-day operating performance of our portfolio of assets. We believe that Normalized FFO is useful because it facilitates the evaluation of our portfolio’s operating performance (i) between periods on
a consistent basis and (ii) to the operating performance of other real estate companies. However, comparability may be limited because our calculation of Normalized FFO may differ significantly from that of other companies, or because of
features of our business that are not present in other companies.We define Normalized FFO as FFO excluding the following income and expense items, as applicable: (a) acquisition, transaction and integration related expenses; (b) the write off
of unamortized discounts, premiums, deferred financing costs, or additional costs, make whole payments and penalties or premiums incurred as the result of early repayment of debt (collectively “Gain (Loss) on extinguishment of debt”); (c)
incentive compensation recognized as a result of sales of real estate; (d) the remeasurement of deferred tax assets; (e) valuation allowance on deferred tax assets, net; (f) termination fee to Former affiliate; (g) gain on lease termination;
(h) compensation expense related to transition awards; (i) litigation proceeds; and (j) other items that we believe are not indicative of operating performance, generally reported as “Other (income) expense” in the Consolidated Statements of
Operations. We also use AFFO and Normalized FAD as supplemental measures of our operating performance. We believe AFFO is useful because it facilitates the evaluation of (i) the current economic return on our portfolio of assets between periods
on a consistent basis and (ii) our portfolio versus those of other real estate companies that report AFFO. However, comparability may be limited because our calculation of AFFO may differ significantly from that of other companies, or because
of features of our business that are not present in other companies. We define AFFO as Normalized FFO excluding the impact of the following: (a) straight-line rents; (b) amortization of above / below market lease intangibles; (c) amortization
of deferred financing costs; (d) amortization of premium or discount on mortgage notes payable; (e) amortization of deferred community fees and other, which includes the net change in deferred community fees and other rent discounts or
incentives and (f) amortization of equity-based compensation expense. 26

Glossary FFO, Normalized FFO, AFFO and Normalized FAD (continued)We define Normalized FAD as AFFO less
routine capital expenditures, which we view as a cost associated with the current economic return. Normalized FAD, which does not reflect debt principal payments and certain other expenses, does not represent cash available for distribution to
stockholders. We believe Normalized FAD is useful because it fully reflects the additional economic costs of maintaining the condition of the portfolio.Gross Assets The carrying amount of total assets, after adding back accumulated depreciation
and amortization, as reported in our consolidated financial statements. Investment Represents the carrying amount of real estate assets, including intangibles, after adding back accumulated depreciation and amortization, for all assets owned as
of the end of the respective reporting period. Net Operating Income (“NOI”) and Cash NOINOI and cash NOI are non-GAAP measures. We define NOI as total revenue less property operating expenses, which include property management fees and travel
cost reimbursements. Cash receipts may differ due to straight-line recognition of certain rental income and the application of other GAAP policies. We define cash NOI as NOI excluding the effects of straight-line rental revenue, amortization of
above / below market lease intangibles and amortization of deferred community fees and other, which includes the net change in deferred community fees and other rent discounts or incentives. We believe that NOI and cash NOI serve as useful
supplemental measures to net income because they allow investors, analysts and management to measure unlevered property-level operating results and to compare our operating results between periods and to the operating results of other real
estate companies on a consistent basis. 27 Occupancy For the managed portfolio, occupancy represents the facilities’ average operating occupancy for the applicable period. For the triple net lease portfolio, occupancy is based on the period
reported unless otherwise noted. The percentages are calculated based on available beds. All occupancy data was derived solely from information provided by operators/tenants without independent verification by us. RevPORRepresents average cash
revenues per occupied bed per month. We use RevPOR to evaluate the revenue generating potential of our senior housing portfolio independent of fluctuating occupancy rates.Same Store and Adjusted Same StoreSame store data presented herein
excludes properties acquired, sold, transitioned to other operators or between segments, or classified as held for sale or discontinued operations during the comparable periods. Same store data is intended to enable management to evaluate the
performance of a consistent portfolio of real estate in a manner that eliminates variances attributable to changes in the composition of our portfolio over time, due to sales and various other factors. Upon implementation of ASC 842 on
1/1/2019, bad debt expense is required to offset revenue as opposed to being included in operating expense under previous guidance. Accordingly, we have reclassified bad debt expense for prior years to offset revenue in order to facilitate a
historical comparison. The change has no impact on the Company’s NOI or Cash NOI.Adjusted same store cash NOI adjusts same store cash NOI to include properties transitioned from the Company’s triple net lease segment to the managed segment
during the comparative periods. For the period during which the properties were owned on a triple net basis, cash NOI reflects the unaudited operating results provided by the operator, as opposed to the rent recorded by the Company, and
excludes ancillary service revenue attributable to a business that ceased operations over the course of 2018.