Attached files
| file | filename |
|---|---|
| EX-99.1 - EX-99.1 - UNIFI INC | ufi-ex991_30.htm |
| 8-K - 8-K - UNIFI INC | ufi-8k_20200806.htm |
Fourth Quarter and Fiscal Year Ended June 28, 2020 (Unaudited Results) August 6, 2020 Conference Call Presentation Exhibit 99.2
Cautionary Statement on Forward-Looking Statements Certain statements included herein contain “forward-looking statements” within the meaning of federal securities laws about the financial condition and results of operations of the Company that are based on management’s beliefs, assumptions and expectations about our future economic performance, considering the information currently available to management. An example of such forward-looking statements include, among others, guidance pertaining to our financial outlook. The words “believe,” “may,” “could,” “will,” “should,” “would,” “anticipate,” “plan,” “estimate,” “project,” “expect,” “intend,” “seek,” “strive” and words of similar import, or the negative of such words, identify or signal the presence of forward-looking statements. These statements are not statements of historical fact, and they involve risks and uncertainties that may cause our actual results, performance or financial condition to differ materially from the expectations of future results, performance or financial condition that we express or imply in any forward-looking statement. Factors that could contribute to such differences include, but are not limited to: the competitive nature of the textile industry and the impact of global competition; changes in the trade regulatory environment and governmental policies and legislation; the availability, sourcing and pricing of raw materials; general domestic and international economic and industry conditions in markets where the Company competes, including economic and political factors over which the Company has no control; changes in consumer spending, customer preferences, fashion trends and end uses for products; the financial condition of the Company’s customers; the loss of a significant customer or brand partner; natural disasters, industrial accidents, power or water shortages, extreme weather conditions and other disruptions at one of our facilities; the disruption of operations, global demand, or financial performance as a result of catastrophic or extraordinary events, including epidemics or pandemics such as the recent strain of coronavirus; the success of the Company’s strategic business initiatives; the volatility of financial and credit markets; the ability to service indebtedness and fund capital expenditures and strategic business initiatives; the availability of and access to credit on reasonable terms; changes in foreign currency exchange, interest and inflation rates; fluctuations in production costs; the ability to protect intellectual property; the strength and reputation of our brands; employee relations; the ability to attract, retain and motivate key employees; the impact of environmental, health and safety regulations; the impact of tax laws, the judicial or administrative interpretations of tax laws and/or changes in such laws or interpretations; the operating performance of joint ventures and other equity method investments; and the accurate financial reporting of information from equity method investees. All such factors are difficult to predict, contain uncertainties that may materially affect actual results and may be beyond our control. New factors emerge from time to time, and it is not possible for management to predict all such factors or to assess the impact of each such factor on the Company. Any forward-looking statement speaks only as of the date on which such statement is made, and we do not undertake any obligation to update any forward-looking statement to reflect events or circumstances after the date on which such statement is made, except as may be required by federal securities laws. The above and other risks and uncertainties are described in the Company’s most recent Annual Report on Form 10-K, and additional risks or uncertainties may be described from time to time in other reports filed by the Company with the Securities and Exchange Commission pursuant to the Securities Exchange Act of 1934, as amended. Non-GAAP Financial Measures Certain non-GAAP financial measures are designed to complement the financial information presented in accordance with GAAP. These non-GAAP financial measures include Earnings Before Interest, Taxes, Depreciation and Amortization (“EBITDA”), Adjusted EBITDA, Adjusted Net (Loss) Income, Adjusted EPS, Adjusted Working Capital and Net Debt (collectively, the “non-GAAP financial measures”). • EBITDA represents Net (loss) income before net interest expense, income tax expense, and depreciation and amortization expense. • Adjusted EBITDA represents EBITDA adjusted to exclude equity in loss (earnings) of Parkdale America, LLC (“PAL”) and, from time to time, certain other adjustments necessary to understand and compare the underlying results of the Company. • Adjusted Net (Loss) Income, which represents Net (loss) income calculated under GAAP, adjusted to exclude certain amounts which management believes do not reflect the ongoing operations and performance of UNIFI and/or which are necessary to understand and compare the underlying results of UNIFI; • Adjusted EPS, which represents Adjusted Net (Loss) Income divided by UNIFI’s weighted average common shares outstanding; • Adjusted Working Capital represents receivables plus inventory and other current assets, less accounts payable and accrued expenses, which is an indicator of the Company’s production efficiency and ability to manage its inventory and receivables. • Net Debt represents debt principal less cash and cash equivalents. The non-GAAP financial measures are not determined in accordance with GAAP and should not be considered a substitute for performance measures determined in accordance with GAAP. The calculations of the non-GAAP financial measures are subjective, based on management’s belief as to which items should be included or excluded in order to provide the most reasonable and comparable view of the underlying operating performance of the business. The Company may, from time to time, modify the amounts used to determine its non-GAAP financial measures. We believe that these non-GAAP financial measures better reflect the Company’s underlying operations and performance and that their use, as operating performance measures, provides investors and analysts with a measure of operating results unaffected by differences in capital structures, capital investment cycles and ages of related assets, among otherwise comparable companies. Management uses Adjusted EBITDA (i) as a measurement of operating performance because it assists us in comparing our operating performance on a consistent basis, as it removes the impact of (a) items directly related to our asset base (primarily depreciation and amortization) and (b) items that we would not expect to occur as a part of our normal business on a regular basis; (ii) for planning purposes, including the preparation of our annual operating budget; (iii) as a valuation measure for evaluating our operating performance and our capacity to incur and service debt, fund capital expenditures and expand our business; and (iv) as one measure in determining the value of other acquisitions and dispositions. Adjusted EBITDA is a key performance metric utilized in the determination of variable compensation. We also believe Adjusted EBITDA is an appropriate supplemental measure of debt service capacity, because it serves as a high-level proxy for cash generated from operations. Equity in loss (earnings) of PAL is excluded from Adjusted EBITDA because such results do not reflect our operating performance. Management uses Adjusted Net (Loss) Income and Adjusted EPS (i) as measurements of net operating performance because they assist us in comparing such performance on a consistent basis, as they remove the impact of (a) items that we would not expect to occur as a part of our normal business on a regular basis and (b) components of the provision for income taxes that we would not expect to occur as a part of our underlying taxable operations; (ii) for planning purposes, including the preparation of our annual operating budget; and (iii) as measures in determining the value of other acquisitions and dispositions. Management uses Adjusted Working Capital as an indicator of the Company’s production efficiency and ability to manage inventory and receivables. In the first quarter of fiscal 2019, in connection with changes to balance sheet presentation required by the adoption of new revenue recognition guidance, the Company updated the definition of Adjusted Working Capital to include Other current assets for current and historical calculations of the non-GAAP financial measure. Other current assets includes amounts capitalized for future conversion into inventory or receivables (e.g., vendor deposits and contract assets), and management believes that its inclusion in the definition of Adjusted Working Capital improves the understanding of the Company’s capital that is supporting production and sales activity. Management uses Net Debt as a liquidity and leverage metric to determine how much debt would remain if all cash and cash equivalents were used to pay down debt principal. In evaluating non-GAAP financial measures, investors should be aware that, in the future, we may incur expenses similar to the adjustments included herein. Our presentation of non-GAAP financial measures should not be construed as indicating that our future results will be unaffected by unusual or non-recurring items. Each of our non-GAAP financial measures has limitations as an analytical tool, and you should not consider it in isolation or as a substitute for analysis of our results or liquidity measures as reported under GAAP. Some of these limitations are (i) it is not adjusted for all non-cash income or expense items that are reflected in our statements of cash flows; (ii) it does not reflect the impact of earnings or charges resulting from matters we consider not indicative of our ongoing operations; (iii) it does not reflect changes in, or cash requirements for, our working capital needs; (iv) it does not reflect the cash requirements necessary to make payments on our debt; (v) it does not reflect our future requirements for capital expenditures or contractual commitments; (vi) it does not reflect limitations on or costs related to transferring earnings from our subsidiaries to us; and (vii) other companies in our industry may calculate this measure differently than we do, limiting its usefulness as a comparative measure. Because of these limitations, these non-GAAP financial measures should not be considered as a measure of discretionary cash available to us to invest in the growth of our business or as a measure of cash that will be available to us to meet our obligations, including those under our outstanding debt obligations. You should compensate for these limitations by relying primarily on our GAAP results and using these measures only as supplemental information.
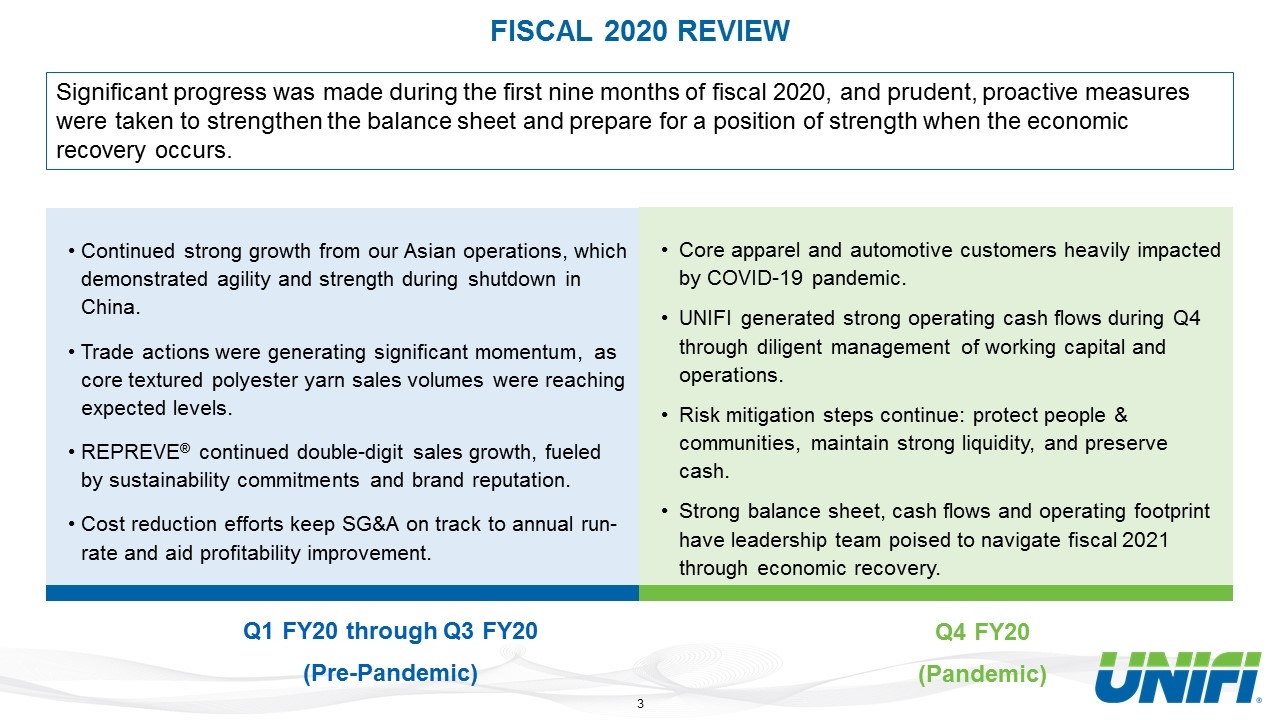
Core apparel and automotive customers heavily impacted by COVID-19 pandemic. UNIFI generated strong operating cash flows during Q4 through diligent management of working capital and operations. Risk mitigation steps continue: protect people & communities, maintain strong liquidity, and preserve cash. Strong balance sheet, cash flows and operating footprint have leadership team poised to navigate fiscal 2021 through economic recovery. Continued strong growth from our Asian operations, which demonstrated agility and strength during shutdown in China. Trade actions were generating significant momentum, as core textured polyester yarn sales volumes were reaching expected levels. REPREVE® continued double-digit sales growth, fueled by sustainability commitments and brand reputation. Cost reduction efforts keep SG&A on track to annual run-rate and aid profitability improvement. Q1 FY20 through Q3 FY20 (Pre-Pandemic) Q4 FY20 (Pandemic) FISCAL 2020 REVIEW Significant progress was made during the first nine months of fiscal 2020, and prudent, proactive measures were taken to strengthen the balance sheet and prepare for a position of strength when the economic recovery occurs.
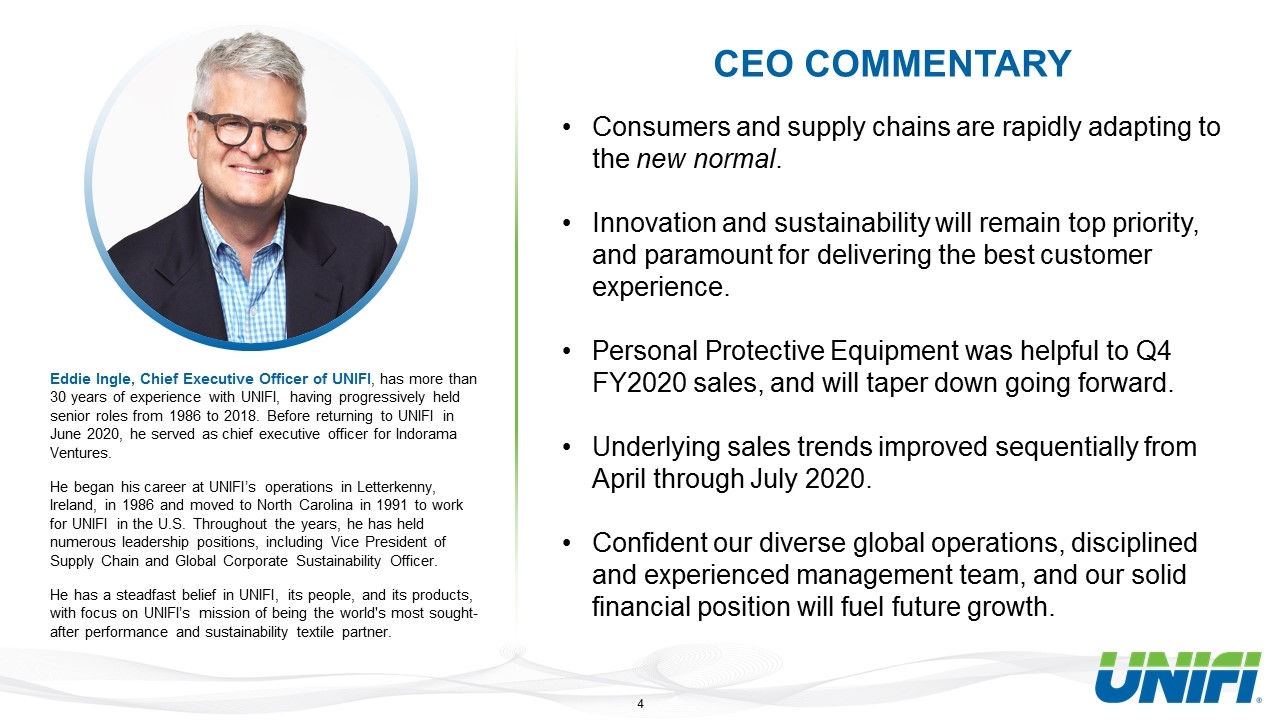
CEO COMMENTARY Consumers and supply chains are rapidly adapting to the new normal. Innovation and sustainability will remain top priority, and paramount for delivering the best customer experience. Personal Protective Equipment was helpful to Q4 FY2020 sales, and will taper down going forward. Underlying sales trends improved sequentially from April through July 2020. Confident our diverse global operations, disciplined and experienced management team, and our solid financial position will fuel future growth. Eddie Ingle, Chief Executive Officer of UNIFI, has more than 30 years of experience with UNIFI, having progressively held senior roles from 1986 to 2018. Before returning to UNIFI in June 2020, he served as chief executive officer for Indorama Ventures. He began his career at UNIFI’s operations in Letterkenny, Ireland, in 1986 and moved to North Carolina in 1991 to work for UNIFI in the U.S. Throughout the years, he has held numerous leadership positions, including Vice President of Supply Chain and Global Corporate Sustainability Officer. He has a steadfast belief in UNIFI, its people, and its products, with focus on UNIFI’s mission of being the world's most sought-after performance and sustainability textile partner.
PARKDALE TRANSACTION OVERVIEW $60,000 cash received on April 29, 2020 from divestiture of 34% investment via sale to majority partner, Parkdale, Incorporated: Transaction improved Net Debt by $60,000 and significantly improves leverage. Proceeds were applied in part to reduce ABL Revolver, with remainder held as cash-on-hand. Amendment to Credit Facility to allow for investment sale and desired use of proceeds completed simultaneously with sale transaction. Cash proceeds: Provide additional flexibility and liquidity for both long-term opportunities and uncertainty associated with the current pandemic. Combined with Q4 FY20 cash generation to reduce ABL Revolver balance to zero during May 2020. (dollars in thousands)
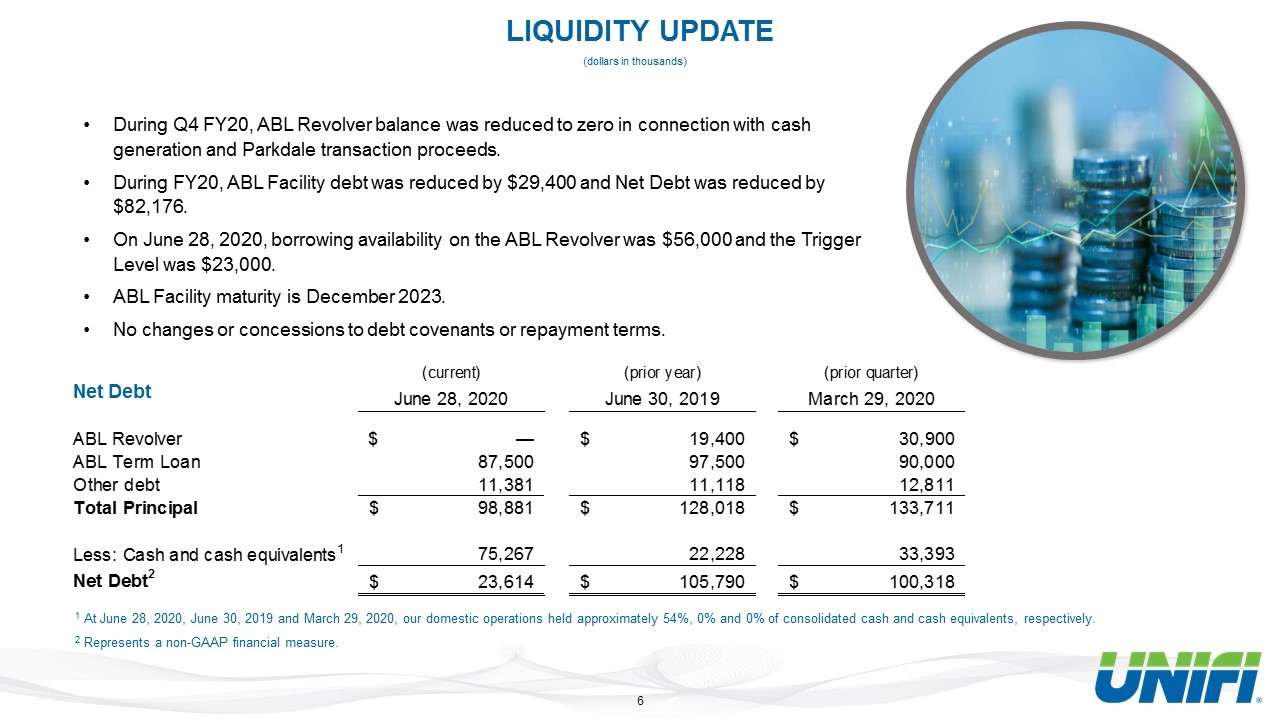
LIQUIDITY UPDATE (dollars in thousands) Net Debt 1 At June 28, 2020, June 30, 2019 and March 29, 2020, our domestic operations held approximately 54%, 0% and 0% of consolidated cash and cash equivalents, respectively. 2 Represents a non-GAAP financial measure. During Q4 FY20, ABL Revolver balance was reduced to zero in connection with cash generation and Parkdale transaction proceeds. During FY20, ABL Facility debt was reduced by $29,400 and Net Debt was reduced by $82,176. On June 28, 2020, borrowing availability on the ABL Revolver was $56,000 and the Trigger Level was $23,000. ABL Facility maturity is December 2023. No changes or concessions to debt covenants or repayment terms.
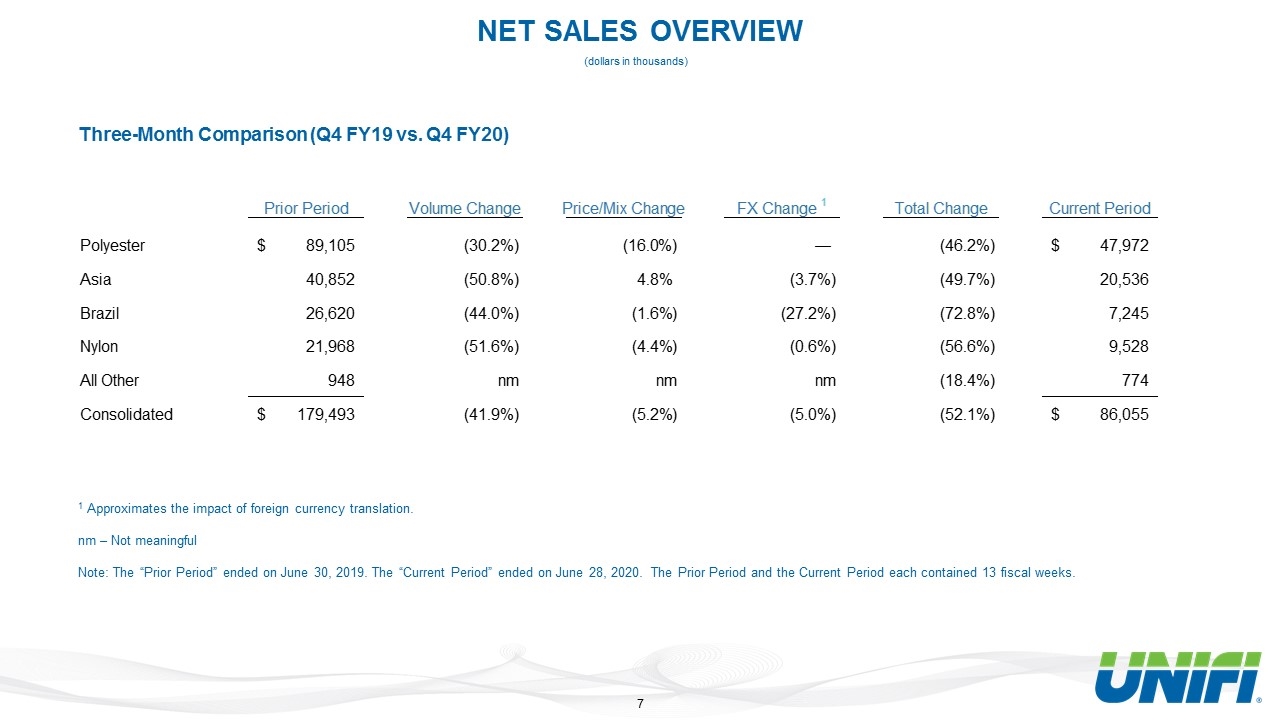
NET SALES OVERVIEW (dollars in thousands) Three-Month Comparison (Q4 FY19 vs. Q4 FY20) 1 Approximates the impact of foreign currency translation. nm – Not meaningful Note: The “Prior Period” ended on June 30, 2019. The “Current Period” ended on June 28, 2020. The Prior Period and the Current Period each contained 13 fiscal weeks.
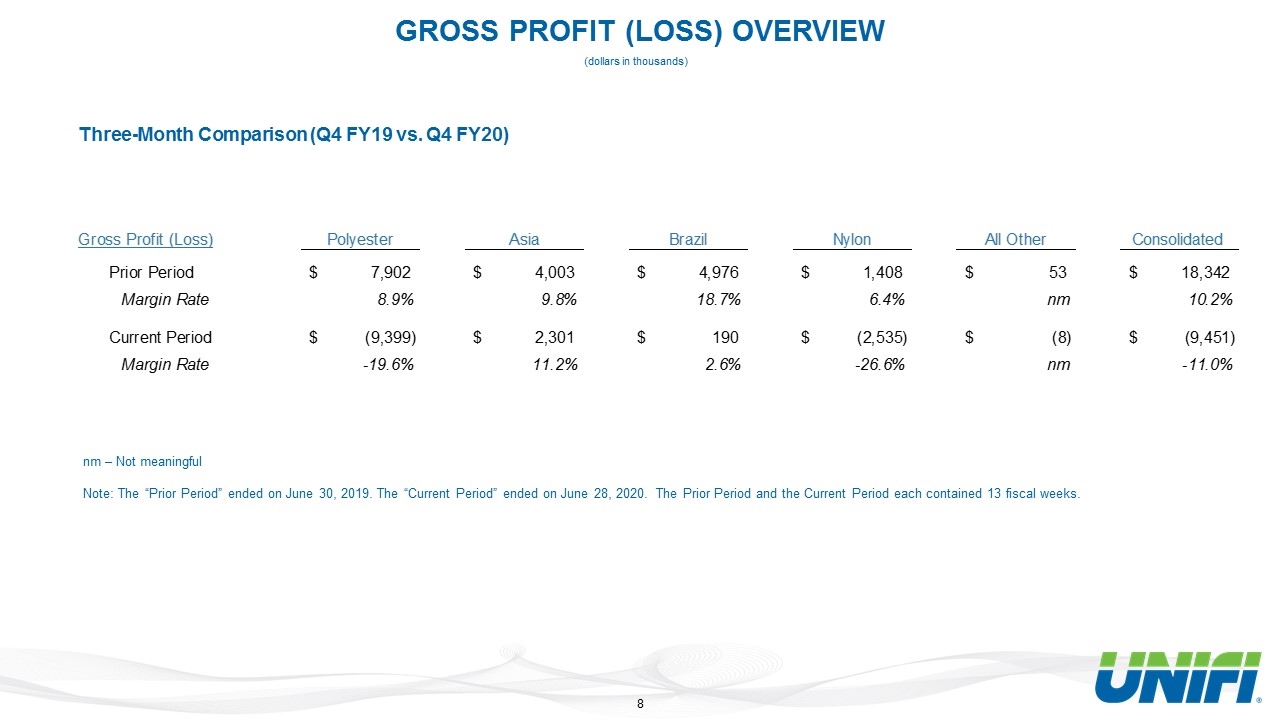
GROSS PROFIT (LOSS) OVERVIEW nm – Not meaningful Note: The “Prior Period” ended on June 30, 2019. The “Current Period” ended on June 28, 2020. The Prior Period and the Current Period each contained 13 fiscal weeks. (dollars in thousands) Three-Month Comparison (Q4 FY19 vs. Q4 FY20)
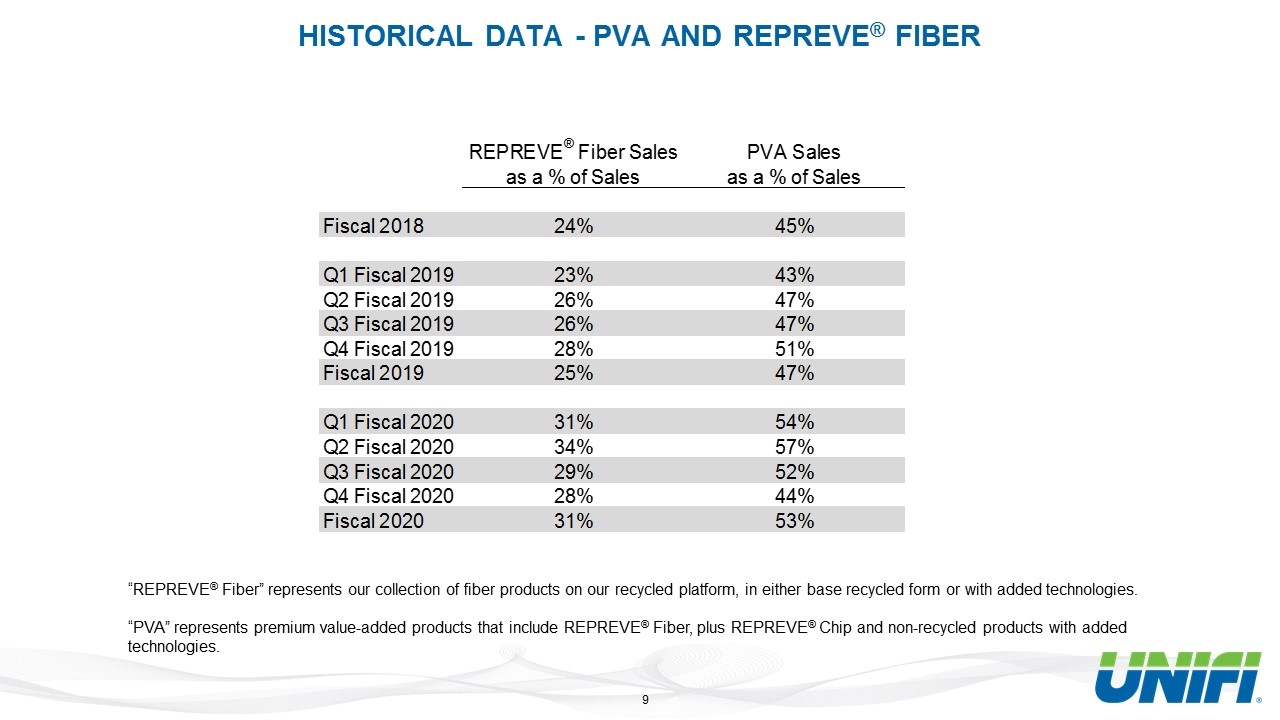
HISTORICAL DATA - PVA AND REPREVE® FIBER “REPREVE® Fiber” represents our collection of fiber products on our recycled platform, in either base recycled form or with added technologies. “PVA” represents premium value-added products that include REPREVE® Fiber, plus REPREVE® Chip and non-recycled products with added technologies.
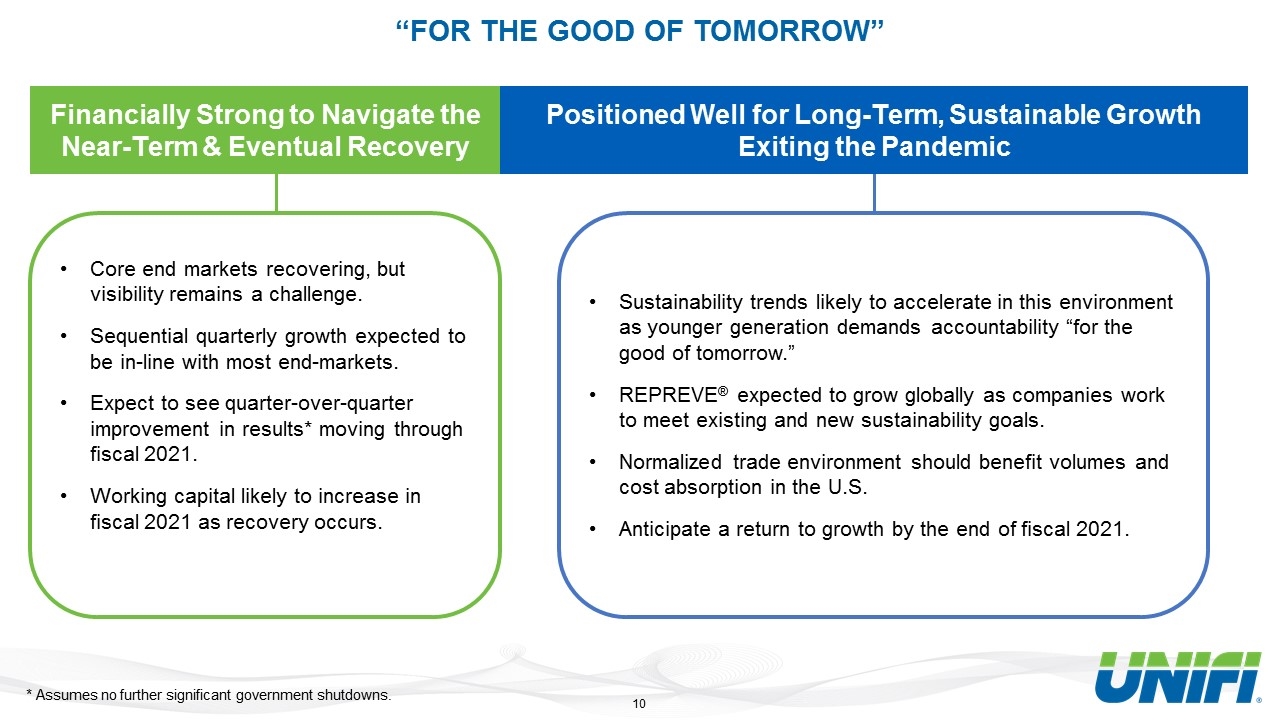
Sustainability trends likely to accelerate in this environment as younger generation demands accountability “for the good of tomorrow.” REPREVE® expected to grow globally as companies work to meet existing and new sustainability goals. Normalized trade environment should benefit volumes and cost absorption in the U.S. Anticipate a return to growth by the end of fiscal 2021. Core end markets recovering, but visibility remains a challenge. Sequential quarterly growth expected to be in-line with most end-markets. Expect to see quarter-over-quarter improvement in results* moving through fiscal 2021. Working capital likely to increase in fiscal 2021 as recovery occurs. Financially Strong to Navigate the Near-Term & Eventual Recovery Positioned Well for Long-Term, Sustainable Growth Exiting the Pandemic “FOR THE GOOD OF TOMORROW” * Assumes no further significant government shutdowns.
APPENDIX
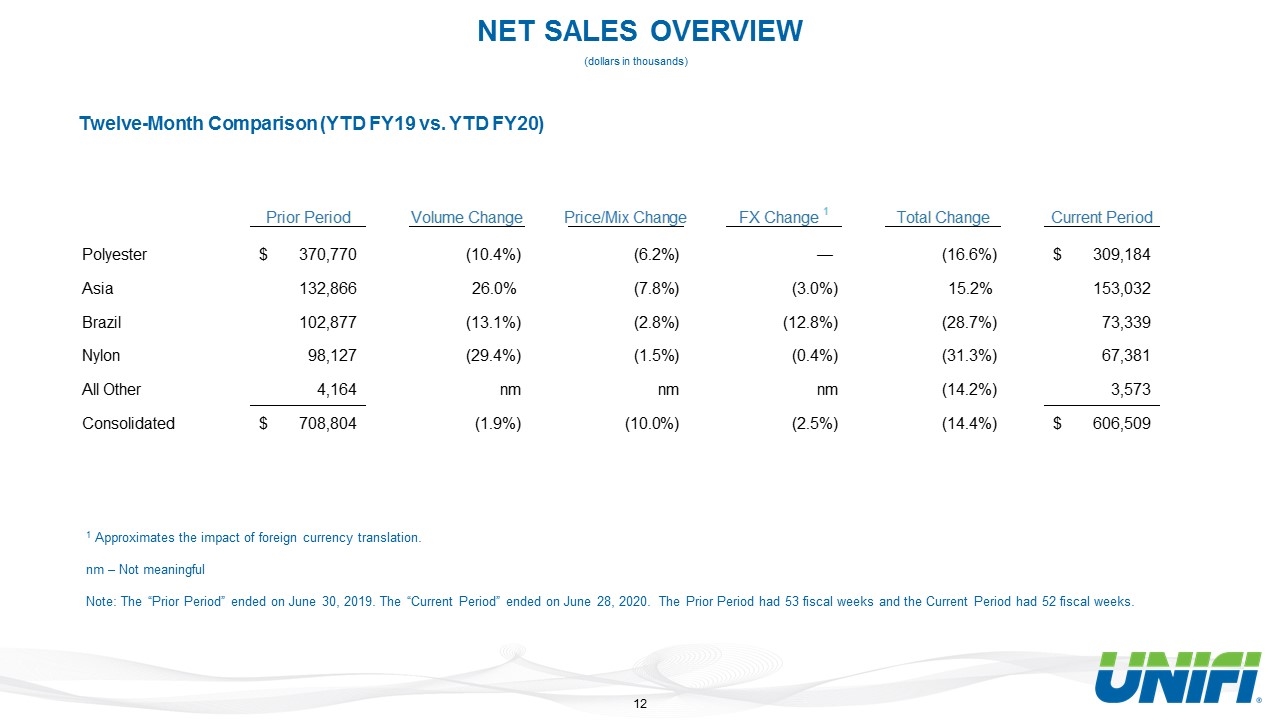
NET SALES OVERVIEW Twelve-Month Comparison (YTD FY19 vs. YTD FY20) 1 Approximates the impact of foreign currency translation. nm – Not meaningful Note: The “Prior Period” ended on June 30, 2019. The “Current Period” ended on June 28, 2020. The Prior Period had 53 fiscal weeks and the Current Period had 52 fiscal weeks. (dollars in thousands)
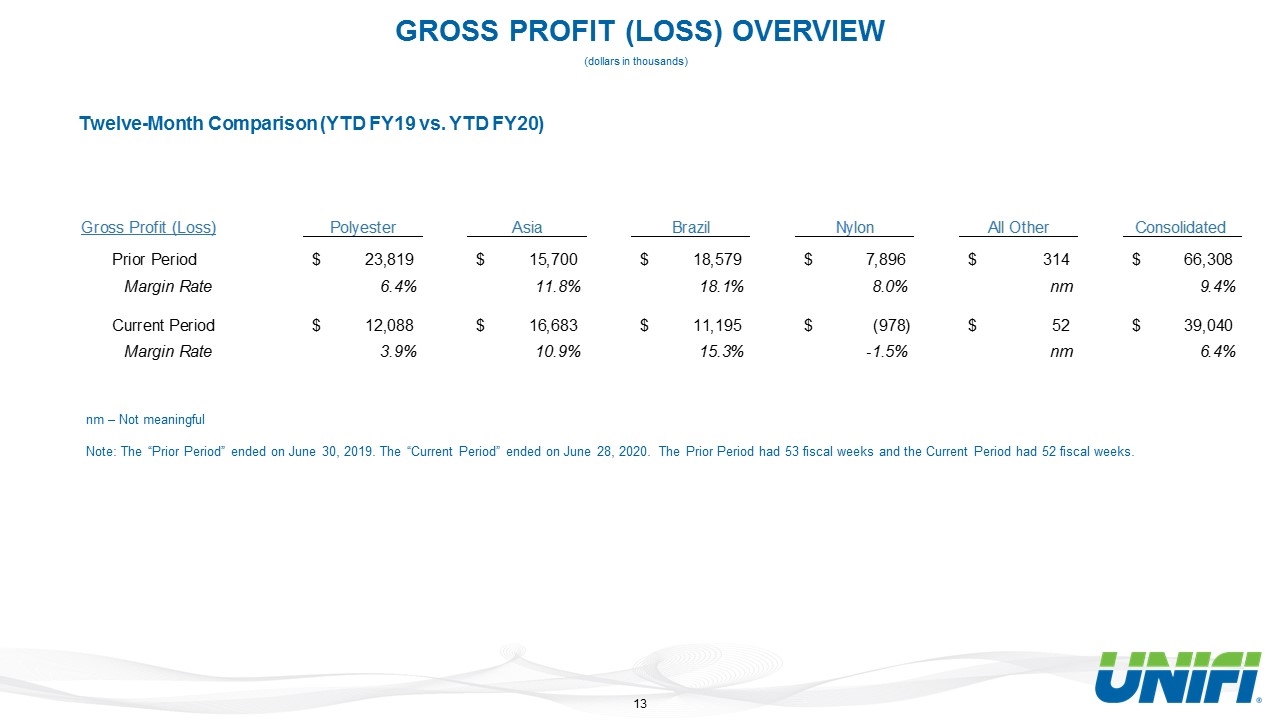
GROSS PROFIT (LOSS) OVERVIEW Twelve-Month Comparison (YTD FY19 vs. YTD FY20) (dollars in thousands) nm – Not meaningful Note: The “Prior Period” ended on June 30, 2019. The “Current Period” ended on June 28, 2020. The Prior Period had 53 fiscal weeks and the Current Period had 52 fiscal weeks.

Thank You!
