Attached files
| file | filename |
|---|---|
| EX-32.2 - EXHIBIT 32.2 - UNIFI INC | ex32-2.htm |
| EX-32.1 - EXHIBIT 32.1 - UNIFI INC | ex32-1.htm |
| EX-31.2 - EXHIBIT 31.2 - UNIFI INC | ex31-2.htm |
| EX-31.1 - EXHIBIT 31.1 - UNIFI INC | ex31-1.htm |
| EX-23.1 - EXHIBIT 23.1 - UNIFI INC | ex23-1.htm |
| EX-21.1 - EXHIBIT 21.1 - UNIFI INC | ex21-1.htm |
| EX-10.20 - EXHIBIT 10.20 - UNIFI INC | ex10-20.htm |
UNITED STATES
SECURITIES AND EXCHANGE COMMISSION
Washington, D.C. 20549
FORM 10-K
[X] ANNUAL REPORT PURSUANT TO SECTION 13 OR 15(d) OF
THE SECURITIES EXCHANGE ACT OF 1934
For the fiscal year ended June 26, 2016
OR
[ ] TRANSITION REPORT PURSUANT TO SECTION 13 OR 15(d) OF
THE SECURITIES EXCHANGE ACT OF 1934
For the transition period from _____to_____
Commission file number: 1-10542
UNIFI, INC.
(Exact name of registrant as specified in its charter)
|
New York |
11-2165495 |
|
(State or other jurisdiction of |
(I.R.S. Employer |
|
incorporation or organization) |
Identification No.) |
7201 West Friendly Avenue
Greensboro, North Carolina 27410
(Address of principal executive offices)(Zip Code)
Registrant’s telephone number, including area code: (336) 294-4410
Securities registered pursuant to Section 12(b) of the Act:
|
Title of each class |
Name of each exchange on which registered |
|
Common Stock |
New York Stock Exchange |
Securities registered pursuant to Section 12(g) of the Act:
None
Indicate by check mark if the registrant is a well-known seasoned issuer, as defined in Rule 405 of the Securities Act. Yes [ ] No [X]
Indicate by check mark if the registrant is not required to file reports pursuant to Section 13 or Section 15(d) of the Act. Yes [ ] No [X]
Indicate by check mark whether the registrant (1) has filed all reports required to be filed by Section 13 or 15(d) of the Securities Exchange Act of 1934 during the preceding 12 months (or for such shorter period that the registrant was required to file such reports), and (2) has been subject to such filing requirements for the past 90 days. Yes [X] No [ ]
Indicate by check mark whether the registrant has submitted electronically and posted on its corporate Web site, if any, every Interactive Data File required to be submitted and posted pursuant to Rule 405 of Regulation S-T (§232.405 of this chapter) during the preceding 12 months (or for such shorter period that the registrant was required to submit and post such files). Yes [X] No [ ]
Indicate by check mark if disclosure of delinquent filers pursuant to Item 405 of Regulation S-K (§229.405 of this chapter) is not contained herein, and will not be contained, to the best of registrant’s knowledge, in definitive proxy or information statements incorporated by reference in Part III of this Form 10-K or any amendment to this Form 10-K. [X]
Indicate by check mark whether the registrant is a large accelerated filer, an accelerated filer, a non-accelerated filer or a smaller reporting company. See the definitions of “large accelerated filer,” “accelerated filer” and “smaller reporting company” in Rule 12b-2 of the Exchange Act.
|
Large accelerated filer ☐ |
Accelerated filer ☒ |
|
Non-accelerated filer ☐ (Do not check if a smaller reporting company) |
Smaller reporting company ☐ |
Indicate by check mark whether the registrant is a shell company (as defined in Rule 12b-2 of the Act). Yes [ ] No [X]
As of December 24, 2015, the aggregate market value of the registrant’s voting common stock held by non-affiliates of the registrant was approximately $463,197,360. The registrant has no non-voting stock.
As of August 18, 2016, the number of shares of the registrant’s common stock outstanding was 17,975,945.
DOCUMENTS INCORPORATED BY REFERENCE
Portions of the registrant’s definitive proxy statement to be filed with the Securities and Exchange Commission in connection with the solicitation of proxies for its 2016 Annual Meeting of Shareholders are incorporated by reference in Part III of this Form 10-K.
FORWARD-LOOKING STATEMENTS
This Annual Report on Form 10-K contains forward-looking statements within the meaning of Section 27A of the Securities Act of 1933, as amended, and Section 21E of the Securities Exchange Act of 1934, as amended, that relate to our plans, objectives, estimates and goals. Statements expressing expectations regarding our future, or projections or estimates relating to products, sales, revenues, expenditures, costs or earnings, are typical of such statements and are made under the Private Securities Litigation Reform Act of 1995. Forward-looking statements are based on management’s beliefs, assumptions and expectations about our future economic performance, considering the information currently available to management. The words “believe,” “may,” “could,” “will,” “should,” “would,” “anticipate,” “estimate,” “project,” “expect,” “intend,” “seek,” “strive” and words of similar import, or the negative of such words, identify or signal the presence of forward-looking statements. These statements are not statements of historical fact; they involve risks and uncertainties that may cause our actual results, performance or financial condition to differ materially from the expectations of future results, performance or financial condition that we express or imply in any forward-looking statement. Factors that could contribute to such differences include, but are not limited to:
|
● |
the competitive nature of the textile industry and the impact of global competition; |
|
● |
changes in the trade regulatory environment and governmental policies and legislation; |
|
● |
the availability, sourcing and pricing of raw materials; |
|
● |
general domestic and international economic and industry conditions in markets where the Company competes, including economic and political factors over which the Company has no control; |
|
● |
changes in consumer spending, customer preferences, fashion trends and end-uses for products; |
|
● |
the financial condition of the Company’s customers; |
|
● |
the loss of a significant customer; |
|
● |
the success of the Company’s strategic business initiatives; |
|
● |
volatility of financial and credit markets; |
|
● |
the ability to service indebtedness and fund capital expenditures and strategic initiatives; |
|
● |
availability of and access to credit on reasonable terms; |
|
● |
changes in currency exchange, interest and inflation rates; |
|
● |
fluctuations in production costs; |
|
● |
the ability to protect intellectual property; |
|
● |
employee relations; |
|
● |
the impact of environmental, health and safety regulations; |
|
● |
the operating performance of joint ventures and other equity investments; |
|
● |
the accurate financial reporting of information from equity method investees; and |
|
● |
other factors discussed below in “Item 1A. Risk Factors” or the Company’s other periodic reports and information filed with the Securities and Exchange Commission. |
All such factors are difficult to predict, contain uncertainties that may materially affect actual results and may be beyond our control. New factors emerge from time to time, and it is not possible for management to predict all such factors or to assess the impact of each such factor on the Company. Any forward-looking statement speaks only as of the date on which such statement is made, and we do not undertake any obligation to update any forward-looking statement to reflect events or circumstances after the date on which such statement is made, except as may be required by federal securities law.
In light of all the above considerations, we reiterate that forward-looking statements are not guarantees of future performance, and we caution you not to rely on them as such.
UNIFI, INC.
ANNUAL REPORT ON FORM 10-K
FOR THE FISCAL YEAR ENDED JUNE 26, 2016
TABLE OF CONTENTS
|
Page | ||
|
Item 1. |
1 | |
|
Item 1A. |
10 | |
|
Item 1B. |
13 | |
|
Item 2. |
13 | |
|
Item 3. |
14 | |
|
Item 4. |
14 | |
| 14 | ||
|
Item 5. |
14 | |
|
Item 6. |
17 | |
|
Item 7. |
Management’s Discussion and Analysis of Financial Condition and Results of Operations |
19 |
|
Item 7A. |
44 | |
|
Item 8. |
45 | |
|
Item 9. |
Changes in and Disagreements With Accountants on Accounting and Financial Disclosure |
45 |
|
Item 9A. |
45 | |
|
Item 9B. |
46 | |
|
Item 10. |
47 | |
|
Item 11. |
47 | |
|
Item 12. |
Security Ownership of Certain Beneficial Owners and Management and Related Stockholder Matters |
47 |
|
Item 13. |
Certain Relationships and Related Transactions, and Director Independence |
47 |
|
Item 14. |
47 | |
|
Item 15. |
48 | |
| 52 | ||
| 53 | ||
Fiscal Year
The fiscal year end for the Company and its subsidiaries in El Salvador and China occurs on the last Sunday in June. The Company’s fiscal years 2016, 2015 and 2014 ended on June 26, 2016, June 28, 2015 and June 29, 2014, respectively. The Company’s Brazilian and Colombian subsidiaries’ fiscal years end on June 30th. There were no significant transactions or events that occurred between the fiscal year ends of the Company and its subsidiaries. The Company’s fiscal 2016, 2015 and 2014 all consisted of 52 weeks.
Presentation
All dollar and other currency amounts, as well as share amounts (except per share amounts), are presented in thousands (000s), except as otherwise noted.
PART I
Item 1. Business
Unifi, Inc., a New York corporation formed in 1969 (together with its subsidiaries, “we,” the “Company” or “Unifi”), is a multi-national manufacturing company that processes and sells high-volume commodity yarns, specialized yarns designed to meet certain customer specifications, and premium value-added (“PVA”) yarns with enhanced performance characteristics. The Company sells yarns made from polyester and nylon to other yarn manufacturers and knitters and weavers that produce fabric for the apparel, hosiery, home furnishings, automotive upholstery, industrial and other end-use markets. The Company’s polyester products include polyester polymer beads (“Chip”), partially oriented yarn (“POY”), textured, solution and package dyed, twisted, beamed and draw wound yarns. Each polyester product is available in virgin or recycled varieties, where the recycled is made from both pre-consumer yarn waste and post-consumer waste, including plastic bottles. The Company’s nylon products include textured, solution dyed and spandex covered products.
The Company maintains one of the textile industry’s most comprehensive yarn product offerings, and has manufacturing operations in four countries and participates in joint ventures in Israel and the United States (“U.S.”). The Company’s principal geographic markets for its products are in North America, Central America, South America and Asia.
The Company has three reportable segments. Operations and revenues for each segment are described below:
|
● |
The Polyester Segment manufactures Chip, POY, textured, dyed, twisted, beamed and draw wound yarns, both virgin and recycled, with sales primarily to other yarn manufacturers and knitters and weavers that produce yarn and/or fabric for the apparel, hosiery, home furnishings, automotive upholstery, industrial and other end-use markets. The Polyester Segment consists of sales and manufacturing operations in the U.S. and El Salvador. |
|
● |
The Nylon Segment manufactures textured nylon yarns and spandex covered yarns, with sales to knitters and weavers that produce fabric primarily for the apparel and hosiery markets. The Nylon Segment consists of sales and manufacturing operations in the U.S. and Colombia. |
|
● |
The International Segment’s products primarily include textured polyester and various types of resale yarns and staple fiber, both virgin and recycled. The International Segment sells its yarns and staple fiber to knitters and weavers that produce fabric for the apparel, automotive upholstery, home furnishings, industrial and other end-use markets primarily in the South American and Asian regions. The International Segment includes a manufacturing location and sales offices in Brazil and a sales office in China. |
Other information for the Company’s reportable segments is provided in Note 26 to the Consolidated Financial Statements in this Annual Report on Form 10-K. In addition to the Company’s reportable segments, the Company conducts certain revenue-producing activities outside of its core business, classified within an All Other category. The operations within All Other do not relate to the direct production or sale of yarn and are insignificant to the consolidated financial statements.
In addition to the above consolidated operations, the Company maintains a 34% non-controlling partnership interest in Parkdale America, LLC (“PAL”), a significant unconsolidated affiliate. The investment in PAL provides diversity to the Company’s overall business in response to global textile trends. PAL is a producer of cotton and synthetic yarns for sale to the textile industry and apparel market, both foreign and domestic. PAL is a limited liability company treated as a partnership for income tax reporting purposes.
Principal Strategic and Operating Focus
The Company reported net income of $34,415, or $1.93 per basic share, for fiscal 2016. Such results reflect (i) growth in sales of PVA products, especially in the International Segment, (ii) lower selling, general and administrative (“SG&A”) expenses than in fiscal 2015 and (iii) lower polyester raw material costs than in fiscal 2015. The International Segment, which was resilient in a difficult economic environment, exhibited strength as the year progressed (especially with sales of PVA products), despite unfavorable impacts from devaluation of the Brazilian currency and soft economic conditions in China. Strong PVA sales are expected to continue to drive favorable results in the Americas and Asia.
Core Business Strategies
The Company’s successful performance reflects its core strategic focus: producing the highest quality, innovative and sustainable products for customers around the world. This strategic focus includes a number of supporting pillars, which include: continuously improving all operational and business processes; enriching the product mix by growing sales of higher-margin PVA products through all market opportunities; and deriving value from sustainability-based initiatives, including polyester and nylon recycling. The Company remains committed to these strategic initiatives, which it believes will increase profitability and generate improved cash flows from operations.
PVA Products and REPREVE®
The Company remains committed to growing the business for its PVA products and believes its research and development work with brands and retailers continues to create new, world-wide sales opportunities. The Company believes it can continue to increase its global PVA sales by more than 10% per year to generate overall mix enrichment and margin gains. The Company’s PVA products now represent approximately 35% of consolidated net sales. The Company’s strategy of enhancing its product mix through a focus on PVA products has helped establish the Company as an innovation leader in its core markets and we believe provides insulation from the pressures of low-priced commodity yarn imports.
REPREVE®, the flagship brand in the Company’s PVA portfolio, continues to grow at a faster pace than other PVA products. As part of our efforts to expand consumer brand recognition of REPREVE®, the Company has developed recycling-focused sponsorships with Marvel Universe LIVE!, the National Football League’s Detroit Lions, the University of North Carolina at Chapel Hill and The North Face Endurance Challenge Series. The increasing success and consumer awareness of the REPREVE® brand continues to provide new opportunities for growth, allowing us to expand into new end-uses and markets for REPREVE®, as well as continuing to grow the brand with current customers. The Company continues to expand efforts toward consumer engagement, awareness and activation through the “REPREVE® National Mobile Tour,” a custom truck and trailer designed to travel across the country educating consumers about the importance of recycling and the transformation process of REPREVE®. Since October 2015, the REPREVE® National Mobile Tour has appeared at sponsored events and retailers throughout the U.S.
PVA Expansion and Capital Investments
During fiscal 2016, we invested approximately $60,000 in capital projects, as we (i) neared completion of a bottle processing plant at an existing facility in Reidsville, North Carolina, (ii) commenced another expansion of our REPREVE® Recycling Center which will allow the Company to increase its annual production capacity to approximately 100 million pounds, (iii) enhanced our automation systems in our Yadkinville, North Carolina POY facility to handle an increasingly-complex product mix, (iv) converted machinery to accommodate smaller production runs, and (v) further increased our air jet texturing capacity. These initiatives were designed to support our mix enrichment strategies, while also improving our ability to service customers.
In fiscal 2017, the Company expects to invest approximately $40,000 in capital projects, which includes (i) completing the fourth REPREVE® Recycling Center production line near the end of fiscal 2017, (ii) additional machinery modifications to meet the ever-changing demands of the market and (iii) investments in Asia to support growth as prominent brand and retail partners continue to respond well to our strategy to provide PVA products globally. As always, the Company will continue to ensure maintenance capital expenditures are sufficient to allow continued production at high efficiencies. As the bottle processing plant begins operating in August 2016, our goal is for continued support of REPREVE® by securing a stream of high-quality raw materials. Our pursuit of high quality, combined with technology advancements in recycling that will be incorporated into the fiscal 2017 recycling expansion, will enhance our ability to continue to grow REPREVE® into other markets such as nonwovens, carpet fiber and packaging.
In addition to the Company’s primary capital investment plan, certain business combinations have occurred in fiscal 2015 and 2014. Although such acquisitions do not comprise material business combinations, each has been relevant to the Company’s recent performance, as described below:
|
● |
On December 2, 2013, the Company acquired certain draw winding assets and the associated business for $2,500. The acquisition increased the Company’s polyester production capacity and allowed the Company to expand its product offerings to include mid-tenacity flat yarns. |
|
● |
On August 28, 2014, PAL paid $10,125 to acquire the remaining 50% ownership interest in a yarn manufacturer based in Mexico in which PAL was historically a 50% member. The acquisition increases PAL’s regional manufacturing capacity and expands its product offerings and customer base. PAL recorded acquired net assets of approximately $23,600. |
|
● |
On February 27, 2015, PAL purchased two manufacturing facilities, plus inventory, for approximately $13,000 cash, and entered into a yarn supply agreement with the seller. The acquisition increases PAL’s regional manufacturing capacity and expands its product offerings and customer base. PAL recorded acquired assets of approximately $19,400. |
Developments in Principal Markets
Apparel production is growing in the regions covered by the North American Free Trade Agreement (“NAFTA”) and the Central American Free Trade Agreement (“CAFTA”), which regions comprise the principal markets for the Company’s Polyester and Nylon Segments. The share of apparel production for these regions as a percentage of U.S. retail has stabilized at approximately 18%, while retail consumption has grown, especially for apparel made with synthetic yarns. The CAFTA region, which continues to be a competitive alternative to Asian supply chains for textile products, has maintained its share of synthetic apparel supply to U.S. retailers. The share of synthetic apparel versus cotton apparel has increased and provided growth for the consumption of synthetic yarns within the CAFTA region. The Company expects incremental growth in the CAFTA region for the foreseeable future, as retailers and brands maintain regional sourcing as part of their overall sourcing plans, retail sales grow, and consumer preferences continue to move from cotton to synthetic apparel.
Our Brazilian subsidiary is primarily impacted by price pressures from imported fiber, fabric and finished goods; the inflation rate in Brazil; and devaluation of the Brazilian Real. The Company continues to work on (i) aggressively pursuing mix enrichment by working with customers to develop programs using our differentiated products as well as our branded PVA yarns, including REPREVE®, and (ii) implementing process improvements and manufacturing efficiency gains that will help lower per-unit costs.
In Asia, our Chinese subsidiary remains an important part of the Company’s global PVA strategy as it enhances our ability to service customers who have global supply chains. During fiscal 2016 and 2015, this subsidiary operated in soft market conditions with low capacity utilization rates throughout the Chinese textile industry. However, interest and demand for the Company’s PVA products in the region helped support strong sales volumes during this period. We are encouraged by projects undertaken with key brands and retailers, which include certain PVA programs that recently transitioned from the Company’s domestic operations.
We expect the success of our Chinese subsidiary will provide a solid foundation for expansion into certain key markets in Asia, such as Sri Lanka and Vietnam, where customers have expressed additional interest in sourcing the Company’s products. As we expand our global operations, we will continue to evaluate the level of capital investment required to support the needs of our customers and appropriately allocate our resources accordingly.
Stock Repurchases
Pursuant to an initial stock repurchase program approved by the Board of Directors (the “Board”) in January 2013, the Company began periodic strategic repurchases of its common stock. That $50,000 repurchase program was completed in March of 2014. In April 2014, the Board approved a second $50,000 stock repurchase program. As of August 18, 2016, the Company has repurchased a total of 3,147 shares, at an average price of $23.01, under these repurchase programs. The Company will continue to evaluate opportunities to use excess cash flow from operations or existing borrowings to repurchase additional stock, while maintaining sufficient liquidity to support its operational needs and fund future strategic growth opportunities.
Industry Overview1
The Company operates in the textile industry and, within that broad category, the respective markets for yarns, fabrics, fibers and end-use products such as apparel and hosiery, automotive upholstery, industrial products and home furnishings. Even though the textile industry is global, there are several distinctive regional or other geographic markets that often shape the business strategies and operations of participants in the industry. Because of free trade agreements and other trade regulations entered into by the U.S. government, the U.S. textile industry, which is otherwise a distinctive geographic market on its own, is often considered in conjunction with other geographic markets or regions in North, South and Central America, such as the regions covered by NAFTA and CAFTA. The Company’s principal markets for its domestic operations are in the regions covered by NAFTA and CAFTA, which together include the countries of Canada, Mexico, Costa Rica, Guatemala, Honduras, El Salvador, Nicaragua, the Dominican Republic and the U.S.
____________________
1 Dollar amounts for market or industry data in this section are actual and not in thousands (000s).
According to data compiled by PCI Xylenes & Polyesters, a global leader in research and analysis for the polyester and raw materials markets, global demand for polyester yarns, which includes both filament and staple yarns, has grown steadily since 1980, and in calendar year 2003, polyester replaced cotton as the fiber with the largest percentage of worldwide sales. In calendar year 2015, global polyester consumption accounted for an estimated 55% of global fiber consumption, and global demand is projected to increase by approximately 4% annually through 2020. In calendar year 2015, global nylon consumption accounted for an estimated 5% of global fiber consumption. Softness in the U.S. retail market during fiscal 2016 had unfavorable impacts to the Company’s Nylon Segment. Additionally, there is a potential for focus on costs to drive the industry to transition from certain nylon-based products to polyester. The polyester and nylon fiber sectors together accounted for approximately 62% of North American textile consumption during calendar year 2015.
According to the National Council of Textile Organizations, the U.S. textile industry’s total shipments were approximately $55.4 billion for calendar year 2015 as the U.S. textile and apparel industry exported nearly $23.7 billion of textile and apparel products, and the exports have grown by approximately 43% since 2009, an increase of over $7.1 billion. The U.S. textile industry remains a large manufacturing employer in the U.S.
Trade Regulation and Rules of Origin
The duty rate on imports into the U.S. of finished apparel categories that utilize polyester and nylon yarns generally range from 16% to 32%. For many years now, imports of fabric and finished goods into the U.S. have increased significantly from countries that do not participate in free trade agreements or trade preference programs, despite duties charged on those imports. The primary drivers for that growth were lower overseas operating costs, foreign government subsidization of textile industries, increased overseas sourcing by U.S. retailers, the entry of China into the World Trade Organization, and the staged elimination of all textile and apparel quotas. Although global apparel imports represent a significant percentage of the U.S. market, Regional FTAs (as described below), which follow general “yarn forward” rules of origin, provide duty free advantages for apparel made from regional fibers, yarns and fabrics, allowing the Company opportunities to participate in this growing market.
A significant number of the Company’s customers in the apparel market produce finished goods that meet the eligibility requirements for duty-free treatment in the regions covered by NAFTA, CAFTA, and the Colombia and Peru free trade agreements (collectively, the “Regional FTAs”). These Regional FTAs contain rules of origin requirements in order for products covered by them to be eligible for duty-free treatment. In the case of textiles such as fabric, yarn (such as POY), fibers (filament and staple) and certain garments made from them, the products are generally required to be fully formed within the respective regions. The Company is the largest filament yarn manufacturer, and one of the few producers of qualifying synthetic yarns, in the regions covered by these agreements.
U.S. legislation commonly referred to as the “Berry Amendment” stipulates that certain textile and apparel articles purchased by the U.S. Department of Defense must be manufactured in the U.S. and must consist of yarns and fibers produced in the U.S. The Company is the largest producer of synthetic yarns for Berry Amendment compliant programs.
The Company refers to fibers sold with specific rules of origin requirements under the Regional FTAs and the Berry Amendment, as “Compliant Yarns.” Approximately two-thirds of the Company’s sales within the Polyester and Nylon Segments are sold as Compliant Yarns under the terms of the Regional FTAs or the Berry Amendment.
The Company believes the requirements of the rules of origin and the associated duty-free cost advantages in the Regional FTAs, together with the Berry Amendment and the growing demand for supplier responsiveness and improved inventory turns, will ensure that a portion of the existing textile industry will remain based in the Americas. The Company expects that the NAFTA and CAFTA regions will continue to maintain their share of apparel production as a percentage of U.S. retail. The Company believes the remaining synthetic apparel production within these regional markets is more specialized and defensible, and, in some cases, apparel producers are bringing programs back to the regions as part of a balanced sourcing strategy for some retailers and brands. Because the Company is the largest of only a few significant producers of Compliant Yarns under these Regional FTAs, one of the Company’s business strategies is to continue to leverage its eligibility status for duty-free processing to increase its share of business with regional and domestic fabric producers who ship their products into these regions.
Over the longer term, however, the textile industry in the U.S. and the NAFTA and CAFTA regions is likely to be impacted if and when the Trans-Pacific Partnership (“TPP”) trade agreement is implemented. Negotiations on the TPP were completed in October 2015 and the agreement was signed in February 2016. Signatory countries include Australia, Brunei, Canada, Chile, Malaysia, Mexico, Japan, New Zealand, Peru, Singapore, Vietnam and the U.S. The TPP includes a yarn forward rule of origin with limited exceptions and extended tariff phase-outs for sensitive textile and apparel products; initiatives that should help provide for the stability of the Western Hemisphere textile and apparel production chain in the initial stages of implementation. The U.S. and other TPP countries will need to ratify the agreement before it can be enacted. The Company’s long-term business strategies are also focused on ways to maintain the Company’s profitability if and when the TPP is implemented.
Competition
The industry in which the Company operates is global and highly competitive. The Company competes not only as a global yarn producer, but also as part of a regional supply chain for certain textile products. For sales of Compliant Yarns, the Company competes with a limited number of foreign and domestic producers of polyester and nylon yarns. For sales of non-Compliant Yarns, the Company competes with a larger number of foreign and domestic producers of polyester and nylon yarns, who can meet the required customer specifications of quality, reliability and timeliness. The Company is affected by imported textile, apparel and hosiery products, which adversely impact demand for the Company’s polyester and nylon products in certain of its markets. Several foreign competitors in the Company’s supply chain have significant competitive advantages, including lower wages, raw material costs and capital costs, and favorable currency exchange rates against the U.S. Dollar, any of which could make the Company’s products, or the related supply chains, less competitive. While competitors have traditionally focused on high-volume commodity products, they are now increasingly focused on specialty and value-added products for which the Company has been able to generate higher margins.
The Company’s major competitors for polyester yarns are O’Mara, Inc. and NanYa Plastics Corp. of America (“NanYa”) in the U.S.; AKRA, S.A. de C.V. in the NAFTA region; and C S Central America S.A. de C.V. in the CAFTA region. The Company’s major competitor in Brazil is Avanti Industria Comercio Importacao e Exportacao Ltda., among other traders of imported yarns and fibers. The Company’s major competitors for nylon yarns are Sapona Manufacturing Company, Inc. and McMichael Mills, Inc. in the U.S.
Raw Materials, Suppliers and Sourcing
The primary raw material supplier for the Polyester Segment for Chip and POY is NanYa. For the International Segment, Reliance Industries, Ltd (“Reliance”) is the main supplier for POY. The primary suppliers of POY to the Nylon Segment are HN Fibers, Ltd., U.N.F. Industries Ltd. (“UNF”), UNF America, LLC (“UNFA”), Invista S.a.r.l. (“INVISTA”), Universal Premier Fibers, LLC, and Nilit US (“Nilit”). Each of UNF and UNFA is a 50/50 joint venture between the Company and Nilit. Currently, there are multiple domestic and foreign suppliers available to fulfill the Company’s sourcing requirements for its recycled products.
The Company produces and buys certain of its raw material fibers for Compliant Yarns from a variety of sources in both the U.S. and Israel. The Company produces a portion of its Chip requirements in its REPREVE® Recycling Center and purchases the remainder of its requirements from external suppliers for use in its spinning facility. In addition, the Company purchases nylon and polyester products for resale from various suppliers. Although the Company does not generally have difficulty obtaining its raw material requirements, the Company has, in the past, experienced interruptions or limitations in the supply of certain raw materials.
Among the expected benefits to the Company’s financial results, construction of its bottle processing facility is intended to secure a high-quality source of raw materials for the growing focus on recycled yarns. Therefore, in concert with the Company’s commitment to sustainability and highly-innovative products and processes, along with the REPREVE® Recycling Center, the bottle processing facility is expected to provide a uniform, high-quality source of raw materials (i.e. plastic bottle flake) for internal consumption and potential sale to external parties. Combined with recent technology advancements in recycling, the bottle flake produced will enhance our ability to grow REPREVE® into other markets such as nonwovens, carpet fiber and packaging.
The price of the principal raw materials used by the Company fluctuates frequently, and it is difficult, and often impossible, to predict trends or upcoming developments. During the first three quarters of fiscal 2016, the Company operated under a predominantly declining polyester raw material cost environment. Polyester raw material prices increased slightly beginning in the fourth quarter of fiscal 2016 due to a short-term increase in crude oil prices, and stayed at those levels through the end of fiscal 2016. The Company believes that polyester raw material costs during most of fiscal 2016 were impacted by lower crude oil values, a lack of major unplanned raw material capacity outages and soft global demand for polyester raw materials. The continuing softness in global crude oil prices is likely to impact the Company’s polyester and nylon raw material costs, but it is not possible to predict the timing or amount of the impact or whether the decline in crude oil prices will stabilize, continue or reverse. In any event, the Company monitors these dynamic factors closely.
Products, Technologies and Related Markets
The Company manufactures polyester yarn and related products in the U.S., El Salvador and Brazil, and nylon yarns in the U.S. and Colombia, for a wide range of end-uses. In addition, the Company purchases certain yarns and staple fiber for resale to its customers. The Company processes and sells POY, high-volume commodity yarns, and PVA and other specialty yarns in both domestic and international markets, with PVA yarns comprising approximately 35%, 30% and 27% of consolidated net sales for fiscal 2016, 2015 and 2014, respectively. The Company provides products to a variety of end-use markets, principally apparel, industrial, furnishings and automotive upholstery.
The domestic apparel market, which includes hosiery, represents approximately 65% of the Company’s sales. Apparel retail sales, supply chain inventory levels and strength of the regional supply base are vital to this market. Generally, synthetic apparel consumed in the U.S. grows 4% to 6% per year and, over the last five years, the Regional FTAs share of supply of U.S. synthetic apparel has remained constant at approximately 18%.
The domestic industrial market represents approximately 16% of the Company’s sales. This market includes medical, belting, tapes, filtration, ropes, protective fabrics and awnings.
The domestic furnishings market, which includes both contract and home furnishings, represents approximately 9% of the Company’s sales. Furnishings sales are largely dependent upon the housing market, which in turn is influenced by consumer confidence and credit availability.
The domestic automotive upholstery market represents approximately 6% of the Company’s sales and has been less susceptible to import penetration because of the exacting specifications and quality requirements often imposed on manufacturers of automotive upholstery and the just-in-time delivery requirements. Effective customer service and prompt response to customer feedback are logistically more difficult for an importer to provide.
The Company also adds value to the overall supply chain for textile products, and increases consumer demand for the Company’s own products, through the development and introduction of branded yarns and technologies that provide unique sustainability, performance, comfort and aesthetic advantages. The Company’s branded portion of its yarn portfolio continues to provide product differentiation to brands, retailers and consumers, and it includes products such as:
|
● |
REPREVE®, a family of eco-friendly yarns made from recycled materials. Since its introduction in 2006, REPREVE® has been the Company’s most successful branded product. The Company’s recycled fibers are manufactured to provide certain performance and/or functional properties to various types of fabrics and end products. |
|
● |
Sorbtek®, a permanent moisture management yarn primarily used in performance base-layer applications, compression apparel, athletic bras, sports apparel, socks and other non-apparel related items. |
|
● |
Reflexx®, a family of stretch yarns that can be found in a wide array of end-use applications, from home furnishings to performance wear and from hosiery and socks to work wear and denim. |
|
● |
aio® all-in-one performance yarns combine multiple performance properties into a single yarn. |
|
● |
Augusta®, a cotton-like yarn with a soft, lofty hand that looks and feels like cotton, but offers the superior performance of synthetic and no fading. |
|
● |
A.M.Y. ®, a yarn with permanent antimicrobial properties for odor control. |
The Company’s branded yarns can be found in a variety of products of well-known brands, retailers and department stores including Ford, Haggar, Polartec, The North Face, Patagonia, Quiksilver, Roxy, Volcom, Perry Ellis, Greg Norman, Pottery Barn, adidas, Reebok, Nike, New Balance, MJ Soffe, Dockers, Levi’s, H&M, TARGET, Walmart, Costco Wholesale, REI, Cabela’s, Sears, Macy’s, Kohl’s, Belk and more.
In addition to the above brands and products, the Company combines its research and development efforts with the demands of customers and markets to develop innovative technologies that enhance yarn characteristics. Application of these technologies allows for various, separate benefits, including, among other things, water repellency, flame retardation, enhanced color-fastness achieved with less water use and protection from ultra-violet rays.
Customers
The Company’s Polyester Segment has approximately 350 customers, its Nylon Segment has approximately 150 customers and its International Segment has approximately 600 customers, all in a variety of geographic markets. The Company’s products are manufactured according to customer specifications and are shipped based upon customer order requirements. Customer payment terms are generally consistent across the segments and are based on prevailing industry practices for the sale of yarn domestically or internationally.
The Company’s consolidated net sales are not materially dependent on a single customer. No single customer accounts for ten percent or more of the Company’s consolidated net sales. The Company’s top ten customers accounted for approximately 33% of consolidated net sales for fiscal 2016 and approximately 32% of receivables as of June 26, 2016. The Company’s net sales within its Nylon Segment are materially dependent upon a domestic customer that accounted for approximately 37% of the Nylon Segment’s net sales for fiscal 2016.
Sales and Marketing
The Company employs an internal sales force of approximately 40 persons operating out of sales offices in the U.S., Brazil, China, El Salvador, Colombia and Switzerland. The Company relies on independent sales agents for sales in several other countries. The Company seeks to create strong customer relationships and to build and strengthen those relationships throughout the supply chain. Through frequent communications with customers, partnering with customers in product development and engaging key downstream brands and retailers, the Company has created significant pull-through sales and brand recognition for its products. For example, the Company works with brands and retailers to educate and create demand for its PVA products. The Company then works with key fabric mill partners to develop specific fabrics for those brands and retailers utilizing its PVA products. In many of these regards, the Company draws upon and integrates the resources of its research and development personnel. In addition, the Company is enhancing co-branding activations with integrated point-of-sale and online marketing with popular brands and retailers to further enable consumers to find REPREVE® and other PVA brands in multiple retail channels. Based on the establishment of many commercial and branded programs, this strategy has been successful for the Company.
Product Customization and Manufacturing Processes
The Company uses advanced production processes to manufacture its high quality yarns cost-effectively in North America, Central America and South America. The Company believes that its flexibility and know-how in producing specialty polyester and nylon yarns provides important development and commercialization advantages.
The Company produces polyester POY and recycled polyester Chip for its commodity, PVA and other specialty yarns. Both the POY and Chip can be sold externally or further processed internally. Our REPREVE® Recycling Center in North Carolina is our primary operation for producing recycled polyester Chip, a critical component in growing the market for REPREVE®.
Additional processing of the Company’s polyester yarn products includes texturing, package dyeing, twisting, beaming and draw winding. The texturing process, which is common to both polyester and nylon, involves the use of high-speed machines to draw, heat and false-twist POY to produce yarn with different physical characteristics, depending on its ultimate end-use. Texturing gives the yarn greater bulk, strength, stretch, consistent dye-ability and a softer feel, thereby making it suitable for use in the knitting and weaving of fabric. Package dyeing allows for matching of customer-specific color requirements for yarns sold into the automotive upholstery, home furnishings and apparel markets. Twisting incorporates real twist into filament yarns, which can be sold for a variety of uses, such as sewing thread, home furnishings and apparel. Beaming places both textured and covered yarns onto beams to be used by customers in warp knitting and weaving applications. The draw winding process utilizes heat and draws POY to produce mid-tenacity, flat yarns.
Additional processing of the Company’s nylon yarn products primarily includes covering, which involves the wrapping or air entangling of filament or spun yarn around a core yarn, primarily spandex. This process enhances a fabric’s ability to stretch, recover its original shape and resist wrinkles while maintaining a softer feel.
The Company’s subsidiary in China offers the same high-quality and innovative PVA products and technologies to multiple of our international customers through contract manufacturing arrangements with trusted providers. This asset-light model currently in place in China allows for a seamless integration of our products into the global supply chain of our customers, especially as new yarns and technologies are adopted by major customers headquartered in the U.S. As we expand our Asian operations to meet the needs of our global customers, we will seek to continue to leverage the asset-light model where the existing Asian infrastructure can accommodate our highly-technical processes, but we will evaluate the need for additional Company assets in response to ever-changing market dynamics.
Research and Development
The Company employs approximately 90 persons who work closely with the Company’s customers and others to develop a variety of yarns and improvements to the performance properties of existing yarns and fabrics. Among other things, the Company evaluates trends and uses the latest technology to create innovative specialty and PVA yarns that meet the needs of evolving consumer preferences. Most of the Company’s branded yarns discussed above, including its flagship REPREVE® brand, were derived from its research and development initiatives.
The Company also includes, as part of its research and development initiatives, the use of continuous improvement methodologies to increase its manufacturing and other operational efficiencies, both to enhance product quality and to derive cost savings. For fiscal 2016, 2015 and 2014, the Company incurred $6,907, $8,113 and $7,921, respectively, for research and development (including salaries and benefits of the personnel involved in those efforts). In fiscal 2016, a portion of the activities traditionally attributed to research and development were allocated to certain of the significant, highly-technical capital projects discussed above.
Intellectual Property
The Company has numerous U.S. registered trademarks. Due to its current brand recognition and potential growth opportunities, the Company believes that REPREVE® is its most significant trademark. Ownership rights in U.S. registered trademarks do not expire if the trademarks are continued in use and properly protected.
The Company licenses certain trademarks, including Dacron® and Softec™, from INVISTA.
Employees
The Company has approximately 2,700 employees, along with approximately 200 individuals working under temporary labor contracts. The number of employees in the Polyester Segment, Nylon Segment, International Segment and corporate office are approximately 1,500, 600, 500 and 100, respectively. While employees of the Company’s Brazilian operations are unionized, none of the labor force employed by the Company’s domestic or other foreign subsidiaries is currently covered by a collective bargaining agreement.
Geographic Data
Geographic information reported in conformance with generally accepted accounting principles is included in Note 26 to the Consolidated Financial Statements in this Annual Report on Form 10-K.
Seasonality
The Company is not significantly impacted by seasonality; however, the Company typically experiences its (i) highest sales volumes in the third and fourth quarters and (ii) its lowest gross margins in the first quarter of its fiscal years. Excluding the effects of fiscal years with 53 weeks rather than 52 weeks, the most significant effects on the Company’s results of operations for particular periods during a year are due to planned manufacturing shutdowns by either the Company or its customers for certain holiday or traditional shutdown periods, which are not concentrated in any one particular season.
Backlog
The Company’s level of unfilled orders is affected by many factors, including the timing of specific orders and the delivery time for specific products, as well as the customer’s ability or inability to cancel the related order. As such, the Company does not consider the amount of unfilled orders, or backlog, to be a meaningful indicator of expected levels of future sales or to be material to an understanding of the Company’s business as a whole.
Inflation
The Company expects costs to continue to rise for certain consumables used to produce and ship its products, as well as for its utilities and certain employee costs and benefits. While the Company attempts to mitigate the impacts of such rising costs through its operational efficiencies and increased selling prices, inflation may become a factor that negatively impacts the Company’s profitability.
Environmental Matters
The Company is subject to various federal, state and local environmental laws and regulations limiting the use, storage, handling, release, discharge and disposal of a variety of hazardous substances and wastes used in or resulting from its operations (and to potential remediation obligations thereunder). These laws include the Federal Water Pollution Control Act, the Clean Air Act, the Resource Conservation and Recovery Act (including provisions relating to underground storage tanks) and the Comprehensive Environmental Response, Compensation, and Liability Act, commonly referred to as “Superfund” or “CERCLA,” and various state counterparts. The Company’s operations are also governed by laws and regulations relating to workplace safety and worker health, principally the Occupational Safety and Health Act and regulations thereunder, which, among other things, establish exposure standards regarding hazardous materials and noise standards, and regulate the use of hazardous chemicals in the workplace.
The Company believes that it has obtained, and is in compliance in all material respects with, all significant permits required to be issued by federal, state or local law in connection with the operation of its business. The Company also believes that the operation of its production facilities and the disposal of waste materials are substantially in compliance with applicable federal, state and local laws and regulations, and that there are no material ongoing or anticipated capital expenditures associated with environmental control facilities necessary to remain in compliance with such provisions. The Company incurs normal operating costs associated with the discharge of materials into the environment, but does not believe that these costs are material or inconsistent with its domestic competitors.
On September 30, 2004, the Company completed its acquisition of the polyester filament manufacturing assets located in Kinston, North Carolina from INVISTA S.a.r.l (“Invista”). The land for the Kinston site was leased pursuant to a 99 year ground lease (“Ground Lease”) with E.I. DuPont de Nemours (“DuPont”). Since 1993, DuPont has been investigating and cleaning up the Kinston site under the supervision of the U.S. Environmental Protection Agency (“EPA”) and the North Carolina Department of Environment and Natural Resources (“DENR”) pursuant to the Resource Conservation and Recovery Act Corrective Action program. The Corrective Action program requires DuPont to identify all potential areas of environmental concern (“AOCs”), to assess the extent of containment at the identified AOCs and to clean it up to comply with applicable regulatory standards. Effective March 20, 2008, the Company entered into a Lease Termination Agreement associated with conveyance of certain assets at Kinston to DuPont. This agreement terminated the Ground Lease and relieved the Company of any future responsibility for environmental remediation, other than participation with DuPont, if so called upon, with regard to the Company’s period of operation of the Kinston site, which was from 2004 to 2008. However, the Company continues to own a satellite service facility acquired in the INVISTA transaction that has contamination from DuPont’s operations and is monitored by DENR. This site has been remediated by DuPont, and DuPont has received authority from DENR to discontinue remediation, other than natural attenuation. DuPont’s duty to monitor and report to DENR will be transferred to the Company in the future, at which time DuPont must pay the Company for seven years of monitoring and reporting costs and the Company will assume responsibility for any future remediation and monitoring of the site. At this time, the Company has no basis to determine if or when it will have any responsibility or obligation with respect to the AOCs or the extent of any potential liability for the same.
Repreve Renewables, LLC
Repreve Renewables, LLC (“Renewables”), in which the Company has a 60% membership interest (and which is unrelated to the Company’s REPREVE® products), is an agricultural company focused on the development, production and commercialization of miscanthus grass for use in the animal bedding, bio energy and bio-based products markets. Renewables’ core crop is giant miscanthus. Renewables developed a proprietary suite of establishment (planting) technology marketed as ACCU YIELD System™ which allows giant miscanthus rhizomes to be dug, processed and planted mechanically.
Renewables was chosen to provide the agricultural and business development services for the University of Iowa’s Biomass Fuel Project. Renewables’ primary focus, however, has been supplying THRIVEZ®, a bedding product made from its proprietary varieties of giant miscanthus, to the U.S. poultry bedding market. Renewables has been trialing THRIVEZ® in poultry houses for a number of the largest poultry integrators, as Renewables believes THRIVEZ® offers competitive advantages to that potential market. Renewables has approximately 3,500 acres planted (on leased land and through contract grower agreements) across the U.S.
During fiscal year 2016, Renewables entered into a secured debt financing arrangement, consisting of a master loan agreement and corresponding term loan supplement having a borrowing capacity of $4,000, with CoBank, ACB and Carolina Farm Credit, ACA. Renewables borrowed $4,000 against such arrangement, which provided liquidity in fiscal 2016 to (i) construct a new processing center in North Carolina, (ii) secure additional land leases and (iii) plant additional acreage, all intended to accommodate the demand for giant miscanthus. In connection with this arrangement, a subsidiary of the Company is subject to joint and several liability in the event of recourse by the lenders.
Unconsolidated Affiliates
The Company participates in two joint ventures that are suppliers to the Company’s Nylon Segment, with one located in the U.S. and one in Israel. The Company also participates in PAL, as discussed above. As of June 26, 2016, the Company had $117,412 recorded for these investments in unconsolidated affiliates. For fiscal 2016, $8,963 of the Company’s $48,243 of income before income taxes was generated from its investments in these unconsolidated affiliates, of which $6,074 was attributable to PAL. Other information regarding the Company’s unconsolidated affiliates is provided in “Item 7. Management’s Discussion and Analysis of Financial Condition and Results of Operations” and in Note 23 to the Consolidated Financial Statements in this Annual Report on Form 10-K.
Available Information
The Company’s website is: www.unifi.com. The information on our website is available for informational purposes and convenience only, and is not incorporated by reference in this Annual Report on Form 10-K or any other filing we make with the SEC.
We make available, without charge, on our website certain reports and amendments to those reports, as applicable, that the Company files with or furnishes to the SEC pursuant to the Exchange Act as soon as practicable after such material is electronically filed with or furnished to the SEC. These include our annual reports on Form 10-K, quarterly reports on Form 10-Q and current reports on Form 8-K. In addition, many of our corporate governance documents are available on our website, including our Audit Committee Charter, Compensation Committee Charter, Corporate Governance and Nominating Committee Charter, Corporate Governance Guidelines, Code of Business Conduct and Ethics, and Ethical Business Conduct Policy Statement. Copies of such materials, as well as any of our SEC reports, may also be obtained without charge by writing to Unifi, Inc., 7201 West Friendly Avenue, Greensboro, North Carolina 27410, Attention: Office of the Secretary.
Item 1A. Risk Factors
Our business, operations and financial condition, and the textile industry in which we operate, are subject to various risks. Some of these risks are described below, but they do not constitute all of the risks that may be applicable to us, our business or our industry. New risks may emerge from time to time, and it is not possible for us to predict all potential risks or to assess with certainty the likely impact of all risks. The discussion below is intended as a summary only of certain material risk factors. More detailed information concerning certain of the risk factors described below is contained in other sections of this Annual Report on Form 10-K, including in “Item 7. Management’s Discussion and Analysis of Financial Condition and Results of Operations.” You should consider all such risks in evaluating the Company or making any investment decision involving the Company.
Risks Relating to Our Business
The Company faces intense competition from a number of domestic and foreign yarn producers and importers of textile and apparel products. Because the Company and the supply chains in which the Company operates do not typically operate on the basis of long-term contracts with textile and apparel customers, these competitive factors could cause the Company’s customers to shift rapidly to other producers.
The Company competes not only against domestic and foreign yarn producers, but also against importers of foreign-sourced fabric and apparel into the U.S. and other countries in which the Company does business (particularly in Brazil with respect to commodity yarn products). The primary competitive factors in the textile industry include price, quality, product styling and differentiation, flexibility of production and finishing, delivery time and customer service. The needs of certain customers and the characteristics of particular products determine the relative importance of these various factors. A large number of the Company’s foreign competitors have significant competitive advantages that may include lower labor and raw materials costs, government subsidies and favorable currency exchange rates against the U.S. Dollar. If any of these advantages increase, or if new and/or larger competitors emerge in the future, the Company’s products could become less competitive, and its sales and profits may decrease as a result. In particular, devaluation of Chinese currency against the U.S. Dollar could result in the Company’s products becoming less competitive from a pricing standpoint and/or could result in the regions covered by NAFTA and CAFTA losing market share to Chinese imports, thereby adversely impacting the Company’s sales and profits. Also, while these foreign competitors have traditionally focused on commodity production, they are now increasingly focused on value-added products, where the Company has been able to generate higher margins. The Company may not be able to continue to compete effectively with imported foreign-made textile and apparel products, which would materially adversely affect its business, financial condition, results of operations or cash flows.
In Brazil, Petrosuape-Companhia Petroquimica de Pernambuco (“Petrosuape”), a subsidiary of Petrobras Petroleo Brasileiro S.A., a public oil company controlled by the Brazilian government, has constructed a polyester manufacturing complex located in the northeast sector of the country. Petrosuape was expected to produce PTA, polyethylene terephthalate (“PET”) resin, POY and textured polyester, with the potential to become a significant competitor of the Company’s Brazilian operations. While there have been recent negative developments involving Petrosuape and its manufacturing complex, the PTA and PET facilities are fully operational and if the facility were to reach full commercial production of textured polyester, its operations could significantly impact the synthetic textile filament market in Brazil, thereby negatively impacting the operating results of the Company.
Significant price volatility of the Company’s raw materials and rising energy costs may result in increased production costs, which the Company may not be able to pass on to its customers, or be able to pass on without a time lag that adversely affects the Company during one or more periods.
A significant portion of the Company’s raw materials are derived from petroleum-based chemicals. The prices for petroleum and petroleum-related products (and energy costs) are volatile and dependent on global supply and demand dynamics, including geo-political risks. While the Company enters into raw material supply agreements from time to time, these agreements typically provide index pricing based on quoted market prices. Therefore, supply agreements provide only limited protection against price volatility. While the Company has, at times in the past, been able to increase sales prices in response to increased raw material costs, the Company has not always been able to do so. The Company has lost in the past (and expects that it may lose in the future) customers to its competitors as a result of price increases. In addition, competitors may be able to obtain raw materials at a lower cost due to market regulations that favor local producers in certain foreign locations where the Company operates, and certain other market regulations that favor the Company over other producers may be amended or repealed. Additionally, inflation can have a long-term impact by increasing the costs of materials, labor and/or energy, any of which costs may adversely impact the Company’s ability to maintain satisfactory margins. If the Company is not able to fully pass on such cost increases to customers in a timely manner (or if it loses a large number of customers to competitors as a result of price increases), the result could be material and adverse to its business, financial condition, results of operations or cash flows.
Depending on the price volatility of the Company’s petroleum-based raw materials, the price gap between virgin raw materials and recycled bottle flake could make virgin raw materials more cost-effective than recycled raw materials, which could result in an adverse effect on the Company’s ability to sell its REPREVE® brand recycled products profitably.
The Company depends upon limited sources for certain of its raw materials, and interruptions in supply could increase its costs of production, cause production inefficiencies or lead to a halt in production in an extreme case.
The Company depends on a limited number of third parties for certain raw material supplies, such as POY, Chip and recycled plastic bottles. Although alternative sources of raw materials exist, the Company may not be able to obtain adequate supplies of such materials on acceptable terms, or at all, from other sources. The Company is dependent on NAFTA, CAFTA and Berry Amendment qualified suppliers of raw materials for the production of Compliant Yarns. These suppliers are also at risk with their raw material supply chains. Any significant disruption or curtailment in the supply of any of its raw materials could cause the Company to reduce (or cease, in an extreme case) its production for an extended period, or require the Company to increase its pricing, which could have a material adverse effect on its business, financial condition, results of operations or cash flows.
The Company has significant foreign operations, and its consolidated results of operations may be adversely affected by the risks associated with doing business in foreign locations, including the risk of fluctuations in foreign currency exchange rates.
The Company has operations in Brazil, China, Colombia and El Salvador, and participates in a foreign joint venture located in Israel. The Company serves customers in Canada, Mexico, Central America, South America, Asia and various countries in Europe. The Company’s foreign operations are subject to certain political, tax, economic and other uncertainties not encountered by its domestic operations that can materially impact the Company’s supply chains or other aspects of its foreign operations. The risks of international operations include trade barriers, duties, exchange controls, national and regional labor strikes, social and political unrest, general economic risks, compliance with a variety of foreign laws (including tax laws), the difficulty of enforcing agreements and collecting receivables through foreign legal systems, taxes on distributions or deemed distributions to the Company or any of its U.S. subsidiaries, maintenance of minimum capital requirements, and import and export controls. The Company’s results of operations and business could be adversely affected as a result of a significant adverse development with respect to any of these matters.
Through its foreign operations, the Company is also exposed to currency exchange rate fluctuations. Fluctuations in foreign exchange rates will impact period-to-period comparisons of the Company’s reported results. Additionally, the Company operates in countries with foreign exchange controls. These controls may limit the Company’s ability to transfer funds from its international operations and joint venture or otherwise to convert local currencies into U.S. Dollars. These limitations could adversely affect the Company’s ability to access cash from these operations.
The Company’s future success will depend in part on its ability to protect its intellectual property rights, and the Company’s inability to enforce these rights could cause it to lose sales and its competitive advantage.
The Company’s success depends in part upon its ability to protect and preserve its rights in the trademarks and other intellectual property it owns or licenses, including its proprietary know-how, methods and processes, and the intellectual property related to its REPREVE® brand. The Company relies on the trademark, copyright and trade secret laws of the U.S. and other countries, as well as nondisclosure and confidentiality agreements, to protect its intellectual property rights. However, the Company may be unable to prevent third parties, employees or contractors from using its intellectual property without authorization, breaching nondisclosure or confidentiality agreements with it, or independently developing technology that is similar to the Company’s property. The use of the Company’s intellectual property by others without authorization may reduce any competitive advantage that the Company has developed, cause it to lose sales or otherwise harm its business.
The Company has investments in less than 100% owned affiliates that the Company does not control, which subjects the Company to uncertainties about the operating performance and quality of financial reporting of these affiliates.
The most significant of these investments is the Company’s 34% minority interest in PAL, an entity that the Company does not control. While this investment is designed to advance important business interests of the Company, the Company does not have majority voting control of PAL or the ability otherwise to control PAL’s policies, management or affairs. The interests of persons who control PAL may differ from the Company’s, and those persons may cause PAL to take actions that are not in the Company’s best interest. Among other things, the Company’s inability to control PAL may adversely affect its ability to receive distributions from PAL or to fully implement its business plan. The incurrence of debt or entry into other agreements by PAL may result in restrictions or prohibitions on PAL’s ability to make distributions to the Company. Even where PAL is not restricted by contract or by law from making distributions, the Company may not be able to influence the timing or amount of such distributions. In addition, if the controlling investor in PAL fails to observe its commitments, PAL may not be able to operate according to its business plan, or the Company may need to increase its level of investment commitment. If any of these events were to occur, the Company’s business, results of operations, financial condition or cash flows could be adversely affected.
The Company also relies on accurate financial reporting from PAL for preparation of the Company’s quarterly and annual financial statements. Errors in the financial information reported by PAL could be material to the Company and may require it to restate past financial statements. Any such restatements could have a material adverse effect on the Company or the market price of its common stock.
PAL receives economic adjustment payments from the Commodity Credit Corporation under the Economic Adjustment Assistance to Users of Upland Cotton. The economic assistance received under this program must be used to acquire, construct, install, modernize, develop, convert or expand land, plant, buildings, equipment or machinery directly attributable to the purpose of manufacturing upland cotton into eligible cotton products in the U.S. Should PAL no longer meet the criteria to receive economic assistance under the program, or should the program be discontinued, PAL’s business could be significantly impacted, which would adversely affect the Company.
The Company requires cash to service its indebtedness and fund capital expenditures and strategic initiatives, and its ability to generate sufficient cash for those purposes depends on many factors beyond its control.
The Company’s principal sources of liquidity are cash flows generated from operations and borrowings under its credit facility. The Company’s ability to make payments on its indebtedness, to fund planned capital expenditures and to fund strategic initiatives will depend on its ability to generate future cash flows from operations. This, to a certain extent, is subject to general economic, financial, competitive, legislative, regulatory and other factors that are beyond the Company’s control. The business may not generate sufficient cash flows from operations, and future borrowings may not be available to the Company in amounts sufficient, to enable the Company to pay its indebtedness and to fund its other liquidity needs. Any such development would have a material adverse effect on the Company.
Risks Relating to the Textile Industry
A decline in general economic or political conditions, and changes in consumer spending, could cause a decline in demand for textile products.
The Company’s products are used in the production of fabric primarily for the apparel, hosiery, home furnishings, automotive upholstery, industrial and other end-use markets. Demand for furniture and durable goods is often affected significantly by economic conditions that have global or regional industry-wide consequences. Demand for a number of categories of apparel also tends to be tied to economic cycles and customer preferences that affect the textile industry in general. Demand for textile products, therefore, tends to vary with the business cycles of the U.S. and other economies, as well as changes in global trade flows, and economic and political conditions.
Historic trends indicate weakening performance in the Nylon sector on a global basis. If the decline is significant in any one year, the impact could have a material adverse effect on the Company’s business, financial condition, results of operations or cash flows.
Unfavorable changes in trade policies and violations of existing trade policies could weaken the Company’s competitive position significantly and have a material adverse effect on its business.
A number of markets within the textile industry in which the Company sells its products, particularly the apparel, hosiery and home furnishings markets, are subject to intense foreign competition. Other markets within the textile industry in which the Company sells its products may in the future become subject to more intense foreign competition. There are currently a number of trade regulations and duties in place to protect the U.S. textile industry against competition from low-priced foreign producers, such as those in China and Vietnam. Changes in such trade regulations or duties may make the price of the Company’s products less attractive than the goods of its competitors or the finished products of a competitor in the supply chain, which could have a material adverse effect on the Company’s business, financial condition, results of operations or cash flows.
According to industry experts and trade associations, there has been a significant amount of illegal transshipments of apparel products into the U.S. and into certain other countries in the NAFTA and CAFTA regions in which the Company competes. Illegal transshipment involves circumventing duties by falsely claiming that textiles and apparel are products of a particular country of origin (or include yarn of a particular country of origin) to avoid paying higher duties or to receive benefits from regional free trade agreements, such as NAFTA and CAFTA. If illegal transshipments are not monitored, and if enforcement is not effective to limit them, these shipments could have a material adverse effect on the Company’s business, financial condition, results of operations or cash flows.
The TPP trade agreement between the U.S., Australia, Brunei, Canada, Chile, Japan, Malaysia, Mexico, New Zealand, Peru, Singapore and Vietnam was signed in February 2016. The timeline for consideration by the U.S. Congress and final enactment remains unclear at this time. When, and if, the TPP is implemented, Vietnam and other major textile and apparel exporting countries will receive beneficial duty that could have a material adverse effect on the Company’s business.
A portion of the Company’s revenues and profits are dependent on a relatively small number of key customers.
Our top ten customers accounted for approximately 33% of our net sales for fiscal 2016 and approximately 32% of receivables as of June 26, 2016. A decrease in sales to, or a complete loss of business from, a key customer could have an adverse impact on the Company’s business. Dependence on a small number of large customers also creates credit risk should one or more of these key customers experience a decline in business and become unable to meet their obligations to the Company.
Item 1B. Unresolved Staff Comments
None.
Item 2. Properties
The following table contains information about the principal properties owned or leased by the Company as of June 26, 2016:
|
Location |
Description |
|
Polyester Segment Properties |
|
|
Domestic |
|
|
Yadkinville, NC |
Five plants (1) and five warehouses (2) |
|
Reidsville, NC |
Two plants (1) |
|
Foreign |
|
|
Ciudad Arce, El Salvador |
One plant and one warehouse (3) |
|
Nylon Segment Properties |
|
|
Domestic |
|
|
Madison, NC |
One plant and one warehouse (1) |
|
Foreign |
|
|
Bogota, Colombia |
One plant (1) |
|
International Segment Properties |
|
|
Foreign |
|
|
Alfenas, Brazil |
One plant and one warehouse (1) |
|
Sao Paulo, Americana and Blumenau, Brazil |
One corporate office (3) and two sales offices (3) |
|
Suzhou, China |
One sales office (3) and one warehouse (3) |
|
Schaffhausen, Switzerland |
One sales office (3) |
|
(1) Owned in fee simple. |
|
|
(2) Three warehouses are owned in fee simple and two warehouses are leased. (3) Leased facilities. | |
In addition to the above properties, the Company owns property located at 7201 West Friendly Avenue in Greensboro, North Carolina, which includes a building that serves as the Company’s corporate headquarters and administrative offices for all of its segments and a sales office. Such property consists of a tract of land containing approximately nine acres, and the building contains approximately 120,000 square feet.
Repreve Renewables, LLC (i) owns a processing center in Seven Springs, North Carolina and (ii) has approximately 5,700 acres of farm land under lease or contract grower arrangements located in Georgia, Iowa, Maryland, Mississippi, North Carolina, Oklahoma and Wisconsin.
As of June 26, 2016, the Company owned approximately 4.8 million square feet of manufacturing, warehouse and office space. Management believes all of the Company’s operating properties are well maintained and in good condition. In fiscal 2016, the Company’s plants in the Polyester, Nylon and International Segments operated below capacity. Management does not perceive any capacity constraints in the foreseeable future.
Item 3. Legal Proceedings
We are from time to time a party to various lawsuits, claims and other legal proceedings that arise in the ordinary course of business. With respect to all such lawsuits, claims and proceedings, we record reserves when it is probable a liability has been incurred and the amount of loss can be reasonably estimated. We do not believe that any of these proceedings, individually or in the aggregate, would be expected to have a material adverse effect on our results of operations, financial position or cash flows.
Item 4. Mine Safety Disclosures
Not applicable.
EXECUTIVE OFFICERS OF THE REGISTRANT
The following is a description of the names and ages of the executive officers of the Company, indicating all positions and offices with the Company held by each such person and each person’s principal occupations or employment during the past five years. Each executive officer of the Company is elected by the Board and holds office from the date of election until thereafter removed by the Board.
Thomas H. Caudle, Jr. — Age: 64 – Mr. Caudle has served as President and a director of Unifi since April 2016. Previously, he was Vice President of Manufacturing of the Company from October 2006 to April 2016 and Vice President of Global Operations of the Company from April 2003 until October 2006. Mr. Caudle joined Unifi in 1982 and, since that time, has served in a variety of other leadership roles, including Senior Vice President in charge of manufacturing for the Company and Vice President of Manufacturing Services.
Sean D. Goodman — Age: 51 – Mr. Goodman has been Vice President and Chief Financial Officer of Unifi since he joined the Company in January 2016. Prior to that, Mr. Goodman served as Senior Vice President and Chief Financial Officer of the Americas region of Landis+Gyr, a multinational corporation focused on energy management technologies, from April 2011 to December 2015. Mr. Goodman also previously served as Director of Strategic Business Development and Director of Finance at The Home Depot, Inc., Vice President of Investment Banking at Morgan Stanley, Head of Strategy and Corporate Development at GUS plc, and a Senior Manager at Deloitte & Touche LLP.
PART II
Item 5. Market for Registrant’s Common Equity, Related Stockholder Matters and Issuer Purchases of Equity Securities
The Company’s common stock is listed for trading on the New York Stock Exchange (“NYSE”) under the symbol “UFI.” The following table sets forth the closing, high and low sales prices of the common stock for the Company’s two most recent fiscal years.
|
Close |
High |
Low |
||||||||||
|
Fiscal 2016: |
||||||||||||
|
Fourth quarter ended June 26, 2016 |
$ | 26.29 | $ | 27.99 | $ | 20.71 | ||||||
|
Third quarter ended March 27, 2016 |
22.74 | 28.96 | 20.85 | |||||||||
|
Second quarter ended December 27, 2015 |
28.66 | 32.99 | 25.76 | |||||||||
|
First quarter ended September 27, 2015 |
29.35 | 34.80 | 25.75 | |||||||||
|
Fiscal 2015: |
||||||||||||
|
Fourth quarter ended June 28, 2015 |
$ | 33.94 | $ | 37.54 | $ | 30.93 | ||||||
|
Third quarter ended March 29, 2015 |
36.08 | 36.30 | 28.55 | |||||||||
|
Second quarter ended December 28, 2014 |
30.04 | 30.97 | 24.51 | |||||||||
|
First quarter ended September 28, 2014 |
26.42 | 30.93 | 25.50 | |||||||||
As of August 18, 2016, there were 149 record holders of the Company’s common stock. A significant number of the outstanding shares of common stock that are beneficially owned by individuals and entities are registered in the name of Cede & Co. Cede & Co. is a nominee of the Depository Trust Company, a securities depository for banks and brokerage firms. The Company estimates that there are approximately 5,600 beneficial owners of its common stock.
No dividends were paid in the past two fiscal years, and the Company does not intend to pay cash dividends in the foreseeable future. The Company’s current debt obligations contain certain restricted payment and restricted investment provisions, including a restriction on the payment of dividends and share repurchases should its borrowing capacity fall below certain thresholds. Information regarding the Company’s debt obligations is provided in Note 12 to the Consolidated Financial Statements in this Annual Report on Form 10-K.
Purchases of Equity Securities
On January 22, 2013, the Company announced a stock repurchase program (the “2013 SRP”) to acquire up to $50,000 of the Company’s common stock. The Company completed its repurchase of shares under the 2013 SRP in March 2014.
On April 23, 2014, the Company announced a new stock repurchase program (the “2014 SRP”) to acquire up to an additional $50,000 of the Company’s common stock. Under the 2014 SRP (as was the case under the 2013 SRP), the Company has been authorized to repurchase shares at prevailing market prices, through open market purchases or privately negotiated transactions at such times and prices and in such manner as determined by management, subject to market conditions, applicable legal requirements, contractual obligations and other factors. Repurchases, if any, are expected to be financed through cash generated from operations and borrowings, and are subject to applicable limitations and restrictions as set forth in the credit agreement governing the Company’s debt obligations. The 2014 SRP has no stated expiration or termination date, and there is no time limit or specific time frame otherwise for repurchases. The Company may discontinue repurchases at any time that management determines additional purchases are not beneficial or advisable.
Through August 18, 2016, the Company has repurchased 3,147 shares of its common stock at a total cost of $72,438, including all associated commission costs, since the inception of the 2013 SRP and the 2014 SRP.
The Company did not purchase any of its common stock during the fourth quarter of fiscal 2016. As of August 18, 2016, $27,603 remained available for repurchases under the 2014 SRP.
PERFORMANCE GRAPH - SHAREHOLDER RETURN ON COMMON STOCK
The below graphic comparison assumes the investment of $100 in each of Unifi, Inc. common stock, the NYSE Composite Index (a broad equity market index), the S&P Smallcap 600 Index (a benchmark index containing inclusion characteristics closely associated with the Company), and a peer group historically selected by the Company in good faith (the “Peer Group”), all at June 24, 2011. The resulting cumulative total return assumes that dividends, if any, were reinvested. Past performance is not indicative of future performance.
Including the Company, the Peer Group consists of eight publicly-traded textile companies, the other seven of which are: Albany International Corp., Culp, Inc., The Dixie Group, Inc., Hampshire Group, Limited, Interface, Inc., Lydall, Inc. and Mohawk Industries, Inc.
We have included the S&P Smallcap 600 Index in this year’s stock performance graph because we believe this index provides a better comparison and benchmark against which to measure our stock performance than the custom Peer Group previously used and provides a more appropriate comparison of our stock performance with that of other similar companies. We have retained the Peer Group for this year for comparison purposes, but do not intend to include the Peer Group in our stock performance graph going forward.
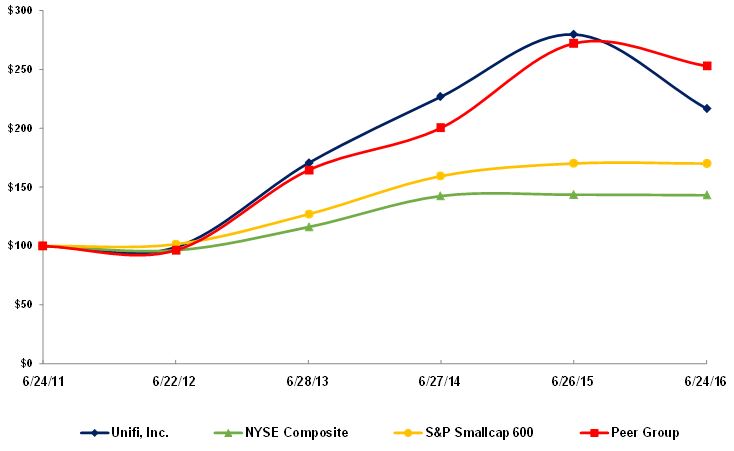 |
|
June 24, 2011 |
June 22, 2012 |
June 28, 2013 |
June 27, 2014 |
June 26, 2015 |
June 24, 2016 |
|||||||||||||||||||
|
Unifi, Inc. |
$ | 100.00 | $ | 98.85 | $ | 170.40 | $ | 226.88 | $ | 279.80 | $ | 216.74 | ||||||||||||
|
NYSE Composite |
100.00 | 96.28 | 116.06 | 142.46 | 143.59 | 143.11 | ||||||||||||||||||
|
S&P Smallcap 600 |
100.00 | 101.43 | 126.97 | 159.39 | 170.10 | 170.05 | ||||||||||||||||||
|
Peer Group |
100.00 | 96.33 | 164.35 | 200.35 | 272.13 | 252.90 | ||||||||||||||||||
Item 6. Selected Financial Data
The following table presents selected historical consolidated financial data (with dollars in thousands, except per share data). The data should be read in conjunction with the Company’s historical consolidated financial statements for each of the periods presented, as well as “Item 7. Management’s Discussion and Analysis of Financial Condition and Results of Operations” in this Annual Report on Form 10-K.
|
For the Fiscal Year Ended |
||||||||||||||||||||
|
June 26, 2016 |
June 28, 2015 |
June 29, 2014 |
June 30, 2013 |
June 24, 2012 |
||||||||||||||||
|
Number of fiscal weeks |
52 | 52 | 52 | 53 | 52 | |||||||||||||||
|
Operations Data: |
||||||||||||||||||||
|
Net sales |
$ | 643,637 | $ | 687,121 | $ | 687,902 | $ | 713,962 | $ | 705,086 | ||||||||||
|
Gross profit |
93,632 | 90,705 | 83,262 | 73,104 | 54,396 | |||||||||||||||
|
Selling, general and administrative expenses |
47,502 | 49,672 | 46,203 | 47,386 | 43,482 | |||||||||||||||
|
Operating income |
42,198 | 38,486 | 31,483 | 22,463 | 8,632 | |||||||||||||||
|
Interest expense |
3,528 | 4,025 | 4,329 | 4,489 | 16,073 | |||||||||||||||
|
Equity in earnings of unconsolidated affiliates (1) |
(8,963 | ) | (19,475 | ) | (19,063 | ) | (11,444 | ) | (19,740 | ) | ||||||||||
|
Income from continuing operations before income taxes |
48,243 | 53,812 | 47,881 | 29,014 | 8,849 | |||||||||||||||
|
Provision (benefit) for income taxes (2) |
15,073 | 13,346 | 20,161 | 13,344 | (1,979 | ) | ||||||||||||||
|
Income from continuing operations, net of tax |
33,170 | 40,466 | 27,720 | 15,670 | 10,828 | |||||||||||||||
|
Net income attributable to Unifi, Inc. |
34,415 | 42,151 | 28,823 | 16,635 | 11,491 | |||||||||||||||
|
Per common share: |
||||||||||||||||||||
|
Net income attributable to Unifi, Inc. |
||||||||||||||||||||
|
Basic |
$ | 1.93 | $ | 2.32 | $ | 1.52 | $ | 0.84 | $ | 0.57 | ||||||||||
|
Diluted |
$ | 1.87 | $ | 2.24 | $ | 1.47 | $ | 0.80 | $ | 0.56 | ||||||||||
|
Cash Flow Data: |
||||||||||||||||||||
|
Net cash provided by operating activities |
$ | 55,975 | $ | 38,903 | $ | 56,357 | $ | 50,509 | $ | 43,309 | ||||||||||
|
Depreciation and amortization expenses |
17,528 | 18,043 | 17,896 | 24,584 | 27,135 | |||||||||||||||
|
Capital expenditures |
52,337 | 25,966 | 19,091 | 8,809 | 6,354 | |||||||||||||||
|
Distributions received from unconsolidated affiliates |
4,732 | 3,718 | 13,214 | 14,940 | 10,616 | |||||||||||||||
|
Cash paid for share repurchases |
6,211 | 10,360 | 36,551 | 19,315 | — | |||||||||||||||
|
Cash dividends declared per common share |
$ | — | $ | — | $ | — | $ | — | $ | — | ||||||||||
|
June 26, 2016 |
June 28, 2015 |
June 29, 2014 |
June 30, 2013 |
June 24, 2012 |
||||||||||||||||
|
Balance Sheet Data: |
||||||||||||||||||||
|
Cash and cash equivalents |
$ | 16,646 | $ | 10,013 | $ | 15,907 | $ | 8,755 | $ | 10,886 | ||||||||||
|
Property, plant and equipment, net |
185,101 | 136,222 | 123,802 | 115,164 | 127,090 | |||||||||||||||
|
Total assets |
526,863 | 476,372 | 468,682 | 455,027 | 481,844 | |||||||||||||||
|
Total debt |
123,012 | 104,110 | 99,488 | 97,753 | 121,552 | |||||||||||||||
|
Total shareholders’ equity |
326,945 | 299,093 | 286,738 | 286,480 | 290,780 | |||||||||||||||
|
(1) |
Equity in earnings of unconsolidated affiliates for fiscal 2015 includes two bargain purchase gains recognized by Parkdale America, LLC for a combined impact to the Company of $4,696. |
|
(2) |
Provision for income taxes for fiscal 2015 includes, among other items, the reversal of $7,639 for the deferred tax liability related to the Company’s indefinite reinvestment assertion, a $3,008 impact related to certain intercompany foreign currency transactions that originated in prior years and were settled in the fourth quarter of fiscal 2015, the release of $3,009 from the valuation allowance primarily in connection with an unconsolidated affiliate, renewable energy credits of $1,036 and net expense recognized for uncertain tax positions of $2,879. |
During fiscal 2014, the Company increased the valuation allowance for certain deferred tax assets, generating additional tax expense of $1,925.
During fiscal 2013, the Company increased the valuation allowance for certain deferred tax assets, generating additional tax expense of $3,243.
During fiscal 2012, the Company released previously recorded valuation allowances against certain of its domestic deferred tax assets, resulting in a $6,017 benefit recorded to income tax expense.
|
Item 7. |
Management’s Discussion and Analysis of Financial Condition and Results of Operations |
The following is management’s discussion and analysis of certain significant factors that have affected the Company’s operations, along with material changes in financial condition, during the periods included in the accompanying Consolidated Financial Statements included in this Annual Report on Form 10-K. Management’s discussion and analysis should be read in conjunction with the remainder of this Annual Report on Form 10-K, with the understanding that “forward-looking statements” may be present. A reference to a “note” refers to the accompanying Notes to Consolidated Financial Statements.
Overview
The Company processes and sells high-volume commodity yarns, specialized yarns designed to meet certain customer specifications, and premium value-added (“PVA”) yarns with enhanced performance characteristics. The Company sells yarns made from polyester and nylon to other yarn manufacturers and knitters and weavers that produce fabric for the apparel, hosiery, home furnishings, automotive upholstery, industrial and other end-use markets. The Company’s polyester products include polyester polymer beads (“Chip”), partially oriented yarn (“POY”), textured, solution and package dyed, twisted, beamed and draw wound yarns. Each polyester product is available in virgin or recycled varieties, where the recycled is made from both pre-consumer yarn waste and post-consumer waste, including plastic bottles. The Company’s nylon products include textured, solution dyed and spandex covered products.
The Company maintains one of the textile industry’s most comprehensive yarn product offerings, and has manufacturing operations in four countries and participates in joint ventures in Israel and the U.S. The Company’s principal geographic markets for its products are located in North America, Central America, South America and Asia. The Company has three reportable segments for its operations - the Polyester Segment, the Nylon Segment and the International Segment – as well as certain ancillary operations that include Repreve Renewables, LLC (“Renewables”), for-hire transportation services and consulting services, which comprise an All Other category. The ancillary operations classified within All Other are insignificant for all periods presented, therefore, the Company’s discussion and analysis of those activities is generally limited to their impact on consolidated results, where appropriate.
The Company reported net income of $34,415, or $1.93 per basic share, for fiscal 2016. Such results reflect (i) growth in sales of PVA products, especially in the International Segment, (ii) lower selling, general and administrative (“SG&A”) expenses than in fiscal 2015 and (iii) lower polyester raw material costs than in fiscal 2015. The International Segment, which was resilient in a difficult economic environment, exhibited strength as the year progressed (especially with sales of PVA products), despite unfavorable impacts from devaluation of the Brazilian currency and soft economic conditions in China. Strong PVA sales are expected to continue to drive favorable results in the Americas and Asia.
Significant Developments and Trends
The Company’s operations in fiscal 2016 remained focused on making improvements to its core business, growing the market for its value-added products, and using cash flow from operations to fund select capital projects, strategic growth opportunities and share repurchases. This focus led to the continuing increase in the Company’s PVA sales as a percentage of its overall sales volume, with sales of PVA products representing approximately 35%, 30% and 27% of consolidated net sales for fiscal 2016, 2015 and 2014, respectively. The Company’s strategy of enriching its product mix through a focus on PVA products helps insulate it from the pressures of low-priced commodity yarn imports and helps to establish the Company as an innovation leader in its core markets.
The Company’s REPREVE® flagship brand continued to grow at a faster pace than other PVA products during fiscal 2016. The increasing success and consumer awareness of the REPREVE® brand continues to provide new opportunities for growth, allowing us to expand into new end-uses and markets for REPREVE®, as well as continuing to grow the brand with current customers.
Fiscal 2016 marks the second of three fiscal years of a significant capital investment plan. Beginning with fiscal 2015, the Company invested approximately $35,000, adding machinery to support expansion of its draw-textured and air-jet textured businesses, launching its third production line in the REPREVE® Recycling Center and installing a 1-megawatt capacity solar farm. In fiscal 2016, the Company invested approximately $60,000 in capital projects, constructing a bottle processing facility, commencing another REPREVE® Recycling Center expansion and enhancing automation systems and existing machinery to handle the increasingly-complex product mix. The Company expects to invest approximately $40,000 in fiscal 2017 to complete the existing significant capital investment plan, completing the fourth production line in the REPREVE® Recycling Center, further enhancing existing assets for supporting growth of the PVA portfolio and fixed asset investments in Asia as prominent brand and retail partners continue to respond well to our strategy to provide PVA products globally.
Alongside its capital projects, the Company has maintained strategic repurchases of shares of its common stock pursuant to its second $50,000 stock repurchase program announced by the Company on April 23, 2014. During fiscal 2016, the Company repurchased a total of 206 shares at an average price of $30.13.
Raw material components represent a significant portion of the Company’s manufactured products. The price of the principal raw materials used by the Company fluctuates frequently, and it is difficult, and often impossible, to predict trends or upcoming developments. During fiscal 2016, 2015 and 2014, the Company operated under a predominantly declining polyester raw material cost environment. The Company believes that polyester raw material costs during most of this time were impacted by lower crude oil values, a lack of major unplanned raw material capacity outages and soft global demand for polyester raw materials. The continuing softness in global crude oil prices is likely to impact the Company’s polyester and nylon raw material costs, but it is not possible to predict the timing or amount of the impact or whether the decline in crude oil prices will stabilize, continue or reverse. In any event, the Company monitors these dynamic factors closely.
During recent years, and most notably in fiscal 2015 and 2016, the Company has been negatively impacted by a devaluation of the Brazilian Real. This devaluation has a significant impact on our net sales and other performance metrics as the results of our Brazilian subsidiary are translated into U.S. Dollars at unfavorable rates. Specifically, the Brazilian Real declined approximately 40% in relation to the U.S. Dollar in fiscal 2015.
Results of Operations
Fiscal 2016, 2015 and 2014 all consisted of 52 weeks. The following table presents a summary of Net income attributable to Unifi, Inc.:
|
For the Fiscal Year Ended |
||||||||||||
|
June 26, 2016 |
June 28, 2015 |
June 29, 2014 |
||||||||||
|
Net sales |
$ | 643,637 | $ | 687,121 | $ | 687,902 | ||||||
|
Cost of sales |
550,005 | 596,416 | 604,640 | |||||||||
|
Gross profit |
93,632 | 90,705 | 83,262 | |||||||||
|
Selling, general and administrative expenses |
47,502 | 49,672 | 46,203 | |||||||||
|
Provision for bad debts |
1,684 | 947 | 287 | |||||||||
|
Other operating expense, net |
2,248 | 1,600 | 5,289 | |||||||||
|
Operating income |
42,198 | 38,486 | 31,483 | |||||||||
|
Interest expense, net |
2,918 | 3,109 | 2,539 | |||||||||
|
Loss on extinguishment of debt |
— | 1,040 | — | |||||||||
|
Other non-operating expense |
— | — | 126 | |||||||||
|
Equity in earnings of unconsolidated affiliates |
(8,963 | ) | (19,475 | ) | (19,063 | ) | ||||||
|
Income before income taxes |
48,243 | 53,812 | 47,881 | |||||||||
|
Provision for income taxes |
15,073 | 13,346 | 20,161 | |||||||||
|
Net income including non-controlling interest |
33,170 | 40,466 | 27,720 | |||||||||
|
Less: net loss attributable to non-controlling interest |
(1,245 | ) | (1,685 | ) | (1,103 | ) | ||||||
|
Net income attributable to Unifi, Inc. |
$ | 34,415 | $ | 42,151 | $ | 28,823 | ||||||
See Note 26 to the Consolidated Financial Statements in this Annual Report on Form 10-K for reconciliations and detail regarding the Company’s reportable segments, discussion and analysis of which follows below.
Key Performance Indicators and Non-GAAP Financial Measures
The Company continuously reviews performance indicators to measure its success. These performance indicators form the basis of management’s discussion and analysis included below:
|
● |
sales volume for the Company and for each of its reportable segments; |
|
● |
unit conversion margin, which represents unit net sales price less unit raw material costs, for the Company and for each of its reportable segments; |
|
● |
gross profit and gross margin for the Company and for each of its reportable segments; |
|
● |
working capital, which represents current assets less current liabilities; |
|
● |
net income and earnings per share for the Company; |
|
● |
Segment Profit, which equals segment gross profit, plus segment depreciation expense; |
|
● |
Earnings Before Interest, Taxes, Depreciation and Amortization (“EBITDA”), which represents net income attributable to Unifi, Inc. before net interest expense, income tax expense and depreciation and amortization expense; |
|
● |
Adjusted EBITDA, which represents EBITDA adjusted to exclude equity in earnings of Parkdale America, LLC (“PAL”); losses on extinguishment of debt; and other operating or non-operating income or expense items necessary to understand and compare the underlying results of the Company. The Company may, from time to time, modify the amounts used to determine its non-GAAP financial measures. In the fourth quarter of fiscal 2016, the Company simplified the calculation of Adjusted EBITDA by eliminating certain adjustments. Most notably, the Company will no longer include an adjustment for non-cash compensation expenses. This simplification is intended to improve the transparency and consistency of management's primary non-GAAP performance metric. Below, the Company has reconciled Adjusted EBITDA under the new definition (applicable in the fourth quarter of fiscal 2016) to Adjusted EBITDA under the previous definition (i.e. as disclosed in the third quarter earnings release, dated April 20, 2016). The Company deems this dual disclosure helpful for external users, most notably in connection with Adjusted EBITDA amounts provided in prior disclosures; |
|
● |
Adjusted Net Income, which excludes certain amounts which management believes do not reflect the ongoing operations and performance of the Company. Adjusted Net Income represents Net income attributable to Unifi, Inc. calculated under GAAP, adjusted to exclude the approximate after-tax impact of certain income or expense items (as well as specific impacts to the provision for income taxes) necessary to understand and compare the underlying results of the Company. The Company may, from time to time, modify the amounts used to determine its non-GAAP financial measures. In the fourth quarter of fiscal 2016, the Company updated the calculation of Adjusted Net Income. Below, the Company has reconciled Adjusted Net Income under the new definition (applicable in the fourth quarter of fiscal 2016) to Adjusted Net Income under the previous definition (i.e. as disclosed in the third quarter earnings release, dated April 20, 2016). The Company deems this dual disclosure helpful for external users, most notably in connection with Adjusted Net Income amounts provided in prior disclosures; |
|
● |
Adjusted EPS (earnings per share), which represents Adjusted Net Income divided by the Company’s basic weighted average common shares outstanding; and |
|
● |
Adjusted Working Capital (receivables plus inventory, less accounts payable and accrued expenses), which is an indicator of the Company’s production efficiency and ability to manage its inventory and receivables. |
EBITDA, Adjusted EBITDA, Adjusted Net Income, Adjusted EPS and Adjusted Working Capital are not determined in accordance with generally accepted accounting principles (“GAAP”) and should not be considered a substitute for performance measures determined in accordance with GAAP. EBITDA, Adjusted EBITDA, Adjusted Net Income, Adjusted EPS and Adjusted Working Capital are non-GAAP financial measurements that management uses to facilitate its analysis and understanding of the Company’s business operations. Management believes they are useful to investors because they provide a supplemental way to understand the underlying operating performance and debt service capacity of the Company. The calculations of EBITDA, Adjusted EBITDA, Adjusted Net Income, Adjusted EPS and Adjusted Working Capital are subjective measures based on management’s belief as to which items should be included or excluded in order to provide the most reasonable view of the underlying operating performance of the business. When applicable, management’s discussion and analysis includes specific consideration for items that comprise the reconciliations of its non-GAAP metrics. See “Select Non-GAAP Reconciliation Information” below for reconciliations of non-GAAP metrics to most directly comparable GAAP metric.
Select Non-GAAP Reconciliation Information
The reconciliations of the amounts reported under GAAP for Net income attributable to Unifi, Inc. to EBITDA, Adjusted EBITDA (as newly defined) and Adjusted EBITDA (as previously defined) are as follows:
|
For the Fiscal Year Ended |
||||||||||||
|
June 26, 2016 |
June 28, 2015 |
June 29, 2014 |
||||||||||
|
Net income attributable to Unifi, Inc. |
$ | 34,415 | $ | 42,151 | $ | 28,823 | ||||||
|
Interest expense, net |
2,884 | 3,109 | 2,539 | |||||||||
|
Provision for income taxes |
15,073 | 13,346 | 20,161 | |||||||||
|
Depreciation and amortization expense |
16,893 | 17,367 | 17,334 | |||||||||
|
EBITDA |
69,265 | 75,973 | 68,857 | |||||||||
|
Equity in earnings of Parkdale America, LLC |
(6,074 | ) | (17,403 | ) | (17,846 | ) | ||||||
|
EBITDA excluding Parkdale, America LLC |
63,191 | 58,570 | 51,011 | |||||||||
|
Key employee transition costs |
2,166 | — | 941 | |||||||||
|
Loss on extinguishment of debt |
— | 1,040 | — | |||||||||
|
Adjusted EBITDA, as newly defined |
$ | 65,357 | $ | 59,610 | $ | 51,952 | ||||||
|
Adjusted EBITDA, as newly defined |
65,357 | 59,610 | 51,952 | |||||||||
|
Non-cash compensation expense |
2,501 | 3,148 | 2,690 | |||||||||
|
Foreign currency transaction losses |
397 | 448 | 504 | |||||||||
|
Net loss on sale or disposal of assets |
(13 | ) | 245 | 475 | ||||||||
|
Restructuring charges, net |
— | — | 332 | |||||||||
|
Other, net |
399 | 871 | 1,420 | |||||||||
|
Adjusted EBITDA, as previously defined |
$ | 68,641 | $ | 64,322 | $ | 57,373 | ||||||
Amounts presented in the reconciliation above may not be consistent with amounts included in the Company’s Consolidated Financial Statements due to the impact of the non-controlling interest in Repreve Renewables, LLC.
The reconciliations of Income before income taxes, Net income attributable to Unifi, Inc. (“Net Income”) to Adjusted Net Income and Basic Earnings Per Share (“Basic EPS”) to Adjusted EPS are detailed in the tables below. Excluding the GAAP results in the tables below, amounts reported under the Net Income columns are generally calculated by applying the statutory tax rate of the jurisdiction for which the amount relates, or, when no impact to Income before income taxes exists, amounts represent components of the respective period’s provision for income taxes.
|
Fiscal Year 2016 |
||||||||||||||||
|
Income Before Income Taxes |
Tax Impact (4) |
Net Income (5) |
Basic EPS |
|||||||||||||
|
GAAP results |
$ | 48,243 | $ | — | $ | 34,415 | $ | 1.93 | ||||||||
|
Key employee transition costs (1) |
2,330 | (673 | ) | 1,493 | 0.08 | |||||||||||
|
Adjusted results, as newly defined (2) |
$ | 50,573 | $ | (673 | ) | $ | 35,908 | $ | 2.01 | |||||||
|
Adjusted results, as newly defined (2) |
$ | 50,573 | $ | (673 | ) | $ | 35,908 | $ | 2.01 | |||||||
|
Change in certain valuation allowances |
— | (461 | ) | (461 | ) | (0.02 | ) | |||||||||
|
Net loss on sale or disposal of assets |
nm | nm | nm | nm | ||||||||||||
|
Adjusted results, as previously defined (3) |
$ | 50,573 | $ | (1,134 | ) | $ | 35,447 | $ | 1.99 | |||||||
|
Weighted average common shares outstanding |
17,857 | |||||||||||||||
|
Fiscal Year 2015 |
||||||||||||||||
|
Income Before Income Taxes |
Tax Impact (4) |
Net Income (5) |
Basic EPS |
|||||||||||||
|
GAAP results |
$ | 53,812 | $ | — | $ | 42,151 | $ | 2.32 | ||||||||
|
Change in deferred tax liability for unremitted foreign earnings assertion |
— | (7,639 | ) | (7,639 | ) | (0.42 | ) | |||||||||
|
Change in deferred tax asset for certain foreign currency transactions |
— | 3,008 | 3,008 | 0.17 | ||||||||||||
|
Change in uncertain tax positions |
— | 2,879 | 2,879 | 0.16 | ||||||||||||
|
Renewable energy tax credits |
— | (1,036 | ) | (1,036 | ) | (0.06 | ) | |||||||||
|
Bargain purchase gains for an equity affiliate (6) |
(4,696 | ) | — | (4,696 | ) | (0.26 | ) | |||||||||
|
Loss on extinguishment of debt |
1,040 | (364 | ) | 676 | 0.03 | |||||||||||
|
Adjusted results, as newly defined (2) |
$ | 50,156 | $ | (3,152 | ) | $ | 35,343 | $ | 1.94 | |||||||
|
Adjusted results, as newly defined (2) |
$ | 50,156 | $ | (3,152 | ) | $ | 35,343 | $ | 1.94 | |||||||
|
Change in certain valuation allowances |
— | (1,506 | ) | (1,506 | ) | (0.08 | ) | |||||||||
|
Net loss on sale or disposal of assets (1) |
778 | 190 | 439 | 0.02 | ||||||||||||
|
Adjusted results, as previously defined (3) |
$ | 50,934 | $ | (4,468 | ) | $ | 34,276 | $ | 1.88 | |||||||
|
Weighted average common shares outstanding |
18,207 | |||||||||||||||
|
Fiscal Year 2014 |
||||||||||||||||
|
Income Before Income Taxes |
Tax Impact (4) |
Net Income (5) |
Basic EPS |
|||||||||||||
|
GAAP results |
$ | 47,881 | $ | — | $ | 28,823 | $ | 1.52 | ||||||||
|
Severance charges |
941 | (329 | ) | 612 | 0.04 | |||||||||||
|
Change in deferred tax liability for unremitted foreign earnings assertion |
— | 249 | 249 | 0.01 | ||||||||||||
|
Change in uncertain tax positions |
— | (174 | ) | (174 | ) | (0.01 | ) | |||||||||
|
Interest income related to judicial claim |
(1,084 | ) | 369 | (715 | ) | (0.04 | ) | |||||||||
|
Adjusted results, as newly defined (2) |
$ | 47,738 | $ | 115 | $ | 28,795 | $ | 1.52 | ||||||||
|
Adjusted results, as newly defined (2) |
$ | 47,738 | $ | 115 | $ | 28,795 | $ | 1.52 | ||||||||
|
Change in certain valuation allowances |
— | 1,925 | 1,925 | 0.10 | ||||||||||||
|
Net restructuring charges |
332 | (117 | ) | 215 | 0.01 | |||||||||||
|
Net loss on sale or disposal of assets |
475 | (166 | ) | 309 | 0.02 | |||||||||||
|
Adjusted results, as previously defined (3) |
$ | 48,545 | $ | 1,757 | $ | 31,244 | $ | 1.65 | ||||||||
|
Weighted average common shares outstanding |
18,919 | |||||||||||||||
(1) Includes transactions for Repreve Renewables, LLC. Therefore, the amounts reflected here consider impacts to the valuation allowances and non-controlling interest.
(2) Calculated under the Company's new definition, as discussed on the previous page.
(3) Calculated under the Company's previous definition, presented here to provide for a comparison to historical amounts discussed and disclosed in prior periods.
(4) Unless otherwise noted, the amount approximates the impact to the provision for income taxes for the respective line item, using a jurisdictional tax rate of 35% for U.S. and 34% for Brazil.
(5) Amounts in this table will not always sum across due to the impact of the non-controlling interest in Repreve Renewables, LLC.
(6) The bargain purchase gains recognized for an equity affiliate did not generate a tax impact for purposes of this reconciliation as the corresponding change in deferred tax expense is offset by a change in the valuation allowance for the Company's investment in the equity affiliate.
nm - Not meaningful.
Review of Fiscal 2016 Results of Operations Compared to Fiscal 2015
Consolidated Overview
The components of Net income attributable to Unifi, Inc., each component as a percentage of net sales, and the percentage increase or decrease over the prior year amounts are presented in the table below. Fiscal 2016 and 2015 both are comprised of 52 weeks.
|
For the Fiscal Year Ended |
||||||||||||||||||||
|
June 26, 2016 |
June 28, 2015 |
|||||||||||||||||||
|
% of Net Sales |
% of Net Sales |
% Change |
||||||||||||||||||
|
Net sales |
$ | 643,637 | 100.0 | $ | 687,121 | 100.0 | (6.3 | ) | ||||||||||||
|
Cost of sales |
550,005 | 85.5 | 596,416 | 86.8 | (7.8 | ) | ||||||||||||||
|
Gross profit |
93,632 | 14.5 | 90,705 | 13.2 | 3.2 | |||||||||||||||
|
Selling, general and administrative expenses |
47,502 | 7.4 | 49,672 | 7.2 | (4.4 | ) | ||||||||||||||
|
Provision for bad debts |
1,684 | 0.2 | 947 | 0.2 | 77.8 | |||||||||||||||
|
Other operating expense, net |
2,248 | 0.3 | 1,600 | 0.2 | 40.5 | |||||||||||||||
|
Operating income |
42,198 | 6.6 | 38,486 | 5.6 | 9.6 | |||||||||||||||
|
Interest expense, net |
2,918 | 0.5 | 3,109 | 0.4 | (6.1 | ) | ||||||||||||||
|
Loss on extinguishment of debt |
— | — | 1,040 | 0.2 | nm | |||||||||||||||
|
Earnings from unconsolidated affiliates |
(8,963 | ) | (1.4 | ) | (19,475 | ) | (2.8 | ) | (54.0 | ) | ||||||||||
|
Income before income taxes |
48,243 | 7.5 | 53,812 | 7.8 | (10.3 | ) | ||||||||||||||
|
Provision for income taxes |
15,073 | 2.4 | 13,346 | 1.9 | 12.9 | |||||||||||||||
|
Net income including non-controlling interest |
33,170 | 5.1 | 40,466 | 5.9 | (18.0 | ) | ||||||||||||||
|
Less: net loss attributable to non-controlling interest |
(1,245 | ) | (0.2 | ) | (1,685 | ) | (0.2 | ) | (26.1 | ) | ||||||||||
|
Net income attributable to Unifi, Inc. |
$ | 34,415 | 5.3 | $ | 42,151 | 6.1 | (18.4 | ) | ||||||||||||
nm – Not meaningful
Consolidated Net Sales
Consolidated net sales for fiscal 2016 decreased by $43,484, or 6.3%, as compared to fiscal 2015.
Consolidated sales volumes decreased 0.7%, concentrated in the Polyester and Nylon Segments, while volumes in the International Segment increased. The slight overall decline in sales volumes was attributable to (i) the Company’s strategic exiting of specific low-margin business, (ii) domestic market softness and supply chain adjustments, partially offset by increased global demand for our PVA yarns.
The Company expects the domestic market softness experienced in fiscal 2016 to have an ongoing impact into the first half of fiscal 2017, but the Company has not identified this matter as a long-term trend.
Consolidated sales pricing declined 5.6%, primarily due to (i) the devaluation of certain foreign currencies versus the U.S. Dollar (approximately $31,000), (ii) a lower proportion of nylon in our product mix and (iii) lower pricing in the Polyester and Nylon Segments as a result of lower raw material costs, partially offset by pricing improvements attributable to the continued success of PVA programs. PVA products comprised approximately 35% of the Company’s consolidated net sales for fiscal 2016 as compared to approximately 30% for fiscal 2015.
Consolidated Gross Profit
Gross profit for fiscal 2016 increased by $2,927, or 3.2%, as compared to fiscal 2015, reflecting strength in the International Segment, partially offset by decreases in the Polyester and Nylon Segments. Gross profit increased for the International Segment due to (i) an increase in sales volumes and margins for our China subsidiary from PVA sales growth and (ii) improved margins in Brazil, partially offset by unfavorable currency translation due to the devaluation of the Brazilian Real and Chinese Renminbi versus the U.S. Dollar. Lower gross profit for the Polyester Segment was primarily attributable to lower sales volumes. Gross profit decreased for the Nylon Segment primarily due to lower sales volumes and devaluation of the Colombian Peso versus the U.S. Dollar, partially offset by improved overall manufacturing efficiencies.
Further details regarding the changes in net sales and gross profit from fiscal 2015 to fiscal 2016 by reportable segment follow.
As of the fourth quarter of fiscal 2016, the Company updated the composition of its Polyester and Nylon Segments for both the current and comparative prior periods, intending to better reflect downstream sales for the respective product lines.
Polyester Segment
The components of Segment Profit, each component as a percentage of net sales, and the percentage increase or decrease over the prior period amounts for the Polyester Segment are as follows:
|
For Fiscal Year Ended |
||||||||||||||||||||
|
June 26, 2016 |
June 28, 2015 |
|||||||||||||||||||
|
% of Net Sales |
% of Net Sales |
% Change |
||||||||||||||||||
|
Net sales |
$ | 383,167 | 100.0 | $ | 396,239 | 100.0 | (3.3 | ) | ||||||||||||
|
Cost of sales |
333,638 | 87.1 | 345,462 | 87.2 | (3.4 | ) | ||||||||||||||
|
Gross profit |
49,529 | 12.9 | 50,777 | 12.8 | (2.5 | ) | ||||||||||||||
|
Depreciation expense |
11,188 | 2.9 | 10,579 | 2.7 | 5.8 | |||||||||||||||
|
Segment Profit |
$ | 60,717 | 15.8 | $ | 61,356 | 15.5 | (1.0 | ) | ||||||||||||
The change in net sales for the Polyester Segment is as follows:
|
Net sales for fiscal 2015 |
$ | 396,239 | ||
|
Decrease in average selling price |
(8,150 | ) | ||
|
Decrease in sales volumes |
(4,922 | ) | ||
|
Net sales for fiscal 2016 |
$ | 383,167 |
The decrease in net sales was attributable to lower sales prices as a result of lower raw material costs (approximately 10% for virgin polyester raw materials), partially offset by an improved sales mix (due to our focus on growing PVA sales). Decreased sales volumes are primarily attributable to (i) the strategic exiting of specific lower-margin commodity business and (ii) lower demand in certain sectors of the retail market, partially offset by growth of PVA yarn volumes.
The change in Segment Profit for the Polyester Segment is as follows:
|
Segment Profit for fiscal 2015 |
$ | 61,356 | ||
|
Decrease in sales volumes |
(761 | ) | ||
|
Increase in underlying margins |
122 | |||
|
Segment Profit for fiscal 2016 |
$ | 60,717 |
The decrease in Segment Profit was attributable to lower sales volumes (as discussed above) and an increase in manufacturing costs, partially offset by the favorable impact of mix enrichment achieved through increased demand for our PVA yarns. Segment Profit, as a percentage of net sales, grew over fiscal 2015, demonstrating mix enrichment.
Polyester Segment net sales and Segment Profit as a percentage of total consolidated amounts were 59.5% and 56.0% for fiscal 2016, compared to 57.7% and 58.1% for fiscal 2015, respectively.
Nylon Segment
The components of Segment Profit, each component as a percentage of net sales, and the percentage increase or decrease over the prior period amounts for the Nylon Segment are as follows:
|
For Fiscal Year Ended |
||||||||||||||||||||
|
June 26, 2016 |
June 28, 2015 |
|||||||||||||||||||
|
% of Net Sales |
% of Net Sales |
% Change |
||||||||||||||||||
|
Net sales |
$ | 131,715 | 100.0 | $ | 149,612 | 100.0 | (12.0 | ) | ||||||||||||
|
Cost of sales |
113,906 | 86.5 | 130,644 | 87.3 | (12.8 | ) | ||||||||||||||
|
Gross profit |
17,809 | 13.5 | 18,968 | 12.7 | (6.1 | ) | ||||||||||||||
|
Depreciation expense |
1,899 | 1.5 | 1,798 | 1.2 | 5.6 | |||||||||||||||
|
Segment Profit |
$ | 19,708 | 15.0 | $ | 20,766 | 13.9 | (5.1 | ) | ||||||||||||
The change in net sales for the Nylon Segment is as follows:
|
Net sales for fiscal 2015 |
$ | 149,612 | ||
|
Decrease in sales volumes |
(13,457 | ) | ||
|
Decrease in average selling price and change in sales mix |
(3,173 | ) | ||
|
Unfavorable currency translation effects |
(1,267 | ) | ||
|
Net sales for fiscal 2016 |
$ | 131,715 |
The decrease in net sales was primarily attributable to (i) lower sales volumes as a result of domestic market weakness and certain inventory adjustments in the supply chain, (ii) a decrease in pricing following the decline in raw material costs, and (iii) currency devaluation of the Colombian Peso versus the U.S. Dollar.
The change in Segment Profit for the Nylon Segment is as follows:
|
Segment Profit for fiscal 2015 |
$ | 20,766 | ||
|
Decrease in sales volumes |
(1,867 | ) | ||
|
Unfavorable currency translation effects (Colombian Peso) |
(329 | ) | ||
|
Improvement in underlying margins |
1,138 | |||
|
Segment Profit for fiscal 2016 |
$ | 19,708 |
The decrease in Segment Profit was primarily attributable to (i) lower sales volume (as discussed above), and (ii) the unfavorable impact of currency devaluation of the Colombian Peso versus the U.S. Dollar. These decreases were partially offset by improved manufacturing efficiencies.
Nylon Segment net sales and Segment Profit as a percentage of total consolidated amounts were 20.5% and 18.2% for fiscal 2016, compared to 21.8% and 19.7% for fiscal 2015, respectively.
International Segment
The components of Segment Profit, each component as a percentage of net sales, and the percentage increase or decrease over the prior period amounts for the International Segment are as follows:
|
For Fiscal Year Ended |
||||||||||||||||||||
|
June 26, 2016 |
June 28, 2015 |
|||||||||||||||||||
|
% of Net Sales |
% of Net Sales |
% Change |
||||||||||||||||||
|
Net sales |
$ | 122,554 | 100.0 | $ | 134,992 | 100.0 | (9.2 | ) | ||||||||||||
|
Cost of sales |
95,666 | 78.1 | 113,556 | 84.1 | (15.8 | ) | ||||||||||||||
|
Gross profit |
26,888 | 21.9 | 21,436 | 15.9 | 25.4 | |||||||||||||||
|
Depreciation expense |
885 | 0.8 | 1,997 | 1.5 | (55.7 | ) | ||||||||||||||
|
Segment Profit |
$ | 27,773 | 22.7 | $ | 23,433 | 17.4 | 18.5 | |||||||||||||
The change in net sales for the International Segment is as follows:
|
Net sales for fiscal 2015 |
$ | 134,992 | ||
|
Unfavorable currency translation effects (Brazilian Real and Chinese Renminbi) |
(29,761 | ) | ||
|
Improvement in average selling price and change in sales mix |
14,233 | |||
|
Increase in sales volumes |
3,090 | |||
|
Net sales for fiscal 2016 |
$ | 122,554 |
The decrease in net sales was primarily attributable to unfavorable currency translation due to the devaluation of the Brazilian Real versus the U.S. Dollar (using a weighted average exchange rate of 3.67 Real/U.S. Dollar versus 2.66) and weakening of the Chinese Renminbi versus the U.S. Dollar. PVA portfolio growth and favorable product and price mix in Brazil led to improvements in average selling price and sales mix. In addition, our Brazilian subsidiary gained market share during the second half of fiscal 2016 as a local competitor closed its operations.
The change in Segment Profit for the International Segment is as follows:
|
Segment Profit for fiscal 2015 |
$ | 23,433 | ||
|
Improvements in underlying margins |
9,098 | |||
|
Increase in sales volumes |
516 | |||
|
Unfavorable currency translation effects (Brazilian Real and Chinese Renminbi) |
(5,274 | ) | ||
|
Segment Profit for fiscal 2016 |
$ | 27,773 |
The increase in Segment Profit for the International Segment was attributable to (i) improved margins in Brazil based on a greater mix of higher-margin manufactured PVA products as well as increased unit conversion margin for both manufactured and resale yarns, (ii) improved margins in China due to the continued growth of PVA programs in Asia and (iii) higher sales volumes as noted in the net sales analysis above. The increase was partially offset by unfavorable currency translation effects due to the devaluation of both the Brazilian Real and Chinese Renminbi against the U.S. Dollar.
International Segment net sales and Segment profit as a percentage of total consolidated amounts were 19.0% and 25.6% for fiscal 2016, compared to 19.6% and 22.2% for fiscal 2015, respectively.
Consolidated Selling, General & Administrative Expenses
The change in SG&A expenses is as follows:
|
SG&A expenses for fiscal 2015 |
$ | 49,672 | ||
|
Decrease in variable compensation |
(1,231 | ) | ||
|
Decrease in non-cash compensation expenses |
(647 | ) | ||
|
Decrease in depreciation and amortization expenses |
(304 | ) | ||
|
Increase in consumer marketing and branding expenses |
888 | |||
|
Decrease due to currency translation, and other net activity |
(876 | ) | ||
|
SG&A expenses for fiscal 2016 |
$ | 47,502 |
Total SG&A expenses were lower versus the prior year period, primarily attributable to (i) a decrease in variable compensation expense due to a smaller pool of executive officers in fiscal 2016, (ii) a decrease in non-cash compensation expense reflecting (a) lower expense for an unfunded supplemental retirement plan driven by lower market performance for an equity index during fiscal 2016 and (b) a comparative decline in the quantity of option awards vesting, (iii) a decrease in depreciation and amortization expenses due to lower amortization of customer lists and (iv) a decrease due to the impact of currency translation. These decreases were partially offset by an increase in consumer marketing and branding expenses resulting from the timing and magnitude of expenses for advertising and sponsorship agreements, primarily for REPREVE®.
Consolidated Provision for Bad Debts
Provision for bad debts increased from $947 for fiscal 2015 to $1,684 for fiscal 2016. The increase primarily reflects a provision for a specific Polyester customer balance, for which the Company has determined a full recovery to be unlikely.
Consolidated Other Operating Expense, Net
Other operating expense, net increased from $1,600 for fiscal 2015 to $2,248 for fiscal 2016, and reflected the following components:
|
For the Fiscal Year Ended |
||||||||
|
June 26, 2016 |
June 28, 2015 |
|||||||
|
Consulting and transition fees for former executive officers |
$ | 1,293 | $ | — | ||||
|
Foreign currency transaction losses |
397 | 448 | ||||||
|
Net (gain) loss on sale or disposal of assets |
(13 | ) | 778 | |||||
|
Other, net |
571 | 374 | ||||||
|
Other operating expense, net |
$ | 2,248 | $ | 1,600 | ||||
The increase was driven by the incurrence of consulting and transition fees related to former executives of the Company, partially offset by a year-over-year decrease in the net impact of asset disposals. Other, net consists of severance charges relating to the transition of certain key employees, partially offset by favorable fair value adjustments for a contingent consideration liability.
During fiscal 2015, Renewables recorded a loss on disposal of assets of $1,322 (before non-controlling interest) relating to certain miscanthus grass which would not be used in the future. Also in fiscal 2015, the Company recognized a gain on sale of assets of $630 relating to the sale of certain land and building assets historically utilized for warehousing in the Polyester Segment.
Consolidated Interest Expense, Net
Interest expense, net decreased from $3,109 for fiscal 2015 to $2,918 for fiscal 2016, and reflected the following components:
|
For the Fiscal Year Ended |
||||||||
|
June 26, 2016 |
June 28, 2015 |
|||||||
|
Interest and fees on ABL Facility |
$ | 2,903 | $ | 3,290 | ||||
|
Other interest |
885 | 273 | ||||||
|
Subtotal of interest on debt obligations |
3,788 | 3,563 | ||||||
|
Amortization of debt financing fees |
407 | 505 | ||||||
|
Mark-to-market adjustment for interest rate swap |
(20 | ) | (83 | ) | ||||
|
Reclassification adjustment for interest rate swap |
77 | 231 | ||||||
|
Interest capitalized to property, plant and equipment, net |
(724 | ) | (191 | ) | ||||
|
Subtotal of other components of interest expense |
(260 | ) | 462 | |||||
|
Total interest expense |
3,528 | 4,025 | ||||||
|
Interest income |
(610 | ) | (916 | ) | ||||
|
Interest expense, net |
$ | 2,918 | $ | 3,109 | ||||
Interest and fees on the ABL Facility decreased in connection with a decline in the weighted average interest rate from 2.8% to 2.3%, partially offset by $177 of fees incurred in fiscal 2016 in connection with the first annual principal reset of the term loan.
The increase in other interest reflects an increase in the average capital lease obligation from $6,286 to $17,583.
The Company capitalized more interest in the current period, driven by increased capital expenditures, the majority of which relate to the construction of a plastic bottle processing facility.
Interest income in each period includes earnings recognized on cash equivalents held globally. Interest income decreased from the comparable prior year period due to a lower average balance of interest-bearing cash equivalents held by our Brazil subsidiary (where interest rates are highest among the Company’s subsidiaries) and changes in currency translation attributable to the devaluation of the Brazilian Real against the U.S. Dollar.
Loss on Extinguishment of Debt
The Company’s amendment of its credit facility during fiscal 2015 established substantially different terms for the term loan portion of the facility (including the replacement of an existing lender), and led the Company to record a loss on extinguishment of debt of $1,040 for the write-off of certain debt financing fees related to the previous credit agreement.
Consolidated Earnings from Unconsolidated Affiliates
For fiscal 2016, the Company generated $48,243 of income before income taxes, of which $8,963 was generated from its investments in unconsolidated affiliates. For fiscal 2015, the Company generated $53,812 of income before income taxes, of which $19,475 was generated from its investments in unconsolidated affiliates. For fiscal 2016, PAL’s corresponding fiscal period consisted of 52 weeks. For fiscal 2015, PAL’s corresponding fiscal period consisted of 53 weeks.
The components of earnings from unconsolidated affiliates are as follows:
|
For the Fiscal Year Ended |
||||||||
|
June 26, 2016 |
June 28, 2015 |
|||||||
|
Earnings from PAL |
$ | (6,074 | ) | $ | (17,403 | ) | ||
|
Earnings from nylon joint ventures |
(2,889 | ) | (2,072 | ) | ||||
|
Total equity in earnings of unconsolidated affiliates |
$ | (8,963 | ) | $ | (19,475 | ) | ||
|
As a percentage of consolidated income before income taxes |
18.6 | % | 36.2 | % | ||||
The Company’s 34% share of PAL’s earnings decreased from $17,403 in fiscal 2015 to $6,074 in fiscal 2016. The decrease is primarily attributable to (i) two bargain purchase gains (combined total of approximately $14,000 for PAL, which equates to approximately $4,700 for the Company) recognized in the prior year period by PAL from the acquisitions of (a) a yarn manufacturer based in Mexico for which PAL previously held a 50% ownership interest and (b) two cotton spinning facilities in the U.S., (ii) lower volumes related to domestic market weakness, (iii) higher start-up and depreciation expenses in connection with recent expansions and (iv) lower operating margins primarily as a result of competitive price pressure.
The remaining change in earnings from unconsolidated affiliates relates to improved combined operating results for the Company’s two nylon extrusion joint ventures that supply POY to the Company’s Nylon Segment, resulting from increased volumes and lower raw material costs.
Consolidated Income Taxes
The change in consolidated income taxes is as follows:
|
For the Fiscal Year Ended |
||||||||
|
June 26, 2016 |
June 28, 2015 |
|||||||
|
Income before income taxes |
$ | 48,243 | $ | 53,812 | ||||
|
Provision for income taxes |
15,073 | 13,346 | ||||||
|
Effective tax rate |
31.2 | % | 24.8 | % | ||||
The effective tax rates for fiscal 2016 and 2015 were favorably impacted by, among other things (i) a lower overall effective tax rate for the Company’s foreign earnings (reflecting free-trade zone sales in El Salvador and lower statutory tax rates in both Brazil and China), (ii) net federal and state credits, (iii) a decrease in the valuation allowance reflecting the recognition of lower taxable income versus book income for the Company’s investment in PAL (for which the Company maintains a full valuation allowance) and (iv) the domestic production activities deduction. Such favorable impacts to the fiscal 2016 and 2015 effective tax rates were partially offset by (a) an increase in the valuation allowance for net operating losses, including Renewables, for which no tax benefit could be recognized, (b) state and local taxes net of the assumed federal benefit and (c) a change in uncertain tax positions.
The effective tax rate increased from 24.8% in fiscal 2015 to 31.2% in fiscal 2016, primarily attributable to certain impacts to the fiscal 2015 effective tax rate that were not components of the fiscal 2016 effective tax rate. In fiscal 2015, the effective tax rate was driven lower by (i) the reversal of the deferred tax liability reflecting the Company’s indefinite reinvestment assertion at that time, generating a benefit of $7,639 and (ii) renewable energy tax credits of $1,036 relating to the installation of a solar farm in Yadkinville, North Carolina. These benefits were partially offset by the unfavorable impact of settling certain intercompany transactions involving the Company’s Brazilian subsidiary, approximating $6,000.
The Company believes activity related to the indefinite reinvestment assertion, combined tax impacts from certain intercompany transactions and renewable energy credits are unlikely to continue in future periods at such magnitude. However, identifying trends in certain components of the provision for income taxes is impracticable.
Consolidated Net Income Attributable to Unifi, Inc.
Net income attributable to Unifi, Inc. for fiscal 2016 was $34,415, or $1.93 per basic share, compared to $42,151, or $2.32 per basic share, for fiscal 2015. After considering the loss on extinguishment of debt of $1,040 recorded in fiscal 2015, the decrease in net income is primarily attributable to (i) a decrease in earnings from PAL (as discussed above), (ii) a more favorable effective tax rate in fiscal 2015, (iii) further unfavorable devaluation of the Brazilian Real versus the U.S. Dollar and (iv) an increase in the provision for bad debts, partially offset by (a) an increase in gross profit, (b) a decrease in SG&A expenses and (c) improved earnings from our nylon joint ventures.
Consolidated Adjusted EBITDA
From fiscal 2015 to 2016, Adjusted EBITDA increased from $64,322 to $68,641 under the Company’s previous definition, while increasing from $59,610 to $65,357 under the Company’s new definition. As discussed earlier, the improvement in gross profit was the primary driver for the increase in Adjusted EBITDA.
Review of Fiscal 2015 Results of Operations Compared to Fiscal 2014
Consolidated Overview
The components of Net income attributable to Unifi, Inc., each component as a percentage of net sales, and the percentage increase or decrease over the prior year amounts are presented in the table below. Fiscal 2015 and 2014 are both comprised of 52 weeks.
|
For the Fiscal Year Ended |
||||||||||||||||||||
|
June 28, 2015 |
June 29, 2014 |
|||||||||||||||||||
|
% of Net Sales |
% of Net Sales |
% Change |
||||||||||||||||||
|
Net sales |
$ | 687,121 | 100.0 | $ | 687,902 | 100.0 | (0.1 | ) | ||||||||||||
|
Cost of sales |
596,416 | 86.8 | 604,640 | 87.9 | (1.4 | ) | ||||||||||||||
|
Gross profit |
90,705 | 13.2 | 83,262 | 12.1 | 8.9 | |||||||||||||||
|
Selling, general and administrative expenses |
49,672 | 7.2 | 46,203 | 6.7 | 7.5 | |||||||||||||||
|
Provision for bad debts |
947 | 0.2 | 287 | — | 230.0 | |||||||||||||||
|
Other operating expense, net |
1,600 | 0.2 | 5,289 | 0.8 | (69.7 | ) | ||||||||||||||
|
Operating income |
38,486 | 5.6 | 31,483 | 4.6 | 22.2 | |||||||||||||||
|
Interest expense, net |
3,109 | 0.4 | 2,539 | 0.4 | 22.4 | |||||||||||||||
|
Loss on extinguishment of debt |
1,040 | 0.2 | — | — | nm | |||||||||||||||
|
Other non-operating expense |
— | — | 126 | — | nm | |||||||||||||||
|
Earnings from unconsolidated affiliates |
(19,475 | ) | (2.8 | ) | (19,063 | ) | (2.8 | ) | 2.2 | |||||||||||
|
Income before income taxes |
53,812 | 7.8 | 47,881 | 7.0 | 12.4 | |||||||||||||||
|
Provision for income taxes |
13,346 | 1.9 | 20,161 | 3.0 | (33.8 | ) | ||||||||||||||
|
Net income including non-controlling interest |
40,466 | 5.9 | 27,720 | 4.0 | 46.0 | |||||||||||||||
|
Less: net loss attributable to non-controlling interest |
(1,685 | ) | (0.2 | ) | (1,103 | ) | (0.2 | ) | 52.8 | |||||||||||
|
Net income attributable to Unifi, Inc. |
$ | 42,151 | 6.1 | $ | 28,823 | 4.2 | 46.2 | |||||||||||||
nm – Not meaningful
Consolidated Net Sales
Consolidated net sales for fiscal 2015 decreased by $781, or 0.1%, as compared to fiscal 2014. The decrease was attributable to (i) unfavorable currency translation due to the devaluation of the Brazilian Real versus the U.S. Dollar and (ii) lower average pricing in the Polyester and Nylon Segments, driven by a reduction in raw material costs and a decline in sales volumes for certain product lines, partially offset by higher sales volumes for (a) regional texturing and (b) the Nylon and International Segments, in addition to revenues from ancillary activities categorized under All Other.
Consolidated sales volumes increased 2.2% from the fiscal 2014 as volumes increased 9.2% in the International Segment, driven by higher manufactured product volumes in Brazil and the success of new programs in China. Polyester Segment sales volumes declined 0.5% as the Company shifted certain production volumes from external sales to internal consumption. This decrease was partially offset by increased textured polyester sales volumes (driven by higher demand for our PVA yarns, primarily REPREVE® products), coupled with growth in the NAFTA and CAFTA regions. Nylon Segment sales volumes increased 0.2%, driven by increased sales of covered nylon yarn, partially offset by lower sales of textured yarns.
Consolidated sales pricing declined 2.3%, primarily due to (i) the devaluation of the Brazilian Real versus the U.S. Dollar and (ii) lower pricing in the Polyester Segment due to lower raw material costs, partially offset by pricing improvements attributable to continued success of PVA programs.
Consolidated Gross Profit
Gross profit for fiscal 2015 increased by $7,443, or 8.9%, as compared to fiscal 2014, reflecting increases in the Polyester and International Segments. Gross profit improvement for the Polyester Segment was primarily driven by higher margins attributable to increased demand for our PVA yarns, coupled with periods of declining raw material costs. Gross profit decreased for the Nylon Segment due to lower margins attributable to a shift in sales mix driven by certain sales programs transitioning from the Nylon Segment to the International Segment, partially offset by increased sales volume for certain covered products as a result of strong demand from the NAFTA and CAFTA regions. Increased gross profit for the International Segment reflects (i) higher sales volumes for Brazil due to favorable pricing conditions for manufactured product, (ii) higher sales volumes in China due to the transition of certain PVA programs from the Nylon Segment and (iii) improved margins and lower converting costs in Brazil on a local currency basis, partially offset by unfavorable currency translation due to the devaluation of the Brazilian Real against the U.S. Dollar. Unfavorable currency translation in the International Segment negatively impacted gross profit by $1,606. Further details regarding the changes in net sales and gross profit from the prior fiscal year follow.
Further details regarding the changes in net sales and gross profit from fiscal 2014 to fiscal 2015 by reportable segment follow.
As of the fourth quarter of fiscal 2016, the Company updated the composition of its Polyester and Nylon Segments for both the current and comparative prior periods, intending to better reflect downstream sales for the respective product lines.
Polyester Segment
The components of Segment Profit, each component as a percentage of net sales, and the percentage increase or decrease over the prior period amounts for the Polyester Segment are as follows:
|
For the Fiscal Year Ended |
||||||||||||||||||||
|
June 28, 2015 |
June 29, 2014 |
|||||||||||||||||||
|
% of Net Sales |
% of Net Sales |
% Change |
||||||||||||||||||
|
Net sales |
$ | 396,239 | 100.0 | $ | 403,699 | 100.0 | (1.8 | ) | ||||||||||||
|
Cost of sales |
345,462 | 87.2 | 356,076 | 88.2 | (3.0 | ) | ||||||||||||||
|
Gross profit |
50,777 | 12.8 | 47,623 | 11.8 | 6.6 | |||||||||||||||
|
Depreciation expense |
10,579 | 2.7 | 9,247 | 2.3 | 14.4 | |||||||||||||||
|
Segment Profit |
$ | 61,356 | 15.5 | $ | 56,870 | 14.1 | 7.9 | |||||||||||||
The change in net sales from fiscal 2014 to fiscal 2015 for the Polyester Segment is as follows:
|
Net sales for fiscal 2014 |
$ | 403,699 | ||
|
Decrease in average selling price |
(5,622 | ) | ||
|
Decrease in sales volumes |
(1,838 | ) | ||
|
Net sales for fiscal 2015 |
$ | 396,239 |
The decrease in net sales was attributable to (i) a lower average selling price for several product lines related to lower raw material costs, partially offset by mix-related improvements and (ii) lower sales volumes for POY, Chip and dyed yarn and a lower average denier. These effects were partially offset by (i) improved sales of textured polyester yarn due to continued growth in the NAFTA and CAFTA regions with greater demand for the Company’s PVA yarns and (ii) $612 of incremental sales associated with acquiring a draw winding business in December 2013. The average denier of our product mix decreased as demand for finer, or lighter weight, yarns, driven by consumer preferences in performance apparel, grew in fiscal 2015.
The change in Segment Profit from fiscal 2014 to fiscal 2015 for the Polyester Segment is as follows:
|
Segment Profit for fiscal 2014 |
$ | 56,870 | ||
|
Improvements in underlying gross margins |
4,745 | |||
|
Decrease in sales volumes |
(259 | ) | ||
|
Segment Profit for fiscal 2015 |
$ | 61,356 |
The increase in Segment Profit was primarily a result of (i) higher underlying gross margins driven by (a) a higher mix of PVA yarns due to increased demand and (b) declining raw material costs (average polyester raw material pricing decreased approximately 14% as compared to fiscal 2014), partially offset by a decrease in sales volumes driven by the factors described in the net sales analysis above.
Polyester Segment net sales and Segment Profit as a percentage of total consolidated amounts were 57.7% and 58.1% for fiscal 2015, compared to 58.7% and 58.3% for fiscal 2014, respectively.
Nylon Segment
The components of Segment Profit, each component as a percentage of net sales, and the percentage increase or decrease over the prior period amounts for the Nylon Segment are as follows:
|
For the Fiscal Year Ended |
||||||||||||||||||||
|
June 28, 2015 |
June 29, 2014 |
|||||||||||||||||||
|
% of Net Sales |
% of Net Sales |
% Change |
||||||||||||||||||
|
Net sales |
$ | 149,612 | 100.0 | $ | 149,297 | 100.0 | 0.2 | |||||||||||||
|
Cost of sales |
130,644 | 87.3 | 129,966 | 87.0 | 0.5 | |||||||||||||||
|
Gross profit |
18,968 | 12.7 | 19,331 | 13.0 | (1.9 | ) | ||||||||||||||
|
Depreciation expense |
1,798 | 1.2 | 2,022 | 1.3 | (11.1 | ) | ||||||||||||||
|
Segment Profit |
$ | 20,766 | 13.9 | $ | 21,353 | 14.3 | (2.7 | ) | ||||||||||||
The change in net sales from fiscal 2014 to fiscal 2015 for the Nylon Segment is as follows:
|
Net sales for fiscal 2014 |
$ | 149,297 | ||
|
Increase in sales volumes |
353 | |||
|
Decrease in pricing and change in sales mix |
(38 | ) | ||
|
Net sales for fiscal 2015 |
$ | 149,612 |
The increase in net sales was attributable to increased sales volumes for certain nylon covered yarn products, partially offset by lower sales volumes for textured nylon yarn. The average selling price remained relatively flat with transitioning of certain PVA sales programs from the U.S. to China, partially offset by other changes in sales mix.
The change in Segment Profit from fiscal 2014 to fiscal 2015 for the Nylon Segment is as follows:
|
Segment Profit for fiscal 2014 |
$ | 21,353 | ||
|
Decrease in underlying gross margins |
(637 | ) | ||
|
Increase in sales volumes |
50 | |||
|
Segment Profit for fiscal 2015 |
$ | 20,766 |
The decrease in Segment Profit was attributable to (i) lower underlying gross margins related to the transitioning of certain PVA sales programs from the U.S. to China, partially offset by (ii) an increase in sales volumes driven by the factors in the above net sales analysis.
Nylon Segment net sales and Segment Profit as a percentage of total consolidated amounts were 21.8% and 19.7% for fiscal 2015, compared to 21.7% and 21.9% for fiscal 2014, respectively.
International Segment
The components of Segment Profit, each component as a percentage of net sales, and the percentage increase or decrease over the prior period amounts for the International Segment are as follows:
|
For the Fiscal Year Ended |
||||||||||||||||||||
|
June 28, 2015 |
June 29, 2014 |
|||||||||||||||||||
|
% of Net Sales |
% of Net Sales |
% Change |
||||||||||||||||||
|
Net sales |
$ | 134,992 | 100.0 | $ | 134,906 | 100.0 | 0.1 | |||||||||||||
|
Cost of sales |
113,556 | 84.1 | 118,598 | 87.9 | (4.3 | ) | ||||||||||||||
|
Gross profit |
21,436 | 15.9 | 16,308 | 12.1 | 31.4 | |||||||||||||||
|
Depreciation expense |
1,997 | 1.5 | 3,032 | 2.2 | (34.1 | ) | ||||||||||||||
|
Segment Profit |
$ | 23,433 | 17.4 | $ | 19,340 | 14.3 | 21.2 | |||||||||||||
The change in net sales from fiscal 2014 to fiscal 2015 for the International Segment is as follows:
|
Net sales for fiscal 2014 |
$ | 134,906 | ||
|
Increase in sales volumes |
11,469 | |||
|
Improvement in pricing and change in sales mix |
4,097 | |||
|
Unfavorable currency translation effects |
(15,480 | ) | ||
|
Net sales for fiscal 2015 |
$ | 134,992 |
The increase in net sales is primarily attributable to a 9.2% increase in sales volumes, reflecting volume increases for both Brazil and China. Brazil’s volumes increased due to (i) growth in PVA sales of air covered and solution dyed polyester yarns for apparel and automotive end-uses, respectively, and (ii) volumes captured as a result of favorable pricing conditions, as devaluation of the local currency made locally manufactured product a more attractive alternative to U.S. Dollar-based competitive imports. China’s sales volumes increased almost 40%, benefiting from several new sales programs, including the transitioning of certain PVA sales programs from the Company’s U.S. operations. The benefit of increased sales volumes and improved pricing and sales mix was partially offset by unfavorable currency translation effects primarily due to the devaluation of the Brazilian Real against the U.S. Dollar (using a weighted average exchange rate of 2.65 Real/U.S. Dollar versus 2.29). China’s average sales price increased more than 10% due to higher volumes of PVA products.
The change in Segment Profit from fiscal 2014 to fiscal 2015 for the International Segment is as follows:
|
Segment Profit for fiscal 2014 |
$ | 19,340 | ||
|
Improvements in underlying operating margins |
3,633 | |||
|
Increase in sales volumes |
1,562 | |||
|
Decrease in net utility costs |
945 | |||
|
Unfavorable currency translation effects |
(2,047 | ) | ||
|
Segment Profit for fiscal 2015 |
$ | 23,433 |
The increase in Segment Profit was attributable to (i) an increase in sales volumes for both Brazil and China, driven by the factors described in the net sales analysis above, (ii) improved margins on certain PVA products for China, along with improved unit conversion margin in Brazil on a local-currency basis due to a higher proportion of manufactured product in the sales mix and lower raw material costs and (iii) lower net utility costs in Brazil. This increase was partially offset by unfavorable currency translation effects due to the devaluation of the Brazilian Real against the U.S. Dollar.
International Segment net sales and Segment Profit as a percentage of total consolidated amounts were 19.6% and 22.2% for fiscal 2015, compared to 19.6% and 19.8% for fiscal 2014, respectively.
Consolidated Selling, General & Administrative Expenses
The change in SG&A expenses from fiscal 2014 to fiscal 2015 is as follows:
|
SG&A expenses for fiscal 2014 |
$ | 46,203 | ||
|
Increase for Renewables |
1,396 | |||
|
Increase in consumer marketing and branding expenses |
1,022 | |||
|
Increase in professional fees |
1,255 | |||
|
Increase in non-cash compensation |
458 | |||
|
Decrease in depreciation and amortization expenses |
(142 | ) | ||
|
Decrease due to currency translation and other activity |
(520 | ) | ||
|
SG&A expenses for fiscal 2015 |
$ | 49,672 |
Total SG&A expenses were higher versus fiscal 2014, with changes among various components, including: (i) an increase in expenses recorded for Renewables classified as SG&A (in fiscal 2014, all expenses for Renewables were recorded to other operating expense, net), (ii) an increase in consumer marketing and branding expenses resulting from new sponsorship agreements involving Marvel Universe LIVE!, the National Football League’s Detroit Lions, the University of North Carolina at Chapel Hill and the North Face Endurance Challenge Series, which exceeded the prior year period expenses related to the Company’s sponsorship of the ESPN X Games Aspen 2014, (iii) an increase in professional fees related to out-sourced auxiliary services for tax and legal services and (iv) an increase in non-cash compensation primarily due to an increase in (a) the number of equity awards granted and (b) the fair value of equity awards granted as a result of the trending higher price of the Company’s common stock leading up to the respective grant dates. These increases were partially offset by a decrease in depreciation and amortization expenses due to lower amortization of customer lists and a net decrease in currency translation.
Consolidated Provision for Bad Debts
Provision for bad debts increased from $287 for fiscal 2014 to $947 for fiscal 2015. The increase is primarily attributable to the net write-off of a customer receivable for $498 originating in the Company’s Brazilian operations, for which recovery has been deemed unlikely.
Consolidated Other Operating Expense, Net
Other operating expense, net decreased from $5,289 for fiscal 2014 to $1,600 for fiscal 2015, and reflected the following components:
|
For the Fiscal Year Ended |
||||||||
|
June 28, 2015 |
June 29, 2014 |
|||||||
|
Net loss on sale or disposal of assets |
$ | 778 | $ | 475 | ||||
|
Foreign currency transaction losses |
448 | 504 | ||||||
|
Operating expenses for Renewables |
— | 2,749 | ||||||
|
Restructuring charges, net |
— | 1,273 | ||||||
|
Other, net |
374 | 288 | ||||||
|
Other operating expense, net |
$ | 1,600 | $ | 5,289 | ||||
During fiscal 2015, Renewables recorded a loss on disposal of assets of $1,322 (before non-controlling interest) relating to certain miscanthus grass which would not be used in the future. Also in fiscal 2015, the Company recognized a gain on sale of assets of $630 relating to the sale of certain land and building assets historically utilized for warehousing in the Polyester Segment.
The operating expenses for Renewables in fiscal 2015 were charged to cost of sales and SG&A expenses for $2,396 and $1,396, respectively. In the prior year, all operating expenses for Renewables of $2,749 (net of $144 of revenues) were charged to other operating expense, net.
Restructuring charges of $1,273 were recorded in fiscal 2014 for certain (i) equipment relocation and reinstallation costs and (ii) severance charges in connection with a former executive officer. There were no restructuring charges recorded in fiscal 2015.
Consolidated Interest Expense, Net
Interest expense, net increased from $2,539 for fiscal 2014 to $3,109 for fiscal 2015, and reflected the following components:
|
For the Fiscal Year Ended |
||||||||
|
June 28, 2015 |
June 29, 2014 |
|||||||
|
Interest on ABL Facility |
$ | 3,290 | $ | 3,292 | ||||
|
Other |
273 | 192 | ||||||
|
Subtotal of interest on debt obligations |
3,563 | 3,484 | ||||||
|
Amortization of debt financing fees |
505 | 424 | ||||||
|
Mark-to-market adjustment for interest rate swap |
(83 | ) | 39 | |||||
|
Reclassification adjustment for interest rate swap |
231 | 554 | ||||||
|
Interest capitalized to property, plant and equipment, net |
(191 | ) | (172 | ) | ||||
|
Subtotal of other components of interest expense |
462 | 845 | ||||||
|
Total interest expense |
4,025 | 4,329 | ||||||
|
Interest income |
(916 | ) | (1,790 | ) | ||||
|
Interest expense, net |
$ | 3,109 | $ | 2,539 | ||||
Although comparatively flat, interest on debt obligations was impacted by (i) an increase in the annual average debt balance from $97,566 for fiscal 2014 to $110,640 for fiscal 2015, while (ii) the annual weighted average interest rate declined from 3.4% to 3.1%. The $13,074 increase in the average outstanding debt balance was primarily a result of new capital leases recognized in fiscal 2015, along with incremental capital expenditures. The annual weighted average interest rate decline is primarily due to favorable amended terms of the Company’s credit agreement.
Interest income in each period includes earnings recognized on cash equivalents held globally. Interest income in fiscal 2014 also includes $1,084 of interest received related to the settlement of a judicial claim involving the Company’s Brazilian subsidiary and $141 of interest received on the return of a deposit with a domestic utility company.
Loss on Extinguishment of Debt
The Company’s amendment of its credit facility during fiscal 2015 established substantially different terms for the term loan portion of the facility (including the replacement of an existing lender), and led the Company to record a loss on extinguishment of debt of $1,040 for the write-off of certain debt financing fees related to the previous credit agreement.
Consolidated Earnings from Unconsolidated Affiliates
The components of earnings from unconsolidated affiliates are as follows:
|
For the Fiscal Year Ended |
||||||||
|
June 28, 2015 |
June 29, 2014 |
|||||||
|
Earnings from PAL |
$ | (17,403 | ) | $ | (17,846 | ) | ||
|
Earnings from nylon joint ventures |
(2,072 | ) | (1,217 | ) | ||||
|
Total equity in earnings of unconsolidated affiliates |
$ | (19,475 | ) | $ | (19,063 | ) | ||
|
As a percentage of consolidated income before income taxes |
36.2 | % | 39.8 | % | ||||
For fiscal 2015, PAL’s corresponding fiscal period consisted of 53 weeks.
The Company’s 34% share of PAL’s earnings decreased from $17,846 in fiscal 2014 to $17,403 in fiscal 2015, primarily attributable to lower earnings recognized under the Farm Bill’s economic adjustment assistance program (of approximately $6,100 for PAL, which equates to approximately $2,100 for the Company) in the current year as compared to the prior year and lower operating margins. The decrease is partially offset by two bargain purchase gains in fiscal 2015 (combined total of approximately $14,000 for PAL, which equates to approximately $4,700 for the Company) from PAL’s acquisition of (i) a yarn manufacturer based in Mexico for which PAL previously held a 50% ownership interest and (ii) two cotton spinning facilities in the U.S.
The remaining change in earnings from unconsolidated affiliates relates to higher combined operating results, due to improved margins, for the Company’s two nylon extrusion joint ventures that supply POY to the Company’s Nylon Segment.
Consolidated Income Taxes
The change in consolidated income taxes is as follows:
|
For the Fiscal Year Ended |
||||||||
|
June 28, 2015 |
June 29, 2014 |
|||||||
|
Income before income taxes |
$ | 53,812 | $ | 47,881 | ||||
|
Provision for income taxes |
13,346 | 20,161 | ||||||
|
Effective tax rate |
24.8 | % | 42.1 | % | ||||
The effective tax rate for fiscal 2015 and fiscal 2014 reflects the following benefits: (i) free-trade zone favorability in El Salvador and lower statutory tax rates in both Brazil and China, (ii) the domestic production activities deduction and (iii) certain federal and state credits, such as the research credit. Such benefits are partially offset by: (a) state and local taxes assessed in the U.S., (b) withholding taxes on intercompany dividends in certain jurisdictions and (c) losses in jurisdictions for which no benefit can be recognized.
The effective tax rate decreased from 42.1% in fiscal 2014 to 24.8% in fiscal 2015, primarily attributable to certain impacts to the fiscal 2015 effective tax rate that were not components of the fiscal 2014 effective tax rate. In fiscal 2015, the effective tax rate was driven lower by (i) the reversal of the deferred tax liability reflecting the Company’s indefinite reinvestment assertion at that time, generating a benefit of $7,639 and (ii) renewable energy tax credits of $1,036 relating to the installation of a solar farm in Yadkinville, North Carolina. These benefits were partially offset by the unfavorable impact of settling certain intercompany transactions involving the Company’s Brazilian subsidiary, approximating $6,000. Lastly, the effective tax rate for fiscal 2015 was favorably impacted by a decrease in the valuation allowance for the Company’s investment in PAL whereas the fiscal 2014 rate was unfavorably impacted by an increase in that same valuation allowance.
The Company believes activity related to the indefinite reinvestment assertion, combined tax impacts from certain intercompany transactions and renewable energy credits are unlikely to continue in future periods at such magnitude. However, identifying trends in certain components of the provision for income taxes is impracticable.
Consolidated Net Income Attributable to Unifi, Inc.
Net income attributable to Unifi, Inc. for fiscal 2015 was $42,151, or $2.32 per basic share, compared to $28,823, or $1.52 per basic share, for fiscal 2014. As discussed earlier, the increase is primarily attributable to a lower effective tax rate and higher gross profits, partially offset by higher SG&A expenses.
Consolidated Adjusted EBITDA
From fiscal 2014 to 2015, Adjusted EBITDA increased from $57,373 to $64,322 under the Company’s previous definition, while increasing from $51,952 to $59,610 under the Company’s new definition. As discussed earlier, the improvement in gross profit was the primary driver for the increase in Adjusted EBITDA.
Liquidity and Capital Resources
The Company’s primary capital requirements are for working capital, capital expenditures, debt service and stock repurchases. The Company’s primary sources of capital are cash generated from operations and borrowings available under the ABL Revolver of its credit facility. For fiscal 2016, cash generated from operations was $55,975, and at June 26, 2016, excess availability under the ABL Revolver was $68,612.
As of June 26, 2016, $118,877 of the Company’s $123,012 of debt obligations were guaranteed by the Company or certain of its domestic operating subsidiaries, while nearly all of the Company’s cash and cash equivalents were held by other subsidiaries within the consolidated group (Renewables and foreign subsidiaries). Cash and cash equivalents held by such other subsidiaries may not be presently available to fund the Company’s domestic capital requirements, including its domestic debt obligations. The Company employs a variety of tax planning and financing strategies to ensure that its worldwide cash is available in the locations where it is needed. The following table presents a summary of cash and cash equivalents, liquidity, working capital and total debt obligations as of June 26, 2016:
|
U.S. |
Brazil |
Renewables (2) |
Others |
Total |
||||||||||||||||
|
Cash and cash equivalents |
$ | 12 | $ | 3,397 | $ | 1,483 | $ | 11,754 | $ | 16,646 | ||||||||||
|
Borrowings available under financing arrangements (1) |
68,612 | — | — | — | 68,612 | |||||||||||||||
|
Liquidity |
$ | 68,624 | $ | 3,397 | $ | 1,483 | $ | 11,754 | $ | 85,258 | ||||||||||
|
Working capital |
$ | 71,677 | $ | 36,789 | $ | 1,642 | $ | 26,476 | $ | 136,584 | ||||||||||
|
Total debt obligations |
$ | 118,877 | $ | — | $ | 4,135 | $ | — | $ | 123,012 | ||||||||||
|
(1) |
Excludes consideration for amounts available under a construction financing arrangement as such borrowings are specific to a capital project. For additional information, see “—Construction Financing” within Debt Obligations below. |
|
(2) |
Although Renewables operates in the U.S., presenting its liquidity measures separate from U.S. operations provides a more accurate depiction of the Company’s domestic liquidity. |
As of June 26, 2016, U.S. income taxes were not provided for on a cumulative total of approximately $78,300 of undistributed earnings and profits of the Company’s foreign subsidiaries as the Company currently intends to reinvest these earnings in these foreign operations indefinitely. If at a later date, these earnings were repatriated to the U.S., the Company would be required to pay taxes on these amounts. Nevertheless, in future periods, the Company will continue to assess the existing circumstances, including any changes in tax laws, and reevaluate the necessity for any deferred tax liability. Determination of the amount of any deferred tax liability on these undistributed earnings is not practicable.
Debt Obligations
The following table presents the total balances outstanding for the Company’s debt obligations, their scheduled maturity dates and the weighted average interest rates for borrowings as well as the applicable current portion of long-term debt:
|
Weighted Average |
Principal Amounts as of |
|||||||||||||||
|
Scheduled Maturity Date |
Interest Rate as of June 26, 2016 (1) |
June 26, 2016 |
June 28, 2015 |
|||||||||||||
|
ABL Revolver |
March 2020 |
2.5% | $ | 6,200 | $ | 5,000 | ||||||||||
|
ABL Term Loan |
March 2020 |
2.3% | 90,250 | 82,125 | ||||||||||||
|
Capital lease obligations |
(2) | (3) | 15,798 | 15,735 | ||||||||||||
|
Construction financing |
(4) | (4) | 6,629 | — | ||||||||||||
|
Renewables’ term loan |
August 2022 |
3.7% | 4,000 | — | ||||||||||||
|
Renewables’ promissory note |
September 2020 |
3.0% | 135 | — | ||||||||||||
|
Term loan from unconsolidated affiliate |
(5) | (5) | — | 1,250 | ||||||||||||
|
Total debt |
123,012 | 104,110 | ||||||||||||||
|
Current portion of Renewables’ promissory note |
(25 | ) | — | |||||||||||||
|
Current portion of capital lease obligations |
(4,261 | ) | (3,385 | ) | ||||||||||||
|
Current portion of long-term debt |
(9,500 | ) | (9,000 | ) | ||||||||||||
|
Total long-term debt |
$ | 109,226 | $ | 91,725 | ||||||||||||
|
(1) |
The weighted average interest rate as of June 26, 2016 for the ABL Term Loan includes the effects of the interest rate swap with a notional balance of $50,000. |
|
(2) |
Scheduled maturity dates for capital lease obligations range from January 2017 to November 2027. |
|
(3) |
Interest rates for capital lease obligations range from 2.3% to 4.6%. |
|
(4) |
Refer to the discussion below under the subheading “—Construction Financing” for further information. |
|
(5) |
Refer to the discussion below under the subheading “—Term Loan from Unconsolidated Affiliate” for further information. |
On March 26, 2015, the Company and its subsidiary, Unifi Manufacturing, Inc., entered into an Amended and Restated Credit Agreement (as subsequently amended, the “Amended Credit Agreement”) for a $200,000 senior secured credit facility (the “ABL Facility”) with a syndicate of lenders. The ABL Facility consists of a $100,000 revolving credit facility (the “ABL Revolver”) and a term loan that can be reset up to a maximum amount of $100,000, once per fiscal year, if certain conditions are met (the “ABL Term Loan”). Such a principal increase occurred in November 2015, as described below under the subheading “—Second Amendment.” The ABL Facility has a maturity date of March 26, 2020.
The Amended Credit Agreement replaced a previous senior secured credit facility dated May 24, 2012 with a similar syndicate of lenders, which, after multiple amendments, would have matured on March 28, 2019 and consisted of a $100,000 revolving credit facility and a $90,000 term loan. As used herein, the terms “ABL Facility,” “ABL Revolver” and “ABL Term Loan” shall mean the senior secured credit facility, the revolving credit facility or the term loan, respectively, under the Amended Credit Agreement or the previous senior secured credit facility, as applicable.
ABL Facility
The ABL Facility is secured by a first-priority perfected security interest in substantially all owned property and assets (together with proceeds and products) of Unifi, Inc., Unifi Manufacturing, Inc. and certain subsidiary guarantors (the “Loan Parties”). It is also secured by a first-priority security interest in all (or 65% in the case of certain first-tier controlled foreign corporations, as required by the lenders) of the stock of (or other ownership interests in) each of the Loan Parties (other than the Company) and certain subsidiaries of the Loan Parties, together with all proceeds and products thereof.
If excess availability under the ABL Revolver falls below the defined Trigger Level, a financial covenant requiring the Loan Parties to maintain a fixed charge coverage ratio on a monthly basis of at least 1.05 to 1.0 becomes effective. The Trigger Level as of June 26, 2016 was $23,781. In addition, the ABL Facility contains restrictions on particular payments and investments, including certain restrictions on the payment of dividends and share repurchases. Subject to specific provisions, the ABL Term Loan may be prepaid at par, in whole or in part, at any time before the maturity date, at the Company’s discretion.
ABL Facility borrowings bear interest at the London Interbank Offer Rate (“LIBOR”) plus an applicable margin of 1.50% to 2.00%, or the Base Rate plus an applicable margin of 0.50% to 1.00%, with interest currently being paid on a monthly basis. The applicable margin is based on (a) the excess availability under the ABL Revolver and (b) the consolidated leverage ratio, calculated by fiscal quarter. The Base Rate means the greater of (i) the prime lending rate as publicly announced from time to time by Wells Fargo, (ii) the Federal Funds Rate plus 0.5%, and (iii) LIBOR plus 1.0%. The Company’s ability to borrow under the ABL Revolver is limited to a borrowing base equal to specified percentages of eligible accounts receivable and inventory and is subject to certain conditions and limitations. There is also a monthly unused line fee under the ABL Revolver of 0.25%.
As of June 26, 2016, the Company was in compliance with all financial covenants and the excess availability under the ABL Revolver was $68,612. At June 26, 2016, the fixed charge coverage ratio was 1.93 to 1.0 and the Company had $200 of standby letters of credit, none of which have been drawn upon.
Second Amendment
On November 19, 2015, the Company entered into the Second Amendment to Amended and Restated Credit Agreement (“Second Amendment”). The Second Amendment increased the percentage applied to real estate valuations, on a one-time basis, from 60% to 75%, for purposes of calculating the Term Loan collateral. Simultaneous to entering into the Second Amendment, the Company entered into the Fourth Amended and Restated Term Note, thereby resetting the ABL Term Loan balance to $95,000. Pursuant to the Second Amendment, the ABL Term Loan is subject to quarterly amortizing payments of $2,375.
Capital Lease Obligations
During fiscal 2016, the Company entered into capital leases with an aggregate present value of $4,154. Fixed interest rates for these capital leases range from 3.4% to 3.8%, with maturity dates in August 2020.
Construction Financing
In December 2015, the Company entered into an agreement with a third party lender that provides for construction-period financing for certain build-to-suit assets. The Company will record project costs to construction in progress and the corresponding liability to construction financing (within long-term debt). The agreement provides for monthly, interest-only payments during the construction period, at a rate of 3.5%, and contains terms customary for a financing of this type.
The agreement provides for 60 monthly payments, which will commence at the earlier of the completion of the construction period or July 1, 2017, with an interest rate of 3.2%.
In connection with this construction financing arrangement, the Company has recorded (i) $210 of deferred financing fees and (ii) long-term debt of $6,629 (to reflect $790 of proceeds for construction financing and $5,839 for construction in progress paid by the third party lender).
Renewables’ Term Loan
In September 2015, Renewables entered into a secured debt financing arrangement consisting of a master loan agreement and corresponding term loan supplement, with unrelated parties, having a borrowing capacity of up to $4,000. In October 2015, Renewables borrowed $4,000. The agreements include representations and warranties made by Renewables, financial covenants, affirmative and negative covenants and events of default that are usual and customary for financings of this type. Borrowings bear interest at LIBOR plus an applicable margin of 3.25%, payable monthly in arrears. Principal payments of $111 per month begin in September 2019 and are payable through July 2022, followed by a final payment equal to the remaining unpaid principal balance in August 2022. In connection with this arrangement, a subsidiary of the Company is subject to joint and several liability in the event of recourse by the lenders.
Renewables’ Promissory Note
In September 2015, Renewables delivered a promissory note in the amount of $135, and cash, to an unrelated third party for the purchase of certain land, consisting of thirty-seven acres located in Seven Springs, North Carolina, valued at $191. Such promissory note bears fixed interest at 3.0%, with principal and interest payable annually over a five-year period.
Term Loan from Unconsolidated Affiliate
On August 30, 2012, a foreign subsidiary of the Company entered into an unsecured loan agreement under which it borrowed $1,250 from an unconsolidated affiliate, U.N.F. Industries Ltd. The entire principal balance was repaid in April 2016.
Scheduled Debt Maturities
The following table presents the scheduled maturities of the Company’s outstanding debt obligations for the following five fiscal years and thereafter:
|
Scheduled Maturities on a Fiscal Year Basis |
||||||||||||||||||||||||
|
2017 |
2018 |
2019 |
2020 |
2021 |
Thereafter |
|||||||||||||||||||
|
ABL Revolver |
$ | — | $ | — | $ | — | $ | 6,200 | $ | — | $ | — | ||||||||||||
|
ABL Term Loan |
9,500 | 9,500 | 9,500 | 61,750 | — | — | ||||||||||||||||||
|
Renewables’ promissory note |
25 | 26 | 27 | 28 | 29 | — | ||||||||||||||||||
|
Renewables’ term loan |
— | — | — | 1,111 | 1,333 | 1,556 | ||||||||||||||||||
|
Capital lease obligations |
4,261 | 4,128 | 4,058 | 2,542 | 171 | 638 | ||||||||||||||||||
|
Total (1) |
$ | 13,786 | $ | 13,654 | $ | 13,585 | $ | 71,631 | $ | 1,533 | $ | 2,194 | ||||||||||||
|
(1) |
Total reported excludes $6,629 for construction financing, described above. |
Further discussion of the terms and conditions of the Amended Credit Agreement and Company’s existing indebtedness is outlined in Note 12 to the Consolidated Financial Statements in this Annual Report on Form 10-K.
Working Capital
The following table presents the components of working capital and the reconciliation from working capital to Adjusted Working Capital:
|
June 26, 2016 |
June 28, 2015 |
|||||||
|
Cash and cash equivalents |
$ | 16,646 | $ | 10,013 | ||||
|
Receivables, net |
83,422 | 83,863 | ||||||
|
Inventories |
103,532 | 111,615 | ||||||
|
Other current assets |
8,292 | 7,473 | ||||||
|
Accounts payable |
(41,593 | ) | (45,023 | ) | ||||
|
Accrued expenses |
(18,474 | ) | (16,640 | ) | ||||
|
Other current liabilities |
(15,241 | ) | (13,061 | ) | ||||
|
Working capital |
$ | 136,584 | $ | 138,240 | ||||
|
Less: Cash and cash equivalents |
(16,646 | ) | (10,013 | ) | ||||
|
Less: Other current assets |
(8,292 | ) | (7,473 | ) | ||||
|
Less: Other current liabilities |
15,241 | 13,061 | ||||||
|
Adjusted Working Capital |
$ | 126,887 | $ | 133,815 | ||||
Working capital decreased from $138,240 as of June 28, 2015 to $136,584 as of June 26, 2016, while Adjusted Working Capital decreased from $133,815 to $126,887. Working capital and Adjusted Working Capital are within the range of management’s expectations based on the composition of the underlying business and global structure. The increase in cash and cash equivalents reflects working capital requirements for expansion of international operations and Renewables. The decrease in inventories is primarily attributable to lower raw material pricing and devaluation of the Brazilian Real versus the U.S. Dollar, as inventory units were essentially unchanged. The decrease in accounts payable is primarily attributable to lower raw material pricing. The increase in accrued expenses is primarily attributable to the reclassification out of long-term liabilities of certain amounts payable in November 2016 under a supplemental unfunded retirement plan, along with certain consulting and transition fees payable within twelve months. Other current liabilities reflects the current portion of long-term debt and income taxes payable, for which there are no notable significant fluctuations.
Capital Projects
During fiscal 2016, we invested approximately $60,000 in capital projects, as we (i) neared completion of a bottle processing plant at an existing facility in Reidsville, North Carolina, (ii) commenced an expansion of our REPREVE® Recycling Center which will allow the Company to increase its annual production capacity to approximately 100 million pounds, (iii) enhanced our automation systems in our Yadkinville, North Carolina POY facility to handle the increasingly-complex product mix, (iv) converted more machinery to accommodate smaller production runs, and (v) further increased our air jet texturing capacity to capture more market share through our position as the leading technical and quality producer. These initiatives were designed to support our mix enrichment strategies, while also improving our ability to service customers.
In fiscal 2017, the Company expects to invest an additional $40,000 in capital projects, which includes (i) completing the fourth REPREVE® Recycling Center expansion near the end of fiscal 2017, (ii) additional machinery modifications to meet the ever-changing demands of the market and (iii) investments in Asia to support growth as prominent brand and retail partners continue to respond well to our strategy to provide PVA products globally. The Company will seek to ensure maintenance capital expenditures are sufficient to allow continued production at high efficiencies. As the bottle processing plant begins operating in August 2016, our goal is to continue support for REPREVE® by securing a stream of high-quality raw materials. This, combined with technology advancements in recycling that will be incorporated into the fiscal 2017 recycling expansion, will enhance our ability to grow REPREVE® into other markets such as nonwovens, carpet fiber and packaging.
The total amount ultimately invested for fiscal 2017 could be more or less depending on the timing and scale of contemplated initiatives, and is expected to be funded by a combination of cash from operations, borrowings under the ABL Revolver and a construction financing arrangement. The Company expects the capital projects undertaken over the course of fiscal 2016 and 2017 to provide benefits to future profitability. The additional assets from these capital projects consist primarily of machinery and equipment.
As a result of our continued focus on REPREVE® and other PVA yarns as part of our mix enrichment strategy, we may incur additional expenditures for capital projects beyond the currently estimated amount, as we pursue new, currently unanticipated, opportunities in order to expand our manufacturing capabilities for these products, for other strategic growth initiatives or to further streamline our manufacturing process, in which case we may be required to increase the amount of our working capital and long-term borrowings. If our strategy is successful, we would expect higher gross profit as a result of the combination of potentially higher sales volumes and an improved mix from higher-margin products.
Stock Repurchase Program
During fiscal 2014, the Company completed its repurchase of shares under its initial $50,000 stock repurchase program that had been announced by the Company on January 22, 2013 (the “2013 SRP”). On April 23, 2014, the Company announced a second stock repurchase program (the “2014 SRP”) to authorize the Company to acquire up to an additional $50,000 of common stock. Under the 2014 SRP (as was the case under the 2013 SRP), the Company is authorized to repurchase shares at prevailing market prices, through open market purchases or privately negotiated transactions at such times and prices and in such manner as determined by management, subject to market conditions, applicable legal requirements, contractual obligations and other factors. Repurchases, if any, are expected to be financed through cash generated from operations and borrowings under the Company’s ABL Revolver, and are subject to applicable limitations and restrictions as set forth in the ABL Facility. The 2014 SRP has no stated expiration or termination date, and there is no time limit or specific time frame otherwise for repurchases. The Company may discontinue repurchases at any time that management determines additional purchases are not beneficial or advisable.
The Company repurchased a total of 206 shares during fiscal 2016, at an average price of $30.13. As of June 26, 2016, the Company has repurchased a total of 3,147 shares, at an average price of $23.01 (for a total of $72,438 inclusive of commission costs) pursuant to its two Board-approved stock repurchase programs. $27,603 remains available under the 2014 SRP as of August 18, 2016.
Liquidity Summary
The Company has met its historical liquidity requirements for working capital, capital expenditures, debt service requirements and other operating needs from its cash flows from operations and available borrowings. The Company believes that its existing cash balances, cash provided by operating activities, and borrowings available under the ABL Revolver will enable the Company to comply with the terms of its indebtedness and meet its foreseeable liquidity requirements. Domestically, the Company’s cash balances, cash provided by operating activities and borrowings available under the ABL Revolver continue to be sufficient to fund the Company’s domestic operating activities as well as cash commitments for its investing and financing activities. For its existing foreign operations, the Company expects its existing cash balances and cash provided by operating activities will provide the needed liquidity to fund its foreign operating activities and any foreign investing activities, such as future capital expenditures. However, expansion of our foreign operations may require cash sourced from our domestic subsidiaries.
Cash Provided by Operating Activities
The significant components of net cash provided by operating activities are summarized below. The Company analyzes net cash provided by operating activities utilizing the major components of the statements of cash flows under the indirect method.
|
For The Fiscal Year Ended |
||||||||||||
|
June 26, 2016 |
June 28, 2015 |
June 29, 2014 |
||||||||||
|
Net income including non-controlling interest |
$ | 33,170 | $ | 40,466 | $ | 27,720 | ||||||
|
Equity in earnings of unconsolidated affiliates |
(8,963 | ) | (19,475 | ) | (19,063 | ) | ||||||
|
Subtotal |
24,207 | 20,991 | 8,657 | |||||||||
|
Distributions received from unconsolidated affiliates |
4,732 | 3,718 | 13,214 | |||||||||
|
Deferred income taxes |
5,983 | (3,796 | ) | 726 | ||||||||
|
Other changes |
21,053 | 17,990 | 33,760 | |||||||||
|
Net cash provided by operating activities |
$ | 55,975 | $ | 38,903 | $ | 56,357 | ||||||
Fiscal 2016 compared to Fiscal 2015
The increase from fiscal 2015 to fiscal 2016 is primarily attributable to significantly lower taxes paid of approximately $7,300 in fiscal 2016 (due, in large part, to the favorable depreciation provisions of the Protecting Americans from Tax Hikes Act of 2015, enacted in December 2015). Further, net income including non-controlling interest, after taking into account non-cash earnings of unconsolidated affiliates, is approximately $3,200 higher than the prior period (noted via the Subtotal above). Such favorability is primarily attributable to improved gross profits in fiscal 2016, along with lower SG&A expenses.
Additionally, other changes in assets and liabilities grew over fiscal 2015, primarily attributable to a favorable change in inventories for fiscal 2016, reflecting lower raw material prices, whereas fiscal 2015 was impacted by a build of raw material inventories in support of expanded recycling activities. However, fiscal 2016 was unfavorably impacted by (i) lower customer receipts in June 2016 compared to June 2015 and (ii) lower raw material prices driving down accounts payable.
Fiscal 2015 compared to Fiscal 2014
Cash flows provided by operating activities were lower in fiscal 2015 than in fiscal 2014, primarily attributable to (i) approximately $9,500 of lower cash distributions from unconsolidated affiliates, (ii) a build of raw materials inventories for expansion of recycling operations and (iii) higher payments for taxes in fiscal 2015, along with (iv) other changes in assets and liabilities.
Distributions received from unconsolidated affiliates declined from fiscal 2014 to 2015 due to the timing of PAL’s capital investment and acquisition activity driving a comparative reduction in its discretionary distributions. Raw materials inventories grew in fiscal 2015 as the Company ramped up recycling activities and explored the viability of multiple sources. Tax payments were higher in fiscal 2015 due to the lack of certain favorable tax regulations (e.g. bonus depreciation).
An unfavorable change to fiscal 2015 for accounts payable and accrued expenses was driven by lower raw material costs, while cash flows provided by operating activities in fiscal 2014 were favorably impacted by the return of certain deposits and associated interest of approximately $6,000.
Partially offsetting these unfavorable changes was (i) the achievement of approximately $7,000 of higher operating income in fiscal 2015, driven by strong gross profits due to increased PVA sales and (ii) higher customer receipts in June 2015.
Cash Used in Investing Activities and Financing Activities
The Company utilized $52,892 for net investing activities and was provided $3,642 from net financing activities during fiscal 2016. Significant investing activities include $52,337 for capital expenditures, which primarily relate to the addition of machinery, equipment and infrastructure for the Company’s new plastic bottle processing plant at our existing location in Reidsville, North Carolina, which is expected to start production in August 2016, along with other capital expenditures to improve the Company’s manufacturing flexibility and capability to produce PVA products and to increase the capacity of our REPREVE® Recycling Center.
Significant financing activities include (i) $9,325 for net borrowings against the ABL Facility and (ii) $4,000 borrowed against a term loan supplement, partially offset by (a) $4,090 for payments on capital lease obligations and (b) $6,211 for stock repurchases.
The Company utilized $22,541 for net investing activities and $18,190 for net financing activities during fiscal 2015. Significant investing activities include $25,966 for capital expenditures, which primarily relate to (i) improving the Company’s manufacturing flexibility and capability to produce PVA products, (ii) increasing the capacity of the recycling facility and (iii) adding to the capacity, flexibility and efficiency of the Company’s facilities in Yadkinville, Madison and El Salvador through the addition of texturing machines. Significant financing activities include net repayments of $6,875 on the ABL Facility and $10,360 for repurchases of Company stock.
The Company utilized $16,869 for net investing activities and $32,410 for net financing activities during fiscal 2014. Significant investing activities include $19,091 for capital expenditures, which primarily relate to (i) improving the Company’s manufacturing flexibility and capability to produce PVA products, (ii) adding to the capacity, flexibility and efficiency of the Company’s Yadkinville texturing facility and (iii) increasing the capacity of the recycling facility. Significant financing outflows include $36,551 for repurchases of Company stock.
Contractual Obligations
As of June 26, 2016, the Company’s contractual obligations consist of the following:
|
Cash Payments Due By Period |
||||||||||||||||||||
|
Description of Commitment |
Total |
Less Than 1 Year |
1-3 Years |
3-5 Years |
More Than 5 Years |
|||||||||||||||
|
ABL Revolver |
$ | 6,200 | $ | — | $ | — | $ | 6,200 | $ | — | ||||||||||
|
ABL Term Loan |
90,250 | 9,500 | 19,000 | 61,750 | — | |||||||||||||||
|
Capital lease obligations |
15,798 | 4,261 | 8,186 | 2,713 | 638 | |||||||||||||||
|
Renewables’ term loan |
4,000 | — | — | 2,444 | 1,556 | |||||||||||||||
|
Renewables’ promissory note |
135 | 25 | 53 | 57 | — | |||||||||||||||
|
Contingent consideration (1) |
1,348 | 493 | 855 | — | — | |||||||||||||||
|
Other long-term obligations (2) |
5,862 | 3,009 | 238 | 74 | 2,541 | |||||||||||||||
|
Subtotal |
123,593 | 17,288 | 28,332 | 73,238 | 4,735 | |||||||||||||||
|
Interest on long-term debt and other obligations (3) |
$ | 9,106 | $ | 2,974 | $ | 4,499 | $ | 1,495 | $ | 138 | ||||||||||
|
Operating leases |
16,387 | 3,784 | 5,591 | 3,740 | 3,272 | |||||||||||||||
|
Capital purchase obligations (4) |
11,611 | 11,611 | — | — | — | |||||||||||||||
|
Purchase obligations (5) |
23,730 | 11,375 | 9,906 | 1,967 | 482 | |||||||||||||||
|
Total cash payments by period (6) |
$ | 184,427 | $ | 47,032 | $ | 48,328 | $ | 80,440 | $ | 8,627 | ||||||||||
|
(1) |
Contingent consideration payments are reflected at present value based on the expected future payments used in the underlying fair value determination. |
|
(2) |
Other long-term obligations do not include an estimate of the timing of potential tax payments related to uncertain tax positions; therefore, $4,463 has been excluded from the table above. |
|
(3) |
Interest payments on variable-rate debt instruments are calculated for future periods using interest rates and terms in effect at June 26, 2016. |
|
(4) |
Capital purchase obligations relate to contracts with vendors for the construction of assets. |
|
(5) |
Purchase obligations primarily consist of utility, software and other service agreements. |
|
(6) |
Construction financing debt of $6,629 and estimated interest of $500 are excluded from the table. |
For purposes of the above table, purchase obligations are defined as agreements that are enforceable and legally binding and that specify all significant terms, including fixed or minimum quantities to be purchased; fixed, minimum or variable price provisions; and the approximate timing of the transaction.
As of June 26, 2016, the Company’s open purchase orders totaled approximately $41,000 and are expected to be settled in fiscal 2017. These open purchase orders are in the ordinary course of business for the procurement of (i) raw materials used in the production of inventory, (ii) certain consumables and outsourced services used in the Company’s manufacturing processes and (iii) selected finished goods for resale sourced from third-party suppliers.
As of June 26, 2016, the Company had $200 of standby letters of credit, none of which have been drawn upon.
Recent Accounting Pronouncements
In April 2015, the Financial Accounting Standards Board (“FASB”) issued Accounting Standards Update (“ASU”) 2015-05, Intangibles—Goodwill and Other—Internal-Use Software (Subtopic 350-40): Customer’s Accounting for Fees Paid in a Cloud Computing Arrangement, providing criteria for determining if a license of software, as part of a cloud services arrangement, is subject to capitalization under the existing guidance for internal-use software. The guidance is effective for the Company’s fiscal 2017.
In July 2015, the FASB issued ASU 2015-11, Inventory, which modifies the subsequent measurement of inventories recorded under a first-in-first-out or average cost method. Under the new standard, such inventories are required to be measured at the lower of cost and net realizable value. The new standard is effective for the Company’s fiscal 2018, with prospective application.
In August 2015, the FASB issued ASU 2015-15, Interest - Imputation of Interest (Subtopic 835-30): Presentation and Subsequent Measurement of Debt Issuance Costs Associated with Line-of-Credit Arrangements - Amendments to SEC Paragraphs Pursuant to Staff Announcement at June 18, 2015 EITF Meeting, which provides clarification from ASU No. 2015-03 regarding the presentation and subsequent measurement of debt issuance costs associated with line-of-credit arrangements.
In February 2016, the FASB issued ASU 2016-02, Leases (Topic 842). The ASU is intended to increase transparency and comparability among organizations by recognizing lease assets and lease liabilities on the balance sheet and disclosing key information about leasing arrangements. ASU 2016-02 requires, among other changes to the lease accounting guidance, lessees to recognize most leases on-balance sheet via a right of use asset and lease liability, and additional qualitative and quantitative disclosures. The ASU is effective for the Company’s fiscal 2020 with a modified retrospective transition method, and early adoption is permitted.
In March 2016, the FASB issued ASU 2016-08, Revenue from Contracts with Customers (Topic 606): Principal versus Agent Considerations (Reporting Revenue Gross versus Net). The ASU is intended to clarify implementation guidance on principal versus agent considerations while reducing the potential for diversity in practice arising from inconsistent application. The effective date and transition requirements for ASU 2016-08 are the same as the effective date and transition requirements of ASU 2014-09 and 2015-14. The guidance is effective for the Company’s fiscal 2019.
In March 2016, the FASB issued ASU 2016-09, Compensation—Stock Compensation (Topic 718): Improvements to Employee Share-Based Payment Accounting. The ASU includes multiple provisions intended to simplify various aspects of the accounting for share-based payments, while reducing cost and complexity. The ASU is effective for the Company’s fiscal 2018, and early adoption is permitted.
In April 2016, the FASB issued ASU 2016-10, Revenue from Contracts with Customers (Topic 606): Identifying Performance Obligations and Licensing. The ASU is intended to clarify implementation guidance on performance obligations and licensing while reducing the potential for diversity in practice arising from inconsistent application. The effective date and transition requirements for ASU 2016-10 are the same as the effective date and transition requirements of ASU 2014-09 and 2015-14. The guidance is effective for the Company’s fiscal 2019.
The Company is evaluating the effect the new guidance will have on its consolidated financial statements and related disclosures.
In July 2013, the FASB issued ASU 2013-11, Presentation of an Unrecognized Tax Benefit When a Net Operating Loss Carryforward, a Similar Tax Loss, or a Tax Credit Carryforward Exists. The guidance requires an entity to present its deferred tax asset for a net operating loss carryforward, similar tax loss, or a tax credit carryforward net of unrecognized tax benefits when settlement in this manner is available under the tax law, which would be based on facts and circumstances as of the balance sheet reporting date and would not consider future events. The Company adopted the guidance in fiscal year 2015 and there is no significant impact on the Company’s financial statements.
In April 2015, the FASB issued ASU 2015-03, Interest—Imputation of Interest, which requires that debt issuance costs related to a recognized debt liability be presented in the balance sheet as a direct deduction from the carrying amount of that debt liability, consistent with debt discounts. The recognition and measurement guidance of debt issuance costs are not affected by the amendments in this update. The new standard is effective for the Company’s fiscal year 2017 and requires the Company to apply the new guidance on a retrospective basis upon adoption. Upon adoption, the Company expects $1,421 and $1,611 of debt issuance costs recorded within other non-current assets at June 26, 2016 and June 28, 2015, respectively, would be presented in the consolidated balance sheets as a direct deduction from the carrying amount of the corresponding debt liabilities.
In fiscal 2016, the Company early adopted ASU 2015-17, Income Taxes (Topic 740): Balance Sheet Classification of Deferred Taxes. The ASU eliminates the existing requirement for entities to present deferred tax assets and liabilities as current and noncurrent in a classified balance sheet. Instead, upon adoption, entities are required to classify all deferred tax assets and liabilities as noncurrent. Adopting this ASU provides simplification in the presentation of deferred tax assets and liabilities and alignment with International Financial Reporting Standards.
There have been no other newly issued or newly applicable accounting pronouncements that have, or are expected to have, a significant impact on the Company's financial statements.
Off-Balance Sheet Arrangements
The Company is not a party to any off-balance sheet arrangements that have, or are reasonably likely to have, a current or future material effect on the Company’s financial condition, results of operations, liquidity or capital expenditures.
Critical Accounting Policies
The preparation of financial statements in conformity with GAAP requires management to make estimates and assumptions that affect the amounts reported in the financial statements and accompanying notes. The SEC has defined a company’s most critical accounting policies as those involving accounting estimates that require management to make assumptions about matters that are highly uncertain at the time and where different reasonable estimates or changes in the accounting estimate from quarter to quarter could materially impact the presentation of the financial statements. The following discussion provides further information about accounting policies critical to the Company and should be read in conjunction with Note 2 to the Consolidated Financial Statements in this Annual Report on Form 10-K.
Receivables Reserves
An allowance for losses is provided for known and potential losses arising from yarn quality claims and for amounts owed by customers. Reserves for yarn quality claims are based on historical claim experience and known pending claims. The collectability of accounts receivable is based on a combination of factors, including the aging of accounts, historical write off experience, present economic conditions such as customer bankruptcy filings, and the financial health of specific customers and market sectors. Since losses depend to a large degree on future economic conditions and the health of the textile industry, a significant level of judgment is required to arrive at the allowance for uncollectible accounts. This allowance is established based on percentages applied to accounts aged for set periods of time, supplemented by reserves for individual customer accounts where collection is no longer certain. Establishing reserves for yarn claims and uncollectible accounts requires management judgment and estimates. The Company does not believe there is a reasonable likelihood that there will be a material change in the estimates and assumptions it uses to assess the allowance for losses. However, certain unexpected events such as a customer bankruptcy filing could have a material impact on the Company’s results of operations. The Company has not made any material changes to the methodology used in establishing its accounts receivable loss reserves during the past three fiscal years. A plus or minus 10% change in the aged accounts receivable reserve percentages would not have been material to the Company’s financial statements for the past three years.
Inventory Reserves
Inventory reserves are established based on many factors including historical recovery rates, the aging of inventories on-hand, inventory movement and expected net realizable value of specific products, and current economic conditions. Specific reserves are established based on a determination of the obsolescence of the inventory and whether the inventory value exceeds amounts to be recovered through expected sales prices, less selling costs. Estimating sales prices and evaluating the condition of the inventories require judgment and estimates, which may impact the ending inventory valuation and gross margins. The Company uses current and historical knowledge to record reasonable estimates of its markdown percentages and expected sales prices. The Company believes it is unlikely that differences in actual demand or selling prices from those projected by management would have a material impact on the Company’s financial condition or results of operations. The Company has not made any material changes to the methodology used in establishing its inventory loss reserves during the past three fiscal years. A plus or minus 10% change in its aged inventory reserves would not have been material to the Company’s financial statements for the past three fiscal years.
Impairment of Long-Lived Assets
Long-lived assets are reviewed for impairment whenever events or changes in circumstances indicate that the carrying amount may not be recoverable. For assets held for sale, an impairment charge is recognized if the carrying value of the assets exceeds the fair value less costs to sell. Estimates are required to determine the fair value, the disposal costs and the time period to dispose of the assets. Such estimates are critical in determining whether any impairment charge should be recorded and the amount of such charge if an impairment loss is deemed to be necessary. For assets held and used, impairment may occur if projected undiscounted cash flows are not adequate to cover the carrying value of the assets. In such cases, additional analysis is conducted to determine the amount of loss to be recognized, and the impairment loss is determined as the amount the carrying value of the asset or asset group exceeds the estimated fair value, measured by future discounted cash flows. The analysis requires estimates of the amount and timing of projected cash flows and, where applicable, judgment associated with, among other factors, the appropriate discount rate. Such estimates are critical in determining whether any impairment charge should be recorded and the amount of such charge if an impairment loss is deemed to be necessary. The Company’s judgment regarding the existence of circumstances that indicate the potential impairment of an asset’s carrying value is based on several factors, including, but not limited to, changes in business environment, a decline in operating cash flows or a decision to close a manufacturing facility. The variability of these factors depends on a number of conditions, including uncertainty about future events and general economic conditions.
Impairment of Investments in Unconsolidated Affiliates
The Company evaluates its investments in unconsolidated affiliates whenever events or changes in circumstances indicate that the carrying amount may not be recoverable. The Company evaluates the ability of an affiliate to generate sufficient earnings and cash flows to justify its carrying value. Reductions in an affiliate’s cash flows that are other than temporary and indicative of a loss of investment value are assessed for impairment purposes. For fiscal 2016, the Company determined there were no “other-than-temporary” impairments related to the carrying value of its investments in unconsolidated affiliates.
Valuation Allowance for Deferred Tax Assets
The Company currently has a valuation allowance against certain of its deferred tax assets in the U.S. and foreign subsidiaries due to negative evidence concerning the realization of those deferred tax assets. The deferred tax valuation allowance at June 26, 2016 consists of the following:
|
Investment in a former domestic unconsolidated affiliate |
$ | 6,418 | ||
|
Equity-method investment in PAL |
2,102 | |||
|
Other |
5,030 | |||
|
Total deferred tax valuation allowance |
$ | 13,550 |
In assessing the realization of deferred tax assets, management considers whether it is more likely than not that some portion or all of the deferred tax assets will be realized. The ultimate realization of deferred tax assets is dependent upon the generation of future taxable income of the appropriate character during the periods in which those temporary differences reverse. Management considers the scheduled reversal of taxable temporary differences, taxable income in carryback periods, projected future taxable income and tax planning strategies in making this assessment. The Company reviews its estimates of future taxable income on a quarterly basis to assess if the need for a valuation allowance exists. The Company continually evaluates both positive and negative evidence to determine whether and when the valuation allowance, or a portion thereof, should be released. A release of the valuation allowance could have a material effect on earnings in the period of release.
Item 7A. Quantitative and Qualitative Disclosures About Market Risk
The Company is exposed to market risks associated with changes in interest rates, fluctuation in currency exchange rates, and raw material and commodity costs, which may adversely affect its financial position, results of operations or cash flows. The Company does not enter into derivative financial instruments for trading purposes, nor is it a party to any leveraged financial instruments.
Interest Rate Risk
The Company is exposed to interest rate risk through its borrowing activities. As of June 26, 2016, the Company had borrowings under its ABL Revolver and ABL Term Loan that totaled $96,450 and contain variable rates of interest; however, the Company hedges a significant portion of such interest rate variability using an interest rate swap. As of June 26, 2016, after considering the variable rate debt obligations that have been hedged and the Company’s outstanding debt obligations with fixed rates of interest, the Company’s sensitivity analysis shows that a 50-basis point increase in LIBOR as of June 26, 2016 would result in an increase of $252 in annual interest expense.
Currency Exchange Rate Risk
The Company conducts its business in various foreign countries and in various foreign currencies. Each of the Company’s subsidiaries may enter into transactions (sales, purchases, fixed purchase commitments, etc.) that are denominated in currencies other than the subsidiary’s functional currency and thereby expose the Company to foreign currency exchange risk. The Company may enter into foreign currency forward contracts to hedge this exposure. The Company may also enter into foreign currency forward contracts to hedge its exposure for certain equipment or inventory purchase commitments. As of June 26, 2016, the Company had no outstanding foreign forward currency contracts.
A significant portion of raw materials purchased by the Company’s Brazilian subsidiary are denominated in U.S. Dollars, requiring the Company to regularly exchange Brazilian Real. During recent years, and most notably in fiscal 2015 and 2016, the Company has been negatively impacted by a devaluation of the Brazilian Real. For fiscal 2015, the Brazilian Real declined approximately 40% in relation to the U.S. Dollar, thereby reducing the utility of cash and cash equivalents held by the Company’s Brazilian subsidiary. Discussion and analysis surrounding the impact of the devaluation of the Brazilian Real on the Company’s results of operations is included above in “Item 7. Management’s Discussion and Analysis of Financial Condition and Results of Operations.”
As of June 26, 2016, the Company’s subsidiaries outside the U.S., whose functional currency is other than the U.S. Dollar, held approximately 13.2% of the Company’s consolidated total assets. The Company does not enter into foreign currency derivatives to hedge its net investment in its foreign operations.
As of June 26, 2016, $12,802, or 76.9%, of the Company’s cash and cash equivalents were held outside the U.S., of which approximately $7,600 were held in U.S. Dollar equivalents.
More information regarding the Company’s derivative financial instruments as of June 26, 2016 is provided in Note 18 to the Consolidated Financial Statements in this Annual Report on Form 10-K.
Raw Material and Commodity Cost Risks
A significant portion of the Company’s raw materials and energy costs are derived from petroleum-based chemicals. The prices for petroleum and petroleum-related products and energy costs are volatile and dependent on global supply and demand dynamics, including certain geo-political risks. The Company does not use financial instruments to hedge its exposure to changes in these costs. The costs of the primary raw materials that the Company uses throughout all of its operations are generally based on U.S. Dollar pricing; and such materials are purchased at market or at fixed prices that are established with individual vendors as part of the purchasing process for quantities expected to be consumed in the ordinary course of business.
Other Risks
The Company is also exposed to political risk, including changing laws and regulations governing international trade, such as quotas, tariffs and tax laws. The degree of impact and the frequency of these events cannot be predicted.
Item 8. Financial Statements and Supplementary Data
The Company’s financial statements required by this Item are included on pages F-1 through F-39 of this Annual Report on Form 10-K. See Item 15(a)(1) for a listing of financial statements provided.
Item 9. Changes in and Disagreements With Accountants on Accounting and Financial Disclosure
None.
Item 9A. Controls and Procedures
Evaluation of Disclosure Controls and Procedures
As of June 26, 2016, an evaluation of the effectiveness of the Company's disclosure controls and procedures (as defined in Rule 13a-15(e) and 15d-15(e) promulgated under the Securities Exchange Act of 1934, as amended (the “Exchange Act”)) was performed under the supervision and with the participation of the Company’s management, including the principal executive officer and principal financial officer. Based on that evaluation, the Company’s principal executive officer and principal financial officer concluded that the Company’s disclosure controls and procedures are effective to ensure that information required to be disclosed by the Company in its reports that it files or submits under the Exchange Act is recorded, processed, summarized and reported within the time periods specified in the Securities and Exchange Commission (the “SEC”) rules and forms, and that information required to be disclosed by the Company in the reports the Company files or submits under the Exchange Act is accumulated and communicated to the Company’s management, including its principal executive officer and principal financial officer, as appropriate to allow timely decisions regarding required disclosure.
Management’s Annual Report on Internal Control Over Financial Reporting
Management of the Company is responsible for establishing and maintaining adequate internal control over financial reporting (as defined in Rule 13a-15(f) and 15d-15(f) promulgated under the Exchange Act). The Company’s internal control over financial reporting is a process designed to provide reasonable assurance regarding the reliability of financial reporting and the preparation of financial statements for external purposes in accordance with generally accepted accounting principles. The Company’s internal control over financial reporting includes those policies and procedures that (i) pertain to the maintenance of records that, in reasonable detail, accurately and fairly reflect the transactions and dispositions of the assets of the Company; (ii) provide reasonable assurance that transactions are recorded as necessary to permit preparation of financial statements in accordance with generally accepted accounting principles, and that receipts and expenditures of the Company are being made only in accordance with authorizations of management and directors of the Company; and (iii) provide reasonable assurance regarding prevention or timely detection of unauthorized acquisition, use, or disposition of the Company’s assets that could have a material effect on the financial statements.
Because of its inherent limitations, internal control over financial reporting may not prevent or detect misstatements. Also, projections of any evaluation of effectiveness to future periods are subject to the risk that controls may become inadequate because of changes in conditions, or that the degree of compliance with the policies or procedures may deteriorate.
Management, under the supervision and with the participation of the principal executive officer and principal financial officer, assessed the effectiveness of the Company’s internal control over financial reporting as of June 26, 2016, based on the framework set forth by the Committee of Sponsoring Organizations of the Treadway Commission (COSO) in Internal Control-Integrated Framework (2013). Based on that assessment, management concluded that, as of June 26, 2016, the Company’s internal control over financial reporting is effective based on the criteria established in Internal Control-Integrated Framework (2013).
Attestation Report of the Independent Registered Public Accounting Firm
The effectiveness of the Company’s internal control over financial reporting as of June 26, 2016 has been audited by KPMG LLP, an independent registered public accounting firm. Their report, which appears in “Item 8. Financial Statements and Supplementary Data,” expresses an unqualified opinion on the effectiveness of the Company’s internal control over financial reporting as of June 26, 2016.
Changes in Internal Control Over Financial Reporting
During the Company’s fourth quarter of fiscal 2016, there has been no change in the Company’s internal controls over financial reporting that has materially affected, or is reasonably likely to materially affect, the Company’s internal controls over financial reporting.
Item 9B. Other Information
None.
PART III
Item 10. Directors, Executive Officers and Corporate Governance
The Company will file with the SEC a definitive proxy statement for our 2016 annual meeting of shareholders (the “Proxy Statement”) no later than 120 days after the close of its fiscal year ended June 26, 2016. The information required by this Item and not given in this Item will appear under the headings “Election of Directors,” “Corporate Governance” and “Section 16(a) Beneficial Ownership Reporting Compliance” in the Proxy Statement, which sections are incorporated in this Item by reference. The information required by this Item with respect to our executive officers appears in Part I of this Annual Report on Form 10-K under the heading “Executive Officers of the Registrant.”
We have adopted a written Code of Business Conduct and Ethics (the “Code of Ethics”), which is intended to qualify as a “code of ethics” within the meaning of Item 406 of Regulation S-K of the Exchange Act. The Code of Ethics applies to our principal executive officer, principal financial officer, principal accounting officer and persons performing similar functions. The Code of Ethics is available on our website at www.unifi.com. We will disclose information pertaining to amendments or waivers to provisions of the Code of Ethics that apply to our principal executive officer, principal financial officer, principal accounting officer or persons performing similar functions and that relate to the elements of the Code of Ethics enumerated in the SEC rules and regulations by posting this information on our website at www.unifi.com. The information on our website is not a part of this Form 10-K and is not incorporated by reference in this report or any of our other filings with the SEC.
Our non-employee directors and their respective principal occupation or employment, if any, are as follows: Robert J. Bishop (Managing Principal, Impala Asset Management LLC, a private investment management company); Paul R. Charron (Independent Management Consultant); Archibald Cox, Jr. (Chairman, Sextant Group, Inc., a financial advisory and private equity firm); William L. Jasper (Retired Chairman and Chief Executive Officer, Unifi, Inc.); James M. Kilts (Founding Partner, Centerview Capital, a private equity firm); Kenneth G. Langone (President and Chief Executive Officer, Invemed Associates LLC, an investment banking firm); James D. Mead (President, James Mead & Company, an executive search and management consulting firm); and Suzanne M. Present (Principal, Gladwyne Partners, LLC, a private partnership fund manager).
Item 11. Executive Compensation
The information required by this Item will appear under the headings “Director Compensation,” “Compensation Discussion and Analysis,” “Executive Compensation Tables,” “Compensation Committee Interlocks and Insider Participation” and “Compensation Committee Report” in the Proxy Statement, which sections are incorporated in this Item by reference.
Item 12. Security Ownership of Certain Beneficial Owners and Management and Related Stockholder Matters
The information required by this Item will appear under the headings “Security Ownership of Certain Beneficial Owners and Management” and “Equity Compensation Plan Information” in the Proxy Statement, which sections are incorporated in this Item by reference.
Item 13. Certain Relationships and Related Transactions, and Director Independence
The information required by this Item will appear under the headings “Corporate Governance—Director Independence,” “Corporate Governance—Policy for Review of Related Person Transactions” and “Corporate Governance—Related Person Transactions” in the Proxy Statement, which sections are incorporated in this Item by reference.
Item 14. Principal Accountant Fees and Services
The information required by this Item will appear under the heading “Ratification of the Appointment of Independent Registered Public Accounting Firm” in the Proxy Statement, which section is incorporated in this Item by reference.
PART IV
Item 15. Exhibits and Financial Statement Schedules
|
(a) |
1. Financial Statements |
The financial statements and schedules listed in the accompanying Index to Consolidated Financial Statements on page F-1 are filed as part of this Report.
2. Financial Statement Schedules
Parkdale America, LLC (“PAL”) is an unconsolidated joint venture in which the Company holds a 34% equity ownership interest. Accordingly, pursuant to Rule 3-09(b)(2) of Regulation S-X under the Exchange Act, the Company will file the required financial statements and related notes of PAL via an amendment to this Annual Report on Form 10-K. PAL’s current fiscal year end is December 31, 2016, which is more than 90 days after the Company’s corresponding (and current) fiscal year, June 26, 2016. PAL’s financial statements as of December 31, 2016 and January 2, 2016 and for the years ended December 31, 2016, January 2, 2016 and January 3, 2015 will be filed on or before March 31, 2017.
PAL’s prior fiscal year end was January 2, 2016, which was more than 90 days after the Company’s corresponding fiscal year, which ended June 28, 2015. Accordingly, pursuant to Rule 3-09(b)(2) of Regulation S-X under the Exchange Act, the Company filed the required financial statements and related notes of PAL on March 31, 2016 via an amendment to the Annual Report on Form 10-K for the fiscal year ended June 28, 2015.
BDO USA, LLP, an independent auditor, issued an audit report on the financial statements of PAL for PAL’s fiscal year ended January 2, 2016.
During the annual reporting period for fiscal 2015, PricewaterhouseCoopers LLP (“PwC”), the independent registered public accounting firm that issued audit reports on the financial statements of PAL for PAL’s fiscal years ended January 3, 2015, December 28, 2013 and December 29, 2012, which reports were included in the amendment to the Company’s Annual Report on Form 10-K for the fiscal year ended June 29, 2014 described above, informed the Company that PwC had performed certain non-audit services, as engaged by the Company that were not in accordance with the auditor independence standards of Regulation S-X. The non-audit services performed by PwC for the Company were related to internal audit associate-level staff secondments. Total fees paid by the Company to PwC for these non-audit services were approximately $151, $108 and $147 for the Company’s fiscal 2015, 2014 and 2013, respectively.
The Audit Committee of the Company’s Board of Directors and PwC separately considered the impact that these non-audit services may have had on PwC’s independence with respect to PAL. Both the Company’s Audit Committee and PwC have concluded that the services identified above did not affect PwC’s ability to be objective and impartial in the conduct of its audits of the January 3, 2015, December 28, 2013 and December 29, 2012 PAL financial statements. In making this determination, both the Company’s Audit Committee and PwC considered, among other things, that at all times the Company retained all decision making over the scope of work and the conclusions formed, the insignificant amount of fees involved, the nature of the services provided and that the services were not the subject of, or related to, PwC’s audits of PAL’s financial statements.
3. Exhibits
|
Exhibit |
Description |
|
3.1(i)(a) |
Restated Certificate of Incorporation of Unifi, Inc. (the “Company”), as amended (incorporated by reference to Exhibit 3a to the Company’s Annual Report on Form 10-K for the fiscal year ended June 27, 2004 (Reg. No. 001-10542) filed on September 17, 2004). |
|
3.1(i)(b) |
Certificate of Change to the Certificate of Incorporation of the Company (incorporated by reference to Exhibit 3.1 to the Company’s Current Report on Form 8-K (Reg. No. 001-10542) dated July 31, 2006). |
|
3.1(i)(c) |
Certificate of Amendment to Restated Certificate of Incorporation of the Company (incorporated by reference to Exhibit 3.1 to the Company’s Current Report on Form 8-K (Reg. No. 001-10542) dated November 3, 2010). |
|
3.1(ii) |
Restated By-laws of the Company (last amended July 20, 2016) (incorporated by reference to Exhibit 3.1 to the Company’s Current Report on Form 8-K (Reg. No. 001-10542) dated July 22, 2016). |
| Exhibit Number |
Description |
|
4^ |
None^ |
|
4.1 |
Registration Rights Agreement dated January 1, 2007 between the Company and Dillon Yarn Corporation (incorporated by reference from Exhibit 7.1 to the Schedule 13D dated January 11, 2007 filed by Dillon Yarn Corporation). |
|
4.2 |
Amended and Restated Credit Agreement, by and among Wells Fargo Bank, National Association, as administrative agent, sole lead arranger, and sole book runner, the lenders that are parties thereto, as the lenders, and the Company and certain of its domestic subsidiaries, as borrowers, dated as of March 26, 2015 (incorporated by reference to Exhibit 4.1 to the Company’s Current Report on Form 8-K (Reg. No. 001-10542) dated March 31, 2015). |
|
4.3 |
First Amendment to Amended and Restated Credit Agreement, dated as of June 26, 2015, by and among the Company and Unifi Manufacturing, Inc., as borrowers, and Wells Fargo Bank, National Association, as agent for the Lenders (incorporated by reference to Exhibit 4.1 to the Company’s Current Report on Form 8-K (Reg. No. 001-10542) dated June 30, 2015). |
|
4.4 |
Second Amendment to Amended and Restated Credit Agreement, dated as of November 19, 2015, by and among the Company and Unifi Manufacturing, Inc., as borrowers, and Wells Fargo Bank, National Association, as agent for the Lenders (incorporated by reference to Exhibit 4.1 to the Company’s Current Report on Form 8-K (Reg. No. 001-10542) dated November 23, 2015). |
|
4.5 |
Amended and Restated Guaranty and Security Agreement, dated as of March 26, 2015, among the Grantors from time to time party thereto and Wells Fargo Bank, National Association, as administrative agent (incorporated by reference to Exhibit 4.2 to the Company’s Current Report on Form 8-K (Reg. No. 001-10542) dated March 31, 2015). |
|
4.6 |
First Amendment to Amended and Restated Guaranty and Security Agreement, dated as of June 26, 2015, by and among the Grantors from time to time party thereto and Wells Fargo Bank, National Association, as administrative agent (incorporated by reference to Exhibit 4.2 to the Company’s Current Report on Form 8-K (Reg. No. 001-10542) dated June 30, 2015). |
|
4.7 |
Trademark Security Agreement, dated as of May 24, 2012, among the Grantors from time to time party thereto and Wells Fargo Bank, N.A., as agent (incorporated by reference to Exhibit 4.3 to the Company’s Current Report on Form 8-K (Reg. No. 001-10542) dated May 25, 2012). |
|
4.8 |
Patent Security Agreement, dated as of May 24, 2012, among the Grantors from time to time party thereto and Wells Fargo Bank, N.A., as agent (incorporated by reference to Exhibit 4.4 to the Company’s Current Report on Form 8-K (Reg. No. 001-10542) dated May 25, 2012). |
|
10.1* |
1999 Unifi, Inc. Long-Term Incentive Plan (incorporated by reference from Exhibit 99.1 to the Company’s Registration Statement on Form S-8 (Reg. No. 333-43158) filed on August 7, 2000). |
|
10.2* |
Form of Option Agreement for Incentive Stock Options granted under the 1999 Unifi, Inc. Long-Term Incentive Plan (incorporated by reference to Exhibit 10.5 to the Company’s Current Report on Form 8-K (Reg. No. 001-10542) dated July 31, 2006). |
|
10.3* |
2008 Unifi, Inc. Long-Term Incentive Plan (incorporated by reference to Exhibit 99.1 to the Company’s Registration Statement on Form S-8 (Reg. No. 333-156090) filed on December 12, 2008). |
|
10.4* |
Form of Option Agreement for Incentive Stock Options granted under the 2008 Unifi, Inc. Long-Term Incentive Plan (incorporated by reference to Exhibit 10.3 to the Company’s Quarterly Report on Form 10-Q for the quarterly period ended December 28, 2008 (Reg. No. 001-10542) filed on February 6, 2009). |
| Exhibit Number |
Description |
| 10.5* | Form of Restricted Stock Unit Agreement for restricted stock units granted under the 2008 Unifi, Inc. Long-Term Incentive Plan (incorporated by reference to Exhibit 10.1 to the Company’s Quarterly Report on Form 10-Q for the quarterly period ended December 26, 2010 (Reg. No. 001-10542) filed on February 4, 2011). |
|
10.6* |
Form of Restricted Stock Unit Agreement for Employees for restricted stock units granted under the 2008 Unifi, Inc. Long-Term Incentive Plan (incorporated by reference to Exhibit 10.1 to the Company’s Quarterly Report on Form 10-Q for the quarterly period ended September 25, 2011 (Reg. No. 001-10542) filed on November 4, 2011). |
|
10.7* |
Unifi, Inc. 2013 Incentive Compensation Plan (incorporated by reference to Exhibit 10.1 to the Company’s Current Report on Form 8-K (Reg. No. 001-10542) dated October 23, 2013). |
|
10.8* |
Form of Restricted Stock Unit Agreement for Non-Employee Directors, for use in connection with Unifi, Inc. 2013 Incentive Compensation Plan (incorporated by reference to Exhibit 10.2 to the Company’s Current Report on Form 8-K (Reg. No. 001-10542) dated October 23, 2013). |
|
10.9* |
Form of Restricted Stock Unit Agreement for Employees, for use in connection with Unifi, Inc. 2013 Incentive Compensation Plan (incorporated by reference to Exhibit 10.3 to the Company’s Quarterly Report on Form 10-Q for the quarterly period ended December 29, 2013 (Reg. No. 001-10542) filed on February 7, 2014). |
|
10.10* |
Form of Incentive Stock Option Agreement (for Executives and Other Officer-Level Employees), for use in connection with Unifi, Inc. 2013 Incentive Compensation Plan (incorporated by reference to Exhibit 10.4 to the Company’s Quarterly Report on Form 10-Q for the quarterly period ended December 29, 2013 (Reg. No. 001-10542) filed on February 7, 2014). |
|
10.11* |
Unifi, Inc. Supplemental Key Employee Retirement Plan, effective July 26, 2006 (incorporated by reference to Exhibit 10.4 to the Company’s Current Report on Form 8-K (Reg. No. 001-10542) dated July 31, 2006). |
|
10.12* |
Amendment to the Unifi, Inc. Supplemental Key Employee Retirement Plan (incorporated by reference to Exhibit 10.1 to the Company’s Current Report on Form 8-K (Reg. No. 001-10542) dated January 5, 2009). |
|
10.13* |
Unifi, Inc. Director Deferred Compensation Plan, dated as of December 14, 2010 (incorporated by reference to Exhibit 10.2 to the Company’s Quarterly Report on Form 10-Q for the quarterly period ended December 26, 2010 (Reg. No. 001-10542) filed on February 4, 2011). |
|
10.14* |
Change in Control Agreement between the Company and Thomas H. Caudle, Jr., effective August 14, 2009 (incorporated by reference to Exhibit 10.3 to the Company’s Current Report on Form 8-K (Reg. No. 001-10542) dated August 18, 2009). |
|
10.15* |
Amendment No. 1 to Change in Control Agreement between the Company and Thomas H. Caudle, Jr., effective December 31, 2011 (incorporated by reference to Exhibit 10.3 to the Company’s Current Report on Form 8-K (Reg. No. 001-10542) dated January 5, 2012). |
|
10.16* |
Amendment No. 2 to Change in Control Agreement between the Company and Thomas H. Caudle, Jr., effective December 31, 2014 (incorporated by reference to Exhibit 10.3 to the Company’s Current Report on Form 8-K (Reg. No. 001-10542) dated December 1, 2014). |
|
10.17* |
Agreement between Unifi, Inc. and James M. Otterberg dated November 2, 2015 (incorporated by reference to Exhibit 10.1 to the Company’s Quarterly Report on Form 10-Q for the quarterly period ended December 27, 2015 (Reg. No. 001-10542) filed on February 4, 2016). |
|
10.18* |
Consulting Agreement between Unifi, Inc. and William L. Jasper dated April 27, 2016 (incorporated by reference to Exhibit 10.1 to the Company’s Current Report on Form 8-K (Reg. No. 001-10542) filed on April 28, 2016). |
|
10.19* |
Agreement between Unifi, Inc. and R. Roger Berrier, Jr. dated April 27, 2016 (incorporated by reference to Exhibit 10.2 to the Company’s Current Report on Form 8-K (Reg. No. 001-10542) filed on April 28, 2016). |
| Exhibit Number |
Description |
|
10.20+* |
Letter Agreement between Unifi, Inc. and Sean D. Goodman dated October 22, 2015. |
|
10.21 |
Sales and Services Agreement dated January 1, 2007 between the Company and Dillon Yarn Corporation (incorporated by reference to Exhibit 99.1 to the Company’s Registration Statement on Form S-3 (Reg. No. 333-140580) filed on February 9, 2007). |
|
10.22 |
First Amendment to Sales and Service Agreement between Unifi Manufacturing, Inc. and Dillon Yarn Corporation, effective January 1, 2009 (incorporated by reference to Exhibit 10.1 to the Company’s Current Report on Form 8-K (Reg. No. 001-10542) dated December 2, 2008). |
|
10.23 |
Second Amendment to Sales and Service Agreement between Unifi Manufacturing, Inc. and Dillon Yarn Corporation, effective January 1, 2010 (incorporated by reference to Exhibit 10.1 to the Company’s Current Report on Form 8-K (Reg. No. 001-10542) dated December 11, 2009). |
|
10.24 |
Third Amendment to Sales and Service Agreement between Unifi Manufacturing, Inc. and Dillon Yarn Corporation, effective January 1, 2011 (incorporated by reference to Exhibit 10.1 to the Company’s Current Report on Form 8-K (Reg. No. 001-10542) dated December 22, 2010). |
|
10.25 |
Fourth Amendment to Sales and Service Agreement between Unifi Manufacturing, Inc. and Dillon Yarn Corporation, effective January 1, 2012 (incorporated by reference to Exhibit 10.1 to the Company’s Current Report on Form 8-K (Reg. No. 001-10542) dated December 20, 2011). |
|
10.26 |
Yarn Purchase Agreement effective as of September 1, 2014 between Unifi Manufacturing, Inc. and Hanesbrands Inc. (portions of the exhibit have been redacted and filed separately with the Securities and Exchange Commission pursuant to a confidential treatment request) (incorporated by reference to Exhibit 10.35 to the Company’s Annual Report on Form 10-K for the fiscal year ended June 29, 2014 (Reg. No. 001-10542) filed on September 10, 2014). |
|
10.27 |
Deposit Account Control Agreement, dated as of May 24, 2012, among Unifi Manufacturing, Inc., Wells Fargo Bank, N.A., and Bank of America, N.A. (incorporated by reference to Exhibit 10.1 to the Company’s Current Report on Form 8-K (Reg. No. 001-10542) dated May 25, 2012). |
|
21.1+ |
List of Subsidiaries. |
|
23.1+ |
Consent of KPMG LLP, Independent Registered Public Accounting Firm. |
|
31.1+ |
Principal executive officer’s certification pursuant to Section 302 of the Sarbanes-Oxley Act of 2002. |
|
31.2+ |
Principal financial officer’s certification pursuant to Section 302 of the Sarbanes-Oxley Act of 2002. |
|
32.1++ |
Principal executive officer’s certification pursuant to Section 906 of the Sarbanes-Oxley Act of 2002. |
|
32.2++ |
Principal financial officer’s certification pursuant to Section 906 of the Sarbanes-Oxley Act of 2002. |
|
101+ |
The following materials from the Company’s Annual Report on Form 10-K for the annual period ended June 26, 2016, formatted in eXtensbile Business Reporting Language (“XBRL”): (i) Consolidated Balance Sheets, (ii) Consolidated Statements of Income, (iii) Consolidated Statements of Comprehensive Income, (iv) Consolidated Statements of Shareholders’ Equity, (v) Consolidated Statements of Cash Flows, and (vi) Notes to Consolidated Financial Statements. |
+ Filed herewith.
++ Furnished herewith.
* These Exhibits are management contracts or compensatory plans or arrangements required to be filed as an exhibit to this Form 10-K pursuant to Item 15(b) of this report.
^ The Company has long-term debt but has not filed the instruments evidencing such debt as part of Exhibit 4, as none of such instruments authorizes the issuance of debt exceeding 10 percent of the total consolidated assets of the Company. The Company agrees to furnish a copy of each such agreement to the Securities and Exchange Commission upon request.
Pursuant to the requirements of Section 13 or 15(d) of the Securities Exchange Act of 1934, the Registrant has duly caused this report to be signed on its behalf by the undersigned, thereunto duly authorized.
| Unifi, Inc. | ||
|
Date: August 26, 2016 |
By: |
/s/ THOMAS H. CAUDLE, JR. |
|
|
Thomas H. Caudle, Jr. | |
| President | ||
Pursuant to the requirements of the Securities Exchange Act of 1934, this report has been signed below by the following persons on behalf of the registrant and in the capacities and on the date indicated:
| Signature | Title | Date | ||||||||
| /s/ THOMAS H. CAUDLE, JR. | President | August 26, 2016 | ||||||||
|
Thomas H. Caudle, Jr. |
(Principal Executive Officer) and Director |
|||||||||
| /s/ SEAN D. GOODMAN | Vice President and Chief Financial Officer | August 26, 2016 | ||||||||
| Sean D. Goodman |
(Principal Financial Officer and Principal Accounting Officer) |
|||||||||
|
/s/ JAMES D. MEAD |
Chairman of the Board |
August 26, 2016 | ||||||||
|
James D. Mead |
and Director |
|||||||||
|
/s/ ROBERT J. BISHOP |
Director |
August 26, 2016 | ||||||||
|
Robert J. Bishop |
||||||||||
|
/s/ PAUL R. CHARRON |
Director |
August 26, 2016 | ||||||||
|
Paul R. Charron |
||||||||||
|
/s/ ARCHIBALD COX, JR. |
Director |
August 26, 2016 | ||||||||
|
Archibald Cox, Jr. |
||||||||||
|
/s/ WILLIAM L. JASPER |
Director |
August 26, 2016 | ||||||||
|
William L. Jasper |
||||||||||
|
/s/ JAMES M. KILTS |
Director |
August 26, 2016 | ||||||||
|
James M. Kilts |
||||||||||
|
/s/ KENNETH G. LANGONE |
Director |
August 26, 2016 | ||||||||
|
Kenneth G. Langone |
||||||||||
|
/s/ SUZANNE M. PRESENT |
Director |
August 26, 2016 | ||||||||
|
Suzanne M. Present |
||||||||||
EXHIBIT INDEX
|
Exhibit |
Description |
|
3.1(i)(a) |
Restated Certificate of Incorporation of Unifi, Inc. (the “Company”), as amended (incorporated by reference to Exhibit 3a to the Company’s Annual Report on Form 10-K for the fiscal year ended June 27, 2004 (Reg. No. 001-10542) filed on September 17, 2004). |
|
3.1(i)(b) |
Certificate of Change to the Certificate of Incorporation of the Company (incorporated by reference to Exhibit 3.1 to the Company’s Current Report on Form 8-K (Reg. No. 001-10542) dated July 31, 2006). |
|
3.1(i)(c) |
Certificate of Amendment to Restated Certificate of Incorporation of the Company (incorporated by reference to Exhibit 3.1 to the Company’s Current Report on Form 8-K (Reg. No. 001-10542) dated November 3, 2010). |
|
3.1(ii) |
Restated By-laws of the Company (last amended July 20, 2016) (incorporated by reference to Exhibit 3.1 to the Company’s Current Report on Form 8-K (Reg. No. 001-10542) dated July 22, 2016). |
|
4^ |
None^ |
|
4.1 |
Registration Rights Agreement dated January 1, 2007 between the Company and Dillon Yarn Corporation (incorporated by reference from Exhibit 7.1 to the Schedule 13D dated January 11, 2007 filed by Dillon Yarn Corporation). |
|
4.2 |
Amended and Restated Credit Agreement, by and among Wells Fargo Bank, National Association, as administrative agent, sole lead arranger, and sole book runner, the lenders that are parties thereto, as the lenders, and the Company and certain of its domestic subsidiaries, as borrowers, dated as of March 26, 2015 (incorporated by reference to Exhibit 4.1 to the Company’s Current Report on Form 8-K (Reg. No. 001-10542) dated March 31, 2015). |
|
4.3 |
First Amendment to Amended and Restated Credit Agreement, dated as of June 26, 2015, by and among the Company and Unifi Manufacturing, Inc., as borrowers, and Wells Fargo Bank, National Association, as agent for the Lenders (incorporated by reference to Exhibit 4.1 to the Company’s Current Report on Form 8-K (Reg. No. 001-10542) dated June 30, 2015). |
|
4.4 |
Second Amendment to Amended and Restated Credit Agreement, dated as of November 19, 2015, by and among the Company and Unifi Manufacturing, Inc., as borrowers, and Wells Fargo Bank, National Association, as agent for the Lenders (incorporated by reference to Exhibit 4.1 to the Company’s Current Report on Form 8-K (Reg. No. 001-10542) dated November 23, 2015). |
|
4.5 |
Amended and Restated Guaranty and Security Agreement, dated as of March 26, 2015, among the Grantors from time to time party thereto and Wells Fargo Bank, National Association, as administrative agent (incorporated by reference to Exhibit 4.2 to the Company’s Current Report on Form 8-K (Reg. No. 001-10542) dated March 31, 2015). |
|
4.6 |
First Amendment to Amended and Restated Guaranty and Security Agreement, dated as of June 26, 2015, by and among the Grantors from time to time party thereto and Wells Fargo Bank, National Association, as administrative agent (incorporated by reference to Exhibit 4.2 to the Company’s Current Report on Form 8-K (Reg. No. 001-10542) dated June 30, 2015). |
|
4.7 |
Trademark Security Agreement, dated as of May 24, 2012, among the Grantors from time to time party thereto and Wells Fargo Bank, N.A., as agent (incorporated by reference to Exhibit 4.3 to the Company’s Current Report on Form 8-K (Reg. No. 001-10542) dated May 25, 2012). |
|
4.8 |
Patent Security Agreement, dated as of May 24, 2012, among the Grantors from time to time party thereto and Wells Fargo Bank, N.A., as agent (incorporated by reference to Exhibit 4.4 to the Company’s Current Report on Form 8-K (Reg. No. 001-10542) dated May 25, 2012). |
|
10.1* |
1999 Unifi, Inc. Long-Term Incentive Plan (incorporated by reference from Exhibit 99.1 to the Company’s Registration Statement on Form S-8 (Reg. No. 333-43158) filed on August 7, 2000). |
| Exhibit Number |
Description |
|
10.2* |
Form of Option Agreement for Incentive Stock Options granted under the 1999 Unifi, Inc. Long-Term Incentive Plan (incorporated by reference to Exhibit 10.5 to the Company’s Current Report on Form 8-K (Reg. No. 001-10542) dated July 31, 2006). |
|
10.3* |
2008 Unifi, Inc. Long-Term Incentive Plan (incorporated by reference to Exhibit 99.1 to the Company’s Registration Statement on Form S-8 (Reg. No. 333-156090) filed on December 12, 2008). |
|
10.4* |
Form of Option Agreement for Incentive Stock Options granted under the 2008 Unifi, Inc. Long-Term Incentive Plan (incorporated by reference to Exhibit 10.3 to the Company’s Quarterly Report on Form 10-Q for the quarterly period ended December 28, 2008 (Reg. No. 001-10542) filed on February 6, 2009). |
|
10.5* |
Form of Restricted Stock Unit Agreement for restricted stock units granted under the 2008 Unifi, Inc. Long-Term Incentive Plan (incorporated by reference to Exhibit 10.1 to the Company’s Quarterly Report on Form 10-Q for the quarterly period ended December 26, 2010 (Reg. No. 001-10542) filed on February 4, 2011). |
|
10.6* |
Form of Restricted Stock Unit Agreement for Employees for restricted stock units granted under the 2008 Unifi, Inc. Long-Term Incentive Plan (incorporated by reference to Exhibit 10.1 to the Company’s Quarterly Report on Form 10-Q for the quarterly period ended September 25, 2011 (Reg. No. 001-10542) filed on November 4, 2011). |
|
10.7* |
Unifi, Inc. 2013 Incentive Compensation Plan (incorporated by reference to Exhibit 10.1 to the Company’s Current Report on Form 8-K (Reg. No. 001-10542) dated October 23, 2013). |
|
10.8* |
Form of Restricted Stock Unit Agreement for Non-Employee Directors, for use in connection with Unifi, Inc. 2013 Incentive Compensation Plan (incorporated by reference to Exhibit 10.2 to the Company’s Current Report on Form 8-K (Reg. No. 001-10542) dated October 23, 2013). |
|
10.9* |
Form of Restricted Stock Unit Agreement for Employees, for use in connection with Unifi, Inc. 2013 Incentive Compensation Plan (incorporated by reference to Exhibit 10.3 to the Company’s Quarterly Report on Form 10-Q for the quarterly period ended December 29, 2013 (Reg. No. 001-10542) filed on February 7, 2014). |
|
10.10* |
Form of Incentive Stock Option Agreement (for Executives and Other Officer-Level Employees), for use in connection with Unifi, Inc. 2013 Incentive Compensation Plan (incorporated by reference to Exhibit 10.4 to the Company’s Quarterly Report on Form 10-Q for the quarterly period ended December 29, 2013 (Reg. No. 001-10542) filed on February 7, 2014). |
|
10.11* |
Unifi, Inc. Supplemental Key Employee Retirement Plan, effective July 26, 2006 (incorporated by reference to Exhibit 10.4 to the Company’s Current Report on Form 8-K (Reg. No. 001-10542) dated July 31, 2006). |
|
10.12* |
Amendment to the Unifi, Inc. Supplemental Key Employee Retirement Plan (incorporated by reference to Exhibit 10.1 to the Company’s Current Report on Form 8-K (Reg. No. 001-10542) dated January 5, 2009). |
|
10.13* |
Unifi, Inc. Director Deferred Compensation Plan, dated as of December 14, 2010 (incorporated by reference to Exhibit 10.2 to the Company’s Quarterly Report on Form 10-Q for the quarterly period ended December 26, 2010 (Reg. No. 001-10542) filed on February 4, 2011). |
|
10.14* |
Change in Control Agreement between the Company and Thomas H. Caudle, Jr., effective August 14, 2009 (incorporated by reference to Exhibit 10.3 to the Company’s Current Report on Form 8-K (Reg. No. 001-10542) dated August 18, 2009). |
|
10.15* |
Amendment No. 1 to Change in Control Agreement between the Company and Thomas H. Caudle, Jr., effective December 31, 2011 (incorporated by reference to Exhibit 10.3 to the Company’s Current Report on Form 8-K (Reg. No. 001-10542) dated January 5, 2012). |
|
10.16* |
Amendment No. 2 to Change in Control Agreement between the Company and Thomas H. Caudle, Jr., effective December 31, 2014 (incorporated by reference to Exhibit 10.3 to the Company’s Current Report on Form 8-K (Reg. No. 001-10542) dated December 1, 2014). |
| Exhibit Number |
Description |
|
10.17* |
Agreement between Unifi, Inc. and James M. Otterberg dated November 2, 2015 (incorporated by reference to Exhibit 10.1 to the Company’s Quarterly Report on Form 10-Q for the quarterly period ended December 27, 2015 (Reg. No. 001-10542) filed on February 4, 2016). |
|
10.18* |
Consulting Agreement between Unifi, Inc. and William L. Jasper dated April 27, 2016 (incorporated by reference to Exhibit 10.1 to the Company’s Current Report on Form 8-K (Reg. No. 001-10542) filed on April 28, 2016). |
|
10.19* |
Agreement between Unifi, Inc. and R. Roger Berrier, Jr. dated April 27, 2016 (incorporated by reference to Exhibit 10.2 to the Company’s Current Report on Form 8-K (Reg. No. 001-10542) filed on April 28, 2016). |
|
10.20+* |
Letter Agreement between Unifi, Inc. and Sean D. Goodman dated October 22, 2015. |
|
10.21 |
Sales and Services Agreement dated January 1, 2007 between the Company and Dillon Yarn Corporation (incorporated by reference to Exhibit 99.1 to the Company’s Registration Statement on Form S-3 (Reg. No. 333-140580) filed on February 9, 2007). |
|
10.22 |
First Amendment to Sales and Service Agreement between Unifi Manufacturing, Inc. and Dillon Yarn Corporation, effective January 1, 2009 (incorporated by reference to Exhibit 10.1 to the Company’s Current Report on Form 8-K (Reg. No. 001-10542) dated December 2, 2008). |
|
10.23 |
Second Amendment to Sales and Service Agreement between Unifi Manufacturing, Inc. and Dillon Yarn Corporation, effective January 1, 2010 (incorporated by reference to Exhibit 10.1 to the Company’s Current Report on Form 8-K (Reg. No. 001-10542) dated December 11, 2009). |
|
10.24 |
Third Amendment to Sales and Service Agreement between Unifi Manufacturing, Inc. and Dillon Yarn Corporation, effective January 1, 2011 (incorporated by reference to Exhibit 10.1 to the Company’s Current Report on Form 8-K (Reg. No. 001-10542) dated December 22, 2010). |
|
10.25 |
Fourth Amendment to Sales and Service Agreement between Unifi Manufacturing, Inc. and Dillon Yarn Corporation, effective January 1, 2012 (incorporated by reference to Exhibit 10.1 to the Company’s Current Report on Form 8-K (Reg. No. 001-10542) dated December 20, 2011). |
|
10.26 |
Yarn Purchase Agreement effective as of September 1, 2014 between Unifi Manufacturing, Inc. and Hanesbrands Inc. (portions of the exhibit have been redacted and filed separately with the Securities and Exchange Commission pursuant to a confidential treatment request) (incorporated by reference to Exhibit 10.35 to the Company’s Annual Report on Form 10-K for the fiscal year ended June 29, 2014 (Reg. No. 001-10542) filed on September 10, 2014). |
|
10.27 |
Deposit Account Control Agreement, dated as of May 24, 2012, among Unifi Manufacturing, Inc., Wells Fargo Bank, N.A., and Bank of America, N.A. (incorporated by reference to Exhibit 10.1 to the Company’s Current Report on Form 8-K (Reg. No. 001-10542) dated May 25, 2012). |
|
21.1+ |
List of Subsidiaries. |
|
23.1+ |
Consent of KPMG LLP, Independent Registered Public Accounting Firm. |
|
31.1+ |
Principal executive officer’s certification pursuant to Section 302 of the Sarbanes-Oxley Act of 2002. |
|
31.2+ |
Principal financial officer’s certification pursuant to Section 302 of the Sarbanes-Oxley Act of 2002. |
|
32.1++ |
Principal executive officer’s certification pursuant to Section 906 of the Sarbanes-Oxley Act of 2002. |
|
32.2++ |
Principal financial officer’s certification pursuant to Section 906 of the Sarbanes-Oxley Act of 2002. |
|
101+ |
The following materials from the Company’s Annual Report on Form 10-K for the annual period ended June 26, 2016, formatted in eXtensbile Business Reporting Language (“XBRL”): (i) Consolidated Balance Sheets, (ii) Consolidated Statements of Income, (iii) Consolidated Statements of Comprehensive Income, (iv) Consolidated Statements of Shareholders’ Equity, (v) Consolidated Statements of Cash Flows, and (vi) Notes to Consolidated Financial Statements. |
+ Filed herewith.
++ Furnished herewith.
* These Exhibits are management contracts or compensatory plans or arrangements required to be filed as an exhibit to this Form 10-K pursuant to Item 15(b) of this report.
^ The Company has long-term debt but has not filed the instruments evidencing such debt as part of Exhibit 4, as none of such instruments authorizes the issuance of debt exceeding 10 percent of the total consolidated assets of the Company. The Company agrees to furnish a copy of each such agreement to the Securities and Exchange Commission upon request.
INDEX TO CONSOLIDATED FINANCIAL STATEMENTS
UNIFI, INC.
|
Consolidated Financial Statements: |
|
|
F-2 | |
|
Consolidated Balance Sheets as of June 26, 2016 and June 28, 2015 |
F-4 |
|
F-5 | |
|
F-6 | |
|
F-7 | |
|
F-8 | |
|
F-9 |
Report of Independent Registered Public Accounting Firm
The Board of Directors and Shareholders
Unifi, Inc.:
We have audited the accompanying consolidated balance sheets of Unifi, Inc. and subsidiaries as of June 26, 2016 and June 28, 2015, and the related consolidated statements of income, comprehensive income, shareholders’ equity, and cash flows for each of the years in the three-year period ended June 26, 2016. These consolidated financial statements are the responsibility of the Company’s management. Our responsibility is to express an opinion on these consolidated financial statements based on our audits.
We conducted our audits in accordance with the standards of the Public Company Accounting Oversight Board (United States). Those standards require that we plan and perform the audit to obtain reasonable assurance about whether the financial statements are free of material misstatement. An audit includes examining, on a test basis, evidence supporting the amounts and disclosures in the financial statements. An audit also includes assessing the accounting principles used and significant estimates made by management, as well as evaluating the overall financial statement presentation. We believe that our audits provide a reasonable basis for our opinion.
In our opinion, the consolidated financial statements referred to above present fairly, in all material respects, the financial position of Unifi, Inc. and subsidiaries as of June 26, 2016 and June 28, 2015, and the results of their operations and their cash flows for each of the years in the three year period ended June 26, 2016, in conformity with U.S. generally accepted accounting principles.
We also have audited, in accordance with the standards of the Public Company Accounting Oversight Board (United States), Unifi, Inc.’s internal control over financial reporting as of June 26, 2016, based on criteria established in Internal Control – Integrated Framework (2013) issued by the Committee of Sponsoring Organizations of the Treadway Commission (COSO), and our report dated August 26, 2016 expressed an unqualified opinion on the effectiveness of the Company’s internal control over financial reporting.
/s/ KPMG LLP
Greensboro, North Carolina
August 26, 2016
Report of Independent Registered Public Accounting Firm
The Board of Directors and Shareholders
Unifi, Inc.:
We have audited Unifi, Inc.’s internal control over financial reporting as of June 26, 2016, based on criteria established in Internal Control – Integrated Framework (2013) issued by the Committee of Sponsoring Organizations of the Treadway Commission (COSO). Unifi, Inc.’s management is responsible for maintaining effective internal control over financial reporting and for its assessment of the effectiveness of internal control over financial reporting, included in the accompanying Management’s Annual Report on Internal Control over Financial Reporting. Our responsibility is to express an opinion on the Company’s internal control over financial reporting based on our audit.
We conducted our audit in accordance with the standards of the Public Company Accounting Oversight Board (United States). Those standards require that we plan and perform the audit to obtain reasonable assurance about whether effective internal control over financial reporting was maintained in all material respects. Our audit included obtaining an understanding of internal control over financial reporting, assessing the risk that a material weakness exists, and testing and evaluating the design and operating effectiveness of internal control based on the assessed risk. Our audit also included performing such other procedures as we considered necessary in the circumstances. We believe that our audit provides a reasonable basis for our opinion.
A company’s internal control over financial reporting is a process designed to provide reasonable assurance regarding the reliability of financial reporting and the preparation of financial statements for external purposes in accordance with generally accepted accounting principles. A company’s internal control over financial reporting includes those policies and procedures that (1) pertain to the maintenance of records that, in reasonable detail, accurately and fairly reflect the transactions and dispositions of the assets of the company; (2) provide reasonable assurance that transactions are recorded as necessary to permit preparation of financial statements in accordance with generally accepted accounting principles, and that receipts and expenditures of the company are being made only in accordance with authorizations of management and directors of the company; and (3) provide reasonable assurance regarding prevention or timely detection of unauthorized acquisition, use, or disposition of the company’s assets that could have a material effect on the financial statements.
Because of its inherent limitations, internal control over financial reporting may not prevent or detect misstatements. Also, projections of any evaluation of effectiveness to future periods are subject to the risk that controls may become inadequate because of changes in conditions, or that the degree of compliance with the policies or procedures may deteriorate.
In our opinion, Unifi, Inc. maintained, in all material respects, effective internal control over financial reporting as of June 26, 2016, based on criteria established in Internal Control – Integrated Framework (2013) issued by the Committee of Sponsoring Organizations of the Treadway Commission (COSO).
We also have audited, in accordance with the standards of the Public Company Accounting Oversight Board (United States), the consolidated balance sheets of Unifi, Inc. and subsidiaries as of June 26, 2016 and June 28, 2015, and the related consolidated statements of income, comprehensive income, shareholders’ equity, and cash flows for each of the years in the three-year period ended June 26, 2016, and our report dated August 26, 2016 expressed an unqualified opinion on those consolidated financial statements.
/s/ KPMG LLP
Greensboro, North Carolina
August 26, 2016
CONSOLIDATED BALANCE SHEETS
(in thousands, except share and per share amounts)
|
June 26, 2016 |
June 28, 2015 |
|||||||
|
ASSETS |
||||||||
|
Cash and cash equivalents |
$ | 16,646 | $ | 10,013 | ||||
|
Receivables, net |
83,422 | 83,863 | ||||||
|
Inventories |
103,532 | 111,615 | ||||||
|
Income taxes receivable |
3,502 | 1,451 | ||||||
|
Other current assets |
4,790 | 6,022 | ||||||
|
Total current assets |
211,892 | 212,964 | ||||||
|
Property, plant and equipment, net |
185,101 | 136,222 | ||||||
|
Deferred income taxes |
2,387 | 3,922 | ||||||
|
Intangible assets, net |
3,741 | 5,388 | ||||||
|
Investments in unconsolidated affiliates |
117,412 | 113,901 | ||||||
|
Other non-current assets |
6,330 | 3,975 | ||||||
|
Total assets |
$ | 526,863 | $ | 476,372 | ||||
|
LIABILITIES AND SHAREHOLDERS’ EQUITY |
||||||||
|
Accounts payable |
$ | 41,593 | $ | 45,023 | ||||
|
Accrued expenses |
18,474 | 16,640 | ||||||
|
Income taxes payable |
1,455 | 676 | ||||||
|
Current portion of long-term debt |
13,786 | 12,385 | ||||||
|
Total current liabilities |
75,308 | 74,724 | ||||||
|
Long-term debt |
109,226 | 91,725 | ||||||
|
Other long-term liabilities |
10,393 | 10,740 | ||||||
|
Deferred income taxes |
4,991 | 90 | ||||||
|
Total liabilities |
199,918 | 177,279 | ||||||
|
Commitments and contingencies |
||||||||
|
Common stock, $0.10 par (500,000,000 shares authorized, 17,847,416 and 18,007,749 shares outstanding) |
1,785 | 1,801 | ||||||
|
Capital in excess of par value |
45,932 | 44,261 | ||||||
|
Retained earnings |
307,065 | 278,331 | ||||||
|
Accumulated other comprehensive loss |
(29,751 | ) | (26,899 | ) | ||||
|
Total Unifi, Inc. shareholders’ equity |
325,031 | 297,494 | ||||||
|
Non-controlling interest |
1,914 | 1,599 | ||||||
|
Total shareholders’ equity |
326,945 | 299,093 | ||||||
|
Total liabilities and shareholders’ equity |
$ | 526,863 | $ | 476,372 | ||||
See accompanying Notes to Consolidated Financial Statements
CONSOLIDATED STATEMENTS OF INCOME
(in thousands, except per share amounts)
|
For the Fiscal Year Ended |
||||||||||||
|
June 26, 2016 |
June 28, 2015 |
June 29, 2014 |
||||||||||
|
Net sales |
$ | 643,637 | $ | 687,121 | $ | 687,902 | ||||||
|
Cost of sales |
550,005 | 596,416 | 604,640 | |||||||||
|
Gross profit |
93,632 | 90,705 | 83,262 | |||||||||
|
Selling, general and administrative expenses |
47,502 | 49,672 | 46,203 | |||||||||
|
Provision for bad debts |
1,684 | 947 | 287 | |||||||||
|
Other operating expense, net |
2,248 | 1,600 | 5,289 | |||||||||
|
Operating income |
42,198 | 38,486 | 31,483 | |||||||||
|
Interest income |
(610 | ) | (916 | ) | (1,790 | ) | ||||||
|
Interest expense |
3,528 | 4,025 | 4,329 | |||||||||
|
Loss on extinguishment of debt |
— | 1,040 | — | |||||||||
|
Other non-operating expense |
— | — | 126 | |||||||||
|
Equity in earnings of unconsolidated affiliates |
(8,963 | ) | (19,475 | ) | (19,063 | ) | ||||||
|
Income before income taxes |
48,243 | 53,812 | 47,881 | |||||||||
|
Provision for income taxes |
15,073 | 13,346 | 20,161 | |||||||||
|
Net income including non-controlling interest |
$ | 33,170 | $ | 40,466 | $ | 27,720 | ||||||
|
Less: net loss attributable to non-controlling interest |
(1,245 | ) | (1,685 | ) | (1,103 | ) | ||||||
|
Net income attributable to Unifi, Inc. |
$ | 34,415 | $ | 42,151 | $ | 28,823 | ||||||
|
Net income attributable to Unifi, Inc. per common share: |
||||||||||||
|
Basic |
$ | 1.93 | $ | 2.32 | $ | 1.52 | ||||||
|
Diluted |
$ | 1.87 | $ | 2.24 | $ | 1.47 | ||||||
See accompanying Notes to Consolidated Financial Statements
CONSOLIDATED STATEMENTS OF COMPREHENSIVE INCOME
(in thousands)
|
For the Fiscal Year Ended |
||||||||||||
|
June 26, 2016 |
June 28, 2015 |
June 29, 2014 |
||||||||||
|
Net income including non-controlling interest |
$ | 33,170 | $ | 40,466 | $ | 27,720 | ||||||
|
Other comprehensive (loss) income: |
||||||||||||
|
Foreign currency translation adjustments |
(2,135 | ) | (21,578 | ) | 327 | |||||||
|
Foreign currency translation adjustments for an unconsolidated affiliate |
(794 | ) | (933 | ) | — | |||||||
|
Reclassification adjustments on interest rate swap |
77 | 231 | 554 | |||||||||
|
Other comprehensive (loss) income, net |
(2,852 | ) | (22,280 | ) | 881 | |||||||
|
Comprehensive income including non-controlling interest |
30,318 | 18,186 | 28,601 | |||||||||
|
Less: comprehensive loss attributable to non-controlling interest |
(1,245 | ) | (1,685 | ) | (1,103 | ) | ||||||
|
Comprehensive income attributable to Unifi, Inc. |
$ | 31,563 | $ | 19,871 | $ | 29,704 | ||||||
See accompanying Notes to Consolidated Financial Statements
CONSOLIDATED STATEMENTS OF SHAREHOLDERS’ EQUITY
(in thousands)
|
Shares |
Common Stock |
Capital in Excess of Par Value |
Retained Earnings |
Accumulated Other Comprehensive Income (Loss) |
Total Unifi, Inc. Shareholders’ Equity |
Non- controlling Interest |
Total Shareholders’ Equity |
|||||||||||||||||||||||||
|
|
||||||||||||||||||||||||||||||||
|
Balance at June 30, 2013 |
19,205 | $ | 1,921 | $ | 36,375 | $ | 252,112 | $ | (5,500 | ) | $ | 284,908 | $ | 1,572 | $ | 286,480 | ||||||||||||||||
|
Options exercised |
798 | 79 | 6,640 | — | — | 6,719 | — | 6,719 | ||||||||||||||||||||||||
|
Stock-based compensation |
— | — | 1,939 | — | — | 1,939 | — | 1,939 | ||||||||||||||||||||||||
|
Conversion of restricted stock units |
31 | 3 | (3 | ) | — | — | — | — | — | |||||||||||||||||||||||
|
Common stock repurchased and retired under publicly announced programs |
(1,524 | ) | (152 | ) | (2,814 | ) | (33,585 | ) | — | (36,551 | ) | — | (36,551 | ) | ||||||||||||||||||
|
Common stock tendered to the Company for the exercise of stock options and retired |
(134 | ) | (14 | ) | (3,540 | ) | (29 | ) | — | (3,583 | ) | — | (3,583 | ) | ||||||||||||||||||
|
Common stock tendered to the Company for withholding tax obligations and retired |
(62 | ) | (6 | ) | — | (1,648 | ) | — | (1,654 | ) | — | (1,654 | ) | |||||||||||||||||||
|
Excess tax benefit on stock-based compensation plans |
— | — | 3,533 | — | — | 3,533 | — | 3,533 | ||||||||||||||||||||||||
|
Other comprehensive income, net of tax |
— | — | — | — | 881 | 881 | — | 881 | ||||||||||||||||||||||||
|
Contributions from non-controlling interest |
— | — | — | — | — | — | 1,254 | 1,254 | ||||||||||||||||||||||||
|
Net income (loss) |
— | — | — | 28,823 | — | 28,823 | (1,103 | ) | 27,720 | |||||||||||||||||||||||
|
Balance at June 29, 2014 |
18,314 | $ | 1,831 | $ | 42,130 | $ | 245,673 | $ | (4,619 | ) | $ | 285,015 | $ | 1,723 | $ | 286,738 | ||||||||||||||||
|
Options exercised |
11 | 1 | 94 | — | — | 95 | — | 95 | ||||||||||||||||||||||||
|
Stock-based compensation |
— | — | 2,631 | — | — | 2,631 | — | 2,631 | ||||||||||||||||||||||||
|
Conversion of restricted stock units |
31 | 3 | (3 | ) | — | — | — | — | — | |||||||||||||||||||||||
|
Common stock repurchased and retired under publicly announced program |
(349 | ) | (34 | ) | (833 | ) | (9,493 | ) | — | (10,360 | ) | — | (10,360 | ) | ||||||||||||||||||
|
Excess tax benefit on stock-based compensation plans |
— | — | 242 | — | — | 242 | — | 242 | ||||||||||||||||||||||||
|
Other comprehensive loss, net of tax |
— | — | — | — | (22,280 | ) | (22,280 | ) | — | (22,280 | ) | |||||||||||||||||||||
|
Contributions from non-controlling interest |
— | — | — | — | — | — | 1,561 | 1,561 | ||||||||||||||||||||||||
|
Net income (loss) |
— | — | — | 42,151 | — | 42,151 | (1,685 | ) | 40,466 | |||||||||||||||||||||||
|
Balance at June 28, 2015 |
18,007 | $ | 1,801 | $ | 44,261 | $ | 278,331 | $ | (26,899 | ) | $ | 297,494 | $ | 1,599 | $ | 299,093 | ||||||||||||||||
|
Options exercised |
27 | 3 | 178 | — | — | 181 | — | 181 | ||||||||||||||||||||||||
|
Stock-based compensation |
— | — | 2,340 | — | — | 2,340 | — | 2,340 | ||||||||||||||||||||||||
|
Conversion of restricted stock units |
19 | 2 | (2 | ) | — | — | — | — | — | |||||||||||||||||||||||
|
Common stock repurchased and retired under publicly announced program |
(206 | ) | (21 | ) | (509 | ) | (5,681 | ) | — | (6,211 | ) | — | (6,211 | ) | ||||||||||||||||||
|
Excess tax benefit on stock-based compensation plans |
— | — | 120 | — | — | 120 | — | 120 | ||||||||||||||||||||||||
|
Tax deficiency from stock-based compensation plans |
— | — | (456 | ) | — | — | (456 | ) | — | (456 | ) | |||||||||||||||||||||
|
Other comprehensive loss, net of tax |
— | — | — | — | (2,852 | ) | (2,852 | ) | — | (2,852 | ) | |||||||||||||||||||||
|
Contributions from non-controlling interest |
— | — | — | — | — | — | 1,560 | 1,560 | ||||||||||||||||||||||||
|
Net income (loss) |
— | — | — | 34,415 | — | 34,415 | (1,245 | ) | 33,170 | |||||||||||||||||||||||
|
Balance at June 26, 2016 |
17,847 | $ | 1,785 | $ | 45,932 | $ | 307,065 | $ | (29,751 | ) | $ | 325,031 | $ | 1,914 | $ | 326,945 | ||||||||||||||||
See accompanying Notes to Consolidated Financial Statements
CONSOLIDATED STATEMENTS OF CASH FLOWS
(in thousands)
|
For the Fiscal Year Ended |
||||||||||||
|
June 26, 2016 |
June 28, 2015 |
June 29, 2014 |
||||||||||
|
Cash and cash equivalents at beginning of year |
$ | 10,013 | $ | 15,907 | $ | 8,755 | ||||||
|
Operating activities: |
||||||||||||
|
Net income including non-controlling interest |
33,170 | 40,466 | 27,720 | |||||||||
|
Adjustments to reconcile net income including non-controlling interest to net cash provided by operating activities: |
||||||||||||
|
Equity in earnings of unconsolidated affiliates |
(8,963 | ) | (19,475 | ) | (19,063 | ) | ||||||
|
Distributions received from unconsolidated affiliates |
4,732 | 3,718 | 13,214 | |||||||||
|
Depreciation and amortization expense |
17,528 | 18,043 | 17,896 | |||||||||
|
Loss on extinguishment of debt |
— | 1,040 | — | |||||||||
|
Non-cash compensation expense |
2,501 | 3,148 | 2,690 | |||||||||
|
Excess tax benefit on stock-based compensation plans |
(120 | ) | (242 | ) | (3,533 | ) | ||||||
|
Deferred income taxes |
5,983 | (3,796 | ) | 726 | ||||||||
|
Other, net |
(302 | ) | 1,441 | 1,649 | ||||||||
|
Changes in assets and liabilities: |
||||||||||||
|
Receivables, net |
(88 | ) | 4,491 | 4,514 | ||||||||
|
Inventories |
6,843 | (6,171 | ) | (2,677 | ) | |||||||
|
Other current assets and income taxes receivable |
(2,235 | ) | (1,099 | ) | 1,141 | |||||||
|
Accounts payable and accrued expenses |
(5,710 | ) | (3,612 | ) | 1,157 | |||||||
|
Income taxes payable |
816 | (2,395 | ) | 5,824 | ||||||||
|
Other non-current assets |
(108 | ) | 76 | 5,173 | ||||||||
|
Other non-current liabilities |
1,928 | 3,270 | (74 | ) | ||||||||
|
Net cash provided by operating activities |
55,975 | 38,903 | 56,357 | |||||||||
|
Investing activities: |
||||||||||||
|
Capital expenditures |
(52,337 | ) | (25,966 | ) | (19,091 | ) | ||||||
|
Investments in miscanthus grass |
(2,610 | ) | (830 | ) | (714 | ) | ||||||
|
Proceeds from sale of assets |
2,099 | 3,847 | 2,719 | |||||||||
|
Other, net |
(44 | ) | 408 | 217 | ||||||||
|
Net cash used in investing activities |
(52,892 | ) | (22,541 | ) | (16,869 | ) | ||||||
|
Financing activities: |
||||||||||||
|
Proceeds from ABL Revolver |
153,200 | 149,100 | 149,300 | |||||||||
|
Payments on ABL Revolver |
(152,000 | ) | (170,100 | ) | (175,800 | ) | ||||||
|
Proceeds from ABL Term Loan |
17,375 | 22,000 | 25,200 | |||||||||
|
Payments on ABL Term Loan |
(9,250 | ) | (7,875 | ) | — | |||||||
|
Proceeds from a term loan supplement |
4,000 | — | — | |||||||||
|
Proceeds from construction financing |
790 | — | — | |||||||||
|
Payment on term loan from equity affiliate |
(1,250 | ) | — | — | ||||||||
|
Payments of debt financing fees |
(217 | ) | (1,063 | ) | (400 | ) | ||||||
|
Payments on capital lease obligations |
(4,090 | ) | (1,286 | ) | (319 | ) | ||||||
|
Common stock repurchased and retired under publicly announced programs |
(6,211 | ) | (10,360 | ) | (36,551 | ) | ||||||
|
Common stock tendered to the Company for withholding tax obligations and retired |
— | — | (1,654 | ) | ||||||||
|
Proceeds from stock option exercises |
181 | 95 | 3,136 | |||||||||
|
Excess tax benefit on stock-based compensation plans |
120 | 242 | 3,533 | |||||||||
|
Contributions from non-controlling interest |
1,560 | 1,561 | 1,254 | |||||||||
|
Other |
(566 | ) | (504 | ) | (109 | ) | ||||||
|
Net cash provided by (used in) financing activities |
3,642 | (18,190 | ) | (32,410 | ) | |||||||
|
Effect of exchange rate changes on cash and cash equivalents |
(92 | ) | (4,066 | ) | 74 | |||||||
|
Net increase (decrease) in cash and cash equivalents |
6,633 | (5,894 | ) | 7,152 | ||||||||
|
Cash and cash equivalents at end of year |
$ | 16,646 | $ | 10,013 | $ | 15,907 | ||||||
See accompanying Notes to Consolidated Financial Statements
Unifi, Inc.
Notes to Consolidated Financial Statements
1. Background
Overview
Unifi, Inc., a New York corporation formed in 1969 (together with its subsidiaries, “we,” the “Company” or “Unifi”), is a multi-national manufacturing company that processes and sells high-volume commodity yarns, specialized yarns designed to meet certain customer specifications, and premium value-added (“PVA”) yarns with enhanced performance characteristics. The Company sells yarns made from polyester and nylon to other yarn manufacturers and knitters and weavers that produce fabric for the apparel, hosiery, home furnishings, automotive upholstery, industrial and other end-use markets. The Company’s polyester products include polyester polymer beads (“Chip”), partially oriented yarn (“POY”), textured, solution and package dyed, twisted, beamed and draw wound yarns. Each polyester product is available in virgin or recycled varieties, where the recycled is made from both pre-consumer yarn waste and post-consumer waste, including plastic bottles. The Company’s nylon products include textured, solution dyed and spandex covered products.
The Company maintains one of the textile industry’s most comprehensive yarn product offerings, and has manufacturing operations in four countries and participates in joint ventures in Israel and the United States (“U.S.”). The Company’s principal geographic markets for its products are located in North America, Central America, South America and Asia.
In addition to the Company’s operations described above, the Company’s investments include, but are not limited to, (i) a 60% controlling membership interest in Repreve Renewables, LLC (“Renewables”), an agricultural company focused on the development, production and commercialization of miscanthus grass for use in the animal bedding, bio-energy and other bio-based products markets; and (ii) a 34% non-controlling partnership interest in Parkdale America, LLC (“PAL”), a producer of cotton and synthetic yarns for sale to the textile industry and apparel market, both foreign and domestic.
Fiscal Year
The fiscal year end for the Company and its subsidiaries in El Salvador and China occurs on the last Sunday in June. The Company’s fiscal 2016, 2015 and 2014 ended on June 26, 2016, June 28, 2015 and June 29, 2014, respectively. The Company’s Brazilian and Colombian subsidiaries’ fiscal years end on June 30th. There were no significant transactions or events that occurred between the fiscal year ends of the Company and its subsidiaries. The Company’s fiscal 2016, 2015 and 2014 all consisted of 52 weeks.
Reclassifications
Certain reclassifications of prior years’ data have been made to conform to the current year presentation.
All dollar and other currency amounts and share amounts, except per share amounts, are presented in thousands (000s), except as otherwise noted.
2. Summary of Significant Accounting Policies
The Company follows U.S. generally accepted accounting principles (“GAAP”). The significant accounting policies described below, together with the other notes that follow, are an integral part of the consolidated financial statements.
Principles of Consolidation
The consolidated financial statements include the accounts of the Company and its subsidiaries in which it maintains a controlling financial interest. All account balances and transactions between the Company and the subsidiaries which it controls have been eliminated. Investments in entities where the Company is able to exercise significant influence, but not control, are accounted for by the equity method. For transactions with entities accounted for under the equity method, any intercompany profits on amounts still remaining are eliminated. Amounts originating from any deferral of intercompany profits are recorded within either the Company’s investment account or the account balance to which the transaction specifically relates (e.g., inventory). Only upon settlement of the intercompany transaction with a third party is the deferral of the intercompany profit recognized by the Company.
Use of Estimates
The preparation of financial statements in conformity with GAAP requires management to make use of estimates and assumptions that affect the reported amounts of assets and liabilities, certain financial statement disclosures at the date of the financial statements, and the reported amounts of revenues and expenses during the period. The Company’s consolidated financial statements include amounts that are based on management’s best estimates and judgments. Actual results may vary from these estimates. These estimates are reviewed periodically to determine if a change is required.
Cash and Cash Equivalents
Cash equivalents are defined as highly liquid, short-term investments having an original maturity of three months or less. Book overdrafts, for which the bank has not advanced cash, if any, are reclassified to accounts payable and reflected as an offset thereto within the consolidated statements of cash flows.
Unifi, Inc.
Notes to Consolidated Financial Statements – (Continued)
Receivables
Receivables are stated at their net realizable value. Allowances are provided for known and potential losses arising from yarn quality claims and for amounts owed by customers. Reserves for yarn quality claims are based on historical experience and known pending claims and are recorded as a reduction of net sales. The allowance for uncollectible accounts is shown as a reduction of operating income and reflects the Company’s best estimate of probable losses inherent in its accounts receivable portfolio determined on the basis of historical experience, aging of trade receivables, specific allowances for known troubled accounts and other currently available information. Customer accounts are written off against the allowance for uncollectible accounts when they are no longer deemed to be collectible.
Inventories
The Company’s inventories are valued at the lower of cost or market with the cost for the majority of its inventory determined using the first-in, first-out method. Certain foreign inventories and limited categories of supplies and agricultural inventories are valued using the average cost method. The Company’s estimates for inventory reserves for obsolete, slow-moving or excess inventories are based upon many factors including historical recovery rates, the aging of inventories on-hand, inventory movement and expected net realizable value of specific products, and current economic conditions.
Debt Financing Fees
The Company capitalizes costs associated with the financing of its debt obligations. These costs are amortized as additional interest expense following either the effective interest method or the straight-line method. In the event of any prepayment of its debt obligations, the Company accelerates the recognition of a pro-rata amount of issuance costs and records an extinguishment of debt.
Property, Plant and Equipment
Property, plant and equipment (“PP&E”) are stated at historical cost less accumulated depreciation. Plant and equipment under capital leases are stated at the present value of minimum lease payments less accumulated amortization. Additions or improvements that substantially extend the useful life of a particular asset are capitalized. Depreciation is calculated primarily utilizing the straight-line method over the following useful lives:
|
Asset categories |
Useful lives in years | ||
|
Land improvements |
Ten |
to | Twenty |
|
Buildings and improvements |
Fifteen |
to | Forty |
|
Machinery and equipment |
Three |
to | Twenty-five |
|
Computer, software and office equipment |
Three |
to | Seven |
|
Internal software development costs |
|
Three | |
|
Transportation equipment |
Three |
to | Fifteen |
Leasehold improvements are depreciated over the lesser of their estimated useful lives or the remaining term of the lease.
Assets under capital leases are amortized in a manner consistent with the Company’s normal depreciation policy if ownership is transferred by the end of the lease, or if there is a bargain purchase option. If such ownership criteria are not met, amortization occurs over the shorter of the lease term or the asset’s useful life.
The Company capitalizes its costs of developing internal software when the software is used as an integral part of its manufacturing or business processes and the technological feasibility has been established. Internal software costs are amortized over a period of three years and, in accordance with the project type, charged to cost of sales or selling, general and administrative (“SG&A”) expenses.
Fully depreciated assets are retained in cost and accumulated depreciation accounts until they are removed from service. In the case of disposals, asset costs and related accumulated depreciation amounts are removed from the accounts, and the net amounts, less proceeds from disposal, are included in the determination of net income and presented within other operating expense, net.
Repair and maintenance costs related to PP&E which do not significantly increase the useful life of an existing asset or do not significantly alter, modify or change the capabilities or production capacity of an existing asset are expensed as incurred.
Interest is capitalized for capital projects requiring a construction period.
PP&E and other long-lived assets are tested for impairment whenever events or changes in circumstances indicate that the respective carrying amount may not be recoverable. Long-lived assets to be disposed of by sale within one year are classified as held for sale and are reported at the lower of carrying amount or fair value less cost to sell. Depreciation ceases for all assets classified as held for sale. Long-lived assets to be disposed of other than by sale are classified as held for use until they are disposed of and these assets are reported at the lower of their carrying amount or estimated fair value.
Unifi, Inc.
Notes to Consolidated Financial Statements – (Continued)
Miscanthus Grass
Miscanthus grass is stated at historical cost and subject to depreciation at the time that production in commercial quantities begins (which is expected to occur approximately twenty-four months after planting). Cost includes expenditures associated with land and planting bed preparation, biological materials and overhead. Cultural care costs are capitalized during the development period (up to twenty-four months) and are subsequently expensed as incurred. Depreciation is calculated utilizing the straight-line method over the shorter of the (i) land lease term including renewal periods or (ii) estimated productive life of the plantings, generally fifteen years.
Intangible Assets
Finite-lived intangible assets, such as customer lists, non-compete agreements, licenses, trademarks and patents are amortized over their estimated useful lives. The Company periodically evaluates the reasonableness of the useful lives of these assets. Once these assets are fully amortized, they are removed from the accounts. These assets are reviewed for impairment or obsolescence when events or changes in circumstances indicate that the carrying amount may not be recoverable. If impaired, intangible assets are written down to fair value based on discounted cash flows or other valuation techniques. The Company has no intangibles with indefinite lives.
Investments in Unconsolidated Affiliates
The Company evaluates its investments in unconsolidated affiliates for impairment whenever events or changes in circumstances indicate that the carrying amount may not be recoverable.
Derivative Instruments
All derivatives are carried on the balance sheet at fair value and are classified according to their asset or liability position and the expected timing of settlement. On the date the derivative contract is entered into, the Company may designate the derivative into one of the following categories:
|
● |
Fair value hedge – a hedge of the fair value of a recognized asset, liability or a firm commitment. Changes in the fair value of derivatives designated and qualifying as fair-value hedges, as well as the offsetting gains and losses on the hedged items, are reported in income in the same period. |
|
● |
Cash flow hedge – a hedge of a forecasted transaction or of the variability of cash flows to be received or paid related to a recognized asset or liability. The effective portion of gains and losses on cash flow hedges are recorded in accumulated other comprehensive loss, until the underlying transactions are recognized in income. When the hedged item is realized, gains or losses are reclassified from accumulated other comprehensive loss to current period earnings on the same line item as the underlying transaction. |
|
● |
Net investment hedge – if a derivative is used as a foreign currency hedge of a net investment in a foreign operation, its changes in fair value, to the extent effective as a hedge, are recorded in foreign currency translation adjustments in accumulated other comprehensive loss. |
Any ineffective portion of a designated hedge is immediately recognized in current period earnings. Derivatives that are not designated for hedge accounting are marked to market at the end of each period with the changes in fair value recognized in current period earnings. Settlements of any fair value or cash flow derivative contracts are classified as cash flows from operating activities.
Fair Value Measurements
The accounting guidance for fair value measurements and disclosures establishes a fair value hierarchy that prioritizes the inputs to valuation techniques used to measure fair value. Fair value is defined as the price that would be received to sell an asset or paid to transfer a liability in an orderly transaction between market participants in the principal market, or if none exists, the most advantageous market, for the specific asset or liability at the measurement date (the exit price). Fair value is based on assumptions that market participants would use when pricing the asset or liability. The hierarchy gives the highest priority to unadjusted quoted prices in active markets and the lowest priority to unobservable inputs. The Company uses the following to measure fair value for its assets and liabilities:
|
● |
Level 1 – Observable inputs that reflect quoted prices for identical assets or liabilities in active markets |
|
● |
Level 2 – Inputs other than quoted prices included in Level 1 that are observable for the asset or liability either indirectly or directly |
Unifi, Inc.
Notes to Consolidated Financial Statements – (Continued)
|
● |
Level 3 – Unobservable inputs reflecting management’s own assumptions about the inputs used in pricing the asset or liability |
The classification of assets and liabilities within the valuation hierarchy is based upon the lowest level of input that is significant to the fair value measurement in its entirety.
Income Taxes
Income taxes are accounted for under the asset and liability method. Deferred tax assets and liabilities are recorded to recognize the expected future tax benefits or costs of events that have been, or will be, reported in different tax years for financial statement purposes than for tax purposes. Deferred tax assets and liabilities are determined based on the difference between the financial statement and tax bases of assets and liabilities using enacted tax rates in effect for the year in which these items are expected to reverse. The Company reviews deferred tax assets to determine if it is more-likely-than-not they will be realized. If the Company determines it is not more-likely-than-not that a deferred tax asset will be realized, it records a valuation allowance to reverse the previously recognized benefit. Provision is made for taxes on undistributed earnings of foreign subsidiaries and related companies to the extent that such earnings are not deemed to be permanently invested.
The Company recognizes tax benefits related to uncertain tax positions if it believes it is more-likely-than-not of being sustained. Recognized income tax positions are measured at the largest amount that is greater than 50% likely of being realized. The Company accrues for other tax contingencies when it is probable that a liability to a taxing authority has been incurred and the amount of the contingency can be reasonably estimated. Income tax expense related to penalties and interest, if incurred, is included in provision for income taxes.
Stock-Based Compensation
Compensation expense for stock awards is based on the grant date fair value and expensed over the applicable vesting period. The Company has a policy of issuing new shares to satisfy share option exercises. For awards with a service condition and a graded vesting schedule, the Company has elected an accounting policy of recognizing compensation cost on a straight-line basis over the requisite service period for each separate vesting portion of the award as if the award was, in-substance, multiple awards.
Foreign Currency Translation
Assets and liabilities of foreign subsidiaries whose functional currency is other than the U.S. Dollar are translated at exchange rates existing at the respective balance sheet dates. Translation gains and losses are not included in determining net income, but are presented in a separate component of accumulated other comprehensive loss. The Company translates the results of operations of its foreign operations at the average exchange rates during the respective periods. Transaction gains and losses are included within other operating expense, net.
Revenue Recognition
The Company recognizes revenue when (a) there is persuasive evidence of an arrangement, (b) the sales price is fixed or determinable, (c) title and the risks of ownership have been transferred to the customer, and (d) collection of the receivable is reasonably assured. For the sale of goods, revenue recognition occurs primarily upon shipment. For service arrangements, revenue is recognized when (i) transportation services have been completed in accordance with the bill of lading contract or (ii) in accordance with contractual agreements with customers utilizing the criteria above. Revenue includes amounts for duties and import taxes, interest billed to customers, and shipping and handling costs billed to customers. Revenue excludes value-added taxes or other sales taxes and includes any applicable deductions for returns and allowances, yarn claims, and discounts.
Cost of Sales
The major components of cost of sales are: (a) materials and supplies, (b) labor and fringe benefits, (c) utility and overhead costs associated with manufactured products, (d) cost of products purchased for resale, (e) shipping, handling and warehousing costs, (f) research and development costs, (g) depreciation expense, and (h) all other costs related to production or providing service activities.
Shipping, Handling and Warehousing Costs
Shipping, handling and warehousing costs include costs to store goods prior to shipment, prepare goods for shipment and physically move goods to customers.
Research and Development Costs
Research and development costs include employee costs, production costs related to customer samples, operating supplies, consulting fees and other miscellaneous costs. The cost of research and development is charged to expense as incurred. Research and development costs were as follows:
|
For the Fiscal Year Ended |
||||||||||||
|
June 26, 2016 |
June 28, 2015 |
June 29, 2014 |
||||||||||
|
Research and development costs |
$ | 6,907 | $ | 8,113 | $ | 7,921 | ||||||
Unifi, Inc.
Notes to Consolidated Financial Statements – (Continued)
Selling, General and Administrative Expenses
The major components of SG&A expenses are: (a) costs of the Company’s sales force, marketing and advertising efforts, as well as commissions and credit insurance, (b) costs of maintaining the Company’s general and administrative support functions including executive management, information technology, human resources, legal, and finance, (c) amortization of intangible assets, and (d) all other costs required to be classified as SG&A expenses.
Advertising Costs
Advertising costs are expensed as incurred and included in SG&A expenses. The Company’s advertising costs include spending for items such as consumer marketing and branding initiatives, promotional items, trade shows, sponsorships and other programs. Advertising costs were as follows:
|
For the Fiscal Year Ended |
||||||||||||
|
June 26, 2016 |
June 28, 2015 |
June 29, 2014 |
||||||||||
|
Advertising costs |
$ | 4,844 | $ | 3,975 | $ | 2,953 | ||||||
Restructuring Charges
Restructuring charges for the relocation of equipment, disposal costs, severance and other exit costs are expensed as incurred.
Self Insurance
The Company self-insures certain risks such as employee healthcare claims. Reserves for incurred but not reported healthcare claims are estimated using historical data, the timeliness of claims processing, medical trends, inflation and any changes, if applicable, in the nature or type of the plan.
Contingencies
At any point in time, the Company may be a party to various pending legal proceedings, claims or environmental actions. Accruals for estimated losses are recorded at the time information becomes available indicating that losses are probable and estimable. Any amounts accrued are not discounted. Legal costs such as outside counsel fees and expenses are charged to expense as incurred.
3. Recent Accounting Pronouncements
In April 2015, the Financial Accounting Standards Board (“FASB”) issued Accounting Standards Update (“ASU”) 2015-05, Intangibles—Goodwill and Other—Internal-Use Software (Subtopic 350-40): Customer’s Accounting for Fees Paid in a Cloud Computing Arrangement, providing criteria for determining if a license of software, as part of a cloud services arrangement, is subject to capitalization under the existing guidance for internal-use software. The guidance is effective for the Company’s fiscal 2017.
In July 2015, the FASB issued ASU 2015-11, Inventory, which modifies the subsequent measurement of inventories recorded under a first-in-first-out or average cost method. Under the new standard, such inventories are required to be measured at the lower of cost and net realizable value. The new standard is effective for the Company’s fiscal 2018, with prospective application.
In August 2015, the FASB issued ASU 2015-15, Interest - Imputation of Interest (Subtopic 835-30): Presentation and Subsequent Measurement of Debt Issuance Costs Associated with Line-of-Credit Arrangements - Amendments to SEC Paragraphs Pursuant to Staff Announcement at June 18, 2015 EITF Meeting, which provides clarification from ASU No. 2015-03 regarding the presentation and subsequent measurement of debt issuance costs associated with line-of-credit arrangements.
In February 2016, the FASB issued ASU 2016-02, Leases (Topic 842). The ASU is intended to increase transparency and comparability among organizations by recognizing lease assets and lease liabilities on the balance sheet and disclosing key information about leasing arrangements. ASU 2016-02 requires, among other changes to the lease accounting guidance, lessees to recognize most leases on-balance sheet via a right of use asset and lease liability, and additional qualitative and quantitative disclosures. The ASU is effective for the Company’s fiscal 2020 with a modified retrospective transition method, and early adoption is permitted.
In March 2016, the FASB issued ASU 2016-08, Revenue from Contracts with Customers (Topic 606): Principal versus Agent Considerations (Reporting Revenue Gross versus Net). The ASU is intended to clarify implementation guidance on principal versus agent considerations while reducing the potential for diversity in practice arising from inconsistent application. The effective date and transition requirements for ASU 2016-08 are the same as the effective date and transition requirements of ASU 2014-09 and 2015-14. The guidance is effective for the Company’s fiscal 2019.
In March 2016, the FASB issued ASU 2016-09, Compensation—Stock Compensation (Topic 718): Improvements to Employee Share-Based Payment Accounting. The ASU includes multiple provisions intended to simplify various aspects of the accounting for share-based payments, while reducing cost and complexity. The ASU is effective for the Company’s fiscal 2018, and early adoption is permitted.
Unifi, Inc.
Notes to Consolidated Financial Statements – (Continued)
In April 2016, the FASB issued ASU 2016-10, Revenue from Contracts with Customers (Topic 606): Identifying Performance Obligations and Licensing. The ASU is intended to clarify implementation guidance on performance obligations and licensing while reducing the potential for diversity in practice arising from inconsistent application. The effective date and transition requirements for ASU 2016-10 are the same as the effective date and transition requirements of ASU 2014-09 and 2015-14. The guidance is effective for the Company’s fiscal 2019.
The Company is evaluating the effect the new guidance will have on its consolidated financial statements and related disclosures.
In July 2013, the FASB issued ASU 2013-11, Presentation of an Unrecognized Tax Benefit When a Net Operating Loss Carryforward, a Similar Tax Loss, or a Tax Credit Carryforward Exists. The guidance requires an entity to present its deferred tax asset for a net operating loss carryforward, similar tax loss, or a tax credit carryforward net of unrecognized tax benefits when settlement in this manner is available under the tax law, which would be based on facts and circumstances as of the balance sheet reporting date and would not consider future events. The Company adopted the guidance in fiscal year 2015 and there is no significant impact on the Company’s financial statements.
In April 2015, the FASB issued ASU 2015-03, Interest—Imputation of Interest, which requires that debt issuance costs related to a recognized debt liability be presented in the balance sheet as a direct deduction from the carrying amount of that debt liability, consistent with debt discounts. The recognition and measurement guidance of debt issuance costs are not affected by the amendments in this update. The new standard is effective for the Company’s fiscal year 2017 and requires the Company to apply the new guidance on a retrospective basis upon adoption. Upon adoption, the Company expects $1,421 and $1,611 of debt issuance costs recorded within other non-current assets at June 26, 2016 and June 28, 2015, respectively, would be presented in the consolidated balance sheets as a direct deduction from the carrying amount of the corresponding debt liabilities.
In fiscal 2016, the Company early adopted ASU 2015-17, Income Taxes (Topic 740): Balance Sheet Classification of Deferred Taxes. The ASU eliminates the existing requirement for entities to present deferred tax assets and liabilities as current and noncurrent in a classified balance sheet. Instead, upon adoption, entities are required to classify all deferred tax assets and liabilities as noncurrent. Adopting this ASU provides simplification in the presentation of deferred tax assets and liabilities and alignment with International Financial Reporting Standards.
Retrospective application of June 28, 2015 balances reflect the revised presentation requirements of ASU 2015-17, as outlined in the table below.
|
June 28, 2015 As Previously Reported |
Adjustments Due to Adoption of ASU 2015-17 |
June 28, 2015 As Adjusted |
||||||||||
|
Deferred income taxes (within total current assets) |
$ | 2,383 | $ | (2,383 | ) | $ | — | |||||
|
Total current assets |
215,347 | (2,383 | ) | 212,964 | ||||||||
|
Deferred income taxes (within non-current assets) |
1,539 | 2,383 | 3,922 | |||||||||
|
Total assets |
476,372 | — | 476,372 | |||||||||
|
Deferred income taxes (within non-current liabilities) |
90 | — | 90 | |||||||||
|
Total liabilities |
177,279 | — | 177,279 | |||||||||
There have been no other newly issued or newly applicable accounting pronouncements that have, or are expected to have, a significant impact on the Company's financial statements.
4. Acquisition
Acquisition of Draw Winding Business
On December 2, 2013, the Company acquired certain draw winding assets and the associated business, and recorded $2,500 for a contingent liability. The acquisition increased the Company’s polyester production capacity and allowed the Company to expand its product offerings to include mid-tenacity flat yarns. The contingent consideration liability represented the present value of the expected future payments due to the seller over the five-year period following the acquisition date.
See Note 9 for further discussion of the customer list and non-compete agreement.
See Note 18 for further discussion of the recurring measurement of the contingent consideration.
5. Receivables, Net
Receivables, net consists of the following:
|
June 26, 2016 |
June 28, 2015 |
|||||||
|
Customer receivables |
$ | 86,358 | $ | 85,731 | ||||
|
Allowance for uncollectible accounts |
(2,839 | ) | (1,596 | ) | ||||
|
Reserves for yarn quality claims |
(795 | ) | (581 | ) | ||||
|
Net customer receivables |
82,724 | 83,554 | ||||||
|
Related party receivables |
10 | 75 | ||||||
|
Other receivables |
688 | 234 | ||||||
|
Total receivables, net |
$ | 83,422 | $ | 83,863 | ||||
Unifi, Inc.
Notes to Consolidated Financial Statements – (Continued)
Other receivables consist primarily of receivables for duty drawback and refunds due from vendors.
The changes in the Company’s allowance for uncollectible accounts and reserves for yarn quality claims were as follows:
|
Allowance for Uncollectible Accounts |
Reserves for Yarn Quality Claims |
|||||||
|
Balance at June 30, 2013 |
$ | (972 | ) | $ | (893 | ) | ||
|
Charged to costs and expenses |
(287 | ) | (1,726 | ) | ||||
|
Charged to other accounts |
(20 | ) | 2 | |||||
|
Deductions |
244 | 1,999 | ||||||
|
Balance at June 29, 2014 |
$ | (1,035 | ) | $ | (618 | ) | ||
|
Charged to costs and expenses |
(947 | ) | (1,336 | ) | ||||
|
Charged to other accounts |
240 | 29 | ||||||
|
Deductions |
146 | 1,344 | ||||||
|
Balance at June 28, 2015 |
$ | (1,596 | ) | $ | (581 | ) | ||
|
Charged to costs and expenses |
(1,684 | ) | (1,886 | ) | ||||
|
Charged to other accounts |
(56 | ) | (4 | ) | ||||
|
Deductions |
497 | 1,676 | ||||||
|
Balance at June 26, 2016 |
$ | (2,839 | ) | $ | (795 | ) | ||
Amounts charged to costs and expenses for the allowance for uncollectible accounts are reflected in provision for bad debts and deductions represent amounts written off which were deemed to not be collectible, net of any recoveries. Amounts charged to costs and expenses for the reserves for yarn quality claims are primarily reflected as a reduction of net sales and deductions represent adjustments to either increase or decrease claims based on negotiated amounts or actual versus estimated claim differences. Amounts charged to other accounts primarily include the impact of translating the activity of the Company’s foreign affiliates from their respective local currencies to the U.S. Dollar.
6. Inventories
Inventories consists of the following:
|
June 26, 2016 |
June 28, 2015 |
|||||||
|
Raw materials |
$ | 37,162 | $ | 42,526 | ||||
|
Supplies |
5,387 | 5,404 | ||||||
|
Work in process |
6,595 | 7,546 | ||||||
|
Finished goods |
55,771 | 56,844 | ||||||
|
Gross inventories |
104,915 | 112,320 | ||||||
|
Inventory reserves |
(1,383 | ) | (705 | ) | ||||
|
Total inventories |
$ | 103,532 | $ | 111,615 | ||||
The cost for the majority of the Company’s inventories is determined using the first-in, first-out method. Certain foreign inventories and limited categories of supplies of $27,651 and $28,426 as of June 26, 2016 and June 28, 2015, respectively, were valued under the average cost method.
7. Other Current Assets
Other current assets consists of the following:
|
June 26, 2016 |
June 28, 2015 |
|||||||
|
Vendor deposits |
$ | 2,036 | $ | 1,743 | ||||
|
Prepaid expenses |
1,496 | 1,647 | ||||||
|
Value added taxes receivable |
1,225 | 1,220 | ||||||
|
Funds held by qualified intermediary |
— | 1,390 | ||||||
|
Other |
33 | 22 | ||||||
|
Total other current assets |
$ | 4,790 | $ | 6,022 | ||||
Vendor deposits primarily relate to down payments made toward the purchase of raw materials by the Company’s U.S., Brazilian and Chinese operations. Value added taxes receivable are recoverable taxes associated with the sales and purchase activities of the Company’s foreign operations. Prepaid expenses consist of advance payments for insurance, professional fees, membership dues, subscriptions, non-income related tax payments, marketing and information technology services.
Unifi, Inc.
Notes to Consolidated Financial Statements – (Continued)
In June 2015, the Company sold certain land and building assets historically utilized for warehousing in the Polyester Segment to an unrelated third party. Net proceeds from the sale of $1,390 were remitted directly to a qualified intermediary in anticipation of an exchange under section 1031 of the Internal Revenue Code of 1986, as amended (“Internal Revenue Code”).
8. Property, Plant and Equipment, Net
Property, plant and equipment, net consists of the following:
|
June 26, 2016 |
June 28, 2015 |
|||||||
|
Land |
$ | 3,154 | $ | 2,413 | ||||
|
Land improvements |
13,734 | 11,709 | ||||||
|
Buildings and improvements |
145,633 | 141,259 | ||||||
|
Assets under capital leases |
21,525 | 17,371 | ||||||
|
Machinery and equipment |
544,369 | 531,225 | ||||||
|
Computers, software and office equipment |
17,823 | 16,782 | ||||||
|
Transportation equipment |
4,713 | 4,736 | ||||||
|
Construction in progress |
39,695 | 6,710 | ||||||
|
Gross property, plant and equipment |
790,646 | 732,205 | ||||||
|
Less: accumulated depreciation |
(602,839 | ) | (595,094 | ) | ||||
|
Less: accumulated amortization – capital leases |
(2,706 | ) | (889 | ) | ||||
|
Total property, plant and equipment, net |
$ | 185,101 | $ | 136,222 | ||||
Assets under capital leases consists of the following:
|
June 26, 2016 |
June 28, 2015 |
|||||||
|
Machinery and equipment |
$ | 14,745 | $ | 12,804 | ||||
|
Transportation equipment |
5,927 | 3,714 | ||||||
|
Building improvements |
853 | 853 | ||||||
|
Gross assets under capital leases |
$ | 21,525 | $ | 17,371 | ||||
During fiscal 2016 and 2015, the Company entered into capital leases with aggregate present values of $4,154 and $12,784, respectively, for machinery and transportation equipment.
Depreciation expense, including the amortization of assets under capital leases and internal software development costs amortization, repairs and maintenance expenses, and capitalized interest were as follows:
|
For the Fiscal Year Ended |
||||||||||||
|
June 26, 2016 |
June 28, 2015 |
June 29, 2014 |
||||||||||
|
Depreciation expense |
$ | 15,269 | $ | 15,422 | $ | 15,174 | ||||||
|
Repair and maintenance expenses |
16,819 | 17,741 | 18,319 | |||||||||
|
Capitalized interest |
724 | 191 | 172 | |||||||||
9. Intangible Assets, Net
Intangible assets, net consists of the following:
|
June 26, 2016 |
June 28, 2015 |
|||||||
|
Customer lists |
$ | 23,615 | $ | 23,615 | ||||
|
Non-compete agreements |
4,293 | 4,293 | ||||||
|
Licenses, trademarks and other |
891 | 837 | ||||||
|
Total intangible assets, gross |
28,799 | 28,745 | ||||||
|
Accumulated amortization - customer lists |
(20,665 | ) | (19,432 | ) | ||||
|
Accumulated amortization - non-compete agreements |
(3,860 | ) | (3,537 | ) | ||||
|
Accumulated amortization – licenses, trademarks and other |
(533 | ) | (388 | ) | ||||
|
Total accumulated amortization |
(25,058 | ) | (23,357 | ) | ||||
|
Total intangible assets, net |
$ | 3,741 | $ | 5,388 | ||||
Unifi, Inc.
Notes to Consolidated Financial Statements – (Continued)
In fiscal 2007, the Company purchased certain texturing operations, which are included in the Company’s Polyester Segment. The valuation of the customer list acquired was determined by estimating the discounted net earnings attributable to the customer relationships that were purchased after considering items such as possible customer attrition. Based on the length and trend of the projected cash flows, an estimated useful life of thirteen years was determined. The customer list is amortized through December 2019, in a manner which reflects the expected economic benefit that will be received over its thirteen-year life. The non-compete agreement is amortized through December 2017, using the straight-line method over the period currently covered by the agreement.
A customer list and a non-compete agreement were recorded in connection with the business combination outlined in Note 4, utilizing similar valuation methods as described above for the fiscal 2007 transaction. The customer list is amortized over a nine-year estimated useful life based on the expected economic benefit. The non-compete agreement is amortized using the straight line method over the five-year term of the agreement.
In fiscal 2012, the Company acquired a controlling interest (and continues to hold such 60% membership interest) in Repreve Renewables, LLC (“Renewables”), an agricultural company focused on the development, production and commercialization of miscanthus grass for use in the animal bedding, bio energy and bio-based products markets. The non-compete agreement for Renewables is amortized using the straight-line method over the five-year term of the agreement. The FREEDOM® Giant Miscanthus (“FGM”) license held by Renewables is amortized using the straight-line method over its estimated useful life of eight years.
The Company capitalizes costs incurred to register trademarks for REPREVE® and other PVA products in various countries. The Company has determined that these trademarks have varying useful lives of up to three years and are being amortized using the straight-line method.
Amortization expense for intangible assets consists of the following:
|
For the Fiscal Year Ended |
||||||||||||
|
June 26, 2016 |
June 28, 2015 |
June 29, 2014 |
||||||||||
|
Customer lists |
$ | 1,233 | $ | 1,594 | $ | 1,845 | ||||||
|
Non-compete agreements |
323 | 323 | 319 | |||||||||
|
Licenses, trademarks and other |
145 | 163 | 134 | |||||||||
|
Total amortization expense |
$ | 1,701 | $ | 2,080 | $ | 2,298 | ||||||
The following table presents the expected intangible asset amortization for the next five fiscal years:
|
2017 |
2018 |
2019 | 2020 |
2021 |
||||||||||||||||
|
Expected amortization |
$ | 1,393 | $ | 1,054 | $ | 700 | $ | 351 | $ | 69 | ||||||||||
10. Other Non-Current Assets
Other non-current assets consists of the following:
|
June 26, 2016 |
June 28, 2015 |
|||||||
|
Miscanthus grass, net |
$ | 4,522 | $ | 2,151 | ||||
|
Debt financing fees |
1,421 | 1,611 | ||||||
|
Other |
387 | 213 | ||||||
|
Total other non-current assets |
$ | 6,330 | $ | 3,975 | ||||
Miscanthus grass is currently being developed and propagated by Renewables for use in the animal bedding market and potentially for bioenergy industries and is reflected net of accumulated depreciation of $213 and $55 at June 26, 2016 and June 28, 2015, respectively.
11. Accrued Expenses
Accrued expenses consists of the following:
|
June 26, 2016 |
June 28, 2015 |
|||||||
|
Payroll and fringe benefits |
$ | 10,370 | $ | 11,258 | ||||
|
Utilities |
2,376 | 2,823 | ||||||
|
Current portion of supplemental post-employment plan |
1,506 | — | ||||||
|
Property taxes |
831 | 790 | ||||||
|
Consulting and transition fees payable to former executive officers |
1,045 | — | ||||||
|
Other |
2,346 | 1,769 | ||||||
|
Total accrued expenses |
$ | 18,474 | $ | 16,640 | ||||
Unifi, Inc.
Notes to Consolidated Financial Statements – (Continued)
Other consists primarily of employee-related claims and payments, interest, marketing expenses, freight expenses, rent, deferred incentives and other non-income related taxes.
12. Long-Term Debt
Debt Obligations
The following table presents the total balances outstanding for the Company’s debt obligations, their scheduled maturity dates and the weighted average interest rates for borrowings as well as the applicable current portion of long-term debt:
|
Weighted Average |
Principal Amounts as of |
|||||||||||||||
|
Scheduled Maturity Date |
Interest Rate as of June 26, 2016 (1) |
June 26, 2016 |
June 28, 2015 |
|||||||||||||
|
ABL Revolver |
March 2020 |
2.5% | $ | 6,200 | $ | 5,000 | ||||||||||
|
ABL Term Loan |
March 2020 |
2.3% | 90,250 | 82,125 | ||||||||||||
|
Capital lease obligations |
(2) | (3) | 15,798 | 15,735 | ||||||||||||
|
Construction financing |
(4) | (4) | 6,629 | — | ||||||||||||
|
Renewables’ term loan |
August 2022 |
3.7% | 4,000 | — | ||||||||||||
|
Renewables’ promissory note |
September 2020 |
3.0% | 135 | — | ||||||||||||
|
Term loan from unconsolidated affiliate |
(5) | (5) | — | 1,250 | ||||||||||||
|
Total debt |
123,012 | 104,110 | ||||||||||||||
|
Current portion of Renewables’ promissory note |
(25 | ) | — | |||||||||||||
|
Current portion of capital lease obligations |
(4,261 | ) | (3,385 | ) | ||||||||||||
|
Current portion of long-term debt |
(9,500 | ) | (9,000 | ) | ||||||||||||
|
Total long-term debt |
$ | 109,226 | $ | 91,725 | ||||||||||||
|
(1) |
The weighted average interest rate as of June 26, 2016 for the ABL Term Loan includes the effects of the interest rate swap with a notional balance of $50,000. |
|
(2) |
Scheduled maturity dates for capital lease obligations range from January 2017 to November 2027. |
|
(3) |
Interest rates for capital lease obligations range from 2.3% to 4.6%. |
|
(4) |
Refer to the discussion below under the subheading “—Construction Financing” for further information. |
|
(5) |
Refer to the discussion below under the subheading “—Term Loan from Unconsolidated Affiliate” for further information. |
On March 26, 2015, the Company and its subsidiary, Unifi Manufacturing, Inc., entered into an Amended and Restated Credit Agreement (as subsequently amended, the “Amended Credit Agreement”) for a $200,000 senior secured credit facility (the “ABL Facility”) with a syndicate of lenders. The ABL Facility consists of a $100,000 revolving credit facility (the “ABL Revolver”) and a term loan that can be reset up to a maximum amount of $100,000, once per fiscal year, if certain conditions are met (the “ABL Term Loan”). Such a principal increase occurred during the quarter ended December 27, 2015, as described below under the subheading “—Second Amendment.” The ABL Facility has a maturity date of March 26, 2020.
The Amended Credit Agreement replaced a previous senior secured credit facility dated May 24, 2012 with a similar syndicate of lenders, which, after multiple amendments, would have matured on March 28, 2019 and consisted of a $100,000 revolving credit facility and a $90,000 term loan. As used herein, the terms “ABL Facility,” “ABL Revolver” and “ABL Term Loan” shall mean the senior secured credit facility, the revolving credit facility or the term loan, respectively, under the Amended Credit Agreement or the previous senior secured credit facility, as applicable.
ABL Facility
The ABL Facility is secured by a first-priority perfected security interest in substantially all owned property and assets (together with proceeds and products) of Unifi, Inc., Unifi Manufacturing, Inc. and certain subsidiary guarantors (the “Loan Parties”). It is also secured by a first-priority security interest in all (or 65% in the case of certain first-tier controlled foreign corporations, as required by the lenders) of the stock of (or other ownership interests in) each of the Loan Parties (other than the Company) and certain subsidiaries of the Loan Parties, together with all proceeds and products thereof.
Unifi, Inc.
Notes to Consolidated Financial Statements – (Continued)
If excess availability under the ABL Revolver falls below the defined Trigger Level, a financial covenant requiring the Loan Parties to maintain a fixed charge coverage ratio on a monthly basis of at least 1.05 to 1.0 becomes effective. The Trigger Level as of June 26, 2016 was $23,781. In addition, the ABL Facility contains restrictions on particular payments and investments, including certain restrictions on the payment of dividends and share repurchases. Subject to specific provisions, the ABL Term Loan may be prepaid at par, in whole or in part, at any time before the maturity date, at the Company’s discretion.
ABL Facility borrowings bear interest at the London Interbank Offer Rate (“LIBOR”) plus an applicable margin of 1.50% to 2.00%, or the Base Rate plus an applicable margin of 0.50% to 1.00%, with interest currently being paid on a monthly basis. The applicable margin is based on (a) the excess availability under the ABL Revolver and (b) the consolidated leverage ratio, calculated by fiscal quarter. The Base Rate means the greater of (i) the prime lending rate as publicly announced from time to time by Wells Fargo, (ii) the Federal Funds Rate plus 0.5%, and (iii) LIBOR plus 1.0%. The Company’s ability to borrow under the ABL Revolver is limited to a borrowing base equal to specified percentages of eligible accounts receivable and inventory and is subject to certain conditions and limitations. There is also a monthly unused line fee under the ABL Revolver of 0.25%.
As of June 26, 2016, the excess availability under the ABL Revolver was $68,612. At June 26, 2016, the fixed charge coverage ratio was 1.93 to 1.0 and the Company had $200 of standby letters of credit, none of which have been drawn upon.
Second Amendment
On November 19, 2015, the Company entered into the Second Amendment to Amended and Restated Credit Agreement (“Second Amendment”). The Second Amendment increased the percentage applied to real estate valuations, on a one-time basis, from 60% to 75%, for purposes of calculating the Term Loan collateral. Simultaneous to entering into the Second Amendment, the Company entered into the Fourth Amended and Restated Term Note, thereby resetting the ABL Term Loan balance to $95,000. Pursuant to the Second Amendment, the ABL Term Loan is subject to quarterly amortizing payments of $2,375.
Capital Lease Obligations
During fiscal 2016, the Company entered into capital leases with an aggregate present value of $4,154. Fixed interest rates for these capital leases range from 3.4% to 3.8%, with maturity dates in August 2020.
Construction Financing
In December 2015, the Company entered into an agreement with a third party lender that provides for construction-period financing for certain build-to-suit assets. The Company will record project costs to construction in progress and the corresponding liability to construction financing (within long-term debt). The agreement provides for monthly, interest-only payments during the construction period, at a rate of 3.5%, and contains terms customary for a financing of this type.
The agreement provides for 60 monthly payments, which will commence at the earlier of the completion of the construction period or July 1, 2017, with an interest rate of 3.2%.
In connection with this construction financing arrangement, the Company has recorded (i) $210 of deferred financing fees and (ii) long-term debt of $6,629 (to reflect $790 of proceeds for construction financing and $5,839 for construction in progress paid by the third party lender).
Renewables’ Term Loan
In September 2015, Renewables entered into a secured debt financing arrangement consisting of a master loan agreement and corresponding term loan supplement, with unrelated parties, having a borrowing capacity of up to $4,000. In October 2015, Renewables borrowed $4,000. The agreements include representations and warranties made by Renewables, financial covenants, affirmative and negative covenants and events of default that are usual and customary for financings of this type. Borrowings bear interest at LIBOR plus an applicable margin of 3.25%, payable monthly in arrears. Principal payments of $111 per month begin in September 2019 and are payable through July 2022, followed by a final payment equal to the remaining unpaid principal balance in August 2022. In connection with this arrangement, a subsidiary of the Company is subject to joint and several liability in the event of recourse by the lenders.
Renewables’ Promissory Note
In September 2015, Renewables delivered a promissory note in the amount of $135, and cash, to an unrelated third party for the purchase of certain land, consisting of thirty-seven acres located in Seven Springs, North Carolina, valued at $191. Such promissory note bears fixed interest at 3.0%, with principal and interest payable annually over a five-year period.
Term Loan from Unconsolidated Affiliate
On August 30, 2012, a foreign subsidiary of the Company entered into an unsecured loan agreement under which it borrowed $1,250 from an unconsolidated affiliate, U.N.F. Industries Ltd. The entire principal balance was repaid in April 2016.
Unifi, Inc.
Notes to Consolidated Financial Statements – (Continued)
Scheduled Debt Maturities
The following table presents the scheduled maturities of the Company’s outstanding debt obligations for the following five fiscal years and thereafter:
|
Scheduled Maturities on a Fiscal Year Basis |
||||||||||||||||||||||||
|
2017 |
2018 |
2019 |
2020 |
2021 |
Thereafter |
|||||||||||||||||||
|
ABL Revolver |
$ | — | $ | — | $ | — | $ | 6,200 | $ | — | $ | — | ||||||||||||
|
ABL Term Loan |
9,500 | 9,500 | 9,500 | 61,750 | — | — | ||||||||||||||||||
|
Renewables’ promissory note |
25 | 26 | 27 | 28 | 29 | — | ||||||||||||||||||
|
Renewables’ term loan |
— | — | — | 1,111 | 1,333 | 1,556 | ||||||||||||||||||
|
Capital lease obligations |
4,261 | 4,128 | 4,058 | 2,542 | 171 | 638 | ||||||||||||||||||
|
Total (1) |
$ | 13,786 | $ | 13,654 | $ | 13,585 | $ | 71,631 | $ | 1,533 | $ | 2,194 | ||||||||||||
|
(1) |
Total reported here excludes $6,629 for construction financing, described above. |
Loss on Extinguishment of Debt
Entering into the Amended Credit Agreement in fiscal 2015 generated substantially different terms for the ABL Term Loan and resulted in the replacement of an existing lender. Accordingly, in fiscal 2015, the Company recorded a loss on extinguishment of debt of $1,040 for the write-off of certain debt financing fees related to the previous credit agreement.
13. Other Long-Term Liabilities
Other long-term liabilities consists of the following:
|
June 26, 2016 |
June 28, 2015 |
|||||||
|
Uncertain tax positions |
$ | 4,463 | $ | 3,980 | ||||
|
Supplemental post-employment plan |
2,262 | 3,690 | ||||||
|
Other |
3,668 | 3,070 | ||||||
|
Total other long-term liabilities |
$ | 10,393 | $ | 10,740 | ||||
The Company maintains an unfunded supplemental post-employment plan for certain management employees. Each employee’s account is credited annually based upon a percentage of the participant’s base salary, with each participant’s balance adjusted quarterly to reflect returns based upon a stock market index. Amounts are paid to participants only after termination of employment.
Other primarily includes certain retiree and post-employment medical and disability liabilities, deferred rent and deferred energy incentive credits.
14. Income Taxes
Components of income before income taxes
The components of income before income taxes consist of the following:
|
For the Fiscal Year Ended |
||||||||||||
|
June 26, 2016 |
June 28, 2015 |
June 29, 2014 |
||||||||||
|
United States |
$ | 21,843 | $ | 38,341 | $ | 38,816 | ||||||
|
Foreign |
26,400 | 15,471 | 9,065 | |||||||||
|
Income before income taxes |
$ | 48,243 | $ | 53,812 | $ | 47,881 | ||||||
Unifi, Inc.
Notes to Consolidated Financial Statements – (Continued)
Components of provision for income taxes
Provision for income taxes consists of the following:
|
For the Fiscal Year Ended |
||||||||||||
|
June 26, 2016 |
June 28, 2015 |
June 29, 2014 |
||||||||||
|
Current: |
||||||||||||
|
Federal |
$ | 655 | $ | 7,985 | $ | 14,463 | ||||||
|
State |
599 | 1,231 | 1,035 | |||||||||
|
Foreign |
7,836 | 7,926 | 4,092 | |||||||||
| Total current tax expense | 9,090 | 17,142 | 19,590 | |||||||||
|
Deferred: |
||||||||||||
|
Federal |
6,220 | (4,006 | ) | 183 | ||||||||
|
State |
246 | (112 | ) | 900 | ||||||||
|
Foreign |
(483 | ) | 322 | (512 | ) | |||||||
| Total deferred tax expense | 5,983 | (3,796 | ) | 571 | ||||||||
|
Provision for income taxes |
$ | 15,073 | $ | 13,346 | $ | 20,161 | ||||||
On December 18, 2015, the Protecting Americans from Tax Hikes Act (the “PATH Act”) was signed into law. The PATH Act did not significantly impact the Company’s effective tax rate in fiscal 2016.
Utilization of Net Operating Loss Carryforwards
State deferred tax expense includes the utilization of net operating loss (“NOL”) carryforwards of $42, $196 and $499 for fiscal 2016, 2015 and 2014, respectively. Foreign deferred tax expense includes the utilization of NOL carryforwards of $0, $147 and $216 for fiscal 2016, 2015 and 2014, respectively.
Effective tax rate
Reconciliation from the federal statutory tax rate to the effective tax rate is as follows:
|
For the Fiscal Year Ended |
||||||||||||
|
June 26, 2016 |
June 28, 2015 |
June 29, 2014 |
||||||||||
|
Federal statutory tax rate |
35.0 | % | 35.0 | % | 35.0 | % | ||||||
|
Foreign income taxed at different rates |
(7.7 | ) | (3.2 | ) | (1.2 | ) | ||||||
|
Repatriation of foreign earnings and withholding taxes |
(1.0 | ) | (0.3 | ) | 0.4 | |||||||
|
Change in valuation allowance |
(3.7 | ) | (5.6 | ) | 4.0 | |||||||
|
Domestic production activities deduction |
(0.5 | ) | (1.3 | ) | (2.3 | ) | ||||||
|
Research and other credits |
4.8 | (0.4 | ) | (0.3 | ) | |||||||
|
State income taxes, net of federal tax benefit |
1.5 | 1.8 | 2.8 | |||||||||
|
Change in uncertain tax positions |
1.2 | 5.4 | (0.5 | ) | ||||||||
|
Settlement of certain intercompany foreign currency transactions |
— | 5.6 | — | |||||||||
|
Indefinite reinvestment assertion |
— | (14.2 | ) | 0.5 | ||||||||
|
Renewable energy credits |
— | (1.9 | ) | — | ||||||||
|
Nondeductible expenses and other |
1.6 | 3.9 | 3.7 | |||||||||
|
Effective tax rate |
31.2 | % | 24.8 | % | 42.1 | % | ||||||
The effective tax rate for fiscal 2016 benefitted from, among other things, (i) a lower overall effective tax rate for the Company’s foreign earnings (reflecting free-trade zone sales in El Salvador and lower statutory tax rates in both Brazil and China); (ii) a decrease in the valuation allowance for the Company’s investment in PAL (for which the Company maintains a full valuation allowance) reflecting the recognition of lower taxable income versus book income, and a reduction in the valuation allowance related to foreign tax credits utilized in 2016. This was partially offset by (a) utilization of foreign tax credits, (b) increase in the valuation allowance for net operating losses, including Renewables, for which no tax benefit could be recognized (c) state and local taxes net of the assumed federal benefit and (d) a change in uncertain tax positions.
The Company’s effective tax rate for fiscal 2015 benefitted from a lower overall effective tax rate for the Company’s foreign earnings (reflecting free-trade zone sales in El Salvador and lower statutory tax rates in both Brazil and China); the reversal of the indefinite reinvestment assertion which provided for indefinitely reinvested foreign earnings at June 28, 2015; a decrease in the valuation allowance related to PAL; benefits from federal and state credits, especially renewable energy credits in connection with the installation of a solar farm; and the domestic production activities deduction. These benefits were partially offset by the change in uncertain tax positions, an increase in the valuation allowance related to Renewables, certain nondeductible expenses and state income tax (net of federal benefit).
The Company’s effective tax rate for fiscal 2014 was impacted by, among other things, an increase in the valuation allowance related to PAL and Renewables, state and local taxes net of the assumed federal benefit, and nondeductible expenses. The impact was partially offset by a lower overall effective tax rate for the Company’s foreign earnings and the domestic production activities deduction.
Unifi, Inc.
Notes to Consolidated Financial Statements – (Continued)
Deferred income taxes
The significant components of the Company’s deferred tax assets and liabilities consist of the following:
|
June 26, 2016 |
June 28, 2015 |
|||||||
|
Deferred tax assets: |
||||||||
|
Investments, including unconsolidated affiliates |
$ | 8,337 | $ | 9,675 | ||||
|
State tax credits |
361 | 461 | ||||||
|
Accrued liabilities and valuation reserves |
3,660 | 2,620 | ||||||
|
Net operating loss carryforwards |
3,952 | 2,904 | ||||||
|
Intangible assets, net |
4,349 | 4,964 | ||||||
|
Incentive compensation plans |
3,297 | 3,515 | ||||||
|
Foreign tax credits |
— | 2,588 | ||||||
|
Other items |
4,668 | 4,673 | ||||||
|
Total gross deferred tax assets |
28,624 | 31,400 | ||||||
|
Valuation allowance |
(13,550 | ) | (15,606 | ) | ||||
|
Net deferred tax assets |
15,074 | 15,794 | ||||||
|
Deferred tax liabilities: |
||||||||
|
Property, plant and equipment |
(17,098 | ) | (11,432 | ) | ||||
|
Other |
(580 | ) | (530 | ) | ||||
|
Total deferred tax liabilities |
(17,678 | ) | (11,962 | ) | ||||
|
Net deferred tax asset (liability) |
$ | (2,604 | ) | $ | 3,832 | |||
Deferred income taxes - valuation allowance
In assessing the realizability of deferred tax assets, the Company considers whether it is more-likely-than-not that some portion or all of the deferred tax assets will not be realized. The ultimate realization of deferred tax assets is dependent upon the generation of future taxable income during the periods in which those temporary differences become deductible. The Company considers the scheduled reversal of taxable temporary differences, taxable income in carryback years, projected future taxable income and tax planning strategies in making this assessment. Since the Company operates in multiple jurisdictions, the assessment is made on a jurisdiction-by-jurisdiction basis, taking into account the effects of local tax law.
The balances and activity for the Company’s deferred tax valuation allowance are as follows:
|
For the Fiscal Year Ended |
||||||||||||
|
June 26, 2016 |
June 28, 2015 |
June 29, 2014 |
||||||||||
|
Balance at beginning of the year |
$ | (15,606 | ) | $ | (18,615 | ) | $ | (16,690 | ) | |||
|
Benefit to (charge to) provision for income taxes |
2,056 | 3,009 | (1,925 | ) | ||||||||
|
Balance at end of year |
$ | (13,550 | ) | $ | (15,606 | ) | $ | (18,615 | ) | |||
Components of the Company’s deferred tax valuation allowance are as follows:
|
For the Fiscal Year Ended |
||||||||||||
|
June 26, 2016 |
June 28, 2015 |
June 29, 2014 |
||||||||||
|
Investment in a former domestic unconsolidated affiliate |
$ | (6,418 | ) | $ | (6,503 | ) | $ | (6,493 | ) | |||
|
Equity-method investment in Parkdale America, LLC |
(2,102 | ) | (3,261 | ) | (7,286 | ) | ||||||
|
Foreign tax credits |
— | (1,680 | ) | (1,680 | ) | |||||||
|
Other (1) |
(5,030 | ) | (4,162 | ) | (3,156 | ) | ||||||
|
Total deferred tax valuation allowance |
$ | (13,550 | ) | $ | (15,606 | ) | $ | (18,615 | ) | |||
(1) Other relates primarily to Renewables.
During fiscal 2016, the Company’s valuation allowance decreased by $2,056. This decrease consists primarily of $1,159 related to the Company’s investment in PAL due to the timing of PAL’s taxable income versus book income and the utilization of $1,680 of foreign tax credits. The decrease was partially offset by a net $858 increase related to the Company’s investment in Renewables and related NOLs as a result of its continued losses.
During fiscal year 2015, the Company’s valuation allowance decreased by $3,009. This decrease relates to the timing of taxable income versus book income for PAL partially offset by a net increase in NOLs for Renewables which were deemed unrealizable, and the disposal of certain miscanthus grass.
During fiscal year 2014, the Company’s valuation allowance increased by $1,925. This increase relates to (i) the timing of taxable income versus book income for PAL and (ii) the generation of additional NOLs for Renewables which were deemed unrealizable.
Unifi, Inc.
Notes to Consolidated Financial Statements – (Continued)
Unrecognized tax benefits
A reconciliation of beginning and ending gross amounts of unrecognized tax benefits is as follows:
|
For the Fiscal Year Ended |
||||||||||||
|
June 26, 2016 |
June 28, 2015 |
June 29, 2014 |
||||||||||
|
Balance at beginning of the year |
$ | 4,029 | $ | 983 | $ | 964 | ||||||
|
Gross increases related to current period tax positions |
110 | 3,469 | 78 | |||||||||
|
Gross increases related to tax positions in prior periods |
1,058 | 18 | 68 | |||||||||
|
Gross decreases related to settlements with tax authorities |
(274 | ) | (178 | ) | (2 | ) | ||||||
|
Gross decreases related to lapse of applicable statute of limitations |
(391 | ) | (263 | ) | (125 | ) | ||||||
|
Balance at end of year |
$ | 4,532 | $ | 4,029 | $ | 983 | ||||||
Unrecognized tax benefits would generate a favorable impact of $4,532 on the Company’s effective tax rate when recognized. The Company does not expect material changes in uncertain tax positions within the next twelve months. The reversal of interests and penalties recognized by the Company within the provision for income taxes were $(23), $(95) and $(193) for fiscal 2016, 2015 and 2014, respectively. The Company has $279, $23 and $118 accrued for interest and/or penalties related to uncertain tax positions as of June 26, 2016, June 28, 2015 and June 29, 2014, respectively.
Expiration of net operating loss carryforwards and foreign tax credits
As of June 26, 2016, the Company has $943 of state net operating loss carryforwards, for which no valuation allowance is established, that may be used to offset future taxable income. These carryforwards, if unused, will expire as follows:
|
State net operating loss carryforwards |
2017 |
through |
2033 |
Tax years subject to examination
The Company and its domestic subsidiaries file a consolidated federal income tax return, as well as income tax returns in multiple state and foreign jurisdictions. The tax years subject to examination vary by jurisdiction. The Company regularly assesses the outcomes of both completed and ongoing examinations to ensure that the Company’s provision for income taxes is sufficient.
In fiscal 2016, the Internal Revenue Service examined the Company’s tax return for the year ending June 30, 2013. The examination closed with no material assessment. As such, the Company is no longer subject to examination for U.S. Federal income tax for years ending June 30, 2013 and prior.
In fiscal 2016, the North Carolina Department of Revenue initiated an audit for tax periods ending June 24, 2012 to June 29, 2014. The audit was not concluded at the end of fiscal 2016. No material assessment is anticipated.
The Company is currently under appeal in Colombia for tax years 2006 and 2007. The Company believes it is more likely than not to conclude the appeal with no material assessment.
Statutes related to material foreign jurisdictions are open from January 1, 2012 and material state jurisdictions from June 24, 2012. Certain carry forward tax attributes generated in years prior remain subject to examination and could change subsequent tax years.
Indefinite reinvestment assertion
During the fourth quarter of fiscal 2015, the Company completed a reorganization of certain foreign subsidiaries that changed the historical ownership structure. The Company provides for U.S. income taxes on the earnings of foreign subsidiaries unless the subsidiaries’ earnings are considered indefinitely reinvested outside the United States.
As of June 26, 2016, U.S. income taxes were not provided for on a cumulative total of approximately $78,300 of undistributed earnings and profits of the Company’s foreign subsidiaries as the Company currently intends to reinvest these earnings in these foreign operations indefinitely. If at a later date, these earnings were repatriated to the U.S., the Company would be required to pay taxes on these amounts. Nevertheless, in future periods, the Company will continue to assess the existing circumstances, including any changes in tax laws, and reevaluate the necessity for any deferred tax liability. Determination of the amount of any deferred tax liability on these undistributed earnings is not practicable.
15. Shareholders’ Equity
During fiscal 2014, the Company completed its repurchase of shares under its $50,000 stock repurchase program that had been approved by the Board on January 22, 2013 (the “2013 SRP”). On April 23, 2014, the Board approved a new stock repurchase program (“2014 SRP”) to acquire up to an additional $50,000 of the Company’s common stock. Under the 2014 SRP (as was the case under the 2013 SRP), the Company has been authorized to repurchase shares at prevailing market prices, through open market purchases or privately negotiated transactions at such times and prices and in such manner as determined by management, subject to market conditions, applicable legal requirements, contractual obligations and other factors. Repurchases are expected to be financed through cash generated from operations and borrowings under the Company’s ABL Revolver, and are subject to applicable limitations and restrictions as set forth in the ABL Facility. The 2014 SRP has no stated expiration or termination date, and there is no time limit or specific time frame otherwise for repurchases. The Company may discontinue repurchases at any time that management determines additional purchases are not beneficial or advisable.
Unifi, Inc.
Notes to Consolidated Financial Statements – (Continued)
The following table summarizes the Company’s repurchases and retirements of its common stock under the 2013 SRP and the 2014 SRP.
|
Total Number of Shares Repurchased as Part of Publicly Announced Plans or Programs |
Average Price Paid per Share |
Maximum Approximate Dollar Value that May Yet Be Repurchased Under the 2014 SRP |
||||||||||
|
Fiscal 2013 |
1,068 | $ | 18.08 | |||||||||
|
Fiscal 2014 |
1,524 | $ | 23.96 | |||||||||
|
Fiscal 2015 |
349 | $ | 29.72 | |||||||||
|
Fiscal 2016 |
206 | $ | 30.13 | |||||||||
|
Total |
3,147 | $ | 23.01 | $ | 27,603 | |||||||
All repurchased shares have been retired and have the status of authorized and unissued shares. The cost of the repurchased shares is recorded as a reduction to common stock to the extent of the par value of the shares acquired and the remainder is allocated between capital in excess of par value and retained earnings. The portion of the remainder that is allocated to capital in excess of par value is limited to a pro rata portion of capital in excess of par value.
No dividends were paid in the three most recent fiscal years.
16. Stock-Based Compensation
On October 23, 2013, the Company’s shareholders approved the Unifi, Inc. 2013 Incentive Compensation Plan (the “2013 Plan”). The 2013 Plan replaced the 2008 Unifi, Inc. Long-Term Incentive Plan (“2008 LTIP”). No additional awards will be granted under the 2008 LTIP; however, prior awards outstanding under the 2008 LTIP remain subject to that plan’s provisions. The 2013 Plan authorized the issuance of 1,000 shares of common stock, subject to certain increases in the event outstanding awards under the 2008 LTIP or 2013 Plan expire, are forfeited or otherwise terminate unexercised.
As of June 26, 2016, a summary of the number of securities remaining available for future issuance under equity compensation plans is as follows:
|
Authorized under the 2013 Plan |
1,000 | |||
|
Plus: Awards expired, forfeited or otherwise terminated unexercised from the 2008 LTIP or 2013 Plan |
290 | |||
|
Less: Awards granted to employees |
(258 | ) | ||
|
Less: Awards granted to non-employee directors |
(70 | ) | ||
|
Available for issuance under the 2013 Plan |
962 |
Stock options
During fiscal 2016, 2015 and 2014, the Company granted stock options to purchase 82, 150 and 97 shares of stock, respectively, to certain key employees. The stock options vest ratably over the required three-year service period and have ten-year contractual terms. For the fiscal 2016, 2015 and 2014, the weighted average exercise price of the options granted was $32.36, $27.38 and $22.31 per share, respectively. The Company used the Black-Scholes model to estimate the weighted average grant date fair value of $20.27, $17.31 and $14.66 per share, respectively.
For options granted, the valuation models used the following assumptions:
|
For the Fiscal Year Ended |
||||||||||||
|
June 26, 2016 |
June 28, 2015 |
June 29, 2014 |
||||||||||
|
Expected term (years) |
7.6 | 7.3 | 7.4 | |||||||||
|
Risk-free interest rate |
2.1% | 2.2% | 2.1% | |||||||||
|
Volatility |
60.5% | 62.6% | 65.9% | |||||||||
|
Dividend yield |
— | — | — | |||||||||
The Company uses historical data to estimate the expected term and volatility. The risk-free interest rate is based on the U.S. Treasury yield curve in effect at the time of the grant for periods corresponding with the expected term of the options.
Unifi, Inc.
Notes to Consolidated Financial Statements – (Continued)
A summary of stock option activity for fiscal 2016 is as follows:
|
Stock Options |
Weighted Average Exercise Price |
Weighted Average Remaining Contractual Life (Years) |
Aggregate Intrinsic Value |
|||||||||||||
|
Outstanding at June 28, 2015 |
934 | $ | 12.63 | |||||||||||||
|
Granted |
82 | $ | 32.36 | |||||||||||||
|
Exercised |
(41 | ) | $ | 14.33 | ||||||||||||
|
Cancelled or forfeited |
(255 | ) | $ | 13.98 | ||||||||||||
|
Expired |
— | $ | — | |||||||||||||
|
Outstanding at June 26, 2016 |
720 | $ | 14.32 | 4.9 | $ | 9,109 | ||||||||||
|
Vested and expected to vest as of June 26, 2016 |
715 | $ | 14.23 | 4.9 | $ | 9,105 | ||||||||||
|
Exercisable at June 26, 2016 |
615 | $ | 11.80 | 4.3 | $ | 9,059 | ||||||||||
As of June 26, 2016, all options subject to a market condition were vested.
At June 26, 2016, the remaining unrecognized compensation cost related to the unvested stock options was $607, which is expected to be recognized over a weighted average period of 1.8 years.
For fiscal 2016, 2015 and 2014, the total intrinsic value of options exercised was $598, $190 and $12,963, respectively. The amount of cash received from the exercise of options was $181, $95 and $3,136 for fiscal 2016, 2015 and 2014, respectively. The tax benefit realized from stock options exercised was $155, $73 and $4,934 for fiscal 2016, 2015 and 2014, respectively.
Restricted stock units
During fiscal 2016 and 2014, the Company granted 20 and 22 restricted stock units (“RSUs”), respectively, to certain key employees. The employee RSUs are subject to a vesting restriction and convey no rights of ownership in shares of Company stock until such employee RSUs have vested and been distributed to the grantee in the form of Company stock. The employee RSUs vest over a three-year period, and will be converted into an equivalent number of shares of stock (for distribution to the grantee) on each vesting date, unless the grantee has elected to defer the receipt of the shares of stock until separation from service. If, after the first anniversary of the grant date and prior to the final vesting date, the grantee has a separation from service without cause for any reason other than the employee’s resignation, the remaining unvested employee RSUs will become fully vested and will be converted to an equivalent number of shares of stock and issued to the grantee. The Company estimated the fair value of the employee RSUs granted during fiscal 2016 and 2014 to be $27.46 and $22.08 per employee RSU, respectively.
During fiscal 2016, 2015 and 2014, the Company granted 28, 17 and 25 RSUs, respectively, to the Company’s non-employee directors. The director RSUs became fully vested on the grant date. The director RSUs convey no rights of ownership in shares of Company stock until such director RSUs have been distributed to the grantee in the form of Company stock. The vested director RSUs will be converted into an equivalent number of shares of Company common stock and distributed to the grantee following the grantee’s termination of service as a member of the Board. The grantee may elect to defer receipt of the shares of stock in accordance with the deferral options provided under the Unifi, Inc. Director Deferred Compensation Plan. The Company estimated the fair value of the director RSUs granted during fiscal 2016, 2015 and 2014 to be $28.08, $28.58 and $23.23 per director RSU, respectively.
The Company estimates the fair value of RSUs based on the market price of the Company’s common stock at the award grant date.
A summary of the RSU activity for fiscal 2016 is as follows:
|
Non-vested |
Weighted Average Grant Date Fair Value |
Vested |
Total |
Weighted Average Grant Date Fair Value |
||||||||||||||||
|
Outstanding at June 28, 2015 |
20 | $ | 18.35 | 167 | 187 | $ | 15.35 | |||||||||||||
|
Granted |
48 | $ | 27.82 | — | 48 | $ | 27.82 | |||||||||||||
|
Vested |
(45 | ) | $ | 24.06 | 45 | — | $ | 24.06 | ||||||||||||
|
Converted |
— | $ | — | (19 | ) | (19 | ) | $ | 16.37 | |||||||||||
|
Cancelled or forfeited |
(2 | ) | $ | 22.08 | (31 | ) | (33 | ) | $ | 14.28 | ||||||||||
|
Outstanding at June 26, 2016 |
21 | $ | 27.20 | 162 | 183 | $ | 18.70 | |||||||||||||
Unifi, Inc.
Notes to Consolidated Financial Statements – (Continued)
At June 26, 2016, the number of RSUs vested and expected to vest was 183, with an aggregate intrinsic value of $4,815. The aggregate intrinsic value of the 162 vested RSUs at June 26, 2016 was $4,263.
The remaining unrecognized compensation cost related to the unvested RSUs at June 26, 2016 is $382, which is expected to be recognized over a weighted average period of 1.4 years.
For fiscal 2016, 2015 and 2014, the total intrinsic value of RSUs converted was $553, $958 and $696, respectively. The tax benefit realized from the conversion of RSUs was $221, $373 and $275 for fiscal 2016, 2015 and 2014, respectively.
Summary
The total cost charged against income related to all stock-based compensation arrangements was as follows:
|
For the Fiscal Year Ended |
||||||||||||
|
June 26, 2016 |
June 28, 2015 |
June 29, 2014 |
||||||||||
|
Stock options |
$ | 1,379 | $ | 1,955 | $ | 1,001 | ||||||
|
RSUs |
961 | 676 | 938 | |||||||||
|
Total compensation cost |
$ | 2,340 | $ | 2,631 | $ | 1,939 | ||||||
The total income tax benefit recognized for stock-based compensation was $592, $623 and $513 for fiscal 2016, 2015 and 2014, respectively.
As of June 26, 2016, total unrecognized compensation costs related to all unvested stock-based compensation arrangements was $989. The weighted average period over which these costs are expected to be recognized is 1.7 years.
17. Defined Contribution Plan
The Company matches employee contributions made to the Unifi, Inc. Retirement Savings Plan (the “DC Plan”), a 401(k) defined contribution plan, which covers eligible domestic salary and hourly employees. Under the terms of the DC Plan, the Company matches 100% of the first three percent of eligible employee contributions and 50% of the next two percent of eligible contributions.
The following table presents the employer matching contribution expense related to the DC Plan:
|
For the Fiscal Year Ended |
||||||||||||
|
June 26, 2016 |
June 28, 2015 |
June 29, 2014 |
||||||||||
|
Matching contribution expense |
$ | 2,331 | $ | 2,201 | $ | 2,006 | ||||||
18. Fair Value of Financial Instruments and Non-Financial Assets and Liabilities
Financial Instruments
The Company may use derivative financial instruments such as foreign currency forward contracts or interest rate swaps to reduce its ongoing business exposures to fluctuations in foreign currency exchange rates or interest rates. The Company does not enter into derivative contracts for speculative purposes.
Foreign currency forward contracts
The Company may enter into foreign currency forward contracts as economic hedges for exposures related to certain sales, inventory purchases and equipment purchases which are denominated in currencies that are not its functional currency. Foreign currency forward contracts are not designated as hedges by the Company and are marked to market each period and offset by the foreign exchange (gains) losses included in other operating expense (income), net resulting from the underlying exposures of the foreign currency denominated assets and liabilities. As of June 26, 2016 and June 28, 2015, there were no outstanding foreign currency forward contracts.
Interest rate swap
On May 18, 2012, the Company entered into a five year, $50,000 interest rate swap with Wells Fargo to provide a hedge against the variability of cash flows related to LIBOR-based variable rate borrowings under the Company’s ABL Facility. It increased to $85,000 in May 2013 (when certain other interest rate swaps terminated) and has decreased $5,000 per quarter since August 2013 to the current notional balance of $50,000, where it will remain through the life of the instrument. This interest rate swap allows the Company to fix LIBOR at 1.06% and terminates on May 24, 2017.
On November 26, 2012, the Company de-designated the interest rate swap as a cash flow hedge. See Note 19 for detail regarding the reclassifications of amounts from accumulated other comprehensive loss related to the interest rate swap.
Unifi, Inc.
Notes to Consolidated Financial Statements – (Continued)
Contingent consideration
On December 2, 2013, the Company acquired certain draw-winding assets in a business combination and recorded a contingent consideration liability. The fair value of the contingent consideration is measured at each reporting period using a discounted cash flow methodology, based on inputs not observable in the market (Level 3 classification in the fair value hierarchy). The inputs to the discounted cash flow model include the estimated payments through the term of the agreement, based on an agreed-upon definition and schedule, adjusted to risk-neutral estimates using a market price of risk factor that considers relevant metrics of comparable entities, discounted using an observable cost of debt over the term of the estimated payments. Any change in the fair value from either the passage of time or events occurring after the acquisition date is recorded in other operating expense (income), net. While adjustments have been made to reflect a decrease for draw-winding operations during fiscal 2016, there have been no significant changes to the other inputs or assumptions used to develop the fair value measurement since the acquisition date.
A reconciliation of the changes in the fair value follows:
|
Contingent consideration as of June 28, 2015 |
$ | 2,207 | ||
|
Changes in fair value |
(294 | ) | ||
|
Payments |
(565 | ) | ||
|
Contingent consideration as of June 26, 2016 |
$ | 1,348 |
Based on the present value of the expected future payments, $493 is reflected in accrued expenses and $855 is reflected in other long-term liabilities.
The Company’s financial assets and liabilities accounted for at fair value on a recurring basis and the level within the fair value hierarchy used to measure these items are as follows:
|
As of June 26, 2016 |
Notional Amount |
USD Equivalent |
Balance Sheet Location |
Fair Value Hierarchy |
Fair Value |
|||||||||||
|
Interest rate swap |
USD |
$ | 50,000 | $ | 50,000 |
Accrued expenses |
Level 2 |
$ | 260 | |||||||
|
Contingent consideration |
— | — |
Accrued expenses and other long-term liabilities |
Level 3 |
$ | 1,348 | ||||||||||
|
As of June 26, 2015 |
Notional Amount |
USD Equivalent |
Balance Sheet Location |
Fair Value Hierarchy |
Fair Value |
|||||||||||
|
Interest rate swap |
USD |
$ | 50,000 | $ | 50,000 |
Other long-term liabilities |
Level 2 |
$ | 280 | |||||||
|
Contingent consideration |
— | — |
Accrued expenses and other long-term liabilities |
Level 3 |
$ | 2,207 | ||||||||||
Estimates for the fair value of the Company’s foreign currency forward contracts and interest rate swaps are obtained from month-end market quotes for contracts with similar terms.
The effects of marked to market hedging derivative instruments for fiscal 2016, 2015 and 2014 are insignificant.
By entering into derivative instrument contracts, the Company exposes itself to counterparty credit risk. The Company attempts to minimize this risk by selecting counterparties with investment grade credit ratings, limiting the amount of exposure to any single counterparty and regularly monitoring its market position with each counterparty. The Company’s derivative instruments do not contain any credit-risk-related contingent features.
The Company believes that there have been no significant changes to its credit risk profile or the interest rates available to the Company for debt issuances with similar terms and average maturities and the Company estimates that the fair values of its debt obligations approximate the carrying amounts. Other financial instruments include cash and cash equivalents, receivables, accounts payable and accrued expenses. The financial statement carrying amounts of these items approximate the fair value due to their short-term nature.
There were no transfers into or out of the levels of the fair value hierarchy for fiscal 2016, 2015 and 2014.
Non-Financial Assets and Liabilities
The Company did not have any non-financial assets or liabilities that were required to be measured at fair value on a recurring basis.
Unifi, Inc.
Notes to Consolidated Financial Statements – (Continued)
19. Accumulated Other Comprehensive Loss
The components of and the changes in accumulated other comprehensive loss, net of tax, as applicable, consist of the following:
|
Derivative Financial Instruments |
||||||||||||
|
Foreign Currency Translation Adjustments |
Reclassification adjustments on interest rate swap |
Accumulated Other Comprehensive (Loss) Income |
||||||||||
|
Balance at June 30, 2013 |
$ | (4,568 | ) | $ | (932 | ) | $ | (5,500 | ) | |||
|
Other comprehensive income, net of tax |
327 | 554 | 881 | |||||||||
|
Balance at June 29, 2014 |
$ | (4,241 | ) | $ | (378 | ) | $ | (4,619 | ) | |||
|
Other comprehensive (loss) income, net of tax |
(22,511 | ) | 231 | (22,280 | ) | |||||||
|
Balance at June 28, 2015 |
$ | (26,752 | ) | $ | (147 | ) | $ | (26,899 | ) | |||
|
Other comprehensive (loss) income, net of tax |
(2,929 | ) | 77 | (2,852 | ) | |||||||
|
Balance at June 26, 2016 |
$ | (29,681 | ) | $ | (70 | ) | $ | (29,751 | ) | |||
A summary of the pre-tax and after-tax effects of the components of other comprehensive (loss) income for fiscal 2016, 2015 and 2014 is provided as follows, noting there is no tax impact for any of the stated fiscal years:
|
Fiscal 2016 |
Fiscal 2015 |
Fiscal 2014 |
||||||||||||||||||||||
|
Pre-tax |
After-tax |
Pre-tax |
After-tax |
Pre-tax |
After-tax |
|||||||||||||||||||
|
Other comprehensive (loss) income: |
||||||||||||||||||||||||
|
Foreign currency translation adjustments |
$ | (2,135 | ) | $ | (2,135 | ) | $ | (21,578 | ) | $ | (21,578 | ) | $ | 327 | $ | 327 | ||||||||
|
Foreign currency translation adjustments for an unconsolidated affiliate |
(794 | ) | (794 | ) | (933 | ) | (933 | ) | — | — | ||||||||||||||
|
Reclassification adjustments for interest rate swap |
77 | 77 | 231 | 231 | 554 | 554 | ||||||||||||||||||
|
Other comprehensive (loss) income |
$ | (2,852 | ) | $ | (2,852 | ) | $ | (22,280 | ) | $ | (22,280 | ) | $ | 881 | $ | 881 | ||||||||
20. Computation of Earnings Per Share
The computation of basic and diluted earnings per share (“EPS”) is as follows:
|
For the Fiscal Year Ended |
||||||||||||
|
June 26, 2016 |
June 28, 2015 |
June 29, 2014 |
||||||||||
|
Basic EPS |
||||||||||||
|
Net income attributable to Unifi, Inc. |
$ | 34,415 | $ | 42,151 | $ | 28,823 | ||||||
|
Weighted average common shares outstanding |
17,857 | 18,207 | 18,919 | |||||||||
|
Basic EPS |
$ | 1.93 | $ | 2.32 | $ | 1.52 | ||||||
|
Diluted EPS |
||||||||||||
|
Net income attributable to Unifi, Inc. |
$ | 34,415 | $ | 42,151 | $ | 28,823 | ||||||
|
Weighted average common shares outstanding |
17,857 | 18,207 | 18,919 | |||||||||
|
Net potential common share equivalents – stock options and RSUs |
558 | 629 | 702 | |||||||||
|
Adjusted weighted average common shares outstanding |
18,415 | 18,836 | 19,621 | |||||||||
|
Diluted EPS |
$ | 1.87 | $ | 2.24 | $ | 1.47 | ||||||
|
Excluded from the calculation of common share equivalents: |
||||||||||||
|
Anti-dilutive common share equivalents |
193 | 150 | 91 | |||||||||
|
Excluded from the calculation of diluted shares: |
||||||||||||
|
Unvested options that vest upon achievement of certain market conditions |
— | — | 13 | |||||||||
Unifi, Inc.
Notes to Consolidated Financial Statements – (Continued)
The calculation of earnings per common share is based on the weighted average number of the Company’s common shares outstanding for the applicable period. The calculation of diluted earnings per common share presents the effect of all potential dilutive common shares that were outstanding during the respective period, unless the effect of doing so is anti-dilutive.
21. Other Operating Expense, Net
Other operating expense, net consists of the following:
|
For the Fiscal Year Ended |
||||||||||||
|
June 26, 2016 |
June 28, 2015 |
June 29, 2014 |
||||||||||
|
Consulting and transition fees for former executive officers |
$ | 1,293 | $ | — | $ | — | ||||||
|
Foreign currency transaction losses |
397 | 448 | 504 | |||||||||
|
Net (gain) loss on sale or disposal of assets |
(13 | ) | 778 | 475 | ||||||||
|
Operating expenses for Renewables |
— | — | 2,749 | |||||||||
|
Restructuring charges, net |
— | — | 1,273 | |||||||||
|
Other, net |
571 | 374 | 288 | |||||||||
|
Other operating expense, net |
$ | 2,248 | $ | 1,600 | $ | 5,289 | ||||||
Net (Gain) Loss on Sale or Disposal of Assets
During fiscal 2015, Renewables disposed of certain miscanthus grass (primarily established during, and maintained since, fiscal 2010) utilized to support certain historical business objectives, resulting in a loss on disposal of assets of $1,322 for fiscal 2015 (for which the non-controlling interest amount is $533).
During fiscal 2015, the Company completed the sale of certain land and building assets historically utilized for warehousing in the Polyester segment. In connection with the sale, the Company recognized a gain on sale of assets of $630. Net proceeds from the sale were remitted directly to a qualified intermediary in anticipation of an exchange under section 1031 of the Internal Revenue Code.
Operating Expenses for Renewables
For fiscal 2014, operating expenses for Renewables (reported net of insignificant revenues of $144) included amounts incurred for employee costs, land and equipment rental costs, contract labor, freight costs, operating supplies, product testing and administrative costs, along with $343 of depreciation and amortization expense. For fiscal 2015 and 2016, such costs are included in cost of sales or SG&A expenses in the consolidated statements of income.
Restructuring charges, net
The components of restructuring charges, net consist of the following:
|
For the Fiscal Year Ended |
||||||||||||
|
June 26, 2016 |
June 28, 2015 |
June 29, 2014 |
||||||||||
|
Severance |
$ | — | $ | — | $ | 941 | ||||||
|
Equipment relocation and reinstallation costs |
— | — | 356 | |||||||||
|
Other |
— | — | (24 | ) | ||||||||
|
Restructuring charges, net |
$ | — | $ | — | $ | 1,273 | ||||||
22. Other Non-Operating Expense
During fiscal 2014, the Company recorded an impairment charge of $126 relating to an investment in a former domestic unconsolidated affiliate.
23. Investments in Unconsolidated Affiliates and Variable Interest Entities
Parkdale America, LLC
In June 1997, the Company and Parkdale Mills, Inc. (“Mills”) entered into a Contribution Agreement that set forth the terms and conditions by which the two companies contributed all of the assets of their spun cotton yarn operations utilizing open-end and air-jet spinning technologies to create Parkdale America, LLC (“PAL”). In exchange for its contribution, the Company received a 34% ownership interest in PAL, which is accounted for using the equity method of accounting. Effective January 1, 2012, Mills’ interest in PAL was assigned to Parkdale Incorporated.
Unifi, Inc.
Notes to Consolidated Financial Statements – (Continued)
PAL is a limited liability company treated as a partnership for income tax reporting purposes. PAL is a producer of cotton and synthetic yarns for sale to the textile industry and apparel market, both foreign and domestic. PAL has 16 manufacturing facilities located primarily in the southeast region of the U.S. and in Mexico. PAL’s five largest customers accounted for approximately 77% of total revenues and 86% of total gross accounts receivable outstanding. As PAL’s fiscal year end is the Saturday nearest to December 31 and its results are considered significant, the Company files an amendment to each Annual Report on Form 10-K on or before 90 days subsequent to PAL’s fiscal year end to provide PAL’s audited financial statements for PAL’s most recent fiscal year. The Company filed an amendment to its 2015 Annual Report on Form 10-K for the fiscal year ended June 28, 2015 on March 31, 2016 to provide PAL’s audited financial statements for PAL’s fiscal year ended January 2, 2016. The Company expects to file an amendment to this Annual Report on Form 10-K on or before March 31, 2017 to provide PAL’s audited financial statements for PAL’s fiscal year ended December 31, 2016.
The federal government maintains a program providing economic adjustment assistance to domestic users of upland cotton (the “cotton rebate program”). The cotton rebate program offers a subsidy for cotton consumed in domestic production, and the subsidy is paid the month after the eligible cotton is consumed. To be completely earned, the subsidy must be used within eighteen months after the marketing year in which it is earned to purchase qualifying capital expenditures in the U.S. for production of goods from upland cotton. The marketing year is from August 1 to July 31. The program provides a subsidy of up to three cents per pound. In February 2014, the federal government extended the program for five years. The cotton subsidy will remain at three cents per pound for the life of the program. PAL recognizes its share of income for the cotton subsidy when the cotton has been consumed and the qualifying assets have been acquired, with an appropriate allocation methodology considering the dual criteria of the subsidy.
PAL is subject to price risk related to anticipated fixed-price yarn sales. To protect the gross margin of these sales, PAL may enter into cotton futures to manage changes in raw material prices in order to protect the gross margin of fixed-priced yarn sales. The derivative instruments used are listed and traded on an exchange and are thus valued using quoted prices classified within Level 1 of the fair value hierarchy. As of June 2016, PAL had no futures contracts designated as cash flow hedges.
As of June 26, 2016, the Company’s investment in PAL was $113,468 and reflected within investments in unconsolidated affiliates in the consolidated balance sheets. The reconciliation between the Company’s share of the underlying equity of PAL and its investment is as follows:
|
Underlying equity as of June 26, 2016 |
$ | 131,742 | ||
|
Initial excess capital contributions |
53,363 | |||
|
Impairment charge recorded by the Company in 2007 |
(74,106 | ) | ||
|
Anti-trust lawsuit against PAL in which the Company did not participate |
2,652 | |||
|
Cotton rebate adjustments to PAL’s depreciation expense |
(183 | ) | ||
|
Investment as of June 26, 2016 |
$ | 113,468 |
On August 28, 2014, PAL acquired the remaining 50% ownership interest in a yarn manufacturer based in Mexico (“Summit”) in which PAL was historically a 50% member. The acquisition increases PAL’s regional manufacturing capacity and expands its product offerings and customer base. PAL accounted for the transaction as a business combination under the acquisition method, recognizing the assets acquired and liabilities assumed at their respective fair values as of the acquisition date. The Company and PAL concluded that the acquisition did not represent a material business combination. PAL recognized a bargain purchase gain of $4,430 and recorded acquired net assets of $23,644.
On February 27, 2015, PAL purchased two manufacturing facilities, plus inventory, for approximately $13,000 cash, and entered into a yarn supply agreement with the seller. PAL has accounted for the transaction as a business combination under the acquisition method, recognizing the assets acquired and liabilities assumed at their respective fair values as of the acquisition date. The Company and PAL concluded that the acquisition did not represent a material business combination. PAL recognized a bargain purchase gain of $9,381.
U.N.F. Industries, Ltd.
In September 2000, the Company and Nilit Ltd. (“Nilit”) formed a 50/50 joint venture, U.N.F. Industries Ltd. (“UNF”), for the purpose of operating nylon extrusion assets to manufacture nylon POY. Raw material and production services for UNF are provided by Nilit under separate supply and services agreements. UNF’s fiscal year end is December 31 and it is a registered Israeli private company located in Migdal Ha-Emek, Israel.
UNF America, LLC
In October 2009, the Company and Nilit America Inc. (“Nilit America”) formed a 50/50 joint venture, UNF America LLC (“UNFA”), for the purpose of operating a nylon extrusion facility which manufactures nylon POY. Raw material and production services for UNFA are provided by Nilit America under separate supply and services agreements. UNFA’s fiscal year end is December 31 and it is a limited liability company treated as a partnership for income tax reporting purposes located in Ridgeway, Virginia.
Unifi, Inc.
Notes to Consolidated Financial Statements – (Continued)
In conjunction with the formation of UNFA, the Company entered into a supply agreement with UNF and UNFA whereby the Company agreed to purchase all of its first quality nylon POY requirements for texturing (subject to certain exceptions) from either UNF or UNFA. The agreement has no stated minimum purchase quantities and pricing is negotiated every six months, based on market rates. As of June 26, 2016, the Company’s open purchase orders related to this agreement were $3,086.
The Company’s raw material purchases under this supply agreement consist of the following:
|
For the Fiscal Year Ended |
||||||||||||
|
June 26, 2016 |
June 28, 2015 |
June 29, 2014 |
||||||||||
|
UNF |
$ | 2,828 | $ | 3,676 | $ | 9,582 | ||||||
|
UNFA |
24,319 | 29,922 | 24,223 | |||||||||
|
Total |
$ | 27,147 | $ | 33,598 | $ | 33,805 | ||||||
As of June 26, 2016 and June 28, 2015, the Company had combined accounts payable due to UNF and UNFA of $3,231 and $4,038, respectively.
The Company has determined that UNF and UNFA are variable interest entities (“VIEs”) and has also determined that the Company is the primary beneficiary of these entities, based on the terms of the supply agreement. As a result, these entities should be consolidated in the Company’s financial results. As the Company purchases substantially all of the output from the two entities, the two entities’ balance sheets constitute 3% or less of the Company’s total assets and total liabilities, and such balances are not expected to comprise a larger portion in the future, the Company has not included the accounts of UNF and UNFA in its consolidated financial statements. As of June 26, 2016, the Company’s combined investments in UNF and UNFA were $3,944 and are shown within investments in unconsolidated affiliates in the consolidated balance sheets. The financial results of UNF and UNFA are included in the Company’s financial statements with a one month lag, using the equity method of accounting and with intercompany profits eliminated in accordance with the Company’s accounting policy. Other than the supply agreement discussed above, the Company does not provide any other commitments or guarantees related to either UNF or UNFA.
Condensed balance sheet and income statement information for the Company’s unconsolidated affiliates is presented in the following tables. As PAL is defined as significant, its information is separately disclosed. For the Company’s fiscal 2016 and 2015, PAL’s corresponding fiscal periods consisted of 52 weeks and 53 weeks, respectively.
|
As of June 26, 2016 |
||||||||||||
|
PAL |
Other |
Total |
||||||||||
|
Current assets |
$ | 244,197 | $ | 12,781 | $ | 256,978 | ||||||
|
Noncurrent assets |
203,251 | 1,069 | 204,320 | |||||||||
|
Current liabilities |
56,921 | 4,048 | 60,969 | |||||||||
|
Noncurrent liabilities |
3,057 | — | 3,057 | |||||||||
|
Shareholders’ equity and capital accounts |
387,470 | 9,802 | 397,272 | |||||||||
|
The Company’s portion of undistributed earnings |
44,414 | 1,609 | 46,023 | |||||||||
|
As of June 28, 2015 |
||||||||||||
|
PAL |
Other |
Total |
||||||||||
|
Current assets |
$ | 250,699 | $ | 9,273 | $ | 259,972 | ||||||
|
Noncurrent assets |
216,708 | 3,676 | 220,384 | |||||||||
|
Current liabilities |
61,243 | 4,985 | 66,228 | |||||||||
|
Noncurrent liabilities |
28,935 | — | 28,935 | |||||||||
|
Shareholders’ equity and capital accounts |
377,229 | 7,964 | 385,193 | |||||||||
|
For the Fiscal Year Ended June 26, 2016 |
||||||||||||
|
PAL |
Other |
Total |
||||||||||
|
Net sales |
$ | 824,248 | $ | 29,463 | $ | 853,711 | ||||||
|
Gross profit |
32,626 | 7,651 | 40,277 | |||||||||
|
Income from operations |
15,143 | 5,772 | 20,915 | |||||||||
|
Net income |
17,670 | 5,838 | 23,508 | |||||||||
|
Depreciation and amortization |
41,282 | 150 | 41,432 | |||||||||
|
Cash received by PAL under cotton rebate program |
17,057 | — | 17,057 | |||||||||
|
Earnings recognized by PAL for cotton rebate program |
16,080 | — | 16,080 | |||||||||
|
Distributions received |
1,732 | 3,000 | 4,732 | |||||||||
Unifi, Inc.
Notes to Consolidated Financial Statements – (Continued)
|
For the Fiscal Year Ended June 28, 2015 |
||||||||||||
|
PAL |
Other |
Total |
||||||||||
|
Net sales |
$ | 828,502 | $ | 33,496 | $ | 861,998 | ||||||
|
Gross profit |
53,042 | 5,480 | 58,522 | |||||||||
|
Income from operations |
34,873 | 3,861 | 38,734 | |||||||||
|
Net income |
50,991 | 4,140 | 55,131 | |||||||||
|
Depreciation and amortization |
33,065 | 117 | 33,182 | |||||||||
|
Cash received by PAL under cotton rebate program |
18,087 | — | 18,087 | |||||||||
|
Earnings recognized by PAL for cotton rebate program |
17,398 | — | 17,398 | |||||||||
|
Distributions received |
2,468 | 1,250 | 3,718 | |||||||||
|
For the Fiscal Year Ended June 29, 2014 |
||||||||||||
|
PAL |
Other |
Total |
||||||||||
|
Net sales |
$ | 841,542 | $ | 34,717 | $ | 876,259 | ||||||
|
Gross profit |
63,645 | 3,921 | 67,566 | |||||||||
|
Income from operations |
48,857 | 2,259 | 51,116 | |||||||||
|
Net income |
52,283 | 2,529 | 54,812 | |||||||||
|
Depreciation and amortization |
26,222 | 101 | 26,323 | |||||||||
|
Cash received by PAL under cotton rebate program |
16,909 | — | 16,909 | |||||||||
|
Earnings recognized by PAL for cotton rebate program |
23,509 | — | 23,509 | |||||||||
|
Distributions received |
11,314 | 1,900 | 13,214 | |||||||||
As of the end of PAL’s fiscal June 2016, June 2015 and June 2014 periods, PAL’s amounts of deferred revenues related to the cotton rebate program were $0 for all periods.
24. Commitments and Contingencies
Collective Bargaining Agreements
While employees of the Company’s Brazilian operations are unionized, none of the labor force employed by the Company’s domestic or other foreign subsidiaries is currently covered by a collective bargaining agreement.
Environmental
On September 30, 2004, the Company completed its acquisition of the polyester filament manufacturing assets located in Kinston, North Carolina from INVISTA S.a.r.l (“Invista”). The land for the Kinston site was leased pursuant to a 99 year ground lease (“Ground Lease”) with E.I. DuPont de Nemours (“DuPont”). Since 1993, DuPont has been investigating and cleaning up the Kinston site under the supervision of the U.S. Environmental Protection Agency (“EPA”) and the North Carolina Department of Environment and Natural Resources (“DENR”) pursuant to the Resource Conservation and Recovery Act Corrective Action program. The Corrective Action program requires DuPont to identify all potential areas of environmental concern (“AOCs”), assess the extent of containment at the identified AOCs and to clean it up to comply with applicable regulatory standards. Effective March 20, 2008, the Company entered into a Lease Termination Agreement associated with conveyance of certain assets at Kinston to DuPont. This agreement terminated the Ground Lease and relieved the Company of any future responsibility for environmental remediation, other than participation with DuPont, if so called upon, with regard to the Company’s period of operation of the Kinston site which was from 2004 to 2008. However, the Company continues to own a satellite service facility acquired in the INVISTA transaction that has contamination from DuPont’s operations and is monitored by DENR. This site has been remediated by DuPont, and DuPont has received authority from DENR to discontinue remediation, other than natural attenuation. DuPont’s duty to monitor and report to DENR will be transferred to the Company in the future, at which time DuPont must pay the Company for seven years of monitoring and reporting costs and the Company will assume responsibility for any future remediation and monitoring of the site. At this time, the Company has no basis to determine if or when it will have any responsibility or obligation with respect to the AOCs or the extent of any potential liability for the same.
Unifi, Inc.
Notes to Consolidated Financial Statements – (Continued)
Operating Leases
The Company routinely leases sales and administrative office space, warehousing and distribution centers, manufacturing space, transportation equipment, manufacturing equipment, and other information technology and office equipment from third parties. In addition, Renewables leases farm land. Currently, the Company does not sub-lease any of its leased property.
Future minimum capital lease payments and future minimum lease payments under non-cancelable operating leases (with initial or remaining lease terms in excess of one year) as of June 26, 2016 for the below fiscal years are:
|
Capital leases |
Operating leases |
|||||||
|
Fiscal 2017 |
$ | 4,814 | $ | 3,784 | ||||
|
Fiscal 2018 |
4,543 | 3,260 | ||||||
|
Fiscal 2019 |
4,333 | 2,331 | ||||||
|
Fiscal 2020 |
2,697 | 2,018 | ||||||
|
Fiscal 2021 |
288 | 1,722 | ||||||
|
Fiscal years thereafter |
1,212 | 3,272 | ||||||
|
Total minimum lease payments |
$ | 17,887 | $ | 16,387 | ||||
|
Less estimated executory costs |
(858 | ) | ||||||
|
Less interest |
(1,231 | ) | ||||||
|
Present value of net minimum capital lease payments |
15,798 | |||||||
|
Less current portion of capital lease obligations |
(4,261 | ) | ||||||
|
Long-term portion of capital lease obligations |
$ | 11,537 | ||||||
In December 2015, the Company entered into an agreement with a third party lender that provides for construction-period financing for certain build-to-suit assets. The Company has recorded project costs to construction in progress and the corresponding liability to construction financing (within long-term debt) of $6,629 as of June 26, 2016 and has existing future construction obligations of $4,471. The expected construction value of the build-to-suit assets is approximately $14,000.
Rental expenses incurred under operating leases and included in operating income consist of the following:
|
For the Fiscal Year Ended |
||||||||||||
|
June 26, 2016 |
June 28, 2015 |
June 29, 2014 |
||||||||||
|
Rental expenses |
$ | 4,867 | $ | 4,214 | $ | 3,621 | ||||||
Unconditional Obligations
The Company is a party to unconditional obligations for certain utility and other purchase or service commitments. These commitments are non-cancelable, have remaining terms in excess of one year and qualify as normal purchases.
On a fiscal year basis, the minimum payments expected to be made as part of such commitments are as follows:
|
2017 |
2018 |
2019 |
2020 |
2021 |
Thereafter |
|||||||||||||||||||
|
Unconditional purchase obligations |
$ | 7,480 | $ | 4,600 | $ | 2,648 | $ | 1,621 | $ | 196 | $ | — | ||||||||||||
|
Unconditional service obligations |
1,555 | 1,508 | 1,150 | 75 | 75 | 482 | ||||||||||||||||||
|
Total unconditional obligations |
$ | 9,035 | $ | 6,108 | $ | 3,798 | $ | 1,696 | $ | 271 | $ | 482 | ||||||||||||
For fiscal 2016, 2015 and 2014, total costs incurred under these commitments consisted of the following:
|
For the Fiscal Year Ended |
||||||||||||
|
June 26, 2016 |
June 28, 2015 |
June 29, 2014 |
||||||||||
|
Costs for unconditional purchase obligations |
$ | 26,790 | $ | 28,971 | $ | 31,386 | ||||||
|
Costs for unconditional service obligations |
641 | 7,625 | 5,932 | |||||||||
|
Total |
$ | 27,431 | $ | 36,596 | $ | 37,318 | ||||||
Unifi, Inc.
Notes to Consolidated Financial Statements – (Continued)
25. Related Party Transactions
Related party receivables consist of the following:
|
June 26, 2016 |
June 28, 2015 |
|||||||
|
Cupron, Inc. |
$ | 3 | $ | 72 | ||||
|
Salem Global Logistics, Inc. |
7 | 3 | ||||||
|
Total related party receivables (included within receivables, net) |
$ | 10 | $ | 75 | ||||
Related party payables consist of the following:
|
June 26, 2016 |
June 28, 2015 |
|||||||
|
Cupron, Inc. |
$ | 619 | $ | 506 | ||||
|
Salem Leasing Corporation |
250 | 277 | ||||||
|
Total related party payables (included within accounts payable) |
$ | 869 | $ | 783 | ||||
Through April 24, 2015, Mr. Mitchel Weinberger was a member of the Company’s Board. Related party transaction amounts for entities affiliated with Mr. Weinberger are omitted from current disclosures as such entities no longer constitute related parties of the Company.
Related party transactions in excess of $120 for the current or prior two fiscal years consist of the matters in the table below and the following paragraphs:
|
For the Fiscal Year Ended |
|||||||||||||
|
Affiliated Entity |
Transaction Type |
June 26, 2016 |
June 28, 2015 |
June 29, 2014 |
|||||||||
|
Salem Leasing Corporation |
Transportation equipment costs |
$ | 3,751 | $ | 3,633 | $ | 3,607 | ||||||
|
Salem Global Logistics, Inc. |
Freight service income |
253 | 179 | 25 | |||||||||
|
Cupron, Inc. |
Sales |
477 | 925 | 486 | |||||||||
|
Cupron, Inc. |
Raw material purchases |
36 | 281 | 8 | |||||||||
Mr. Kenneth G. Langone, a member of the Board, is a director, stockholder and non-executive Chairman of the Board of Salem Holding Company. The Company leases tractors and trailers from Salem Leasing Corporation, a wholly-owned subsidiary of Salem Holding Company. In addition to the monthly operating lease payments, the Company also incurs expenses for routine repair and maintenance, fuel and other expenses. These leases do not contain renewal, purchase options or escalation clauses with respect to the minimum lease charges. The balance of a capital lease obligation with Salem Leasing Corporation as of June 26, 2016 was $1,015.
Salem Global Logistics, Inc. is also a wholly-owned subsidiary of Salem Holding Company. During fiscal 2016, 2015 and 2014, the Company earned income by providing for-hire freight services for Salem Global Logistics, Inc.
Mr. William J. Armfield, IV, until his passing in July 2016, was a member of the Board, and held an indirect minority equity interest in (and was non-executive Chairman of the Board of) Cupron, Inc. (“Cupron”) and was also a director.
On April 27, 2016, Mr. William L. Jasper retired from the Company while remaining on the Board, and during the fourth quarter of fiscal 2016, the Company paid $126 to Mr. Jasper for consulting fees. As of June 26, 2016, $625 of consulting fees were payable to Mr. Jasper subject to his continued compliance with the underlying agreement.
On December 3, 2013, certain of the Company’s executive officers (at that time) exercised options to purchase shares of the Company’s common stock under previously granted option awards. Pursuant to authorization from the Company’s Board, and as part of the 2013 SRP, the Company repurchased 225 shares of common stock issued in those option exercises at a negotiated price of $25.59 per share (which was equal to the average of the closing trade prices of the Company’s common stock for the 30 days ending December 2, 2013 and represented a 7.1% discount to the $27.56 closing price of the common stock on December 2, 2013).
26. Business Segment Information
The Company has three reportable segments. Operations and revenues for each segment are described below:
|
● |
The Polyester Segment manufactures Chip, POY, textured, dyed, twisted, beamed and draw wound yarns, both virgin and recycled, with sales primarily to other yarn manufacturers and knitters and weavers that produce yarn and/or fabric for the apparel, hosiery, automotive upholstery, home furnishings, industrial and other end-use markets. The Polyester Segment consists of sales and manufacturing operations in the U.S. and El Salvador. |
Unifi, Inc.
Notes to Consolidated Financial Statements – (Continued)
|
● |
The Nylon Segment manufactures textured nylon yarns and spandex covered yarns, with sales to knitters and weavers that produce fabric primarily for the apparel and hosiery markets. The Nylon Segment consists of sales and manufacturing operations in the U.S. and Colombia. |
|
● |
The International Segment’s products primarily include textured polyester and various types of resale yarns and staple fiber, both virgin and recycled. The International Segment sells its yarns and staple fiber to knitters and weavers that produce fabric for the apparel, automotive upholstery, home furnishings, industrial and other end-use markets primarily in the South American and Asian regions. The International Segment includes a manufacturing location and sales offices in Brazil and a sales office in China. |
In addition to its reportable segments, the Company’s selected financial information includes an All Other category. All Other consists primarily of Renewables (an operating segment that does not meet quantitative thresholds for reporting), for-hire transportation services and consulting services. Revenue for Renewables is primarily derived from (i) facilitating the use of miscanthus grass as bio-fuel through service agreements and (ii) delivering harvested miscanthus grass to poultry producers for animal bedding. For-hire transportation services revenues are derived from performing common carrier services utilizing the Company’s fleet of transportation equipment. Revenues for consulting services are derived from providing process improvement and change management consulting services to entities across various industries.
The operations within All Other (i) are not subject to review by the chief operating decision maker at a level consistent with the Company’s other operations, (ii) are not regularly evaluated using the same metrics applied to the Company’s other operations and (iii) do not qualify for aggregation with an existing reportable segment. Therefore, such operations are excluded from reportable segments. Any comparative amounts relating to the All Other category in fiscal 2014 are insignificant.
The Company evaluates the operating performance of its segments based upon Segment Profit, which represents segment gross profit plus segment depreciation expense. This measurement of segment profit or loss best aligns segment reporting with the current assessments and evaluations performed by, and information provided to, the chief operating decision maker.
In fiscal 2015 and 2014, the Company evaluated the operating performance of its segments based upon a different metric, referred to as Segment Adjusted Profit, which was defined as segment gross profit, plus segment depreciation and amortization, less segment SG&A expenses, plus segment other adjustments. SG&A expenses and other adjustments are no longer significant to the segment evaluations performed by the chief operating decision maker. The Company is providing current and comparative selected financial information below under the current method of evaluating segment profitability.
The accounting policies for the segments are consistent with the Company’s accounting policies. Intersegment sales are omitted from the below financial information, as they are (i) insignificant to the Company’s segments and consolidated operations and (ii) excluded from segment evaluations performed by the chief operating decision maker.
As of the fourth quarter of fiscal 2016, the Company updated the composition of its Polyester and Nylon Segments for both the current and comparative prior periods, intending to better reflect downstream sales for the respective product lines.
Selected financial information is presented below:
|
For the Fiscal Year Ended June 26, 2016 |
||||||||||||||||||||
|
Polyester |
Nylon |
International |
All Other |
Total |
||||||||||||||||
|
Net sales |
$ | 383,167 | $ | 131,715 | $ | 122,554 | $ | 6,201 | $ | 643,637 | ||||||||||
|
Cost of sales |
333,638 | 113,906 | 95,666 | 6,795 | 550,005 | |||||||||||||||
|
Gross profit (loss) |
49,529 | 17,809 | 26,888 | (594 | ) | 93,632 | ||||||||||||||
|
Depreciation expense |
11,188 | 1,899 | 885 | 820 | 14,792 | |||||||||||||||
|
Segment Profit |
$ | 60,717 | $ | 19,708 | $ | 27,773 | $ | 226 | $ | 108,424 | ||||||||||
|
For the Fiscal Year Ended June 28, 2015 |
||||||||||||||||||||
|
Polyester |
Nylon |
International |
All Other |
Total |
||||||||||||||||
|
Net sales |
$ | 396,239 | $ | 149,612 | $ | 134,992 | $ | 6,278 | $ | 687,121 | ||||||||||
|
Cost of sales |
345,462 | 130,644 | 113,556 | 6,754 | 596,416 | |||||||||||||||
|
Gross profit (loss) |
50,777 | 18,968 | 21,436 | (476 | ) | 90,705 | ||||||||||||||
|
Depreciation expense |
10,579 | 1,798 | 1,997 | 473 | 14,847 | |||||||||||||||
|
Segment Profit (Loss) |
$ | 61,356 | $ | 20,766 | $ | 23,433 | $ | (3 | ) | $ | 105,552 | |||||||||
Unifi, Inc.
Notes to Consolidated Financial Statements – (Continued)
|
For the Fiscal Year Ended June 29, 2014 |
||||||||||||||||
|
Polyester |
Nylon |
International |
Total |
|||||||||||||
|
Net sales |
$ | 403,699 | $ | 149,297 | $ | 134,906 | $ | 687,902 | ||||||||
|
Cost of sales |
356,076 | 129,966 | 118,598 | 604,640 | ||||||||||||
|
Gross profit |
47,623 | 19,331 | 16,308 | 83,262 | ||||||||||||
|
Depreciation expense |
9,247 | 2,022 | 3,032 | 14,301 | ||||||||||||
|
Segment Profit |
$ | 56,870 | $ | 21,353 | $ | 19,340 | $ | 97,563 | ||||||||
The reconciliations of segment gross profit (loss) to consolidated income before income taxes are as follows:
|
For the Fiscal Year Ended |
||||||||||||
|
June 26, 2016 |
June 28, 2015 |
June 29, 2014 |
||||||||||
|
Polyester |
$ | 49,529 | $ | 50,777 | $ | 47,623 | ||||||
|
Nylon |
17,809 | 18,968 | 19,331 | |||||||||
|
International |
26,888 | 21,436 | 16,308 | |||||||||
|
All Other |
(594 | ) | (476 | ) | — | |||||||
|
Total segment gross profit |
93,632 | 90,705 | 83,262 | |||||||||
|
SG&A expenses |
47,502 | 49,672 | 46,203 | |||||||||
|
Provision for bad debts |
1,684 | 947 | 287 | |||||||||
|
Other operating expense, net |
2,248 | 1,600 | 5,289 | |||||||||
|
Operating income |
42,198 | 38,486 | 31,483 | |||||||||
|
Interest income |
(610 | ) | (916 | ) | (1,790 | ) | ||||||
|
Interest expense |
3,528 | 4,025 | 4,329 | |||||||||
|
Loss on extinguishment of debt |
— | 1,040 | — | |||||||||
|
Other non-operating expense |
— | — | 126 | |||||||||
|
Equity in earnings of unconsolidated affiliates |
(8,963 | ) | (19,475 | ) | (19,063 | ) | ||||||
|
Income before income taxes |
$ | 48,243 | $ | 53,812 | $ | 47,881 | ||||||
The reconciliations of segment depreciation and amortization expense to consolidated depreciation and amortization expense are as follows:
|
For the Fiscal Year Ended |
||||||||||||
|
June 26, 2016 |
June 28, 2015 |
June 29, 2014 |
||||||||||
|
Polyester |
$ | 11,188 | $ | 10,579 | $ | 9,247 | ||||||
|
Nylon |
1,899 | 1,798 | 2,022 | |||||||||
|
International |
885 | 1,997 | 3,032 | |||||||||
|
Segment depreciation expense |
13,972 | 14,374 | 14,301 | |||||||||
|
All Other |
820 | 473 | — | |||||||||
|
Other depreciation and amortization expense |
2,736 | 3,196 | 3,595 | |||||||||
|
Depreciation and amortization expense |
$ | 17,528 | $ | 18,043 | $ | 17,896 | ||||||
The reconciliations of segment capital expenditures to consolidated capital expenditures are as follows:
|
For the Fiscal Year Ended |
||||||||||||
|
June 26, 2016 |
June 28, 2015 |
June 29, 2014 |
||||||||||
|
Polyester |
$ | 44,517 | $ | 21,267 | $ | 14,701 | ||||||
|
Nylon |
2,548 | 2,392 | 2,284 | |||||||||
|
International |
2,755 | 1,468 | 1,637 | |||||||||
|
Segment capital expenditures |
49,820 | 25,127 | 18,622 | |||||||||
|
Other capital expenditures |
2,517 | 839 | 469 | |||||||||
|
Capital expenditures |
$ | 52,337 | $ | 25,966 | $ | 19,091 | ||||||
The reconciliations of segment total assets to consolidated total assets are as follows:
|
June 26, 2016 |
June 28, 2015 |
June 29, 2014 |
||||||||||
|
Polyester |
$ | 243,295 | $ | 208,416 | $ | 197,242 | ||||||
|
Nylon |
63,141 | 66,490 | 70,852 | |||||||||
|
International |
73,650 | 63,031 | 81,604 | |||||||||
|
Segment total assets |
380,086 | 337,937 | 349,698 | |||||||||
|
Other current assets |
6,674 | 4,687 | 2,164 | |||||||||
|
Other PP&E |
16,597 | 13,544 | 12,250 | |||||||||
|
Other non-current assets |
6,094 | 6,303 | 5,341 | |||||||||
|
Investments in unconsolidated affiliates |
117,412 | 113,901 | 99,229 | |||||||||
|
Total assets |
$ | 526,863 | $ | 476,372 | $ | 468,682 | ||||||
Unifi, Inc.
Notes to Consolidated Financial Statements – (Continued)
Geographic Data:
Geographic information is set forth below, beginning with net sales. Brazil is reported separately from other foreign countries because its net sales exceeds 10% of consolidated net sales in fiscal 2016, 2015 and 2014, while its total assets exceeds 10% of consolidated total assets for fiscal 2015 and 2014.
|
For the Fiscal Year Ended |
||||||||||||
|
June 26, 2016 |
June 28, 2015 |
June 29, 2014 |
||||||||||
|
U.S. |
$ | 472,287 | $ | 509,490 | $ | 512,496 | ||||||
|
Brazil |
83,087 | 101,912 | 113,448 | |||||||||
|
Remaining Foreign |
88,263 | 75,719 | 61,958 | |||||||||
|
Total |
$ | 643,637 | $ | 687,121 | $ | 687,902 | ||||||
|
Export sales from the Company’s U.S. operations to external customers |
$ | 113,725 | $ | 119,548 | $ | 100,546 | ||||||
The information for net sales is based on the operating locations from where the items were produced or distributed.
Geographic information for long-lived assets is as follows:
|
June 26, 2016 |
June 28, 2015 |
June 29, 2014 |
||||||||||
|
U.S. |
$ | 294,275 | $ | 242,042 | $ | 215,910 | ||||||
|
Brazil |
9,714 | 8,207 | 12,188 | |||||||||
|
Remaining Foreign |
8,595 | 9,237 | 7,413 | |||||||||
|
Total |
$ | 312,584 | $ | 259,486 | $ | 235,511 | ||||||
Long-lived assets are comprised of property, plant and equipment, net; intangible assets, net; investments in unconsolidated affiliates; and other non-current assets.
Geographic information for total assets is as follows:
|
June 26, 2016 |
June 28, 2015 |
June 29, 2014 |
||||||||||
|
U.S. |
$ | 429,100 | $ | 388,766 | $ | 362,125 | ||||||
|
Brazil |
53,993 | 50,300 | 70,581 | |||||||||
|
Remaining Foreign |
43,770 | 37,306 | 35,976 | |||||||||
|
Total |
$ | 526,863 | $ | 476,372 | $ | 468,682 | ||||||
27. Quarterly Results (Unaudited)
Quarterly financial data and selected highlights are as follows:
|
For the Fiscal Quarters Ended |
||||||||||||||||
|
September 27, 2015 |
December 27, 2015 |
March 27, 2016 |
June 26, 2016 |
|||||||||||||
|
Net sales |
$ | 162,165 | $ | 156,336 | $ | 161,278 | $ | 163,858 | ||||||||
|
Gross profit |
20,984 | 21,813 | 23,364 | 27,471 | ||||||||||||
|
Net income including non-controlling interest |
7,786 | 6,194 | 9,275 | 9,915 | ||||||||||||
|
Less: net loss attributable to non-controlling interest |
(239 | ) | (270 | ) | (414 | ) | (322 | ) | ||||||||
|
Net income attributable to Unifi, Inc. (1) |
$ | 8,025 | $ | 6,464 | $ | 9,689 | $ | 10,237 | ||||||||
|
Net income attributable to Unifi, Inc. per common share: |
||||||||||||||||
|
Basic (2) |
$ | 0.45 | $ | 0.36 | $ | 0.54 | $ | 0.57 | ||||||||
|
Diluted (2) |
$ | 0.43 | $ | 0.35 | $ | 0.53 | $ | 0.56 | ||||||||
Unifi, Inc.
Notes to Consolidated Financial Statements – (Continued)
|
For the Fiscal Quarters Ended |
||||||||||||||||
|
September 28, 2014 |
December 28, 2014 |
March 29, 2015 |
June 28, 2015 |
|||||||||||||
|
Net sales (3) |
$ | 175,561 | $ | 164,422 | $ | 172,187 | $ | 174,951 | ||||||||
|
Gross profit (3) |
20,450 | 22,929 | 22,007 | 25,319 | ||||||||||||
|
Net income including non-controlling interest |
6,675 | 9,122 | 9,759 | 14,910 | ||||||||||||
|
Less: net loss attributable to non-controlling interest |
(402 | ) | (296 | ) | (257 | ) | (730 | ) | ||||||||
|
Net income attributable to Unifi, Inc. (4) |
$ | 7,077 | $ | 9,418 | $ | 10,016 | $ | 15,640 | ||||||||
|
Net income attributable to Unifi, Inc. per common share: |
||||||||||||||||
|
Basic (2) |
$ | 0.39 | $ | 0.52 | $ | 0.55 | $ | 0.86 | ||||||||
|
Diluted (2) |
$ | 0.37 | $ | 0.50 | $ | 0.53 | $ | 0.83 | ||||||||
|
(1) |
Includes the unfavorable impact of key employee transition costs of approximately $840, $270 and $400 for the quarters ended June 26, 2016, March 27, 2016 and December 27, 2015, respectively. |
|
(2) |
Income per share is computed independently for each of the periods presented. The sum of the income per share amounts for the quarters may not equal the total for the year. |
|
(3) |
Net sales and gross profit for the fiscal quarters ended September 28, 2014, December 28, 2014 and March 29, 2015 have been revised to reflect revenues presented for All Other (as described in more detail in Note 26). Such income had been previously recorded as an offset to cost of sales or other operating expense due to the insignificance of the underlying business activities to the consolidated financial statements. |
|
(4) |
Net income attributable to Unifi, Inc. for the quarter ended September 28, 2014 includes a bargain purchase gain recorded by PAL (of which $1,506 was recognized by the Company). |
Net income attributable to Unifi, Inc. for the quarter ended December 28, 2014 includes a net change in deferred tax valuation allowances of $630 recorded as a benefit to the income tax provision.
Net income attributable to Unifi, Inc. for the quarter ended March 29, 2015 includes the following:
|
a. |
a net change in deferred tax valuation allowances of $924 recorded as a benefit to the income tax provision, |
|
b. |
renewable energy tax credits of $782 recorded as a benefit to the income tax provision and |
|
c. |
an after-tax loss on extinguishment of debt of approximately $676. |
Net income attributable to Unifi, Inc. for the quarter ended June 28, 2015 includes the following:
|
a. |
a net change in deferred tax valuation allowances of $1,749 recorded as a benefit to the income tax provision, |
|
b. |
a $7,822 reversal of the deferred tax liability related to the Company’s indefinite reinvestment assertion, |
|
c. |
the reversal of a $3,008 deferred tax asset related to certain intercompany foreign currency transactions which originated in prior years and were settled in the fourth quarter of fiscal 2015, |
|
d. |
a net change in uncertain tax positions of $3,046 recorded to provision for income taxes and |
|
e. |
a bargain purchase gain recorded by PAL (of which $3,190 is recognized by the Company). |
28. Supplemental Cash Flow Information
Cash payments for interest and taxes consist of the following:
|
For the Fiscal Year Ended |
||||||||||||
|
June 26, 2016 |
June 28, 2015 |
June 29, 2014 |
||||||||||
|
Interest, net of capitalized interest |
$ | 3,066 | $ | 3,304 | $ | 3,313 | ||||||
|
Income taxes, net of refunds |
9,923 | 17,208 | 12,569 | |||||||||
Cash payments for taxes shown above consist primarily of income and withholding tax payments made by the Company in both U.S. and foreign jurisdictions.
Unifi, Inc.
Notes to Consolidated Financial Statements – (Continued)
Non-Cash Investing and Financing Activities
As of June 26, 2016, June 28, 2015 and June 29, 2014, $4,197, $1,726 and $5,023, respectively, were included in accounts payable for unpaid capital expenditures.
In June 2015, the Company sold certain land and building assets. Net proceeds from the sale of $1,390 were remitted directly to a qualified intermediary.
During fiscal 2016, 2015 and 2014, the Company entered into capital leases with aggregate present values of $4,154, $12,784 and $3,353, respectively.
During fiscal 2016 Renewables acquired certain land valued at $191 utilizing a promissory note for $135 and cash.
During fiscal 2016, the Company recorded $5,839 to construction in progress and long-term debt, in connection with the financing arrangement described under the subheading “—Construction Financing” in Note 12.
The total fair value of the long-lived assets acquired in the December 2013 purchase of a draw winding business was $2,500, and the contingent consideration liability established at the acquisition date was $2,500.
On December 3, 2013, the Company received and retired 134 shares of its common stock, with a fair value of $3,583, tendered in lieu of cash for the exercise of 421 employee stock options.
F-39