Attached files
| file | filename |
|---|---|
| 8-K - WEX INC. 8-K - WEX Inc. | a52257908.htm |
Exhibit 99.1

WEX Second Quarter 2020 Earnings July 30, 2020
WEX Forward-Looking Statements These earnings materials contain forward-looking statements, including
statements regarding: financial guidance; assumptions underlying the Company's financial guidance and the potential for providing the same; future growth opportunities and expectations; and, market opportunities. Any statements that are not
statements of historical facts may be deemed to be forward-looking statements. When used in these earnings materials, the words “anticipate,” “believe,” “continue,” “could,” “estimate,” “expect,” “intend,” “may,” “plan,” “project” and similar
expressions are intended to identify forward-looking statements, although not all forward-looking statements contain such words. These forward-looking statements are subject to a number of risks and uncertainties that could cause actual results
to differ materially, including: the extent to which the coronavirus (COVID-19) outbreak and measures taken in response thereto adversely impact our business, results of operations and financial condition; the effects of general economic
conditions on fueling patterns as well as payment and transaction processing activity; the impact of foreign currency exchange rates on the Company’s operations, revenue and income; changes in interest rates; the impact of fluctuations in fuel
prices including the impact of any continued reductions in fuel price and the resulting impact on our revenues and net income; the effects of the Company’s business expansion and acquisition efforts; potential adverse changes to business or
employee relationships, including those resulting from the completion of an acquisition; competitive responses to any acquisitions; uncertainty of the expected financial performance of the combined operations following completion of an
acquisition; the failure to complete or successfully integrate the Company's acquisitions; the ability to realize anticipated synergies and cost savings; unexpected costs, charges or expenses resulting from an acquisition; the Company's ability
to successfully acquire, integrate, operate and expand commercial fuel card programs; the failure of corporate investments to result in anticipated strategic value; the impact and size of credit losses; the impact of changes to the Company's
credit standards; breaches of the Company’s technology systems or those of the Company's third-party service providers and any resulting negative impact on the Company's reputation, liabilities or relationships with customers or merchants; the
Company’s failure to maintain or renew key commercial agreements; failure to expand the Company’s technological capabilities and service offerings as rapidly as the Company’s competitors; failure to successfully implement the Company's
information technology strategies and capabilities in connection with its technology outsourcing and insourcing arrangements and any resulting cost associated with that failure; the actions of regulatory bodies, including banking and securities
regulators, or possible changes in banking or financial regulations impacting the Company’s industrial bank, the Company as the corporate parent or other subsidiaries or affiliates; legal, political and economic uncertainty surrounding the
United Kingdom's departure from the European Union; the impact of the transition from LIBOR as a global benchmark to a replacement rate; the impact of the Company’s outstanding notes on its operations; the impact of increased leverage on the
Company's operations, results or borrowing capacity generally, and as a result of acquisitions specifically; the incurrence of impairment charges if our assessment of the fair value of certain of our reporting units changes; the uncertainties
of litigation, including the legal proceedings with respect to the purchase agreement relating to the proposed eNett and Optal transaction; as well as other risks and uncertainties identified in Item 1A of our Annual Report for the year ended
December 31, 2019 and our Form 10-Q for the quarter ended March 31, 2020, filed respectively with the Securities and Exchange Commission on February 28, 2020 and May 11, 2020. The Company's forward-looking statements do not reflect the
potential future impact of any alliance, merger, acquisition, disposition or stock repurchases. The forward-looking statements speak only as of the date of these materials and undue reliance should not be placed on these statements. The Company
disclaims any obligation to update any forward-looking statements as a result of new information, future events or otherwise.Non-GAAP Information:For additional important information and disclosure regarding our use of non-GAAP metrics,
specifically adjusted net income attributable to shareholders and adjusted operating income, please see our most recent earnings release, issued on July 30, 2020. See the Appendix to this presentation for an explanation and reconciliation of
(i) non-GAAP adjusted net income attributable to shareholders (or "adjusted net income" or “ANI”) to GAAP net (loss) income attributable to shareholders, and (ii) ANI per diluted share to GAAP net (loss) income per diluted share.
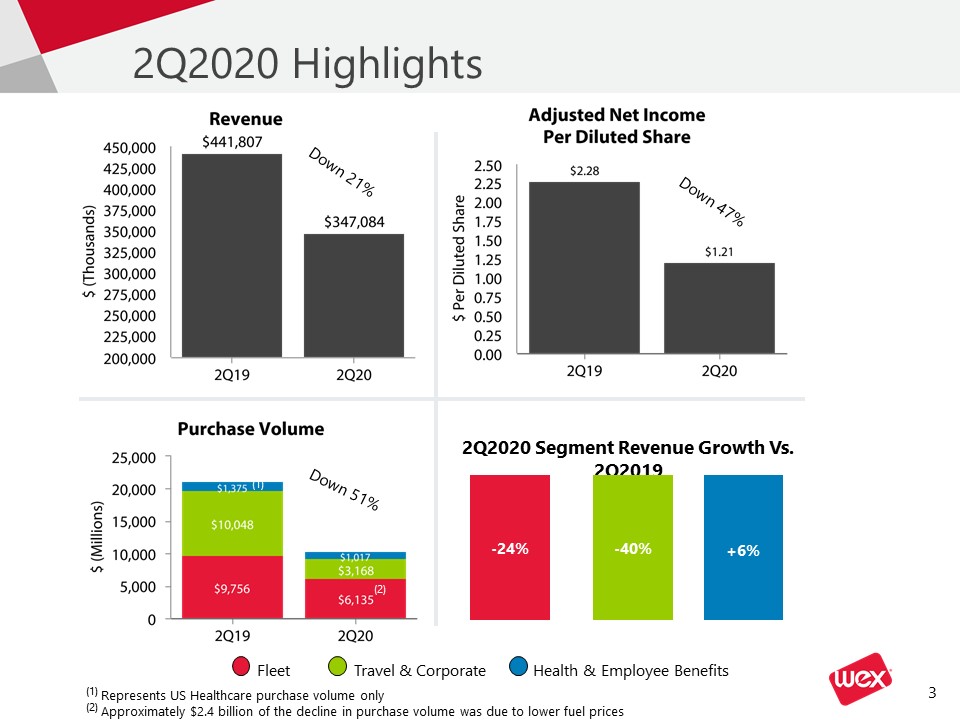
2Q2020 Highlights Fleet Travel & Corporate Health & Employee Benefits Down 21%
Down 47% Down 51% 2Q2020 Segment Revenue Growth
Vs. 2Q2019 +6% -40% -24% (1) (1) Represents US Healthcare purchase volume only(2) Approximately $2.4 billion of the decline in purchase volume was due to lower fuel prices (2)
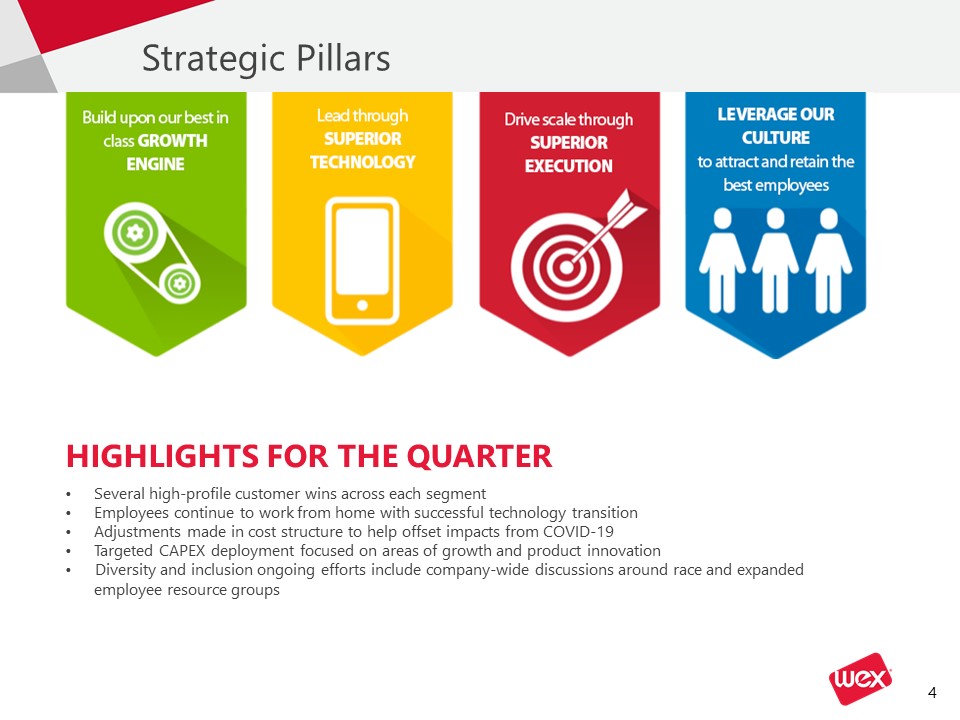
Strategic Pillars HIGHLIGHTS FOR THE QUARTER Several high-profile customer wins across each
segmentEmployees continue to work from home with successful technology transitionAdjustments made in cost structure to help offset impacts from COVID-19Targeted CAPEX deployment focused on areas of growth and product innovation Diversity and
inclusion ongoing efforts include company-wide discussions around race and expanded employee
resource groups
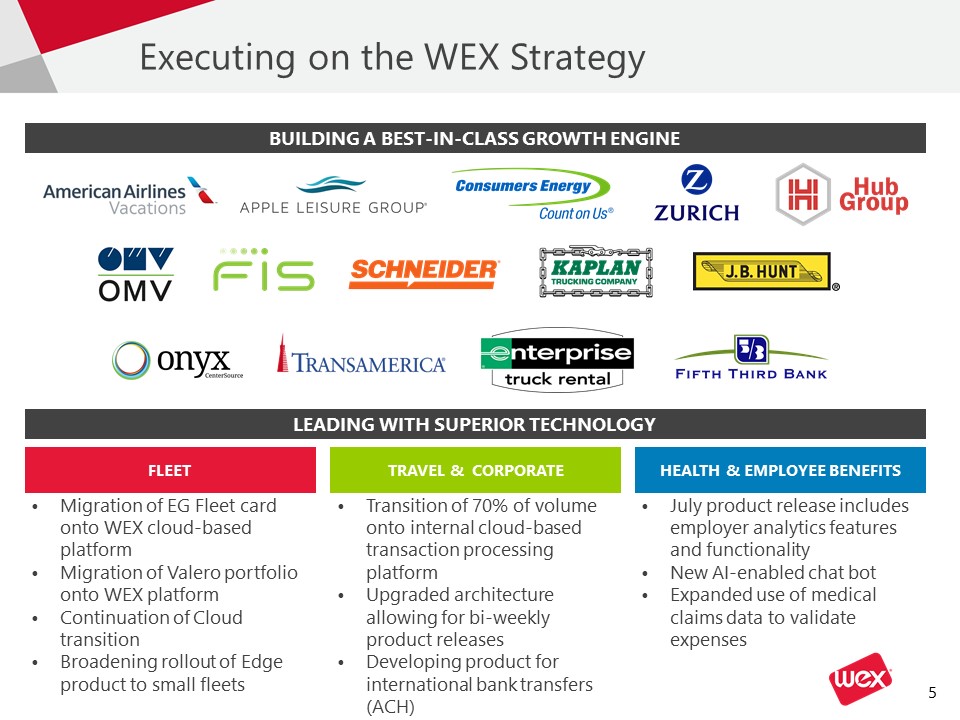
Executing on the WEX Strategy FLEET TRAVEL & CORPORATE HEALTH & EMPLOYEE
BENEFITS Migration of EG Fleet card onto WEX cloud-based platformMigration of Valero portfolio onto WEX platformContinuation of Cloud transitionBroadening rollout of Edge product to small fleets Transition of 70% of volume onto internal
cloud-based transaction processing platformUpgraded architecture allowing for bi-weekly product releasesDeveloping product for international bank transfers (ACH) July product release includes employer analytics features and functionality New
AI-enabled chat botExpanded use of medical claims data to validate expenses LEADING WITH SUPERIOR TECHNOLOGY BUILDING A BEST-IN-CLASS GROWTH ENGINE
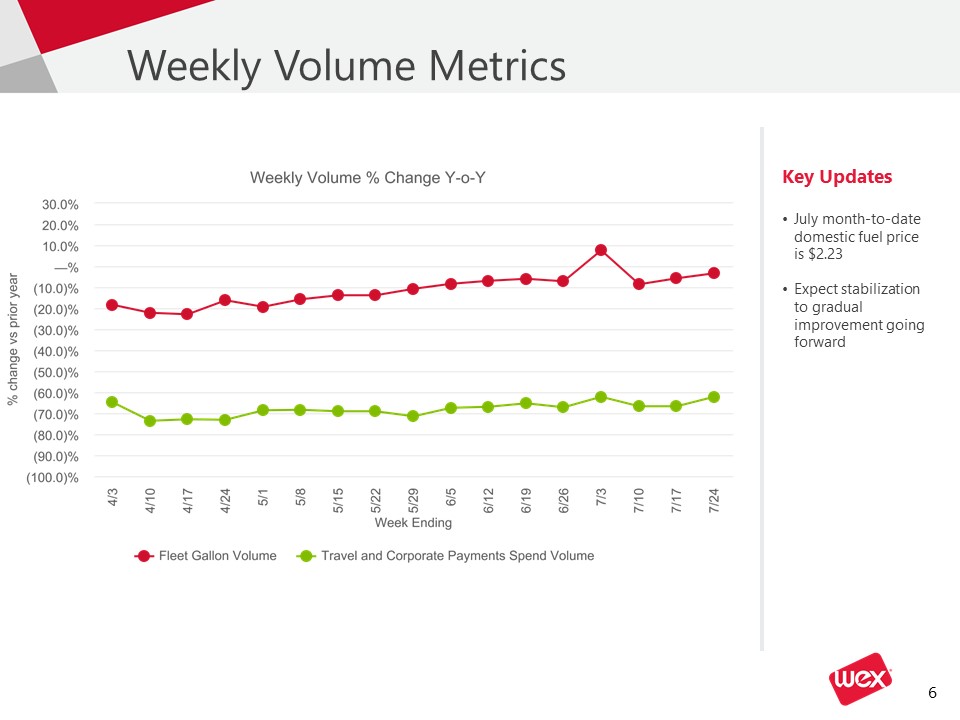
Weekly Volume Metrics Key UpdatesJuly month-to-date domestic fuel price is $2.23Expect stabilization
to gradual improvement going forward
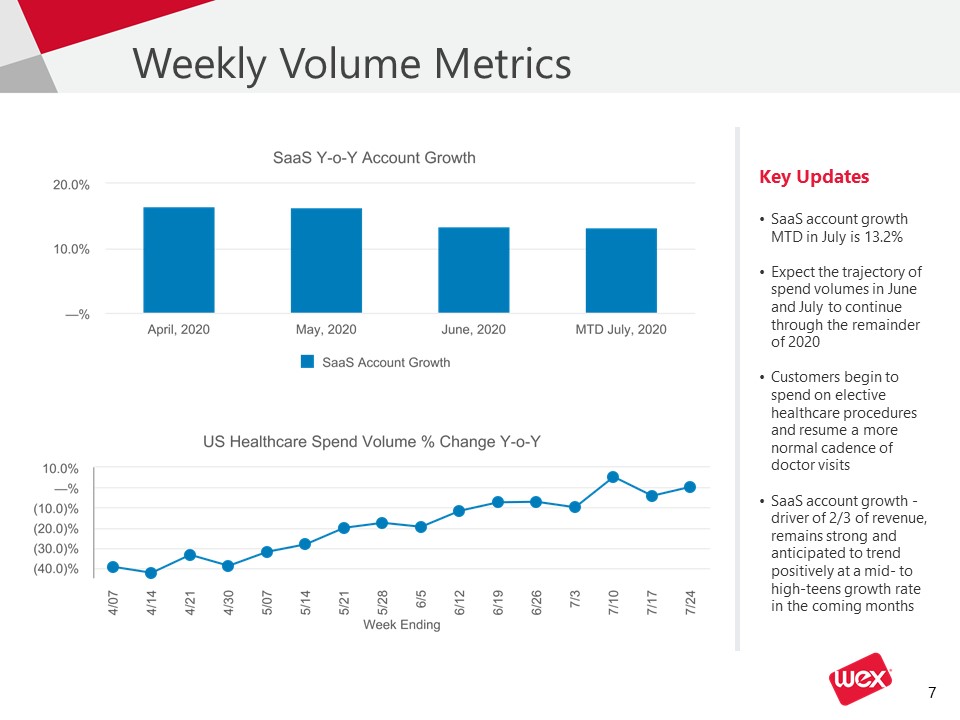
Weekly Volume Metrics Key UpdatesSaaS account growth MTD in July is 13.2%Expect the trajectory of
spend volumes in June and July to continue through the remainder of 2020
Customers begin to spend on elective healthcare procedures and resume a more normal cadence of doctor visits
SaaS account growth - driver of 2/3 of revenue, remains strong
and anticipated to trend positively at a mid- to high-teens growth rate in the coming months

WEX Second Quarter 2020 Financial Results
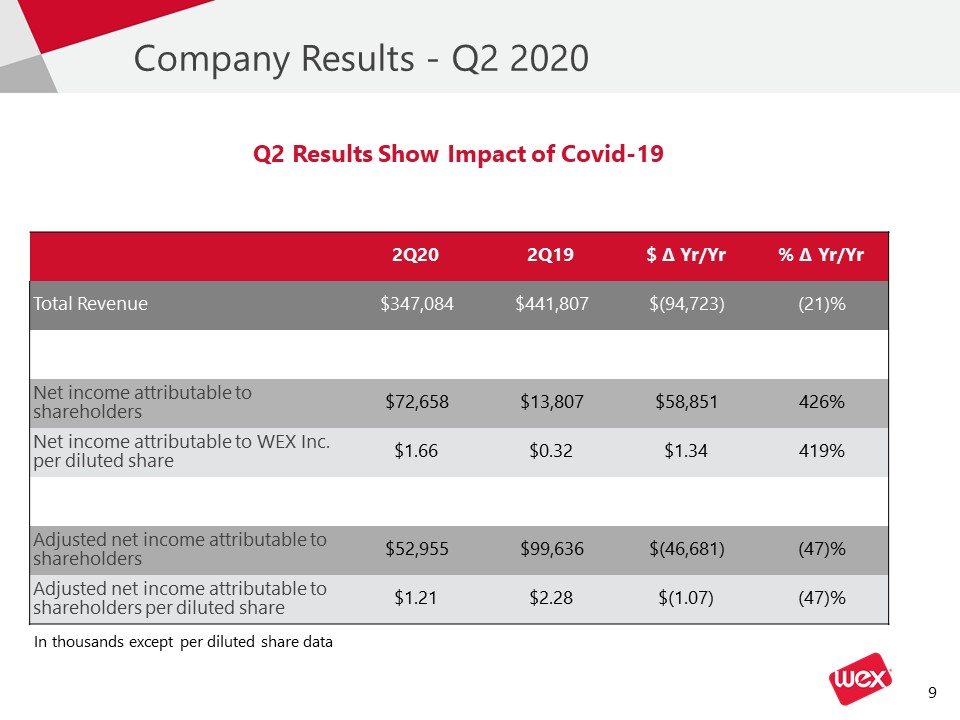
Company Results - Q2 2020 2Q20 2Q19 $ ∆ Yr/Yr % ∆ Yr/Yr Total
Revenue $347,084 $441,807 $(94,723) (21)% Net income attributable to shareholders $72,658 $13,807 $58,851 426% Net income attributable to WEX Inc. per diluted share $1.66 $0.32 $1.34 419% Adjusted net income
attributable to shareholders $52,955 $99,636 $(46,681) (47)% Adjusted net income attributable to shareholders per diluted share $1.21 $2.28 $(1.07) (47)% In thousands except per diluted share data Q2 Results Show Impact of
Covid-19
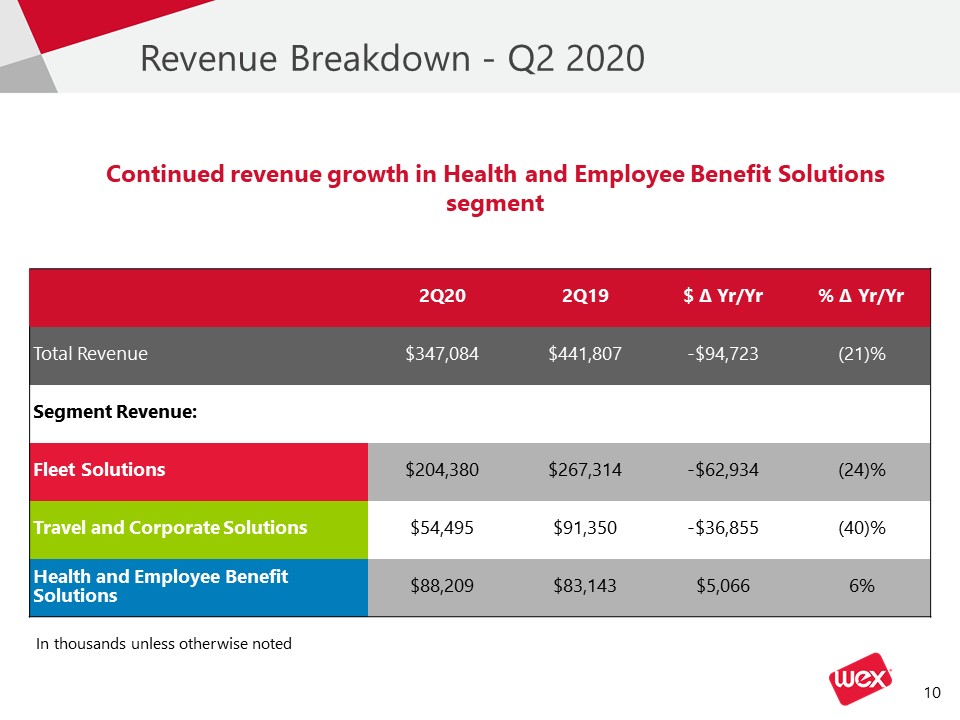
Revenue Breakdown - Q2 2020 2Q20 2Q19 $ ∆ Yr/Yr % ∆ Yr/Yr Total
Revenue $347,084 $441,807 -$94,723 (21)% Segment Revenue: Fleet Solutions $204,380 $267,314 -$62,934 (24)% Travel and Corporate Solutions $54,495 $91,350 -$36,855 (40)% Health and Employee Benefit
Solutions $88,209 $83,143 $5,066 6% Continued revenue growth in Health and Employee Benefit Solutions segment In thousands unless otherwise noted
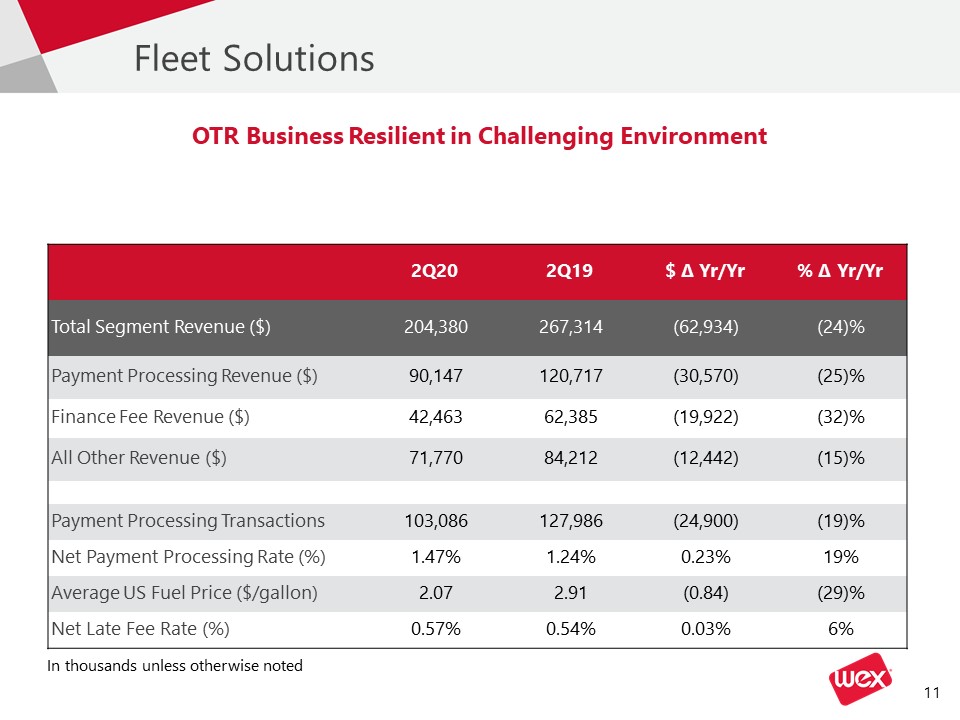
Fleet Solutions 2Q20 2Q19 $ ∆ Yr/Yr % ∆ Yr/Yr Total Segment Revenue
($) 204,380 267,314 (62,934) (24)% Payment Processing Revenue ($) 90,147 120,717 (30,570) (25)% Finance Fee Revenue ($) 42,463 62,385 (19,922) (32)% All Other Revenue ($) 71,770 84,212 (12,442) (15)% Payment
Processing Transactions 103,086 127,986 (24,900) (19)% Net Payment Processing Rate (%) 1.47% 1.24% 0.23% 19% Average US Fuel Price ($/gallon) 2.07 2.91 (0.84) (29)% Net Late Fee Rate (%) 0.57% 0.54% 0.03% 6% OTR Business
Resilient in Challenging Environment In thousands unless otherwise noted
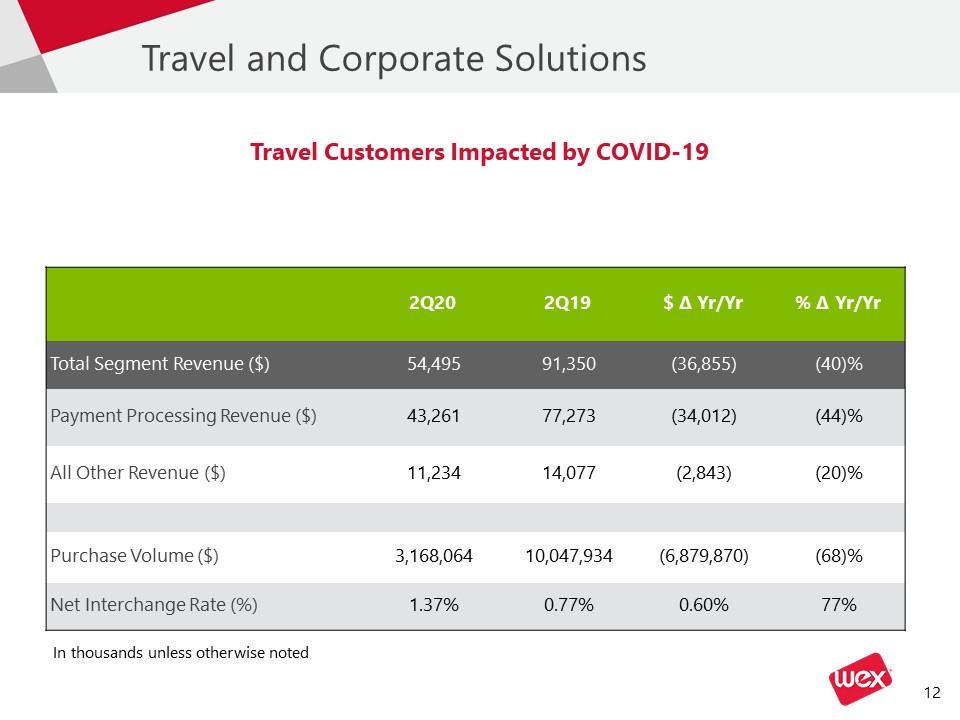
Travel and Corporate Solutions 2Q20 2Q19 $ ∆ Yr/Yr % ∆ Yr/Yr Total Segment Revenue
($) 54,495 91,350 (36,855) (40)% Payment Processing Revenue ($) 43,261 77,273 (34,012) (44)% All Other Revenue ($) 11,234 14,077 (2,843) (20)% Purchase Volume ($) 3,168,064 10,047,934 (6,879,870) (68)% Net
Interchange Rate (%) 1.37% 0.77% 0.60% 77% Travel Customers Impacted by COVID-19 In thousands unless otherwise noted
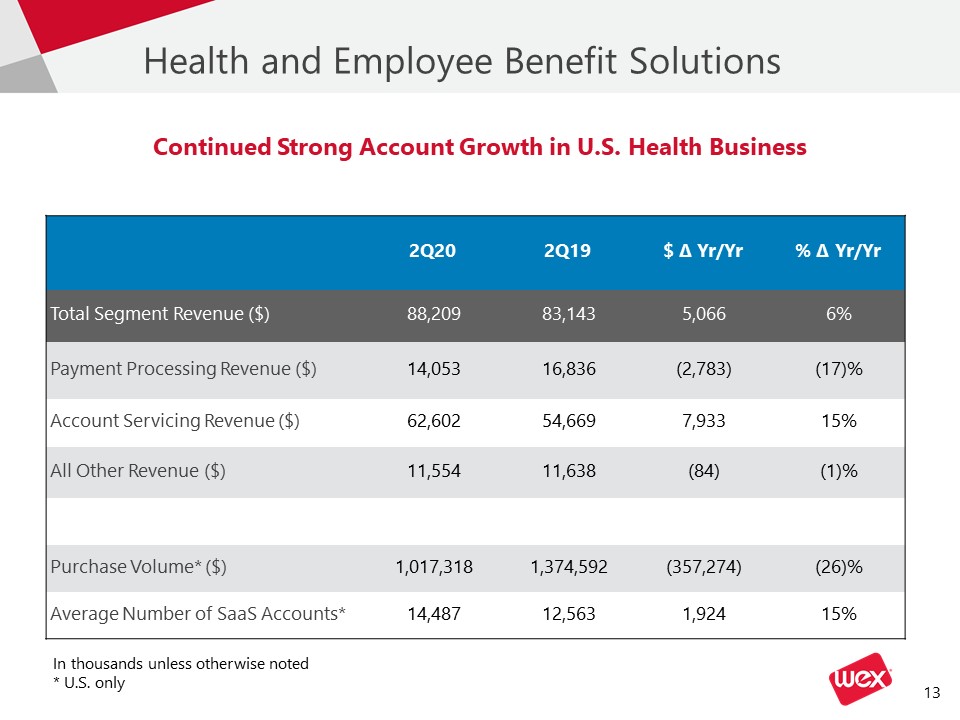
Health and Employee Benefit Solutions 2Q20 2Q19 $ ∆ Yr/Yr % ∆ Yr/Yr Total Segment Revenue
($) 88,209 83,143 5,066 6% Payment Processing Revenue ($) 14,053 16,836 (2,783) (17)% Account Servicing Revenue ($) 62,602 54,669 7,933 15% All Other Revenue ($) 11,554 11,638 (84) (1)% Purchase Volume*
($) 1,017,318 1,374,592 (357,274) (26)% Average Number of SaaS Accounts* 14,487 12,563 1,924 15% Continued Strong Account Growth in U.S. Health Business In thousands unless otherwise noted* U.S. only
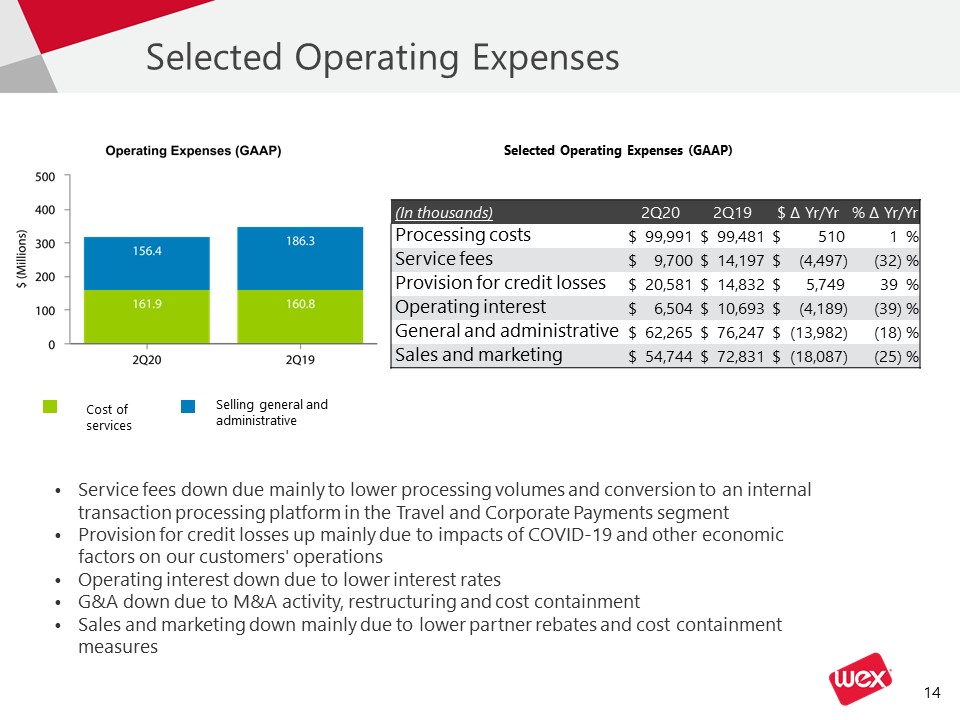
Selected Operating Expenses Service fees down due mainly to lower processing volumes and conversion to
an internal transaction processing platform in the Travel and Corporate Payments segmentProvision for credit losses up mainly due to impacts of COVID-19 and other economic factors on our customers' operationsOperating interest down due to lower
interest ratesG&A down due to M&A activity, restructuring and cost containment Sales and marketing down mainly due to lower partner rebates and cost containment measures (In thousands) 2Q20 2Q19 $ ∆ Yr/Yr % ∆
Yr/Yr Processing costs $ 99,991 $ 99,481 $ 510 1 % Service fees $ 9,700 $ 14,197 $ (4,497) (32) % Provision for credit losses $ 20,581 $ 14,832 $ 5,749 39 % Operating
interest $ 6,504 $ 10,693 $ (4,189) (39) % General and administrative $ 62,265 $ 76,247 $ (13,982) (18) % Sales and marketing $ 54,744 $ 72,831 $ (18,087) (25) % Cost of services Selling general and
administrative Selected Operating Expenses (GAAP)
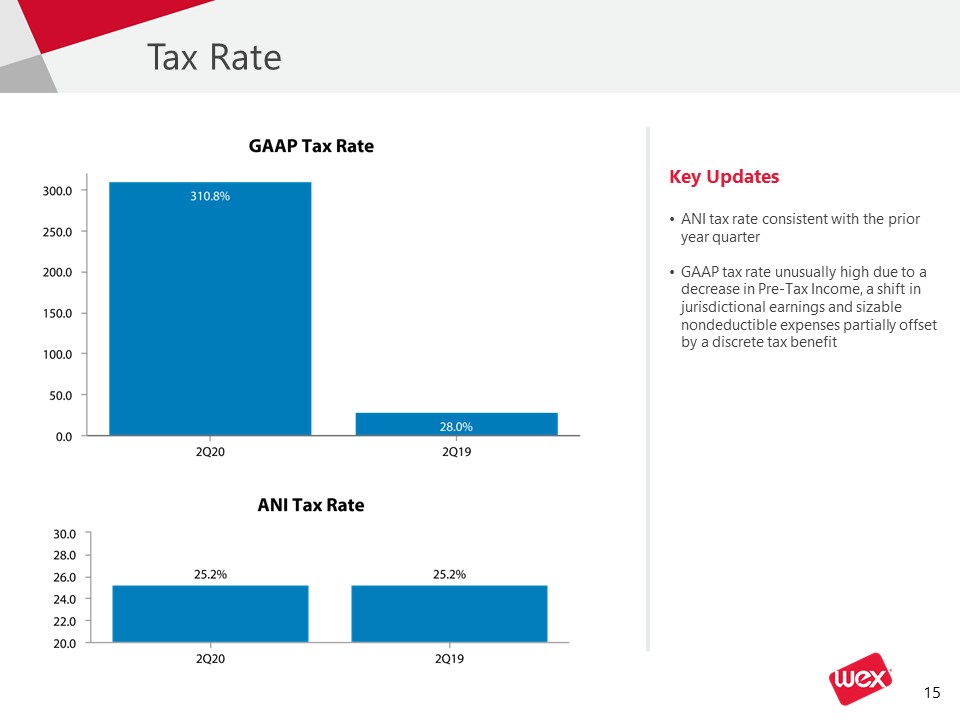
Tax Rate Key UpdatesANI tax rate consistent with the prior year quarterGAAP tax rate unusually high due
to a decrease in Pre-Tax Income, a shift in jurisdictional earnings and sizable nondeductible expenses partially offset by a discrete tax benefit
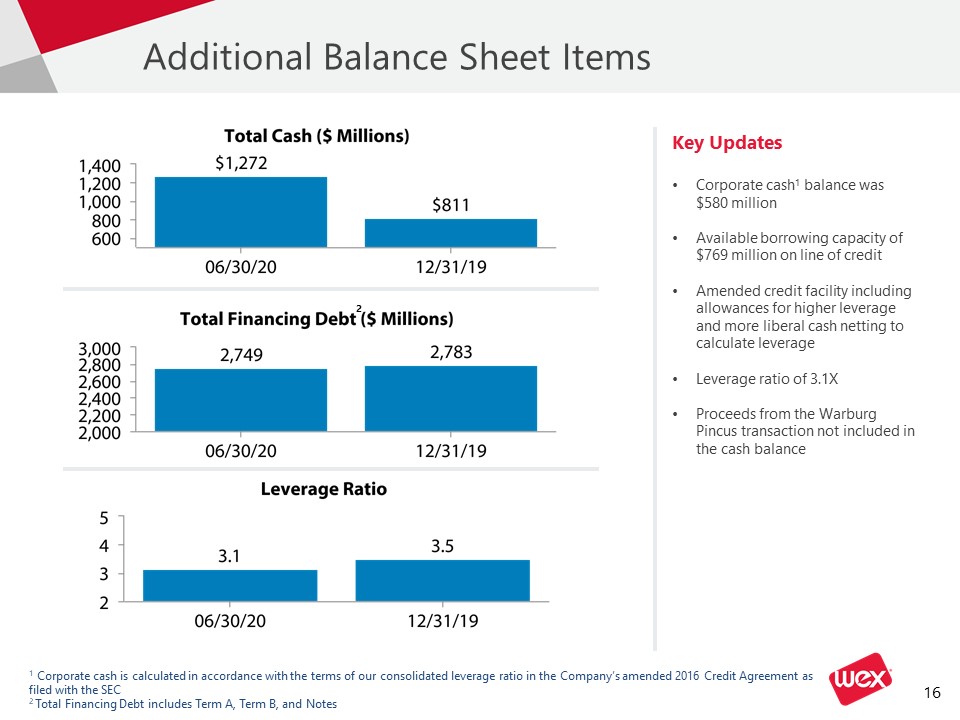
Additional Balance Sheet Items Key UpdatesCorporate cash1 balance was $580 million Available
borrowing capacity of $769 million on line of creditAmended credit facility including allowances for higher leverage and more liberal cash netting to calculate leverageLeverage ratio of 3.1XProceeds from the Warburg Pincus transaction not
included in the cash balance 1 Corporate cash is calculated in accordance with the terms of our consolidated leverage ratio in the Company’s amended 2016 Credit Agreement as filed with the SEC2 Total Financing Debt includes Term A,
Term B, and Notes 2

Appendix

Diversity and Inclusion Areas of focus WORKPLACE WORKFORCE COMMUNITY MARKETPLACE Create a
culture of inclusion to drive innovation Build tomorrow’s diverse workforce Embrace the diversity of our communities Cement D&I as a market imperative and as part of our reputation
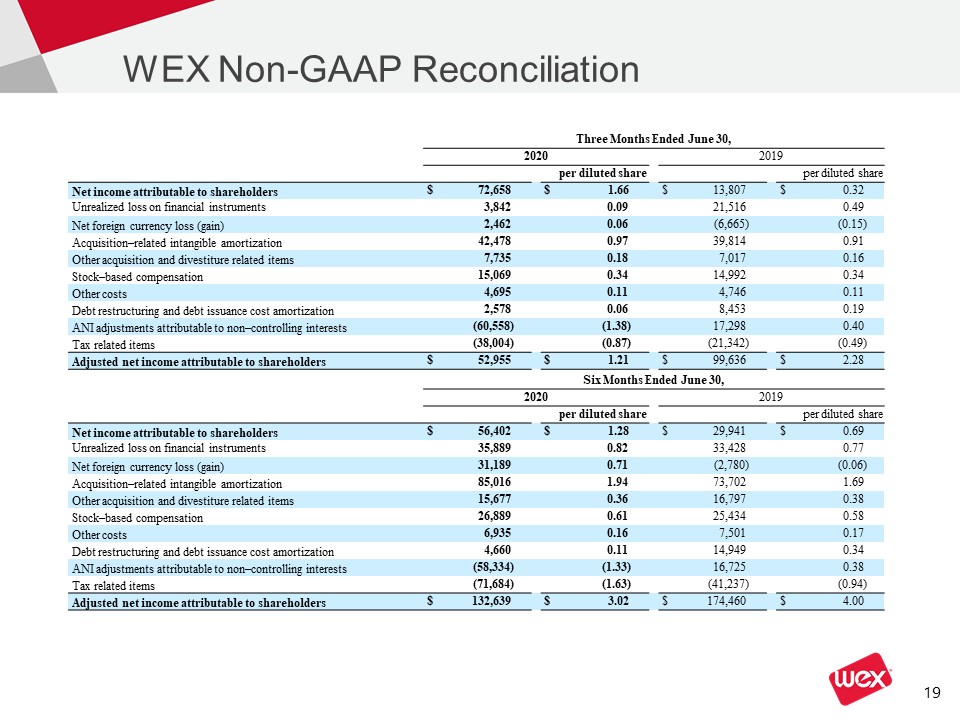
WEX Non-GAAP Reconciliation Three Months Ended June
30, 2020 2019 per diluted share per diluted share Net income attributable to
shareholders $ 72,658 $ 1.66 $ 13,807 $ 0.32 Unrealized loss on financial instruments 3,842 0.09 21,516 0.49 Net foreign currency loss
(gain) 2,462 0.06 (6,665) (0.15) Acquisition–related intangible amortization 42,478 0.97 39,814 0.91 Other acquisition and divestiture related
items 7,735 0.18 7,017 0.16 Stock–based compensation 15,069 0.34 14,992 0.34 Other costs 4,695 0.11 4,746 0.11 Debt restructuring and debt issuance
cost amortization 2,578 0.06 8,453 0.19 ANI adjustments attributable to non–controlling interests (60,558) (1.38) 17,298 0.40 Tax related
items (38,004) (0.87) (21,342) (0.49) Adjusted net income attributable to shareholders $ 52,955 $ 1.21 $ 99,636 $ 2.28 Six Months Ended June
30, 2020 2019 per diluted share per diluted share Net income attributable to
shareholders $ 56,402 $ 1.28 $ 29,941 $ 0.69 Unrealized loss on financial instruments 35,889 0.82 33,428 0.77 Net foreign currency loss
(gain) 31,189 0.71 (2,780) (0.06) Acquisition–related intangible amortization 85,016 1.94 73,702 1.69 Other acquisition and divestiture related
items 15,677 0.36 16,797 0.38 Stock–based compensation 26,889 0.61 25,434 0.58 Other costs 6,935 0.16 7,501 0.17 Debt restructuring and debt issuance
cost amortization 4,660 0.11 14,949 0.34 ANI adjustments attributable to non–controlling interests (58,334) (1.33) 16,725 0.38 Tax related
items (71,684) (1.63) (41,237) (0.94) Adjusted net income attributable to shareholders $ 132,639 $ 3.02 $ 174,460 $ 4.00
The Company's non-GAAP adjusted net income excludes unrealized gains and losses on financial instruments,
net foreign currency gains and losses, acquisition-related intangible amortization, other acquisition and divestiture related items, stock-based compensation, other costs, debt restructuring and debt issuance cost amortization, similar
adjustments attributable to our non-controlling interests and certain tax related items. .Although adjusted net income is not calculated in accordance with U.S. generally accepted accounting principles (“GAAP”), this non-GAAP measures is
integral to the Company's reporting and planning processes. The Company considers this measures integral because it exclude the above-specified items that the Company's management excludes in evaluating the Company's performance. Specifically,
in addition to evaluating the Company's performance on a GAAP basis, management evaluates the Company's performance on a basis that excludes the above items because:Exclusion of the non-cash, mark-to-market adjustments on financial instruments,
including interest rate swap agreements and investment securities, helps management identify and assess trends in the Company's underlying business that might otherwise be obscured due to quarterly non-cash earnings fluctuations associated with
these financial instruments. Net foreign currency gains and losses primarily result from the remeasurement to functional currency of cash, accounts receivable and accounts payable balances, certain intercompany notes denominated in foreign
currencies and any gain or loss on foreign currency hedges relating to these items. The exclusion of these items helps management compare changes in operating results between periods that might otherwise be obscured due to currency
fluctuations.The Company considers certain acquisition-related costs, including certain financing costs, investment banking fees, warranty and indemnity insurance, certain integration related expenses and amortization of acquired intangibles,
as well as gains and losses from divestitures to be unpredictable, dependent on factors that may be outside of our control and unrelated to the continuing operations of the acquired or divested business or the Company. In addition, the size and
complexity of an acquisition, which often drives the magnitude of acquisition-related costs, may not be indicative of such future costs. The Company believes that excluding acquisition-related costs and gains or losses of divestitures
facilitates the comparison of our financial results to the Company's historical operating results and to other companies in our industry.Stock-based compensation is different from other forms of compensation as it is a non-cash expense. For
example, a cash salary generally has a fixed and unvarying cash cost. In contrast, the expense associated with an equity-based award is generally unrelated to the amount of cash ultimately received by the employee, and the cost to the Company
is based on a stock-based compensation valuation methodology and underlying assumptions that may vary over time.We exclude other costs when evaluating our continuing business performance as such items are not consistently occurring and do not
reflect expected future operating expense, nor do they provide insight into the fundamentals of current or past operations of our business. This includes costs related to further streamline the business, improve the Company’s efficiency, create
synergies and globalize the Company’s operations. For the three and six months ended June 30, 2020, other costs include certain costs incurred in association with COVID-19, including the cost of providing additional health, welfare and
technological support to our employees as they work remotely.Debt restructuring and debt issuance cost amortization are unrelated to the continuing operations of the Company. Debt restructuring costs are not consistently occurring and do not
reflect expected future operating expense, nor do they provide insight into the fundamentals of current or past operations of our business. In addition, since debt issuance cost amortization is dependent upon the financing method, which can
vary widely company to company, we believe that excluding these costs helps to facilitate comparison to historical results as well as to other companies within our industry.The adjustments attributable to non-controlling interests, including
adjustments to the redemption value of a non-controlling interest, have no significant impact on the ongoing operations of the business.The tax related items are the difference between the Company’s U.S. GAAP tax provision and a pro forma tax
provision based upon the Company’s adjusted net income before taxes as well as the impact from certain discrete tax items. The methodology utilized for calculating the Company’s adjusted net income tax provision is the same methodology utilized
in calculating the Company’s U.S. GAAP tax provision.For the same reasons, WEX believes that adjusted net income may also be useful to investors when evaluating the Company's performance. However, because adjusted net income is a non-GAAP
measure, it should not be considered as a substitute for, or superior to, net income as determined in accordance with GAAP. In addition, adjusted net income as used by WEX may not be comparable to similarly titled measures employed by other
companies. WEX Non-GAAP Reconciliation