Attached files
| file | filename |
|---|---|
| 8-K - FORM 8-K - COMMUNITY FINANCIAL CORP /MD/ | f8k_072920.htm |
Exhibit 99.1
Parent of: (“TCFC”) 1 (“CBTC”) Investor Presentation Second Quarter Financial Update July 2020

Forward Looking Information 2 Certain statements contained in this communication may not be based on historical facts and are “forward - looking statements” within the meaning of Section 27 A of the Securities Act of 1933 , as amended, and Section 21 E of the Securities Exchange Act of 1934 , as amended . Forward - looking statements can generally be identified by the fact that they do not relate strictly to historical or current facts . They often include words like “believe,” “expect,” “anticipate,” “estimate” and “intend” or future or conditional verbs such as “will,” “would,” “should,” “could” or “may . ” Statements in this communication that are not strictly historical are forward - looking and are based upon current expectations that may differ materially from actual results . These forward - looking statements include, without limitation, those relating to The Community Financial Corporation’s and Community Bank of the Chesapeake’s future growth and management’s outlook or expectations for revenue, assets, asset quality, profitability, business prospects, net interest margin, non - interest revenue, allowance for loan losses, the level of credit losses from lending, liquidity levels, capital levels, expense run rates, or other future financial or business performance strategies or expectations, and any statements of the plans and objectives of management for future operations products or services, including the expected benefits from, and/or the execution of, integration plans relating to any acquisition we have undertaken or that we undertake in the future ; plans and cost savings regarding branch closings or consolidation ; any statement of expectation or belief ; projections related to certain financial metrics ; and any statement of assumptions underlying the foregoing . These forward - looking statements express management’s current expectations or forecasts of future events, results and conditions, and by their nature are subject to and involve risks and uncertainties that could cause actual results to differ materially from those anticipated by the statements made herein . Factors that might cause actual results to differ materially from those made in such statements include, but are not limited to : risks, uncertainties and other factors relating to the COVID - 19 pandemic (including the length of time that the pandemic continues, the ability of states and local governments to successfully implement the lifting of restrictions on movement and the potential imposition of further restrictions on movement and travel in the future ; the effect of the pandemic on the general economy and on the businesses of our borrowers and their ability to make payments on their obligations ; the remedial actions and stimulus measures adopted by federal, state and local governments ; and the inability of employees to work due to illness, quarantine, or government mandates) ; the synergies and other expected financial benefits from any acquisition we have undertaken or that we undertake in the future, may not be realized within the expected time frames ; costs or difficulties related to integration matters might be greater than expected ; changes in The Community Financial Corporation’s or Community Bank of the Chesapeake’s operating or expansion strategy ; availability of and costs associated with obtaining adequate and timely sources of liquidity ; the ability to maintain credit quality ; general economic trends ; changes in interest rates ; loss of deposits and loan demand to other financial institutions ; substantial changes in financial markets ; changes in real estate value and the real estate market ; regulatory changes ; the impact of government shutdowns or sequestrations ; the possibility of unforeseen events affecting the industry generally ; the uncertainties associated with newly developed or acquired operations ; the outcome of litigation that may arise ; market disruptions and other effects of terrorist activities ; and the matters described in “Item 1 A Risk Factors” in the Company’s Annual Report on Form 10 - K for the Year Ended December 31 , 2019 , and in its other reports and communications filed with the Securities and Exchange Commission (the “SEC”) . These forward - looking statements may also be subject to other risks and uncertainties, including those that we may discuss elsewhere in this communication or in our filings with the SEC, accessible on the SEC’s Web site at www . sec . gov . We undertake no obligation to update these forward - looking statements to reflect events or circumstances after the date hereof or to reflect the occurrence of unforeseen events, except as required under the rules and regulations of the SEC . You are cautioned not to place undue reliance on the forward - looking statements contained in this communication in that actual results could differ materially from those indicated in such forward - looking statements, due to a variety of factors . Any forward - looking statement speaks only as of the date of this communication, and we undertake no obligation to update these forward - looking statements to reflect events or circumstances that occur after the date of this communication . Annualized, pro forma, projected and estimated numbers are used for illustrative purpose only, are not forecasts, and may not reflect actual results .

The Community Financial Corporation 3 x The Community Financial Corporation (NASDAQ: TCFC) is the bank holding company for Community Bank of the Chesapeake (the “Bank”) x $1.8 billion in assets at Q1 2020 (1) and market capitalization of approximately $132 Million (2) x Headquartered in Waldorf, MD with 14 office locations in Maryland and Virginia • Branches: 11 in the Southern Maryland counties of Calvert, Charles and St. Mary’s and 1 in Virginia in in the City of Fredericksburg • Loan Production Offices (LPOs): 3 in Maryland (La Plata, Prince Frederick and Leonardtown) and 1 in Virginia (Fredericksburg) x Average branch size of greater than $125 million significantly exceeds industry average x Relationship banking focus; high touch with direct access to senior decision makers x Current platform has capacity to support future organic growth Source: Management. (1) Total assets at 06/30/2020 were $2.1 billion and include both U.S. SBA PPP loans of $125.6 million and increased on - balance sheet liquidity from COVID - 19 government stimulus and customer arrangements with financial institutions and vendors. (2) Market data as of 07/27/2020.

Investment Highlights 4 x More than 30 consecutive years of profitability x Strong, Experienced Management Team positioned for growth x Increased Profitability Momentum in Pre - Tax Pre - Provision income x COVID - 19 • Deferred loans of $264.9 million at 06 - 30 - 2020 represent 17.7% of gross portfolio loans • The Company originated $130 million or 902 U.S. Small Business Administration Payroll Protection Program loans (“U.S. SBA PPP”) in Q2 2020 • Increased provisions to respond to COVID - 19 – ALLL increased from 0.75% at 12/31/19 to 1.09% at 06/30/2020 x Positioned in Demographically Attractive Markets x Strong Market Share Position in Core Market. The Bank is focused on: • Continuing to improve funding costs • Maintaining expense control discipline • Opportunistic growth from market disruption (e.g., WesBanco - Old Line acquisition) • Increasing market share in Fredericksburg, VA and the Greater Fredericksburg Area

Consistent Shareholder Value Creation Book value and tangible book value were the same until 2018 upon the acquisition of County First Bank: $10 . 0 2 5 $10 . 4 8 $10 . 9 8 $14 . 2 8 $13.09 $12 . 0 6 $16. 7 9 $17 . 2 3 $17 . 4 3 $18 . 2 5 $18 . 3 2 $19 . 3 4 $19 . 5 2 $25 . 2 5 $23.65 $22.54 $21.48 $20 . 5 3 $28 . 5 7 $29 . 9 1 2 0 01 2 0 02 2 0 03 2 0 04 2 0 05 2 0 06 2 0 07 2 0 08 2 0 09 2 0 10 2 0 11 2 0 12 2 0 13 2 0 14 2 0 15 2 0 16 2 0 17 2 0 18 2 0 19 Q2 2 0 20 Source: Company filings. Note: Tangible book value per share is a non - GAAP financial measure. Refer to Appendix to this presentation for a reconciliation. Additional shares outstanding from the capital raised below impacted year to year comparability of per share book value amounts: In October 2013, the Company issued 1,591,300 shares of common stock for net proceeds of $27.4 million after commissions and related offering expenses. In December 2019, the Company issued 312,747 shares of common stock in a private placement offering for net proceeds of $10.6 million after offering expenses.

#1 Market Share Position in Southern Maryland (1) Source: Federal Deposit Insurance Corporation website. Includes Calvert, MD, Charles, MD, Saint Mary’s, MD and Fredericksburg, VA Deposit market share data as of 6/30/19. FDIC data for 2020 survey will not be published and available until September 2020. Existing Franchise TCFC (12) Deposit Market Share – Counties of Operation (1) Rank Institution (ST) Deposits in M a r k e t ($mm) Market S h a r e (%) 1 $ 1 , 49 7 21 . 7 2 Bank of America Corp. 1 , 18 2 17 . 1 3 PNC Financial Services Group Inc. 1 , 14 9 16 . 6 4 BB&T Corp. 716 10 . 4 5 Old Line Bancshares Inc. 553 8 . 0 6 SunTrust Bank 409 5 . 9 7 Delmar Bancorp (Virginia Partners) 290 4 . 2 8 Atlantic Union Bankshares Corp. 266 3 . 9 9 M&T Bank Bank Corp. 259 3 . 7 10 Wells Fargo & Co. 249 3 . 6 11 Capital One Financial Corp. 150 2 . 2 Top 11 of 17 Instututions had $6.7 billion of $6.9 billion reported in FDIC June 30, 2019 survey. 6

Source:, Company regulatory and SEC filings. TCFC had no intangible assets until 2018. (1) Non - GAAP financial measures. Refer to Appendix to this presentation for a reconciliation. (2) Operating results are non - GAAP financial measures. Refer to Appendix to this presentation for a reconciliation. (3) NPLs include nonaccrual loans, loans 90+ days past due and accruing TDRs. NPAs include NPLs and OREO. the Bank’s funding composition, the control of operating expenses and organic loan growth x 2020 YTD NIM expansion compared to PYTD x Net deferred fees of $3.8 million for U.S. SBA PPP loans x 89% or $2.1 million increase to noninterest income YTD Q2 2020 compared to PYTD Q2 2019 x Strong expense control x In December 2019 - issued 312,747 shares of common stock for net proceeds of $10.6 million x Paid off $23.0 million of 6.25% Sub - debt in February 2020. Financial Highlights 2016 FY 2017 FY 2018 FY 2019FY YTD 2019 YTD 2020 Highlights ($000s except per share) 12/31/16 12/31/17 12/31/18 12/31/19 6/30/19 6/30/20 Balance Sheet Total Assets $ 1,334,257 $ 1,405,961 $ 1,689,227 $ 1,797,536 $ 1,756,448 $ 2,093,756 x Improved earnings in 2019 due to changes in 7 Gross Portfolio Loans ("GPLs") 1 , 088 , 98 2 1 , 150 , 04 4 1 , 346 , 92 2 1 , 454 , 17 2 1 , 387 , 18 6 1 , 492 , 74 5 U.S. SBA PPP Loans - - - - - 129 , 38 4 Deposits 1 , 038 , 82 5 1 , 106 , 23 7 1 , 429 , 62 9 1 , 511 , 83 7 1 , 494 , 44 2 1 , 670 , 36 4 Tangible Common Equity (1) 104 , 42 6 109 , 95 7 140 , 84 1 168 , 54 1 150 , 36 0 176 , 79 7 Consolidated Capital (%) Tang. Common Equity/Tang. Assets (1) 7 . 8 3 % 7 . 8 2 % 8 . 4 1 % 9 . 4 4 % 8 . 6 3 % 8 . 5 0 % Tier 1 Risk Based Ratio 10 . 6 2 10 . 5 3 11 . 2 3 11 . 9 1 11 . 2 1 11 . 1 2 Risk - Based Capital Ratio 13 . 6 0 13 . 4 0 13 . 6 8 14 . 1 6 13 . 5 6 12 . 9 4 TBV Per Share (1) 22 . 5 4 23 . 6 5 25 . 2 5 28 . 5 7 26 . 9 3 29 . 9 1 Asset Quality (%) NPAs/Assets (3) 1 . 9 9 % 1 . 7 1 % 2 . 0 2 % 2 . 0 2 % 1 . 4 7 % 1 . 4 2 % NCOs/Avg Portfolio Loans 0 . 1 0 0 . 0 3 0 . 0 7 0 . 0 7 0 . 1 4 0 . 3 0 NPLs (3 ) + OREO/GPLs + OREO 2 . 4 2 2 . 0 7 2 . 5 1 1 . 8 0 1 . 8 5 1 . 8 2 Reserves/NPLs (3) 52 . 4 71 . 5 42 . 3 59 . 1 70 . 4 69 . 5 Profitability Net Income to Common $ 7 , 33 1 $ 7 , 20 8 $ 11 , 22 8 $ 15 , 27 2 $ 7 , 50 4 $ 6 , 19 8 ROAA 0 . 6 0 % 0 . 5 2 % 0 . 7 0 % 0 . 8 8 % 0 . 8 8 % 0 . 6 5 % ROAA (Operating) (2) 0 . 6 0 0 . 7 8 0 . 8 7 0 . 8 8 0 . 8 8 0 . 6 5 Pre - tax Pre - Provision ("PTPP") ROAA (1) 1 . 1 5 1 . 2 6 1 . 0 5 1 . 3 2 1 . 3 0 1 . 5 7 ROACE 7 . 0 9 6 . 5 5 7 . 5 3 9 . 3 2 9 . 4 1 6 . 6 4 ROACE (Operating) (2) 7 . 0 9 9 . 7 0 9 . 3 4 9 . 3 2 9 . 4 1 6 . 6 4 PTPP ROACE (1) 13 . 6 4 15 . 8 0 11 . 2 7 14 . 0 7 15 . 9 5 13 . 9 1 Net Interest Margin 3 . 4 8 3 . 3 7 3 . 4 3 3 . 3 1 3 . 3 2 3 . 3 9 Efficiency Ratio (1) 64 . 8 60 . 4 61 . 5 59 . 8 59 . 8 51 . 5 Non - Interest Exp/Avg Assets (Operating) (2) 2 . 3 0 2 . 0 7 2 . 1 1 2 . 0 2 1 . 9 9 1 . 8 1 Net Operating Exp/Avg Assets (Operating) (2) 2 . 0 0 1 . 7 9 1 . 8 5 1 . 7 1 1 . 7 4 1 . 4 1 Diluted EPS $ 1 . 5 9 $ 1 . 5 6 $ 2 . 0 2 $ 2 . 7 5 $ 1 . 3 5 $ 1 . 0 5 Diluted EPS (Operating) (2) 1 . 5 9 2 . 3 1 2 . 5 1 2 . 7 5 1 . 3 5 1 . 0 5

Return on Average Assets (%) x The combination of improved expense discipline, continued organic growth and increased noninterest income have produced a steady improvement x Closed four of five County First locations during May 2018. Net of one branch (La Plata) added to branch network Increasing Profitability – ROAA PTPP = Pre - tax Pre - provision Income 0 . 60 % 0 . 78 % 0 . 87 % 0 . 88 % 0 . 65 % 0 . 60 % 0 . 52 % 0 . 70 % 0 . 88 % 0 . 65 % 1 . 15 % 1 . 26 % 1 . 05 % 1 . 32 % 1 . 57 % 2 0 1 6 2020 YTD 2018 Reported ROAA 2 0 1 9 PTPP ROAA Source: Company filings. (1) Operating results are non - GAAP financial measures. Refer to Appendix to this presentation for a reconciliation. 8 2017 Operating ROAA (1)

Increasing Profitability - ROACE Return on Average Common Equity (%) PTPP = Pre - tax Pre - provision Income 7 . 09 % 9 . 70 % 9 . 32 % 6 . 64 % 7 . 09 % 6 . 55 % 7 . 53 % 9 . 32 % 6 . 64 % 13 . 64 % 15 . 80 % 11.27% 9.33% 14 . 07 % 15 . 95 % 2 0 1 6 2020 YTD 2017 Operating ROACE (1) 2018 Reported ROACE 2019 PTPP ROACE Source: Company filings. (1) Operating results are non - GAAP financial measures. Refer to Appendix to this presentation for a reconciliation. 9

Efficiency & Net Operating Expenses Efficiency Ratio (1) Net Operating Expense / Avg. Assets (1) x Expense control remains a top priority through the COVID - 19 crisis x Increased noninterest income and net interest income in 2020 while maintaining expenses has increased efficiency and PTPP x On - going review of operating expense base for specific savings initiatives, including closure of underperforming branches x Efficiency ratio and net operating expense below peer institutions 6 8 .0% 6 4 .8% 6 0 .4% 6 1 .5% 5 9 .8% 5 1 .5% 2015 Y 2016 Y 2017 Y 2018 Y 2019 Y 2 0 2 0Y TD 2.30% Source: Management and Company filings (1) TCFC Operating results non - GAAP financial measures. Refer to Appendix to this presentation for a reconciliation. 10 2.10% 1.89% 2.13% 1.55% 2 . 16 % 2 . 00 % 1 . 79 % 1 . 85 % 1.75% 1.71% 1 . 41 % 2015Y 2016Y 2017Y 2018Y 2019Y 2020YTD Reported Operating

Loan Composition Historical Loan Growth Since 2015 ($mm) Loan Composition (06/30/2020) x U.S. Small Business Administration Payroll Protection Program loans (“U.S. SBA PPP”) of $129.4 million at 06/30/2020 are excluded from the above balances and metrics due to their temporary nature. x Commercial loan portfolios were 84% of loans at June 30, 2020 $1.5 Billion YTD Yield: 4.43% $ 9 1 7 .7 $ 1 ,0 8 9.0 $ 1 ,1 5 0.0 $ 1 ,3 4 6.9 $ 1 ,4 5 4.2 $ 1 ,4 9 2.7 2 0 1 5 Y 2 0 1 6 Y 2 0 1 7 Y 2 0 1 8 Y 2 0 1 9 Y 2 0 2 0 Q2 Owner - Occupied, CRE and C&I 32% Source: Management and company filings 11 Commerc ia l Real Estate 43% Res id e nt i a l Rentals 9% Residential & Consumer 13% Residential Con s truction 3%
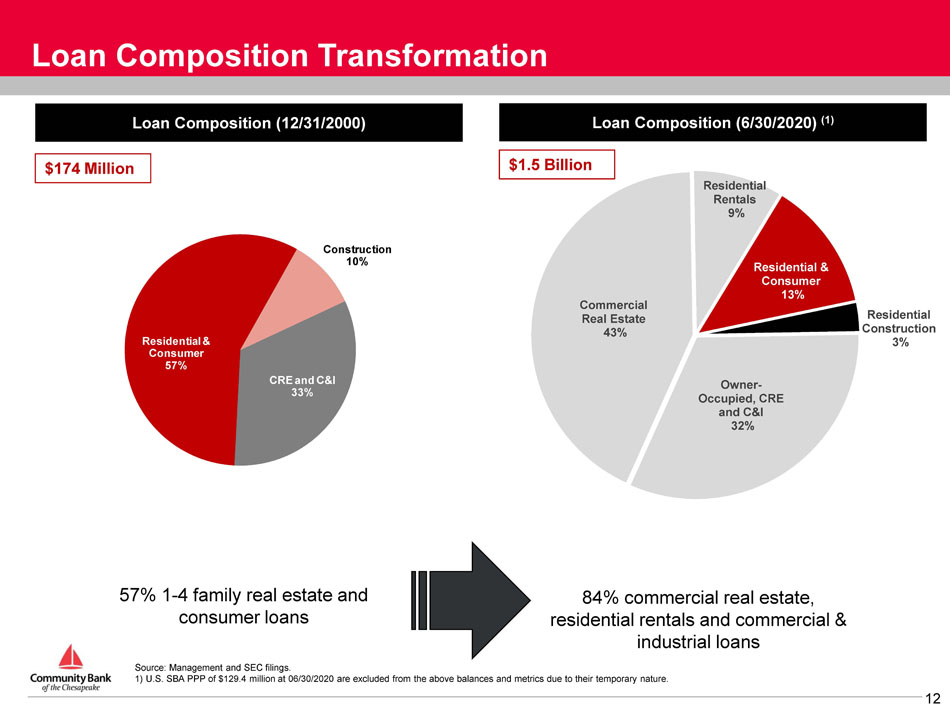
Loan Composition Transformation Loan Composition (12/31/2000) $174 Million Loan Composition (6/30/2020) (1) Source: Management and SEC filings. 1) U.S. SBA PPP of $129.4 million at 06/30/2020 are excluded from the above balances and metrics due to their temporary nature. $1.5 Billion 57% 1 - 4 family real estate and consumer loans 84% commercial real estate, residential rentals and commercial & industrial loans CRE and C&I 33% Residential & Consumer 57% C on s tr u c ti o n 10% Owner - Occupied, CRE and C&I 32% 12 Commerc ia l Real Estate 43% Res id e nt i a l Rentals 9% Residential & Consumer 13% Residential Con s truction 3%

Asset Quality – Classified and Non - Performing Assets Classified Asset (1) Trends as a Percentage of Assets Nonperforming Asset Composition (“NPAs’) (06/30/2020) x 69%, or $56.8 million, reduction in classified assets (1) since their peak in Q3 2011 from $81.9 million to $25.1 million at Q2 2020 x NPLs (2) + OREO/Gross Portfolio Loans (3) + OREO have decreased from 2.51% at Q4 2018 to 1.82% at Q2 2020 Source: Management and company filings. (1) Classified assets include loans graded as substandard, doubtful or loss, non - investment grade securities and OREO. (2) NPLs include nonaccrual loans, loans 90+ days past due and accruing TDRs. NPAs include NPLs and OREO. (3) U.S. SBA PPP of $129.4 million at 06/30/2020 are excluded from the above balances and metrics due to their temporary nature. $27.2 Million 3.7 9 % 2.94% 3.58% 2.42% 1.93% 1.20% 12/31/2015 Total 1 2 /3 1 /2 0 1 6 1 2 /3 1 /2 0 1 7 Classified Loans 12/31/2018 12/31/2019 6/30/2020 Other Real Estate Owned Non - A c c rual $ 2 2.9 84% 13 Accruing TDRs $0 .6 2% O R E O $3.7 14%

Asset Quality – COVID - 19 Deferred Loans x The Company’s COVID - 19 deferred loans represent 17.7% of gross portfolio loans at June 30, 2020 x Deferral requests have slowed as of July 29, 2020. At June 30, 2020 there was approximately $20.0 million of additional deferred loan requests being considered by the Company June 30, 2020 COVID - 19 Deferred Loans (dollars in thousands) Loan Balances Interest Recognized Scheduled % Number of Loans Not Received Monthly Principal Scheduled Monthly Interest Commercial real estate $ 228,117 86.14% 153 $ 2,259 $ 813 $ 831 Residential first mortgages 13,545 5.11% 41 160 40 48 Residential rentals 8,643 3.26% 26 110 33 38 Construction and land development - 0.00% - - - - Home equity and second mortgages 394 0.15% 5 6 2 1 Commercial loans 745 0.28% 7 11 1 3 Consumer loans 11 0.00% 3 - - - Commercial equipment 13,395 5.06% 77 116 221 48 Total $ 264,850 100.00% 31 2 $ 2,662 $ 1,110 $ 969 COVID - 19 Deferred Loans - Next Payment Due By Month (dollars in thousands) Loan Balances % Number of Loans July - 20 11,629 4.39% 18 August - 20 17,530 6.62% 21 September - 20 5,480 2.07% 31 October - 20 96,349 36.38% 113 November - 20 113,012 42.67% 99 December - 20 15,768 5.95% 21 January - 21 5,081 1.92% 9 Total $ 264,849 100.00% 31 2 Source: Management. 14
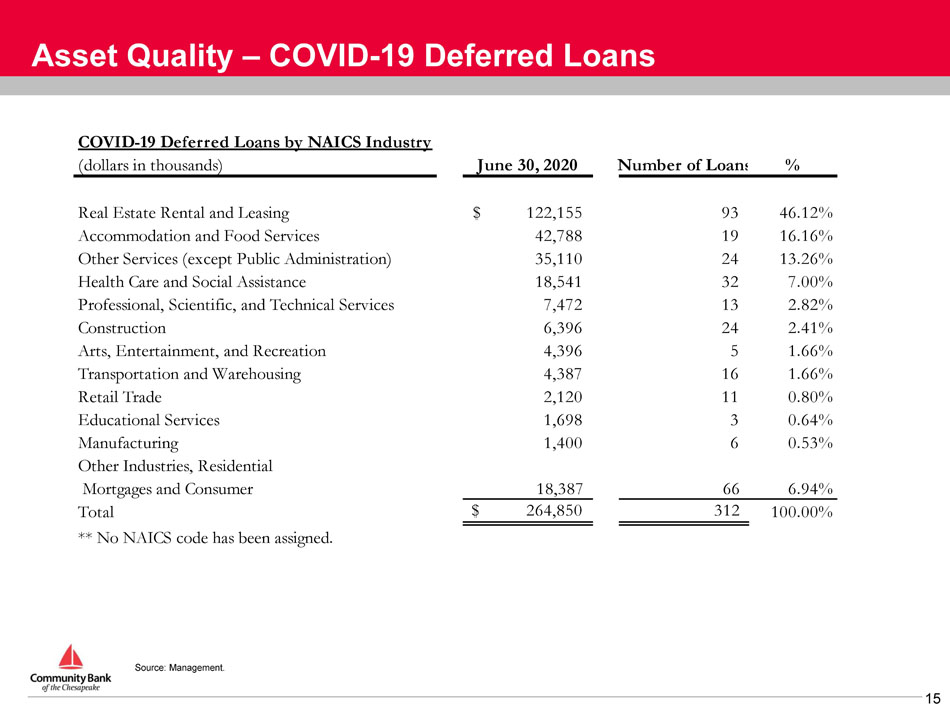
Asset Quality – COVID - 19 Deferred Loans COVID - 19 Deferred Loans by NAICS Industry (dollars in thousands) June 30, 2020 Number of Loan % Real Estate Rental and Leasing $ 122,155 93 46.12% Accommodation and Food Services 42,788 19 16.16% Other Services (except Public Administration) 35,110 24 13.26% Health Care and Social Assistance 18,541 32 7.00% Professional, Scientific, and Technical Services 7,472 13 2.82% Construction 6,396 24 2.41% Arts, Entertainment, and Recreation 4,396 5 1.66% Transportation and Warehousing 4,387 16 1.66% Retail Trade 2,120 11 0.80% Educational Services 1,698 3 0.64% Manufacturing 1,400 6 0.53% Other Industries, Residential Mortgages and Consumer 18,387 66 6.94% Total $ 264,850 312 100.00% ** No NAICS code has been assigned. Source: Management. 15

Deposit & Funding Transformation $1.7 Billion x The Bank’s deposit funding mix significantly changed during the last eight years . At June 30 , 2020 the Bank’s deposit funding consisted of approximately 78 % transaction accounts ( 74 % at 12 / 31 / 19 ) compared to 45 % at December 31 , 2011 x The Bank’s origination of $130 million in U.S. SBA PPP loans in the second quarter of 2020 has created goodwill with new customers x The acquisition in Q1 2018 (~$160 million of transaction deposits) and organic growth decreased wholesale funding from 18.7% of assets or $262.0 million at Q4 2017 to 4.0% of assets or $83.3 million at Q2 2020 x Gross loans to deposits decreased from 104.1% at Q4 2017 to 89.4% at Q2 2020 (96.2% at Q4 2019) Source: Management and company filings. (1) Deposit balances at 06/30/2020 include increased customer liquidity as a result of federal government stimulus as a result of the COVID - 19 pandemic. Deposit Composition (12/31/2011) Deposit Composition (1) (06/30/2020) $0.8 Billion Interest Bearing T r ansa c tion 35.1% Non - In t e r e s t Bearing Transaction 9.8% Time Dep o sits 55.1% Interest Bearing T ran s a c tion 56.8% 16 N o n - Interest Bearing Transaction 21.3% Time D e p o s its 21.9%

Deposit Composition Historical Deposit Growth Since 2015 ($mm) x Success in increasing transaction deposits, including noninterest bearing deposits, has helped alleviate pressure on cost of funds x Total deposits increased ~$560 million since December 31, 2017 • County First acquisition added ~$200 million in deposits in 2018 • Deposits organically increased ~$200 million between 2017 and Q4 2020 • Deposits have increased ~$160 million between Q4 2019 and Q2 2020 x Time deposits steadily decreased as a percentage of deposit funding since 2015 $ 9 0 6 .9 $ 1 ,0 3 8.8 $ 1 ,1 0 6.2 $ 1 ,4 2 9.6 $ 1 ,5 1 1.8 x Deposits have increased at a compound annual growth rate (“CAGR”) of 14.5% since 2015 $1,670.4 $142.8 $144.9 $159.8 $209.4 $241.2 $356.2 $388.5 $461.1 $494.8 $773.2 $876.4 $947.7 $375.6 $432.8 $451.6 $447.0 $394.2 $366.5 2016Y 2017Y 2015Y Total Interest Bearing Transaction 2018 Y 2019 Y 2 0 2 0 Q 2 Non - Interest Bearing Transaction Time Deposits Source: Management and company filings. 17

Loans to Deposits (%) x Increased liquidity provides more opportunities to lower funding costs over time x The Bank considers reciprocal deposits to be core deposits Wholesale Funds to Assets Increasing Liquidity 1 0 1.2% 1 0 4.8% 1 0 4.0% 9 4 .2% 9 6 .2% 89.4% x Wholesale funds include Federal Home Loan Bank advances and brokered deposits 2 0 1 5 Y 2 0 1 6 Y 2 0 1 7 Y 2 0 1 8 Y 2 0 1 9 Y 2 0 2 0 Q2 1 2 .3% Source: Management and company filings. 18 2 0 .7% 1 8 .7% 6.4% 4.0% 2.6% 2 0 1 5 Y 2 0 1 6 Y 2 0 1 7 Y 2 0 1 8 Y 2 0 1 9 Y 2 0 2 0 Q2

Cost of Funding and Net Interest Margin Source: Management and company filings. Net Interest Margin vs. Cost of Funding 3.21% 3.31% 3.56% 3.68% 3.60% 3.48% 3.37% 3.43% 3.31% 3.39% 1.59% 1.21% 0.88% 0.74% 0.75% 0.73% 0.81% 0.99% 1.22% 0.72% 1.43% 1.05% 0.71% 0.56% 0.48% 0.48% 0.56% 0.80% 1.06% 0.64% 2011 2012 2015 2017 2018 2019 2 0 2 0Y TD 2013 2014 Net Interest Margin 2016 Cost of Funds Cost of Deposits 19
Appe n dix 20

Non - GAAP Reconciliation Tangible Book Value Per Share & Tangible Common Equity / Tangible Assets ‘‘Tangible book value per share’’ is defined as tangible stockholders’ equity less preferred equity and intangible assets divided by total common shares outstanding . We believe that this measure is important to many investors in the marketplace who are interested in changes from period to period in book value per common share exclusive of changes in intangible assets . (dollars in thousands, except share data) For the Years Ended (dollars in thousands, except share data) For the Years Ended For the Period Ended 2001 2002 2003 2004 2005 2006 2007 2008 2009 2010 2011 Stockholders' Equity $ 25,586 $ 26,873 $ 27,912 $ 31,124 $ 34,578 $ 37,729 $ 48,847 $ 67 , 11 4 $ 68,190 $ 71,105 $ 75,454 Intangible Assets - - - - - - - - - - - Preferred Equity - - - - - - - ( 16 , 31 7 ) ( 16 , 31 7 ) (16,317) ( 20 , 000 ) Tangible Common Equity $ 25 , 58 6 $ 26,873 $ 27,912 $ 31,124 $ 34,578 $ 37,729 $ 48,847 $ 50 , 79 7 $ 51,873 $ 54,788 $ 55,454 Shares Outstanding 2,554,218 2,564,252 2,542,314 2,580,444 2,641,487 2,642,288 2,909,974 2 , 947 , 75 9 2,976,041 3,002,616 3,026,557 Tangible Book Value per Share $ 10.02 $ 10.48 $ 10.98 $ 12.06 $ 13.09 $ 14.28 $ 16.79 $ 17 . 2 3 $ 17.43 $ 18.25 $ 18.32 2012 2013 2014 2015 2016 2017 2018 2019 6/30/2019 6/30/2020 Stockholders' Equity $ 79,047 $ 110,730 $ 116,559 $ 99,783 $ 104,426 $ 109,957 $ 154,482 $ 181,494 $ 163,645 $ 189,442 Intangible Assets - - - - - - (13,641) (12,953) (13,285) (12,645) Preferred Equity (20,000) (20,000) (20,000) - - - - - - - Tangible Common Equity $ 59 , 04 7 $ 90,730 $ 96,559 $ 99 , 78 3 $ 104 , 42 6 $ 109 , 95 7 $ 140 , 84 1 $ 168 , 54 1 $ 150,360 $ 176,797 Total Assets $ 981,639 $1,023,824 $1,082,878 $1,143,332 $1,334,257 $1,405,961 $1,689,227 $1,797,536 $1,756,448 $2 , 093 , 75 6 Intangible Assets - - - - - - (13,641) (12,953) ( 13 , 28 5 ) ( 12 , 64 5 ) Tangible Assets $ 981,639 $1,023,824 $1,082,878 $1,143,332 $1,334,257 $1,405,961 $1,675,586 $1,784,583 $1,743,163 $2 , 081 , 11 1 Shares Outstanding 3,052,416 4,647,407 4,702,715 4,645,429 4,633,868 4,649,658 5,577,559 5,900,249 5,582,438 5 , 911 , 71 5 Tangible Book Value per Share $ 19.34 $ 19.52 $ 20.53 $ 21.48 $ 22.54 $ 23.65 $ 25.25 $ 28.57 $ 26.93 $ 29 . 9 1 Tangible Common Equity/Tangible Assets 6 . 02 % 8.86% 8.92% 8.73% 7.83% 7.82% 8.41% 9.44% 8 . 63 % 8 . 50 % Source: Management and company filings. 21

Efficiency Ratio & Noninterest Expense and Net Operating Expense to Average Assets Non - GAAP Reconciliation ‘‘Efficiency ratio” is defined as recurring non - interest expense less foreclosed real estate (OREO) expenses and valuation allowances, less merger and acquisition costs, less amortization of intangible assets divided by operating revenue . Operating revenue is equal to net interest income plus non - interest income excluding gains and losses on securities and foreclosed real estate . In our judgment, the adjustments made to non - interest expense and operating revenue allow investors and analysts to better assess our operating expenses in relation to our core operating revenue by removing the volatility that is associated with certain one - time items and other discrete items that are unrelated to our core business . “Efficiency ratio as reported” is defined as non - interest expense divided by operating revenue . This is the ratio that appears in the Company’s SEC filings . (dollars in thousands, except share data) For the Years Ended YTD (1) Net operating expense is non - interest expense offset by non - interest income. 2015 2016 2017 2018 2019 6/30/2019 6/30/2020 Non - Interest Expense $ 28,418 $ 29,159 $ 30,097 $ 38,149 $ 36,233 $ 17,521 $ 19,080 OREO Valuation Allowance & Expenses ( 1 , 059 ) (861) ( 746 ) ( 657 ) ( 963 ) (488) (1,882) Merger Costs - - ( 829 ) ( 3 , 625 ) - - - Adjusted Non - Interest Expense (Numerator) $ 27 , 35 9 $ 28,298 $ 28 , 52 2 $ 33 , 86 7 $ 35 , 27 0 $ 17,033 $ 17,198 Source: Management and company filings. 22 Net Interest Income $ 36,528 $ 39,905 $ 43,388 $ 50,887 $ 53,534 $ 26,296 $ 29,577 Non - Interest Income 3 , 29 9 3,360 4,084 4,068 5,766 2 , 31 4 4 , 38 0 (Gains)/Losses on OREO Disposals 20 436 ( 43 ) 8 - - - Realized (Gains) Losses on Other Assets 407 ( 12 ) ( 47 ) ( 1 ) 1 - Unrealized (Gains) Losses on Equity Securities - - - 81 (134) ( 121 ) ( 115 ) Realized (Gains) Losses on Securities (4) (31) ( 175 ) - ( 226 ) - ( 441 ) Operaing Revenue (Denominator) $ 40,250 $ 43,658 $ 47 , 20 7 $ 55 , 04 3 $ 58 , 94 1 $ 28 , 48 9 $ 33 , 40 1 Average Assets $1,092,906 $1,229,470 $1,376,983 $1,603,393 $1,743,448 $1,710,253 $1,896,488 Reported Efficiency Ratio 71 . 4 % 67.4% 63 . 4 % 69 . 4 % 61 . 1 % 61 . 2 % 56 . 2 % Efficiency Ratio 68 . 0 % 64.8% 60 . 4 % 61 . 5 % 59 . 8 % 59 . 8 % 51 . 5 % Reported Non - interest Expense/Avg Assets 2 . 60 % 2.37% 2 . 19 % 2 . 38 % 2 . 08 % 2 . 05 % 2 . 01 % Operating Non - interest Expense/Avg Assets 2 . 50 % 2.30% 2 . 07 % 2 . 11 % 2 . 02 % 1 . 99 % 1 . 81 % Reported Net Operating Expense/Avg Assets (1) 2 . 30 % 2.10% 1 . 89 % 2 . 13 % 1 . 75 % 1 . 78 % 1 . 55 % Operating Net Operating Expense/Avg Assets (1) 2 . 16 % 2.00% 1 . 79 % 1 . 85 % 1 . 71 % 1 . 74 % 1 . 41 %

Operating Metrics – Excluding the Impact of the Tax Cuts and Jobs Act & One - Time Merger Costs During 2017 and 2018 , our operating results were impacted by one - time expenses related to our acquisition of County First Bank . During 2017 , the Tax Cut and Jobs Act of 2017 had a one - time impact to earnings in the fourth quarter of 2017 . We believe that investors would benefit from analyzing our profitability and expense metrics excluding these one - time items . Non - GAAP Reconciliation (dollars in thousands, except share data) For the Years Ended Y T D 2016 2017 2018 2019 6/30/2019 6/30/2020 Net Income (as reported) $ 7,331 $ 7,208 $ 11,228 $ 15,272 $ 7,504 $ 6 , 19 8 Tax Cuts and Jobs Act (net of tax) - 2,740 - - - - Merger Costs (net of tax) - 724 2,693 - - - Non - GAAP Operating Net Income $ 7,331 $ 10,672 $ 13,921 $ 15,272 $ 7,504 $ 6 , 19 8 Reported Return on Average Assets 0 . 60 % 0 . 52 % 0 . 70 % 0 . 88 % 0 . 88 % 0 . 65 % Operating Return on Average Assets 0 . 60 % 0 . 78 % 0 . 87 % 0 . 88 % 0 . 88 % 0 . 65 % Reported Return on Average Common Equity 7 . 09 % 6 . 55 % 7 . 53 % 9 . 32 % 9 . 41 % 6 . 64 % Operating Return on Average Common Equity 7 . 09 % 9 . 70 % 9 . 33 % 9 . 32 % 9 . 41 % 6 . 64 % Reported Diluted Earnings Per Share $ 1.59 $ 1.56 $ 2.02 $ 2.75 $ 1.35 $ 1 . 0 5 Operating Diluted Earnings Per Share $ 1.59 $ 2.31 $ 2.51 $ 2.75 $ 1.35 $ 1 . 0 5 Average Assets $1,229,470 $1,376,983 $1,603,393 $1,743,448 $1,710,253 $ 1 , 896 , 48 8 Average Equity 103,397 109 , 97 9 149,128 163,936 159,420 186 , 58 0 Weighted Average Common Shares Outstanding 4,599,502 4,629,228 5,550,510 5,560,588 5,558,984 5 , 890 , 60 7 Source: Management and company filings. 23

Pre - Tax Pre - Provision (“PTPP”) Income ROAA and ROACE Non - GAAP Reconciliation We believe that pre - tax pre - provision income, which reflects our profitability before income taxes and loan loss provisions, allows investors to better assess our operating income and expenses in relation to our core operating revenue by removing the volatility that is associated with credit provisions and different state income tax rates for comparable institutions. We also believe that during a crisis such as the COVID - 19 pandemic, this information is useful as the impact of the pandemic on the loan loss provisions of various institutions will likely vary based on the geography of the communities served by a particular institution. (dollars in thousands) For the Years Ended Y T D 2016 2017 2018 2019 6/30/2019 6/30/2020 Net Income (as reported) $ 7,331 $ 7,208 $ 11 , 22 8 $ 15,272 $ 7,504 $ 6,198 Loan Loss Provision 2 , 35 9 1 , 01 0 1 , 40 5 2 , 13 0 875 7 , 60 0 Income Taxes 4 , 41 6 9 , 15 7 4 , 17 3 5 , 66 5 2 , 71 0 1 , 07 9 Non - GAAP PTPP Income $ 14,106 $ 17,375 $ 16 , 80 6 $ 23,067 $ 11,089 $ 14,877 PTPP ROAA 1 . 15 % 1 . 26 % 1 . 05 % 1 . 32 % 1 . 30 % 1 . 57 % PTPP ROACE 13 . 64 % 15 . 80 % 11 . 27 % 14 . 07 % 13 . 91 % 15 . 95 % Average Assets $ 1,229,471 $ 1,376,983 $ 1,603,393 $ 1,743,448 $ 1,710,253 $ 1,896,488 Average Equity $ 103,397 $ 109,979 $ 149 , 12 8 $ 163,936 $ 159,420 $ 186,580 Source: Management and company filings. 24

Executive Team – Holding Company (TCFC) & Bank (CBTC) William J. Pasenelli x EVP and President of Bank x Joined in 2005 x Former EVP and Senior Loan Officer at Mercantile Southern Maryland Bank x President and Chief Executive Officer x Joined in 2000 x Former CFO of Acacia Federal Savings Bank (1987 - 2000) James M. Burke Todd L. Capitani x EVP and Chief Financial Officer x Joined in 2009 x Former Senior Manager with Deloitte Consulting and CFO of Ruesch International, Inc. Christy M. Lombardi x EVP, Chief Operating Officer and Corporate Secretary x Joined in 1998 x Oversees human resources and shareholder relations 25

Executive Team – Bank (CBTC) B. Scot Ebron x EVP and Maryland Chief Market Banking Officer x Joined in 2003 x Market Banking Officer and oversight of Community Wealth Advisors x EVP and Virginia Chief Market Banking Officer x Joined in 2018 x Market Banking Officer and oversight of Retail Sales Team Patrick D. Pierce John A. Chappelle x EVP and Chief Digital Banking Officer x Joined in 2007 x Digital and online banking channels and oversight of Commercial Services Team Lacey A. Pierce x EVP and Chief Administrative Affairs Officer x Joined in 2007 x Corporate administration and oversight of Marketing, Lending Services and Facilities Talal Tay x EVP and Chief Risk Officer x Joined in 2018 x Enterprise risk management and oversight of Credit and Compliance 26