Attached files
| file | filename |
|---|---|
| EX-99.3 - EXHIBIT 99.3 - FIRST BANCSHARES INC /MS/ | a52256519ex99_3.htm |
| EX-99.1 - EXHIBIT 99.1 - FIRST BANCSHARES INC /MS/ | a52256519ex99_1.htm |
| 8-K - THE FIRST BANCSHARES, INC. 8-K - FIRST BANCSHARES INC /MS/ | a52256519.htm |
Exhibit 99.2

July 2020 NASDAQ: FBMS
This slide presentation and certain of our other filings with the Securities and Exchange Commission
contain statements that constitute “forward-looking statements” within the meaning of, and subject to the protections of, Section 27A of the Securities Act of 1933, as amended, and Section 21E of the Securities Exchange Act of 1934, as amended.
All statements other than statements of historical fact are forward-looking statements. Such statements can generally be identified by such words as “believes,” “anticipates,” “expects,” “may,” “will,” “assumes,” “should,” “predicts,” “could,”
“would,” “intends,” “targets,” “estimates,” “projects,” “plans,” “potential” and other similar words and expressions of the future or otherwise regarding the outlook for the Company’s future business and financial performance and/or the
performance of the banking industry and economy in general. Prospective investors are cautioned that any such forward-looking statements are not guarantees of future performance and involve known and unknown risks and uncertainties which may
cause the actual results, performance or achievements of the Company to be materially different from the future results, performance or achievements expressed or implied by such forward-looking statements. Forward-looking statements are based
on the information known to, and current beliefs and expectations of, the Company’s management and are subject to significant risks and uncertainties. Actual results may differ materially from those contemplated by such forward-looking
statements. Factors that might cause such differences include, but are not limited to: (1) competitive pressures among financial institutions increasing significantly; (2) changes in economic or political conditions, either nationally or
locally, particularly in areas in which the Company conducts operations; (3) interest rate risk; (4) changes in applicable laws, rules, or regulations, including changes to statutes, regulations or regulatory policies or practices as a result
of, or in response to COVID-19; (5) risks related to the Company’s recently completed acquisitions, including that the anticipated benefits from the recently completed acquisitions are not realized in the time frame anticipated or at all as a
result of changes in general economic and market conditions or other unexpected factors or events; (6) changes in management’s plans for the future; (7) credit risk associated with our lending activities; changes in interest rates, loan demand,
real estate values, or competition; (8) changes in accounting principles, policies, or guidelines; (9) adverse results from current or future litigation, regulatory examinations or other legal and/or regulatory actions, including as a result of
the Company’s participation in and execution of government programs related to the COVID-19 pandemic; (10) the impact of the COVID-19 pandemic on the Company’s assets, business, cash flows, financial condition, liquidity, prospects and results
of operations; (11) potential increases in the provision for loan losses resulting from the COVID-19 pandemic; and (12) other general competitive, economic, political, and market factors, including those affecting our business, operations,
pricing, products, or services. These and other factors that could cause results to differ materially from those described in the forward-looking statements, as well as a discussion of the risks and uncertainties that may affect our business,
can be found in our Annual Report on Form 10-K and in other filings we make with the Securities and Exchange Commission, which are available on the SEC’s website, http://www.sec.gov. Undue reliance should not be placed on forward-looking
statements. The Company disclaims any obligation to update such factors or to publicly announce the results of any revisions to any of the forward-looking statements included herein to reflect future events or developments. Statements about the
potential effects of the COVID-19 pandemic on the Company’s assets, business, liquidity, financial condition, prospects, and results of operations may constitute forward-looking statements and are subject to the risks that the actual effects
may differ, possibly materially, from what is reflected in these forward-looking statements due to factors and future developments that are uncertain, unpredictable and in many cases beyond our control, including the depth, dispersion and
duration of the pandemic, actions taken by governmental authorities in response to the pandemic, and the direct and indirect impact of the pandemic on customers, employees, third parties and the Company. 2 Forward Looking Statement
The First Bancshares: Building Shareholder Value 3
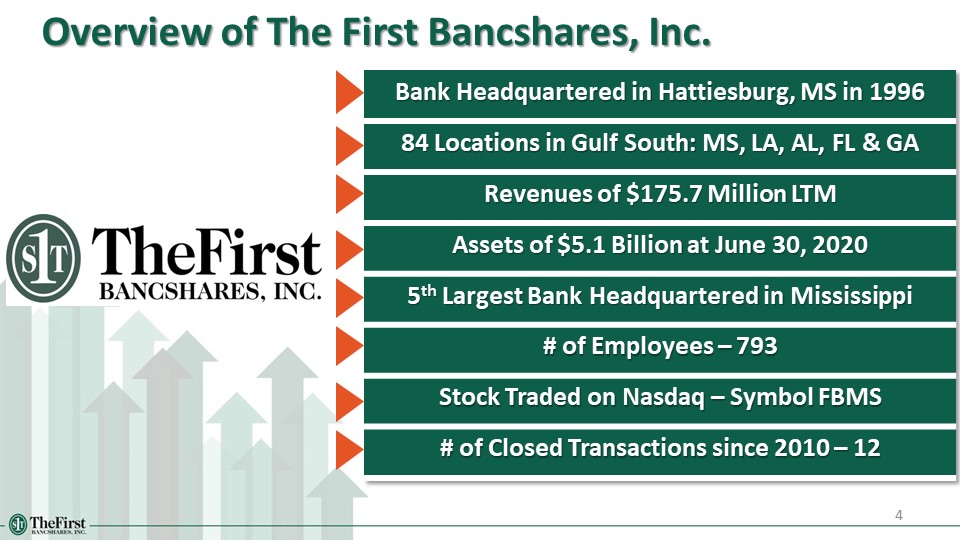
Overview of The First Bancshares, Inc. 4 Bank Headquartered in Hattiesburg, MS in 1996 84 Locations
in Gulf South: MS, LA, AL, FL & GA Revenues of $175.7 Million LTM Assets of $5.1 Billion at June 30, 2020 5th Largest Bank Headquartered in Mississippi # of Employees – 793 Stock Traded on Nasdaq – Symbol FBMS # of Closed
Transactions since 2010 – 12
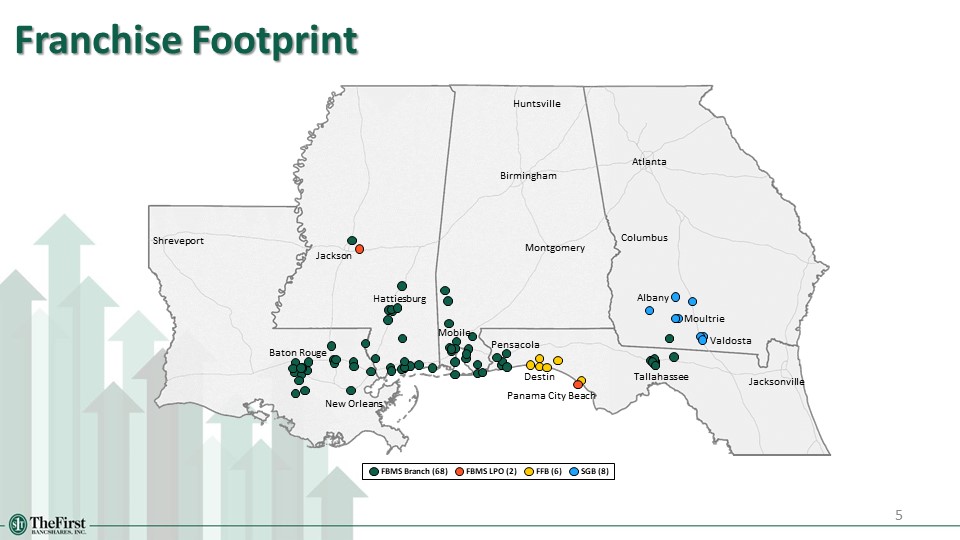
Franchise Footprint FBMS Branch (68) SGB (8) FBMS LPO (2) FFB
(6) Jackson Mobile Baton Rouge Tallahassee New
Orleans Columbus Shreveport Jacksonville Destin Pensacola Albany Moultrie Valdosta Panama City Beach Birmingham Huntsville Montgomery Atlanta Hattiesburg 5
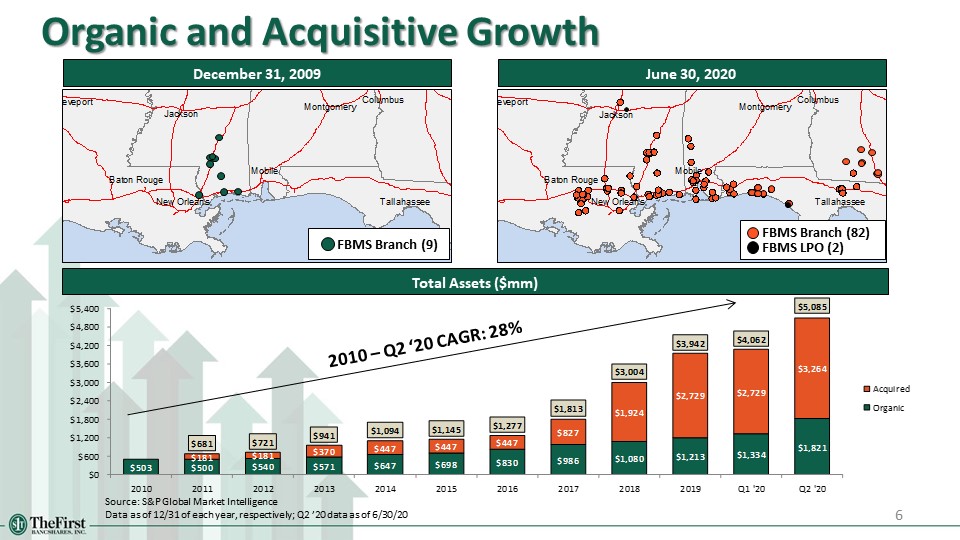
Organic and Acquisitive Growth December 31, 2009 June 30, 2020 Total Assets ($mm) 2010 – Q2
‘20 CAGR: 28% Source: S&P Global Market IntelligenceData as of 12/31 of each year, respectively; Q2 ’20 data as of 6/30/20 FBMS Branch (9) FBMS Branch (82) FBMS LPO (2) 6
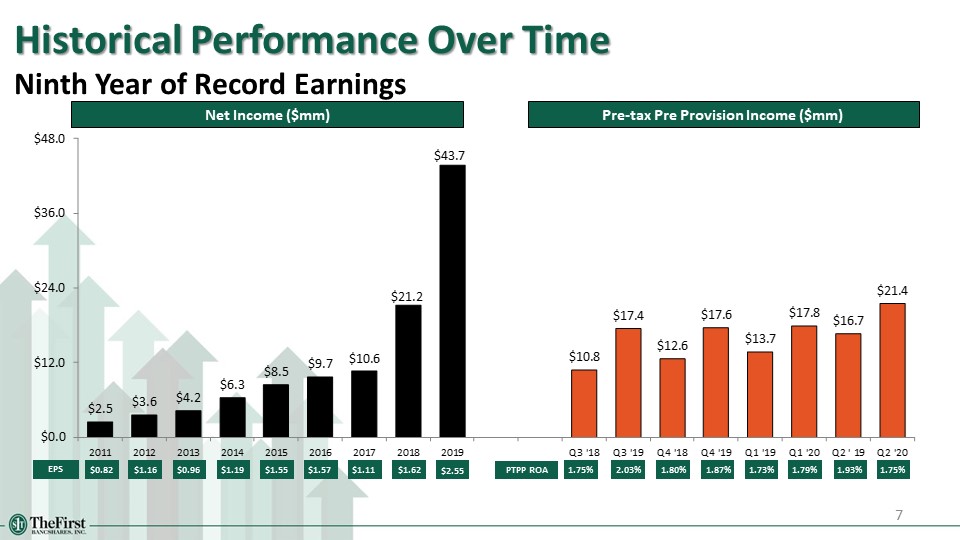
Historical Performance Over TimeNinth Year of Record Earnings EPS Net Income
($mm) $0.82 $1.16 $0.96 $1.19 $1.55 $1.57 $1.11 $1.62 1.75% 2.03% 1.80% 1.93% 1.87% 1.73% 1.79% 1.75% $2.55 7 Pre-tax Pre Provision Income ($mm) PTPP ROA
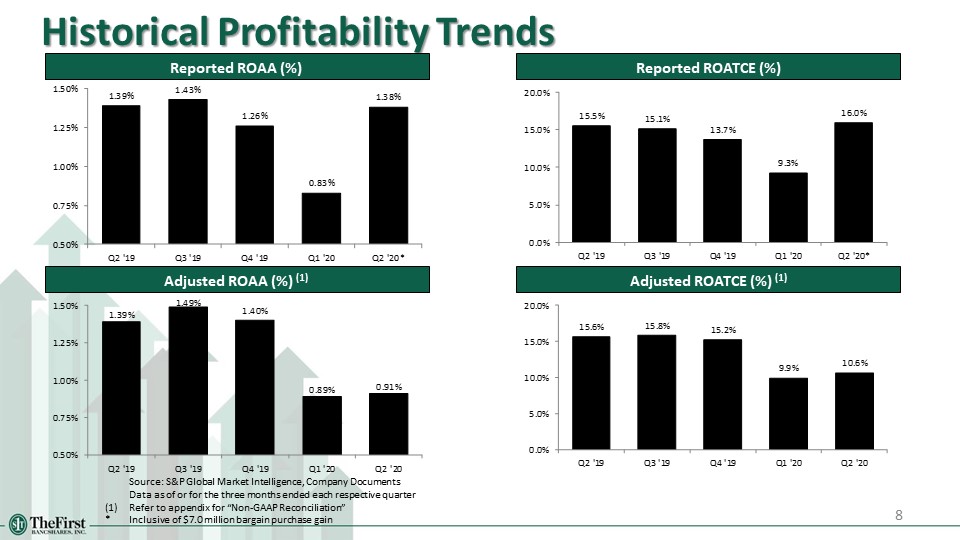
Historical Profitability Trends 8 Reported ROAA (%) Source: S&P Global Market Intelligence,
Company Documents Data as of or for the three months ended each respective quarter(1) Refer to appendix for “Non-GAAP Reconciliation” * Inclusive of $7.0 million bargain purchase gain Adjusted ROAA (%) (1) Reported ROATCE (%) Adjusted ROATCE
(%) (1)
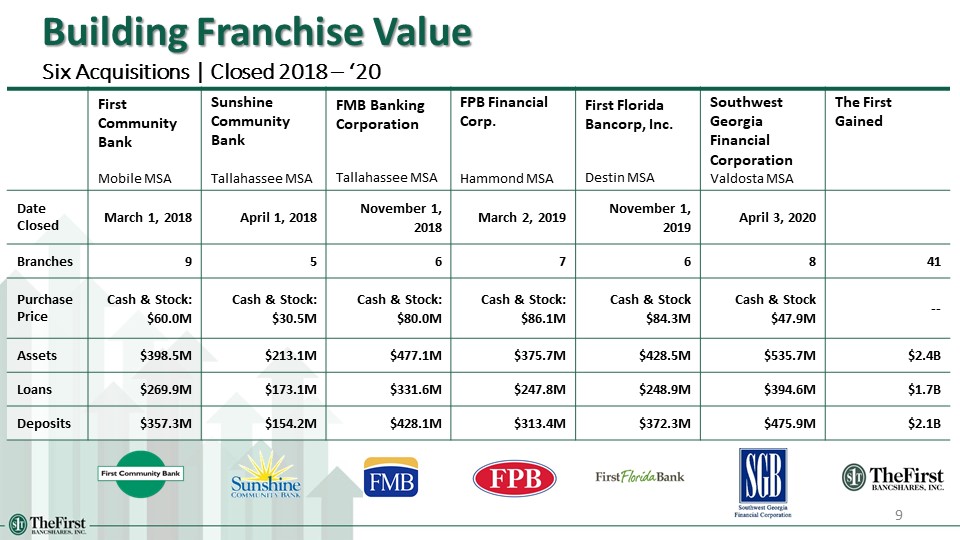
9 First Community BankMobile MSA Sunshine Community BankTallahassee MSA FMB Banking
CorporationTallahassee MSA FPB FinancialCorp.Hammond MSA First Florida Bancorp, Inc.Destin MSA Southwest Georgia Financial CorporationValdosta MSA The First Gained Date Closed March 1, 2018 April 1, 2018 November 1, 2018 March 2,
2019 November 1, 2019 April 3, 2020 Branches 9 5 6 7 6 8 41 Purchase Price Cash & Stock: $60.0M Cash & Stock: $30.5M Cash & Stock: $80.0M Cash & Stock: $86.1M Cash & Stock $84.3M Cash & Stock
$47.9M -- Assets $398.5M $213.1M $477.1M $375.7M $428.5M $535.7M $2.4B Loans $269.9M $173.1M $331.6M $247.8M $248.9M $394.6M $1.7B Deposits $357.3M $154.2M $428.1M $313.4M $372.3M $475.9M $2.1B Building Franchise
ValueSix Acquisitions | Closed 2018 – ‘20
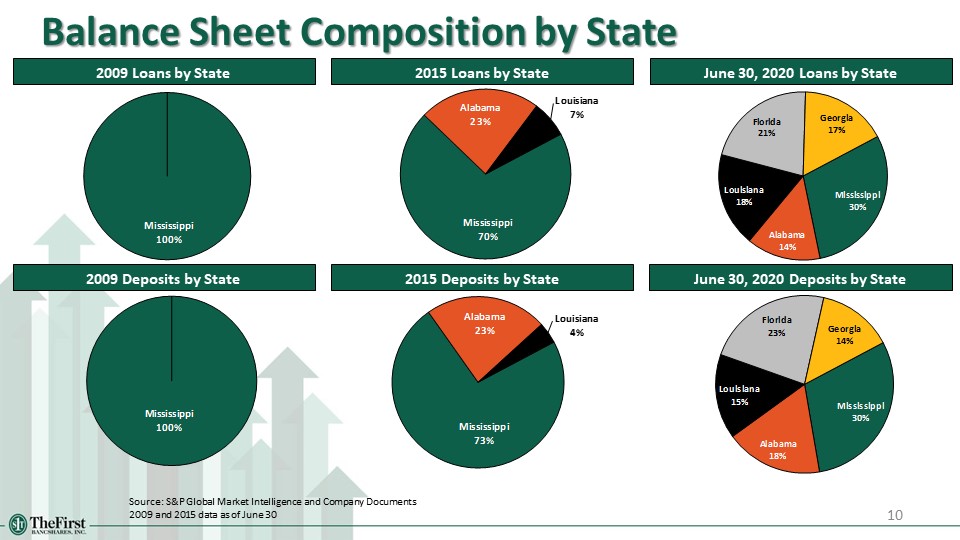
Balance Sheet Composition by State 10 2015 Deposits by State June 30, 2020 Deposits by State Source:
S&P Global Market Intelligence and Company Documents 2009 and 2015 data as of June 30 2015 Loans by State June 30, 2020 Loans by State 2009 Loans by State 2009 Deposits by State
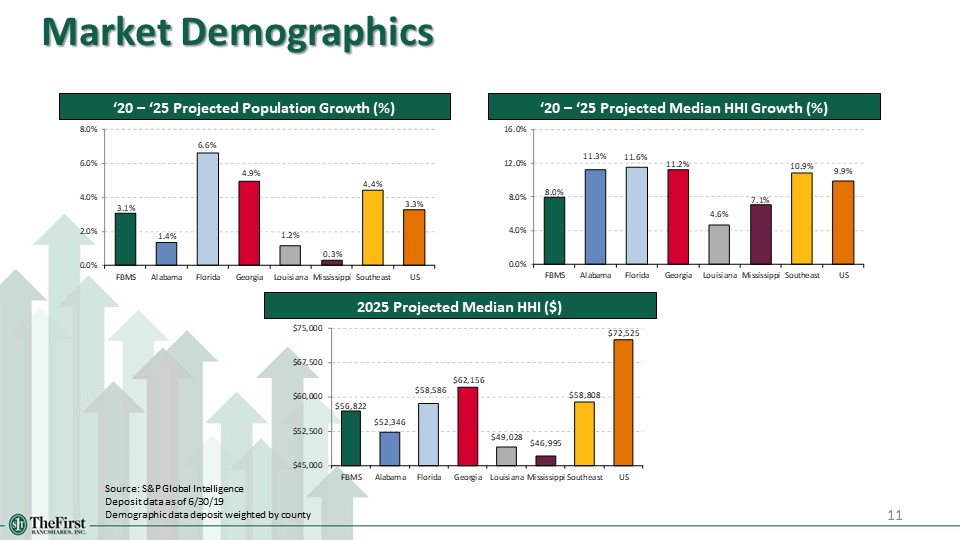
Market Demographics 11 ‘20 – ‘25 Projected Population Growth (%) ‘20 – ‘25 Projected Median HHI Growth
(%) 2025 Projected Median HHI ($) Source: S&P Global IntelligenceDeposit data as of 6/30/19Demographic data deposit weighted by county
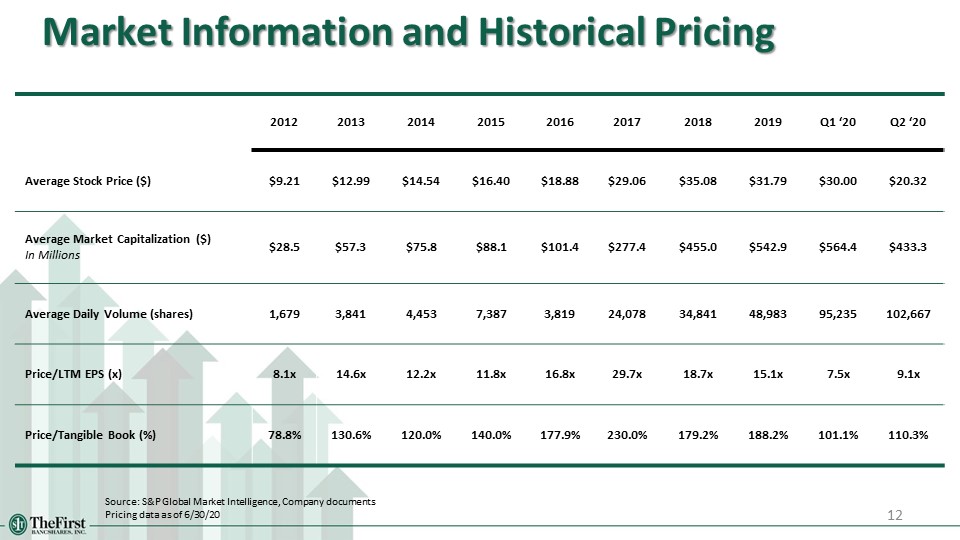
12 2012 2013 2014 2015 2016 2017 2018 2019 Q1 ‘20 Q2 ‘20 Average Stock Price
($) $9.21 $12.99 $14.54 $16.40 $18.88 $29.06 $35.08 $31.79 $30.00 $20.32 Average Market Capitalization ($)In Millions $28.5 $57.3 $75.8 $88.1 $101.4 $277.4 $455.0 $542.9 $564.4 $433.3 Average Daily Volume
(shares) 1,679 3,841 4,453 7,387 3,819 24,078 34,841 48,983 95,235 102,667 Price/LTM EPS (x) 8.1x 14.6x 12.2x 11.8x 16.8x 29.7x 18.7x 15.1x 7.5x 9.1x Price/Tangible Book
(%) 78.8% 130.6% 120.0% 140.0% 177.9% 230.0% 179.2% 188.2% 101.1% 110.3% Market Information and Historical Pricing Source: S&P Global Market Intelligence, Company documentsPricing data as of 6/30/20
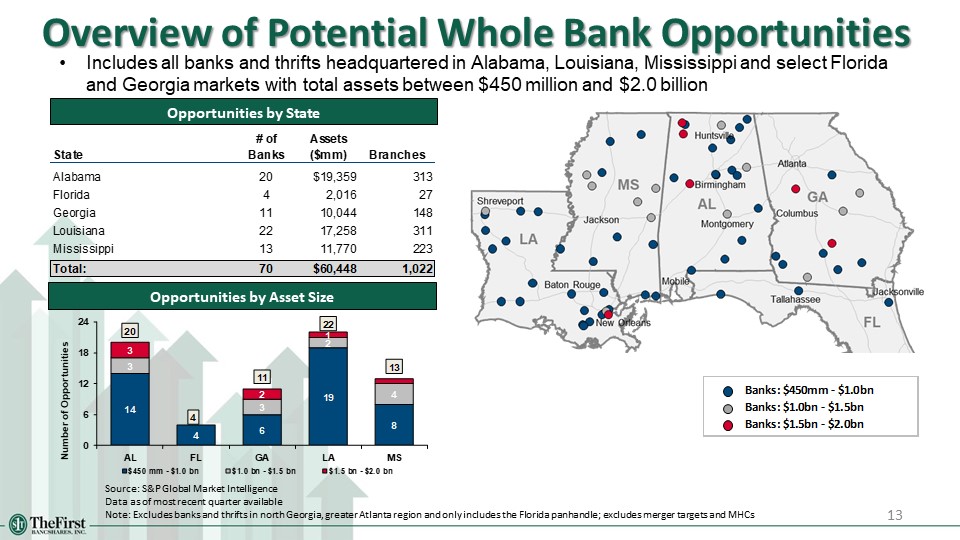
13 Overview of Potential Whole Bank Opportunities Source: S&P Global Market IntelligenceData
as of most recent quarter availableNote: Excludes banks and thrifts in north Georgia, greater Atlanta region and only includes the Florida panhandle; excludes merger targets and MHCs Opportunities by State Opportunities by Asset
Size Includes all banks and thrifts headquartered in Alabama, Louisiana, Mississippi and select Florida and Georgia markets with total assets between $450 million and $2.0 billion
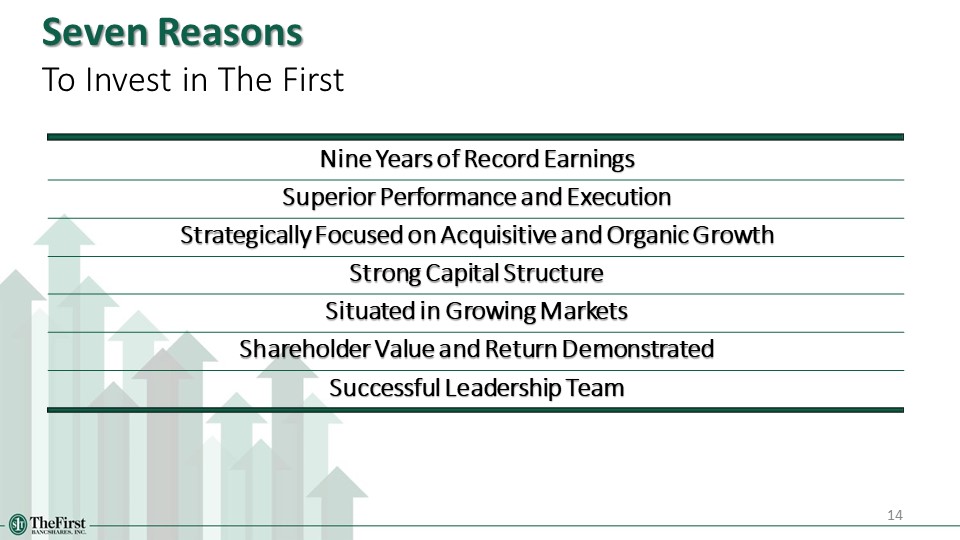
Nine Years of Record Earnings Superior Performance and Execution Strategically Focused on Acquisitive
and Organic Growth Strong Capital Structure Situated in Growing Markets Shareholder Value and Return Demonstrated Successful Leadership Team 14 Seven ReasonsTo Invest in The First
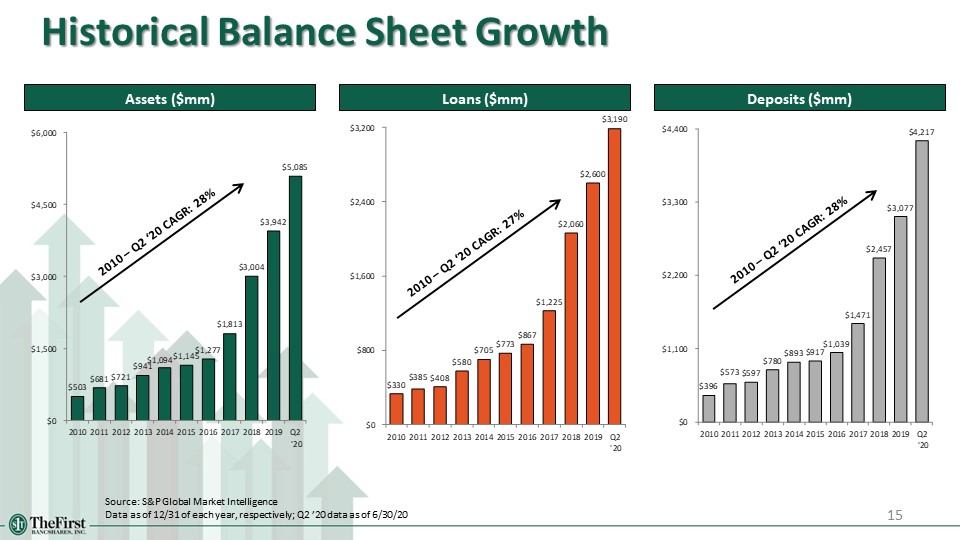
Historical Balance Sheet Growth 15 Assets ($mm) Source: S&P Global Market IntelligenceData as of
12/31 of each year, respectively; Q2 ’20 data as of 6/30/20 Loans ($mm) Deposits ($mm) 2010 – Q2 ‘20 CAGR: 28% 2010 – Q2 ‘20 CAGR: 27% 2010 – Q2 ‘20 CAGR: 28%
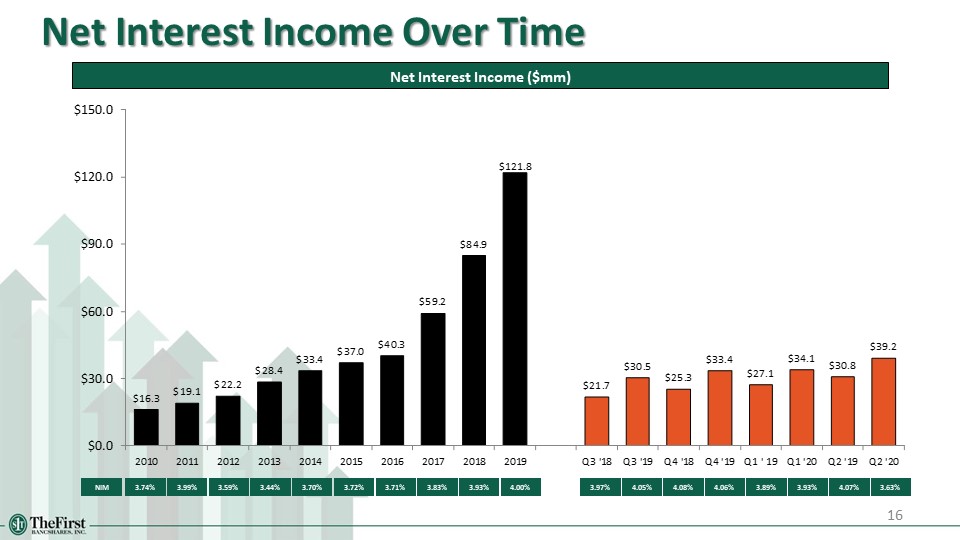
Net Interest Income Over Time 16 3.74% 3.99% 3.59% 3.44% 3.70% 3.72% 3.71% 3.97% 4.08% Net
Interest Income ($mm) NIM 4.05% 3.83% 3.93% 4.06% 3.89% 3.93% 4.07% 3.63% 4.00%
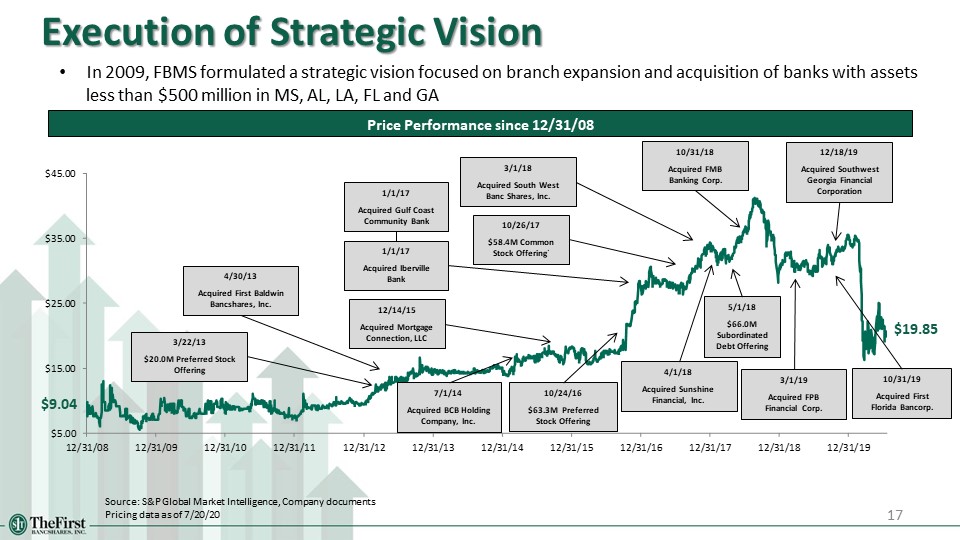
Execution of Strategic Vision 17 Source: S&P Global Market Intelligence, Company documentsPricing
data as of 7/20/20 Price Performance since 12/31/08 In 2009, FBMS formulated a strategic vision focused on branch expansion and acquisition of banks with assets less than $500 million in MS, AL, LA, FL and GA $9.04 $19.85 3/22/13$20.0M
Preferred Stock Offering 4/30/13Acquired First Baldwin Bancshares, Inc. 7/1/14Acquired BCB Holding Company, Inc. 12/14/15Acquired Mortgage Connection, LLC 10/24/16$63.3M Preferred Stock Offering 1/1/17Acquired Gulf Coast Community
Bank 1/1/17Acquired Iberville Bank 10/26/17$58.4M Common Stock Offering` 3/1/18Acquired South West Banc Shares, Inc. 4/1/18Acquired Sunshine Financial, Inc. 5/1/18$66.0M Subordinated Debt Offering 10/31/18Acquired FMB Banking
Corp. 3/1/19Acquired FPB Financial Corp. 10/31/19 Acquired First Florida Bancorp. 12/18/19 Acquired Southwest Georgia Financial Corporation
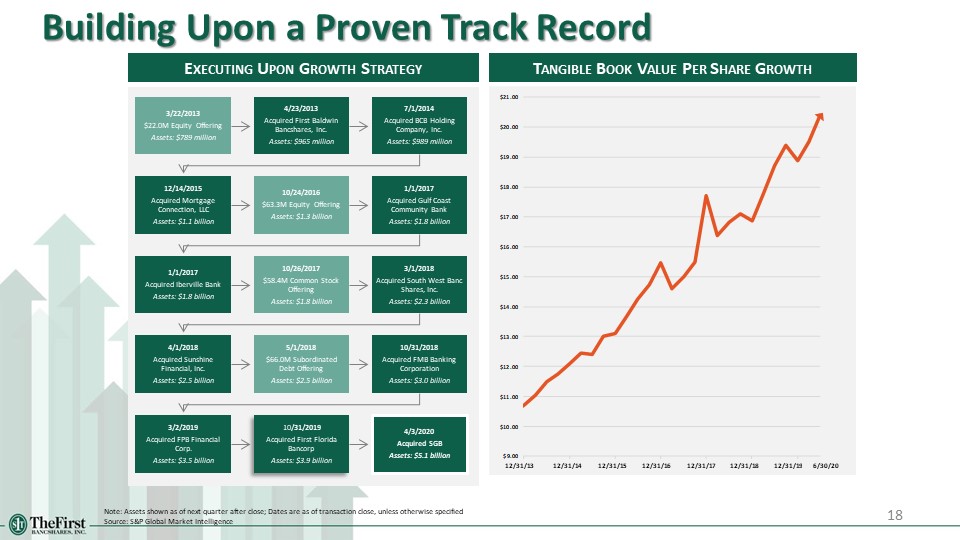
Note: Assets shown as of next quarter after close; Dates are as of transaction close, unless otherwise
specifiedSource: S&P Global Market Intelligence Executing Upon Growth Strategy Tangible Book Value Per Share Growth 18 Building Upon a Proven Track
Record 12/31/19 12/31/18 12/31/17 12/31/16 12/31/15 12/31/14 12/31/13 6/30/20
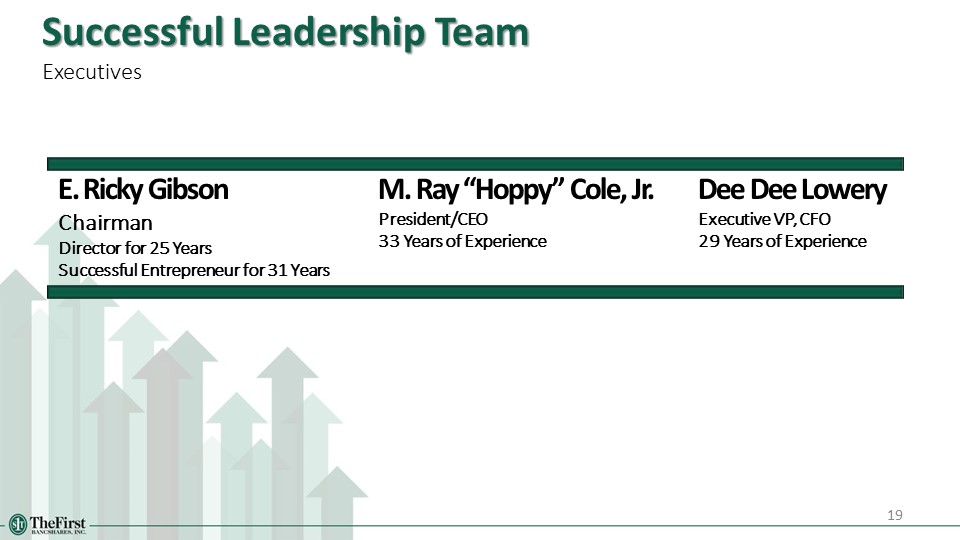
19 Successful Leadership TeamExecutives E. Ricky GibsonChairmanDirector for 25 YearsSuccessful
Entrepreneur for 31 Years M. Ray “Hoppy” Cole, Jr.President/CEO33 Years of Experience Dee Dee LoweryExecutive VP, CFO29 Years of Experience
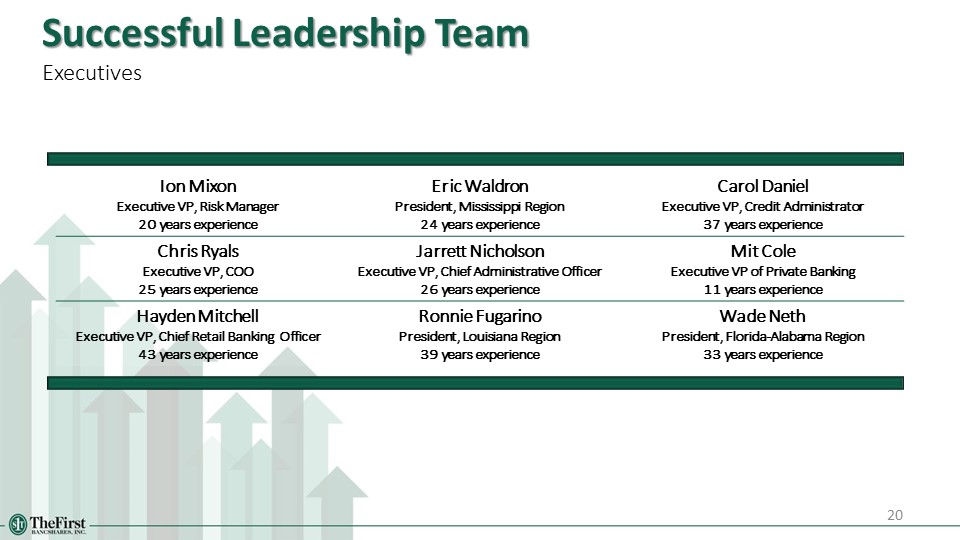
Ion MixonExecutive VP, Risk Manager20 years experience Eric WaldronPresident, Mississippi Region24 years
experience Carol DanielExecutive VP, Credit Administrator37 years experience Chris RyalsExecutive VP, COO25 years experience Jarrett NicholsonExecutive VP, Chief Administrative Officer26 years experience Mit ColeExecutive VP of Private
Banking11 years experience Hayden MitchellExecutive VP, Chief Retail Banking Officer 43 years experience Ronnie FugarinoPresident, Louisiana Region39 years experience Wade NethPresident, Florida-Alabama Region33 years
experience 20 Successful Leadership TeamExecutives
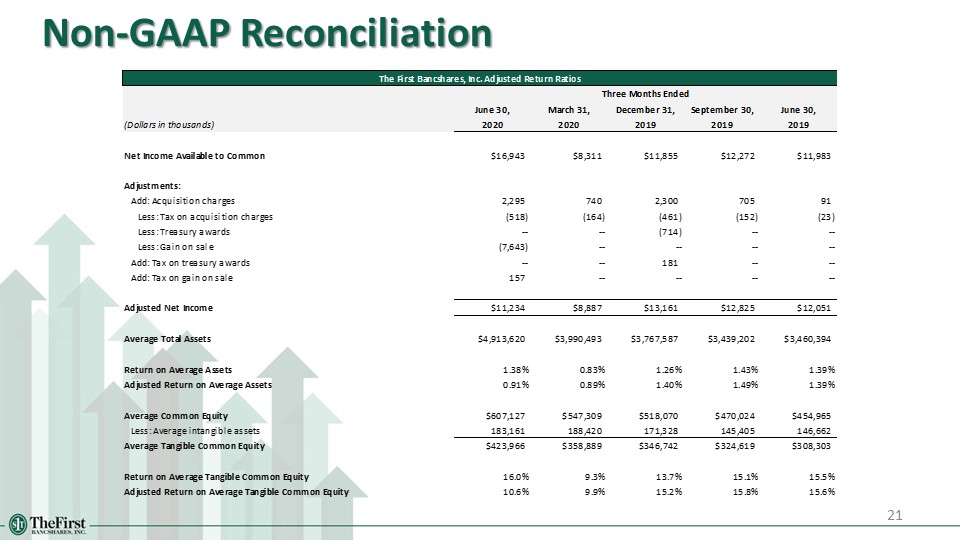
21 Non-GAAP Reconciliation