Attached files
| file | filename |
|---|---|
| 8-K - 8-K - CITY HOLDING CO | a8-kkbwpres.htm |

City Holding Company KBW Community Bank Investor Conference July 28-July 30, 2020
Forward looking statements • This presentation contains certain forward-looking statements that are included pursuant to the safe harbor provisions of the Private Securities Litigation Reform Act of 1995. Such information involves risks and uncertainties that could result in the Company's actual results differing from those projected in the forward-looking statements. Factors that could cause actual results to differ from those discussed in such forward-looking statements include, but are not limited to those set forth in the Company’s Annual Report on Form 10-K for the fiscal year ended December 31, 2018 under “ITEM 1A Risk Factors” and the following: (1) general economic conditions, especially in the communities and markets in which we conduct our business; (2) the uncertainties on the Company’s business, results of operations and financial condition, caused by the COVID-19 pandemic, which will depend on several factors, including the scope and duration of the pandemic, its continued influence on financial markets, the effectiveness of the Company’s work from home arrangements and staffing levels in operational facilities, the impact of market participants on which the Company relies and actions taken by governmental authorities and other third parties in response to the pandemic; (3) credit risk, including risk that negative credit quality trends may lead to a deterioration of asset quality, risk that our allowance for loan losses may not be sufficient to absorb actual losses in our loan portfolio, and risk from concentrations in our loan portfolio; (4) changes in the real estate market, including the value of collateral securing portions of our loan portfolio; (5) changes in the interest rate environment; (6) operational risk, including cybersecurity risk and risk of fraud, data processing system failures, and network breaches; (7) changes in technology and increased competition, including competition from non-bank financial institutions; (8) changes in consumer preferences, spending and borrowing habits, demand for our products and services, and customers’ performance and creditworthiness; (9) difficulty growing loan and deposit balances; (10) our ability to effectively execute our business plan, including with respect to future acquisitions; (11) changes in regulations, laws, taxes, government policies, monetary policies and accounting policies affecting bank holding companies and their subsidiaries; (12) deterioration in the financial condition of the U.S. banking system may impact the valuations of investments the Company has made in the securities of other financial institutions; (13) regulatory enforcement actions and adverse legal actions; (14) difficulty attracting and retaining key employees; (15) other economic, competitive, technological, operational, governmental, regulatory, and market factors affecting our operations. Forward-looking statements made herein reflect management's expectations as of the date such statements are made. Such information is provided to assist stockholders and potential investors in understanding current and anticipated financial operations of the Company and is included pursuant to the safe harbor provisions of the Private Securities Litigation Reform Act of 1995. The Company undertakes no obligation to update any forward-looking statement to reflect events or circumstances that arise after the date such statements are made. 2

City was very proud to recently announce that for the 3rd consecutive year, we were awarded the highest ranking in customer satisfaction in the North Central District by JD Power (IN, OH, KY, MI, WV). 2018 2019 2020 3
Presenters: Skip Hageboeck CEO & President David Bumgarner EVP & CFO Tim Quinlan Retail Banking Executive 4
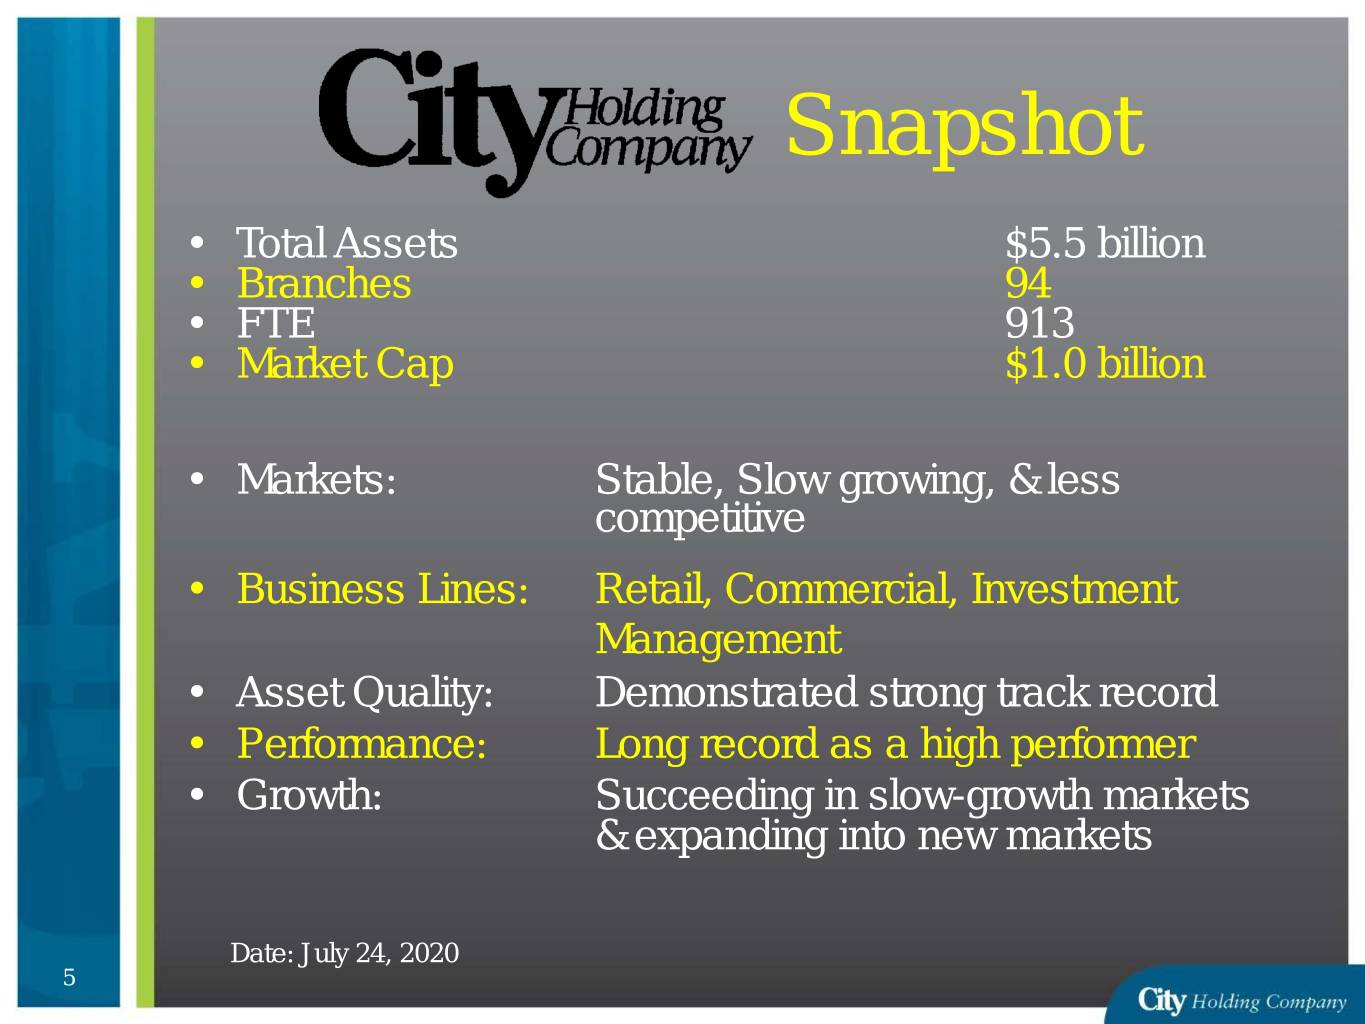
Snapshot • Total Assets $5.5 billion • Branches 94 • FTE 913 • Market Cap $1.0 billion • Markets: Stable, Slow growing, & less competitive • Business Lines: Retail, Commercial, Investment Management • Asset Quality: Demonstrated strong track record • Performance: Long record as a high performer • Growth: Succeeding in slow-growth markets & expanding into new markets Date: July 24, 2020 5

Deposits mostly in WV and E. KY Key Deposit Markets Deposits West Virginia & E. Kentucky – dating to 1870 76% New Markets 24% 6
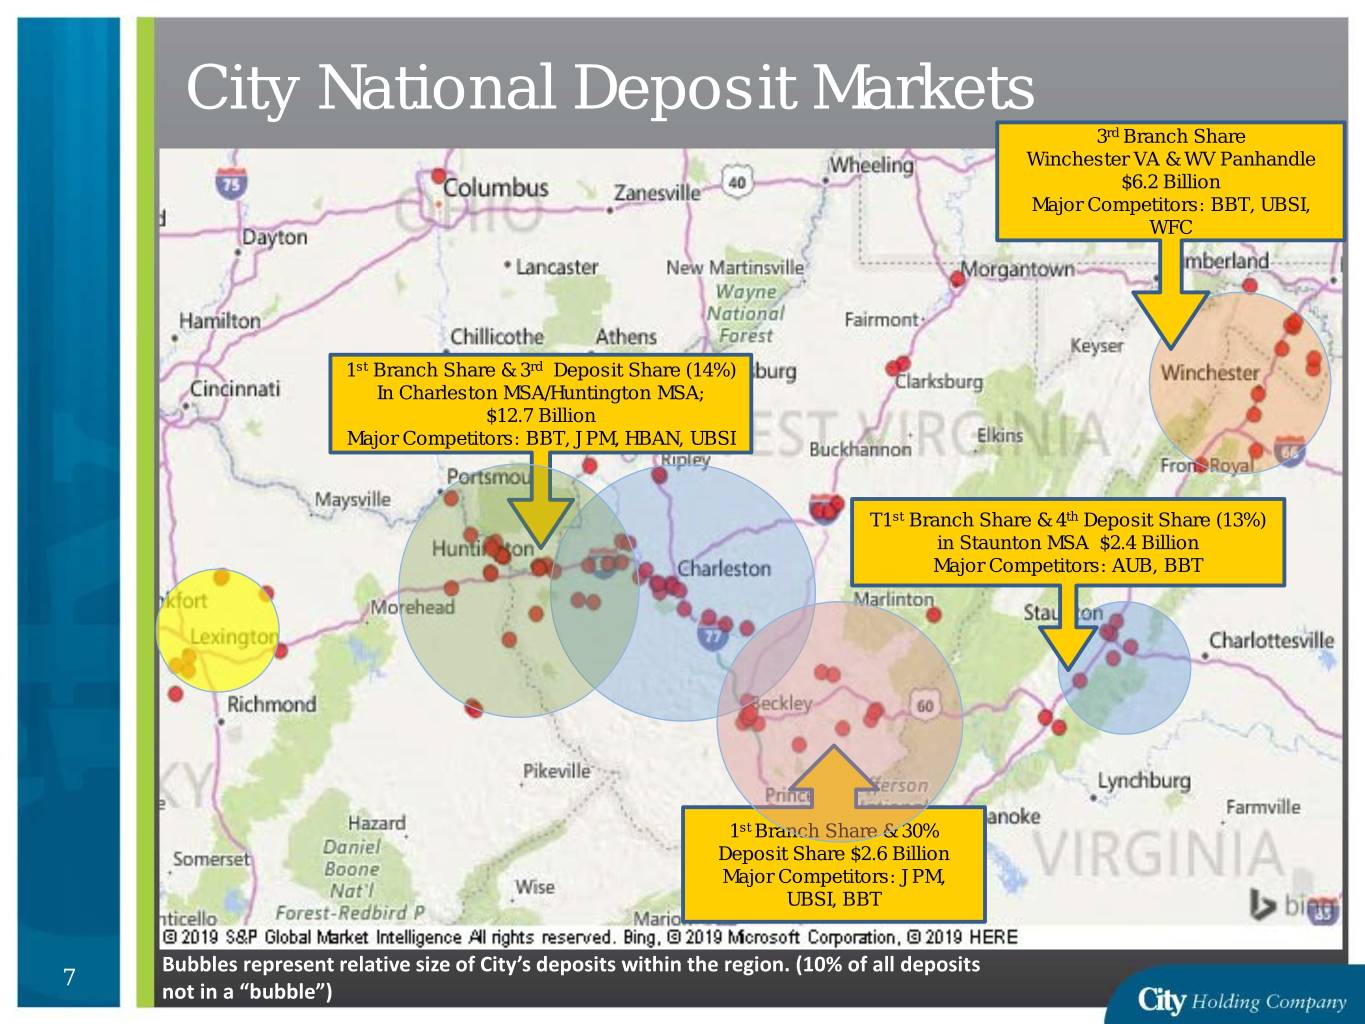
City National Deposit Markets 3rd Branch Share Winchester VA & WV Panhandle $6.2 Billion Major Competitors: BBT, UBSI, WFC 1st Branch Share & 3rd Deposit Share (14%) In Charleston MSA/Huntington MSA; $12.7 Billion Major Competitors: BBT, JPM, HBAN, UBSI T1st Branch Share & 4th Deposit Share (13%) in Staunton MSA $2.4 Billion Major Competitors: AUB, BBT 1st Branch Share & 30% Deposit Share $2.6 Billion Major Competitors: JPM, UBSI, BBT Bubbles represent relative size of City’s deposits within the region. (10% of all deposits 7 not in a “bubble”)

Diversified Commercial Loan Portfolio Percent of Commercial Key Loan Markets Portfolio West Virginia & Eastern Kentucky – dating to 1870 47% Virginia/Eastern Panhandle Markets – acquired 15% 2012/13 Charlotte LPO – de novo 2006 9% Lexington, KY – acquired 2015 17% Columbus, OH & Pittsburgh PA 12% 8
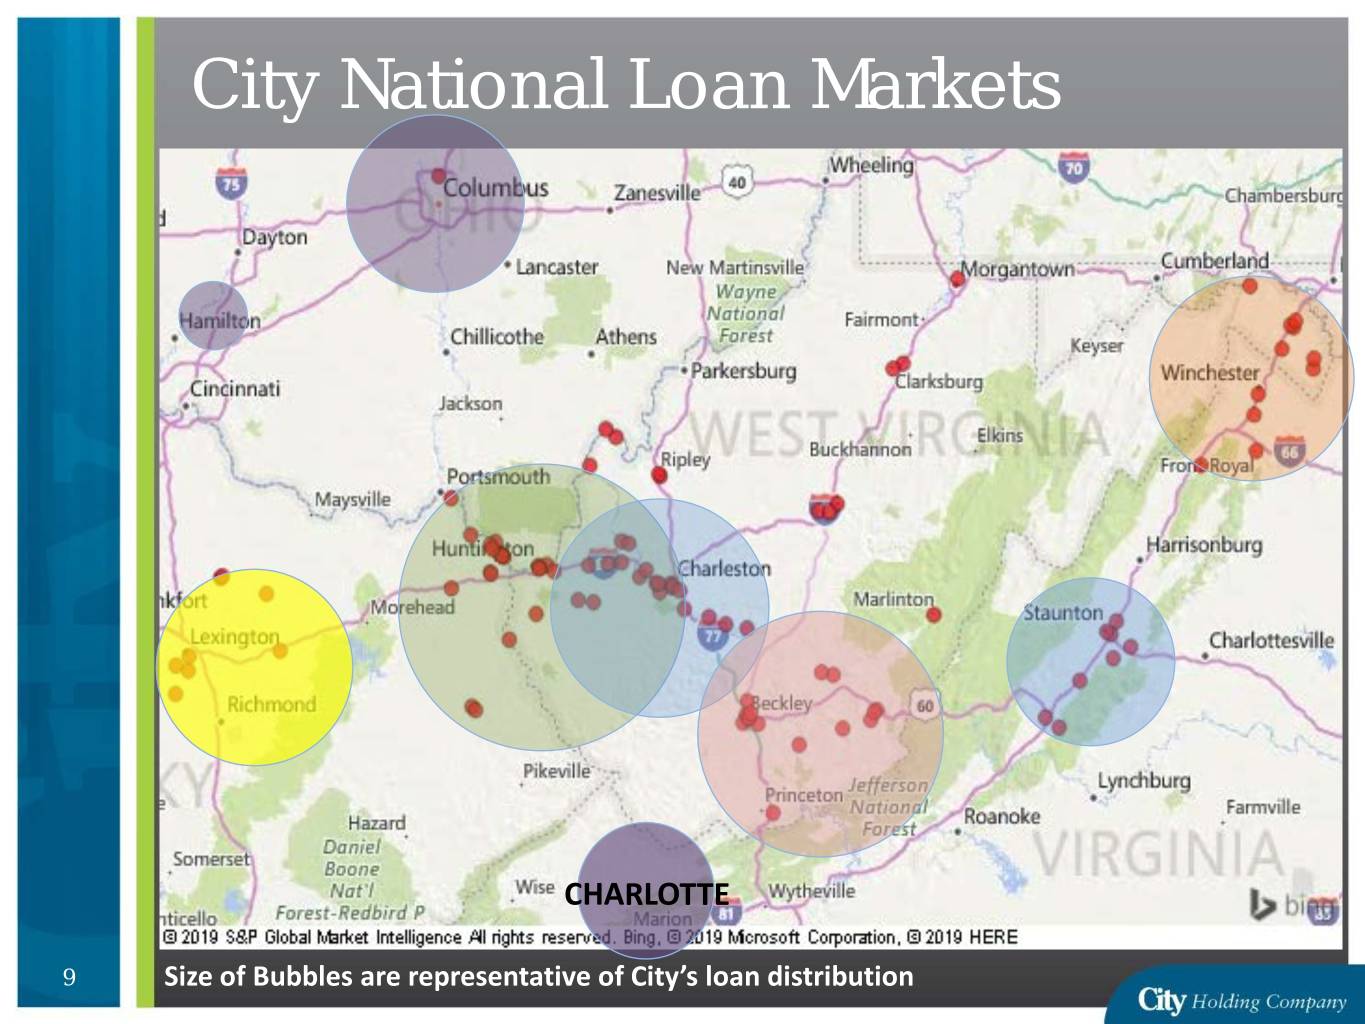
City National Loan Markets CHARLOTTE 9 Size of Bubbles are representative of City’s loan distribution

Market Position City’s biggest markets have strong distribution, large share, and high profitability Deposits Deposit Branch Branch Market Population ($mm) Share Branches Share Rank Charleston/Huntington /Ashland MSA 611,000 $1,729 14% 36 20% 1 Beckley/Lewisburg WV 162,000 783 30% 16 25% 1 Winchester/ Martinsburg 397,000 424 7% 11 10% 3 Valley Region 160,000 270 11% 8 15% 1 (tie) Lexington KY Region 430,000 259 3% 7 4% 9 Note: Green highlight indicates market expansion as a result of acquisitions. Data: S&P Global MI – regions modified slightly to fit City’s branch distribution 10
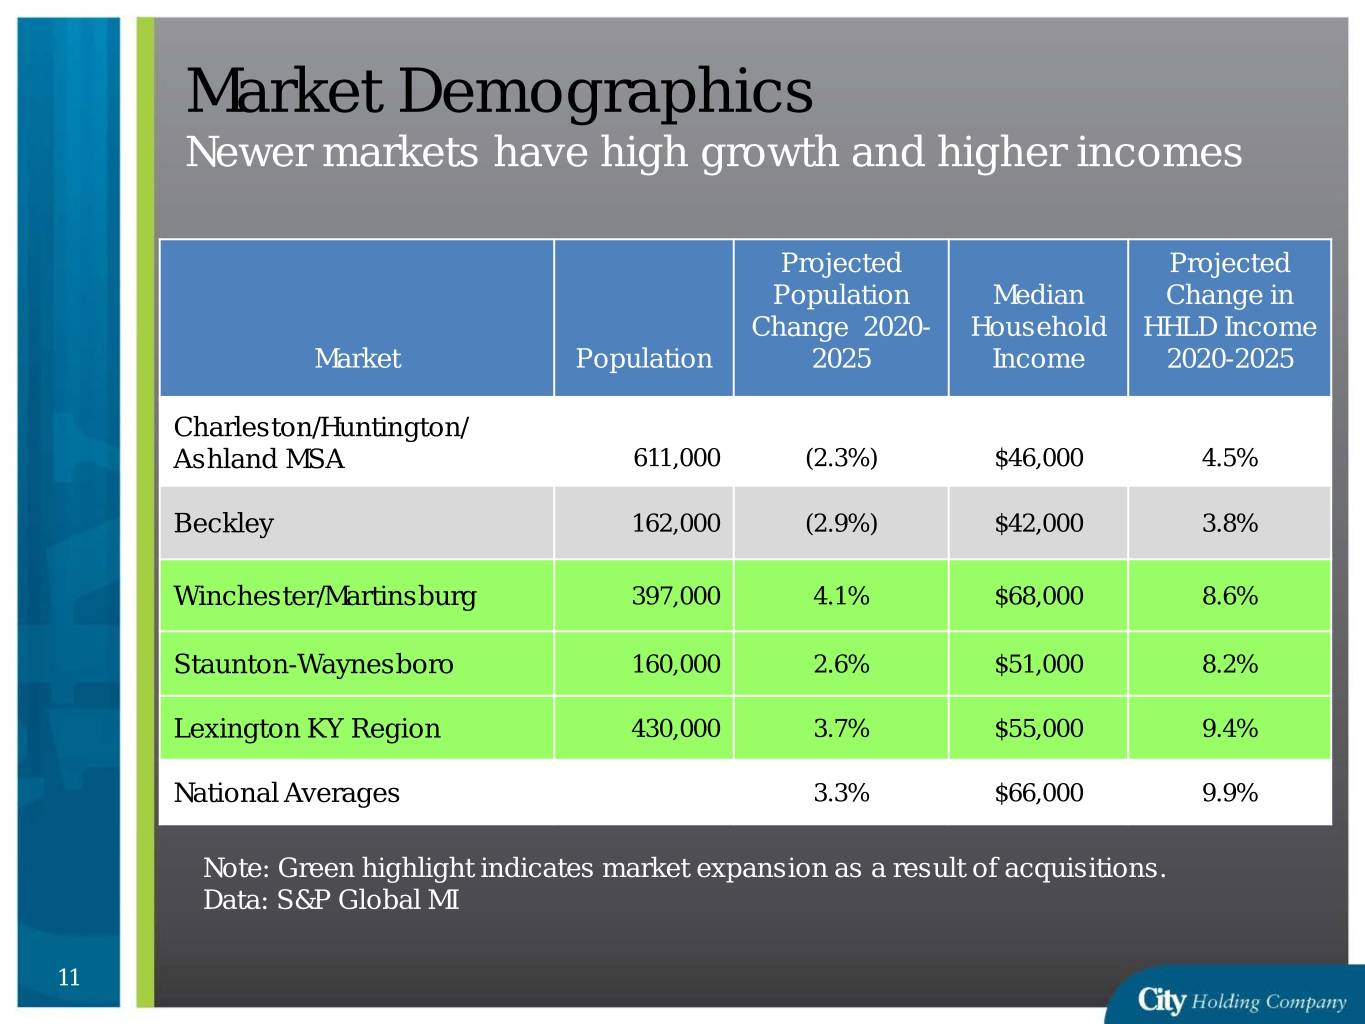
Market Demographics Newer markets have high growth and higher incomes Projected Projected Population Median Change in Change 2020- Household HHLD Income Market Population 2025 Income 2020-2025 Charleston/Huntington/ Ashland MSA 611,000 (2.3%) $46,000 4.5% Beckley 162,000 (2.9%) $42,000 3.8% Winchester/Martinsburg 397,000 4.1% $68,000 8.6% Staunton-Waynesboro 160,000 2.6% $51,000 8.2% Lexington KY Region 430,000 3.7% $55,000 9.4% National Averages 3.3% $66,000 9.9% Note: Green highlight indicates market expansion as a result of acquisitions. Data: S&P Global MI 11
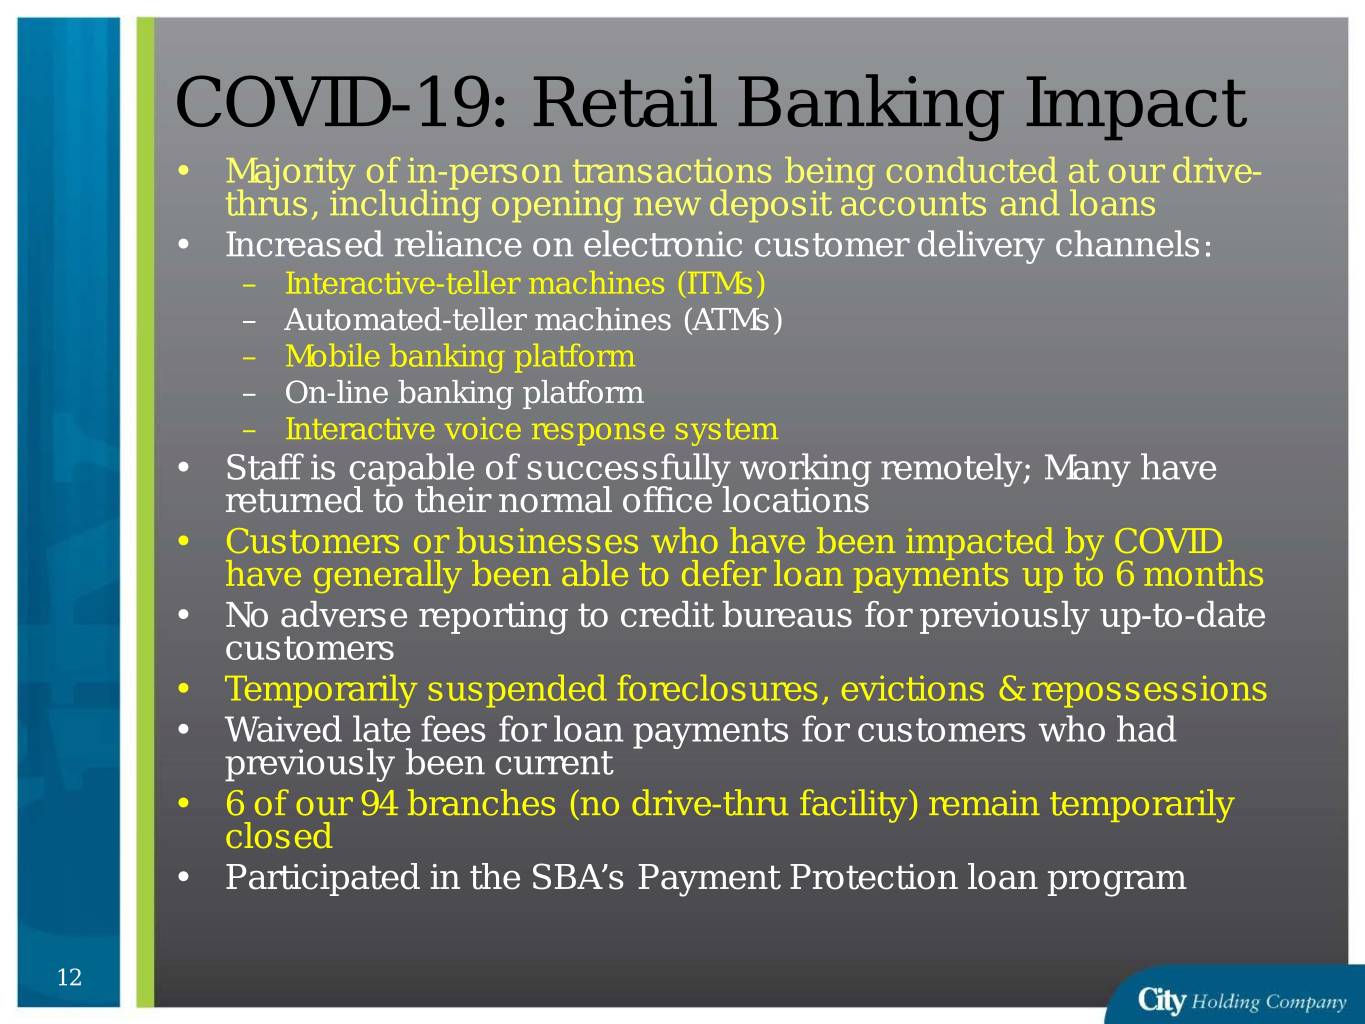
COVID-19: Retail Banking Impact • Majority of in-person transactions being conducted at our drive- thrus, including opening new deposit accounts and loans • Increased reliance on electronic customer delivery channels: – Interactive-teller machines (ITMs) – Automated-teller machines (ATMs) – Mobile banking platform – On-line banking platform – Interactive voice response system • Staff is capable of successfully working remotely; Many have returned to their normal office locations • Customers or businesses who have been impacted by COVID have generally been able to defer loan payments up to 6 months • No adverse reporting to credit bureaus for previously up-to-date customers • Temporarily suspended foreclosures, evictions & repossessions • Waived late fees for loan payments for customers who had previously been current • 6 of our 94 branches (no drive-thru facility) remain temporarily closed • Participated in the SBA’s Payment Protection loan program 12
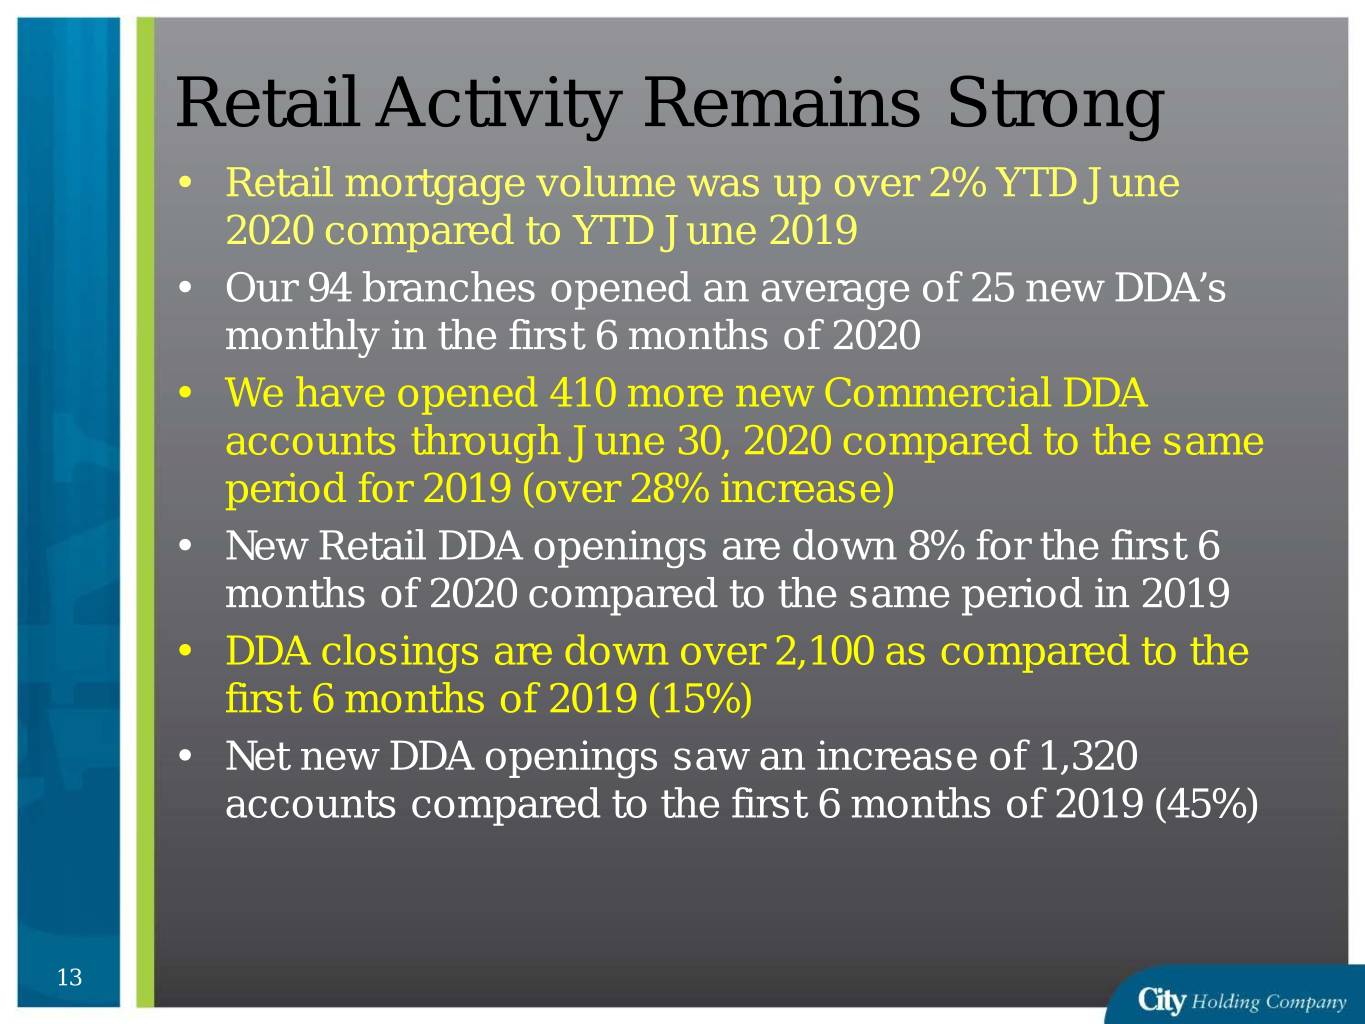
Retail Activity Remains Strong • Retail mortgage volume was up over 2% YTD June 2020 compared to YTD June 2019 • Our 94 branches opened an average of 25 new DDA’s monthly in the first 6 months of 2020 • We have opened 410 more new Commercial DDA accounts through June 30, 2020 compared to the same period for 2019 (over 28% increase) • New Retail DDA openings are down 8% for the first 6 months of 2020 compared to the same period in 2019 • DDA closings are down over 2,100 as compared to the first 6 months of 2019 (15%) • Net new DDA openings saw an increase of 1,320 accounts compared to the first 6 months of 2019 (45%) 13

COVID-19 Impact: Net Interest Income 2019 2020 Analyst 2020 YTD 2021 Analyst Expectations Expectations Net Interest $161.4 MM $157.3 MM $78.5 MM $153.2 MM Income Provision ($1.3 MM) $2.27 MM $9.2 MM $17.2 MM Non-Interest $68.5 MM $78.5 MM $48.0 MM $67.2 MM Income ($30.1 MM w/o Visa Sale) Non-Interest $117.6 MM $118.3 MM $57.9 MM $122.4 MM Expense PTPP $112.2 MM $117.5 MM $50.7 MM $98.0 MM (without Visa) Tax Rate 21.3% 20.7% 20.3% 21.3% Net Income $89.4 MM $75.1 MM $33.0 MM $63.6 MM 14
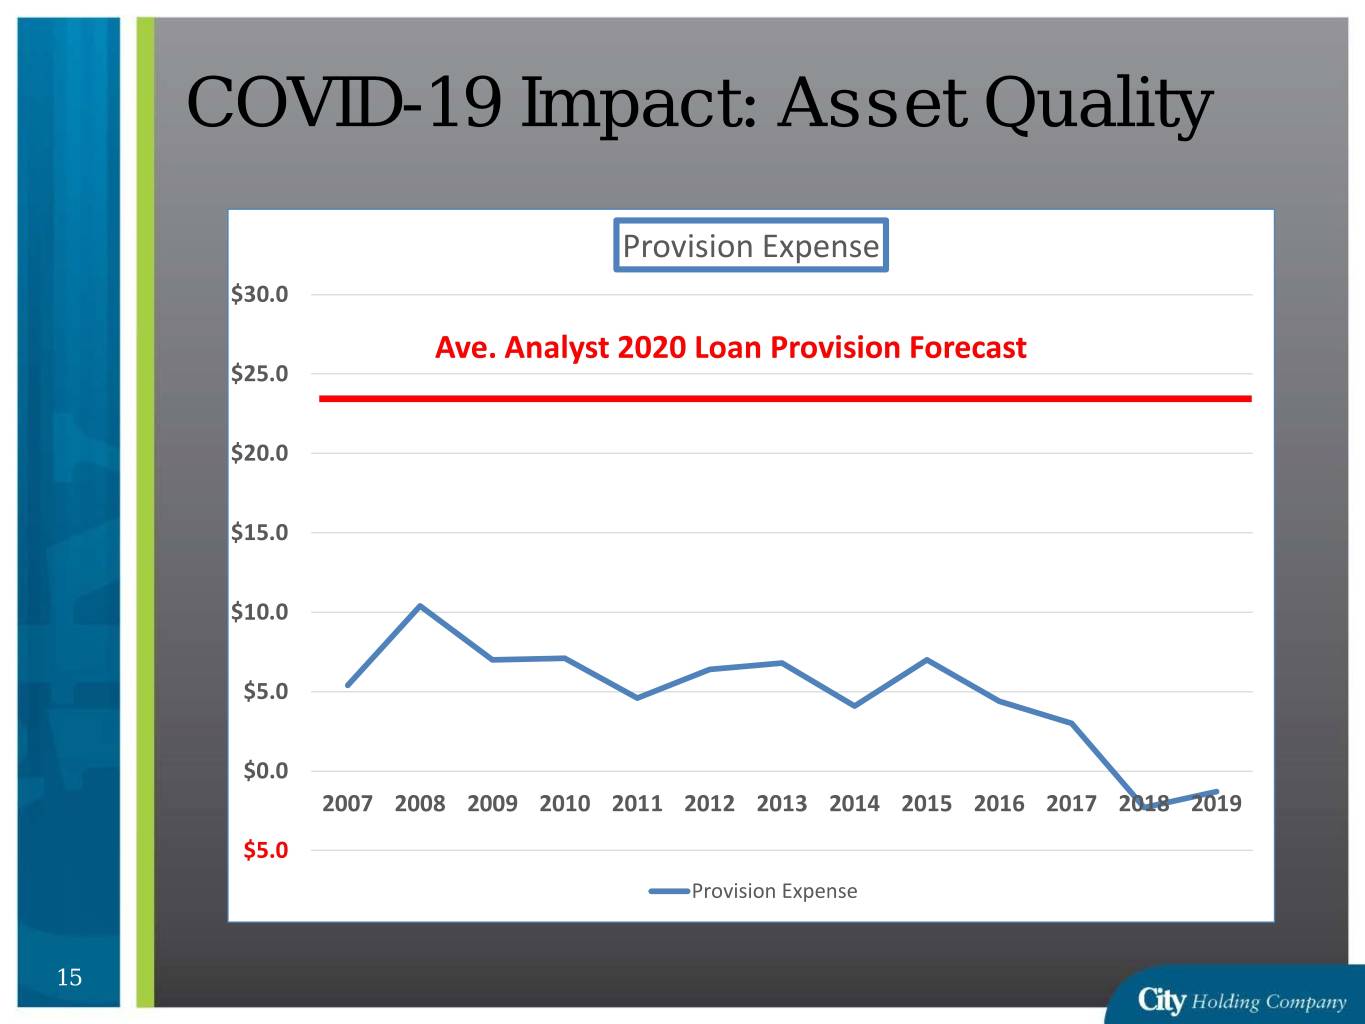
COVID-19 Impact: Asset Quality Provision Expense $30.0 Ave. Analyst 2020 Loan Provision Forecast $25.0 $20.0 $15.0 $10.0 $5.0 $0.0 2007 2008 2009 2010 2011 2012 2013 2014 2015 2016 2017 2018 2019 $5.0 Provision Expense 15
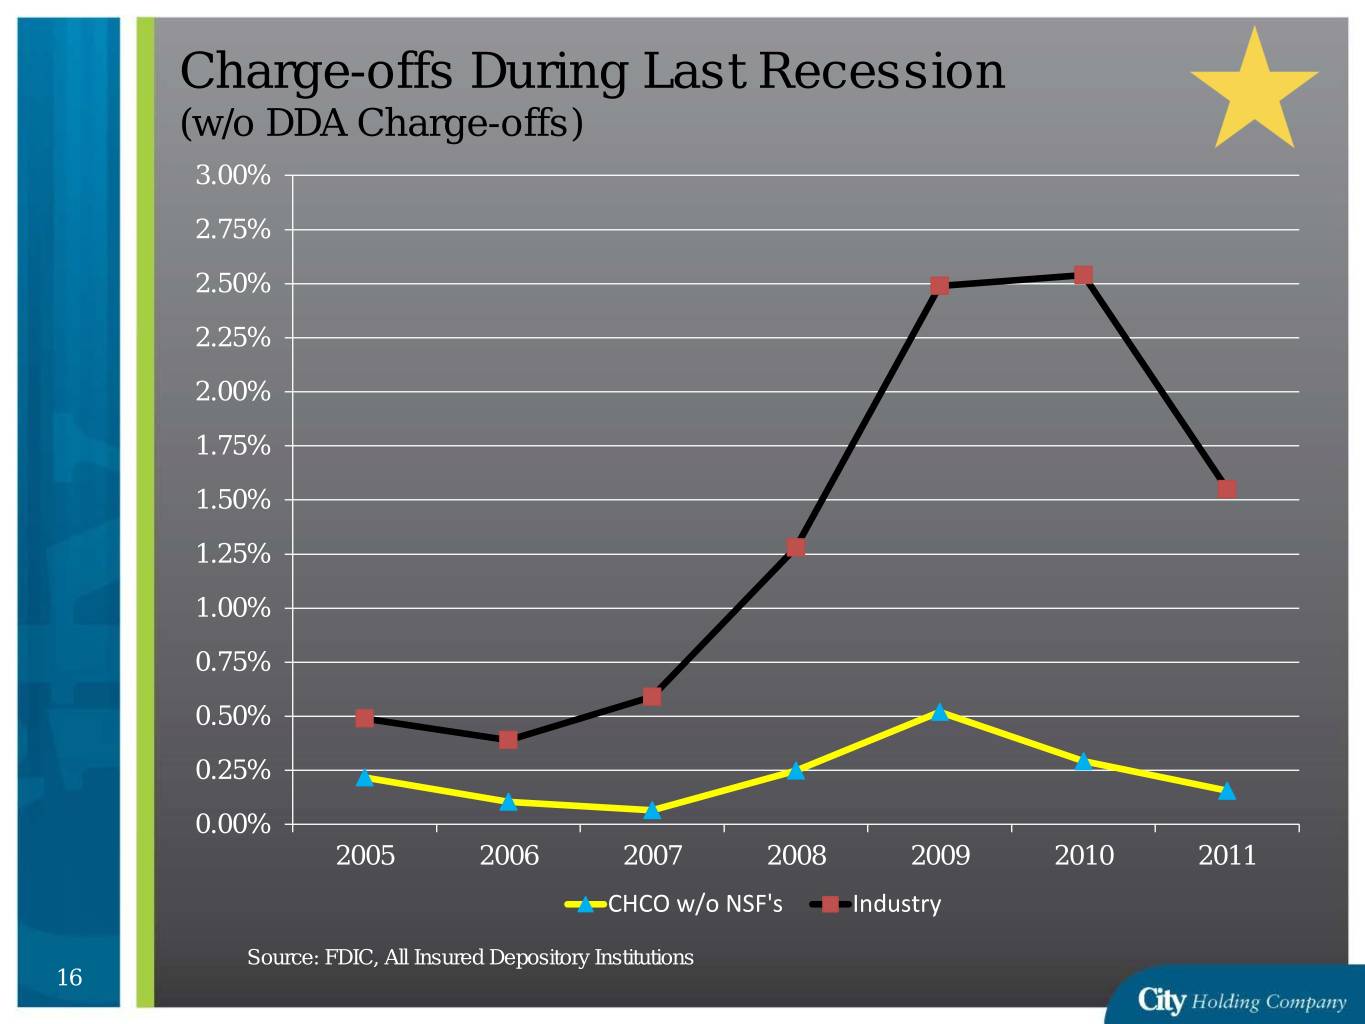
Charge-offs During Last Recession (w/o DDA Charge-offs) 3.00% 2.75% 2.50% 2.25% 2.00% 1.75% 1.50% 1.25% 1.00% 0.75% 0.50% 0.25% 0.00% 2005 2006 2007 2008 2009 2010 2011 CHCO w/o NSF's Industry Source: FDIC, All Insured Depository Institutions 16
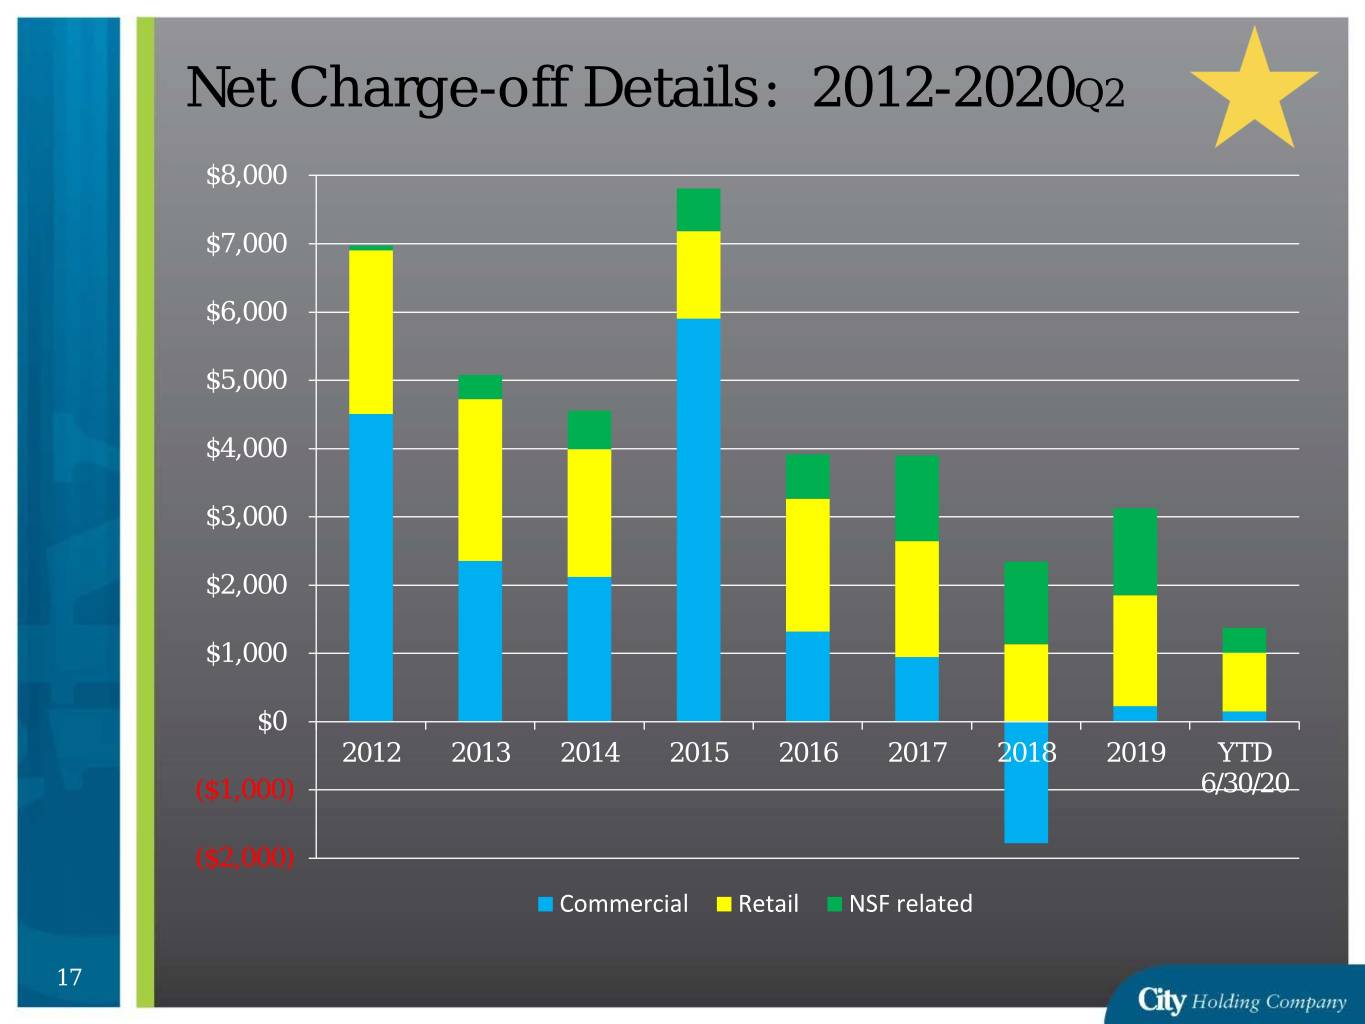
Net Charge-off Details: 2012-2020Q2 $8,000 $7,000 $6,000 $5,000 $4,000 $3,000 $2,000 $1,000 $0 2012 2013 2014 2015 2016 2017 2018 2019 YTD ($1,000) 6/30/20 ($2,000) Commercial Retail NSF related 17
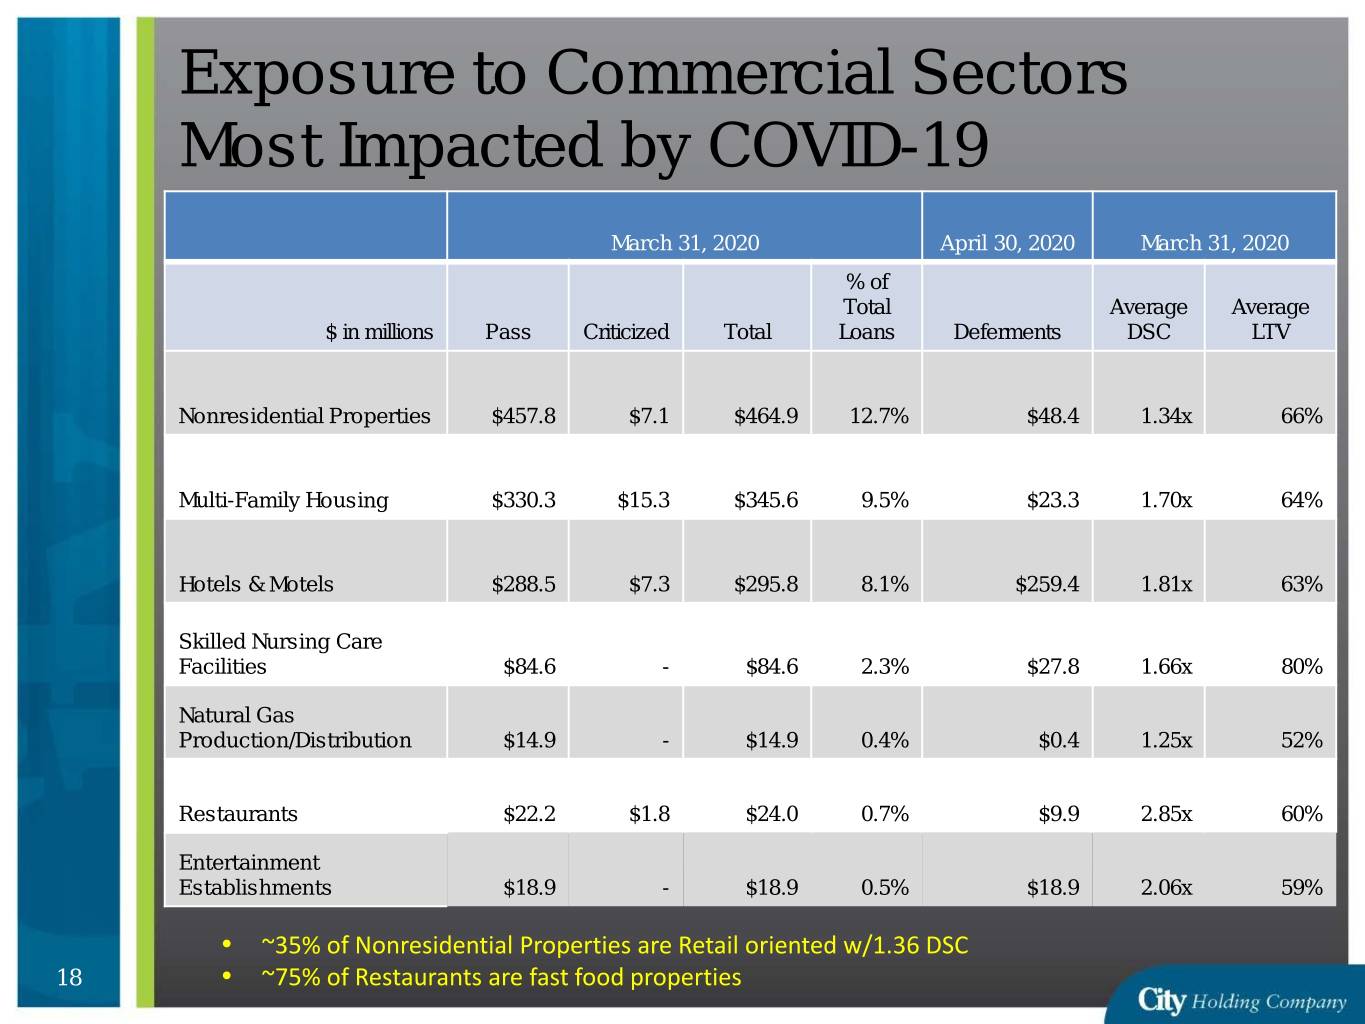
Exposure to Commercial Sectors Most Impacted by COVID-19 March 31, 2020 April 30, 2020 March 31, 2020 % of Total Average Average $ in millions Pass Criticized Total Loans Deferments DSC LTV Nonresidential Properties $457.8 $7.1 $464.9 12.7% $48.4 1.34x 66% Multi-Family Housing $330.3 $15.3 $345.6 9.5% $23.3 1.70x 64% Hotels & Motels $288.5 $7.3 $295.8 8.1% $259.4 1.81x 63% Skilled Nursing Care Facilities $84.6 - $84.6 2.3% $27.8 1.66x 80% Natural Gas Production/Distribution $14.9 - $14.9 0.4% $0.4 1.25x 52% Restaurants $22.2 $1.8 $24.0 0.7% $9.9 2.85x 60% Entertainment Establishments $18.9 - $18.9 0.5% $18.9 2.06x 59% • ~35% of Nonresidential Properties are Retail oriented w/1.36 DSC 18 • ~75% of Restaurants are fast food properties

Hotel Exposure 23.4% Location Map 34.2% 23.2% WV KY 4.6% 14.6% OH VA Other 19
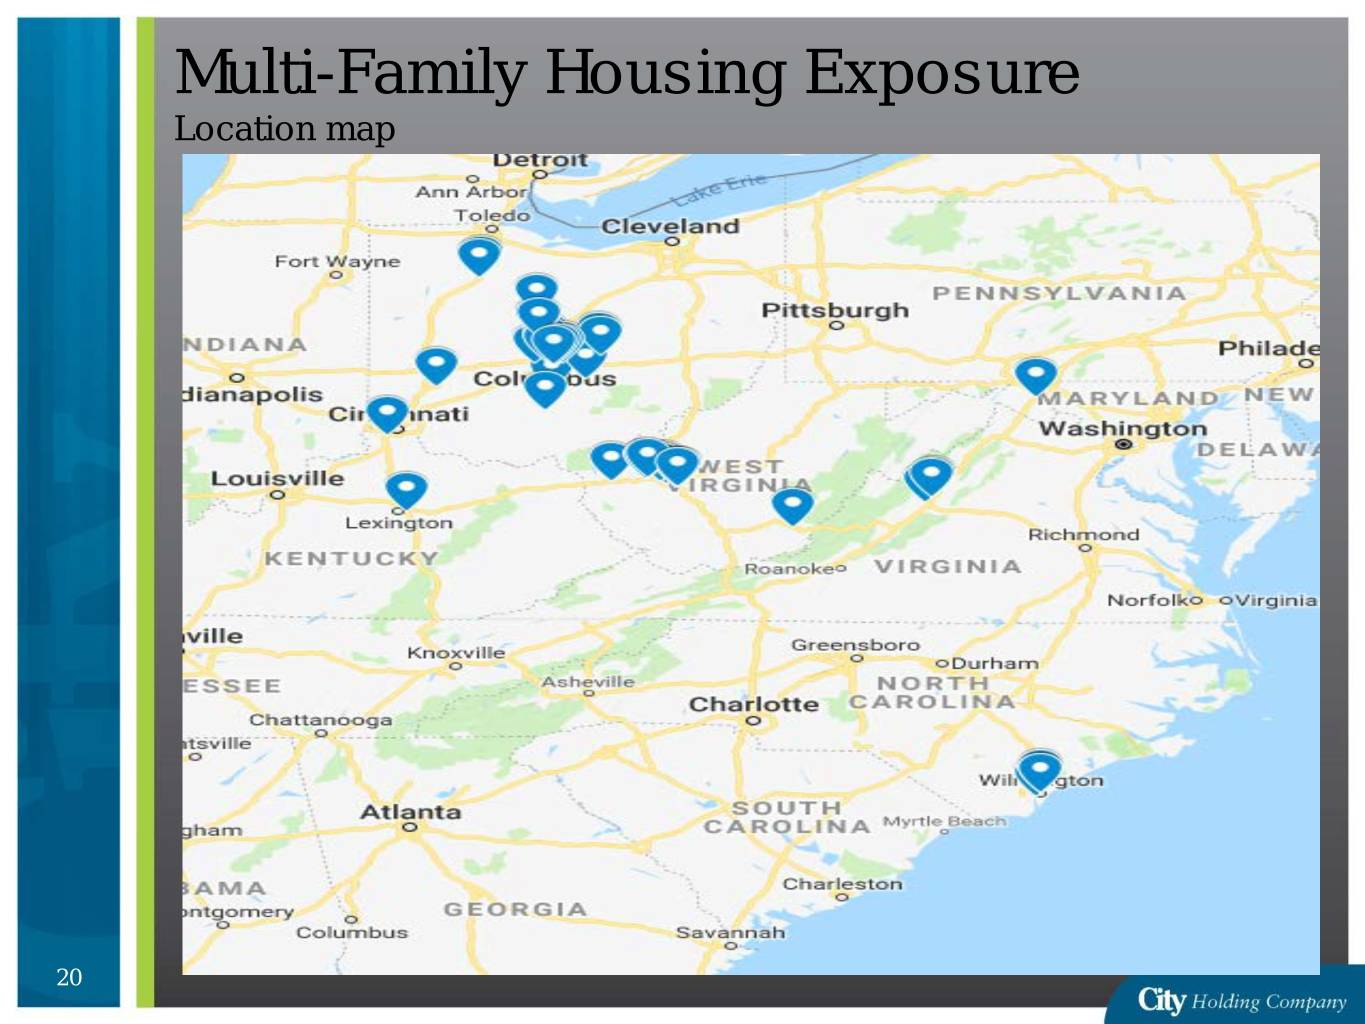
Multi-Family Housing Exposure Location map 20
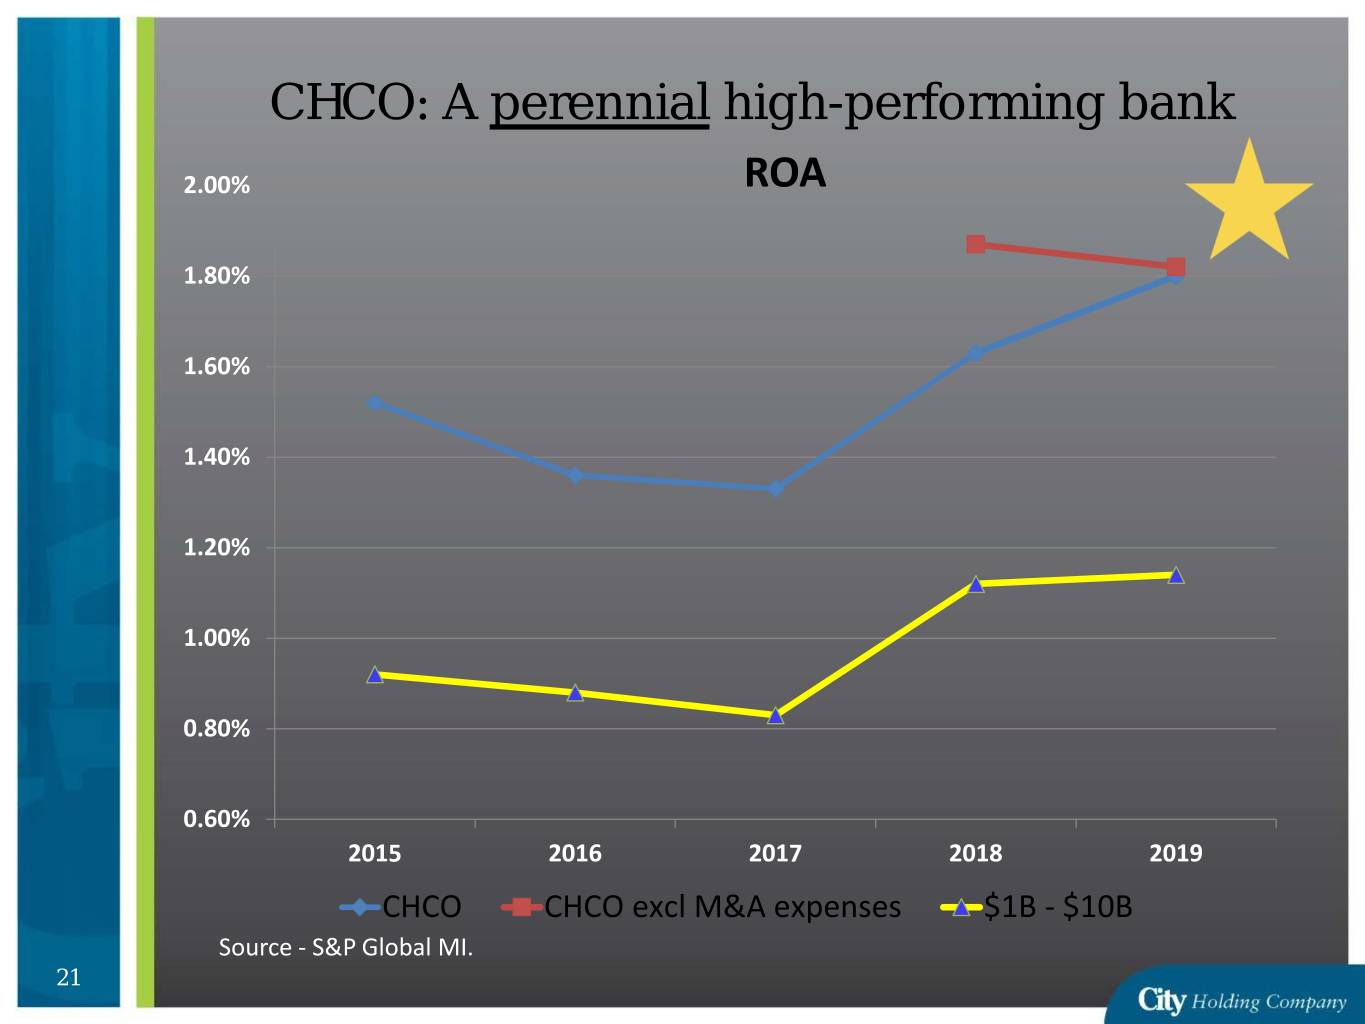
CHCO: A perennial high-performing bank 2.00% ROA 1.80% 1.60% 1.40% 1.20% 1.00% 0.80% 0.60% 2015 2016 2017 2018 2019 CHCO CHCO excl M&A expenses $1B - $10B Source - S&P Global MI. 21
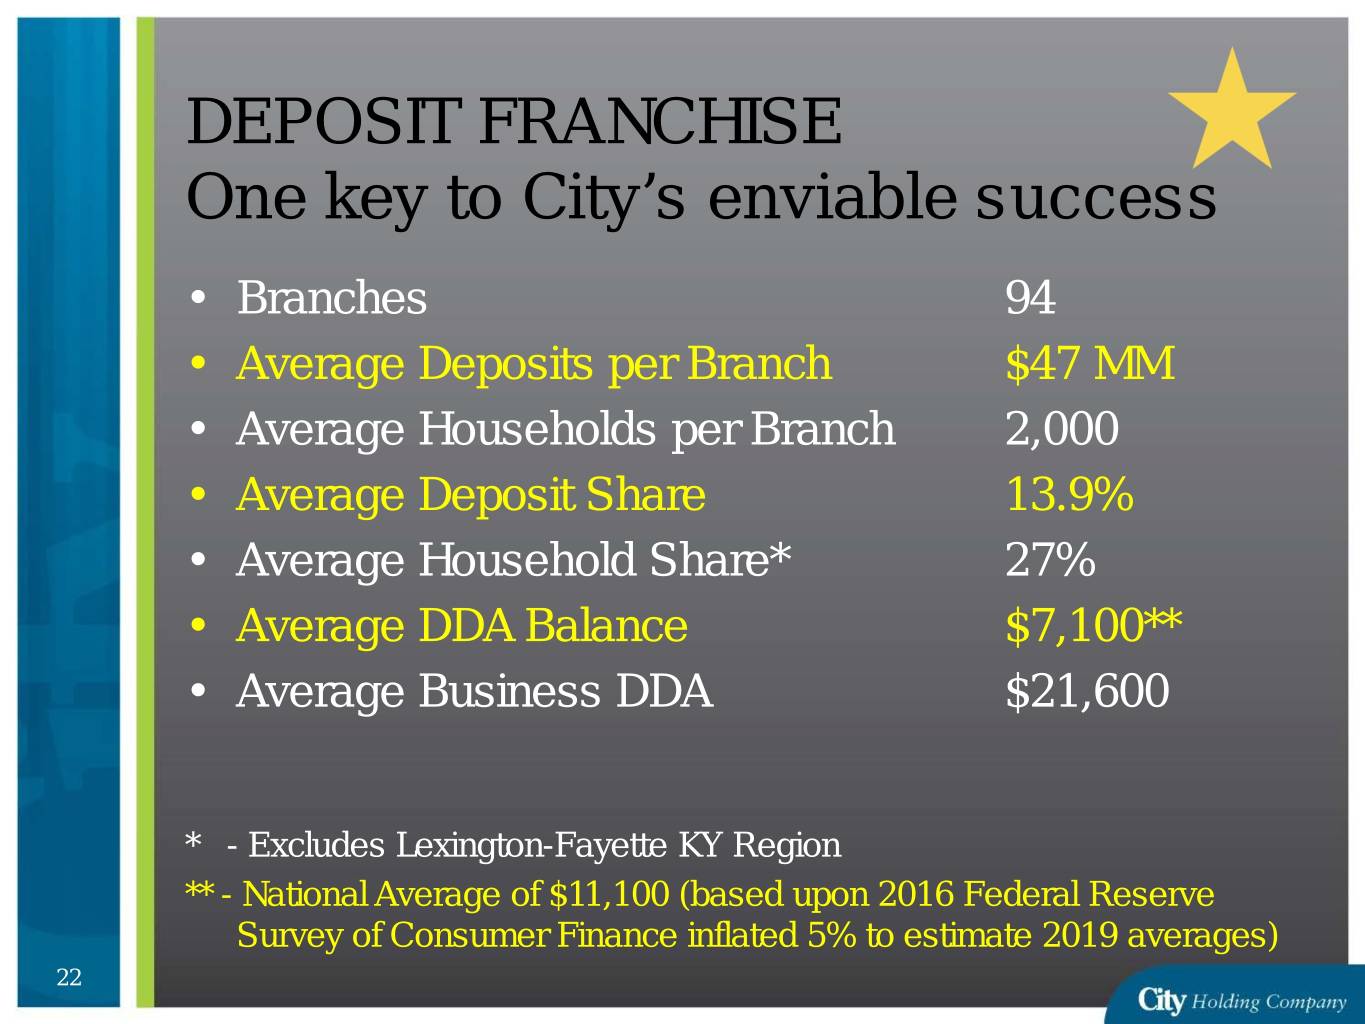
DEPOSIT FRANCHISE One key to City’s enviable success • Branches 94 • Average Deposits per Branch $47 MM • Average Households per Branch 2,000 • Average Deposit Share 13.9% • Average Household Share* 27% • Average DDA Balance $7,100** • Average Business DDA $21,600 * - Excludes Lexington-Fayette KY Region ** - National Average of $11,100 (based upon 2016 Federal Reserve Survey of Consumer Finance inflated 5% to estimate 2019 averages) 22
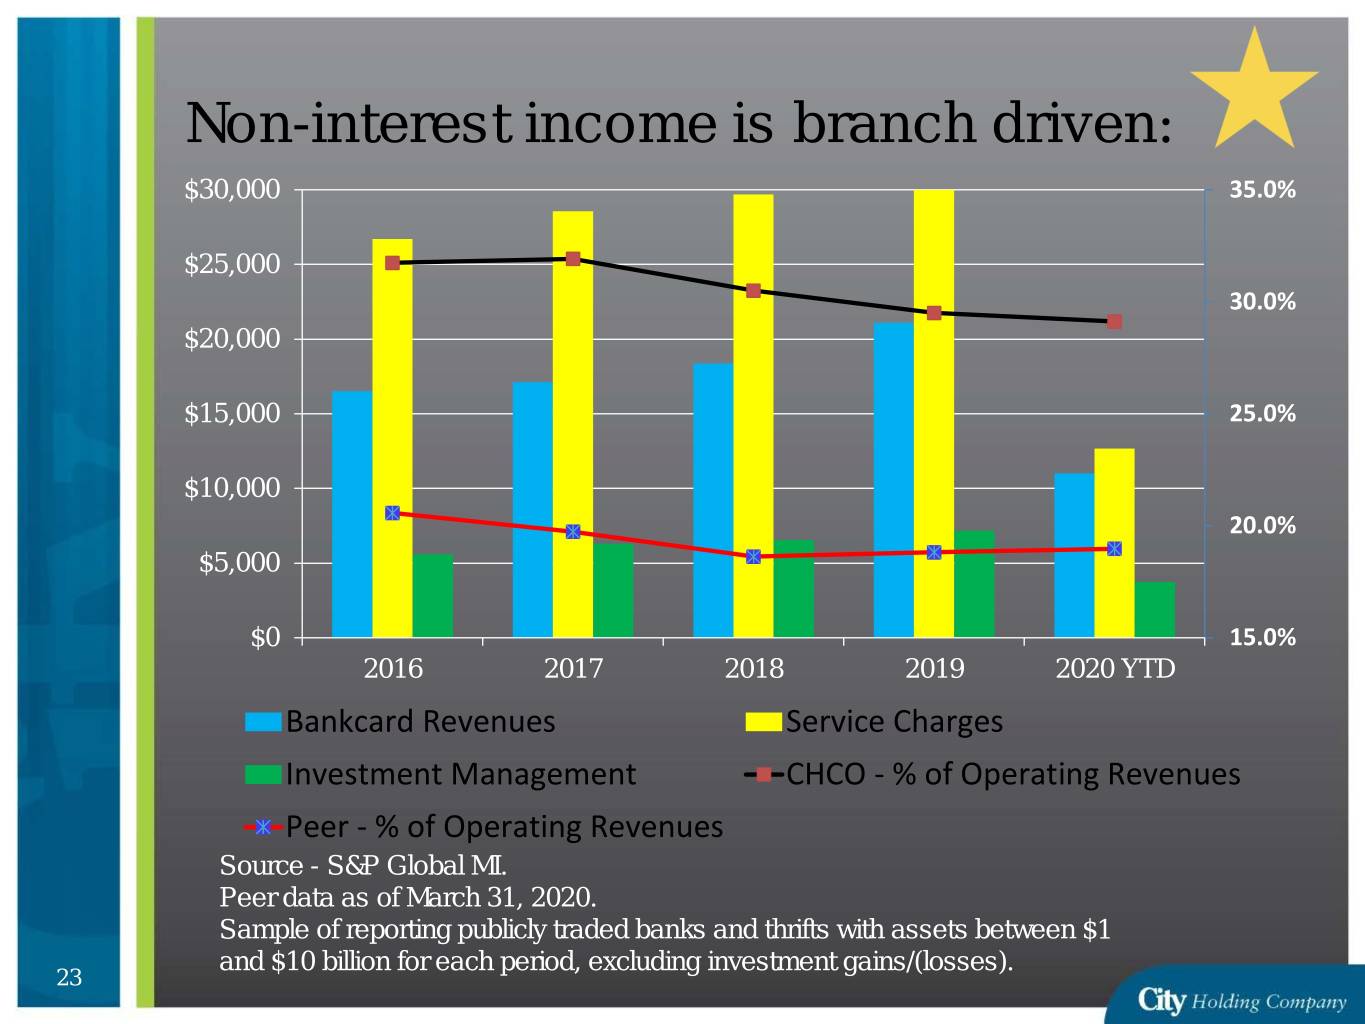
Non-interest income is branch driven: $30,000 35.0% $25,000 30.0% $20,000 $15,000 25.0% $10,000 20.0% $5,000 $0 15.0% 2016 2017 2018 2019 2020 YTD Bankcard Revenues Service Charges Investment Management CHCO - % of Operating Revenues Peer - % of Operating Revenues Source - S&P Global MI. Peer data as of March 31, 2020. Sample of reporting publicly traded banks and thrifts with assets between $1 and $10 billion for each period, excluding investment gains/(losses). 23
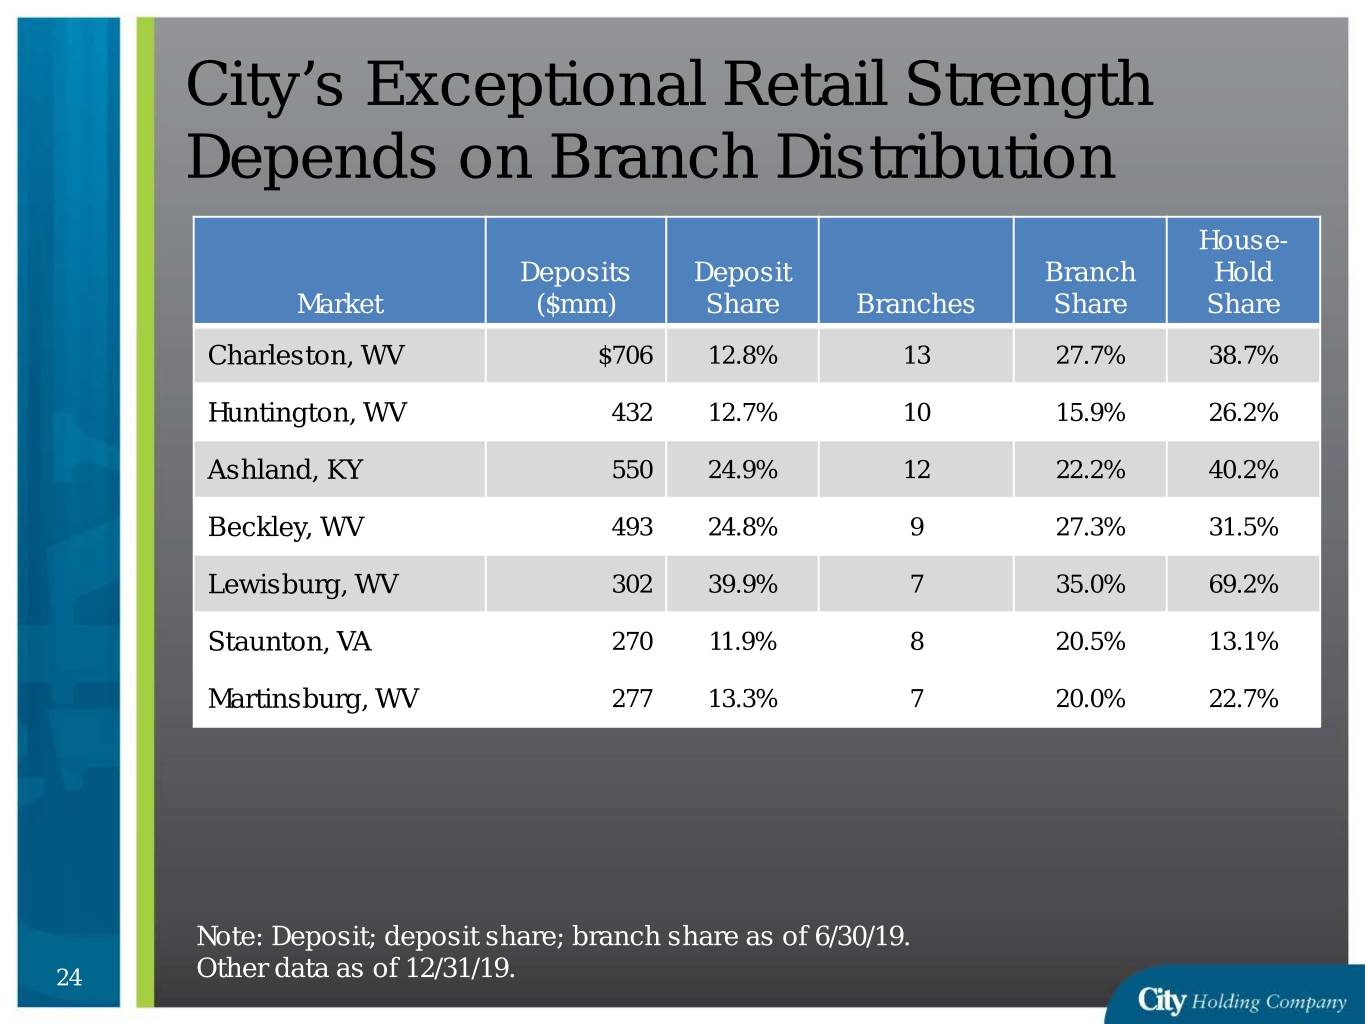
City’s Exceptional Retail Strength Depends on Branch Distribution House- Deposits Deposit Branch Hold Market ($mm) Share Branches Share Share Charleston, WV $706 12.8% 13 27.7% 38.7% Huntington, WV 432 12.7% 10 15.9% 26.2% Ashland, KY 550 24.9% 12 22.2% 40.2% Beckley, WV 493 24.8% 9 27.3% 31.5% Lewisburg, WV 302 39.9% 7 35.0% 69.2% Staunton, VA 270 11.9% 8 20.5% 13.1% Martinsburg, WV 277 13.3% 7 20.0% 22.7% Note: Deposit; deposit share; branch share as of 6/30/19. 24 Other data as of 12/31/19.
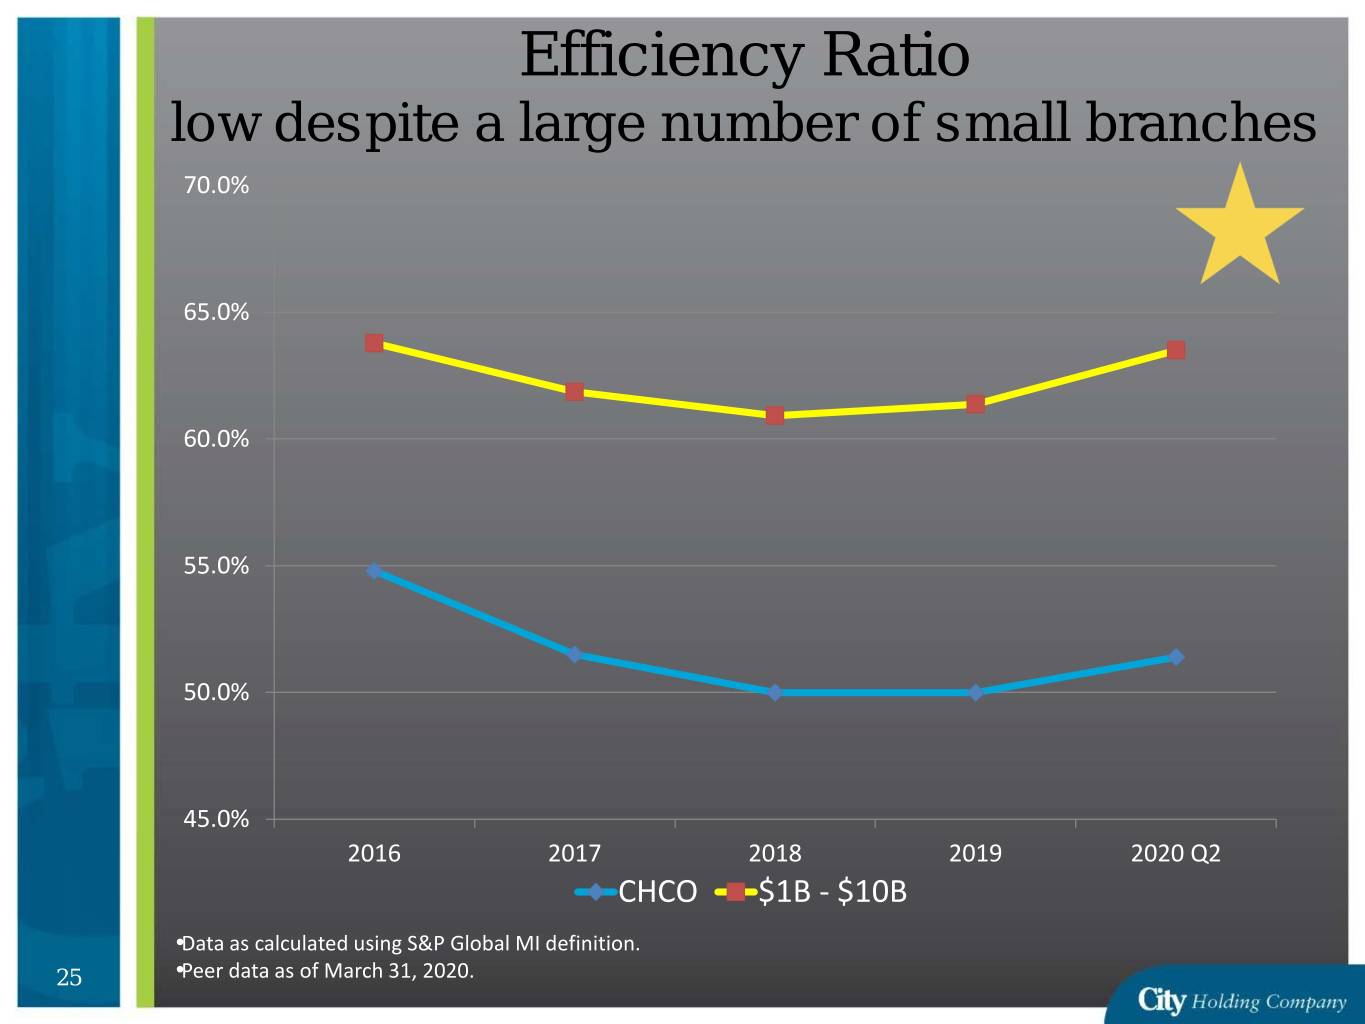
Efficiency Ratio low despite a large number of small branches 70.0% 65.0% 60.0% 55.0% 50.0% 45.0% 2016 2017 2018 2019 2020 Q2 CHCO $1B - $10B •Data as calculated using S&P Global MI definition. 25 •Peer data as of March 31, 2020.
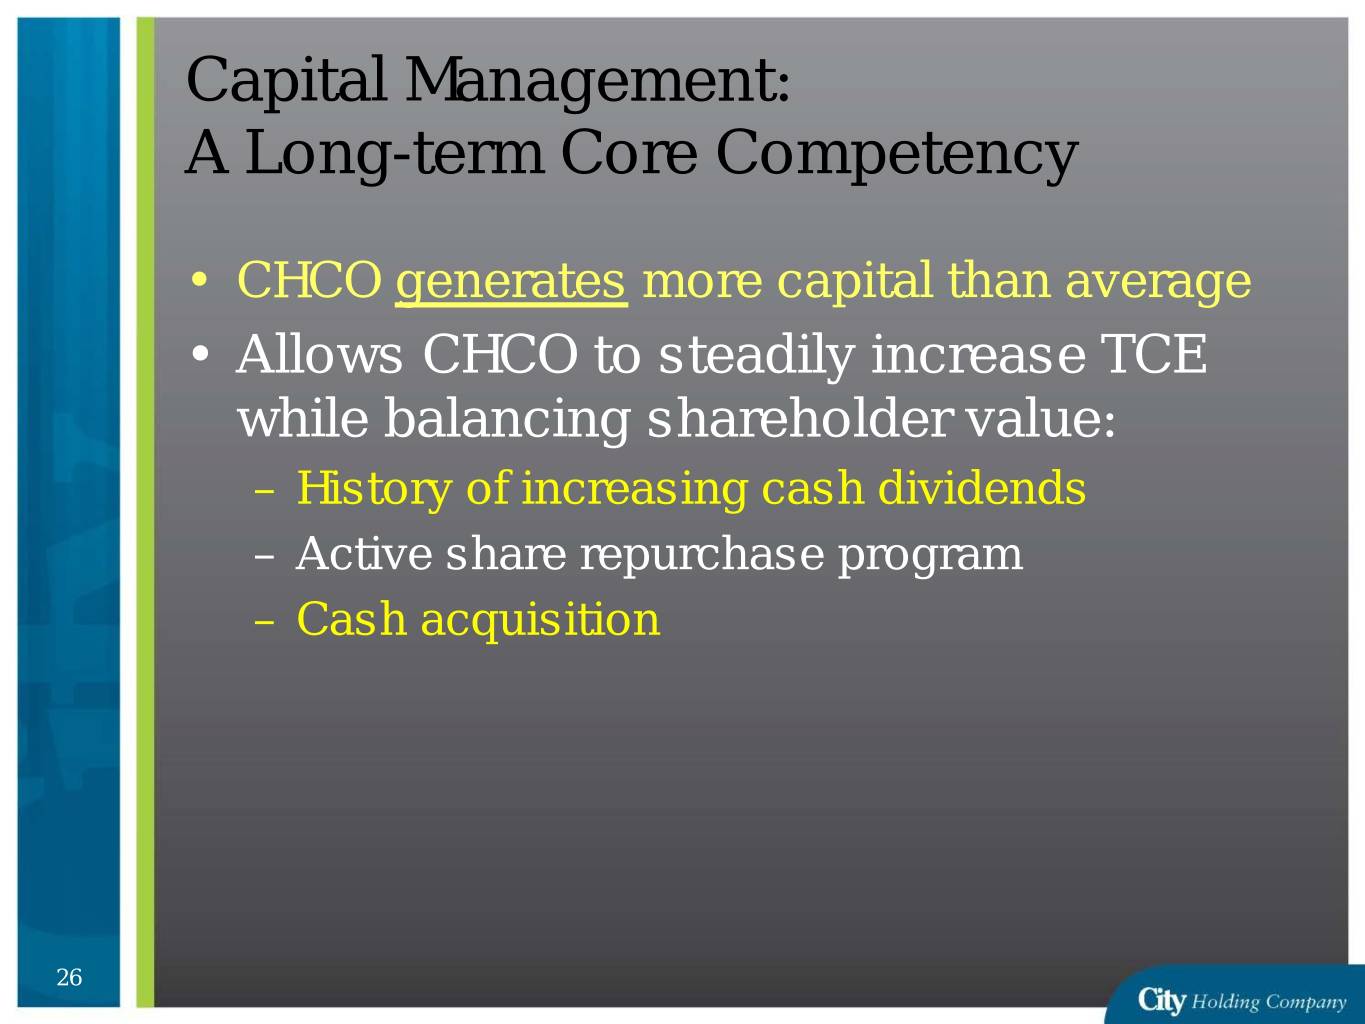
Capital Management: A Long-term Core Competency • CHCO generates more capital than average • Allows CHCO to steadily increase TCE while balancing shareholder value: – History of increasing cash dividends – Active share repurchase program – Cash acquisition 26
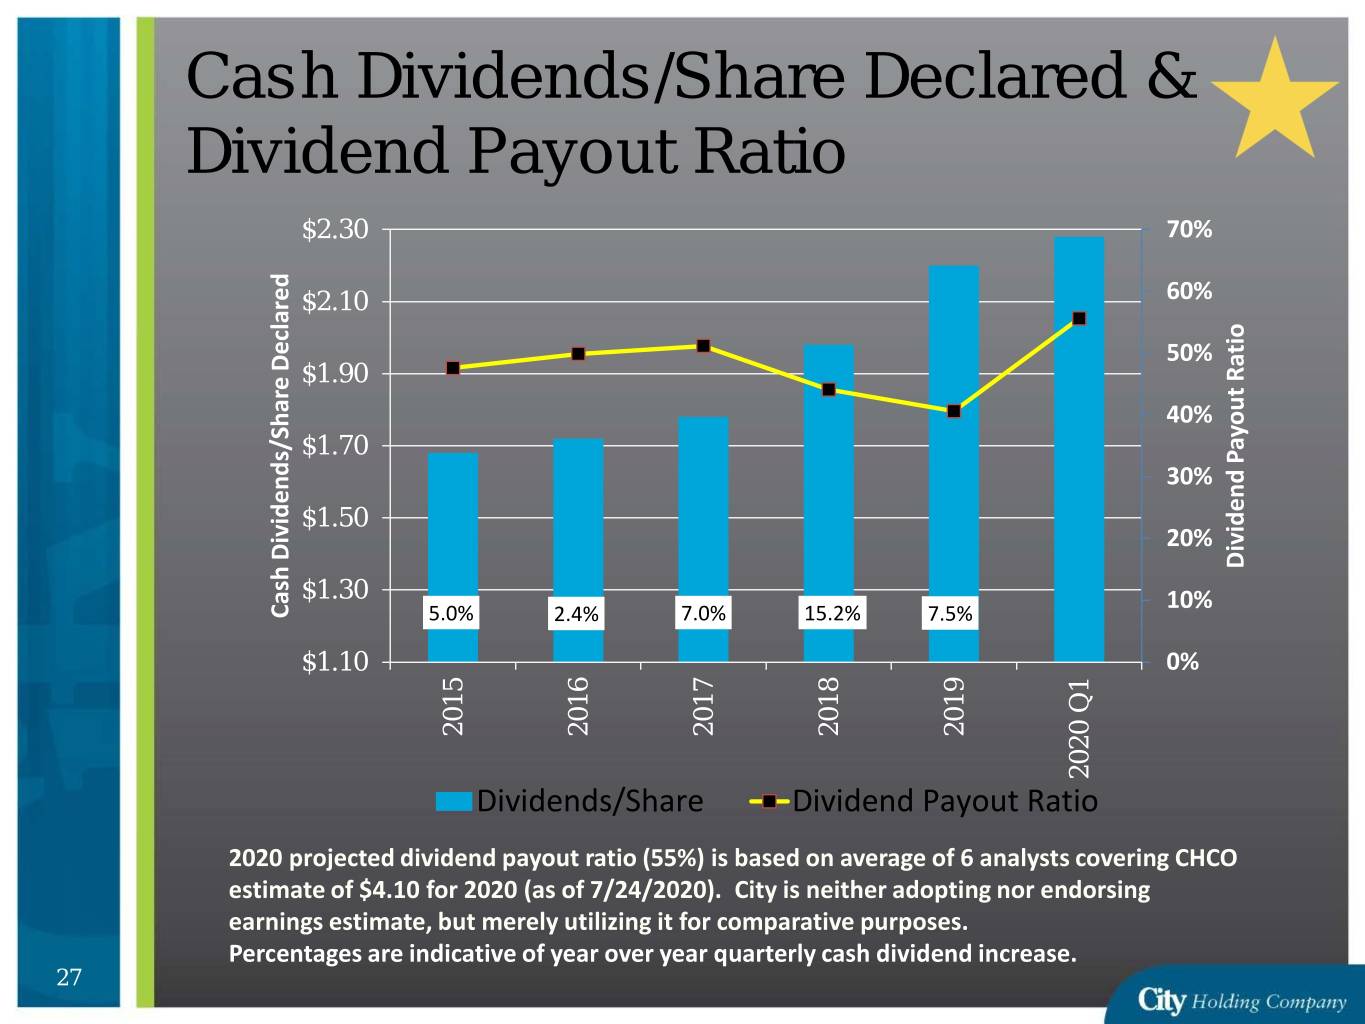
Cash Dividends/Share Declared & Dividend Payout Ratio $2.30 70% $2.10 60% 50% $1.90 40% $1.70 30% $1.50 20% Dividend Payout Ratio Payout Dividend $1.30 10% Cash Dividends/Share Declared Cash Dividends/Share 5.0% 2.4% 7.0% 15.2% 7.5% $1.10 0% 2015 2016 2017 2018 2019 2020Q1 Dividends/Share Dividend Payout Ratio 2020 projected dividend payout ratio (55%) is based on average of 6 analysts covering CHCO estimate of $4.10 for 2020 (as of 7/24/2020). City is neither adopting nor endorsing earnings estimate, but merely utilizing it for comparative purposes. Percentages are indicative of year over year quarterly cash dividend increase. 27

Share Activity: City’s strong capital and high profitability have allowed aggressive share repurchases $30,000 $25,000 440,604 $20,000 $15,000 290,491 260,674 $10,000 261,134 231,132 $5,000 107,662 $0 2016 2017 2018 2019 2020 Q2 Repurchase $ Issuance $ Labels represent shares repurchased or issued. 28

Acquisition territory: Small Community Banks will struggle with lower net interest income, asset quality challenges, lack of scale, and limited liquidity for their stock. Underperforming small banks may be interested in joining a stronger partner. City is well positioned to acquire select franchises. 29

Bottom Line: CHCO is a Simple Model Incredible Core Banking Franchise Well Managed (Expenses, Asset Quality, Etc.) Disciplined Growth Strategy focused on shareholders, and community service Highly Profitable Allows Strong Dividends & Accretive Share Repurchases 30
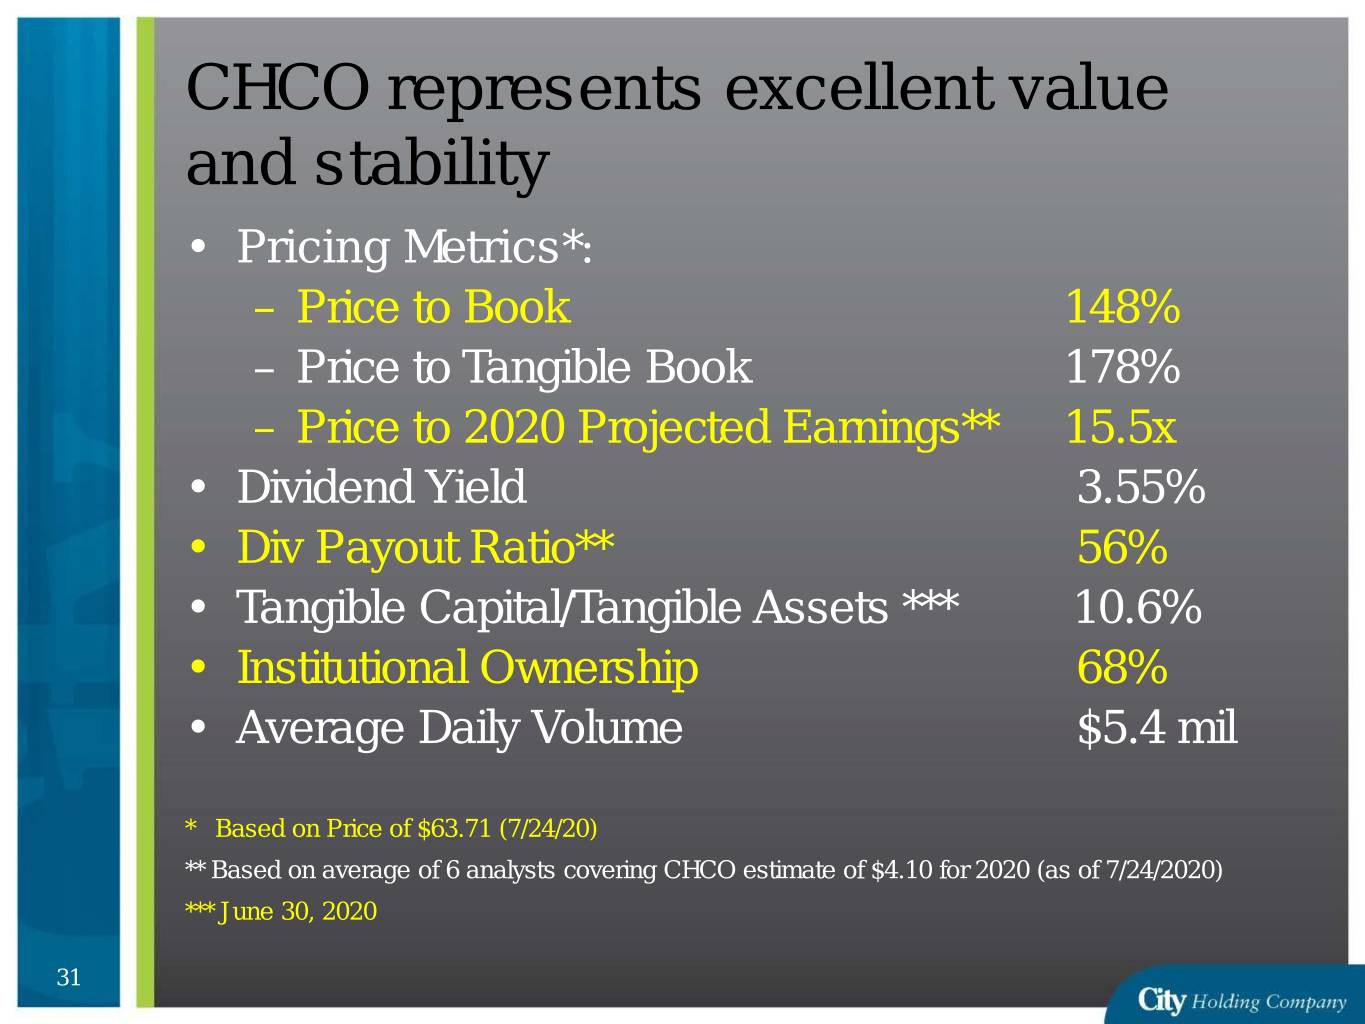
CHCO represents excellent value and stability • Pricing Metrics*: – Price to Book 148% – Price to Tangible Book 178% – Price to 2020 Projected Earnings** 15.5x • Dividend Yield 3.55% • Div Payout Ratio** 56% • Tangible Capital/Tangible Assets *** 10.6% • Institutional Ownership 68% • Average Daily Volume $5.4 mil * Based on Price of $63.71 (7/24/20) ** Based on average of 6 analysts covering CHCO estimate of $4.10 for 2020 (as of 7/24/2020) *** June 30, 2020 31
