Attached files
| file | filename |
|---|---|
| 8-K - FORM 8-K - CB Financial Services, Inc. | f8k_072820.htm |
Exhibit 99.1
Investor Presentation KBW Community Bank Investor Conference July 2020
1 Statements contained in this investor presentation that are not historical facts may constitute forward - looking statements as that term is defined in the Private Securities Litigation Reform Act of 1995 (the “Act”) . Such forward - looking statements are subject to significant risks and uncertainties . CB Financial Services, Inc . (the “Company”) intends such forward - looking statements to be covered by the safe harbor provisions contained in the Act . The Company’s ability to predict results or the actual effect of future plans or strategies is inherently uncertain . Factors which could have a material adverse effect on the operations and future prospects of the Company and its subsidiaries include, but are not limited to, changes in market interest rates, general economic conditions, changes in federal and state regulation, actions by our competitors, loan delinquency rates, our ability to control costs and expenses, and other factors that are described in the Company’s periodic reports as filed with the Securities and Exchange Commission . These risks and uncertainties should be considered in evaluating forward - looking statements and undue reliance should not be placed on such statements . The Company assumes no obligation to update any forward - looking statement except as may be required by applicable law or regulation . Non - GAAP Financial Measures This presentation contains non - GAAP financial measures, which management believes may be helpful in understanding the Company's results of operations and financial position and when comparing results over different periods . Non - GAAP measures eliminate the impact of certain items such as intangible assets (when calculating Tangible Book Value), OREO expenses and amortization of intangibles assets, and also one - time expenses such as merger costs and related data processing termination fees, legal costs, severance pay, accelerated depreciation expense and lease termination fees . Merger related charges represent expenses to either satisfy contractual obligations of acquired entities without any useful benefit to the Company or to convert and consolidate customer records onto the Company platforms . These costs are unique to each transaction based on the contracts in existence at the merger date . These disclosures should not be viewed as a substitute for operating results determined in accordance with GAAP, nor are they necessarily comparable to non - GAAP performance measures that may be presented by other banks and financial institutions . Please see the non - GAAP reconciliations table included in the Appendix to this investor presentation . Forward - Looking Statements
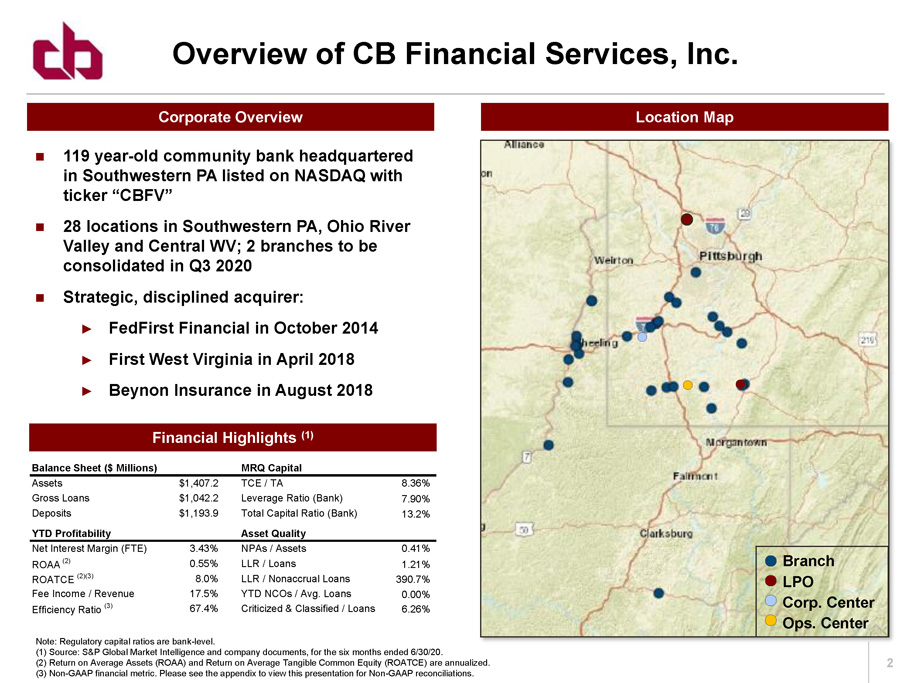
2 2 119 year - old community bank headquartered in Southwestern PA listed on NASDAQ with ticker “CBFV” 28 locations in Southwestern PA, Ohio River Valley and Central WV; 2 branches to be consolidated in Q3 2020 Strategic, disciplined acquirer: ► FedFirst Financial in October 2014 ► First West Virginia in April 2018 ► Beynon Insurance in August 2018 Location Map Corporate Overview Financial Highlights (1) Overview of CB Financial Services, Inc. Note: Regulatory capital ratios are bank - level. (1) Source: S&P Global Market Intelligence and company documents, for the six months ended 6/30/20. (2) Return on Average Assets (ROAA) and Return on Average Tangible Common Equity (ROATCE) are annualized. (3) Non - GAAP financial metric. Please see the appendix to view this presentation for Non - GAAP reconciliations. Branch LPO Corp. Center Ops. Center Balance Sheet ($ Millions) MRQ Capital Assets $1,407.2 TCE / TA 8.36% Gross Loans $1,042.2 Leverage Ratio (Bank) 7.90% Deposits $1,193.9 Total Capital Ratio (Bank) 13.2% YTD Profitability Asset Quality Net Interest Margin (FTE) 3.43% NPAs / Assets 0.41% ROAA (2) 0.55% LLR / Loans 1.21% ROATCE (2)(3) 8.0% LLR / Nonaccrual Loans 390.7% Fee Income / Revenue 17.5% YTD NCOs / Avg. Loans 0.00% Efficiency Ratio (3) 67.4% Criticized & Classified / Loans 6.26%
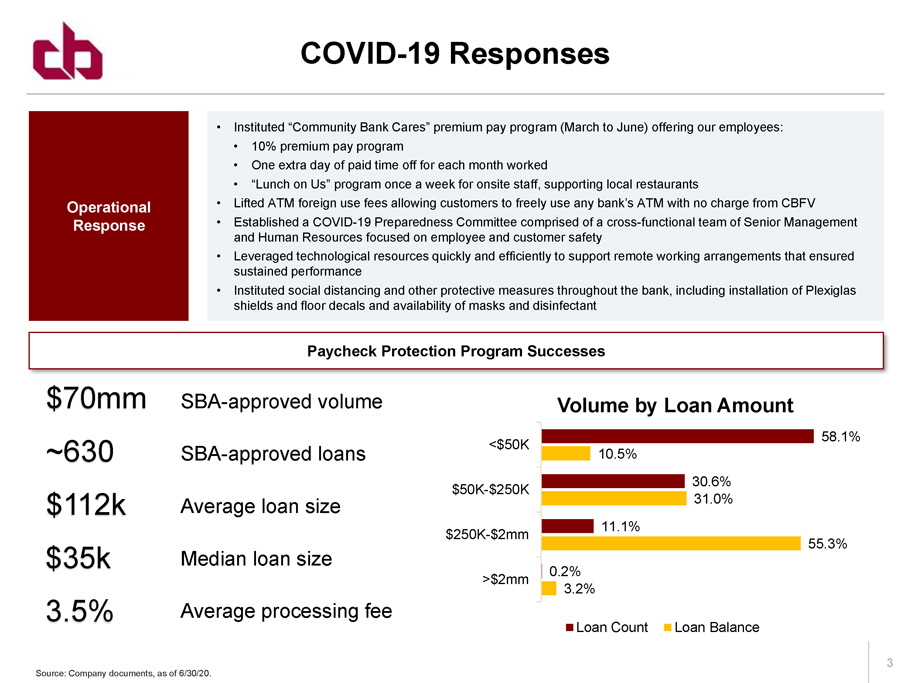
3 COVID - 19 Responses Source: Company documents, as of 6/30/20. $70mm SBA - approved volume ~630 SBA - approved loans $112k Average loan size $35k Median loan size 3.5% Average processing fee Paycheck Protection Program Successes Operational Response • Instituted “Community Bank Cares” premium pay program (March to June) offering our employees: • 10% premium pay program • One extra day of paid time off for each month worked • “Lunch on Us” program once a week for onsite staff, supporting local restaurants • Lifted ATM foreign use fees allowing customers to freely use any bank’s ATM with no charge from CBFV • Established a COVID - 19 Preparedness Committee comprised of a cross - functional team of Senior Management and Human Resources focused on employee and customer safety • Leveraged technological resources quickly and efficiently to support remote working arrangements that ensured sustained performance • Instituted social distancing and other protective measures throughout the bank, including installation of Plexiglas shields and floor decals and availability of masks and disinfectant 58.1% 30.6% 11.1% 0.2% 10.5% 31.0% 55.3% 3.2% <$50K $50K-$250K $250K-$2mm >$2mm Volume by Loan Amount Loan Count Loan Balance
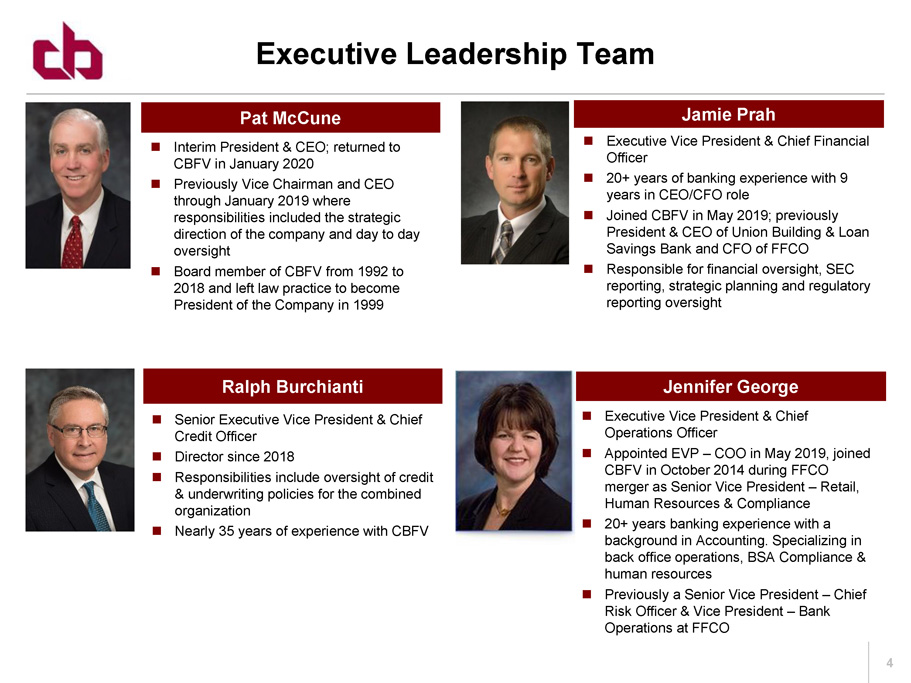
4 Interim President & CEO; returned to CBFV in January 2020 Previously Vice Chairman and CEO through January 2019 where responsibilities included the strategic direction of the company and day to day oversight Board member of CBFV from 1992 to 2018 and left law practice to become President of the Company in 1999 Jamie Prah Executive Vice President & Chief Financial Officer 20+ years of banking experience with 9 years in CEO/CFO role Joined CBFV in May 2019; previously President & CEO of Union Building & Loan Savings Bank and CFO of FFCO Responsible for financial oversight, SEC reporting, strategic planning and regulatory reporting oversight Pat McCune Jennifer George Ralph Burchianti Senior Executive Vice President & Chief Credit Officer Director since 2018 Responsibilities include oversight of credit & underwriting policies for the combined organization Nearly 35 years of experience with CBFV Executive Vice President & Chief Operations Officer Appointed EVP – COO in May 2019, joined CBFV in October 2014 during FFCO merger as Senior Vice President – Retail, Human Resources & Compliance 20+ years banking experience with a background in Accounting. Specializing in back office operations, BSA Compliance & human resources Previously a Senior Vice President – Chief Risk Officer & Vice President – Bank Operations at FFCO Executive Leadership Team
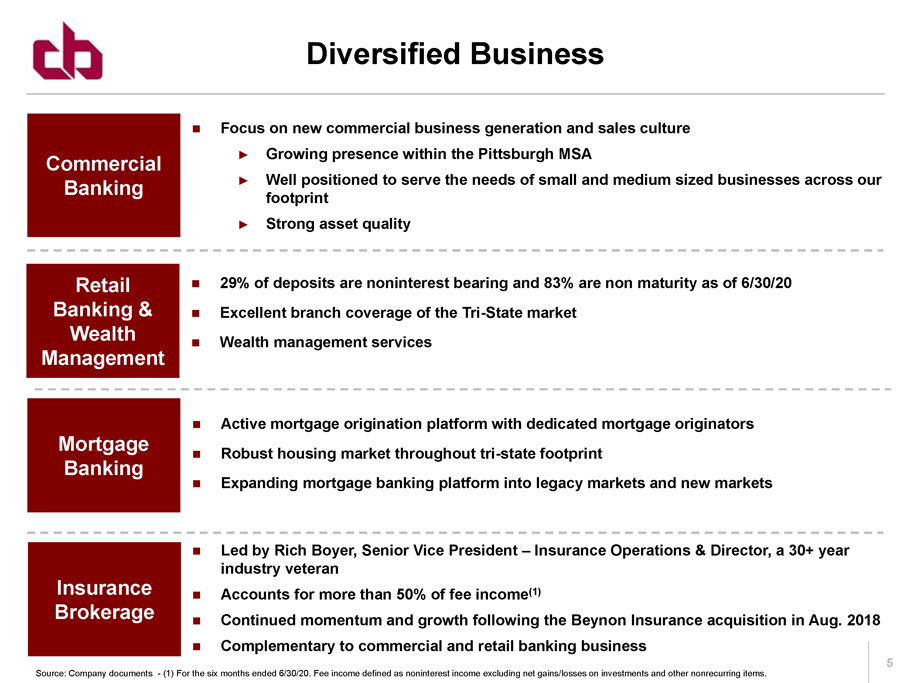
5 Diversified Business Source: Company documents - (1) For the six months ended 6/30/20. Fee income defined as noninterest income excluding net gains/ losses on investments and other nonrecurring items. Focus on new commercial business generation and sales culture ► Growing presence within the Pittsburgh MSA ► Well positioned to serve the needs of small and medium sized businesses across our footprint ► Strong asset quality Commercial Banking Retail Banking & Wealth Management Mortgage Banking Insurance Brokerage Active mortgage origination platform with dedicated mortgage originators Robust housing market throughout tri - state footprint Expanding mortgage banking platform into legacy markets and new markets Led by Rich Boyer, Senior Vice President – Insurance Operations & Director, a 30+ year industry veteran Accounts for more than 50% of fee income (1) Continued momentum and growth following the Beynon Insurance acquisition in Aug. 2018 Complementary to commercial and retail banking business 29% of deposits are noninterest bearing and 83% are non maturity as of 6/30/20 Excellent branch coverage of the Tri - State market Wealth management services
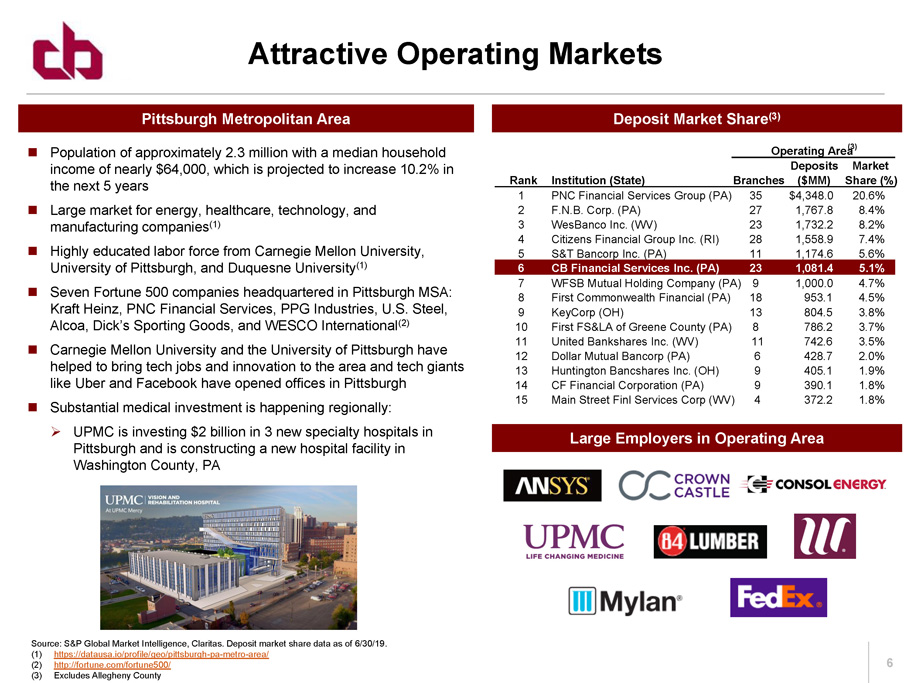
6 Population of approximately 2.3 million with a median household income of nearly $64,000, which is projected to increase 10.2% in the next 5 years Large market for energy, healthcare, technology, and manufacturing companies (1) Highly educated labor force from Carnegie Mellon University, University of Pittsburgh, and Duquesne University (1) Seven Fortune 500 companies headquartered in Pittsburgh MSA: Kraft Heinz, PNC Financial Services, PPG Industries, U.S. Steel, Alcoa, Dick’s Sporting Goods, and WESCO International (2) Carnegie Mellon University and the University of Pittsburgh have helped to bring tech jobs and innovation to the area and tech giants like Uber and Facebook have opened offices in Pittsburgh Substantial medical investment is happening regionally: » UPMC is investing $2 billion in 3 new specialty hospitals in Pittsburgh and is constructing a new hospital facility in Washington County, PA Large Employers in Operating Area Pittsburgh Metropolitan Area Deposit Market Share (3) Attractive Operating Markets Source: S&P Global Market Intelligence, Claritas. Deposit market share data as of 6/30/19. (1) https://datausa.io/profile/geo/pittsburgh - pa - metro - area/ (2) http://fortune.com/fortune500/ (3) Excludes Allegheny County Operating Area (3) Deposits Market Rank Institution (State) Branches ($MM) Share (%) 1 PNC Financial Services Group (PA) 35 $4,348.0 20.6% 2 F.N.B. Corp. (PA) 27 1,767.8 8.4% 3 WesBanco Inc. (WV) 23 1,732.2 8.2% 4 Citizens Financial Group Inc. (RI) 28 1,558.9 7.4% 5 S&T Bancorp Inc. (PA) 11 1,174.6 5.6% 6 CB Financial Services Inc. (PA) 23 1,081.4 5.1% 7 WFSB Mutual Holding Company (PA) 9 1,000.0 4.7% 8 First Commonwealth Financial (PA) 18 953.1 4.5% 9 KeyCorp (OH) 13 804.5 3.8% 10 First FS&LA of Greene County (PA) 8 786.2 3.7% 11 United Bankshares Inc. (WV) 11 742.6 3.5% 12 Dollar Mutual Bancorp (PA) 6 428.7 2.0% 13 Huntington Bancshares Inc. (OH) 9 405.1 1.9% 14 CF Financial Corporation (PA) 9 390.1 1.8% 15 Main Street Finl Services Corp (WV) 4 372.2 1.8%
7 Empower our experienced, high quality employees to provide superior customer service in all aspects of our business Create a sales and service culture which builds full relationships with our customers Enhance profitability and efficiency while continuing to invest for future growth Continue our track record of opportunistic growth in the robust Pittsburgh MSA and across our footprint Evolve toward more electronic/digital products and processes driving greater efficiency and expand our brand awareness in our market by utilizing digital and other outlets Leverage our credit culture and strong loan underwriting to uphold our asset quality metrics Be the Community Bank of choice across our footprint for residents and small and medium sized businesses Strategic Vision for CBFV

Financial Update
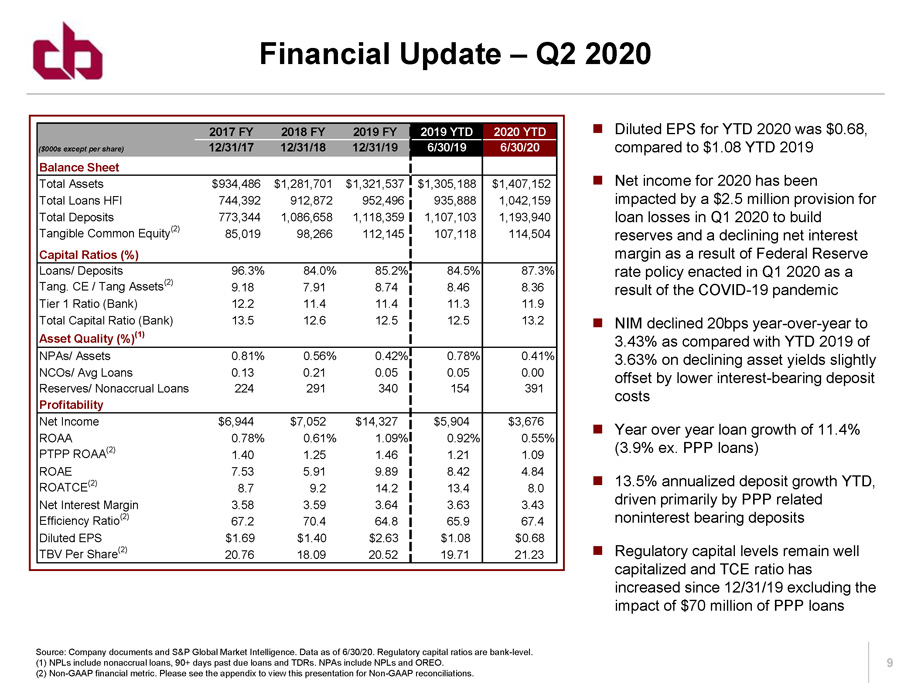
9 Diluted EPS for YTD 2020 was $0.68, compared to $1.08 YTD 2019 Net income for 2020 has been impacted by a $2.5 million provision for loan losses in Q1 2020 to build reserves and a declining net interest margin as a result of Federal Reserve rate policy enacted in Q1 2020 as a result of the COVID - 19 pandemic NIM declined 20bps year - over - year to 3.43% as compared with YTD 2019 of 3.63% on declining asset yields slightly offset by lower interest - bearing deposit costs Year over year loan growth of 11.4% (3.9% ex. PPP loans) 13.5% annualized deposit growth YTD, driven primarily by PPP related noninterest bearing deposits Regulatory capital levels remain well capitalized and TCE ratio has increased since 12/31/19 excluding the impact of $70 million of PPP loans Financial Update – Q2 2020 Source: Company documents and S&P Global Market Intelligence. Data as of 6/30/20. Regulatory capital ratios are bank - level. (1) NPLs include nonaccrual loans, 90+ days past due loans and TDRs. NPAs include NPLs and OREO. (2) Non - GAAP financial metric. Please see the appendix to view this presentation for Non - GAAP reconciliations. 2017 FY 2018 FY 2019 FY 2019 YTD 2020 YTD ($000s except per share) 12/31/17 12/31/18 12/31/19 6/30/19 6/30/20 Balance Sheet Total Assets $934,486 $1,281,701 $1,321,537 $1,305,188 $1,407,152 Total Loans HFI 744,392 912,872 952,496 935,888 1,042,159 Total Deposits 773,344 1,086,658 1,118,359 1,107,103 1,193,940 Tangible Common Equity (2) 85,019 98,266 112,145 107,118 114,504 Capital Ratios (%) Loans/ Deposits 96.3% 84.0% 85.2% 84.5% 87.3% Tang. CE / Tang Assets (2) 9.18 7.91 8.74 8.46 8.36 Tier 1 Ratio (Bank) 12.2 11.4 11.4 11.3 11.9 Total Capital Ratio (Bank) 13.5 12.6 12.5 12.5 13.2 Asset Quality (%) (1) NPAs/ Assets 0.81% 0.56% 0.42% 0.78% 0.41% NCOs/ Avg Loans 0.13 0.21 0.05 0.05 0.00 Reserves/ Nonaccrual Loans 224 291 340 154 391 Profitability Net Income $6,944 $7,052 $14,327 $5,904 $3,676 ROAA 0.78% 0.61% 1.09% 0.92% 0.55% PTPP ROAA (2) 1.40 1.25 1.46 1.21 1.09 ROAE 7.53 5.91 9.89 8.42 4.84 ROATCE (2) 8.7 9.2 14.2 13.4 8.0 Net Interest Margin 3.58 3.59 3.64 3.63 3.43 Efficiency Ratio (2) 67.2 70.4 64.8 65.9 67.4 Diluted EPS $1.69 $1.40 $2.63 $1.08 $0.68 TBV Per Share (2) 20.76 18.09 20.52 19.71 21.23
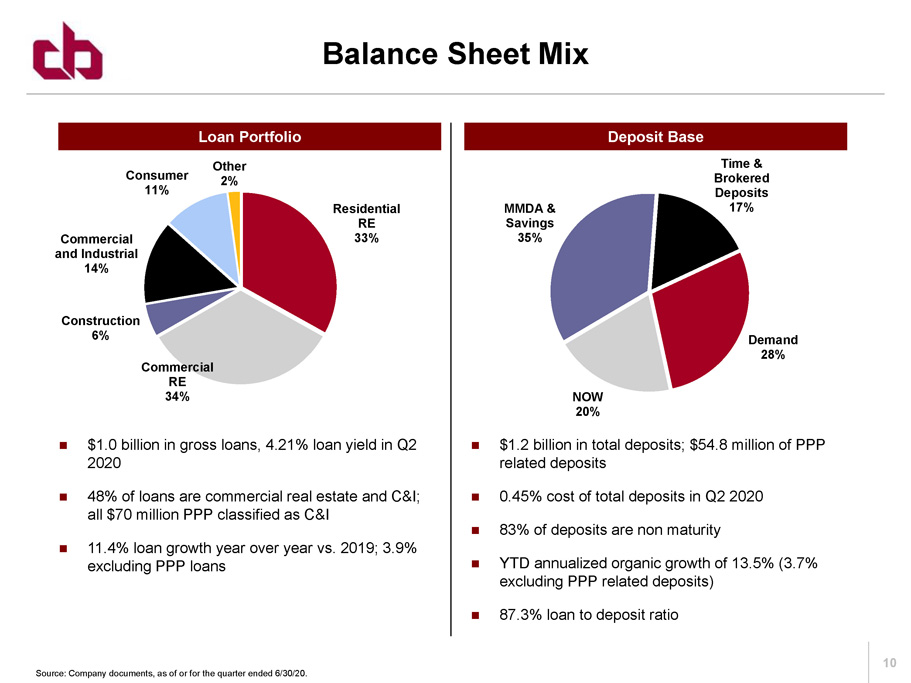
10 Deposit Base Loan Portfolio Balance Sheet Mix Source: Company documents, as of or for the quarter ended 6/30/20. $1.0 billion in gross loans, 4.21% loan yield in Q2 2020 48% of loans are commercial real estate and C&I; all $70 million PPP classified as C&I 11.4% loan growth year over year vs. 2019; 3.9% excluding PPP loans $1.2 billion in total deposits; $54.8 million of PPP related deposits 0.45% cost of total deposits in Q2 2020 83% of deposits are non maturity YTD annualized organic growth of 13.5% (3.7% excluding PPP related deposits) 87.3% loan to deposit ratio Residential RE 33% Commercial RE 34% Construction 6% Commercial and Industrial 14% Consumer 11% Other 2% Demand 28% NOW 20% MMDA & Savings 35% Time & Brokered Deposits 17%
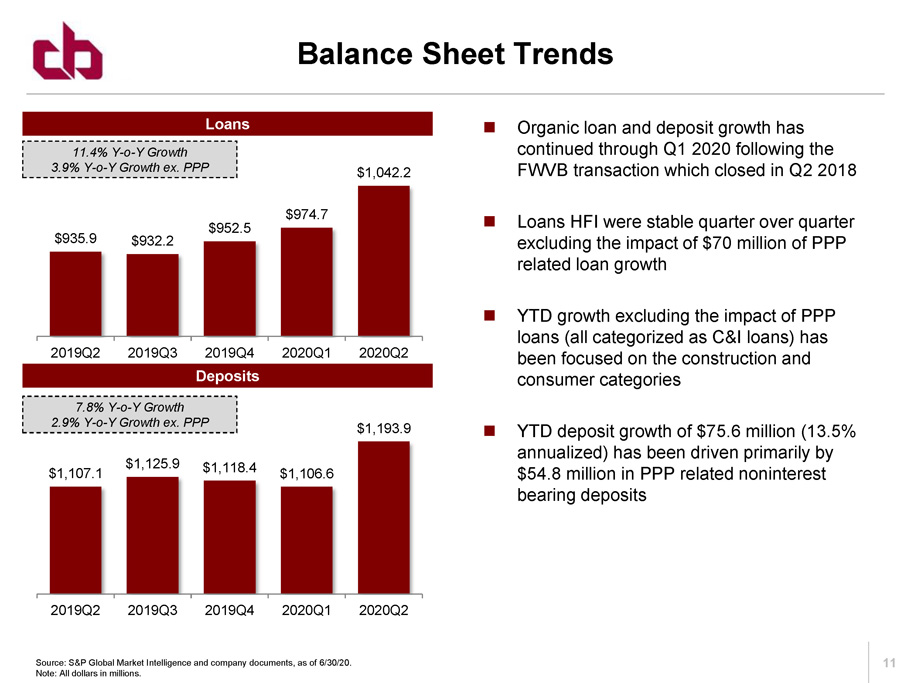
11 Loans Deposits Balance Sheet Trends Source: S&P Global Market Intelligence and company documents, as of 6/30/20. Note: All dollars in millions. Organic loan and deposit growth has continued through Q1 2020 following the FWVB transaction which closed in Q2 2018 Loans HFI were stable quarter over quarter excluding the impact of $70 million of PPP related loan growth YTD growth excluding the impact of PPP loans (all categorized as C&I loans) has been focused on the construction and consumer categories YTD deposit growth of $75.6 million (13.5% annualized) has been driven primarily by $54.8 million in PPP related noninterest bearing deposits $935.9 $932.2 $952.5 $974.7 $1,042.2 2019Q2 2019Q3 2019Q4 2020Q1 2020Q2 $1,107.1 $1,125.9 $1,118.4 $1,106.6 $1,193.9 2019Q2 2019Q3 2019Q4 2020Q1 2020Q2 11.4% Y - o - Y Growth 3.9% Y - o - Y Growth ex. PPP 7.8% Y - o - Y Growth 2.9% Y - o - Y Growth ex. PPP
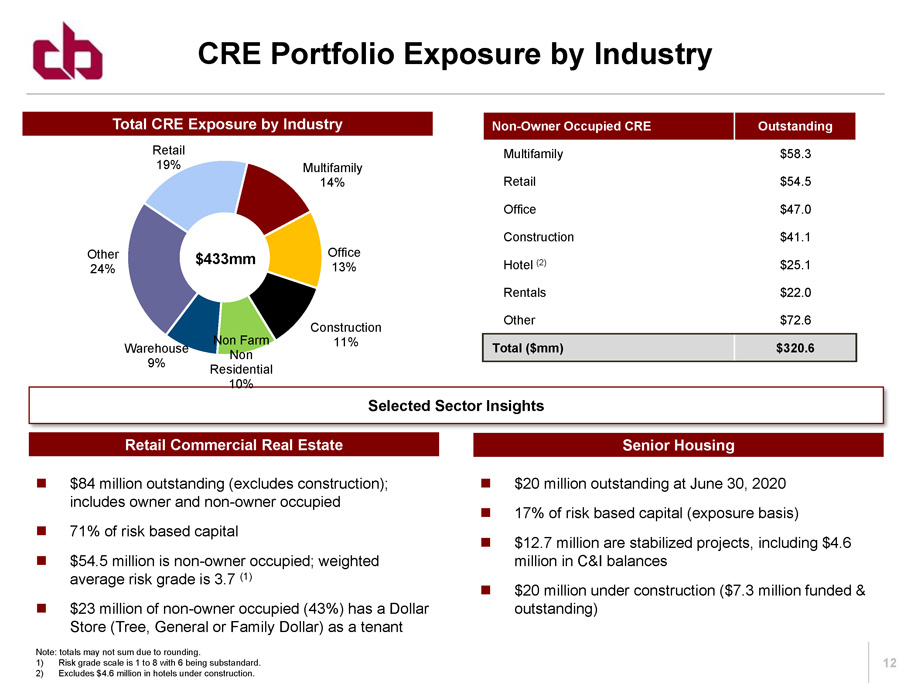
12 CRE Portfolio Exposure by Industry Note: totals may not sum due to rounding. 1) Risk grade scale is 1 to 8 with 6 being substandard. 2) Excludes $4.6 million in hotels under construction. Selected Sector Insights Retail Commercial Real Estate Senior Housing $84 million outstanding (excludes construction); includes owner and non - owner occupied 71% of risk based capital $54.5 million is non - owner occupied; weighted average risk grade is 3.7 (1) $23 million of non - owner occupied (43%) has a Dollar Store (Tree, General or Family Dollar) as a tenant $20 million outstanding at June 30, 2020 17% of risk based capital (exposure basis) $12.7 million are stabilized projects, including $4.6 million in C&I balances $20 million under construction ($7.3 million funded & outstanding) Retail 19% Multifamily 14% Office 13% Construction 11% Non Farm Non Residential 10% Warehouse 9% Other 24% $433mm Non - Owner Occupied CRE Outstanding Multifamily $58.3 Retail $54.5 Office $47.0 Construction $41.1 Hotel (2) $25.1 Rentals $22.0 Other $72.6 Total ($mm) $320.6 Total CRE Exposure by Industry
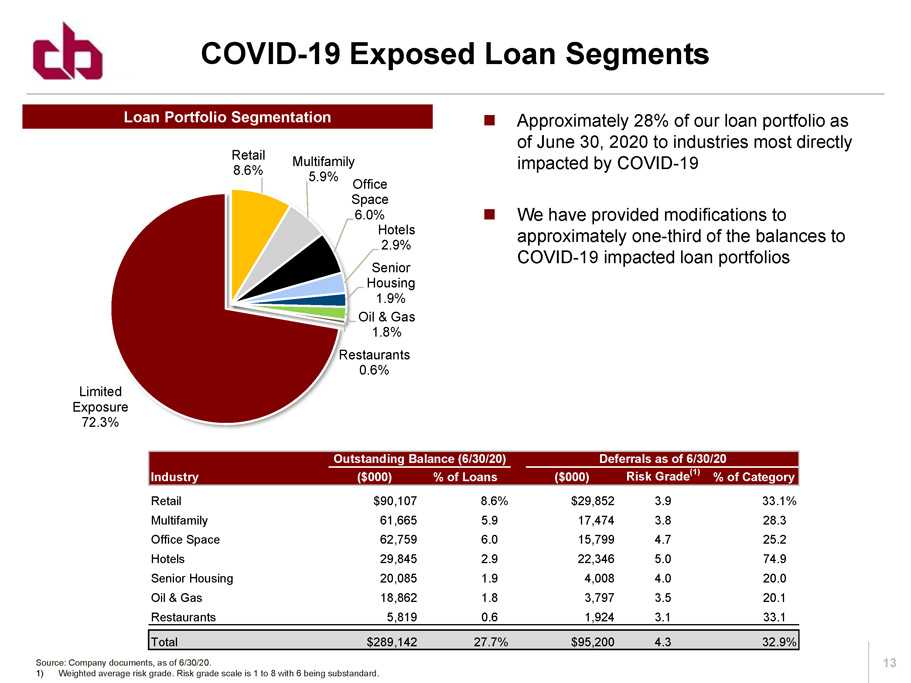
13 COVID - 19 Exposed Loan Segments Source: Company documents, as of 6/30/20. 1) Weighted average risk grade. Risk grade scale is 1 to 8 with 6 being substandard. Loan Portfolio Segmentation Retail 8.6% Multifamily 5.9% Office Space 6.0% Hotels 2.9% Senior Housing 1.9% Oil & Gas 1.8% Restaurants 0.6% Limited Exposure 72.3% Approximately 28% of our loan portfolio as of June 30, 2020 to industries most directly impacted by COVID - 19 We have provided modifications to approximately one - third of the balances to COVID - 19 impacted loan portfolios Outstanding Balance (6/30/20) Deferrals as of 6/30/20 Industry ($000) % of Loans ($000) Risk Grade (1) % of Category Retail $90,107 8.6% $29,852 3.9 33.1% Multifamily 61,665 5.9 17,474 3.8 28.3 Office Space 62,759 6.0 15,799 4.7 25.2 Hotels 29,845 2.9 22,346 5.0 74.9 Senior Housing 20,085 1.9 4,008 4.0 20.0 Oil & Gas 18,862 1.8 3,797 3.5 20.1 Restaurants 5,819 0.6 1,924 3.1 33.1 Total $289,142 27.7% $95,200 4.3 32.9%
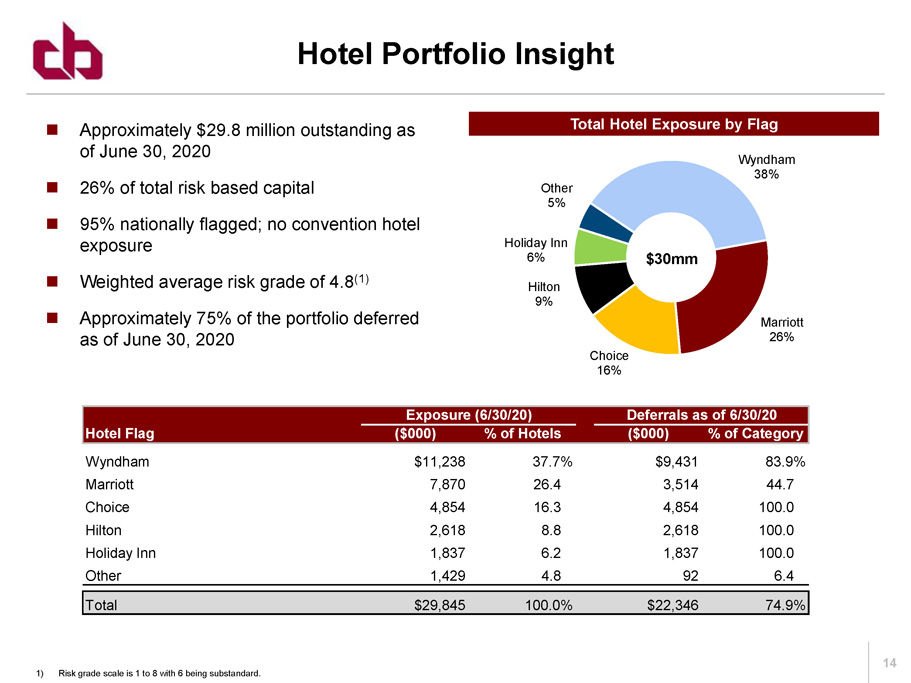
14 Hotel Portfolio Insight 1) Risk grade scale is 1 to 8 with 6 being substandard. Wyndham 38% Marriott 26% Choice 16% Hilton 9% Holiday Inn 6% Other 5% $30mm Total Hotel Exposure by Flag Approximately $29.8 million outstanding as of June 30, 2020 26% of total risk based capital 95% nationally flagged; no convention hotel exposure Weighted average risk grade of 4.8 (1) Approximately 75% of the portfolio deferred as of June 30, 2020 Exposure (6/30/20) Deferrals as of 6/30/20 Hotel Flag ($000) % of Hotels ($000) % of Category Wyndham $11,238 37.7% $9,431 83.9% Marriott 7,870 26.4 3,514 44.7 Choice 4,854 16.3 4,854 100.0 Hilton 2,618 8.8 2,618 100.0 Holiday Inn 1,837 6.2 1,837 100.0 Other 1,429 4.8 92 6.4 Total $29,845 100.0% $22,346 74.9%
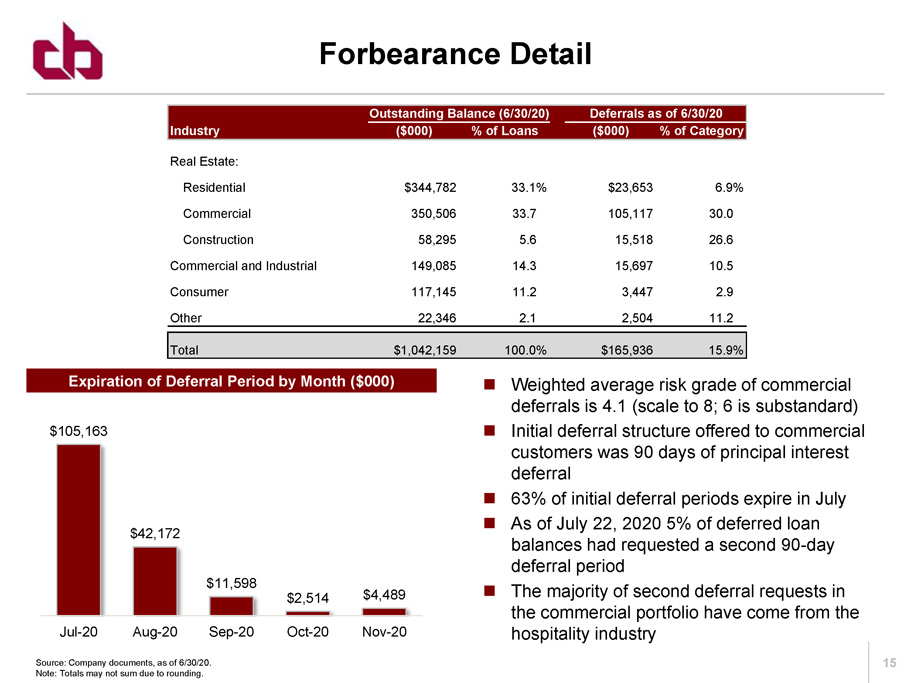
15 Forbearance Detail Expiration of Deferral Period by Month ($000) Weighted average risk grade of commercial deferrals is 4.1 (scale to 8; 6 is substandard) Initial deferral structure offered to commercial customers was 90 days of principal interest deferral 63% of initial deferral periods expire in July As of July 22, 2020 5% of deferred loan balances had requested a second 90 - day deferral period The majority of second deferral requests in the commercial portfolio have come from the hospitality industry $105,163 $42,172 $11,598 $2,514 $4,489 Jul-20 Aug-20 Sep-20 Oct-20 Nov-20 Source: Company documents, as of 6/30/20. Note: Totals may not sum due to rounding. Outstanding Balance (6/30/20) Deferrals as of 6/30/20 Industry ($000) % of Loans ($000) % of Category Real Estate: Residential $344,782 33.1% $23,653 6.9% Commercial 350,506 33.7 105,117 30.0 Construction 58,295 5.6 15,518 26.6 Commercial and Industrial 149,085 14.3 15,697 10.5 Consumer 117,145 11.2 3,447 2.9 Other 22,346 2.1 2,504 11.2 Total $1,042,159 100.0% $165,936 15.9%
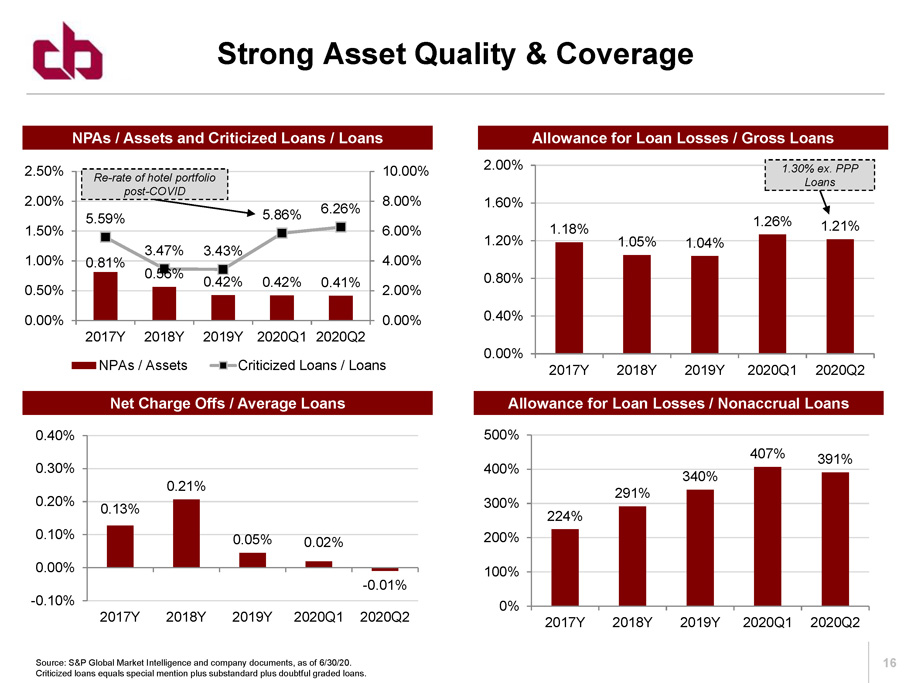
16 NPAs / Assets and Criticized Loans / Loans Allowance for Loan Losses / Gross Loans Net Charge Offs / Average Loans Strong Asset Quality & Coverage Source: S&P Global Market Intelligence and company documents, as of 6/30/20. Criticized loans equals special mention plus substandard plus doubtful graded loans. Allowance for Loan Losses / Nonaccrual Loans 0.81% 0.56% 0.42% 0.42% 0.41% 5.59% 3.47% 3.43% 5.86% 6.26% 0.00% 2.00% 4.00% 6.00% 8.00% 10.00% 0.00% 0.50% 1.00% 1.50% 2.00% 2.50% 2017Y 2018Y 2019Y 2020Q1 2020Q2 NPAs / Assets Criticized Loans / Loans 1.18% 1.05% 1.04% 1.26% 1.21% 0.00% 0.40% 0.80% 1.20% 1.60% 2.00% 2017Y 2018Y 2019Y 2020Q1 2020Q2 224% 291% 340% 407% 391% 0% 100% 200% 300% 400% 500% 2017Y 2018Y 2019Y 2020Q1 2020Q2 0.13% 0.21% 0.05% 0.02% - 0.01% -0.10% 0.00% 0.10% 0.20% 0.30% 0.40% 2017Y 2018Y 2019Y 2020Q1 2020Q2 Re - rate of hotel portfolio post - COVID 1.30% ex. PPP Loans
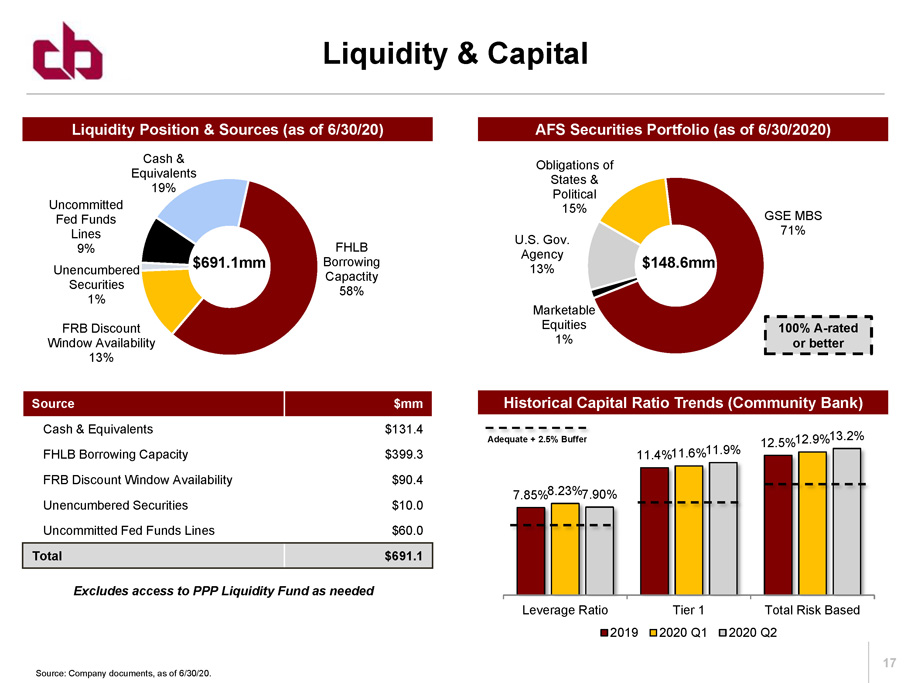
17 U.S. Gov. Agency 13% Obligations of States & Political 15% GSE MBS 71% Marketable Equities 1% Liquidity & Capital Source: Company documents, as of 6/30/20. Source $mm Cash & Equivalents $131.4 FHLB Borrowing Capacity $399.3 FRB Discount Window Availability $90.4 Unencumbered Securities $10.0 Uncommitted Fed Funds Lines $60.0 Total $691.1 Excludes access to PPP Liquidity Fund as needed $148.6mm Cash & Equivalents 19% FHLB Borrowing Capactity 58% FRB Discount Window Availability 13% Unencumbered Securities 1% Uncommitted Fed Funds Lines 9% $691.1mm 100% A - rated or better Totals may not sum due to rounding AFS Securities Portfolio (as of 6/30/2020) Liquidity Position & Sources (as of 6/30/20) 7.85% 11.4% 12.5% 8.23% 11.6% 12.9% 7.90% 11.9% 13.2% Leverage Ratio Tier 1 Total Risk Based 2019 2020 Q1 2020 Q2 Adequate + 2.5% Buffer Historical Capital Ratio Trends (Community Bank)
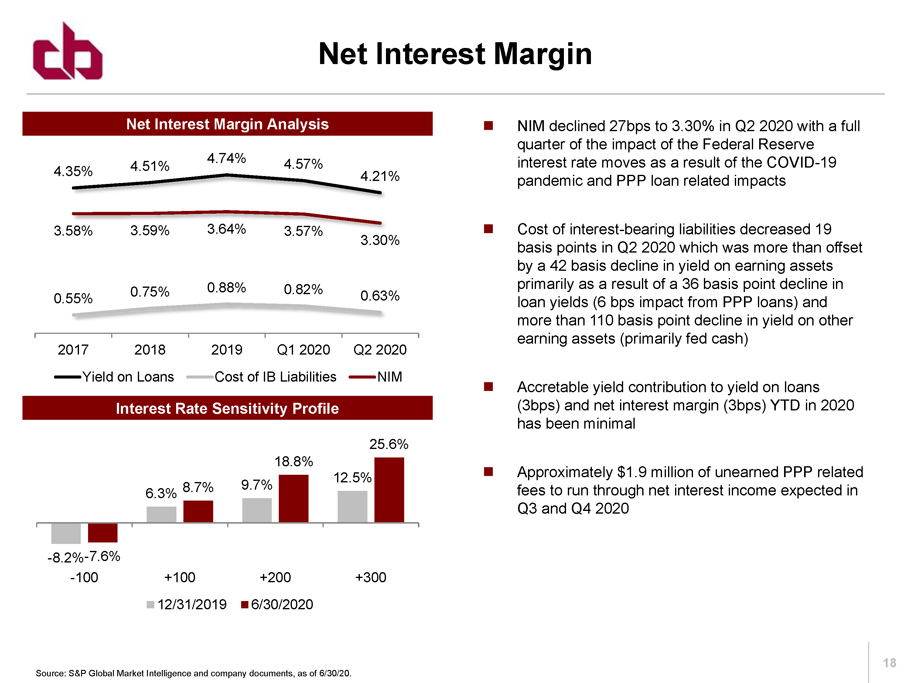
18 Net Interest Margin Analysis Interest Rate Sensitivity Profile Net Interest Margin Source: S&P Global Market Intelligence and company documents, as of 6/30/20. NIM declined 27bps to 3.30% in Q2 2020 with a full quarter of the impact of the Federal Reserve interest rate moves as a result of the COVID - 19 pandemic and PPP loan related impacts Cost of interest - bearing liabilities decreased 19 basis points in Q2 2020 which was more than offset by a 42 basis decline in yield on earning assets primarily as a result of a 36 basis point decline in loan yields (6 bps impact from PPP loans) and more than 110 basis point decline in yield on other earning assets (primarily fed cash) Accretable yield contribution to yield on loans (3bps) and net interest margin (3bps) YTD in 2020 has been minimal Approximately $1.9 million of unearned PPP related fees to run through net interest income expected in Q3 and Q4 2020 4.35% 4.51% 4.74% 4.57% 4.21% 0.55% 0.75% 0.88% 0.82% 0.63% 3.58% 3.59% 3.64% 3.57% 3.30% 2017 2018 2019 Q1 2020 Q2 2020 Yield on Loans Cost of IB Liabilities NIM - 8.2% 6.3% 9.7% 12.5% - 7.6% 8.7% 18.8% 25.6% -100 +100 +200 +300 12/31/2019 6/30/2020
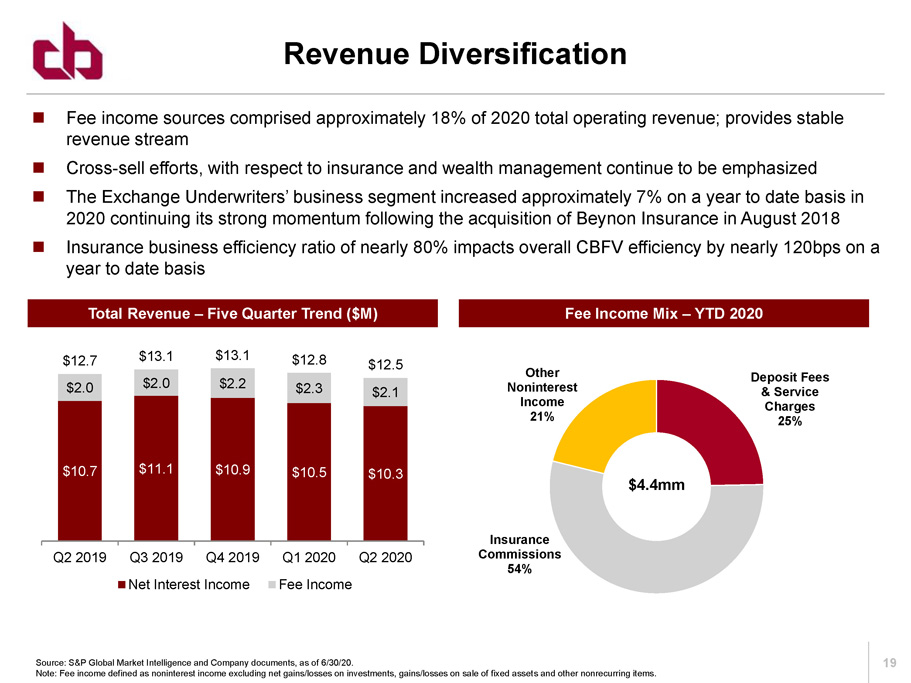
19 Deposit Fees & Service Charges 25% Insurance Commissions 54% Other Noninterest Income 21% Fee Income Mix – YTD 2020 Fee income sources comprised approximately 18% of 2020 total operating revenue; provides stable revenue stream Cross - sell efforts, with respect to insurance and wealth management continue to be emphasized The Exchange Underwriters’ business segment increased approximately 7% on a year to date basis in 2020 continuing its strong momentum following the acquisition of Beynon Insurance in August 2018 Insurance business efficiency ratio of nearly 80% impacts overall CBFV efficiency by nearly 120bps on a year to date basis Total Revenue – Five Quarter Trend ($M) Revenue Diversification Source: S&P Global Market Intelligence and Company documents, as of 6/30/20. Note: Fee income defined as noninterest income excluding net gains/losses on investments, gains/losses on sale of fixed asset s a nd other nonrecurring items. $10.7 $11.1 $10.9 $10.5 $10.3 $2.0 $2.0 $2.2 $2.3 $2.1 $12.7 $13.1 $13.1 $12.8 $12.5 Q2 2019 Q3 2019 Q4 2019 Q1 2020 Q2 2020 Net Interest Income Fee Income $4.4mm
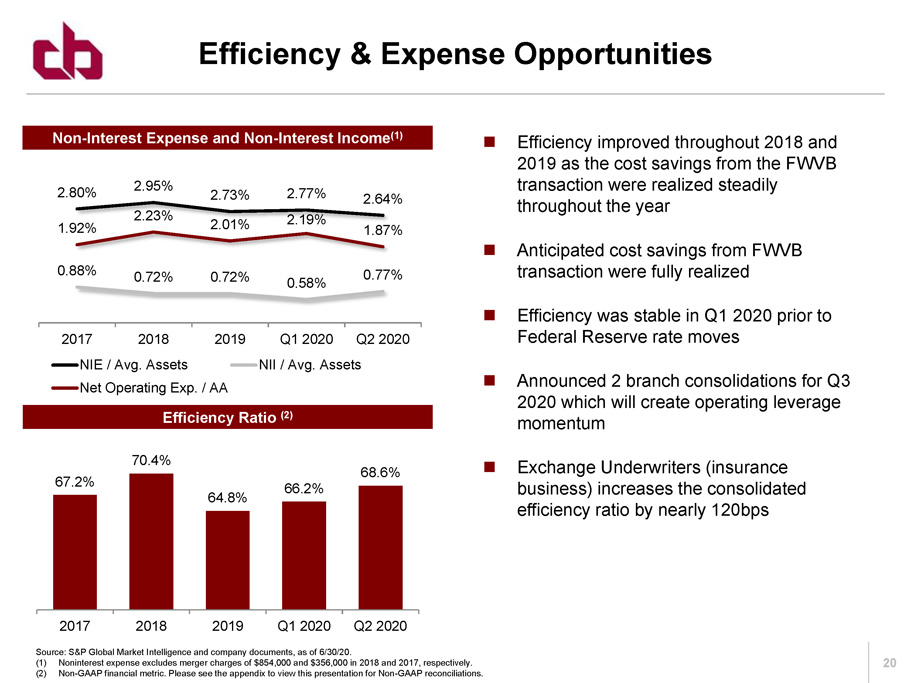
20 Non - Interest Expense and Non - Interest Income (1) Efficiency & Expense Opportunities Source: S&P Global Market Intelligence and company documents, as of 6/30/20. (1) Noninterest expense excludes merger charges of $854,000 and $356,000 in 2018 and 2017, respectively. (2) Non - GAAP financial metric. Please see the appendix to view this presentation for Non - GAAP reconciliations. Efficiency improved throughout 2018 and 2019 as the cost savings from the FWVB transaction were realized steadily throughout the year Anticipated cost savings from FWVB transaction were fully realized Efficiency was stable in Q1 2020 prior to Federal Reserve rate moves Announced 2 branch consolidations for Q3 2020 which will create operating leverage momentum Exchange Underwriters (insurance business) increases the consolidated efficiency ratio by nearly 120bps Efficiency Ratio (2) 67.2% 70.4% 64.8% 66.2% 68.6% 2017 2018 2019 Q1 2020 Q2 2020 2.80% 2.95% 2.73% 2.77% 2.64% 0.88% 0.72% 0.72% 0.58% 0.77% 1.92% 2.23% 2.01% 2.19% 1.87% 2017 2018 2019 Q1 2020 Q2 2020 NIE / Avg. Assets NII / Avg. Assets Net Operating Exp. / AA
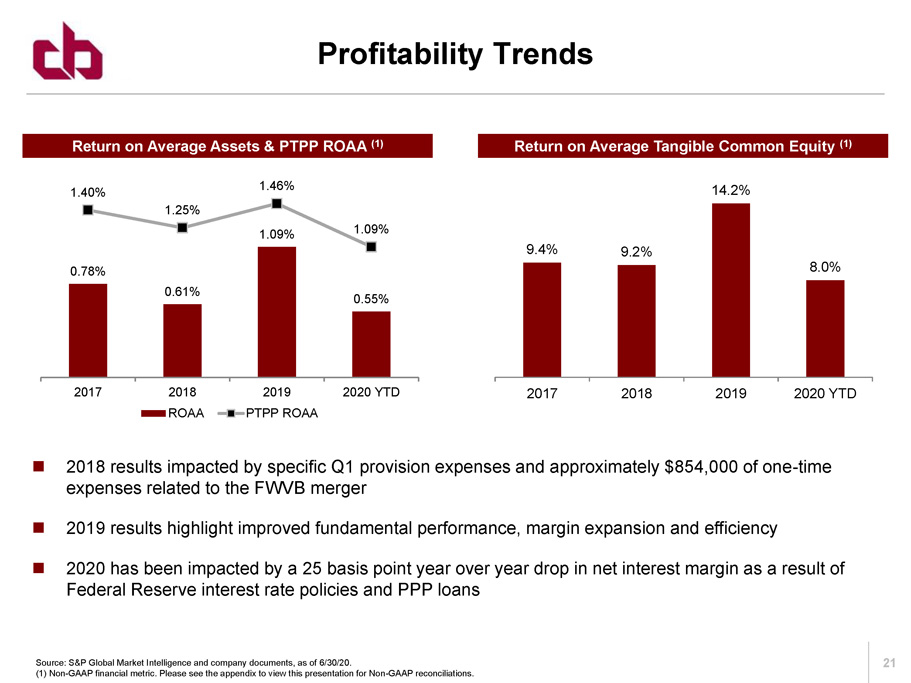
21 Return on Average Assets & PTPP ROAA (1) Return on Average Tangible Common Equity (1) Profitability Trends Source: S&P Global Market Intelligence and company documents, as of 6/30/20. (1) Non - GAAP financial metric. Please see the appendix to view this presentation for Non - GAAP reconciliations. 2018 results impacted by specific Q1 provision expenses and approximately $854,000 of one - time expenses related to the FWVB merger 2019 results highlight improved fundamental performance, margin expansion and efficiency 2020 has been impacted by a 25 basis point year over year drop in net interest margin as a result of Federal Reserve interest rate policies and PPP loans 9.4% 9.2% 14.2% 8.0% 2017 2018 2019 2020 YTD 0.78% 0.61% 1.09% 0.55% 1.40% 1.25% 1.46% 1.09% 2017 2018 2019 2020 YTD ROAA PTPP ROAA

Questions?

Appendix
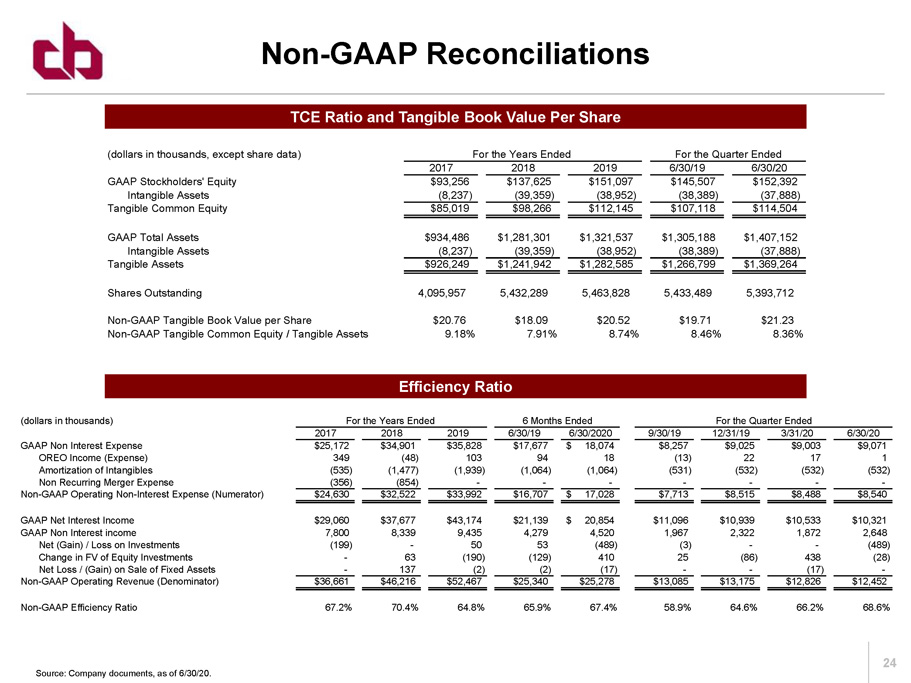
24 TCE Ratio and Tangible Book Value Per Share Efficiency Ratio Non - GAAP Reconciliations Source: Company documents, as of 6/30/20. (dollars in thousands) For the Years Ended 6 Months Ended For the Quarter Ended 2017 2018 2019 6/30/19 6/30/2020 9/30/19 12/31/19 3/31/20 6/30/20 GAAP Non Interest Expense $25,172 $34,901 $35,828 $17,677 18,074$ $8,257 $9,025 $9,003 $9,071 OREO Income (Expense) 349 (48) 103 94 18 (13) 22 17 1 Amortization of Intangibles (535) (1,477) (1,939) (1,064) (1,064) (531) (532) (532) (532) Non Recurring Merger Expense (356) (854) - - - - - - - Non-GAAP Operating Non-Interest Expense (Numerator) $24,630 $32,522 $33,992 $16,707 17,028$ $7,713 $8,515 $8,488 $8,540 GAAP Net Interest Income $29,060 $37,677 $43,174 $21,139 20,854$ $11,096 $10,939 $10,533 $10,321 GAAP Non Interest income 7,800 8,339 9,435 4,279 4,520 1,967 2,322 1,872 2,648 Net (Gain) / Loss on Investments (199) - 50 53 (489) (3) - - (489) Change in FV of Equity Investments - 63 (190) (129) 410 25 (86) 438 (28) Net Loss / (Gain) on Sale of Fixed Assets - 137 (2) (2) (17) - - (17) - Non-GAAP Operating Revenue (Denominator) $36,661 $46,216 $52,467 $25,340 $25,278 $13,085 $13,175 $12,826 $12,452 Non-GAAP Efficiency Ratio 67.2% 70.4% 64.8% 65.9% 67.4% 58.9% 64.6% 66.2% 68.6% (dollars in thousands, except share data) For the Years Ended For the Quarter Ended 2017 2018 2019 6/30/19 6/30/20 GAAP Stockholders' Equity $93,256 $137,625 $151,097 $145,507 $152,392 Intangible Assets (8,237) (39,359) (38,952) (38,389) (37,888) Tangible Common Equity $85,019 $98,266 $112,145 $107,118 $114,504 GAAP Total Assets $934,486 $1,281,301 $1,321,537 $1,305,188 $1,407,152 Intangible Assets (8,237) (39,359) (38,952) (38,389) (37,888) Tangible Assets $926,249 $1,241,942 $1,282,585 $1,266,799 $1,369,264 Shares Outstanding 4,095,957 5,432,289 5,463,828 5,433,489 5,393,712 Non-GAAP Tangible Book Value per Share $20.76 $18.09 $20.52 $19.71 $21.23 Non-GAAP Tangible Common Equity / Tangible Assets 9.18% 7.91% 8.74% 8.46% 8.36%
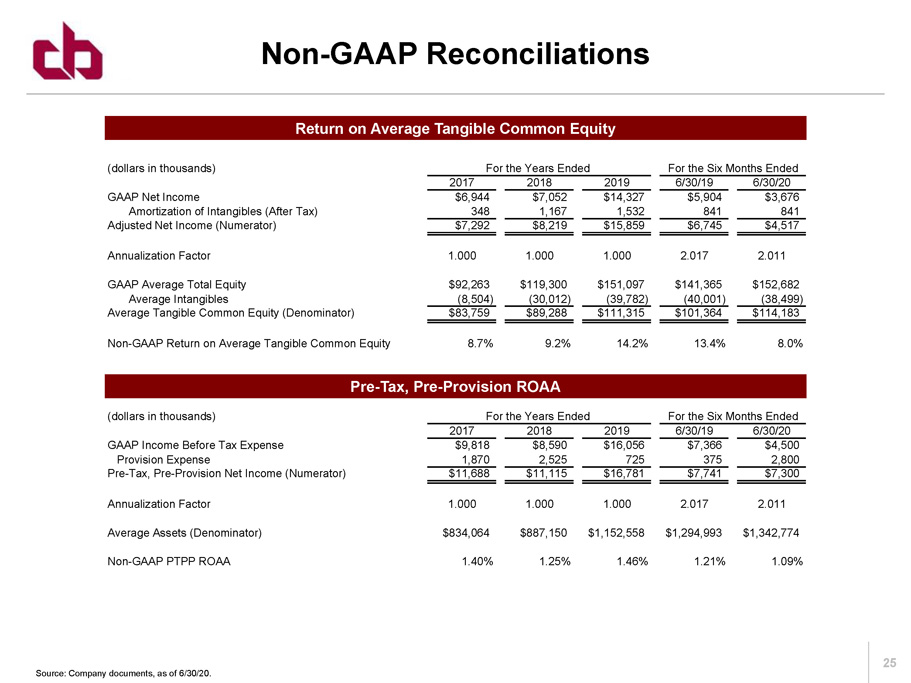
25 Return on Average Tangible Common Equity Non - GAAP Reconciliations Source: Company documents, as of 6/30/20. Pre - Tax, Pre - Provision ROAA (dollars in thousands) For the Years Ended For the Six Months Ended 2017 2018 2019 6/30/19 6/30/20 GAAP Income Before Tax Expense $9,818 $8,590 $16,056 $7,366 $4,500 Provision Expense 1,870 2,525 725 375 2,800 Pre-Tax, Pre-Provision Net Income (Numerator) $11,688 $11,115 $16,781 $7,741 $7,300 Annualization Factor 1.000 1.000 1.000 2.017 2.011 Average Assets (Denominator) $834,064 $887,150 $1,152,558 $1,294,993 $1,342,774 Non-GAAP PTPP ROAA 1.40% 1.25% 1.46% 1.21% 1.09% (dollars in thousands) For the Years Ended For the Six Months Ended 2017 2018 2019 6/30/19 6/30/20 GAAP Net Income $6,944 $7,052 $14,327 $5,904 $3,676 Amortization of Intangibles (After Tax) 348 1,167 1,532 841 841 Adjusted Net Income (Numerator) $7,292 $8,219 $15,859 $6,745 $4,517 Annualization Factor 1.000 1.000 1.000 2.017 2.011 GAAP Average Total Equity $92,263 $119,300 $151,097 $141,365 $152,682 Average Intangibles (8,504) (30,012) (39,782) (40,001) (38,499) Average Tangible Common Equity (Denominator) $83,759 $89,288 $111,315 $101,364 $114,183 Non-GAAP Return on Average Tangible Common Equity 8.7% 9.2% 14.2% 13.4% 8.0%