Attached files
| file | filename |
|---|---|
| EX-32.1 - EXHIBIT 32.1 - CB Financial Services, Inc. | exh_321.htm |
| EX-31.2 - EXHIBIT 31.2 - CB Financial Services, Inc. | exh_312.htm |
| EX-31.1 - EXHIBIT 31.1 - CB Financial Services, Inc. | exh_311.htm |
| EX-23 - EXHIBIT 23 - CB Financial Services, Inc. | exh_23.htm |
| EX-21 - EXHIBIT 21 - CB Financial Services, Inc. | exh_21.htm |
UNITED STATES
SECURITIES AND EXCHANGE COMMISSION
Washington, D.C. 20549
FORM 10-K
(Mark One)
| ☒ | ANNUAL REPORT PURSUANT TO SECTION 13 OR 15(d) OF THE SECURITIES EXCHANGE ACT OF 1934 |
For the fiscal year ended December 31, 2017
| OR |
| ☐ | TRANSITION REPORT PURSUANT TO SECTION 13 OR 15(d) OF THE SECURITIES EXCHANGE ACT OF 1934 |
For the transition period from __________ to __________
Commission file number: 001-36706
| CB FINANCIAL SERVICES, INC. | ||
| (Exact name of registrant as specified in its charter) |
| Pennsylvania | 51-0534721 | |
| (State or other jurisdiction of incorporation or organization) | (IRS Employer Identification Number) |
| 100 North Market Street, Carmichaels, Pennsylvania | 15320 | |
| (Address of principal executive offices) | (Zip Code) |
Registrant’s telephone number, including area code: (724) 966-5041
Securities registered under Section 12(b) of the Act:
| Title of each class | Name of each exchange on which registered | |
| Common Stock, par value $0.4167 per share | The Nasdaq Stock Market, LLC |
Securities registered under Section 12(g) of the Act: None
Indicate by check mark if the registrant is a well-known seasoned issuer, as defined in Rule 405 of the Securities Act.
Yes ☐ No ☒
Indicate by check mark if the registrant is not required to file reports pursuant to Section 13 or Section 15(d) of the Act.
Yes ☐ No ☒
Indicate by check mark whether the registrant (1) has filed all reports required to be filed by Section 13 or 15(d) of the Securities Exchange Act of 1934 during the preceding 12 months (or for such shorter period that the registrant was required to file such reports), and (2) has been subject to such filing requirements for the past 90 days. Yes ☒ No ☐
Indicate by check mark whether the registrant has submitted electronically and posted on its corporate Web site, if any, every Interactive Data File required to be submitted and posted pursuant to Rule 405 of Regulation S-T during the preceding 12 months (or for such shorter period that the registrant was required to submit and post such files). Yes ☒ No ☐
Indicate by check mark if disclosure of delinquent filers pursuant to Item 405 of Regulation S-K is not contained herein, and will not be contained, to the best of the registrant’s knowledge, in definitive proxy or information statements incorporated by reference in Part III of this Form 10-K or any amendment to this Form 10-K. ☐
Indicate by check mark whether the registrant is a large accelerated filer, an accelerated filer, a non-accelerated filer, a smaller reporting company, or an emerging growth company. See the definitions of “large accelerated filer,” “accelerated filer,” “smaller reporting company” and “emerging growth company” in Rule 12b-2 of the Exchange Act.
| Large accelerated filer ☐ | Accelerated filer ☒ |
| Non-accelerated filer ☐ (Do not check if a smaller reporting company) | Smaller reporting company ☐ |
| Emerging growth company ☒ | |
If an emerging growth company, indicate by check mark if the Registrant has elected not to use the extended transition period for complying with any new or revised financial accounting standards provided pursuant to Section 13(a) of the Exchange Act. ☒
Indicate by check mark whether the registrant is a shell company (as defined by Rule 12b-2 of the Act).
Yes ☐ No ☒
The aggregate market value of the voting and non-voting common equity held by non-affiliates of the Registrant, computed by reference to the last sale price on June 30, 2017, as reported by the Nasdaq Global Market, was approximately $95.7 million.
As of March 26, 2018, the number of shares outstanding of the Registrant’s Common Stock was 4,096,452.
TABLE OF CONTENTS
| ITEM 1. | Business |
Forward-Looking Statements
This Annual Report on Form 10-K contains forward-looking statements, which can be identified by the use of words such as “estimate,” “project,” “believe,” “intend,” “anticipate,” “assume,” “plan,” “seek,” “expect,” “will,” “may,” “should,” “indicate,” “would,” “believe,” “contemplate,” “continue,” “target” and words of similar meaning. These forward-looking statements include, but are not limited to:
| · | statements of our goals, intentions and expectations; |
| · | statements regarding our business plans, prospects, growth and operating strategies; |
| · | statements regarding the asset quality of our loan and investment portfolios; and |
| · | estimates of our risks and future costs and benefits. |
These forward-looking statements are based on our current beliefs and expectations, and are inherently subject to significant business, economic and competitive uncertainties and contingencies, many of which are beyond our control. In addition, these forward-looking statements are subject to assumptions with respect to future business strategies and decisions that are subject to change. We are under no duty to and do not take any obligation to update any forward-looking statements after the date of this Annual Report on Form 10-K.
The following factors, among others, could cause actual results to differ materially from the anticipated results or other expectations expressed in the forward-looking statements:
| · | our ability to manage our operations under the current economic conditions nationally and in our market area; |
| · | exploration and drilling of natural gas reserves in our market area may be affected by federal, state and local laws and regulations affecting production, permitting, environmental protection and other matters, which could materially and adversely affect our customers, loan and deposit volume, and asset quality; |
| · | our customers who depend on the exploration and drilling of natural gas reserves may be materially and adversely affected by decreases in the market prices for natural gas; |
| · | adverse changes in the financial industry, securities, credit, and national and local real estate markets (including real estate values); |
| · | significant increases in our loan losses, including our inability to resolve classified and nonperforming assets or reduce risks associated with our loans, and management’s assumptions in determining the adequacy of the allowance for loan losses; |
| · | credit risks of lending activities, including changes in the level and trend of loan delinquencies and write-offs and in our allowance for loan losses and provision for loan losses; |
| · | competition among depository and other financial institutions; |
| · | our ability to complete our pending merger with First West Virginia Bancorp, Inc.; |
| · | our ability to successfully integrate the operations of businesses we have acquired; |
| · | our success in increasing our commercial real estate and commercial business lending; |
| · | our ability to attract and maintain deposits and our success in introducing new financial products; |
| · | our ability to maintain/improve our asset quality even as we increase our commercial real estate and commercial business lending; |
| · | changes in interest rates generally, including changes in the relative differences between short-term and long-term interest rates and in deposit interest rates, that may affect our net interest margin and funding sources; |
| · | fluctuations in the demand for loans; |
| · | technological changes that may be more difficult or expensive than expected; |
| · | changes in consumer spending, borrowing and savings habits; |
| · | declines in the yield on our interest-earning assets resulting from the current low interest rate environment; |
| · | risks related to a high concentration of loans secured by real estate located in our market area; |
| 1 |
| · | our ability to enter new markets successfully and capitalize on growth opportunities; |
| · | changes in laws or government regulations or policies affecting financial institutions, including the Dodd-Frank Act and the JOBS Act, which could result in, among other things, increased deposit insurance premiums and assessments, capital requirements, regulatory fees and compliance costs, particularly the new capital regulations, and the resources we have available to address such changes; |
| · | changes in accounting policies and practices, as may be adopted by the bank regulatory agencies, the Financial Accounting Standards Board, the Securities and Exchange Commission or the Public Company Accounting Oversight Board; |
| · | changes in our compensation and benefit plans, and our ability to retain key members of our senior management team and to address staffing needs in response to product demand or to implement our strategic plans; |
| · | loan delinquencies and changes in the underlying cash flows of our borrowers; |
| · | our ability to control costs and expenses, particularly those associated with operating as a publicly traded company; |
| · | the failure or security breaches of computer systems on which we depend; |
| · | the ability of preventing or detecting cybersecurity attacks on customer credentials, developing multiple layers of security controls that defend against malicious use of customer internet-based products and services of Community Bank, and our business continuity plan to recover from a malware or other cybersecurity attack; |
| · | the ability of key third-party service providers to perform their obligations to us; and |
| · | other economic, competitive, governmental, regulatory and operational factors affecting our operations, pricing, products and services described elsewhere in this report. |
Because of these and a wide variety of other uncertainties, our actual future results may be materially different from the expected results indicated by these forward-looking statements.
In this Annual Report on Form 10-K, the terms “we,” “our,” and “us” refer to CB Financial Services, Inc., and Community Bank, unless the context indicates another meaning. In addition, we sometimes refer to CB Financial Services, Inc., as “CB,” or the “Company” and to Community Bank as the “Bank.”
CB Financial Services, Inc.
CB Financial Services, Inc. (the “Company”), a Pennsylvania corporation, is a bank holding company headquartered in Carmichaels, Pennsylvania. The Company’s common stock is traded on the Nasdaq Global Market under the symbol “CBFV.” The Company conducts its operations primarily through its wholly owned subsidiary, Community Bank, a Pennsylvania-chartered commercial bank. At December 31, 2017, the Company, on a consolidated basis, had total assets of $934.5 million, total deposits of $733.3 million and shareholders’ equity of $93.3 million.
Community Bank
Community Bank is a Pennsylvania-chartered commercial bank headquartered in Carmichaels, Pennsylvania. Community Bank is a community-oriented institution that conducts its business from its main office and 15 branches in Greene, Allegheny, Washington, Fayette and Westmoreland Counties in southwestern Pennsylvania by offering residential and commercial real estate loans, commercial and industrial loans, and consumer loans as well as a variety of deposit products for individuals and businesses in its market area. In addition, the Bank is the sole shareholder of Exchange Underwriters, Inc. ("Exchange Underwriters"), a wholly-owned subsidiary that is a full-service, independent insurance agency that offers property and casualty, commercial liability, surety and other insurance products.
The Bank was originally chartered in 1901 as The First National Bank of Carmichaels. In 1987, we changed our name to Community Bank, National Association. In December 2006, Community Bank completed a charter conversion from a national bank to a Pennsylvania-chartered commercial bank wholly-owned by the Company. Community Bank is a member of the Federal Home Loan Bank (“FHLB”) System. Our deposits are insured by the Federal Deposit Insurance Corporation (“FDIC”).
Our principal executive office is located at 100 North Market Street, Carmichaels, Pennsylvania, and our telephone number at that address is (724) 966-5041. Our website address is http://www.communitybank.tv. Information on this website is not and should not be considered to be a part of this Annual Report.
Pending Merger
On November 16, 2017, the Company signed a definitive merger agreement with First West Virginia Bancorp (“FWVB”), the holding company for Progressive Bank, N.A. (“PB”), a national association. Through the proposed merger, the Company anticipates future revenue and earnings growth from an expanded menu of financial services expanding the Company’s business footprint into the Ohio Valley. If completed, the merger will result in the addition of eight branches and expanded the Company’s reach into West Virginia with seven branches and one branch in Eastern Ohio. In connection with the merger, the Company expects to issue approximately 1,317,647 shares of common stock and pay estimated cash consideration of $9.8 million. The estimated merger value is approximately $49.0 million. Completion of the merger is subject to the receipt of shareholder and regulatory approvals and other customary closing conditions.
| 2 |
If completed, the merger will be accounted for as an acquisition in accordance with the acquisition method of accounting as detailed in Accounting Standards Codification ("ASC") 805, Business Combinations. The acquisition method of accounting requires an acquirer to recognize the assets acquired and the liabilities assumed based on their fair values as of the date of acquisition. This process is heavily reliant on measuring and estimating the fair values of all the assets and liabilities of the acquired entity. To the extent we do not have the requisite expertise to determine the fair values of the assets acquired and liabilities assumed, we are engaging third-party valuation specialists to assist us in determining such values.
Market Area
The Company’s southwestern Pennsylvania market area consists of Greene, Allegheny, Washington, Fayette and Westmoreland Counties in southwestern Pennsylvania. Our branches located in Allegheny, Fayette, Washington and Westmoreland Counties are in the southern suburban area of metropolitan Pittsburgh. The area has been impacted by the energy industry through the extraction of untapped natural gas reserves in the Marcellus Shale Formation. The Marcellus Shale Formation extends throughout much of the Appalachian Basin and most of Pennsylvania, and is located near high-demand markets along the east coast. The proximity to these markets makes it an attractive target for energy development and has resulted in significant job creation through the development of gas wells and transportation of gas. Greene County is a significantly more rural county compared to the counties in which we have our other branches.
Based on data published by the Pennsylvania Department of Labor and Industry, the estimated populations of Allegheny, Greene, Washington, Fayette and Westmoreland Counties are approximately 1.3 million, 41,000, 203,000, 149,000 and 370,000, respectively. The December 2017 unemployment rates for Allegheny, Greene, Washington, Fayette and Westmoreland Counties were 4.8%, 5.7%, 5.2%, 7.0% and 5.2%, respectively, compared to a state-wide average of 4.7%. The average annual wage as of the third quarter of 2017 (the latest data available) in Allegheny, Greene, Washington, Fayette and Westmoreland Counties was $56,000, $56,000, $51,000, $38,000, and $44,000, respectively, compared to $52,000 statewide.
Competition
We encounter significant competition both in attracting deposits and in originating real estate and other loans. Our most direct competition for deposits historically has come from other commercial banks, savings banks, savings associations and credit unions in our market area, and we expect continued strong competition from such financial institutions in the foreseeable future. The Company faces additional competition for deposits from online financial institutions and non-depository competitors, such as the mutual fund industry, securities and brokerage firms, and insurance companies. We compete for deposits by offering depositors a high level of personal service and expertise together with a wide range of financial services. Our deposit sources are primarily concentrated in the communities surrounding our banking offices located in Greene, Allegheny, Washington, Fayette and Westmoreland Counties, Pennsylvania. As of June 30, 2017, our FDIC-insured deposit market share in the counties we serve out of 42 bank and thrift institutions with offices in Greene, Allegheny, Washington, Fayette and Westmoreland Counties, Pennsylvania, was 0.57%. Such data does not reflect deposits held by credit unions.
The competition for real estate and other loans comes principally from other commercial banks, mortgage banking companies, government-sponsored entities, savings banks and savings associations. This competition for loans has increased substantially in recent years. We compete for loans primarily through the interest rates and loan fees we charge and the efficiency and quality of services we provide to borrowers and home builders. Factors that affect competition include general and local economic conditions, current interest rate levels and the volatility of the mortgage markets.
Lending Activities
General. Historically, our principal lending activity has been the origination of residential loans secured by one- to four-family residential properties in our local market area and commercial real estate, construction, commercial and industrial, and consumer loans. At December 31, 2017, our net loans receivable totaled $735.6 million compared to $674.1 million at December 31, 2016. Commercial and industrial loans increased $27.0 million primarily due to a concerted effort to increase our market share. Construction loans increased $25.5 million primarily due to the origination of construction projects. Commercial Real Estate loans increased $8.0 million primarily due to continued emphasis for growth in this area of the loan portfolio. Residential Real Estate loans increased $1.9 million due to retaining mortgage loans as a result of rising interest rates which lead to a decline in sold mortgage loans.
| 3 |
Loan Portfolio Composition. The Company primarily originates residential real estate, commercial real estate, construction, commercial and industrial, consumer and other loans. The following table sets forth the composition of the Company’s loan portfolio by type of loan at the dates indicated, excluding loans held for sale.
| (Dollars in thousands) | ||||||||||||||||||||||||||||||||||||||||
| December 31, | ||||||||||||||||||||||||||||||||||||||||
| 2017 | 2016 | 2015 | 2014 | 2013 | ||||||||||||||||||||||||||||||||||||
| Amount | Percent | Amount | Percent | Amount | Percent | Amount | Percent | Amount | Percent | |||||||||||||||||||||||||||||||
| Originated Loans | ||||||||||||||||||||||||||||||||||||||||
| Real Estate: | ||||||||||||||||||||||||||||||||||||||||
| Residential | $ | 200,486 | 32.6 | % | $ | 186,077 | 35.4 | % | $ | 170,169 | 35.2 | % | $ | 161,719 | 39.4 | % | $ | 157,520 | 41.5 | % | ||||||||||||||||||||
| Commercial | 160,235 | 26.1 | 139,894 | 26.7 | 127,614 | 26.4 | 104,994 | 25.7 | 102,058 | 27.0 | ||||||||||||||||||||||||||||||
| Construction | 36,149 | 5.9 | 10,646 | 2.0 | 17,343 | 3.6 | 10,039 | 2.5 | 10,367 | 2.7 | ||||||||||||||||||||||||||||||
| Commercial | ||||||||||||||||||||||||||||||||||||||||
| and Industrial | 100,294 | 16.3 | 71,091 | 13.5 | 60,487 | 12.5 | 53,238 | 13.0 | 49,017 | 12.9 | ||||||||||||||||||||||||||||||
| Consumer | 114,358 | 18.6 | 114,007 | 21.7 | 103,605 | 21.4 | 76,242 | 18.6 | 59,101 | 15.6 | ||||||||||||||||||||||||||||||
| Other | 3,376 | 0.5 | 3,637 | 0.7 | 4,592 | 0.9 | 3,099 | 0.8 | 1,083 | 0.3 | ||||||||||||||||||||||||||||||
| Total loans | 614,898 | 100.0 | % | 525,352 | 100.0 | % | 483,810 | 100.0 | % | 409,331 | 100.0 | % | 379,146 | 100.0 | % | |||||||||||||||||||||||||
| Allowance for losses | (8,215 | ) | (7,283 | ) | (6,490 | ) | (5,195 | ) | (5,382 | ) | ||||||||||||||||||||||||||||||
| Loans, net | $ | 606,683 | $ | 518,069 | $ | 477,320 | $ | 404,136 | $ | 373,764 | ||||||||||||||||||||||||||||||
| Loans Acquired at Fair Value | ||||||||||||||||||||||||||||||||||||||||
| Real Estate: | ||||||||||||||||||||||||||||||||||||||||
| Residential | $ | 72,952 | 56.3 | % | $ | 85,511 | 54.7 | % | $ | 103,058 | 51.7 | % | $ | 161,561 | 58.4 | % | ||||||||||||||||||||||||
| Commercial | 48,802 | 37.7 | 61,116 | 39.0 | 75,406 | 37.8 | 77,864 | 28.2 | ||||||||||||||||||||||||||||||||
| Construction | - | 0.0 | - | 0.0 | 3,870 | 1.9 | 12,158 | 4.4 | ||||||||||||||||||||||||||||||||
| Commercial | ||||||||||||||||||||||||||||||||||||||||
| and Industrial | 7,541 | 5.8 | 9,721 | 6.2 | 16,660 | 8.3 | 23,363 | 8.5 | ||||||||||||||||||||||||||||||||
| Consumer | 199 | 0.2 | 197 | 0.1 | 550 | 0.3 | 1,369 | 0.5 | ||||||||||||||||||||||||||||||||
| Total loans | $ | 129,494 | 100.0 | % | $ | 156,545 | 100.0 | % | $ | 199,544 | 100.0 | % | $ | 276,315 | 100.0 | % | ||||||||||||||||||||||||
| Allowance for losses | (581 | ) | (520 | ) | - | - | ||||||||||||||||||||||||||||||||||
| Loans, net | $ | 128,913 | $ | 156,025 | $ | 199,544 | $ | 276,315 | ||||||||||||||||||||||||||||||||
| Total Loans | ||||||||||||||||||||||||||||||||||||||||
| Real Estate: | ||||||||||||||||||||||||||||||||||||||||
| Residential | $ | 273,438 | 36.7 | % | $ | 271,588 | 39.8 | % | $ | 273,227 | 40.0 | % | $ | 323,280 | 47.1 | % | $ | 157,520 | 41.5 | % | ||||||||||||||||||||
| Commercial | 209,037 | 28.1 | 201,010 | 29.5 | 203,020 | 29.7 | 182,858 | 26.7 | 102,058 | 27.0 | ||||||||||||||||||||||||||||||
| Construction | 36,149 | 4.9 | 10,646 | 1.6 | 21,213 | 3.1 | 22,197 | 3.2 | 10,367 | 2.7 | ||||||||||||||||||||||||||||||
| Commercial | ||||||||||||||||||||||||||||||||||||||||
| and Industrial | 107,835 | 14.5 | 80,812 | 11.9 | 77,147 | 11.3 | 76,601 | 11.2 | 49,017 | 12.9 | ||||||||||||||||||||||||||||||
| Consumer | 114,557 | 15.4 | 114,204 | 16.7 | 104,155 | 15.2 | 77,611 | 11.3 | 59,101 | 15.6 | ||||||||||||||||||||||||||||||
| Other | 3,376 | 0.4 | 3,637 | 0.5 | 4,592 | 0.7 | 3,099 | 0.5 | 1,083 | 0.3 | ||||||||||||||||||||||||||||||
| Total loans | 744,392 | 100.0 | % | 681,897 | 100.0 | % | 683,354 | 100.0 | % | 685,646 | 100.0 | % | 379,146 | 100.0 | % | |||||||||||||||||||||||||
| Allowance for losses | (8,796 | ) | (7,803 | ) | (6,490 | ) | (5,195 | ) | (5,382 | ) | ||||||||||||||||||||||||||||||
| Loans, net | $ | 735,596 | $ | 674,094 | $ | 676,864 | $ | 680,451 | $ | 373,764 | ||||||||||||||||||||||||||||||
Residential Real Estate Loans. Residential real estate loans are comprised of loans secured by one- to four-family residential and, to a lesser extent, multifamily properties. Included in residential real estate loans are traditional one- to four-family mortgage loans, multifamily mortgage loans, home equity installment loans, and home equity lines of credit. We generate loans through our marketing efforts, existing customers and referrals, real estate brokers, builders and local businesses. At December 31, 2017, $273.4 million, or 36.7% of our total loan portfolio, was invested in residential loans.
One- to Four-Family Mortgage Loans. Historically our primary lending activity has been the origination of fixed-rate, one- to four-family, owner-occupied, residential mortgage loans with terms up to 30 years secured by property located in our market area. At December 31, 2017, one- to four-family mortgage loans totaled $181.2 million. Our fixed-rate one- to four-family residential mortgage loans are generally conforming loans, underwritten according to secondary market guidelines. We generally originate fixed-rate mortgage loans in amounts up to the maximum conforming loan limits established by the Federal Housing Finance Agency, which is generally $424,100 for single-family homes, except in certain high-cost areas in the United States. At December 31, 2017, we had 33 one- to four-family residential mortgage loans totaling $20.3 million with principal balances in excess of $424,100, commonly referred to as jumbo loans. Our fixed-rate mortgage loans amortize monthly with principal and interest due each month. These loans often remain outstanding for significantly shorter periods than their contractual terms because borrowers may refinance or prepay loans at their option without a prepayment penalty.
| 4 |
When underwriting one- to four-family mortgage loans, we review and verify each loan applicant’s income and credit history. Management believes that stability of income and past credit history are integral parts in the underwriting process. Written appraisals are generally required on real estate property offered to secure an applicant’s loan. We generally limit the loan-to-value ratios of one- to four-family residential mortgage loans to 80% of the purchase price or appraised value of the property, whichever is less. For one- to four-family real estate loans with loan-to-value ratios of over 80%, we generally require private mortgage insurance. We require fire and casualty insurance on all properties securing real estate loans. We require title insurance, or an attorney’s title opinion, as circumstances warrant.
Our one- to four-family mortgage loans customarily include due-on-sale clauses, which give us the right to declare a loan immediately due and payable in the event, among other things, that the borrower sells or otherwise disposes of the underlying real property serving as collateral for the loan.
Fixed-rate one- to four-family residential mortgage loans with terms of 15 years or more are originated for resale to the secondary market. During the years ended December 31, 2017 and 2016, we originated $19.8 and $22.2 million of fixed-rate residential mortgage loans, respectively, which were subsequently sold in the secondary mortgage market.
The origination of fixed-rate mortgage loans versus adjustable-rate mortgage loans is monitored on an ongoing basis and is affected significantly by the level of market interest rates, customer preference, our interest rate risk position and our competitors’ loan products. We no longer offer adjustable-rate mortgage loans, but in the past offered them for terms ranging up to 30 years. Adjustable-rate mortgage loans secured by one- to four-family residential real estate totaled $16.8 million at December 31, 2017. Adjustable-rate mortgage loans make our loan portfolio more interest rate sensitive. However, as the interest income earned on adjustable-rate mortgage loans varies with prevailing interest rates, such loans do not offer predictable cash flows in the same manner as long-term, fixed-rate loans. Adjustable-rate mortgage loans carry increased credit risk associated with potentially higher monthly payments by borrowers as general market interest rates increase. It is possible that during periods of rising interest rates that the risk of delinquencies and defaults on adjustable-rate mortgage loans may increase due to the upward adjustment of interest costs to the borrower, resulting in increased loan losses.
We do not offer an “interest only” mortgage loan product on one- to four-family residential properties (where the borrower pays interest for an initial period, after which the loan converts to a fully amortizing loan). We also do not offer loans that provide for negative amortization of principal, such as “Option ARM” loans, where the borrower can pay less than the interest owed on the loan, resulting in an increased principal balance during the life of the loan. We do not offer a “subprime loan” program (loans that generally target borrowers with weakened credit histories typically characterized by payment delinquencies, previous charge-offs, judgments, bankruptcies, or borrowers with questionable repayment capacity as evidenced by low credit scores or high debt-burden ratios) or Alt-A loans (traditionally defined as loans having less than full documentation). We may originate loans to consumers with a credit score below 660. This may be defined as subprime loans. There are typically mitigating circumstances that according to FDIC guidance and our opinion would not designate such loans as “subprime.”
Home Equity Loans. At December 31, 2017, home equity loans totaled $92.2 million. Our home equity loans and lines of credit are generally secured by the borrower’s principal residence. The maximum amount of a home equity loan or line of credit is generally 85% of the appraised value of a borrower’s real estate collateral less the amount of any prior mortgages or related liabilities. Home equity loans and lines of credit are approved with both fixed and adjustable interest rates, which we determine based upon market conditions. Such loans are fully amortized over the life of the loan. Generally, the maximum term for home equity loans is 15 years.
Our underwriting standards for home equity loans include a determination of the applicant’s credit history and an assessment of the applicant’s ability to meet existing obligations and payments on the proposed loan. The stability of the applicant’s monthly income may be determined by verification of gross monthly income from primary employment, and additionally from any verifiable secondary income. We also consider the length of employment with the borrower’s present employer. Creditworthiness of the applicant is of primary consideration; however, the underwriting process also includes a comparison of the value of the collateral in relation to the proposed loan amount.
Home equity loans entail greater risks than one- to four-family residential mortgage loans, which are secured by first lien mortgages. In such cases, collateral repossessed after a default may not provide an adequate source of repayment of the outstanding loan balance because of damage or depreciation in the value of the property or loss of equity to the first lien position. Further, home equity loan payments are dependent on the borrower’s continuing financial stability, and therefore are more likely to be adversely affected by job loss, divorce, illness or personal bankruptcy. Finally, the application of various federal and state laws, including federal and state bankruptcy and insolvency laws, may limit the amount that can be recovered on such loans in the event of a default.
| 5 |
Commercial Real Estate Loans. We originate commercial real estate loans that are secured primarily by improved properties, such as retail facilities, office buildings and other non-residential buildings. At December 31, 2017, $209.0 million, or 28.1% of our total loan portfolio, consisted of commercial real estate loans.
Our commercial real estate loans generally have terms of up to 15 years and have adjustable interest rates. The adjustable rate loans are typically fixed for the first five years and adjust every five years thereafter. The maximum loan-to-value ratio of our commercial real estate loans is generally 75% to 80% of the lower of cost or appraised value of the property securing the loan.
We consider a number of factors in originating commercial real estate loans. We evaluate the qualifications and financial condition of the borrower, including project-level and global cash flows and debt service coverage, credit history and management expertise, as well as the value and condition of the property, securing the loan. When evaluating the qualifications of the borrower, we consider the financial resources of the borrower, the borrower’s experience in owning or managing similar property and the borrower’s payment history with Community Bank and other financial institutions. In evaluating the property securing the loan, the factors considered include the net operating income of the mortgaged property before debt service and depreciation, and the ratio of the loan amount to the appraised value of the property. We generally will not lend to High Volatility Commercial Real Estate (HVCRE) projects. All commercial real estate loans are appraised by outside independent state certified general appraisers. Personal guarantees are generally obtained from the principals of commercial real estate loan borrowers, although this requirement may be waived in limited circumstances depending upon the loan-to-value ratio and the debt-service ratio associated with the loan. Community Bank requires property and casualty insurance and flood insurance if the property is in a flood zone area.
We underwrite commercial real estate loan participations to the same standards as loans originated by us. In addition, we consider the financial strength and reputation of the lead lender. We require the lead lender to provide a full closing package as well as annual financial statements for the borrower and related entities so that we can conduct an annual loan review for all loan participations. Loans secured by commercial real estate generally involve a greater degree of credit risk than residential mortgage loans and carry larger loan balances. This increased credit risk is a result of several factors, including the effects of general economic conditions on income producing properties and the successful operation or management of the properties securing the loans. Furthermore, the repayment of loans secured by commercial real estate is typically dependent upon the successful operation of the related business and real estate property. If the cash flow from the project is reduced, the borrower’s ability to repay the loan may be impaired.
Construction Loans. We originate construction loans to individuals to finance the construction of residential dwellings and also originate loans for the construction of commercial properties, including hotels, apartment buildings, housing developments, and owner-occupied properties used for businesses. At December 31, 2017, $36.1 million, or 4.9% of our total loan portfolio, consisted of construction loans. Our construction loans generally provide for the payment of interest only during the construction phase, which is usually 12 to 18 months. At the end of the construction phase, the loan generally converts to a permanent residential or commercial mortgage loan. Loans generally can be made with a maximum loan-to-value ratio of 80% on both residential and commercial construction. Before making a commitment to fund a construction loan, we require a pro forma appraisal of the property, as completed by an independent licensed appraiser. We also will require an inspection of the property before disbursement of funds during the term of the construction loan. We typically do not lend to developers unless they maintain a 15% cash equity position in the project.
Commercial and Industrial Loans. We originate commercial and industrial loans and lines of credit to borrowers located in our market area that are generally secured by collateral other than real estate, such as equipment, inventory, and other business assets. At December 31, 2017, $107.8 million, or 14.5% of our total loan portfolio, consisted of commercial and industrial loans. The loans generally have terms of maturity from three to five years with adjustable interest rates tied to the prime rate LIBOR or the weekly average of the FHLB of Pittsburgh three to ten year fixed rates. We generally obtain personal guarantees from the borrower or a third party as a condition to originating the loan. On a limited basis, we will originate unsecured business loans in those instances where the applicant’s financial strength and creditworthiness has been established. Commercial business loans generally bear higher interest rates than residential loans, but they also may involve a higher risk of default because their repayment is generally dependent on the successful operation of the borrower’s business.
Our underwriting standards for commercial business loans include a determination of the applicant’s ability to meet existing obligations and payments on the proposed loan from normal cash flows generated in the applicant’s business. We assess the financial strength of each applicant through the review of financial statements and tax returns provided by the applicant. The creditworthiness of an applicant is derived from a review of credit reports as well as a search of public records. We periodically review business loans following origination. We request financial statements at least annually and review them for substantial deviations or changes that might affect repayment of the loan. Our loan officers may also visit the premises of borrowers to observe the business premises, facilities, and personnel and to inspect the pledged collateral. Underwriting standards for business loans are different for each type of loan depending on the financial strength of the applicant and the value of collateral offered as security. All commercial loans are assigned a risk rating. These ratings are reviewed annually by the independent loan review professionals.
| 6 |
Consumer Loans. We originate consumer loans that primarily consist of indirect auto loans and, to a lesser extent, secured and unsecured loans and lines of credit. As of December 31, 2017, consumer loans totaled $114.6 million, or 15.4%, of our total loan portfolio, of which $106.1 million were indirect auto loans. Consumer loans are generally offered on a fixed-rate basis. Our underwriting standards for consumer loans include a determination of the applicant’s credit history and an assessment of the applicant’s ability to meet existing obligations and payments on the proposed loan. The stability of the applicant’s monthly income may be determined by verification of gross monthly income from primary employment, and additionally from any verifiable secondary income. We also consider the length of employment with the borrower’s present employer as well as the amount of time the borrower has lived in the local area. Creditworthiness of the applicant is of primary consideration; however, the underwriting process also includes a comparison of the value of the collateral in relation to the proposed loan amount.
Indirect auto loans are loans that are sold by auto dealerships to third parties, such as banks or other types of lenders. We work with various auto dealers throughout our lending area. The dealer collects information from the applicant and transmits it to us electronically for review, where we can either accept or reject applicants without ever meeting them. If the Bank approves the applicant’s request for financing, the Bank purchases the dealership-originated installment sales contract and is known as the holder in due course that is entitled to receive principal and interest payments from a borrower. As compensation for generating the loan, a portion of the rate is advanced to the dealer and accrued in a prepaid dealer reserve account. As a result, the Bank’s yield is below the interest rate because the Bank must wait for the stream of loan payments to be repaid. The Bank will receive a pro rata refund of the amount prepaid to the dealer only if the loan prepays within the first six months or if the collateral for the loan is repossessed. The Bank is responsible for pursuing repossession if the borrower defaults on payments.
Consumer loans entail greater risks than one- to four-family residential mortgage loans, particularly consumer loans secured by rapidly depreciating assets, such as automobiles, or loans that are unsecured. In such cases, collateral repossessed after a default may not provide an adequate source of repayment of the outstanding loan balance because of damage, loss or depreciation. Further, consumer loan payments are dependent on the borrower’s continuing financial stability, and therefore are more likely to be adversely affected by job loss, divorce, illness or personal bankruptcy. Such events would increase our risk of loss on unsecured loans. Finally, the application of various federal and state laws, including federal and state bankruptcy and insolvency laws, may limit the amount that can be recovered on such loans in the event of a default.
| 7 |
Loan Portfolio Maturities and Yields. The following table summarizes the scheduled repayments of our loan portfolio at December 31, 2017. Demand loans, loans having no stated repayment schedule or maturity, and overdraft loans are reported as being due in one year or less. Consumer loans consist primarily of indirect automobile loans whereby a portion of the rate is prepaid to the dealer and accrued in a prepaid dealer reserve account. Thus the true yield for the portfolio is significantly less than the note rate disclosed below.
| (Dollars in thousands) | ||||||||||||||||||||||||||||||||
| Real Estate | Commercial | |||||||||||||||||||||||||||||||
| Residential | Commercial | Construction | and Industrial | |||||||||||||||||||||||||||||
| Weighted | Weighted | Weighted | Weighted | |||||||||||||||||||||||||||||
| Due During the Years | Average | Average | Average | Average | ||||||||||||||||||||||||||||
| Ending December 31, | Amount | Rate | Amount | Rate | Amount | Rate | Amount | Rate | ||||||||||||||||||||||||
| Originated Loans | ||||||||||||||||||||||||||||||||
| 2018 | $ | 199 | 5.03 | % | $ | 5,408 | 4.73 | % | $ | 971 | 5.00 | % | $ | 1,566 | 4.74 | % | ||||||||||||||||
| 2019 | 787 | 4.73 | 3,430 | 4.53 | 1,669 | 5.25 | 3,637 | 4.25 | ||||||||||||||||||||||||
| 2020 | 1,165 | 4.53 | 993 | 5.11 | 5,319 | 4.71 | 12,226 | 3.80 | ||||||||||||||||||||||||
| 2021 to 2022 | 4,534 | 4.29 | 13,477 | 4.18 | 2,562 | 4.00 | 17,943 | 4.39 | ||||||||||||||||||||||||
| 2023 to 2027 | 35,447 | 4.09 | 57,569 | 4.42 | 3,750 | 3.54 | 29,125 | 3.68 | ||||||||||||||||||||||||
| 2028 to 2032 | 42,791 | 4.05 | 64,567 | 4.60 | 9,464 | 4.53 | 3,933 | 4.71 | ||||||||||||||||||||||||
| 2033 and Beyond | 115,563 | 4.14 | 14,791 | 4.26 | 12,414 | 4.86 | 31,864 | 3.88 | ||||||||||||||||||||||||
| Total | $ | 200,486 | 4.12 | $ | 160,235 | 4.47 | $ | 36,149 | 4.58 | $ | 100,294 | 3.96 | ||||||||||||||||||||
| Consumer | Other | Total | |||||||||||||||||||||||
| Weighted | Weighted | Weighted | |||||||||||||||||||||||
| Due During the Years | Average | Average | Average | ||||||||||||||||||||||
| Ending December 31, | Amount | Rate | Amount | Rate | Amount | Rate | |||||||||||||||||||
| Originated Loans | |||||||||||||||||||||||||
| 2018 | $ | 960 | 4.06 | % | $ | 4 | 2.50 | % | $ | 9,108 | 4.69 | % | |||||||||||||
| 2019 | 4,712 | 3.65 | 37 | 3.00 | 14,272 | 4.26 | |||||||||||||||||||
| 2020 | 15,686 | 3.92 | 46 | 3.00 | 35,435 | 4.06 | |||||||||||||||||||
| 2021 to 2022 | 65,673 | 4.17 | 54 | 3.68 | 104,243 | 4.21 | |||||||||||||||||||
| 2023 to 2027 | 19,670 | 5.21 | - | - | 145,561 | 4.27 | |||||||||||||||||||
| 2028 to 2032 | 2 | 6.89 | 697 | 2.95 | 121,454 | 4.39 | |||||||||||||||||||
| 2033 and Beyond | 7,655 | 6.42 | 2,538 | 4.12 | 184,825 | 4.21 | |||||||||||||||||||
| Total | $ | 114,358 | 4.41 | $ | 3,376 | 3.84 | $ | 614,898 | 4.26 | ||||||||||||||||
| 8 |
| (Dollars in thousands) | ||||||||||||||||||||||||||||||||
| Real Estate | Commercial | |||||||||||||||||||||||||||||||
| Residential | Commercial | Construction | and Industrial | |||||||||||||||||||||||||||||
| Weighted | Weighted | Weighted | Weighted | |||||||||||||||||||||||||||||
| Due During the Years | Average | Average | Average | Average | ||||||||||||||||||||||||||||
| Ending December 31, | Amount | Rate | Amount | Rate | Amount | Rate | Amount | Rate | ||||||||||||||||||||||||
| Loans Acquired at Fair Value | ||||||||||||||||||||||||||||||||
| 2018 | $ | 122 | 4.66 | % | $ | 3,755 | 4.04 | % | $ | - | - | % | $ | 1,416 | 4.11 | % | ||||||||||||||||
| 2019 | 1,420 | 4.70 | 466 | 5.75 | - | - | 894 | 3.73 | ||||||||||||||||||||||||
| 2020 | 150 | 4.56 | 855 | 3.86 | - | - | - | - | ||||||||||||||||||||||||
| 2021 to 2022 | 1,196 | 4.57 | 2,536 | 4.62 | - | - | 676 | 4.66 | ||||||||||||||||||||||||
| 2023 to 2027 | 8,213 | 4.30 | 20,194 | 4.25 | - | - | 2,604 | 3.93 | ||||||||||||||||||||||||
| 2028 to 2032 | 9,226 | 4.29 | 5,473 | 5.00 | - | - | - | - | ||||||||||||||||||||||||
| 2033 and Beyond | 52,625 | 4.59 | 15,523 | 4.45 | - | - | 1,951 | 4.49 | ||||||||||||||||||||||||
| Total | $ | 72,952 | 4.52 | $ | 48,802 | 4.41 | $ | - | - | $ | 7,541 | 4.15 | ||||||||||||||||||||
| Consumer | Total | ||||||||||||||||
| Weighted | Weighted | ||||||||||||||||
| Due During the Years | Average | Average | |||||||||||||||
| Ending December 31, | Amount | Rate | Amount | Rate | |||||||||||||
| Loans Acquired at Fair Value | |||||||||||||||||
| 2018 | $ | - | 12.00 | % | $ | 5,293 | 4.07 | % | |||||||||
| 2019 | 3 | 10.00 | 2,783 | 4.57 | |||||||||||||
| 2020 | - | - | 1,005 | 3.97 | |||||||||||||
| 2021 to 2022 | - | - | 4,408 | 4.61 | |||||||||||||
| 2023 to 2027 | - | - | 31,011 | 4.24 | |||||||||||||
| 2028 to 2032 | 41 | 6.50 | 14,740 | 4.56 | |||||||||||||
| 2033 and Beyond | 155 | 6.37 | 70,254 | 4.56 | |||||||||||||
| Total | $ | 199 | 6.45 | $ | 129,494 | 4.46 | |||||||||||
| (Dollars in thousands) | ||||||||||||||||||||||||||||||||
| Real Estate | Commercial | |||||||||||||||||||||||||||||||
| Residential | Commercial | Construction | and Industrial | |||||||||||||||||||||||||||||
| Weighted | Weighted | Weighted | Weighted | |||||||||||||||||||||||||||||
| Due During the Years | Average | Average | Average | Average | ||||||||||||||||||||||||||||
| Ending December 31, | Amount | Rate | Amount | Rate | Amount | Rate | Amount | Rate | ||||||||||||||||||||||||
| Total Loans | ||||||||||||||||||||||||||||||||
| 2018 | $ | 321 | 4.89 | % | $ | 9,163 | 4.45 | % | $ | 971 | 5.00 | % | $ | 2,982 | 4.44 | % | ||||||||||||||||
| 2019 | 2,207 | 4.71 | 3,896 | 4.68 | 1,669 | 5.25 | 4,531 | 4.15 | ||||||||||||||||||||||||
| 2020 | 1,315 | 4.53 | 1,848 | 4.53 | 5,319 | 4.71 | 12,226 | 3.80 | ||||||||||||||||||||||||
| 2021 to 2022 | 5,730 | 4.35 | 16,013 | 4.25 | 2,562 | 4.00 | 18,619 | 4.40 | ||||||||||||||||||||||||
| 2023 to 2027 | 43,660 | 4.13 | 77,763 | 4.38 | 3,750 | 3.54 | 31,729 | 3.70 | ||||||||||||||||||||||||
| 2028 to 2032 | 52,017 | 4.09 | 70,040 | 4.63 | 9,464 | 4.53 | 3,933 | 4.71 | ||||||||||||||||||||||||
| 2033 and Beyond | 168,188 | 4.28 | 30,314 | 4.36 | 12,414 | 4.86 | 33,815 | 3.92 | ||||||||||||||||||||||||
| Total | $ | 273,438 | 4.23 | $ | 209,037 | 4.46 | $ | 36,149 | 4.58 | $ | 107,835 | 3.97 | ||||||||||||||||||||
| Consumer | Other | Total | |||||||||||||||||||||||
| Weighted | Weighted | Weighted | |||||||||||||||||||||||
| Due During the Years | Average | Average | Average | ||||||||||||||||||||||
| Ending December 31, | Amount | Rate | Amount | Rate | Amount | Rate | |||||||||||||||||||
| Total Loans | |||||||||||||||||||||||||
| 2018 | $ | 960 | 4.06 | % | $ | 4 | 2.50 | % | $ | 14,401 | 4.47 | % | |||||||||||||
| 2019 | 4,715 | 3.65 | 37 | 3.00 | 17,055 | 4.31 | |||||||||||||||||||
| 2020 | 15,686 | 3.92 | 46 | 3.00 | 36,440 | 4.06 | |||||||||||||||||||
| 2021 to 2022 | 65,673 | 4.17 | 54 | 3.68 | 108,651 | 4.22 | |||||||||||||||||||
| 2023 to 2027 | 19,670 | 5.21 | - | - | 176,572 | 4.26 | |||||||||||||||||||
| 2028 to 2032 | 43 | 6.52 | 697 | 2.95 | 136,194 | 4.41 | |||||||||||||||||||
| 2033 and Beyond | 7,810 | 6.42 | 2,538 | 4.12 | 255,079 | 4.31 | |||||||||||||||||||
| Total | $ | 114,557 | 4.41 | $ | 3,376 | 3.84 | $ | 744,392 | 4.30 | ||||||||||||||||
| 9 |
The following table sets forth at December 31, 2017, the dollar amount of all fixed-rate and adjustable-rate loans due after December 31, 2018.
| (Dollars in thousands) | ||||||||||||
| Due After December 31, 2018 | ||||||||||||
| Fixed | Adjustable | Total | ||||||||||
| Originated Loans | ||||||||||||
| Real Estate: | ||||||||||||
| Residential | $ | 173,700 | $ | 26,587 | $ | 200,287 | ||||||
| Commercial | 25,866 | 128,961 | 154,827 | |||||||||
| Construction | 5,855 | 29,323 | 35,178 | |||||||||
| Commercial and Industrial | 56,681 | 42,047 | 98,728 | |||||||||
| Consumer | 108,483 | 4,915 | 113,398 | |||||||||
| Other | 2,676 | 696 | 3,372 | |||||||||
| Total loans | $ | 373,261 | $ | 232,529 | $ | 605,790 | ||||||
| Loans Acquired at Fair Value | ||||||||||||
| Real Estate: | ||||||||||||
| Residential | $ | 67,944 | $ | 4,886 | $ | 72,830 | ||||||
| Commercial | 36,149 | 8,898 | 45,047 | |||||||||
| Construction | - | - | - | |||||||||
| Commercial and Industrial | 4,174 | 1,951 | 6,125 | |||||||||
| Consumer | 37 | 162 | 199 | |||||||||
| Total loans | $ | 108,304 | $ | 15,897 | $ | 124,201 | ||||||
| Total Loans | ||||||||||||
| Real Estate: | ||||||||||||
| Residential | $ | 241,644 | $ | 31,473 | $ | 273,117 | ||||||
| Commercial | 62,015 | 137,859 | 199,874 | |||||||||
| Construction | 5,855 | 29,323 | 35,178 | |||||||||
| Commercial and Industrial | 60,855 | 43,998 | 104,853 | |||||||||
| Consumer | 108,520 | 5,077 | 113,597 | |||||||||
| Other | 2,676 | 696 | 3,372 | |||||||||
| Total loans | $ | 481,565 | $ | 248,426 | $ | 729,991 | ||||||
Loan Approval Procedures and Authority
Our lending activities follow written, non-discriminatory underwriting standards and loan origination procedures established by the board of directors. In the approval process for residential loans, we assess the borrower’s ability to repay the loan and the value of the property securing the loan. To assess the borrower’s ability to repay, we review the borrower’s income and expenses and employment and credit history. In the case of commercial real estate loans, we also review projected income, expenses and the viability of the project being financed. We generally require appraisals of all real property securing loans. Appraisals are performed by independent licensed appraisers. Community Bank’s loan approval policies and limits are also established by its board of directors. All loans originated by Community Bank are subject to its underwriting guidelines. Loan approval authorities vary based on loan size in the aggregate. Individual officer loan approval authority generally applies to loans of up to $500,000. Loans above that amount and up to $1 million may be approved by the Loan Committee. Loans between $1 million and $2 million may be approved by the Discount Committee, which includes five directors of the Bank. Loans in the aggregate over $2 million must be approved by the board of directors.
Delinquencies and Classified Assets
When a borrower fails to remit a required loan payment, a courtesy notice is sent to the borrower prior to the end of their appropriate grace period stressing the importance of paying the loan current. If a payment is not paid within the appropriate grace period, then a late notice is mailed. In addition, telephone calls are made and additional letters may be sent. For loans that are secured by real estate that become 30 days delinquent, an Act 6 Notice of Intention to Foreclose will be mailed stating to the borrower that they have 30 days to cure the default. In the event that the default is not cured by the 30th day then an Act 91 Notice of Foreclosure is mailed stating to the customer that they have 33 days to cure the default for Pennsylvania mortgages. Once the loan has become 90 or more days delinquent then it is forwarded to the Bank’s attorney to pursue other remedies or to file a mortgage foreclosure complaint. In the event that all collection efforts have not succeeded, then the property will proceed to a Sheriff Sale to be sold. Collection efforts continue on all loans until it is determined by the Executive Vice President of Credit Administration and the Collection Department Manager that the debt is uncollectable. For commercial loans, the borrower is contacted in an attempt to reestablish the loan to current payment status and ensure timely payments continue. Collection efforts continue until the loan is 60 days past due, at which time demand payment, default, and/or foreclosure procedures are initiated. We may consider loan workout arrangements with certain borrowers under certain circumstances.
| 10 |
Nonperforming Assets and Delinquent Loans. The Company reviews its loans on a regular basis and generally places loans on nonaccrual status when either principal or interest is 90 days or more past due. In addition, the Company places loans on nonaccrual status when we do not expect to receive full payment of interest or principal. Interest accrued and unpaid at the time a loan is placed on nonaccrual status is reversed from interest income. Loans that are 90 days or more past due may still accrue interest if they are well secured and in the process of collection. Once a loan is placed on nonaccrual status, the borrower must generally demonstrate at least six consecutive months of payment performance before the loan is eligible to return to accrual status.
Management monitors all past due loans and nonperforming assets. Such loans are placed under close supervision, with consideration given to the need for additions to the allowance for loan losses and (if appropriate) partial or full charge-off. At December 31, 2017 we had $168,000 of loans 90 days or more past due that were still accruing interest. Nonperforming assets decreased $1.0 million to $7.6 million at December 31, 2017, compared to $8.6 million at December 31, 2016. The decrease in the level of nonperforming assets was primarily due to the resolution of commercial real estate and residential real estate non-accrual loans. In addition, troubled debt restructured commercial and industrial loans had a loan payoff and loan paydowns during the current year.
Management believes the volume of nonperforming assets can be partially attributed to unique borrower circumstances as well as the economy in general. We have an experienced chief credit officer, collections and credit departments that monitor the loan portfolio and seek to prevent any deterioration of asset quality.
Real estate acquired through foreclosure or by deed-in-lieu of foreclosure is classified as real estate owned until such time as it is sold. When real estate owned is acquired, it is recorded at the lower of the unpaid principal balance of the related loan, or its fair market value, less estimated selling expenses. Any further write-down of real estate owned is charged against earnings. At December 31, 2017, we owned $326,000 of property classified as real estate owned.
Nonperforming Assets. The following table sets forth the amounts and categories of our nonperforming assets at the dates indicated. Included in nonperforming loans and assets are troubled debt restructurings, which are loans whose contractual terms have been restructured in a manner that grants a concession to a borrower experiencing financial difficulties.
| 11 |
| (Dollars in Thousands) | ||||||||||||||||||||
| December 31, | ||||||||||||||||||||
| 2017 | 2016 | 2015 | 2014 | 2013 | ||||||||||||||||
| Non-accrual loans: | ||||||||||||||||||||
| Originated Loans | ||||||||||||||||||||
| Real estate: | ||||||||||||||||||||
| Residential | $ | 524 | $ | 308 | $ | 687 | $ | 309 | $ | 339 | ||||||||||
| Commercial | 288 | 73 | 3,463 | 581 | 2,665 | |||||||||||||||
| Construction | 43 | 107 | 230 | 344 | 365 | |||||||||||||||
| Commercial and Industrial | 2,079 | 1,829 | - | 4 | - | |||||||||||||||
| Consumer | 71 | 160 | 14 | - | 17 | |||||||||||||||
| Total Originated Non-accrual Loans | 3,005 | 2,477 | 4,394 | 1,238 | 3,386 | |||||||||||||||
| Loans Acquired at Fair Value | ||||||||||||||||||||
| Real estate: | ||||||||||||||||||||
| Residential | 899 | 1,565 | 1,500 | 1,234 | - | |||||||||||||||
| Commercial | - | 347 | 399 | 484 | - | |||||||||||||||
| Commercial and Industrial | 16 | - | 42 | - | - | |||||||||||||||
| Total Loans Acquired at Fair Value Non-accrual Loans | 915 | 1,912 | 1,941 | 1,718 | - | |||||||||||||||
| Total non-accrual loans | 3,920 | 4,389 | 6,335 | 2,956 | 3,386 | |||||||||||||||
| Accruing loans past due 90 days or more: | ||||||||||||||||||||
| Originated Loans | ||||||||||||||||||||
| Real estate: | ||||||||||||||||||||
| Residential | - | 120 | 193 | 369 | - | |||||||||||||||
| Consumer | 26 | 8 | - | 10 | - | |||||||||||||||
| Total originated accruing loans 90 days or more past due | 26 | 128 | 193 | 379 | - | |||||||||||||||
| Loans Acquired at Fair Value | ||||||||||||||||||||
| Real estate: | ||||||||||||||||||||
| Residential | 142 | 223 | - | - | - | |||||||||||||||
| Total loans acquired at fair value accruing 90 days or | ||||||||||||||||||||
| more past due | 142 | 223 | - | - | - | |||||||||||||||
| Total accruing loans 90 days or more past due | 168 | 351 | 193 | 379 | - | |||||||||||||||
| Total non-accrual loans and accruing loans 90 days or more past due | 4,088 | 4,740 | 6,528 | 3,335 | 3,386 | |||||||||||||||
| Troubled debt restructurings, accruing | ||||||||||||||||||||
| Originated Loans: | ||||||||||||||||||||
| Real Estate - Residential | 30 | - | - | - | - | |||||||||||||||
| Real Estate - Commercial | 1,271 | 1,325 | 1,375 | 246 | 543 | |||||||||||||||
| Commercial and Industrial | 5 | 6 | 7 | 310 | - | |||||||||||||||
| Other | 1 | 4 | - | - | - | |||||||||||||||
| Total Originated Loans | 1,307 | 1,335 | 1,382 | 556 | 543 | |||||||||||||||
| Loans Acquired at Fair Value: | ||||||||||||||||||||
| Real Estate - Residential | 1,257 | 1,299 | 1,296 | 1,337 | - | |||||||||||||||
| Real Estate - Commercial | 426 | 660 | 1,488 | 1,800 | - | |||||||||||||||
| Commercial and Industrial | 173 | 393 | - | - | - | |||||||||||||||
| Total Loans Acquired at Fair Value | 1,856 | 2,352 | 2,784 | 3,137 | - | |||||||||||||||
| Total Troubled Debt Restructurings, Accruing | 3,163 | 3,687 | 4,166 | 3,693 | 543 | |||||||||||||||
| Total nonperforming loans | 7,251 | 8,427 | 10,694 | 7,028 | 3,929 | |||||||||||||||
| Real estate owned: | ||||||||||||||||||||
| Residential | 152 | - | 138 | 104 | 82 | |||||||||||||||
| Commercial | - | - | - | - | 54 | |||||||||||||||
| Other | 174 | 174 | 174 | 174 | 174 | |||||||||||||||
| Total real estate owned | 326 | 174 | 312 | 278 | 310 | |||||||||||||||
| Total nonperforming assets | $ | 7,577 | $ | 8,601 | $ | 11,006 | $ | 7,306 | $ | 4,239 | ||||||||||
| Nonperforming loans to total loans | 0.97 | % | 1.24 | % | 1.56 | % | 1.03 | % | 1.04 | % | ||||||||||
| Nonperforming assets to total assets | 0.81 | 1.02 | 1.32 | 0.86 | 0.78 | |||||||||||||||
| 12 |
For the year ended December 31, 2017, gross interest income that would have been recorded had our non-accruing loans been current in accordance with their original terms was $74,000.
At December 31, 2017, we had no loans that were not currently classified as nonaccrual, 90 days past due or troubled debt restructurings, but where known information about possible credit problems of borrowers caused management to have serious concerns as to the ability of the borrowers to comply with present loan repayment terms and that may result in disclosure as nonaccrual, 90 days past due or troubled debt restructurings.
Classified Assets. Federal regulations provide that loans and other assets of lesser quality should be classified as “substandard,” “doubtful” or “loss” assets. An asset is considered “substandard” if it is inadequately protected by the current net worth and paying capacity of the obligor or of the collateral pledged, if any. Substandard assets include those characterized by the “distinct possibility” that the Company will sustain “some loss” if the deficiencies are not corrected. Assets classified as “doubtful” have all of the weaknesses inherent in those classified “substandard,” with the added characteristic that the weaknesses present make “collection or liquidation in full,” on the basis of currently existing facts, conditions, and values, “highly questionable and improbable.” Assets classified as “loss” are those considered “uncollectible” and of such little value that their continuance as assets is not warranted. The Company designates an asset as “special mention” if the asset has a potential weakness that warrants management’s close attention. The Company uses an eight point internal risk rating system to monitor the credit quality of the overall loan portfolio. The first four categories are considered not criticized, and are aggregated as “pass” rated. The criticized rating categories used by management generally follow bank regulatory definitions. The special mention category includes assets that are currently protected but are below average quality, resulting in an undue credit risk, but not to the point of justifying a substandard classification. Loans in the substandard category have well-defined weaknesses that jeopardize the liquidation of the debt, and have a distinct possibility that some loss will be sustained if the weaknesses are not corrected. Those loans that typically represent a specific allocation of the allowance for loan losses are placed in the doubtful category. As part of the periodic exams of Community Bank by the FDIC and the Pennsylvania Department of Banking and Securities, the staff of such agencies reviews our classifications and determines whether such classifications are adequate. Such agencies have, in the past, and may in the future require us to classify certain assets which management has not otherwise classified or require a classification more severe than established by management. The following table shows the principal amount of special mention and classified loans at December 31, 2017 and December 31, 2016.
| (Dollars in thousands) | ||||||||||||||||||||||||
| December 31, | ||||||||||||||||||||||||
| 2017 | 2016 | |||||||||||||||||||||||
| Originated Loans | Loans Acquired at Fair Value | Total | Originated Loans | Loans Acquired at Fair Value | Total | |||||||||||||||||||
| Special Mention | $ | 25,652 | $ | 5,009 | $ | 30,661 | $ | 17,888 | $ | 2,400 | $ | 20,288 | ||||||||||||
| Substandard | 6,497 | 2,466 | 8,963 | 4,418 | 3,255 | 7,673 | ||||||||||||||||||
| Doubtful | 1,912 | 77 | 1,989 | 2,474 | 121 | 2,595 | ||||||||||||||||||
| Loss | - | - | - | - | - | - | ||||||||||||||||||
| Total | $ | 34,061 | $ | 7,552 | $ | 41,613 | $ | 24,780 | $ | 5,776 | $ | 30,556 | ||||||||||||
The total amount of special mention and classified loans increased $11.1 million, or 36.2%, to $41.6 million at December 31, 2017, compared to $30.6 million at December 31, 2016. The increase in special mention loans was due to a decline in performance of larger originated commercial and industrial loans. The increase in substandard loans is primarily due to downgrades of originated commercial and industrial loan relationships, partially offset by a decrease in acquired commercial and industrial loan relationships due to classified loan payoffs and paydowns.
Allowance for Loan Losses. The allowance for loan losses is maintained at a level considered adequate to provide for losses that can be reasonably anticipated. Management performs a quarterly evaluation of the adequacy of the allowance based on losses in the current loan portfolio, which includes an assessment of economic conditions, changes in the nature and volume of the loan portfolio, loan loss experience, volume and severity of past due, classified and nonaccrual loans as well as other loan modifications, quality of the Company’s loan review system, the degree of oversight by the Company’s Board of Directors, existence and effect of any concentrations of credit and changes in the level of such concentrations, effect of external factors, such as competition and legal and regulatory requirements and other relevant factors. While management uses the best information available to make such evaluations, future adjustments to the allowance may be necessary if economic conditions differ substantially from the assumptions used in making evaluations. Additions are made to the allowance through periodic provisions charged to income and recovery of principal and interest on loans previously charged-off. Losses of principal are charged directly to the allowance when a loss actually occurs or when a determination is made that the specific loss is probable. This evaluation is inherently subjective as it requires estimates that are susceptible to significant revisions as more information becomes available.
| 13 |
The allowance consists of specific, general and unallocated components. The specific component relates to loans that are classified as impaired. A loan is considered to be impaired when, based upon current information and events, it is probable that the Company will be unable to collect all amounts due for principal and interest according to the original contractual terms of the loan agreement. Management determines the significance of payment delays and payment shortfalls on a case-by-case basis, taking into consideration all of the circumstances surrounding the loan and the borrower, including the length of the delay, the reasons for the delay, the borrower’s prior payment record and the amount of the shortfall in relation to the principal and interest owed. Impairment is measured based on the present value of expected future cash flows discounted at a loan’s effective interest rate, or as a practical expedient, the observable market price, or, if the loan is collateral dependent, the fair value of the underlying collateral. When the measurement of an impaired loan is less than the recorded investment in the loan, the impairment is recorded in a specific valuation allowance through a charge to the provision for loan losses. Any reserve for unfunded lending commitments represents management’s estimate of losses inherent in its unfunded loan commitments and is recorded in the allowance for loan losses on the consolidated Statement of Condition.
Groups of loans with similar risk characteristics are collectively evaluated for impairment based on the group’s historical loss experience adjusted for changes in trends, conditions and other relevant factors that affect repayment of the loans. Accordingly, we do not separately identify individual consumer and residential loans for impairment measurements, unless such loans are the subject of a restructuring agreement due to financial difficulties of the borrower.
The general component covers non-classified loans and is based on historical charge-off experience and expected loss given our internal risk rating process. The loan portfolio is stratified into homogeneous groups of loans that possess similar loss characteristics and an appropriate loss ratio adjusted for other qualitative factors is applied to the homogeneous pools of loans to estimate the incurred losses in the loan portfolio. The other qualitative factors considered by management include, but are not limited to, the following:
| • | changes in lending policies and procedures, including underwriting standards and collection practices; |
| • | changes in national and local economic and business conditions and developments, including the condition of various market segments; |
| • | changes in the nature and volume of the loan portfolio; |
| • | changes in the experience, ability and depth of management and the lending staff; |
| • | changes in the trend of the volume and severity of the past due, nonaccrual, and classified loans; |
| • | the existence of any concentrations of credit, and changes in the level of such concentrations; and |
| • | the effect of external factors, such as competition and legal and regulatory requirements on the level of estimated credit losses in our current portfolio. |
Commercial real estate loans generally have higher credit risks compared to one- to four-family residential mortgage loans, as they typically involve larger loan balances concentrated with single borrowers or groups of related borrowers. In addition, payment experience on loans secured by income-producing properties typically depends on the successful operation of the related real estate project, and this may be subject to a greater extent to adverse conditions in the real estate market and in the general economy.
Commercial and industrial business loans involve a greater risk of default than one- to four-residential mortgage loans of like duration because their repayment generally depends on the successful operation of the borrower’s business and the sufficiency of collateral, if any.
This specific valuation allowance is periodically adjusted for significant changes in the amount or timing of expected future cash flows, observable market price or fair value of the collateral. The specific valuation allowance, or allowance for impaired loans, is part of the total allowance for loan losses. Cash payments received on impaired loans that are considered non-accrual are recorded as a direct reduction of the recorded investment in the loan. When the recorded investment has been fully collected, receipts are recorded as recoveries to the allowance for loan losses until the previously charged-off principal is fully recovered. Subsequent amounts collected are recognized as interest income. If no charge-off exists, then once the recorded investment has been fully collected, any future amounts collected would be recognized as interest income. Impaired loans are not returned to accrual status until all amounts due, both principal and interest, are current and a sustained payment history has been demonstrated. Troubled Debt Restructuring (TDR) loans are generally considered impaired loans until such loans are performing in accordance with their modified terms. Once a TDR loan establishes a consistent payment history under the modified terms, then it is considered to return to accrual status. The general component covers pools of loans by loan class, including commercial loans not considered impaired, as well as smaller balance homogeneous loans, such as residential real estate and consumer loans. An unallocated component is maintained to cover uncertainties that could affect the Company’s estimate of probable losses. Generally, management considers all nonaccrual and TDR loans and certain renegotiated debt, when it exists, for impairment. The maximum period without payment that typically can occur before a loan is considered for impairment is 90 days. The past due status of loans receivable is determined based on contractual due dates for loan payments.
| 14 |
The allowance for loan losses increased $1.0 million, or 12.7%, to $8.8 million at December 31, 2017, compared to $7.8 million at December 31, 2016. Net charge-offs were $877,000 during 2017 compared to $727,000 during 2016. The allowance for loan losses to nonperforming loans ratio increased to 121.31% at December 31, 2017, compared to 92.60% at December 31, 2016. The increase was due to a decrease in nonperforming loans, mainly attributed to decreases in commercial real estate and residential real estate non-accrual loans, TDR commercial and industrial loans and an increase in the allowance for loan losses.
Although we maintain our allowance for loan losses at a level that we consider to be adequate to provide for potential losses, there can be no assurance that such losses will not exceed the estimated amounts or that we will not be required to make additions to the allowance for loan losses in the future. Future additions to our allowance for loan losses and changes in the related ratio of the allowance for loan losses to nonperforming loans are dependent upon the economy, changes in real estate values and interest rates, the view of the regulatory authorities toward adequate loan loss reserve levels, and inflation. Management will continue to periodically review the entire loan portfolio to determine the extent, if any, to which further additional loan loss provisions may be deemed necessary.
Analysis of the Allowance for Loan Losses. The following table summarizes changes in the allowance for loan losses by loan categories for each year indicated and additions to the allowance for loan losses, which have been charged to operations. Loans acquired in connection with the merger with FedFirst were recorded at their estimated fair value at the acquisition date and did not include a carryover of the pre-merger allowance for loan losses.
| (Dollars in Thousands) | ||||||||||||||||||||
| Years Ended December 31, | ||||||||||||||||||||
| 2017 | 2016 | 2015 | 2014 | 2013 | ||||||||||||||||
| Originated Loans | ||||||||||||||||||||
| Balance at beginning of year | $ | 7,283 | $ | 6,490 | $ | 5,195 | $ | 5,382 | $ | 5,904 | ||||||||||
| Provision for loan losses | 1,620 | 1,326 | 1,747 | - | 100 | |||||||||||||||
| Charge-offs: | ||||||||||||||||||||
| Real estate: | ||||||||||||||||||||
| Residential | (22 | ) | (24 | ) | (23 | ) | (39 | ) | (181 | ) | ||||||||||
| Commercial | - | (11 | ) | (291 | ) | - | (555 | ) | ||||||||||||
| Construction | - | - | - | (38 | ) | - | ||||||||||||||
| Commercial and Industrial | - | - | - | - | (109 | ) | ||||||||||||||
| Consumer | (915 | ) | (717 | ) | (326 | ) | (195 | ) | (96 | ) | ||||||||||
| Other | - | (49 | ) | - | - | - | ||||||||||||||
| Total Charge-offs | (937 | ) | (801 | ) | (640 | ) | (272 | ) | (941 | ) | ||||||||||
| Recoveries: | ||||||||||||||||||||
| Real estate: | ||||||||||||||||||||
| Residential | 13 | 10 | 49 | 2 | 86 | |||||||||||||||
| Commercial | - | 95 | 11 | - | 69 | |||||||||||||||
| Construction | - | - | - | - | - | |||||||||||||||
| Commercial and Industrial | 37 | - | 10 | 5 | 68 | |||||||||||||||
| Consumer | 199 | 140 | 118 | 78 | 96 | |||||||||||||||
| Other | - | 23 | - | - | - | |||||||||||||||
| Total Recoveries | 249 | 268 | 188 | 85 | 319 | |||||||||||||||
| Net charge-offs | (688 | ) | (533 | ) | (452 | ) | (187 | ) | (622 | ) | ||||||||||
| Balance at end of year | $ | 8,215 | $ | 7,283 | $ | 6,490 | $ | 5,195 | $ | 5,382 | ||||||||||
| 15 |
| (Dollars in Thousands) | ||||||||||||||||
| Years Ended December 31, | ||||||||||||||||
| 2017 | 2016 | 2015 | 2014 | |||||||||||||
| Loans Acquired at Fair Value | ||||||||||||||||
| Balance at beginning of year | $ | 520 | $ | - | $ | - | $ | - | ||||||||
| Provision for loan losses | 250 | 714 | 258 | - | ||||||||||||
| Charge-offs: | ||||||||||||||||
| Real estate: | ||||||||||||||||
| Residential | (109 | ) | (24 | ) | (197 | ) | - | |||||||||
| Commercial | (132 | ) | (180 | ) | (18 | ) | - | |||||||||
| Consumer | (4 | ) | (7 | ) | (61 | ) | - | |||||||||
| Total Charge-offs | (245 | ) | (211 | ) | (276 | ) | - | |||||||||
| Recoveries: | ||||||||||||||||
| Real estate: | ||||||||||||||||
| Residential | 49 | 7 | 14 | - | ||||||||||||
| Commercial | 3 | 3 | 3 | - | ||||||||||||
| Consumer | 4 | 7 | 1 | - | ||||||||||||
| Total Recoveries | 56 | 17 | 18 | - | ||||||||||||
| Net charge-offs | (189 | ) | (194 | ) | (258 | ) | - | |||||||||
| Balance at end of year | $ | 581 | $ | 520 | $ | - | $ | - | ||||||||
| (Dollars in Thousands) | ||||||||||||||||||||
| Years Ended December 31, | ||||||||||||||||||||
| 2017 | 2016 | 2015 | 2014 | 2013 | ||||||||||||||||
| Total Allowance for Loan Losses | ||||||||||||||||||||
| Balance at beginning of year | $ | 7,803 | $ | 6,490 | $ | 5,195 | $ | 5,382 | $ | 5,904 | ||||||||||
| Provision for loan losses | 1,870 | 2,040 | 2,005 | - | 100 | |||||||||||||||
| Charge-offs: | ||||||||||||||||||||
| Real estate: | ||||||||||||||||||||
| Residential | (131 | ) | (48 | ) | (220 | ) | (39 | ) | (181 | ) | ||||||||||
| Commercial | (132 | ) | (191 | ) | (309 | ) | - | (555 | ) | |||||||||||
| Construction | - | - | - | (38 | ) | - | ||||||||||||||
| Commercial and Industrial | - | - | - | - | (109 | ) | ||||||||||||||
| Consumer | (919 | ) | (724 | ) | (387 | ) | (195 | ) | (96 | ) | ||||||||||
| Other | - | (49 | ) | - | - | - | ||||||||||||||
| Total Charge-offs | (1,182 | ) | (1,012 | ) | (916 | ) | (272 | ) | (941 | ) | ||||||||||
| Recoveries: | ||||||||||||||||||||
| Real estate: | ||||||||||||||||||||
| Residential | 62 | 17 | 63 | 2 | 86 | |||||||||||||||
| Commercial | 3 | 98 | 14 | - | 69 | |||||||||||||||
| Construction | - | - | - | - | - | |||||||||||||||
| Commercial and Industrial | 37 | - | 10 | 5 | 68 | |||||||||||||||
| Consumer | 203 | 147 | 119 | 78 | 96 | |||||||||||||||
| Other | - | 23 | - | - | - | |||||||||||||||
| Total Recoveries | 305 | 285 | 206 | 85 | 319 | |||||||||||||||
| Net charge-offs | (877 | ) | (727 | ) | (710 | ) | (187 | ) | (622 | ) | ||||||||||
| Balance at end of year | $ | 8,796 | $ | 7,803 | $ | 6,490 | $ | 5,195 | $ | 5,382 | ||||||||||
| Allowance for loan losses to nonperforming loans | 121.31 | % | 92.60 | % | 60.69 | % | 73.92 | % | 136.98 | % | ||||||||||
| Allowance for loan losses to total loans | 1.18 | 1.14 | 0.95 | 0.76 | 1.42 | |||||||||||||||
| Net charge-offs to average loans | 0.13 | 0.11 | 0.11 | 0.04 | 0.17 | |||||||||||||||
| 16 |
Allocation of Allowance for Loan Losses. The following table sets forth the allocation of allowance for loan losses by loan category at the dates indicated. The table reflects the allowance for loan losses as a percentage of total loans receivable. Management believes that the allowance can be allocated by category only on an approximate basis. The allocation of the allowance by category is not necessarily indicative of future losses and does not restrict the use of the allowance to absorb losses in any category.
| (Dollars in thousands) | ||||||||||||||||||||||||||||||||||||||||
| December 31, | ||||||||||||||||||||||||||||||||||||||||
| 2017 | 2016 | 2015 | 2014 | 2013 | ||||||||||||||||||||||||||||||||||||
| Percent of | Percent of | Percent of | Percent of | Percent of | ||||||||||||||||||||||||||||||||||||
| Total | Total | Total | Total | Total | ||||||||||||||||||||||||||||||||||||
| Amount | Loans(1) | Amount | Loans(1) | Amount | Loans(1) | Amount | Loans(1) | Amount | Loans(1) | |||||||||||||||||||||||||||||||
| Originated Loans | ||||||||||||||||||||||||||||||||||||||||
| Real Estate: | ||||||||||||||||||||||||||||||||||||||||
| Residential | $ | 891 | 32.6 | % | $ | 1,106 | 35.4 | % | $ | 1,623 | 35.2 | % | $ | 2,690 | 39.4 | % | $ | 1,481 | 43.3 | % | ||||||||||||||||||||
| Commercial | 1,799 | 26.1 | 1,942 | 26.7 | 2,045 | 26.4 | 582 | 25.7 | 1,703 | 25.2 | ||||||||||||||||||||||||||||||
| Construction | 276 | 5.9 | 65 | 2.0 | 137 | 3.6 | 122 | 2.5 | 355 | 2.7 | ||||||||||||||||||||||||||||||
| Commercial and Industrial | 2,461 | 16.3 | 1,579 | 13.5 | 784 | 12.5 | 684 | 13.0 | 1,013 | 11.0 | ||||||||||||||||||||||||||||||
| Consumer | 2,358 | 18.6 | 2,463 | 21.7 | 1,887 | 21.4 | 1,015 | 18.6 | 592 | 15.6 | ||||||||||||||||||||||||||||||
| Other | - | 0.5 | - | 0.7 | - | 0.9 | - | 0.8 | - | 2.2 | ||||||||||||||||||||||||||||||
| Total Allocated Allowance | 7,785 | 100.0 | 7,155 | 100.0 | 6,476 | 100.0 | 5,093 | 100.0 | 5,144 | 100.0 | ||||||||||||||||||||||||||||||
| Unallocated | 430 | - | 128 | - | 14 | - | 102 | - | 238 | - | ||||||||||||||||||||||||||||||
| Total Allowance for Loan | ||||||||||||||||||||||||||||||||||||||||
| Losses on Originated Loans | $ | 8,215 | 100.0 | % | $ | 7,283 | 100.0 | % | $ | 6,490 | 100.0 | % | $ | 5,195 | 100.0 | % | $ | 5,382 | 100.0 | % | ||||||||||||||||||||
| Loans Acquired at Fair Value | ||||||||||||||||||||||||||||||||||||||||
| Real Estate: | ||||||||||||||||||||||||||||||||||||||||
| Residential | $ | - | 56.3 | % | $ | - | 54.7 | % | $ | - | 51.7 | % | $ | - | 58.4 | % | ||||||||||||||||||||||||
| Commercial | 490 | 37.7 | 365 | 39.0 | - | 37.8 | - | 28.2 | ||||||||||||||||||||||||||||||||
| Construction | - | 0.0 | - | 0.0 | - | 1.9 | - | 4.4 | ||||||||||||||||||||||||||||||||
| Commercial and Industrial | 83 | 5.8 | 120 | 6.2 | - | 8.3 | - | 8.5 | ||||||||||||||||||||||||||||||||
| Consumer | - | 0.2 | - | 0.1 | - | 0.3 | - | 0.5 | ||||||||||||||||||||||||||||||||
| Total Allocated Allowance | 573 | 100.0 | 485 | 100.0 | - | 100.0 | - | 100.0 | ||||||||||||||||||||||||||||||||
| Unallocated | 8 | - | 35 | - | - | - | - | - | ||||||||||||||||||||||||||||||||
| Total Allowance for Loan | ||||||||||||||||||||||||||||||||||||||||
| Losses on Loans Acquired | ||||||||||||||||||||||||||||||||||||||||
| at Fair Value | $ | 581 | 100.0 | % | $ | 520 | 100.0 | % | $ | - | 100.0 | % | $ | - | 100.0 | % | ||||||||||||||||||||||||
| Total Loans | ||||||||||||||||||||||||||||||||||||||||
| Real Estate: | ||||||||||||||||||||||||||||||||||||||||
| Residential | $ | 891 | 36.7 | % | $ | 1,106 | 39.8 | % | $ | 1,623 | 40.0 | % | $ | 2,690 | 47.1 | % | $ | 1,481 | 43.3 | % | ||||||||||||||||||||
| Commercial | 2,289 | 28.1 | 2,307 | 29.5 | 2,045 | 29.7 | 582 | 26.7 | 1,703 | 25.2 | ||||||||||||||||||||||||||||||
| Construction | 276 | 4.9 | 65 | 1.6 | 137 | 3.1 | 122 | 3.2 | 355 | 2.7 | ||||||||||||||||||||||||||||||
| Commercial and Industrial | 2,544 | 14.5 | 1,699 | 11.9 | 784 | 11.3 | 684 | 11.2 | 1,013 | 11.0 | ||||||||||||||||||||||||||||||
| Consumer | 2,358 | 15.4 | 2,463 | 16.7 | 1,887 | 15.2 | 1,015 | 11.3 | 592 | 15.6 | ||||||||||||||||||||||||||||||
| Other | - | 0.4 | - | 0.5 | - | 0.7 | - | 0.5 | - | 2.2 | ||||||||||||||||||||||||||||||
| Total Allocated Allowance | 8,358 | 100.0 | 7,640 | 100.0 | 6,476 | 100.0 | 5,093 | 100.0 | 5,144 | 100.0 | ||||||||||||||||||||||||||||||
| Unallocated | 438 | 163 | 14 | 102 | 238 | |||||||||||||||||||||||||||||||||||
| Total Allowance | ||||||||||||||||||||||||||||||||||||||||
| for Loan Losses | $ | 8,796 | 100.0 | % | $ | 7,803 | 100.0 | % | $ | 6,490 | 100.0 | % | $ | 5,195 | 100.0 | % | $ | 5,382 | 100.0 | % | ||||||||||||||||||||
| (1) | Represents percentage of loans in each category to total loans |
| 17 |
Investment Activities
General. The Company’s investment policy is established by its board of directors. The policy emphasizes safety of the investment, liquidity requirements, potential returns, cash flow targets, and consistency with the Company’s interest rate risk management strategy.
Our current investment policy permits us to invest in U.S. treasuries, federal agency securities, mortgage-backed securities, investment grade corporate bonds, municipal bonds, short-term instruments, and other securities. The investment policy also permits investments in certificates of deposit, securities purchased under an agreement to resell, bankers acceptances, commercial paper and federal funds. Our current investment policy generally does not permit investment in stripped mortgage-backed securities, short sales, derivatives, or other high-risk securities. Federal and Pennsylvania state laws generally limit our investment activities to those permissible for a national bank.
The accounting rules require that, at the time of purchase, we designate a security as held to maturity, available-for-sale, or trading, depending on our ability and intent. Securities available for sale are reported at fair value, while securities held to maturity are reported at amortized cost. Our entire portfolio is designated as available-for-sale.
The portfolio consists primarily of U.S. government and agency securities, municipal bonds, and mortgage-backed securities classified as available for sale. We expect the composition of our investment portfolio to continue to change based on liquidity needs associated with loan origination activities. During the year ended December 31, 2017, we had no investment securities that were deemed to be other than temporarily impaired.
Under federal regulations, we are required to maintain a minimum amount of liquid assets that may be invested in specified short-term securities and certain other investments. Liquidity levels may be increased or decreased depending upon the yields on investment alternatives and upon management’s judgment as to the attractiveness of the yields then available in relation to other opportunities and its expectation of the level of yield that will be available in the future, as well as management’s projections as to the short-term demand for funds to be used in our loan originations and other activities.
U.S. Government and Agency Securities. At December 31, 2017, we held U.S. Government and agency securities with a fair value of $65.9 million compared to $66.2 million at December 31, 2016. At December 31, 2017, these securities had an average expected life of 3.7 years. While these securities generally provide lower yields than other investments, such as mortgage-backed securities, our current investment strategy is to maintain investments in such instruments to the extent appropriate for liquidity purposes, as collateral for borrowings, and for prepayment protection.
Municipal Bonds. At December 31, 2017, we held available-for-sale municipal bonds with a fair value of $39.0 million compared to $35.7 million at December 31, 2016. Nearly all of our municipal bonds are issued by local municipalities or school districts located in Pennsylvania. Municipal bonds may be general obligation of the issuer or secured by specific revenues. The majority of our municipal bonds are general obligation bonds, which are backed by the full faith and credit of the municipality, paid off with funds from taxes and other fees, and have ratings (when available) of A or above. We also invest in a limited amount of special revenue municipal bonds, which are used to fund projects that will eventually create revenue directly, such as a toll road or lease payments for a new building.
Mortgage-Backed Securities. We invest in mortgage-backed securities insured or guaranteed by the United States government or government-sponsored enterprises. These securities, which consist of mortgage-backed securities issued by Ginnie Mae, Fannie Mae and Freddie Mac, had an amortized cost of $17.1 million and $2.6 million at December 31, 2017 and 2016, respectively. The fair value of our mortgage-backed securities portfolio was $17.0 million and $2.6 million at December 31, 2017 and 2016, respectively. At December 31, 2017, all of the mortgage-backed securities in the investment portfolio had fixed rates of interest.
Mortgage-backed securities are created by pooling mortgages and issuing a security with an interest rate that is less than the interest rate on the underlying mortgages. Mortgage-backed securities typically represent a participation interest in a pool of single-family or multifamily mortgages, although we invest primarily in mortgage-backed securities backed by one- to four-family mortgages. The issuers of such securities pool and resell the participation interests in the form of securities to investors, such as Community Bank. Some securities pools are guaranteed as to payment of principal and interest to investors. Mortgage-backed securities generally yield less than the loans that underlie such securities because of the cost of payment guarantees and credit enhancements. However, mortgage-backed securities are more liquid than individual mortgage loans because there is an active trading market for such securities. In addition, mortgage-backed securities may be used to collateralize our specific liabilities and obligations. Finally, mortgage-backed securities are assigned lower risk-weightings for purposes of calculating our risk-based capital level.
Investments in mortgage-backed securities involve a risk that actual payments will be greater or less than the prepayment rate estimated at the time of purchase, which may require adjustments to the amortization of any premium or acceleration of any discount relating to such interests, thereby affecting the net yield on our securities. We periodically review current prepayment speeds to determine whether prepayment estimates require modification that could cause amortization or accretion adjustments.
| 18 |
Investment Securities Portfolio. The following table sets forth the composition of our investment securities portfolio at the dates indicated. Investment securities do not include FHLB of Pittsburgh and Atlantic Community Bankers’ Bank stock totaling $4.3 million, $3.7 million, and $3.8 million at December 31, 2017, 2016 and 2015, respectively.
| (dollars in thousands) | ||||||||||||||||||||||||
| December 31, | ||||||||||||||||||||||||
| 2017 | 2016 | 2015 | ||||||||||||||||||||||
| Amortized | Fair | Amortized | Fair | Amortized | Fair | |||||||||||||||||||
| Cost | Value | Cost | Value | Cost | Value | |||||||||||||||||||
| Securities available-for-sale | ||||||||||||||||||||||||
| U.S. Government Agencies | $ | 67,603 | $ | 65,888 | $ | 67,944 | $ | 66,156 | $ | 51,151 | $ | 51,188 | ||||||||||||
| Obligations of States and Political Subdivisions | 38,867 | 38,988 | 35,856 | 35,735 | 39,351 | 40,074 | ||||||||||||||||||
| Mortgage-Backed Securities - | ||||||||||||||||||||||||
| Government-Sponsored Enterprises | 17,123 | 16,978 | 2,588 | 2,619 | 3,390 | 3,403 | ||||||||||||||||||
| Equity Securities - Mutual Funds | 500 | 503 | 500 | 507 | 500 | 513 | ||||||||||||||||||
| Equity Securities - Other | 1,188 | 1,226 | 1,106 | 1,191 | 600 | 685 | ||||||||||||||||||
| Total securities available-for-sale | $ | 125,281 | $ | 123,583 | $ | 107,994 | $ | 106,208 | $ | 94,992 | $ | 95,863 | ||||||||||||
Portfolio Maturities and Yields. The composition and maturities of the investment securities portfolio at December 31, 2017, are summarized in the following table. Maturities are based on the final contractual payment dates, and do not reflect the impact of prepayments or early redemptions that may occur. Equity Securities – Mutual Funds and Equity Securities – Other do not have a scheduled maturity date, but have been included in the Due after Ten Years category.
| (Dollars in thousands) | ||||||||||||||||||||||||||||||||||||||||
| More than One Year | More Than Five Years | |||||||||||||||||||||||||||||||||||||||
| One Year or Less | Through Five Years | Through Ten Years | More Than Ten Years | Total | ||||||||||||||||||||||||||||||||||||
| Weighted | Weighted | Weighted | Weighted | Weighted | ||||||||||||||||||||||||||||||||||||
| Carrying | Average | Carrying | Average | Carrying | Average | Carrying | Average | Carrying | Average | |||||||||||||||||||||||||||||||
| Value | Yield | Value | Yield | Value | Yield | Value | Yield | Value | Yield | |||||||||||||||||||||||||||||||
| U.S. Government Agencies | $ | - | - | % | $ | 13,503 | 1.83 | % | $ | 52,385 | 2.05 | % | $ | - | - | % | $ | 65,888 | 2.00 | % | ||||||||||||||||||||
| Obligations of States and | ||||||||||||||||||||||||||||||||||||||||
| Political Subdivisions | 927 | 3.66 | 9,279 | 2.51 | 16,409 | 2.23 | 12,373 | 2.44 | 38,988 | 2.46 | ||||||||||||||||||||||||||||||
| Mortgage-Backed Securities - | ||||||||||||||||||||||||||||||||||||||||
| Government-Sponsored | ||||||||||||||||||||||||||||||||||||||||
| Enterprises | - | - | - | - | 5,330 | 2.08 | 11,648 | 2.34 | 16,978 | 2.26 | ||||||||||||||||||||||||||||||
| Equity Securities - | ||||||||||||||||||||||||||||||||||||||||
| Mutual Funds | - | - | - | - | - | - | 503 | 2.19 | 503 | 2.19 | ||||||||||||||||||||||||||||||
| Equity Securities - Other | - | - | - | - | - | - | 1,226 | 3.22 | 1,226 | 3.22 | ||||||||||||||||||||||||||||||
| Total available-for- | ||||||||||||||||||||||||||||||||||||||||
| sale securities | $ | 927 | 3.66 | % | $ | 22,782 | 2.10 | % | $ | 74,124 | 2.09 | % | $ | 25,750 | 2.43 | % | $ | 123,583 | 2.18 | % | ||||||||||||||||||||
| 19 |
Sources of Funds
General. Deposits have traditionally been the Company’s primary source of funds for use in lending and investment activities. The Company also uses borrowings, primarily FHLB of Pittsburgh advances, to supplement cash flow needs, lengthen the maturities of liabilities for interest rate risk purposes and manage the cost of funds. In addition, funds are derived from scheduled loan payments, investment maturities, loan prepayments, loan sales, retained earnings and income on earning assets. While scheduled loan payments and income on earning assets are relatively stable sources of funds, deposit inflows and outflows can vary widely and are influenced by prevailing interest rates, market conditions and levels of competition.
Deposits. Deposits are generated primarily from residents within the Company’s market area. The Company offers a selection of deposit accounts. Deposit account terms vary, with the principal differences being the minimum balance required, the amount of time the funds must remain on deposit and the interest rate.
Interest rates paid, maturity terms, service fees and withdrawal penalties are established on a periodic basis. Deposit rates and terms are based primarily on current operating strategies and market rates, liquidity requirements, rates paid by competitors and growth goals.
The flow of deposits is influenced significantly by general economic conditions, changes in money market and other prevailing interest rates and competition. The variety of deposit accounts offered allows the Company to be competitive in obtaining funds and responding to changes in consumer demand. Based on experience, the Company believes that its deposits are relatively stable. However, the ability to attract and maintain deposits and the rates paid on these deposits has been and will continue to be significantly affected by market conditions.
The following tables set forth the distribution of our average deposit accounts, by account type, for the years indicated.
| (Dollars in Thousands) | ||||||||||||||||||||||||||||||||||||
| For the Years Ended December 31, | ||||||||||||||||||||||||||||||||||||
| 2017 | 2016 | 2015 | ||||||||||||||||||||||||||||||||||
| Average Balance | Percent | Weighted Average Rate | Average Balance | Percent | Weighted Average Rate | Average Balance | Percent | Weighted Average Rate | ||||||||||||||||||||||||||||
| Non-Interest Bearing | ||||||||||||||||||||||||||||||||||||
| Demand Deposits | $ | 177,220 | 24.0 | % | - | % | $ | 163,790 | 23.9 | % | - | % | $ | 164,015 | 23.6 | % | - | % | ||||||||||||||||||
| NOW Accounts | 133,412 | 18.0 | 0.26 | 114,301 | 16.7 | 0.18 | 104,202 | 15.0 | 0.16 | |||||||||||||||||||||||||||
| Savings Accounts | 129,301 | 17.5 | 0.18 | 122,710 | 17.9 | 0.18 | 122,652 | 17.7 | 0.18 | |||||||||||||||||||||||||||
| Money Market Accounts | 138,782 | 18.8 | 0.27 | 143,644 | 20.9 | 0.25 | 151,338 | 21.8 | 0.23 | |||||||||||||||||||||||||||
| Time Deposits | 160,634 | 21.7 | 1.16 | 141,040 | 20.6 | 1.06 | 151,730 | 21.9 | 1.06 | |||||||||||||||||||||||||||
| Total Deposits | $ | 739,349 | 100.0 | % | 0.38 | % | $ | 685,485 | 100.0 | % | 0.33 | % | $ | 693,937 | 100.0 | % | 0.34 | % | ||||||||||||||||||
The following table sets forth time deposits classified by interest rate as of the dates indicated.
| (Dollars in thousands) | ||||||||||||
| December 31, | ||||||||||||
| 2017 | 2016 | 2015 | ||||||||||
| Interest Rate Range: | ||||||||||||
| Less than 0.25% | $ | 18,595 | $ | 21,246 | $ | 24,136 | ||||||
| 0.25% to 0.50% | 7,873 | 18,627 | 30,968 | |||||||||
| 0.51% to 1.00% | 16,051 | 18,233 | 18,432 | |||||||||
| 1.01% to 2.00% | 110,360 | 82,238 | 51,321 | |||||||||
| 2.01% to 3.00% | 10,221 | 11,957 | 16,878 | |||||||||
| 3.01% to 4.00% | 770 | 1,513 | 1,645 | |||||||||
| 4.01% or greater | 431 | 1,214 | 2,271 | |||||||||
| Total Time Deposits | $ | 164,301 | $ | 155,028 | $ | 145,651 | ||||||
| 20 |
The following table sets forth, by interest rate ranges and scheduled maturity, information concerning our time deposits at December 31, 2017.
| (Dollars in thousands) | ||||||||||||||||||||||||||||||||
| December 31, 2017 | ||||||||||||||||||||||||||||||||
| Period to Maturity | ||||||||||||||||||||||||||||||||
| Less Than | More Than | More Than | More Than | More Than | Percent | |||||||||||||||||||||||||||
| Or Equal to | One to | Two to | Three to | Four to | More Than | of | ||||||||||||||||||||||||||
| One Year | Two Years | Three Years | Four Years | Five Years | Five Years | Total | Total | |||||||||||||||||||||||||
| Interest Rate Range: | ||||||||||||||||||||||||||||||||
| Less than 0.25% | $ | 15,848 | $ | 2,306 | $ | 51 | $ | 247 | $ | 143 | $ | - | $ | 18,595 | 11.3 | % | ||||||||||||||||
| 0.25% to 0.50% | 4,883 | 2,990 | - | - | - | - | 7,873 | 4.8 | ||||||||||||||||||||||||
| 0.51% to 1.00% | 9,857 | 3,229 | 2,717 | 248 | - | - | 16,051 | 9.8 | ||||||||||||||||||||||||
| 1.01% to 2.00% | 26,025 | 45,303 | 15,377 | 8,114 | 8,663 | 6,878 | 110,360 | 67.1 | ||||||||||||||||||||||||
| 2.01% to 3.00% | 4,834 | 472 | 1,915 | 1,998 | 230 | 772 | 10,221 | 6.2 | ||||||||||||||||||||||||
| 3.01% to 4.00% | 290 | 276 | 4 | - | - | 200 | 770 | 0.5 | ||||||||||||||||||||||||
| 4.01% or greater | 416 | - | 1 | - | 14 | - | 431 | 0.3 | ||||||||||||||||||||||||
| Total | $ | 62,153 | $ | 54,576 | $ | 20,065 | $ | 10,607 | $ | 9,050 | $ | 7,850 | $ | 164,301 | 100.0 | % | ||||||||||||||||
As of December 31, 2017, the aggregate amount of outstanding time deposits in amounts greater than or equal to $100,000 was approximately $90.0 million, of which $35.8 million were deposits from public entities. The following table sets forth the maturity of those time deposits as of December 31, 2017.
| (Dollars in Thousands) | ||||
| December 31, 2017 | ||||
| Three Months or Less | $ | 4,048 | ||
| Over Three Months to Six Months | 8,232 | |||
| Over Six Months to One Year | 20,639 | |||
| Over One Year to Three Years | 45,007 | |||
| Over Three Years | 12,097 | |||
| Total | $ | 90,023 | ||
Borrowings. Deposits are our primary source of funds for lending and investment activities. If the need arises, we may rely upon borrowings to supplement our supply of available funds and to fund deposit withdrawals. Our borrowings consist of advances from the FHLB, funds borrowed under repurchase agreements and federal funds purchased.
The FHLB functions as a central reserve bank providing credit for us and other member savings associations and financial institutions. As a member, we are required to own capital stock in the FHLB and are authorized to apply for advances on the security of such stock and certain of our home mortgages, provided certain standards related to creditworthiness have been met. We typically secure advances from the FHLB with one- to four-family residential mortgage, commercial real estate and commercial and industrial loans. Advances are made pursuant to several different programs. Each credit program has its own interest rate and range of maturities. Depending on the program, limitations on the amount of advances are based either on a fixed percentage of a member institution’s stockholders’ equity or on the FHLB’s assessment of the institution’s creditworthiness. At December 31, 2017, we had a maximum borrowing capacity with the FHLB of up to $298.4 million. At December 31, 2017, we had $38.3 million in FHLB advances outstanding, of which $24.5 million were long-term borrowings.
Securities sold under agreements to repurchase represent business deposit customers whose funds, above designated target balances, are transferred into an overnight interest-earning investment account by purchasing securities from the Bank’s investment portfolio under an agreement to repurchase. We may be required to provide additional collateral based on the fair value of the underlying securities. Short-term borrowings also consist of federal funds purchased.
At December 31, 2017, we also maintained a Borrower-In-Custody of Collateral agreement with the Federal Reserve Bank of Cleveland for advances of up to $89.1 million and multiple line of credit arrangements with various banks totaling $40.0 million. At December 31, 2017, we did not have any outstanding balances under any of these borrowing relationships.
| 21 |
The following table sets forth information concerning balances and interest rates on our FHLB advances at the dates and for the periods indicated.
| (Dollars in thousands) | ||||||||||||
| At or For the Years Ended December 31, | ||||||||||||
| 2017 | 2016 | 2015 | ||||||||||
| Balance at End of Period | $ | 38,264 | $ | 28,000 | $ | 37,360 | ||||||
| Average Balance Outstanding During the Period | 25,233 | 28,596 | 28,801 | |||||||||
| Maximum Amount Outstanding at any Month End | 38,264 | 34,160 | 46,067 | |||||||||
| Weighted Average Interest Rate at End of Period | 1.92 | % | 1.80 | % | 1.47 | % | ||||||
| Average Interest Rate During the Period | 1.91 | 1.80 | 1.09 | |||||||||
The following table sets forth information concerning balances and interest rates on our repurchase agreements at the dates and for the periods indicated.
| (Dollars in thousands) | ||||||||||||
| At or For the Years Ended December 31, | ||||||||||||
| 2017 | 2016 | 2015 | ||||||||||
| Balance at End of Period | $ | 25,841 | $ | 27,027 | $ | 23,088 | ||||||
| Average Balance Outstanding During the Period | 26,350 | 26,311 | 23,303 | |||||||||
| Maximum Amount Outstanding at any Month End | 27,951 | 30,095 | 27,908 | |||||||||
| Weighted Average Interest Rate at End of Period | 0.26 | % | 0.24 | % | 0.18 | % | ||||||
| Average Interest Rate During the Period | 0.31 | 0.26 | 0.24 | |||||||||
Subsidiary Activities
Community Bank is the only subsidiary of the Company. Community Bank wholly-owns Exchange Underwriters, Inc., a full-service, independent insurance agency.
Personnel
As of December 31, 2017, the Company and Community Bank had a total of 201 full-time equivalent employees. None of the Company’s employees are represented by a collective bargaining group.
REGULATION AND SUPERVISION
General
CB Financial Services, Inc., is a bank holding company within the meaning of the Bank Holding Company Act of 1956, as amended. As such, it is registered with, subject to examination and supervision by, and otherwise required to comply with the rules and regulations of the Federal Reserve Board.
Community Bank is a Pennsylvania-chartered commercial bank subject to extensive regulation by the Pennsylvania Department of Banking and Securities and the FDIC. Community Bank’s deposit accounts are insured up to applicable limits by the FDIC. Community Bank must file reports with the Pennsylvania Department of Banking and Securities and the FDIC concerning its activities and financial condition, in addition to obtaining regulatory approvals prior to entering into certain transactions, such as mergers or acquisitions with other depository institutions. There are periodic examinations of the Bank by the Pennsylvania Department of Banking and Securities and the FDIC to review Community Bank’s compliance with various regulatory requirements. Community Bank is also subject to certain reserve requirements established by the Federal Reserve Board. This regulation and supervision establishes a comprehensive framework of activities in which a commercial bank can engage and is intended primarily for the protection of the FDIC and depositors. The regulatory structure also gives the regulatory authorities extensive discretion in connection with their supervisory and enforcement activities and examination policies, including policies with respect to the classification of assets and the establishment of adequate loan loss reserves for regulatory purposes. Any change in such regulation, whether by the Pennsylvania Department of Banking and Securities, the FDIC, the Federal Reserve Board or Congress could have a material impact on the operations of Community Bank.
| 22 |
Set forth below is a brief description of material regulatory requirements that are or will be applicable to CB Financial Services, Inc., and Community Bank. The description is limited to certain material aspects of the statutes and regulations addressed, is not intended to be a complete description of such statutes and regulations and their effects on CB Financial Services, Inc. and Community Bank, and is qualified in its entirety by reference to the actual statutes and regulations involved.
Federal Legislation
The Dodd-Frank Act made significant changes to the regulatory structure for depository institutions and their holding companies. However, the Dodd-Frank Act’s changes go well beyond that and affect the lending, investments and other operations of all depository institutions. The Dodd-Frank Act requires the Federal Reserve to set minimum capital levels for bank holding companies that are as stringent as those required for the insured depository subsidiaries, and the components of Tier 1 capital for holding companies are restricted to capital instruments that are currently considered to be Tier 1 capital for insured depository institutions. The legislation also establishes a floor for capital of insured depository institutions that cannot be lower than the standards in effect upon passage, and directs the federal banking regulators to implement new leverage and capital requirements that take into account off-balance sheet activities and other risks, including risks relating to securitized products and derivatives.
The Dodd-Frank Act created a new Consumer Financial Protection Bureau with broad powers to supervise and enforce consumer protection laws. The Consumer Financial Protection Bureau has broad rule-making authority for a wide range of consumer protection laws that apply to all banks, such as Community Bank, including the authority to prohibit “unfair, deceptive or abusive” acts and practices. The Consumer Financial Protection Bureau has examination and enforcement authority over all banks with more than $10 billion in assets. Banks with $10 billion or less in assets are still examined for compliance by their applicable bank regulators. The new legislation also gave state attorney generals the ability to enforce applicable federal consumer protection laws.
The Dodd-Frank Act broadened the base for FDIC insurance assessments. Assessments are now based on the average consolidated total assets less tangible equity capital of a financial institution. The legislation also increased the maximum amount of deposit insurance for banks to $250,000 per depositor, retroactive to January 1, 2008. The Dodd-Frank Act increased shareholder influence over boards of directors by requiring companies to give shareholders a non-binding vote on executive compensation and so called “golden parachute” payments. The legislation also directs the Federal Reserve to promulgate rules prohibiting excessive compensation paid to bank holding company executives, regardless of whether the company is publicly traded or not. Further, the legislation requires that originators of securitized loans retain a percentage of the risk for transferred loans, directs the Federal Reserve to regulate pricing of certain debit card interchange fees and contains a number of reforms related to mortgage origination.
The Dodd Frank Act has resulted in an increased regulatory burden and compliance, operating and interest expense for the Company and Community Bank.
Bank Regulation
Business Activities. Community Bank derives its lending and investment powers from the applicable Pennsylvania law, federal law and applicable state and federal regulations. Under these laws and regulations, Community Bank may invest in mortgage loans secured by residential and commercial real estate, commercial business and consumer loans, certain types of debt securities and certain other assets, subject to applicable limits.
Capital Requirements. Federal regulations require state banks to meet three minimum capital standards: a 1.5% tangible capital ratio, a 4% core capital to assets leverage ratio (3% for savings associations receiving the highest rating on the composite, or “CAMELS,” rating system for capital adequacy, asset quality, management, earnings, liquidity and sensitivity to market risk), and an 8% risk-based capital ratio.
The risk-based capital standard for state banks requires the maintenance of Tier 1 (core) and total capital (which is defined as core capital and supplementary capital) to risk-weighted assets of at least 4% and 8%, respectively. In determining the amount of risk weighted assets, all assets, including certain off balance sheet assets, are multiplied by a risk-weight factor of 0% to 1250%, assigned by the regulations, based on the risks believed inherent in the type of asset. Core capital is defined as common shareholders’ equity (including retained earnings), certain noncumulative perpetual preferred stock and related surplus and minority interests in equity accounts of consolidated subsidiaries, less intangibles other than certain mortgage servicing rights and credit card relationships. The components of supplementary capital include cumulative preferred stock, long-term perpetual preferred stock, mandatory convertible securities, subordinated debt and intermediate preferred stock, the allowance for loan losses limited to a maximum of 1.25% of risk-weighted assets and up to 45% of net unrealized gains on available-for-sale equity securities with readily determinable fair market values. Overall, the amount of supplementary capital included as part of total capital cannot exceed 100% of core capital. Additionally, an institution that retains credit risk in connection with an asset sale is required to maintain additional regulatory capital because of the purchaser’s recourse against the institution. In assessing an institution’s capital adequacy, the FDIC takes into consideration not only these numeric factors, but qualitative factors as well and has the authority to establish higher capital requirements for individual associations where necessary.
| 23 |
At December 31, 2017, Community Bank’s capital exceeded all applicable requirements.
New Capital Rule. On July 9, 2013, the FDIC and the other federal bank revised their risk-based capital rule and the method for calculating risk-weighted assets to make them consistent with agreements that were reached by the Basel Committee on Banking Supervision and certain provisions of the Dodd-Frank Act. The rule applies to all depository institutions and top-tier bank holding companies with total consolidated assets of $500 million or more (such as Community Bank). Among other things, the rule establishes a new common equity Tier 1 minimum capital requirement (4.5% of risk-weighted assets), increases the minimum Tier 1 capital to risk-based assets requirement (from 4.0% to 6.0% of risk-weighted assets) and assigns a higher risk weight (150%) to exposures that are more than 90 days past due or are on nonaccrual status and to certain commercial real estate facilities that finance the acquisition, development or construction of real property. The rule also requires unrealized gains and losses on certain “available-for-sale” securities holdings to be included for purposes of calculating regulatory capital requirements unless a one-time opt-in or opt-out is exercised. Community Bank elected the one-time opt-out election for the accumulated other comprehensive income (AOCI) to be excluded from the regulatory capital calculation as of the March 31, 2015 Call Report. The rule limits a banking organization’s capital distributions and certain discretionary bonus payments if the banking organization does not hold a “capital conservation buffer” consisting of 2.5% of common equity Tier 1 capital to risk-weighted assets in addition to the amount necessary to meet its minimum risk-based capital requirements. The rule became effective for Community Bank on January 1, 2015. The capital conservation buffer requirement is being phased in at 0.625% per year beginning January 1, 2016 and ending January 1, 2019, when the full 2.5% capital conservation buffer requirement will be effective.
Loans-to-One Borrower. Generally, a Pennsylvania-chartered commercial bank may not make a loan or extend credit to a single or related group of borrowers in excess of 15% of capital. An additional amount may be loaned, equal to 10% of unimpaired capital and surplus, if the loan is secured by readily marketable collateral, which generally does not include real estate. As of December 31, 2017, Community Bank was in compliance with the loans-to-one borrower limitations.
Capital Distributions. The Pennsylvania Banking Code states, in part, that dividends may be declared and paid only out of accumulated net earnings and may not be declared or paid unless surplus is at least equal to capital. Dividends may not reduce surplus without the prior consent of the Pennsylvania Department of Banking and Securities. In addition, the Federal Deposit Insurance Act provides that an insured depository institution may not make any capital distribution if, after making such distribution, the institution would fail to meet any applicable regulatory capital requirement.
Community Reinvestment Act and Fair Lending Laws. All insured institutions have a responsibility under the Community Reinvestment Act and related regulations to help meet the credit needs of their communities, including low- and moderate-income borrowers. The FDIC is required to assess the federal savings association’s record of compliance with the Community Reinvestment Act. Failure to comply with the provisions of the Community Reinvestment Act could, at a minimum, result in denial of certain corporate applications, such as branches or mergers, or in restrictions on its activities. In addition, the Equal Credit Opportunity Act and the Fair Housing Act prohibit lenders from discriminating in their lending practices on the basis of characteristics specified in those statutes. The failure to comply with the Equal Credit Opportunity Act and the Fair Housing Act could result in enforcement actions by the FDIC, as well as other federal regulatory agencies and the Department of Justice.
The Community Reinvestment Act requires all institutions insured by the FDIC to publicly disclose their rating. Community Bank received a “satisfactory” rating in its most recent federal examination.
Transactions with Related Parties. A state-chartered bank’s authority to engage in transactions with, its affiliates is limited by Sections 23A and 23B of the Federal Reserve Act and federal regulation. An affiliate is generally a company that controls, or is under common control with an insured depository institution, such as Community Bank. The Company is an affiliate of Community Bank because of its control of Community Bank. In general, transactions between an insured depository institution and its affiliates are subject to certain quantitative limits and collateral requirements. In addition, federal regulations prohibit a state chartered bank from lending to any of its affiliates that are engaged in activities that are not permissible for bank holding companies and from purchasing the securities of any affiliate, other than a subsidiary. Finally, transactions with affiliates must be consistent with safe and sound banking practices, not involve the purchase of low-quality assets and be on terms that are as favorable to the institution as comparable transactions with non-affiliates.
Community Bank’s authority to extend credit to its directors, executive officers and 10% shareholders, as well as to entities controlled by such persons, is currently governed by the requirements of Sections 22(g) and 22(h) of the Federal Reserve Act and Regulation O of the Federal Reserve. Among other things, these provisions generally require that extensions of credit to insiders:
| 24 |
| • | be made on terms that are substantially the same as, and follow credit underwriting procedures that are not less stringent than, those prevailing for comparable transactions with unaffiliated persons and that do not involve more than the normal risk of repayment or present other unfavorable features; and |
| • | not exceed certain limitations on the amount of credit extended to such persons, individually and in the aggregate, which limits are based, in part, on the amount of Community Bank’s capital. |
In addition, extensions of credit in excess of certain limits must be approved by Community Bank’s board of directors. Extensions of credit to executive officers are subject to additional limits based on the type of extension involved.
Standards for Safety and Soundness. Federal law requires each federal banking agency to prescribe certain standards for all insured depository institutions. These standards relate to, among other things, internal controls, information systems and audit systems, loan documentation, credit underwriting, interest rate risk exposure, asset growth, compensation, and other operational and managerial standards as the agency deems appropriate. Interagency guidelines set forth the safety and soundness standards that the federal banking agencies use to identify and address problems at insured depository institutions before capital becomes impaired. If the appropriate federal banking agency determines that an institution fails to meet any standard prescribed by the guidelines, the agency may require the institution to submit to the agency an acceptable plan to achieve compliance with the standard. If an institution fails to meet these standards, the appropriate federal banking agency may require the institution to implement an acceptable compliance plan. Failure to implement such a plan can result in further enforcement action, including the issuance of a cease and desist order or the imposition of civil money penalties.
Prompt Corrective Action Regulations. Under the Federal Prompt Corrective Action statute, the FDIC is required to take supervisory actions against undercapitalized state-chartered banks under its jurisdiction, the severity of which depends upon the institution’s level of capital. An institution that has total risk-based capital of less than 8% or a leverage ratio or a Tier 1 risk-based capital ratio that generally is less than 4% is considered to be “undercapitalized”. An institution that has total risk-based capital less than 6%, a Tier 1 core risk-based capital ratio of less than 3% or a leverage ratio that is less than 3% is considered to be “significantly undercapitalized.” An institution that has a tangible capital to assets ratio equal to or less than 2% is deemed to be “critically undercapitalized.”
Generally, the Pennsylvania Department of Banking and Securities (the “Pennsylvania Department of Banking” or “PDBS”) is required to appoint a receiver or conservator for a state-chartered bank that is “critically undercapitalized” within specific time frames. The regulations also provide that a capital restoration plan must be filed with the FDIC within 45 days of the date that an institution is deemed to have received notice that it is “undercapitalized,” “significantly undercapitalized” or “critically undercapitalized.” Any bank holding company of an institution that is required to submit a capital restoration plan must guarantee performance under the plan in an amount of up to the lesser of 5% of the institution’s assets at the time it was deemed to be undercapitalized by the FDIC or the amount necessary to restore the institution to adequately capitalized status. This guarantee remains in place until the FDIC notifies the institution that it has maintained adequately capitalized status for each of four consecutive calendar quarters. Institutions that are undercapitalized become subject to certain mandatory measures, such as a restrictions on capital distributions and asset growth. The PDBS may also take any one of a number of discretionary supervisory actions against undercapitalized institutions, including the issuance of a capital directive and the replacement of senior executive officers and directors.
At December 31, 2017, Community Bank met the criteria for being considered “well capitalized.”
In addition, the final capital rule adopted in July 2013 revises the prompt corrective action categories to incorporate the revised minimum capital requirements of that rule.
Enforcement. The Pennsylvania Department of Banking maintains enforcement authority over Community Bank, including the power to issue cease and desist orders and civil money penalties and to remove directors, officers or employees. It also has the power to appoint a conservator or receiver for a bank upon insolvency, imminent insolvency, unsafe or unsound condition or certain other situations. The FDIC has primary federal enforcement responsibility over non-FRB-member state banks and has authority to bring actions against the institution and all institution-affiliated parties, including shareholders, and any attorneys, appraisers and accountants who knowingly or recklessly participate in wrongful actions likely to have an adverse effect on the bank. Formal enforcement action may range from the issuance of a capital directive or cease and desist order to removal of officers and/or directors. Civil penalties cover a wide range of violations and can amount to $25,000 per day, or even $1 million per day in especially egregious cases. In general, regulatory enforcement actions occur with respect to situations involving unsafe or unsound practices or conditions, violations of law or regulation or breaches of fiduciary duty. Federal and Pennsylvania laws also establish criminal penalties for certain violations.
| 25 |
Insurance of Deposit Accounts. The Deposit Insurance Fund of the FDIC insures deposits at FDIC-insured financial institutions, such as Community Bank. Deposit accounts in Community Bank are insured by the FDIC generally up to a maximum of $250,000 per separately insured depositor and up to a maximum of $250,000 for self-directed retirement accounts. The FDIC charges insured depository institutions premiums to maintain the Deposit Insurance Fund.
Under the FDIC’s risk-based assessment system, insured institutions are assigned to one of four risk categories based on supervisory evaluations, regulatory capital levels and certain other risk factors. Rates are based on each institution’s risk category and certain specified risk adjustments. Stronger institutions pay lower rates while riskier institutions pay higher rates. Assessments are based on an institution’s average consolidated total assets minus average tangible equity instead of total deposits, ranging from 2.5 to 45 basis points.
In addition to the FDIC assessments, the Financing Corporation (“FICO”) is authorized to impose and collect, with the approval of the FDIC, assessments for anticipated payments, issuance costs and custodial fees on bonds issued by the FICO in the 1980s to recapitalize the former Federal Savings and Loan Insurance Corporation. The bonds issued by the FICO are due to mature in 2017 through 2019.
The FDIC has authority to increase insurance assessments. Any significant increases would have an adverse effect on the operating expenses and results of operations of Community Bank. Management cannot predict what assessment rates will be in the future.
Insurance of deposits may be terminated by the FDIC upon a finding that an institution has engaged in unsafe or unsound practices, is in an unsafe or unsound condition to continue operations or has violated any applicable law, regulation, rule, order or condition imposed by the FDIC. Community Bank does not currently know of any practice, condition or violation that may lead to termination of its deposit insurance.
Prohibitions Against Tying Arrangements. State-chartered banks are prohibited, subject to some exceptions, from extending credit to or offering any other service, or fixing or varying the consideration for such extension of credit or service, on the condition that the customer obtain some additional service from the institution or its affiliates or not obtain services of a competitor of the institution.
FHLB System. Community Bank is a member of the FHLB System, which consists of 12 regional FHLBs. The FHLB System provides a central credit facility primarily for member institutions as well as other entities involved in home mortgage lending. As a member of the FHLB of Pittsburgh, Community Bank is required to acquire and hold shares of capital stock in the FHLB. As of December 31, 2017, Community Bank was in compliance with this requirement. Community Bank also is able to borrow from the FHLB of Pittsburgh, which provides an additional source of liquidity for Community Bank.
Federal Reserve System. The FRB regulations require banks to maintain reserves against their transaction accounts (primarily Negotiable Order of Withdrawal, or NOW and regular checking accounts). The regulations generally provide that reserves be maintained against aggregate transaction accounts as follows for 2017: a 3% reserve ratio is assessed on net transaction accounts up to and including $115.1 million; a 10% reserve ratio is applied above $115.1 million. The first $15.5 million of otherwise reservable balances (subject to adjustments by the Federal Reserve Board) are exempted from the reserve requirements. Community Bank complies with the foregoing requirements. The amounts are adjusted annually and, for 2018, establish a 3% reserve ratio for aggregate transaction accounts up to $122.3 million, a 10% ratio above $122.3 million, and an exemption of $16.0 million.
Other Regulations
Interest and other charges collected or contracted for by Community Bank are subject to state usury laws and federal laws concerning interest rates. Community Bank’s operations are also subject to federal and state laws applicable to credit transactions, such as the:
| • | Truth-In-Lending Act, governing disclosures of credit terms to consumer borrowers; |
| • | Home Mortgage Disclosure Act, requiring financial institutions to provide information to enable the public and public officials to determine whether a financial institution is fulfilling its obligation to help meet the housing needs of the community it serves; |
| • | Equal Credit Opportunity Act, prohibiting discrimination on the basis of race, creed or other prohibited factors in extending credit; |
| • | Fair Credit Reporting Act, governing the use and provision of information to credit reporting agencies; |
| • | Fair Debt Collection Act, governing the manner in which consumer debts may be collected by collection agencies; |
| 26 |
| • | Truth in Savings Act; and |
| • | Rules and regulations of the various federal and state agencies charged with the responsibility of implementing such laws. |
The operations of Community Bank also are subject to the:
| • | Right to Financial Privacy Act, which imposes a duty to maintain confidentiality of consumer financial records and prescribes procedures for complying with administrative subpoenas of financial records; |
| • | Electronic Funds Transfer Act and Regulation E promulgated thereunder, which govern automatic deposits to and withdrawals from deposit accounts and customers’ rights and liabilities arising from the use of automated teller machines and other electronic banking services; |
| • | Check Clearing for the 21st Century Act (also known as “Check 21”), which gives “substitute checks,” such as digital check images and copies made from that image, the same legal standing as the original paper check; |
| • | The USA PATRIOT Act, which requires banks operating to, among other things, establish broadened anti-money laundering compliance programs, due diligence policies and controls to ensure the detection and reporting of money laundering. Such required compliance programs are intended to supplement existing compliance requirements, also applicable to financial institutions, under the Bank Secrecy Act and the Office of Foreign Assets Control regulations; and |
| • | The Gramm-Leach-Bliley Act, which places limitations on the sharing of consumer financial information by financial institutions with unaffiliated third parties. Specifically, the Gramm-Leach-Bliley Act requires all financial institutions offering financial products or services to retail customers to provide such customers with the financial institution’s privacy policy and provide such customers the opportunity to “opt out” of the sharing of certain personal financial information with unaffiliated third parties. |
Holding Company Regulation
General. The Company is a bank holding company within the meaning of the Bank Holding Company Act of 1956, as amended. As such, the Company is registered with the Federal Reserve and is subject to regulations, examinations, supervision and reporting requirements applicable to bank holding companies. In addition, the Federal Reserve has enforcement authority over the Company and its non-bank subsidiaries. Among other things, this authority permits the Federal Reserve to restrict or prohibit activities that are determined to be a serious risk to the subsidiary banking institution.
Capital. The Dodd-Frank Act requires the Federal Reserve to establish for all depository institution holding companies minimum consolidated capital requirements that are as stringent as those required for the insured depository subsidiaries.
Source of Strength. The Dodd-Frank Act requires the federal bank regulatory agencies to issue regulations requiring that all bank holding companies serve as a source of strength to their subsidiary depository institutions by providing capital, liquidity and other support in times of financial stress.
Dividends. The Federal Reserve has issued a policy statement regarding the payment of dividends and the repurchase of shares of common stock by bank holding companies. In general, the policy provides that dividends should be paid only out of current earnings and only if the prospective rate of earnings retention by the holding company appears consistent with the organization’s capital needs, asset quality and overall financial condition. Regulatory guidance provides for prior regulatory consultation with respect to capital distributions in certain circumstances, such as where the company’s net income for the past four quarters, net of dividends previously paid over that period, is insufficient to fully fund the dividend or the company’s overall rate or earnings retention is inconsistent with the company’s capital needs and overall financial condition. The ability of a holding company to pay dividends may be restricted if a subsidiary depository institution becomes undercapitalized. The policy statement also states that a holding company should inform the Federal Reserve supervisory staff before redeeming or repurchasing common stock or perpetual preferred stock if the holding company is experiencing financial weaknesses or if the repurchase or redemption would result in a net reduction, as of the end of a quarter, in the amount of such equity instruments outstanding compared with the beginning of the quarter in which the redemption or repurchase occurred. These regulatory policies may affect the Company’s ability to pay dividends, repurchase shares of common stock or otherwise engage in capital distributions.
Acquisition. Under the Change in Bank Control Act, a federal statute, a notice must be submitted to the Federal Reserve if any person (including a company), or group acting in concert, seeks to acquire direct or indirect “control” of a bank holding company. Under certain circumstances, a change of control may occur, and prior notice is required, upon the acquisition of 10% or more of the company’s outstanding voting stock, unless the Federal Reserve has found that the acquisition will not result in control of the company. A change in control definitively occurs upon the acquisition of 25% or more of the company’s outstanding voting stock.
| 27 |
Under the Change in Bank Control Act, the Federal Reserve generally has 60 days from the filing of a complete notice to act, taking into consideration certain factors, including the financial and managerial resources of the acquirer and the competitive effects of the acquisition.
Federal Securities Laws. The Company’s common stock is registered with the Securities and Exchange Commission under the Securities Exchange Act of 1934, as amended. As a result, the Company is subject to the information, proxy solicitation, insider trading restrictions and other requirements under the Securities Exchange Act of 1934.
Emerging Growth Company Status. The Jumpstart Our Business Startups Act (the “JOBS Act”), which was enacted in April 2012, has made numerous changes to the federal securities laws to facilitate access to capital markets. Under the JOBS Act, a company with total annual gross revenues of less than $1.0 billion during its most recently completed fiscal year qualifies as an “emerging growth company.” The Company qualifies as an emerging growth company under the JOBS Act. An “emerging growth company” may choose not to hold shareholder votes to approve annual executive compensation (more frequently referred to as “say-on pay” votes) or executive compensation payable in connection with a merger (more frequently referred to as “say-on-golden parachute” votes). An emerging growth company also is not subject to the requirement that its auditors attest to the effectiveness of the company’s internal control over financial reporting, and can provide scaled disclosure regarding executive compensation. The Company anticipate losing its Emerging Growth Company Status at the end of 2018 as a result of exceeding the $1 billion asset level due to the proposed merger. Finally, an emerging growth company may elect to comply with new or amended accounting pronouncements in the same manner as a private company, but must make such election when the company is first required to file a registration statement. Such an election is irrevocable during the period a company is an emerging growth company. The Company has not elected to comply with new or amended accounting pronouncements in the same manner as a private company. A company loses emerging growth company status on the earlier of: (i) the last day of the fiscal year of the company during which it had total annual gross revenues of $1.0 billion or more; (ii) the last day of the fiscal year of the issuer following the fifth anniversary of the date of the first sale of common equity securities of the company pursuant to an effective registration statement under the Securities Act of 1933; (iii) the date on which such company has, during the previous three-year period, issued more than $1.0 billion in non-convertible debt; or (iv) the date on which such company is deemed to be a “large accelerated filer” under Securities and Exchange Commission regulations (generally, at least $700 million of voting and non-voting equity held by nonaffiliates).
TAXATION
General. The Company and Community Bank are subject to federal income taxation in the same general manner as other corporations, with some exceptions discussed below. The following discussion of federal taxation is intended only to summarize certain pertinent federal income tax matters and is not a comprehensive description of the tax rules applicable to the Company and Community Bank.
Method of Accounting. For federal income tax purposes, the Company currently reports its income and expenses on the accrual method of accounting and uses a tax year ending December 31 for filing its federal and state income tax returns.
Federal Taxation. The federal income tax laws apply to the Company in the same manner as to other corporations with some exceptions. The Company may exclude from income 100% of dividends received from Community Bank as members of the same affiliated group of corporations. For federal income tax purposes, corporations may carry back net operating losses to the preceding two taxable years and forward to the succeeding twenty taxable years, subject to certain limitations. For its 2017 fiscal year, the Company’s maximum federal income tax rate was 34%.
State Taxation. The Bank is subject to the Pennsylvania Bank and Trust Company Shares Tax, otherwise known as “shares tax.” The shares tax rate in the prior year was 0.89%. As of July 1, 2016, the Pennsylvania state legislature ratified an increase of the shares tax rate to 0.95% that became effective for tax years starting January 1, 2017. The tax is imposed on the Bank’s adjusted equity. The Company and Exchange Underwriters are subject to the Pennsylvania Corporate Net Income Tax, otherwise known as “CNI tax.” The CNI tax rate in 2017 was 9.99%. The tax is imposed on income or loss from the federal income tax return on a separate-company basis for the Company and Exchange Underwriters. The federal return income or loss is adjusted for various items treated differently by the Pennsylvania Department of Revenue.
| 28 |
| ITEM 1A. | Risk Factors |
In addition to risk disclosed elsewhere in this Annual Report, the following are risks associated with our business and operations.
Changes in interest rates may reduce the Company’s profits and impair asset values.
The Company’s earnings and cash flows depend primarily on its net interest income. Interest rates are highly sensitive to many factors that are beyond the Company’s control, including general economic conditions and the policies of various governmental and regulatory agencies, particularly the Federal Reserve. Changes in market interest rates could have an adverse effect on the Company’s financial condition and results of operations. The Company’s interest-bearing liabilities generally reprice or mature more quickly than its interest earning assets. If rates increase rapidly, the Company may have to increase the rates paid on deposits, particularly higher cost time deposits and borrowed funds, more quickly than any changes in interest rates earned on loans and investments, resulting in a negative effect on interest rate spreads and net interest income. Increases in interest rates may also make it more difficult for borrowers to repay adjustable rate loans. Conversely, should market interest rates fall below current levels, the Company’s net interest margin also could be negatively affected if competitive pressures keep it from further reducing rates on deposits, while the yields on the Company’s interest-earning assets decrease more rapidly through loan prepayments and interest rate adjustments. Decreases in interest rates often result in increased prepayments of loans and mortgage-related securities, as borrowers refinance their loans to reduce borrowings costs. Under these circumstances, the Company is subject to reinvestment risk to the extent it is unable to reinvest the cash received from such prepayments in loans or other investments that have interest rates that are comparable to the interest rates on existing loans and securities. Changes in interest rates also affect the value of the Company’s interest-earning assets, and in particular its securities portfolio. Generally, the value of fixed-rate securities fluctuates inversely with changes in interest rates. Unrealized gains and losses on securities available for sale determined to be temporary in nature are reported as a separate component of equity. Decreases in the fair value of securities available for sale resulting from increases in interest rates therefore could have an adverse effect on the Company’s shareholders’ equity.
A large percentage of the Company’s loans are collateralized by real estate, and further disruptions in the real estate market may result in losses and reduce the Company’s earnings.
A substantial portion of the Company’s loan portfolio consists of loans collateralized by real estate. Improving economic conditions have shifted to an increase in demand for real estate, which has resulted in stabilization of some real estate values in the Company’s markets. Further disruptions in the real estate market could significantly impair the value of the Company’s collateral and its ability to sell the collateral upon foreclosure. The real estate collateral in each case provides an alternate source of repayment in the event of default by the borrower and may deteriorate in value during the time the credit is extended. If real estate values decline further, it is likely that the Company would be required to increase its allowance for loan losses. If, during a period of lower real estate values, the Company is required to liquidate the collateral securing a loan to satisfy debts or to increase its allowance for loan losses, it could materially reduce its profitability and adversely affect its financial condition.
Failure to complete the pending merger with FWVB could negatively impact the Company’s stock price and its future business and financial results.
There can be no assurance that the merger will be completed. If the merger is not completed, the ongoing business of the Company may be adversely affected and the Company may experience negative reactions from the financial markets and from its customers and employees, and the Company also could be subject to litigation related to any failure to complete the merger. All these matters, if they come to pass, could have an adverse effect on the Company’s business and results of operations and stock price.
If the FWVB merger is completed, the Company be unable to successfully integrate FWVB’s operations or retain its employees, which could adversely affect the Company.
The merger involves the integration of two companies that have previously operated independently. The difficulties of combining the operations of the two companies include, among other things: integrating personnel with diverse business backgrounds; combining different corporate cultures; and retaining key employees. Furthermore, the diversion of management’s attention and any delays or difficulties encountered in the integration of the two companies’ operations could have an adverse effect on the Company’s business and results of operations following the merger. Additionally, the Company may not be able to achieve the level of cost savings, revenue enhancements and other synergies that it expects to realize in the merger, and may not be able to capitalize upon the existing FWVB customer relationships to the extent anticipated, or it may take longer, or be more difficult or expensive than expected, to achieve these goals, all of which could have an adverse effect on the Company’s business, results of operation and stock price.
| 29 |
Strong competition within the Company’s market area could adversely affect the Company’s earnings and slow growth.
The Company faces intense competition both in making loans and attracting deposits. Price competition for loans and deposits might result in the Company earning less on its loans and paying more on its deposits, which reduces net interest income. Some of the Company’s competitors have substantially greater resources than the Company has and may offer services that it does not provide. The Company expects competition to increase in the future as a result of legislative, regulatory and technological changes and the continuing consolidation in the financial services industry. The Company’s profitability will depend upon its continued ability to compete successfully in its market areas.
Government responses to economic conditions may adversely affect the Company’s operations, financial condition and earnings.
The Dodd-Frank Wall Street Reform and Consumer Protection Act (the “Dodd-Frank Act”) has changed the bank regulatory framework. For example, the law created an independent Consumer Financial Protection Bureau that has assumed the consumer protection responsibilities of the various federal banking agencies, established more stringent capital standards for banks and bank holding companies, and gave the Federal Reserve exclusive authority to regulate both banking holding companies and savings and loan holding companies. The legislation also has resulted in numerous new regulations affecting the lending, funding, trading and investment activities of banks and bank holding companies. The Consumer Financial Protection Bureau has broad rulemaking authority for a wide range of consumer protection laws that apply to all banks and savings institutions (including Community Bank), including the authority to prohibit “unfair, deceptive or abusive” acts and practices. Banks and savings institutions with $10.0 billion or less in assets will continue to be examined by their applicable bank regulators. The Dodd-Frank Act also requires the federal banking agencies to promulgate rules requiring mortgage lenders to retain a portion of the credit risk related to loans that are securitized and sold to investors, and in 2014 the federal bank agencies issued a final rule regarding retention of credit risk on loan sales.
These rules could make it more difficult for the Company to sell loans in the secondary market. Bank regulatory agencies also have been responding aggressively to any safety and soundness or compliance concerns identified in examinations, and such agencies have broad discretion and significant resources to initiate enforcement actions against financial institutions and their directors and officers in connection with their examination authority. Ongoing uncertainty and adverse developments in the financial services industry and in the domestic and international credit markets, and the effect of new legislation and regulatory actions in response to these conditions, may adversely affect the Company’s operations by restricting business activities, including the ability to originate or sell loans, modify loan terms or foreclose on property securing loans.
Compliance with these new laws and regulations has required and will continue to require changes to the Company’s business and operations and may result in additional costs and divert management’s time from other business activities, any of which may adversely impact its results of operations, liquidity or financial condition.
Proposed and final regulations would restrict Community Bank’s ability to originate and sell loans.
The Consumer Financial Protection Bureau has issued a rule designed to clarify for lenders how they can avoid legal liability under the Dodd-Frank Act, which holds lenders accountable for ensuring a borrower’s ability to repay a mortgage. Loans that meet this “qualified mortgage” definition will be presumed to have complied with the new ability-to-repay standard. Under the Consumer Financial Protection Bureau’s rule, a qualified mortgage loan must not contain certain specified features, including:
| · | excessive upfront points and fees (those exceeding 3% of the total loan amount, less “bona fide discount points” for prime loans); |
| · | interest-only payments; |
| · | negative-amortization; and |
| · | terms of longer than 30 years. |
Also, to qualify as a “qualified mortgage,” a loan must be made to a borrower whose total monthly debt-to-income ratio does not exceed 43%. Lenders must also verify and document the income and financial resources relied upon to qualify the borrower on the loan and underwrite the loan based on a fully amortizing payment schedule and maximum interest rate during the first five years, taking into account all applicable taxes, insurance and assessments. Although the significant majority of the Company’s historical loan originations would qualify as qualified mortgages under the new rule on qualified mortgages, the new rule may limit the Company’s ability or desire to make certain types of loans or loans to certain borrowers, and may make it more costly and/or time consuming to make these loans, which could limit the Company’s growth and/or profitability. The new rule may also alter the Company’s residential mortgage loan origination mix between qualified and non-qualified mortgage loans, which could reduce gain on sale fees from secondary market loan sales and affect interest rate risk related to non-qualified loans that are originated and held in the Company’s portfolio.
| 30 |
A worsening of economic conditions could adversely affect the Company’s financial condition and results of operations.
Although the U.S. economy has emerged from the severe recession that occurred in 2008 and 2009, recent economic growth has been slow and uneven. Recovery by many businesses has been impaired by lower consumer spending, and a notable portion of new jobs created nationally have been in lower wage positions. A return to prolonged deteriorating economic conditions could significantly affect the markets in which the Company operates, the value of loans and investments, ongoing operations, costs and profitability. Further declines in real estate values and sales volumes and continued elevated unemployment levels may result in higher than expected loan delinquencies, increases in nonperforming and criticized classified assets, and a decline in demand for the Company’s products and services. In addition, the recent decline in natural gas prices, if it persists or if prices decline further, may depress natural gas exploration and drilling activities in the Marcellus Shale Formation. Furthermore, exploration and drilling of natural gas reserves in our market area may be affected by federal, state and local laws and regulations affecting production, permitting, environmental protection and other matters. Any of these events may negatively affect our customer, and may cause the Company to incur losses, and may adversely affect its financial condition and results of operations.
If the Company’s allowance for loan losses is not sufficient to cover actual loan losses, the Company’s results of operations would be negatively affected.
In determining the adequacy of the allowance for loan losses, the Company analyzes its loss and delinquency experience by loan categories and considers the effect of existing economic conditions. In addition, the Company makes various assumptions and judgments about the collectability of the loan portfolio, including the creditworthiness of its borrowers and the value of the real estate and other assets serving as collateral for the repayment of many of the loans. If the results of these analyses are incorrect, the allowance for loan losses may not be sufficient to cover losses inherent in the portfolio, which would require additions to the allowance and would reduce net income.
In addition, bank regulators periodically review the Company’s allowance for loan losses and may require it to increase the allowance for loan losses or recognize further loan charge-offs. Any increase in the allowance for loan losses or loan charge-offs as required by these regulatory authorities may have a material adverse effect on the Company’s financial condition and results of operations.
Because the Company emphasizes commercial real estate and commercial loan originations, its credit risk may increase, and continued downturns in the local real estate market or economy could adversely affect its earnings.
Commercial real estate and commercial loans generally have more inherent risk than the residential real estate loans. Because the repayment of commercial real estate and commercial loans depends on the successful management and operation of the borrower’s properties or related businesses, repayment of such loans can be affected by adverse conditions in the local real estate market or economy. Commercial real estate and commercial loans also may involve relatively large loan balances to individual borrowers or groups of related borrowers. A downturn in the real estate market or the local economy could adversely affect the value of properties securing the loan or the revenues from the borrower’s business, thereby increasing the risk of nonperforming loans. As the Company’s commercial real estate and commercial loan portfolios increase, the corresponding risks and potential for losses from these loans may also increase. Furthermore, it may be difficult to assess the future performance of newly originated commercial loans, as such loans may have delinquency or charge-off levels above the Company’s historical experience, which could adversely affect the Company’s future performance.
If our nonperforming assets increase, our earnings will suffer.
Our nonperforming assets adversely affect our net income in various ways. We do not record interest income on non-accrual loans or real estate owned. We must reserve for probable losses, which results in additional provisions for loan losses. As circumstances warrant, we must write down the value of properties in our other real estate owned portfolio to reflect changing market values. Additionally, we have legal fees associated with the resolution of problem assets as well as additional costs, such as taxes, insurance and maintenance related to our other real estate owned. The resolution of nonperforming assets also requires the active involvement of management, which can adversely affect the amount of time we devote to the income-producing activities of Community Bank. If our estimate of the allowance for loan losses is inadequate, we will have to increase the allowance accordingly.
| 31 |
If we are unable to borrow funds, we may not be able to meet the cash flow requirements of our depositors, creditors, and borrowers, or the operating cash needed to fund corporate expansion and other corporate activities.
Liquidity is the ability to meet cash flow needs on a timely basis at a reasonable cost. Our liquidity is used to make loans and to repay deposit liabilities as they become due or are demanded by customers. Liquidity policies and procedures are established by the board, with operating limits set based upon the ratio of loans to deposits and percentage of assets funded with non-core or wholesale funding. We regularly monitor our overall liquidity position to ensure various alternative strategies exist to cover unanticipated events that could affect liquidity. We also establish policies and monitor guidelines to diversify our wholesale funding sources to avoid concentrations in any one market source. Wholesale funding sources include federal funds purchased, securities sold under repurchase agreements, non-core deposits, and debt. Community Bank is a member of the FHLB of Pittsburgh, which provides funding through advances to members that are collateralized with mortgage-related assets.
We maintain a portfolio of available-for-sale securities that can be used as a secondary source of liquidity. There are other sources of liquidity available to us should they be needed. These sources include the sale of loans, the ability to acquire national market, non-core deposits, issuance of additional collateralized borrowings such as FHLB advances and federal funds purchased, and the issuance of preferred or common securities.
The impact of the changing regulatory capital requirements and new capital rules is uncertain.
The implementation of more stringent capital requirements for Community Bank and the Company could, among other things, result in lower returns on invested capital, require raising additional capital, and result in regulatory actions if they are unable to comply with such requirements. The stricter capital requirements could also result in management modifying its business strategy, and limit the Company’s ability to make distributions (including paying dividends) or repurchasing its shares.
The Company’s ability to pay dividends is subject to the ability of Community Bank to make capital distributions to the Company, and also may be limited by Federal Reserve policy.
The Company’s long-term ability to pay dividends to its shareholders depends primarily on the ability of Community Bank to make capital distributions to the Company and on the availability of cash at the holding company level if Community Bank’s earnings are not sufficient to pay dividends. In addition, the Federal Reserve has issued a policy statement regarding the payment of dividends by bank holding companies. In general, the policy provides that dividends should be paid only out of current earnings and only if the prospective rate of earnings retention by the holding company appears consistent with the organization’s capital needs, asset quality and overall financial condition. Regulatory guidance provides for prior regulatory consultation with respect to capital distributions in certain circumstances, such as where the holding company’s net income for the past four quarters, net of dividends paid over that period, is insufficient to fully fund the dividend or the holding company’s overall rate or earnings retention is inconsistent with the its capital needs and overall financial condition. These regulatory policies may adversely affect the Company’s ability to pay dividends or otherwise engage in capital distributions.
Changes in the Company’s accounting policies or in accounting standards could materially affect how the Company reports its financial condition and results of operations.
The Company’s accounting policies are essential to understanding its financial condition and results of operations. Some of these policies require the use of estimates and assumptions that may affect the value of the Company’s assets, liabilities, and financial results. Some of the Company’s accounting policies are critical because they require management to make difficult, subjective and complex judgments about matters that are inherently uncertain, and because it is likely that materially different amounts would be reported under different conditions or using different assumptions. If such estimates or assumptions underlying the Company’s financial statements are incorrect, it may experience material losses.
From time to time, the Financial Accounting Standards Board and the Securities and Exchange Commission change the financial accounting and reporting standards or the interpretation of those standards that govern the preparation of the Company’s financial statements. These changes are beyond the Company’s control, can be difficult to predict, and could materially affect how the Company reports its financial condition and results of operations. The Company could also be required to apply a new or revised standard retroactively, resulting in restating prior period financial statements in material amounts.
The need to account for certain assets at estimated fair value, such as loans held for sale and investment securities, may adversely affect the Company’s financial condition and results of operations.
The Company reports certain assets, such as loans held for sale, acquired loans and investment securities, at estimated fair value. Generally, for assets that are reported at fair value, the Company uses quoted market prices or valuation models that utilize observable market inputs to estimate fair value. Because the Company carries these assets on its books at their estimated fair value, it may incur losses even if the asset in question presents minimal credit risk.
| 32 |
Because the nature of the financial services business involves a high volume of transactions, the Company faces significant operational risks.
The Company operates in diverse markets and relies on the ability of its employees and systems to process a significant number of transactions. Operational risk is the risk of loss resulting from operations, including the risk of fraud by employees or persons outside a company, the execution of unauthorized transactions by employees, errors relating to transaction processing and technology, breaches of the internal control system and compliance requirements, and business continuation and disaster recovery. Insurance coverage may not be available for such losses, or where available, such losses may exceed insurance limits. This risk of loss also includes the potential legal actions that could arise as a result of an operational deficiency or as a result of noncompliance with applicable regulatory standards, adverse business decisions or their implementation, and customer attrition due to potential negative publicity. If a breakdown occurs in the internal controls system, improper operation of systems or improper employee actions, the Company could incur financial loss, face regulatory action and suffer damage to its reputation.
Risks associated with system failures, interruptions, breaches of security or cyber security could negatively affect the Company’s earnings.
Information technology systems are critical to the Company’s business. The Company uses various technology systems to manage customer relationships, general ledger, securities investments, deposits and loans. The Company has established policies and procedures to prevent or limit the effect of system failures, interruptions and security breaches, but such events may still occur or may not be adequately addressed if they do occur. In addition, any compromise of the Company’s systems could deter customers from using its products and services. Security systems may not protect systems from security breaches.
In addition, the Company outsources some of its data processing to certain third-party providers. If these third-party providers encounter difficulties, or if the Company has difficulty communicating with them, the Company’s ability to adequately process and account for transactions could be affected, and business operations could be adversely affected. Threats to information security also exist in the processing of customer information through various other vendors and their personnel.
The occurrence of any system failures, interruption or breach of security could damage the Company’s reputation and result in a loss of customers and business thereby, subjecting it to additional regulatory scrutiny, or could expose it to litigation and possible financial liability. Any of these events could have a material adverse effect on its financial condition and results of operations.
The Company is constantly reliable upon the availability of technology, the Internet and telecommunication systems to enable financial transactions by clients, record and monitor transactions and transmit and receive data to and from clients and third parties. Information security risks have increased significantly due to the use of online, telephone and mobile banking channels by clients and the increased sophistication and activities of organized crime, hackers, terrorists and other external parties. Our technologies, systems, networks and our clients’ devices have been subject to, and are likely to continue to be the target of, cyberattacks, computer viruses, malware, phishing attacks or information security breaches that could result in the unauthorized release, gathering, monitoring, misuse, loss or destruction of our or our clients’ confidential, proprietary and other information, the theft of client assets through fraudulent transactions or disruption of our or our clients’ or other third parties’ business operations. Any of the foregoing could have a material adverse effect on the Company’s business, financial condition and results of operations.
The Company’s risk management framework may not be effective in mitigating risk and reducing the potential for significant losses.
The Company’s risk management framework is designed to minimize risk and loss to the company. The Company seeks to identify, measure, monitor, report and control exposure to risk, including strategic, market, liquidity, compliance and operational risks. While the Company uses a broad and diversified set of risk monitoring and mitigation techniques, these techniques are inherently limited because they cannot anticipate the existence or future development of currently unanticipated or unknown risks. Economic conditions and heightened legislative and regulatory scrutiny of the financial services industry, among other developments, have increased the Company’s level of risk. Accordingly, the Company could suffer losses if it fails to properly anticipate and manage these risks.
| 33 |
The Company is an emerging growth company within the meaning of the Securities Act and has decided to take advantage of certain exemptions from various reporting requirements applicable to emerging growth companies. Its common stock could, therefore, be less attractive to investors.
As an “emerging growth company,” the Company is eligible to take advantage of certain exemptions from various reporting requirements that are applicable to other public companies that are not emerging growth companies, including, but not limited to, reduced disclosure about the Company’s executive compensation and omission of compensation discussion and analysis, and an exemption from the requirement of holding a nonbinding advisory vote on executive compensation. In addition, the Company is not subject to certain requirements of Section 404 of the Sarbanes Oxley Act, including the additional level of review of its internal control over financial reporting that may occur when outside auditors attest to its internal control over financial reporting. The Company has elected to take advantage of these exceptions. As a result, the Company’s stockholders will not have access to certain information they may deem important, which may adversely affect the value and trading price of the Company’s common stock. Due to the pending merger, the Company feels that the emerging growth company status will expire as of 12/31/18 with exceeding the $1.0 billion asset limitation.
| ITEM 1B. | Unresolved Staff Comments |
Not applicable.
| ITEM 2. | Properties |
We conduct our business through our main office and fifteen branch offices. At December 31, 2017, our premises and equipment had an aggregate net book value of approximately $16.7 million. Of this amount, $2.3 million currently resides in fixed assets in process. The fixed assets in process amount is mainly comprised of an office building project. The Corporate Center project is an extensive renovation of an office building that was reclassified from an other real estate owned property into fixed assets in process in the first quarter of 2016. This project is currently under construction and resides in fixed assets in process for approximately $2.2 million as of December 31, 2017, and primarily consists of the building cost of approximately $1.9 million. We believe that our office facilities are adequate to meet our present and immediately foreseeable needs.
The following table sets forth certain information concerning the main and each branch office at December 31, 2017.
| 34 |
| (Dollars In Thousands) | ||||||||||||
| Year | Owned | Approximate | Net Book | |||||||||
| Occupied or | or | Square | Value at | |||||||||
| Location | Acquired | Leased | Footage | December 31, 2017 | ||||||||
| Main Office: | ||||||||||||
| 100 North Market Street | ||||||||||||
| Carmichaels, PA 15320 | 1901 | Owned | 12,500 | $ | 1,210 | |||||||
| Branch Offices (Greene County): | ||||||||||||
| 30 West Greene Street | ||||||||||||
| Waynesburg, PA 15370 | 1980 | Owned | 2,800 | 244 | ||||||||
| 100 Miller Lane | Building owned | |||||||||||
| Waynesburg, PA 15370 | 1983 | Ground lease | 7,500 | 225 | ||||||||
| 3241 W. Roy Furman Highway | ||||||||||||
| Rogersville, PA 15359 | 1987 | Owned | 720 | 108 | ||||||||
| 1993 S. Eighty Eight Road | Included | |||||||||||
| Greensboro, PA 15338 | 1963 | Owned | 500 | with main office | ||||||||
| R.J. Sommers Jr. Operations Center (Greene County): | ||||||||||||
| 600 Evergreene Drive | ||||||||||||
| Waynesburg, PA 15370 | 2016 | Owned | 20,000 | 5,632 | ||||||||
| Branch Office (Allegheny County): | ||||||||||||
| 714 Brookline Boulevard | ||||||||||||
| Pittsburgh, PA 15226 | 2004 | Owned | 3,950 | 254 | ||||||||
| Branch Offices (Washington County) | ||||||||||||
| 65 West Chestnut Street | Building owned | |||||||||||
| Washington, PA 15301 | 2009 | Ground lease | 1,494 | 684 | ||||||||
| Waterdam Centre | ||||||||||||
| 4139 Washington Road | ||||||||||||
| McMurray, PA 15317 | 1994 | Leased | 2,800 | 118 | ||||||||
| 200 Main Street | ||||||||||||
| Claysville, PA 15232 | 1996 | Owned | 8,400 | 638 | ||||||||
| 351 Oak Spring Road | ||||||||||||
| Washington, PA 15301 | 2000 | Leased | 610 | 48 | ||||||||
| Southpointe Commons | ||||||||||||
| 325 Southpointe Boulevard, Ste. 100 | ||||||||||||
| Canonsburg, PA 15317 | 2000 | Leased | 1,811 | 183 | ||||||||
| 235 West Main Street | ||||||||||||
| Monongahela, PA 15063 | 2014 | Owned | 6,323 | 1,426 | ||||||||
| Washington Business Center: | ||||||||||||
| 90 West Chestnut Street, Ste 100 | ||||||||||||
| Washington, PA 15301 | 1987 | Leased | 6,815 | 39 | ||||||||
| Corporate Center - Washington: | ||||||||||||
| 2111 North Franklin Drive | ||||||||||||
| Washington, PA 15301 | 2017 | Owned | 22,500 | 2,119 | ||||||||
| Branch Offices (Fayette County): | ||||||||||||
| 545 West Main Street | Building owned | |||||||||||
| Uniontown, PA 15401 | 2014 | Ground lease | 4,160 | 767 | ||||||||
| 101 Independence Street | ||||||||||||
| Perryopolis, PA 15473 | 2014 | Owned | 1,992 | 270 | ||||||||
| Uniontown Business Center: | ||||||||||||
| 110 Daniel Drive , Suite 10 | ||||||||||||
| Uniontown, PA 15401 | 2016 | Leased | 1,935 | 19 | ||||||||
| Branch Offices (Westmoreland County): | ||||||||||||
| 565 Donner Avenue | ||||||||||||
| Monessen, PA 15062 | 2014 | Owned | 18,055 | 1,327 | ||||||||
| 1670 Broad Avenue | ||||||||||||
| Belle Vernon, PA 15012 | 2014 | Owned | 5,048 | 1,152 | ||||||||
| Exchange Underwriters | ||||||||||||
| 121-123 West Pike Street | ||||||||||||
| Canonsburg, PA 15317 | 2014 | Owned | 4,720 | 249 | ||||||||
| 35 |
| ITEM 3. | Legal Proceedings |
At December 31, 2017, we were not involved in any pending legal proceedings other than routine legal proceedings occurring in the ordinary course of business which, in the aggregate, involve amounts that management believes are immaterial to our financial condition, results of operations and cash flows.
| ITEM 4. | Mine Safety Disclosures. |
None.
| ITEM 5. | Market for Registrant’s Common Equity, Related Stockholder Matters and Issuer Purchases of Equity Securities |
The Company’s common stock is traded on the NASDAQ Global Market under the symbol “CBFV.” The Company began trading on the Nasdaq Global Market on November 3, 2014. Prior to November 3, 2014, the Company was quoted on the OTC Markets under the symbol “CBFV.” The approximate number of holders of record of the Company’s common stock as of March 9, 2018, was 515. Certain shares of Company common stock are held in “nominee” or “street” name and accordingly, the number of beneficial owners of such shares is not known or included in the foregoing number.
| 2017 | 2016 | |||||||||||||||||||||||
| Quarter Ended: | High | Low | Dividend | High | Low | Dividend | ||||||||||||||||||
| March 31 | $ | 29.35 | $ | 25.25 | $ | 0.22 | $ | 22.90 | $ | 19.05 | $ | 0.22 | ||||||||||||
| June 30 | 28.90 | 25.40 | 0.22 | 22.17 | 19.72 | 0.22 | ||||||||||||||||||
| September 30 | 29.35 | 25.60 | 0.22 | 23.40 | 21.21 | 0.22 | ||||||||||||||||||
| December 31 | 30.75 | 28.35 | 0.22 | 26.90 | 22.30 | 0.22 | ||||||||||||||||||
Equity Compensation Plans
The following table provides information at December 31, 2017, for compensation plans under which equity securities may be issued.
| Number of securities | |||||||||||||
| remaining available for | |||||||||||||
| Number of securities | future issuance under | ||||||||||||
| to be issued upon | Weighted-average | equity compensation | |||||||||||
| exercise of | exercise price of | plans (excluding | |||||||||||
| outstanding options | outstanding options | securities reflected | |||||||||||
| Plan Category | warrants and rights | warrants and rights | in column (A)) | ||||||||||
| (A) | (B) | (C) | |||||||||||
| Equity compensation plans: | |||||||||||||
| Approved by stockholders | 263,640 | $ | 24.33 | 117,815 | (1) | ||||||||
| Not approved by stockholders | - | - | - | ||||||||||
| Total | 263,640 | $ | 24.33 | 117,815 | |||||||||
| (1) | Represents 111,824 shares available under the 2015 Equity Incentive Plan that can be issued as restricted stock awards or units and 5,991 shares that can be issued as stock options. Restricted stock awards or units may be issued above this amount provided that the number of shares reserved for stock options is reduced by three shares for each restricted stock award or unit share granted. |
During the fourth quarter of 2017, the Company did not repurchase shares of its common stock.
| 36 |
The following graph charts the yearly change in cumulative shareholder return (assuming the reinvestment of all dividends) on the Company’s common stock against the cumulative shareholder return (assuming the reinvestment of all dividends) of the Russell Micro Cap Index (a broad market index) and of the NASDAQ Bank Index (a peer index). Effective November 3, 2014, the Company’s common stock began trading on the NASDAQ Global Market. Before that date, it was quoted on the OTC Market. The shareholder returns indicated are not necessarily indicative of future performance of the Company’s common stock or of either index.
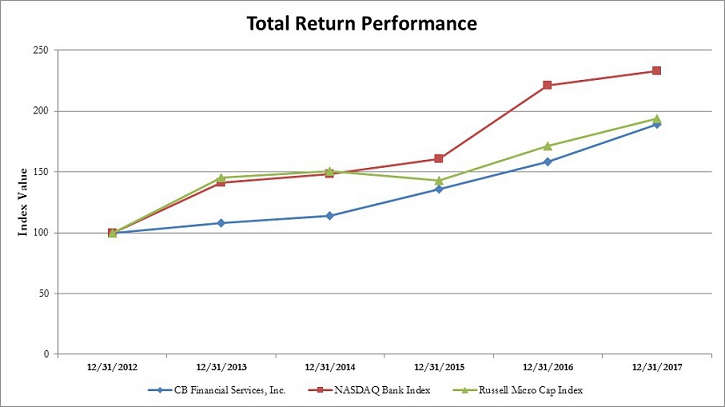
| Source: Bloomberg | Year Ended | |||||||||||||||||||||||
| 12/31/2012 | 12/31/2013 | 12/31/2014 | 12/31/2015 | 12/31/2016 | 12/31/2017 | |||||||||||||||||||
| CB Financial Services, Inc. | 100.00 | 108.37 | 113.80 | 135.93 | 158.53 | 189.37 | ||||||||||||||||||
| NASDAQ Bank Index | 100.00 | 141.31 | 148.11 | 161.09 | 221.04 | 232.84 | ||||||||||||||||||
| Russell Micro Cap Index | 100.00 | 145.36 | 150.58 | 142.91 | 171.63 | 194.07 | ||||||||||||||||||
| ITEM 6. | Selected Financial Data |
The following tables set forth selected historical financial and other data of the Company at and for the years ended December 31, 2017, 2016, 2015, 2014 and 2013. The information at December 31, 2017 and 2016, and for the years ended December 31, 2017, 2016, and 2015 is derived in part from, and should be read together with, the audited financial statements and notes thereto beginning at page 66 of this Annual Report on Form 10-K. The information at December 31, 2015, 2014 and 2013 and for the years ended December 31, 2014 and 2013 is derived in part from audited financial statements that are not included in this Annual Report on Form 10-K.
| 37 |
| (Dollars in Thousands) | ||||||||||||||||||||
| December 31, | ||||||||||||||||||||
| 2017 | 2016 | 2015 | 2014 | 2013 | ||||||||||||||||
| Selected Financial Condition Data: | ||||||||||||||||||||
| Total Assets | $ | 934,486 | $ | 846,075 | $ | 830,677 | $ | 846,314 | $ | 546,486 | ||||||||||
| Cash and Due From Banks | 20,622 | 14,282 | 11,340 | 11,751 | 16,417 | |||||||||||||||
| Investment Securities Available-for-Sale | 123,583 | 106,208 | 95,863 | 105,449 | 133,810 | |||||||||||||||
| Investment Securities Held-to-Maturity | - | - | - | 504 | 1,006 | |||||||||||||||
| Loans, Net | 735,596 | 674,094 | 676,864 | 680,451 | 373,764 | |||||||||||||||
| Deposits | 773,344 | 698,218 | 679,299 | 697,494 | 480,335 | |||||||||||||||
| Short-Term Borrowings | 39,605 | 27,027 | 32,448 | 46,684 | 15,384 | |||||||||||||||
| Other Borrowings | 24,500 | 28,000 | 28,000 | 15,136 | 4,000 | |||||||||||||||
| Total Stockholders’ Equity | 93,256 | 89,469 | 86,896 | 81,912 | 45,005 | |||||||||||||||
| (Dollars in Thousands) | ||||||||||||||||||||
| Years Ended December 31, | ||||||||||||||||||||
| 2017 | 2016 | 2015 | 2014 | 2013 | ||||||||||||||||
| Selected Operating Data: | ||||||||||||||||||||
| Interest and Dividend Income | $ | 32,434 | $ | 32,018 | $ | 31,917 | $ | 20,841 | $ | 17,905 | ||||||||||
| Interest Expense | 3,374 | 2,870 | 2,715 | 1,960 | 2,236 | |||||||||||||||
| Net Interest Income | 29,060 | 29,148 | 29,202 | 18,881 | 15,669 | |||||||||||||||
| Provision for Loan Losses | 1,870 | 2,040 | 2,005 | - | 100 | |||||||||||||||
| Net Interest Income After Provision for Loan Losses | 27,190 | 27,108 | 27,197 | 18,881 | 15,569 | |||||||||||||||
| Noninterest Income | 7,800 | 7,362 | 7,595 | 3,818 | 3,205 | |||||||||||||||
| Noninterest Expense - Merger-Related | 356 | - | - | 1,979 | - | |||||||||||||||
| Noninterest Expense | 24,816 | 23,778 | 22,929 | 14,819 | 13,358 | |||||||||||||||
| Income Before Income Taxes | 9,818 | 10,692 | 11,863 | 5,901 | 5,416 | |||||||||||||||
| Income Taxes | 2,874 | 3,112 | 3,443 | 1,609 | 1,160 | |||||||||||||||
| Net Income | $ | 6,944 | $ | 7,580 | $ | 8,420 | $ | 4,292 | $ | 4,256 | ||||||||||
| Years Ended December 31, | ||||||||||||||||||||
| 2017 | 2016 | 2015 | 2014 | 2013 | ||||||||||||||||
| Performance Ratios: | ||||||||||||||||||||
| Return on Average Assets | 0.78 | % | 0.91 | % | 1.01 | % | 0.72 | % | 0.79 | % | ||||||||||
| Return on Average Equity | 7.53 | 8.48 | 9.89 | 8.60 | 9.43 | |||||||||||||||
| Interest Rate Spread (1)(3) | 3.44 | 3.68 | 3.69 | 3.34 | 3.08 | |||||||||||||||
| Net Interest Margin (2)(3) | 3.58 | 3.82 | 3.82 | 3.47 | 3.23 | |||||||||||||||
| Noninterest Expense to Average Assets | 2.80 | 2.85 | 2.74 | 2.81 | 2.47 | |||||||||||||||
| Efficiency Ratio (4) | 68.29 | 65.13 | 62.31 | 74.00 | 70.77 | |||||||||||||||
| Dividend Payout Ratio (5) | 0.52 | 0.47 | 0.41 | 0.52 | 0.49 | |||||||||||||||
| Average Interest-Earning Assets to | ||||||||||||||||||||
| Average Interest-Bearing Liabilities | 134.88 | 135.12 | 134.26 | 137.33 | 134.56 | |||||||||||||||
| Average Equity to Average Assets | 10.40 | 10.71 | 10.17 | 8.34 | 8.37 | |||||||||||||||
| Capital Ratios: | ||||||||||||||||||||
| Common Equity Tier 1 Capital to Risk-Weighted Assets (6) | 12.22 | % | 13.37 | % | 12.83 | % | N/A | N/A | ||||||||||||
| Tier 1 Capital to Risk-Weighted Assets (6) | 12.22 | 13.37 | 12.83 | 11.63 | % | 11.73 | % | |||||||||||||
| Total Capital to Risk-Weighted Assets (6) | 13.47 | 14.62 | 13.89 | 12.50 | 12.98 | |||||||||||||||
| Tier 1 Leverage Capital to Adjusted Total Assets (6) | 9.27 | 9.80 | 9.60 | 9.33 | 7.70 | |||||||||||||||
| Asset Quality Ratios: | ||||||||||||||||||||
| Allowance for Loan Losses to Total Loans (7) | 1.18 | % | 1.14 | % | 0.95 | % | 0.76 | % | 1.42 | % | ||||||||||
| Allowance for Loan Losses to Nonperforming Loans (7) | 121.31 | 92.60 | 60.69 | 71.14 | 136.98 | |||||||||||||||
| Net Charge-Offs to Average Loans | 0.13 | 0.11 | 0.11 | 0.04 | 0.17 | |||||||||||||||
| Nonperforming Loans to Total Loans | 0.97 | 1.24 | 1.56 | 1.06 | 1.04 | |||||||||||||||
| Nonperforming Loans to Total Assets | 0.78 | 1.00 | 1.29 | 0.86 | 0.72 | |||||||||||||||
| Nonperforming Assets to Total Assets | 0.81 | 1.02 | 1.32 | 0.90 | 0.78 | |||||||||||||||
| Other: | ||||||||||||||||||||
| Number of Offices | 16 | 16 | 16 | 16 | 11 | |||||||||||||||
| Number of Full-Time Equivalent Employees | 201 | 200 | 198 | 189 | 125 | |||||||||||||||
| 38 |
______________________
| (1) | Represents the difference between the weighted average yield on average interest-earning assets and the weighted average cost of average interest-bearing liabilities. |
| (2) | Represents net interest income as a percentage of average interest-earning assets. |
| (3) | Tax-equivalent yield adjustments have been made for tax exempt loan and securities income utilizing a marginal federal tax rate of 34%. |
| (4) | Represents noninterest expense divided by the sum of net interest income and noninterest income. |
| (5) | Represents dividends declared per share divided by net income per share. |
| (6) | Capital ratios are for Community Bank only. |
| (7) | Loans acquired in connection with the merger with FedFirst were recorded at their estimated fair value at the acquisition date and did not include a carryover of the pre-merger allowance for loan losses. |
| ITEM 7. | Management’s Discussion and Analysis of Financial Condition and Results of Operations |
This discussion and analysis reflects our consolidated financial statements and other relevant statistical data, and is intended to enhance your understanding of our financial condition and results of operations. The information in this section has been derived from the audited consolidated financial statements, which appear beginning on page 66 of this Annual Report on Form 10-K. You should read the information in this section in conjunction with the business and financial information the Company provided in this Annual Report on Form 10-K.
Overview
Community Bank is a Pennsylvania-chartered commercial bank headquartered in Carmichaels, Pennsylvania. Community Bank operates from 16 offices in Greene, Allegheny, Washington, Fayette and Westmoreland Counties in southwestern Pennsylvania. Community Bank is a community-oriented institution offering residential and commercial real estate loans, commercial and industrial loans, and consumer loans as well as a variety of deposit products for individuals and businesses in its market area. Property and casualty, commercial liability, surety and other insurance products are offered through Exchange Underwriters, Inc., the Bank’s wholly-owned subsidiary that is a full-service, independent insurance agency.
Community Bank invests primarily in United States Government agency securities, bank-qualified, general obligation and special revenue municipal issues, and mortgage-backed securities issued or guaranteed by the United States Government or agencies thereof.
Our principal sources of funds are customer deposits, proceeds from the sale of loans, funds received from the repayment and prepayment of loans and mortgage-backed securities, and the sale, call, or maturity of investment securities. Principal sources of income are interest income on loans and investments, sales of loans and securities, service charges, commissions, loan servicing fees and other fees. Our principal expenses are interest paid on deposits, employee compensation and benefits, occupancy and equipment expense, and FDIC insurance premiums.
Our results of operations depend primarily on our net interest income. Net interest income is the difference between the interest income we earn on our interest-earning assets and the interest we pay on our interest-bearing liabilities. Our results of operations also are affected by our provisions for loan losses, noninterest income and noninterest expense. Noninterest income currently consists primarily of fees and service charges on deposit accounts, fees and charges on loans, gain on sales of other real estate owned, income from bank-owned life insurance and other income. We continue to expect our noninterest income to increase in future periods as a result of the insurance commissions generated from the Bank’s subsidiary, Exchange Underwriters. Noninterest expense currently consists primarily of expenses related to salaries and employee benefits, occupancy and equipment, contracted services, legal fees, other real estate owned, advertising and promotion, stationery and supplies, deposit and general insurance and other expenses.
Our results of operations also may be affected significantly by general and local economic and competitive conditions, changes in market interest rates, governmental policies and actions of regulatory authorities. We expect our return on equity to remain relatively low until we are able to leverage the additional capital we received from the stock offering associated with the merger.
Business Strategy
We intend to operate as a well-capitalized and profitable community bank dedicated to providing exceptional personal service to our individual and business customers. We believe that we have a competitive advantage in the markets we serve because of our knowledge of the local marketplace and our long-standing history of providing superior, relationship-based customer service. Our core business strategies are discussed below.
| 39 |
| · | Improve earnings through asset diversification. Historically, we have emphasized the origination of residential mortgage loans secured by homes in our market area. However, loan diversification improves our earnings because commercial real estate and commercial and industrial loans generally have higher interest rates than residential mortgage loans. Another benefit of commercial lending is that it improves the sensitivity of our interest-earning assets because commercial loans typically have shorter terms than residential mortgage loans and frequently have variable interest rates. |
| · | Use sound underwriting practices to maintain asset quality. We have sought to maintain a high level of asset quality and moderate credit risk by using underwriting standards that we believe are conservative. Although we intend to continue our efforts to originate commercial real estate and commercial and industrial loans, we intend to continue our philosophy of managing loan exposures through our conservative approach to lending. |
| · | Improve our funding mix by marketing core deposits. Core deposits (demand deposits, NOW accounts, money market accounts and savings accounts) comprised 78.0% of our total deposits at December 31, 2017. We value core deposits because they represent longer-term customer relationships and a lower cost of funding compared to certificates of deposit. We have succeeded in growing core deposits by promoting a sales culture in our branch offices that is supported by the use of technology and by offering a variety of products for our business customers, such as sweep and insured money sweep services, remote electronic deposit, online banking with bill pay, mobile banking, and automated clearinghouse. |
| · | Supplement fee income through our insurance operations. Fee income earned through our insurance agency, Exchange Underwriters, supplements our income from banking operations. We intend to pursue opportunities to grow this line of business, including hiring insurance producers with established books of business and through acquisitions. |
Critical Accounting Policies
Critical accounting policies are those that involve significant judgments and assumptions by management and that have, or could have, a material impact on the Company’s income or the carrying value of its assets. The Company’s critical accounting policies are those related to its allowance for loan losses, the evaluation of other-than-temporary impairment of investment securities, the valuation of and its ability to realize deferred tax assets, and the measurement of fair values of financial instruments.
Allowance for Loan Losses. The allowance for loan losses is calculated with the objective of maintaining an allowance necessary to absorb credit losses inherent in the loan portfolio. Management’s determination of the adequacy of the allowance is based on periodic evaluations of the loan portfolio and other relevant factors. However, this evaluation is inherently subjective, as it requires an estimate of the loss content for each risk rating and for each impaired loan, an estimate of the amounts and timing of expected future cash flows, and an estimate of the value of collateral.
The Company has established a systematic method of periodically reviewing the credit quality of the loan portfolio in order to establish an allowance for loan losses. The allowance for loan losses is based on current judgments about the credit quality of individual loans and segments of the loan portfolio. The allowance for loan losses is established through a provision for loan losses based on the Company’s evaluation of the probable losses inherent in the loan portfolio, and considers all known internal and external factors that affect loan collectability as of the reporting date. The evaluation, which includes a review of loans on which full collectability may not be reasonably assured, considers, among other matters, the estimated net realizable value or the fair value of the underlying collateral, economic conditions, historical loan loss experience, knowledge of inherent losses in the portfolio that are probable and reasonably estimable and other factors that warrant recognition in providing an appropriate loan loss allowance. Management believes this is a critical accounting policy because this evaluation involves a high degree of complexity and requires it to make subjective judgments that often require assumptions or estimates about various matters.
The allowance for loan losses consists primarily of specific allocations and general allocations. Specific allocations are made for loans that are determined to be impaired. Impairment is measured by determining the present value of expected future cash flows or, for collateral-dependent loans, the fair value of the collateral, including adjustments for market conditions and selling expenses. The general allocation is determined by segregating the remaining loans by type of loan, risk weighting and payment history. The Company also analyzes delinquency trends, general economic conditions, and geographic and industry concentrations. This analysis establishes factors that are applied to the loan groups to determine the amount of the general allowance. The principal assumption used in calculating the allowance for loan losses is the estimate of loss for each risk rating. Actual loan losses may be significantly more than the allowance the Company has established, which could have a material negative effect on its financial results.
| 40 |
Goodwill. We recorded goodwill in connection with our merger with FedFirst. Goodwill represents the excess of the cost of an acquisition over the fair value of the net assets acquired. Goodwill is not amortized but is tested for impairment annually or more frequently if impairment indicators arise. Goodwill and other intangibles are subject to impairment testing at the reporting unit level, which must be conducted at least annually. We perform impairment testing during the fourth quarter of each year, or more frequently if impairment indicators exist. Determining the fair value of a reporting unit under the goodwill impairment test is judgmental and often involves the use of significant estimates and assumptions. Estimates of fair value are primarily determined using discounted cash flows, market comparisons and recent transactions. These approaches use significant estimates and assumptions including projected future cash flows, discount rates reflecting the market rate of return, projected growth rates and determination and evaluation of appropriate market comparables. However, future events could cause us to conclude that goodwill has become impaired, which would result in recording an impairment loss. Any resulting impairment loss could have a material adverse impact on our financial condition and results of operations. Our annual assessment of potential goodwill impairment was completed in the fourth quarter of 2017. Based on the fair value of the reporting unit that has goodwill, no impairment of goodwill was recognized in 2017, 2016 and 2015.
Other-Than-Temporary Impairment. In estimating other-than-temporary impairment of investment securities, securities are evaluated on at least a quarterly basis to determine whether a decline in their value is other-than-temporary. In estimating other-than temporary impairment losses, management considers (1) the length of time and the extent to which the fair value has been less than cost, (2) the financial condition and near-term prospects of the issuer, and (3) whether or not the Company intends to sell or expect that it is more likely than not that it will be required to sell the investment security before an anticipated recovery in fair value. Once a decline in value for a debt security is determined to be other than temporary, the other-than-temporary impairment is separated in (a) the amount of total other-than-temporary impairment related to a decrease in cash flows expected to be collected from the debt security (the credit loss) and (b) the amount of other-than-temporary impairment related to all other factors. The amount of the total other-than-temporary impairment related to credit loss is recognized in earnings. The amount of other-than-temporary impairment related to other factors is recognized in other comprehensive income (loss).
Valuation of Deferred Tax Assets. In evaluating the ability to realize deferred tax assets, management considers all positive and negative information, including the Company’s past operating results and its forecast of future taxable income. In determining future taxable income, management utilizes a budget process that makes business assumptions, and the implementation of feasible and prudent tax planning strategies. The Company also utilizes a monthly forecasting tool to incorporate activity throughout the calendar year. These assumptions require it to make judgments about its future taxable income that are consistent with the plans and estimates it uses to manage its business. The net deferred tax asset is offset by an equal valuation allowance. Any change in estimated future taxable income may result in a reduction of the valuation allowance against the deferred tax asset, which would result in income tax benefit in the period.
Fair Value Measurements. Fair value is defined as the exchange price that would be received for an asset or paid to transfer a liability (an exit price) in the principal or most advantageous market for the asset or liability in an orderly transaction between market participants on the measurement date. Valuation techniques used to measure fair value must maximize the use of observable inputs and minimize the use of unobservable inputs. A three-level of fair value hierarchy prioritizes the inputs used to measure fair value:
| · | Level 1—Quoted prices in active markets for identical assets or liabilities; includes certain U.S. Treasury and other U.S. Government agency debt that is highly liquid and actively traded in over-the-counter markets. |
| · | Level 2—Inputs other than Level 1 that are observable, either directly or indirectly, such as quoted prices for similar assets or liabilities, quoted prices in markets that are not active or other inputs that are observable or can be corroborated by observable market data for substantially the full term of the assets or liabilities. |
| · | Level 3—Unobservable inputs that are supported by little or no market activity and that are significant to the fair value of the assets or liabilities. Level 3 assets and liabilities include financial instruments whose value is determined using pricing models, discounted cash flow methodologies or similar techniques, as well as instruments for which the determination of fair value requires significant management judgment or estimation. |
The asset or liability’s fair value measurement level within the fair value hierarchy is based on the lowest level of any input that is significant to the fair value measurement.
Comparison of Financial Condition at December 31, 2017, and December 31, 2016
Assets. Total assets increased $88.4 million, or 10.4%, to $934.5 million at December 31, 2017 compared to $846.1 million at December 31, 2016.
Cash and due from banks increased $6.3 million, or 44.4%, to $20.6 million at December 31, 2017 compared to $14.3 million at December 31, 2016. This is primarily the result of deposit growth in excess of loan demand.
Investment securities classified as available-for-sale increased $17.4 million, or 16.4%, to $123.6 million at December 31, 2017 compared to $106.2 million at December 31, 2016. This increase was primarily the result of new security purchases funded by deposit growth.
| 41 |
Loans, net, increased $61.5 million, or 9.1%, to $735.6 million at December 31, 2017 compared to $674.1 million at December 31, 2016. This was primarily due to net loan originations of $27.0 million on commercial and industrial loans, $25.5 million on construction loans, $8.0 million on commercial real estate loans and $1.9 million on residential mortgage loans.
Premises and equipment, net, increased $2.6 million, or 18.3%, to $16.7 million at December 31, 2017 compared to $14.1 million at December 31, 2016. This is due to the additions related to the new Operations Center that was placed into service in the second quarter. Total premises and equipment capitalized for the new Operations Center totaled $5.3 million. In addition, there was $250,000 in additions for fixed assets in process related to the construction of the Corporate Center in the current period. The Corporate Center building was previously taken into premise and equipment from a previously defaulted loan relationship in the first quarter of 2016.
Liabilities. Total liabilities increased $84.6 million, or 11.2%, to $841.2 million at December 31, 2017 compared to $756.6 million at December 31, 2016.
Total deposits increased $75.1 million, or 10.8%, to $773.3 million at December 31, 2017 compared to $698.2 million at December 31, 2016. There were increases of $39.2 million in NOW accounts, $23.1 million in demand deposits, $10.8 million in savings accounts and $9.3 million in time deposits, partially offset by decreases of $4.8 million in money market accounts and $2.5 million in brokered deposits. Due to the rising interest rate environment, the Bank has been selective on offering promotional interest rates and has concentrated its efforts on increasing noninterest-bearing accounts by building strong customer relationships. In addition, school district and municipal deposits increased $33.0 million due to building stronger customer relationships with these depositors and new accounts.
Short-term borrowings increased $12.6 million, or 46.5%, to $39.6 million at December 31, 2017 compared to $27.0 million at December 31, 2016. At December 31, 2017, short-term borrowings were comprised of $25.8 million of securities sold under agreements to repurchase and $13.8 million of FHLB overnight borrowings compared to $27.0 million of securities sold under agreement to repurchase at December 31, 2016. The increase is related to loan originations that exceeded available cash reserves near year-end, partially offset by a decrease in business deposit customers whose funds, above designated target balances, are transferred into an overnight interest-earning investment account by purchasing securities from the Bank’s investment portfolio under an agreement to repurchase. Other borrowed funds decreased by $3.5 million due to a maturing FHLB long-term borrowing that was retired in the current period. As a result of current period activity, the weighted average interest rate on long-term borrowings increased by 12 basis points to 1.92%.
Stockholders’ Equity. Stockholders’ equity increased $3.8 million, or 4.2%, to $93.3 million at December 31, 2017 compared to $89.5 million at December 31, 2016. During the period, net income was $6.9 million and the Company paid $3.6 million in dividends to stockholders.
Comparison of Operating Results for the Years Ended December 31, 2017, and December 31, 2016
Overview. Net income decreased $636,000, or 8.4%, to $6.9 million, for the year ended December 31, 2017, compared to $7.6 million for the year ended December 31, 2016.
Net Interest Income. Net interest income decreased $88,000 , or 0.3%, to remain constant at $29.1 million for the years ended December 31, 2017 and 2016.
Interest and dividend income increased $416,000, or 1.3%, to $32.4 million for the year ended December 31, 2017 compared to $32.0 million for the year ended December 31, 2016. Interest income on taxable securities increased $293,000 despite a decrease of 24 basis points in yield from new purchases with lower prevailing yields. The average balance for taxable securities increased $22.7 million for the year ended December 31, 2017. Interest income on Federal funds sold increased $175,000 for the year ended December 31, 2017. This is primarily the result of the end of the historically low interest rates in the last year and the increases in the average interest-earning balances of $17.7 million as a result of deposit growth for the year ended December 31, 2017. Other interest and dividend income increased $119,000 primarily due to increased interest earned with correspondent deposit banks and FHLB dividends in the current period. Interest income on securities exempt from federal tax decreased $122,000 due to deploying proceeds from security calls and maturities into purchasing taxable securities in the current year. There was a decrease of $1.6 million in the average balance on securities exempt from federal tax and a decrease of 33 basis points in yield as a result of security calls and maturities that had higher yields. Interest income on loans decreased $49,000 primarily due to accretion on the acquired loan portfolio credit mark for the year ended December 31, 2017 of $762,000, or 11 basis points compared to $1.4 million, or 21 basis points for the year ended December 31, 2016. There was an increase in average loans outstanding of $9.2 million for the year ended December 31, 2017. The increase in average loans was mainly due to commercial, indirect and line of credit loan originations in the later part of the current period.
| 42 |
Interest expense increased $504,000, or 17.6%, to $3.4 million for the year ended December 31, 2017 compared to $2.9 million for the year ended December 31, 2016. Interest expense on deposits increased $527,000 due to current year rate increases and an increase in average interest-bearing deposits of $40.4 million which we attribute primarily to time deposits, interest-bearing demand deposits and savings accounts. The average cost of interest-bearing deposits increased 6 basis points. In addition, short-term borrowings increased $9,000 in the current period due to increased interest rates on securities sold under agreements to repurchase. Interest expense on other borrowed funds decreased $30,000 due to a decrease in long-term borrowings as a result of a FHLB long-term borrowing for $3.5 million that matured in the current period.
Provision for Loan Losses. The provision for loan losses decreased $170,000, to $1.9 million, for the year ended December 31, 2017, of which $250,000 was attributed to the acquired loan portfolio, compared to $2.0 million of provision for loan losses for the year ended December 31, 2016, of which $714,000 was attributed to the acquired loan portfolio. Net charge-offs for the year ended December 31, 2017 were $877,000, which included $616,000 of net charge-offs on automobile loans, compared to net charge-offs of $727,000 for the year ended December 31, 2016, which included $578,000 of net charge-offs on automobile loans. Management analyzes the loan portfolio on a quarterly basis to determine the adequacy of the allowance for loan losses and the need for an increase or reduction in provision for loan losses for the year ended December 31, 2017. The decrease in provision is mainly attributed to loan payoffs, stable credit quality and reductions in qualitative factors, mainly offset by sizable loan growth of $60.4 million in commercial loans and increased impaired loans resulting in an average balance increase of approximately $1.3 million in impaired loans for the year ended December 31, 2017 as compared to the year ended December 31, 2016. As the acquired loan portfolio has loan payoffs, paydowns and accretion of the credit mark, the need for additional provision may be required based on our loan loss analysis.
Noninterest Income. Noninterest income increased $438,000, or 5.9%, to $7.8 million for the year ended December 31, 2017 compared to $7.4 million at December 31, 2016. There was a $486,000 increase in insurance commissions from Exchange Underwriters due to an increase in commercial commission and fee income and additional contingency fees received in the current period. Service fees on deposit accounts increased $68,000 primarily due to increased NSF fees due to customer overdrafts of deposit accounts and check card fees. Net gains on purchased tax credits increased $57,000 due to purchased Pennsylvania shares tax credits being recognized in the current period. Net gains on the sales of investments increased $31,000 due to the sale of equity securities. These sales were transacted to recognize capital gains that were offset by a capital loss carry forward deferred tax asset that was acquired in the merger. The capital loss carry forward deferred tax asset has been fully recognized in the current period. There was a decrease in the net gains on sales of residential mortgage loans of $201,000. The decrease in gains was primarily due to a decrease in the number of loans originated and subsequently sold to the FHLB as part of the Mortgage Partnership Finance® (“MPF®”) program. The MPF® program enables member financial institutions to offer competitive interest rates for fixed-rate mortgage loans without assuming any of the interest rate risk associated with a long-term asset. Income from bank-owned life insurance decreased $14,000 due to lower crediting rates in the current period. Other miscellaneous income increased $7,000 due to the servicing income received from mortgage loans sold to the FHLB as part of the MPF® program.
Noninterest Expense. Noninterest expense increased $1.4 million, or 5.9%, to $25.2 million for the year ended December 31, 2017 compared to $23.8 million for the year ended December 31, 2016. Salaries and employee benefits increased $813,000, primarily due to additional employees, normal salary increases, incentive compensation, retirement benefits and employee stock options. This was partially offset by decreases in employee group health insurance and restricted stock awards expense. Merger-related expenses increased $356,000 due to the pending FWVB merger. Equipment and occupancy increased $180,000 and $160,000, respectively, primarily due to equipment purchases and new maintenance contracts for the Operations Center. Occupancy expenses were due to depreciation taken on the new Operations Center during the current period. In addition, other increases for occupancy were property and building contracted services related to moving expenses, real estate taxes, property insurance and utilities. Bankcard processing expense increased $43,000 due to the increased number of automatic teller transactions (“ATM”) in the current period. Pennsylvania shares tax, which is calculated based on the Bank’s stockholders’ equity, increased $29,000 due to the increase in equity that was calculated on the current year shares tax return. Contracted services decreased $82,000 due to compensation consulting, Pennsylvania state sales tax refund as a result of a Bank initiated reverse audit and reclassification of core processing expense to data processing. Legal and professional fees decreased $69,000 due to the previously mentioned mortgage insurance proceeds, in which part of the insurance proceeds were utilized to offset legal fees attributed to the problem loan relationship. Other real estate owned expense was $349,000 of income in the current period compared to $393,000 of income in the prior period resulting in an increase of $44,000 in expense. This change is primarily due to the $566,000 pre-tax gain recognized due to the foreclosure procedures on two commercial real estate loans that moved into other real estate owned properties in the first quarter of 2016. In addition, there were losses incurred on the sales of other real estate owned properties in the prior period. This was partially offset due to the final resolutions of loan collection efforts through the sale of a mineral rights interest for $186,000, bankruptcy court settlement for $86,000 and mortgage insurance proceeds for $85,000 in the current period. These items are considered non-recurring. Other noninterest expense decreased $40,000 primarily due to a decrease in various miscellaneous expenses, such as other insurance, other losses and non-employee restricted stock awards. Advertising decreased $25,000 related to decreases in print/media advertising and promotional items as a cost savings initiative.
| 43 |
Income Tax Expense. Income taxes decreased $238,000 to $2.9 million for the year ended December 31, 2017 compared to $3.1 million for the year ended December 31, 2016. The effective tax rate for the year ended December 31, 2017 was 29.3% compared to 29.1% for the year ended December 31, 2016. The decrease in income taxes was primarily due to a decrease of $874,000 in pre-tax income and the $89,000 revaluation adjustment of net deferred tax liabilities due to the enactment of the new tax law during the fourth quarter, partially offset by the expiration of the low income housing tax credit program. The increase in the effective tax rate was related to the decrease in tax exempt income, the expiration of the low income housing tax credit program and the capital loss carry forward deferred tax asset that has been fully recognized, partially offset by the favorable tax preference charitable donation of a former First Federal Savings Bank building to the City of Monessen, Pennsylvania and the revaluation adjustment of net deferred tax liabilities in the current period.
The Tax Cuts and Jobs Act (the “Tax Act”) was enacted on December 22, 2017. The Tax Act reduces the US federal corporate tax rate from 35% to 21%. At December 31, 2017, we have completed our accounting for the tax effects of enactment of the Act.
As described below, we have made a reasonable estimate of the effects on our existing deferred tax balances as of December 31, 2017. We re-measured all of our deferred tax assets (“DTA”) and liabilities (“DTL”) based on the rates at which they are expected to reverse in the future. We recognized an income tax benefit of $89,000 for the year ended December 31, 2017 related to adjusting our net deferred tax liability balance to reflect the new corporate tax rate.
In addition, DTAs/DTLs related to available for sale (“AFS”) securities unrealized losses that were revalued as of December 31, 2017 noted above created a “stranded tax effects” in Accumulated Other Comprehensive Income (“AOCI”) due enactment of the Tax Act. The issue arose due to the nature of GAAP recognition of tax rate change effects on the AFS DTA/DTL revaluation as an adjustment to income tax provision.
In February 2018, FASB issued ASU 2018-02 - Income Statement - Reporting Comprehensive Income (Topic 220). As disclosed in Note 1 of the Annual Report, the Company early adopted the provisions of the ASU 2018-02 and recorded a reclassification adjustment of $220,000 from AOCI to retained earnings for stranded tax effects related to AFS securities resulting from the newly enacted corporate tax rate. The amount of the reclassification was the difference between the 35 percent historical corporate tax rate and the newly enacted 21 percent corporate tax rate. See Statement of Changes in Stockholders Equity for additional details and reclassification impact due to impact of the ASU 2018-02.
The accounting for the effects of the tax rate change on deferred tax balances is complete and no provisional amounts were recorded for this item.
Reconciliation of income tax provision for the years ended December 31, 2017 and 2016:
| (Dollars in thousands) | ||||||||
| 2017 | 2016 | |||||||
| Current Payable | $ | 3,137 | $ | 3,179 | ||||
| Tax Act impact of the stranded tax effect related to deferred taxes for AFS securities | 220 | - | ||||||
| Tax Act impact on remaining deferred tax assets and liabilities | (309 | ) | - | |||||
| Deferred Benefit | (174 | ) | (67 | ) | ||||
| Total Provision | $ | 2,874 | $ | 3,112 | ||||
As a result of the above mentioned revaluation of DTAs/DTLs and the reduction in the overall corporate tax rate to 21%, the Company believes the new tax law will have an overall benefit on future earnings. The 2017 tax provision, if applying the reduced corporate tax rate of 21% to net income before income taxes would have had a reduction in federal income tax of approximately $1.1 million for the 2017 tax year.
Comparison of Operating Results for the Years Ended December 31, 2016, and December 31, 2015
Overview. Net income decreased $840,000, or 10.0%, to $7.6 million, for the year ended December 31, 2016, compared to $8.4 million for the year ended December 31, 2015.
Net Interest Income. Net interest income decreased $54,000, or 0.2%, to $29.1 million for the year ended December 31, 2016 compared to $29.2 million for the year ended December 31, 2015.
| 44 |
Interest and dividend income increased $101,000, or 0.3%, to $32.0 million for the year ended December 31, 2016 compared to $31.9 million for the year ended December 31, 2015. Interest income on taxable securities increased $279,000 due to an increase of 48 basis points in yield from new purchases or from higher yields on the existing securities in the portfolio. In addition, calls on discounted agency securities resulted in accelerated discount accretion recognition into income in the current period. Interest income on loans increased $14,000 and had an increase in average loans outstanding of $545,000. The slight increase in average loans was due to loan originations within the indirect auto, commercial, lines of credit and student loan portfolios, partially offset by decreases in mortgage and installment loans mainly due to loan payoffs. The accretion on the acquired loan portfolio credit mark as of the year ended December 31, 2016, was 21 basis points compared to 16 basis points for the year ended December 31, 2015. Other interest and dividend income decreased $103,000 primarily due to a decrease in FHLB stock dividends, which included the payment of a special dividend in the first quarter of 2015 of $56,000. As a result of receiving no special dividend in the current year and a decrease in short-term borrowings compared to the prior year, the Bank was required to hold less FHLB stock. Interest income on securities exempt from federal tax decreased $101,000 due to deploying proceeds from security calls and maturities into loan funding, purchasing taxable securities and satisfying liquidity needs in the current year. There was a decrease of $3.6 million in the average balance on securities exempt from federal tax and a decrease of 2 basis points in yield as a result of security calls and maturities that had higher yields.
Interest expense increased $155,000, or 5.7%, to $2.9 million for the year ended December 31, 2016 compared to $2.7 million for the year ended December 31, 2015. Interest expense on other borrowed funds increased $224,000 due to an increase in long-term borrowings. This was primarily due to the Bank laddering $15.0 million in short-term borrowings in the first quarter of 2015 and $13.0 million in short-term borrowings in late 2015 into a series of long-term FHLB borrowings to mitigate the Company’s interest rate risk in the event of rising interest rates. Interest expense on deposits decreased $59,000 due to a decrease in average interest-bearing deposits of $8.2 million, which we attribute primarily to time deposit accounts rate shopping in the current low interest rate market. The average cost of interest-bearing deposits remained constant year over year at 44 basis points. In addition, short-term borrowings decreased $10,000 in the current period due to the laddering of FHLB long-term borrowings.
Provision for Loan Losses. The provision for loan losses increased $35,000 and was $2.0 million for the year ended December 31, 2016, of which $714,000 was attributed to the acquired loan portfolio compared to $2.0 million provision for loan losses for the year ended December 31, 2015. Net charge-offs for the year ended December 31, 2016, were $727,000, which included $578,000 of net charge-offs on automobile loans, compared to net charge-offs of $710,000 for the year ended December 31, 2015. Management analyzes the loan portfolio on a quarterly basis to determine the adequacy of the allowance for loan losses, and the need for additional provisions for loan losses and determined the additional current provision was necessary for the year ended December 31, 2016 compared to the year ended December 31, 2015. There was loan growth of $9.4 million in indirect auto loans and approximately a $400,000 increase in auto loan net charge-offs as compared to the prior year. In addition, there was an increase of $1.9 million in criticized loans at year-end as compared to the prior year. As the acquired loan portfolio has loan payoffs, paydowns and accretion of the credit mark, the need for additional provision is required based on our loan loss analysis.
Noninterest Income. Noninterest income decreased $233,000, or 3.1%, to $7.4 million for the year ended December 31, 2016, compared to $7.6 million at December 31, 2015. There was a $439,000 decrease in insurance commissions from Exchange Underwriters due to reduced contingency fees and a decline in commercial commission and fee income received in the current year. Service fees on deposit accounts decreased $172,000 primarily due to a decrease in check card fees from deposit accounts acquired in the merger recognized in the prior period. Other commissions decreased $66,000 primarily due to the prior year recognition of a securities class action lawsuit settlement proceeds and a state mutual thrift tax refund, both from the merger. Other miscellaneous income decreased $29,000 primarily due to increases in amortization on mortgage servicing rights related to loans sold to the FHLB and third-party student loan servicing fees due to an increase in student loan originations in the current year. This was partially offset by an increase in the servicing income received from mortgage loans sold to the FHLB as part of the MPF® program. There was an increase in the net gains on sales of residential mortgage loans of $301,000. The increase in gains was primarily due to an increase in the number of loans originated and subsequently sold to the FHLB as part of the MPF® programs. In addition, net gains on the sales of investments increased $168,000 due to the sale of equity securities. These sales were transacted to recognize capital gains that will be offset by a capital loss carry forward deferred tax asset that was acquired in the merger.
Noninterest Expense. Noninterest expense increased $849,000, or 3.7%, to $23.8 million for the year ended December 31, 2016, compared to $22.9 million for the year ended December 31, 2015. Salaries and employee benefits increased $631,000, primarily due to additional employees, normal salary increases and employee stock options, and restricted stock awards expense. This was partially offset by decreases in incentive compensation and group health insurance expense. Other noninterest expense increased $239,000 primarily due to an increase in various miscellaneous expenses, such as non-employee stock options and restricted stock awards, telephone, supplies, other losses attributable to debit card fraud losses and Pennsylvania state bank assessment. This was partially offset by decreases in teller shortages, overdraft charge-offs and Pennsylvania state sales tax. Occupancy and equipment increased $217,000 and $94,000, respectively, primarily due to accelerated depreciation taken on leasehold improvements in the Bank’s current operation center that will not transfer over to the new Operations Center currently under construction for the Bank. Other increases for occupancy were related to real estate taxes, bank building rental and utilities, mainly from the other real estate owned property reclassified into fixed assets in process during the first quarter. This property will undergo an extensive renovation and will subsequently be placed into Bank operations within our southwestern Pennsylvania market. Equipment expense increases were mainly due to maintenance contracts from our core processing vendor and final copier/printer invoices from a discontinued contract. In addition, equipment depreciation increased due to fixed asset acquisitions placed into service, primarily for the Uniontown Business Center that was opened during the second quarter. PA shares tax, which is calculated based on the Bank’s stockholders’ equity, increased $41,000 due to the net income impact on stockholders’ equity. Other real estate owned income was $393,000 in the current period compared to $196,000 in the prior period resulting in a decrease of $197,000 in expense. This change is primarily due to the $566,000 pre-tax gain recognized due to the foreclosure procedures on two commercial real estate loans that moved into other real estate owned properties in the first quarter of 2016. Advertising decreased $111,000 related to the termination of a cooperative marketing agreement at Exchange Underwriters, partially offset by advertising initiatives to promote the Bank. The FDIC assessment decreased $75,000 due to a factor reduction by the FDIC in the computation of the insurance assessment.
Income Tax Expense. Income taxes decreased $331,000, to $3.1 million for the year ended December 31, 2016, compared to $3.4 million for the year ended December 31, 2015. The effective tax rate for the year ended December 31, 2016, was 29.1% compared to 29.0% for the year ended December 31, 2015. The decrease in income taxes was due to a decrease of $1.2 million in pre-tax income. The increase in the effective tax rate was related to the decrease in tax-exempt income in the current period.
| 45 |
Average Balances and Yields. The following table sets forth average balance sheets, average yields and costs, and certain other information for the years indicated. Tax-equivalent yield adjustments have been made for tax exempt loan and securities income utilizing a marginal federal tax rate of 34%. All average balances are daily average balances. Non-accrual loans are included in the computation of average balances only. The yields set forth below include the effect of deferred fees, discounts, and premiums that are amortized or accreted to interest income or interest expense.
| AVERAGE BALANCE SHEET | ||||||||||||||||||||||||||||||||||||
| (Dollars in thousands) | ||||||||||||||||||||||||||||||||||||
| Years Ended December 31, | ||||||||||||||||||||||||||||||||||||
| 2017 | 2016 | 2015 | ||||||||||||||||||||||||||||||||||
| Interest | Interest | Interest | ||||||||||||||||||||||||||||||||||
| Average | and | Yield/ | Average | and | Yield/ | Average | and | Yield/ | ||||||||||||||||||||||||||||
| Balance | Dividends | Cost | Balance | Dividends | Cost | Balance | Dividends | Cost | ||||||||||||||||||||||||||||
| Assets: | ||||||||||||||||||||||||||||||||||||
| Interest-Earning Assets: | ||||||||||||||||||||||||||||||||||||
| Loans, Net | $ | 681,539 | $ | 29,680 | 4.35 | % | $ | 672,321 | $ | 29,685 | 4.42 | % | $ | 671,776 | $ | 29,668 | 4.42 | % | ||||||||||||||||||
| Investment Securities | ||||||||||||||||||||||||||||||||||||
| Taxable | 79,878 | 1,531 | 1.92 | 57,224 | 1,238 | 2.16 | 57,082 | 959 | 1.68 | |||||||||||||||||||||||||||
| Tax Exempt | 36,681 | 1,324 | 3.61 | 38,259 | 1,509 | 3.94 | 41,892 | 1,661 | 3.96 | |||||||||||||||||||||||||||
| Other Interest-Earning Assets | 29,789 | 484 | 1.62 | 11,720 | 190 | 1.62 | 11,318 | 281 | 2.48 | |||||||||||||||||||||||||||
| Total Interest-Earning Assets | 827,887 | 33,019 | 3.99 | 779,524 | 32,622 | 4.18 | 782,068 | 32,569 | 4.16 | |||||||||||||||||||||||||||
| Noninterest-Earning Assets | 59,263 | 54,540 | 55,300 | |||||||||||||||||||||||||||||||||
| Total Assets | $ | 887,150 | $ | 834,064 | $ | 837,368 | ||||||||||||||||||||||||||||||
| Liabilities and | ||||||||||||||||||||||||||||||||||||
| Stockholders' equity: | ||||||||||||||||||||||||||||||||||||
| Interest-Bearing Liabilities: | ||||||||||||||||||||||||||||||||||||
| Interest-Bearing Demand Deposits | $ | 133,412 | 342 | 0.26 | % | $ | 114,301 | 204 | 0.18 | % | $ | 104,202 | 165 | 0.16 | % | |||||||||||||||||||||
| Savings | 129,301 | 238 | 0.18 | 122,710 | 225 | 0.18 | 122,652 | 222 | 0.18 | |||||||||||||||||||||||||||
| Money Market | 138,782 | 369 | 0.27 | 143,644 | 362 | 0.25 | 151,338 | 355 | 0.23 | |||||||||||||||||||||||||||
| Time Deposits | 160,634 | 1,862 | 1.16 | 141,040 | 1,493 | 1.06 | 151,730 | 1,601 | 1.06 | |||||||||||||||||||||||||||
| Total Interest-Bearing Deposits | 562,129 | 2,811 | 0.44 | 521,695 | 2,284 | 0.44 | 529,922 | 2,343 | 0.44 | |||||||||||||||||||||||||||
| Borrowings | 51,658 | 563 | 1.09 | 55,214 | 586 | 1.06 | 52,588 | 372 | 0.71 | |||||||||||||||||||||||||||
| Total Interest-Bearing Liabilities | 613,787 | 3,374 | 0.55 | 576,909 | 2,870 | 0.50 | 582,510 | 2,715 | 0.47 | |||||||||||||||||||||||||||
| Noninterest-Bearing Liabilities | 181,100 | 167,804 | 169,696 | |||||||||||||||||||||||||||||||||
| Total Liabilities | 794,887 | 744,713 | 752,206 | |||||||||||||||||||||||||||||||||
| Stockholders' Equity | 92,263 | 89,351 | 85,162 | |||||||||||||||||||||||||||||||||
| Total Liabilities and | ||||||||||||||||||||||||||||||||||||
| Stockholders' Equity | $ | 887,150 | $ | 834,064 | $ | 837,368 | ||||||||||||||||||||||||||||||
| Net Interest Income | $ | 29,645 | $ | 29,752 | $ | 29,854 | ||||||||||||||||||||||||||||||
| Net Interest Rate Spread (1) | 3.44 | % | 3.68 | % | 3.69 | % | ||||||||||||||||||||||||||||||
| Net Interest-Earning Assets (2) | $ | 214,100 | $ | 202,615 | $ | 199,558 | ||||||||||||||||||||||||||||||
| Net Interest Margin (3) | 3.58 | 3.82 | 3.82 | |||||||||||||||||||||||||||||||||
| Average Interest-Earning Assets to | ||||||||||||||||||||||||||||||||||||
| Average Interest-Bearing Liabilities | 134.88 | 135.12 | 134.26 | |||||||||||||||||||||||||||||||||
_________
| (1) | Net interest rate spread represents the difference between the weighted average yield on interest-earning assets and the weighted average cost of interest-bearing liabilities. |
| (2) | Net interest-earning assets represent total interest-earning assets less total interest-bearing liabilities. |
| (3) | Net interest margin represents net interest income divided by average total interest-earning assets. Interest income and yields are on a fully tax equivalent basis utilizing a marginal tax rate of 34%. |
| 46 |
Rate/Volume Analysis
The following table presents the effects of changing rates and volumes on our net interest income for the years indicated. The rate column shows the effects attributable to changes in rate (changes in rate multiplied by prior volume). The volume column shows the effects attributable to changes in volume (changes in volume multiplied by prior rate). The total column represents the sum of the prior columns. For purposes of this table, changes attributable to both rate and volume, which cannot be segregated, have been allocated proportionately based on the changes due to rate and the changes due to volume.
| (Dollars in thousands) | ||||||||||||||||||||||||
| Year Ended December 31, 2017 | Year Ended December 31, 2016 | |||||||||||||||||||||||
| Compared To | Compared To | |||||||||||||||||||||||
| Year Ended December 31, 2016 | Year Ended December 31, 2015 | |||||||||||||||||||||||
| Increase (Decrease) Due to | Increase (Decrease) Due to | |||||||||||||||||||||||
| Volume | Rate | Total | Volume | Rate | Total | |||||||||||||||||||
| Interest and Dividend Income: | ||||||||||||||||||||||||
| Loans, net | $ | 469 | $ | (474 | ) | $ | (5 | ) | $ | 17 | $ | - | $ | 17 | ||||||||||
| Investment Securities: | ||||||||||||||||||||||||
| Taxable | 442 | (149 | ) | 293 | 4 | 275 | 279 | |||||||||||||||||
| Tax-Exempt | (62 | ) | (123 | ) | (185 | ) | (144 | ) | (8 | ) | (152 | ) | ||||||||||||
| Other Interest-Earning Assets | 294 | - | 294 | 9 | (100 | ) | (91 | ) | ||||||||||||||||
| Total Interest-Earning Assets | 1,143 | (746 | ) | 397 | (114 | ) | 167 | 53 | ||||||||||||||||
| Interest Expense: | ||||||||||||||||||||||||
| Deposits | 199 | 328 | 527 | (59 | ) | - | (59 | ) | ||||||||||||||||
| Borrowings | (40 | ) | 17 | (23 | ) | 22 | 192 | 214 | ||||||||||||||||
| Total Interest-Bearing Liablities | 159 | 345 | 504 | (37 | ) | 192 | 155 | |||||||||||||||||
| Change in Net Interest Income | $ | 984 | $ | (1,091 | ) | $ | (107 | ) | $ | (77 | ) | $ | (25 | ) | $ | (102 | ) | |||||||
Liquidity and Capital Resources
Liquidity is the ability to meet current and future financial obligations of a short-term nature. The Company’s primary sources of funds consist of deposit inflows, loan repayments, and maturities and sales of securities. While maturities and scheduled amortization of loans and securities are predictable sources of funds, deposit flows and mortgage prepayments are greatly influenced by general interest rates, economic conditions and competition.
The Company regularly adjusts its investments in liquid assets based upon its assessment of expected loan demand, expected deposit flows, yields available on interest-earning deposits and securities, and the objectives of its asset/liability management program. Excess liquid assets are invested generally in interest-earning deposits with other banks and short- and intermediate-term securities. The Company believes that it had sufficient liquidity at December 31, 2017, to satisfy its short- and long-term liquidity needs at that date.
The Company’s most liquid assets are cash and due, from banks, which totaled $20.6 million at December 31, 2017. Unpledged securities, which provide an additional source of liquidity, totaled $32.3 million. In addition, at December 31, 2017, the Company had the ability to borrow up to $298.4 million from the FHLB of Pittsburgh, of which $38.3 million was outstanding and $56.3 million was utilized toward standby letters of credit. The Company also has the ability to borrow up to $89.1 million from the Federal Reserve Bank through its Borrower-In-Custody line of credit agreement and $40.0 million from multiple line of credit arrangements with various banks, none of which were outstanding.
At December 31, 2017, the Company had funding commitments totaling $180.8 million, consisting primarily of commitments to originate loans, unused lines of credit and letters of credit.
At December 31, 2017, certificates of deposit due within one year of that date totaled $62.2 million, or 37.8% of total certificates of deposit. If these certificates of deposit do not remain with the Company, the Company will be required to seek other sources of funds. Depending on market conditions, the Company may be required to pay higher rates on such deposits or other borrowings than it currently pays on these certificates of deposit. The Company believes, however, based on past experience, that a significant portion of its certificates of deposit will remain with it, either as certificates of deposit or as other deposit products. The Company has the ability to attract and retain deposits by adjusting the interest rates offered.
| 47 |
The Company’s primary investing activities are the origination of loans and the purchase of securities. For the year ended December 31, 2017, the Company originated $252.5 million in loans compared to $197.8 million for the year ended December 31, 2016.
The Company is a separate legal entity from Community Bank and must provide for its own liquidity to pay dividends to shareholders and for other corporate purposes. At December 31, 2017, the Company (on an unconsolidated basis) had liquid assets of $1.9 million.
We are committed to maintaining a strong liquidity position. We monitor our liquidity position on a daily basis. We anticipate that we will have sufficient funds to meet our current funding commitments. Based on our deposit retention experience and current pricing strategy, we anticipate that a significant portion of maturing time deposits will be retained.
At December 31, 2017, we exceeded all of our regulatory capital requirements. Accordingly, Community Bank was categorized as well-capitalized at December 31, 2017, and December 31, 2016. Management is not aware of any conditions or events since the most recent notification that would change our category. The Bank’s actual capital ratios are presented in the following table. The Company’s capital ratios are comparable to those shown for the Bank.
| (Dollars in thousands) | ||||||||||||||||
| December 31, 2017 | December 31, 2016 | |||||||||||||||
| Amount | Ratio | Amount | Ratio | |||||||||||||
| Common Equity Tier 1 Capital (to Risk-Weighted Assets) | ||||||||||||||||
| Actual | $ | 84,599 | 12.22 | % | $ | 81,845 | 13.38 | % | ||||||||
| For Capital Adequacy Purposes | 31,159 | 4.50 | 27,533 | 4.50 | ||||||||||||
| To Be Well Capitalized | 45,008 | 6.50 | 39,770 | 6.50 | ||||||||||||
| Tier I Capital (to Risk-Weighted Assets) | ||||||||||||||||
| Actual | 84,599 | 12.22 | 81,845 | 13.38 | ||||||||||||
| For Capital Adequacy Purposes | 41,546 | 6.00 | 36,711 | 6.00 | ||||||||||||
| To Be Well Capitalized | 55,395 | 8.00 | 48,947 | 8.00 | ||||||||||||
| Total Capital (to Risk-Weighted Assets) | ||||||||||||||||
| Actual | 93,257 | 13.47 | 89,497 | 14.63 | ||||||||||||
| For Capital Adequacy Purposes | 55,395 | 8.00 | 48,947 | 8.00 | ||||||||||||
| To Be Well Capitalized | 69,243 | 10.00 | 61,184 | 10.00 | ||||||||||||
| Tier I Leverage Capital (to Adjusted Total Assets) | ||||||||||||||||
| Actual | 84,599 | 9.27 | 81,845 | 9.80 | ||||||||||||
| For Capital Adequacy Purposes | 36,492 | 4.00 | 33,390 | 4.00 | ||||||||||||
| To Be Well Capitalized | 45,616 | 5.00 | 41,738 | 5.00 | ||||||||||||
Off-Balance Sheet Arrangements and Contractual Obligations
Commitments. As a financial services provider, the Company routinely is a party to various financial instruments with off-balance-sheet risks, such as commitments to extend credit, commitments under unused lines of credit, and commitments under letters of credit. While these contractual obligations represent potential future cash requirements, a significant portion of commitments to extend credit may expire without being drawn upon. Such commitments are subject to the same credit policies and approval process accorded to loans the Company makes. In addition, the Company enters into commitments to sell mortgage loans.
Contractual Obligations. In the ordinary course of its operations, the Company enters into certain contractual obligations. Such obligations include operating leases for premises and equipment, agreements with respect to borrowed funds and deposit liabilities and agreements with respect to investments. The following tables present certain of our contractual obligations at December 31, 2017.
| 48 |
| (Dollars in thousands) | ||||||||||||||||||||
| Payment Due by Period | ||||||||||||||||||||
| Less Than | More Than | More Than | ||||||||||||||||||
| Or Equal to | One to | Three to | More Than | |||||||||||||||||
| Total | One Year | Three Years | Five Years | Five Years | ||||||||||||||||
| Certificates of deposit | $ | 164,301 | $ | 62,153 | $ | 74,641 | $ | 19,657 | $ | 7,850 | ||||||||||
| Borrowings | 64,105 | 44,105 | 12,000 | 8,000 | - | |||||||||||||||
| Operating lease obligations | 1,521 | 399 | 426 | 197 | 499 | |||||||||||||||
| Total | $ | 229,927 | $ | 106,657 | $ | 87,067 | $ | 27,854 | $ | 8,349 | ||||||||||
Impact of Inflation and Changing Price
The consolidated financial statements and related notes of the Company have been prepared in accordance with GAAP. GAAP generally requires the measurement of financial position and operating results in terms of historical dollars without consideration of changes in the relative purchasing power of money over time due to inflation. The impact of inflation is reflected in the increased cost of the Company’s operations. Unlike industrial companies, the Company’s assets and liabilities are primarily monetary in nature. As a result, changes in market interest rates have a greater impact on performance than the effects of inflation.
| ITEM 7A. | Quantitative and Qualitative Disclosures about Market Risk |
General. The majority of the Company’s assets and liabilities are monetary in nature. Consequently, the Company’s most significant form of market risk is interest rate risk. The Company’s assets, consisting primarily of mortgage loans, have longer maturities than its liabilities; consisting primarily of deposits. As a result, a principal part of its business strategy is to manage interest rate risk and reduce the exposure of net interest income to changes in market interest rates. Accordingly, the Company’s board of directors has established an Asset/Liability Management Committee, which is responsible for evaluating the interest rate risk inherent in the Company’s assets and liabilities, for determining the level of risk that is appropriate given the Company’s business strategy, operating environment, capital, liquidity and performance objectives; and for managing this risk consistent with the guidelines approved by the board of directors. Senior management monitors the level of interest rate risk on a monthly basis and the Asset/Liability Management Committee meets on a monthly basis to review its asset/liability policies and position and interest rate risk position, and to discuss and implement interest rate risk strategies.
Economic Value of Equity. The Company monitors interest rate risk through the use of a simulation model that estimates the amounts by which the fair value of its assets and liabilities (its economic value of equity, or “EVE”) would change in the event of a range of assumed changes in market interest rates. The quarterly reports developed in the simulation model assist the Company in identifying, measuring, monitoring and controlling interest rate risk to ensure compliance within the Company’s policy guidelines.
The table below sets forth, as of December 31, 2017, the estimated changes in EVE that would result from the designated instantaneous changes in market interest rates. Computations of prospective effects of hypothetical interest rate changes are based on numerous assumptions, including relative levels of market interest rates, loan prepayments and deposit decay, and should not be relied upon as indicative of actual results.
| (Dollars in thousands) | ||||||||||||||||||||||||||||
| EVE as a Percent of | ||||||||||||||||||||||||||||
| Economic Value of Equity | Portfolio Value of Assets | Earnings at Risk | ||||||||||||||||||||||||||
| Change in Interest Rates | Dollar | Dollar | Percent | Dollar | Percent | |||||||||||||||||||||||
| in Basis Points ("bp") | Amount | Change | Change | NPV Ratio | Change | Change | Change | |||||||||||||||||||||
| +300 bp | $ | 93,507 | $ | (18,463 | ) | (16.5 | )% | 10.96 | % | (120 | )bp | $ | (148 | ) | (0.5 | )% | ||||||||||||
| +200 bp | 102,226 | (9,744 | ) | (8.7 | ) | 11.67 | (49 | ) | 1,000 | 3.1 | ||||||||||||||||||
| +100 bp | 108,448 | (3,522 | ) | (3.1 | ) | 12.06 | (10 | ) | 1,138 | 3.5 | ||||||||||||||||||
| Flat | 111,970 | - | - | 12.16 | - | - | - | |||||||||||||||||||||
| -100 bp | 114,084 | 2,114 | 1.9 | 12.11 | (5 | ) | (1,741 | ) | (5.4 | ) | ||||||||||||||||||
| 49 |
Certain shortcomings are inherent in the methodology used in the above interest rate risk measurement. Modeling changes in EVE require making certain assumptions that may or may not reflect the manner in which actual yields and costs respond to changes in market interest rates. In this regard, the EVE tables presented assume that the composition of the Company’s interest-sensitive assets and liabilities existing at the beginning of a period remains constant over the period being measured, and assumes that a particular change in interest rates is reflected uniformly across the yield curve regardless of the duration or repricing of specific assets and liabilities. Accordingly, although the EVE tables provide an indication of the Company’s interest rate risk exposure at a particular point in time, such measurements are not intended to and do not provide a precise forecast of the effect of changes in market interest rates on EVE and will differ from actual results. EVE calculations also may not reflect the fair values of financial instruments. For example, decreases in market interest rates can increase the fair values of the Company’s loans, deposits and borrowings.
| ITEM 8. | Financial Statements and Supplementary Data |
The Financial Statements are included in Part IV, Item 15 of this Form 10-K.
| ITEM 9. | Changes in and Disagreements with Accountants on Accounting and Financial Disclosure |
None.
| ITEM 9A. | Controls and Procedures |
| (a) | Disclosure Controls and Procedures |
The Company’s management, including the Company’s principal executive officer and principal financial officer, have evaluated the effectiveness of the Company’s “disclosure controls and procedures,” as such term is defined in Rules 13a-15(e) and 15d-15(e) promulgated under the Securities Exchange Act of 1934, as amended, (the “Exchange Act”). Based upon their evaluation, the principal executive officer and principal financial officer concluded that, as of the end of the period covered by this report, the Company’s disclosure controls and procedures were effective for the purpose of ensuring that the information required to be disclosed in the reports that the Company files or submits under the Exchange Act with the Securities and Exchange Commission (the “SEC”) (1) is recorded, processed, summarized and reported within the time periods specified in the SEC’s rules and forms, and (2) is accumulated and communicated to the Company’s management, including its principal executive and principal financial officers, as appropriate to allow timely decisions regarding required disclosure.
| (b) | Internal Control Over Financial Reporting |
The Company’s management is responsible for establishing and maintaining adequate internal control over financial reporting. The internal control process has been designed under our supervision to provide reasonable assurance regarding the reliability of financial reporting and the preparation of the Company’s financial statements for external reporting purposes in accordance with accounting principles generally accepted in the United States of America.
Management conducted an assessment of the effectiveness of the Company’s internal control over financial reporting as of December 31, 2017, utilizing the framework established in the 2013 Internal Control – Integrated Framework issued by the Committee of Sponsoring Organizations of the Treadway Commission (COSO). Based on this assessment, management has determined that the Company’s internal control over financial reporting as of December 31, 2017, is effective.
Our internal control over financial reporting includes policies and procedures that pertain to the maintenance of records that accurately and fairly reflect, in reasonable detail, transactions and dispositions of assets; and provide reasonable assurances that: (1) transactions are recorded as necessary to permit preparation of financial statements in accordance with accounting principles generally accepted in the United States; (2) receipts and expenditures are being made only in accordance with authorizations of management and the directors of the Company; and (3) unauthorized acquisition, use, or disposition of the Company’s assets that could have a material effect on the Company’s financial statements are prevented or timely detected.
All internal control systems, no matter how well designed, have inherent limitations. Therefore, even those systems determined to be effective can provide only reasonable assurance with respect to financial statement preparation and presentation. Also, projections of any evaluation of effectiveness to future periods are subject to the risk that controls may become inadequate because of changes in conditions, or that the degree of compliance with the policies or procedures may deteriorate.
| 50 |
This annual report does not include an attestation report of the Company’s registered public accounting firm regarding internal control over financial reporting. Management’s report was not subject to attestation by the Company’s registered public accounting firm pursuant to rules of the SEC that permit the Company to provide only management’s report in this annual report.
| (c) | Changes to Internal Control Over Financial Reporting |
There were no changes in the Company’s internal control over financial reporting during the three months ended December 31, 2017, that have materially affected, or are reasonable likely to materially affect, the Company’s internal control over financial reporting.
| ITEM 9B. | Other Information |
None.
| ITEM 10. | Directors, Executive Officers and Corporate Governance |
Board Committees
The following table identifies the Board’s standing committees and their members as of December 31, 2017. All members of each committee are independent in accordance with the listing requirements of the NASDAQ Stock Market. Each committee operates under a written charter that is approved by the Board and that governs its composition, responsibilities and operation. Each committee reviews and reassesses the adequacy of its charter at least annually. The charter of each committee is available at the Investor Relations section of the Bank’s website (www.communitybank.tv).
| Director | Audit Committee |
Compensation Committee |
Nominating/ Corporate Governance Committee | |||
| Karl G. Baily | Vice Chairman | X | ||||
| Richard B. Boyer | ||||||
| Mark E. Fox | Chairman | X | X | |||
| William C. Groves | X | Chairman | ||||
| Charles R. Guthrie, CPA | X | Chairman | X | |||
| Joseph N. Headlee | X | Vice Chairman | ||||
| John J. LaCarte | X | Vice Chairman | X | |||
| Barron P. McCune, Jr. | ||||||
| Patrick G. O’Brien | ||||||
| David F. Pollock | X | X | ||||
| Ralph J. Sommers, Jr. | ||||||
| John M. Swiatek | X | X | ||||
| Number of meetings in fiscal 2017 | 9 | 2 | 1 |
Audit Committee
The Audit Committee is responsible for providing oversight relating to our consolidated financial statements and financial reporting process, systems of internal accounting and financial controls, internal audit function, annual independent audit and the compliance and ethics programs established by management and the Board. The Audit Committee is also responsible for engaging the Company’s independent registered public accounting firm and monitoring its conduct and independence. The Company’s Board has designated Charles R. Guthrie, CPA as an “audit committee financial expert” under the rules of the Securities and Exchange Commission.
| 51 |
Compensation Committee
The Compensation Committee approves the compensation objectives for the Company and the Bank, establishes the compensation for the Company’s and Bank’s executive management and conducts the performance review of the Chief Executive Officer. The Compensation Committee reviews and evaluates all components of compensation, including salaries, cash incentive plans, long-term incentive plans and various employee benefit matters. The Compensation Committee also administers and has discretionary authority over the issuance of equity awards under the Company’s equity incentive plan. Decisions by the Compensation Committee with respect to the compensation of executive officers, except for the issuance of equity awards, are approved by the full Board. The Committee also assists the Board in evaluating potential candidates for executive positions. With respect to other executive officers, the Chief Executive Officer recommends their annual compensation based on both individual and company-wide performance, subject to review and approval of the Compensation Committee and the Board. In addition, the Compensation Committee may delegate to management certain of its duties and responsibilities, including the adoption, amendment, modification or termination of the Bank’s tax-qualified retirement plans and health and welfare plans. The Compensation Committee also reviews the form and amount of compensation paid to our non-management directors from time to time.
The Compensation Committee has sole authority and responsibility under its charter to approve the engagement of any compensation consultant it uses and the fees for those services. The Compensation Committee did not engage the services of a compensation consultant during 2017.
Nominating/Corporate Governance Committee
The Nominating/Corporate Governance Committee assists the Board in: (i) identifying individuals qualified to become Board members, consistent with criteria approved by the Board; (ii) recommending to the Board the director nominees for the next annual meeting; (iii) implementing policies and practices relating to corporate governance, including implementation of and monitoring adherence to corporate governance guidelines; (iv) leading the Board in its annual review of the Board’s performance; and (v) recommending director nominees for each committee.
Consideration of Stockholder Recommendations. It is the policy of the Nominating/Corporate Governance Committee to consider director candidates recommended by stockholders who appear to be qualified to serve on the Company’s Board. The Nominating/Corporate Governance Committee may choose not to consider an unsolicited recommendation if no vacancy exists on the Board and the Nominating/Corporate Governance Committee does not perceive a need to increase the size of the Board. In order to avoid the unnecessary use of the Nominating/Corporate Governance Committee’s resources, the Nominating/Corporate Governance Committee will consider only those director candidates recommended in accordance with the procedures set forth below.
Procedures to be Followed by Stockholders. To submit a recommendation of a director candidate to the Nominating/Corporate Governance Committee, a stockholder should submit the following information in writing, addressed to the Chairman of the Nominating/Corporate Governance Committee, care of the Corporate Secretary, at the main office of the Company:
| 1. | The name of the person recommended as a director candidate; |
| 2. | All information relating to such person that is required to be disclosed in solicitations of proxies for election of directors pursuant to Regulation 14A under the Securities Exchange Act of 1934; |
| 3. | The written consent of the person being recommended as a director candidate to being named in the proxy statement as a nominee and to serving as a director if elected; |
| 4. | As to the stockholder making the recommendation, the name and address of such stockholder as they appear on the Company’s records; provided, however, that if the stockholder is not a registered holder of the Company’s common stock, the stockholder should submit his or her name and address along with a current written statement from the record holder of the shares that reflects ownership of the Company’s common stock; and |
| 5. | A statement disclosing whether such stockholder is acting with or on behalf of any other person and, if applicable, the identity of such person. |
In order for a director candidate to be considered for nomination at the Company’s annual meeting of stockholders, the recommendation must be received by the Nominating/Corporate Governance Committee at least 120 calendar days before the date the Company’s proxy statement was released to stockholders in connection with the previous year’s annual meeting, advanced by one year.
Code of Ethics and Business Conduct
The Company has adopted a code of ethics and business conduct which applies to all of the Company’s and the Bank’s directors, officers and employees. A copy of the code of ethics and business conduct is available on the Investor Relations section of the Bank’s website (www.communitybank.tv).
| 52 |
Directors
The Board of Directors consists of 12 members. The Board is divided into three classes, each with three-year staggered terms, with approximately one-third of the directors elected each year.
The following directors have terms ending in 2018:
Karl G. Baily. Mr. Baily, age 66, has served as a director since 1996. He retired as President of Caldwell Banker Baily Real Estate and Vice President of Baily Insurance Agency, Inc. in 2012.
Mr. Baily provides the board of directors with long-standing knowledge of the local real estate market and the local community.
Barron P. McCune, Jr. Mr. McCune, age 64, has served as a director since 1992. He served as President of Community Bank from 1999 to 2017, as Chief Executive Officer of Community Bank since 2005 and Vice Chairman since 2006. Before joining Community Bank in 1992, Mr. McCune practiced law for 20 years and performed legal work for the Bank. He holds a bachelor’s degree from Duke University and a law degree from the University of Denver School of Law.
Mr. McCune’s long history of service to Community Bank and his legal knowledge are valuable assets to the board of directors.
Ralph J. Sommers, Jr. Mr. Sommers, age 78, has served as a director since 1983 and as Chairman of the Board since 1999. He previously served as Chief Executive Officer of Community Bank from 1982 to 2005.
Mr. Sommers’ long history with Community Bank and his knowledge of its market area are valuable assets to the board of directors.
John M. Swiatek. Mr. Swiatek, age 60, served as a director of FedFirst since 2010. He is currently a partner in the Swiatek Melone Group, a strategic marketing, communications and public relations practice. Previously, he served as Managing Director of Innovation Sports & Entertainment, a division of The Innovation Group. Before joining The Innovation Group in 2011, he was the Director of the Sports, Entertainment and Marketing division of GSP Consulting Corporation. Mr. Swiatek also co-founded and served as the President and Managing Partner of the Washington Wild Things, a minor league professional baseball team in Washington, Pennsylvania, from 2001 until 2009.
Mr. Swiatek brings to the board of directors extensive business background in finance, management and marketing. In addition, he is familiar with our market areas as well as the surrounding greater Pittsburgh metropolitan area.
The following directors have terms ending in 2019:
Richard B. Boyer. Mr. Boyer, age 59, served as a director of FedFirst since 2002. He has been the President of Exchange Underwriters, Inc. since 1989.
As President of Exchange Underwriters, Mr. Boyer brings to the board of directors knowledge of the insurance industry and the operations of Exchange Underwriters, which he has managed for over 25 years.
Charles R. Guthrie, CPA. Mr. Guthrie, age 58, has served as a director since 2005. He is the President of Guthrie Belczyk and Associates, P.C., an accounting firm. Until 2012, Mr. Guthrie served as a registered representative of LPL, an investment company. Mr. Guthrie has been a Certified Public Accountant since 1982. He serves on committees of various community organizations in Community Bank’s local market area.
Mr. Guthrie’s expertise in accounting and corporate management and his community involvement are valuable assets to the board of directors.
Joseph N. Headlee. Mr. Headlee, age 68, has served as a director since 2002. He is a partner in Wayne Lumber Company and in Headlee Partnership. He has held these positions since 1982 and 1980, respectively. Mr. Headlee also has served as Treasurer of Franklin Township Sewage Authority.
Mr. Headlee brings to the board of directors experience in business management and marketing and familiarity with Community Bank’s market area.
Patrick G. O’Brien. Mr. O’Brien, age 56, served as a director of FedFirst since 2009. He became President of Community Bank in 2017. Before joining Community Bank in 2014, Mr. O’Brien was FedFirst’s President and Chief Executive Officer in 2009 to 2014 and served as Executive Vice President and Chief Operating Officer of FedFirst from 2005 to 2009. Before joining FedFirst, he served as Regional President and Senior Lender – Commercial Lending with WesBanco Bank, Inc., Washington, Pennsylvania, from 2002 to 2005. Before serving with WesBanco Bank, he was Senior Vice President of Commercial Lending with Wheeling National Bank from 1999 to 2002, and Vice President and District Manager (Retail Banking) at PNC from 1993 to 1999.
| 53 |
As FedFirst’s former President and Chief Executive Officer, Mr. O’Brien brings to the board of directors knowledge of FedFirst’s operations, extensive experience in community banking and familiarity with our market area.
The following directors have terms ending in 2020:
Mark E. Fox. Mr. Fox, age 59, has served as a director since 1998. Mr. Fox has more than 35 years’ experience as the owner and manager of Fox Ford, Inc., a local car dealership. Since 2013, he has served as the President of Fox Ford, Inc. Before that time, he served as Vice President of Fox Ford, Inc. He holds a bachelors’ degree in accounting and a MBA degree.
Mr. Fox’s experience in managing a local business provides the board of directors with insight into economic and business trends in Community Bank’s market area.
William C. Groves. Mr. Groves, age 76, has served as a director since 1996. Since 1980 he has served as the President of Haulit Trucking, Inc. Mr. Groves is also a township supervisor of Cumberland Township, a position he has held since 2003.
Mr. Groves’s experience in managing a local business and his long standing ties to the local community provide the board of directors with valuable insight on Community Bank’s local market area.
John J. LaCarte. Mr. LaCarte, age 51, served as a director of FedFirst Financial Corporation (“FedFirst”) since 1998 and served as FedFirst’s Chairman of the Board since 2004. He is the President of LaCarte Development Company and LaCarte Enterprises, Inc., the holding company of Model Dry Cleaners, LLC, Model Uniforms, LLC and Model Apparel, LLC.
Mr. LaCarte brings to the board of directors entrepreneurial and business management experience from successfully managing a business with over 25 locations in Pennsylvania and Ohio and 300 employees. In addition, as a lifelong resident of the area and owner of a local business based in Washington County, he offers the board of directors significant knowledge related to the local business, market area and retail environment. Mr. LaCarte’s career as a small business owner also provides organizational understanding and management expertise.
David F. Pollock. Mr. Pollock, age 63, has served as a director since 2006. Mr. Pollock has been a practicing attorney for over 33 years. He is a Managing Partner in the law firm of Pollock Morris, LLC and, since 2008, has been a Managing Partner of P&S Development, LLC, a real estate development company.
Mr. Pollock’s legal knowledge and real estate development experience in Community Bank’s market area significantly contribute to the depth of the board of directors.
Executive Officers Who Are Not Directors
Below is information regarding our executive officers who are not directors of the Company or the Bank. Each individual has held his current position for at least the last five years, unless otherwise stated. The ages presented are as of December 31, 2017.
Kevin D. Lemley, CPA. Mr. Lemley, age 63, has been employed by CB Financial since December 2011 and serves as Executive Vice President and Chief Financial Officer. From 2010 to 2011, he served as Senior Vice President and Chief Credit Administration Officer of Centra Bank, Inc. From 1999 to 2010, he served as Senior Vice President and Chief Financial Officer of Centra Bank, Inc.
Ralph Burchianti. Mr. Burchianti, age 62, has been employed by CB Financial since August 1985 and serves as Executive Vice President – Chief Credit Officer.
Section 16(a) Beneficial Ownership Reporting Compliance
Section 16(a) of the Securities Exchange Act of 1934 requires the Company’s executive officers and directors, and persons who own more than 10% of any registered class of the Company’s equity securities, to file reports of ownership and changes in ownership with the Securities and Exchange Commission. These individuals are required by regulation to furnish the Company with copies of all Section 16(a) reports they file. Based solely on its review of the copies of the reports it has received and written representations provided to it from the individuals required to file the reports, the Company believes that each of its executive officers and directors has complied with applicable reporting requirements for transactions in the Company’s common stock during the fiscal year ended December 31, 2017.
| 54 |
| ITEM 11. | Executive Compensation |
The following table sets forth the compensation received by individuals who served as directors, and who were not also named executive officers, of the Company during the fiscal year ended December 31, 2017.
| Fees Earned or Paid in Cash | Stock Awards (1) | Option Awards (2) | Nonqualified Deferred Compensation Earnings | All Other Compensation | Total | |||||||||||||||||||
| Karl G. Baily | $ | 26,400 | $ | 23,063 | $ | 6,924 | $ | — | $ | 2,640 | $ | 59,027 | ||||||||||||
| Mark E. Fox | 38,400 | 23,063 | 6,924 | — | 2,640 | 71,027 | ||||||||||||||||||
| William C. Groves | 35,400 | 23,063 | 6,924 | — | 2,640 | 68,027 | ||||||||||||||||||
| Charles R. Guthrie, CPA | 29,400 | 23,063 | 6,924 | — | 2,640 | 62,027 | ||||||||||||||||||
| Joseph N. Headlee | 26,400 | 23,063 | 6,924 | — | 2,640 | 59,027 | ||||||||||||||||||
| John J. LaCarte | 26,400 | 23,063 | 6,924 | — | 2,640 | 59,027 | ||||||||||||||||||
| David F. Pollock | 29,400 | 23,063 | 6,924 | — | 2,640 | 62,027 | ||||||||||||||||||
| Ralph J. Sommers, Jr. | 38,400 | 23,063 | 6,924 | — | 60,236 | (3) | 128,622 | |||||||||||||||||
| John M. Swiatek | 26,400 | 23,063 | 6,924 | — | 2,640 | 59,027 | ||||||||||||||||||
__________________
| (1) | Reflects the aggregate grant date fair value for restricted stock awards computed in accordance with Financial Accounting Standards Board Accounting Standards Codification (“FASB ASC”) Topic 718 – Share Based Payment, based on the closing price of the Company’s common stock on the grant date ($30.75 per share on December 15, 2017). Restricted stock awards vest on December 15, 2018. As of December 31, 2017, each listed director had an outstanding stock award for 750 shares. See “Executive Compensation – Equity Incentive Plan.” |
| (2) | Reflects the aggregate grant date fair value for stock options computed in accordance with FASB ASC Topic 718, using the binomial option pricing model to estimate the fair value of stock option awards. Stock option awards vest in five approximately equal installments, with the first vesting occurring on December 15, 2018. As of December 31, 2017, each listed director had an outstanding option award for 1,115 shares. See “Executive Compensation – Equity Incentive Plan.” |
| (3) | Includes salary ($50,000) and bonus ($2,200) paid in accordance with the employment agreement between Community Bank and Mr. Sommers. See “Executive Compensation – Employment Agreements.” |
The amounts reflected in the “Stock Awards” and “Option Awards” columns of the above table represent the grant date fair value of the awards issued to the listed directors under the CB Financial Services, Inc. 2015 Equity Incentive Plan (the “2015 Equity Incentive Plan”), as determined in accordance with applicable accounting standards. Although the full grant date fair value of the stock option awards is reflected in the above table, the actual value of the stock options, if any, realized by a director will depend on the extent to which the market value of the Company common stock exceeds the exercise price of the stock option on the date of exercise. Accordingly, there is no assurance that the value realized by a director will be at or near the estimated value reflected in the above table.
Summary Compensation Table. The following information is furnished for the principal executive officer of the Company or its subsidiaries and the two most highly-compensated executive officers (other than the principal executive officer) of the Company and its subsidiaries whose total compensation for the fiscal year ended December 31, 2017, exceeded $100,000. These individuals are sometimes referred to in this proxy statement as the “named executive officers.”
| 55 |
| Name and Principal Position | Year | Salary | Bonus | Stock Awards (1) | Option Awards (1) | All Other Compensation (2) | Total | |||||||||||||||||||||
| Barron P. McCune, Jr. | 2017 | $ | 363,960 | $ | 42,024 | $ | 23,063 | $ ― | $ | 75,482 | $ | 504,529 | ||||||||||||||||
| Vice Chairman & | 2016 | 353,760 | 23,800 | 10,210 | 20,503 | 75,733 | 485,006 | |||||||||||||||||||||
| Chief Executive Officer | 2015 | 333,760 | 32,000 | 15,998 | 59,700 | 75,572 | 517,030 | |||||||||||||||||||||
| Patrick G. O’Brien | 2017 | $ | 257,861 | $ | 30,943 | $ ― | $ | 25,461 | $ | 43,466 | $ | 357,731 | ||||||||||||||||
| President | 2016 | 250,350 | 17,525 | 7,512 | 17,094 | 42,810 | 335,291 | |||||||||||||||||||||
| 2015 | 238,500 | 23,835 | 11,926 | 49,750 | 41,758 | 365,769 | ||||||||||||||||||||||
| Richard B. Boyer | 2017 | $ | 251,396 | $ | 44,186 | $ | 23,063 | $ | 10,495 | $ | 66,063 | $ | 395,203 | |||||||||||||||
| Vice President of | 2016 | 242,439 | ― | 13,225 | 10,276 | 66,416 | 332,356 | |||||||||||||||||||||
| Insurance Operations | 2015 | 223,554 | 47,531 | 16,688 | 29,850 | 61,871 | 379,494 | |||||||||||||||||||||
| (1) | These amounts represent the grant date fair value of the awards issued to the named executive officers under the 2015 Equity Incentive Plan, as determined in accordance with applicable accounting standards. Although the full grant date fair value of the stock option awards is reflected in the above table, the actual value of the stock options, if any, realized by the named executive officers will depend on the extent to which the market value of the Company common stock exceeds the exercise price of the stock option on the date of exercise. Accordingly, there is no assurance that the value realized by a named executive officer will be at or near the estimated value reflected in the above table. |
| (2) | The following table details the amounts reported in the “All Other Compensation” column for 2017. The table may exclude perquisites which did not exceed $10,000 in the aggregate for each named executive officer. |
| Mr. McCune | Mr. O’Brien | Mr. Boyer | ||||||||||
| Employer contributions to 401(k) plan | $ | 34,450 | $ | 13,250 | $ | 13,250 | ||||||
| Supplemental retirement plan contribution | 9,547 | — | — | |||||||||
| Imputed income on split dollar life insurance | 366 | — | 1,234 | |||||||||
| Director fees | 26,400 | 26,400 | 26,400 | |||||||||
| Total | 70,763 | 39,650 | 40,884 | |||||||||
Employment Agreements. Community Bank has entered into employment agreements with Messrs. Sommers, McCune, O’Brien and Boyer (referred to below as the “executives” or “executive”). Exchange Underwriters, Inc. is also a party to the employment agreement with Mr. Boyer. The employment agreements have a term that begins October 31, 2014 and continues 36 months after May 1, 2015. On each anniversary date (which is defined as May 1 of each calendar year), each employment agreement will extend for one year such that the remaining term will be for 36 months thereafter, provided that disinterested members of the Bank’s board of directors conduct a comprehensive performance evaluation of the executive and affirmatively approve the extension.
Each employment agreement provides for an annual base salary rate of $50,000, $320,000, $238,350 and $190,000 for Messrs. Sommers, McCune, O’Brien and Boyer, respectively. In addition to base salary, each executive (except Mr. Boyer) is entitled to participate in bonus programs and benefit plans that are made available by the Bank to management employees. In lieu of participating in the Bank’s bonus programs, Mr. Boyer is entitled to receive: (i) 25% of all first year commissions generated by any salesperson of Exchange Underwriters, Inc. (including himself) from the sales of new insurance policies, which the commissions earned will be paid on a monthly basis; and (ii) an annual bonus equal to 20% of the year-over-year growth in Exchange Underwriters, Inc.’s annual audited net income, excluding any net income effect from the completion of any agency acquisition.
Each executive will be reimbursed for all reasonable business expenses incurred. Moreover, Messrs. Sommers, McCune and O’Brien are entitled to use of a company-purchased automobile and will be reimbursed for all operating expenses of the automobile. Community Bank will also make a taxable annual contribution of $9,547 to a non-qualified supplemental retirement program for the benefit of Mr. McCune.
In the event of the executive’s involuntary termination of employment for reasons other than cause, disability or death, or if the executive resigns during the term of the employment agreement for “good reason,” Community Bank will provide the executive with the following severance benefits:
| · | continued base salary payments (at the rate in effect as of the date of determination) for the greater of 12 months or the remaining term of the employment agreement, payable in accordance with regular payroll practices; and |
| 56 |
| · | continued life insurance and non-taxable medical and dental coverage, which will end upon the earlier of the completion of the remaining term of the employment agreement or the date on which the executive receives substantially similar benefits from another employer. |
For purposes of the employment agreements, “good reason” is defined as: (i) a material reduction in the executive’s base salary or benefits (other than a reduction that is part of a good faith, overall reduction applicable to all employees); (ii) a material reduction in the executive’s authorities, duties or responsibilities; or (iii) a material breach of the employment agreement by the Bank.
Upon the occurrence of the executive’s termination for any reason (other than for cause) on or after the effective time of a change in control of the Company or Community Bank, then in lieu of the severance benefits immediately above, the Bank or any successor will provide the executive with the following severance benefits:
| · | a benefit equal to three times the executive’s highest annual rate of base salary earned during the calendar year of the executive’s date of termination or either of the three calendar years immediately preceding the date of termination, payable in equal installments according to regular payroll practices; and |
| · | continued life insurance and non-taxable medical and dental coverage until the earlier of: (i) three years after the executive’s date of termination; or (ii) the date on which the executive receives substantially similar benefits from another employer. |
Upon any termination of employment (except following a change in control), each executive is required to adhere to non-competition and non-solicitation covenants for one year.
Non-Equity Bonus Program. Community Bank maintains a bonus program designed to align the interests of employees of Community Bank with the overall performance of CB Financial and the Bank. Employees selected by the board of directors are eligible to participate in the bonus program. Each employee’s bonus amount is designated as a percentage of base salary, and is determined based on the satisfaction of objective performance targets related to the Bank’s net income and net loan growth (which is determined based on the percentage increase in net loans from the prior fiscal year). For the 2017 plan year, the Compensation Committee established performance targets related to net income and net loan growth set forth in the following matrix, with the percentage amounts (based on the satisfaction of the applicable performance targets) representing the percentage of the employee’s base salary for purposes of determining his or her bonus:
| Net Loan Growth | ||||||||||||||||||||
| Net Income | 0% | 4% | 8% | 12% | 16% | |||||||||||||||
| $7,047 | — | 0.6 | % | 1.2 | % | 2.4 | % | 3.6 | % | |||||||||||
| $7,197 | 0.6 | % | 1.2 | % | 2.4 | % | 3.6 | % | 4.8 | % | ||||||||||
| $7,347 | 1.2 | % | 2.4 | % | 3.6 | % | 4.8 | % | 6.0 | % | ||||||||||
| $7,497 | 2.4 | % | 3.6 | % | 4.8 | % | 6.0 | % | 7.2 | % | ||||||||||
| $7,647 | 3.6 | % | 4.8 | % | 6.0 | % | 7.2 | % | 8.4 | % | ||||||||||
For calculation purposes in 2017, net income was approximately $7.1 million (as adjusted for merger expenses and changes in the federal tax code) and net loans increased approximately 12%. As a result, based on the matrix above, each employee earned a bonus equal to 3% of base salary within the matrix. At their discretion, the Board of Directors approved an employee bonus equal to 5% of base salary, which was paid in January 2018.
Split Dollar Agreements. Community Bank has entered into split dollar life insurance agreements with each of Messrs. Sommers and McCune. Under each agreement, the executive’s designated beneficiary will be entitled to share in the proceeds under a life insurance policy owned by the Bank on the life of the executive. The death benefit payable to each executive is $200,000, provided, however that the death benefit must not exceed the executive’s net-at-risk portion of the proceeds (which is the difference between the cash surrender value of the policy and the total proceeds payable under the policy upon the death of the insured). If the executive’s termination occurs subsequent to a change in control of Community Bank, the executive will be 100% vested in his death benefit. The Bank is the sole beneficiary of any death proceeds remaining after the executive’s death benefit has been paid to his designated beneficiary.
Community Bank also has assumed the split dollar life insurance agreement between First Federal Savings Bank and Mr. Boyer in connection with the Company’s merger with FedFirst. This agreement provides Mr. Boyer with a cash payment if he dies while in service with the Bank. Under the terms of the agreement, the Bank is the owner of and pays all the premiums on the life insurance policy under which Mr. Boyer is insured. Under the agreement, upon Mr. Boyer’s death his designated beneficiary is entitled to $1,000,000 if he dies before age 65 and $500,000 if he dies after age 65. The Bank is entitled to any remaining insurance proceeds. If Mr. Boyer terminates his employment before attaining his normal retirement age, his division of the insurance proceeds will be prorated based on his years of service with the Bank.
| 57 |
401(k) Plan. Community Bank maintains the 401(k) Profit Sharing Plan, a tax-qualified defined contribution retirement plan (the “401(k) Plan”), for all employees who have satisfied the 401(k) Plan’s eligibility requirements. Each eligible employee can begin participating in the 401(k) Plan on the first day of the calendar quarter following the attainment of age 18 and completion of six months of service.
A participant may contribute up to 100% of his or her compensation to the 401(k) Plan on a pre-tax or post-tax (referred to as a “Roth” contribution) basis, subject to the limitations imposed by the Internal Revenue Code. For 2017, the salary deferral contribution limit is $18,000 provided, however, that a participant over age 50 may contribute an additional $6,000 to the 401(k) Plan. Each plan year, Community Bank makes a matching contribution, based on each participant’s salary deferral contribution. The matching contribution formula is currently a 25% match of employee 401(k) Plan deferrals (if any) up to the first 4% of compensation deferred. In addition to salary deferral contributions, the 401(k) Plan provides that the Bank will make a safe harbor employer contribution to each eligible participant’s account equal to 3% of the participant’s compensation earned during the plan year (referred to as a “safe harbor contribution”). A participant is always 100% vested in his or her salary deferral and safe harbor contributions.
In addition, for the 2017 plan year, Community Bank made a discretionary profit sharing contribution to each participant’s account in accordance with the following schedule:
| For all employees who were participants in the Community Bank Pension Plan as of December 31, 2007. | |
| Age 66 or older | 1% of compensation |
| Age 51-65 | 9% of compensation |
| Age 45-50 | 7% of compensation |
| Age 40-44 | 5% of compensation |
| Age 35-39 | 3% of compensation |
| Age 34 and under | 1% of compensation |
| All employees who were not participants in the Community Bank Pension Plan as of December 31, 2007 and all employees hired on or after January 1, 2007 | 1% of compensation |
Each participant vests in his or her profit sharing contribution at a rate 20% per year such that the participant will become 100% vested upon the completion of five years of credited service. However a participant will immediately become 100% vested in any profit sharing contributions upon the participant’s death, disability or attainment of age 65 while employed with Community Bank.
Generally, a participant (or participant’s beneficiary upon death) may receive a distribution from his or her vested account at retirement, age 59½ (while employed with Community Bank), death, disability or termination of employment, which is payable in a lump sum. Each participant has an individual account under the 401(k) Plan and may direct the investment of his or her account balance among a variety of investment options available under the plan.
| 58 |
Outstanding Equity Awards at December 31, 2017. The following table sets forth information with respect to outstanding equity awards as of December 31, 2017, for the named executive officers. All equity awards reflected in this table were granted pursuant to the 2015 Equity Incentive Plan, described below.
| Option Awards | Stock Awards | |||||||||||||||||||||
| Name | Number of Securities Underlying Unexercised Options Exercisable | Number of Securities Underlying Unexercised Options Unexercisable(1) | Option Exercise Price | Option Expiration Date | Number of Shares of Restricted Stock That Have Not Vested(2) | Market Value of Shares of Restricted Stock That Have Not Vested(3) | ||||||||||||||||
| Barron P. McCune, Jr. | 6,000 | 9,000 | $ | 22.25 | 12/16/2025 | ― | $ | ― | ||||||||||||||
| 842 | 3,368 | 26.45 | 12/16/2026 | ― | ― | |||||||||||||||||
| ― | 3,280 | 30.75 | 12/15/2027 | 750 | 22,500 | |||||||||||||||||
| Patrick G. O’Brien | 5,000 | 7,500 | $ | 22.25 | 12/16/2025 | ― | ― | |||||||||||||||
| 702 | 2,808 | 26.45 | 12/16/2026 | ― | ― | |||||||||||||||||
| ― | 4,100 | 30.75 | 12/15/2027 | ― | ― | |||||||||||||||||
| Richard B. Boyer | 3,000 | 4,500 | $ | 22.25 | 12/16/2025 | ― | ― | |||||||||||||||
| 422 | 1,688 | 26.45 | 12/16/2026 | ― | ― | |||||||||||||||||
| ― | 1,690 | 30.75 | 12/15/2027 | 750 | 22,500 | |||||||||||||||||
__________________________________________
| (1) | Options vest in five equal installments, commencing on December 15, 2018, December 16, 2017 and 2016, respectively. |
| (2) | Restricted stock awards become 100% vested on December 15, 2018. |
| (3) | Based on the $30.00 closing price of the Company’s common stock on December 31, 2017. |
2015 Equity Incentive Plan. At the 2015 annual meeting, the Company’s stockholders approved the 2015 Equity Incentive Plan to provide officers, employees and directors of the Company and Community Bank with additional incentives to promote the growth and performance of the Company. Subject to permitted adjustments for certain corporate transactions, the 2015 Equity Incentive Plan authorizes the issuance or delivery to participants of up to 407,146 shares of Company common stock pursuant to grants of incentive and non-statutory stock options, restricted stock awards and restricted stock units. Of this amount, the maximum number of shares of Company common stock that may be issued under the plan pursuant to the exercise of stock options is 271,431 shares, and the maximum number of shares of Company common stock that may be issued as restricted stock awards or restricted stock units is 135,715 shares (the “Restricted Stock Threshold Amount”). The Compensation Committee may issue restricted stock awards or restricted stock units that exceed the Restricted Stock Threshold Amount, provided that the number of shares of Company common stock that are reserved for issuance under the 2015 Equity Incentive Plan as stock options will be reduced by three shares of common stock for each restricted stock award or restricted stock unit that is issued in excess of the Restricted Stock Threshold Amount.
Employees and directors of the Company and its subsidiaries are eligible to receive awards under the 2015 Equity Incentive Plan, except non-employee directors may not be granted incentive stock options. The 2015 Equity Incentive Plan will be administered by the members of the Compensation Committee. The Compensation Committee may grant any of these types of awards subject to performance based vesting conditions. Such awards shall be referred to herein as “performance awards.” As of December 31, 2017, 5,991 stock options and 111,824 shares of restricted stock remain available for award from the 2015 Equity Incentive Plan.
The Compensation Committee shall specify the vesting schedule or conditions of each award. Unless the Compensation Committee specifies a different vesting schedule at the time of grant, awards under the 2015 Equity Incentive Plan, other than performance awards, shall be granted with a vesting rate not exceeding 20% per year, with the first installment vesting no earlier than one year after the date of grant of the award. If the vesting of an award under the 2015 Equity Incentive Plan is conditioned on the completion of a specified period of service with the Company or its subsidiaries, without the achievement of performance measures or objectives, then the required period of service for full vesting shall be determined by the Compensation Committee and evidenced in an award agreement. Notwithstanding anything to the contrary in the 2015 Equity Incentive Plan, except with respect to the deemed satisfaction of any performance conditions on a change in control, no award granted under the 2015 Equity Incentive Plan will vest in less than one year from the date of grant, unless due to death, disability or involuntary termination following a change in control. Vesting may be accelerated upon death, disability, or involuntary termination of employment or service following a change in control, or at the discretion of the Compensation Committee at any time after the first anniversary of the date of grant of an award.
| 59 |
| ITEM 12. | Security Ownership of Certain Beneficial Owners and Management and Related Stockholder Matters |
The Company does not know of any person to be the beneficial owner of more than 5% of the Company’s outstanding common stock as of March 29, 2018.
The following table provides information as of March 29, 2018, about the shares of Company common stock that may be considered to be beneficially owned by each nominee for director, by each continuing director, by the executive officers named in the Summary Compensation Table and by all directors and executive officers of the Company as a group. A person may be considered to beneficially own any shares of common stock over which he has, directly or indirectly, sole or shared voting or investment power. Unless otherwise indicated, each of the named individuals has sole voting and investment power with respect to the shares shown and none of the named individuals has pledged any of his shares.
| Name | Number of Shares Owned | Percent of Common Stock Outstanding (1) | ||||||
| Directors: | ||||||||
| Karl G. Baily | 18,360 | (2)(5) | * | |||||
| Richard B. Boyer | 21,996 | (5) | * | |||||
| Mark E. Fox | 12,660 | (3)(5) | * | |||||
| William C. Groves | 20,179 | (4) | * | |||||
| Charles R. Guthrie, CPA | 12,895 | (3)(5) | * | |||||
| Joseph N. Headlee | 23,800 | (3) | * | |||||
| John J. LaCarte | 52,338 | (3) | 1.3 | % | ||||
| Barron P. McCune, Jr. | 68,697 | (2) | 1.7 | % | ||||
| Patrick G. O’Brien | 58,231 | (5) | 1.4 | % | ||||
| David F. Pollock | 36,285 | * | ||||||
| Ralph J. Sommers, Jr. | 22,540 | * | ||||||
| John M. Swiatek | 13,848 | (5) | * | |||||
| Executive Officers Who Are Not Directors: | ||||||||
| Kevin D. Lemley, CPA | 10,275 | (2)(5) | * | |||||
| Ralph Burchianti | 60,370 | (4) | 1.5 | % | ||||
| All Directors and Executive Officers as a Group (14 persons) | 432,474 | 10.6 | % | |||||
__________________________________
| * | Represents less than 1% of the Company’s outstanding shares. |
| (1) | Based on 4,096,452 shares of the Company’s common stock outstanding and entitled to vote as of March 29, 2018. |
| (2) | Includes shares owned indirectly through a spouse or child as follows: Mr. Baily – 400 shares, Mr. McCune – 5,330 shares and Mr. Lemley – 2,910 shares. |
| (3) | Includes shares held by a corporation or limited partnership as follows: Mr. Fox – 725 shares, Mr. Guthrie – 48 shares, Mr. Headlee – 5,000 shares and Mr. LaCarte – 19,090 shares. |
| (4) | Includes shares owned indirectly through an investment club as follows: Messrs. Groves and Burchianti – 220 shares each. The investment club, in which Messrs. Groves and Burchianti each has a 10% interest, owns a total of 2,200 shares. |
| (5) | Includes shares owned through a retirement account as follows: Mr. Baily – 1,850 shares, Mr. Boyer – 11,989 shares, Mr. Fox –5,318 shares, Mr. Guthrie – 5,667 shares, Mr. O’Brien – 19,694 shares, Mr. Swiatek – 6,334 shares and Mr. Lemley – 725 shares. |
| 60 |
The following table provides information at December 31, 2017, for compensation plans under which equity securities may be issued.
| Number of securities | ||||||||||||
| remaining available for | ||||||||||||
| Number of securities | future issuance under | |||||||||||
| to be issued upon | Weighted-average | equity compensation | ||||||||||
| exercise of | exercise price of | plans (excluding | ||||||||||
| outstanding options | outstanding options | securities reflected | ||||||||||
| Plan Category | warrants and rights | warrants and rights | in column (A)) | |||||||||
| (A) | (B) | (C) | ||||||||||
| Equity compensation plans: | ||||||||||||
| Approved by stockholders | 263,640 | $ | 24.33 | 117,815 | (1) | |||||||
| Not approved by stockholders | - | - | - | |||||||||
| Total | 263,640 | $ | 24.33 | 117,815 | ||||||||
| (1) | Represents 111,824 shares available under the 2015 Equity Incentive Plan that can be issued as restricted stock awards or units and 5,991 shares that can be issued as stock options. Restricted stock awards or units may be issued above this amount provided that the number of shares reserved for stock options is reduced by three shares for each restricted stock award or unit share granted. |
| ITEM 13. | Certain Relationships and Related Transactions and Director Independence |
Director Independence
The Company’s Board of Directors currently consists of 15 members, all of whom are independent under the listing requirements of the NASDAQ Stock Market except for Richard B. Boyer, Barron P. McCune, Jr., Patrick G. O’Brien and Ralph J. Sommers, Jr., who are our employees. In determining the independence of directors, the Board considered the various deposit, loan and other relationships that each director has with the Bank, including loans and lines of credit outstanding to Mark Fox, Charles R. Guthrie, CPA, Joseph Headlee, John LaCarte and David Pollock or to their related entities, as well as the transactions disclosed under “Other Information Relating to Directors and Executive Officers—Transactions with Related Persons”, but determined in each case that these relationships did not interfere with their exercise of independent judgment in carrying out their responsibilities as directors.
Board Leadership Structure and Board’s Role in Risk Oversight
Mr. Sommers serves as Chairman of the Board of Directors and Mr. McCune serves as Vice-Chairman of the Board of Directors. The Board of Directors believes this arrangement is appropriate given that more than a simple majority of the members of the Board of Directors are independent. The Board of Directors believes that the independent directors, working together, provide strong, independent oversight of the Company’s management and affairs. The Board of Directors has not designated a lead independent director.
Risk is inherent with every business, and how well a business manages risk can ultimately determine its success. The Company faces a number of risks, including credit risk, interest rate risk, liquidity risk, operational risk, strategic risk and reputation risk. Management is responsible for the daily management of risks the Company faces, while the Board, as a whole and through its committees, has responsibility for the oversight of risk management. In its risk oversight role, the Board has the responsibility to satisfy itself that the risk management processes designed and implemented by management are adequate and functioning as designed. To do this, the Chairman of the Board meets regularly with management to discuss strategy and the risks facing the Company. Senior management attends the Board meetings and is available to address any questions or concerns raised by the Board on risk management and any other matters. The independent members of the Board, working together, provide strong, independent oversight of the Company’s management and affairs through its standing committees and, when necessary, special meetings of independent directors.
Transactions with Related Persons
Loans and Extensions of Credit. Federal law generally prohibits the Company from making loans to its executive officers and directors. However, there is a specific exemption from such prohibition for loans made by Community Bank to its executive officers and directors in compliance with federal banking regulations. Federal banking regulations generally require that all loans or extensions of credit to executive officers and directors of insured institutions must be made on substantially the same terms, including interest rates and collateral, as those prevailing at the time for comparable transactions with other persons and must not involve more than the normal risk of repayment or present other unfavorable features. However, federal regulations allow financial institutions, such as Community Bank, to make loans to executive officers and directors at reduced interest rates if the loans are made under a benefit program that is generally available to all other employees and that does not give preference to any executive officer or director over any other employee.
| 61 |
In addition, loans made to a director or executive officer in an amount that, when aggregated with the amount of all other loans to the person and his or her related interests, are in excess of the greater of $25,000 or 5% of Community Bank’s capital and surplus, up to a maximum of $500,000, must be approved in advance by a majority of the disinterested members of Community Bank’s board of directors.
The outstanding balance of loans extended by Community Bank to its executive officers and directors and related parties was $7.2 million at December 31, 2017. Such loans were made in the ordinary course of business, on substantially the same terms, including interest rates and collateral, as those prevailing at the time for comparable loans with persons not related to Community Bank, and did not involve more than the normal risk of collectability or present other unfavorable features when made.
Other Transactions. Since January 1, 2017, there have been no transactions and there are no currently proposed transactions in which the Company or the Bank were or are to be a participant and the amount involved exceeds $120,000, and in which any of the Company’s executive officers and directors had or will have a direct or indirect material interest.
| ITEM 14. | Principal Accountant Fees and Services |
Audit Fees. Baker Tilly Virchow Krause, LLP has served as the Company’s independent registered public accounting firm since October 1, 2014. The following table sets forth the fees that it billed to the Company for the fiscal years ended December 31, 2017 and 2016, respectively.
| Fiscal 2017 | Fiscal 2016 | |||||||
| Audit fees (1) | $ | 123,500 | $ | 119,305 | ||||
| Audit-related fees (2) | 36,949 | 17,943 | ||||||
| Tax fees(3) | 11,000 | 11,675 | ||||||
| All other fees(4) | 8,325 | — | ||||||
___________________
| (1) | Includes fees for the audit of the annual consolidated financial statements, review of Annual Report on Form 10-K, and review of financial statements included in Forms 10-Q and services that are normally provided in connection with statutory and regulatory filings or engagements. |
| (2) | Includes fees for review of Form S-4 in relation to pending merger with First West Virginia, audit of employee benefit plans and fees for consultation and review in connection with Sarbanes Oxley 404 compliance. |
| (3) | Includes fees for tax compliance services including preparation of federal and state tax returns and planning advice. |
| (4) | Includes fees for Cost Segregation Study engagement performed on RJ Sommers, Jr. Operations Center. |
Policy on Audit Committee Pre-Approval of Audit and Permissible Non-Audit Services of the Independent Registered Public Accounting Firm. The Audit Committee has adopted a policy for approval of audit and permitted non-audit services by the Company’s independent registered public accounting firm. The Audit Committee will consider annually and approve the provision of audit services by the independent registered public accounting firm and, if appropriate, approve the provision of certain defined audit and non-audit services. The Audit Committee also will consider on a case-by-case basis and, if appropriate, approve specific engagements.
Any proposed specific engagement may be presented to the Audit Committee for consideration at its next regular meeting or, if earlier consideration is required, to the Audit Committee or one or more of its members. The member or members to whom such authority is delegated shall report any specific approval of services at its next regular meeting. The Audit Committee will regularly review summary reports detailing all services being provided to the Company by its independent registered public accounting firm.
During the fiscal year ended December 31, 2017, all audit-related fees, tax fees, and all other fees set forth in the table above were approved by the Audit Committee.
| 62 |
| ITEM 15. | Exhibits and Financial Statement Schedules |
| (a)(1) | Financial Statements |
The financial statements filed as a part of this Form 10-K are:
| (A) | Report of Independent Registered Public Accounting Firm; |
| (B) | Consolidated Statement of Financial Condition - December 31, 2017 and 2016; |
| (C) | Consolidated Statement of Income - years ended December 31, 2017, 2016 and 2015; |
| (D) | Consolidated Statement of Comprehensive Income - years ended December 31, 2017, 2016 and 2015; |
| (E) | Consolidated Statement of Changes in Stockholders’ Equity - years ended December 31, 2017, 2016 and 2015; |
| (F) | Consolidated Statement of Cash Flows - years ended December 31, 2017, 2016 and 2015; and |
| (G) | Notes to Consolidated Financial Statements. |
| (a)(2) | Financial Statement Schedules |
All financial statement schedules have been omitted as the required information is inapplicable or has been included in the Notes to Consolidated Financial Statements.
| (a)(3) | Exhibits |
| 3.1 | Amended and Restated Articles of Incorporation of CB Financial Services, Inc. (1) |
| 3.2 | Bylaws of CB Financial Services, Inc. (1) |
| 4 | Form of Stock Certificate of CB Financial Services, Inc. (1) |
| 10.1 | Employment Agreement by and between Community Bank and Barron P. McCune, Jr. (2) |
| 10.2 | Employment Agreement by and between Community Bank and Kevin D. Lemley (3) |
| 10.3 | Employment Agreement by and between Community Bank and Ralph Burchianti (4) |
| 10.4 | Employment Agreement by and between Community Bank and Ralph J. Sommers, Jr. (5) |
| 10.5 | Employment Agreement by and between Community Bank and Patrick G. O’Brien (1) |
| 10.6 | Employment Agreement by and among Community Bank, Exchange Underwriters, Inc., and Richard B. Boyer dated April 14, 2014 (1) |
| 10.7 | Split Dollar Life Insurance Agreement by and between Community Bank and Barron P. McCune, Jr., dated April 1, 2005 (1) |
| 10.8 | Split Dollar Life Insurance Agreement by and between Community Bank and Ralph Burchianti dated April 1, 2005 (1) |
| 10.9 | Split Dollar Life Insurance Agreement by and between Community Bank and Ralph J. Sommers, Jr., dated April 1, 2005 (1) |
| 10.10 | Split Dollar Life Insurance Agreement dated as of June 1, 2002, by and between First Federal Savings Bank and Richard B. Boyer (6) |
| 10.11 | Amendment dated as of July 19, 2002, to the Life Insurance Endorsement Method Split Dollar Plan Agreement by and between First Federal Savings Bank and Richard B. Boyer (7) |
| 10.12 | Amendment dated as of September 13, 2005, to the Life Insurance Endorsement Method Split Dollar Plan Agreement by and between First Federal Savings Bank and Richard B. Boyer (8) |
| 10.13 | Lease Agreement dated as of June 1, 2012, by and between Exchange Underwriters, Inc. and Richard B. and Wendy A. Boyer (9) |
| 10.14 | CB Financial Services, Inc., 2015 Equity Incentive Plan (10) |
| 10.15 | Agreement and Plan of Merger by and between CB Financial Services, Inc. and First West Virginia Bancorp, Inc. (11) |
| 21 | Subsidiaries |
| 23 | Consent of Baker Tilly Virchow Krause LLP |
| 63 |
| 31.1 | Certification required pursuant to Section 302 of the Sarbanes-Oxley Act of 2002 |
| 31.2 | Certification required pursuant to Section 302 of the Sarbanes-Oxley Act of 2002 |
| 32.1 | Certification of Chief Executive Officer and Chief Financial Officer pursuant to Section 906 of the Sarbanes-Oxley Act of 2002. |
| 101.0 | The following materials for the year ended December 31, 2017, formatted in XBRL (Extensible Business Reporting Language): (i) the Consolidated Statement of Financial Condition, (ii) the Consolidated Statement of Operations, (iii) the Consolidated Statement of Comprehensive Income, (iv) the Consolidated Statement of Changes in Stockholders’ Equity, (v) the Consolidated Statement of Cash Flows and (vi) the Notes to the Audited Consolidated Financial Statements. |
| (1) | Incorporated by reference to the Exhibits to the Company’s Registration Statement on Form S-4 filed with the Securities and Exchange Commission on June 13, 2014 (File No. 333-196749). |
| (2) | Incorporated by reference to Exhibit 10.1 to the Company’s Form 10-K for the year ended December 31, 2014, filed on March 26, 2015. |
| (3) | Incorporated by reference to Exhibit 10.2 to the Company’s Form 10-K for the year ended December 31, 2014, filed on March 26, 2015. |
| (4) | Incorporated by reference to Exhibit 10.3 to the Company’s Form 10-K for the year ended December 31, 2014, filed on March 26, 2015. |
| (5) | Incorporated by reference to Exhibit 10.4 to the Company’s Form 10-K for the year ended December 31, 2014, filed on March 26, 2015. |
| (6) | Incorporated herein by reference to Exhibit 10.11 to FedFirst Financial Corporation’s Registration Statement on Form SB-2, as amended (File No. 333-121405), initially filed on December 17, 2004. |
| (7) | Incorporated herein by reference to Exhibit 10.2 to FedFirst Financial Corporation’s Quarterly Report on Form 10-Q for the quarter ended March 31, 2008, filed on May 9, 2008. |
| (8) | Incorporated herein by reference to Exhibit 10.4 to FedFirst Financial Corporation’s Quarterly Report on Form 10-Q for the quarter ended March 31, 2008, filed on May 9, 2008. |
| (9) | Incorporated herein by reference to Exhibit 10.7 to FedFirst Financial Corporation’s Annual Report on Form 10-K for the fiscal year ended December 31, 2012, filed on March 15, 2013. |
| (10) | Incorporated herein by reference to Appendix A to the Company’s Definitive Proxy Statement, filed on April 16, 2015. |
| (11) | Incorporated herein by reference to the Company’s Current Report on Form 8-K, filed on November 16, 2017. |
| ITEM 16. | Form 10-K Summary |
Not applicable.
| 64 |
Pursuant to the requirements of Section 13 or 15(d) of the Securities Exchange Act of 1934, the Registrant has duly caused this report to be signed on its behalf by the undersigned, thereunto duly authorized.
| CB FINANCIAL SERVICES, INC. | |||
| Date: March 28, 2018 | By: | /s/ Barron P. McCune, Jr. | |
| Barron P. McCune, Jr. | |||
| Chief Executive Officer | |||
Pursuant to the requirements of the Securities Exchange of 1934, this report has been signed below by the following persons on behalf of the Registrant and in the capacities and on the dates indicated.
| By: | /s/Barron P. McCune, Jr | By: | /s/ Kevin D. Lemley | ||
| Barron P. McCune, Jr. | Kevin D. Lemley | ||||
| Chief Executive Officer and | Executive Vice President and Chief Financial Officer | ||||
| Vice Chairman | |||||
| Date: March 28, 2018 | Date: March 28, 2018 | ||||
| By: | /s/ Ralph J. Sommers, Jr. | By: | /s/ Karl G. Baily | ||
| Ralph J. Sommers, Jr. | Karl G. Baily | ||||
| Director (Chairman of the Board) | Director | ||||
| Date: March 28, 2018 | Date: March 28, 2018 | ||||
| By: | /s/ Richard B. Boyer | By: | /s/ Mark E. Fox | ||
| Richard B. Boyer | Mark E. Fox | ||||
| Director | Director | ||||
| Date: March 28, 2018 | Date: March 28, 2018 | ||||
| By: | /s/ William C. Groves | By: | /s/ Charles R. Guthrie | ||
| William C. Groves | Charles R. Guthrie, CPA | ||||
| Director | Director | ||||
| Date: March 28, 2018 | Date: March 28, 2018 | ||||
| By: | /s/ Joseph N. Headlee | By: | /s/ John J. LaCarte | ||
| Joseph N. Headlee | John J. LaCarte | ||||
| Director | Director | ||||
| Date: March 28, 2018 | Date: March 28, 2018 | ||||
| By: | /s/ Patrick G. O’Brien | By: | /s/ David F. Pollock | ||
| Patrick G. O'Brien | David F. Pollock | ||||
| Director | Director | ||||
| Date: March 28, 2018 | Date: March 28, 2018 | ||||
| By: | /s/ John M. Swiatek | ||||
| John M. Swiatek | |||||
| Director | |||||
| Date: March 28, 2018 | |||||
| 65 |
![]()
CONSOLIDATED FINANCIAL STATEMENTS
Contents
Page
| 66 |
Report of Independent Registered Public Accounting Firm
To the Stockholders and Board of Directors of CB Financial Services, Inc.:
Opinion on the Financial Statements
We have audited the accompanying consolidated statements of financial condition of CB Financial Services, Inc. and Subsidiary (the "Company") as of December 31, 2017 and 2016, the related consolidated statements of income, comprehensive income, changes in stockholders' equity, and cash flows, for each of the three years in the period ended December 31, 2017, and the related notes (collectively referred to as the "consolidated financial statements"). In our opinion, the consolidated financial statements present fairly, in all material respects, the financial position of the Company as of December 31, 2017 and 2016, and the results of its operations and its cash flows for each of the three years in the period ended December 31, 2017, in conformity with accounting principles generally accepted in the United States of America.
Basis for Opinion
These consolidated financial statements are the responsibility of the Company's management. Our responsibility is to express an opinion on the Company's consolidated financial statements based on our audits. We are a public accounting firm registered with the Public Company Accounting Oversight Board (United States) ("PCAOB") and are required to be independent with respect to the Company in accordance with the U.S. federal securities laws and the applicable rules and regulations of the Securities and Exchange Commission and the PCAOB.
We conducted our audits in accordance with the standards of the PCAOB. Those standards require that we plan and perform the audit to obtain reasonable assurance about whether the consolidated financial statements are free of material misstatement, whether due to error or fraud. The Company is not required to have, nor were we engaged to perform, an audit of its internal control over financial reporting. As part of our audits we are required to obtain an understanding of internal control over financial reporting but not for the purpose of expressing an opinion on the effectiveness of the Company's internal control over financial reporting. Accordingly, we express no such opinion.
Our audits included performing procedures to assess the risks of material misstatement of the consolidated financial statements, whether due to error or fraud, and performing procedures that respond to those risks. Such procedures included examining, on a test basis, evidence regarding the amounts and disclosures in the consolidated financial statements. Our audits also included evaluating the accounting principles used and significant estimates made by management, as well as evaluating the overall presentation of the consolidated financial statements. We believe that our audits provide a reasonable basis for our opinion.
/s/ Baker Tilly Virchow Krause, LLP
Pittsburgh, Pennsylvania
We have served as the Company's auditor since 2006.
March 28, 2018
| 67 |
![]()
Consolidated Statement of Financial Condition
(Dollars in thousands, except per share and share data)
| December 31, | ||||||||
| 2017 | 2016 | |||||||
| ASSETS | ||||||||
| Cash and Due From Banks: | ||||||||
| Interest Bearing | $ | 11,685 | $ | 7,699 | ||||
| Non-Interest Bearing | 8,937 | 6,583 | ||||||
| Total Cash and Due From Banks | 20,622 | 14,282 | ||||||
| Investment Securities Available-for-Sale | 123,583 | 106,208 | ||||||
| Loans, Net | 735,596 | 674,094 | ||||||
| Premises and Equipment, Net | 16,712 | 14,132 | ||||||
| Bank-Owned Life Insurance | 19,151 | 18,687 | ||||||
| Goodwill | 4,953 | 4,953 | ||||||
| Core Deposit Intangible | 3,284 | 3,819 | ||||||
| Accrued Interest and Other Assets | 10,585 | 9,900 | ||||||
| TOTAL ASSETS | $ | 934,486 | $ | 846,075 | ||||
| LIABILITIES | ||||||||
| Deposits: | ||||||||
| Demand Deposits | $ | 188,499 | $ | 165,400 | ||||
| NOW Accounts | 145,183 | 105,962 | ||||||
| Money Market Accounts | 136,914 | 141,674 | ||||||
| Savings Accounts | 132,359 | 121,520 | ||||||
| Time Deposits | 164,301 | 155,028 | ||||||
| Brokered Deposits | 6,088 | 8,634 | ||||||
| Total Deposits | 773,344 | 698,218 | ||||||
| Short-Term Borrowings | 39,605 | 27,027 | ||||||
| Other Borrowed Funds | 24,500 | 28,000 | ||||||
| Accrued Interest and Other Liabilities | 3,781 | 3,361 | ||||||
| TOTAL LIABILITIES | 841,230 | 756,606 | ||||||
| STOCKHOLDERS' EQUITY | ||||||||
| Preferred Stock, No Par Value; 5,000,000 Shares Authorized | - | - | ||||||
| Common Stock, $0.4167 Par Value; 35,000,000 Shares Authorized, 4,363,346 Shares Issued and 4,095,957 and 4,086,625 Shares Outstanding at December 31, 2017 and December 31, 2016, Respectively | 1,818 | 1,818 | ||||||
| Capital Surplus | 42,089 | 41,863 | ||||||
| Retained Earnings | 55,280 | 51,713 | ||||||
| Treasury Stock, at Cost (267,389 Shares at December 31, 2017 and 276,721 Shares at December 31, 2016) | (4,590 | ) | (4,746 | ) | ||||
| Accumulated Other Comprehensive Loss | (1,341 | ) | (1,179 | ) | ||||
| TOTAL STOCKHOLDERS' EQUITY | 93,256 | 89,469 | ||||||
| TOTAL LIABILITIES AND STOCKHOLDERS' EQUITY | $ | 934,486 | $ | 846,075 | ||||
| 68 |
![]()
Consolidated Statement of Income
(Dollars in thousands, except per share and share data)
| Years Ended December 31, | ||||||||||||
| 2017 | 2016 | 2015 | ||||||||||
| INTEREST AND DIVIDEND INCOME | ||||||||||||
| Loans, Including Fees | $ | 29,527 | $ | 29,576 | $ | 29,562 | ||||||
| Federal Funds Sold | 199 | 24 | 12 | |||||||||
| Investment Securities: | ||||||||||||
| Taxable | 1,531 | 1,238 | 959 | |||||||||
| Exempt From Federal Income Tax | 892 | 1,014 | 1,115 | |||||||||
| Other Interest and Dividend Income | 285 | 166 | 269 | |||||||||
| TOTAL INTEREST AND DIVIDEND INCOME | 32,434 | 32,018 | 31,917 | |||||||||
| INTEREST EXPENSE | ||||||||||||
| Deposits | 2,811 | 2,284 | 2,343 | |||||||||
| Federal Funds Purchased | - | 2 | 2 | |||||||||
| Short-Term Borrowings | 82 | 73 | 83 | |||||||||
| Other Borrowed Funds | 481 | 511 | 287 | |||||||||
| TOTAL INTEREST EXPENSE | 3,374 | 2,870 | 2,715 | |||||||||
| NET INTEREST INCOME | 29,060 | 29,148 | 29,202 | |||||||||
| Provision For Loan Losses | 1,870 | 2,040 | 2,005 | |||||||||
| NET INTEREST INCOME AFTER PROVISION FOR LOAN LOSSES | 27,190 | 27,108 | 27,197 | |||||||||
| NONINTEREST INCOME | ||||||||||||
| Service Fees on Deposit Accounts | 2,482 | 2,414 | 2,586 | |||||||||
| Insurance Commissions | 3,583 | 3,097 | 3,536 | |||||||||
| Other Commissions | 452 | 448 | 514 | |||||||||
| Net Gains on Sale of Loans | 458 | 659 | 358 | |||||||||
| Net Gains on Sale of Investments | 199 | 168 | - | |||||||||
| Net Gains on Purchased Tax Credits | 57 | - | - | |||||||||
| Income from Bank-Owned Life Insurance | 464 | 478 | 474 | |||||||||
| Other | 105 | 98 | 127 | |||||||||
| TOTAL NONINTEREST INCOME | 7,800 | 7,362 | 7,595 | |||||||||
| NONINTEREST EXPENSE | ||||||||||||
| Salaries and Employee Benefits | 13,937 | 13,124 | 12,493 | |||||||||
| Occupancy | 2,154 | 1,994 | 1,777 | |||||||||
| Equipment | 1,919 | 1,739 | 1,645 | |||||||||
| FDIC Assessment | 373 | 388 | 463 | |||||||||
| PA Shares Tax | 749 | 720 | 679 | |||||||||
| Contracted Services | 537 | 619 | 639 | |||||||||
| Legal Fees | 436 | 505 | 495 | |||||||||
| Advertising | 694 | 719 | 830 | |||||||||
| Bankcard Processing Expense | 519 | 476 | 456 | |||||||||
| Other Real Estate Owned (Income) | (349 | ) | (393 | ) | (196 | ) | ||||||
| Amortization of Core Deposit Intangible | 535 | 535 | 535 | |||||||||
| Merger-Related | 356 | - | - | |||||||||
| Other | 3,312 | 3,352 | 3,113 | |||||||||
| TOTAL NONINTEREST EXPENSE | 25,172 | 23,778 | 22,929 | |||||||||
| Income Before Income Taxes | 9,818 | 10,692 | 11,863 | |||||||||
| Income Taxes | 2,874 | 3,112 | 3,443 | |||||||||
| NET INCOME | $ | 6,944 | $ | 7,580 | $ | 8,420 | ||||||
| EARNINGS PER SHARE | ||||||||||||
| Basic | $ | 1.70 | $ | 1.86 | $ | 2.07 | ||||||
| Diluted | 1.69 | 1.86 | 2.07 | |||||||||
| WEIGHTED AVERAGE SHARES OUTSTANDING | ||||||||||||
| Basic | 4,088,191 | 4,081,247 | 4,071,855 | |||||||||
| Diluted | 4,110,372 | 4,086,190 | 4,071,855 | |||||||||
| 69 |
![]()
Consolidated Statement of Comprehensive Income
(Dollars in thousands)
| Years Ended December 31, | ||||||||||||
| 2017 | 2016 | 2015 | ||||||||||
| Net Income | $ | 6,944 | $ | 7,580 | $ | 8,420 | ||||||
| Other Comprehensive Income (Loss): | ||||||||||||
| Unrealized Gains (Losses) on Available-for-Sale Securities Net of Income Tax (Benefit) of $98, ($846), and $5 for the Years Ended December 31, 2017, 2016, and 2015, Respectively | 189 | (1,643 | ) | 10 | ||||||||
| Reclassification Adjustment for Gains on Securities Included in Net Income, Net of Income Tax of $68 and $57 for the Years Ended December 31, 2017 and 2016, Respectively (1) | (131 | ) | (111 | ) | - | |||||||
| Other Comprehensive Income (Loss), Net of Income Tax (Benefit) | 58 | (1,754 | ) | 10 | ||||||||
| Total Comprehensive Income | $ | 7,002 | $ | 5,826 | $ | 8,430 | ||||||
| (1) | The gross amount of gains on securities of $199 and $168 for the years ended December 31, 2017 and 2016, respectively, are reported as Net Gains on Sales of Investments on the Consolidated Statement of Income. The income tax effect of $68 and $57 for the years ended December 31, 2017 and 2016, respectively, are included in Income Taxes on the Consolidated Statement of Income. |
| 70 |
![]()
Consolidated Statement of Changes in Stockholders’ Equity
(Dollars in thousands, except per share and share data)
| Shares Issued | Common Stock | Capital Surplus | Retained Earnings | Treasury Stock | Accumulated Other Comprehensive Income (Loss) | Total | ||||||||||||||||||||||
| December 31, 2014 | 4,363,346 | $ | 1,818 | $ | 41,762 | $ | 42,766 | $ | (4,999 | ) | $ | 565 | $ | 81,912 | ||||||||||||||
| Net Income | - | - | - | 8,420 | - | - | 8,420 | |||||||||||||||||||||
| Other Comprehensive Income | - | - | - | - | - | 10 | 10 | |||||||||||||||||||||
| Restricted Stock Awards Granted | - | - | (163 | ) | - | 163 | - | - | ||||||||||||||||||||
| Stock-Based Compensation Expense | - | - | 15 | - | - | - | 15 | |||||||||||||||||||||
| Dividends Declared ($0.85 per share) | - | - | - | (3,461 | ) | - | - | (3,461 | ) | |||||||||||||||||||
| Treasury Stock Purchased, at Cost | - | - | - | - | - | - | - | |||||||||||||||||||||
| December 31, 2015 | 4,363,346 | 1,818 | 41,614 | 47,725 | (4,836 | ) | 575 | 86,896 | ||||||||||||||||||||
| Net Income | - | - | - | 7,580 | - | - | 7,580 | |||||||||||||||||||||
| Other Comprehensive Loss | - | - | - | - | - | (1,754 | ) | (1,754 | ) | |||||||||||||||||||
| Restricted Stock Awards Granted | - | - | (104 | ) | - | 104 | - | - | ||||||||||||||||||||
| Stock-Based Compensation Expense | - | - | 353 | - | - | - | 353 | |||||||||||||||||||||
| Dividends Declared ($0.88 per share) | - | - | - | (3,592 | ) | - | - | (3,592 | ) | |||||||||||||||||||
| Treasury Stock Purchased, at Cost (478 shares) | - | - | - | - | (14 | ) | - | (14 | ) | |||||||||||||||||||
| December 31, 2016 | 4,363,346 | 1,818 | 41,863 | 51,713 | (4,746 | ) | (1,179 | ) | 89,469 | |||||||||||||||||||
| Net Income | - | - | - | 6,944 | - | - | 6,944 | |||||||||||||||||||||
| Other Comprehensive Loss | - | - | - | - | - | 58 | 58 | |||||||||||||||||||||
| Reclassification of the stranded tax effect related to deferred taxes for available-for-sale securities (1) | - | - | - | 220 | - | (220 | ) | - | ||||||||||||||||||||
| Restricted Stock Awards Granted | - | - | (142 | ) | - | 142 | - | - | ||||||||||||||||||||
| Stock-Based Compensation Expense | - | - | 361 | - | - | - | 361 | |||||||||||||||||||||
| Exercise of Stock Options | - | - | 7 | - | 24 | - | 31 | |||||||||||||||||||||
| Dividends Declared ($0.88 per share) | - | - | - | (3,597 | ) | - | - | (3,597 | ) | |||||||||||||||||||
| Treasury Stock Purchased, at Cost (318 shares) | - | - | - | - | (10 | ) | - | (10 | ) | |||||||||||||||||||
| December 31, 2017 | 4,363,346 | $ | 1,818 | $ | 42,089 | $ | 55,280 | $ | (4,590 | ) | $ | (1,341 | ) | $ | 93,256 | |||||||||||||
| (1) | This reclassification is the result of the Company’s early adopting of FASB ASU 2018-02 Income Statement – Reporting Comprehensive Income (Topic 220). See Note 1 for additional information. |
| 71 |
![]()
Consolidated Statement of Cash Flows
(Dollars in thousands)
| Years Ended December 31, | ||||||||||||
| 2017 | 2016 | 2015 | ||||||||||
| OPERATING ACTIVITIES | ||||||||||||
| Net Income | $ | 6,944 | $ | 7,580 | $ | 8,420 | ||||||
| Αdjustmеnts to Rеconcilе Net Income to Net Cash Provided By Operating Activities: | ||||||||||||
| Net Amortization on Investments | 375 | 232 | 677 | |||||||||
| Depreciation and Amortization | 2,499 | 3,092 | 2,572 | |||||||||
| Provision for Loan Losses | 1,870 | 2,040 | 2,005 | |||||||||
| Income from Bank-Owned Life Insurance | (464 | ) | (478 | ) | (474 | ) | ||||||
| Proceeds From Mortgage Loans Sold | 20,252 | 22,838 | 58,607 | |||||||||
| Originations of Mortgage Loans for Sale | (19,794 | ) | (22,179 | ) | (20,123 | ) | ||||||
| Gains on Sales of Loans | (458 | ) | (659 | ) | (358 | ) | ||||||
| Gains on Sales of Investment Securities | (199 | ) | (168 | ) | - | |||||||
| (Gains) Losses on Sales of Other Real Estate Owned and Repossessed Assets | (379 | ) | 9 | (285 | ) | |||||||
| Noncash Expense for Stock-Based Compensation | 361 | 353 | 15 | |||||||||
| (Increase) Decrease in Accrued Interest Receivable | (266 | ) | (21 | ) | 116 | |||||||
| Valuation Adjustment on Foreclosed Real Estate | - | (566 | ) | - | ||||||||
| Retirements of Premises and Equipment | 152 | - | - | |||||||||
| (Decrease) Increase in Deferred Income Tax | (263 | ) | (67 | ) | (19 | ) | ||||||
| (Decrease) Increase in Taxes Payable | (345 | ) | (283 | ) | 3,071 | |||||||
| Increase (Decrease) in Accrued Interest Payable | 96 | 29 | (43 | ) | ||||||||
| Other, Net | 1,222 | (1,181 | ) | (2,618 | ) | |||||||
| NET CASH PROVIDED BY OPERATING ACTIVITIES | 11,603 | 10,571 | 51,563 | |||||||||
| INVESTING ACTIVITIES | ||||||||||||
| Investment Securities Available for Sale: | ||||||||||||
| Proceeds From Principal Repayments and Maturities | 14,363 | 63,958 | 37,204 | |||||||||
| Purchases of Securities | (44,664 | ) | (77,868 | ) | (28,276 | ) | ||||||
| Proceeds from Sales of Securities | 12,838 | 844 | - | |||||||||
| Investment Securities Held-to-Maturity: | ||||||||||||
| Proceeds From Principal Repayments and Maturities | - | - | 500 | |||||||||
| Net Increase in Loans | (64,522 | ) | (3,943 | ) | (38,165 | ) | ||||||
| Purchase of Premises and Equipment | (3,845 | ) | (2,541 | ) | (604 | ) | ||||||
| Proceeds From Sales of Other Real Estate Owned and Repossessed Assets | 615 | 1,869 | 830 | |||||||||
| Decrease (Increase) in Restricted Equity Securities | (676 | ) | 160 | (435 | ) | |||||||
| NET CASH USED IN INVESTING ACTIVITIES | (85,891 | ) | (17,521 | ) | (28,946 | ) | ||||||
| FINANCING ACTIVITIES | ||||||||||||
| Net Increase (Decrease) in Deposits | 75,126 | 18,919 | (18,195 | ) | ||||||||
| Net Increase (Decrease) in Short-Term Borrowings | 12,578 | (5,421 | ) | (14,236 | ) | |||||||
| Principal Payments on Other Borrowed Funds | (3,500 | ) | - | (15,136 | ) | |||||||
| Proceeds from Long-Term Borrowings | - | - | 28,000 | |||||||||
| Cash Dividends Paid | (3,597 | ) | (3,592 | ) | (3,461 | ) | ||||||
| Treasury Stock, Purchases at Cost | (10 | ) | (14 | ) | - | |||||||
| Exercise of Stock Options | 31 | - | - | |||||||||
| NET CASH PROVIDED BY (USED IN) FINANCING ACTIVITIES | 80,628 | 9,892 | (23,028 | ) | ||||||||
| INCREASE (DECREASE) IN CASH AND CASH EQUIVALENTS | 6,340 | 2,942 | (411 | ) | ||||||||
| CASH AND DUE FROM BANKS AT BEGINNING OF YEAR | 14,282 | 11,340 | 11,751 | |||||||||
| CASH AND DUE FROM BANKS AT END OF YEAR | $ | 20,622 | $ | 14,282 | $ | 11,340 | ||||||
| SUPPLEMENTAL CASH FLOW INFORMATION: | ||||||||||||
| Cash paid for: | ||||||||||||
| Interest on deposits and borrowings (including interest credited to deposit accounts of $2,713, $2,253 and $2,357 respectively) | 3,278 | 2,841 | 2,759 | |||||||||
| Income taxes | 3,250 | 2,720 | 2,268 | |||||||||
| Real estate acquired in settlement of loans | 321 | 3,236 | 542 | |||||||||
| Transfer of real estate acquired in settlement of loans to premise and equipment | - | 2,350 | - | |||||||||
| 72 |
CB FINANCIAL SERVICES, INC
NOTES TO CONSOLIDATED FINANCIAL STATEMENTS
NOTE 1—SUMMARY OF SIGNIFICANT ACCOUNTING POLICIES
Principles of Consolidation and Basis of Presentation
The accompanying consolidated financial statements include the accounts of CB Financial Services, Inc., and its wholly owned subsidiary, Community Bank (the “Bank”), and the Bank’s wholly owned subsidiary, Exchange Underwriters, Inc. (“Exchange Underwriters”). CB Financial Services, Inc., and Community Bank are collectively referred to as the “Company.” All intercompany transactions and balances have been eliminated in consolidation.
Nature of Operations
The Company derives substantially all its income from banking and bank-related services, which include interest earnings on commercial, commercial mortgage, residential real estate and consumer loan financing, as well as interest earnings on investment securities and fees generated from deposit services to its customers. The Company provides banking services primarily to communities in Greene, Allegheny, Washington, Fayette and Westmoreland Counties located in southwestern Pennsylvania. The Company also conducts insurance brokerage activities through Exchange Underwriters.
The Company has evaluated events and transactions occurring subsequent to the balance sheet date of December 31, 2017 through the date the consolidated financial statements are being issued for items that should potentially be recognized or disclosed in these consolidated financial statements.
Use of Estimates
The financial statements have been prepared in conformity with accounting principles generally accepted in the United States of America (“U.S. GAAP”) and with general practice within the banking industry. In preparing the financial statements, management is required to make estimates and assumptions that affect the reported amounts of assets and liabilities as of the date of the Consolidated Statement of Financial Condition, and revenues and expenses for the period. Actual results could differ significantly from those estimates. Material estimates that are particularly susceptible to significant change in the near term relate to fair value of investment securities available for sale, determination of the allowance for losses on loans, the valuation of real estate acquired in connection with foreclosures or in satisfaction of loans, other-than-temporary impairment evaluations of securities, the valuation of deferred tax assets and the valuation of goodwill impairment.
Revenue Recognition
Income on loans and investments is recognized as earned on the accrual method. Service charges and fees on deposit accounts are recognized at the time the customer account is charged. Gains and losses on sales of mortgages are based on the difference between the selling price and the carrying value of the related mortgage sold.
Exchange Underwriters records insurance commissions based on the method in which the policy is billed. For policies that Exchange Underwriters directly bills to policyholders, known as “agency billing,” income is recorded when billed. For policies a third-party insurance company directly bills to policyholders on behalf of Exchange Underwriters, known as “direct billing,” income is recorded as payments are received. Commissions are recorded net of cancellations.
Operating Segments
The Company evaluated the provisions of ASC Topic 280, Segment Reporting, and determined that segment reporting information related to Exchange Underwriters was not required to be presented because the segment comprises less than 10% of total interest and noninterest income, and less than 10% of the combined assets of the Company.
An operating segment is defined as a component of an enterprise that engages in business activities which generate revenue and incur expense, and the operating results of which are reviewed by management. The Company’s business activities are currently confined to one operating segment, which is community banking.
Cash and Due From Banks
Included in Cash and Due From Banks are required federal reserves of $3.3 million and $3.4 million at December 31, 2017 and 2016, respectively, for facilitating the implementation of monetary policy by the Federal Reserve System. The required reserves are computed by applying prescribed ratios to the classes of average deposit balances. These are held in the form of cash on hand and/or balances maintained directly with the Federal Reserve Bank.
| 73 |
Investment Securities
Investment securities are classified at the time of purchase, based on management’s intentions and ability, as securities held to maturity or securities available-for-sale. Debt securities acquired with the intent and the ability to hold to maturity are stated at cost adjusted for amortization of premium and accretion of discount, which are computed using a level yield method and recognized as adjustments to interest income. Unrealized holding gains and losses for available-for-sale securities are reported as a separate component of stockholders’ equity, net of tax, until realized. Realized securities gains and losses, if any, are computed using the specific identification method. Declines in the fair value of individual securities below amortized cost that are other than temporary will result in write-downs of the individual securities to their fair value. Any related write-downs will be included in earnings as realized losses. Interest and dividends on investment securities are recognized as income when earned.
Common stock of the Federal Home Loan Bank (“FHLB”) and of Atlantic Community Bankers’ Bank (“ACBB”) represent ownership in organizations that are wholly owned by other financial institutions. These restricted equity securities are accounted for based on industry guidance in ASC Sub-Topic 325-20, which requires the investment to be carried at cost and evaluated for impairment based on the ultimate recoverability of the par value. Included in accrued interest and other assets are FHLB stock of $4.3 million and $3.6 million at December 31, 2017 and 2016, respectively, and ACBB stock of $85,000 at December 31, 2017 and 2016.
The Company periodically evaluates its FHLB investment for possible impairment based on, among other things, the capital adequacy of the FHLB and its overall financial condition. The Company believes its holdings in the stock are ultimately recoverable at par value at December 31, 2017, and, therefore, determined that FHLB stock was not impaired. In addition, the Company has ample liquidity and does not require redemption of its FHLB stock in the foreseeable future.
Loans Receivable and Allowance for Loan Losses
Loans receivable that management has the intent and ability to hold for the foreseeable future or until maturity or payoff are stated at the principal amount outstanding net of deferred loan fees and the allowance for loan losses. The Company’s loan portfolio is segmented to enable management to monitor risk and performance. The real estate loans are further segregated into three classes. Residential mortgages include those secured by residential properties and include home equity loans, while commercial mortgages consist of loans to commercial borrowers secured by commercial real estate. Construction loans typically consist of loans to build commercial buildings and acquire and develop residential real estate. The commercial and industrial segment consists of loans to finance the activities of commercial customers. The consumer segment consists primarily of indirect auto loans as well as personal installment loans and personal or overdraft lines of credit.
Residential mortgage and construction loans are typically longer-term loans and, therefore, generally present greater interest rate risk than the consumer and commercial loans. Under certain economic conditions, housing values may decline, which may increase the risk that the collateral values are not sufficient. Commercial real estate loans generally present a higher level of risk than loans secured by residences. This greater risk is due to several factors, including the concentration of principal in a limited number of loans and borrowers, the effect of general economic conditions on income-producing properties, and the increased difficulty in evaluating and monitoring these types of loans. Furthermore, the repayment of commercial real estate loans is typically dependent upon the successful operation of the related real estate project. If the cash flow from the project is reduced (for example, if leases are not obtained or renewed, a bankruptcy court modifies a lease term, or a major tenant is unable to fulfill its lease obligations), the borrower’s ability to repay the loan may be impaired. Commercial and industrial loans are generally secured by business assets, inventories, accounts receivable, etc., which present collateral risk. Consumer loans generally have higher interest rates and shorter terms than residential mortgage loans; however, they have additional credit risk due to the type of collateral securing the loan.
Accrual of interest on loans is generally discontinued when it is determined that a reasonable doubt exists as to the collectability of principal, interest, or both. Payments received on nonaccrual loans are recorded as income or applied against principal according to management’s judgment as to the collectability of such principal. Loans are returned to accrual status when all the principal and interest amounts contractually due are brought, and current and future payments are reasonably assured.
The Company uses an eight point internal risk rating system to monitor the credit quality of the overall loan portfolio. The first four categories are not considered criticized and are aggregated as “pass” rated. The criticized rating categories used by management generally follow bank regulatory definitions. The special mention category includes assets that are currently protected but are below average quality, resulting in an undue credit risk, but not to the point of justifying a substandard classification. Loans in the substandard category have well-defined weaknesses that jeopardize the liquidation of the debt, and have a distinct possibility that some loss will be sustained if the weaknesses are not corrected. Loans classified as doubtful have all the weaknesses inherent in loans classified as substandard with the added characteristic that collection or liquidation in full, on the basis of current conditions and facts, is highly improbable. Loans classified as loss are considered uncollectable and of such little value that continuance as an asset is not warranted.
| 74 |
In the normal course of business, the Company modifies loan terms for various reasons. These reasons may include a retention strategy to compete in the current interest rate environment, and to re-amortize or extend a loan term to better match the loan’s payment stream with the borrower’s cash flows. A modified loan is considered to be a troubled debt restructuring (“TDR”) when the Company has determined that the borrower is experiencing financial difficulties and the Company grants a concession to the borrower. The Company evaluates the probability that the borrower will be in payment default on any of its debt in the foreseeable future without modification. To make this determination a credit review is performed to assess the ability of the borrower to meet their obligations.
When the Company restructures a loan for a troubled borrower, the loan terms (i.e., interest rate, payment, amortization period and/or maturity date) are modified in such a way to enable the borrower to cover the modified debt service payments based on current financials and cash flow adequacy. If the hardship is thought to be temporary, then modified terms are offered only for that time period. Where possible, the Company obtains additional collateral and/or secondary payment sources at the time of the restructure. To date, the Company has not forgiven any principal as a restructuring concession. The Company will not offer modified terms if it believes that modifying the loan terms will only delay an inevitable permanent default.
All loans designated as TDRs are considered impaired loans and may be in either accruing or non-accruing status. The Company’s policy for recognizing interest income on TDRs does not differ from its overall policy for interest recognition. TDRs are considered to be in payment default if, subsequent to modification, the loans are transferred to non-accrual status. A loan may be removed from nonaccrual TDR status if it has performed according to its modified terms for at least six consecutive months.
The performance and credit quality of the loan portfolio are also monitored by analyzing the age of the loans receivable as determined by the length of time a recorded payment is past due. The past due status of all classes of loans receivable is determined based on contractual due dates for loan payments.
Loan origination and commitment fees as well as certain direct loan origination costs are being deferred and the net amount amortized as an adjustment to the related loan’s yield. These amounts are being amortized over the contractual lives of the related loans.
The allowance for loan losses is maintained at a level considered adequate to provide for losses that can be reasonably anticipated. Management performs a quarterly evaluation of the adequacy of the allowance based on potential losses in the current loan portfolio, which includes an assessment of economic conditions, changes in the nature and volume of the loan portfolio, loan loss experience, volume and severity of past due, classified and nonaccrual loans as well as other loan modifications, quality of the Company’s loan review system, the degree of oversight by the Company’s board of directors, existence and effect of any concentrations of credit and changes in the level of such concentrations, effect of external factors, such as competition and legal and regulatory requirements, and other relevant factors. While management uses the best information available to make such evaluations, future adjustments to the allowance may be necessary if economic conditions differ substantially from the assumptions used in making evaluations. Additions are made to the allowance through periodic provisions charged to income and recovery of principal and interest on loans previously charged-off. Losses of principal are charged directly to the allowance when a loss actually occurs or when a determination is made that the specific loss is probable. This evaluation is inherently subjective as it requires estimates that are susceptible to significant revisions as more information becomes available.
The allowance consists of specific, general and unallocated components. The specific component relates to loans that are classified as impaired. A loan is considered to be impaired when, based upon current information and events, it is probable that the Company will be unable to collect all amounts due for principal and interest according to the original contractual terms of the loan agreement. Management determines the significance of payment delays and payment shortfalls on a case-by-case basis, taking into consideration all of the circumstances surrounding the loan and the borrower, including the length of the delay, the reasons for the delay, the borrower’s prior payment record, and the amount of the shortfall in relation to the principal and interest owed. Impairment is measured based on the present value of expected future cash flows discounted at a loan’s effective interest rate, or as a practical expedient, the observable market price, or, if the loan is collateral dependent, the fair value of the underlying collateral. When the measurement of an impaired loan is less than the recorded investment in the loan, the impairment is recorded in a specific valuation allowance through a charge to the provision for loan losses.
This specific valuation allowance is periodically adjusted for significant changes in the amount or timing of expected future cash flows, observable market price or fair value of the collateral. The specific valuation allowance, or allowance for impaired loans, is part of the total allowance for loan losses. Cash payments received on impaired loans that are considered non-accrual are recorded as a direct reduction of the recorded investment in the loan. When the recorded investment has been fully collected, receipts are recorded as recoveries to the allowance for loan losses until the previously charged-off principal is fully recovered. Subsequent amounts collected are recognized as interest income. If no charge-off exists, then once the recorded investment has been fully collected, any future amounts collected would be recognized as interest income. Impaired loans are not returned to accrual status until all amounts due, both principal and interest, are current and a sustained payment history has been demonstrated.
| 75 |
The general component covers pools of loans by loan class, including commercial loans not considered impaired, as well as smaller balance homogeneous loans, such as residential real estate and consumer loans. Management determines historical loss experience for each segment of loans using the two-year rolling average of the net charge-off data within each segment. Qualitative and environmental factors are also considered that are likely to cause estimated credit losses associated with the Bank’s existing portfolio to differ from historical loss experience, and include levels and trends in delinquency and impaired loans; levels and trends in net charge-offs, trends in volume and terms of loans; change in underwriting, policies, procedures, practices and key personnel; national and local economic trends; industry conditions, and effects of changes in high-risk credit circumstances. The qualitative and environmental factors are reviewed on a quarterly basis to ensure they are reflective of current conditions in the portfolio and economy. An unallocated component is maintained to cover uncertainties that could affect the Company’s estimate of probable losses.
Loans that were acquired in the merger with FedFirst Financial Corporation were recorded at fair value with no carryover of the related allowance for credit losses. The fair value of the acquired loans was estimated by management with the assistance of a third-party valuation specialist.
The excess of cash flows expected at acquisition over the estimated fair value is referred to as the accretable discount and is recognized into interest income over the remaining life of the loan. The difference between contractually required payments at acquisition and the cash flows expected to be collected at acquisition is referred to as the nonaccretable discount. The nonaccretable discount represents estimated future credit losses expected to be incurred over the life of the loan. Subsequent decreases to the expected cash flows require an evaluation to determine the need for an allowance for loan losses. Subsequent improvements in expected cash flows result in the reversal of a corresponding amount of the nonaccretable discount, which is then reclassified as accretable discount that is recognized into interest income over the remaining life of the loan using the interest method. The evaluation of the amount of future cash flows that is expected to be collected is performed in a similar manner as that used to determine our allowance for credit losses. Charge-offs of the principal amount on acquired loans would be first applied to the nonaccretable discount portion of the fair value adjustment.
Generally, management considers all nonaccrual loans and certain renegotiated debt, when it exists, for impairment. The maximum period without payment that typically can occur before a loan is considered for impairment is 90 days. The past due status of loans receivable is determined based on contractual due dates for loan payments.
The Company grants commercial, residential, and other consumer loans to customers throughout Greene, Washington, Allegheny, Fayette and Westmoreland Counties in Pennsylvania. Although the Company has a diversified loan portfolio at December 31, 2017 and 2016, a substantial portion of its debtors’ ability to honor their contracts is determined by the economic environment of these counties.
Premises and Equipment
Premises and equipment are stated at cost, less accumulated depreciation. Depreciation is principally computed on the straight-line method over the estimated useful lives of the related assets, which range from three to seven years for furniture, fixtures and equipment, and 27.5 to 40 years for building premises. Leasehold improvements are amortized over the shorter of their estimated useful lives or their respective lease terms, which range from seven to fifteen years. Expenditures for maintenance and repairs are charged to expense when incurred while costs of major additions and improvements are capitalized.
Bank-Owned Life Insurance
The Company is the owner and beneficiary of bank-owned life insurance (“BOLI”) policies on certain employees. The earnings from the BOLI policies are recognized as a component of noninterest income. The BOLI policies are an asset that can be liquidated, if necessary, with associated tax costs. However, the Company intends to hold these policies and, accordingly, the Company has not provided for deferred income taxes on the earnings from the increase in cash surrender value.
Real Estate Owned
Real estate owned acquired in settlement of foreclosed loans is carried as a component of other assets at the lower of cost or fair value minus estimated cost to sell. Prior to foreclosure, the estimated collectible value of the collateral is evaluated to determine if a partial charge-off of the loan balance is necessary. After transfer to real estate owned, any subsequent write-downs are charged against noninterest expense. Direct costs incurred in the foreclosure process and subsequent holding costs incurred on such properties are recorded as expenses of current operations. Real estate owned was $326,000 and $174,000 at December 31, 2017 and 2016, respectively. Of these amounts, $168,000 represent residential loans at December 31, 2017. Residential loans in process of foreclosure were $1.5 and $2.2 million at December 31, 2017 and 2016, respectively.
| 76 |
Income Taxes
The Company accounts for income taxes in accordance with income tax accounting guidance in ASC Topic 740, Income Taxes. The income tax accounting guidance results in two components of income tax expense: current and deferred. Current income tax expense reflects taxes to be paid or refunded for the current period by applying the provisions of the enacted tax law to the taxable income or excess of deductions over revenues. The Company determines deferred income taxes using the balance sheet method. Under this method, the net deferred tax asset or liability is based on the tax effects of the differences between book and tax basis of assets and liabilities, and enacted changes in tax rates and laws are recognized in the period in which they occur.
Deferred income tax expense results from changes in deferred tax assets and liabilities between periods. Deferred tax assets are recognized if it is more likely than not, based on the technical merits, that the tax position will be realized or sustained upon examination, the term more likely than not means a likelihood of more than 50%; the terms examined and upon examination also include resolution of the related appeals or litigation processes, if any. A tax position that meets the more-likely-than-not recognition threshold is initially and subsequently measured as the largest amount of tax benefit that has a greater than 50% likelihood of being realized upon settlement with a taxing authority that has full knowledge of all relevant information. The determination of whether or not a tax position has met the more-likely-than-not recognition threshold considers the facts, circumstances and information available at the reporting date, and is subject to management’s judgment. Deferred tax assets are reduced by a valuation allowance if, based on the weight of evidence available, it is more likely than not that some portion of all of a deferred tax asset will not be realized.
The Company recognizes interest and penalties on income taxes as a component of income tax expense.
Goodwill and Intangible Assets
Goodwill represents the excess of the cost of an acquisition over the fair value of the net assets acquired. Other intangible assets represent purchased assets that lack physical substance but can be distinguished from goodwill because of contractual or other legal rights. Intangible assets that have finite lives, such as core deposit intangibles, customer relationship intangibles and renewal lists, are amortized over their estimated useful lives and subject to periodic impairment testing. Core deposit intangibles are primarily amortized over ten years using accelerated methods. Customer renewal lists are amortized over their estimated useful lives which range from eight to thirteen years.
Goodwill and other intangibles are subject to impairment testing at the reporting unit level, which must be conducted at least annually. We perform impairment testing during the fourth quarter of each year, or more frequently if impairment indicators exist. We also continue to monitor other intangibles for impairment and to evaluate carrying amounts, as necessary.
Determining the fair value of a reporting unit under the goodwill impairment test is judgmental and often involves the use of significant estimates and assumptions. Similarly, estimates and assumptions are used in determining the fair value of other intangible assets. Estimates of fair value are primarily determined using discounted cash flows, market comparisons and recent transactions. These approaches use significant estimates and assumptions including projected future cash flows, discount rates reflecting the market rate of return, projected growth rates and determination and evaluation of appropriate market comparables. However, future events could cause us to conclude that goodwill or other intangibles have become impaired, which would result in recording an impairment loss. Any resulting impairment loss could have a material adverse impact on our financial condition and results of operations.
Based on the fair value of the reporting unit that has goodwill, no impairment of goodwill was recognized in 2017, 2016 and 2015.
Mortgage Service Rights (“MSRs”)
The Company has agreements for the express purpose of selling loans in the secondary market. The Company maintains all servicing rights for these loans. Originated MSRs are recorded by allocating total costs incurred between the loan and servicing rights based on their relative fair values. MSRs are amortized in proportion to sold mortgages that are serviced and are included in other assets on the accompanying Consolidated Statement of Financial Condition. Servicing fee income is recorded for fees earned for servicing loans. The fees are based on contractual percentage of the outstanding principal or a fixed amount per loan and are recorded as income when earned. The amortization of MSRs is netted against loan servicing fee income. The carrying and fair values of the MSRs and related amortization are not significant for financial reporting purposes.
Treasury Stock
The purchase of the Company’s common stock is recorded at cost. At the date of subsequent reissue, the treasury stock account is reduced by the cost of such stock on the average cost basis, with any excess proceeds being credited to capital surplus.
| 77 |
Comprehensive Income
Comprehensive income consists of net income and other comprehensive income (loss). Other comprehensive income (loss) is comprised of unrealized holding gains (losses) on the available-for-sale securities portfolio, net of tax.
Earnings Per Share
The Company provides dual presentation of basic and diluted earnings per share. Basic earnings per share is calculated utilizing the reported net income as the numerator and weighted average shares outstanding as the denominator. The computation of diluted earnings per share differs in that the dilutive effects of any options, and convertible securities are adjusted for in the denominator. Treasury shares are not deemed outstanding for earnings per share calculations.
Stock-Based Compensation
In 2015, the Company’s stockholders approved the 2015 Equity Incentive Plan (the “Plan”). The purpose of the Plan is to promote the long-term financial success of the Company by providing a means to attract, retain and reward individuals who contribute to such success and to further align their interests with those of the Company’s stockholders through the ownership of additional common stock of the Company. The effective date of the Plan was May 20, 2015, which was the date the Plan satisfied the applicable stockholder approval requirement. The Plan shall remain in effect as long as any awards are outstanding, provided, however, that no awards may be granted under the Plan after the day immediately prior to the ten-year anniversary of the effective date of May 20, 2015. All of the Company’s directors and employees are eligible to participate in the Plan. The Plan authorizes the granting of options to purchase shares of the Company’s stock, which may be non-qualified stock options or incentive stock options, restricted stock awards or restricted stock units. The Plan reserved an aggregate number of 407,146 shares, of which two-thirds of the shares (271,431) may be issued as stock options and one-third of the shares (135,715) may be issued as restricted stock awards or units. Restricted stock awards or units can be issued above the one-third threshold provided that the number of shares reserved for stock options is reduced by three shares for each restricted stock award or unit granted above the one-third threshold.
ASC Topic 718, Compensation – Stock Compensation, requires recognizing the compensation cost in the financial statements for stock-based payment transactions. Stock option expense is measured based on the grant date fair value of the stock options issued. The per share fair value of stock options granted is calculated using the Black-Scholes-Merton option pricing model, using assumptions for expected life, expected dividend rate, risk-free interest rate and an expected volatility. The Company uses the simplified method to determine the expected term because it does not have sufficient historical exercise data to provide a reasonable basis upon which to estimate expected term due to the limited period of time its shares have been publicly traded. The stock option exercise price is equal to the market value on the date of grant. Restricted stock award expense is measured based on the market price of the Company’s common stock at the date of the grant. Unrecognized compensation expense is recognized ratably over the remaining service period, generally defined as the vesting period, for all nonvested restricted stock awards and stock options. Restricted stock awards are typically granted with a one-year vesting period, and stock options are typically granted with a five-year vesting period and a vesting rate of 20% per year. The contractual life of stock options is typically 10 years from the date of grant.
Cash Flow Information
The Company has defined cash equivalents as those amounts due from depository institutions, interest-bearing deposits with other banks with maturities of less than 90 days, and federal funds sold.
Advertising Costs
Advertising costs are expensed as incurred.
Reclassifications
Certain comparative amounts for prior periods have been reclassified to conform to the current year presentation. Such reclassifications did not affect net income or stockholders’ equity.
Recent Accounting Standards
In February 2018, the FASB issued Accounting Standards Update (“ASU”) 2018-02, Income Statement - Reporting Comprehensive Income (Topic 220) - Reclassification of Certain Tax Effects from Accumulated Other Comprehensive Income. The amendments in this update affect any entity that is required to apply the provisions of Topic 220, Income Statement—Reporting Comprehensive Income. Deferred tax asset (DTA) related to available for sale (AFS) securities gains/(losses) that were revalued as of December 31, 2017 (See Note 11 – Income Taxes) created a “stranded tax effects” in Accumulated Other Comprehensive Income (AOCI) due to the enactment of the Tax Cuts and Jobs Act (the Tax Act). The issue arose due to the nature of existing GAAP requiring recognition of tax rate change effects on the DTA revaluation related to AFS securities as an adjustment to income tax provision. Specifically, ASU 2018-02 permits a reclassification from AOCI to retained earnings for stranded tax effects resulting from the Tax Act. The adoption of ASU 2018-02 eliminates the stranded tax effects resulting from the Tax Act and improves the usefulness of information reported to financial statement users.
| 78 |
However, because the amendments only relate to the reclassification of the income tax effects of the Tax Act, the underlying GAAP guidance that requires that the effect of a change in tax laws or rates be included in income from continuing operations is not affected. The amendments in this update are optional and are effective for fiscal years beginning after December 15, 2018, and interim periods within those fiscal years. Early adoption of the amendment is permitted.
The Company early adopted the provisions of ASU 2018-02 effective December 31, 2017 and elected to record a reclassification adjustment of $220,000 from AOCI to retained earnings in the consolidated statements of stockholders’ equity for stranded tax effects resulting from enactment of the Tax Act. The amount of the reclassification was the difference between the 35 percent historical corporate tax rate and the newly enacted 21 percent corporate tax rate. See the consolidated statement of stockholders equity and Note 11 – Income Taxes for additional information.
In January 2018, the FASB issued Accounting Standards Update (“ASU”) 2018-01, Leases (Topic 842), Land Easement Practical Expedient for Transition to Topic 842. ASU 2018-01 is intended to be effective with ASU 2016-02, as amended. The amendments in ASU 2018-01 are as follows: provide an optional transition practical expedient for the adoption of ASU 2016-02 that, if elected, would not require an organization to reconsider their accounting for existing land easements that are not currently accounted for under the old lease standards; and clarify that new or modified land easements should be evaluated under ASU 2016-02, once an entity has adopted the new standard. ASU 2016-02 will require lessees to recognize a right-of-use (ROU) asset for its right to use the underlying asset and a lease liability for the corresponding lease obligation for leases with terms of more than twelve months. Both the ROU asset and lease liability will initially be measured at the present value of the future minimum lease payments over the lease term. Subsequent measurement, including the presentation of expenses and cash flows, will depend on the classification of the lease as either a finance or an operating lease. Accounting by lessors will remain largely unchanged from current U.S. GAAP. ASU 2016-02 is effective for fiscal years beginning after December 15, 2018, and interim periods within those years, with early adoption permitted, and is to be applied as of the beginning of the earliest period presented using a modified retrospective approach. The Company is currently evaluating the provisions of ASU 2016-02, but expects to report increased assets and liabilities as a result of reporting additional leases on the Company's consolidated financial condition or results of operations.
In September 2017, the FASB issued Accounting Standards Update ("ASU") 2017-13, Revenue Recognition (Topic 605), Revenue from Contracts with Customers (Topic 606), Leases (Topic 840), and Leases (Topic 842): Amendments to SEC Paragraphs Pursuant to the Staff Announcement at the July 20, 2017 EITF Meeting and Rescission of Prior SEC Staff Announcements and Observer Comments. ASU 2017-13 amends the early adoption date option for certain companies related to the adoption of ASU No. 2014-09, Revenue from Contracts with Customers (Topic 606) and ASU No. 2016-02, Leases (Topic 842). The SEC staff stated the SEC would not object to a public business entity that otherwise would not meet the definition of a public business entity except for a requirement to include or the inclusion of its financial statements or financial information in another entity’s filing with the SEC adopting ASC Topic 606 for annual reporting periods beginning after December 15, 2018, and interim reporting periods within annual reporting periods beginning after December 15, 2019. The SEC staff stated the SEC would not object to a public business entity that otherwise would not meet the definition of a public business entity except for a requirement to include or the inclusion of its financial statements or financial information in another entity’s filing with the SEC adopting ASC Topic 842 for fiscal years beginning after December 15, 2019, and interim periods within fiscal years beginning after December 15, 2020. The Company is evaluating the provisions of ASU 2017-13 but believes that its adoption will not have a material impact on the Company's consolidated financial condition or results of operations.
In July 2017, the FASB issued Accounting Standards Update ("ASU") 2017-11, Earnings Per Share (Topic 260); Distinguishing Liabilities from Equity (Topic 480); Derivatives and Hedging (Topic 815): (Part I) Accounting for Certain Financial Instruments with Down Round Features, (Part II) Replacement of the Indefinite Deferral for Mandatorily Redeemable Financial Instruments of Certain Nonpublic Entities and Certain Mandatorily Redeemable Noncontrolling Interests with a Scope Exception. ASU 2017-11 amendments simplify the accounting for certain financial instruments with down round features. The amendments require companies to disregard the down round feature when assessing whether the instrument is indexed to its own stock, for purposes of determining liability or equity classification. Companies that provide earnings per share (EPS) data will adjust their basic EPS calculation for the effect of the feature when triggered and will also recognize the effect of the trigger within equity. ASU 2017-11 is effective for public business entities that are SEC filers for annual periods beginning after December 15, 2018, and interim periods within those annual periods, for public entities that are not SEC filers for annual periods beginning after December 15, 2019 and for all other entities for annual periods beginning after December 15, 2020 with early adoption permitted. The Company is evaluating the provisions of ASU 2017-11 but believes that its adoption will not have a material impact on the Company's consolidated financial condition or results of operations.
| 79 |
In May 2017, the FASB issued ASU 2017-10, Service Concession Arrangements (Topic 853): Determining the Customer of the Operation Services. ASU 2017-10 amendments clarify that the grantor in a service concession arrangement is the customer of the operation services in all cases for those arrangements. ASU 2017-10 is effective for public business entities that are SEC filers for annual periods beginning after December 15, 2017, and interim periods within those annual periods, for public entities that are not SEC filers for annual periods beginning after December 15, 2018 and for all other entities for annual periods beginning after December 15, 2019 with early adoption permitted, including within an interim period, subject to specific transition requirements depending on whether an entity adopted Topic 606 before or after the issuance of ASU 2017-10. The Company is evaluating the provisions of ASU 2017-10 but believes that its adoption will not have a material impact on the Company's consolidated financial condition or results of operations.
In May 2017, the FASB issued ASU 2017-09, Compensation—Stock Compensation (Topic 718): Scope of Modification Accounting. ASU 2017-09 amendments provide guidance on determining which changes to the terms and conditions of share-based payment awards require an entity to apply modification accounting under ASU Topic 718. ASU 2017-09 is effective for all entities for annual periods, including interim periods within those annual periods beginning after December 15, 2017 with early adoption permitted. The Company is evaluating the provisions of ASU 2017-09 but believes that its adoption will not have a material impact on the Company's consolidated financial condition or results of operations.
In March 2017, the FASB issued ASU 2017-08, Receivables- Nonrefundable Fees and Other Costs (Subtopic 310-20): Premium Amortization on Purchases of Callable Debt Securities. ASU 2017-08 amends guidance on the amortization period of premiums on certain purchases of callable debt securities. The amendments shorten the amortization period of premiums on certain purchases of callable debt securities to the earliest call date. ASU 2017-08 is effective for public business entities that are SEC filers for annual periods beginning after December 15, 2018, and interim periods within those annual periods with early adoption permitted. The Company is evaluating the provisions of ASU 2017-08 but believes that its adoption will not have a material impact on the Company's consolidated financial condition or results of operations.
In January 2017, the FASB issued ASU 2017-04, Intangibles - Goodwill and Other (Topic 350): Simplifying the Test for Goodwill Impairment. ASU 2017-04 simplifies the accounting for goodwill impairments by eliminating the second step of the goodwill impairment test. Instead, an entity will apply a one-step quantitative test and record the amount of goodwill impairment as the excess of a reporting unit's carrying amount over its fair value, not to exceed the total amount of goodwill allocated to the reporting unit. The new guidance does not amend the optional qualitative assessment of goodwill impairment. ASU 2017-04 is effective for public business entities that are SEC filers for annual periods beginning after December 15, 2019, and interim periods within those annual periods, with early adoption permitted, and is to be applied on a prospective basis. The Company is currently evaluating the provisions of ASU 2017-04, but does not believe that its adoption will have a material impact on the Company's consolidated financial condition or results of operations.
In August 2016, the FASB issued ASU 2016-15, Statement of Cash Flow (Topic 230): Classification of Certain Cash Receipts and Cash Payments. ASU 2016-15 addresses the following eight specific cash flow issues: debt prepayment or debt extinguishment costs; settlement of zero-coupon debt instruments or other debt instruments with coupon interest rates that are insignificant in relation to the effective interest rate of the borrowing; contingent consideration payments made after a business combination; proceeds from the settlement of insurance claims; proceeds from the settlement of corporate-owned life insurance policies, including bank-owned life insurance policies; distributions received from equity method investees; beneficial interests in securitization transactions; and separately identifiable cash flows and application of the predominance principle. ASU 2016-15 is effective for fiscal years beginning after December 15, 2017, and interim periods within those fiscal years. The amendments should be applied using a retrospective transition method to each period presented. The Company is currently evaluating the provisions of ASU 2016-15, but does not believe that its adoption will have a material impact on the Company's consolidated financial condition or results of operations.
In June 2016, the FASB issued ASU 2016-13, Financial Instruments – Credit Losses (Topic 326): Measurement of Credit Losses on Financial Instruments. ASU 2016-13 amends guidance on reporting credit losses for assets held at amortized cost basis and available for sale debt securities. For assets held at amortized cost basis, ASU 2016-13 eliminates the probable initial recognition threshold in current GAAP; and instead requires an entity to reflect its current estimate of all expected credit losses. The allowance for credit losses is a valuation account that is deducted from the amortized cost basis of the financial assets to present the net amount expected to be collected. For available for sale debt securities, credit losses should be measured in a manner similar to current GAAP, however this ASU will require that credit losses be presented as an allowance rather than as a write-down. ASU 2016-13 affects companies holding financial assets and net investment in leases that are not accounted for at fair value through net income. The ASU 2016-13 amendments affect loans, debt securities, trade receivables, net investments in leases, off balance-sheet credit exposures, reinsurance receivables, and any other financial assets not excluded from the scope that have the contractual right to receive cash. ASU 2016-13 is effective for fiscal years beginning after December 15, 2019, and interim periods within those fiscal years, with early adoption permitted. The Company is currently evaluating the provisions of ASU 2016-13, but does not believe that its adoption will have a material impact on the Company's consolidated financial condition or results of operations.
| 80 |
In March 2016, the FASB issued ASU 2016-09, Compensation - Stock Compensation (Topic 718): Improvements to Employee Share-Based Payment Accounting. ASU 2016-09 introduces amendments intended to simplify the accounting for stock compensation. ASU 2016-09 requires all excess tax benefits and tax deficiencies to be recognized as income tax expense or benefit in the income statement. The tax effects of exercised or vested awards should be treated as discrete items in the reporting period in which they occur. An entity should also recognize excess tax benefits and assess the need for a valuation allowance, regardless of whether the benefit reduces taxes payable in the current period. The ASU also requires excess tax benefits be classified along with other income tax cash flows as an operating activity in the statement of cash flows. ASU 2016-09 is effective for annual periods beginning after December 15, 2016, and interim periods within those annual periods, with early adoption permitted. The adoption of ASU 2016-09 as of January 1, 2017, had no effect on the Company's consolidated financial condition or results of operations.
In February 2016, the FASB issued Accounting Standards Update (“ASU”) 2016-02, Leases (Topic 842), which increases the transparency and comparability among organizations by recognizing lease assets and lease liabilities on the balance sheet, and disclosing key information about leasing arrangements. ASU 2016-02 will require lessees to recognize a right-of-use (ROU) asset for its right to use the underlying asset and a lease liability for the corresponding lease obligation for leases with terms of more than twelve months. Both the ROU asset and lease liability will initially be measured at the present value of the future minimum lease payments over the lease term. Subsequent measurement, including the presentation of expenses and cash flows, will depend on the classification of the lease as either a finance or an operating lease. Accounting by lessors will remain largely unchanged from current U.S. GAAP. ASU 2016-02 is effective for fiscal years beginning after December 15, 2018, and interim periods within those years, with early adoption permitted, and is to be applied as of the beginning of the earliest period presented using a modified retrospective approach. The Company is currently evaluating the provisions of ASU 2016-02, but expects to report increased assets and liabilities as a result of reporting additional leases on the Company's consolidated statement of financial condition or results of operations.
In January 2016, the FASB issued ASU 2016-01, Financial Instruments – Overall (Subtopic 825-10), which enhances the reporting model for financial instruments regarding certain aspects of recognition, measurement, presentation, and disclosure. ASU 2016-01 (i) requires equity investments (except those accounted for under the equity method or that are consolidated) to be measured at fair value with changes in fair value recognized in net income; (ii) simplifies the impairment assessment of equity investments without readily determinable fair values by requiring a qualitative assessment to identify impairment; (iii) eliminates the requirement for an entity to disclose the methods and significant assumptions used to estimate the fair value of financial instruments measured at amortized cost; (iv) requires an entity to use the exit price notion when measuring the fair value of financial instruments for disclosure purposes; and (v) requires separate presentation of financial assets and financial liabilities by measurement category and form of financial asset on the balance sheet or in the accompanying notes to the financial statements. ASU 2016-01 is effective for fiscal years, and interim periods within those years, beginning after December 15, 2017, and is to be applied using a cumulative-effect adjustment to the balance sheet as of the beginning of the fiscal year of adoption. The Company is currently evaluating the provisions of ASU 2016-01, but does not believe that its adoption will have a material impact on the Company's consolidated financial condition or results of operations.
In May 2014, the FASB issued ASU 2014-09, Revenue from Contracts with Customers, which establishes a comprehensive revenue recognition standard for virtually all industries under GAAP, including those that previously followed industry-specific guidance, such as the real estate, construction and software industries. ASU 2014-09 specifies that an entity shall recognize revenue when, or as, the entity satisfies a performance obligation by transferring a promised good or service (i.e., an asset) to a customer. An asset is transferred when, or as, the customer obtains control of the asset. Entities are required to disclose qualitative and quantitative information on the nature, amount, timing and uncertainty of revenue and cash flows arising from contracts with customers. In August 2015, the FASB issued ASU 2015-14, which defers the effective date of ASU 2014-09. The guidance is effective for the Company’s financial statements beginning January 1, 2018. The guidance allows an entity to apply the new standard either retrospectively or through a cumulative effect adjustment as of January 1, 2018. This guidance does not apply to revenue associated with financial instruments, including loans, securities, and derivatives that are accounted for under other U.S. GAAP guidance. For that reason, we do not expect it to have a material impact on our consolidated results of operations for elements of the statement of income associated with financial instruments, including securities gains, interest income, and interest expense. However, we do believe the new standard will result in new disclosure requirements. We are currently reviewing contracts to document the impact of the new guidance on our service offerings that are in the scope of the guidance included in non-interest income, such as insurance commission fees, deposit related fees and service charges, payment processing fees, trust services fees and brokerage services fees. The Company is defining the effect of the new guidance on revenue sources other than financial instruments on its consolidated financial condition or results of operations and will use modified retrospective method for transition in which the cumulative effect will be recognized at the date of adoption with no restatement of comparative periods presented.
| 81 |
NOTE 2— PENDING MERGER
On November 16, 2017, the Company entered into a definitive merger agreement with First West Virginia Bancorp (“FWVB”), the holding company for Progressive Bank, N.A. (“PB”), a national association. Through the proposed merger, the Company anticipates future revenue and earnings growth from an expanded menu of financial services expanding the Company’s business footprint into the Ohio Valley. The merger will result in the addition of eight branches and expand the Company’s reach into West Virginia with seven branches and one branch in Eastern Ohio. In connection with the merger, the Company will issue approximately 1,317,647 shares of common stock and estimated cash consideration of $9.8 million. The merger estimated value is approximately $49.0 million. Completion of the merger is subject to the receipt of shareholder and regulatory approvals and other customary closing conditions.
Merger-related expenses are recorded in the Consolidated Statement of Income and include costs relating to the Company’s proposed acquisition of FWVB, as described above. These charges represent one-time costs associated with acquisition activities and do not represent ongoing costs of the fully integrated combined organization. Accounting guidance requires that acquisition-related transactional and restructuring costs incurred by the Company be charged to expense as incurred. As of December 31, 2017, there were $356,000 of merger related expenses recorded in the Consolidated Statement of Income.
As of December 31, 2017, FWVB had approximately $334 million of assets, $101 million of loans, and $281 million of deposits held across a network of 12 branches located in West Virginia. Upon closing, the Company stockholders and FWVB stockholders will own approximately 76% and 24% of the combined company, respectively.
The merger will be accounted for as an acquisition in accordance with the acquisition method of accounting as detailed in Accounting Standards Codification ("ASC") 805, Business Combinations. The acquisition method of accounting requires an acquirer to recognize the assets acquired and the liabilities assumed based on their fair values as of the date of acquisition. This process is heavily reliant on measuring and estimating the fair values of all the assets and liabilities of the acquired entity. To the extent we do not have the requisite expertise to determine the fair values of the assets acquired and liabilities assumed, we will engage third-party valuation specialists to assist us in determining such values.
NOTE 3—EARNINGS PER SHARE
There are no convertible securities, which would affect the numerator in calculating basic and diluted earnings per share; therefore, net income as presented on the Consolidated Statement of Income is used as the numerator.
The following table sets forth the composition of the weighted-average common shares (denominator) used in the basic and diluted earnings per share computation.
| Years Ended December 31, | ||||||||||||
| 2017 | 2016 | 2015 | ||||||||||
| Weighted-Average Common Shares Outstanding | 4,363,346 | 4,363,346 | 4,363,346 | |||||||||
| Average Treasury Stock Shares | (275,155 | ) | (282,099 | ) | (291,491 | ) | ||||||
| Weighted-Average Common Shares and Common Stock Equivalents Used to Calculate Basic Earnings Per Share | 4,088,191 | 4,081,247 | 4,071,855 | |||||||||
| Additional Common Stock Equivalents (Stock Options) Used to Calculate Diluted Earnings Per Share | 22,181 | 4,943 | - | |||||||||
| Weighted-Average Common Shares and Common Stock | ||||||||||||
| Weighted-Average Common Shares and Common Stock Equivalents Used to Calculate Diluted Earnings Per Share | 4,110,372 | 4,086,190 | 4,071,855 | |||||||||
| Earnings per share: | ||||||||||||
| Basic | $ | 1.70 | $ | 1.86 | $ | 2.07 | ||||||
| Diluted | 1.69 | 1.86 | 2.07 | |||||||||
The dilutive effect on average shares outstanding is the result of stock options outstanding. For the years ended December 31, 2017 and 2016, respectively, options to purchase were 263,640 and 227,100 shares of common stock at a weighted average exercise price of $24.33 and $23.17 were outstanding. All stock options that were outstanding for the years ended December 31, 2017, and 2016 were included in the computation of diluted earnings per share. All stock options for the year ended December 31, 2015, were not included in the computation of diluted earnings per share because the options’ exercise price was greater than the average market price of common stock for the period.
| 82 |
NOTE 4—INVESTMENT SECURITIES
The amortized cost and fair value of investment securities available-for-sale as of December 31, 2017 and 2016, are as follows:
| (Dollars in thousands) | ||||||||||||||||
| 2017 | ||||||||||||||||
| Amortized Cost | Gross Unrealized Gains | Gross Unrealized Losses | Fair Value | |||||||||||||
| U.S. Government Agencies | $ | 67,603 | $ | - | $ | (1,715 | ) | $ | 65,888 | |||||||
| Obligations of States and Political Subdivisions | 38,867 | 255 | (134 | ) | 38,988 | |||||||||||
| Mortgage-Backed Securities - Government-Sponsored Enterprises | 17,123 | - | (145 | ) | 16,978 | |||||||||||
| Equity Securities - Mutual Funds | 500 | 3 | - | 503 | ||||||||||||
| Equity Securities - Other | 1,188 | 52 | (14 | ) | 1,226 | |||||||||||
| Total | $ | 125,281 | $ | 310 | $ | (2,008 | ) | $ | 123,583 | |||||||
| 2016 | ||||||||||||||||
| Amortized Cost | Gross Unrealized Gains | Gross Unrealized Losses | Fair Value | |||||||||||||
| U.S. Government Agencies | $ | 67,944 | $ | 18 | $ | (1,806 | ) | $ | 66,156 | |||||||
| Obligations of States and Political Subdivisions | 35,856 | 366 | (487 | ) | 35,735 | |||||||||||
| Mortgage-Backed Securities - Government-Sponsored Enterprises | 2,588 | 31 | - | 2,619 | ||||||||||||
| Equity Securities - Mutual Funds | 500 | 7 | - | 507 | ||||||||||||
| Equity Securities - Other | 1,106 | 91 | (6 | ) | 1,191 | |||||||||||
| Total | $ | 107,994 | $ | 513 | $ | (2,299 | ) | $ | 106,208 | |||||||
| 83 |
The following tables show the Company’s gross unrealized losses and fair value, aggregated by investment category and length of time that the individual securities have been in a continuous unrealized loss position at December 31, 2017 and 2016:
| (Dollars in thousands) | ||||||||||||||||||||||||||||||||||||
| 2017 | ||||||||||||||||||||||||||||||||||||
| Less than 12 months | 12 Months or Greater | Total | ||||||||||||||||||||||||||||||||||
| Number of Securities | Fair Value | Gross Unrealized Losses | Number of Securities | Fair Value | Gross Unrealized Losses | Number of Securities | Fair Value | Gross Unrealized Losses | ||||||||||||||||||||||||||||
| U.S. Government Agencies | 7 | $ | 23,805 | $ | (223 | ) | 16 | $ | 42,083 | $ | (1,492 | ) | 23 | $ | 65,888 | $ | (1,715 | ) | ||||||||||||||||||
| Obligations of States and Political Subdivisions | 20 | 10,061 | (47 | ) | 9 | 4,397 | (87 | ) | 29 | 14,458 | (134 | ) | ||||||||||||||||||||||||
| Mortgage-Backed Securities - Government Sponsored Enterprises | 9 | 16,978 | (145 | ) | - | - | - | 9 | 16,978 | (145 | ) | |||||||||||||||||||||||||
| Equity Securities - Other | 5 | 458 | (7 | ) | 1 | 53 | (7 | ) | 6 | 511 | (14 | ) | ||||||||||||||||||||||||
| Total | 41 | $ | 51,302 | $ | (422 | ) | 26 | $ | 46,533 | $ | (1,586 | ) | 67 | $ | 97,835 | $ | (2,008 | ) | ||||||||||||||||||
| 2016 | ||||||||||||||||||||||||||||||||||||
| Less than 12 months | 12 Months or Greater | Total | ||||||||||||||||||||||||||||||||||
| Number of Securities | Fair Value | Gross Unrealized Losses | Number of Securities | Fair Value | Gross Unrealized Losses | Number of Securities | Fair Value | Gross Unrealized Losses | ||||||||||||||||||||||||||||
| U.S. Government Agencies | 23 | $ | 62,853 | $ | (1,806 | ) | - | $ | - | $ | - | 23 | $ | 62,853 | $ | (1,806 | ) | |||||||||||||||||||
| Obligations of States and Political Subdivisions | 39 | 19,749 | (485 | ) | 1 | 260 | (2 | ) | 40 | 20,009 | (487 | ) | ||||||||||||||||||||||||
| Equity Securities - Other | 2 | 160 | (6 | ) | - | - | - | 2 | 160 | (6 | ) | |||||||||||||||||||||||||
| Total | 64 | $ | 82,762 | $ | (2,297 | ) | 1 | $ | 260 | $ | (2 | ) | 65 | $ | 83,022 | $ | (2,299 | ) | ||||||||||||||||||
For debt securities, the Company does not believe any individual unrealized loss as of December 31, 2017, represents an other-than-temporary impairment. The Company performs a review of the entire securities portfolio on a quarterly basis to identify securities that may indicate an other-than-temporary impairment. The Company’s management considers the length of time and the extent to which the fair value has been less than cost and the financial condition of the issuer. The securities that are temporarily impaired at December 31, 2017 and 2016, relate principally to changes in interest rates subsequent to the acquisition of the specific securities. The Company does not intend to sell or it is not more likely than not that it will be required to sell any of the securities in an unrealized loss position before recovery of its amortized cost or maturity of the security.
Investment securities available-for-sale with a carrying value of $83.8 million and $71.6 million at December 31, 2017 and 2016, respectively, are pledged to secure public deposits, short-term borrowings and for other purposes as required or permitted by law.
The scheduled maturities of investment securities available-for-sale at December 31, 2017, are summarized as follows:
| (Dollars in thousands) | ||||||||
| 2017 | ||||||||
| Available-for-Sale | ||||||||
| Amortized Cost | Fair Value | |||||||
| Due in One Year or Less | $ | 923 | $ | 927 | ||||
| Due after One Year through Five Years | 22,943 | 22,782 | ||||||
| Due after Five Years through Ten Years | 75,626 | 74,124 | ||||||
| Due after Ten Years | 25,789 | 25,750 | ||||||
| Total | $ | 125,281 | $ | 123,583 | ||||
Equity securities – mutual funds and equity securities – other do not have a scheduled maturity date, but have been included in the due after ten years category.
There were no sales of available-for-sale investment securities during 2015. Sales of available-for-sale investment securities in 2017 and 2016 resulted in gross gains of $207,000 and $168,000, respectively, and in 2017, there were sales of available-for-sale investment securities sold at a gross loss for $8,000. This realized loss on the sale of securities was by design to mitigate risk and utilize the sale proceeds in higher yielding security purchases.
| 84 |
The following table shows the Company’s available-for-sale obligations of states and political subdivisions and their sources of repayment as of December 31, 2017 and 2016, respectively:
| (Dollars in thousands) | ||||||||||||||||
| 2017 | 2016 | |||||||||||||||
| Amortized Cost | Fair Value | Amortized Cost | Fair Value | |||||||||||||
| General Obligation: | ||||||||||||||||
| Pennsylvania Municipalities: | ||||||||||||||||
| School | $ | 29,671 | $ | 29,755 | $ | 29,206 | $ | 29,148 | ||||||||
| Public Improvement | 3,095 | 3,103 | 3,504 | 3,462 | ||||||||||||
| Total General Obligation | 32,766 | 32,858 | 32,710 | 32,610 | ||||||||||||
| Special Revenue | ||||||||||||||||
| Pennsylvania Political Subdivisions: | ||||||||||||||||
| Other | 2,221 | 2,227 | 2,898 | 2,873 | ||||||||||||
| Other State Political Subdivisions: | ||||||||||||||||
| School | 2,653 | 2,659 | ||||||||||||||
| Public Improvement | 977 | 992 | - | - | ||||||||||||
| Water and Sewer | 250 | 252 | 248 | 252 | ||||||||||||
| Total Special Revenue | 6,101 | 6,130 | 3,146 | 3,125 | ||||||||||||
| Total Obligations of States and Political Subdivisions | $ | 38,867 | $ | 38,988 | $ | 35,856 | $ | 35,735 | ||||||||
The Company has a concentration of obligations of municipal and political subdivisions in the Commonwealth of Pennsylvania, primarily in obligations of school districts. These investments are not concentrated geographically within any region of Pennsylvania as they are disbursed over the entire Commonwealth. School district bonds are backed by the individual school districts and also by the Commonwealth via an enhanced rating under the State Aid Withholding Program, Intercept Program or Act 50 in Pennsylvania. In addition, most investments in this area also have credit support from various insuring agencies.
The Company evaluates its investments in states, municipalities, and political subdivisions both on a pre-purchase and subsequently on a quarterly basis. The evaluation includes a review of fund balances, outstanding pension liabilities, operating revenues and expenses for the most recent five years, if available, and the trends of those metrics. In addition to this financial review, other pertinent criteria are reviewed, such as population growth in the area, median family income, poverty rates, and debt service expenditures as a percent of expenditures. Based upon these criteria, the creditworthiness of the investments is determined. Upon completion of the review, the results are compared to the published credit ratings. As a result of the Company’s review, there were no investments in states, municipalities and political subdivisions that differed significantly from the published credit ratings.
| 85 |
NOTE 5—LOANS AND RELATED ALLOWANCE FOR LOAN LOSSES
The following table summarizes the major classifications of loans as of December 31, 2017 and 2016:
| (Dollars in thousands) | ||||||||
| 2017 | 2016 | |||||||
| Originated Loans | ||||||||
| Real Estate: | ||||||||
| Residential | $ | 200,486 | $ | 186,077 | ||||
| Commercial | 160,235 | 139,894 | ||||||
| Construction | 36,149 | 10,646 | ||||||
| Commercial and Industrial | 100,294 | 71,091 | ||||||
| Consumer | 114,358 | 114,007 | ||||||
| Other | 3,376 | 3,637 | ||||||
| Total Originated Loans | 614,898 | 525,352 | ||||||
| Allowance for Loan Losses | (8,215 | ) | (7,283 | ) | ||||
| Loans, Net | $ | 606,683 | $ | 518,069 | ||||
| Loans Acquired at Fair Value | ||||||||
| Real Estate: | ||||||||
| Residential | $ | 72,952 | $ | 85,511 | ||||
| Commercial | 48,802 | 61,116 | ||||||
| Construction | - | - | ||||||
| Commercial and Industrial | 7,541 | 9,721 | ||||||
| Consumer | 199 | 197 | ||||||
| Total Loans Acquired at Fair Value | 129,494 | 156,545 | ||||||
| Allowance for Loan Losses | (581 | ) | (520 | ) | ||||
| Loans, Net | $ | 128,913 | $ | 156,025 | ||||
| Total Loans | ||||||||
| Real Estate: | ||||||||
| Residential | $ | 273,438 | $ | 271,588 | ||||
| Commercial | 209,037 | 201,010 | ||||||
| Construction | 36,149 | 10,646 | ||||||
| Commercial and Industrial | 107,835 | 80,812 | ||||||
| Consumer | 114,557 | 114,204 | ||||||
| Other | 3,376 | 3,637 | ||||||
| Total Loans | 744,392 | 681,897 | ||||||
| Allowance for Loan Losses | (8,796 | ) | (7,803 | ) | ||||
| Loans, Net | $ | 735,596 | $ | 674,094 | ||||
Real estate loans serviced for others, which are not included in the Consolidated Statement of Financial Condition, totaled $95.4 and $83.9 million at December 31, 2017 and 2016, respectively.
| 86 |
Loans summarized by the aggregate pass and the criticized categories of special mention, substandard and doubtful within the internal risk rating system as of December 31, 2017 and 2016, are as follows:
| (Dollars in thousands) | ||||||||||||||||||||
| 2017 | ||||||||||||||||||||
| Pass | Special Mention | Substandard | Doubtful | Total | ||||||||||||||||
| Originated Loans | ||||||||||||||||||||
| Real Estate: | ||||||||||||||||||||
| Residential | $ | 198,869 | $ | 1,031 | $ | 586 | $ | - | $ | 200,486 | ||||||||||
| Commercial | 143,824 | 13,161 | 2,716 | 534 | 160,235 | |||||||||||||||
| Construction | 35,571 | - | 535 | 43 | 36,149 | |||||||||||||||
| Commercial and Industrial | 84,910 | 11,460 | 2,589 | 1,335 | 100,294 | |||||||||||||||
| Consumer | 114,287 | - | 71 | - | 114,358 | |||||||||||||||
| Other | 3,376 | - | - | - | 3,376 | |||||||||||||||
| Total Originated Loans | $ | 580,837 | $ | 25,652 | $ | 6,497 | $ | 1,912 | $ | 614,898 | ||||||||||
| Loans Acquired at Fair Value | ||||||||||||||||||||
| Real Estate: | ||||||||||||||||||||
| Residential | $ | 71,176 | $ | - | $ | 1,776 | $ | - | $ | 72,952 | ||||||||||
| Commercial | 43,297 | 5,004 | 501 | - | 48,802 | |||||||||||||||
| Construction | - | - | - | - | - | |||||||||||||||
| Commercial and Industrial | 7,270 | 5 | 189 | 77 | 7,541 | |||||||||||||||
| Consumer | 199 | - | - | - | 199 | |||||||||||||||
| Total Loans Acquired at Fair Value | $ | 121,942 | $ | 5,009 | $ | 2,466 | $ | 77 | $ | 129,494 | ||||||||||
| Total Loans | ||||||||||||||||||||
| Real Estate: | ||||||||||||||||||||
| Residential | $ | 270,045 | $ | 1,031 | $ | 2,362 | $ | - | $ | 273,438 | ||||||||||
| Commercial | 187,121 | 18,165 | 3,217 | 534 | 209,037 | |||||||||||||||
| Construction | 35,571 | - | 535 | 43 | 36,149 | |||||||||||||||
| Commercial and Industrial | 92,180 | 11,465 | 2,778 | 1,412 | 107,835 | |||||||||||||||
| Consumer | 114,486 | - | 71 | - | 114,557 | |||||||||||||||
| Other | 3,376 | - | - | - | 3,376 | |||||||||||||||
| Total Loans | $ | 702,779 | $ | 30,661 | $ | 8,963 | $ | 1,989 | $ | 744,392 | ||||||||||
| 87 |
| 2016 | ||||||||||||||||||||
| Pass | Special Mention | Substandard | Doubtful | Total | ||||||||||||||||
| Originated Loans | ||||||||||||||||||||
| Real Estate: | ||||||||||||||||||||
| Residential | $ | 184,721 | $ | 1,050 | $ | 306 | $ | - | $ | 186,077 | ||||||||||
| Commercial | 122,811 | 14,118 | 2,035 | 930 | 139,894 | |||||||||||||||
| Construction | 9,944 | - | 595 | 107 | 10,646 | |||||||||||||||
| Commercial and Industrial | 65,612 | 2,720 | 1,322 | 1,437 | 71,091 | |||||||||||||||
| Consumer | 113,847 | - | 160 | - | 114,007 | |||||||||||||||
| Other | 3,637 | - | - | - | 3,637 | |||||||||||||||
| Total Originated Loans | $ | 500,572 | $ | 17,888 | $ | 4,418 | $ | 2,474 | $ | 525,352 | ||||||||||
| Loans Acquired at Fair Value | ||||||||||||||||||||
| Real Estate: | ||||||||||||||||||||
| Residential | $ | 83,044 | $ | - | $ | 2,467 | $ | - | $ | 85,511 | ||||||||||
| Commercial | 58,411 | 2,358 | 347 | - | 61,116 | |||||||||||||||
| Construction | - | - | - | - | - | |||||||||||||||
| Commercial and Industrial | 9,117 | 42 | 441 | 121 | 9,721 | |||||||||||||||
| Consumer | 197 | - | - | - | 197 | |||||||||||||||
| Total Loans Acquired at Fair Value | $ | 150,769 | $ | 2,400 | $ | 3,255 | $ | 121 | $ | 156,545 | ||||||||||
| Total Loans | ||||||||||||||||||||
| Real Estate: | ||||||||||||||||||||
| Residential | $ | 267,765 | $ | 1,050 | $ | 2,773 | $ | - | $ | 271,588 | ||||||||||
| Commercial | 181,222 | 16,476 | 2,382 | 930 | 201,010 | |||||||||||||||
| Construction | 9,944 | - | 595 | 107 | 10,646 | |||||||||||||||
| Commercial and Industrial | 74,729 | 2,762 | 1,763 | 1,558 | 80,812 | |||||||||||||||
| Consumer | 114,044 | - | 160 | - | 114,204 | |||||||||||||||
| Other | 3,637 | - | - | - | 3,637 | |||||||||||||||
| Total Loans | $ | 651,341 | $ | 20,288 | $ | 7,673 | $ | 2,595 | $ | 681,897 | ||||||||||
At December 31, 2017 and 2016, there were no loans in the criticized category of loss.
| 88 |
The following tables present the classes of the loan portfolio summarized by the aging categories of performing loans and nonaccrual loans as of December 31, 2017 and 2016:
| (Dollars in thousands) | ||||||||||||||||||||||||||||
| 2017 | ||||||||||||||||||||||||||||
| Loans Current | 30-59 Days Past Due | 60-89 Days Past Due | 90 Days Or More Past Due | Total Past Due | Non- Accrual | Total Loans | ||||||||||||||||||||||
| Originated Loans | ||||||||||||||||||||||||||||
| Real Estate: | ||||||||||||||||||||||||||||
| Residential | $ | 198,564 | $ | 1,088 | $ | 310 | $ | - | $ | 1,398 | $ | 524 | $ | 200,486 | ||||||||||||||
| Commercial | 159,947 | - | - | - | - | 288 | 160,235 | |||||||||||||||||||||
| Construction | 36,106 | - | - | - | - | 43 | 36,149 | |||||||||||||||||||||
| Commercial and Industrial | 96,863 | 125 | 1,227 | - | 1,352 | 2,079 | 100,294 | |||||||||||||||||||||
| Consumer | 112,965 | 1,142 | 154 | 26 | 1,322 | 71 | 114,358 | |||||||||||||||||||||
| Other | 3,376 | - | - | - | - | - | 3,376 | |||||||||||||||||||||
| Total Originated Loans | $ | 607,821 | $ | 2,355 | $ | 1,691 | $ | 26 | $ | 4,072 | $ | 3,005 | $ | 614,898 | ||||||||||||||
| Loans Acquired at Fair Value | ||||||||||||||||||||||||||||
| Real Estate: | ||||||||||||||||||||||||||||
| Residential | $ | 71,333 | $ | 398 | $ | 180 | $ | 142 | $ | 720 | $ | 899 | $ | 72,952 | ||||||||||||||
| Commercial | 48,802 | - | - | - | - | - | 48,802 | |||||||||||||||||||||
| Construction | - | - | - | - | - | - | - | |||||||||||||||||||||
| Commercial and Industrial | 7,448 | 77 | - | - | 77 | 16 | 7,541 | |||||||||||||||||||||
| Consumer | 199 | - | - | - | - | - | 199 | |||||||||||||||||||||
| Total Loans Acquired at Fair Value | $ | 127,782 | $ | 475 | $ | 180 | $ | 142 | $ | 797 | $ | 915 | $ | 129,494 | ||||||||||||||
| Total Loans | ||||||||||||||||||||||||||||
| Real Estate: | ||||||||||||||||||||||||||||
| Residential | $ | 269,897 | $ | 1,486 | $ | 490 | $ | 142 | $ | 2,118 | $ | 1,423 | $ | 273,438 | ||||||||||||||
| Commercial | 208,749 | - | - | - | - | 288 | 209,037 | |||||||||||||||||||||
| Construction | 36,106 | - | - | - | - | 43 | 36,149 | |||||||||||||||||||||
| Commercial and Industrial | 104,311 | 202 | 1,227 | - | 1,429 | 2,095 | 107,835 | |||||||||||||||||||||
| Consumer | 113,164 | 1,142 | 154 | 26 | 1,322 | 71 | 114,557 | |||||||||||||||||||||
| Other | 3,376 | - | - | - | - | - | 3,376 | |||||||||||||||||||||
| Total Loans | $ | 735,603 | $ | 2,830 | $ | 1,871 | $ | 168 | $ | 4,869 | $ | 3,920 | $ | 744,392 | ||||||||||||||
| 89 |
| 2016 | ||||||||||||||||||||||||||||
| Loans Current | 30-59 Days Past Due | 60-89 Days Past Due | 90 Days Or More Past Due | Total Past Due | Non- Accrual | Total Loans | ||||||||||||||||||||||
| Originated Loans | ||||||||||||||||||||||||||||
| Real Estate: | ||||||||||||||||||||||||||||
| Residential | $ | 183,939 | $ | 1,638 | $ | 72 | $ | 120 | $ | 1,830 | $ | 308 | $ | 186,077 | ||||||||||||||
| Commercial | 139,821 | - | - | - | - | 73 | 139,894 | |||||||||||||||||||||
| Construction | 10,539 | - | - | - | - | 107 | 10,646 | |||||||||||||||||||||
| Commercial and Industrial | 68,310 | 952 | - | - | 952 | 1,829 | 71,091 | |||||||||||||||||||||
| Consumer | 112,232 | 1,311 | 296 | 8 | 1,615 | 160 | 114,007 | |||||||||||||||||||||
| Other | 3,637 | - | - | - | - | - | 3,637 | |||||||||||||||||||||
| Total Originated Loans | $ | 518,478 | $ | 3,901 | $ | 368 | $ | 128 | $ | 4,397 | $ | 2,477 | $ | 525,352 | ||||||||||||||
| Loans Acquired at Fair Value | ||||||||||||||||||||||||||||
| Real Estate: | ||||||||||||||||||||||||||||
| Residential | $ | 82,523 | $ | 893 | $ | 307 | $ | 223 | $ | 1,423 | $ | 1,565 | $ | 85,511 | ||||||||||||||
| Commercial | 60,437 | 332 | - | - | 332 | 347 | 61,116 | |||||||||||||||||||||
| Construction | - | - | - | - | - | - | - | |||||||||||||||||||||
| Commercial and Industrial | 9,577 | 121 | 23 | - | 144 | - | 9,721 | |||||||||||||||||||||
| Consumer | 197 | - | - | - | - | - | 197 | |||||||||||||||||||||
| Total Loans Acquired at Fair Value | $ | 152,734 | $ | 1,346 | $ | 330 | $ | 223 | $ | 1,899 | $ | 1,912 | $ | 156,545 | ||||||||||||||
| Total Loans | ||||||||||||||||||||||||||||
| Real Estate: | ||||||||||||||||||||||||||||
| Residential | $ | 266,462 | $ | 2,531 | $ | 379 | $ | 343 | $ | 3,253 | $ | 1,873 | $ | 271,588 | ||||||||||||||
| Commercial | 200,258 | 332 | - | - | 332 | 420 | 201,010 | |||||||||||||||||||||
| Construction | 10,539 | - | - | - | - | 107 | 10,646 | |||||||||||||||||||||
| Commercial and Industrial | 77,887 | 1,073 | 23 | - | 1,096 | 1,829 | 80,812 | |||||||||||||||||||||
| Consumer | 112,429 | 1,311 | 296 | 8 | 1,615 | 160 | 114,204 | |||||||||||||||||||||
| Other | 3,637 | - | - | - | - | - | 3,637 | |||||||||||||||||||||
| Total Loans | $ | 671,212 | $ | 5,247 | $ | 698 | $ | 351 | $ | 6,296 | $ | 4,389 | $ | 681,897 | ||||||||||||||
Total unrecorded interest income related to nonaccrual loans was $74,000 and $86,000 for 2017 and 2016, respectively.
| 90 |
A summary of the loans considered impaired as of December 31, 2017, 2016 and 2015, are as follows:
| (Dollars in thousands) | ||||||||||||||||||||
| December 31, 2017 | ||||||||||||||||||||
| Recorded Investment | Related Allowance | Unpaid Principal Balance | Average Recorded Investment | Interest Income Recognized | ||||||||||||||||
| With No Related Allowance Recorded: | ||||||||||||||||||||
| Originated Loans | ||||||||||||||||||||
| Real Estate: | ||||||||||||||||||||
| Residential | $ | 89 | $ | - | $ | 91 | $ | 114 | $ | 4 | ||||||||||
| Commercial | 2,142 | - | 2,142 | 2,297 | 104 | |||||||||||||||
| Construction | 578 | - | 578 | 629 | 26 | |||||||||||||||
| Commercial and Industrial | 1,002 | - | 1,002 | 1,058 | 28 | |||||||||||||||
| Other | 1 | - | 1 | 3 | - | |||||||||||||||
| Total With No Related Allowance Recorded | $ | 3,812 | $ | - | $ | 3,814 | $ | 4,101 | $ | 162 | ||||||||||
| Loans Acquired at Fair Value | ||||||||||||||||||||
| Real Estate: | ||||||||||||||||||||
| Residential | $ | 1,257 | $ | - | $ | 1,257 | $ | 1,278 | $ | 65 | ||||||||||
| Commercial | 927 | - | 927 | 965 | 51 | |||||||||||||||
| Commercial and Industrial | 189 | - | 189 | 320 | 12 | |||||||||||||||
| Total With No Related Allowance Recorded | $ | 2,373 | $ | - | $ | 2,373 | $ | 2,563 | $ | 128 | ||||||||||
| Total Loans | ||||||||||||||||||||
| Real Estate: | ||||||||||||||||||||
| Residential | $ | 1,346 | $ | - | $ | 1,348 | $ | 1,392 | $ | 69 | ||||||||||
| Commercial | 3,069 | - | 3,069 | 3,262 | 155 | |||||||||||||||
| Construction | 578 | - | 578 | 629 | 26 | |||||||||||||||
| Commercial and Industrial | 1,191 | - | 1,191 | 1,378 | 40 | |||||||||||||||
| Other | 1 | - | 1 | 3 | - | |||||||||||||||
| Total With No Related Allowance Recorded | $ | 6,185 | $ | - | $ | 6,187 | $ | 6,664 | $ | 290 | ||||||||||
| With A Related Allowance Recorded: | ||||||||||||||||||||
| Originated Loans | ||||||||||||||||||||
| Real Estate: | ||||||||||||||||||||
| Commercial | $ | 1,480 | $ | 351 | $ | 1,480 | $ | 1,509 | $ | 65 | ||||||||||
| Commercial and Industrial | 2,927 | 1,264 | 3,019 | 3,346 | 159 | |||||||||||||||
| Total With A Related Allowance Recorded | $ | 4,407 | $ | 1,615 | $ | 4,499 | $ | 4,855 | $ | 224 | ||||||||||
| Loans Acquired at Fair Value | ||||||||||||||||||||
| Real Estate: | ||||||||||||||||||||
| Commercial and Industrial | $ | 77 | $ | 3 | $ | 77 | $ | 98 | $ | 4 | ||||||||||
| Total With A Related Allowance Recorded | $ | 77 | $ | 3 | $ | 77 | $ | 98 | $ | 4 | ||||||||||
| Total Loans | ||||||||||||||||||||
| Real Estate: | ||||||||||||||||||||
| Commercial | $ | 1,480 | $ | 351 | $ | 1,480 | $ | 1,509 | $ | 65 | ||||||||||
| Commercial and Industrial | 3,004 | 1,267 | 3,096 | 3,444 | 163 | |||||||||||||||
| Total With A Related Allowance Recorded | $ | 4,484 | $ | 1,618 | $ | 4,576 | $ | 4,953 | $ | 228 | ||||||||||
| 91 |
| December 31, 2017 (cont.) | ||||||||||||||||||||
| Recorded Investment | Related Allowance | Unpaid Principal Balance | Average Recorded Investment | Interest Income Recognized | ||||||||||||||||
| Total Impaired Loans: | ||||||||||||||||||||
| Originated Loans | ||||||||||||||||||||
| Real Estate: | ||||||||||||||||||||
| Residential | $ | 89 | $ | - | $ | 91 | $ | 114 | $ | 4 | ||||||||||
| Commercial | 3,622 | 351 | 3,622 | 3,806 | 169 | |||||||||||||||
| Construction | 578 | - | 578 | 629 | 26 | |||||||||||||||
| Commercial and Industrial | 3,929 | 1,264 | 4,021 | 4,404 | 187 | |||||||||||||||
| Other | 1 | - | 1 | 3 | - | |||||||||||||||
| Total Impaired Loans | $ | 8,219 | $ | 1,615 | $ | 8,313 | $ | 8,956 | $ | 386 | ||||||||||
| Loans Acquired at Fair Value | ||||||||||||||||||||
| Real Estate: | ||||||||||||||||||||
| Residential | $ | 1,257 | $ | - | $ | 1,257 | $ | 1,278 | $ | 65 | ||||||||||
| Commercial | 927 | - | 927 | 965 | 51 | |||||||||||||||
| Commercial and Industrial | 266 | 3 | 266 | 418 | 16 | |||||||||||||||
| Total Impaired Loans | $ | 2,450 | $ | 3 | $ | 2,450 | $ | 2,661 | $ | 132 | ||||||||||
| Total Loans | ||||||||||||||||||||
| Real Estate: | ||||||||||||||||||||
| Residential | $ | 1,346 | $ | - | $ | 1,348 | $ | 1,392 | $ | 69 | ||||||||||
| Commercial | 4,549 | 351 | 4,549 | 4,771 | 220 | |||||||||||||||
| Construction | 578 | - | 578 | 629 | 26 | |||||||||||||||
| Commercial and Industrial | 4,195 | 1,267 | 4,287 | 4,822 | 203 | |||||||||||||||
| Other | 1 | - | 1 | 3 | - | |||||||||||||||
| Total Impaired Loans | $ | 10,669 | $ | 1,618 | $ | 10,763 | $ | 11,617 | $ | 518 | ||||||||||
| 92 |
| 2016 | ||||||||||||||||||||
| Recorded Investment | Related Allowance | Unpaid Principal Balance | Average Recorded Investment | Interest Income Recognized | ||||||||||||||||
| With No Related Allowance Recorded: | ||||||||||||||||||||
| Originated Loans | ||||||||||||||||||||
| Real Estate: | ||||||||||||||||||||
| Commercial | $ | 2,112 | $ | - | $ | 2,112 | $ | 2,228 | $ | 100 | ||||||||||
| Construction | 702 | - | 702 | 843 | 28 | |||||||||||||||
| Commercial and Industrial | 825 | - | 825 | 891 | 45 | |||||||||||||||
| Other | 4 | - | 4 | 6 | 1 | |||||||||||||||
| Total With No Related Allowance Recorded | $ | 3,643 | $ | - | $ | 3,643 | $ | 3,968 | $ | 174 | ||||||||||
| Loans Acquired at Fair Value | ||||||||||||||||||||
| Real Estate: | ||||||||||||||||||||
| Residential | $ | 1,300 | $ | - | $ | 1,300 | $ | 1,320 | $ | 68 | ||||||||||
| Commercial | 660 | - | 660 | 763 | 47 | |||||||||||||||
| Commercial and Industrial | 441 | - | 441 | 543 | 21 | |||||||||||||||
| Total With No Related Allowance Recorded | $ | 2,401 | $ | - | $ | 2,401 | $ | 2,626 | $ | 136 | ||||||||||
| Total Loans | ||||||||||||||||||||
| Real Estate: | ||||||||||||||||||||
| Residential | $ | 1,300 | $ | - | $ | 1,300 | $ | 1,320 | $ | 68 | ||||||||||
| Commercial | 2,772 | - | 2,772 | 2,991 | 147 | |||||||||||||||
| Construction | 702 | - | 702 | 843 | 28 | |||||||||||||||
| Commercial and Industrial | 1,266 | - | 1,266 | 1,434 | 66 | |||||||||||||||
| Other | 4 | - | 4 | 6 | 1 | |||||||||||||||
| Total With No Related Allowance Recorded | $ | 6,044 | $ | - | $ | 6,044 | $ | 6,594 | $ | 310 | ||||||||||
| With A Related Allowance Recorded: | ||||||||||||||||||||
| Originated Loans | ||||||||||||||||||||
| Real Estate: | ||||||||||||||||||||
| Commercial | $ | 1,249 | $ | 360 | $ | 1,249 | $ | 1,277 | $ | 66 | ||||||||||
| Commercial and Industrial | 1,940 | 655 | 1,946 | 1,951 | 27 | |||||||||||||||
| Total With A Related Allowance Recorded | $ | 3,189 | $ | 1,015 | $ | 3,195 | $ | 3,228 | $ | 93 | ||||||||||
| Loans Acquired at Fair Value | ||||||||||||||||||||
| Real Estate: | ||||||||||||||||||||
| Commercial | $ | 347 | $ | 114 | $ | 437 | $ | 367 | $ | - | ||||||||||
| Commercial and Industrial | 121 | 31 | 121 | 141 | 6 | |||||||||||||||
| Total With A Related Allowance Recorded | $ | 468 | $ | 145 | $ | 558 | $ | 508 | $ | 6 | ||||||||||
| Total Loans | ||||||||||||||||||||
| Real Estate: | ||||||||||||||||||||
| Commercial | $ | 1,596 | $ | 474 | $ | 1,686 | $ | 1,644 | $ | 66 | ||||||||||
| Commercial and Industrial | 2,061 | 686 | 2,067 | 2,092 | 33 | |||||||||||||||
| Total With A Related Allowance Recorded | $ | 3,657 | $ | 1,160 | $ | 3,753 | $ | 3,736 | $ | 99 | ||||||||||
| 93 |
| December 31, 2016 (cont.) | ||||||||||||||||||||
| Recorded Investment | Related Allowance | Unpaid Principal Balance | Average Recorded Investment | Interest Income Recognized | ||||||||||||||||
| Total Impaired Loans: | ||||||||||||||||||||
| Originated Loans | ||||||||||||||||||||
| Real Estate: | ||||||||||||||||||||
| Commercial | $ | 3,361 | $ | 360 | $ | 3,361 | $ | 3,505 | $ | 166 | ||||||||||
| Construction | 702 | - | 702 | 843 | 28 | |||||||||||||||
| Commercial and Industrial | 2,765 | 655 | 2,771 | 2,842 | 72 | |||||||||||||||
| Other | 4 | - | 4 | 6 | 1 | |||||||||||||||
| Total Impaired Loans | $ | 6,832 | $ | 1,015 | $ | 6,838 | $ | 7,196 | $ | 267 | ||||||||||
| Loans Acquired at Fair Value | ||||||||||||||||||||
| Real Estate: | ||||||||||||||||||||
| Residential | $ | 1,300 | $ | - | $ | 1,300 | $ | 1,320 | $ | 68 | ||||||||||
| Commercial | 1,007 | 114 | 1,097 | 1,130 | 47 | |||||||||||||||
| Commercial and Industrial | 562 | 31 | 562 | 684 | 27 | |||||||||||||||
| Total Impaired Loans | $ | 2,869 | $ | 145 | $ | 2,959 | $ | 3,134 | $ | 142 | ||||||||||
| Total Loans | ||||||||||||||||||||
| Real Estate: | ||||||||||||||||||||
| Residential | $ | 1,300 | $ | - | $ | 1,300 | $ | 1,320 | $ | 68 | ||||||||||
| Commercial | 4,368 | 474 | 4,458 | 4,635 | 213 | |||||||||||||||
| Construction | 702 | - | 702 | 843 | 28 | |||||||||||||||
| Commercial and Industrial | 3,327 | 686 | 3,333 | 3,526 | 99 | |||||||||||||||
| Other | 4 | - | 4 | 6 | 1 | |||||||||||||||
| Total Impaired Loans | $ | 9,701 | $ | 1,160 | $ | 9,797 | $ | 10,330 | $ | 409 | ||||||||||
| 94 |
| 2015 | ||||||||||||||||||||
| Recorded Investment | Related Allowance | Unpaid Principal Balance | Average Recorded Investment | Interest Income Recognized | ||||||||||||||||
| With No Related Allowance Recorded: | ||||||||||||||||||||
| Originated Loans | ||||||||||||||||||||
| Real Estate: | ||||||||||||||||||||
| Residential | $ | 5 | $ | - | $ | 17 | $ | 6 | $ | - | ||||||||||
| Commercial | 6,636 | - | 6,636 | 7,095 | 232 | |||||||||||||||
| Construction | 229 | - | 230 | 292 | - | |||||||||||||||
| Commercial and Industrial | 627 | - | 627 | 756 | 35 | |||||||||||||||
| Total With No Related Allowance Recorded | $ | 7,497 | $ | - | $ | 7,510 | $ | 8,149 | $ | 267 | ||||||||||
| Loans Acquired at Fair Value | ||||||||||||||||||||
| Real Estate: | ||||||||||||||||||||
| Residential | $ | 1,296 | $ | - | $ | 1,296 | $ | 1,315 | $ | 67 | ||||||||||
| Commercial | 4,188 | - | 4,263 | 4,449 | 214 | |||||||||||||||
| Commercial and Industrial | 63 | - | 63 | 79 | 3 | |||||||||||||||
| Total With No Related Allowance Recorded | $ | 5,547 | $ | - | $ | 5,622 | $ | 5,843 | $ | 284 | ||||||||||
| Total Loans | ||||||||||||||||||||
| Real Estate: | ||||||||||||||||||||
| Residential | $ | 1,301 | $ | - | $ | 1,313 | $ | 1,321 | $ | 67 | ||||||||||
| Commercial | 10,824 | - | 10,899 | 11,544 | 446 | |||||||||||||||
| Construction | 229 | - | 230 | 292 | - | |||||||||||||||
| Commercial and Industrial | 690 | - | 690 | 835 | 38 | |||||||||||||||
| Total With No Related Allowance Recorded | $ | 13,044 | $ | - | $ | 13,132 | $ | 13,992 | $ | 551 | ||||||||||
| With A Related Allowance Recorded: | ||||||||||||||||||||
| Originated Loans | ||||||||||||||||||||
| Real Estate: | ||||||||||||||||||||
| Commercial | $ | 1,436 | $ | 408 | $ | 1,441 | $ | 1,457 | $ | 37 | ||||||||||
| Commercial and Industrial | 136 | 9 | 137 | 128 | 5 | |||||||||||||||
| Total With A Related Allowance Recorded | $ | 1,572 | $ | 417 | $ | 1,578 | $ | 1,585 | $ | 42 | ||||||||||
| Total Loans | ||||||||||||||||||||
| Real Estate: | ||||||||||||||||||||
| Commercial | $ | 1,436 | $ | 408 | $ | 1,441 | $ | 1,457 | $ | 37 | ||||||||||
| Commercial and Industrial | 136 | 9 | 137 | 128 | 5 | |||||||||||||||
| Total With A Related Allowance Recorded | $ | 1,572 | $ | 417 | $ | 1,578 | $ | 1,585 | $ | 42 | ||||||||||
| 95 |
| December 31, 2015 (cont.) | ||||||||||||||||||||
| Recorded Investment | Related Allowance | Unpaid Principal Balance | Average Recorded Investment | Interest Income Recognized | ||||||||||||||||
| Total Impaired Loans: | ||||||||||||||||||||
| Originated Loans | ||||||||||||||||||||
| Real Estate: | ||||||||||||||||||||
| Residential | $ | 5 | $ | - | $ | 17 | $ | 6 | $ | - | ||||||||||
| Commercial | 8,072 | 408 | 8,077 | 8,552 | 269 | |||||||||||||||
| Construction | 229 | - | 230 | 292 | - | |||||||||||||||
| Commercial and Industrial | 763 | 9 | 764 | 884 | 40 | |||||||||||||||
| Total Impaired Loans | $ | 9,069 | $ | 417 | $ | 9,088 | $ | 9,734 | $ | 309 | ||||||||||
| Loans Acquired at Fair Value | ||||||||||||||||||||
| Real Estate: | ||||||||||||||||||||
| Residential | $ | 1,296 | $ | - | $ | 1,296 | $ | 1,315 | $ | 67 | ||||||||||
| Commercial | 4,188 | - | 4,263 | 4,449 | 214 | |||||||||||||||
| Commercial and Industrial | 63 | - | 63 | 79 | 3 | |||||||||||||||
| Total Impaired Loans | $ | 5,547 | $ | - | $ | 5,622 | $ | 5,843 | $ | 284 | ||||||||||
| Total Loans | ||||||||||||||||||||
| Real Estate: | ||||||||||||||||||||
| Residential | $ | 1,301 | $ | - | $ | 1,313 | $ | 1,321 | $ | 67 | ||||||||||
| Commercial | 12,260 | 408 | 12,340 | 13,001 | 483 | |||||||||||||||
| Construction | 229 | - | 230 | 292 | - | |||||||||||||||
| Commercial and Industrial | 826 | 9 | 827 | 963 | 43 | |||||||||||||||
| Total Impaired Loans | $ | 14,616 | $ | 417 | $ | 14,710 | $ | 15,577 | $ | 593 | ||||||||||
Loans classified as TDRs consisted of 16 and 15 loans totaling $4.5 and $4.7 million as of December 31, 2017 and 2016, respectively. Originated loans classified as TDRs consisted of eight and seven loans totaling $2.6 million and $2.8 million as of December 31, 2017 and 2016, respectively. Loans acquired at fair value classified as TDRs consisted of eight and nine loans totaling $1.9 and $2.4 million at December 31, 2017 and 2016, respectively.
During the year ended December 31, 2017, one originated residential real estate loan was given extended terms in a new TDR transaction and subsequently sold partial collateral to paydown the existing loan balance by the current year-end. During the year ended December 31, 2017, one commercial loan TDR that had extended terms per the merger with FedFirst, acquired at fair value, paid off.
During the year ended December 31, 2016, three originated loans, two commercial and industrial loans, one extended terms and the other C&I line of credit was frozen with interest only payments, and an other consumer loan had extended terms in new TDR transactions. In addition, two acquired loans at fair value, one commercial and industrial loan with interest only payments for 4 months, and one residential real estate loan with principal reduction and extended terms entered into new TDR transactions. During the year ended December 31, 2016, two commercial loan TDRs with extended terms, acquired at fair value, paid off.
During the year ended December 31, 2015, one commercial loan previously identified as an originated TDR and two other commercial loans were consolidated into one loan into a new TDR transaction. In addition, two commercial loans previously identified as originated TDRs were refinanced into new TDR transactions. During the year ended December 31, 2015, one commercial extended term TDR, acquired at fair value, paid off.
No TDRs have subsequently defaulted during the years ended December 31, 2017, 2016 and 2015, respectively.
| 96 |
The following table presents information at the time of modification related to loans modified as TDRs during the periods indicated.
| (Dollars in thousands) | ||||||||||||||||
| Year Ended December 31, 2017 | ||||||||||||||||
| Number of Contracts | Pre- Modification Outstanding Recorded Investment | Post- Modification Outstanding Recorded Investment | Related Allowance | |||||||||||||
| Originated Loans | ||||||||||||||||
| Real Estate | ||||||||||||||||
| Residential | 1 | $ | 61 | $ | 61 | $ | - | |||||||||
| Total | 1 | $ | 61 | $ | 61 | $ | - | |||||||||
| Year Ended December 31, 2016 | ||||||||||||||||
| Number of Contracts | Pre- Modification Outstanding Recorded Investment | Post- Modification Outstanding Recorded Investment | Related Allowance | |||||||||||||
| Originated Loans | ||||||||||||||||
| Real Estate | ||||||||||||||||
| Commercial and Industrial | 2 | $ | 1,437 | $ | 1,443 | $ | 531 | |||||||||
| Other | 1 | 7 | 7 | - | ||||||||||||
| Total | 3 | $ | 1,444 | $ | 1,450 | $ | 531 | |||||||||
| Loans Acquired at Fair Value | ||||||||||||||||
| Real Estate | ||||||||||||||||
| Residential | 1 | $ | 37 | $ | 45 | $ | - | |||||||||
| Commercial | 1 | 539 | 539 | - | ||||||||||||
| Total | 2 | $ | 576 | $ | 584 | $ | - | |||||||||
| Year Ended December 31, 2015 | ||||||||||||||||
| Number of Contracts | Pre- Modification Outstanding Recorded Investment | Post- Modification Outstanding Recorded Investment | Related Allowance | |||||||||||||
| Originated Loans | ||||||||||||||||
| Real Estate | ||||||||||||||||
| Commercial | 2 | $ | 912 | $ | 1,135 | $ | 125 | |||||||||
| Total | 2 | $ | 912 | $ | 1,135 | $ | 125 | |||||||||
Loans acquired in connection with the merger with FedFirst were recorded at their estimated fair value at the acquisition date and did not include a carryover of the allowance for loan losses because the determination of the fair value of acquired loans incorporated credit risk assumptions. The loans acquired with evidence of deterioration in credit quality since origination for which it was probable that all contractually required payments would not be collected were not significant to the consolidated financial statements of the Company.
| 97 |
The following table presents changes in the accretable discount on the loans acquired at fair value for the dates indicated.
| Accretable Discount | ||||
| Balance at December 31, 2014 | $ | 4,359 | ||
| Accretable yield | (1,086 | ) | ||
| Reduction due to unexpected early payoffs | 7 | |||
| Nonaccretable premium | 22 | |||
| Balance at December 31, 2015 | 3,302 | |||
| Accretable yield | (717 | ) | ||
| Reduction due to unexpected early payoffs | (720 | ) | ||
| Nonaccretable discount | (225 | ) | ||
| Balance at December 31, 2016 | 1,640 | |||
| Accretable yield | (597 | ) | ||
| Reduction due to unexpected early payoffs | (171 | ) | ||
| Nonaccretable discount | (112 | ) | ||
| Balance at December 31, 2017 | $ | 760 | ||
Certain directors, executive officers and principal stockholders of the Company, including family members or companies in which they are principal owners, are loan customers of the Company. Such loans are made in the normal course of business, and summarized as follows:
| (Dollars in thousands) | ||||||||||||
| 2017 | 2016 | 2015 | ||||||||||
| Balance, January 1 | $ | 7,545 | $ | 7,485 | $ | 7,341 | ||||||
| Additions | 362 | 754 | 172 | |||||||||
| Payments | (734 | ) | (694 | ) | (28 | ) | ||||||
| Balance, December 31 | $ | 7,173 | $ | 7,545 | $ | 7,485 | ||||||
| 98 |
The activity in the allowance for loan loss summarized by primary segments and segregated into the amount required for loans individually evaluated for impairment and the amount required for loans collectively evaluated for potential impairment as of December 31, 2017, 2016 and 2015 is summarized below:
| (Dollars in thousands) | ||||||||||||||||||||||||||||||||
| 2017 | ||||||||||||||||||||||||||||||||
| Real Estate Residential | Real Estate Commercial | Real Estate Construction | Commercial and Industrial | Consumer | Other | Unallocated | Total | |||||||||||||||||||||||||
| Originated Loans | ||||||||||||||||||||||||||||||||
| Beginning Balance | $ | 1,106 | $ | 1,942 | $ | 65 | $ | 1,579 | $ | 2,463 | $ | - | $ | 128 | $ | 7,283 | ||||||||||||||||
| Charge-offs | (22 | ) | - | - | (915 | ) | - | - | (937 | ) | ||||||||||||||||||||||
| Recoveries | 13 | - | 37 | 199 | - | - | 249 | |||||||||||||||||||||||||
| Provision | (206 | ) | (143 | ) | 211 | 845 | 611 | - | 302 | 1,620 | ||||||||||||||||||||||
| Ending Balance | $ | 891 | $ | 1,799 | $ | 276 | $ | 2,461 | $ | 2,358 | $ | - | $ | 430 | $ | 8,215 | ||||||||||||||||
| Individually Evaluated for Impairment | $ | - | $ | 351 | $ | - | $ | 1,264 | $ | - | $ | - | $ | - | $ | 1,615 | ||||||||||||||||
| Collectively Evaluated for Potential Impairment | $ | 891 | $ | 1,448 | $ | 276 | $ | 1,197 | $ | 2,358 | $ | - | $ | 430 | $ | 6,600 | ||||||||||||||||
| Loans Acquired at Fair Value | ||||||||||||||||||||||||||||||||
| Beginning Balance | $ | - | $ | 365 | $ | - | $ | 120 | $ | - | $ | - | $ | 35 | $ | 520 | ||||||||||||||||
| Charge-offs | (109 | ) | (132 | ) | - | - | (4 | ) | - | - | (245 | ) | ||||||||||||||||||||
| Recoveries | 49 | 3 | - | - | 4 | - | - | 56 | ||||||||||||||||||||||||
| Provision | 60 | 254 | - | (37 | ) | - | - | (27 | ) | 250 | ||||||||||||||||||||||
| Ending Balance | $ | - | $ | 490 | $ | - | $ | 83 | $ | - | $ | - | $ | 8 | $ | 581 | ||||||||||||||||
| Individually Evaluated for Impairment | $ | - | $ | - | $ | - | $ | 3 | $ | - | $ | - | $ | - | $ | 3 | ||||||||||||||||
| Collectively Evaluated for Potential Impairment | $ | - | $ | 490 | $ | - | $ | 80 | $ | - | $ | - | $ | 8 | $ | 578 | ||||||||||||||||
| Total Allowance for Loan Losses | ||||||||||||||||||||||||||||||||
| Beginning Balance | $ | 1,106 | $ | 2,307 | $ | 65 | $ | 1,699 | $ | 2,463 | $ | - | $ | 163 | $ | 7,803 | ||||||||||||||||
| Charge-offs | (131 | ) | (132 | ) | - | - | (919 | ) | - | - | (1,182 | ) | ||||||||||||||||||||
| Recoveries | 62 | 3 | - | 37 | 203 | - | - | 305 | ||||||||||||||||||||||||
| Provision | (146 | ) | 111 | 211 | 808 | 611 | - | 275 | 1,870 | |||||||||||||||||||||||
| Ending Balance | $ | 891 | $ | 2,289 | $ | 276 | $ | 2,544 | $ | 2,358 | $ | - | $ | 438 | $ | 8,796 | ||||||||||||||||
| Individually Evaluated for Impairment | $ | - | $ | 351 | $ | - | $ | 1,267 | $ | - | $ | - | $ | - | $ | 1,618 | ||||||||||||||||
| Collectively Evaluated for Potential Impairment | $ | 891 | $ | 1,938 | $ | 276 | $ | 1,277 | $ | 2,358 | $ | - | $ | 438 | $ | 7,178 | ||||||||||||||||
| 99 |
| 2016 | ||||||||||||||||||||||||||||||||
| Real Estate Residential | Real Estate Commercial | Real Estate Construction | Commercial and Industrial | Consumer | Other | Unallocated | Total | |||||||||||||||||||||||||
| Originated Loans | ||||||||||||||||||||||||||||||||
| Beginning Balance | $ | 1,623 | $ | 2,045 | $ | 137 | $ | 784 | $ | 1,887 | $ | - | $ | 14 | $ | 6,490 | ||||||||||||||||
| Charge-offs | (24 | ) | (11 | ) | - | - | (717 | ) | (49 | ) | - | (801 | ) | |||||||||||||||||||
| Recoveries | 10 | 95 | - | - | 140 | 23 | - | 268 | ||||||||||||||||||||||||
| Provision | (503 | ) | (187 | ) | (72 | ) | 795 | 1,153 | 26 | 114 | 1,326 | |||||||||||||||||||||
| Ending Balance | $ | 1,106 | $ | 1,942 | $ | 65 | $ | 1,579 | $ | 2,463 | $ | - | $ | 128 | $ | 7,283 | ||||||||||||||||
| Individually Evaluated for Impairment | $ | - | $ | 360 | $ | - | $ | 655 | $ | - | $ | - | $ | - | $ | 1,015 | ||||||||||||||||
| Collectively Evaluated for Potential Impairment | $ | 1,106 | $ | 1,582 | $ | 65 | $ | 924 | $ | 2,463 | $ | - | $ | 128 | $ | 6,268 | ||||||||||||||||
| Loans Acquired at Fair Value | ||||||||||||||||||||||||||||||||
| Beginning Balance | $ | - | $ | - | $ | - | $ | - | $ | - | $ | - | $ | - | $ | - | ||||||||||||||||
| Charge-offs | (24 | ) | (180 | ) | - | - | (7 | ) | - | - | (211 | ) | ||||||||||||||||||||
| Recoveries | 7 | 3 | - | - | 7 | - | - | 17 | ||||||||||||||||||||||||
| Provision | 17 | 542 | - | 120 | - | - | 35 | 714 | ||||||||||||||||||||||||
| Ending Balance | $ | - | $ | 365 | $ | - | $ | 120 | $ | - | $ | - | $ | 35 | $ | 520 | ||||||||||||||||
| Individually Evaluated for Impairment | $ | - | $ | 114 | $ | - | $ | 31 | $ | - | $ | - | $ | - | $ | 145 | ||||||||||||||||
| Collectively Evaluated for Potential Impairment | $ | - | $ | 251 | $ | - | $ | 89 | $ | - | $ | - | $ | 35 | $ | 375 | ||||||||||||||||
| Total Allowance for Loan Losses | ||||||||||||||||||||||||||||||||
| Beginning Balance | $ | 1,623 | $ | 2,045 | $ | 137 | $ | 784 | $ | 1,887 | $ | - | $ | 14 | $ | 6,490 | ||||||||||||||||
| Charge-offs | (48 | ) | (191 | ) | - | - | (724 | ) | (49 | ) | - | (1,012 | ) | |||||||||||||||||||
| Recoveries | 17 | 98 | - | - | 147 | 23 | - | 285 | ||||||||||||||||||||||||
| Provision | (486 | ) | 355 | (72 | ) | 915 | 1,153 | 26 | 149 | 2,040 | ||||||||||||||||||||||
| Ending Balance | $ | 1,106 | $ | 2,307 | $ | 65 | $ | 1,699 | $ | 2,463 | $ | - | $ | 163 | $ | 7,803 | ||||||||||||||||
| Individually Evaluated for Impairment | $ | - | $ | 474 | $ | - | $ | 686 | $ | - | $ | - | $ | - | $ | 1,160 | ||||||||||||||||
| Collectively Evaluated for Potential Impairment | $ | 1,106 | $ | 1,833 | $ | 65 | $ | 1,013 | $ | 2,463 | $ | - | $ | 163 | $ | 6,643 | ||||||||||||||||
| 2015 | ||||||||||||||||||||||||||||||||
| Real Estate Residential | Real Estate Commercial | Real Estate Construction | Commercial and Industrial | Consumer | Other | Unallocated | Total | |||||||||||||||||||||||||
| Originated Loans | ||||||||||||||||||||||||||||||||
| Beginning Balance | $ | 2,690 | $ | 582 | $ | 122 | $ | 684 | $ | 1,015 | $ | - | $ | 102 | $ | 5,195 | ||||||||||||||||
| Charge-offs | (23 | ) | (291 | ) | - | - | (326 | ) | - | - | (640 | ) | ||||||||||||||||||||
| Recoveries | 49 | 11 | - | 10 | 118 | - | - | 188 | ||||||||||||||||||||||||
| Provision | (1,093 | ) | 1,743 | 15 | 90 | 1,080 | - | (88 | ) | 1,747 | ||||||||||||||||||||||
| Ending Balance | $ | 1,623 | $ | 2,045 | $ | 137 | $ | 784 | $ | 1,887 | $ | - | $ | 14 | $ | 6,490 | ||||||||||||||||
| Individually Evaluated for Impairment | $ | - | $ | 408 | $ | - | $ | 9 | $ | - | $ | - | $ | - | $ | 417 | ||||||||||||||||
| Collectively Evaluated for Potential Impairment | $ | 1,623 | $ | 1,637 | $ | 137 | $ | 775 | $ | 1,887 | $ | - | $ | 14 | $ | 6,073 | ||||||||||||||||
| Loans Acquired at Fair Value | ||||||||||||||||||||||||||||||||
| Beginning Balance | $ | - | $ | - | $ | - | $ | - | $ | - | $ | - | $ | - | $ | - | ||||||||||||||||
| Charge-offs | (197 | ) | (18 | ) | - | - | (61 | ) | - | - | (276 | ) | ||||||||||||||||||||
| Recoveries | 14 | 3 | - | - | 1 | - | - | 18 | ||||||||||||||||||||||||
| Provision | 183 | 15 | - | - | 60 | - | - | 258 | ||||||||||||||||||||||||
| Ending Balance | $ | - | $ | - | $ | - | $ | - | $ | - | $ | - | $ | - | $ | - | ||||||||||||||||
| Total Allowance for Loan Losses | ||||||||||||||||||||||||||||||||
| Beginning Balance | $ | 2,690 | $ | 582 | $ | 122 | $ | 684 | $ | 1,015 | $ | - | $ | 102 | $ | 5,195 | ||||||||||||||||
| Charge-offs | (220 | ) | (309 | ) | - | - | (387 | ) | - | - | (916 | ) | ||||||||||||||||||||
| Recoveries | 63 | 14 | - | 10 | 119 | - | - | 206 | ||||||||||||||||||||||||
| Provision | (910 | ) | 1,758 | 15 | 90 | 1,140 | - | (88 | ) | 2,005 | ||||||||||||||||||||||
| Ending Balance | $ | 1,623 | $ | 2,045 | $ | 137 | $ | 784 | $ | 1,887 | $ | - | $ | 14 | $ | 6,490 | ||||||||||||||||
| Individually Evaluated for Impairment | $ | - | $ | 408 | $ | - | $ | 9 | $ | - | $ | - | $ | - | $ | 417 | ||||||||||||||||
| Collectively Evaluated for Potential Impairment | $ | 1,623 | $ | 1,637 | $ | 137 | $ | 775 | $ | 1,887 | $ | - | $ | 14 | $ | 6,073 | ||||||||||||||||
| 100 |
The following tables present the major classifications of loans summarized by individually evaluated for impairment and collectively evaluated for potential impairment as of December 31, 2017 and 2016:
| (Dollars in thousands) | ||||||||||||||||||||||||||||
| 2017 | ||||||||||||||||||||||||||||
| Real Estate Residential | Real Estate Commercial | Real Estate Construction | Commercial and Industrial | Consumer | Other | Total | ||||||||||||||||||||||
| Originated Loans | ||||||||||||||||||||||||||||
| Individually Evaluated for Impairment | $ | 89 | $ | 3,622 | $ | 578 | $ | 3,929 | $ | - | $ | 1 | $ | 8,219 | ||||||||||||||
| Collectively Evaluated for Potential Impairment | 200,397 | 156,613 | 35,571 | 96,365 | 114,358 | 3,375 | 606,679 | |||||||||||||||||||||
| $ | 200,486 | $ | 160,235 | $ | 36,149 | $ | 100,294 | $ | 114,358 | $ | 3,376 | $ | 614,898 | |||||||||||||||
| Loans Acquired at Fair Value | ||||||||||||||||||||||||||||
| Individually Evaluated for Impairment | $ | 1,257 | $ | 927 | $ | - | $ | 266 | $ | - | $ | - | $ | 2,450 | ||||||||||||||
| Collectively Evaluated for Potential Impairment | 71,695 | 47,875 | - | 7,275 | 199 | - | 127,044 | |||||||||||||||||||||
| $ | 72,952 | $ | 48,802 | $ | - | $ | 7,541 | $ | 199 | $ | - | $ | 129,494 | |||||||||||||||
| Total Loans | ||||||||||||||||||||||||||||
| Individually Evaluated for Impairment | $ | 1,346 | $ | 4,549 | $ | 578 | $ | 4,195 | $ | - | $ | 1 | $ | 10,669 | ||||||||||||||
| Collectively Evaluated for Potential Impairment | 272,092 | 204,488 | 35,571 | 103,640 | 114,557 | 3,375 | 733,723 | |||||||||||||||||||||
| $ | 273,438 | $ | 209,037 | $ | 36,149 | $ | 107,835 | $ | 114,557 | $ | 3,376 | $ | 744,392 | |||||||||||||||
| 2016 | ||||||||||||||||||||||||||||
| Real Estate Residential | Real Estate Commercial | Real Estate Construction | Commercial and Industrial | Consumer | Other | Total | ||||||||||||||||||||||
| Originated Loans | ||||||||||||||||||||||||||||
| Individually Evaluated for Impairment | $ | - | $ | 3,361 | $ | 702 | $ | 2,765 | $ | - | $ | 4 | $ | 6,832 | ||||||||||||||
| Collectively Evaluated for Potential Impairment | 186,077 | 136,533 | 9,944 | 68,326 | 114,007 | 3,633 | 518,520 | |||||||||||||||||||||
| $ | 186,077 | $ | 139,894 | $ | 10,646 | $ | 71,091 | $ | 114,007 | $ | 3,637 | $ | 525,352 | |||||||||||||||
| Loans Acquired at Fair Value | ||||||||||||||||||||||||||||
| Individually Evaluated for Impairment | $ | 1,300 | $ | 1,007 | $ | - | $ | 562 | $ | - | $ | - | $ | 2,869 | ||||||||||||||
| Collectively Evaluated for Potential Impairment | 84,211 | 60,109 | - | 9,159 | 197 | - | 153,676 | |||||||||||||||||||||
| $ | 85,511 | $ | 61,116 | $ | - | $ | 9,721 | $ | 197 | $ | - | $ | 156,545 | |||||||||||||||
| Total Loans | ||||||||||||||||||||||||||||
| Individually Evaluated for Impairment | $ | 1,300 | $ | 4,368 | $ | 702 | $ | 3,327 | $ | - | $ | 4 | $ | 9,701 | ||||||||||||||
| Collectively Evaluated for Potential Impairment | 270,288 | 196,642 | 9,944 | 77,485 | 114,204 | 3,633 | 672,196 | |||||||||||||||||||||
| $ | 271,588 | $ | 201,010 | $ | 10,646 | $ | 80,812 | $ | 114,204 | $ | 3,637 | $ | 681,897 | |||||||||||||||
| 101 |
NOTE 6—PREMISES AND EQUIPMENT
Major classifications of premises and equipment are summarized as follows:
| (Dollars in thousands) | ||||||||
| 2017 | 2016 | |||||||
| Land | $ | 2,040 | $ | 2,067 | ||||
| Building | 16,217 | 11,285 | ||||||
| Leasehold Improvements | 1,795 | 1,854 | ||||||
| Furniture, Fixtures, and Equipment | 10,574 | 10,066 | ||||||
| Property Held Under Capital Lease | 299 | 299 | ||||||
| Fixed Assets in Process | 2,302 | 4,194 | ||||||
| 33,227 | 29,765 | |||||||
| Less Accumulated Depreciation and Amortization | (16,515 | ) | (15,633 | ) | ||||
| Total Premises and Equipment | $ | 16,712 | $ | 14,132 | ||||
Depreciation and amortization expense on premises and equipment was $1.1 million, $1.0 million, and $921,000 for the years ended December 31, 2017, 2016, and 2015, respectively. Commitments for awarded construction contracts were $3.6 million and $4.5 million, of which $250,000 and $4.5 million have been paid as of December 31, 2017 and 2016, respectively. There were no commitments for awarded construction contracts for the year ended December 31, 2015.
NOTE 7—CORE DEPOSIT INTANGIBLE
A summary of core deposit intangible assets is as follows:
| Carrying Amount | ||||
| Balance at December 31, 2015 | $ | 4,353 | ||
| Amortization Expense | (534 | ) | ||
| Balance at December 31, 2016 | 3,819 | |||
| Amortization Expense | (535 | ) | ||
| Balance at December 31, 2017 | $ | 3,284 | ||
Core deposit intangible assets related to the FedFirst merger totaled $5.0 million, with an estimated life of approximately nine years. Amortization expense on the core deposit intangible is expected to be approximately $535,000 per year and is expected to total approximately $2.7 million over the next five years.
NOTE 8—DEPOSITS
The following table shows the maturities of time deposits for the next five years and beyond as of December 31, 2017 (dollars in thousands):
| 2017 | ||||
| 2018 | $ | 62,153 | ||
| 2019 | 54,576 | |||
| 2020 | 20,065 | |||
| 2021 | 10,607 | |||
| 2022 | 9,050 | |||
| Beyond 2022 | 7,850 | |||
| Total | $ | 164,301 | ||
The balance in time deposits that meet or exceed the FDIC insurance limit of $250,000 totaled $52.1 million and $46.0 million as of December 31, 2017 and 2016, respectively.
| 102 |
NOTE 9—SHORT-TERM BORROWINGS
The following table sets forth the components of short-term borrowings as of the years indicated.
| (Dollars in thousands) | ||||||||||||||||
| 2017 | 2016 | |||||||||||||||
| Amount | Weighted Average Rate | Amount | Weighted Average Rate | |||||||||||||
| Short-term Borrowings | ||||||||||||||||
| Federal Funds Purchased: | ||||||||||||||||
| Average Balance Outstanding During the Period | $ | 75 | - | % | $ | 307 | 0.65 | % | ||||||||
| Maximum Amount Outstanding at any Month End | 550 | 6,000 | ||||||||||||||
| FHLB Borrowings: | ||||||||||||||||
| Balance at Period End | 13,764 | 1.57 | - | - | ||||||||||||
| Average Balance Outstanding During the Period | 215 | 0.93 | 596 | 0.67 | ||||||||||||
| Maximum Amount Outstanding at any Month End | 13,764 | 6,160 | ||||||||||||||
| Securities Sold Under Agreements to Repurchase: | ||||||||||||||||
| Balance at Period End | 25,841 | 0.26 | 27,027 | 0.24 | ||||||||||||
| Average Balance Outstanding During the Period | 26,350 | 0.31 | 26,311 | 0.26 | ||||||||||||
| Maximum Amount Outstanding at any Month End | 27,951 | 30,095 | ||||||||||||||
| Securities Collaterizing the Agreements at Period-End: | ||||||||||||||||
| Carrying Value | 38,953 | 33,785 | ||||||||||||||
| Market Value | 38,081 | 32,931 | ||||||||||||||
NOTE 10—OTHER BORROWED FUNDS
Other borrowed funds consist of fixed rate, long-term advances from the FHLB with remaining maturities as follows:
| (Dollars in thousands) | ||||||||||||||||
| 2017 | 2016 | |||||||||||||||
| Amount | Weighted Average Rate | Amount | Weighted Average Rate | |||||||||||||
| Due in One Year | $ | 4,500 | 1.41 | % | $ | 3,500 | 0.94 | % | ||||||||
| Due After One Year to Two Years | 6,000 | 1.78 | 4,500 | 1.41 | ||||||||||||
| Due After Two Years to Three Years | 6,000 | 1.97 | 6,000 | 1.78 | ||||||||||||
| Due After Three Years to Four Years | 5,000 | 2.18 | 6,000 | 1.97 | ||||||||||||
| Due After Four Years to Five Years | 3,000 | 2.41 | 5,000 | 2.18 | ||||||||||||
| Due After Five Years | - | - | 3,000 | 2.41 | ||||||||||||
| Total | $ | 24,500 | 1.92 | $ | 28,000 | 1.80 | ||||||||||
The Company maintains a credit arrangement with the FHLB with a maximum borrowing limit of approximately $298.4 million as of December 31, 2017. This arrangement is subject to annual renewal, incurs no service charge, and is secured by a blanket security agreement on outstanding residential mortgage loans and the Company’s investment in FHLB stock. Under this arrangement the Company had available a variable rate line of credit in the amount of $143.1 million and $148.5 million as of December 31, 2017 and 2016, respectively.
A Borrower-In-Custody of Collateral agreement was entered into with the Federal Reserve Bank for an $89.1 million line of credit. This credit agreement requires quarterly certification of collateral, is subject to annual renewal, incurs no service charge, and is secured by commercial and consumer indirect loans. The Company also maintains multiple line of credit arrangements with various banks totaling $40.0 million. As of December 31, 2017, no draws had been taken on these facilities.
| 103 |
NOTE 11—INCOME TAXES
The Tax Cuts and Jobs Act (the “Tax Act”) was enacted on December 22, 2017. The Tax Act reduces the US federal corporate tax rate from 35% to 21%. At December 31, 2017, we have completed our accounting for the tax effects of enactment of the Act.
As described below, we have made a reasonable estimate of the effects on our existing deferred tax balances as of December 31, 2017. We re-measured all of our deferred tax assets (“DTA”) and liabilities (“DTL”) based on the rates at which they are expected to reverse in the future. We recognized an income tax benefit of $89,000 for the year ended December 31, 2017 related to adjusting our net deferred tax liability balance to reflect the new corporate tax rate.
In addition, DTAs/DTLs related to available for sale (“AFS”) securities unrealized losses that were revalued as of December 31, 2017 noted above created a “stranded tax effects” in Accumulated Other Comprehensive Income (“AOCI”) due enactment of the Tax Act. The issue arose due to the nature of GAAP recognition of tax rate change effects on the AFS DTA/DTL revaluation as an adjustment to income tax provision.
In February 2018, FASB issued ASU 2018-02 - Income Statement - Reporting Comprehensive Income (Topic 220). As disclosed in Note 1, the Company early adopted the provisions of the ASU 2018-02 and recorded a reclassification adjustment of $220,000 from AOCI to retained earnings for stranded tax effects related to AFS securities resulting from the newly enacted corporate tax rate. The amount of the reclassification was the difference between the 35 percent historical corporate tax rate and the newly enacted 21 percent corporate tax rate. See Statement of Changes in Stockholders Equity for additional details and reclassification impact due to impact of the ASU 2018-02.
The accounting for the effects of the tax rate change on deferred tax balances is complete and no provisional amounts were recorded for this item.
Reconciliation of income tax provision for the years ended December 31, 2017, 2016 and 2015:
| (Dollars in thousands) | ||||||||||||
| 2017 | 2016 | 2015 | ||||||||||
| Current Payable | $ | 3,137 | $ | 3,179 | $ | 3,462 | ||||||
| Tax Act impact of the stranded tax effect related to deferred taxes for AFS securities | 220 | - | - | |||||||||
| Tax Act impact on remaining deferred tax assets and liabilities | (309 | ) | - | - | ||||||||
| Deferred Benefit | (174 | ) | (67 | ) | (19 | ) | ||||||
| Total Provision | $ | 2,874 | $ | 3,112 | $ | 3,443 | ||||||
| 104 |
The tax effects of deductible and taxable temporary differences that gave rise to significant portions of the net deferred tax assets and liabilities are as follows:
| (Dollars in thousands) | ||||||||||||
| 2017 | 2016 | |||||||||||
| Deferred Tax Assets: | ||||||||||||
| Allowance for Loan Losses | $ | 1,847 | $ | 2,653 | ||||||||
| Amortization of Core Deposit Intangible | 9 | 28 | ||||||||||
| Amortization of Intangibles | 68 | 105 | ||||||||||
| Postretirement Benefits | 31 | 54 | ||||||||||
| Net Unrealized Loss on Securities | 357 | 607 | ||||||||||
| Passthrough Entities | 2 | 4 | ||||||||||
| Stock-Based Compensation Expense | 17 | 14 | ||||||||||
| Other | 92 | 181 | ||||||||||
| Gross Deferred Tax Assets | 2,423 | 3,646 | ||||||||||
| Deferred Tax Liabilities: | ||||||||||||
| Deferred Origination Fees and Costs | 260 | 395 | ||||||||||
| Depreciation | 375 | 421 | ||||||||||
| Mortgage Servicing Rights | 191 | 272 | ||||||||||
| Purchase Accounting Adjustments | 1,340 | 2,111 | ||||||||||
| Goodwill | 379 | 578 | ||||||||||
| Other | - | 4 | ||||||||||
| Gross Deferred Tax Liabilities | 2,545 | 3,781 | ||||||||||
| Net Deferred Tax Liabilities | (1 | ) | $ | (122 | ) | $ | (135 | ) | ||||
| (1) | The 2017 DTAs and DTLs are tax effected by 21% according to the 2017 enactment of the Tax Cuts and Jobs Act. The 2016 DTAs and DTLs are tax effected by the Company’s statutory tax rate of 34%. |
No valuation allowance was established against the deferred tax assets in view of the Company’s ability to carryback taxes paid in previous years, cumulative history of earnings and anticipated future taxable income as evidenced by the Company’s earnings potential at December 31, 2017, 2016 and 2015.
Deferred taxes at December 31, 2017 and 2016, are included in other assets in the accompanying Consolidated Statement of Financial Condition.
A reconciliation of the federal income tax expense at statutory income tax rates and the actual income tax expense on income before taxes is shown below:
| (Dollars in thousands) | ||||||||||||||||||||||||
| 2017 | 2016 | 2015 | ||||||||||||||||||||||
| Amount | Percent of Pre-tax Income | Amount | Percent of Pre-tax Income | Amount | Percent of Pre-tax Income | |||||||||||||||||||
| Provision at Statutory Rate | $ | 3,338 | 34.0 | % | $ | 3,635 | 34.0 | % | $ | 4,033 | 34.0 | % | ||||||||||||
| State Taxes (Net of Federal Benefit) | 79 | 0.8 | 56 | 0.5 | 94 | 0.8 | ||||||||||||||||||
| Effect of Tax-Free Income | (395 | ) | (4.0 | ) | (404 | ) | (3.8 | ) | (432 | ) | (3.6 | ) | ||||||||||||
| BOLI Income | (162 | ) | (1.6 | ) | (163 | ) | (1.5 | ) | (158 | ) | (1.3 | ) | ||||||||||||
| Merger Expenses | 119 | 1.2 | - | - | - | - | ||||||||||||||||||
| Stock Options - ISO | 51 | 0.5 | 38 | 0.4 | 5 | 0.0 | ||||||||||||||||||
| Effect of the enactment of the Tax Act | (89 | ) | (0.9 | ) | - | - | - | - | ||||||||||||||||
| Other | (67 | ) | (0.7 | ) | (50 | ) | (0.5 | ) | (99 | ) | (0.9 | ) | ||||||||||||
| Actual Tax Expense and Effective Rate | $ | 2,874 | 29.3 | % | $ | 3,112 | 29.1 | % | $ | 3,443 | 29.0 | % | ||||||||||||
| 105 |
The Company’s federal and Pennsylvania income tax returns are no longer subject to examination by federal or Commonwealth of Pennsylvania taxing authorities for years before 2014. As of December 31, 2017 and 2016, there were no unrecognized tax benefits. The Company recognizes interest accrued related to unrecognized tax benefits in interest expense and penalties in operating expenses. There were no interest or penalties accrued at December 31, 2017 and 2016.
NOTE 12—EMPLOYEE BENEFITS
SAVINGS AND PROFIT SHARING PLAN
The Company maintains a Cash or Deferred Profit-sharing Section 401(k) Plan with contributions matching those by eligible employees for the first 4% of an employee’s contribution at the rate of $0.25 on the dollar. All employees who are over the age of 18 and completed six months of employment are eligible to participate in the plan. The Company made contributions of $141,000, $140,000 and $124,000 in 2017, 2016 and 2015, respectively, to this plan. The 401(k) Plan includes a “safe harbor” provision and a discretionary retirement contribution. The Company made contributions of $636,000, $515,000, and $558,000 for the “safe harbor” provision in 2017, 2016 and 2015, respectively.
2015 EQUITY INCENTIVE PLAN AND STOCK OPTION PLANS
Details of the restricted stock awards and stock option grant under the 2015 Equity Incentive Plan are summarized as follows at the grant date indicated.
| December 15, 2017 | December 16, 2016 | December 16, 2015 | ||||||||||
| Number of restricted shares granted | 8,250 | 6,086 | 9,555 | |||||||||
| Number of stock options granted | 40,015 | 50,000 | 177,500 | |||||||||
| Grant date common stock price | $ | 30.75 | $ | 26.45 | $ | 22.25 | ||||||
| Restricted shares market value before tax | 254 | 161 | 213 | |||||||||
| Stock options market value before tax | 248 | 244 | 706 | |||||||||
| Stock option pricing assumptions | ||||||||||||
| Expected life in years | 6.5 | 6.5 | 6.5 | |||||||||
| Expected dividend yield | 2.86 | % | 3.33 | % | 3.96 | % | ||||||
| Risk-free interest rate | 2.05 | % | 1.90 | % | 1.67 | % | ||||||
| Expected volatility | 26.2 | % | 25.7 | % | 28.2 | % | ||||||
| Weighted average grant date fair value | $ | 6.21 | $ | 4.87 | $ | 3.98 | ||||||
The Company recognizes expense over the one-year vesting period for the restricted stock awards and the five-year vesting period for the stock options. Stock-based compensation expense related to restricted stock awards and stock options was $361,000, $353,000 and $15,000 for the years ended December 31, 2017, 2016 and 2015, respectively. As of December 31, 2017, 2016 and 2015, respectively, total unrecognized compensation expense was $850,000, $800,000 and $683,000 related to nonvested stock options, and $ 242,000, $154,000 and $204,000 related to restricted stock awards. The Company accrued tax benefit for non-qualified stock options of $13,000, $10,000 and $1,000 for the years ended December 31, 2017, 2016 and 2015, respectively.
Intrinsic value represents the amount by which the fair value of the underlying stock at December 31, 2017, 2016 and 2015, exceeds the exercise price of the stock options. The intrinsic value of stock options was $1.5 million, $638,000 and $119,000 at December 31, 2017, 2016, and 2015, respectively.
At December 31, 2017, 2016 and 2015, respectively, there were 5,991, 43,931 and 93,931 shares available under the Plan to be issued in connection with the exercise of stock options, and 111,824, 120,074 and 126,160 shares that may be issued as restricted stock awards or units. Restricted stock awards or units may be issued above this amount provided that the number of shares reserved for stock options is reduced by three shares for each restricted stock award or unit share granted.
| 106 |
The following table presents stock option data for the years indicated:
| 2017 | 2016 | 2015 | ||||||||||||||||||||||||||||||||||
| Number of Shares | Weighted Average Exercise Price | Weighted Average Remaining Contractual Life in Years | Number of Shares | Weighted Average Exercise Price | Weighted Average Remaining Contractual Life in Years | Number of Shares | Weighted Average Exercise Price | Weighted Average Remaining Contractual Life in Years | ||||||||||||||||||||||||||||
| Outstanding at beginning of year | 227,100 | 23.17 | 9.2 | 177,500 | $ | 22.25 | 9.0 | - | $ | - | - | |||||||||||||||||||||||||
| Granted | 40,015 | 30.75 | 10.0 | 50,000 | 26.45 | 10.0 | 177,500 | 22.25 | ||||||||||||||||||||||||||||
| Exercised | (1,400 | ) | 22.25 | (400 | ) | 22.25 | - | - | ||||||||||||||||||||||||||||
| Forfeited | (2,075 | ) | 23.21 | - | - | - | - | |||||||||||||||||||||||||||||
| Outstanding at end of year | 263,640 | 24.33 | 8.5 | 227,100 | 23.17 | 9.2 | 177,500 | 22.25 | 10.0 | |||||||||||||||||||||||||||
| Exercisable at end of year | 78,705 | 22.78 | 8.1 | 35,100 | 22.25 | 9.0 | - | - | - | |||||||||||||||||||||||||||
| Number of Shares | Weighted Average Exercise Price | Weighted Average Remaining Service Period in Years | Number of Shares | Weighted Average Exercise Price | Weighted Average Remaining Service Period in Years | Number of Shares | Weighted Average Exercise Price | Weighted Average Remaining Service Period in Years | ||||||||||||||||||||||||||||
| Nonvested at end of year | 184,935 | $ | 24.99 | 5.0 | 192,000 | $ | 23.34 | 5.0 | 177,500 | $ | 22.25 | 5.0 | ||||||||||||||||||||||||
The following table presents restricted stock award data at the dates indicated.
| Number of Shares | Weighted Average Grant Date Fair Value Price | Weighted Average Remaining Service Period in Years | ||||||||||
| Nonvested at December 31, 2015 | 9,555 | $ | 22.25 | 1.0 | ||||||||
| Granted | 6,086 | 26.45 | 1.0 | |||||||||
| Vested | (9,555 | ) | (22.25 | ) | (1.0 | ) | ||||||
| Forfeited | - | - | - | |||||||||
| Nonvested at December 31, 2016 | 6,086 | $ | 26.45 | 1.0 | ||||||||
| Granted | 8,250 | 30.75 | 1.0 | |||||||||
| Vested | (6,086 | ) | (26.45 | ) | (1.0 | ) | ||||||
| Forfeited | - | - | - | |||||||||
| Nonvested at December 31, 2017 | 8,250 | $ | 30.75 | 1.0 | ||||||||
NOTE 13—COMMITMENTS AND CONTINGENT LIABILITIES
The Company is a party to financial instruments with off-balance-sheet risk in the normal course of business primarily to meet the financing needs of its customers. These financial instruments include commitments to extend credit and standby and performance letters of credit. Those instruments involve, to varying degrees, elements of credit and interest rate risk in excess of the amount recognized in the Statement of Financial Condition. The contract amounts of those instruments reflect the extent of involvement the Company has in particular classes of financial instruments.
The Company’s exposure to credit loss in the event of nonperformance by the other party to the financial instrument for commitments to extend credit and standby and performance letters of credit written is represented by the contractual amount of those instruments. The Company uses the same credit policies in making commitments and conditional obligations as it does for on-balance-sheet instruments.
| 107 |
The unused and available credit balances of financial instruments whose contracts represent credit risk at December 31, 2017 and 2016 are as follows:
| (Dollars in thousands) | ||||||||
| 2017 | 2016 | |||||||
| Standby Letters of Credit | $ | 55,105 | $ | 36,657 | ||||
| Performance Letters of Credit | 4,339 | 2,471 | ||||||
| Construction Mortgages | 30,619 | 21,363 | ||||||
| Personal Lines of Credit | 6,183 | 5,905 | ||||||
| Overdraft Protection Lines | 6,167 | 5,680 | ||||||
| Home Equity Lines of Credit | 16,337 | 14,722 | ||||||
| Commercial Lines of Credit | 62,088 | 51,725 | ||||||
| $ | 180,838 | $ | 138,523 | |||||
Commitments to extend credit are agreements to lend to a customer as long as there is no violation of any condition established in the contract. Commitments generally have fixed expiration dates or other termination clauses and may require payment of a fee. Because many of the commitments are expected to expire without being drawn upon, the total commitment amounts do not necessarily represent future cash requirements. The Company evaluates each customer’s creditworthiness on a case-by-case basis. The amount of collateral obtained, if deemed necessary by the Company upon extension of credit, is based on management’s credit evaluation of the counterparty. Collateral held varies, but may include accounts receivable, inventory, property, plant and equipment, and income-producing commercial properties.
Performance letters of credit represent conditional commitments issued by the Company to guarantee the performance of a customer to a third party. These instruments are issued primarily to support bid or performance-related contracts. The coverage period for these instruments is typically a one-year period with an annual renewal option subject to prior approval by management. Fees earned from the issuance of these letters are recognized upon expiration of the letter. For secured letters of credit, the collateral is typically Company deposit instruments or customer business assets.
NOTE 14—REGULATORY CAPITAL
The Company and the Bank are subject to various regulatory capital requirements administered by the federal banking agencies. Failure to meet minimum capital requirements can result in certain mandatory and possibly additional discretionary actions by regulators that, if undertaken, could have a direct material effect on the Company’s financial statements. Under capital adequacy guidelines and the regulatory framework for prompt corrective action, each must meet specific capital guidelines that involve quantitative measures of their assets, liabilities and certain off-balance-sheet items as calculated under regulatory accounting practices. The capital amounts and classification are also subject to qualitative judgments by the regulators about components, risk weightings and other factors.
Quantitative measures established by regulation to ensure capital adequacy require the Company and the Bank to maintain minimum amounts and ratios of total and Tier 1 capital to risk-weighted assets and of Tier 1 capital to average assets. Management believes, as of December 31, 2017, that the Company and the Bank met all capital adequacy requirements to which they were subject at that date.
As of December 31, 2017, the most recent notification from the Federal Deposit Insurance Corporation categorized the Company as well capitalized under the regulatory framework for prompt corrective action. There are no conditions or events since that notification that management believes have changed the institution’s category.
| 108 |
The Bank’s actual capital ratios are presented in the following table, which shows that it met all regulatory capital requirements at December 31, 2017 and 2016. The Company’s capital ratios are comparable to those shown for the Bank.
| (Dollars in thousands) | ||||||||||||||||
| December 31, 2017 | December 31, 2016 | |||||||||||||||
| Amount | Ratio | Amount | Ratio | |||||||||||||
| Common Equity Tier 1 Capital (to Risk-Weighted Assets) | ||||||||||||||||
| Actual | $ | 84,599 | 12.22 | % | $ | 81,845 | 13.38 | % | ||||||||
| For Capital Adequacy Purposes | 31,159 | 4.50 | 27,533 | 4.50 | ||||||||||||
| To Be Well Capitalized | 45,008 | 6.50 | 39,770 | 6.50 | ||||||||||||
| Tier I Capital (to Risk-Weighted Assets) | ||||||||||||||||
| Actual | 84,599 | 12.22 | 81,845 | 13.38 | ||||||||||||
| For Capital Adequacy Purposes | 41,546 | 6.00 | 36,711 | 6.00 | ||||||||||||
| To Be Well Capitalized | 55,395 | 8.00 | 48,947 | 8.00 | ||||||||||||
| Total Capital (to Risk-Weighted Assets) | ||||||||||||||||
| Actual | 93,257 | 13.47 | 89,497 | 14.63 | ||||||||||||
| For Capital Adequacy Purposes | 55,395 | 8.00 | 48,947 | 8.00 | ||||||||||||
| To Be Well Capitalized | 69,243 | 10.00 | 61,184 | 10.00 | ||||||||||||
| Tier I Leverage Capital (to Adjusted Total Assets) | ||||||||||||||||
| Actual | 84,599 | 9.27 | 81,845 | 9.80 | ||||||||||||
| For Capital Adequacy Purposes | 36,492 | 4.00 | 33,390 | 4.00 | ||||||||||||
| To Be Well Capitalized | 45,616 | 5.00 | 41,738 | 5.00 | ||||||||||||
Basel is a committee of central banks and bank regulators from major industrialized countries that develops broad policy guidelines for use by each country’s regulators with the purpose of ensuring that financial institutions have adequate capital given the risk levels of assets and off-balance-sheet financial instruments. In 2013, the Federal Reserve approved final rules that substantially amend the regulatory risk-based capital rules. The FDIC and the OCC subsequently approved these rules. The final rules implement the “Basel III” regulatory capital reforms and changes required by the Dodd-Frank Act. “Basel III” refers to two consultative documents released by the Basel Committee on Banking Supervision in December 2009, the rules text released in December 2010, and loss absorbency rules issued in January 2011, which include significant changes to bank capital, leverage and liquidity requirements.
The rules include new risk-based capital and leverage ratios, which are phased in from 2015 to 2019, and would refine the definition of what constitutes “capital” for purposes of calculating those ratios. The new minimum capital level requirements applicable to institutions under the final rules are as follows: (i) a new common equity Tier 1 capital ratio of 4.5%; (ii) a Tier 1 capital ratio of 6% (increased from 4%); (iii) a total capital ratio of 8% (unchanged from current rules); and (iv) a Tier 1 leverage ratio of 4% for all institutions.
The final rules also establish a “capital conservation buffer” above the new regulatory minimum capital requirements, which must consist entirely of common equity Tier 1 capital. The capital conservation buffer will be phased-in over four years beginning on January 1, 2016, as follows: the maximum buffer will be 0.625% of risk-weighted assets for 2016, 1.25% for 2017, 1.875% for 2018, and 2.5% for 2019 and thereafter. This will result in the following minimum ratios beginning in 2019: (i) a common equity Tier 1 capital ratio of 7.0%, (ii) a Tier 1 capital ratio of 8.5%, and (iii) a total capital ratio of 10.5%. Under the final rules, institutions are subject to limitations on paying dividends, engaging in share repurchases, and paying discretionary bonuses if its capital level falls below the buffer amount. These limitations establish a maximum percentage of eligible retained income that could be utilized for such actions.
Basel III provided discretion for regulators to impose an additional buffer, the “countercyclical buffer,” of up to 2.5% of common equity Tier 1 capital to take into account the macro-financial environment and periods of excessive credit growth. However, the final rules permit the countercyclical buffer to be applied only to “advanced approach banks” ( i.e., banks with $250 billion or more in total assets or $10 billion or more in total foreign exposures). The final rules also implement revisions and clarifications consistent with Basel III regarding the various components of Tier 1 capital, including common equity, and unrealized gains and losses, as well as certain instruments that will no longer qualify as Tier 1 capital, some of which will be phased out over time. However, the final rules provide that small depository institution holding companies with less than $15 billion in total assets as of December 31, 2009 will be able to permanently include non-qualifying instruments that were issued and included in Tier 1 or Tier 2 capital prior to May 19, 2010, in additional Tier 1 or Tier 2 capital until they redeem such instruments or until the instruments mature.
| 109 |
The final rules also contain revisions to the prompt corrective action framework, which is designed to place restrictions on insured depository institutions if their capital levels begin to show signs of weakness. These revisions took effect January 1, 2015. Under the prompt corrective action requirements, which are designed to complement the capital conservation buffer, insured depository institutions will be required to meet the following increased capital level requirements in order to qualify as “well capitalized:” (i) a new common equity Tier 1 capital ratio of 6.5%; (ii) a Tier 1 capital ratio of 8% (increased from 6%); (iii) a total capital ratio of 10% (unchanged from current rules); and (iv) a Tier 1 leverage ratio of 5% (increased from 4%).
The final rules set forth certain changes for the calculation of risk-weighted assets, which we were required to utilize beginning January 1, 2015. The standardized approach final rule utilizes an increased number of credit risk exposure categories and risk weights, and also addresses: (i) an alternative standard of creditworthiness consistent with Section 939A of the Dodd-Frank Act; (ii) revisions to recognition of credit risk mitigation; (iii) rules for risk weighting of equity exposures and past due loans; (iv) revised capital treatment for derivatives and repo-style transactions; and (v) disclosure requirements for top-tier banking organizations with $50 billion or more in total assets that are not subject to the “advance approach rules” that apply to banks with greater than $250 billion in consolidated assets.
NOTE 15—OPERATING LEASES
The Company leases several offices or the ground on which they are located under operating leases expiring by 2034.
Minimum future rental payments under noncancelable operating leases having remaining terms in excess of one year at December 31, 2017, are as follows (dollars in thousands):
| 2017 | ||||
| 2018 | $ | 399 | ||
| 2019 | 275 | |||
| 2020 | 151 | |||
| 2021 | 124 | |||
| 2022 | 73 | |||
| 2023 & thereafter | 499 | |||
| Total | $ | 1,521 | ||
Rental expense recorded was $531,000, $581,000 and $543,000 for the years ended December 31, 2017, 2016 and 2015, respectively.
NOTE 16—FAIR VALUE DISCLOSURE
FASB ASC 820 “Fair Value Measurement” defines fair value and provides the framework for measuring fair value and required disclosures about fair value measurements. Fair value is defined as the price that would be received for an asset or paid to transfer a liability in an orderly transaction between market participants in the principal or most advantageous market for the asset or liability at the market date. ASC 820 establishes a fair value hierarchy that prioritizes the inputs used in valuation methods to determine fair value.
The three levels of fair value hierarchy are as follows:
| Level I | – Fair value is based on unadjusted quoted prices in active markets that are accessible to the Company for identical assets. These generally provide the most reliable evidence and are used to measure fair value whenever available. |
| Level II | – Fair value is based on significant inputs, other than Level I inputs, that are observable either directly or indirectly for substantially the full term of the asset through corroboration with observable market data. Level II inputs include quoted market prices in active markets for similar assets, quoted market prices in markets that are not active for identical or similar assets, and other observable inputs. |
| Level III | – Fair value would be based on significant unobservable inputs. Examples of valuation methodologies that would result in Level III classification include option pricing models, discounted cash flows and other similar techniques. |
This hierarchy requires the use of observable market data when available. The level in the fair value hierarchy within which the fair value measurement falls is determined based on the lowest level input that is significant to the fair value measurement.
| 110 |
The following table presents the financial assets measured at fair value on a recurring basis and reported on the Consolidated Statement of Financial Condition as of December 31, 2017 and 2016, by level within the fair value hierarchy. The majority of the Company’s securities are included in Level II of the fair value hierarchy. Fair values for Level II securities were primarily determined by a third-party pricing service using both quoted prices for similar assets, when available, and model-based valuation techniques that derive fair value based on market-corroborated data, such as instruments with similar prepayment speeds and default interest rates. The standard inputs that are normally used include benchmark yields of like securities, reportable trades, broker/dealer quotes, issuer spreads, two-sided markets, benchmark securities, bids, offers, and reference data including market research publications.
| (Dollars in thousands) | ||||||||||
| Valuation | December 31, | |||||||||
| Hierarchy | 2017 | 2016 | ||||||||
| Available for Sale Securities: | ||||||||||
| U.S. Government Agencies | Level II | $ | 65,888 | $ | 66,156 | |||||
| Obligations of States and Political Subdivisions | Level II | 38,988 | 35,735 | |||||||
| Mortgage-Backed Securities - Government-Sponsored Enterprises | Level II | 16,978 | 2,619 | |||||||
| Equity Securities - Mutual Funds | Level I | 503 | 507 | |||||||
| Equity Securities - Other | Level I | 1,226 | 1,191 | |||||||
| Total Available for Sale Securities | $ | 123,583 | $ | 106,208 | ||||||
The following table presents the financial assets measured at fair value on a nonrecurring basis on the Consolidated Statement of Financial Condition as of the dates indicated by level within the fair value hierarchy. The table also presents the significant unobservable inputs used in the fair value measurements. Impaired loans that are collateral dependent are written down to fair value through the establishment of specific reserves. Techniques used to value the collateral that secure the impaired loans include: quoted market prices for identical assets classified as Level I inputs, and observable inputs, employed by certified appraisers, for similar assets classified as Level II inputs. In cases where valuation techniques included inputs that are unobservable and are based on estimates and assumptions developed by management based on the best information available under each circumstance, the asset valuation is classified as Level III inputs.
| (Dollars in thousands) | Significant | |||||||||||||||||||
| Valuation | Fair Value at December 31, | Valuation | Significant | Unobservable | ||||||||||||||||
| Financial Asset | Hierarchy | 2017 | 2016 | Techniques | Unobservable Inputs | Input Value | ||||||||||||||
| Impaired Loans | Level III | $ | 2,866 | $ | 2,497 | Market Comparable Properties | Marketability Discount | 10% to 30% | (1) | |||||||||||
| OREO | Level III | 321 | - | Market Comparable Properties | Marketability Discount | 10% to 50% | (1) | |||||||||||||
(1) Range includes discounts taken since appraisal and estimated values.
Impaired loans are evaluated and valued at the time the loan is identified as impaired, at the lower of cost or fair value. Fair value is measured based on the value of the collateral securing these loans and is classified as Level III in the fair value hierarchy. At December 31, 2017 and 2016, the value of impaired loans was $10.7 million and $9.7 million, respectively. Impaired loans at December 31, 2017 and 2016 with a related allowance recorded consist of the loan balance of $4.5 million and $3.7 million less their specific valuation allowances of $1.6 million and $1.2 million, respectively.
Financial instruments are defined as cash, evidence of an ownership in an entity, or a contract which creates an obligation or right to receive or deliver cash or another financial instrument from/to a second entity on potentially favorable or unfavorable terms.
Fair value is the price that would be received to sell an asset or paid to transfer a liability in an orderly transaction between market participants at the measurement date. If no readily available market exists, the fair value estimates for financial instruments should be based upon management’s judgment regarding current economic conditions, interest rate risk, expected cash flows, future estimated losses and other factors, as determined through various option pricing formulas or simulation modeling. As many of these assumptions result from judgments made by management based upon estimates that are inherently uncertain, the resulting estimated fair values may not be indicative of the amount realizable in the sale of a particular financial instrument. In addition, changes in the assumptions on which the estimated fair values are based may have significant impact on the resulting estimated fair values.
As certain assets, such as deferred tax assets and premises and equipment, are not considered financial instruments, the estimated fair value of financial instruments would not represent the full value of the Company.
| 111 |
The Company employed simulation modeling in determining the estimated fair value of financial instruments for which quoted market prices were not available, based upon the following assumptions:
Cash and Due From Banks, Restricted Stock, Bank-Owned Life Insurance, Accrued Interest Receivable, Short-Term Borrowings, and Accrued Interest Payable
The fair value is equal to the current carrying value.
Investment Securities (carried at fair value)
The fair value of investment securities is equal to the available quoted market price. If no quoted market price is available, fair value is estimated using the quoted market price for similar securities or matrix pricing, which is a mathematical technique used widely in the industry to value debt securities without relying exclusively on quoted market prices for the specific securities, but rather by relying on the securities’ relationship to other benchmark quoted prices.
Loans Receivable (carried at cost)
For variable-rate loans that reprice frequently and with no significant change in credit risk, fair values are based on carrying values. Fair values for certain mortgage loans, credit card loans and other consumer loans are based on quoted market prices of similar loans sold in conjunction with securitization transactions, adjusted for differences in loan characteristics. Fair values for other loans are estimated using discounted cash flow analyses using market interest rates for comparable loans. Fair values for nonperforming loans are estimated using discounted cash flow analyses or underlying collateral values, where applicable.
Deposit Liabilities (carried at cost)
The fair values disclosed for demand deposits, are, by definition, equal to the amount payable on demand at the reporting date. The carrying amounts of variable-rate, fixed-term money market accounts and certificates of deposit approximate their fair values at the reporting date. Fair values for fixed-rate certificates of deposit are estimated using a discounted cash flow calculation that applies market interest rates on comparable instruments to a schedule of aggregated expected monthly maturities on time deposits.
Borrowed Funds (carried at cost)
Fair values of borrowed funds are estimated using discounted cash flow analyses based on current market rates for similar types of borrowing arrangements.
Commitments to Extend Credit (carried at cost)
These financial instruments are generally not subject to sale and estimated fair values are not readily available. The carrying value, represented by the net deferred fee arising from the unrecognized commitment or letter of credit, and the fair value determined by discounting the remaining contractual fee over the term of the commitment using fees currently charged to enter into similar agreements with similar credit risk, are not considered material for disclosure. The contractual amounts of unfunded commitments and letters of credit are presented in Note 13.
| 112 |
The estimated fair values of the Company’s financial instruments at December 31, 2017 and 2016, are as follows:
| (Dollars in thousands) | ||||||||||||||||||
| 2017 | 2016 | |||||||||||||||||
| Valuation Method Used | Carrying Value | Fair Value | Carrying Value | Fair Value | ||||||||||||||
| Financial Assets: | ||||||||||||||||||
| Cash and Due From Banks: | ||||||||||||||||||
| Interest Bearing | Level I | $ | 11,685 | $ | 11,685 | $ | 7,699 | $ | 7,699 | |||||||||
| Non-Interest Bearing | Level I | 8,937 | 8,937 | 6,583 | 6,583 | |||||||||||||
| Investment Securities: | ||||||||||||||||||
| Available for Sale | See Above | 123,583 | 123,583 | 106,208 | 106,208 | |||||||||||||
| Loans, Net | Level III | 735,596 | 741,020 | 674,094 | 684,777 | |||||||||||||
| Restricted Stock | Level II | 4,340 | 4,340 | 3,665 | 3,665 | |||||||||||||
| Bank-Owned Life Insurance | Level II | 19,151 | 19,151 | 18,687 | 18,687 | |||||||||||||
| Accrued Interest Receivable | Level I | 2,707 | 2,707 | 2,441 | 2,441 | |||||||||||||
| Financial Liabilities: | ||||||||||||||||||
| Deposits | Level II | 773,344 | 748,450 | 698,218 | 697,806 | |||||||||||||
| Short-term Borrowings | Level I | 39,605 | 39,605 | 27,027 | 27,027 | |||||||||||||
| Other Borrowed Funds | Level II | 24,500 | 24,443 | 28,000 | 28,098 | |||||||||||||
| Accrued Interest Payable | Level I | 430 | 430 | 334 | 334 | |||||||||||||
NOTE 17—OTHER NONINTEREST EXPENSE
Other noninterest expense that exceeds 10% of total noninterest expense is required to be disclosed by detailed expenses. The details for other noninterest expense for the Company’s consolidated statement of income for the years ended December 31, 2017, 2016 and 2015, are as follows:
| (Dollars in thousands) | ||||||||||||
| 2017 | 2016 | 2015 | ||||||||||
| OTHER NONINTEREST EXPENSE | ||||||||||||
| Non-employee compensation | $ | 409 | $ | 540 | $ | 380 | ||||||
| Printing and supplies | 385 | 381 | 341 | |||||||||
| Postage | 218 | 213 | 209 | |||||||||
| Telephone | 398 | 391 | 346 | |||||||||
| Charitable Contributions | 140 | 129 | 128 | |||||||||
| Dues and subscriptions | 234 | 192 | 184 | |||||||||
| Loan expenses | 409 | 320 | 311 | |||||||||
| Meals and entertainment | 145 | 117 | 126 | |||||||||
| Travel | 162 | 151 | 173 | |||||||||
| Training | 29 | 38 | 51 | |||||||||
| Miscellaneous | 783 | 880 | 864 | |||||||||
| TOTAL OTHER NONINTEREST EXPENSE | $ | 3,312 | $ | 3,352 | $ | 3,113 | ||||||
| 113 |
NOTE 18—CONDENSED FINANCIAL STATEMENTS OF PARENT COMPANY
Financial information pertaining only to CB Financial Services, Inc., is as follows:
Statement of Financial Condition
| (Dollars in thousands) | ||||||||
| December 31, | ||||||||
| 2017 | 2016 | |||||||
| ASSETS | ||||||||
| Cash and Due From Banks | $ | 692 | $ | 132 | ||||
| Investment Securities, Available-for-Sale | 1,226 | 1,191 | ||||||
| Investment in Community Bank | 90,260 | 87,099 | ||||||
| Other Assets | 1,276 | 1,099 | ||||||
| TOTAL ASSETS | $ | 93,454 | $ | 89,521 | ||||
| LIABILITIES AND STOCKHOLDERS' EQUITY | ||||||||
| Other Liabilities | $ | 198 | $ | 52 | ||||
| Stockholders Equity | 93,256 | 89,469 | ||||||
| TOTAL LIABILITIES AND STOCKHOLDERS' EQUITY | $ | 93,454 | $ | 89,521 | ||||
Statement of Income
| (Dollars in thousands) | ||||||||||||
| Years Ended December 31, | ||||||||||||
| 2017 | 2016 | 2015 | ||||||||||
| Interest and Dividend Income | $ | 41 | $ | 31 | $ | 27 | ||||||
| Dividend from Bank Subsidiary | 4,047 | 3,892 | 3,461 | |||||||||
| Noninterest Income | 207 | 168 | - | |||||||||
| Noninterest Expense | (356) | - | - | |||||||||
| Income Before Undistributed Net Income of Subsidiary and Income Taxes | 3,939 | 4,091 | 3,488 | |||||||||
| Undistributed Net Income of Subsidiary | 3,072 | 3,549 | 4,935 | |||||||||
| Income Before Income Taxes | 7,011 | 7,640 | 8,423 | |||||||||
| Income Taxes | 67 | 60 | 3 | |||||||||
| NET INCOME | $ | 6,944 | $ | 7,580 | $ | 8,420 | ||||||
| 114 |
Statement of Comprehensive Income
| Years Ended December 31, | ||||||||||||
| 2017 | 2016 | 2015 | ||||||||||
| Net Income | $ | 6,944 | $ | 7,580 | $ | 8,420 | ||||||
| Other Comprehensive (Loss) Income: | ||||||||||||
| Unrealized (Losses) Gains on Available-for-Sale Securities Net of Income (Benefit) Tax of ($16), $0, and $10 for the Years Ended December 31, 2017, 2016, and 2015, Respectively | (31 | ) | - | 18 | ||||||||
| Reclassification Adjustment for Gains on Securities Included in Net Income, Net of Income Tax of $70 and $57 for the Years Ended December 31, 2017 and 2016, Respectively (1) | (137 | ) | (111 | ) | - | |||||||
| Other Comprehensive (Loss) Income, Net of Income (Benefit) Tax | (168 | ) | (111 | ) | 18 | |||||||
| Total Comprehensive Income | $ | 6,776 | $ | 7,469 | $ | 8,438 | ||||||
(1) The gross amount of gains on securities of $199 and $168 for the years ended December 31, 2017 and 2016, respectively, are reported as Noninterest Income on the Parent Company Statement of Income. The income tax effect of $70 and $57 for the years ended December 31, 2017 and 2016, respectively, are included in Income Taxes on the Parent Company Statement of Income.
| 115 |
Statement of Cash Flows
| (Dollars in thousands) | ||||||||||||
| Years Ended December 31, | ||||||||||||
| 2017 | 2016 | 2015 | ||||||||||
| OPERATING ACTIVITIES | ||||||||||||
| Net Income | $ | 6,944 | $ | 7,580 | $ | 8,420 | ||||||
| Αdjustmеnts to Rеconcilе Net Income to Net Cash | ||||||||||||
| Provided By Operating Activities: | ||||||||||||
| Undistributed Net Income of Subsidiary | (3,072 | ) | (3,549 | ) | (4,935 | ) | ||||||
| Gain on Sales of Investment Securities | (207 | ) | (168 | ) | - | |||||||
| Noncash Expense for Stock-Based Compensation | 361 | 353 | 15 | |||||||||
| Other, net | 96 | (210 | ) | (13 | ) | |||||||
| NET CASH PROVIDED BY OPERATING ACTIVITIES | 4,122 | 4,006 | 3,487 | |||||||||
| INVESTING ACTIVITIES | ||||||||||||
| Purchases of Securities | (1,058 | ) | (1,181 | ) | (27 | ) | ||||||
| Proceeds from Sales of Securities | 1,184 | 844 | - | |||||||||
| NET CASH PROVIDED BY (USED IN) INVESTING ACTIVITIES | 126 | (337 | ) | (27 | ) | |||||||
| FINANCING ACTIVITIES | ||||||||||||
| Cash Dividends Paid | (3,597 | ) | (3,592 | ) | (3,461 | ) | ||||||
| Treasury Stock, Purchases at Cost | (10 | ) | (14 | ) | - | |||||||
| Stock Award Grant | (112 | ) | (57 | ) | ||||||||
| Exercise of Stock Options | 31 | 2 | - | |||||||||
| NET CASH USED IN FINANCING ACTIVITIES | (3,688 | ) | (3,661 | ) | (3,461 | ) | ||||||
| INCREASE (DECREASE) IN CASH AND EQUIVALENTS | 560 | 8 | (1 | ) | ||||||||
| CASH AND CASH EQUIVALENTS AT BEGINNING OF YEAR | 132 | 124 | 125 | |||||||||
| CASH AND CASH EQUIVALENTS AT END OF YEAR | $ | 692 | $ | 132 | $ | 124 | ||||||
| 116 |
NOTE 19—QUARTERLY FINANCIAL INFORMATION (Unaudited)
The following tables summarize selected information regarding the Company’s results of operations for the periods indicated (dollars in thousands, except per share date). Quarterly earnings per share data may vary from annual earnings per share due to rounding.
| Three Months Ended | ||||||||||||||||
| 2017 | March 31 | June 30 | September 30 | December 31 | ||||||||||||
| Interest Income | $ | 7,791 | $ | 7,949 | $ | 8,213 | $ | 8,481 | ||||||||
| Interest Expense | 796 | 814 | 860 | 904 | ||||||||||||
| Net Interest Income | 6,995 | 7,135 | 7,353 | 7,577 | ||||||||||||
| Provision for Loan Losses | 420 | 300 | 300 | 850 | ||||||||||||
| Net Interest Income after Provision for Loan Losses | 6,575 | 6,835 | 7,053 | 6,727 | ||||||||||||
| Noninterest Income | 2,076 | 1,966 | 1,818 | 1,940 | ||||||||||||
| Noninterest Expense | 6,217 | 6,304 | 5,897 | 6,754 | ||||||||||||
| Income before Income Taxes | 2,434 | 2,497 | 2,974 | 1,913 | ||||||||||||
| Income Taxes | 730 | 696 | 910 | 538 | ||||||||||||
| Net Income | $ | 1,704 | $ | 1,801 | $ | 2,064 | $ | 1,375 | ||||||||
| Earnings Per Share - Basic | $ | 0.42 | $ | 0.44 | $ | 0.50 | $ | 0.34 | ||||||||
| Earnings Per Share - Diluted | 0.42 | 0.44 | 0.50 | 0.33 | ||||||||||||
| Dividends Per Share | 0.22 | 0.22 | 0.22 | 0.22 | ||||||||||||
| Three Months Ended | ||||||||||||||||
| 2016 | March 31 | June 30 | September 30 | December 31 | ||||||||||||
| Interest Income | $ | 8,122 | $ | 7,950 | $ | 7,684 | $ | 8,262 | ||||||||
| Interest Expense | 703 | 702 | 708 | 757 | ||||||||||||
| Net Interest Income | 7,419 | 7,248 | 6,976 | 7,505 | ||||||||||||
| Provision for Loan Losses | 850 | 300 | 450 | 440 | ||||||||||||
| Net Interest Income after Provision for Loan Losses | 6,569 | 6,948 | 6,526 | 7,065 | ||||||||||||
| Noninterest Income | 1,848 | 1,868 | 1,821 | 1,825 | ||||||||||||
| Noninterest Expense | 5,514 | 6,088 | 6,165 | 6,011 | ||||||||||||
| Income before Income Taxes | 2,903 | 2,728 | 2,182 | 2,879 | ||||||||||||
| Income Taxes | 858 | 790 | 607 | 857 | ||||||||||||
| Net Income | $ | 2,045 | $ | 1,938 | $ | 1,575 | $ | 2,022 | ||||||||
| Earnings Per Share - Basic | $ | 0.50 | $ | 0.48 | $ | 0.38 | $ | 0.50 | ||||||||
| Earnings Per Share - Diluted | 0.50 | 0.48 | 0.38 | 0.49 | ||||||||||||
| Dividends Per Share | 0.22 | 0.22 | 0.22 | 0.22 | ||||||||||||
117