Attached files
| file | filename |
|---|---|
| EX-99.1 - EX-99.1 - Bankwell Financial Group, Inc. | ex991q22020earningsrel.htm |
| 8-K - 8-K - Bankwell Financial Group, Inc. | bwfg-20200728.htm |

Bankwell Financial Group 2Q20 Investor Presentation
Safe Harbor This presentation may contain certain forward-looking statements about Bankwell Financial Group, Inc. (the “Company”). Forward-looking statements include statements regarding anticipated future events and can be identified by the fact that they do not relate strictly to historical or current facts. They often include words such as “believe,” “expect,” “would,” “should,” “could,” or “may.” Forward-looking statements, by their nature, are subject to risks and uncertainties. Certain factors that could cause actual results to differ materially from expected results include increased competitive pressures, changes in the interest rate environment, general economic conditions or conditions within the securities markets, and legislative and regulatory changes that could adversely affect the business in which the Company and its subsidiaries are engaged. The COVID-19 pandemic is adversely affecting Bankwell Financial Group, its customers, counterparties, employees, and third party service providers, and the ultimate extent of the impacts on its business, financial position, results of operations, liquidity, and prospects is unknown. 2
Table of Contents • 2Q20 Performance • COVID-19 Deferrals Update • Credit & Capital • Portfolio Overview • Bankwell History & Overview 3
2Q20 Performance
2Q20 Summary • $1.21 million reported net income, or $0.16 earnings per share ̶ $0.49 reduction in EPS due to incremental COVID-19 provision for loan loss • $4.49 million pre-tax, pre-provision net revenue (“PPNR”), or $0.57 per share1 ̶ Non interest expense includes $0.5 million of COVID-19-related expenses ̶ Temporary COVID-19 liquidity build adds $0.5 million interest expense • Deferral requests totaled $340 million, or 22% of outstanding loan balances ̶ Anticipate ~$228 million to resume normal payment schedules during 3Q20 • Maintained strong capital and liquidity during the quarter: ̶ ~$60 million total capital in excess of “well capitalized” ̶ Maintained increased on-balance sheet liquidity (14% at 6/30) ̶ $398 million of FHLB borrowing capacity & $42 million of additional bank lines • Continued to reduce deposit costs and to improve mix • 2Q20 Net Interest Margin (“NIM”) 2.89%; excluding the impact of COVID-19, NIM 3.10% • The Company declared the 3Q20 dividend of $0.14 per share 1 Pre-tax, pre-provision net revenue per share is a non-GAAP metric & excludes provision for loan losses and income tax expense 5
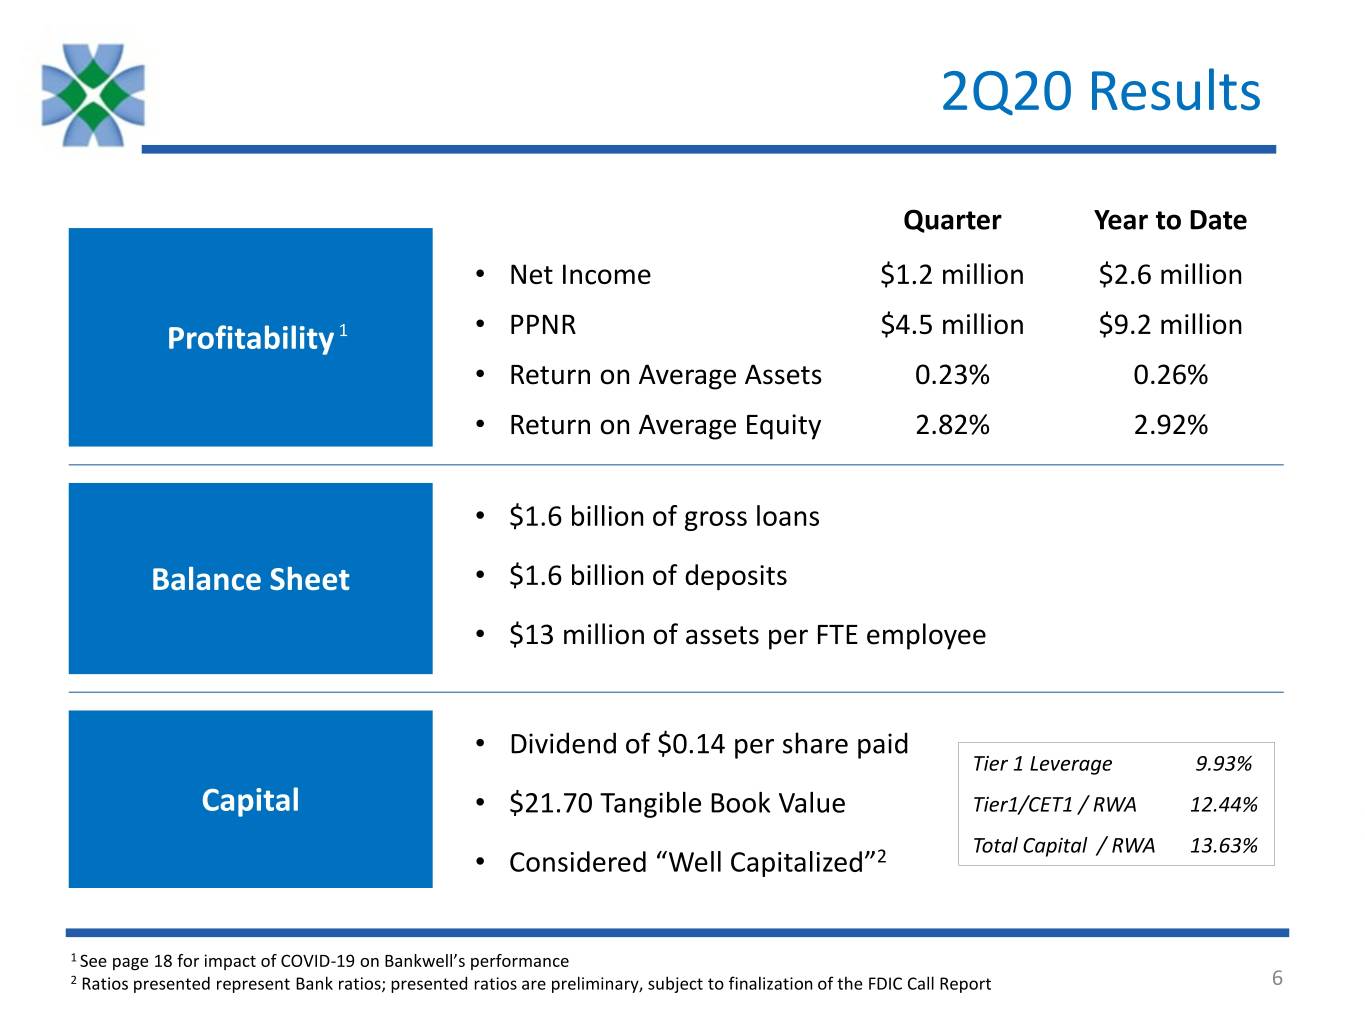
2Q20 Results Quarter Year to Date • Net Income $1.2 million $2.6 million Profitability 1 • PPNR $4.5 million $9.2 million • Return on Average Assets 0.23% 0.26% • Return on Average Equity 2.82% 2.92% • $1.6 billion of gross loans Balance Sheet • $1.6 billion of deposits • $13 million of assets per FTE employee • Dividend of $0.14 per share paid Tier 1 Leverage 9.93% Capital • $21.70 Tangible Book Value Tier1/CET1 / RWA 12.44% Total Capital / RWA 13.63% • Considered “Well Capitalized”2 1 See page 18 for impact of COVID-19 on Bankwell’s performance 2 Ratios presented represent Bank ratios; presented ratios are preliminary, subject to finalization of the FDIC Call Report 6
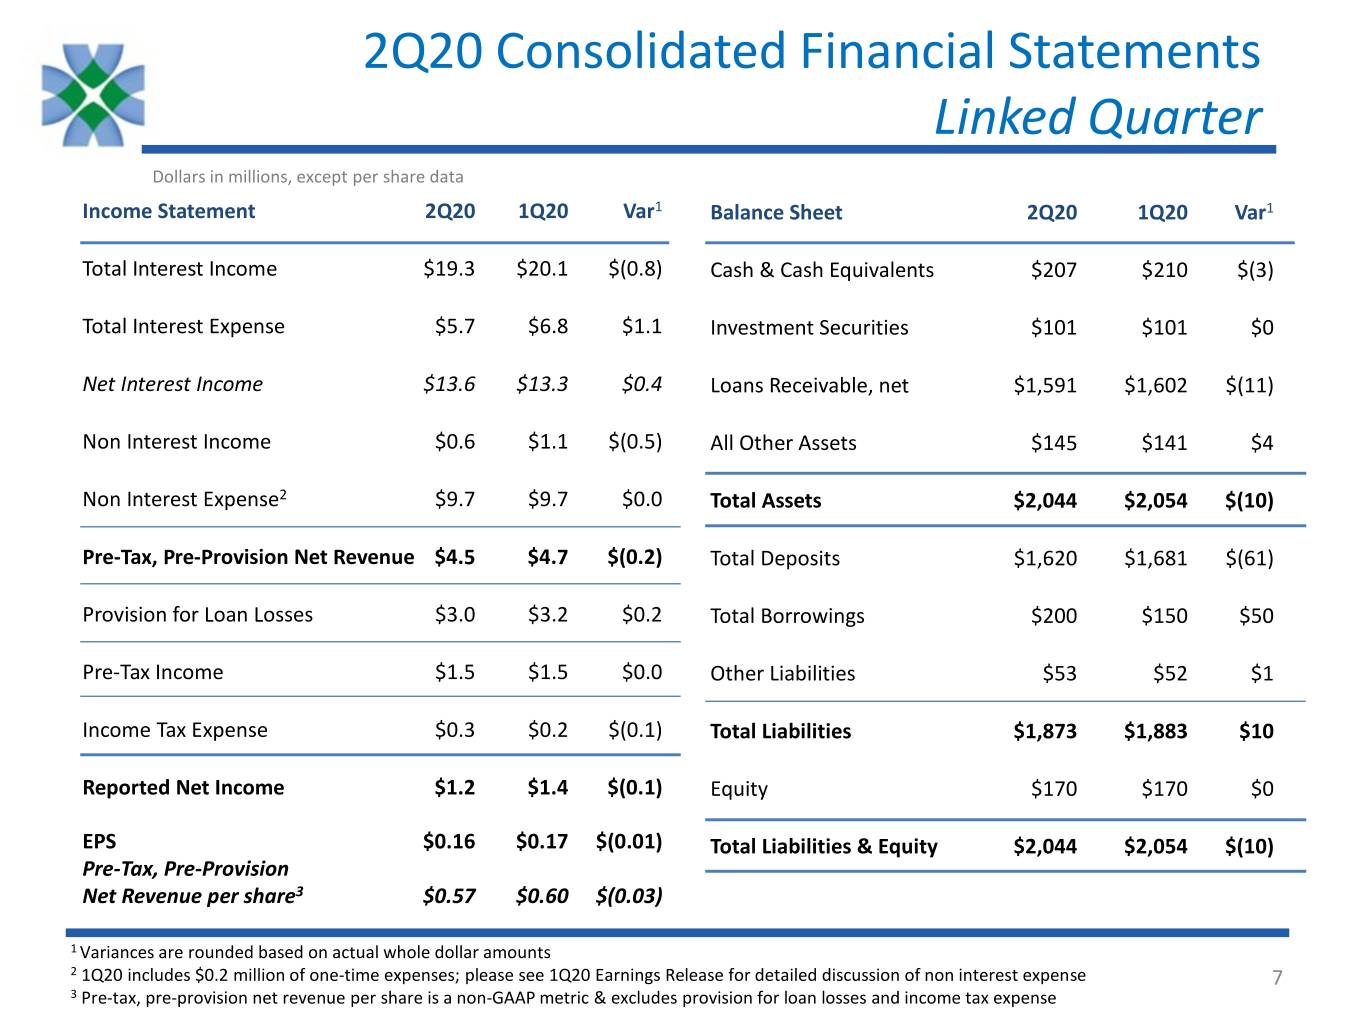
2Q20 Consolidated Financial Statements Linked Quarter Dollars in millions, except per share data Income Statement 2Q20 1Q20 Var1 Balance Sheet 2Q20 1Q20 Var1 Total Interest Income $19.3 $20.1 $(0.8) Cash & Cash Equivalents $207 $210 $(3) Total Interest Expense $5.7 $6.8 $1.1 Investment Securities $101 $101 $0 Net Interest Income $13.6 $13.3 $0.4 Loans Receivable, net $1,591 $1,602 $(11) Non Interest Income $0.6 $1.1 $(0.5) All Other Assets $145 $141 $4 Non Interest Expense2 $9.7 $9.7 $0.0 Total Assets $2,044 $2,054 $(10) Pre-Tax, Pre-Provision Net Revenue $4.5 $4.7 $(0.2) Total Deposits $1,620 $1,681 $(61) Provision for Loan Losses $3.0 $3.2 $0.2 Total Borrowings $200 $150 $50 Pre-Tax Income $1.5 $1.5 $0.0 Other Liabilities $53 $52 $1 Income Tax Expense $0.3 $0.2 $(0.1) Total Liabilities $1,873 $1,883 $10 Reported Net Income $1.2 $1.4 $(0.1) Equity $170 $170 $0 EPS $0.16 $0.17 $(0.01) Total Liabilities & Equity $2,044 $2,054 $(10) Pre-Tax, Pre-Provision Net Revenue per share3 $0.57 $0.60 $(0.03) 1 Variances are rounded based on actual whole dollar amounts 2 1Q20 includes $0.2 million of one-time expenses; please see 1Q20 Earnings Release for detailed discussion of non interest expense 7 3 Pre-tax, pre-provision net revenue per share is a non-GAAP metric & excludes provision for loan losses and income tax expense
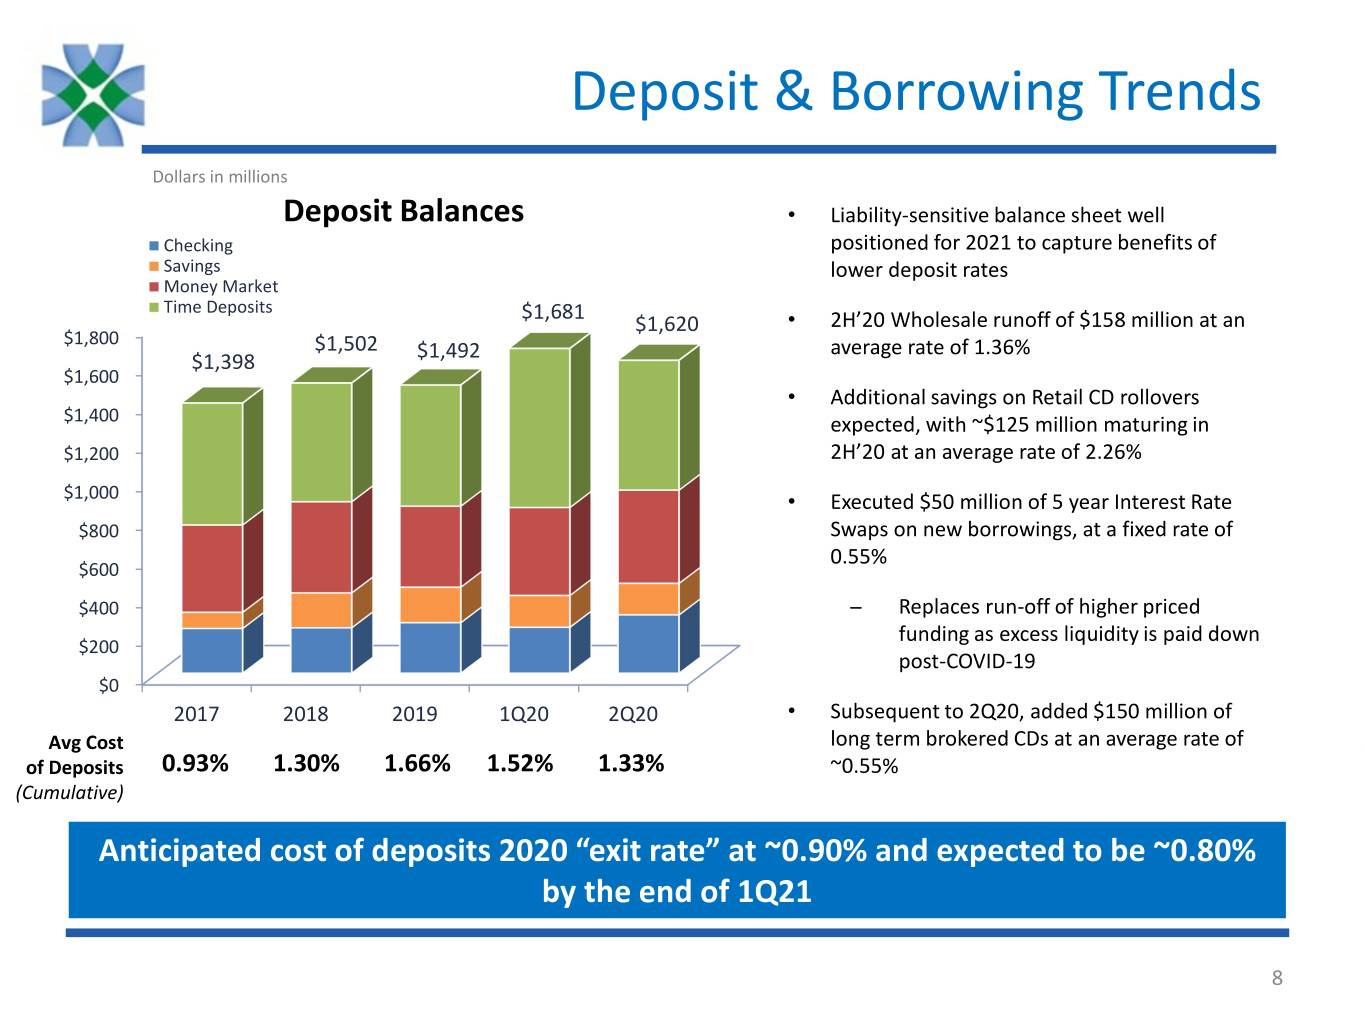
Deposit & Borrowing Trends Dollars in millions Deposit Balances • Liability-sensitive balance sheet well Checking positioned for 2021 to capture benefits of Savings lower deposit rates Money Market Time Deposits $1,681 $1,620 • 2H’20 Wholesale runoff of $158 million at an $1,800 $1,502 average rate of 1.36% $1,398 $1,492 $1,600 • Additional savings on Retail CD rollovers $1,400 expected, with ~$125 million maturing in $1,200 2H’20 at an average rate of 2.26% $1,000 • Executed $50 million of 5 year Interest Rate $800 Swaps on new borrowings, at a fixed rate of 0.55% $600 $400 ̶ Replaces run-off of higher priced funding as excess liquidity is paid down $200 post-COVID-19 $0 2017 2018 2019 1Q20 2Q20 • Subsequent to 2Q20, added $150 million of Avg Cost long term brokered CDs at an average rate of of Deposits 0.93% 1.30% 1.66% 1.52% 1.33% ~0.55% (Cumulative) Anticipated cost of deposits 2020 “exit rate” at ~0.90% and expected to be ~0.80% by the end of 1Q21 8
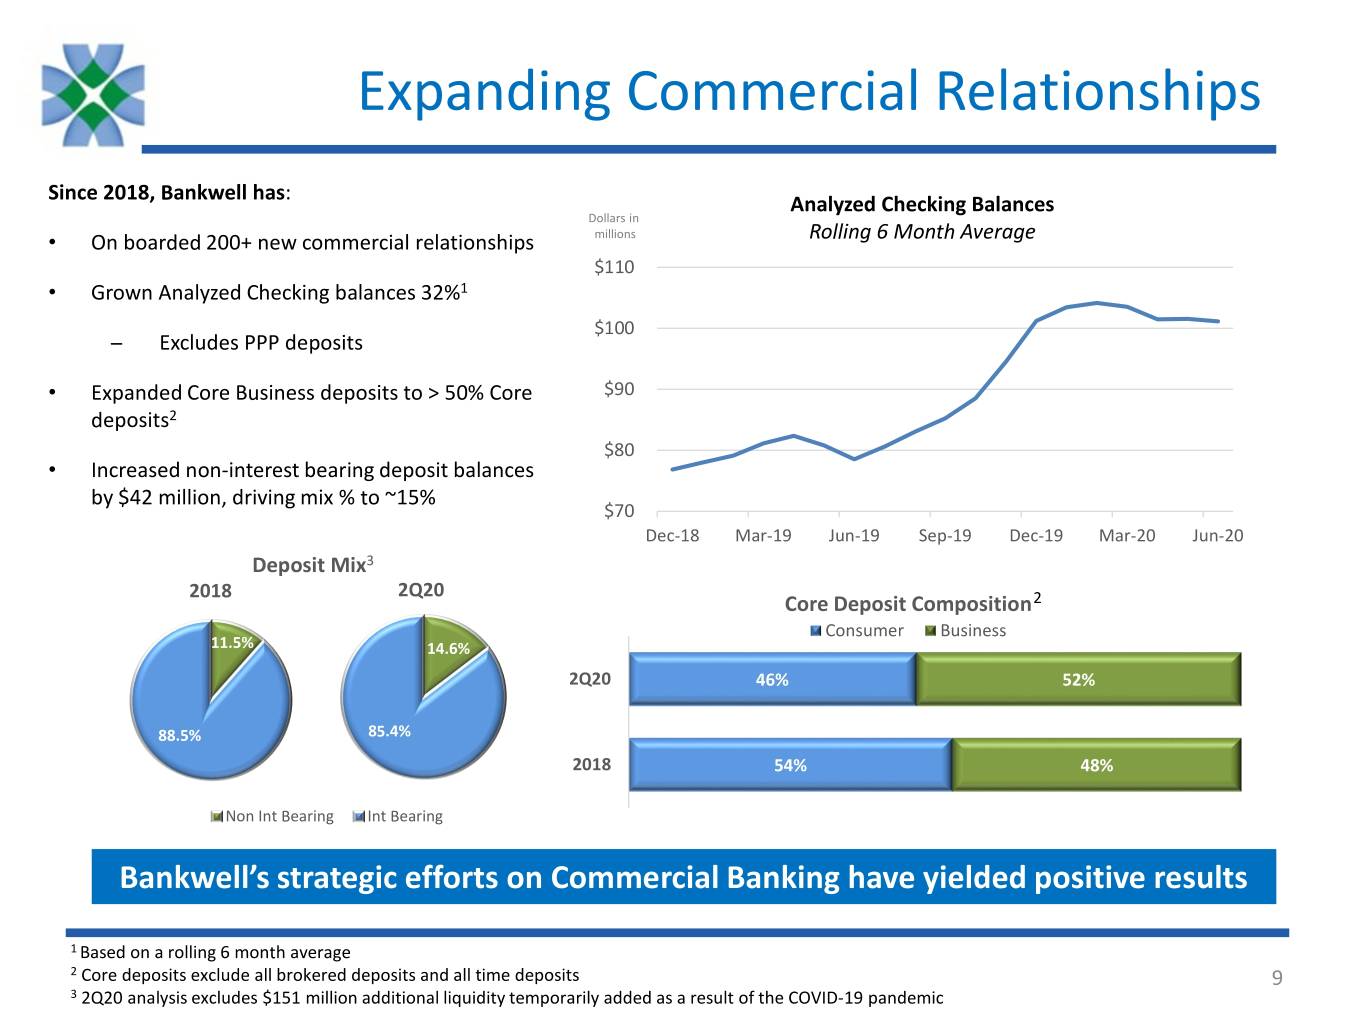
Expanding Commercial Relationships Since 2018, Bankwell has: Analyzed Checking Balances Dollars in millions Rolling 6 Month Average • On boarded 200+ new commercial relationships $110 • Grown Analyzed Checking balances 32%1 $100 ̶ Excludes PPP deposits • Expanded Core Business deposits to > 50% Core $90 deposits2 $80 • Increased non-interest bearing deposit balances by $42 million, driving mix % to ~15% $70 Dec-18 Mar-19 Jun-19 Sep-19 Dec-19 Mar-20 Jun-20 Deposit Mix3 2018 2Q20 Core Deposit Composition2 Consumer Business 11.5% 14.6% 2Q20 46% 52% 88.5% 85.4% 2018 54% 48% Non Int Bearing Int Bearing Bankwell’s strategic efforts on Commercial Banking have yielded positive results 1 Based on a rolling 6 month average 2 Core deposits exclude all brokered deposits and all time deposits 9 3 2Q20 analysis excludes $151 million additional liquidity temporarily added as a result of the COVID-19 pandemic
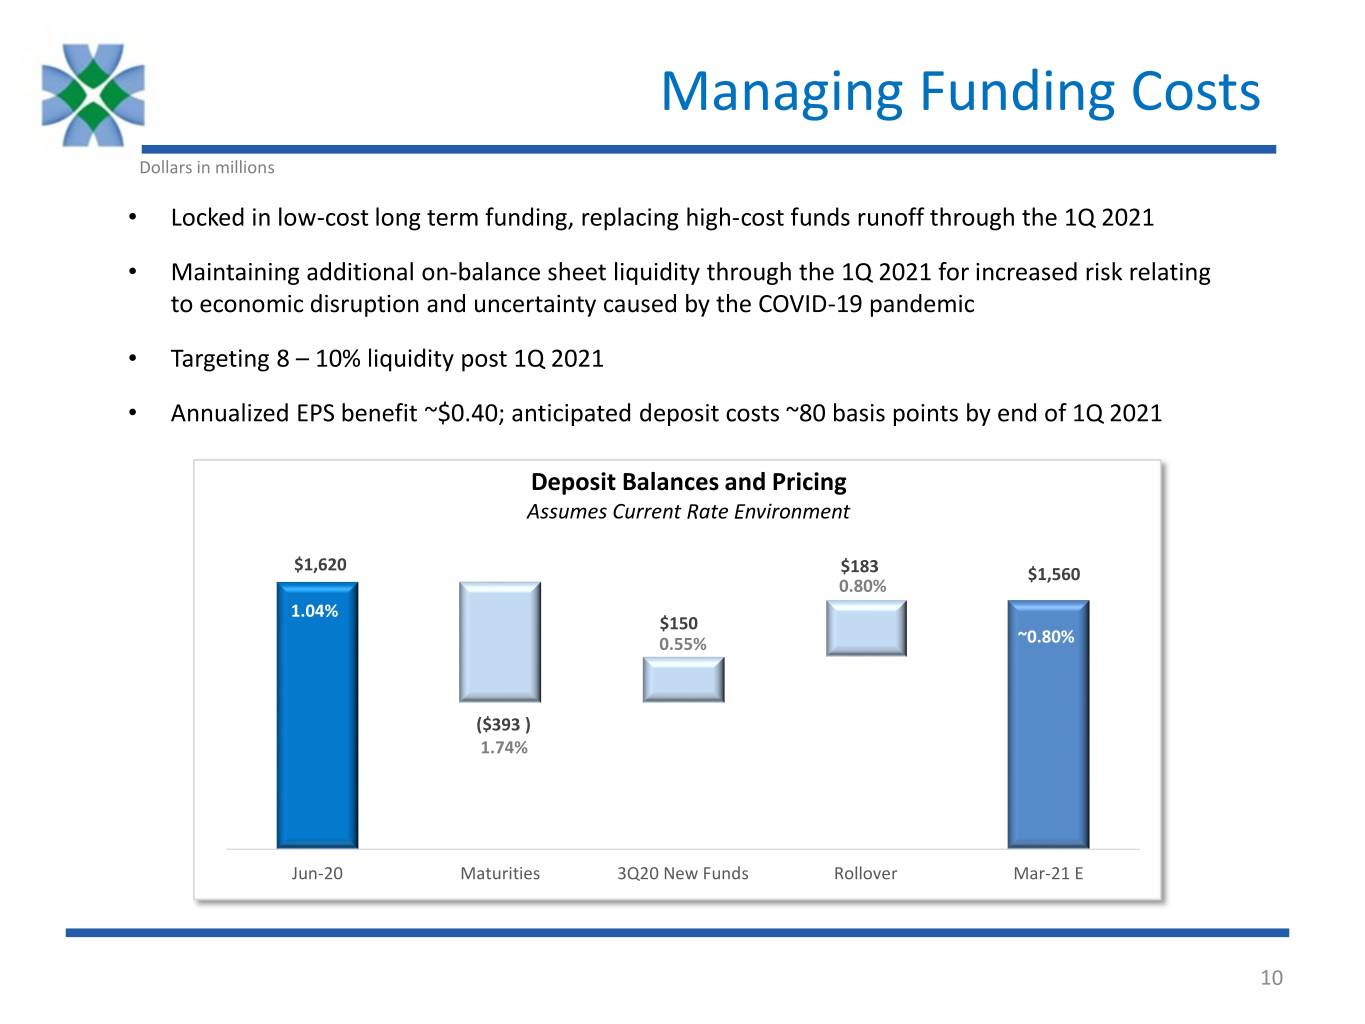
Managing Funding Costs Dollars in millions • Locked in low-cost long term funding, replacing high-cost funds runoff through the 1Q 2021 • Maintaining additional on-balance sheet liquidity through the 1Q 2021 for increased risk relating to economic disruption and uncertainty caused by the COVID-19 pandemic • Targeting 8 – 10% liquidity post 1Q 2021 • Annualized EPS benefit ~$0.40; anticipated deposit costs ~80 basis points by end of 1Q 2021 Deposit Balances and Pricing Assumes Current Rate Environment $1,620 $183 $1,560 0.80% 1.04% $150 0.55% ~0.80% ($393 ) 1.74% Jun-20 Maturities 3Q20 New Funds Rollover Mar-21 E 10
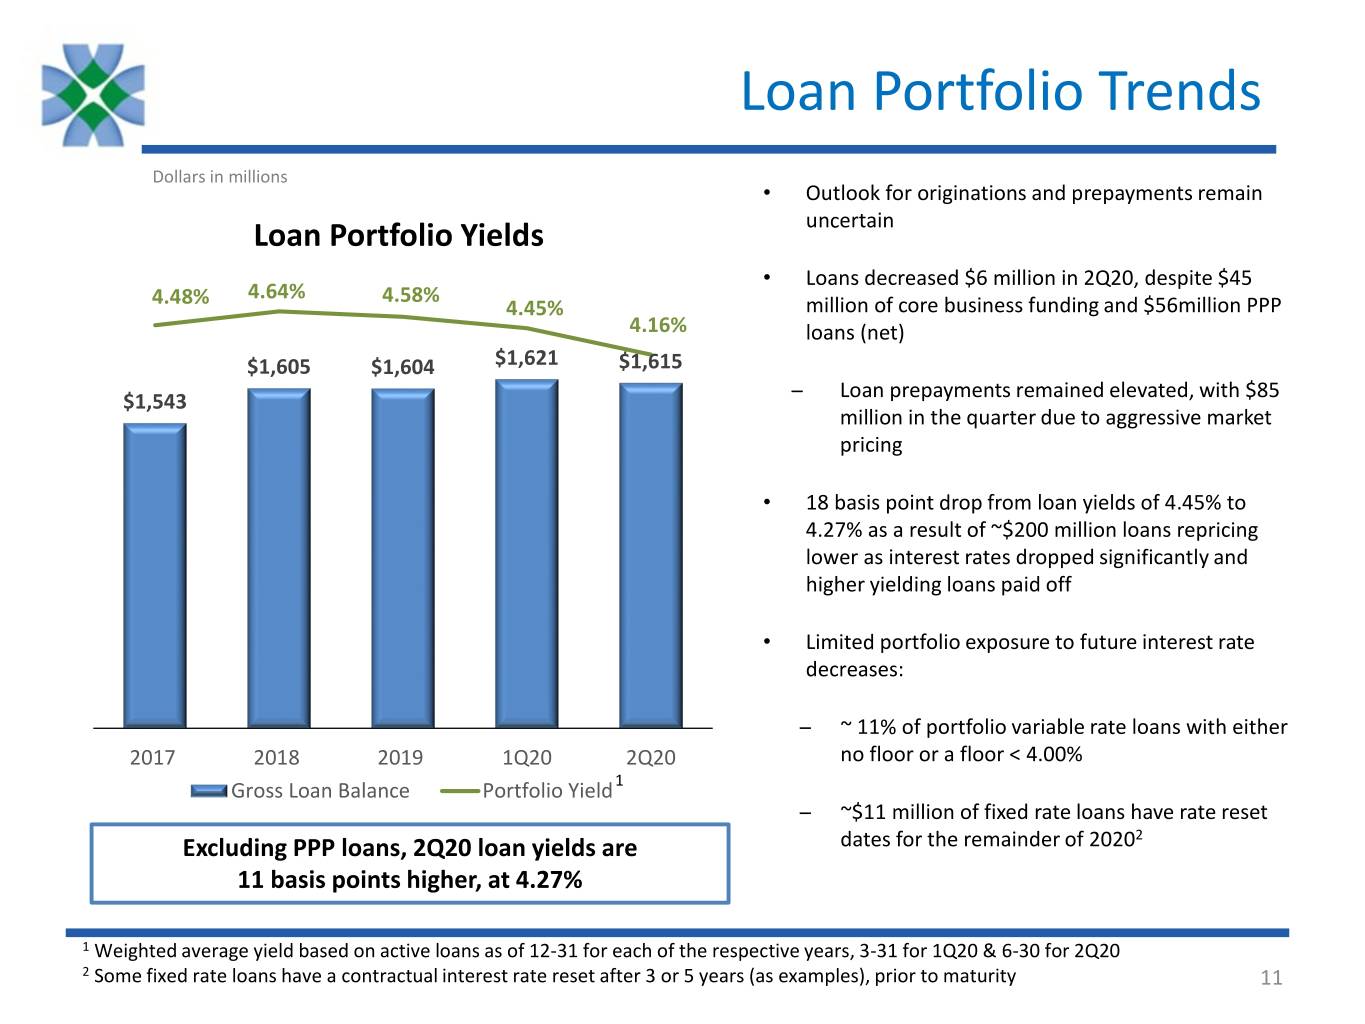
Loan Portfolio Trends Dollars in millions • Outlook for originations and prepayments remain uncertain Loan Portfolio Yields $1,800 5.00%• Loans decreased $6 million in 2Q20, despite $45 4.48% 4.64% 4.58% 4.45% million of core business funding and $56million PPP 4.50% $1,700 4.16% loans (net) $1,605 $1,604 $1,621 $1,615 4.00% $1,600 ̶ Loan prepayments remained elevated, with $85 $1,543 3.50% million in the quarter due to aggressive market $1,500 pricing 3.00% $1,400 2.50%• 18 basis point drop from loan yields of 4.45% to 4.27% as a result of ~$200 million loans repricing 2.00% $1,300 lower as interest rates dropped significantly and 1.50% higher yielding loans paid off $1,200 1.00%• Limited portfolio exposure to future interest rate $1,100 decreases: 0.50% $1,000 0.00% ̶ ~ 11% of portfolio variable rate loans with either 2017 2018 2019 1Q20 2Q20 no floor or a floor < 4.00% Gross Loan Balance Portfolio Yield1 ̶ ~$11 million of fixed rate loans have rate reset 2 Excluding PPP loans, 2Q20 loan yields are dates for the remainder of 2020 11 basis points higher, at 4.27% 1 Weighted average yield based on active loans as of 12-31 for each of the respective years, 3-31 for 1Q20 & 6-30 for 2Q20 2 Some fixed rate loans have a contractual interest rate reset after 3 or 5 years (as examples), prior to maturity 11

COVID-19 Deferrals Update
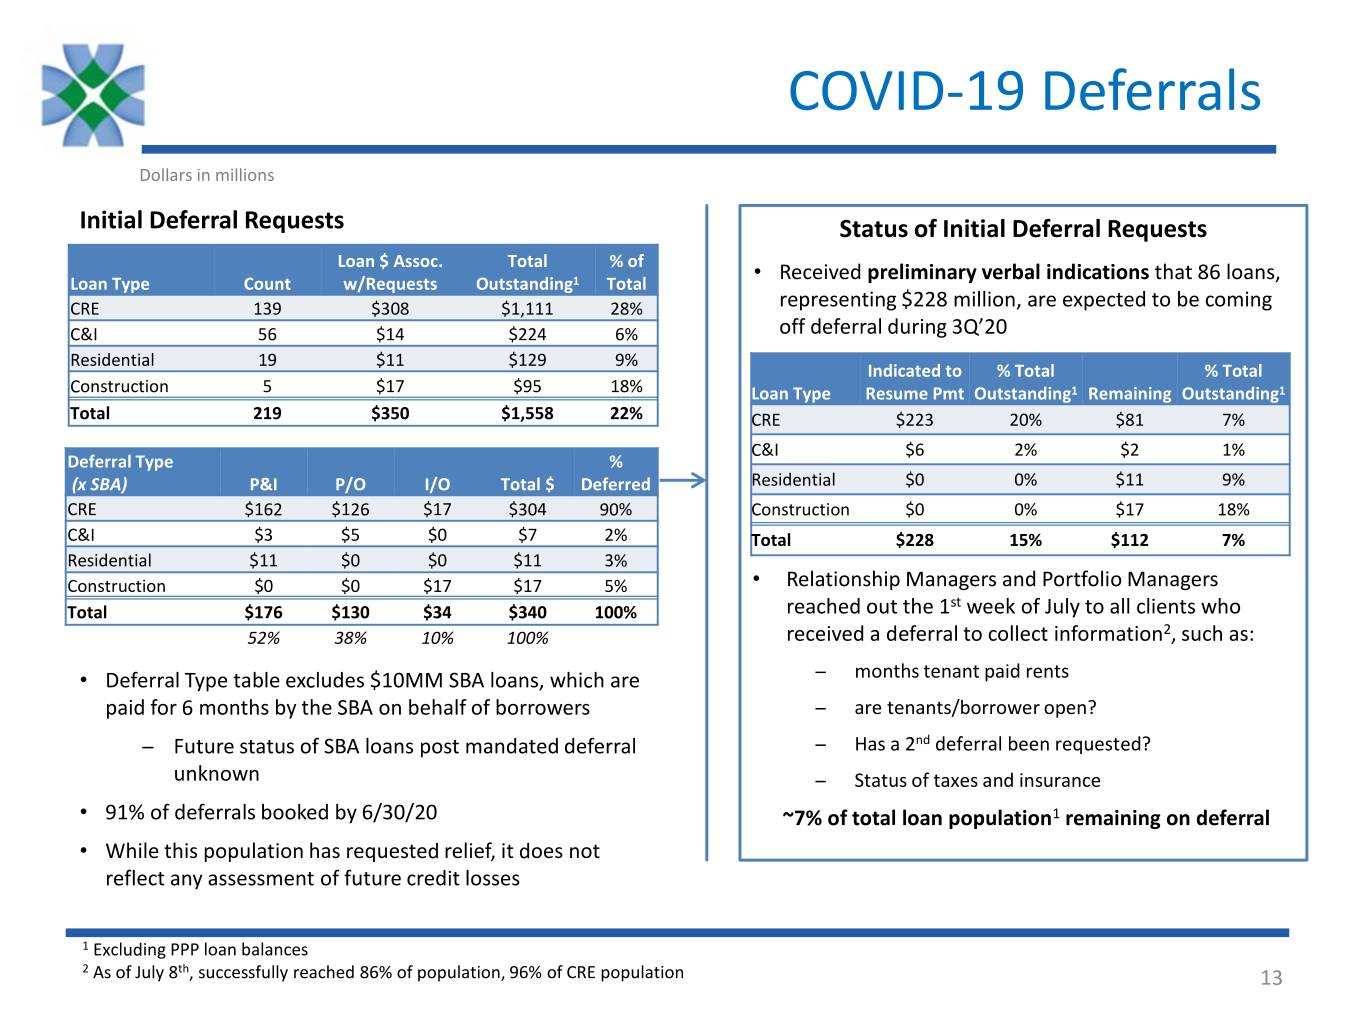
COVID-19 Deferrals Dollars in millions Initial Deferral Requests Status of Initial Deferral Requests Loan $ Assoc. Total % of • Received that 86 loans, Loan Type Count w/Requests Outstanding1 Total preliminary verbal indications CRE 139 $308 $1,111 28% representing $228 million, are expected to be coming C&I 56 $14 $224 6% off deferral during 3Q’20 Residential 19 $11 $129 9% Indicated to % Total % Total Construction 5 $17 $95 18% Loan Type Resume Pmt Outstanding1 Remaining Outstanding1 Total 219 $350 $1,558 22% CRE $223 20% $81 7% C&I $6 2% $2 1% Deferral Type % (x SBA) P&I P/O I/O Total $ Deferred Residential $0 0% $11 9% CRE $162 $126 $17 $304 90% Construction $0 0% $17 18% C&I $3 $5 $0 $7 2% Total $228 15% $112 7% Residential $11 $0 $0 $11 3% Construction $0 $0 $17 $17 5% • Relationship Managers and Portfolio Managers st Total $176 $130 $34 $340 100% reached out the 1 week of July to all clients who 52% 38% 10% 100% received a deferral to collect information2, such as: • Deferral Type table excludes $10MM SBA loans, which are ̶ months tenant paid rents paid for 6 months by the SBA on behalf of borrowers ̶ are tenants/borrower open? ̶ Future status of SBA loans post mandated deferral ̶ Has a 2nd deferral been requested? unknown ̶ Status of taxes and insurance • 91% of deferrals booked by 6/30/20 ~7% of total loan population1 remaining on deferral • While this population has requested relief, it does not reflect any assessment of future credit losses 1 Excluding PPP loan balances 2 As of July 8th, successfully reached 86% of population, 96% of CRE population 13
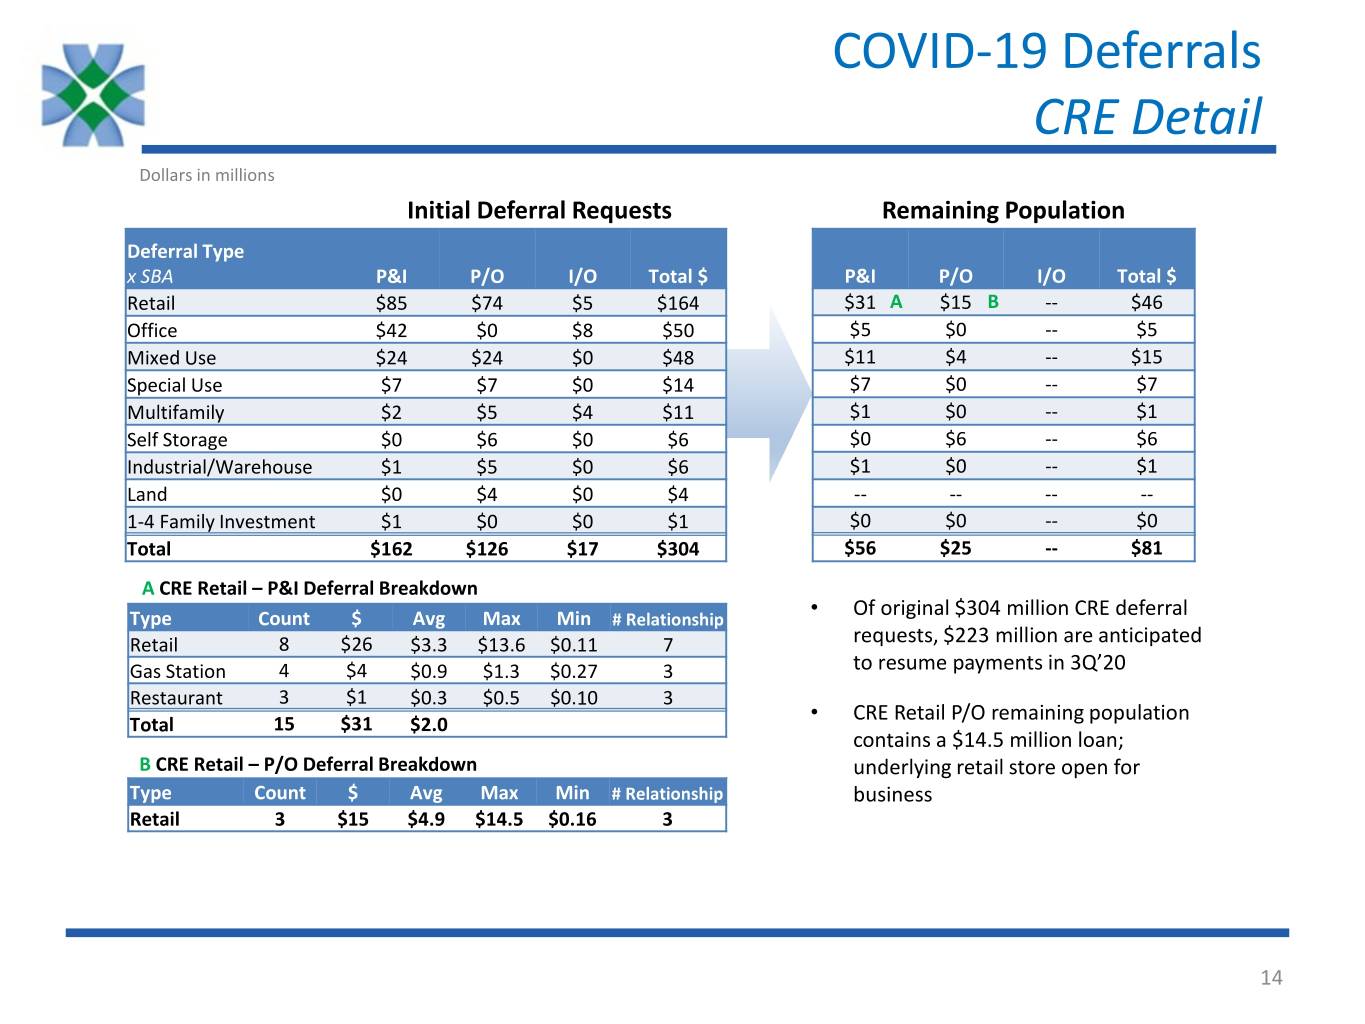
COVID-19 Deferrals CRE Detail Dollars in millions Initial Deferral Requests Remaining Population Deferral Type x SBA P&I P/O I/O Total $ P&I P/O I/O Total $ Retail $85 $74 $5 $164 $31 A $15 B -- $46 Office $42 $0 $8 $50 $5 $0 -- $5 Mixed Use $24 $24 $0 $48 $11 $4 -- $15 Special Use $7 $7 $0 $14 $7 $0 -- $7 Multifamily $2 $5 $4 $11 $1 $0 -- $1 Self Storage $0 $6 $0 $6 $0 $6 -- $6 Industrial/Warehouse $1 $5 $0 $6 $1 $0 -- $1 Land $0 $4 $0 $4 -- -- -- -- 1-4 Family Investment $1 $0 $0 $1 $0 $0 -- $0 Total $162 $126 $17 $304 $56 $25 -- $81 A CRE Retail – P&I Deferral Breakdown • Of original $304 million CRE deferral Type Count $ Avg Max Min # Relationship Retail 8 $26 $3.3 $13.6 $0.11 7 requests, $223 million are anticipated Gas Station 4 $4 $0.9 $1.3 $0.27 3 to resume payments in 3Q’20 Restaurant 3 $1 $0.3 $0.5 $0.10 3 • CRE Retail P/O remaining population Total 15 $31 $2.0 contains a $14.5 million loan; B CRE Retail – P/O Deferral Breakdown underlying retail store open for Type Count $ Avg Max Min # Relationship business Retail 3 $15 $4.9 $14.5 $0.16 3 14
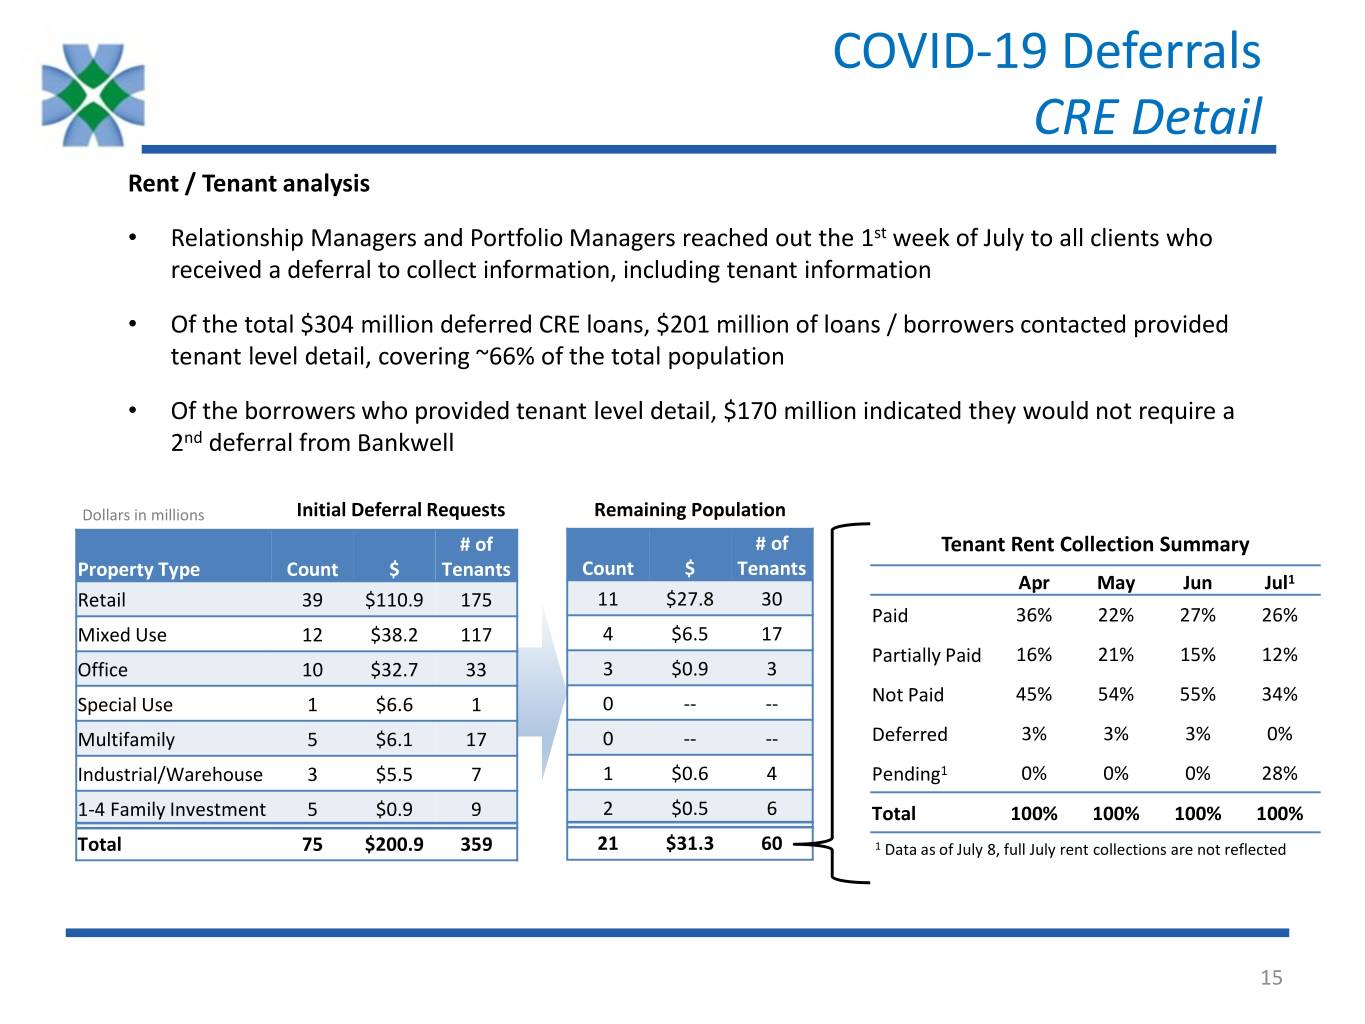
COVID-19 Deferrals CRE Detail Rent / Tenant analysis • Relationship Managers and Portfolio Managers reached out the 1st week of July to all clients who received a deferral to collect information, including tenant information • Of the total $304 million deferred CRE loans, $201 million of loans / borrowers contacted provided tenant level detail, covering ~66% of the total population • Of the borrowers who provided tenant level detail, $170 million indicated they would not require a 2nd deferral from Bankwell Dollars in millions Initial Deferral Requests Remaining Population # of # of Tenant Rent Collection Summary Property Type Count $ Tenants Count $ Tenants Apr May Jun Jul1 Retail 39 $110.9 175 11 $27.8 30 Paid 36% 22% 27% 26% Mixed Use 12 $38.2 117 4 $6.5 17 Partially Paid 16% 21% 15% 12% Office 10 $32.7 33 3 $0.9 3 45% 54% 55% 34% Special Use 1 $6.6 1 0 -- -- Not Paid Multifamily 5 $6.1 17 0 -- -- Deferred 3% 3% 3% 0% Industrial/Warehouse 3 $5.5 7 1 $0.6 4 Pending1 0% 0% 0% 28% 1-4 Family Investment 5 $0.9 9 2 $0.5 6 Total 100% 100% 100% 100% Total 75 $200.9 359 21 $31.3 60 1 Data as of July 8, full July rent collections are not reflected 15
2Q20 Performance Impact of COVID-19
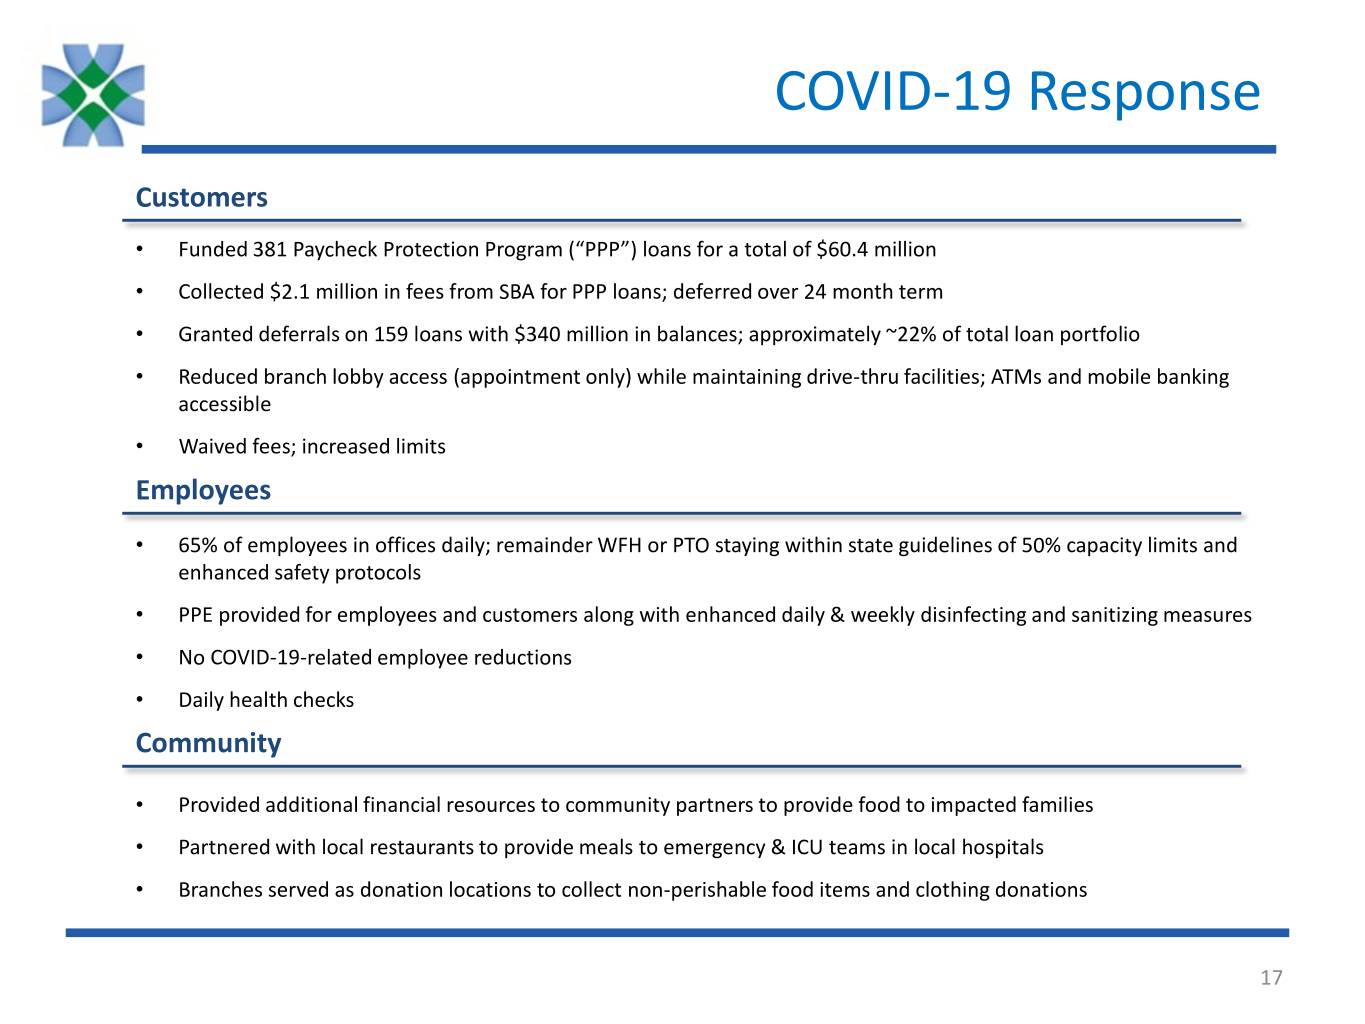
COVID-19 Response Customers • Funded 381 Paycheck Protection Program (“PPP”) loans for a total of $60.4 million • Collected $2.1 million in fees from SBA for PPP loans; deferred over 24 month term • Granted deferrals on 159 loans with $340 million in balances; approximately ~22% of total loan portfolio • Reduced branch lobby access (appointment only) while maintaining drive-thru facilities; ATMs and mobile banking accessible • Waived fees; increased limits Employees • 65% of employees in offices daily; remainder WFH or PTO staying within state guidelines of 50% capacity limits and enhanced safety protocols • PPE provided for employees and customers along with enhanced daily & weekly disinfecting and sanitizing measures • No COVID-19-related employee reductions • Daily health checks Community • Provided additional financial resources to community partners to provide food to impacted families • Partnered with local restaurants to provide meals to emergency & ICU teams in local hospitals • Branches served as donation locations to collect non-perishable food items and clothing donations 17
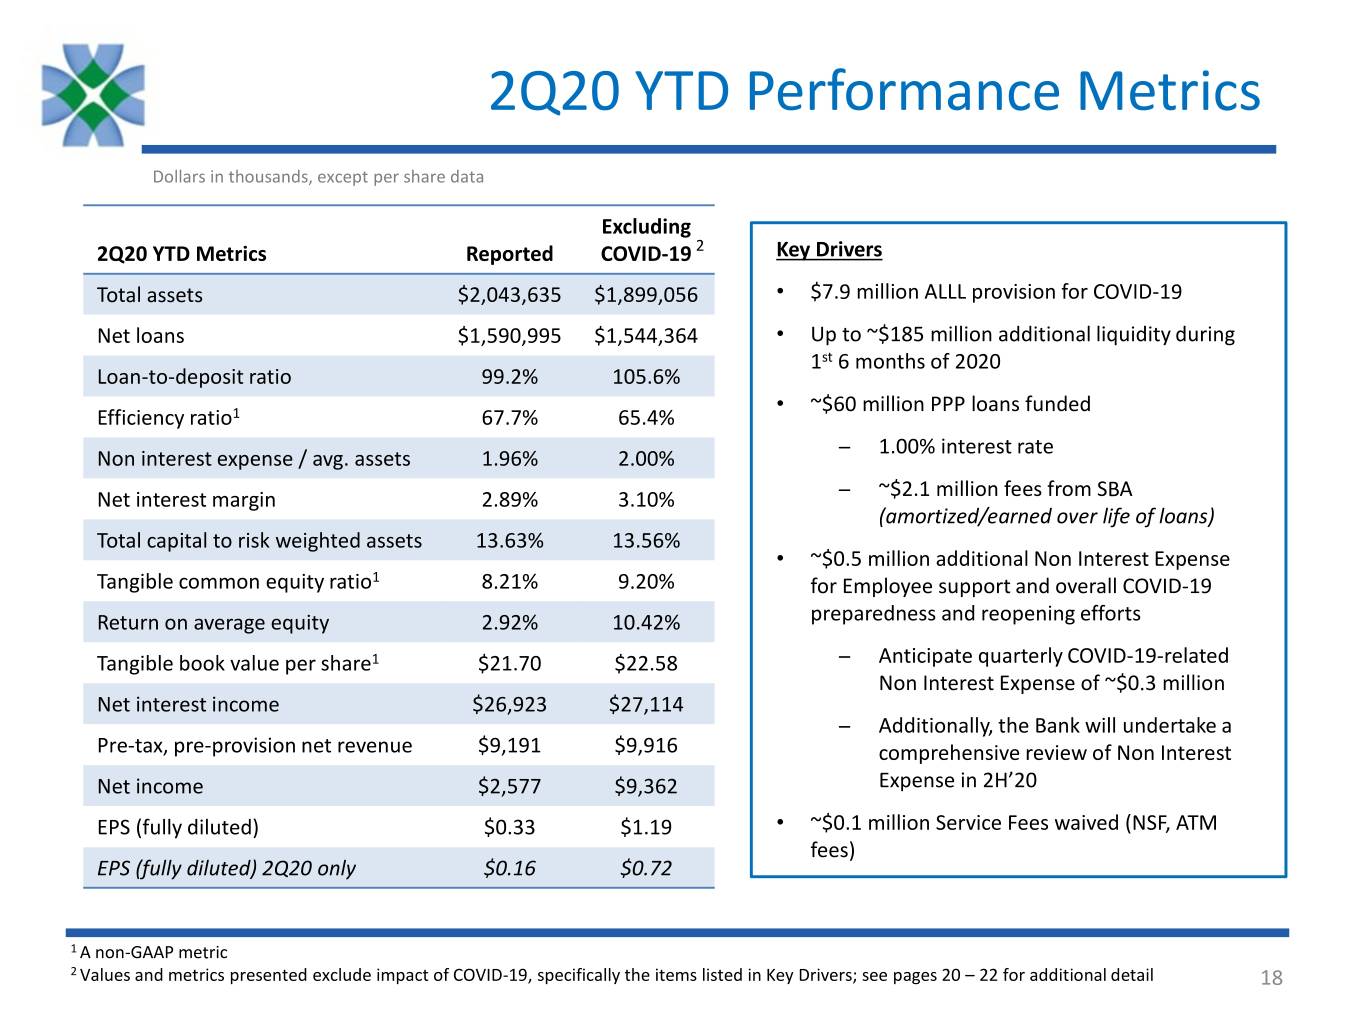
2Q20 YTD Performance Metrics Dollars in thousands, except per share data Excluding 2 2Q20 YTD Metrics Reported COVID-19 2 Key Drivers Total assets $2,043,635 $1,899,056 • $7.9 million ALLL provision for COVID-19 Net loans $1,590,995 $1,544,364 • Up to ~$185 million additional liquidity during 1st 6 months of 2020 Loan-to-deposit ratio 99.2% 105.6% • ~$60 million PPP loans funded Efficiency ratio1 67.7% 65.4% ̶ 1.00% interest rate Non interest expense / avg. assets 1.96% 2.00% Net interest margin 2.89% 3.10% ̶ ~$2.1 million fees from SBA (amortized/earned over life of loans) Total capital to risk weighted assets 13.63% 13.56% • ~$0.5 million additional Non Interest Expense Tangible common equity ratio1 8.21% 9.20% for Employee support and overall COVID-19 Return on average equity 2.92% 10.42% preparedness and reopening efforts Tangible book value per share1 $21.70 $22.58 ̶ Anticipate quarterly COVID-19-related Non Interest Expense of ~$0.3 million Net interest income $26,923 $27,114 ̶ Additionally, the Bank will undertake a Pre-tax, pre-provision net revenue $9,191 $9,916 comprehensive review of Non Interest Net income $2,577 $9,362 Expense in 2H’20 EPS (fully diluted) $0.33 $1.19 • ~$0.1 million Service Fees waived (NSF, ATM fees) EPS (fully diluted) 2Q20 only $0.16 $0.72 1 A non-GAAP metric 2 Values and metrics presented exclude impact of COVID-19, specifically the items listed in Key Drivers; see pages 20 – 22 for additional detail 18
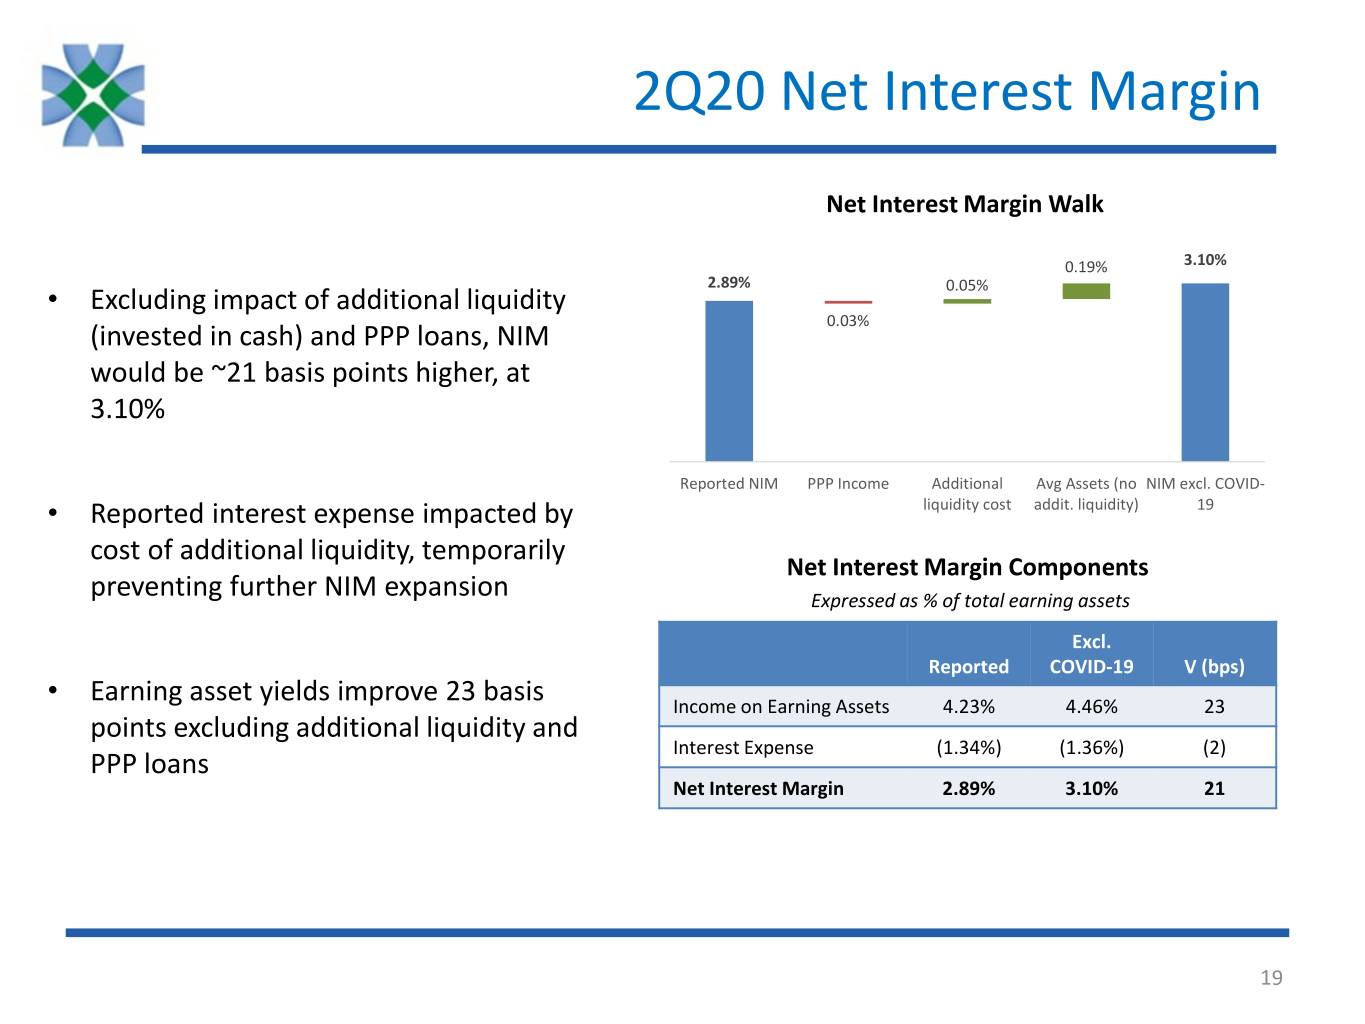
2Q20 Net Interest Margin Net Interest Margin Walk 0.19% 3.10% 2.89% 0.05% • Excluding impact of additional liquidity 0.03% (invested in cash) and PPP loans, NIM would be ~21 basis points higher, at 3.10% Reported NIM PPP Income Additional Avg Assets (no NIM excl. COVID- • Reported interest expense impacted by liquidity cost addit. liquidity) 19 cost of additional liquidity, temporarily Net Interest Margin Components preventing further NIM expansion Expressed as % of total earning assets Excl. Reported COVID-19 V (bps) • Earning asset yields improve 23 basis Income on Earning Assets 4.23% 4.46% 23 points excluding additional liquidity and Interest Expense (1.34%) (1.36%) (2) PPP loans Net Interest Margin 2.89% 3.10% 21 19
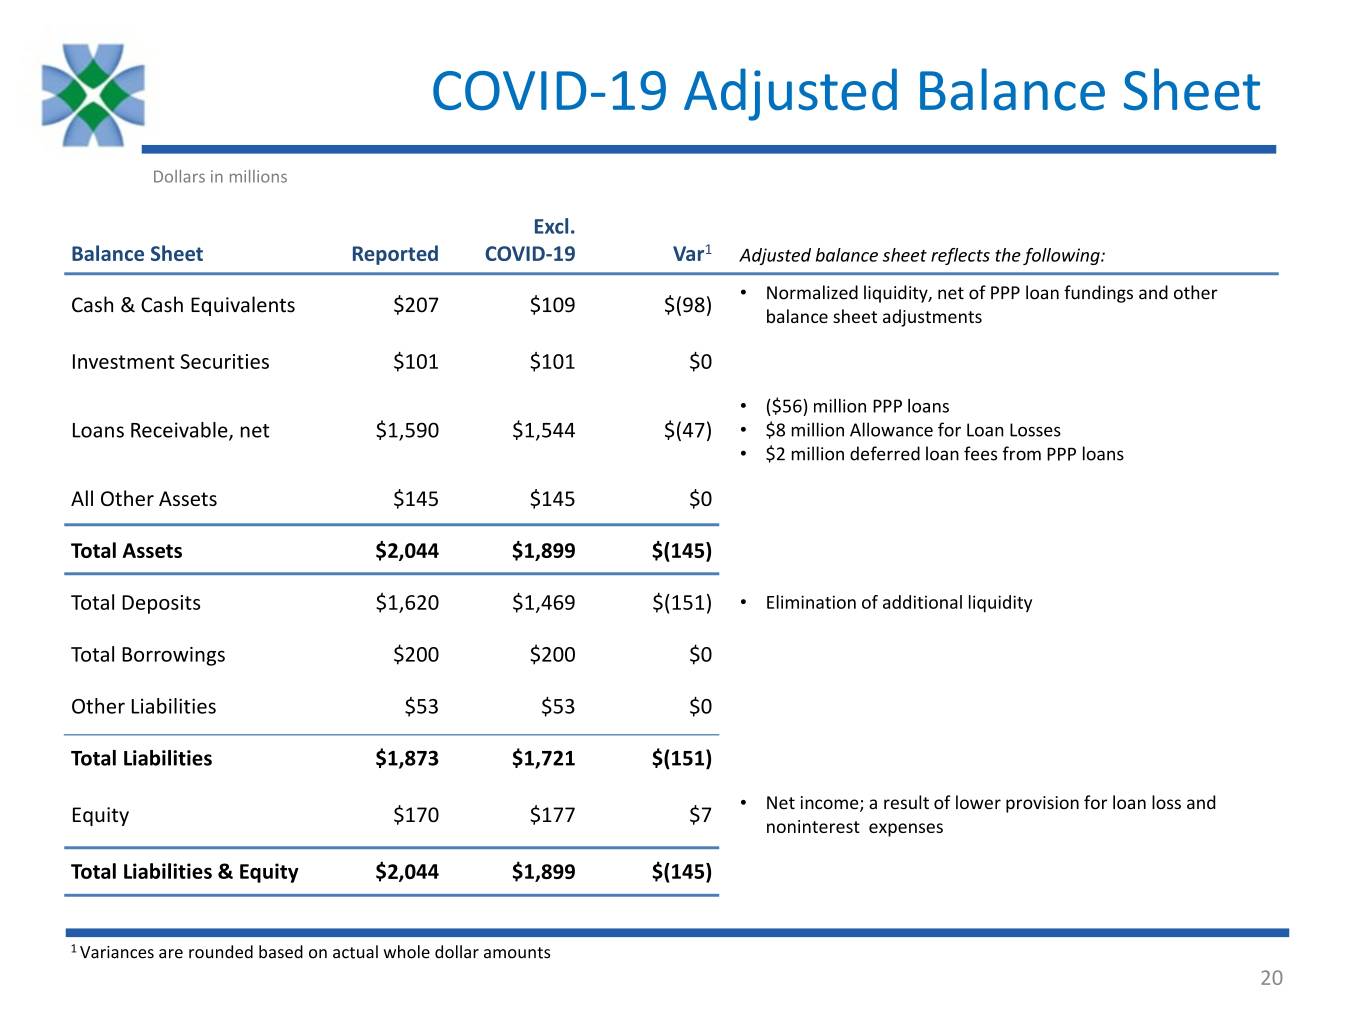
COVID-19 Adjusted Balance Sheet Dollars in millions Excl. Balance Sheet Reported COVID-19 Var1 Adjusted balance sheet reflects the following: • Normalized liquidity, net of PPP loan fundings and other Cash & Cash Equivalents $207 $109 $(98) balance sheet adjustments Investment Securities $101 $101 $0 • ($56) million PPP loans Loans Receivable, net $1,590 $1,544 $(47) • $8 million Allowance for Loan Losses • $2 million deferred loan fees from PPP loans All Other Assets $145 $145 $0 Total Assets $2,044 $1,899 $(145) Total Deposits $1,620 $1,469 $(151) • Elimination of additional liquidity Total Borrowings $200 $200 $0 Other Liabilities $53 $53 $0 Total Liabilities $1,873 $1,721 $(151) • Net income; a result of lower provision for loan loss and Equity $170 $177 $7 noninterest expenses Total Liabilities & Equity $2,044 $1,899 $(145) 1 Variances are rounded based on actual whole dollar amounts 20
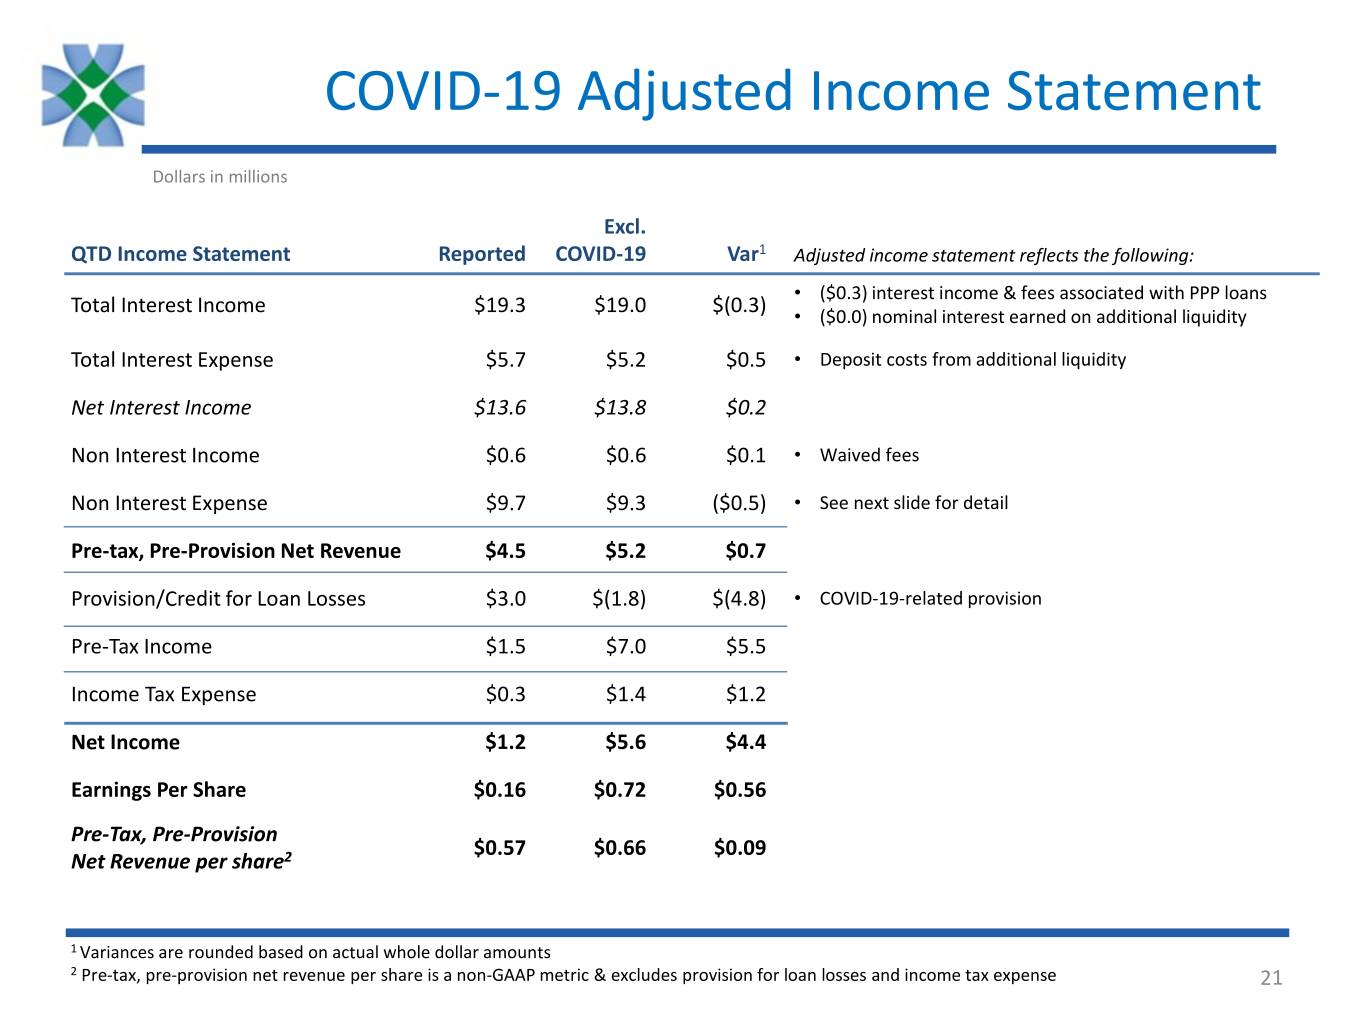
COVID-19 Adjusted Income Statement Dollars in millions Excl. QTD Income Statement Reported COVID-19 Var1 Adjusted income statement reflects the following: • ($0.3) interest income & fees associated with PPP loans Total Interest Income $19.3 $19.0 $(0.3) • ($0.0) nominal interest earned on additional liquidity Total Interest Expense $5.7 $5.2 $0.5 • Deposit costs from additional liquidity Net Interest Income $13.6 $13.8 $0.2 Non Interest Income $0.6 $0.6 $0.1 • Waived fees Non Interest Expense $9.7 $9.3 ($0.5) • See next slide for detail Pre-tax, Pre-Provision Net Revenue $4.5 $5.2 $0.7 Provision/Credit for Loan Losses $3.0 $(1.8) $(4.8) • COVID-19-related provision Pre-Tax Income $1.5 $7.0 $5.5 Income Tax Expense $0.3 $1.4 $1.2 Net Income $1.2 $5.6 $4.4 Earnings Per Share $0.16 $0.72 $0.56 Pre-Tax, Pre-Provision $0.57 $0.66 $0.09 Net Revenue per share2 1 Variances are rounded based on actual whole dollar amounts 2 Pre-tax, pre-provision net revenue per share is a non-GAAP metric & excludes provision for loan losses and income tax expense 21
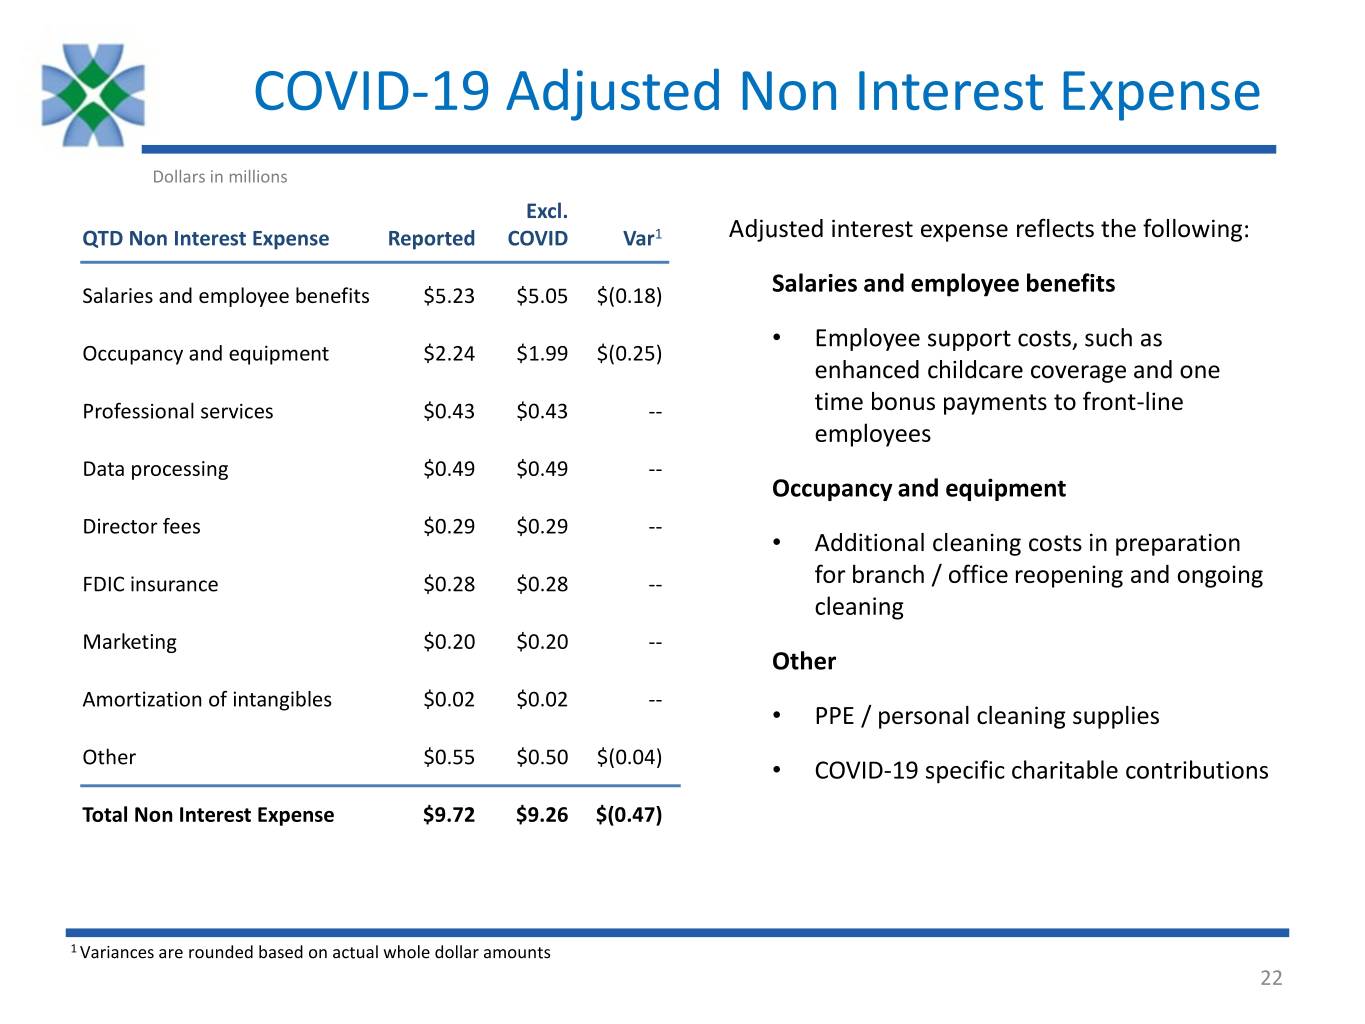
COVID-19 Adjusted Non Interest Expense Dollars in millions Excl. QTD Non Interest Expense Reported COVID Var1 Adjusted interest expense reflects the following: Salaries and employee benefits $5.23 $5.05 $(0.18) Salaries and employee benefits • Employee support costs, such as Occupancy and equipment $2.24 $1.99 $(0.25) enhanced childcare coverage and one Professional services $0.43 $0.43 -- time bonus payments to front-line employees Data processing $0.49 $0.49 -- Occupancy and equipment Director fees $0.29 $0.29 -- • Additional cleaning costs in preparation FDIC insurance $0.28 $0.28 -- for branch / office reopening and ongoing cleaning Marketing $0.20 $0.20 -- Other Amortization of intangibles $0.02 $0.02 -- • PPE / personal cleaning supplies Other $0.55 $0.50 $(0.04) • COVID-19 specific charitable contributions Total Non Interest Expense $9.72 $9.26 $(0.47) 1 Variances are rounded based on actual whole dollar amounts 22

Credit & Capital
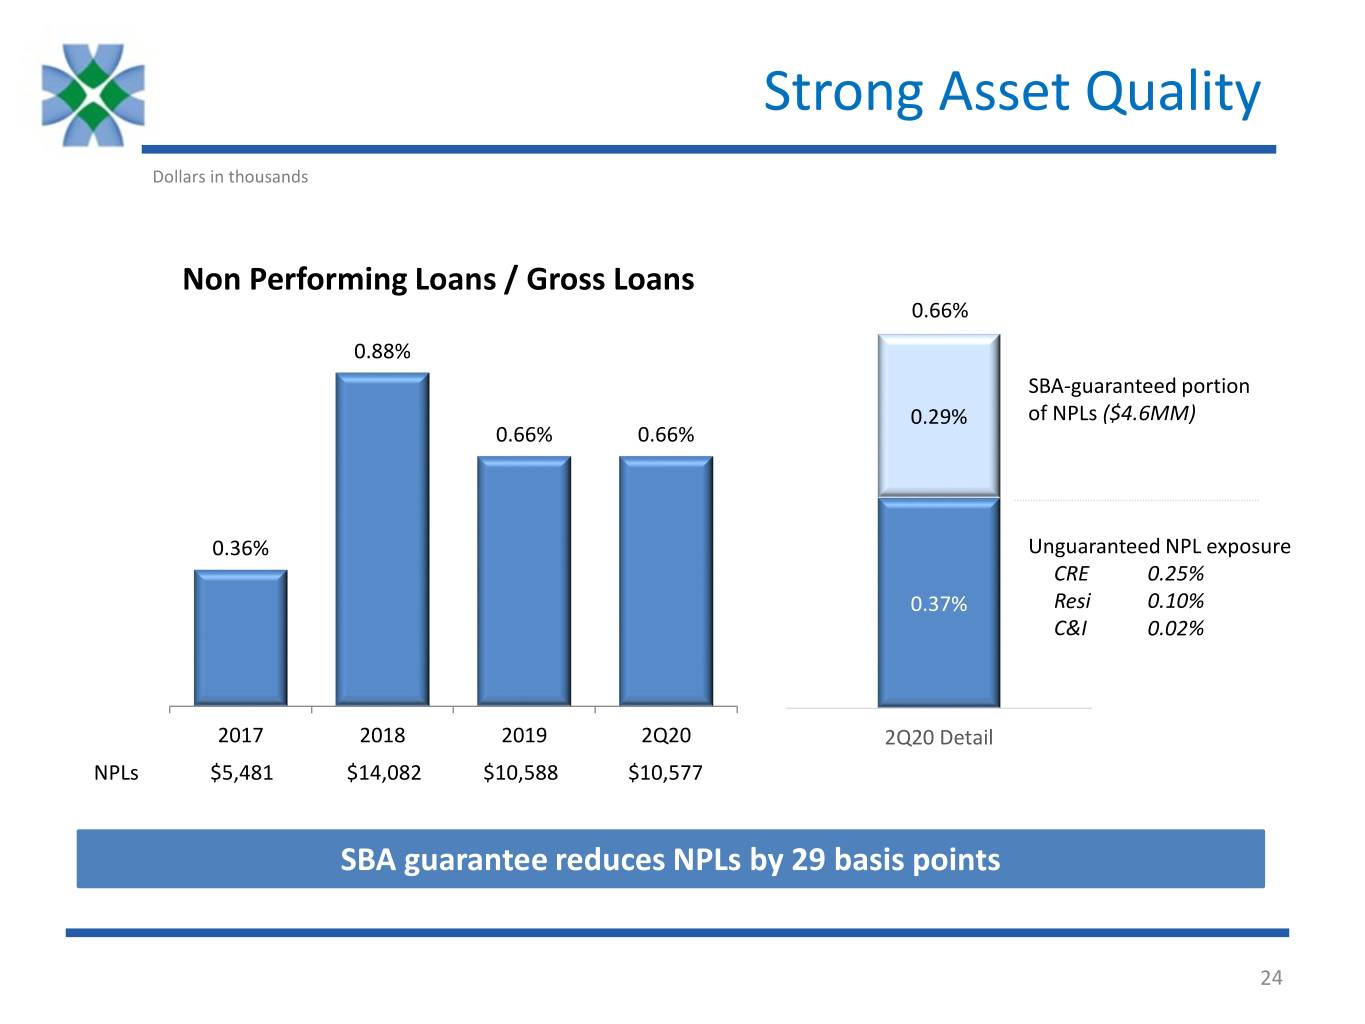
Strong Asset Quality Dollars in thousands Non Performing Loans / Gross Loans 0.66% 0.88% SBA-guaranteed portion 0.29% of NPLs ($4.6MM) 0.66% 0.66% 0.36% Unguaranteed NPL exposure CRE 0.25% 0.37% Resi 0.10% C&I 0.02% 2017 2018 2019 2Q20 2Q20 Detail NPLs $5,481 $14,082 $10,588 $10,577 SBA guarantee reduces NPLs by 29 basis points 24
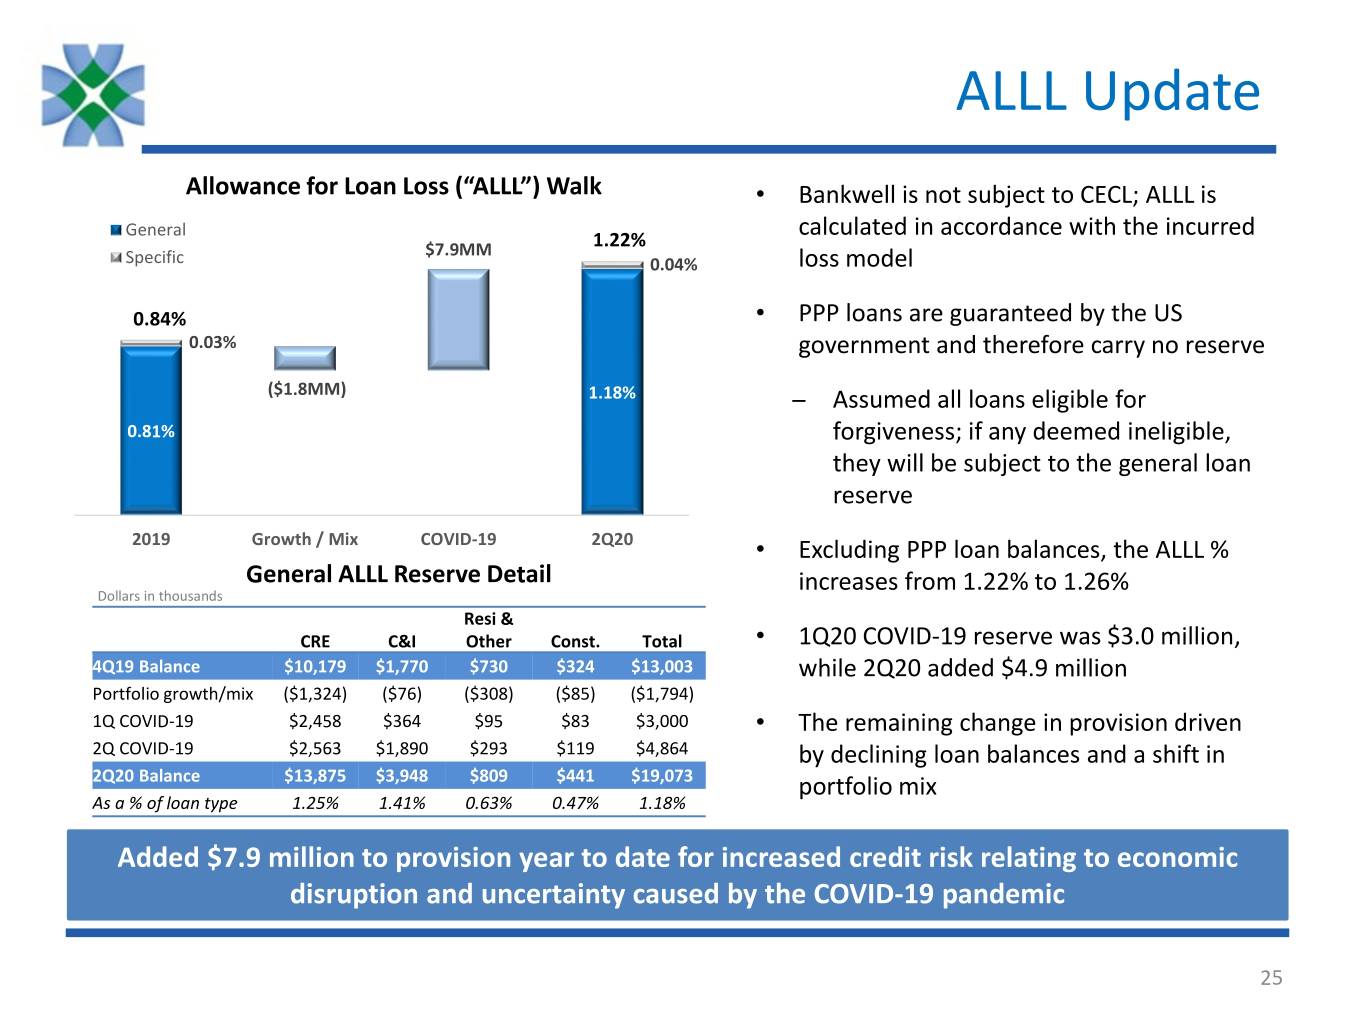
ALLL Update Allowance for Loan Loss (“ALLL”) Walk • Bankwell is not subject to CECL; ALLL is General calculated in accordance with the incurred $7.9MM 1.22% Specific 0.04% loss model 0.84% • PPP loans are guaranteed by the US 0.03% government and therefore carry no reserve ($1.8MM) 1.18% ̶ Assumed all loans eligible for 0.81% forgiveness; if any deemed ineligible, they will be subject to the general loan reserve 2019 Growth / Mix COVID-19 2Q20 • Excluding PPP loan balances, the ALLL % General ALLL Reserve Detail Dollars in thousands increases from 1.22% to 1.26% Resi & CRE C&I Other Const. Total • 1Q20 COVID-19 reserve was $3.0 million, 4Q19 Balance $10,179 $1,770 $730 $324 $13,003 while 2Q20 added $4.9 million Portfolio growth/mix ($1,324) ($76) ($308) ($85) ($1,794) 1Q COVID-19 $2,458 $364 $95 $83 $3,000 • The remaining change in provision driven 2Q COVID-19 $2,563 $1,890 $293 $119 $4,864 by declining loan balances and a shift in 2Q20 Balance $13,875 $3,948 $809 $441 $19,073 portfolio mix As a % of loan type 1.25% 1.41% 0.63% 0.47% 1.18% Added $7.9 million to provision year to date for increased credit risk relating to economic disruption and uncertainty caused by the COVID-19 pandemic 25
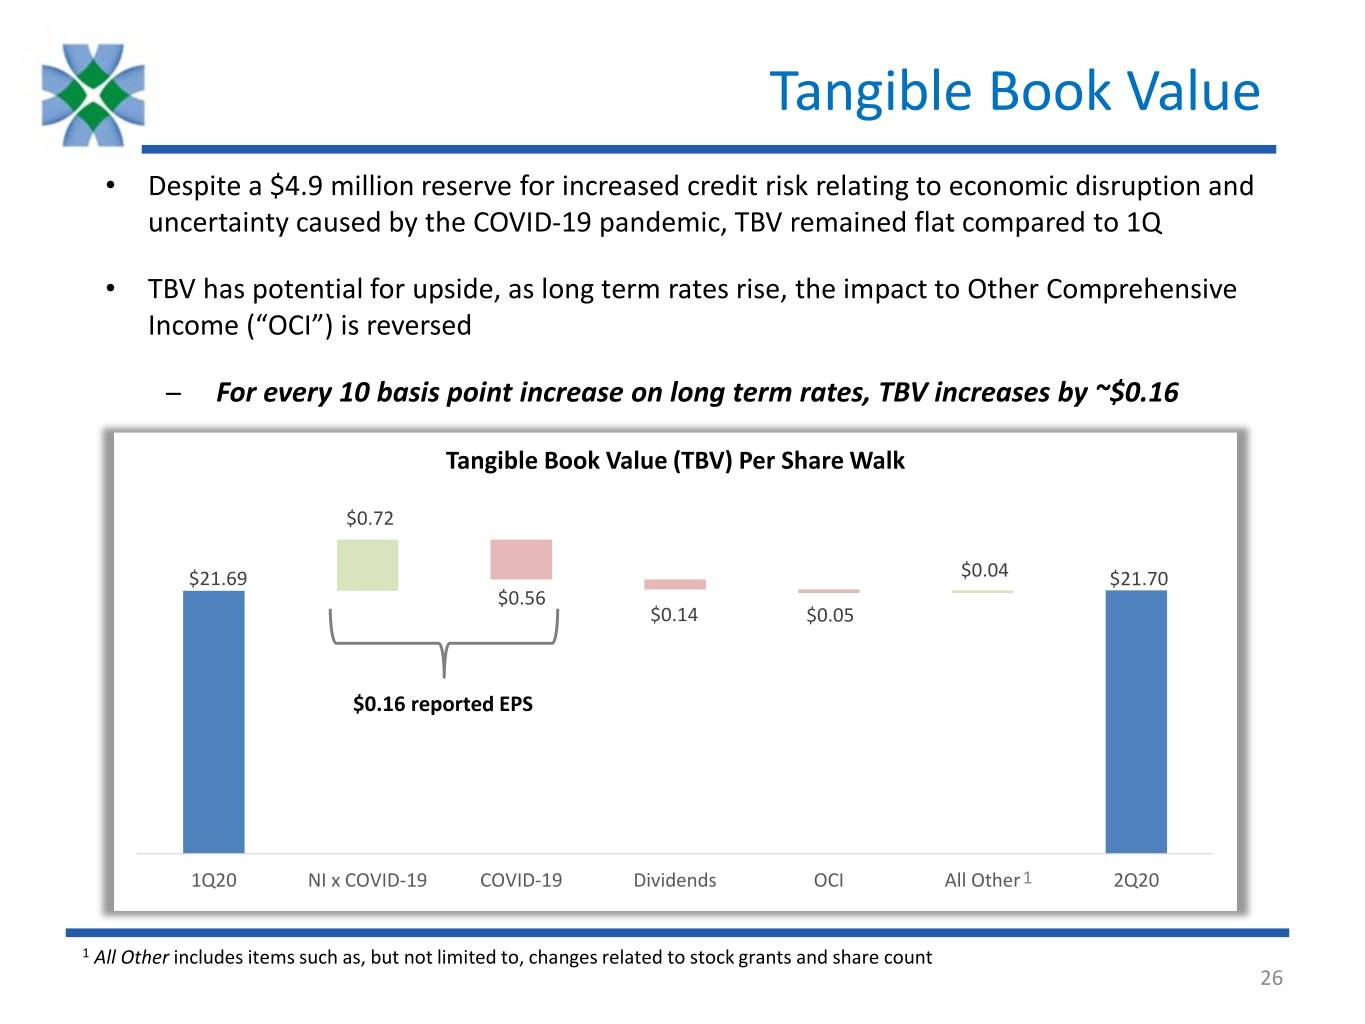
Tangible Book Value • Despite a $4.9 million reserve for increased credit risk relating to economic disruption and uncertainty caused by the COVID-19 pandemic, TBV remained flat compared to 1Q • TBV has potential for upside, as long term rates rise, the impact to Other Comprehensive Income (“OCI”) is reversed ̶ For every 10 basis point increase on long term rates, TBV increases by ~$0.16 Tangible Book Value (TBV) Per Share Walk $0.72 $21.69 $0.04 $21.70 $0.56 $0.14 $0.05 $0.16 reported EPS 1Q20 NI x COVID-19 COVID-19 Dividends OCI All Other1 2Q20 1 All Other includes items such as, but not limited to, changes related to stock grants and share count 26
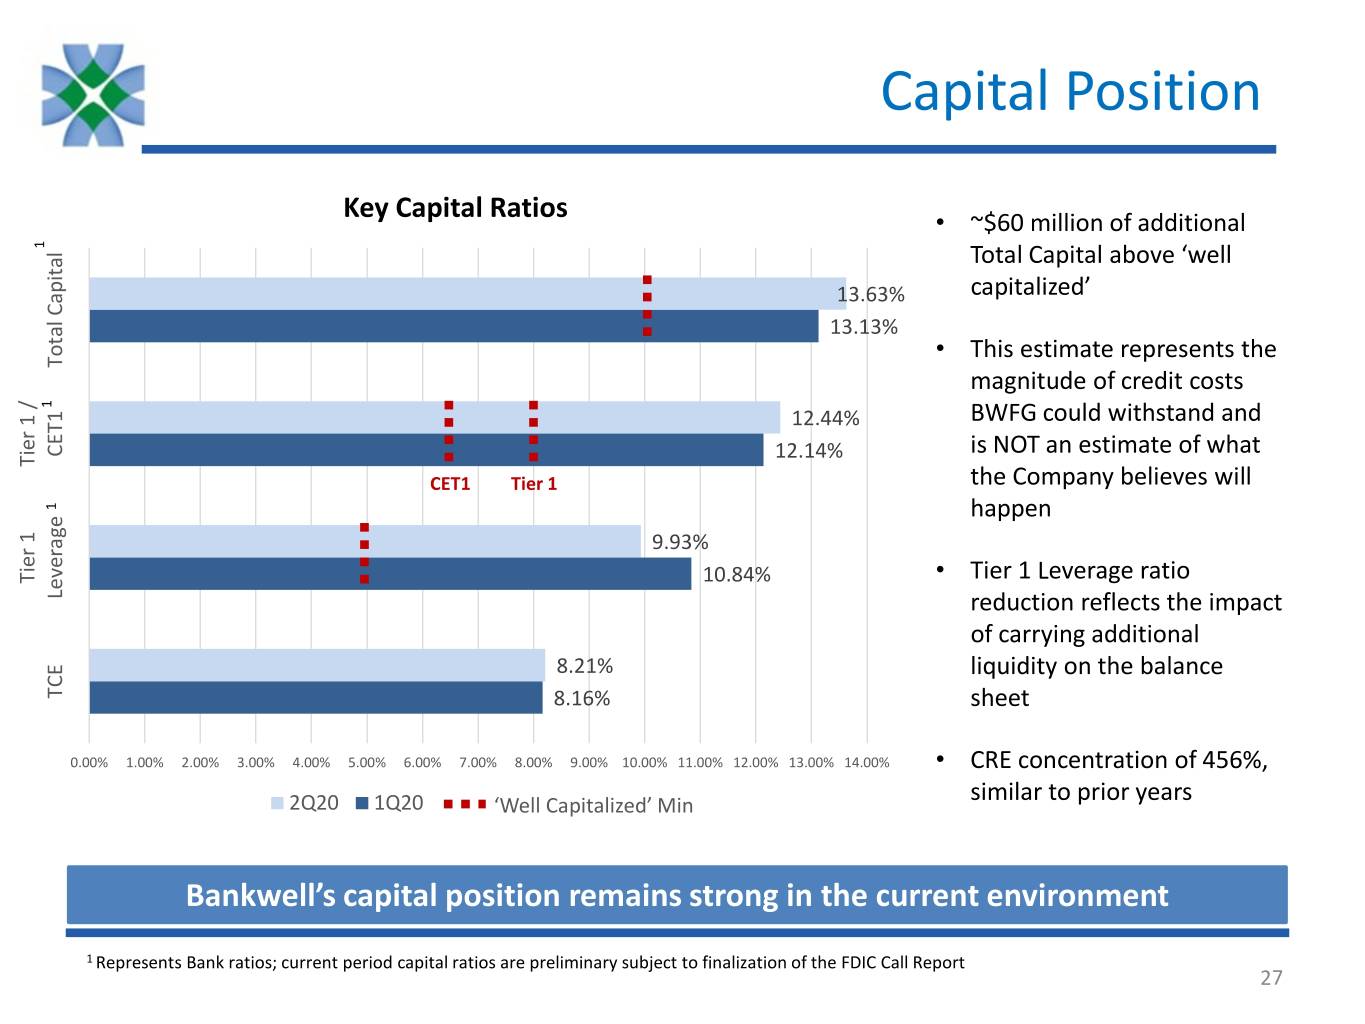
Capital Position Key Capital Ratios • ~$60 million of additional 1 Total Capital above ‘well 13.63% capitalized’ 13.13% • This estimate represents the Total Capital Total magnitude of credit costs 1 12.44% BWFG could withstand and CET1 12.14% is NOT an estimate of what Tier 1 Tier / CET1 Tier 1 the Company believes will 1 happen 9.93% Tier 1 Tier 10.84% • Tier 1 Leverage ratio Leverage reduction reflects the impact of carrying additional 8.21% liquidity on the balance TCE 8.16% sheet 0.00% 1.00% 2.00% 3.00% 4.00% 5.00% 6.00% 7.00% 8.00% 9.00% 10.00% 11.00% 12.00% 13.00% 14.00% • CRE concentration of 456%, similar to prior years 2Q20 1Q20 ‘Well Capitalized’ Min Bankwell’s capital position remains strong in the current environment 1 Represents Bank ratios; current period capital ratios are preliminary subject to finalization of the FDIC Call Report 27

Portfolio Overview
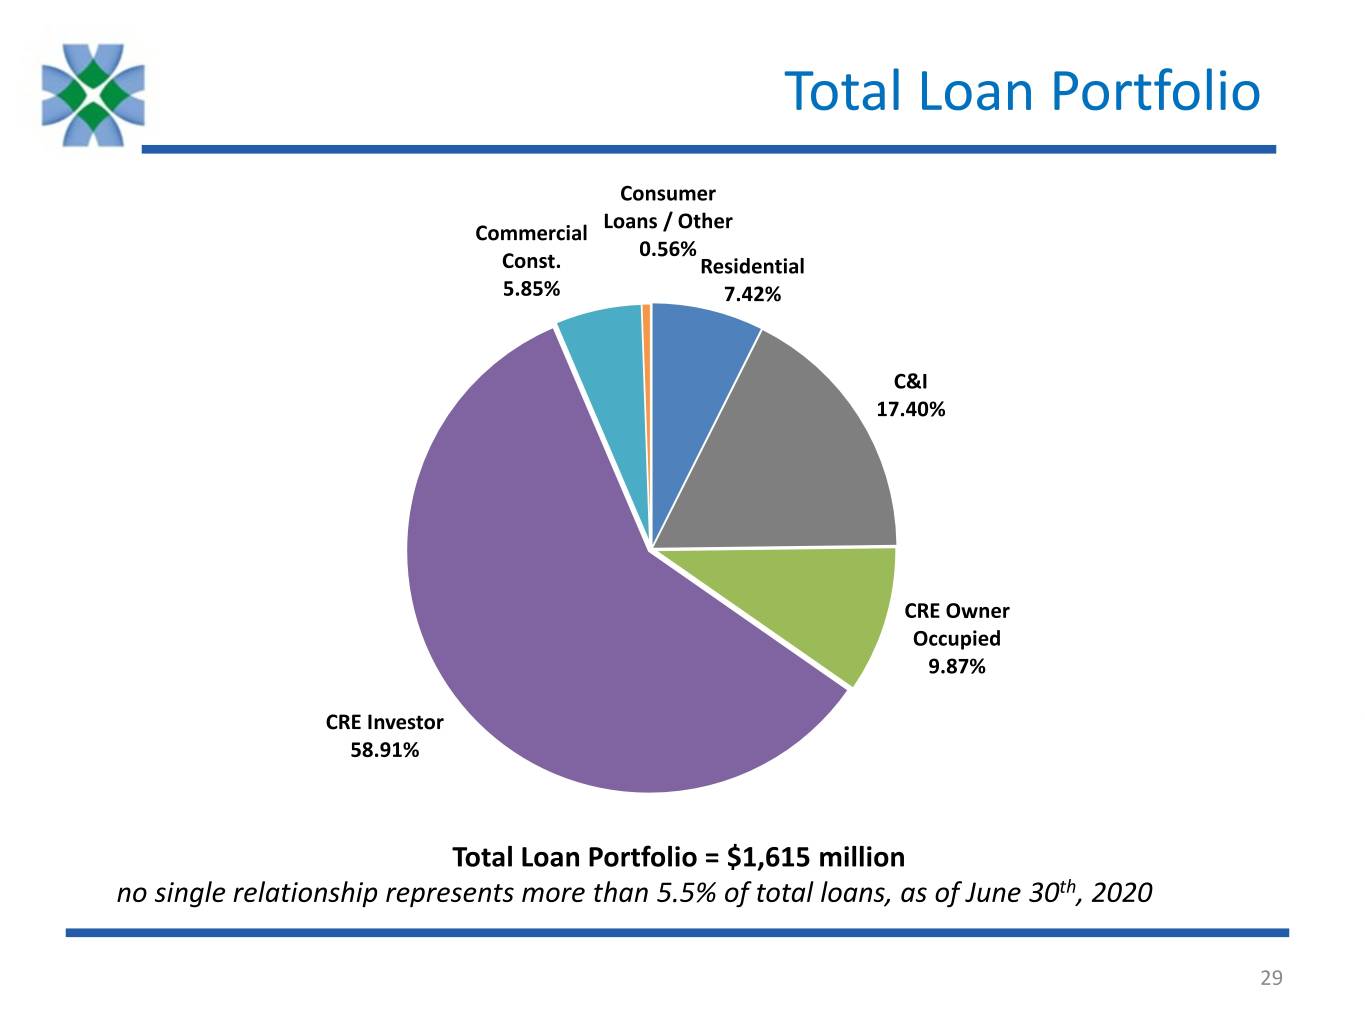
Total Loan Portfolio Consumer Loans / Other Commercial 0.56% Const. Residential 5.85% 7.42% C&I 17.40% CRE Owner Occupied 9.87% CRE Investor 58.91% Total Loan Portfolio = $1,615 million no single relationship represents more than 5.5% of total loans, as of June 30th, 2020 29
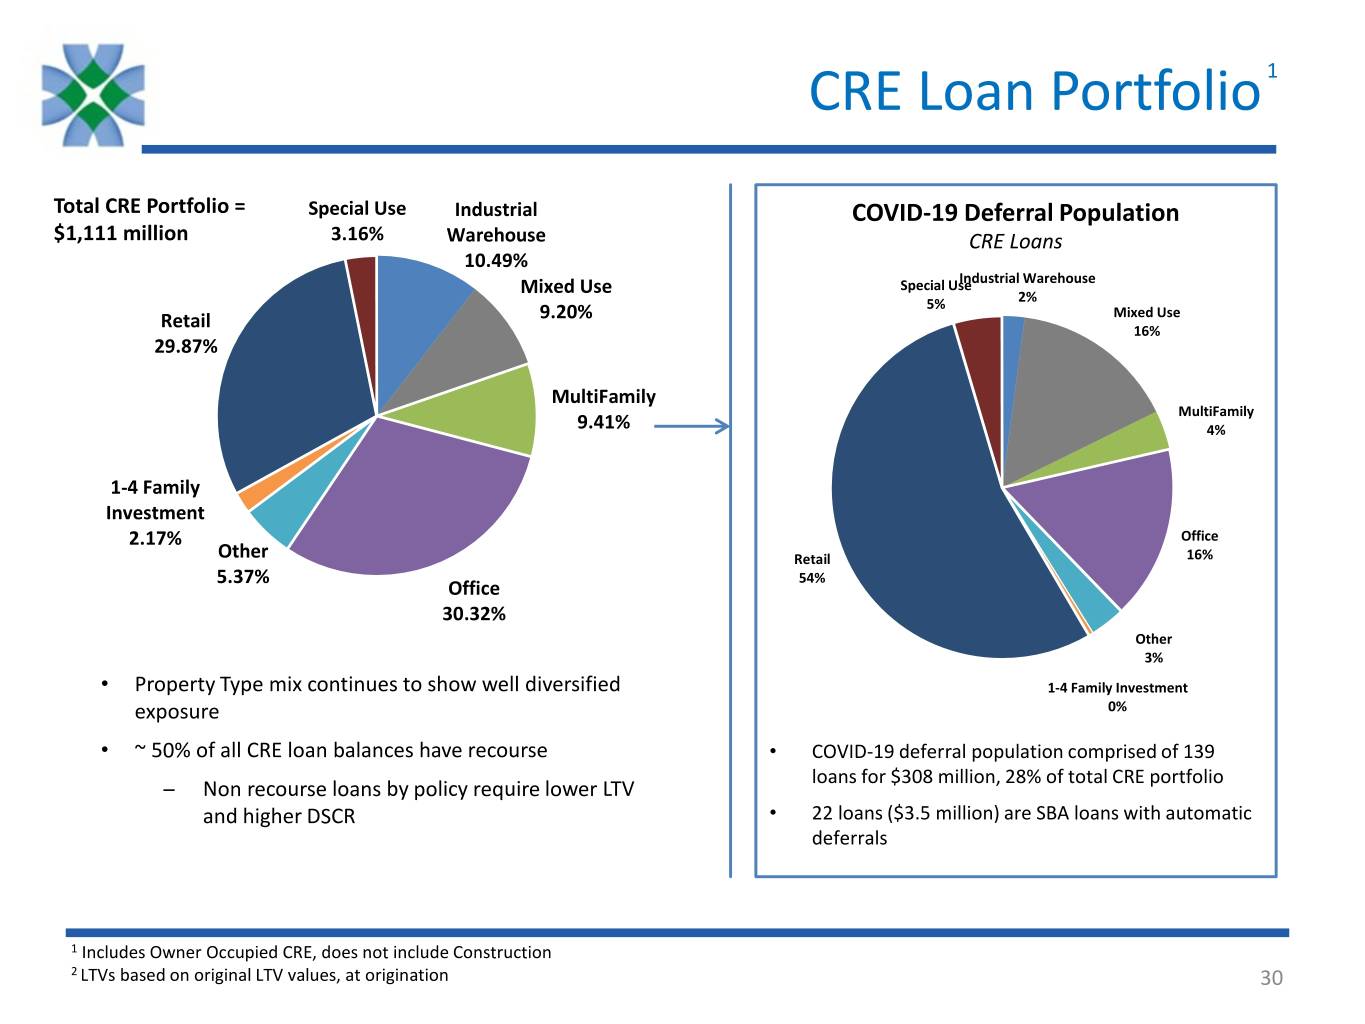
CRE Loan Portfolio 1 Total CRE Portfolio = Special Use Industrial COVID-19 Deferral Population $1,111 million 3.16% Warehouse CRE Loans 10.49% Mixed Use Special UseIndustrial Warehouse 5% 2% 9.20% Mixed Use Retail 16% 29.87% MultiFamily MultiFamily 9.41% 4% 1-4 Family Investment 2.17% Office Other Retail 16% 5.37% 54% Office 30.32% Other 3% • Property Type mix continues to show well diversified 1-4 Family Investment exposure 0% • ~ 50% of all CRE loan balances have recourse • COVID-19 deferral population comprised of 139 loans for $308 million, 28% of total CRE portfolio ̶ Non recourse loans by policy require lower LTV and higher DSCR • 22 loans ($3.5 million) are SBA loans with automatic deferrals 1 Includes Owner Occupied CRE, does not include Construction 2 LTVs based on original LTV values, at origination 30
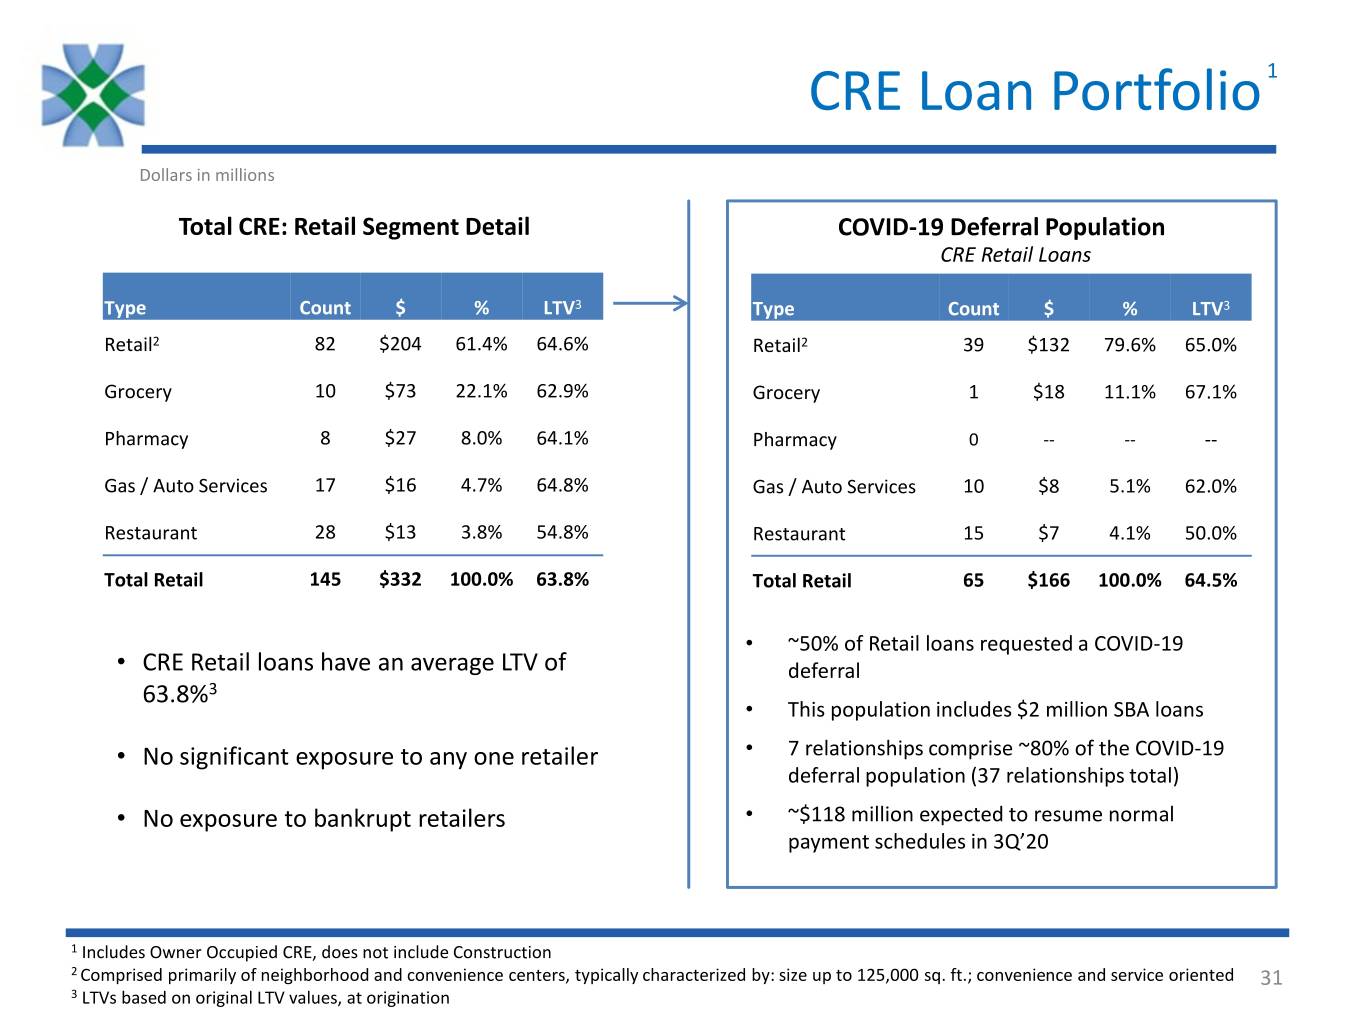
CRE Loan Portfolio 1 Dollars in millions Total CRE: Retail Segment Detail COVID-19 Deferral Population CRE Retail Loans Type Count $ % LTV3 Type Count $ % LTV3 Retail2 82 $204 61.4% 64.6% Retail2 39 $132 79.6% 65.0% Grocery 10 $73 22.1% 62.9% Grocery 1 $18 11.1% 67.1% Pharmacy 8 $27 8.0% 64.1% Pharmacy 0 -- -- -- Gas / Auto Services 17 $16 4.7% 64.8% Gas / Auto Services 10 $8 5.1% 62.0% Restaurant 28 $13 3.8% 54.8% Restaurant 15 $7 4.1% 50.0% Total Retail 145 $332 100.0% 63.8% Total Retail 65 $166 100.0% 64.5% • ~50% of Retail loans requested a COVID-19 • CRE Retail loans have an average LTV of deferral 63.8%3 • This population includes $2 million SBA loans • No significant exposure to any one retailer • 7 relationships comprise ~80% of the COVID-19 deferral population (37 relationships total) • No exposure to bankrupt retailers • ~$118 million expected to resume normal payment schedules in 3Q’20 1 Includes Owner Occupied CRE, does not include Construction 2 Comprised primarily of neighborhood and convenience centers, typically characterized by: size up to 125,000 sq. ft.; convenience and service oriented 31 3 LTVs based on original LTV values, at origination
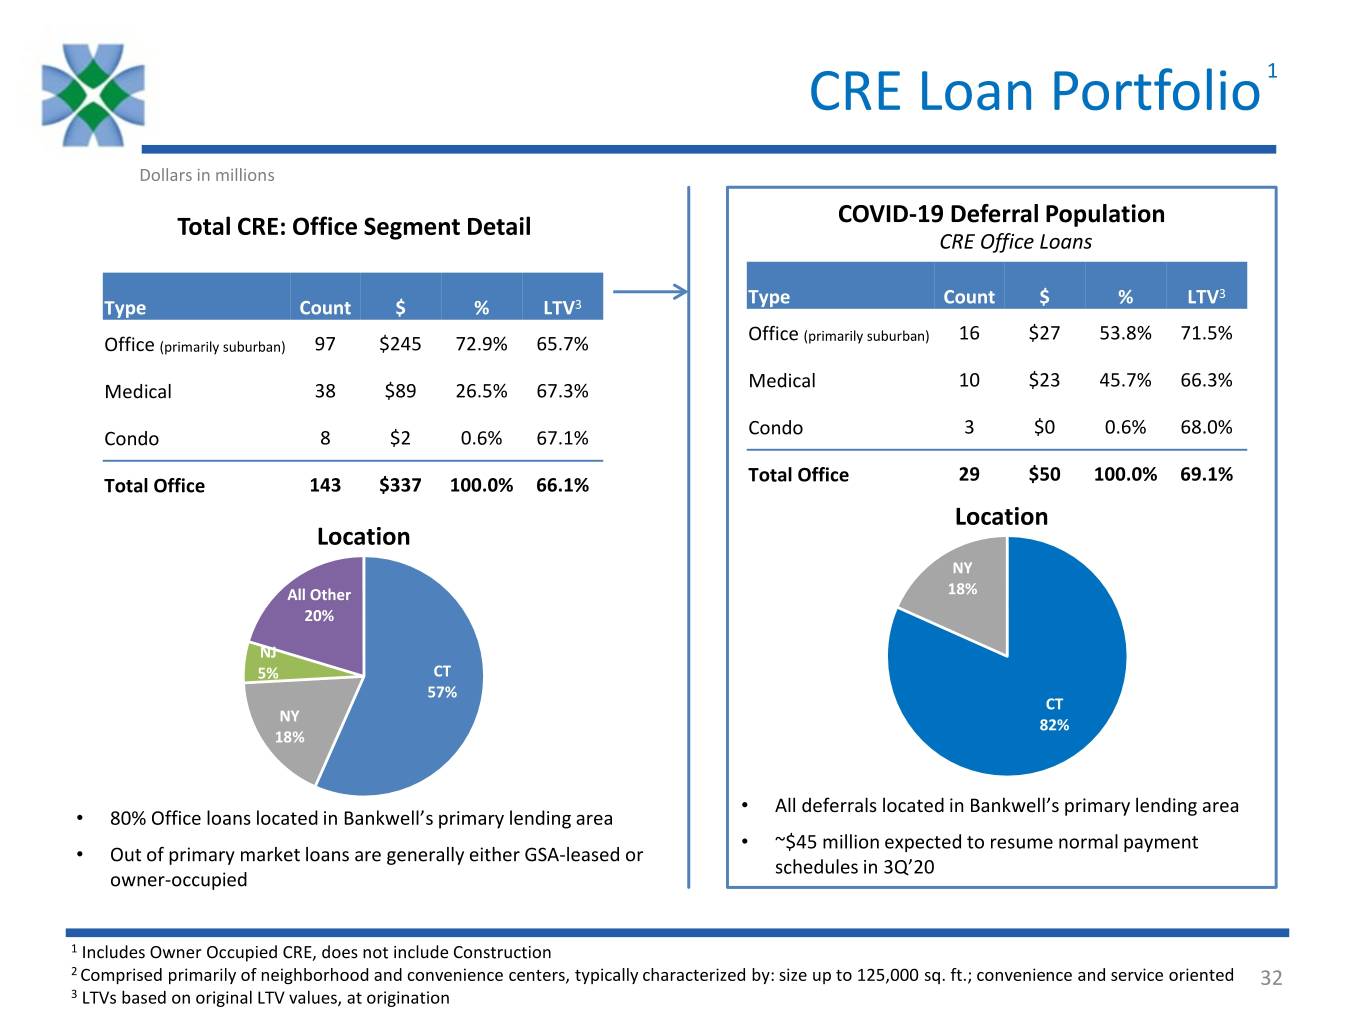
CRE Loan Portfolio 1 Dollars in millions COVID-19 Deferral Population Total CRE: Office Segment Detail CRE Office Loans Type Count $ % LTV3 Type Count $ % LTV3 Office (primarily suburban) 16 $27 53.8% 71.5% Office (primarily suburban) 97 $245 72.9% 65.7% Medical 10 $23 45.7% 66.3% Medical 38 $89 26.5% 67.3% Condo 3 $0 0.6% 68.0% Condo 8 $2 0.6% 67.1% Total Office 29 $50 100.0% 69.1% Total Office 143 $337 100.0% 66.1% Location Location NY All Other 18% 20% NJ 5% CT 57% CT NY 82% 18% • All deferrals located in Bankwell’s primary lending area • 80% Office loans located in Bankwell’s primary lending area • ~$45 million expected to resume normal payment • Out of primary market loans are generally either GSA-leased or schedules in 3Q’20 owner-occupied 1 Includes Owner Occupied CRE, does not include Construction 2 Comprised primarily of neighborhood and convenience centers, typically characterized by: size up to 125,000 sq. ft.; convenience and service oriented 32 3 LTVs based on original LTV values, at origination
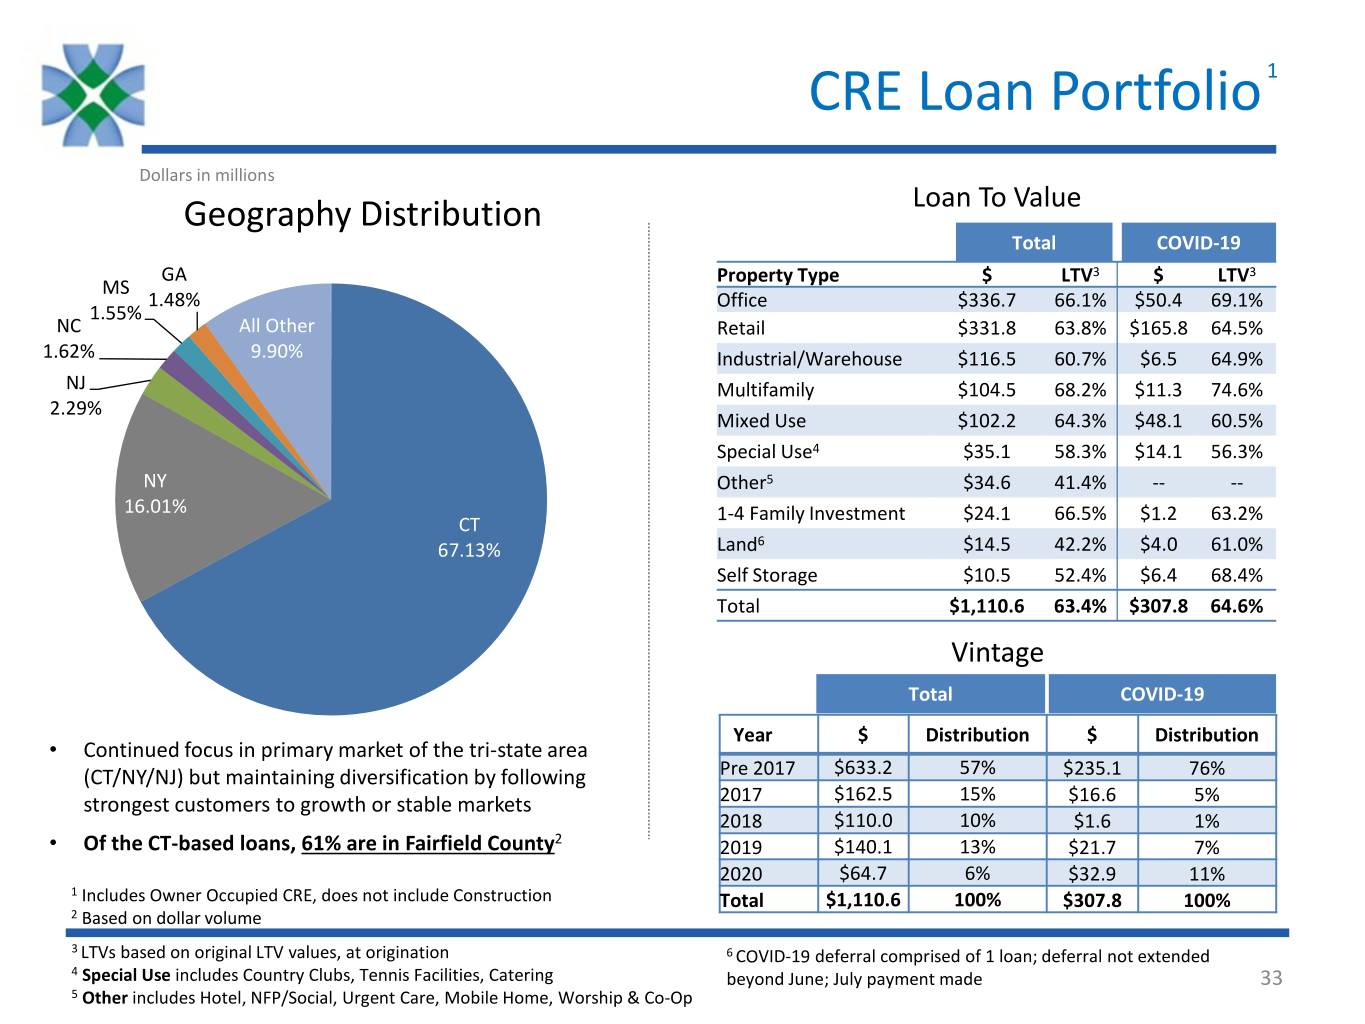
CRE Loan Portfolio 1 Dollars in millions Geography Distribution Loan To Value Total COVID-19 GA Property Type $ LTV3 $ LTV3 MS 1.48% Office $336.7 66.1% $50.4 69.1% 1.55% NC All Other Retail $331.8 63.8% $165.8 64.5% 1.62% 9.90% Industrial/Warehouse $116.5 60.7% $6.5 64.9% NJ Multifamily $104.5 68.2% $11.3 74.6% 2.29% Mixed Use $102.2 64.3% $48.1 60.5% Special Use4 $35.1 58.3% $14.1 56.3% NY Other5 $34.6 41.4% -- -- 16.01% 1-4 Family Investment $24.1 66.5% $1.2 63.2% CT 67.13% Land6 $14.5 42.2% $4.0 61.0% Self Storage $10.5 52.4% $6.4 68.4% Total $1,110.6 63.4% $307.8 64.6% Vintage Total COVID-19 Year $ Distribution $ Distribution • Continued focus in primary market of the tri-state area (CT/NY/NJ) but maintaining diversification by following Pre 2017 $633.2 57% $235.1 76% strongest customers to growth or stable markets 2017 $162.5 15% $16.6 5% 2018 $110.0 10% $1.6 1% • Of the CT-based loans, 61% are in Fairfield County2 2019 $140.1 13% $21.7 7% 2020 $64.7 6% $32.9 11% 1 Includes Owner Occupied CRE, does not include Construction Total $1,110.6 100% $307.8 100% 2 Based on dollar volume 3 LTVs based on original LTV values, at origination 6 COVID-19 deferral comprised of 1 loan; deferral not extended 4 Special Use includes Country Clubs, Tennis Facilities, Catering beyond June; July payment made 33 5 Other includes Hotel, NFP/Social, Urgent Care, Mobile Home, Worship & Co-Op
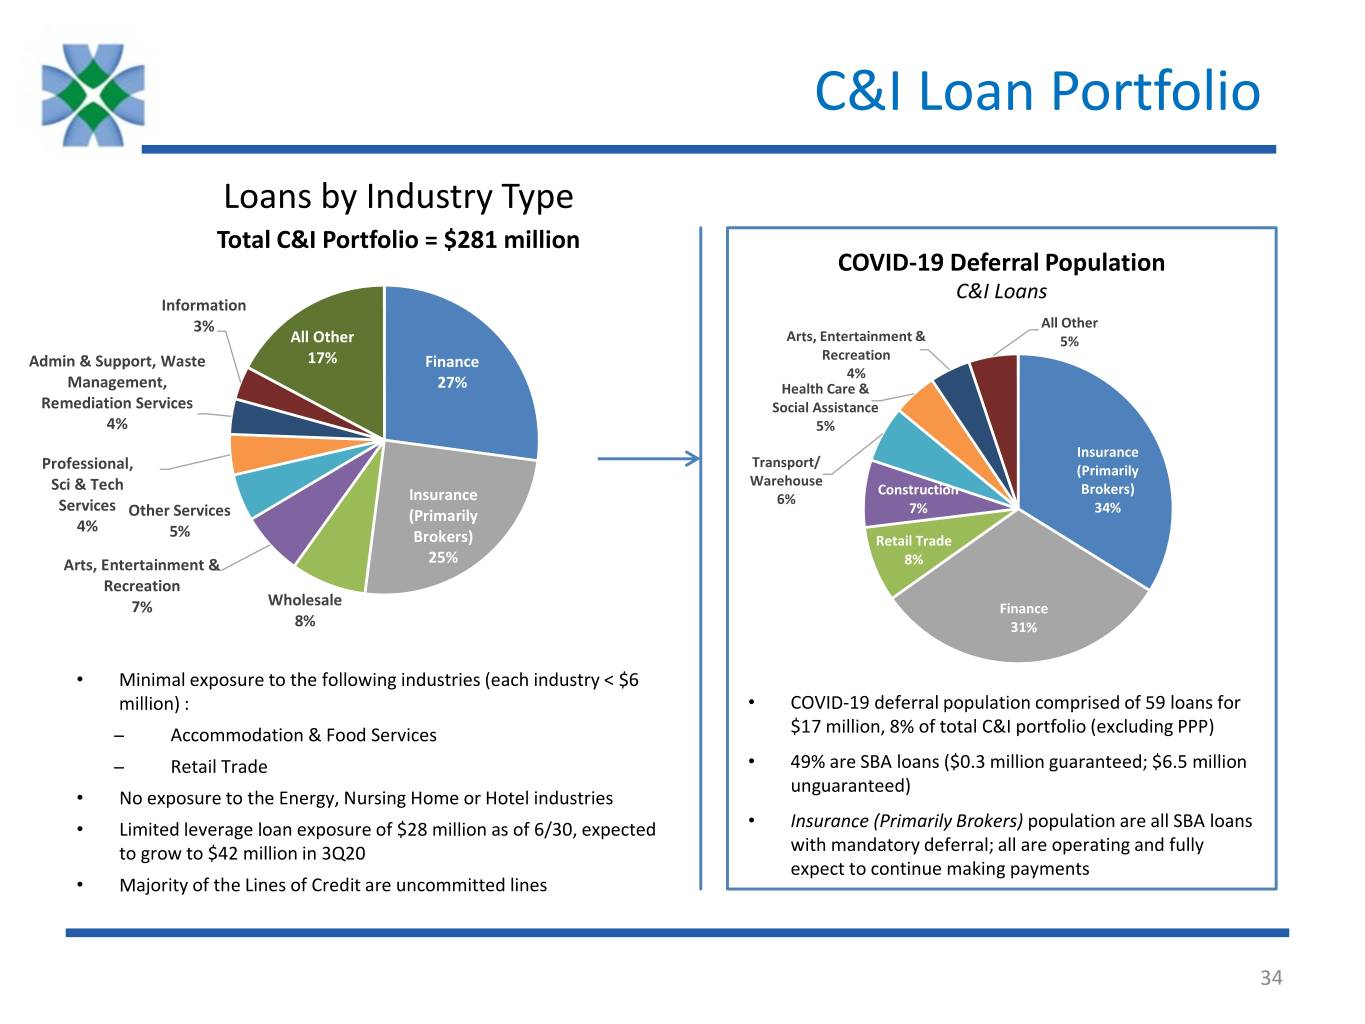
C&I Loan Portfolio Loans by Industry Type Total C&I Portfolio = $281 million COVID-19 Deferral Population C&I Loans Information 3% All Other All Other Arts, Entertainment & 5% Admin & Support, Waste 17% Finance Recreation 4% Management, 27% Health Care & Remediation Services Social Assistance 4% 5% Insurance Transport/ Professional, (Primarily Sci & Tech Warehouse Insurance Construction Brokers) Services 6% Other Services (Primarily 7% 34% 4% 5% Brokers) Retail Trade Arts, Entertainment & 25% 8% Recreation 7% Wholesale Finance 8% 31% • Minimal exposure to the following industries (each industry < $6 million) : • COVID-19 deferral population comprised of 59 loans for ̶ Accommodation & Food Services $17 million, 8% of total C&I portfolio (excluding PPP) ̶ Retail Trade • 49% are SBA loans ($0.3 million guaranteed; $6.5 million unguaranteed) • No exposure to the Energy, Nursing Home or Hotel industries • Limited leverage loan exposure of $28 million as of 6/30, expected • Insurance (Primarily Brokers) population are all SBA loans to grow to $42 million in 3Q20 with mandatory deferral; all are operating and fully expect to continue making payments • Majority of the Lines of Credit are uncommitted lines 34
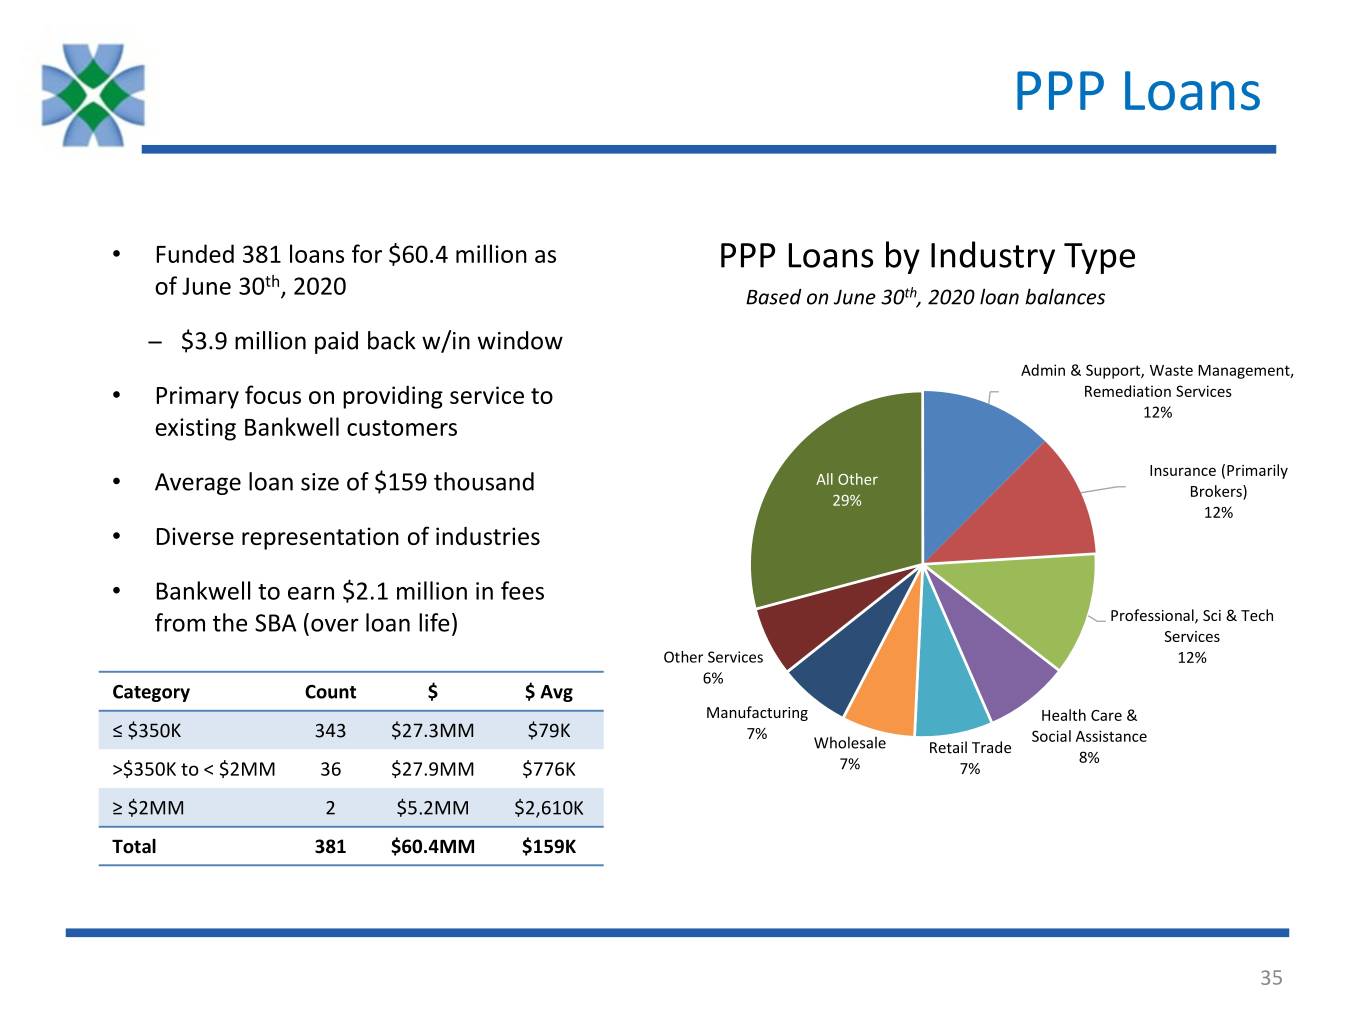
PPP Loans • Funded 381 loans for $60.4 million as PPP Loans by Industry Type th of June 30 , 2020 Based on June 30th, 2020 loan balances ̶ $3.9 million paid back w/in window Admin & Support, Waste Management, • Primary focus on providing service to Remediation Services 12% existing Bankwell customers Insurance (Primarily All Other • Average loan size of $159 thousand Brokers) 29% 12% • Diverse representation of industries • Bankwell to earn $2.1 million in fees Professional, Sci & Tech from the SBA (over loan life) Services Other Services 12% 6% Category Count $ $ Avg Manufacturing Health Care & ≤ $350K 343 $27.3MM $79K 7% Social Assistance Wholesale Retail Trade 8% >$350K to < $2MM 36 $27.9MM $776K 7% 7% ≥ $2MM 2 $5.2MM $2,610K Total 381 $60.4MM $159K 35
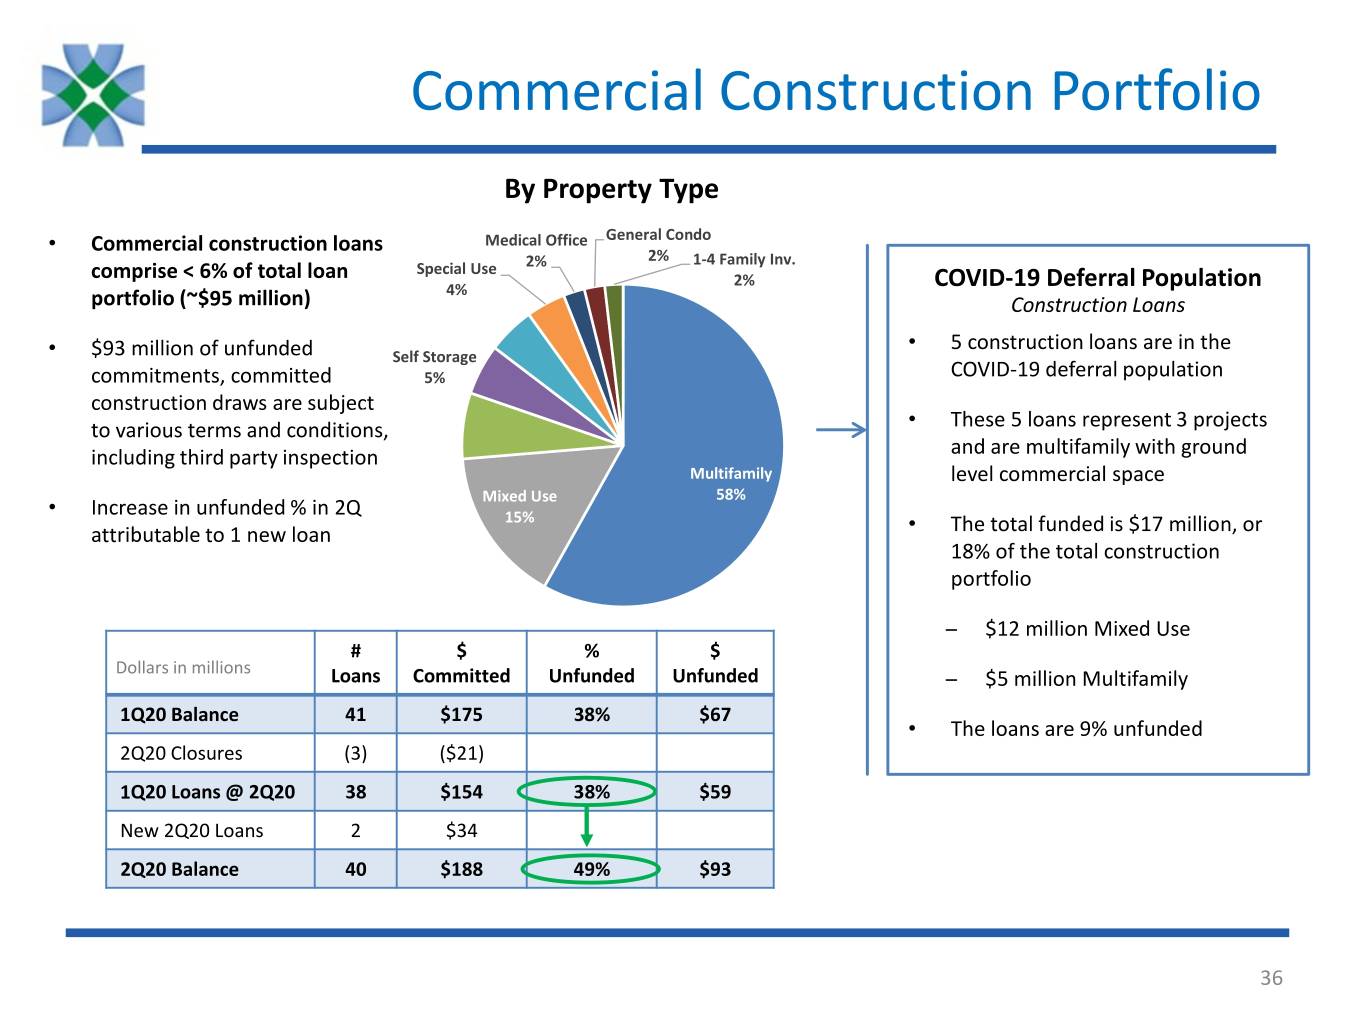
Commercial Construction Portfolio By Property Type • Commercial construction loans Medical Office General Condo 2% 1-4 Family Inv. Special Use 2% comprise < 6% of total loan 2% 4% COVID-19 Deferral Population portfolio (~$95 million) Land Construction Loans 5% • 5 construction loans are in the • $93 million of unfunded Self Storage commitments, committed 5% COVID-19 deferral population construction draws are subject General Retail • These 5 loans represent 3 projects to various terms and conditions, 7% including third party inspection and are multifamily with ground Multifamily level commercial space Mixed Use 58% • Increase in unfunded % in 2Q 15% attributable to 1 new loan • The total funded is $17 million, or 18% of the total construction portfolio ̶ $12 million Mixed Use # $ % $ Dollars in millions Loans Committed Unfunded Unfunded ̶ $5 million Multifamily 1Q20 Balance 41 $175 38% $67 • The loans are 9% unfunded 2Q20 Closures (3) ($21) 1Q20 Loans @ 2Q20 38 $154 38% $59 New 2Q20 Loans 2 $34 2Q20 Balance 40 $188 49% $93 36
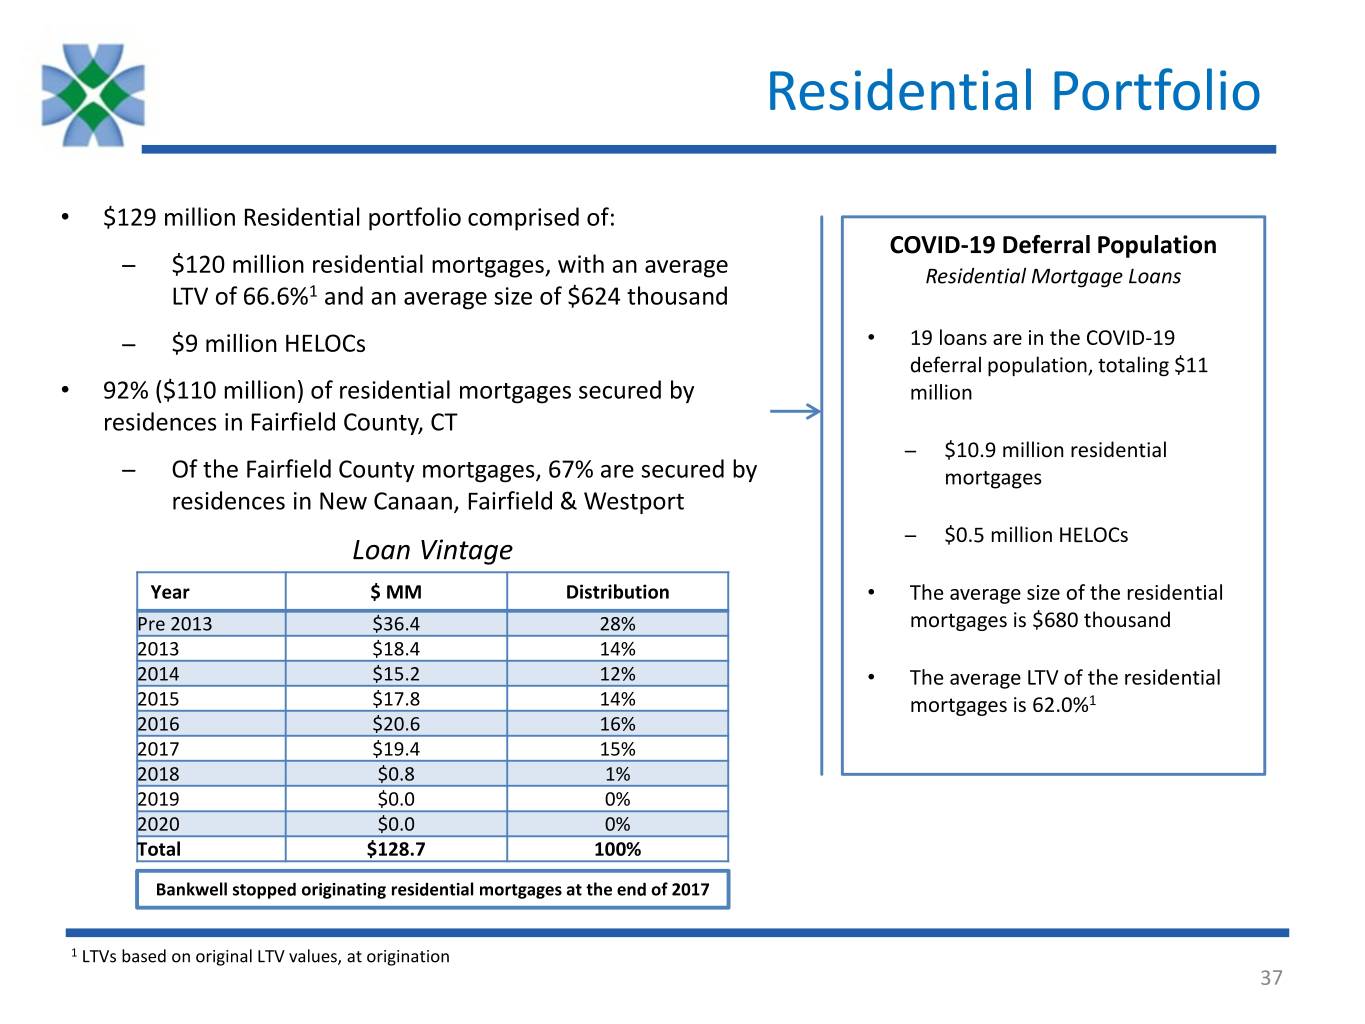
Residential Portfolio • $129 million Residential portfolio comprised of: COVID-19 Deferral Population ̶ $120 million residential mortgages, with an average Residential Mortgage Loans LTV of 66.6%1 and an average size of $624 thousand ̶ $9 million HELOCs • 19 loans are in the COVID-19 deferral population, totaling $11 • 92% ($110 million) of residential mortgages secured by million residences in Fairfield County, CT ̶ $10.9 million residential ̶ Of the Fairfield County mortgages, 67% are secured by mortgages residences in New Canaan, Fairfield & Westport Loan Vintage ̶ $0.5 million HELOCs Year $ MM Distribution • The average size of the residential Pre 2013 $36.4 28% mortgages is $680 thousand 2013 $18.4 14% 2014 $15.2 12% • The average LTV of the residential 2015 $17.8 14% mortgages is 62.0%1 2016 $20.6 16% 2017 $19.4 15% 2018 $0.8 1% 2019 $0.0 0% 2020 $0.0 0% Total $128.7 100% Bankwell stopped originating residential mortgages at the end of 2017 1 LTVs based on original LTV values, at origination 37

Bankwell History & Overview
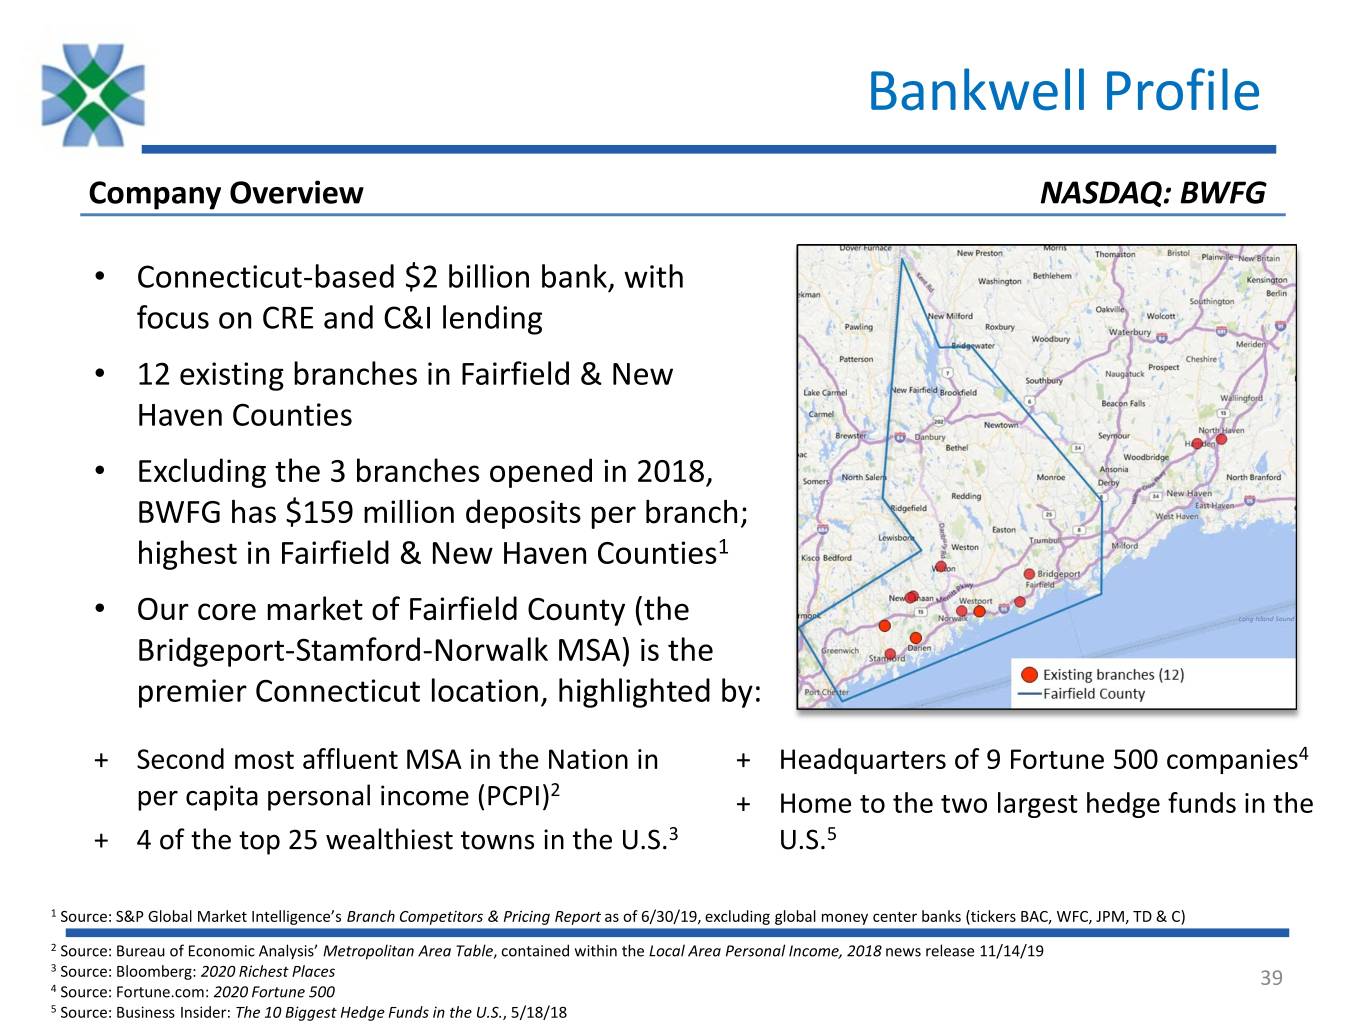
Bankwell Profile Company Overview NASDAQ: BWFG • Connecticut-based $2 billion bank, with focus on CRE and C&I lending • 12 existing branches in Fairfield & New Haven Counties • Excluding the 3 branches opened in 2018, BWFG has $159 million deposits per branch; highest in Fairfield & New Haven Counties1 • Our core market of Fairfield County (the Bridgeport-Stamford-Norwalk MSA) is the premier Connecticut location, highlighted by: + Second most affluent MSA in the Nation in + Headquarters of 9 Fortune 500 companies4 per capita personal income (PCPI)2 + Home to the two largest hedge funds in the + 4 of the top 25 wealthiest towns in the U.S.3 U.S.5 1 Source: S&P Global Market Intelligence’s Branch Competitors & Pricing Report as of 6/30/19, excluding global money center banks (tickers BAC, WFC, JPM, TD & C) 2 Source: Bureau of Economic Analysis’ Metropolitan Area Table, contained within the Local Area Personal Income, 2018 news release 11/14/19 3 Source: Bloomberg: 2020 Richest Places 39 4 Source: Fortune.com: 2020 Fortune 500 5 Source: Business Insider: The 10 Biggest Hedge Funds in the U.S., 5/18/18
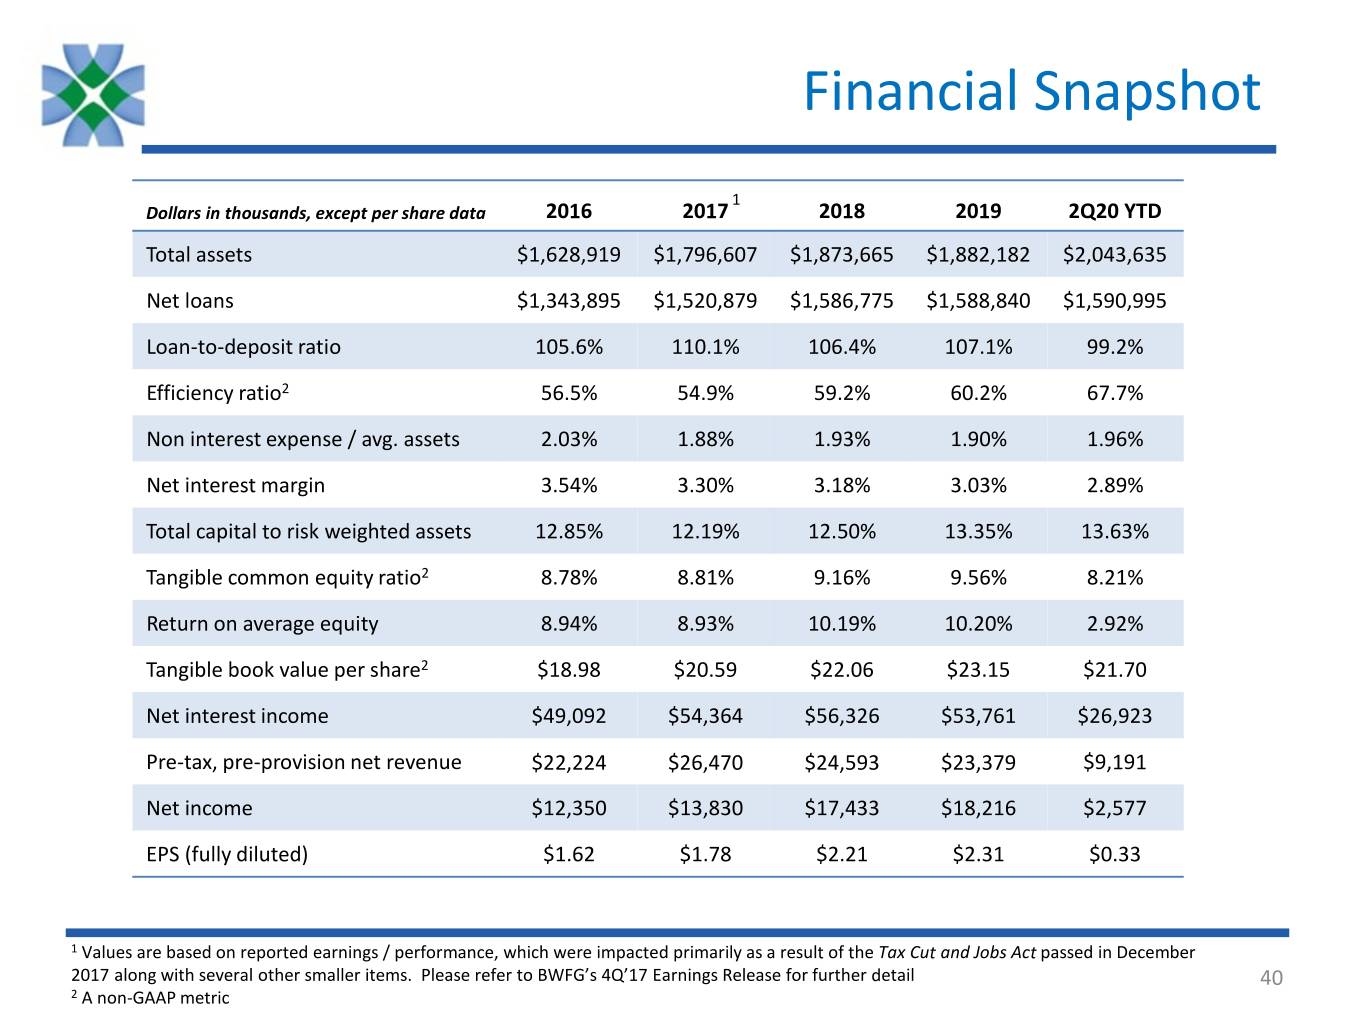
Financial Snapshot 1 Dollars in thousands, except per share data 2016 2017 2018 2019 2Q20 YTD Total assets $1,628,919 $1,796,607 $1,873,665 $1,882,182 $2,043,635 Net loans $1,343,895 $1,520,879 $1,586,775 $1,588,840 $1,590,995 Loan-to-deposit ratio 105.6% 110.1% 106.4% 107.1% 99.2% Efficiency ratio2 56.5% 54.9% 59.2% 60.2% 67.7% Non interest expense / avg. assets 2.03% 1.88% 1.93% 1.90% 1.96% Net interest margin 3.54% 3.30% 3.18% 3.03% 2.89% Total capital to risk weighted assets 12.85% 12.19% 12.50% 13.35% 13.63% Tangible common equity ratio2 8.78% 8.81% 9.16% 9.56% 8.21% Return on average equity 8.94% 8.93% 10.19% 10.20% 2.92% Tangible book value per share2 $18.98 $20.59 $22.06 $23.15 $21.70 Net interest income $49,092 $54,364 $56,326 $53,761 $26,923 Pre-tax, pre-provision net revenue $22,224 $26,470 $24,593 $23,379 $9,191 Net income $12,350 $13,830 $17,433 $18,216 $2,577 EPS (fully diluted) $1.62 $1.78 $2.21 $2.31 $0.33 1 Values are based on reported earnings / performance, which were impacted primarily as a result of the Tax Cut and Jobs Act passed in December 2017 along with several other smaller items. Please refer to BWFG’s 4Q’17 Earnings Release for further detail 40 2 A non-GAAP metric
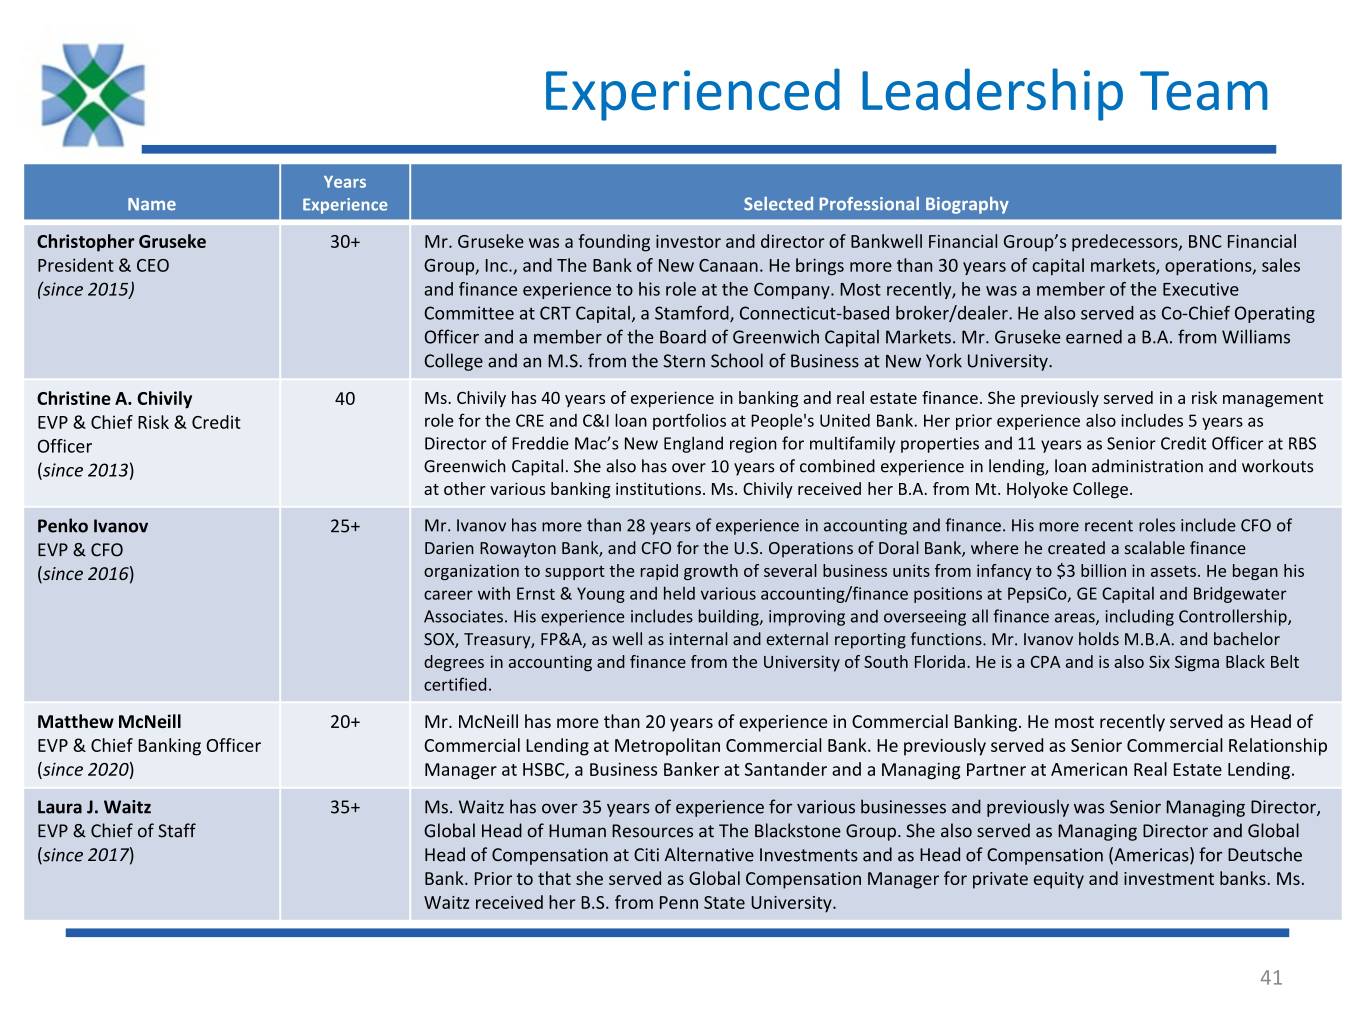
Experienced Leadership Team Years Name Experience Selected Professional Biography Christopher Gruseke 30+ Mr. Gruseke was a founding investor and director of Bankwell Financial Group’s predecessors, BNC Financial President & CEO Group, Inc., and The Bank of New Canaan. He brings more than 30 years of capital markets, operations, sales (since 2015) and finance experience to his role at the Company. Most recently, he was a member of the Executive Committee at CRT Capital, a Stamford, Connecticut-based broker/dealer. He also served as Co-Chief Operating Officer and a member of the Board of Greenwich Capital Markets. Mr. Gruseke earned a B.A. from Williams College and an M.S. from the Stern School of Business at New York University. Christine A. Chivily 40 Ms. Chivily has 40 years of experience in banking and real estate finance. She previously served in a risk management EVP & Chief Risk & Credit role for the CRE and C&I loan portfolios at People's United Bank. Her prior experience also includes 5 years as Officer Director of Freddie Mac’s New England region for multifamily properties and 11 years as Senior Credit Officer at RBS (since 2013) Greenwich Capital. She also has over 10 years of combined experience in lending, loan administration and workouts at other various banking institutions. Ms. Chivily received her B.A. from Mt. Holyoke College. Penko Ivanov 25+ Mr. Ivanov has more than 28 years of experience in accounting and finance. His more recent roles include CFO of EVP & CFO Darien Rowayton Bank, and CFO for the U.S. Operations of Doral Bank, where he created a scalable finance (since 2016) organization to support the rapid growth of several business units from infancy to $3 billion in assets. He began his career with Ernst & Young and held various accounting/finance positions at PepsiCo, GE Capital and Bridgewater Associates. His experience includes building, improving and overseeing all finance areas, including Controllership, SOX, Treasury, FP&A, as well as internal and external reporting functions. Mr. Ivanov holds M.B.A. and bachelor degrees in accounting and finance from the University of South Florida. He is a CPA and is also Six Sigma Black Belt certified. Matthew McNeill 20+ Mr. McNeill has more than 20 years of experience in Commercial Banking. He most recently served as Head of EVP & Chief Banking Officer Commercial Lending at Metropolitan Commercial Bank. He previously served as Senior Commercial Relationship (since 2020) Manager at HSBC, a Business Banker at Santander and a Managing Partner at American Real Estate Lending. Laura J. Waitz 35+ Ms. Waitz has over 35 years of experience for various businesses and previously was Senior Managing Director, EVP & Chief of Staff Global Head of Human Resources at The Blackstone Group. She also served as Managing Director and Global (since 2017) Head of Compensation at Citi Alternative Investments and as Head of Compensation (Americas) for Deutsche Bank. Prior to that she served as Global Compensation Manager for private equity and investment banks. Ms. Waitz received her B.S. from Penn State University. 41

Thank You & Questions
