Attached files
| file | filename |
|---|---|
| 8-K - 8-K - SHORE BANCSHARES INC | tm2025765d1_8k.htm |
Exhibit 99.1

1 Investor Presentation July 2020

2 This investor presentation contains, and future oral and written statements of Shore Bancshares, Inc. (the “Company” or “SHBI ”) and its wholly - owned banking subsidiary, Shore united bank (the “Bank”), and its management may contain, statements about future events that constitute forward - looking statements within the m eaning of the Private Securities Litigation Reform Act of 1995. Forward - looking statements may be identified by references to a future period or periods or by the use of the words "believe, " "expect," "anticipate," "intend," "estimate," "assume," "will," should," "plan," and other similar terms or expressions. Forward - looking statements include, but are not limited to: (i) projections an d estimates of revenues, expenses, income or loss, earnings or loss per share, and other financial items, including our estimated financial results for the second quarter of 2020, (ii) statements o f p lans, objectives and expectations of the Company or its management, (iii) statements of future economic performance, and (iv) statements of assumptions underlying such statements. Forward - looking state ments should not be relied on because they involve known and unknown risks, uncertainties and other factors, some of which are beyond the control of the Company and the Bank. These ris ks, uncertainties and other factors may cause the actual results, performance, and achievements of the Company and the Bank to be materially different from the anticipated future results, per for mance or achievements expressed in, or implied by, the forward - looking statements. Factors that could cause such differences include, but are not limited to, local, regional, national and in ternational economic conditions, the extent of the impact of the COVID - 19 pandemic, including the impact of actions taken by governmental and regulatory authorities in response to such pandemic, s uch as the CARES Act and the programs established thereunder, and our participation in such programs, volatility of the financial markets, changes in interest rates, regulatory considerat ion s, competition and market expansion opportunities, changes in non - interest expenditures or in the anticipated benefits of such expenditures, the receipt of required regulatory approvals, cha nge s in non - performing assets and charge - offs, changes in tax laws, current or future litigation, regulatory examinations or other legal and/or regulatory actions, the impact of any tariffs, te rro rist threats and attacks, acts of war or threats thereof or other pandemics. Therefore, the Company can give no assurance that the results contemplated in the forward - looking statements will be realized. F or more information about these factors, please see our reports filed with or furnished to the Securities and Exchange Commission (the “SEC”), including the Company’s most recent Annual Rep ort on Form 10 - K and Quarterly Report on Form 10 - Q on file with the SEC, including the sections entitled "Risk Factors" and "Management's Discussion and Analysis of Financial Condition and Res ults of Operations." Any forward - looking statements contained in this investor presentation are made as of the date hereof, and the Company undertakes no duty, and specifically disclaims any du ty, to update or revise any such statements, whether as a result of new information, future events or otherwise, except as required by applicable law. This investor presentation has been prepa red by the Company solely for informational purposes based on its own information, as well as information from public sources. Certain of the information contained herein may be derived from info rma tion provided by industry sources. The Company believes such information is accurate and that the sources from which it has been obtained are reliable. However, the Company has not inde pen dently verified such information and cannot guarantee the accuracy of such information. This investor presentation has been prepared to assist interested parties in making their own eva luation of the Company and does not purport to contain all of the information that may be relevant. In all cases, interested parties should conduct their own investigation and analysis of th e C ompany and the data set forth in the investor presentation and other information provided by or on behalf of the Company. This investor presentation is not an offer to sell securities and it is no t soliciting an offer to buy securities in any state where the offer or sale is not permitted. Neither the SEC nor any other regulatory body has appro ved or disapproved of the securities of the Company or passed upon the accuracy or adequacy of this presentation. Any representation to the contrary is a criminal offense. Non - GAAP Financials This investor presentation includes certain non - GAAP financial measures intended to supplement, not substitute for, comparable G AAP measures and the Company’s reported results prepared in accordance with GAAP. Reconciliations of non - GAAP financial measures to GAAP financial measures are provided at the end of the presentation. Numbers in this presentation may not sum due to rounding. Disclaimer
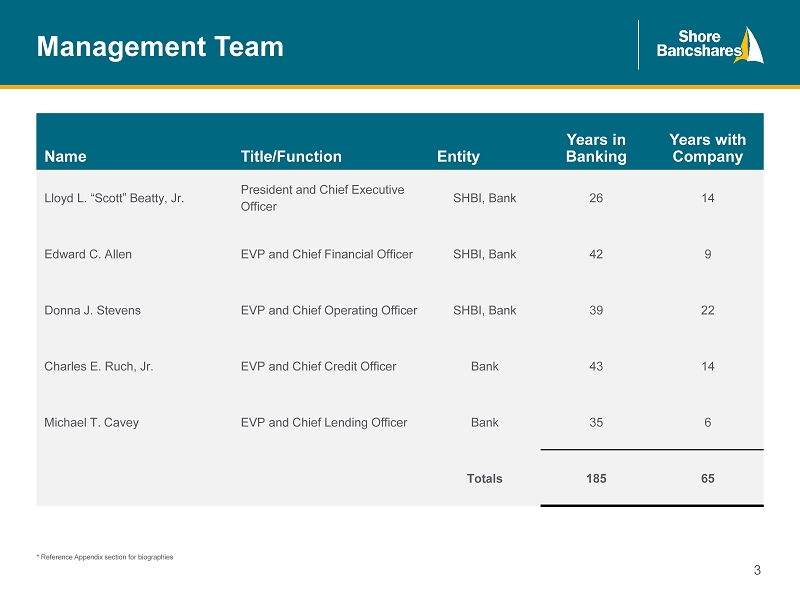
3 Management Team * Reference Appendix section for biographies Name Title/Function Entity Years in Banking Years with Company Lloyd L. “Scott” Beatty, Jr. President and Chief Executive Officer SHBI, Bank 26 14 Edward C. Allen EVP and Chief Financial Officer SHBI, Bank 42 9 Donna J. Stevens EVP and Chief Operating Officer SHBI, Bank 39 22 Charles E. Ruch, Jr. EVP and Chief Credit Officer Bank 43 14 Michael T. Cavey EVP and Chief Lending Officer Bank 35 6 Totals 185 65
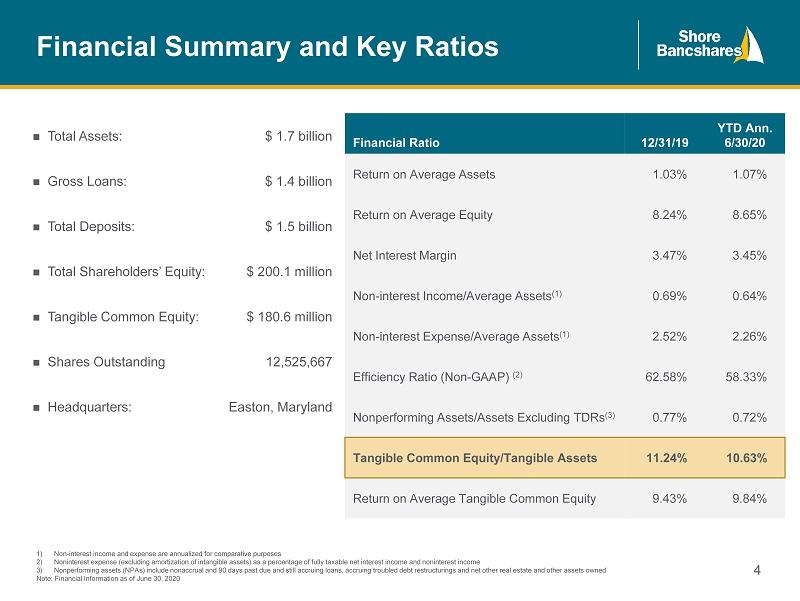
4 Financial Summary and Key Ratios Financial Ratio 12/31/19 YTD Ann. 6/30/20 Return on Average Assets 1.03% 1.07% Return on Average Equity 8.24% 8.65% Net Interest Margin 3.47% 3.45% Non - interest Income/Average Assets (1) 0.69% 0.64% Non - interest Expense/Average Assets (1) 2.52% 2.26% Efficiency Ratio (Non - GAAP) (2) 62.58% 58.33% Nonperforming Assets/Assets Excluding TDRs (3) 0.77% 0.72% Tangible Common Equity/Tangible Assets 11.24% 10.63% Return on Average Tangible Common Equity 9.43% 9.84% Total Assets: $ 1.7 billion Gross Loans: $ 1.4 billion Total Deposits: $ 1.5 billion Total Shareholders’ Equity: $ 200.1 million Tangible Common Equity: $ 180.6 million Shares Outstanding 12,525,667 Headquarters: Easton, Maryland 1) Non - interest income and expense are annualized for comparative purposes 2) Noninterest expense (excluding amortization of intangible assets) as a percentage of fully taxable net interest income and no nin terest income 3) Nonperforming assets (NPAs) include nonaccrual and 90 days past due and still accruing loans, accruing troubled debt restruct uri ngs and net other real estate and other assets owned Note: Financial Information as of June 30, 2020

5 Locations SHORE BANCSHARES Headquarters 28969 Information Lane Easton, MD 2160 BANKING Shore United Bank 18 E. Dover Street Easton, MD 21601 877.758.1600 ShoreUnitedBank.com LOAN PRODUCTION OFFICES Shore United Bank 651 N. Broad Street, Suite 201 Middletown, DE 19709 9748 Stephen Decatur Highway, Unit 104 Ocean City, MD 21842 INVESTMENTS WYE Financial Partners 16 N. Washington Street Easton, MD 21601 410.763.8543 WyeFinancialPartners.com

6 Strategic Direction Market Expansion LPO’s and Strategic Branching Acquire Banks Contiguous to our Existing Markets Leverage Back Office Capability Additions to Staff Have Been Primarily Production Operating Strategy Drive Profitability Emphasis on Core Deposits & Cost of Funds Capitalize on New Market Opportunities Increase Referrals Diversify Loan Portfolio

7 Maryland Rank Share Branches Talbot 1 40.81% 4 Queen Anne’s 2 25.28% 5 Caroline 3 15.61% 2 Kent 5 8.91% 1 Dorchester 7 4.59% 1 Worchester 12 0.50% 1 Howard 14 0.38% 1 Baltimore 16 0.86% 2 Delaware Rank Share Branches Kent 6 5.52% 4 Virginia Accomack 5 1.60% 1 Selected SHBI Market Highlights 2020 Median Household income for entire franchise is $87,818 in MD, $68,672 in DE, $77,431 in VA, vs. $66,010 for the US Projected HH income increase (2020 - 2025) is 9.50% for MD, and 8.08% for DE, and 9.94% for VA Projected 5 - year population growth rate (2020 - 2025) in overall market = 5.25% for MD, 9.16% for DE, and 7.46% for VA SHBI deposit market rank/share by county (2019):
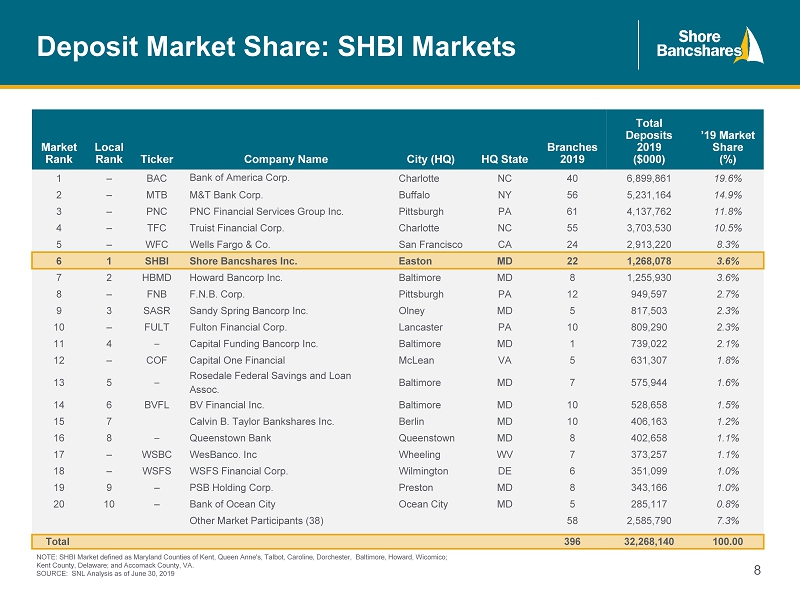
8 Market Rank Local Rank Ticker Company Name City (HQ) HQ State Branches 2019 Total Deposits 2019 ($000) ’19 Market Share (%) 1 – BAC Bank of America Corp. Charlotte NC 40 6,899,861 19.6% 2 – MTB M&T Bank Corp. Buffalo NY 56 5,231,164 14.9% 3 – PNC PNC Financial Services Group Inc. Pittsburgh PA 61 4,137,762 11.8% 4 – TFC Truist Financial Corp. Charlotte NC 55 3,703,530 10.5% 5 – WFC Wells Fargo & Co. San Francisco CA 24 2,913,220 8.3% 6 1 SHBI Shore Bancshares Inc. Easton MD 22 1,268,078 3.6% 7 2 HBMD Howard Bancorp Inc. Baltimore MD 8 1,255,930 3.6% 8 – FNB F.N.B. Corp. Pittsburgh PA 12 949,597 2.7% 9 3 SASR Sandy Spring Bancorp Inc. Olney MD 5 817,503 2.3% 10 – FULT Fulton Financial Corp. Lancaster PA 10 809,290 2.3% 11 4 – Capital Funding Bancorp Inc. Baltimore MD 1 739,022 2.1% 12 – COF Capital One Financial McLean VA 5 631,307 1.8% 13 5 – Rosedale Federal Savings and Loan Assoc. Baltimore MD 7 575,944 1.6% 14 6 BVFL BV Financial Inc. Baltimore MD 10 528,658 1.5% 15 7 Calvin B. Taylor Bankshares Inc. Berlin MD 10 406,163 1.2% 16 8 – Queenstown Bank Queenstown MD 8 402,658 1.1% 17 – WSBC WesBanco. Inc Wheeling WV 7 373,257 1.1% 18 – WSFS WSFS Financial Corp. Wilmington DE 6 351,099 1.0% 19 9 – PSB Holding Corp. Preston MD 8 343,166 1.0% 20 10 – Bank of Ocean City Ocean City MD 5 285,117 0.8% Other Market Participants (38) 58 2,585,790 7.3% Total 396 32,268,140 100.00 Deposit Market Share: SHBI Markets NOTE: SHBI Market defined as Maryland Counties of Kent, Queen Anne's, Talbot, Caroline, Dorchester, Baltimore, Howard, Wicom ico ; Kent County, Delaware; and Accomack County, VA. SOURCE: SNL Analysis as of June 30, 2019

9 Operating in Stable Mid - Atlantic Markets Source: US Bureau of Labor Statistics Rank State May 2020 Preliminary Unemployment Data Total Deposits (in thousands) Rank State May 2020 Preliminary Unemployment Data Total Deposits (in thousands) 1 Nebraska 5.2 27 Indiana 12.3 2 Utah 8.5 28 South Carolina 12.5 3 Wyoming 8.8 29 Alaska 12.6 4 Arizona 8.9 29 Oklahoma 12.6 4 District of Columbia 8.9 31 Vermont 12.7 4 Idaho 8.9 32 North Carolina 12.9 7 Montana 9.0 32 West Virginia 12.9 8 North Dakota 9.1 34 Texas 13.0 9 New Mexico 9.2 35 Pennsylvania 13.1 10 Maine 9.3 USA 13.3 11 Connecticut 9.4 36 Louisiana 13.3 11 South Dakota 9.4 37 Ohio 13.7 11 Virginia 9.4 $7,112 38 Oregon 14.2 14 Arkansas 9.5 39 Florida 14.5 15 Georgia 9.7 39 New Hampshire 14.5 16 Alabama 9.9 39 New York 14.5 16 Maryland 9.9 $1,380,189 42 Washington 15.1 16 Minnesota 9.9 43 Illinois 15.2 19 Iowa 10.0 43 New Jersey 15.2 19 Kansas 10.0 45 Delaware 15.8 $117,699 21 Missouri 10.1 46 California 16.3 22 Colorado 10.2 46 Massachusetts 16.3 23 Mississippi 10.6 46 Rhode Island 16.3 24 Kentucky 11.0 49 Michigan 21.2 25 Tennessee 11.3 50 Hawaii 22.6 26 Wisconsin 12.0 51 Nevada 25.3

10 Recent Developments PAYCHECK PROTECTION PROGRAM (PPP) Shore United Bank team responded quickly to identify impacted customers At 6/30/2020 1,427 loans booked for approximately $122,955,423 22% of loans to new customers Funds are provided in the form of loans that will be fully forgiven when used for payroll costs, interest on mortgages, rent and utilities Loan payments deferred until forgiveness approved or up to 10 months after covered period ends and have a 2 or 5 - year maturity Size # of loans % of total loans Balance as of 6/30/20 Under $150 thousand 1,169 87% $43,106,372 $150 – $350 thousand 105 8% $23,518,045 $350K and above 74 5% $56,331,006 Total 1,348 100% $122,955,423

11 0.17% 0.13% 0.10% 0.04% 0.12% 2016 2017 2018 2019 2020Q2 $968 $1,179 $1,186 $1,303 $1,465 2016 2017 2018 2019 2020Q2 $1,160 $1,394 $1,483 $1,559 $1,720 2016 2017 2018 2019 2020Q2 Total Deposits ($M ) Total Assets ($M ) Total Gross Loans Held for Investment ($M) NCOs / Avg. Loans Targeted, Organic Balance Sheet Growth 1) Core deposits defined as total deposits less total CDs >$250,000 and brokered deposits (as of June 30, 2020) Source: S&P Global Market Intelligence; Company documents $997 $1,203 $1,212 $1,341 $1,505 Core 1 Total

12 $3 $10 $11 $16 $16 $5 2016Y 2017Y 2018Y 2019Y 2020Q2 3.56% 3.76% 3.74% 3.54% 3.45% 2016 2017 2018 2019 2020Q2 0.84% 0.87% 1.15% 1.08% 1.07% 1.74% 2016 2017 2018 2019 2020Q2 Net Income from Continuing Operations ($M) ROAE from Continuing Operations ROAA from Continuing Operations NIM (FTE) Strong, Consistent Historical Profitability Note: 2020Q2 metrics are YTD; Yellow dotted lines in 2018 denote results including proceeds received from sale on insurance s ubs idiary Source: S&P Global Market Intelligence; Company documents $25 2020Q2 2020Q1
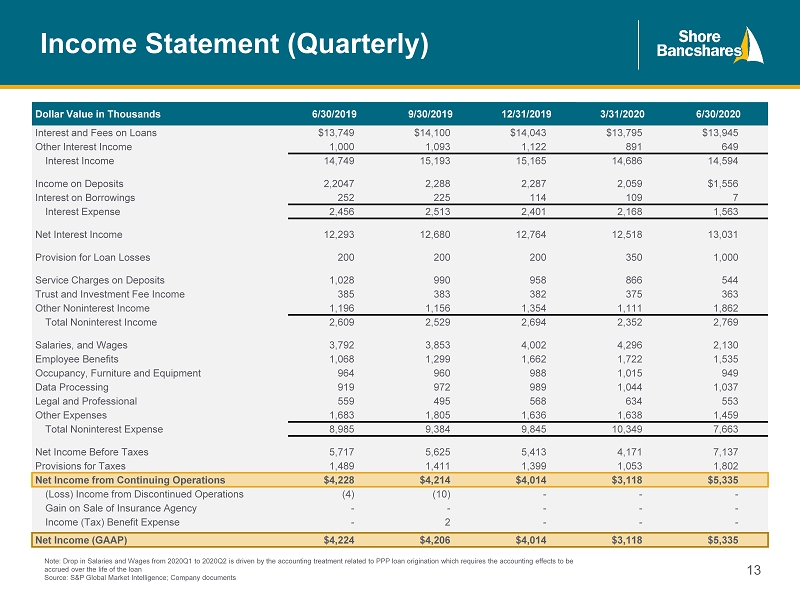
13 Income Statement (Quarterly) Dollar Value in Thousands 6/30/2019 9/30/2019 12/31/2019 3/31/2020 6/30/2020 Interest and Fees on Loans $13,749 $14,100 $14,043 $13,795 $13,945 Other Interest Income 1,000 1,093 1,122 891 649 Interest Income 14,749 15,193 15,165 14,686 14,594 Income on Deposits 2,2047 2,288 2,287 2,059 $1,556 Interest on Borrowings 252 225 114 109 7 Interest Expense 2,456 2,513 2,401 2,168 1,563 Net Interest Income 12,293 12,680 12,764 12,518 13,031 Provision for Loan Losses 200 200 200 350 1,000 Service Charges on Deposits 1,028 990 958 866 544 Trust and Investment Fee Income 385 383 382 375 363 Other Noninterest Income 1,196 1,156 1,354 1,111 1,862 Total Noninterest Income 2,609 2,529 2,694 2,352 2,769 Salaries, and Wages 3,792 3,853 4,002 4,296 2,130 Employee Benefits 1,068 1,299 1,662 1,722 1,535 Occupancy, Furniture and Equipment 964 960 988 1,015 949 Data Processing 919 972 989 1,044 1,037 Legal and Professional 559 495 568 634 553 Other Expenses 1,683 1,805 1,636 1,638 1,459 Total Noninterest Expense 8,985 9,384 9,845 10,349 7,663 Net Income Before Taxes 5,717 5,625 5,413 4,171 7,137 Provisions for Taxes 1,489 1,411 1,399 1,053 1,802 Net Income from Continuing Operations $4,228 $4,214 $4,014 $3,118 $5,335 (Loss) Income from Discontinued Operations (4) (10) - - - Gain on Sale of Insurance Agency - - - - - Income (Tax) Benefit Expense - 2 - - - Net Income (GAAP) $4,224 $4,206 $4,014 $3,118 $5,335 Note: Drop in Salaries and Wages from 2020Q1 to 2020Q2 is driven by the accounting treatment related to PPP loan origination whi ch requires the accounting effects to be accrued over the life of the loan Source: S&P Global Market Intelligence; Company documents

14 Loan Balances Modified Due to COVID - 19 Through 6/30/20 Dollar Value in Thousands Total Loan Balance as of 6/30/2020 Loans Modified to Interest Only Payments (6 Months or Less) Loans Modified to Payment Deferral (3 Months) Total Loans Modified Percentage of Loans Modified Hospitality Industry $112,531,000 $28,725,702 $51,705,214 $80,430,916 71.47% Non - Owner Occupied Retail Stores 92,755,482 4,027,906 51,966,492 55,994,398 60.37% Non - Owner Occupied Retail Stores Restaurant (Anchor) 8,442,175 – 3,214,976 3,214,976 38.08% Owner - Occupied Retail Stores 17,757,890 1,220,257 1,407,768 2,628,025 14.80% Owner – Occupied Restaurants 7,101,825 220,453 1,858,799 2,079,251 29.28% Oil & Gas Industry – – – – – Other Commercial Loans 962,969,830 24,048,090 42,719,044 66,767,135 8.75% Total Commercial Loans $1,001,558,202 $58,242,408 $152,872,293 $211,114,701 21.08% Residential 1 – 4 Family Personal $234,096,010 – – – – Residential 1 – 4 Family Rentals 95,223,000 $658,072 $9,331,354 $9,989,427 $10.49% Home Equity Loans 50,554,956 – – – – Total Residential Real Estate Loans $379,873,966 $658,072 $9,331,354 $9,989,427 2.63% Consumer Loans $26,877,378 – – – – Mortgage Warehouse Loans – – – – – Overdrafts and Other (1,060,699) – – – – Total Loans $1,407,248,847 $58,900,480 $162,203,647 $221,104,127 15.71% Note: Financial Information as of June 30, 2020 Loan Balances Modified due to COVID - 19

15 (Dollar Value in Thousands) As of June 30, 2020 Loan Type Balance % of Total Construction $110,657 7.9% 1 - 4 family residential 14,528 Other 96,129 Residential Real Estate 430,436 30.6% Secured by 1 - 4 family - revolving 51,146 Secured by 1 - 4 family - closed end 342,851 Secured by multifamily residential 36,439 Commercial Real Estate 619,237 44.0% Secured by farmland 33,873 Secured by owner - occupied 203,666 Secured by hotel 112,531 Secured by non - owner retail 101,197 Secured by other 167,970 Restaurant 7,102 0.5% Secured by owner 7,102 Commercial 214,616 15.2% Commercial and industrial loans 91,661 PPP Loans (SBA) 122,955 Consumer 25,201 1.8% Auto 18,493 Other 6,708 Total $1,407,249 100.0% Concentrations as a percentage of total capital as of 6 /30 /20 : CRE Concentration Ratio = 291.0% Construction Concentration Ratio = 60.2% Commercial 15.2% Consumer 1.8% Construction 7.9% Residential Real Estate 30.6% Commercial Real Estate 44.0% Loan Portfolio $1,407.2mm Restaurants 0.5%
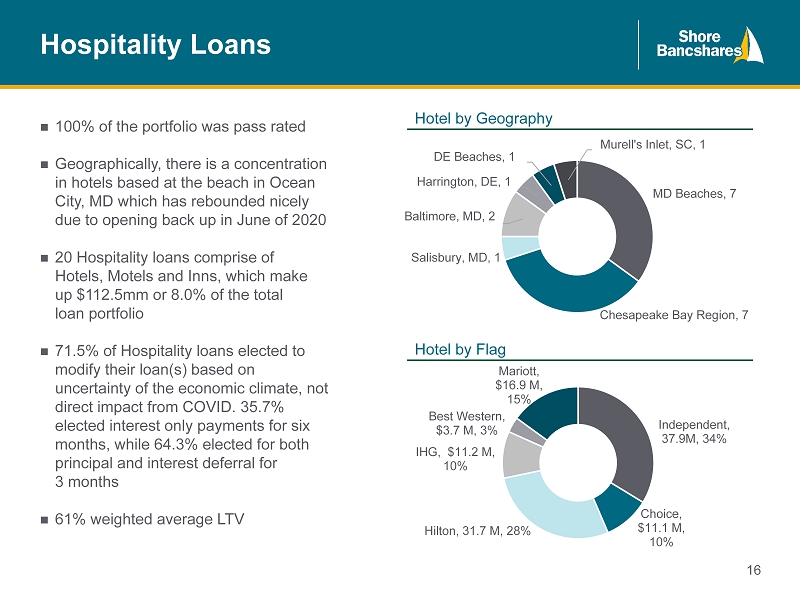
16 100% of the portfolio was pass rated Geographically, there is a concentration in hotels based at the beach in Ocean City, MD which has rebounded nicely due to opening back up in June of 2020 20 Hospitality loans comprise of Hotels, Motels and Inns, which make up $112.5mm or 8.0% of the total loan portfolio 71.5% of Hospitality loans elected to modify their loan(s) based on uncertainty of the economic climate, not direct impact from COVID. 35.7% elected interest only payments for six months, while 64.3% elected for both principal and interest deferral for 3 months 61% weighted average LTV Independent , 37.9M, 34% Choice , $11.1 M, 10% Hilton , 31.7 M, 28% IHG , $11.2 M, 10% Best Western , $3.7 M, 3% Mariott , $16.9 M, 15% MD Beaches , 7 Chesapeake Bay Region , 7 Salisbury, MD , 1 Baltimore, MD , 2 Harrington, DE , 1 DE Beaches , 1 Murell's Inlet, SC , 1 Hospitality Loans Hotel by Geography Hotel by Flag

17 MD/DE Beaches Chesapeake Bay Region Myrtle Beach Area
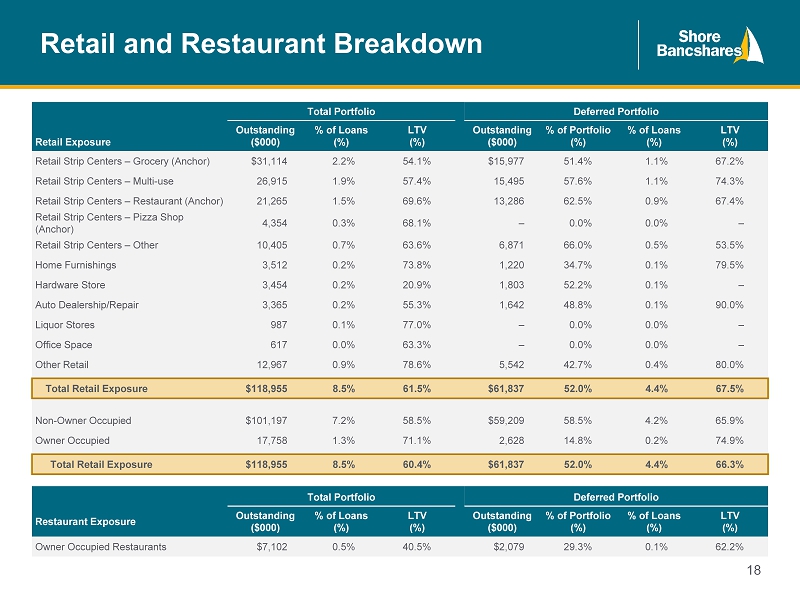
18 Retail and Restaurant Breakdown Total Portfolio Deferred Portfolio Retail Exposure Outstanding ($000) % of Loans (%) LTV (%) Outstanding ($000) % of Portfolio (%) % of Loans (%) LTV (%) Retail Strip Centers – Grocery (Anchor) $31,114 2.2% 54.1% $15,977 51.4% 1.1% 67.2% Retail Strip Centers – Multi - use 26,915 1.9% 57.4% 15,495 57.6% 1.1% 74.3% Retail Strip Centers – Restaurant (Anchor) 21,265 1.5% 69.6% 13,286 62.5% 0.9% 67.4% Retail Strip Centers – Pizza Shop (Anchor) 4,354 0.3% 68.1% – 0.0% 0.0% – Retail Strip Centers – Other 10,405 0.7% 63.6% 6,871 66.0% 0.5% 53.5% Home Furnishings 3,512 0.2% 73.8% 1,220 34.7% 0.1% 79.5% Hardware Store 3,454 0.2% 20.9% 1,803 52.2% 0.1% – Auto Dealership/Repair 3,365 0.2% 55.3% 1,642 48.8% 0.1% 90.0% Liquor Stores 987 0.1% 77.0% – 0.0% 0.0% – Office Space 617 0.0% 63.3% – 0.0% 0.0% – Other Retail 12,967 0.9% 78.6% 5,542 42.7% 0.4% 80.0% Total Retail Exposure $118,955 8.5% 61.5% $61,837 52.0% 4.4% 67.5% Non - Owner Occupied $101,197 7.2% 58.5% $59,209 58.5% 4.2% 65.9% Owner Occupied 17,758 1.3% 71.1% 2,628 14.8% 0.2% 74.9% Total Retail Exposure $118,955 8.5% 60.4% $61,837 52.0% 4.4% 66.3% Total Portfolio Deferred Portfolio Restaurant Exposure Outstanding ($000) % of Loans (%) LTV (%) Outstanding ($000) % of Portfolio (%) % of Loans (%) LTV (%) Owner Occupied Restaurants $7,102 0.5% 40.5% $2,079 29.3% 0.1% 62.2%
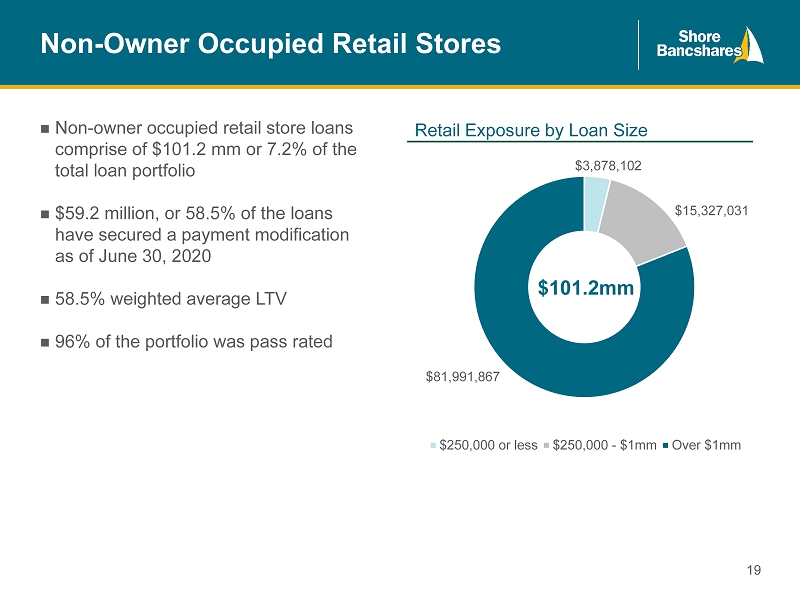
19 $3,878,102 $15,327,031 $81,991,867 $250,000 or less $250,000 - $1mm Over $1mm $101.2mm Non - Owner Occupied Retail Stores Non - owner occupied retail store loans comprise of $101.2 mm or 7.2% of the total loan portfolio $59.2 million, or 58.5% of the loans have secured a payment modification as of June 30, 2020 58.5% weighted average LTV 96% of the portfolio was pass rated Retail Exposure by Loan Size
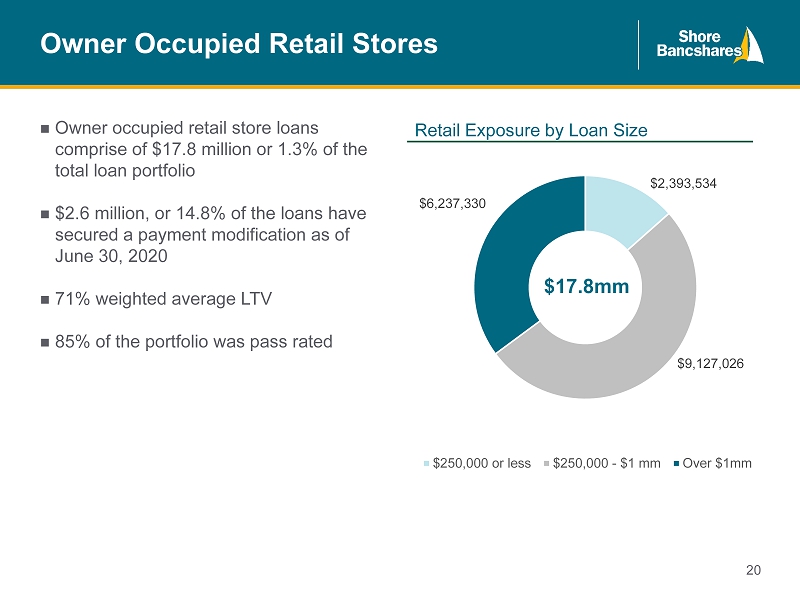
20 $2,393,534 $9,127,026 $6,237,330 $250,000 or less $250,000 - $1 mm Over $1mm $17.8mm Owner Occupied Retail Stores Owner occupied retail store loans comprise of $17.8 million or 1.3% of the total loan portfolio $2.6 million, or 14.8% of the loans have secured a payment modification as of June 30, 2020 71% weighted average LTV 85% of the portfolio was pass rated Retail Exposure by Loan Size
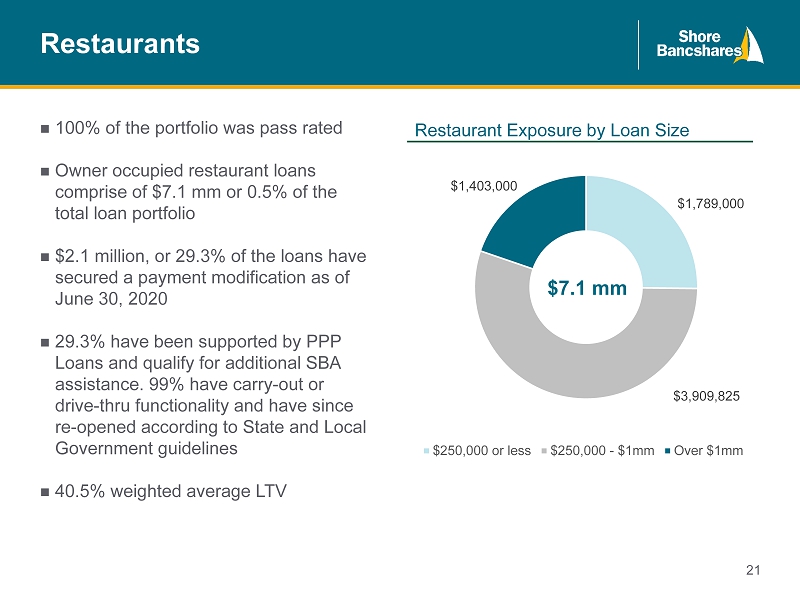
21 $1,789,000 $3,909,825 $1,403,000 $250,000 or less $250,000 - $1mm Over $1mm $7.1 mm Restaurants 100% of the portfolio was pass rated Owner occupied restaurant loans comprise of $7.1 mm or 0.5% of the total loan portfolio $2.1 million, or 29.3% of the loans have secured a payment modification as of June 30, 2020 29.3% have been supported by PPP Loans and qualify for additional SBA assistance. 99% have carry - out or drive - thru functionality and have since re - opened according to State and Local Government guidelines 40.5% weighted average LTV Restaurant Exposure by Loan Size

22 Restaurants Map

23 Dollar Values in Thousands 6/30/2019 6/30/2020 Non - performing Assets Nonaccrual Loans $14,592 $11,649 90+ or More Days Past Due 439 604 Other Real Estate Owned 524 38 Total Non - Performing Assets $15,555 $12,291 Performing TDRs $7,768 $7,312 Total NPAs + TDRs $23,323 $19,603 NPAs / Assets (%) 1.04 0.71 NPAs + TDRS / Assets (%) 1.56 1.14 Reserves Loan Loss Reserve $10,305 $11,090 Reserves / Gross Loans (%) 0.89 (1) 0.84 (1) Reserves / Legacy Loans (%)` 0.83 (2) 0.79 (2) Reserves / Gross Loans (%) 0.83 0.86 (3) Reserves / NPLs (%) 70.62 95.20 Reserves / NPLs+TDRs (%) 44.18 56.57 Net Charge - offs Net Charge - Offs $338 $767 Credit Quality Statistics 1) Includes mark on purchased loans from Northwest 2) Excludes mark on purchased loans from Northwest 3) Excludes PPP loans
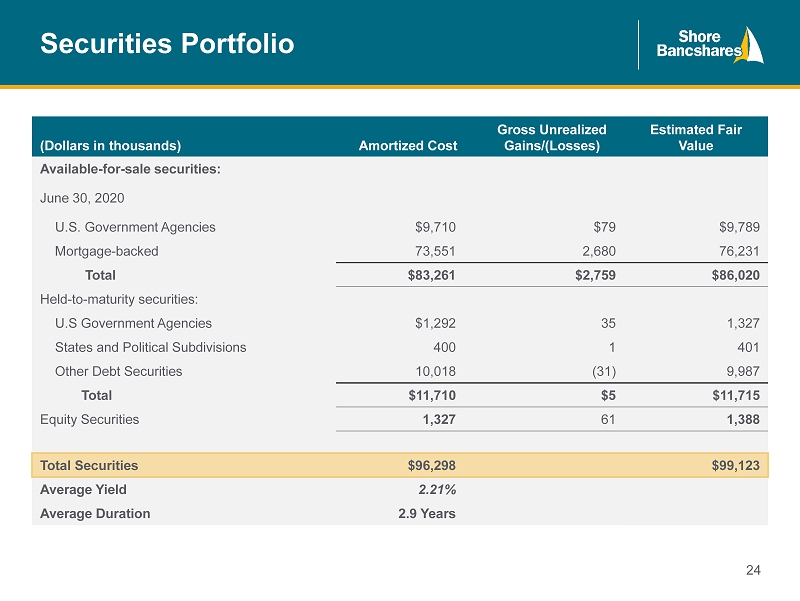
24 (Dollars in thousands) Amortized Cost Gross Unrealized Gains/(Losses) Estimated Fair Value Available - for - sale securities: June 30, 2020 U.S. Government Agencies $9,710 $79 $9,789 Mortgage - backed 73,551 2,680 76,231 Total $83,261 $2,759 $86,020 Held - to - maturity securities: U.S Government Agencies $1,292 35 1,327 States and Political Subdivisions 400 1 401 Other Debt Securities 10,018 (31) 9,987 Total $11,710 $5 $11,715 Equity Securities 1,327 61 1,388 Total Securities $96,298 $99,123 Average Yield 2.21% Average Duration 2.9 Years Securities Portfolio

25 (Dollar Value in Thousands) June 30, 2020 Deposit Type Balance % of Total Average Rate (%) Noninterest Bearing Demand 442,966 29.4 0.00 Interest Bearing Demand 344,940 22.9 0.37 Money Market & Savings 438,103 29.2 0.34 CDs $100,000 or more 129,467 8.6 1.83 Other Time 149,222 9.9 1.58 Total Deposits 1,504,728 100.0 0.53 Total Cost of Interest Bearing Deposits 0.73 Total Cost of Funds (Including Borrowings) 0.54 Noninterest Bearing Demand 29.4% Interest Bearing Demand 22.9% Money Market & Savings 29.2% CDs $100k or more 8.6% Other Time 9.9% $1.504 mm Attractive Deposit Base Retail Exposure by Loan Size

26 1,135 1,160 1,394 1,483 1,559 1,720 11.93% 12.32% 10.38% 11.13% 11.24% 10.26% 4% 8% 12% 16% 20% $0.00 $400.00 $800.00 $1,200.00 $1,600.00 $2,000.00 2015 2016 2017 2018 2019 2020Q2 Total Assets TCE/TA Strong Capital and Asset Growth

27 Capital Ratios (Bank Only) 9.79% 10.64% 10.66% 11.84% 13.00% 13.26% 11.84% 13.00% 13.26% 12.73% 13.87% 14.14% 0.00% 2.00% 4.00% 6.00% 8.00% 10.00% 12.00% 14.00% 16.00% YE 2018 YE 2019 6/30/2020 Tier 1 Leverage Ratio Common Equity Tier 1 Tier 1 Risk-Based Capital Ratio2 Total Risk-Based Capital Ratio

28 Compelling Investment Considerations Excellent Cost of Funds Strategic plan positioned for organic growth and acquisitions Focused on creating sustainable competitive advantages Strengthened noninterest revenue sources Driving a sales culture with both a commercial and retail focus while maintaining our credit discipline

29 APPENDIX Appendix

30 SHBI Management Team Talent, depth, unique skills Lloyd L. “Scott” Beatty, Jr ., 67, CPA, President & CEO of Shore Bancshares, Inc. since June 2013, Director of SHBI since December 2000, Director of Shore United Bank (formerly the Talbot Bank and CNB) since 1992. COO from 2006 until 2012 and named President and CO O in 2012. Formerly COO, private equity firm Darby Overseas Investments. Formerly Managing Partner of public accounting firm. Edward C. Allen , 72, Executive Vice President & Chief Financial Officer Shore Bancshares, Inc. and of Shore United Bank since June 2016 . Prior to that he was President & CEO of CNB, a Shore Bancshares affiliate for two years. Mr. Allen is a career banker with 40 years experience in community banks. Donna J. Stevens , 58, Executive Vice President & Chief Operating Officer of Shore Bancshares, Inc. since July 2015 and Shore United Bank since July 2016. She has been employed by the Company in various officer capacities since 1997, including Senior Vice President, and Senior Operations and Compliance Officer of CNB. Ms. Stevens is a graduate of Maryland Banking School and ABA Stonier Graduate Scho ol of Banking. Charles E. Ruch Jr. , 59, Executive Vice President and Chief Credit Officer of Shore United Bank (formerly CNB) since 2010 and joined CNB in 2006. Entered banking in 1977, holding various retail positions from teller to core manager through the 1980s with Equitable Ban k. Joined AB&T as a commercial lender in 1987 and was AB&T’s Senior Commercial Lender for 10 years. Graduated from the University of Ma ryl and in 1983. Michael T. Cavey , 61 , Executive Vice President and Chief Lending Officer of Shore United Bank (formerly the Talbot Bank) joined the bank in 2014 as a Senior Vice President and Commercial Sales Manager. Prior to his employment in 2014 with The Talbot Bank, Mr. Cavey wo rked for Howard Bank as a Senior Vice President and Regional Executive for Howard and Anne Arundel Counties for five years. Prior to his position at Howard Bank, Mr. Cavey held a Senior Vice President and Commercial Team Leader positions at Sandy Spring Bank and M& T Bank. Mr. Cavey received his Bachelor of Science degree from Duke University. Jennifer M. Joseph ; 51 , Executive Vice President and Chief Retail Officer of Shore United Bank since November 2016. Prior to her employment, Mrs. Joseph served as the Market Executive of PNC Bank, N.A. from 2011 to 2015. Mrs. Joseph entered into banking in 1986, holding various retail and lending positions, including Business Banking Sales Manager. She is a graduate of ABA Stonier Grad uat e School of Banking and CBA Graduate School of Retail Bank Management. W. David Morse , 58, Executive Vice President and Legal Counsel of Shore Bancshares, Inc. and Shore United Bank (formerly the Talbot Bank) has served as Secretary and General Counsel for the Company since 2008. He began employment with Talbot Bank in 1991. He received his Juris Doctorate from the University of Baltimore and his Bachelor of Arts degree from High Point College, NC.

31 Dollar Values in Thousands 2016 2017 2018 2019 6/30/2020 Assets Cash and Cash Equivalents $75,938 $31,820 $67,225 $94,971 $126,284 Available for Sale Securities 163,902 196,955 154,432 122,791 86,020 Other Securities 1,650 3,735 7,745 5,532 16,724 Total Cash & Securities 248,194 238,757 235,445 232,080 229,028 Loans Held for Sale – – – – – Total Loans Held for Investment 871,525 1,093,514 1,195,355 1,248,654 1,407,249 Loan Loss Reserve (8,726) (9,781) (10,343) (10,507) (11,090) Total Net Loans Held for Investment 862,799 1,083,733 1,185,012 1,238,147 1,396,159 Goodwill and Other Intangibles 13,010 21,241 20,375 19,770 19,488 Total Other Assets 33,791 48,335 41,022 69,164 74,849 Total Assets 1,160,271 $1,393,860 $1,483,076 $1,559,235 $1,719,524 Liabilities Deposits $997,489 $1,202,781 $1,212,341 $1,341,334 $1,504,728 FHLB Borrowings – 15,662 74,989 15,000 – Senior Debt 3,203 21,734 75,812 21,018 22,234 Subordinated Debt – – – – – Total Debt 3,203 21,734 75,812 21,018 22,234 Other Liabilities 5,280 5,609 11,738 4,081 (7,572) Total Liabilities 1,005,972 $1,230,124 $1,299,891 $1,366,433 $1,519,390 Equity Total Equity $154,299 $163,736 $183,185 $192,802 $200,134 Total Liabilities & Shareholder's Equity $1,160,271 $1,393,860 $1,483,076 $1,559,235 $1,719,524 Consolidated Historical Balance Sheet Source: S&P Global Market Intelligence
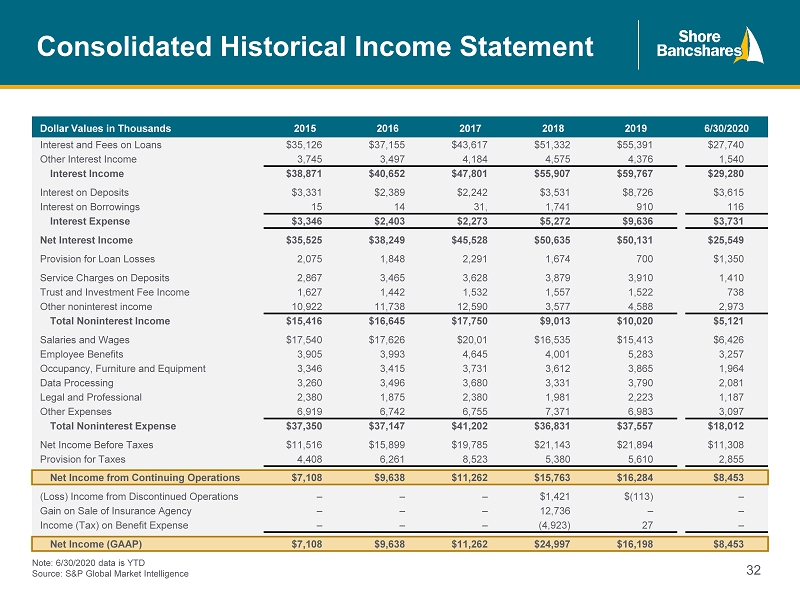
32 Consolidated Historical Income Statement Note: 6/30/2020 data is YTD Source: S&P Global Market Intelligence Dollar Values in Thousands 2015 2016 2017 2018 2019 6/30/2020 Interest and Fees on Loans $35,126 $37,155 $43,617 $51,332 $55,391 $27,740 Other Interest Income 3,745 3,497 4,184 4,575 4,376 1,540 Interest Income $38,871 $40,652 $47,801 $55,907 $59,767 $29,280 Interest on Deposits $3,331 $2,389 $2,242 $3,531 $8,726 $3,615 Interest on Borrowings 15 14 31, 1,741 910 116 Interest Expense $3,346 $2,403 $2,273 $5,272 $9,636 $3,731 Net Interest Income $35,525 $38,249 $45,528 $50,635 $50,131 $25,549 Provision for Loan Losses 2,075 1,848 2,291 1,674 700 $1,350 Service Charges on Deposits 2,867 3,465 3,628 3,879 3,910 1,410 Trust and Investment Fee Income 1,627 1,442 1,532 1,557 1,522 738 Other noninterest income 10,922 11,738 12,590 3,577 4,588 2,973 Total Noninterest Income $15,416 $16,645 $17,750 $9,013 $10,020 $5,121 Salaries and Wages $17,540 $17,626 $20,01 $16,535 $15,413 $6,426 Employee Benefits 3,905 3,993 4,645 4,001 5,283 3,257 Occupancy, Furniture and Equipment 3,346 3,415 3,731 3,612 3,865 1,964 Data Processing 3,260 3,496 3,680 3,331 3,790 2,081 Legal and Professional 2,380 1,875 2,380 1,981 2,223 1,187 Other Expenses 6,919 6,742 6,755 7,371 6,983 3,097 Total Noninterest Expense $37,350 $37,147 $41,202 $36,831 $37,557 $18,012 Net Income Before Taxes $11,516 $15,899 $19,785 $21,143 $21,894 $11,308 Provision for Taxes 4,408 6,261 8,523 5,380 5,610 2,855 Net Income from Continuing Operations $7,108 $9,638 $11,262 $15,763 $16,284 $8,453 (Loss) Income from Discontinued Operations – – – $1,421 $(113) – Gain on Sale of Insurance Agency – – – 12,736 – – Income (Tax) on Benefit Expense – – – (4,923) 27 – Net Income (GAAP) $7,108 $9,638 $11,262 $24,997 $16,198 $8,453