Attached files
| file | filename |
|---|---|
| EX-23 - SHORE BANCSHARES INC | v214536_ex23.htm |
| EX-3.2(I) - SHORE BANCSHARES INC | v214536_ex3-2i.htm |
| EX-3.2(IV) - SHORE BANCSHARES INC | v214536_ex3-2iv.htm |
| EX-3.2(II) - SHORE BANCSHARES INC | v214536_ex3-2ii.htm |
| EX-3.2(III) - SHORE BANCSHARES INC | v214536_ex3-2iii.htm |
| EX-32 - SHORE BANCSHARES INC | v214536_ex32.htm |
| EX-31.1 - SHORE BANCSHARES INC | v214536_ex31-1.htm |
| EX-31.2 - SHORE BANCSHARES INC | v214536_ex31-2.htm |
UNITED STATES
SECURITIES AND EXCHANGE COMMISSION
Washington, D.C. 20549
FORM 10-K
ANNUAL REPORT PURSUANT TO SECTION 13 OR 15(d) OF THE
SECURITIES EXCHANGE ACT OF 1934
For the Year Ended December 31, 2010
Commission File No. 0-22345
SHORE BANCSHARES, INC.
(Exact name of registrant as specified in its charter)
|
Maryland
|
52-1974638
|
|
(State or Other Jurisdiction of
|
(I.R.S. Employer
|
|
Incorporation or Organization)
|
Identification No.)
|
|
18 East Dover Street, Easton, Maryland
|
21601
|
|
(Address of Principal Executive Offices)
|
(Zip Code)
|
(410) 763-7800
Registrant’s Telephone Number, Including Area Code
Securities Registered pursuant to Section 12(b) of the Act:
|
Title of Each Class:
|
Name of Each Exchange on Which Registered:
|
|
Common stock, par value $.01 per share
|
Nasdaq Global Select Market
|
Indicate by check mark if the registrant is a well-known seasoned issuer, as defined in Rule 405 of the Securities Act. £
Indicate by check mark if the registrant is not required to file reports pursuant to Section 13 or Section 16(d) of the Act. £
Indicate by check mark whether the registrant (1) has filed all reports required to be filed by Section 13 or 15(d) of the Securities Exchange Act of 1934 during the preceding 12 months (or for such shorter period that the registrant was required to file such reports), and (2) has been subject to such filing requirements for the past 90 days Yes R No £
Indicate by check mark whether the registrant has submitted electronically and posted on its corporate Web site, if any, every Interactive Data File required to be submitted and posted pursuant to Rule 405 of Regulation S-T (§232.405 of this chapter) during the preceding 12 months (or for such shorter period that the registrant was required to submit and post such files). Yes £ No £ (Not Applicable)
Indicate by check mark if disclosure of delinquent filers pursuant to Item 405 of Regulation S-K is not contained herein, and will not be contained, to the best of the registrant’s knowledge, in definitive proxy or information statements incorporated by reference in Part III of this Form 10-K or any amendment to this Form 10-K £
Indicate by check mark whether the registrant is a large accelerated filer, an accelerated filer, or a non-accelerated filer (check one):
|
Large accelerated filer £
|
Accelerated filer R
|
Non-accelerated filer £
|
Smaller Reporting Company £
|
Indicate by check mark whether the registrant is a shell company (as defined in Rule 12b-2 of the Exchange Act): Yes £ No R
State the aggregate market value of the voting and non-voting common equity held by non-affiliates computed by reference to the price at which the common equity was last sold, or the average bid and asked price of such common equity, as of the last business day of the registrant’s most recently completed second fiscal quarter: $95,759,413.
The number of shares outstanding of the registrant’s common stock as of the latest practicable date: 8,443,436 as of February 28, 2011.
Documents Incorporated by Reference
Certain information required by Part III of this annual report is incorporated therein by reference to the definitive proxy statement for the 2011 Annual Meeting of Stockholders.
INDEX
|
Part I
|
|||
|
Item 1.
|
Business
|
2
|
|
|
Item 1A.
|
Risk Factors
|
10
|
|
|
Item 1B.
|
Unresolved Staff Comments
|
17
|
|
|
Item 2.
|
Properties
|
17
|
|
|
Item 3.
|
Legal Proceedings
|
19
|
|
|
Item 4.
|
[Removed and Reserved]
|
19
|
|
|
Part II
|
|||
|
Item 5.
|
Market for Registrant’s Common Equity, Related Stockholder Matters and Issuer Purchases of Equity Securities
|
19
|
|
|
Item 6.
|
Selected Financial Data
|
21
|
|
|
Item 7.
|
Management’s Discussion and Analysis of Financial Condition and Results of Operations
|
22
|
|
|
Item 7A.
|
Quantitative and Qualitative Disclosures About Market Risk
|
38
|
|
|
Item 8.
|
Financial Statements and Supplementary Data
|
38
|
|
|
Item 9.
|
Changes in and Disagreements with Accountants on Accounting and Financial Disclosure
|
75
|
|
|
Item 9A.
|
Controls and Procedures
|
75
|
|
|
Item 9B.
|
Other Information
|
75
|
|
|
Part III
|
|||
|
Item 10.
|
Directors, Executive Officers and Corporate Governance
|
75
|
|
|
Item 11.
|
Executive Compensation
|
75
|
|
|
Item 12.
|
Security Ownership of Certain Beneficial Owners and Management and Related Stockholder Matters
|
76
|
|
|
Item 13.
|
Certain Relationships and Related Transactions, and Director Independence
|
76
|
|
|
Item 14.
|
Principal Accountant Fees and Services
|
76
|
|
|
Part IV
|
|||
|
Item 15.
|
Exhibits and Financial Statement Schedules
|
77
|
|
|
SIGNATURES
|
77
|
||
|
EXHIBIT LIST
|
78
|
||
This Annual Report of Shore Bancshares, Inc. (the “Company”) on Form 10-K contains forward-looking statements within the meaning of The Private Securities Litigation Reform Act of 1995. Readers of this report should be aware of the speculative nature of “forward-looking statements”. Statements that are not historical in nature, including the words “anticipate”, “estimate”, “should”, “expect”, “believe”, “intend”, and similar expressions, are based on current expectations, estimates and projections about (among other things) the industry and the markets in which the Company and its subsidiaries operate; they are not guarantees of future performance. Whether actual results will conform to
expectations and predictions is subject to known and unknown risks and uncertainties, including risks and uncertainties discussed in this Form 10-K, general economic, market or business conditions; changes in interest rates, deposit flow, the cost of funds, and demand for loan products and financial services; changes in our competitive position or competitive actions by other companies; changes in the quality or composition of loan and investment portfolios; the ability to mange growth; changes in laws or regulations or policies of federal and state regulators and agencies; and other circumstances beyond the Company’s control. Consequently, all of the forward-looking statements made in this document are qualified by these cautionary statements, and there can be no assurance that the actual results anticipated will be realized, or if substantially realized, will have the expected consequences on the Company’s business or operations. For a more complete
discussion of these and other risk factors, see Item 1A of Part I of this report. Except as required by applicable laws, we do not intend to publish updates or revisions of forward-looking statements it makes to reflect new information, future events or otherwise.
Except as expressly provided otherwise, the term “Company” as used in this report refers to Shore Bancshares, Inc. and the terms “we”, “us” and “our” refer collectively to Shore Bancshares, Inc. and its consolidated subsidiaries.
PART I
|
Item 1.
|
Business.
|
BUSINESS
General
The Company was incorporated under the laws of Maryland on March 15, 1996 and is a financial holding company registered under the Bank Holding Company Act of 1956, as amended (the “BHC Act”). The Company’s primary business is acting as the parent company to several financial institution and insurance entities. The Company engages in the banking business through CNB, a Maryland trust company with commercial banking powers, The Talbot Bank of Easton, Maryland, a Maryland commercial bank (“Talbot Bank”), and, until January 1, 2011, The Felton Bank, a Delaware commercial bank (“Felton Bank” and, together with CNB and Talbot Bank, the “Banks”). On January 1, 2011, Felton Bank merged into CNB, with CNB as the surviving
bank. Until December 31, 2009, CNB did business as The Centreville National Bank of Maryland, a national banking association. It was converted to a Maryland charter on that date.
The Company engages in the insurance business through two general insurance producer firms, The Avon-Dixon Agency, LLC, a Maryland limited liability company, and Elliott Wilson Insurance, LLC, a Maryland limited liability company; one marine insurance producer firm, Jack Martin & Associates, Inc., a Maryland corporation; three wholesale insurance firms, Tri-State General Insurance Agency, LTD, a Maryland corporation, Tri-State General Insurance Agency of New Jersey, Inc., a New Jersey corporation, and Tri-State General Insurance Agency of Virginia, Inc., a Virginia corporation (collectively “TSGIA”); and two insurance premium finance companies, Mubell Finance, LLC, a Maryland limited liability company, and ESFS, Inc., a Maryland corporation (all of the foregoing are collectively referred to as the
“Insurance Subsidiaries”).
The Company engages in the mortgage brokerage business under the name “Wye Mortgage Group” through a minority series investment in an unrelated Delaware limited liability company. The Company also has three inactive subsidiaries, Wye Financial Services, LLC, Shore Pension Services, LLC, and Wye Mortgage, LLC, all of which were organized under Maryland law.
Talbot Bank owns all of the issued and outstanding securities of Dover Street Realty, Inc., a Maryland corporation that engages in the business of holding and managing real property acquired by Talbot Bank as a result of loan foreclosures.
We operate in two business segments: community banking and insurance products and services. Financial information related to our operations in these segments for each of the two years ended December 31, 2010 is provided in Note 25 to the Company’s Consolidated Financial Statements included in Item 8 of Part II of this report.
2
Banking Products and Services
CNB commenced operations in 1876. Talbot Bank is a Maryland commercial bank that commenced operations in 1885 and was acquired by the Company in its December 2000 merger with Talbot Bancshares, Inc. (“Talbot Bancshares”). Felton Bank was a Delaware commercial bank that commenced operations in 1908 and was acquired by the Company in April 2004 when it merged with Midstate Bancorp, Inc. The Banks operate 19 full service branches and 22 ATMs and provide a full range of commercial and consumer banking products and services to individuals, businesses, and other organizations in Kent County, Queen Anne’s County, Caroline County, Talbot County and Dorchester County in Maryland and in Kent County, Delaware. The Banks’ deposits are insured by the Federal
Deposit Insurance Corporation (the “FDIC”).
The Banks are independent community banks and serve businesses and individuals in their respective market areas. Services offered are essentially the same as those offered by larger regional institutions that compete with the Banks. Services provided to businesses include commercial checking, savings, certificates of deposit and overnight investment sweep accounts. The Banks offer all forms of commercial lending, including secured and unsecured loans, working capital loans, lines of credit, term loans, accounts receivable financing, real estate acquisition development, construction loans and letters of credit. Merchant credit card clearing services are available as well as direct deposit of payroll, internet banking and telephone banking services.
Services to individuals include checking accounts, various savings programs, mortgage loans, home improvement loans, installment and other personal loans, credit cards, personal lines of credit, automobile and other consumer financing, safe deposit boxes, debit cards, 24-hour telephone banking, internet banking, and 24-hour automatic teller machine services. The Banks also offer nondeposit products, such as mutual funds and annuities, and discount brokerage services to their customers. Additionally, the Banks have Saturday hours and extended hours on certain evenings during the week for added customer convenience.
Lending Activities
The Banks originate secured and unsecured loans for business purposes. Commercial loans are typically secured by real estate, accounts receivable, inventory, equipment and/or other assets of the business. Commercial loans generally involve a greater degree of credit risk than one to four family residential mortgage loans. Repayment is often dependent on the successful operation of the business and may be affected by adverse conditions in the local economy or real estate market. The financial condition and cash flow of commercial borrowers is therefore carefully analyzed during the loan approval process, and continues to be monitored by obtaining business financial statements, personal financial statements and income tax returns. The frequency of this ongoing analysis
depends upon the size and complexity of the credit and collateral that secures the loan. It is also the Company’s general policy to obtain personal guarantees from the principals of the commercial loan borrowers.
Commercial real estate loans are primarily those secured by land for residential and commercial development, agricultural purpose properties, service industry buildings such as restaurants and motels, retail buildings and general purpose business space. The Banks attempt to mitigate the risks associated with these loans through thorough financial analyses, conservative underwriting procedures, including prudent loan to value ratio standards, obtaining additional collateral when prudent, closely monitoring construction projects to control disbursement of funds on loans, and management’s knowledge of the local economy in which the Banks lend.
The Banks provide residential real estate construction loans to builders and individuals for single family dwellings. Residential construction loans are usually granted based upon “as completed” appraisals and are secured by the property under construction. Additional collateral may be taken if loan to value ratios exceed 80%. Site inspections are performed to determine pre-specified stages of completion before loan proceeds are disbursed. These loans typically have maturities of six to 12 months and may have fixed or variable rate features. Permanent financing options for individuals include fixed and variable rate loans with three- and five-year balloon features and one-, three- and five-year adjustable rate mortgage loans. The risk of loss
associated with real estate construction lending is controlled through conservative underwriting procedures such as loan to value ratios of 80% or less at origination, obtaining additional collateral when prudent, and closely monitoring construction projects to control disbursement of funds on loans.
The Banks originate fixed and variable rate residential mortgage loans. As with any consumer loan, repayment is dependent on the borrower’s continuing financial stability, which can be adversely impacted by job loss, divorce, illness, or personal bankruptcy. Underwriting standards recommend loan to value ratios not to exceed 80% at origination based on appraisals performed by approved appraisers. The Banks rely on title insurance to protect their lien priorities and protect the property securing the loans by requiring fire and casualty insurance.
Wye Mortgage Group brokers long-term fixed rate residential mortgage loans for sale on the secondary market for which it receives commissions upon settlement. The Company adjusts the balance of its investment in Wye Mortgage Group by the Company’s share of Wye Mortgage Group’s undistributed income or loss.
3
A variety of consumer loans are offered to customers, including home equity loans, credit cards and other secured and unsecured lines of credit and term loans. Careful analysis of an applicant’s creditworthiness is performed before granting credit, and on going monitoring of loans outstanding is performed in an effort to minimize risk of loss by identifying problem loans early.
Deposit Activities
The Banks offer a full array of deposit products including checking, savings and money market accounts, regular and IRA certificates of deposit, and Christmas Savings accounts. The Banks also offer the CDARS program, providing up to $50 million of FDIC insurance to our customers. In addition, we offer our commercial customers packages which include Cash Management services and various checking opportunities.
Trust Services
CNB has a trust department through which it markets trust, asset management and financial planning services to customers within our market areas using the trade name Wye Financial & Trust.
Insurance Activities
The Avon-Dixon Agency, LLC, Elliott Wilson Insurance, LLC, and Mubell Finance, LLC were formed as a result of the Company’s acquisition of the assets of The Avon-Dixon Agency, Inc., Elliott Wilson Insurance, Inc., Avon-Dixon Financial Services, Inc., Joseph M. George & Son, Inc. and 59th Street Finance Company on May 1, 2002. In November 2002, The Avon-Dixon Agency, LLC acquired certain assets of W. M. Freestate & Son, Inc., a full-service insurance producer firm located in Centreville, Maryland. Jack Martin & Associates, Inc., Tri-State General Insurance Agency, LTD, Tri-State General Insurance Agency of New Jersey, Inc., Tri-State General Insurance Agency of Virginia, Inc., and ESFS, Inc. were acquired on October 1, 2007.
The Insurance Subsidiaries offer a full range of insurance products and services to customers, including insurance premium financing.
Seasonality
Management does not believe that our business activities are seasonal in nature. Demand for our products and services may vary depending on local and national economic conditions, but management believes that any variation will not have a material impact on our planning or policy-making strategies.
Employees
At February 28, 2011, we employed 345 persons, of which 304 were employed on a full-time basis.
COMPETITION
The banking business, in all of its phases, is highly competitive. Within our market areas, we compete with commercial banks (including local banks and branches or affiliates of other larger banks), savings and loan associations and credit unions for loans and deposits, with money market and mutual funds and other investment alternatives for deposits, with consumer finance companies for loans, with insurance companies, agents and brokers for insurance products, and with other financial institutions for various types of products and services. There is also competition for commercial and retail banking business from banks and financial institutions located outside our market areas.
The primary factors in competing for deposits are interest rates, personalized services, the quality and range of financial services, convenience of office locations and office hours. The primary factors in competing for loans are interest rates, loan origination fees, the quality and range of lending services and personalized services. The primary factors in competing for insurance customers are competitive rates, the quality and range of insurance products offered, and quality, personalized service.
To compete with other financial services providers, we rely principally upon local promotional activities, including advertisements in local newspapers, trade journals and other publications and on the radio, personal relationships established by officers, directors and employees with customers, and specialized services tailored to meet its customers’ needs. In those instances in which we are unable to accommodate the needs of a customer, we will arrange for those services to be provided by other financial services providers with which we have a relationship. We additionally rely on referrals from satisfied customers.
4
The following tables set forth deposit data for FDIC-insured institutions in Kent County, Queen Anne’s County, Caroline County, Talbot County and Dorchester County in Maryland and in Kent County, Delaware as of June 30, 2010, the most recent date for which comparative information is available.
|
% of
|
||||||||
|
Kent County, Maryland
|
Deposits
|
Total
|
||||||
|
(in thousands)
|
||||||||
|
Peoples Bank of Kent County, Maryland
|
$ | 180,815 | 35.07 | % | ||||
|
PNC Bank, NA
|
145,993 | 28.31 | ||||||
|
Chesapeake Bank and Trust Co.
|
66,443 | 12.89 | ||||||
|
Branch Banking & Trust
|
47,960 | 9.30 | ||||||
|
CNB
|
43,545 | 8.44 | ||||||
|
SunTrust Bank
|
30,886 | 5.99 | ||||||
|
Total
|
$ | 515,642 | 100.00 | % | ||||
Source: FDIC DataBook
|
% of
|
||||||||
|
Queen Anne’s County, Maryland
|
Deposits
|
Total
|
||||||
|
(in thousands)
|
||||||||
|
The Queenstown Bank of Maryland
|
$ | 354,227 | 43.27 | % | ||||
|
CNB
|
200,455 | 24.49 | ||||||
|
Bank of America, NA
|
65,122 | 7.95 | ||||||
|
PNC Bank, NA
|
60,805 | 7.43 | ||||||
|
Bank Annapolis
|
45,593 | 5.57 | ||||||
|
M&T
|
43,498 | 5.31 | ||||||
|
Branch Banking & Trust
|
23,983 | 2.93 | ||||||
|
SunTrust Bank
|
8,828 | 1.08 | ||||||
|
Capital One Bank
|
8,596 | 1.05 | ||||||
|
Peoples Bank
|
7,527 | 0.92 | ||||||
|
Total
|
$ | 818,634 | 100.00 | % | ||||
Source: FDIC DataBook
|
% of
|
||||||||
|
Caroline County, Maryland
|
Deposits
|
Total
|
||||||
| (in thousands) | ||||||||
|
Provident State Bank, Inc
|
$ | 151,782 | 38.32 | % | ||||
|
PNC Bank, NA
|
101,084 | 25.52 | ||||||
|
CNB
|
57,106 | 14.42 | ||||||
|
Branch Banking & Trust
|
30,788 | 7.77 | ||||||
|
M&T
|
23,997 | 6.06 | ||||||
|
Bank of America, NA
|
16,749 | 4.23 | ||||||
|
Easton Bank & Trust
|
11,722 | 2.96 | ||||||
|
The Queenstown Bank of Maryland
|
2,820 | 0.71 | ||||||
|
Total
|
$ | 396,048 | 100.00 | % | ||||
Source: FDIC DataBook
5
|
% of
|
||||||||
|
Talbot County, Maryland
|
Deposits
|
Total
|
||||||
|
(in thousands)
|
||||||||
|
The Talbot Bank of Easton, Maryland
|
$ | 580,928 | 49.96 | % | ||||
|
PNC Bank, NA
|
131,775 | 11.33 | ||||||
|
Easton Bank & Trust
|
126,394 | 10.87 | ||||||
|
Bank of America, NA
|
92,389 | 7.95 | ||||||
|
Branch Banking & Trust
|
54,401 | 4.68 | ||||||
|
SunTrust Bank
|
44,925 | 3.86 | ||||||
|
The Queenstown Bank of Maryland
|
43,328 | 3.73 | ||||||
|
M&T
|
31,897 | 2.74 | ||||||
|
Provident State Bank, Inc
|
20,863 | 1.79 | ||||||
|
First Mariner Bank
|
18,589 | 1.60 | ||||||
|
Capital One Bank
|
17,258 | 1.48 | ||||||
|
Total
|
$ | 1,162,747 | 100.00 | % | ||||
Source: FDIC DataBook
|
% of
|
||||||||
|
Dorchester County, Maryland
|
Deposits
|
Total
|
||||||
|
(in thousands)
|
||||||||
|
The National Bank of Cambridge
|
$ | 197,275 | 32.30 | % | ||||
|
Bank of the Eastern Shore
|
187,630 | 30.72 | ||||||
|
Hebron Savings Bank
|
56,171 | 9.20 | ||||||
|
Branch Banking & Trust
|
44,004 | 7.21 | ||||||
|
Provident State Bank, Inc
|
39,729 | 6.51 | ||||||
|
Bank of America, NA
|
25,359 | 4.15 | ||||||
|
SunTrust Bank
|
21,994 | 3.60 | ||||||
|
M&T
|
21,000 | 3.44 | ||||||
|
The Talbot Bank of Easton, Maryland
|
17,532 | 2.87 | ||||||
|
Total
|
$ | 610,694 | 100.00 | % | ||||
Source: FDIC DataBook
|
% of
|
||||||||
|
Kent County, Delaware
|
Deposits
|
Total
|
||||||
|
(in thousands)
|
||||||||
|
Wilmington Trust
|
$ | 548,818 | 31.64 | % | ||||
|
PNC Bank Delaware
|
252,719 | 14.57 | ||||||
|
First NB of Wyoming
|
238,823 | 13.77 | ||||||
|
RBS Citizens NA
|
186,751 | 10.77 | ||||||
|
Wells Fargo
|
157,370 | 9.07 | ||||||
|
Wilmington Savings Fund Society
|
111,444 | 6.42 | ||||||
|
The Felton Bank
|
73,984 | 4.27 | ||||||
|
Artisans Bank
|
59,881 | 3.45 | ||||||
|
TD Bank NA
|
43,395 | 2.50 | ||||||
|
County Bank
|
37,878 | 2.18 | ||||||
|
Midcoast Community Bank
|
19,298 | 1.11 | ||||||
|
Fort Sill National Bank
|
4,311 | 0.25 | ||||||
|
Total
|
$ | 1,734,672 | 100.00 | % | ||||
Source: FDIC DataBook
For further information about competition in our market areas, see the Risk Factor entitled “We operate in a highly competitive market and our inability to effectively compete in our markets could have an adverse impact on our financial condition and results of operations” in Item 1A of Part I of this annual report.
6
SUPERVISION AND REGULATION
The following is a summary of the material regulations and policies applicable to us and is not intended to be a comprehensive discussion. Changes in applicable laws and regulations may have a material effect on our business, financial condition and results of operations.
General
The Company is a financial holding company registered with the Board of Governors of the Federal Reserve System (the “FRB”) under the BHC Act and, as such, is subject to the supervision, examination and reporting requirements of the BHC Act and the regulations of the FRB.
CNB and Talbot Bank are Maryland commercial banks subject to the banking laws of Maryland and to regulation by the Commissioner of Financial Regulation of Maryland, who is required by statute to make at least one examination in each calendar year (or at 18-month intervals if the Commissioner determines that an examination is unnecessary in a particular calendar year). Prior to its merger with CNB on January 1, 2011, Felton Bank was a Delaware commercial bank subject to the banking laws of Delaware and to regulation by the Delaware Office of the State Bank Commissioner, who was entitled by statute to make examinations of Felton Bank as and when deemed necessary or expedient. The FDIC, which is also entitled to conduct regular examinations, is the primary federal regulator of CNB and Talbot
Bank, and it was also the primary federal regulator of Felton Bank. The deposits of the Banks are insured by the FDIC, so certain laws and regulations administered by the FDIC also govern their deposit taking operations. In addition to the foregoing, the Banks are subject to numerous state and federal statutes and regulations that affect the business of banking generally.
Nonbank affiliates of the Company are subject to examination by the FRB, and, as affiliates of the Banks, may be subject to examination by the Banks’ regulators from time to time. In addition, the Insurance Subsidiaries are each subject to licensing and regulation by the insurance authorities of the states in which they do business. Retail sales of insurance products by the Insurance Subsidiaries to customers of the Banks are also subject to the requirements of the Interagency Statement on Retail Sales of Nondeposit Investment Products promulgated in 1994, as amended, by the FDIC, the FRB and the other federal banking agencies. Wye Mortgage Group is subject to supervision by the banking agencies of the states in which it does business.
Regulation of Financial Holding Companies
In November 1999, the federal Gramm-Leach-Bliley Act (the “GLB Act”) was signed into law. Effective in pertinent part on March 11, 2000, the GLB Act revised the BHC Act and repealed the affiliation provisions of the Glass-Steagall Act of 1933, which, taken together, limited the securities, insurance and other non-banking activities of any company that controls an FDIC insured financial institution. Under the GLB Act, a bank holding company can elect, subject to certain qualifications, to become a “financial holding company”. The GLB Act provides that a financial holding company may engage in a full range of financial activities, including insurance and securities sales and underwriting activities, and real estate development, with new expedited notice
procedures.
Under FRB policy, the Company is expected to act as a source of strength to its subsidiary banks, and the FRB may charge the Company with engaging in unsafe and unsound practices for failure to commit resources to a subsidiary bank when required. In addition, under the Financial Institutions Reform, Recovery and Enforcement Act of 1989 (“FIRREA”), depository institutions insured by the FDIC can be held liable for any losses incurred by, or reasonably anticipated to be incurred by, the FDIC in connection with (i) the default of a commonly controlled FDIC-insured depository institution or (ii) any assistance provided by the FDIC to a commonly controlled FDIC-insured depository institution in danger of default. Accordingly, in the event that any insured subsidiary of the Company
causes a loss to the FDIC, other insured subsidiaries of the Company could be required to compensate the FDIC by reimbursing it for the estimated amount of such loss. Such cross guaranty liabilities generally are superior in priority to obligations of a financial institution to its stockholders and obligations to other affiliates.
Federal Regulation of Banks
Federal and state banking regulators may prohibit the institutions over which they have supervisory authority from engaging in activities or investments that the agencies believes are unsafe or unsound banking practices. These banking regulators have extensive enforcement authority over the institutions they regulate to prohibit or correct activities that violate law, regulation or a regulatory agreement or which are deemed to be unsafe or unsound practices. Enforcement actions may include the appointment of a conservator or receiver, the issuance of a cease and desist order, the termination of deposit insurance, the imposition of civil money penalties on the institution, its directors, officers, employees and institution-affiliated parties, the issuance of directives to increase capital,
the issuance of formal and informal agreements, the removal of or restrictions on directors, officers, employees and institution-affiliated parties, and the enforcement of any such mechanisms through restraining orders or other court actions.
7
The Banks are subject to the provisions of Section 23A and Section 23B of the Federal Reserve Act. Section 23A limits the amount of loans or extensions of credit to, and investments in, the Company and its nonbank affiliates by the Banks. Section 23B requires that transactions between any of the Banks and the Company and its nonbank affiliates be on terms and under circumstances that are substantially the same as with non-affiliates.
The Banks are also subject to certain restrictions on extensions of credit to executive officers, directors, and principal stockholders or any related interest of such persons, which generally require that such credit extensions be made on substantially the same terms as are available to third parties dealing with the Banks and not involve more than the normal risk of repayment. Other laws tie the maximum amount that may be loaned to any one customer and its related interests to capital levels.
As part of the Federal Deposit Insurance Company Improvement Act of 1991 (“FDICIA”), each federal banking regulator adopted non-capital safety and soundness standards for institutions under its authority. These standards include internal controls, information systems and internal audit systems, loan documentation, credit underwriting, interest rate exposure, asset growth, and compensation, fees and benefits. An institution that fails to meet those standards may be required by the agency to develop a plan acceptable to meet the standards. Failure to submit or implement such a plan may subject the institution to regulatory sanctions. The Company, on behalf of the Banks, believes that the Banks meet substantially all standards that have been
adopted. FDICIA also imposes capital standards on insured depository institutions.
The Community Reinvestment Act (“CRA”) requires that, in connection with the examination of financial institutions within their jurisdictions, the federal banking regulators evaluate the record of the financial institution in meeting the credit needs of their communities including low and moderate income neighborhoods, consistent with the safe and sound operation of those banks. These factors are also considered by all regulatory agencies in evaluating mergers, acquisitions and applications to open a branch or facility. As of the date of its most recent examination report, each of the Banks has a CRA rating of “Satisfactory.”
On October 14, 2008, the FDIC announced the creation of the Temporary Liquidity Guarantee Program (the “TLGP”) to decrease the cost of bank funding and, hopefully, normalize lending. This program is comprised of two components. The first component guarantees senior unsecured debt issued between October 14, 2008 and June 30, 2009. The guarantee will remain in effect until June 30, 2012 for such debts that mature beyond June 30, 2009. The second component, called the Transaction Accounts Guarantee Program (“TAG”), provided full coverage for non-interest bearing transaction deposit accounts, IOLTAs, and NOW accounts with interest rates of 0.25% or less, regardless of account balance, initially until December 31, 2009. The TAG program expired on
December 31, 2010. We elected to participate in both programs and paid additional FDIC premiums in 2010 and 2009 as a result. See the section below entitled “Deposit Insurance”.
On July 21, 2010, President Obama signed into law the Dodd-Frank Wall Street Reform and Consumer Protection Act (the “Dodd-Frank Act”), which made sweeping changes to the financial regulatory landscape and will impact all financial institutions, including the Company and the Banks.
On November 9, 2010, the FDIC issued a final rule to implement Section 343 of the Dodd-Frank Act that provides temporary unlimited deposit insurance coverage for non-interest bearing transaction accounts at all FDIC-insured depository institutions. The coverage is automatic for all FDIC-insured institutions and does not include an opt out option. The separate coverage for noninterest-bearing transaction accounts became effective on December 31, 2010 and terminates on December 31, 2012.
These new laws, regulations and regulatory actions will cause our regulatory expenses to increase. Additionally, due in part to numerous bank failures throughout the country since 2008, the FDIC imposed an emergency insurance assessment to help restore the Deposit Insurance Fund and further required insured depository institutions to prepay their estimated quarterly risk-based deposit assessments through 2012 on December 30, 2009. Given the current state of the national economy, there can be no assurance that the FDIC will not impose future emergency assessments or further revise its rate structure.
The Dodd-Frank Act’s significant regulatory changes include the creation of a new financial consumer protection agency, known as the Bureau of Consumer Financial Protection, that is empowered to promulgate new consumer protection regulations and revise existing regulations in many areas of consumer compliance. Moreover, the Dodd-Frank Act permits states to adopt stricter consumer protection laws and states’ attorneys general may enforce consumer protection rules issued by the Bureau. The Dodd-Frank Act also imposes more stringent capital requirements on bank holding companies by, among other things, imposing leverage ratios on bank holding companies and prohibiting new trust preferred securities issuances from counting as Tier 1 capital. These developments may limit our future
capital strategies. The Dodd-Frank Act also increases regulation of derivatives and hedging transactions, which could limit our ability to enter into, or increase the costs associated with, interest rate and other hedging transactions.
8
Certain provisions of the Dodd-Frank Act, including those relating to direct supervision by the Bureau of Consumer Financial Protection, will not apply to banking organizations with assets of less than $10 billion, such as the Company and the Banks. Nevertheless, the other provisions of the Dodd-Frank Act will increase our regulatory compliance burden and costs and may restrict the financial products and services we offer to our customers. In particular, the Dodd-Frank Act will require us to invest significant management attention and resources so that we can evaluate the impact of this law and make any necessary changes to our product offerings and operations.
Capital Requirements
FDICIA established a system of prompt corrective action to resolve the problems of undercapitalized institutions. Under this system, federal banking regulators are required to rate supervised institutions on the basis of five capital categories: “well -capitalized,” “adequately capitalized,” “undercapitalized,” “significantly undercapitalized,” and “critically undercapitalized;” and to take certain mandatory actions, and are authorized to take other discretionary actions, with respect to institutions in the three undercapitalized categories. The severity of the actions will depend upon the category in which the institution is placed. A depository institution is “well capitalized” if it has a total risk based
capital ratio of 10% or greater, a Tier 1 risk based capital ratio of 6% or greater, and a leverage ratio of 5% or greater and is not subject to any order, regulatory agreement, or written directive to meet and maintain a specific capital level for any capital measure. An “adequately capitalized” institution is defined as one that has a total risk based capital ratio of 8% or greater, a Tier 1 risk based capital ratio of 4% or greater and a leverage ratio of 4% or greater (or 3% or greater in the case of a bank with a composite CAMELS rating of 1).
FDICIA generally prohibits a depository institution from making any capital distribution, including the payment of cash dividends, or paying a management fee to its holding company if the depository institution would thereafter be undercapitalized. Undercapitalized depository institutions are subject to growth limitations and are required to submit capital restoration plans. For a capital restoration plan to be acceptable, the depository institution’s parent holding company must guarantee (subject to certain limitations) that the institution will comply with such capital restoration plan.
Significantly undercapitalized depository institutions may be subject to a number of other requirements and restrictions, including orders to sell sufficient voting stock to become adequately capitalized and requirements to reduce total assets and stop accepting deposits from correspondent banks. Critically undercapitalized depository institutions are subject to the appointment of a receiver or conservator, generally within 90 days of the date such institution is determined to be critically undercapitalized.
As of December 31, 2010, the Banks were each deemed to be “well capitalized.” For more information regarding the capital condition of the Company, see Note 17 of Consolidated Financial Statements appearing in Item 8 of Part II of this report.
Deposit Insurance
The deposits of the Banks are insured to a maximum of $250,000 per depositor through the Deposit Insurance Fund, which is administered by the FDIC, and the Banks are required to pay quarterly deposit insurance premium assessments to the FDIC. The Deposit Insurance Fund was created pursuant to the Federal Deposit Insurance Reform Act of 2005 (the “Reform Act”). This law (i) required the then-existing $100,000 deposit insurance coverage to be indexed for inflation (with adjustments every five years, commencing January 1, 2011), and (ii) increased the deposit insurance coverage for retirement accounts to $250,000 per participant, subject to adjustment for inflation. Effective October 3, 2008, however, the Emergency Economic Stabilization Act of 2008 (the
“EESA”) was enacted and, among other things, temporarily raised the basic limit on federal deposit insurance coverage from $100,000 to $250,000 per depositor. EESA initially contemplated that the coverage limit would return to $100,000 after December 31, 2009, but the expiration date has since been extended to December 31, 2013. The coverage for retirement accounts did not change and remains at $250,000. On July 21, 2010, as part of the Dodd-Frank Act, the current standard maximum deposit insurance amount was permanently raised to $250,000.
The Reform Act also gave the FDIC greater latitude in setting the assessment rates for insured depository institutions which could be used to impose minimum assessments. On May 22, 2009, the FDIC imposed an emergency insurance assessment of five basis points in an effort to restore the Deposit Insurance Fund to an acceptable level. On November 12, 2009, the FDIC adopted a final rule requiring insured depository institutions to prepay their estimated quarterly risk-based deposit assessments for the fourth quarter of 2009, and for all of 2010, 2011, and 2012, on December 30, 2009, along with each institution’s risk based deposit insurance assessment for the third quarter of 2009. It was also announced that the assessment rate will increase by 3 basis points effective January
1, 2011. The prepayment will be accounted for as a prepaid expense to be amortized quarterly. The prepaid assessment will qualify for a zero risk weight under the risk-based capital requirements. The Banks’ three-year prepaid assessment was $5.4 million. The Banks paid a total of $1.8 million in FDIC premiums during 2010.
9
USA PATRIOT Act
Congress adopted the USA PATRIOT Act (the “Patriot Act”) on October 26, 2001 in response to the terrorist attacks that occurred on September 11, 2001. Under the Patriot Act, certain financial institutions, including banks, are required to maintain and prepare additional records and reports that are designed to assist the government’s efforts to combat terrorism. The Patriot Act includes sweeping anti-money laundering and financial transparency laws and required additional regulations, including, among other things, standards for verifying client identification when opening an account and rules to promote cooperation among financial institutions, regulators and law enforcement entities in identifying parties that may be involved in terrorism or money laundering.
Federal Securities Laws
The shares of the Company’s common stock are registered with the Securities and Exchange Commission (the “SEC”) under Section 12(b) of the Securities Exchange Act of 1934, as amended (the “Exchange Act”), and listed on the NASDAQ Global Select Market. The Company is subject to information reporting requirements, proxy solicitation requirements, insider trading restrictions and other requirements of the Exchange Act, including the requirements imposed under the federal Sarbanes-Oxley Act of 2002. Among other things, loans to and other transactions with insiders are subject to restrictions and heightened disclosure, directors and certain committees of the Board must satisfy certain independence requirements, and the Corporation is generally required to comply with
certain corporate governance requirements.
Governmental Monetary and Credit Policies and Economic Controls
The earnings and growth of the banking industry and ultimately of the Bank are affected by the monetary and credit policies of governmental authorities, including the FRB. An important function of the FRB is to regulate the national supply of bank credit in order to control recessionary and inflationary pressures. Among the instruments of monetary policy used by the FRB to implement these objectives are open market operations in U.S. Government securities, changes in the federal funds rate, changes in the discount rate of member bank borrowings, and changes in reserve requirements against member bank deposits. These means are used in varying combinations to influence overall growth of bank loans, investments and deposits and may also affect interest rates charged on loans or paid for
deposits. The monetary policies of the FRB authorities have had a significant effect on the operating results of commercial banks in the past and are expected to continue to have such an effect in the future. In view of changing conditions in the national economy and in the money markets, as well as the effect of actions by monetary and fiscal authorities, including the FRB, no prediction can be made as to possible future changes in interest rates, deposit levels, loan demand or their effect on the business and earnings of the Company and its subsidiaries.
AVAILABLE INFORMATION
The Company maintains an Internet site at www.shbi.com on which it makes available, free of charge, its Annual Report on Form 10-K, Quarterly Reports on Form 10-Q, Current Reports on Form 8-K, and all amendments to the foregoing as soon as reasonably practicable after these reports are electronically filed with, or furnished to, the SEC. In addition, stockholders may access these reports and documents on the SEC’s web site at www.sec.gov.
Item 1A. RISK FACTORS.
The following factors may impact our business, financial condition and results of operations and should be considered carefully in evaluating an investment in shares of common stock of the Company.
Risks Relating to Our Business
The Company’s future depends on the successful growth of its subsidiaries
The Company’s primary business activity for the foreseeable future will be to act as the holding company of CNB, Talbot Bank, and its other subsidiaries. Therefore, the Company’s future profitability will depend on the success and growth of these subsidiaries. In the future, part of the Company’s growth may come from buying other banks and buying or establishing other companies. Such entities may not be profitable after they are purchased or established, and they may lose money, particularly at first. A new bank or company may bring with it unexpected liabilities, bad loans, or bad employee relations, or the new bank or company may lose customers.
10
A majority of our business is concentrated in Maryland and Delaware, a significant amount of which is concentrated in real estate lending, so a decline in the local economy and real estate markets could adversely impact our financial condition and results of operations
Because most of our loans are made to customers who reside on the Eastern Shore of Maryland and in Delaware, a decline in local economic conditions may have a greater effect on our earnings and capital than on the earnings and capital of larger financial institutions whose loan portfolios are geographically diverse. Further, we make many real estate secured loans, including construction and land development loans, all of which are in greater demand when interest rates are low and economic conditions are good. The national and local economies have significantly weakened during the past three years in large part due to the widely-reported problems in the sub-prime mortgage loan market and the meltdown of the financial industry as a whole. As a result, real estate values across the
country, including in our market areas, have decreased and the general availability of credit, especially credit to be secured by real estate, has also decreased. These conditions have made it more difficult for real estate owners and owners of loans secured by real estate to sell their assets at the times and at the prices they desire. In addition, these conditions have increased the risk that the market values of the real estate securing our loans may deteriorate, which could cause us to lose money in the event a borrower fails to repay a loan and we are forced to foreclose on the property. There can be no guarantee as to when or whether economic conditions will improve.
Our concentrations of commercial real estate loans could subject us to increased regulatory scrutiny and directives, which could force us to preserve or raise capital and/or limit our future commercial lending activities.
The FRB and the FDIC, along with the other federal banking regulators, issued guidance in December 2006 entitled “Concentrations in Commercial Real Estate Lending, Sound Risk Management Practices” directed at institutions who have particularly high concentrations of commercial real estate loans within their lending portfolios. This guidance suggests that these institutions face a heightened risk of financial difficulties in the event of adverse changes in the economy and commercial real estate markets. Accordingly, the guidance suggests that institutions whose concentrations exceed certain percentages of capital should implement heightened risk management practices appropriate to their concentration risk. The guidance provides that banking regulators may require such
institutions to reduce their concentrations and/or maintain higher capital ratios than institutions with lower concentrations in commercial real estate. Based on our concentration of commercial real estate and construction lending as of December 31, 2010, we may be subject to heightened supervisory scrutiny during future examinations and/or be required to take steps to address our concentration and capital levels. Management cannot predict the extent to which this guidance will impact our operations or capital requirements. Further, we cannot guarantee that any risk management practices we implement will be effective to prevent losses relating from concentrations in our commercial real estate portfolio.
Interest rates and other economic conditions will impact our results of operations
The national economy and the local economy have significantly weakened during the past three years, primarily as a result of the widely reported financial institution meltdown. This weakening has caused real estate values to drop, decreased the demand for credit, and caused public anxiety regarding the health and future of the financial services industry as a whole.
Our results of operations may be materially and adversely affected by changes in prevailing economic conditions, including declines in real estate values, rapid changes in interest rates and the monetary and fiscal policies of the federal government. Our profitability is in part a function of the spread between the interest rates earned on assets and the interest rates paid on deposits and other interest-bearing liabilities (i.e., net interest income), including advances from the Federal Home Loan Bank (the “FHLB”) of Atlanta. Interest rate risk arises from mismatches (i.e., the interest sensitivity gap) between the dollar amount of repricing or maturing assets and
liabilities and is measured in terms of the ratio of the interest rate sensitivity gap to total assets. More assets repricing or maturing than liabilities over a given time period is considered asset-sensitive and is reflected as a positive gap, and more liabilities repricing or maturing than assets over a given time period is considered liability-sensitive and is reflected as negative gap. An asset-sensitive position (i.e., a positive gap) could enhance earnings in a rising interest rate environment and could negatively impact earnings in a falling interest rate environment, while a liability-sensitive position (i.e., a negative gap) could enhance earnings in a falling interest rate environment and negatively impact earnings in a rising interest rate environment. Fluctuations in interest rates are not predictable or
controllable. We have attempted to structure our asset and liability management strategies to mitigate the impact on net interest income of changes in market interest rates, but there can be no assurance that these attempts will be successful in the event of future changes.
11
The Banks may experience credit losses in excess of their allowances, which would adversely impact our financial condition and results of operations
The risk of credit losses on loans varies with, among other things, general economic conditions, the type of loan being made, the creditworthiness of the borrower over the term of the loan and, in the case of a collateralized loan, the value and marketability of the collateral for the loan. Management of each of the Banks bases the allowance for credit losses upon, among other things, historical experience, an evaluation of economic conditions and regular reviews of delinquencies and loan portfolio quality. Based upon such factors, management makes various assumptions and judgments about the ultimate collectability of the loan portfolio and provides an allowance for credit losses based upon a percentage of the outstanding balances and for specific loans when their ultimate collectability is
considered questionable. If management’s assumptions and judgments prove to be incorrect and the allowance for credit losses is inadequate to absorb future losses, or if the bank regulatory authorities, as a part of their examination process, require our bank subsidiaries to increase their respective allowance for credit losses, our earnings and capital could be significantly and adversely affected. Moreover, future adjustments may be necessary if economic conditions differ substantially from the assumptions used or adverse developments arise with respect to the Banks’ nonperforming or performing loans. Material additions to the allowance for credit losses of one of the Banks would result in a decrease in that Bank’s net income and capital and could have a material adverse effect on our financial condition.
The market value of our investments might decline
As of December 31, 2010, we had classified 94% of our investment securities as available-for-sale pursuant to the Financial Accounting Standards Board’s Accounting Standards Codification Topic 320 (“ASC 320”) relating to accounting for investments. ASC 320 requires that unrealized gains and losses in the estimated value of the available-for-sale portfolio be “marked to market” and reflected as a separate item in stockholders’ equity (net of tax) as accumulated other comprehensive income. The remaining investment securities are classified as held-to-maturity in accordance with ASC 320 and are stated at amortized cost.
In the past, gains on sales of investment securities have not been a significant source of income for us. There can be no assurance that future market performance of our investment portfolio will enable us to realize income from sales of securities. Stockholders’ equity will continue to reflect the unrealized gains and losses (net of tax) of these investments. There can be no assurance that the market value of our investment portfolio will not decline, causing a corresponding decline in stockholders’ equity.
CNB and Talbot Bank are members of the FHLB of Atlanta. Prior to its merger with CNB, Felton Bank was a member of the FHLB of Pittsburgh. A member of the FHLB system is required to purchase stock issued by the relevant FHLB bank based on how much it borrows from the FHLB and the quality of the collateral pledged to secure that borrowing. Accordingly, our investments include stock issued by the FHLB of Atlanta and the FHLB of Pittsburgh. These investments could be subject to future impairment charges and there can be no guaranty of future dividends.
Management believes that several factors will affect the market values of our investment portfolio. These include, but are not limited to, changes in interest rates or expectations of changes, the degree of volatility in the securities markets, inflation rates or expectations of inflation and the slope of the interest rate yield curve (the yield curve refers to the differences between shorter-term and longer-term interest rates; a positively sloped yield curve means shorter-term rates are lower than longer-term rates). Also, the passage of time will affect the market values of our investment securities, in that the closer they are to maturing, the closer the market price should be to par value. These and other factors may impact specific categories of the portfolio differently,
and management cannot predict the effect these factors may have on any specific category.
The banking industry is heavily regulated; significant regulatory changes could adversely affect our operations
Our operations are and will be affected by current and future legislation and by the policies established from time to time by various federal and state regulatory authorities. The Company is subject to supervision by the FRB; and CNB and Talbot Bank are subject to supervision and periodic examination by the Maryland Commissioner and the FDIC. Banking regulations, designed primarily for the safety of depositors, may limit a financial institution’s growth and the return to its investors by restricting such activities as the payment of dividends, mergers with or acquisitions by other institutions, investments, loans and interest rates, interest rates paid on deposits, expansion of branch offices, and the offering of securities or trust services. The Company and the Banks are
also subject to capitalization guidelines established by federal law and could be subject to enforcement actions to the extent that those institutions are found by regulatory examiners to be undercapitalized. It is not possible to predict what changes, if any, will be made to existing federal and state legislation and regulations or the effect that such changes may have on our future business and earnings prospects. Management also cannot predict the nature or the extent of the effect on our business and earnings of future fiscal or monetary policies, economic controls, or new federal or state legislation. Further, the cost of compliance with regulatory requirements may adversely affect our ability to operate profitably.
12
We operate in a highly competitive market, and our inability to effectively compete in our markets could have an adverse impact on our financial condition and results of operations
We operate in a competitive environment, competing for loans, deposits, insurance products and customers with commercial banks, savings associations and other financial entities. Competition for deposits comes primarily from other commercial banks, savings associations, credit unions, money market and mutual funds and other investment alternatives. Competition for loans comes primarily from other commercial banks, savings associations, mortgage banking firms, credit unions and other financial intermediaries. Competition for other products, such as insurance and securities products, comes from other banks, securities and brokerage companies, insurance companies, insurance agents and brokers, and other nonbank financial service providers in our market areas. Many of these
competitors are much larger in terms of total assets and capitalization, have greater access to capital markets, and/or offer a broader range of financial services than those offered by us. In addition, banks with a larger capitalization and financial intermediaries not subject to bank regulatory restrictions have larger lending limits and are thereby able to serve the needs of larger customers. Our growth and profitability will depend upon our ability to attract and retain skilled managerial, marketing and technical personnel. Competition for qualified personnel in the financial services industry is intense, and there can be no assurance that we will be successful in attracting and retaining such personnel.
In addition, current banking laws facilitate interstate branching, merger activity among banks, and expanded activities. Since September 1995, certain bank holding companies have been authorized to acquire banks throughout the United States. Since June 1, 1997, certain banks have been permitted to merge with banks organized under the laws of different states. As a result, interstate banking is now an accepted element of competition in the banking industry and the Corporation may be brought into competition with institutions with which it does not presently compete. Moreover, as discussed above, the GLB Act revised the BHC Act in 2000 and repealed the affiliation provisions of the Glass-Steagall Act of 1933, which, taken together, limited the securities, insurance and
other non-banking activities of any company that controls an FDIC insured financial institution. These laws may increase the competition we face in our market areas in the future, although management cannot predict the degree to which such competition will impact our financial condition or results of operations.
Our regulatory expenses will likely increase due to federal laws, rules and programs that have been enacted or adopted in response to the recent banking crisis and the current national recession
In response to the banking crisis that began in 2008 and the resulting national recession, the federal government took drastic steps to help stabilize the credit market and the financial industry. These steps included the enactment of EESA, which, among other things, raised the basic limit on federal deposit insurance coverage to $250,000, and the FDIC’s adoption of the TLGP, which, under the TAG portion, provides full deposit insurance coverage through June 30, 2010 for non-interest bearing transaction deposit accounts, IOLTAs, and NOW accounts with interest rates of 0.50% or less, regardless of account balance. The TLGP was extended to December 31, 2010 and includes non-interest bearing transaction deposit accounts, IOLTAs, and NOW accounts with interest rates of 0.25% or less, regardless of
account balance. The TLGP requires participating institutions, like us, to pay 10 basis points per annum for the additional insured deposits. These actions will cause our regulatory expenses to increase. Additionally, due in part to the failure of depository institutions around the country since the banking crisis began, the FDIC imposed an emergency insurance assessment to help restore the Deposit Insurance Fund and further required insured depository institutions to prepay their estimated quarterly risk-based deposit assessments through 2012 on December 30, 2009. Given the current state of the national economy, there can be no assurance that the FDIC will not impose future emergency assessments or further revise its rate structure.
In addition, and as noted above, the Dodd-Frank Act recently became law and implements significant changes in the financial regulatory landscape that will impact all financial institutions, including the Company and the Banks. The Dodd-Frank Act is likely to increase our regulatory compliance burden. It is too early, however, for us to assess the full impact that the Dodd-Frank Act may have on our business, financial condition or results of operations. Many of the Dodd-Frank Act’s provisions require subsequent regulatory rulemaking. The Dodd-Frank Act’s significant regulatory changes include the creation of a new financial consumer protection agency, known as the Bureau of Consumer Financial Protection, that is empowered to promulgate new consumer protection
regulations and revise existing regulations in many areas of consumer compliance, which will increase our regulatory compliance burden and costs and may restrict the financial products and services we offer to our customers. Moreover, the Dodd-Frank Act permits states to adopt stricter consumer protection laws and states’ attorneys general may enforce consumer protection rules issued by the Bureau. The Dodd-Frank Act also imposes more stringent capital requirements on bank holding companies by, among other things, imposing leverage ratios on bank holding companies and prohibiting new trust preferred issuances from counting as Tier 1 capital. These restrictions may limit our future capital strategies. The Dodd-Frank Act also increases regulation of derivatives and hedging transactions, which could limit our ability to enter into, or increase the costs associated with, interest rate and other hedging transactions. Although certain
provisions of the Dodd-Frank Act, such as direct supervision by the Bureau of Consumer Financial Protection, will not apply to banking organizations with less than $10 billion of assets, such as the Company and the Banks, the changes resulting from the legislation will impact our business. These changes will require us to invest significant management attention and resources to evaluate and make necessary changes.
13
Recent amendments to the FRB’s Regulation E may negatively impact our non-interest income.
On November 12, 2009, the FRB announced the final rules amending Regulation E (“Reg E”) that prohibit financial institutions from charging fees to consumers for paying overdrafts on automated teller machine and one-time debit card transactions, unless a consumer consents, or opts-in, to the overdraft service for those types of transactions. Compliance with this regulation is effective July 1, 2010 for new consumer accounts and August 15, 2010 for existing consumer accounts. The impact of these new rules has the potential to reduce our non-interest income and this reduction could be material.
Customer concern about deposit insurance may cause a decrease in deposits held at the Banks
With recent increased concerns about bank failures, customers increasingly are concerned about the extent to which their deposits are insured by the FDIC. Customers may withdraw deposits from the Banks in an effort to ensure that the amount they have on deposit with us is fully insured. Decreases in deposits may adversely affect our funding costs and net income.
Our funding sources may prove insufficient to replace deposits and support our future growth
We rely on customer deposits, advances from the FHLB, and lines of credit at other financial institutions to fund our operations. Although we have historically been able to replace maturing deposits and advances if desired, no assurance can be given that we would be able to replace such funds in the future if our financial condition or the financial condition of the FHLB or market conditions were to change. Our financial flexibility will be severely constrained and/or our cost of funds will increase if we are unable to maintain our access to funding or if financing necessary to accommodate future growth is not available at favorable interest rates. Finally, if we are required to rely more heavily on more expensive funding sources to support future growth, our revenues may not
increase proportionately to cover our costs. In this case, our profitability would be adversely affected.
The loss of key personnel could disrupt our operations and result in reduced earnings
Our growth and profitability will depend upon our ability to attract and retain skilled managerial, marketing and technical personnel. Competition for qualified personnel in the financial services industry is intense, and there can be no assurance that we will be successful in attracting and retaining such personnel. Our current executive officers provide valuable services based on their many years of experience and in-depth knowledge of the banking industry. Due to the intense competition for financial professionals, these key personnel would be difficult to replace and an unexpected loss of their services could result in a disruption to the continuity of operations and a possible reduction in earnings.
We may lose key personnel because of our participation in the Troubled Asset Relief Program Capital Purchase Program
On January 9, 2009, we participated in the Troubled Asset Relief Program (“TARP”) Capital Purchase Program (the “CPP”) adopted by the U.S. Department of Treasury (“Treasury”) by selling $25 million in shares of our Fixed Rate Cumulative Perpetual Preferred Stock, Series A (the “Series A Preferred Stock”) to Treasury and issuing a 10-year common stock purchase warrant (the “Warrant”) to Treasury. As part of these transactions, we adopted Treasury’s standards for executive compensation and corporate governance for the period during which Treasury holds any shares of the Series A Preferred Stock and/or any shares of common stock that may be acquired upon exercise of the Warrant. On February 17, 2009, the American Recovery and
Reinvestment Act of 2009 (the “Recovery Act”) was signed into law, which, among other things, imposes additional executive compensation restrictions on institutions that participate in TARP for so long as any TARP assistance remains outstanding. Among these restrictions is a prohibition against making most severance payments to our “senior executive officers”, which term includes our Chairman and Chief Executive Officer, our Chief Financial Officer and, generally, the three next most highly compensated executive officers, and to the next five most highly compensated employees. The restrictions also limit the type, timing and amount of bonuses, retention awards and incentive compensation that may be paid to our five most highly compensated employees.
On April 15, 2009, the Company redeemed all of the outstanding Series A Preferred Stock from the Treasury, so the foregoing restrictions ceased to apply. However, the Treasury still holds the Warrant which, if exercised, would again subject us to these restrictions. If the Treasury were to exercise the Warrant for shares of our common stock, these restrictions, coupled with the competition we face from other institutions, including institutions that did not participate in TARP, may make it more difficult for us to attract and/or retain exceptional key employees.
14
Our lending activities subject us to the risk of environmental liabilities
A significant portion of our loan portfolio is secured by real property. During the ordinary course of business, we may foreclose on and take title to properties securing certain loans. In doing so, there is a risk that hazardous or toxic substances could be found on these properties. If hazardous or toxic substances are found, we may be liable for remediation costs, as well as for personal injury and property damage. Environmental laws may require us to incur substantial expenses and may materially reduce the affected property’s value or limit our ability to use or sell the affected property. In addition, future laws or more stringent interpretations of enforcement policies with respect to existing laws may increase our exposure to environmental
liability. Although we have policies and procedures to perform an environmental review before initiating any foreclosure action on real property, these reviews may not be sufficient to detect all potential environmental hazards. The remediation costs and any other financial liabilities associated with an environmental hazard could have a material adverse effect on our financial condition and results of operations.
We may be subject to other claims
We may from time to time be subject to claims from customers for losses due to alleged breaches of fiduciary duties, errors and omissions of employees, officers and agents, incomplete documentation, the failure to comply with applicable laws and regulations, or many other reasons. Also, our employees may knowingly or unknowingly violate laws and regulations. Management may not be aware of any violations until after their occurrence. This lack of knowledge may not insulate the Company or our subsidiaries from liability. Claims and legal actions may result in legal expenses and liabilities that may reduce our profitability and hurt our financial condition.
We may be adversely affected by other recent legislation
As discussed above, the GLB Act repealed restrictions on banks affiliating with securities firms and it also permitted bank holding companies that become financial holding companies to engage in additional financial activities, including insurance and securities underwriting and agency activities, merchant banking, and insurance company portfolio investment activities that are currently not permitted for bank holding companies. Although the Company is a financial holding company, this law may increase the competition we face from larger banks and other companies. It is not possible to predict the full effect that this law will have on us.
The Sarbanes-Oxley Act of 2002 requires management of publicly traded companies to perform an annual assessment of their internal controls over financial reporting and to report on whether the system is effective as of the end of the Company’s fiscal year. Disclosure of significant deficiencies or material weaknesses in internal controls could cause an unfavorable impact to shareholder value by affecting the market value of our stock.
The Patriot Act requires certain financial institutions, such as the Banks, to maintain and prepare additional records and reports that are designed to assist the government’s efforts to combat terrorism. This law includes sweeping anti-money laundering and financial transparency laws and required additional regulations, including, among other things, standards for verifying client identification when opening an account and rules to promote cooperation among financial institutions, regulators and law enforcement entities in identifying parties that may be involved in terrorism or money laundering. If we fail to comply with this law, we could be exposed to adverse publicity as well as fines and penalties assessed by regulatory agencies.
We may not be able to keep pace with developments in technology in which case we may become less competitive and lose customers
We use various technologies in our business, including telecommunication, data processing, computers, automation, internet-based banking, and debit cards. Technology changes rapidly. Our ability to compete successfully with other banks and non-bank entities may depend on whether we can exploit technological changes. We may not be able to exploit technological changes, and any investment we do make may not make us more profitable. We converted to a new core data processing system during the second quarter of 2009. Although management expects that this system will improve operating efficiencies, there can be no guaranty that it will do so or that software, hardware or other technical problems will not delay its effectiveness.
Risks Relating to the Company’s Securities
The Company’s shares of common stock and the Warrant are not insured
The shares of the Company’s common stock and the Warrant are not deposits and are not insured against loss by the FDIC or any other governmental or private agency.
15
The Company’s ability to pay dividends is limited by applicable banking and corporate law
The Company’s stockholders are entitled to dividends on their shares of common stock if, when, and as declared by the Company’s Board of Directors out of funds legally available for that purpose. The Company’s current ability to pay dividends to stockholders is largely dependent upon its earnings in future periods and upon the receipt of dividends from the Banks. FRB guidance requires a bank holding company, like the Company, to consult with the FRB before paying dividends if the Company’s earnings do not exceed the aggregate amount of the proposed dividend. The FRB has the ability to prohibit a dividend in such a situation. Both federal and state laws impose restrictions on the ability of the Banks to pay dividends. Federal law
prohibits the payment of a dividend by an insured depository institution if the depository institution is considered “undercapitalized” or if the payment of the dividend would make the institution “undercapitalized”. Maryland banking law provides that a state-chartered bank may pay dividends out of undivided profits or, with the prior approval of the Maryland Commissioner, from surplus in excess of 100% of required capital stock. If, however, the surplus of a Maryland bank is less than 100% of its required capital stock, then cash dividends may not be paid in excess of 90% of net earnings. In addition to these specific restrictions, bank regulatory agencies also have the ability to prohibit proposed dividends by a financial institution that would otherwise be permitted under applicable regulations if the regulatory body determines that such distribution would constitute an unsafe or unsound practice. Because of these
limitations, there can be no guarantee that the Company’s Board will declare dividends in any fiscal quarter.
There is no market for the Warrant, and the common stock is not heavily traded
There is no established trading market for the Warrant. The Company’s common stock is listed on the NASDAQ Global Select Market, but shares of the common stock are not heavily traded. Securities that are not heavily traded can be more volatile than stock trading in an active public market. Factors such as our financial results, the introduction of new products and services by us or our competitors, and various factors affecting the banking industry generally may have a significant impact on the market price of the shares of the common stock. Management cannot predict the extent to which an active public market for any of the Company’s securities will develop or be sustained in the future. Accordingly, holders of the Company’s securities may
not be able to sell such securities at the volumes, prices, or times that they desire.
The Company’s Articles of Incorporation and By-Laws and Maryland law may discourage a corporate takeover
The Company’s Amended and Restated Articles of Incorporation, as supplemented (the “Charter”), and Amended and Restated By-Laws, as amended (the “By-Laws”), contain certain provisions designed to enhance the ability of the Board of Directors to deal with attempts to acquire control of the Company. The Charter and By-Laws provide for the classification of the Board into three classes; directors of each class generally serve for staggered three-year periods. No director may be removed except for cause and then only by a vote of at least two-thirds of the total eligible stockholder votes. The Charter gives the Board certain powers in respect of the Company’s securities. First, the Board has the authority to classify and reclassify
unissued shares of stock of any class or series of stock by setting, fixing, eliminating, or altering in any one or more respects the preferences, rights, voting powers, restrictions and qualifications of, dividends on, and redemption, conversion, exchange, and other rights of, such securities. Second, a majority of the Board, without action by the stockholders, may amend the Charter to increase or decrease the aggregate number of shares of stock or the number of shares of stock of any class that the Company has authority to issue. The Board could use these powers, along with its authority to authorize the issuance of securities of any class or series, to issue securities having terms favorable to management to persons affiliated with or otherwise friendly to management.
Maryland law also contains anti-takeover provisions that apply to the Company. The Maryland Business Combination Act generally prohibits, subject to certain limited exceptions, corporations from being involved in any “business combination” (defined as a variety of transactions, including a merger, consolidation, share exchange, asset transfer or issuance or reclassification of equity securities) with any “interested shareholder” for a period of five years following the most recent date on which the interested shareholder became an interested shareholder. An interested shareholder is defined generally as a person who is the beneficial owner of 10% or more of the voting power of the outstanding voting stock of the corporation after the date on which the corporation had
100 or more beneficial owners of its stock or who is an affiliate or associate of the corporation and was the beneficial owner, directly or indirectly, of 10% percent or more of the voting power of the then outstanding stock of the corporation at any time within the two-year period immediately prior to the date in question and after the date on which the corporation had 100 or more beneficial owners of its stock. The Maryland Control Share Acquisition Act applies to acquisitions of “control shares”, which, subject to certain exceptions, are shares the acquisition of which entitle the holder, directly or indirectly, to exercise or direct the exercise of the voting power of shares of stock of the corporation in the election of directors within any of the following ranges of voting power: one-tenth or more, but less than one-third of all voting power; one-third or more, but less than a majority of all voting power or a majority or more of all voting
power. Control shares have limited voting rights. The By-Laws exempt the Company’s capital securities from the Maryland Control Share Acquisition Act, but the Board has the authority to eliminate the exemption without stockholder approval.
16
Although these provisions do not preclude a takeover, they may have the effect of discouraging, delaying or deferring a tender offer or takeover attempt that a shareholder might consider in his or her best interest, including those attempts that might result in a premium over the market price for the common stock. Such provisions will also render the removal of the Board of Directors and of management more difficult and, therefore, may serve to perpetuate current management. These provisions could potentially adversely affect the market price of the Company’s common stock.
Item 1B. Unresolved Staff Comments.
None.
Item 2. Properties.
Our offices are listed in the tables below. The Company’s main office is the same as Talbot Bank’s main office. The Company owns real property at 28969 Information Lane in Easton, Maryland, which houses the Operations, Information Technology and Finance departments of the Company and its subsidiaries, and certain operations of The Avon-Dixon Agency, LLC.
|
The Talbot Bank of Easton, Maryland
|
||
|
Branches
|
||
|
Main Office
18 East Dover Street
Easton, Maryland 21601
|
Tred Avon Square Branch
212 Marlboro Road
Easton, Maryland 21601
|
St. Michaels Branch
1013 South Talbot Street
St. Michaels, Maryland 21663
|
|
Elliott Road Branch
8275 Elliott Road
Easton, Maryland 21601
|
Sunburst Branch
424 Dorchester Avenue
Cambridge, Maryland 21613
|
Tilghman Branch
5804 Tilghman Island Road
Tilghman, Maryland 21671
|
|
Trappe Branch
29349 Maple Avenue, Suite 1
Trappe, Maryland 21673
|
||
|
ATMs
|
||
|
Memorial Hospital at Easton
219 South Washington Street
Easton, Maryland 21601
|
Talbottown
218 North Washington Street
Easton, Maryland 21601
|
|
17
|
CNB
|
||
|
Branches
|
||
|
Main Office
109 North Commerce Street
Centreville, Maryland 21617
|
Route 213 South Branch
2609 Centreville Road
Centreville, Maryland 21617
|
Chester Branch
300 Castle Marina Road
Chester, Maryland 21619
|
|
Chestertown Branch
305 High Street
Chestertown, Maryland 21620
|
Denton Branch
850 South 5th Avenue
Denton, Maryland 21629
|
Grasonville Branch
202 Pullman Crossing
Grasonville, Maryland 21638
|
|
Stevensville Branch
408 Thompson Creek Road
Stevensville, Maryland 21666
|
Tuckahoe Branch
22151 WES Street
Ridgely, Maryland 21660
|
Washington Square Branch
899 Washington Avenue
Chestertown, Maryland 21620
|
|
Felton Branch
120 West Main Street
Felton, Delaware 19943
(formerly Felton Bank)
|
Milford Branch
698-A North Dupont Boulevard
Milford, Delaware 19963
(formerly Felton Bank)
|
Camden Wal-Mart Supercenter
263 Wal-Mart Drive
Camden, Delaware 19934
(formerly Felton Bank)
|
|
Division Office - Wye Financial & Trust
16 North Washington Street, Suite 1
Easton, Maryland 21601
|
||
|
ATM
Queenstown Harbor Golf Links
Queenstown, Maryland 21658
|
||
|
The Avon-Dixon Agency, LLC
|
||
|
Headquarters
28969 Information Lane
Easton, Maryland 21601
|
Easton Office
106 North Harrison Street
Easton, Maryland 21601
|
Chestertown Office
899 Washington Avenue
Chestertown, Maryland 21620
|
|
Grasonville Office
202 Pullman Crossing
Grasonville, Maryland 21638
|
Centreville Office
105 Lawyers Row
Centreville, Maryland 21617
|
|
|
Elliott-Wilson Insurance, LLC
106 North Harrison Street Easton, Maryland 21601
|
Mubell Finance, LLC
106 North Harrison Street Easton, Maryland 21601
|
Wye Mortgage Group
17 East Dover Street, Suite 101
Easton, Maryland 21601
|
|
Jack Martin & Associates, Inc.
135 Old Solomon’s Island Road
Annapolis, Maryland 21401
|
Tri-State General Insurance Agencies and ESFS, Inc.
One Plaza East, 4th Floor
Salisbury, Maryland 21802
|
|
Talbot Bank owns the real property on which all of its offices are located, except that it operates under leases at its St. Michaels, Tilghman and Trappe branches. CNB owns the real property on which all of its Maryland offices are located, except that it operates under a lease at the office of Wye Financial and Trust in Easton. CNB leases the real property on which all of its Delaware offices (former offices of Felton Bank) are located. The Insurance Subsidiaries do not own any real property, but operate under leases. For information about rent expense for all leased premises, see Note 5 to the Consolidated Financial Statements appearing in Item 8 of Part II of this report.
18
|
Item 3.
|
Legal Proceedings.
|
We are at times, in the ordinary course of business, subject to legal actions. Management, upon the advice of counsel, believes that losses, if any, resulting from current legal actions will not have a material adverse effect on our financial condition or results of operations.
|
Item 4.
|
[Removed and Reserved]
|
PART II
|
Item 5.
|
Market for Registrant’s Common Equity, Related Stockholder Matters and Issuer Purchases of Equity Securities.
|
MARKET PRICE, HOLDERS AND CASH DIVIDENDS
The shares of the common stock of the Company are listed on the NASDAQ Global Select Market under the symbol “SHBI”. As of February 28, 2011, the Company had approximately 1,648 holders of record. The high and low sales prices for the shares of common stock of the Company, as reported on the NASDAQ Global Select Market, and the cash dividends declared on those shares for each quarterly period of 2010 and 2009 are set forth in the table below.
|
2010
|
2009
|
|||||||||||||||||||||||
|
Price Range
|
Dividends
|
Price Range
|
Dividends
|
|||||||||||||||||||||
|
High
|
Low
|
Paid
|
High
|
Low
|
Paid
|
|||||||||||||||||||
|
First Quarter
|
$ | 14.75 | $ | 10.21 | $ | 0.06 | $ | 24.43 | $ | 11.00 | $ | 0.16 | ||||||||||||
|
Second Quarter
|
14.80 | 11.75 | 0.06 | 21.46 | 15.18 | 0.16 | ||||||||||||||||||
|
Third Quarter
|
12.10 | 9.20 | 0.06 | 20.72 | 16.64 | 0.16 | ||||||||||||||||||
|
Fourth Quarter
|
10.73 | 9.25 | 0.06 | 17.71 | 13.52 | 0.16 | ||||||||||||||||||
| $ | 0.24 | $ | 0.64 | |||||||||||||||||||||
On February 28, 2011, the closing sales price for the shares of common stock as reported on the NASDAQ Global Select Market was $9.98 per share.
Stockholders received cash dividends totaling $2.0 million and $5.4 million in 2010 and 2009, respectively. Dividends paid per share exceeded earnings per share in 2010. The ratio of dividends paid per share to earnings per share was 100.00% in 2009. Cash dividends are typically declared on a quarterly basis and are at the discretion of the Board of Directors, based upon such factors as operating results, financial condition, capital adequacy, regulatory requirements, and stockholder return. The Company’s ability to pay dividends is limited by federal banking and state corporate law and is generally dependent on the ability of the Company’s subsidiaries, particularly the Banks, to declare dividends to the Company. For more information regarding these
limitations, see Item 1A of Part I of this report under the headings, “The Company’s ability to pay dividends is limited by applicable banking and corporate law”, which is incorporated herein by reference.
In an effort to preserve the Company’s capital, the quarterly common stock dividend was reduced to $0.06 from $0.16 per share, effective for the dividend payable February 26, 2010.
The transfer agent for the Company’s common stock is:
Registrar & Transfer Company
10 Commerce Drive
Cranford, New Jersey 07016
Investor Relations: 1-800-368-5948
E-mail for investor inquiries: info@rtco.com.
19
The performance graph below compares the cumulative total shareholder return on the common stock of the Company with the cumulative total return on the equity securities included in the NASDAQ Composite Index (reflecting overall stock market performance), the NASDAQ Bank Index (reflecting changes in banking industry stocks), and the SNL Small Cap Bank Index (reflecting changes in stocks of banking institutions of a size similar to the Company) assuming in each case an initial $100 investment on December 31, 2005 and reinvestment of dividends as of the end of the Company’s fiscal years. Returns are shown on a total return basis. The performance graph represents past performance and should not be considered to be an indication of future performance.
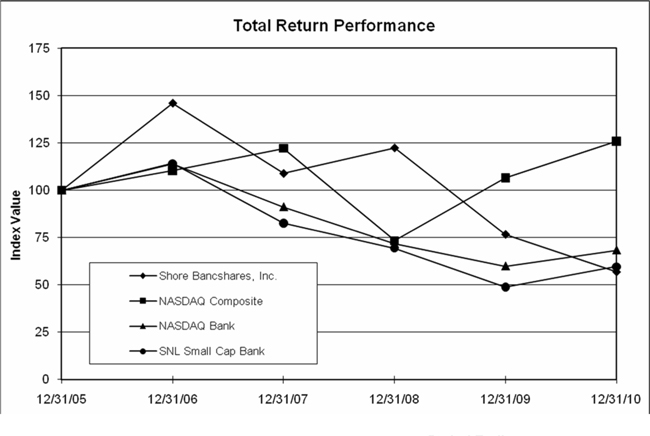
|
Period Ending
|
||||||||||||||||||||||||
|
Index
|
12/31/05
|
12/31/06
|
12/31/07
|
12/31/08
|
12/31/09
|
12/31/10
|
||||||||||||||||||
|
Shore Bancshares, Inc.
|
100.00 | 145.85 | 108.85 | 122.31 | 76.74 | 56.96 | ||||||||||||||||||
|
NASDAQ Composite
|
100.00 | 110.39 | 122.15 | 73.32 | 106.57 | 125.91 | ||||||||||||||||||
|
NASDAQ Bank
|
100.00 | 113.82 | 91.16 | 71.52 | 59.87 | 68.34 | ||||||||||||||||||
|
SNL Small Cap Bank
|
100.00 | 114.14 | 82.53 | 69.37 | 48.76 | 59.56 | ||||||||||||||||||
ISSUER REPURCHASES
On February 2, 2006, the Company’s Board of Directors authorized the Company to repurchase up to 165,000 shares of its common stock over a period not to exceed 60 months. Shares may be repurchased in the open market or in privately negotiated transactions at such times and in such amounts per transaction as the President of the Company determines to be appropriate, subject to Board oversight. The Company intends to use the repurchased shares to fund the Company’s employee benefit plans and for other general corporate purposes. No shares were repurchased by or on behalf of the Company and its affiliates (as defined by Exchange Act Rule 10b-18) during 2010.
EQUITY COMPENSATION PLAN INFORMATION
Pursuant to the SEC’s Regulation S-K Compliance and Disclosure Interpretation 106.01, the information regarding the Corporation’s equity compensation plans required by this Item pursuant to Item 201(d) of Regulation S-K is located in Item 12 of Part III of this annual report and is incorporated herein by reference.
20
Item 6. Selected Financial Data.
The following table sets forth certain selected financial data for the five years ended December 31, 2010, and is qualified in its entirety by the detailed statistical and other information contained in this report, including “Management’s Discussion and Analysis of Financial Condition and Results of Operations” appearing in Item 7 of Part II of this report and the financial statements and notes thereto appearing in Item 8 of Part II of this report.
| Years Ended December 31, | ||||||||||||||||||||
|
(Dollars in thousands, except per share data)
|
2010
|
2009
|
2008
|
2007
|
2006
|
|||||||||||||||
|
RESULTS OF OPERATIONS:
|
||||||||||||||||||||
|
Interest income
|
$ | 55,461 | $ | 58,789 | $ | 61,474 | $ | 65,141 | $ | 57,971 | ||||||||||
|
Interest expense
|
12,822 | 17,411 | 21,555 | 24,105 | 19,074 | |||||||||||||||
|
Net interest income
|
42,639 | 41,378 | 39,919 | 41,036 | 38,897 | |||||||||||||||
|
Provision for credit losses
|
21,119 | 8,986 | 3,337 | 1,724 | 1,493 | |||||||||||||||
|
Net interest income after provision for credit losses
|
21,520 | 32,392 | 36,582 | 39,312 | 37,404 | |||||||||||||||
|
Noninterest income
|
18,041 | 19,541 | 20,350 | 14,679 | 12,839 | |||||||||||||||
|
Noninterest expense
|
41,720 | 40,248 | 38,370 | 32,539 | 28,535 | |||||||||||||||
|
(Loss) income before income taxes
|
(2,159 | ) | 11,685 | 18,562 | 21,452 | 21,708 | ||||||||||||||
|
Income tax (benefit) expense
|
(492 | ) | 4,412 | 7,092 | 8,002 | 8,154 | ||||||||||||||
|
Net (loss) income
|
(1,667 | ) | 7,273 | 11,470 | 13,450 | 13,554 | ||||||||||||||
|
Preferred stock dividends and discount accretion
|
- | 1,876 | - | - | - | |||||||||||||||
|
Net (loss) income available to common shareholders
|
$ | (1,667 | ) | $ | 5,397 | $ | 11,470 | $ | 13,450 | $ | 13,554 | |||||||||
|
PER COMMON SHARE DATA:
|
||||||||||||||||||||
|
Net income – basic
|
$ | (0.20 | ) | $ | 0.64 | $ | 1.37 | $ | 1.61 | $ | 1.62 | |||||||||
|
Net income – diluted
|
(0.20 | ) | 0.64 | 1.37 | 1.60 | 1.61 | ||||||||||||||
|
Dividends paid
|
0.24 | 0.64 | 0.64 | 0.64 | 0.59 | |||||||||||||||
|
Book value (at year end)
|
14.51 | 15.18 | 15.16 | 14.35 | 13.28 | |||||||||||||||
|
Tangible book value (at year end)1
|
12.32 | 12.64 | 12.55 | 11.68 | 11.67 | |||||||||||||||
|
FINANCIAL CONDITION (at year end):
|
||||||||||||||||||||
|
Loans
|
$ | 895,404 | $ | 916,557 | $ | 888,528 | $ | 776,350 | $ | 699,719 | ||||||||||
|
Assets
|
1,130,311 | 1,156,516 | 1,044,641 | 956,911 | 945,649 | |||||||||||||||
|
Deposits
|
979,516 | 990,937 | 845,371 | 765,895 | 774,182 | |||||||||||||||
|
Long-term debt
|
932 | 1,429 | 7,947 | 12,485 | 25,000 | |||||||||||||||
|
Stockholders’ equity
|
122,513 | 127,810 | 127,385 | 120,235 | 111,327 | |||||||||||||||
|
PERFORMANCE RATIOS (for the year):
|
||||||||||||||||||||
|
Return on average total assets
|
(0.15 | )% | 0.48 | % | 1.13 | % | 1.42 | % | 1.52 | % | ||||||||||
|
Return on average stockholders’ equity
|
(1.33 | ) | 4.00 | 9.22 | 11.79 | 12.66 | ||||||||||||||
|
Net interest margin
|
4.02 | 3.90 | 4.23 | 4.64 | 4.70 | |||||||||||||||
|
Efficiency ratio2
|
68.75 | 66.07 | 63.66 | 58.40 | 55.15 | |||||||||||||||
|
Dividend payout ratio
|
(120.00 | ) | 100.00 | 46.72 | 39.75 | 36.42 | ||||||||||||||
|
Average stockholders’ equity to average total assets
|
11.05 | 11.96 | 12.30 | 12.04 | 11.98 | |||||||||||||||
1Total stockholders’ equity, net of goodwill and other intangible assets, divided by the number of shares of common stock outstanding at year end.
2Noninterest expense as a percentage of total revenue (net interest income plus total noninterest income). Lower ratios indicate improved productivity.
21
Item 7. Management’s Discussion and Analysis of Financial Condition and Results of Operations.
The following discussion compares the Company’s financial condition at December 31, 2010 to its financial condition at December 31, 2009 and the results of operations for the years ended December 31, 2010, 2009, and 2008. This discussion should be read in conjunction with the Consolidated Financial Statements and the Notes thereto appearing in Item 8 of Part II of this report.
PERFORMANCE OVERVIEW
The Company recorded a net loss of $1.7 million in 2010, compared to net income of $5.4 million and $11.5 million for 2009 and 2008, respectively. The basic and diluted loss per common share for 2010 was $0.20, compared to basic and diluted earnings per common share of $0.64 for 2009 and $1.37 for 2008.
For 2010, the main contributors to the net loss were goodwill impairment charges and a higher provision for credit losses when compared to the prior two years. During the third quarter of 2010, the Company recorded goodwill impairment charges of $3.0 million and other intangible assets impairment charges of $51 thousand. The provision for credit losses for 2010, 2009 and 2008 was $21.1 million, $9.0 million and $3.3 million, respectively. During 2010, the ongoing economic recession created more credit quality issues that resulted in higher loan charge offs and a higher provision for credit losses than in 2009 and 2008.
During 2009, net income available to common stockholders was negatively impacted by dividends and discount accretion associated with the sale and subsequent redemption of the Company’s Series A Preferred Stock issued to the Treasury under the TARP Capital Purchase Plan (the “CPP”). The impact on 2009 earnings from the preferred stock activity was $1.9 million.
Return on average assets was (0.15)% for 2010, compared to 0.48% for 2009 and 1.13% for 2008. Return on average stockholders’ equity for 2010 was (1.33)%, compared to 4.00% for 2009 and 9.22% for 2008. Comparing the year ended December 31, 2010 to the year ended December 31, 2009, average assets increased slightly to $1.137 billion, average loans decreased slightly to $906.7 million, average deposits increased 3.2% to $980.3 million, and average stockholders’ equity decreased 7.0% to $125.6 million. Comparing 2009 to 2008, average assets increased 11.7%, average loans increased 9.1%, average deposits increased 16.4%, and average stockholders’ equity increased 8.5%.
CRITICAL ACCOUNTING POLICIES
The Company’s consolidated financial statements are prepared in accordance with accounting principles generally accepted in the United States of America and follow general practices within the industries in which it operates. Application of these principles requires management to make estimates, assumptions, and judgments that affect the amounts reported in the financial statements and accompanying notes. These estimates, assumptions, and judgments are based on information available as of the date of the financial statements; accordingly, as this information changes, the financial statements could reflect different estimates, assumptions, and judgments. Certain policies inherently have a greater reliance on the use of estimates, assumptions, and judgments and as such have a greater
possibility of producing results that could be materially different than originally reported. Estimates, assumptions, and judgments are necessary when assets and liabilities are required to be recorded at fair value, when a decline in the value of an asset not carried on the financial statements at fair value warrants an impairment write-down or valuation reserve to be established, or when an asset or liability needs to be recorded contingent upon a future event. Carrying assets and liabilities at fair value inherently results in more financial statement volatility. The fair values and the information used to record valuation adjustments for certain assets and liabilities are based either on quoted market prices or are provided by other third-party sources, when available.
The most significant accounting policies that the Company follows are presented in Note 1 to the Consolidated Financial Statements. These policies, along with the disclosures presented in the other financial statement notes and in this discussion, provide information on how significant assets and liabilities are valued in the financial statements and how those values are determined. Based on the valuation techniques used and the sensitivity of financial statement amounts to the methods, assumptions, and estimates underlying those amounts, management has determined that the accounting policy with respect to the allowance for credit losses to be the accounting area that requires the most subjective or complex judgments, and, as such, could be most subject to revision as new information becomes
available. Accordingly, the allowance for credit losses is considered to be a critical accounting policy, along with goodwill and other intangible assets and fair value, as discussed below.
The allowance for credit losses represents management’s estimate of credit losses inherent in the loan portfolio as of the balance sheet date. Determining the amount of the allowance for credit losses is considered a critical accounting estimate because it requires significant judgment and the use of estimates related to the amount and timing of expected future cash flows on impaired loans, estimated losses on pools of homogeneous loans based on historical loss experience, and consideration of current economic trends and conditions, all of which may be susceptible to significant change. The loan portfolio also represents the largest asset type on the consolidated balance sheets. Note 1 to the Consolidated Financial Statements describes the methodology used to determine the
allowance for credit losses and a discussion of the factors driving changes in the amount of the allowance for credit losses is included in the Provision for Credit Losses and Risk Management section of this discussion.
22
Goodwill represents the excess of the cost of an acquisition over the fair value of the net assets acquired. Other intangible assets represent purchased assets that also lack physical substance but can be distinguished from goodwill because of contractual or other legal rights or because the asset is capable of being sold or exchanged either on its own or in combination with a related contract, asset or liability. Goodwill and other intangible assets are required to be recorded at fair value. Determining fair value is subjective, requiring the use of estimates, assumptions and management judgment. Goodwill and other intangible assets with indefinite lives are tested at least annually for impairment, usually during the third quarter, or on an interim basis if
circumstances dictate. Intangible assets that have finite lives are amortized over their estimated useful lives and also are subject to impairment testing. Impairment testing requires that the fair value of each of the Company’s reporting units be compared to the carrying amount of its net assets, including goodwill. The Company’s reporting units were identified based on an analysis of each of its individual operating segments. If the fair value of a reporting unit is less than book value, an expense may be required to write down the related goodwill or purchased intangibles to record an impairment loss.
The Company measures certain financial assets and liabilities at fair value, with the measurements made on a recurring or nonrecurring basis. Significant financial instruments measured at fair value on a recurring basis are investment securities and interest rate caps. Impaired loans and other real estate and other assets owned are significant financial instruments measured at fair value on a nonrecurring basis. Fair value is defined as the exchange price that would be received for an asset or paid to transfer a liability (an exit price) in the principal or most advantageous market for the asset or liability in an orderly transaction between market participants on the measurement date. In determining fair value, the Company is required to maximize the use of observable
inputs and minimize the use of unobservable inputs, reducing subjectivity.
RECENT ACCOUNTING PRONOUNCEMENTS AND DEVELOPMENTS
The Financial Accounting Standards Board’s (“FASB”) Accounting Standards Codification became effective on July 1, 2009. At that date, the codification became FASB’s officially recognized source of authoritative U.S. generally accepted accounting principles (“GAAP”) applicable to all public and non-public non-governmental entities, superseding existing FASB, American Institute of Certified Public Accountants (“AICPA”), Emerging Issues Task Force (“EITF”) and related literature. Rules and interpretive releases of the SEC under the authority of federal securities laws are also sources of authoritative GAAP for SEC registrants. All other accounting literature is considered non-authoritative. The switch to the codification affects the way companies
refer to U.S. GAAP in financial statements and accounting policies. Citing particular content in the codification involves specifying the unique numeric path to the content through the Topic, Subtopic, Section and Paragraph structure.
Note 1 to the Consolidated Financial Statements discusses new accounting policies that the Company adopted during 2010 and the expected impact of accounting policies recently issued or proposed but not yet required to be adopted. To the extent the adoption of new accounting standards materially affects our financial condition, results of operations or liquidity, the impacts are discussed in the applicable section(s) of this discussion and Notes to the Consolidated Financial Statements.
RESULTS OF OPERATIONS
Net Interest Income and Net Interest Margin
During 2010 and 2009, the FRB made no changes to the fed funds rate, unlike in 2008 when the FRB reduced the fed funds rate by 400 basis points. The New York Prime rate, the primary index used for variable rate loans, also remained unchanged during 2010 and 2009 but declined 400 basis points during 2008. Reflecting the continuing lower interest rate environment, our overall yields earned and rates paid during 2010 decreased when compared to 2009 and 2008.
Net interest income remains the most significant component of our earnings. It is the excess of interest and fees earned on total earning assets (loans, investment securities, federal funds sold and interest-bearing deposits with other banks) over interest owed on interest-bearing liabilities (deposits and borrowings). As shown in the table below, tax equivalent net interest income for 2010 was $42.9 million, a 2.9% increase over 2009. The increase was primarily due to lower rates paid on interest-bearing liabilities offsetting the decline in yields on earning assets. Tax equivalent net interest income for 2009 was $41.7 million, a 3.4% increase over 2008. During 2009, the increase in the volume of earning assets and lower rates paid on interest-bearing
liabilities were sufficient to offset the decline in yields on earning assets.
Our net interest margin (i.e., tax equivalent net interest income divided by average earning assets) represents the net yield on earning assets. The net interest margin is managed through loan and deposit pricing and asset/liability strategies and in 2010, the net interest margin benefited from the Company’s effort to reduce deposit pricing structures. The net interest margin was 4.02% for 2010, compared to 3.90% for 2009 and 4.23% for 2008. The increase in net interest income was enough to improve the net interest margin 12 basis points in 2010 when compared to 2009 which was not the case in 2009 because the net interest margin declined 33 basis points when compared to 2008. The net interest spread, which is the
difference between the average yield on earning assets and the rate paid for interest-bearing liabilities, was 3.76% for 2010, 3.52% for 2009 and 3.68% for 2008.
23
The following table sets forth the major components of net interest income, on a tax equivalent basis, for the years ended December 31, 2010, 2009, and 2008.
|
2010
|
2009
|
2008
|
||||||||||||||||||||||||||||||||||
|
Average
|
Interest
|
Yield/
|
Average
|
Interest
|
Yield/
|
Average
|
Interest
|
Yield
|
||||||||||||||||||||||||||||
|
(Dollars in thousands)
|
Balance
|
(1)
|
Rate
|
Balance
|
(1)
|
Rate
|
Balance
|
(1)
|
/Rate
|
|||||||||||||||||||||||||||
|
Earning assets
|
||||||||||||||||||||||||||||||||||||
|
Loans (2) (3)
|
$ | 906,732 | $ | 52,118 | 5.75 | % | $ | 913,631 | $ | 55,369 | 6.06 | % | $ | 837,739 | $ | 57,041 | 6.81 | % | ||||||||||||||||||
|
Investment securities:
|
||||||||||||||||||||||||||||||||||||
|
Taxable
|
101,162 | 3,209 | 3.17 | 84,283 | 3,184 | 3.78 | 85,105 | 3,788 | 4.45 | |||||||||||||||||||||||||||
|
Tax-exempt
|
6,080 | 321 | 5.29 | 8,071 | 458 | 5.67 | 11,031 | 646 | 5.86 | |||||||||||||||||||||||||||
|
Federal funds sold
|
39,770 | 60 | 0.15 | 59,416 | 84 | 0.14 | 16,427 | 308 | 1.87 | |||||||||||||||||||||||||||
|
Interest-bearing deposits
|
14,520 | 18 | 0.12 | 3,200 | 11 | 0.35 | 3,666 | 92 | 2.51 | |||||||||||||||||||||||||||
|
Total earning assets
|
1,068,264 | 55,726 | 5.22 | % | 1,068,601 | 59,106 | 5.53 | % | 953,968 | 61,875 | 6.49 | % | ||||||||||||||||||||||||
|
Cash and due from banks
|
16,567 | 17,049 | 14,829 | |||||||||||||||||||||||||||||||||
|
Other assets
|
65,774 | 54,016 | 50,275 | |||||||||||||||||||||||||||||||||
|
Allowance for credit losses
|
(13,689 | ) | (10,754 | ) | (8,270 | ) | ||||||||||||||||||||||||||||||
|
Total assets
|
$ | 1,136,916 | $ | 1,128,912 | $ | 1,010,802 | ||||||||||||||||||||||||||||||
|
Interest-bearing liabilities
|
||||||||||||||||||||||||||||||||||||
|
Demand deposits
|
$ | 130,297 | 315 | 0.24 | % | $ | 124,758 | 315 | 0.25 | % | $ | 113,002 | 437 | 0.39 | % | |||||||||||||||||||||
|
Money market and savings deposits
|
258,650 | 1,970 | 0.76 | 218,125 | 1,354 | 0.62 | 175,376 | 2,406 | 1.37 | |||||||||||||||||||||||||||
|
Certificates of deposit, $100,000 or more
|
256,393 | 5,128 | 2.00 | 258,879 | 7,670 | 2.96 | 193,678 | 7,955 | 4.11 | |||||||||||||||||||||||||||
|
Other time deposits
|
214,121 | 5,268 | 2.46 | 234,468 | 7,679 | 3.28 | 226,201 | 9,079 | 4.01 | |||||||||||||||||||||||||||
|
Interest-bearing deposits
|
859,461 | 12,681 | 1.48 | 836,230 | 17,018 | 2.04 | 708,257 | 19,877 | 2.81 | |||||||||||||||||||||||||||
|
Short-term borrowings
|
16,348 | 83 | 0.51 | 25,519 | 127 | 0.50 | 47,765 | 1,147 | 2.40 | |||||||||||||||||||||||||||
|
Long-term debt
|
1,304 | 58 | 4.41 | 4,792 | 266 | 5.55 | 11,598 | 531 | 4.58 | |||||||||||||||||||||||||||
|
Total interest-bearing liabilities
|
877,113 | 12,822 | 1.46 | % | 866,541 | 17,411 | 2.01 | % | 767,620 | 21,555 | 2.81 | % | ||||||||||||||||||||||||
|
Noninterest-bearing deposits
|
120,871 | 113,430 | 107,430 | |||||||||||||||||||||||||||||||||
|
Other liabilities
|
13,346 | 13,963 | 11,388 | |||||||||||||||||||||||||||||||||
|
Stockholders’ equity
|
125,586 | 134,978 | 124,364 | |||||||||||||||||||||||||||||||||
|
Total liabilities and stockholders’ equity
|
$ | 1,136,916 | $ | 1,128,912 | $ | 1,010,802 | ||||||||||||||||||||||||||||||
|
Net interest spread
|
$ | 42,904 | 3.76 | % | $ | 41,695 | 3.52 | % | $ | 40,320 | 3.68 | % | ||||||||||||||||||||||||
|
Net interest margin
|
4.02 | % | 3.90 | % | 4.23 | % | ||||||||||||||||||||||||||||||
(1) All amounts are reported on a tax equivalent basis computed using the statutory federal income tax rate of 34.0% for 2010; 34.2% for 2009 and 35% for 2008, exclusive of the alternative minimum tax rate and nondeductible interest expense. The taxable equivalent adjustment amounts utilized in the above table to compute yields aggregated $265 thousand in 2010, $317 thousand in 2009, and $401 thousand in 2008.
(2) Average loan balances include nonaccrual loans.
(3) Interest income on loans includes amortized loan fees, net of costs, and yields are stated to include all.
On a tax equivalent basis, total interest income was $55.7 million for 2010, compared to $59.1 million for 2009 and $61.9 million for 2008. The Company’s largest source of interest income is loans. The tax equivalent yield on loans decreased to 5.75% for 2010, compared to 6.06% for 2009 and 6.81% for 2008. The decrease of $6.9 million in average loans and the decrease of 31 basis points in the yield on loans was the primary reason for the decline in interest income in 2010. Interest income in 2009 also declined when compared to 2008 because the $75.9 million increase in average loans during 2009 was not enough to offset the decrease of 75 basis points in the yield on loans for that year. The changes in all other average earning assets included
increases in taxable investment securities and interest-bearing deposits with other banks of $16.9 million and $11.3 million, respectively, when compared to 2009 and decreases in federal funds sold and tax-exempt investment securities of $19.6 million and $2.0 million, respectively, when compared to 2009. For 2009, average federal funds sold increased while average investment securities and interest-bearing deposits with other banks decreased. As a percentage of total average earning assets, loans, investment securities and federal funds sold were 84.9%, 10.0% and 3.7%, respectively, for 2010, compared to 85.5%, 8.6% and 5.6%, respectively, for 2009 and 87.8%, 10.1% and 1.7%, respectively, for 2008. The yields on all other earning assets in 2010 declined when compared to 2009 except for the yield on federal funds sold which increased one basis point. The yields on all other earning assets decreased in 2009 when compared to
yields in 2008. When comparing 2010 to 2009, the overall decrease in yields on earning assets produced $3.4 million less in interest income, almost all of which was due to lower rates, as seen in the Rate/Volume Variance Analysis below. In 2009, the overall decrease in yields on earning assets produced $2.8 million less in interest income, $7.7 million of which was due to lower rates net of $4.9 million due to increased volume.
24
Interest expense was $12.8 million for 2010, compared to $17.4 million for 2009 and $21.6 million for 2008. Although overall volume increased, lower rates paid for interest-bearing liabilities, primarily time deposits (certificates of deposit of $100,000 or more and other time deposits), was the main reason for the decrease in interest expense in 2010. A similar situation prevailed during 2009, with overall volumes increasing but rates decreasing enough to reduce interest expense. The Company incurs the largest amount of interest expense from time deposits. The average rate paid for certificates of deposit of $100,000 or more decreased 96 basis points to 2.00% for 2010 from 2.96% for 2009 and decreased 115 basis points in 2009 from 4.11% for 2008. The rate paid for all other time deposits decreased 82
basis points to 2.46% for 2010, compared to 3.28% for 2009, and decreased 73 basis points in 2009 from 4.01% for 2008. During 2010, the overall decrease in rates on interest-bearing liabilities produced $4.6 million less in interest expense, $4.8 million of which was due to lower rates net of $211 thousand due to increased volume, as shown in the table below. In 2009, the overall decrease in rates on interest bearing liabilities produced $4.1 million less in interest expense, $6.5 million of which was due to lower rates net of $2.4 million due to increased volume.
The following Rate/Volume Variance Analysis identifies the portion of the changes in tax equivalent net interest income attributable to changes in volume of average balances or to changes in the yield on earning assets and rates paid on interest- bearing liabilities.
|
2010 over (under) 2009
|
2009 over (under) 2008
|
|||||||||||||||||||||||
|
Total
|
Caused By
|
Total
|
Caused By
|
|||||||||||||||||||||
|
(Dollars in thousands)
|
Variance
|
Rate
|
Volume
|
Variance
|
Rate
|
Volume
|
||||||||||||||||||
|
Interest income from earning assets:
|
||||||||||||||||||||||||
|
Loans
|
$ | (3,251 | ) | $ | (2,768 | ) | $ | (483 | ) | $ | (1,672 | ) | $ | (6,583 | ) | $ | 4,911 | |||||||
|
Taxable investment securities
|
25 | (558 | ) | 583 | (604 | ) | (568 | ) | (36 | ) | ||||||||||||||
|
Tax-exempt investment securities
|
(137 | ) | (29 | ) | (108 | ) | (188 | ) | (20 | ) | (168 | ) | ||||||||||||
|
Federal funds sold
|
(24 | ) | 6 | (30 | ) | (224 | ) | (479 | ) | 255 | ||||||||||||||
|
Interest-bearing deposits
|
7 | (11 | ) | 18 | (81 | ) | (71 | ) | (10 | ) | ||||||||||||||
|
Total interest income
|
(3,380 | ) | (3,360 | ) | (20 | ) | (2,769 | ) | (7,721 | ) | 4,952 | |||||||||||||
|
Interest expense on deposits and borrowed funds:
|
||||||||||||||||||||||||
|
Interest-bearing demand deposits
|
- | (13 | ) | 13 | (122 | ) | (164 | ) | 42 | |||||||||||||||
|
Money market and savings deposits
|
616 | 90 | 526 | (1,052 | ) | (1,627 | ) | 575 | ||||||||||||||||
|
Time deposits
|
(4,953 | ) | (4,834 | ) | (119 | ) | (1,685 | ) | (4,278 | ) | 2,593 | |||||||||||||
|
Short-term borrowings
|
(44 | ) | 3 | (47 | ) | (1,020 | ) | (604 | ) | (416 | ) | |||||||||||||
|
Long-term debt
|
(208 | ) | (46 | ) | (162 | ) | (265 | ) | 95 | (360 | ) | |||||||||||||
|
Total interest expense
|
(4,589 | ) | (4,800 | ) | 211 | (4,144 | ) | (6,578 | ) | 2,434 | ||||||||||||||
|
Net interest income
|
$ | 1,209 | $ | 1,440 | $ | (231 | ) | $ | 1,375 | $ | (1,143 | ) | $ | 2,518 | ||||||||||
The rate and volume variance for each category has been allocated on a consistent basis between rate and volume variances, based on a percentage of rate, or volume, variance to the sum of the absolute two variances.
Noninterest Income
Noninterest income decreased $1.5 million, or 7.7%, in 2010, compared to a decrease of $809 thousand, or 4.0%, in 2009. The decrease in noninterest income in 2010 when compared to 2009 was mainly due to a decline in insurance agency commissions of $1.0 million, a decline in mortgage broker fees of $666 thousand and a mark to market gain of $420 thousand on interest rate swaps in 2009. The decline in insurance agency commissions reflected the continuing soft market in the insurance industry. Mortgage broker fees declined because the Company terminated the operations of its mortgage subsidiary during 2010 and now conducts brokerage activities through a minority series investment in an unrelated Delaware limited liability company under the name “Wye Mortgage
Group”. During 2010, Wye Mortgage Group generated a $6 thousand loss which was reported in other noninterest income. The decrease in noninterest income was partially offset by increases in trust and investment fee income and other noninterest income of $403 thousand and $417 thousand, respectively. Other noninterest income included a $224 thousand gain relating to the surrender of directors’ life insurance policies.
25
A decline in insurance agency commissions of $959 thousand and net gains on asset sales of $524 thousand in 2008 accounted for most of the decrease in 2009 when compared to 2008. This decrease was partially offset by an increase of $652 thousand in other noninterest income. The net gains in 2008 included a $1.3 million gain on the sale of a bank branch, offset by a combined $386 thousand other than temporary impairment and subsequent loss on the sale of Freddie Mac Preferred Stock and a $337 thousand loss on the sale of the Company’s investment in Delmarva Bank Data Processing Center, Inc., an unconsolidated subsidiary. The increase in other noninterest income in 2009 when compared to 2008 included a $420 thousand mark to market gain on interest rate swaps and a $273
thousand increase in revenue from the mortgage subsidiary.
The following table summarizes our noninterest income for the years ended December 31.
|
Years Ended
|
Change from Prior Year
|
|||||||||||||||||||||||||||
|
2010/09
|
2009/08
|
|||||||||||||||||||||||||||
|
(Dollars in thousands)
|
2010
|
2009
|
2008
|
Amount
|
Percent
|
Amount
|
Percent
|
|||||||||||||||||||||
|
Service charges on deposit accounts
|
$ | 3,257 | $ | 3,424 | $ | 3,600 | $ | (167 | ) | (4.9 | )% | $ | (176 | ) | (4.9 | )% | ||||||||||||
|
Trust and investment fee income
|
1,503 | 1,100 | 951 | 403 | 36.6 | 149 | 15.7 | |||||||||||||||||||||
|
Gains (losses) on sales of investment securities
|
- | 49 | (15 | ) | (49 | ) | (100.0 | ) | 64 | 426.7 | ||||||||||||||||||
|
Other than temporary impairment of securities
|
- | - | (371 | ) | - | - | 371 | 100.0 | ||||||||||||||||||||
|
Insurance agency commissions income
|
10,113 | 11,131 | 12,090 | (1,018 | ) | (9.1 | ) | (959 | ) | (7.9 | ) | |||||||||||||||||
|
Gains (losses) on disposals of premises and equipment
|
- | - | 1,247 | - | - | (1,247 | ) | (100.0 | ) | |||||||||||||||||||
|
Loss on sale of investment in unconsolidated subsidiary
|
- | - | (337 | ) | - | - | 337 | 100.0 | ||||||||||||||||||||
|
Other noninterest income:
|
||||||||||||||||||||||||||||
|
Interest rate swaps
|
- | 420 | - | (420 | ) | (100.0 | ) | 420 | - | |||||||||||||||||||
|
Mortgage broker fees
|
182 | 848 | 575 | (666 | ) | (78.5 | ) | 273 | 47.5 | |||||||||||||||||||
|
Other
|
2,986 | 2,569 | 2,610 | 417 | 16.2 | (41 | ) | (1.6 | ) | |||||||||||||||||||
|
Total
|
3,168 | 3,837 | 3,185 | (669 | ) | (17.4 | ) | 652 | 20.5 | |||||||||||||||||||
|
Total
|
$ | 18,041 | $ | 19,541 | $ | 20,350 | $ | (1,500 | ) | (7.7 | ) | $ | (809 | ) | (4.0 | ) | ||||||||||||
Noninterest Expense
Total noninterest expense increased $1.5 million, or 3.7%, in 2010, which was lower than the increase of $1.9 million, or 4.9%, in 2009. A significant portion of the increase in 2010 was due to goodwill and other intangible assets impairment charges of $3.1 million when compared to 2009. As a result of the annual assessment for goodwill and other intangible assets impairment, it was determined that goodwill at Felton Bank was impaired and goodwill and other intangible assets were impaired at TSGIA. The Company recorded goodwill impairment charges of $1.5 million at Felton Bank and goodwill impairment charges of $1.5 million and other intangible assets impairment charges of $51 thousand at TSGIA. Other noninterest expenses for 2010 increased $723 thousand when
compared to 2009, over half of which included expenses related to collection and other real estate owned activities. Partially offsetting these increases in expense were a decrease in salaries and wages of $1.1 million and a decrease in employee benefits of $802 thousand reflecting lower expenses accrued for bonus and profit sharing plans which are a part of overall cost containment measures taken by the Company. Insurance agency commissions expense and FDIC insurance premium expense decreased $344 thousand and $244 thousand, respectively.
A significant portion of the increase in 2009 was due to increased FDIC insurance premium expense of $1.7 million when compared to 2008. The increase in FDIC insurance premiums was attributable to higher overall rates, a one-time special assessment of $513 thousand and growth in our deposits. Other noninterest expenses for 2009 increased $490 thousand when compared to 2008, over half of which included expenses related to collection and other real estate owned activities. Occupancy expense increased $145 thousand mainly due to one additional bank branch and usual annual rent increases. Partially offsetting these increases in expense were lower insurance agency commissions expense of $335 thousand and lower employee benefits expense of $264
thousand. Employee benefits declined from 2009 amounts primarily due to less expense accrued for the Company’s profit sharing plan contribution for 2009.
26
Amortization of intangible assets relates to Felton Bank and the Insurance Subsidiaries. See Note 7 to the Consolidated Financial Statements for further information regarding the impact of goodwill and other intangible assets on the financial statements.
We had 321 full-time equivalent employees at December 31, 2010, compared to 335 and 333 at December 31, 2009 and 2008, respectively.
The following table summarizes our noninterest expense for the years ended December 31.
|
Years Ended
|
Change from Prior Year
|
|||||||||||||||||||||||||||
|
2010/09
|
2009/08
|
|||||||||||||||||||||||||||
|
(Dollars in thousands)
|
2010
|
2009
|
2008
|
Amount
|
Percent
|
Amount
|
Percent
|
|||||||||||||||||||||
|
Salaries and wages
|
$ | 17,477 | $ | 18,488 | $ | 18,426 | $ | (1,011 | ) | (5.5 | )% | $ | 62 | 0.3 | % | |||||||||||||
|
Employee benefits
|
3,829 | 4,631 | 4,895 | (802 | ) | (17.3 | ) | (264 | ) | (5.4 | ) | |||||||||||||||||
|
Occupancy expense
|
2,328 | 2,324 | 2,179 | 4 | 0.2 | 145 | 6.7 | |||||||||||||||||||||
|
Furniture and equipment expense
|
1,200 | 1,183 | 1,185 | 17 | 1.4 | (2 | ) | (0.2 | ) | |||||||||||||||||||
|
Data processing
|
2,607 | 2,463 | 2,323 | 144 | 5.8 | 140 | 6.0 | |||||||||||||||||||||
|
Directors’ fees
|
412 | 478 | 558 | (66 | ) | (13.8 | ) | (80 | ) | (14.3 | ) | |||||||||||||||||
|
Goodwill and other intangible assets impairment
|
3,051 | - | - | 3,051 | - | - | - | |||||||||||||||||||||
|
Amortization of intangible assets
|
515 | 515 | 515 | - | - | - | - | |||||||||||||||||||||
|
Insurance agency commissions expense
|
1,569 | 1,913 | 2,248 | (344 | ) | (18.0 | ) | (335 | ) | (14.9 | ) | |||||||||||||||||
|
FDIC insurance premium expense
|
1,834 | 2,078 | 356 | (244 | ) | (11.7 | ) | 1,722 | 483.7 | |||||||||||||||||||
|
Other noninterest expense
|
6,898 | 6,175 | 5,685 | 723 | 11.7 | 490 | 8.6 | |||||||||||||||||||||
|
Total
|
$ | 41,720 | $ | 40,248 | $ | 38,370 | $ | 1,472 | 3.7 | $ | 1,878 | 4.9 | ||||||||||||||||
Income Taxes
The Company reported an income tax benefit of $492 thousand for 2010, compared to an income tax expense of $4.4 million and $7.1 million for 2009 and 2008, respectively. The effective tax rate was a 22.8% benefit for 2010 and a 37.8% and 38.2% expense for 2009 and 2008, respectively. The tax benefit rate for 2010 reflected that $1.5 million of the goodwill impairment charge was not tax deductible. The effective tax rate decreased in 2009 mainly because the Company’s federal income tax rate was 34.2% compared to 35.0% for 2008.
REVIEW OF FINANCIAL CONDITION
Asset and liability composition, asset quality, capital resources, liquidity, market risk and interest sensitivity are all factors that affect our financial condition.
Assets
Total assets decreased 2.3% from $1.157 billion at December 31, 2009 to $1.130 billion at December 31, 2010. Total assets increased 10.7% from the end of 2008 to the end of 2009. Average total assets for the year ended December 31, 2010 were $1.137 billion, slightly higher than the $1.129 billion for 2009. Average total assets increased 11.7% in 2009 over 2008. The loan portfolio is the primary source of our income, and it represented 84.9%, 85.5% and 87.8% of average earning assets for 2010, 2009 and 2008, respectively.
Funding for loans is provided primarily by core deposits. Additional funding is obtained through short-term and long-term borrowings. Average total deposits increased 3.2% to $980.3 million at December 31, 2010, compared to a 16.4% increase for 2009. Deposits provided funding for approximately 91.8%, 88.9% and 85.5% of average earning assets for 2010, 2009 and 2008, respectively.
The following table sets forth the average balance of the components of average earning assets as a percentage of total average earning assets for the year ended December 31.
|
2010
|
2009
|
2008
|
2007
|
2006
|
||||||||||||||||
|
Loans
|
84.9 | % | 85.5 | % | 87.8 | % | 81.6 | % | 79.6 | % | ||||||||||
|
Investment securities
|
10.0 | 8.6 | 10.1 | 14.1 | 14.8 | |||||||||||||||
|
Federal funds sold
|
3.7 | 5.6 | 1.7 | 2.4 | 3.4 | |||||||||||||||
|
Interest-bearing deposits with other banks
|
1.4 | 0.3 | 0.4 | 1.9 | 2.2 | |||||||||||||||
| 100.0 | % | 100.0 | % | 100.0 | % | 100.0 | % | 100.0 | % | |||||||||||
27
Interest-Bearing Deposits With Other Banks and Federal Funds Sold
We invest excess cash balances (i.e., the excess cash remaining after funding loans and investing in securities with deposits and borrowings) in interest-bearing accounts and federal funds sold offered by our correspondent banks. These liquid investments are maintained at a level necessary to meet immediate liquidity needs. Average interest-bearing deposits with other banks and federal funds sold decreased $8.3 million to $54.3 million for the year ended December 31, 2010, compared to an increase of $42.5 million in 2009. The fluctuations in these accounts reflected that there was less excess cash in 2010 than in 2009.
Investment Securities
The investment portfolio is structured to provide us with liquidity and also plays an important role in the overall management of interest rate risk. Investment securities available for sale are stated at estimated fair value based on quoted market prices. They represent securities which may be sold as part of the asset/liability management strategy or which may be sold in response to changing interest rates. Net unrealized holding gains and losses on these securities are reported net of related income taxes as accumulated other comprehensive income, a separate component of stockholders’ equity. Investment securities in the held to maturity category are stated at cost adjusted for amortization of premiums and accretion of discounts. We have the intent
and current ability to hold such securities until maturity. At December 31, 2010, 94% of the portfolio was classified as available for sale and 6% as held to maturity, compared to 92% and 8%, respectively, at December 31, 2009 and 88% and 12%, respectively, at December 31, 2008. The percentage of securities designated as available for sale reflects the amount needed to support our anticipated growth and liquidity needs. With the exception of municipal securities, our general practice is to classify all newly purchased securities as available for sale.
Investment securities available for sale increased $1.5 million, or 1.5%, in 2010, totaling $99.1 million at December 31, 2010, compared to $97.6 million at December 31, 2009. In 2009, investment securities available for sale increased $21.7 million, or 28.6%. The fluctuations in investment securities available for sale reflected that purchases were slightly more than maturities in 2010 but purchases were considerably more than maturities in 2009.
Investment securities held to maturity, consisting primarily of tax-exempt municipal bonds, totaled $6.7 million at December 31, 2010, compared to $8.9 million at December 31, 2009 and $10.3 million at December 31, 2008. There were only maturities and no purchases of investment securities held to maturity during 2010 and more maturities than purchases in 2009. We do not typically invest in structured notes or other derivative securities.
The following table sets forth the maturities and weighted average yields of the bond investment portfolio as of December 31, 2010.
|
1 Year or Less
|
1-5 Years
|
5-10 Years
|
Over 10 Years
|
|||||||||||||||||||||||||||||
|
Carrying
|
Average
|
Carrying
|
Average
|
Carrying
|
Average
|
Carrying
|
Average
|
|||||||||||||||||||||||||
|
(Dollars in thousands)
|
Amount
|
Yield
|
Amount
|
Yield
|
Amount
|
Yield
|
Amount
|
Yield
|
||||||||||||||||||||||||
|
Available for sale:
|
||||||||||||||||||||||||||||||||
|
U.S. Government agencies
|
$ | 10,185 | 3.16 | % | $ | 28,568 | 2.03 | % | $ | 16,996 | 3.68 | % | $ | 3,155 | 4.26 | % | ||||||||||||||||
|
Mortgage-backed securities
|
811 | 3.36 | 10,160 | 4.13 | 7,014 | 3.91 | 21,592 | 3.62 | ||||||||||||||||||||||||
|
Total available for sale
|
$ | 10,996 | 3.18 | $ | 38,728 | 2.57 | $ | 24,010 | 3.75 | $ | 24,747 | 3.70 | ||||||||||||||||||||
|
Held to maturity:
|
||||||||||||||||||||||||||||||||
|
Obligations of states and political subdivisions1
|
$ | 1,163 | 5.12 | % | $ | 3,840 | 5.12 | % | $ | 1,219 | 4.80 | % | $ | 505 | 5.38 | % | ||||||||||||||||
1Yields adjusted to reflect a tax equivalent basis assuming a federal tax rate of 34.0%.
Loans
During 2010, loans declined when compared to the prior year as the ongoing economic recession created fewer loan opportunities and more loan charge offs. Loans, net of unearned income, totaled $895.4 million at December 31, 2010, a decrease of $21.2 million, or 2.3%, from 2009. Loans increased $28.0 million, or 3.2%, in 2009 when compared to 2008. Most of our loans are secured by real estate. Real estate loans are classified as construction, residential or commercial real estate loans. Total real estate loans decreased $8.8 million, or 1.1%, from year-end 2009 to year-end 2010. Construction loans decreased $17.5 million, or 10.8%, during the same period, offsetting the increases in residential and commercial real estate loans. Commercial
loans, which include financial and agricultural loans, decreased $8.8 million, or 9.6%, and consumer loans, a small percentage of the overall loan portfolio, decreased $3.6 million, or 18.0%, from the end of 2009 to the end of 2010. At the end of 2009, real estate loans increased $31.5 million, or 4.1%, commercial loans remained relatively flat and consumer loans decreased $3.6 million or, 15.6%, when compared to the end of 2008. At December 31, 2010, 54.1% of the loan portfolio had fixed interest rates and 45.9% had adjustable interest rates. At December 31, 2010 and 2009, there were no loans held for sale. We do not engage in foreign or subprime lending activities.
28
The table below sets forth trends in the composition of the loan portfolio over the past five years (including net deferred loan fees/costs).
|
December 31,
|
||||||||||||||||||||
|
(Dollars in thousands)
|
2010
|
2009
|
2008
|
2007
|
2006
|
|||||||||||||||
|
Real estate – construction
|
$ | 143,952 | $ | 161,437 | $ | 179,847 | $ | 155,513 | $ | 158,943 | ||||||||||
|
Real estate – residential
|
333,738 | 327,873 | 289,510 | 256,195 | 222,687 | |||||||||||||||
|
Real estate – commercial
|
318,726 | 315,930 | 304,396 | 248,953 | 217,781 | |||||||||||||||
|
Commercial
|
82,787 | 91,783 | 91,644 | 92,258 | 80,186 | |||||||||||||||
|
Consumer
|
16,201 | 19,534 | 23,131 | 23,431 | 20,122 | |||||||||||||||
|
Total
|
$ | 895,404 | $ | 916,557 | $ | 888,528 | $ | 776,350 | $ | 699,719 | ||||||||||
The table below sets forth the maturities and interest rate sensitivity of the loan portfolio at December 31, 2010.
|
(Dollars in thousands)
|
Maturing
within one year
|
Maturing after
one but within
five years
|
Maturing after
five years
|
Total
|
||||||||||||
|
Real estate – construction
|
$ | 115,590 | $ | 23,984 | $ | 4,378 | $ | 143,952 | ||||||||
|
Real estate – residential
|
140,272 | 79,217 | 114,249 | 333,738 | ||||||||||||
|
Real estate – commercial
|
125,998 | 174,954 | 17,774 | 318,726 | ||||||||||||
|
Commercial
|
45,862 | 26,355 | 10,570 | 82,787 | ||||||||||||
|
Consumer
|
8,588 | 6,415 | 1,198 | 16,201 | ||||||||||||
|
Total
|
$ | 436,310 | $ | 310,925 | $ | 148,169 | $ | 895,404 | ||||||||
|
Rate terms:
|
||||||||||||||||
|
Fixed-interest rate loans
|
$ | 201,408 | $ | 241,230 | $ | 42,062 | $ | 484,700 | ||||||||
|
Adjustable-interest rate loans
|
234,902 | 69,695 | 106,107 | 410,704 | ||||||||||||
|
Total
|
$ | 436,310 | $ | 310,925 | $ | 148,169 | $ | 895,404 | ||||||||
Deposits
We use core deposits primarily to fund loans and to purchase investment securities. Average deposits increased $30.7 million, or 3.2%, in 2010, compared to a 16.4% increase in 2009. The majority of the average deposit growth was in money market and savings deposits which increased $40.5 million, or 18.6%. These deposits increased primarily from participation in the Promontory Insured Network Deposits Program (“IND”) during all of 2010. The Company began participation in the IND program during the second quarter of 2009 and the program has a five-year term and a guaranteed minimum funding level of $70 million. Average time deposits (certificates of deposit, $100,000 or more and other time deposits) decreased $22.7 million, or 4.6%, during 2010
mainly due to a reduction in rates to reflect current market conditions and the Company’s liquidity needs. Average time deposits also declined because some of our largest customers are local government municipalities and their deposits have decreased due to reduced tax revenues. Average interest-bearing demand deposits increased $5.5 million, or 4.4%, and noninterest-bearing deposits increased $7.4 million, or 6.6%, during 2010 when compared to 2009.
The majority of average deposit growth during 2009 was from time deposits which increased $73.5 million, or 17.5%, when compared to 2008. Large municipal deposits, expanded levels of FDIC insurance coverage and customers seeking investments with less risk contributed to the increase. Average money market and savings deposits increased $42.7 million, or 24.4%, primarily because the Company began to participate in the IND program. Average interest-bearing demand deposits increased $11.8 million, or 10.4%, and noninterest-bearing deposits increased $6.0 million, or 5.6%, when compared to 2008.
29
The following table sets forth the average balances of deposits and the percentage of each category to total average deposits for the years ended December 31.
|
Average Balances
|
||||||||||||||||||||||||
|
(Dollars in thousands)
|
2010
|
2009
|
2008
|
|||||||||||||||||||||
|
Noninterest-bearing demand
|
$ | 120,871 | 12.3 | % | $ | 113,430 | 11.9 | % | $ | 107,430 | 13.2 | % | ||||||||||||
|
Interest-bearing deposits
|
||||||||||||||||||||||||
|
Demand
|
130,297 | 13.3 | 124,758 | 13.1 | 113,002 | 13.9 | ||||||||||||||||||
|
Money market and savings
|
258,650 | 26.4 | 218,125 | 23.0 | 175,376 | 21.5 | ||||||||||||||||||
|
Certificates of deposit, $100,000 or more
|
256,393 | 26.2 | 258,879 | 27.3 | 193,678 | 23.7 | ||||||||||||||||||
|
Other time deposits
|
214,121 | 21.8 | 234,468 | 24.7 | 226,201 | 27.7 | ||||||||||||||||||
|
Total
|
$ | 980,332 | 100.0 | % | $ | 949,660 | 100.0 | % | $ | 815,687 | 100.0 | % | ||||||||||||
The following table sets forth the maturity ranges of certificates of deposit with balances of $100,000 or more as of December 31, 2010, with most maturing in over three through twelve months.
|
(Dollars in thousands)
|
||||
|
Three months or less
|
$ | 67,896 | ||
|
Over three through 12 months
|
117,323 | |||
|
Over 12 months
|
78,446 | |||
|
Total
|
$ | 263,665 | ||
Short-Term Borrowings
Short-term borrowings generally consist of securities sold under agreements to repurchase and short-term borrowings from the FHLB. Securities sold under agreements to repurchase are issued in conjunction with cash management services for commercial depositors. We also borrow from the FHLB on a short-term basis and occasionally borrow from correspondent banks under federal fund lines of credit arrangements to meet short-term liquidity needs. At December 31, 2010, short-term borrowings included only repurchase agreements. At December 31, 2009, short-term borrowings included repurchase agreements and other short-term borrowings which consisted of $3.4 million drawn on a $10.0 million line of credit with a commercial bank. The Company obtained this line of credit
during the fourth quarter of 2009 and the outstanding balance at the end of 2009 was repaid in February of 2010.
The average balance of short-term borrowings decreased $9.2 million, or 35.9%, in 2010, whereas the balance decreased $22.2 million, or 46.6%, in 2009. The need for short-term borrowings was reduced due to increases in average deposits and fewer funding requirements for loans during 2010 than in 2009. The decrease in average short-term borrowings in 2009 reflected less dependence on short-term borrowings for funding growth than was required in 2008 mainly due to larger increases in average deposits.
The following table sets forth our position with respect to short-term borrowings.
|
2010
|
2009
|
2008
|
||||||||||||||||||||||
|
Interest
|
Interest
|
Interest
|
||||||||||||||||||||||
|
(Dollars in thousands)
|
Balance
|
Rate
|
Balance
|
Rate
|
Balance
|
Rate
|
||||||||||||||||||
|
Average outstanding for the year
|
$ | 16,348 | 0.51 | % | $ | 25,519 | 0.50 | % | $ | 47,765 | 2.40 | % | ||||||||||||
|
Outstanding at year end
|
16,041 | 0.35 | 20,404 | 0.82 | 52,969 | 0.49 | ||||||||||||||||||
|
Maximum outstanding at any month end
|
18,447 | - | 46,270 | - | 73,094 | - | ||||||||||||||||||
Long-Term Debt
We use long-term borrowings to meet longer term liquidity needs, specifically to fund loan growth where deposit growth is not sufficient. Average long-term debt declined $3.5 million during 2010 and $6.8 million during 2009 because deposit growth was sufficient to meet funding needs. All long-term debt at the end of 2010 and 2009 was related to the acquisition of TSGIA. Acquisition-related debt was $932 thousand and $1.4 million at year-end 2010 and 2009, respectively.
Capital Management
Total stockholders’ equity for the Company was $122.5 million at December 31, 2010, 4.1% lower than in the previous year. Stockholders’ equity at December 31, 2009 increased slightly over December 31, 2008. The decrease in stockholders’ equity in 2010 was due primarily to the $1.7 million loss and $2.0 million in dividends paid on shares of the common stock of the Company. The increase in stockholders’ equity in 2009 was due primarily to earnings of $7.3 million reduced by a common stock dividend of $5.4 million. In addition, during 2009 stockholders’ equity increased $1.5 million due to the Warrant issued to the Treasury under the CPP but decreased $1.8 million as a result of dividends paid on the Company’s Series A Preferred Stock issued
under the CPP.
30
In 2010, the Company reduced the quarterly common stock dividend to $0.06 from $0.16 per share. The reduction in dividends was intended primarily to mitigate declines in stockholders’ equity and capital ratios. Even though stockholders’ equity decreased at the end of 2010 when compared to 2009, the Company and the Banks continued to maintain capital at levels in excess of the risk-based capital guidelines adopted by the federal banking agencies, as seen in the table below. At year-end 2010, the Company remained well in excess of regulatory requirements for well capitalized institutions.
We record unrealized holding gains (losses), net of tax, on investment securities available for sale and on cash flow hedging activities as accumulated other comprehensive income (loss), a separate component of stockholders’ equity. At December 31, 2010, the portion of the investment portfolio designated as “available for sale” had net unrealized holding gains, net of tax, of $970 thousand, compared to net unrealized holding gains, net of tax, of $728 thousand at December 31, 2009 and net unrealized holding gains, net of tax, of $1.4 million at December 31, 2008. There were $2.8 million, $568 thousand and $0 in net unrealized holding losses on cash flow hedging activities at the end of 2010, 2009 and 2008, respectively. See Note 20 to the Consolidated Financial
Statements for further information on hedging activities.
The following table compares the Company’s capital ratios as of December 31 to the minimum regulatory requirements.
|
Minimum
Regulatory
|
||||||||||||||||
|
(Dollars in thousands)
|
2010
|
2009
|
2008
|
Requirements
|
||||||||||||
|
Tier 1 capital
|
$ | 105,808 | $ | 106,391 | $ | 104,117 | ||||||||||
|
Tier 2 capital
|
11,249 | 10,537 | 9,755 | |||||||||||||
|
Total risk-based capital
|
117,057 | 116,928 | 113,872 | |||||||||||||
|
Net risk-weighted assets
|
895,581 | 928,933 | 894,024 | |||||||||||||
|
Adjusted average total assets
|
1,109,999 | 1,148,077 | 1,013,815 | |||||||||||||
|
Risk-based capital ratios:
|
||||||||||||||||
|
Tier 1
|
11.81 | % | 11.45 | % | 11.65 | % | 4.0 | % | ||||||||
|
Total capital
|
13.07 | 12.59 | 12.74 | 8.0 | ||||||||||||
|
Tier 1 leverage ratio
|
9.53 | 9.27 | 10.27 | 4.0 | ||||||||||||
See Note 17 to the Consolidated Financial Statements for further information about the regulatory capital positions of the Company and the Banks.
Provision for Credit Losses and Risk Management
Originating loans involves a degree of risk that credit losses will occur in varying amounts according to, among other factors, the types of loans being made, the credit-worthiness of the borrowers over the term of the loans, the quality of the collateral for the loan, if any, as well as general economic conditions. The Company’s Board of Directors demands accountability of management, keeping the interests of shareholders in focus. Through the Banks’ Asset/Liability Management Committees and the Company’s Audit Committee, the Board actively reviews critical risk positions, including credit, market, liquidity and operational risk. The Company’s goal in managing risk is to reduce earnings volatility, control exposure to unnecessary risk, and ensure
appropriate returns for risk assumed. Senior members of management actively manage risk at the product level, supplemented with corporate level oversight through the Asset/Liability Management Committee and internal audit function. The risk management structure is designed to identify risk issues through a systematic process, enabling timely and appropriate action to avoid and mitigate risk.
Credit risk is mitigated through loan portfolio diversification, limiting exposure to any single industry or customer, collateral protection and standard lending policies and underwriting criteria. The following discussion provides information and statistics on the overall quality of the Company’s loan portfolio. Note 1 to the Consolidated Financial Statements describes the accounting policies related to nonperforming loans (loans on nonaccrual or delinquent 90 days or more and troubled debt restructurings) and charge-offs and describes the methodologies used to develop the allowance for credit losses, including the specific, formula and nonspecific components (also discussed below). Management believes the policies governing nonperforming loans and charge-offs are
consistent with regulatory standards. The amount of the allowance for credit losses and the resulting provision are reviewed monthly by senior members of management and approved quarterly by the Board of Directors.
The allowance is increased by provisions for credit losses charged to expense and recoveries of loans previously charged-off. It is decreased by loans charged-off in the current period. Loans, or portions thereof, are charged off when considered uncollectible. Provisions for credit losses are made to bring the allowance for credit losses within the range of balances that are considered appropriate based upon the allowance methodology and to reflect losses within the loan portfolio as of the balance sheet date.
31
The adequacy of the allowance for credit losses is determined based on management’s estimate of the inherent risks associated with lending activities, estimated fair value of collateral, past experience and present indicators such as loan delinquency trends, nonaccrual loans and current market conditions. Management believes the allowance is adequate; however, future changes in the composition of the loan portfolio and financial condition of borrowers may result in additions to the allowance. Examination of the portfolio and allowance by various regulatory agencies and consultants engaged by the Company may result in the need for additional provisions based upon information available at the time of the examination. Each of the Banks maintains a separate allowance for credit
losses, which is only available to absorb losses from their respective loan portfolios. The allowance set by each of the Banks is subject to regulatory examination and determination as to its adequacy.
The allowance for credit losses is comprised of three parts: the specific allowance, the formula allowance and the nonspecific allowance. The specific allowance is established against impaired loans until charge offs are made. The formula allowance is determined based on management’s assessment of industry trends and economic factors in the markets in which we operate. The determination of the formula allowance involves a higher risk of uncertainty and considers current risk factors that may not have yet manifested themselves in our historical loss factors. The nonspecific allowance captures losses that have impacted the portfolio but have yet to be recognized in either the specific or formula allowance.
The specific allowance is used to individually allocate an allowance to loans identified as impaired. An impaired loan may show deficiencies in the borrower’s overall financial condition, payment history, support available from financial guarantors and/or the fair market value of collateral. If it is determined that there is a loss associated with an impaired loan, a specific allowance is established until a charge off is made. Impaired loans, or portions thereof, are charged off when deemed uncollectible.
The formula allowance is used to estimate the loss on internally risk-rated loans, exclusive of those identified as impaired. Loans that are identified as special mention, substandard and doubtful are adversely rated. These loans are assigned higher allowance factors than favorably rated loans due to management’s concerns regarding collectability or management’s knowledge of particular elements regarding the borrower. Loans that are favorably rated are grouped by type (commercial real estate and construction, residential real estate, commercial or consumer). Each loan type is assigned an allowance factor based on management’s estimate of the risk, complexity and size of individual loans within a particular
category.
The nonspecific allowance is used to estimate the loss on loans stemming from more global factors such as delinquencies, loss history, trends in volume and terms of loans, effects of changes in lending policy, the experience and depth of management, national and local economic trends, concentrations of credit, the quality of the loan review system and the effect of external factors such as competition and regulatory requirements.
The economic recession began to materially impact our performance in the second half of 2009 and throughout 2010. Because most of our loans are secured by real estate, our credit quality issues grew as property values and real estate sales declined in our market. These credit quality issues have resulted in higher provisions for credit losses, loan charge-offs and nonperforming assets.
At December 31, 2010, the allowance for credit losses was $14.2 million, or 1.57% of average outstanding loans and 39% of total nonaccrual loans. This compares to an allowance of $10.9 million, or 1.19% of average outstanding loans and 67% of nonaccrual loans, at December 31, 2009, and an allowance of $9.3 million, or 1.11% of average outstanding loans and 115% of nonaccrual loans, at December 31, 2008. The ratio of net charge-offs to average loans was 1.96% in 2010, 0.81% in 2009 and 0.19% in 2008.
The allowance for credit losses as a percentage of nonaccrual loans has declined in each of the last three years as a result of the increased volume of nonaccrual loans. The majority of the Company’s nonaccrual loans are real estate secured and at the time the loan is determined to be impaired the uncollectible portion is charged-off. At December 31, 2010, nonaccrual loans were reduced by partial charge-offs totaling $8.3 million, or 18.6%, of the unpaid principal balance.
32
The provision for credit losses was $21.1 million for 2010, compared to $9.0 million and $3.3 million for 2009 and 2008, respectively. Net loan charge-offs totaled $17.8 million in 2010, $7.4 million in 2009 and $1.6 million in 2008. Construction loans had the largest amount of charge offs in 2010. These losses primarily related to two significant construction loan relationships described below in the discussion relating to nonaccrual loans. As management identifies problem loans, losses are quantified and minimized, and loan workouts are pursued concluding in either mutually acceptable resolutions or disposal of the problem loans.
The following table sets forth a summary of our loan loss experience for the years ended December 31.
|
(Dollars in thousands)
|
2010
|
2009
|
2008
|
2007
|
2006
|
|||||||||||||||
|
Balance, beginning of year
|
$ | 10,876 | $ | 9,320 | $ | 7,551 | $ | 6,300 | $ | 5,236 | ||||||||||
|
Loans charged off
|
||||||||||||||||||||
|
Real estate – construction
|
(7,910 | ) | (674 | ) | (536 | ) | - | - | ||||||||||||
|
Real estate – residential
|
(5,818 | ) | (2,621 | ) | (316 | ) | (137 | ) | - | |||||||||||
|
Real estate – commercial
|
(492 | ) | (1,695 | ) | (238 | ) | - | (2 | ) | |||||||||||
|
Commercial
|
(3,710 | ) | (2,304 | ) | (447 | ) | (276 | ) | (539 | ) | ||||||||||
|
Consumer
|
(589 | ) | (417 | ) | (276 | ) | (301 | ) | (137 | ) | ||||||||||
|
Total
|
(18,519 | ) | (7,711 | ) | (1,813 | ) | (714 | ) | (678 | ) | ||||||||||
|
Recoveries
|
||||||||||||||||||||
|
Real estate – construction
|
14 | 2 | - | - | - | |||||||||||||||
|
Real estate – residential
|
215 | 70 | 19 | - | - | |||||||||||||||
|
Real estate – commercial
|
108 | 6 | - | - | 46 | |||||||||||||||
|
Commercial
|
214 | 66 | 136 | 165 | 123 | |||||||||||||||
|
Consumer
|
200 | 137 | 90 | 76 | 80 | |||||||||||||||
|
Total
|
751 | 281 | 245 | 241 | 249 | |||||||||||||||
|
Net loans charged off
|
(17,768 | ) | (7,430 | ) | (1,568 | ) | (473 | ) | (429 | ) | ||||||||||
|
Provision for credit losses
|
21,119 | 8,986 | 3,337 | 1,724 | 1,493 | |||||||||||||||
|
Balance, end of year
|
$ | 14,227 | $ | 10,876 | $ | 9,320 | $ | 7,551 | $ | 6,300 | ||||||||||
|
Average loans outstanding
|
$ | 906,732 | $ | 913,631 | $ | 837,739 | $ | 728,766 | $ | 664,244 | ||||||||||
|
Percentage of net charge-offs to average loans outstanding during the year
|
1.96 | % | 0.81 | % | 0.19 | % | 0.06 | % | 0.06 | % | ||||||||||
|
Percentage of allowance for credit losses at year end to average loans
|
1.57 | % | 1.19 | % | 1.11 | % | 1.04 | % | 0.95 | % | ||||||||||
33
During 2010, there was no change in the methods or assumptions affecting the allowance methodology. The amount of the provision is determined based on management’s analysis of the portfolio, growth and changes in the condition of credits and their resultant specific loss allocations. Historically, we have experienced the majority of our losses in the commercial loan portfolio, which are typically not secured by real estate. However, beginning in 2008, the Company experienced significantly higher losses on real estate secured loans due to declining real estate values and the economic recession.
As seen in the table below, the unallocated portion of the allowance for credit losses was a fairly small percent of the total allowance with $343 thousand at December 31, 2010, $124 thousand at December 31, 2009 and $216 thousand at December 31, 2008. As stated previously, most of our loans are secured by real estate with the portfolio comprised of 16.1% construction, 37.3% residential real estate and 35.6% commercial real estate at December 31, 2010. That compares to 17.6%, 35.8% and 34.5%, respectively, at December 31, 2009 and 20.2%, 32.6% and 34.3 %, respectively, at December 31, 2008.
The following table sets forth the allocation of the allowance for credit losses and the percentage of loans in each category to total loans for the years ended December 31.
|
2010
|
2009
|
2008
|
2007
|
2006
|
||||||||||||||||||||||||||||||||||||
|
% of
|
% of
|
% of
|
% of
|
% of
|
||||||||||||||||||||||||||||||||||||
|
(Dollars in thousands)
|
Amount
|
Loans
|
Amount
|
Loans
|
Amount
|
Loans
|
Amount
|
Loans
|
Amount
|
Loans
|
||||||||||||||||||||||||||||||
|
Real estate - construction
|
$ | 3,327 | 16.1 | % | $ | 2,630 | 17.6 | % | $ | 2,749 | 20.2 | % | $ | 1,398 | 20.0 | % | $ | 1,229 | 22.7 | % | ||||||||||||||||||||
|
Real estate - residential
|
4,833 | 37.3 | 1,528 | 35.8 | 644 | 32.6 | 538 | 33.0 | 467 | 31.8 | ||||||||||||||||||||||||||||||
|
Real estate - commercial
|
3,665 | 35.6 | 3,947 | 34.5 | 3,357 | 34.3 | 3,537 | 32.1 | 2,808 | 31.1 | ||||||||||||||||||||||||||||||
|
Commercial
|
1,422 | 9.2 | 2,132 | 10.0 | 2,073 | 10.3 | 1,826 | 11.9 | 1,525 | 11.5 | ||||||||||||||||||||||||||||||
|
Consumer
|
637 | 1.8 | 515 | 2.1 | 281 | 2.6 | 252 | 3.0 | 271 | 2.9 | ||||||||||||||||||||||||||||||
|
Unallocated
|
343 | - | 124 | - | 216 | - | - | - | - | - | ||||||||||||||||||||||||||||||
|
Total
|
$ | 14,227 | 100.0 | % | $ | 10,876 | 100.0 | % | $ | 9,320 | 100.0 | % | $ | 7,551 | 100.0 | % | $ | 6,300 | 100.0 | % | ||||||||||||||||||||
34
Nonaccrual loans and loans 90 days past due and still accruing at December 31, 2010, 2009 and 2008 were primarily real estate loans. Total nonaccrual loans increased to 4.05% of total loans at December 31, 2010, compared to 1.78% at December 31, 2009 and 0.91% at December 31, 2008. The increase in nonaccrual loans during 2010 was primarily in real estate loans, specifically in construction loans that related largely to two borrowing relationships. The Company has a $5.0 million participation with a regional bank that is matured. Through December 31, 2009, the customer made all interest payments. During 2010, this loan migrated from 90 days past due to nonaccrual and $745 thousand was subsequently charged off. Also during 2010, a second significant
construction loan relationship totaling approximately $14.0 million was put on nonaccrual and $6.4 million was subsequently charged off. Loans 90 days past due and still accruing were $4.7 million, $7.4 million and $1.4 million at year-end 2010, 2009 and 2008, respectively. At the end of 2010, nonaccrual loans and loans 90 days past due and still accruing included troubled debt restructurings of $3.1 million and $194 thousand, respectively. Management believes nonaccrual loans and loans 90 days past due and still accruing have been adequately provided for in the allowance for credit losses.
The following table summarizes our nonperforming and past due assets as of December 31.
|
(Dollars in thousands)
|
2010
|
2009
|
2008
|
2007
|
2006
|
|||||||||||||||
|
Nonperforming assets
|
||||||||||||||||||||
|
Nonaccrual loans
|
||||||||||||||||||||
|
Real estate – construction
|
$ | 17,261 | $ | 7,163 | $ | 5,277 | $ | 1,668 | $ | - | ||||||||||
|
Real estate – residential
|
9,969 | 4,246 | 1,015 | 876 | 158 | |||||||||||||||
|
Real estate – commercial
|
5,133 | 2,828 | 1,682 | 877 | 5,819 | |||||||||||||||
|
Commercial
|
3,845 | 2,028 | 137 | 114 | 1,673 | |||||||||||||||
|
Consumer
|
30 | 37 | 4 | 5 | 8 | |||||||||||||||
|
Total nonaccrual loans
|
36,238 | 16,302 | 8,115 | 3,540 | 7,658 | |||||||||||||||
|
Other real estate and other assets owned
|
3,702 | 2,572 | 148 | 176 | 398 | |||||||||||||||
|
Total nonperforming assets
|
39,940 | 18,874 | 8,263 | 3,716 | 8,056 | |||||||||||||||
|
Loans 90 days past due and still accruing
|
||||||||||||||||||||
|
Real estate – construction
|
- | 5,096 | 64 | 637 | - | |||||||||||||||
|
Real estate – residential
|
3,454 | 2,274 | 583 | 473 | 352 | |||||||||||||||
|
Real estate – commercial
|
986 | - | 726 | 137 | 256 | |||||||||||||||
|
Commercial
|
174 | - | 3 | 337 | 18 | |||||||||||||||
|
Consumer
|
88 | 55 | 5 | 22 | 15 | |||||||||||||||
|
Total loans 90 days past due
|
4,702 | 7,425 | 1,381 | 1,606 | 641 | |||||||||||||||
|
Total nonperforming assets and past due loans
|
$ | 44,642 | $ | 26,299 | $ | 9,644 | $ | 5,322 | $ | 8,697 | ||||||||||
|
Nonaccrual loans to total loans at period end
|
4.05 | % | 1.78 | % | 0.91 | % | 0.46 | % | 1.09 | % | ||||||||||
|
Nonperforming assets to total loans and other real estate and other assets owned
|
4.44 | % | 2.05 | % | 0.93 | % | 0.48 | % | 1.15 | % | ||||||||||
|
Nonperforming assets to total assets
|
3.53 | % | 1.63 | % | 0.79 | % | 0.39 | % | 0.85 | % | ||||||||||
|
Nonperforming assets and past due loans, to total loans and other real estate and other assets owned
|
4.97 | % | 2.86 | % | 1.09 | % | 0.69 | % | 1.24 | % | ||||||||||
|
Nonperforming assets and past due loans to total assets
|
3.95 | % | 2.27 | % | 0.92 | % | 0.56 | % | 0.92 | % | ||||||||||
Market Risk Management
Market risk is the risk of loss arising from adverse changes in the fair value of financial instruments due to changes in interest rates, exchange rates or equity pricing. Our principal market risk is interest rate risk that arises from our lending, investing and deposit taking activities. Our profitability is largely dependent on the Banks’ net interest income. Interest rate risk can significantly affect net interest income to the degree that interest-bearing liabilities mature or reprice at different intervals than interest-earning assets. The Banks’ Asset/Liability Management Committees oversee the management of interest rate risk. The primary purpose of these committees is to manage the exposure of net interest margins to unexpected changes
due to interest rate fluctuations. These efforts affect our loan pricing and deposit rate policies as well as asset mix, volume guidelines, and liquidity and capital planning.
During 2009, the Company began using derivative instruments to hedge its exposure to changes in interest rates. The Company does not use derivatives for any trading or other speculative purposes. See Note 20 to the Consolidated Financial Statements for further information on hedging activities.
35
Because we are not exposed to market risk from trading activities and do not utilize off-balance sheet management strategies, the Asset/Liability Management Committees of the Banks rely on “gap” analysis as its primary tool in managing interest rate risk. Gap analysis summarizes the amount of interest sensitive assets and liabilities, which will reprice over various time intervals. The excess between the volume of assets and liabilities repricing in each interval is the interest sensitivity “gap”. “Positive gap” occurs when more assets reprice in a given time interval, while “negative gap” occurs when more liabilities reprice. As of December 31, 2010, we had an overall negative gap position within the one-year repricing
interval because the interest sensitive liabilities exceeded the interest sensitive assets within the one-year repricing interval by $37.0 million, or 3.3% of total assets. The negative gap position within the one-year interval at December 31, 2009 totaled $150.8 million, or 13.0% of total assets. The $113.8 million decrease in the one-year negative gap for 2010 when compared to 2009 was primarily due to fewer time deposits in the one-year interval gap at the end of 2010 than at the end of 2009. The negative gap position within the one-year interval at December 31, 2008, totaled $101.3 million, or 9.7% of total assets.
The following table summarizes our interest sensitivity at December 31, 2010. Loans, federal funds sold, time deposits and short-term borrowings are classified based on contractual maturities if fixed rate or earliest repricing date if variable rate. Investment securities are classified by contractual maturities or, if they have call provisions, by the most likely repricing date.
|
3 Months
|
1 Year
|
3 Years
|
Non-
|
|||||||||||||||||||||||||
|
Within
|
through
|
through
|
through
|
After
|
Sensitive
|
|||||||||||||||||||||||
|
December 31, 2010
|
3 Months
|
12 Months
|
3 Years
|
5 Years
|
5 Years
|
Funds
|
Total
|
|||||||||||||||||||||
|
(Dollars in thousands)
|
||||||||||||||||||||||||||||
|
ASSETS
|
||||||||||||||||||||||||||||
|
Loans, net
|
$ | 426,288 | $ | 129,594 | $ | 189,507 | $ | 101,368 | $ | 48,647 | $ | (14,227 | ) | $ | 881,177 | |||||||||||||
|
Investment securities
|
25,808 | 18,889 | 15,181 | 13,446 | 31,884 | 574 | 105,782 | |||||||||||||||||||||
|
Federal funds sold
|
36,691 | - | - | - | - | - | 36,691 | |||||||||||||||||||||
|
Interest-bearing deposits with other banks
|
21,593 | - | - | - | - | - | 21,593 | |||||||||||||||||||||
|
Other assets
|
- | - | - | - | - | 85,068 | 85,068 | |||||||||||||||||||||
|
Total assets
|
510,380 | 148,483 | 204,688 | 114,814 | 80,531 | 71,415 | 1,130,311 | |||||||||||||||||||||
|
LIABILITIES
|
||||||||||||||||||||||||||||
|
Noninterest-bearing demand deposits
|
- | - | - | - | - | 124,188 | 124,188 | |||||||||||||||||||||
|
Interest-bearing demand deposits
|
128,426 | - | - | - | - | - | 128,426 | |||||||||||||||||||||
|
Money market and savings deposits
|
255,515 | - | - | - | - | - | 255,515 | |||||||||||||||||||||
|
Certificates of deposit, $100,000 or more
|
67,896 | 117,323 | 43,380 | 35,066 | - | - | 263,665 | |||||||||||||||||||||
|
Other time deposits
|
30,457 | 79,685 | 66,252 | 31,317 | 11 | - | 207,722 | |||||||||||||||||||||
|
Short-term borrowings
|
16,041 | - | - | - | - | - | 16,041 | |||||||||||||||||||||
|
Long-term debt
|
- | 477 | 455 | - | - | - | 932 | |||||||||||||||||||||
|
Other liabilities
|
- | - | - | - | - | 11,309 | 11,309 | |||||||||||||||||||||
|
STOCKHOLDERS’ EQUITY
|
- | - | - | - | - | 122,513 | 122,513 | |||||||||||||||||||||
|
Total Liabilities and Stockholders’ Equity
|
498,335 | 197,485 | 110,087 | 66,383 | 11 | 258,010 | 1,130,311 | |||||||||||||||||||||
|
Excess (deficit)
|
$ | 12,045 | $ | (49,002 | ) | $ | 94,601 | $ | 48,431 | $ | 80,520 | $ | (186,595 | ) | $ | - | ||||||||||||
|
Cumulative excess (deficit)
|
$ | 12,045 | $ | (36,957 | ) | $ | 57,644 | $ | 106,075 | $ | 186,595 | $ | - | $ | - | |||||||||||||
|
Cumulative excess (deficit) as percent of total assets
|
1.1 | % | (3.3 | )% | 5.1 | % | 9.4 | % | 16.5 | % | - | % | - | % | ||||||||||||||
36
In addition to gap analysis, the Banks utilize simulation models to quantify the effect a hypothetical immediate plus or minus 300 basis point change in rates would have on their net interest income and the fair value of capital. The model takes into consideration the effect of call features of investment securities as well as prepayments of loans in periods of declining rates. When actual changes in interest rates occur, the changes in interest-earning assets and interest-bearing liabilities may differ from the assumptions used in the model. The chart below provides the sensitivity profiles for net interest income and the fair value of capital as of year-end 2010 and 2009. As of December 31, 2010 and 2009, due to the low interest-rate environment, we believe the results of the minus 300 basis point
change in rates are not meaningful.
|
Immediate Change in Rates
|
||||||||||||||||||||||||
|
-300
|
-200
|
-100
|
+100
|
+200
|
+300
|
|||||||||||||||||||
|
Basis Points
|
Basis Points
|
Basis Points
|
Basis Points
|
Basis Points
|
Basis Points
|
|||||||||||||||||||
|
2010
|
||||||||||||||||||||||||
|
% Change in Net Interest Income
|
N/A | (3.95 | )% | 0.88 | % | 1.10 | % | 3.21 | % | 7.89 | % | |||||||||||||
|
% Change in Value of Capital
|
N/A | 8.39 | % | 3.87 | % | 4.38 | % | 7.40 | % | 9.34 | % | |||||||||||||
|
2009
|
||||||||||||||||||||||||
|
% Change in Net Interest Income
|
N/A | (12.81 | )% | (1.35 | )% | 2.69 | % | 4.98 | % | 7.31 | % | |||||||||||||
|
% Change in Value of Capital
|
N/A | 3.34 | % | 0.19 | % | 3.25 | % | 6.26 | % | 8.33 | % | |||||||||||||
Off-Balance Sheet Arrangements
In the normal course of business, to meet the financing needs of its customers, the Banks are parties to financial instruments with off-balance sheet risk. These financial instruments include commitments to extend credit and standby letters of credit. The Banks’ exposure to credit loss in the event of nonperformance by the other party to these financial instruments is represented by the contractual amount of the instruments. The Banks use the same credit policies in making commitments and conditional obligations as they use for on-balance sheet instruments. The Banks generally require collateral or other security to support the financial instruments with credit risk. The amount of collateral or other security is determined based on management’s
credit evaluation of the counterparty. The Banks evaluate each customer’s creditworthiness on a case-by-case basis.
Commitments to extend credit are agreements to lend to a customer as long as there is no violation of any condition established in the contract. Letters of credit are conditional commitments issued by the Banks to guarantee the performance of a customer to a third party. Letters of credit and other commitments generally have fixed expiration dates or other termination clauses and may require payment of a fee. Because many of the letters of credit and commitments are expected to expire without being drawn upon, the total commitment amount does not necessarily represent future cash requirements. Further information about these arrangements is provided in Note 21 to the Consolidated Financial Statements.
Management does not believe that any of the foregoing arrangements have or are reasonably likely to have a current or future effect on our financial condition, revenues or expenses, results of operations, liquidity, capital expenditures or capital resources that is material to investors.
Liquidity Management
Liquidity describes our ability to meet financial obligations that arise during the normal course of business. Liquidity is primarily needed to meet the borrowing and deposit withdrawal requirements of customers and to fund current and planned expenditures. Liquidity is derived through increased customer deposits, maturities in the investment portfolio, loan repayments and income from earning assets. To the extent that deposits are not adequate to fund customer loan demand, liquidity needs can be met in the short-term funds markets. We have arrangements with correspondent banks whereby we have $24.5 million available in federal funds lines of credit and a reverse repurchase agreement available to meet any short-term needs which may not otherwise be funded by the
Banks’ portfolio of readily marketable investments that can be converted to cash. The Banks are also members of the Federal Home Loan Bank, which provides another source of liquidity. At December 31, 2010, the Banks had credit availability of approximately $29.1 million from the Federal Home Loan Bank. During 2009, through a commercial bank the Company obtained a $10.0 million line of credit which expired in November of 2010.
At December 31, 2010, our loan to deposit ratio was approximately 91.4%, a more liquid position than the 92.5% and 105% at year-end 2009 and 2008, respectively. During 2009, we began participating in the IND program which increased liquidity. Investment securities available for sale totaling $99.1 million at the end of 2010 were available for the management of liquidity and interest rate risk. The comparable amounts were $97.6 million and $75.9 million at December 31, 2009 and 2008, respectively. Cash and cash equivalents were $78.0 million at December 31, 2010, compared to $75.6 million at year-end 2009 and $27.3 million at year-end 2008. Overall, the Company’s liquidity position at the end of 2010 was similar to that at the end of 2009, with both years ending in
a more liquid position than at the end of 2008. Management is not aware of any demands, commitments, events or uncertainties that will materially affect our ability to maintain liquidity at satisfactory levels.
37
We have various financial obligations, including contractual obligations and commitments that may require future cash payments.
The following table presents, as of December 31, 2010, significant fixed and determinable contractual obligations to third parties by payment date.
|
(Dollars in thousands)
|
Within
one year
|
One to
three years
|
Three to
five years
|
Over
five years
|
Total
|
|||||||||||||||
|
Long-term debt
|
$ | 477 | $ | 455 | $ | - | $ | - | $ | 932 | ||||||||||
|
Operating leases
|
717 | 1,019 | 578 | 1,634 | 3,948 | |||||||||||||||
|
Purchase obligations
|
1,732 | 3,410 | 3,139 | 7,682 | 15,963 | |||||||||||||||
|
Total
|
$ | 2,926 | $ | 4,884 | $ | 3,717 | $ | 9,316 | $ | 20,843 | ||||||||||
|
Item 7A.
|
Quantitative and Qualitative Disclosures About Market Risk.
|
The information required by this item may be found in Item 7 of Part II of this report under the caption “Market Risk Management”, which is incorporated herein by reference.
|
Item 8.
|
Financial Statements and Supplementary Data.
|
INDEX TO CONSOLIDATED FINANCIAL STATEMENTS
|
Management’s Report on Internal Control over Financial Reporting
|
39
|
|
|
Report of Independent Registered Public Accounting Firm
|
40
|
|
|
Consolidated Balance Sheets
|
41
|
|
|
Consolidated Statements of (Loss) Income
|
42
|
|
|
Consolidated Statements of Changes in Stockholders’ Equity
|
43
|
|
|
Consolidated Statements of Comprehensive (Loss) Income
|
44
|
|
|
Consolidated Statements of Cash Flows
|
45
|
|
|
Notes to Consolidated Financial Statements
|
47
|
38
MANAGEMENT’S REPORT ON INTERNAL CONTROL OVER FINANCIAL REPORTING
Management of Shore Bancshares, Inc. (the “Company”) is responsible for the preparation, integrity and fair presentation of the consolidated financial statements included in this annual report. The Company’s consolidated financial statements have been prepared in accordance with accounting principles generally accepted in the United States of America and, as such, include some amounts that are based on the best estimates and judgments of management.
The Company’s management is responsible for establishing and maintaining adequate internal control over financial reporting. This internal control system is designed to provide reasonable assurance to management and the Board of Directors regarding the reliability of the Company’s financial reporting and the preparation and presentation of financial statements for external reporting purposes in conformity with accounting principles generally accepted in the United States of America, as well as to safeguard assets from unauthorized use or disposition. The system of internal control over financial reporting is evaluated for effectiveness by management and tested for reliability through a program of internal audit with actions taken to correct potential deficiencies as they are
identified. Because of inherent limitations in any internal control system, no matter how well designed, misstatement due to error or fraud may occur and not be detected, including the possibility of the circumvention or overriding of controls. Accordingly, even an effective internal control system can provide only reasonable assurance with respect to financial statement preparation. Further, because of changes in conditions, internal control effectiveness may vary over time.
Management assessed the effectiveness of the Company’s internal control over financial reporting as of December 31, 2010 based upon criteria set forth in Internal Control – Integrated Framework issued by the Committee of Sponsoring Organizations of the Treadway Commission (COSO).
Based on this assessment and on the foregoing criteria, management has concluded that, as of December 31, 2010, the Company’s internal control over financial reporting is effective. Stegman & Company, the Company’s independent registered public accounting firm that audited the financial statements included in this annual report, has issued a report on the Company’s internal control over financial reporting, which appears on the following page.
March 15, 2011
|
/s/ W. Moorhead Vermilye
|
/s/ Susan E. Leaverton
|
|
|
W. Moorhead Vermilye
|
Susan E. Leaverton, CPA
|
|
|
Chief Executive Officer
|
Principal Accounting Officer
|
39
REPORT OF INDEPENDENT REGISTERED PUBLIC ACCOUNTING FIRM
To the Board of Directors and
Stockholders of Shore Bancshares, Inc.
We have audited the accompanying consolidated balance sheets of Shore Bancshares, Inc. (the “Company”) as of December 31, 2010 and 2009, and the consolidated statements of (loss) income, changes in stockholders’ equity, comprehensive (loss) income and cash flows for each of the years in the three-year period ended December 31, 2010. We also have audited the Company’s internal control over financial reporting as of December 31, 2010, based on criteria established in Internal Control—Integrated Framework issued by the Committee of Sponsoring Organizations of the Treadway Commission (COSO). The Company’s management is responsible for these financial statements, for maintaining effective internal control over
financial reporting, and for its assessment of the effectiveness of internal control over financial reporting, included in the accompanying Management’s Report on Internal Control over Financial Reporting. Our responsibility is to express an opinion on these consolidated financial statements and an opinion on the Company’s internal control over financial reporting based on our audits.
We conducted our audits in accordance with the standards of the Public Company Accounting Oversight Board (United States). Those standards require that we plan and perform the audits to obtain reasonable assurance about whether the financial statements are free of material misstatement and whether effective internal control over financial reporting was maintained in all material respects. Our audits of the consolidated financial statements included examining, on a test basis, evidence supporting the amounts and disclosures in the financial statements, assessing the accounting principles used and significant estimates made by management, and evaluating the overall financial statement presentation. Our audit of internal control over financial reporting included obtaining an
understanding of internal control over financial reporting, assessing the risk that a material weakness exists, and testing and evaluating the design and operating effectiveness of internal control based on the assessed risk. Our audits also included performing such other procedures as we considered necessary in the circumstances. We believe that our audits provide a reasonable basis for our opinions.
A company’s internal control over financial reporting is a process designed to provide reasonable assurance regarding the reliability of financial reporting and the preparation of financial statements for external purposes in accordance with generally accepted accounting principles. A company’s internal control over financial reporting includes those policies and procedures that (1) pertain to the maintenance of records that, in reasonable detail, accurately and fairly reflect the transactions and dispositions of the assets of the company; (2) provide reasonable assurance that transactions are recorded as necessary to permit preparation of financial statements in accordance with generally accepted accounting principles, and that receipts and expenditures of the company are being made only
in accordance with authorizations of management and directors of the company; and (3) provide reasonable assurance regarding prevention or timely detection of unauthorized acquisition, use, or disposition of the company’s assets that could have a material effect on the financial statements.
Because of its inherent limitations, internal control over financial reporting may not prevent or detect misstatements. Also, projections of any evaluation of effectiveness to future periods are subject to the risk that controls may become inadequate because of changes in conditions, or that the degree of compliance with the policies or procedures may deteriorate.
In our opinion, the consolidated financial statements referred to above present fairly, in all material respects, the financial position of Shore Bancshares, Inc. as of December 31, 2010 and 2009, and the results of its operations and its cash flows for each of the years in the three-year period ended December 31, 2010 in conformity with accounting principles generally accepted in the United States of America. Also in our opinion, Shore Bancshares, Inc. maintained, in all material respects, effective internal control over financial reporting as of December 31, 2010, based on criteria established in Internal Control—Integrated Framework issued by the Committee of Sponsoring Organizations of the Treadway Commission (COSO).

Baltimore, Maryland
March 15, 2011
40
SHORE BANCSHARES, INC.
CONSOLIDATED BALANCE SHEETS
December 31,
|
(In thousands, except share data)
|
2010
|
2009
|
||||||
|
ASSETS
|
||||||||
|
Cash and due from banks
|
$ | 19,680 | $ | 14,411 | ||||
|
Interest-bearing deposits with other banks
|
21,593 | 598 | ||||||
|
Federal funds sold
|
36,691 | 60,637 | ||||||
|
Investment securities:
|
||||||||
|
Available for sale, at fair value
|
99,055 | 97,595 | ||||||
|
Held to maturity, at amortized cost –fair value of $6,851 (2010) and $9,012 (2009)
|
6,727 | 8,940 | ||||||
|
Loans
|
895,404 | 916,557 | ||||||
|
Less: allowance for credit losses
|
(14,227 | ) | (10,876 | ) | ||||
|
Loans, net
|
881,177 | 905,681 | ||||||
|
Premises and equipment, net
|
14,483 | 14,307 | ||||||
|
Goodwill
|
13,678 | 15,954 | ||||||
|
Other intangible assets, net
|
4,840 | 5,406 | ||||||
|
Other real estate and other assets owned, net
|
3,702 | 2,572 | ||||||
|
Other assets
|
28,685 | 30,415 | ||||||
|
Total assets
|
$ | 1,130,311 | $ | 1,156,516 | ||||
|
LIABILITIES
|
||||||||
|
Deposits:
|
||||||||
|
Noninterest-bearing demand
|
$ | 124,188 | $ | 122,492 | ||||
|
Interest-bearing demand
|
128,426 | 133,946 | ||||||
|
Money market and savings
|
255,515 | 249,793 | ||||||
|
Certificates of deposit, $100,000 or more
|
263,665 | 262,663 | ||||||
|
Other time
|
207,722 | 222,043 | ||||||
|
Total deposits
|
979,516 | 990,937 | ||||||
|
Short-term borrowings
|
16,041 | 20,404 | ||||||
|
Accrued expenses and other liabilities
|
11,309 | 15,936 | ||||||
|
Long-term debt
|
932 | 1,429 | ||||||
|
Total liabilities
|
1,007,798 | 1,028,706 | ||||||
|
STOCKHOLDERS’ EQUITY
|
||||||||
|
Common stock, par value $.01, authorized 35,000,000 shares; shares issued and outstanding–8,443,436 (2010) and 8,418,963 (2009)
|
84 | 84 | ||||||
|
Warrant
|
1,543 | 1,543 | ||||||
|
Additional paid in capital
|
30,242 | 29,872 | ||||||
|
Retained earnings
|
92,458 | 96,151 | ||||||
|
Accumulated other comprehensive (loss) income
|
(1,814 | ) | 160 | |||||
|
Total stockholders’ equity
|
122,513 | 127,810 | ||||||
|
Total liabilities and stockholders’ equity
|
$ | 1,130,311 | $ | 1,156,516 | ||||
The notes to the consolidated financial statements are an integral part of these statements.
41
SHORE BANCSHARES, INC.
CONSOLIDATED STATEMENTS OF (LOSS) INCOME
For the Years Ended December 31,
|
(Dollars in thousands, except per share data)
|
2010
|
2009
|
2008
|
|||||||||
|
INTEREST INCOME
|
||||||||||||
|
Interest and fees on loans
|
$ | 51,962 | $ | 55,209 | $ | 56,866 | ||||||
|
Interest and dividends on investment securities:
|
||||||||||||
|
Taxable
|
3,209 | 3,184 | 3,788 | |||||||||
|
Tax-exempt
|
212 | 301 | 420 | |||||||||
|
Interest on federal funds sold
|
60 | 84 | 308 | |||||||||
|
Interest on deposits with other banks
|
18 | 11 | 92 | |||||||||
|
Total interest income
|
55,461 | 58,789 | 61,474 | |||||||||
|
INTEREST EXPENSE
|
||||||||||||
|
Interest on deposits
|
12,681 | 17,018 | 19,877 | |||||||||
|
Interest on short-term borrowings
|
83 | 127 | 1,147 | |||||||||
|
Interest on long-term debt
|
58 | 266 | 531 | |||||||||
|
Total interest expense
|
12,822 | 17,411 | 21,555 | |||||||||
|
NET INTEREST INCOME
|
42,639 | 41,378 | 39,919 | |||||||||
|
Provision for credit losses
|
21,119 | 8,986 | 3,337 | |||||||||
|
NET INTEREST INCOME AFTER PROVISION FOR CREDIT LOSSES
|
21,520 | 32,392 | 36,582 | |||||||||
|
NONINTEREST INCOME
|
||||||||||||
|
Service charges on deposit accounts
|
3,257 | 3,424 | 3,600 | |||||||||
|
Trust and investment fee income
|
1,503 | 1,100 | 951 | |||||||||
|
Gains (losses) on sales of investment securities
|
- | 49 | (15 | ) | ||||||||
|
Other than temporary impairment of securities
|
- | - | (371 | ) | ||||||||
|
Insurance agency commissions income
|
10,113 | 11,131 | 12,090 | |||||||||
|
Gains on disposals of premises and equipment
|
- | - | 1,247 | |||||||||
|
Loss on sale of investment in unconsolidated subsidiary
|
- | - | (337 | ) | ||||||||
|
Other noninterest income
|
3,168 | 3,837 | 3,185 | |||||||||
|
Total noninterest income
|
18,041 | 19,541 | 20,350 | |||||||||
|
NONINTEREST EXPENSE
|
||||||||||||
|
Salaries and wages
|
17,477 | 18,488 | 18,426 | |||||||||
|
Employee benefits
|
3,829 | 4,631 | 4,895 | |||||||||
|
Occupancy expense
|
2,328 | 2,324 | 2,179 | |||||||||
|
Furniture and equipment expense
|
1,200 | 1,183 | 1,185 | |||||||||
|
Data processing
|
2,607 | 2,463 | 2,323 | |||||||||
|
Directors’ fees
|
412 | 478 | 558 | |||||||||
|
Goodwill and other intangible assets impairment
|
3,051 | - | - | |||||||||
|
Amortization of intangible assets
|
515 | 515 | 515 | |||||||||
|
Insurance agency commissions expense
|
1,569 | 1,913 | 2,248 | |||||||||
|
FDIC insurance premium expense
|
1,834 | 2,078 | 356 | |||||||||
|
Other noninterest expenses
|
6,898 | 6,175 | 5,685 | |||||||||
|
Total noninterest expense
|
41,720 | 40,248 | 38,370 | |||||||||
|
(LOSS) INCOME BEFORE INCOME TAXES
|
(2,159 | ) | 11,685 | 18,562 | ||||||||
|
Income tax (benefit) expense
|
(492 | ) | 4,412 | 7,092 | ||||||||
|
NET (LOSS) INCOME
|
(1,667 | ) | 7,273 | 11,470 | ||||||||
|
Preferred stock dividends and discount accretion
|
- | 1,876 | - | |||||||||
|
Net (loss) income available to common shareholders
|
$ | (1,667 | ) | $ | 5,397 | $ | 11,470 | |||||
|
Basic (loss) earnings per common share
|
$ | (0.20 | ) | $ | 0.64 | $ | 1.37 | |||||
|
Diluted (loss) earnings per common share
|
$ | (0.20 | ) | $ | 0.64 | $ | 1.37 | |||||
|
Cash dividends paid per common share
|
$ | 0.24 | $ | 0.64 | $ | 0.64 | ||||||
The notes to the consolidated financial statements are an integral part of these statements.
42
SHORE BANCSHARES, INC.
CONSOLIDATED STATEMENTS OF CHANGES IN STOCKHOLDERS’ EQUITY
For the Years Ended December 31, 2010, 2009, and 2008
|
(Dollars in thousands, except per share data)
|
Preferred
Stock
|
Common
Stock
|
Warrant
|
Additional
Paid In
Capital
|
Retained
Earnings
|
Accumulated
Other
Comprehensive
Income (Loss)
|
Total
Stockholders’
Equity
|
|||||||||||||||||||||
|
Balances, December 31, 2007
|
$ | - | $ | 84 | $ | - | $ | 29,539 | $ | 90,365 | $ | 247 | $ | 120,235 | ||||||||||||||
|
Adjustment to initially apply EITF Issue 06-4
|
- | - | - | - | (318 | ) | - | (318 | ) | |||||||||||||||||||
|
Comprehensive income:
|
||||||||||||||||||||||||||||
|
Net income
|
- | - | - | - | 11,470 | - | 11,470 | |||||||||||||||||||||
|
Unrealized gains on available-for-sale securities, net of reclassification adjustment, net of taxes
|
- | - | - | - | - | 1,146 | 1,146 | |||||||||||||||||||||
|
Total comprehensive income
|
12,616 | |||||||||||||||||||||||||||
|
Shares issued for employee stock-based awards
|
- | - | - | 138 | - | - | 138 | |||||||||||||||||||||
|
Stock-based compensation expense
|
- | - | - | 91 | - | - | 91 | |||||||||||||||||||||
|
Cash dividends paid ($0.64 per share)
|
- | - | - | - | (5,377 | ) | - | (5,377 | ) | |||||||||||||||||||
|
Balances, December 31, 2008
|
- | 84 | - | 29,768 | 96,140 | 1,393 | 127,385 | |||||||||||||||||||||
|
Comprehensive income:
|
||||||||||||||||||||||||||||
|
Net income
|
- | - | - | - | 7,273 | - | 7,273 | |||||||||||||||||||||
|
Unrealized losses on available-for-sale securities, net of reclassification adjustment, net of taxes
|
- | - | - | - | - | (665 | ) | (665 | ) | |||||||||||||||||||
|
Unrealized losses on cash flow hedging activities, net of taxes
|
- | - | - | - | - | (568 | ) | (568 | ) | |||||||||||||||||||
|
Total comprehensive income
|
6,040 | |||||||||||||||||||||||||||
|
Warrant issued
|
- | - | 1,543 | - | - | - | 1,543 | |||||||||||||||||||||
|
Preferred shares issued pursuant to TARP
|
25,000 | - | - | - | - | - | 25,000 | |||||||||||||||||||||
|
Discount from issuance of preferred stock
|
(1,543 | ) | - | - | - | - | - | (1,543 | ) | |||||||||||||||||||
|
Discount accretion
|
68 | - | - | - | (68 | ) | - | - | ||||||||||||||||||||
|
Redemption of preferred stock
|
(23,525 | ) | - | - | - | - | - | (23,525 | ) | |||||||||||||||||||
|
Shares issued for employee stock-based awards
|
- | - | - | 2 | - | - | 2 | |||||||||||||||||||||
|
Stock-based compensation expense
|
- | - | - | 102 | - | - | 102 | |||||||||||||||||||||
|
Preferred stock dividends
|
- | - | - | - | (1,808 | ) | - | (1,808 | ) | |||||||||||||||||||
|
Cash dividends paid ($0.64 per share)
|
- | - | - | - | (5,386 | ) | - | (5,386 | ) | |||||||||||||||||||
|
Balances, December 31, 2009
|
- | 84 | 1,543 | 29,872 | 96,151 | 160 | 127,810 | |||||||||||||||||||||
|
Comprehensive loss:
|
||||||||||||||||||||||||||||
|
Net loss
|
- | - | - | - | (1,667 | ) | - | (1,667 | ) | |||||||||||||||||||
|
Unrealized gains on available-for-sale securities, net of reclassification adjustment, net of taxes
|
- | - | - | - | - | 242 | 242 | |||||||||||||||||||||
|
Unrealized losses on cash flow hedging activities, net of taxes
|
- | - | - | - | - | (2,216 | ) | (2,216 | ) | |||||||||||||||||||
|
Total comprehensive loss
|
(3,641 | ) | ||||||||||||||||||||||||||
|
Stock-based compensation expense
|
- | - | - | 370 | - | - | 370 | |||||||||||||||||||||
|
Cash dividends paid ($0.24 per share)
|
- | - | - | - | (2,026 | ) | - | (2,026 | ) | |||||||||||||||||||
|
Balances, December 31, 2010
|
$ | - | $ | 84 | $ | 1,543 | $ | 30,242 | $ | 92,458 | $ | (1,814 | ) | $ | 122,513 | |||||||||||||
The notes to the consolidated financial statements are an integral part of these statements.
43
SHORE BANCSHARES, INC.
CONSOLIDATED STATEMENTS OF COMPREHENSIVE (LOSS) INCOME
For the Years Ending December 31,
|
(Dollars in thousands)
|
2010
|
2009
|
2008
|
|||||||||
|
Net (loss) income
|
$ | (1,667 | ) | $ | 7,273 | $ | 11,470 | |||||
|
Other comprehensive (loss) income:
|
||||||||||||
|
Securities available for sale:
|
||||||||||||
|
Unrealized holding gains (losses) on available-for-sale securities
|
406 | (1,061 | ) | 1,525 | ||||||||
|
Tax effect
|
(164 | ) | 425 | (609 | ) | |||||||
|
Reclassification of (gains) losses recognized in net income
|
- | (49 | ) | 386 | ||||||||
|
Tax effect
|
- | 20 | (156 | ) | ||||||||
|
Net of tax amount
|
242 | (665 | ) | 1,146 | ||||||||
|
Cash flow hedging activities:
|
||||||||||||
|
Unrealized holding losses on cash flow hedging activities
|
(3,717 | ) | (952 | ) | - | |||||||
|
Tax effect
|
1,501 | 384 | - | |||||||||
|
Net of tax amount
|
(2,216 | ) | (568 | ) | - | |||||||
|
Total other comprehensive (loss) income
|
(1,974 | ) | (1,233 | ) | 1,146 | |||||||
|
Comprehensive (loss) income
|
$ | (3,641 | ) | $ | 6,040 | $ | 12,616 | |||||
The notes to the consolidated financial statements are an integral part of these statements.
44
SHORE BANCSHARES, INC.
CONSOLIDATED STATEMENTS OF CASH FLOWS
For the Years Ended December 31,
|
(Dollars in thousands)
|
2010
|
2009
|
2008
|
|||||||||
|
CASH FLOWS FROM OPERATING ACTIVITIES:
|
||||||||||||
|
Net (loss) income
|
$ | (1,667 | ) | $ | 7,273 | $ | 11,470 | |||||
|
Adjustments to reconcile net (loss) income to net cash provided by operating activities:
|
||||||||||||
|
Provision for credit losses
|
21,119 | 8,986 | 3,337 | |||||||||
|
Goodwill and other intangibles impairment
|
3,051 | - | - | |||||||||
|
Depreciation and amortization
|
2,405 | 1,880 | 1,784 | |||||||||
|
Discount accretion on debt securities
|
(128 | ) | (226 | ) | (199 | ) | ||||||
|
Stock-based compensation expense
|
390 | 102 | 91 | |||||||||
|
Excess tax benefits from stock-based arrangements
|
(20 | ) | (5 | ) | (4 | ) | ||||||
|
Deferred income taxes
|
(2,905 | ) | (928 | ) | (498 | ) | ||||||
|
(Gains) losses on sales of securities
|
- | (49 | ) | 15 | ||||||||
|
Other than temporary impairment of securities
|
- | - | 371 | |||||||||
|
Gains on disposals of premises and equipment
|
- | - | (1,247 | ) | ||||||||
|
Loss on sale of investment in unconsolidated subsidiary
|
- | - | 337 | |||||||||
|
Losses on sales of other real estate owned
|
78 | 26 | 50 | |||||||||
|
Write-downs of other real estate owned
|
657 | 159 | - | |||||||||
|
Gains on interest rate swaps
|
- | (420 | ) | - | ||||||||
|
Net changes in:
|
||||||||||||
|
Insurance premiums receivable
|
242 | 365 | (265 | ) | ||||||||
|
Accrued interest receivable
|
(256 | ) | (198 | ) | 402 | |||||||
|
Prepaid FDIC premium expense
|
(1,376 | ) | (5,425 | ) | (10 | ) | ||||||
|
Other assets
|
3,650 | (1,481 | ) | (1,673 | ) | |||||||
|
Accrued interest payable
|
(921 | ) | (569 | ) | (443 | ) | ||||||
|
Other liabilities
|
(972 | ) | 689 | 491 | ||||||||
|
Net cash provided by operating activities
|
23,347 | 10,179 | 14,009 | |||||||||
|
CASH FLOWS FROM INVESTING ACTIVITIES:
|
||||||||||||
|
Proceeds from maturities and principal payments of securities available for sale
|
47,945 | 53,668 | 82,063 | |||||||||
|
Proceeds from sales of securities available for sale
|
- | 2,048 | 2 | |||||||||
|
Purchases of securities available for sale
|
(49,626 | ) | (78,376 | ) | (62,551 | ) | ||||||
|
Proceeds from maturities and principal payments of securities held to maturity
|
2,195 | 3,934 | 3,666 | |||||||||
|
Purchases of securities held to maturity
|
- | (2,623 | ) | (1,026 | ) | |||||||
|
Net decrease (increase) in loans
|
264 | (38,190 | ) | (114,033 | ) | |||||||
|
Purchases of premises and equipment
|
(1,292 | ) | (1,553 | ) | (331 | ) | ||||||
|
Proceeds from sales of premises and equipment
|
- | - | 2,773 | |||||||||
|
Proceeds from sales of other real estate owned
|
1,255 | 122 | 264 | |||||||||
|
Purchases of interest rate caps
|
- | (6,475 | ) | - | ||||||||
|
Investment in unconsolidated subsidiary
|
(25 | ) | - | - | ||||||||
|
Proceeds from sale of investment in unconsolidated subsidiary
|
- | - | 600 | |||||||||
|
Net cash provided (used) by investing activities
|
716 | (67,445 | ) | (88,573 | ) | |||||||
|
CASH FLOWS FROM FINANCING ACTIVITIES
|
||||||||||||
|
Net increase (decrease) in demand, money market and savings deposits
|
1,898 | 127,319 | (10,688 | ) | ||||||||
|
Net (decrease) increase in certificates of deposit
|
(13,320 | ) | 18,247 | 90,163 | ||||||||
|
Excess tax benefits from stock-based arrangements
|
20 | 5 | 4 | |||||||||
|
Net (decrease) increase in short-term borrowings
|
(4,363 | ) | (32,565 | ) | 5,276 | |||||||
|
Proceeds from issuance of long-term debt
|
- | - | 3,000 | |||||||||
|
Repayment of long-term debt
|
(497 | ) | (6,518 | ) | (7,538 | ) | ||||||
|
Net (payment) receipt of counterparty collateral – interest rate caps
|
(3,457 | ) | 4,847 | - | ||||||||
|
Proceeds from issuance of preferred stock and warrant
|
- | 25,000 | - | |||||||||
|
Redemption of preferred stock
|
- | (23,525 | ) | - | ||||||||
|
Proceeds from issuance of common stock
|
- | 2 | 138 | |||||||||
|
Preferred stock dividends paid
|
- | (1,808 | ) | - | ||||||||
|
Common stock dividends paid
|
(2,026 | ) | (5,386 | ) | (5,377 | ) | ||||||
|
Net cash (used) provided by financing activities
|
(21,745 | ) | 105,618 | 74,978 | ||||||||
45
SHORE BANCSHARES, INC.
CONSOLIDATED STATEMENTS OF CASH FLOWS (CONTINUED)
For the Years Ended December 31,
|
(Dollars in thousands)
|
2010
|
2009
|
2008
|
|||||||||
|
NET INCREASE IN CASH AND CASH EQUIVALENTS
|
2,318 | 48,352 | 414 | |||||||||
|
CASH AND CASH EQUIVALENTS AT BEGINNING OF YEAR
|
75,646 | 27,294 | 26,880 | |||||||||
|
CASH AND CASH EQUIVALENTS AT END OF YEAR
|
$ | 77,964 | $ | 75,646 | $ | 27,294 | ||||||
|
Supplemental cash flow information:
|
||||||||||||
|
Interest paid
|
$ | 13,743 | $ | 17,980 | $ | 21,998 | ||||||
|
Income taxes paid
|
$ | 1,193 | $ | 4,975 | $ | 9,704 | ||||||
|
Transfers from loans to other real estate owned
|
$ | 3,140 | $ | 2,731 | $ | 286 | ||||||
The notes to consolidated financial statements are an integral part of these statements.
46
SHORE BANCSHARES, INC.
NOTES TO CONSOLIDATED FINANCIAL STATEMENTS
For the Years Ended December 31, 2010, 2009, and 2008
|
NOTE 1.
|
SUMMARY OF SIGNIFICANT ACCOUNTING POLICIES
|
The consolidated financial statements include the accounts of Shore Bancshares, Inc. and its subsidiaries (collectively referred to in these Notes as the “Company”), with all significant intercompany transactions eliminated. The investments in subsidiaries are recorded on the Company’s books (Parent only) on the basis of its equity in the net assets of the subsidiaries. The accounting and reporting policies of the Company conform to accounting principles generally accepted in the United States of America (“GAAP”). For purposes of comparability, certain reclassifications have been made to amounts previously reported to conform with the current period presentation.
In 2009, the Financial Accounting Standards Board (the “FASB”) established the Accounting Standards Codification (“ASC”) as the source of authoritative accounting principles recognized by the FASB to be applied by non-governmental entities in the preparation of financial statements in conformity with generally accepted accounting principles. Rules and interpretive releases of the U.S. Securities and Exchange Commission (the “SEC”) under authority of federal securities laws are also sources of authoritative guidance for SEC registrants. All guidance contained in the ASC carries an equal level of authority. All non-grandfathered, non-SEC accounting literature not included in the ASC is superseded and deemed non-authoritative. The switch to the ASC affects the way companies refer
to U.S. GAAP in financial statements and accounting policies. Citing particular content in the ASC involves specifying the unique numeric path to the content through the Topic, Subtopic, Section and Paragraph structure.
Nature of Operations
The Company engages in the banking business through CNB, a Maryland trust company with commercial banking powers, and The Talbot Bank of Easton, Maryland, a Maryland commercial bank (“Talbot Bank”). Through December 31, 2010, the Company also engaged in the banking business through The Felton Bank, a Delaware commercial bank (“Felton Bank” and, together with CNB and Talbot Bank, the “Banks”), which was merged into CNB on January 1, 2011. The Company’s primary source of revenue is interest earned on commercial, real estate and consumer loans made to customers located on the Delmarva Peninsula. The Company engages in the insurance business through two general insurance producer firms, The Avon-Dixon Agency, LLC, a Maryland limited liability
company, and Elliott Wilson Insurance, LLC, a Maryland limited liability company; one marine insurance producer firm, Jack Martin & Associates, Inc., a Maryland corporation; three wholesale insurance firms, Tri-State General Insurance Agency, LTD, a Maryland corporation, Tri-State General Insurance Agency of New Jersey, Inc., a New Jersey corporation, and Tri-State General Insurance Agency of Virginia, Inc., a Virginia corporation (collectively, “TSGIA”); and two insurance premium finance companies, Mubell Finance, LLC, a Maryland limited liability company, and ESFS, Inc., a Maryland corporation (all of the foregoing insurance entities are collectively referred to as the “Insurance Subsidiaries”). The Company engages in the mortgage brokerage business under the name “Wye Mortgage Group” through a minority series investment in an unrelated Delaware limited liability company.
Use of Estimates
The preparation of financial statements in conformity with accounting principles generally accepted in the United States of America requires management to make estimates and assumptions that affect the reported amounts of assets and liabilities and the disclosure of contingent assets and liabilities at the date of the financial statements and the reported amounts of revenues and expenses during the reporting period. Actual results could differ from those estimates.
The allowance for credit losses is a material estimate that is particularly susceptible to significant changes in the near term. Management believes that the allowance for credit losses is sufficient to address the probable losses in the current portfolio. While management uses available information to recognize losses on loans, future additions to the allowance may be necessary based on changes in economic conditions. In addition, various regulatory agencies, as an integral part of their examination processes, periodically review the Company’s allowance for credit losses. Such agencies may require the Company to recognize additions to the allowance based on their judgments about information available to them at the time of their examination.
Investment Securities Available for Sale
Investment securities available for sale are stated at estimated fair value based on quoted market prices. They represent those securities which management may sell as part of its asset/liability strategy or which may be sold in response to changing interest rates, changes in prepayment risk or other similar factors. The cost of securities sold is determined by the specific identification method. Purchase premiums and discounts are recognized in interest income using the interest method over the terms of the securities. Net unrealized holding gains and losses on these securities are reported as accumulated other comprehensive income, a separate component of stockholders’ equity, net of related income taxes. Declines in the fair value of individual
available-for-sale securities below their cost that are other than temporary result in write-downs of the individual securities to their fair value and are reflected in earnings as realized losses. Factors affecting the determination of whether an other-than-temporary impairment has occurred include a downgrading of the security by a rating agency, a significant deterioration in the financial condition of the issuer, or that management would have the intent to sell a security or be required to sell a security before recovery of its amortized cost.
47
Investment Securities Held to Maturity
Investment securities held to maturity are stated at cost adjusted for amortization of premiums and accretion of discounts. Purchase premiums and discounts are recognized in interest income using the interest method over the terms of the securities. The Company intends and has the ability to hold such securities until maturity. Declines in the fair value of individual held-to-maturity securities below their cost that are other than temporary result in write-downs of the individual securities to their fair value. Factors affecting the determination of whether an other-than-temporary impairment has occurred include a downgrading of the security by a rating agency, a significant deterioration in the financial condition of the issuer, or that management would have the
intent to sell a security or be required to sell a security before recovery of its amortized cost.
Loans
Loans are stated at their principal amount outstanding net of any deferred fees and costs. Interest income on loans is accrued at the contractual rate based on the principal amount outstanding. Fees charged and costs capitalized for originating loans are being amortized substantially on the interest method over the term of the loan. A loan is placed on nonaccrual when it is specifically determined to be impaired or when principal or interest is delinquent for 90 days or more, unless the loan is well secured and in the process of collection. Any unpaid interest previously accrued on those loans is reversed from income. Interest income generally is not recognized on specific impaired loans unless the likelihood of further loss is remote. Interest
payments received on nonaccrual loans are applied as a reduction of the loan principal balance unless collectability of the principal amount is reasonably assured, in which case interest is recognized on a cash basis. Loans are returned to accrual status when all principal and interest amounts contractually due are brought current and future payments are reasonably assured.
Loans are considered impaired when it is probable that the Company will not collect all principal and interest payments according to the loan’s contractual terms. The impairment of a loan is measured at the present value of expected future cash flows using the loan’s effective interest rate, or at the loan’s observable market price or the fair value of the collateral if the loan is collateral dependent. Generally, the Company measures impairment on such loans by reference to the fair value of the collateral. Income on impaired loans is recognized on a cash basis, and payments are first applied against the principal balance outstanding. Impaired loans do not include groups of smaller balance homogeneous loans such as residential mortgage and consumer installment
loans that are evaluated collectively for impairment. Reserves for probable credit losses related to these loans are based on historical loss ratios and are included in the allowance for credit losses.
A loan is considered a troubled debt restructuring if a concession is granted due to deterioration in the borrower’s financial condition. Troubled debt restructurings may include modifications of original loan terms, receipts of assets in partial or full satisfaction of loans or a combination thereof. The Company does not participate in any specific government or Company sponsored loan modification programs. All restructured loan agreements are contracts negotiated with individual borrowers.
Allowance for Credit Losses
The allowance for credit losses is maintained at a level believed adequate by management to absorb losses inherent in the loan portfolio as of the balance sheet date and is based on the size and current risk characteristics of the loan portfolio, an assessment of individual problem loans and actual loss experience, current economic events in specific industries and geographical areas, including unemployment levels, and other pertinent factors, including regulatory guidance and general economic conditions and other observable data. Determination of the allowance is inherently subjective as it requires significant estimates, including the amounts and timing of expected future cash flows or collateral value of impaired loans, estimated losses on pools of homogeneous loans that are based on historical loss
experience, and consideration of current economic trends, all of which may be susceptible to significant change. Loans, or portions thereof, that are considered uncollectible are charged off against the allowance, while recoveries of amounts previously charged off are credited to the allowance. A provision for credit losses is charged to operations based on management’s periodic evaluation of the factors previously mentioned, as well as other pertinent factors. Evaluations are conducted at least quarterly and more often if deemed necessary.
The allowance for credit losses is an estimate of the losses that may be sustained in the loan portfolio. The allowance is based on two basic principles of accounting: (i) ASC Topic 450, “Contingencies”, which requires that losses be accrued when they are probable of occurring and estimable, and (ii) ASC Topic 310, “Receivables,” which requires that losses be accrued based on the differences between the loan balance and the value of collateral, present value of future cash flows or values that are observable in the secondary market. Management uses many factors, including economic conditions and trends, the value and adequacy of collateral, the volume and mix of the loan portfolio, and our internal loan processes in determining the inherent loss that may be present in
our loan portfolio. Actual losses could differ significantly from management’s estimates. In addition, GAAP itself may change from one previously acceptable method to another. Although the economics of transactions would be the same, the timing of events that would impact the transactions could change.
48
The allowance for credit losses is comprised of three parts: the specific allowance, the formula allowance and the nonspecific allowance. The specific allowance is established against impaired loans until charge offs are made. The formula allowance, described below, is determined based on management’s assessment of industry trends and economic factors in the markets in which we operate. The determination of the formula allowance involves a higher risk of uncertainty and considers current risk factors that may not have yet manifested themselves in our historical loss factors. The nonspecific allowance captures losses that have impacted the portfolio but have yet to be recognized in either the specific or formula allowance.
The formula allowance is used to estimate the loss on internally risk-rated loans, exclusive of those identified as impaired. Loans that are identified as special mention, substandard and doubtful are adversely rated. A special mention loan has potential weaknesses that could result in a future loss to the Company if the weaknesses are realized. A substandard loan has certain deficiencies that could result in a future loss to the Company if these deficiencies are not corrected. A doubtful loan has enough risk that there is a high probability that the Company will sustain a loss. These loans are assigned higher allowance factors than favorably rated loans due to management’s concerns regarding collectability or management’s knowledge of particular
elements regarding the borrower. Loans that are favorably rated are grouped by type (commercial real estate and construction, residential real estate, commercial or consumer). Each loan type is assigned an allowance factor based on management’s estimate of the risk, complexity and size of individual loans within a particular category.
Premises and Equipment
Premises and equipment are stated at cost less accumulated depreciation and amortization. Depreciation and amortization are calculated using the straight-line method over the estimated useful lives of the assets. Useful lives range from three to ten years for furniture, fixtures and equipment; three to five years for computer hardware and data handling equipment; and ten to forty years for buildings and building improvements. Land improvements are amortized over a period of 15 years and leasehold improvements are amortized over the term of the respective lease. Sale-leaseback transactions are considered normal leasebacks and any realized gains are deferred and amortized to other income on a straight-line basis over the initial lease term. Maintenance and
repairs are charged to expense as incurred, while improvements which extend the useful life of an asset are capitalized and depreciated over the estimated remaining life of the asset.
Long-lived assets are evaluated periodically for impairment when events or changes in circumstances indicate the carrying amount may not be recoverable. Impairment exists when the expected undiscounted future cash flows of a long-lived asset are less than its carrying value. In that event, the Company recognizes a loss for the difference between the carrying amount and the estimated fair value of the asset.
Goodwill and Other Intangible Assets
Goodwill represents the excess of the cost of an acquisition over the fair value of the net assets acquired. Other intangible assets represent purchased assets that also lack physical substance but can be distinguished from goodwill because of contractual or other legal rights or because the asset is capable of being sold or exchanged either on its own or in combination with a related contract, asset or liability. Goodwill and other intangible assets with indefinite lives are tested at least annually for impairment, usually during the third quarter, or on an interim basis if circumstances dictate. Intangible assets that have finite lives are amortized over their estimated useful lives and also are subject to impairment testing. The Company’s other intangible
assets that have finite lives are amortized on a straight-line basis over varying periods not exceeding 21 years.
Impairment testing requires that the fair value of each of the Company’s reporting units be compared to the carrying amount of its net assets, including goodwill. The Company’s reporting units were identified based on an analysis of each of its individual operating segments. If the fair value of a reporting unit is less than book value, an expense may be required to write down the related goodwill or purchased intangibles to record an impairment loss.
During the third quarter of 2010, as part of the Company’s annual impairment testing process, goodwill and other intangible assets were tested for impairment and it was determined that there was an impairment. The Company recorded goodwill impairment charges of $3.0 million and other intangible assets impairment charges of $51 thousand. Half of the goodwill impairment charges related to the 2004 acquisition of The Felton Bank and the other half of the goodwill charges and all of the other intangible assets impairment charges related to the 2007 acquisition of TSGIA.
49
Other Real Estate Owned
Other real estate owned represents assets acquired in satisfaction of loans either by foreclosure or deeds taken in lieu of foreclosure. Properties acquired are recorded at the lower of cost or fair value less estimated selling costs at the time of acquisition with any deficiency charged to the allowance for credit losses. Thereafter, costs incurred to operate or carry the properties as well as reductions in value as determined by periodic appraisals are charged to operating expense. Gains and losses resulting from the final disposition of the properties are included in noninterest income.
Short-Term Borrowings
Short-term borrowings are comprised primarily of repurchase agreements. The repurchase agreements are securities sold to the Company’s customers, at the customers’ request, under a continuing “roll-over” contract that matures in one business day. The underlying securities sold are U.S. Government agency securities, which are segregated from the Company’s other investment securities by its safekeeping agents.
Income Taxes
The Company and its subsidiaries file a consolidated federal income tax return. The Company accounts for income taxes using the liability method in accordance with required accounting guidance. Under this method, deferred tax assets and liabilities are determined by applying the applicable federal and state income tax rates to cumulative temporary differences. These temporary differences represent differences between financial statement carrying amounts and the corresponding tax bases of certain assets and liabilities. Deferred taxes result from such temporary differences.
Deferred tax assets and liabilities are recognized for the future tax consequences attributable to differences between the financial statement carrying amounts of existing assets and liabilities and their respective tax bases. Deferred tax assets and liabilities are measured using enacted tax rates expected to apply to taxable income in the years in which those temporary differences are expected to be recovered or settled. The effect on deferred tax assets and liabilities of a change in tax rates is recognized in the period that includes the enactment date. The Company recognizes accrued interest and penalties related to unrecognized tax benefits as a component of tax expense.
Basic and Diluted Earnings Per Common Share
Basic earnings (loss) per share is calculated by dividing net income (loss) available to common stockholders by the weighted-average number of common shares outstanding and does not include the effect of any potentially dilutive common stock equivalents. Diluted earnings (loss) per share is calculated by dividing net income (loss) by the weighted-average number of shares outstanding, adjusted for the dilutive effect of stock-based awards. There is no dilutive effect on the loss per share during loss periods. See Note 16 for further information.
Transfers of Financial Assets
Transfers of financial assets are accounted for as sales, when control over the assets has been surrendered. Control over transferred assets is deemed to be surrendered when (1) the assets have been isolated from the Company, (2) the transferee obtains the right (free of conditions that constrain it from taking advantage of that right) to pledge or exchange the transferred assets, and (3) the Company does not maintain effective control over the transferred assets through an agreement to repurchase them before their maturity.
Statement of Cash Flows
Cash and due from banks, interest-bearing deposits with other banks and federal funds sold are considered “cash and cash equivalents” for financial reporting purposes.
Stock-Based Compensation
Accounting guidance for stock-based compensation requires that expense relating to such transactions be recognized as compensation cost in the income statement. Stock-based compensation expense is recognized ratably over the requisite service period for all awards and is based on the grant date fair value. See Note 13, “Stock-Based Compensation”, in the Notes to Consolidated Financial Statements for a further discussion.
Derivative Instruments and Hedging Activities
Under accounting guidance for derivative instruments and hedging activities, all derivatives are recorded as other assets or other liabilities on the balance sheet at their respective fair values. When the purpose of a derivative is to hedge the variability of a floating rate asset or liability, the derivative is considered a “cash flow” hedge. To account for the effective portion of a cash flow hedge, unrealized gains and losses due to changes in the fair value of the derivative designated as a cash flow hedge are recorded in other comprehensive income. Ineffectiveness resulting from differences between the cash flows of the hedged item and changes in fair value of the derivative is recognized as other noninterest income. The net interest settlement on a
derivative designated as a cash flow hedge is treated as an adjustment of the interest income or interest expense of the hedged asset or liability.
50
Fair Value
The Company measures certain financial assets and liabilities at fair value. Significant financial instruments measured at fair value on a recurring basis are investment securities and interest rate caps. Impaired loans and other real estate and other assets owned are significant financial instruments measured at fair value on a nonrecurring basis.
The Company conducts a review each quarter for all investment securities which reflect possible impairment to determine whether unrealized losses are temporary. Valuations for the investment portfolio are determined using quoted market prices, if available. If quoted prices are not available, fair values are measured using methods such as independent pricing models or quotes for similar investment securities.
See Note 19, “Fair Value Measurements”, in the Notes to Consolidated Financial Statements for a further discussion of fair value.
Advertising Costs
Advertising costs are generally expensed as incurred. The Company incurred advertising costs of approximately $347 thousand, $383 thousand and $513 thousand for the years ended December 31, 2010, 2009 and 2008, respectively.
New Accounting Pronouncements
Accounting Standards Update (“ASU”) No. 2009-16, “Transfers and Servicing (Topic 860) – Accounting for Transfers of Financial Assets”. New accounting guidance under ASU 2009-16 amended prior accounting guidance to enhance reporting about transfers of financial assets, including securitizations, and where companies have continuing exposure to the risks related to transferred financial assets. This guidance eliminates the concept of a “qualifying special-purpose entity” and changes the requirements for derecognizing financial assets. This guidance also requires additional disclosures about all continuing involvements with transferred financial assets including information about gains and losses resulting from
transfers during the period. This new accounting guidance became effective January 1, 2010 and did not have a significant impact on the Company’s financial statements.
ASU No. 2009-17, “Consolidations (Topic 810) – Improvements to Financial Reporting by Enterprises Involved with Variable Interest Entities”. New accounting guidance under ASU 2009-17 amended prior guidance to change how a company determines when an entity that is insufficiently capitalized or is not controlled through voting (or similar rights) should be consolidated. The determination of whether a company is required to consolidate an entity is based on, among other things, an entity’s purpose and design and a company’s ability to direct the activities of the entity that most significantly impact the entity’s economic performance. This guidance requires additional disclosures about the reporting entity’s
involvement with variable-interest entities and any significant changes in risk exposure due to that involvement as well as its affect on the entity’s financial statements. This new accounting guidance became effective January 1, 2010 and did not have a significant impact on the Company’s financial statements.
NOTE 2. CASH AND DUE FROM BANKS
The Board of Governors of the Federal Reserve System (the “FRB”) requires banks to maintain certain minimum cash balances consisting of vault cash and deposits in the appropriate Federal Reserve Bank or in other commercial banks. Such balances for the Company’s bank subsidiaries averaged approximately $1.9 million and $1.5 million during 2010 and 2009, respectively.
51
NOTE 3. INVESTMENT SECURITIES
The amortized cost and estimated fair values of investment securities are as follows:
|
Gross
|
Gross
|
Estimated
|
||||||||||||||
|
Amortized
|
Unrealized
|
Unrealized
|
Fair
|
|||||||||||||
|
(Dollars in thousands)
|
Cost
|
Gains
|
Losses
|
Value
|
||||||||||||
|
Available-for-sale securities:
|
||||||||||||||||
|
December 31, 2010:
|
||||||||||||||||
|
Obligations of U.S. Government agencies and corporations
|
$ | 58,052 | $ | 921 | $ | 69 | $ | 58,904 | ||||||||
|
Mortgage-backed securities
|
38,817 | 933 | 173 | 39,577 | ||||||||||||
|
Equity securities
|
566 | 8 | - | 574 | ||||||||||||
|
Total
|
$ | 97,435 | $ | 1,862 | $ | 242 | $ | 99,055 | ||||||||
|
December 31, 2009:
|
||||||||||||||||
|
Obligations of U.S. Treasury
|
$ | 2,998 | $ | - | $ | - | $ | 2,998 | ||||||||
|
Obligations of U.S. Government agencies and corporations
|
57,258 | 879 | 397 | 57,740 | ||||||||||||
|
Mortgage-backed securities
|
35,579 | 818 | 90 | 36,307 | ||||||||||||
|
Equity securities
|
546 | 4 | - | 550 | ||||||||||||
|
Total
|
$ | 96,381 | $ | 1,701 | $ | 487 | $ | 97,595 | ||||||||
|
Held-to-maturity securities:
|
||||||||||||||||
|
December 31, 2010:
|
||||||||||||||||
|
Obligations of states and political subdivisions
|
$ | 6,727 | $ | 143 | $ | 19 | $ | 6,851 | ||||||||
|
December 31, 2009:
|
||||||||||||||||
|
Obligations of states and political subdivisions
|
$ | 8,940 | $ | 163 | $ | 91 | $ | 9,012 | ||||||||
Gross unrealized losses and fair value by length of time that the individual available-for-sale securities have been in a continuous unrealized loss position at December 31, 2010, are as follows:
|
Less than
12 Months
|
More than
12 Months
|
Total
|
||||||||||||||||||||||
|
(Dollars in thousands)
|
Fair
Value
|
Unrealized
Losses
|
Fair
Value
|
Unrealized
Losses
|
Fair
Value
|
Unrealized
Losses
|
||||||||||||||||||
|
Available-for-sale securities:
|
||||||||||||||||||||||||
|
U.S. Gov’t agencies and corporations
|
$ | 8,747 | $ | 42 | $ | 3,268 | $ | 27 | $ | 12,015 | $ | 69 | ||||||||||||
|
Mortgage-backed securities
|
13,406 | 173 | - | - | 13,406 | 173 | ||||||||||||||||||
|
Total
|
$ | 22,153 | $ | 215 | $ | 3,268 | $ | 27 | $ | 25,421 | $ | 242 | ||||||||||||
52
The available-for-sale securities have a fair value of approximately $99.1 million, of which approximately $25.4 million have unrealized losses when compared to their amortized cost. The securities with the unrealized losses in the available-for-sale portfolio all have modest duration risk, low credit risk, and minimal losses (approximately 0.25%) when compared to total amortized cost. The unrealized losses on debt securities that exist are the result of market changes in interest rates since the original purchase. Because the Company does not intend to sell these debt securities and it is not more likely than not that the Company will be required to sell these securities before recovery of their amortized cost bases, which may be at maturity, the Company considers the unrealized
losses in the available-for-sale portfolio to be temporary.
Gross unrealized losses and fair value by length of time that the individual held-to-maturity securities have been in a continuous unrealized loss position at December 31, 2010 are as follows:
|
Less than
12 Months
|
More than
12 Months
|
Total
|
||||||||||||||||||||||
|
(Dollars in thousands)
|
Fair
Value
|
Unrealized
Losses
|
Fair
Value
|
Unrealized
Losses
|
Fair
Value
|
Unrealized
Losses
|
||||||||||||||||||
|
Held-to-maturity securities:
|
||||||||||||||||||||||||
|
Obligations of states and political subdivisions
|
$ | 996 | $ | 15 | $ | 206 | $ | 4 | $ | 1,202 | $ | 19 | ||||||||||||
The held-to-maturity securities have a fair value of approximately $6.9 million, of which approximately $1.2 million have unrealized losses when compared to their amortized cost. All of the securities with the unrealized losses in the held-to-maturity portfolio are municipal securities with modest duration risk, low credit risk, and minimal losses (approximately 0.28%) when compared to total amortized cost. The unrealized losses that exist are the result of market changes in interest rates since the original purchase. Because the Company does not intend to sell these securities and it is not more likely than not that the Company will be required to sell these securities before recovery of their amortized cost bases, which may be at maturity, the Company considers that the
unrealized losses in the held-to-maturity portfolio to be temporary.
The amortized cost and estimated fair values of investment securities by maturity date at December 31, 2010 are as follows:
|
Available for sale
|
Held to maturity
|
|||||||||||||||
|
Amortized
|
Estimated
|
Amortized
|
Estimated
|
|||||||||||||
|
(Dollars in thousands)
|
Cost
|
Fair Value
|
Cost
|
Fair Value
|
||||||||||||
|
Due in one year or less
|
$ | 10,839 | $ | 10,996 | $ | 1,163 | $ | 1,164 | ||||||||
|
Due after one year through five years
|
38,069 | 38,728 | 3,840 | 3,964 | ||||||||||||
|
Due after five years through ten years
|
23,569 | 24,010 | 1,219 | 1,228 | ||||||||||||
|
Due after ten years
|
24,392 | 24,747 | 505 | 495 | ||||||||||||
| 96,869 | 98,481 | 6,727 | 6,851 | |||||||||||||
|
Equity securities
|
566 | 574 | - | - | ||||||||||||
|
Total
|
$ | 97,435 | $ | 99,055 | $ | 6,727 | $ | 6,851 | ||||||||
The maturity dates for mortgage-backed securities are determined by expected maturity dates. The maturity dates for the remaining debt securities are determined using contractual maturity dates.
The following table sets forth the amortized cost and estimated fair values of securities which have been pledged as collateral for obligations to federal, state and local government agencies, and other purposes as required or permitted by law, or sold under agreements to repurchase. All pledged securities are in the available-for-sale investment portfolio.
|
December 31, 2010
|
December 31, 2009
|
|||||||||||||||
|
Amortized
|
Estimated
|
Amortized
|
Estimated
|
|||||||||||||
|
(Dollars in thousands)
|
Cost
|
Fair Value
|
Cost
|
Fair Value
|
||||||||||||
|
Pledged available-for-sale securities
|
$ | 63,097 | $ | 64,651 | $ | 64,856 | $ | 66,024 | ||||||||
There were no obligations of states or political subdivisions with carrying values, as to any issuer, exceeding 10% of stockholders’ equity at December 31, 2010 or 2009.
Proceeds from sales of investment securities were $0, $2.0 million, and $2 thousand for the years ended December 31, 2010, 2009, and 2008, respectively. Gross gains from sales of investment securities were $0, $49 thousand, and $0 for the years ended December 31, 2010, 2009, and 2008, respectively. There were no gross losses for the years ended December 31, 2010 or 2009. Gross losses were $15 thousand for the year ended December 31, 2008. The investment securities losses in 2008 resulted from the sale of 10,000 shares of Freddie Mac preferred stock. The Company also incurred a $371 thousand other than temporary impairment loss on these securities during 2008.
53
NOTE 4. LOANS AND ALLOWANCE FOR CREDIT LOSSES
The Company makes residential mortgage, consumer and commercial loans to customers primarily in the Maryland counties of Talbot, Queen Anne’s, Kent, Caroline and Dorchester and in Kent County, Delaware. The principal categories of the loan portfolio at December 31 are summarized as follows:
|
(Dollars in thousands)
|
2010
|
2009
|
||||||
|
Real estate – construction
|
$ | 143,952 | $ | 161,437 | ||||
|
Real estate – residential
|
333,738 | 327,873 | ||||||
|
Real estate – commercial
|
318,726 | 315,930 | ||||||
|
Commercial
|
82,787 | 91,566 | ||||||
|
Consumer
|
16,201 | 19,751 | ||||||
|
Total loans
|
895,404 | 916,557 | ||||||
|
Allowance for credit losses
|
(14,227 | ) | (10,876 | ) | ||||
|
Total loans, net
|
$ | 881,177 | $ | 905,681 | ||||
Loans are net of unearned income of $38 thousand at year-end 2010 and $221 thousand at year-end 2009.
In the normal course of banking business, loans are made to officers and directors and their affiliated interests. These loans are made on substantially the same terms and conditions as those prevailing at the time for comparable transactions with outsiders and are not considered to involve more than the normal risk of collectibility. As of December 31, 2010, and 2009, such loans outstanding, both direct and indirect (including guarantees), to directors, their associates and policy-making officers, totaled approximately $20.0 million and $19.2 million, respectively. During 2010 and 2009, loan additions were approximately $2.1 million and $11.7 million, respectively, and loan repayments were approximately $1.3 million and $2.0 million, respectively.
Activity in the allowance for credit losses is summarized as follows:
|
(Dollars in thousands)
|
2010
|
2009
|
2008
|
|||||||||
|
Balance, beginning of year
|
$ | 10,876 | $ | 9,320 | $ | 7,551 | ||||||
|
Loans charged off
|
||||||||||||
|
Real estate – construction
|
(7,910 | ) | (674 | ) | (536 | ) | ||||||
|
Real estate – residential
|
(5,818 | ) | (2,621 | ) | (316 | ) | ||||||
|
Real estate – commercial
|
(492 | ) | (1,695 | ) | (238 | ) | ||||||
|
Commercial
|
(3,710 | ) | (2,304 | ) | (447 | ) | ||||||
|
Consumer
|
(589 | ) | (417 | ) | (276 | ) | ||||||
|
Total
|
(18,519 | ) | (7,711 | ) | (1,813 | ) | ||||||
|
Recoveries
|
||||||||||||
|
Real estate – construction
|
14 | 2 | - | |||||||||
|
Real estate – residential
|
215 | 70 | 19 | |||||||||
|
Real estate – commercial
|
108 | 6 | - | |||||||||
|
Commercial
|
214 | 66 | 136 | |||||||||
|
Consumer
|
200 | 137 | 90 | |||||||||
|
Total
|
751 | 281 | 245 | |||||||||
|
Net loans charged off
|
(17,768 | ) | (7,430 | ) | (1,568 | ) | ||||||
|
Provision for credit losses
|
21,119 | 8,986 | 3,337 | |||||||||
|
Balance, end of year
|
$ | 14,227 | $ | 10,876 | $ | 9,320 | ||||||
54
Information with respect to impaired loans and the related valuation allowance as of December 31 is as follows:
|
(Dollars in thousands)
|
2010
|
2009
|
2008
|
|||||||||
|
Impaired loans with a valuation allowance
|
$ | 837 | $ | 2,028 | $ | 2,550 | ||||||
|
Impaired loans with no valuation allowance
|
35,401 | 14,274 | 5,565 | |||||||||
|
Total impaired loans
|
$ | 36,238 | $ | 16,302 | $ | 8,115 | ||||||
|
Allowance for credit losses applicable to impaired loans
|
$ | 203 | $ | 468 | $ | 341 | ||||||
|
Allowance for credit losses applicable to other than impaired loans
|
14,024 | 10,408 | 8,979 | |||||||||
|
Total allowance for credit losses
|
$ | 14,227 | $ | 10,876 | $ | 9,320 | ||||||
|
Average recorded investment in impaired loans
|
$ | 35,242 | $ | 12,646 | $ | 5,477 | ||||||
Loans are evaluated on a case by case basis for impairment. Once the amount of impairment has been determined the uncollectible portion is charged off. In some cases a specific allocation within the allowance is made until such time a charge off is made. At December 31, 2010, impaired loans had been reduced by partial charge-offs totaling $8.3 million, or 18.6%, of the unpaid principal balance. In addition, $203 thousand in specific reserves were established against $837 thousand of impaired loans.
Gross interest income of $2.1 million, $859 thousand and $476 thousand would have been recorded in 2010, 2009 and 2008, respectively, if impaired loans had been current and performing in accordance with their original terms. Interest actually recorded on such loans was $0, $4 thousand and $193 thousand for 2010, 2009 and 2008, respectively.
The following table provides information on impaired loans by loan category as of December 31, 2010.
|
(Dollars in thousands)
|
Recorded
investment
|
Unpaid
principal
balance
|
Related
allowance
|
Average
recorded
investment
|
||||||||||||
|
2010
|
||||||||||||||||
|
With no related allowance recorded:
|
||||||||||||||||
|
Real estate – construction
|
$ | 17,261 | $ | 22,643 | $ | - | $ | 17,784 | ||||||||
|
Real estate – residential
|
9,132 | 11,038 | - | 8,368 | ||||||||||||
|
Real estate – commercial
|
5,133 | 5,558 | - | 3,827 | ||||||||||||
|
Commercial
|
3,845 | 4,305 | - | 2,793 | ||||||||||||
|
Consumer
|
30 | 30 | - | 56 | ||||||||||||
|
Total
|
35,401 | 43,574 | - | 32,828 | ||||||||||||
|
With a related allowance recorded:
|
||||||||||||||||
|
Real estate – construction
|
- | - | - | 1,596 | ||||||||||||
|
Real estate – residential
|
837 | 945 | 203 | 420 | ||||||||||||
|
Real estate – commercial
|
- | - | - | - | ||||||||||||
|
Commercial
|
- | - | - | 398 | ||||||||||||
|
Consumer
|
- | - | - | - | ||||||||||||
|
Total
|
837 | 945 | 203 | 2,414 | ||||||||||||
|
Total:
|
||||||||||||||||
|
Real estate – construction
|
17,261 | 22,643 | - | 19,380 | ||||||||||||
|
Real estate – residential
|
9,969 | 11,983 | 203 | 8,788 | ||||||||||||
|
Real estate – commercial
|
5,133 | 5,558 | - | 3,827 | ||||||||||||
|
Commercial
|
3,845 | 4,305 | - | 3,191 | ||||||||||||
|
Consumer
|
30 | 30 | - | 56 | ||||||||||||
|
Total
|
$ | 36,238 | $ | 44,519 | $ | 203 | $ | 35,242 | ||||||||
55
The following table provides details on the allowance for credit losses by loan category for 2010. The table also includes impairment information relating to the allowance for credit losses and loans as of December 31, 2010. There were no loans acquired with deteriorated credit quality.
|
(Dollars in thousands)
|
Real estate -
construction
|
Real estate -
residential
|
Real estate -
commercial
|
Commercial
|
Consumer
|
Unallocated
|
Total
|
|||||||||||||||||||||
|
2010
|
||||||||||||||||||||||||||||
|
Allowance for credit losses:
|
||||||||||||||||||||||||||||
|
Beginning balance
|
$ | 2,630 | $ | 1,528 | $ | 3,947 | $ | 2,132 | $ | 515 | $ | 124 | $ | 10,876 | ||||||||||||||
|
Charge-offs
|
(7,910 | ) | (5,818 | ) | (492 | ) | (3,710 | ) | (589 | ) | - | (18,519 | ) | |||||||||||||||
|
Recoveries
|
14 | 215 | 108 | 214 | 200 | - | 751 | |||||||||||||||||||||
|
Provision
|
8,593 | 8,908 | 102 | 2,786 | 511 | 219 | 21,119 | |||||||||||||||||||||
|
Ending balance
|
$ | 3,327 | $ | 4,833 | $ | 3,665 | $ | 1,422 | $ | 637 | $ | 343 | $ | 14,227 | ||||||||||||||
|
Ending balance: individually evaluated for impairment
|
$ | - | $ | 203 | $ | - | $ | - | $ | - | $ | - | $ | 203 | ||||||||||||||
|
Ending balance: collectively evaluated for impairment
|
$ | 3,327 | $ | 4,630 | $ | 3,665 | $ | 1,422 | $ | 637 | $ | 343 | $ | 14,024 | ||||||||||||||
|
Loans:
|
||||||||||||||||||||||||||||
|
Ending balance
|
$ | 143,952 | $ | 333,738 | $ | 318,726 | $ | 82,787 | $ | 16,201 | $ | - | $ | 895,404 | ||||||||||||||
|
Ending balance: individually evaluated for impairment
|
$ | 17,261 | $ | 9,969 | $ | 5,133 | $ | 3,845 | $ | 30 | $ | - | $ | 36,238 | ||||||||||||||
|
Ending balance: collectively evaluated for impairment
|
$ | 126,691 | $ | 323,769 | $ | 313,593 | $ | 78,942 | $ | 16,171 | $ | - | $ | 859,166 | ||||||||||||||
56
The following table provides information on loan risk ratings as of December 31, 2010.
|
(Dollars in thousands)
|
Real estate -
construction
|
Real estate -
residential
|
Real estate -
commercial
|
Commercial
|
Consumer
|
Total
|
||||||||||||||||||
|
Pass/Performing
|
$ | 83,344 | $ | 283,895 | $ | 260,040 | $ | 73,502 | $ | 16,043 | $ | 716,824 | ||||||||||||
|
Special mention
|
23,090 | 23,847 | 17,821 | 2,249 | - | 67,007 | ||||||||||||||||||
|
Substandard
|
20,257 | 13,752 | 35,732 | 3,088 | 128 | 72,957 | ||||||||||||||||||
|
Doubtful
|
- | 2,275 | - | 103 | - | 2,378 | ||||||||||||||||||
|
Nonaccrual
|
17,261 | 9,969 | 5,133 | 3,845 | 30 | 36,238 | ||||||||||||||||||
|
Total
|
$ | 143,952 | $ | 333,738 | $ | 318,726 | $ | 82,787 | $ | 16,201 | $ | 895,404 | ||||||||||||
The following table provides information on the aging of the loan portfolio as of December 31, 2010.
|
(Dollars in thousands)
|
30-59 days
past due
|
60-89
days
past due |
90 days or
more past
due
|
Total past
due
|
Current
|
Total
|
90 days or
more past
due and
accruing
|
|||||||||||||||||||||
|
Real estate – construction
|
$ | 1,691 | $ | 108 | $ | 17,261 | $ | 19,060 | $ | 124,892 | $ | 143,952 | $ | - | ||||||||||||||
|
Real estate – residential
|
4,046 | 1,355 | 13,423 | 18,824 | 314,914 | 333,738 | 3,454 | |||||||||||||||||||||
|
Real estate – commercial
|
3,393 | 2,717 | 6,119 | 12,229 | 306,497 | 318,726 | 986 | |||||||||||||||||||||
|
Commercial
|
470 | 465 | 4,019 | 4,954 | 77,833 | 82,787 | 174 | |||||||||||||||||||||
|
Consumer
|
486 | 25 | 118 | 629 | 15,572 | 16,201 | 88 | |||||||||||||||||||||
|
Total
|
$ | 10,086 | $ | 4,670 | $ | 40,940 | $ | 55,696 | $ | 839,708 | $ | 895,404 | $ | 4,702 | ||||||||||||||
NOTE 5. PREMISES AND EQUIPMENT
A summary of premises and equipment at December 31 is as follows:
|
(Dollars in thousands)
|
2010
|
2009
|
||||||
|
Land
|
$ | 4,902 | $ | 4,337 | ||||
|
Buildings and land improvements
|
12,290 | 12,081 | ||||||
|
Furniture and equipment
|
8,322 | 7,823 | ||||||
| 25,514 | 24,241 | |||||||
|
Accumulated depreciation
|
(11,031 | ) | (9,934 | ) | ||||
|
Total
|
$ | 14,483 | $ | 14,307 | ||||
Depreciation expense totaled $1.1 million for each of the three years in the period ended December 31, 2010. The increase in premises and equipment was primarily from the purchases associated with the relocation of a bank branch.
On April 17, 2008, the Company entered into a sale-leaseback agreement with Milford Plaza Enterprises, LLC (“Purchaser”). Under the agreement, the Company terminated its ground lease with the Purchaser and conveyed to the Purchaser title to the Company’s improvements to the property, generally consisting of the Company’s branch banking facility in Milford, Delaware. The Company received $1.3 million for this sale and an immaterial loss was recorded on the transaction. The Company has leased back the facility for an initial period of 12 years. Monthly rental expense under the agreement is approximately $12 thousand.
57
The Company leases facilities under operating leases. Rental expense for the years ended December 31, 2010, 2009, and 2008 was $770 thousand, $774 thousand and $607 thousand, respectively. Rental expense decreased slightly in 2010 when compared to 2009 while rental expense increased in 2009 when compared to 2008 mainly due to one additional lease on a new bank branch and annual rent increases. Future minimum annual rental payments are approximately as follows:
|
(Dollars in thousands)
|
||||
|
2011
|
$ | 717 | ||
|
2012
|
601 | |||
|
2013
|
418 | |||
|
2014
|
333 | |||
|
2015
|
245 | |||
|
Thereafter
|
1,634 | |||
|
Total minimum lease payments
|
$ | 3,948 | ||
NOTE 6. INVESTMENT IN UNCONSOLIDATED SUBSIDIARY
During 2010, the Company terminated the operations of its mortgage brokerage subsidiary and now conducts brokerage activities through a minority series investment in an unrelated Delaware limited liability company under the name “Wye Mortgage Group”. This investment is carried at cost, adjusted for the Company’s 49.0% equity ownership in Wye Mortgage Group’s undistributed income or loss. At December 31, 2010, the balance was $19 thousand, reflecting an initial investment of $25 thousand, net of a $6 thousand loss for 2010.
NOTE 7. GOODWILL AND OTHER INTANGIBLE ASSETS
Goodwill totaled $13.7 million at December 31, 2010 and $16.0 million at December 31, 2009. Under the provisions of FASB ASC Topic 350, “Intangibles – Goodwill and Other”, goodwill was subjected to an annual assessment for impairment during the third quarter of 2010. As a result of the annual assessment, it was determined that goodwill at Felton Bank, one of the banks in our Community Banking segment, was impaired and the Company recorded goodwill impairment charges of $1.5 million. As of December 31, 2010, the Community Banking segment had $2.6 million in goodwill compared to $4.1 million at the end of 2009.
During the testing for goodwill and other intangible assets impairment in the third quarter of 2010, it was determined that goodwill and other intangible assets at TSGIA, a wholesale insurance agency in our Insurance Products and Services segment, were impaired. The Company recorded goodwill impairment charges of $1.5 million and other intangible assets impairment charges of $51 thousand. During the fourth quarter of 2010, goodwill increased $724 thousand for our Insurance Products and Services segment. The increase reflected a contingent payment to be made to Jack Martin & Associates, Inc., one of our retail insurance producer firms, for meeting performance criteria outlined in its acquisition agreement. As of December 31, 2010, the Insurance Products and Services
segment had $11.1 million in goodwill compared to $11.9 million at the end of 2009.
The Company will continue to review goodwill and other intangible assets on an annual basis for impairment and as events occur or circumstances change.
58
The significant components of goodwill and acquired intangible assets are as follows:
|
December 31, 2010
|
December 31, 2009
|
|||||||||||||||||||||||||||||||||||
|
(Dollars in thousands)
|
Gross
Carrying
Amount
|
Impairment
Charges
|
Accumulated
Amortization
|
Net
Carrying
Amount
|
Weighted
Average
Remaining
Life
|
Gross
Carrying
Amount
|
Accumulated
Amortization
|
Net
Carrying
Amount
|
Weighted
Average
Remaining
Life
|
|||||||||||||||||||||||||||
|
Goodwill
|
$ | 17,345 | $ | (3,000 | ) | $ | (667 | ) | $ | 13,678 | - | $ | 16,621 | $ | (667 | ) | $ | 15,954 | - | |||||||||||||||||
|
Other intangible assets
|
||||||||||||||||||||||||||||||||||||
|
Amortizable other intangible assets
|
||||||||||||||||||||||||||||||||||||
|
Employment agreements
|
$ | 1,730 | $ | - | $ | (810 | ) | $ | 920 | 3.7 | $ | 1,730 | $ | (561 | ) | $ | 1,169 | 4.7 | ||||||||||||||||||
|
Insurance expirations
|
1,270 | - | (725 | ) | 545 | 6.4 | 1,270 | (640 | ) | 630 | 7.5 | |||||||||||||||||||||||||
|
Core deposits
|
968 | - | (817 | ) | 151 | 1.3 | 968 | (696 | ) | 272 | 2.3 | |||||||||||||||||||||||||
|
Customer relationships
|
960 | (6 | ) | (195 | ) | 759 | 12.6 | 960 | (135 | ) | 825 | 13.7 | ||||||||||||||||||||||||
| 4,928 | (6 | ) | (2,547 | ) | 2,375 | 4,928 | (2,032 | ) | 2,896 | |||||||||||||||||||||||||||
|
Unamortizable other intangible assets
|
||||||||||||||||||||||||||||||||||||
|
Carrier relationships
|
1,300 | (45 | ) | - | 1,255 | - | 1,300 | - | 1,300 | - | ||||||||||||||||||||||||||
|
Trade name
|
1,210 | - | - | 1,210 | - | 1,210 | - | 1,210 | - | |||||||||||||||||||||||||||
| 2,510 | (45 | ) | - | 2,465 | 2,510 | - | 2,510 | |||||||||||||||||||||||||||||
|
Total other intangible assets
|
$ | 7,438 | $ | (51 | ) | $ | (2,547 | ) | $ | 4,840 | $ | 7,438 | $ | (2,032 | ) | $ | 5,406 | |||||||||||||||||||
The current period and estimated future amortization expense for amortizable other intangible assets is as follows:
|
Amortization
|
|||||
|
(Dollars in thousands)
|
Expense
|
||||
|
Year ended December 31, 2010
|
$ | 515 | |||
|
Estimate for years ended December 31,
|
2011
|
515 | |||
|
2012
|
402 | ||||
|
2013
|
306 | ||||
|
2014
|
306 | ||||
|
2015
|
265 | ||||
NOTE 8. OTHER ASSETS AND LIABILITIES
The Company had the following other assets at December 31.
|
(Dollars in thousands)
|
2010
|
2009
|
||||||
|
Nonmarketable investment securities
|
$ | 2,949 | $ | 3,149 | ||||
|
Insurance premiums receivable
|
741 | 983 | ||||||
|
Accrued interest receivable
|
5,060 | 4,804 | ||||||
|
Deferred income taxes (1)
|
7,578 | 3,337 | ||||||
|
Interest rate caps (2)
|
2,022 | 6,168 | ||||||
|
Prepaid FDIC premium expense
|
4,073 | 5,449 | ||||||
|
Other assets
|
6,262 | 6,525 | ||||||
|
Total
|
$ | 28,685 | $ | 30,415 | ||||
The Company had the following other liabilities at December 31.
|
(Dollars in thousands)
|
2010
|
2009
|
||||||
|
Accrued interest payable
|
$ | 860 | $ | 1,781 | ||||
|
Counterparty collateral - interest rate caps (2)
|
1,390 | 4,847 | ||||||
|
Other liabilities
|
9,059 | 9,308 | ||||||
|
Total
|
$ | 11,309 | $ | 15,936 | ||||
(1) See Note 15 for further discussion.
(2) See Note 20 for further discussion.
59
NOTE 9. DEPOSITS
The approximate amount of certificates of deposit of $100,000 or more at December 31, 2010 and 2009 was $263.7 million and $262.7 million, respectively.
The approximate maturities of total time deposits at December 31 are as follows:
|
(Dollars in thousands)
|
2010
|
2009
|
||||||
|
Due in one year or less
|
$ | 295,361 | $ | 384,169 | ||||
|
Due in one to three years
|
109,632 | 77,373 | ||||||
|
Due in three to five years
|
66,394 | 23,164 | ||||||
|
Total
|
$ | 471,387 | $ | 484,706 | ||||
NOTE 10. SHORT-TERM BORROWINGS
The following table summarizes certain information for short-term borrowings for the years ended December 31:
|
2010
|
2009
|
|||||||||||||||
|
(Dollars in thousands)
|
Amount
|
Rate
|
Amount
|
Rate
|
||||||||||||
|
Average for the Year
|
||||||||||||||||
|
Retail repurchase agreements
|
$ | 15,824 | 0.44 | % | $ | 18,200 | 0.41 | % | ||||||||
|
Federal Home Loan Bank advances
|
- | - | 6,000 | 0.60 | ||||||||||||
|
Other short-term borrowings
|
524 | 2.53 | 1,319 | 1.23 | ||||||||||||
|
Total
|
$ | 16,348 | 0.51 | $ | 25,519 | 0.50 | ||||||||||
|
At Year End
|
||||||||||||||||
|
Retail repurchase agreements
|
$ | 16,041 | 0.35 | % | $ | 17,026 | 0.47 | % | ||||||||
|
Federal Home Loan Bank advances
|
- | - | - | - | ||||||||||||
|
Other short-term borrowings
|
- | - | 3,378 | 2.51 | ||||||||||||
|
Total
|
$ | 16,041 | 0.35 | $ | 20,404 | 0.82 | ||||||||||
|
Maximum Month-End Balance
|
||||||||||||||||
|
Retail repurchase agreements
|
$ | 17,864 | $ | 29,220 | ||||||||||||
|
Federal Home Loan Bank advances
|
- | 17,050 | ||||||||||||||
|
Other short-term borrowings
|
3,378 | 3,378 | ||||||||||||||
Securities sold under agreements to repurchase are securities sold to customers, at the customers’ request, under a “roll-over” contract that matures in one business day. The underlying securities sold are U.S. Government agency securities, which are segregated in the Company’s custodial accounts from other investment securities.
The Company may periodically borrow from a correspondent federal funds line of credit arrangement, under a secured reverse repurchase agreement, or from the Federal Home Loan Bank to meet short-term liquidity needs.
At December 31, 2010, short-term borrowings included only repurchase agreements. At December 31, 2009, short-term borrowings included repurchase agreements and other short-term borrowings which consisted of $3.4 million drawn on a $10.0 million line of credit with a commercial bank. The Company obtained this line of credit during the fourth quarter of 2009 and the outstanding balance at the end of 2009 was repaid in February of 2010.
60
NOTE 11. LONG-TERM DEBT
As of December 31, the Company had the following long-term debt:
|
(Dollars in thousands)
|
2010
|
2009
|
||||||
|
Acquisition-related debt, 4.08% interest, annual payments over five years
|
$ | 932 | $ | 1,429 | ||||
The acquisition-related debt was incurred as part of the purchase price of TSGIA and is payable to the seller thereof, who remains the President of that subsidiary.
NOTE 12. BENEFIT PLANS
401(k) and Profit Sharing Plan
The Company has a 401(k) and profit sharing plan covering substantially all full-time employees. The plan calls for matching contributions by the Company, and the Company makes discretionary contributions based on profits. Company contributions to this plan included in expense totaled $501 thousand, $1.1 million, and $1.4 million for 2010, 2009, and 2008, respectively. The expense decreased in 2010 when compared to 2009 and decreased in 2009 when compared to 2008 due to a decline in the amounts accrued for the profit sharing portion of the plan based on lower profits.
NOTE 13. STOCK-BASED COMPENSATION
At December 31, 2010, the Company maintained two equity compensation plans under which it may issue shares of common stock or grant other equity-based awards: (i) the Shore Bancshares, Inc. 2006 Stock and Incentive Compensation Plan (“2006 Equity Plan”); and (ii) the Shore Bancshares, Inc. 1998 Stock Option Plan (the “1998 Option Plan”). The Company's ability to grant options under the 1998 Option Plan expired on March 3, 2008 pursuant to the terms of that plan, but stock options granted thereunder were outstanding as of December 31, 2010.
Under the 2006 Equity Plan, stock-based awards may be granted periodically to directors, executive officers, and key employees at the discretion of the Compensation Committee of the Company’s Board. Stock-based awards granted to date under the 2006 Equity Plan are generally time-based, vesting on each anniversary of the grant date over a three to five year period of time and, in the case of stock options, expiring 10 years from the grant date. The 2006 Equity Plan originally reserved 631,972 shares of common stock for grant, and 575,217 shares remained available for grant at December 31, 2010.
The following table summarizes restricted stock award activity for the Company under the 2006 Equity Plan for the two years ended December 31, 2010:
|
Year Ended December 31, 2010
|
Year Ended December 31, 2009
|
|||||||||||||||
|
Number
|
Weighted Average Grant
|
Number
|
Weighted Average Grant
|
|||||||||||||
|
of Shares
|
Date Fair Value
|
of Shares
|
Date Fair Value
|
|||||||||||||
|
Nonvested at beginning of year
|
27,405 | $ | 20.23 | 16,859 | $ | 22.55 | ||||||||||
|
Granted
|
24,473 | 13.41 | 14,254 | 18.12 | ||||||||||||
|
Vested
|
(7,751 | ) | 18.47 | (3,708 | ) | 22.63 | ||||||||||
|
Cancelled
|
- | - | - | - | ||||||||||||
|
Nonvested at end of year
|
44,127 | 16.76 | 27,405 | 20.23 | ||||||||||||
The total fair value of restricted stock awards vested was $163 thousand in 2010 and $67 thousand in 2009.
61
The following is a summary of stock option activity for the 1998 Option Plan for 2010 and 2009:
|
Year Ended December 31, 2010
|
Year Ended December 31, 2009
|
|||||||||||||||
|
Number
|
Weighted Average
|
Number
|
Weighted Average
|
|||||||||||||
|
of Shares
|
Exercise Price
|
of Shares
|
Exercise Price
|
|||||||||||||
|
Outstanding at beginning of year
|
10,850 | $ | 13.36 | 18,550 | $ | 15.52 | ||||||||||
|
Granted
|
- | - | - | - | ||||||||||||
|
Exercised
|
- | - | (25 | ) | 21.33 | |||||||||||
|
Expired/Cancelled
|
(2,430 | ) | 14.00 | (7,675 | ) | 18.55 | ||||||||||
|
Outstanding at end of year
|
8,420 | 13.17 | 10,850 | 13.36 | ||||||||||||
At December 31, 2010, each of the 8,420 outstanding options was exercisable, had a weighted average exercise price of $13.17 per share, and had a remaining contract life of 1.3 years.
The Company estimates the fair value of stock options using the Black-Scholes valuation model with weighted average assumptions for dividend yield, expected volatility, risk-free interest rate and expected lives (in years). The expected dividend yield is calculated by dividing the total expected annual dividend payout by the average stock price. The expected volatility is based on historical volatility of the underlying securities. The risk-free interest rate is based on the Federal Reserve Bank’s constant maturities daily interest rate in effect at grant date. The expected life of the options represents the period of time that the Company expects the awards to be outstanding based on historical experience with similar awards. No options were granted
during 2010 or 2009.
There was no aggregate intrinsic value in options outstanding and exercisable based on the $10.54 market value per share of the Company’s common stock at December 31, 2010. The total intrinsic value of stock options exercised during the years ended December 31, 2010, 2009, and 2008 was $0, less than $1 thousand and $80 thousand, respectively. No stock options vested in 2010, 2009 or 2008.
Stock-based compensation expense totaled $390 thousand, $102 thousand and $91 thousand in 2010, 2009, and 2008, respectively. Stock-based compensation expense is recognized ratably over the requisite service period for all awards, is based on the grant date fair value and reflects forfeitures as they occur. The total income tax benefit recognized in the accompanying consolidated statements of income related to stock-based compensation was $20 thousand, $5 thousand, and $4 thousand in 2010, 2009, and 2008, respectively. Unrecognized stock-based compensation expense related to stock-based awards totaled $424 thousand at December 31, 2010. At such date, the weighted-average period over which this unrecognized expense was expected to be recognized was 1.7 years.
NOTE 14. DEFERRED COMPENSATION
The Shore Bancshares, Inc. Executive Deferred Compensation Plan (the “Plan”) is for members of management and highly compensated employees of the Company and its subsidiaries. The Plan permits a participant to elect, each year, to defer receipt of up to 100% of his or her salary and bonus to be earned in the following year. The Plan also permits the participant to defer the receipt of performance-based compensation not later than six months before the end of the period for which it is to be earned. The deferred amounts are credited to an account maintained on behalf of the participant and are invested at the discretion of each participant in certain deemed investment options selected from time to time by the Compensation Committee of the Company’s Board. The Company
may also make matching, mandatory and discretionary contributions for certain participants. A participant is fully vested at all times in the amounts that he or she elects to defer. Any contributions by the Company will vest over a five-year period. The Company made contributions to the Plan totaling $94 thousand, $85 thousand, and $84 thousand for 2010, 2009, and 2008, respectively. There were no elective deferrals made by plan participants during 2010. One plan participant made elective deferrals during 2009 and 2008.
The Company has a supplemental deferred compensation plan to provide retirement benefits to its Chief Executive Officer. The participant is 100% vested in amounts credited to his account. No contributions have been made to this plan since the adoption of the Plan described above.
62
CNB has agreements with certain of its directors under which they have deferred part of their fees and compensation. The amounts deferred are invested in insurance policies, owned by CNB, on the lives of the respective individuals. Amounts available under the policies are to be paid to the individuals as retirement benefits over future years. The cash surrender value and the accrued benefit obligation included in other assets and other liabilities at December 31 are as follows:
|
(Dollars in thousands)
|
2010
|
2009
|
||||||
|
Cash surrender value
|
$ | 3,191 | $ | 2,347 | ||||
|
Accrued benefit obligation
|
1,037 | 1,269 | ||||||
The increase in the cash surrender value of directors’ life insurance policies at year-end 2010 when compared to year-end 2009 reflected the repayment of loans associated with these assets. The decrease in the accrued benefit obligation from the end of 2009 to the end of 2010 reflected the surrender of certain directors’ life insurance policies which resulted in a $224 thousand gain.
NOTE 15. INCOME TAXES
Income taxes included in the balance sheets as of December 31 are as follows:
|
(Dollars in thousands)
|
2010
|
2009
|
||||||
|
Federal income taxes currently (payable) receivable
|
$ | (512 | ) | $ | 918 | |||
|
State income taxes currently receivable (payable)
|
111 | (25 | ) | |||||
|
Deferred income tax benefit
|
7,578 | 3,337 | ||||||
Components of income tax expense for each of the three years ended December 31 are as follows:
|
(Dollars in thousands)
|
2010
|
2009
|
2008
|
|||||||||
|
Current tax expense:
|
||||||||||||
|
Federal
|
$ | 1,940 | $ | 4,078 | $ | 6,120 | ||||||
|
State
|
473 | 1,262 | 1,470 | |||||||||
| 2,413 | 5,340 | 7,590 | ||||||||||
|
Deferred income tax benefit:
|
||||||||||||
|
Federal
|
(2,350 | ) | (708 | ) | (334 | ) | ||||||
|
State
|
(555 | ) | (220 | ) | (164 | ) | ||||||
| (2,905 | ) | (928 | ) | (498 | ) | |||||||
|
Total income tax (benefit) expense
|
$ | (492 | ) | $ | 4,412 | $ | 7,092 | |||||
A reconciliation of tax computed at the statutory federal tax rate of 34.0% for 2010, 34.2% for 2009 and 35% for 2008 to the actual tax expense for the three years ended December 31 follows:
|
(Dollars in thousands)
|
2010
|
2009
|
2008
|
|||||||||
|
Tax at federal statutory rate
|
34.0 | % | 34.2 | % | 35.0 | % | ||||||
|
Tax effect of:
|
||||||||||||
|
Tax-exempt income
|
7.6 | (1.6 | ) | (1.2 | ) | |||||||
|
Non-deductible goodwill impairment charges
|
(24.3 | ) | - | - | ||||||||
|
Other non-deductible expenses
|
(1.3 | ) | 0.2 | 0.1 | ||||||||
|
State income taxes, net of federal benefit
|
2.4 | 5.9 | 4.6 | |||||||||
|
Other
|
4.4 | (0.9 | ) | (0.3 | ) | |||||||
|
Actual income tax expense rate
|
22.8 | % | 37.8 | % | 38.2 | % | ||||||
63
Significant components of the Company’s deferred tax assets and liabilities as of December 31 are as follows:
|
(Dollars in thousands)
|
2010
|
2009
|
||||||
|
Deferred tax assets:
|
||||||||
|
Allowance for credit losses
|
$ | 5,652 | $ | 4,311 | ||||
|
Reserve for off-balance sheet commitments
|
198 | 171 | ||||||
|
Write-downs of other real estate owned
|
163 | 56 | ||||||
|
Net operating loss carry forward
|
258 | 156 | ||||||
|
Deferred gain on sale leaseback
|
45 | 49 | ||||||
|
Deferred income
|
1,244 | 665 | ||||||
|
Accrued employee benefits
|
1,049 | 849 | ||||||
|
Accrued data processing expenses
|
298 | 195 | ||||||
|
Unrealized losses on interest rate caps
|
1,884 | 384 | ||||||
|
Other
|
15 | 7 | ||||||
|
Total deferred tax assets
|
10,806 | 6,843 | ||||||
|
Deferred tax liabilities:
|
||||||||
|
Depreciation
|
550 | 529 | ||||||
|
Purchase accounting adjustments
|
1,047 | 1,374 | ||||||
|
Federal Home Loan Bank stock dividend
|
29 | 29 | ||||||
|
Deferred capital gain on branch sale
|
486 | 493 | ||||||
|
Deferred gains on interest rate swaps
|
169 | 169 | ||||||
|
Deferred loan costs
|
256 | 373 | ||||||
|
Unrealized gains on available-for-sale securities
|
650 | 486 | ||||||
|
Other
|
41 | 53 | ||||||
|
Total deferred tax liabilities
|
3,228 | 3,506 | ||||||
|
Net deferred tax assets
|
$ | 7,578 | $ | 3,337 | ||||
NOTE 16. EARNINGS/(LOSS) PER COMMON SHARE
Basic earnings (loss) per common share are calculated by dividing net income (loss) available to common stockholders by the weighted average number of common shares outstanding during the period. Diluted earnings (loss) per common share are calculated by dividing net income (loss) available to common stockholders by the weighted average number of common shares outstanding during the period, adjusted for the dilutive effect of stock-based awards. There is no dilutive effect on the loss per share during loss periods. The following table provides information relating to the calculation of earnings (loss) per common share:
|
(In thousands, except per share data)
|
2010
|
2009
|
2008
|
|||||||||
|
Net (loss) income
|
$ | (1,667 | ) | $ | 5,397 | $ | 11,470 | |||||
|
Weighted average shares outstanding – basic
|
8,442 | 8,414 | 8,400 | |||||||||
|
Dilutive effect of stock-based awards
|
- | 3 | 7 | |||||||||
|
Weighted average shares outstanding – diluted
|
8,442 | 8,417 | 8,407 | |||||||||
|
(Loss) earnings per common share – basic
|
$ | (0.20 | ) | $ | 0.64 | $ | 1.37 | |||||
|
(Loss) earnings per common share – diluted
|
$ | (0.20 | ) | $ | 0.64 | $ | 1.36 | |||||
There were 173 thousand antidilutive weighted average shares relating to a common stock purchase warrant excluded from the diluted earnings per share calculation for 2010, 169 thousand for 2009 and none for 2008. There were 8,626 antidilutive weighted average stock-based awards excluded from the diluted earnings per share calculation for 2010, 438 for 2009 and 3,284 for 2008.
64
NOTE 17. REGULATORY CAPITAL REQUIREMENTS
The Company and each of the Banks are subject to various regulatory capital requirements administered by the federal banking agencies. Failure to meet minimum capital requirements can initiate certain mandatory - and possibly additional discretionary - actions by regulators that, if undertaken, could have a direct material effect on the Company’s financial statements. Under capital adequacy guidelines and the regulatory framework for prompt corrective action, the Banks must meet specific capital guidelines that involve quantitative measures of the Banks’ assets, liabilities, and certain off-balance sheet items as calculated under regulatory accounting practices. The Banks’ capital amounts and classification are also subject to qualitative judgments by the
regulators about components, risk weightings, and other factors.
Quantitative measures established by regulation to ensure capital adequacy require the Banks to maintain amounts and ratios (set forth in the table below) of Tier 1 and total capital (as defined in the regulations) to risk-weighted assets (as defined), and of Tier 1 capital (as defined) to average assets (leverage ratio). Management believes, as of December 31, 2010, that the Company and the Banks met all capital adequacy requirements to which they are subject.
As of December 31, 2010 and 2009, the most recent notification from the Federal Deposit Insurance Corporation categorized the Banks as well capitalized under the regulatory framework for prompt corrective action. To be categorized as well capitalized, the Banks must maintain minimum Tier 1 risk-based and total risk-based capital ratios, and Tier 1 leverage ratios. Management believes that there are no conditions or events since that notification that have changed the Company’s or Banks’ well-capitalized category.
The minimum ratios for capital adequacy purposes are 4.00%, 8.00% and 4.00% for the Tier 1 risk-based capital, total risk-based capital and leverage ratios, respectively. To be categorized as well capitalized, a bank must maintain minimum ratios of 6.00%, 10.00% and 5.00% for its Tier 1 risk-based capital, total risk-based capital and leverage ratios, respectively. Shore Bancshares, Inc., as a financial holding company, is subject to the well-capitalized requirement.
Capital amounts and ratios for Shore Bancshares, Inc., Talbot Bank, CNB and Felton Bank as of December 31, 2010 and 2009 are presented below:
|
December 31, 2010
(Dollars in thousands)
|
Tier 1
Capital
|
Total
Risk-
Based
Capital
|
Net
Risk-
Weighted
Assets
|
Adjusted
Average
Total Assets
|
Tier 1
Risk-Based
Capital
Ratio
|
Total
Risk-Based
Capital
Ratio
|
Tier 1
Leverage
Ratio
|
|||||||||||||||||||||
|
Company
|
$ | 105,808 | $ | 117,057 | $ | 895,581 | $ | 1,109,999 | 11.81 | % | 13.07 | % | 9.53 | % | ||||||||||||||
|
Talbot Bank
|
65,736 | 73,133 | 589,533 | 682,493 | 11.15 | 12.41 | 9.63 | |||||||||||||||||||||
|
CNB
|
32,813 | 35,893 | 246,056 | 342,771 | 13.34 | 14.59 | 9.57 | |||||||||||||||||||||
|
Felton Bank
|
7,683 | 8,459 | 61,086 | 81,621 | 12.58 | 13.85 | 9.41 | |||||||||||||||||||||
|
December 31, 2009
(Dollars in thousands)
|
Tier 1
Capital
|
Total
Risk-
Based
Capital
|
Net
Risk-
Weighted
Assets
|
Adjusted
Average
Total Assets
|
Tier 1
Risk-Based
Capital
Ratio
|
Total
Risk-Based
Capital
Ratio
|
Tier 1
Leverage
Ratio
|
|||||||||||||||||||||
|
Company
|
$ | 106,391 | $ | 116,928 | $ | 928,933 | $ | 1,148,077 | 11.45 | % | 12.59 | % | 9.27 | % | ||||||||||||||
|
Talbot Bank
|
67,539 | 73,953 | 602,944 | 728,612 | 11.20 | 12.27 | 9.27 | |||||||||||||||||||||
|
CNB
|
31,461 | 34,539 | 245,852 | 324,464 | 12.80 | 14.05 | 9.70 | |||||||||||||||||||||
|
Felton Bank
|
8,684 | 9,642 | 76,060 | 90,268 | 11.42 | 12.68 | 9.62 | |||||||||||||||||||||
Federal and state laws and regulations applicable to banks and their holding companies impose certain restrictions on dividend payments by the Banks, as well as restricting extensions of credit and transfers of assets between the Banks and the Company. The Banks paid dividends of $2.1 million to the Company during 2010. At December 31, 2010, the Banks could have paid dividends to the Company of approximately $9.5 million without the prior consent and approval of the regulatory agencies. The Company had no outstanding receivables from subsidiaries at December 31, 2010 or 2009.
NOTE 18. LINES OF CREDIT
The Banks had $24.5 million in unsecured federal funds lines of credit and a reverse repurchase agreement available on a short-term basis from correspondent banks at December 31, 2010. The comparable amount was $56.5 million at December 31, 2009. In addition, the Banks had credit availability of approximately $29.1 million and $14.1 million from the Federal Home Loan Bank at December 31, 2010 and 2009, respectively. The Banks have pledged as collateral, under a blanket lien, all qualifying residential loans under borrowing agreements with the Federal Home Loan Bank. At both December 31, 2010 and 2009, the Federal Home Loan Bank had issued letters of credit of $71.0 million on behalf of the Banks to local government entities as collateral for their deposits. The Banks
had no short-term borrowings from the Federal Home Loan Bank at December 31, 2010 or 2009.
65
During 2009, the Company obtained a $10.0 million line of credit with a commercial bank to be used primarily for working capital or other general business purposes. At the end of 2009, short-term borrowings included $3.4 million drawn on this line which was repaid in February of 2010. This line of credit expired in November of 2010.
NOTE 19. FAIR VALUE MEASUREMENTS
ASC 820, “Fair Value Measurements and Disclosures” provides a framework for measuring and disclosing fair value under GAAP. This accounting guidance requires disclosures about the fair value of assets and liabilities recognized in the balance sheet in periods subsequent to initial recognition, whether the measurements are made on a recurring basis or on a nonrecurring basis.
ASC 820 defines fair value as the exchange price that would be received for an asset or paid to transfer a liability (an exit price) in the principal or most advantageous market for the asset or liability in an orderly transaction between market participants on the measurement date. ASC 820 also establishes a fair value hierarchy, which requires an entity to maximize the use of observable inputs and minimize the use of unobservable inputs when measuring fair value.
The Company utilizes fair value measurements to record fair value adjustments to certain assets and liabilities and to determine fair value disclosures. Securities available for sale and derivative assets and liabilities are recorded at fair value on a recurring basis. Additionally, from time to time, the Company may be required to record at fair value other assets on a nonrecurring basis, such as impaired loans and foreclosed assets (other real estate owned). These nonrecurring fair value adjustments typically involve application of lower of cost or market accounting or write-downs of individual assets.
Under ASC 820, assets and liabilities are grouped at fair value in three levels, based on the markets in which the assets and liabilities are traded and the reliability of the assumptions used to determine their fair values. These hierarchy levels are:
Level 1 inputs – Unadjusted quoted prices in active markets for identical assets or liabilities that the entity has the ability to access at the measurement date.
Level 2 inputs – Inputs other than quoted prices included in Level 1 that are observable for the asset or liability, either directly or indirectly. These might include quoted prices for similar assets or liabilities in active markets, and inputs other than quoted prices that are observable for the asset or liability, such as interest rates and yield curves that are observable at commonly quoted intervals.
Level 3 inputs – Unobservable inputs for determining the fair values of assets or liabilities that reflect an entity’s own assumptions about the assumptions that market participants would use in pricing the assets or liabilities.
The following is a description of valuation methodologies used for the Company’s assets and liabilities recorded at fair value.
Investment Securities Available for Sale
Investment securities available for sale are recorded at fair value on a recurring basis. Fair value measurement is based on quoted prices, if available. If quoted prices are not available, fair values are measured using independent pricing models or other model-based valuation techniques such as the present value of future cash flows, adjusted for the security’s credit rating, prepayment assumptions and other factors such as credit loss assumptions. Level 1 securities include those traded on an active exchange such as the New York Stock Exchange, Treasury securities that are traded by dealers or brokers in active over-the-counter markets and money market funds. Level 2 securities include mortgage-backed securities issued by government sponsored entities, municipal bonds and corporate debt securities.
Securities classified as Level 3 include asset-backed securities in less liquid markets.
Loans
The Company does not record loans at fair value on a recurring basis; however, from time to time, a loan is considered impaired and a valuation allowance may be established. Loans for which it is probable that payment of interest and principle will not be made in accordance with the contractual terms of the loan are considered impaired. The fair value of impaired loans is estimated using one of several methods, including the collateral value, market value of similar debt, enterprise value, liquidation value and discounted cash flows. At December 31, 2010, substantially all impaired loans were evaluated based on the fair value of the collateral and were classified as Level 3 in the fair value hierarchy.
66
Other Real Estate Owned (Foreclosed Assets)
Foreclosed assets are adjusted for fair value upon transfer of loans to foreclosed assets. Subsequently, foreclosed assets are carried at the lower of carrying value and fair value. Fair value is based on independent market prices, appraised value of the collateral or management’s estimation of the value of the collateral and classified as Level 3 in the fair value hierarchy.
Derivative Assets and Liabilities
Derivative instruments held or issued by the Company for risk management purposes are traded in over-the-counter markets where quoted market prices are not readily available. For those derivatives, the Company measures fair value using models that use primarily market observable inputs, such as yield curves and option volatilities, and include the value associated with counterparty credit risk. The Company classifies derivative instruments held or issued for risk management purposes as recurring Level 2. As of December 31, 2010, the Company’s derivative instruments consisted solely of interest rate caps. Derivative assets and liabilities are included in other assets and liabilities, respectively, in the accompanying consolidated balance sheets.
Assets Recorded at Fair Value on a Recurring Basis
The table below presents the recorded amount of assets measured at fair value on a recurring basis at December 31, 2010. There were no transfers between Levels 1 and 2 during 2010.
|
(Dollars in thousands)
|
Fair Value
|
Quoted Prices
(Level 1)
|
Significant Other
Observable Inputs
(Level 2)
|
Significant
Unobservable Inputs
(Level 3)
|
||||||||||||
|
Securities available for sale:
|
||||||||||||||||
|
U.S. Government agencies
|
$ | 58,904 | $ | - | $ | 58,904 | $ | - | ||||||||
|
Mortgage-backed securities
|
39,577 | - | 39,577 | - | ||||||||||||
|
Other equity securities
|
574 | - | 574 | - | ||||||||||||
|
Total
|
$ | 99,055 | $ | - | $ | 99,055 | $ | - | ||||||||
|
Interest rate caps
|
$ | 2,022 | $ | - | $ | 2,022 | $ | - | ||||||||
Assets Recorded at Fair Value on a Nonrecurring Basis
The table below presents the recorded amount of assets measured at fair value on a nonrecurring basis at December 31, 2010.
|
(Dollars in thousands)
|
Fair Value
|
Quoted Prices
(Level 1)
|
Significant Other
Observable Inputs
(Level 2)
|
Significant
Unobservable Inputs
(Level 3)
|
||||||||||||
|
Impaired loans
|
||||||||||||||||
|
Real estate – construction
|
$ | 17,261 | $ | - | $ | - | $ | 17,261 | ||||||||
|
Real estate – residential
|
9,766 | - | - | 9,766 | ||||||||||||
|
Real estate – commercial
|
5,133 | - | - | 5,133 | ||||||||||||
|
Commercial
|
3,845 | - | - | 3,845 | ||||||||||||
|
Consumer
|
30 | - | - | 30 | ||||||||||||
|
Total
|
$ | 36,035 | $ | - | $ | - | $ | 36,035 | ||||||||
|
Other real estate owned
|
$ | 3,702 | $ | - | $ | - | $ | 3,702 | ||||||||
Impaired loans had a carrying amount of $36.2 million with a valuation allowance of $203 thousand at December 31, 2010.
67
The following disclosures relate to the fair value of the Company’s financial instruments. The methods and assumptions used to estimate the fair value of each class of financial instruments for which it is practicable to estimate that value is discussed below:
Cash and Cash Equivalents
For short-term instruments, the carrying amount is a reasonable estimate of fair value.
Investment Securities
For all investments in debt securities, fair values are based on quoted market prices. If a quoted market price is not available, fair value is estimated using quoted market prices for similar securities.
Loans
The fair values of categories of fixed rate loans, such as commercial loans, residential mortgage, and other consumer loans is estimated by discounting the future cash flows using the current rates at which similar loans would be made to borrowers with similar credit ratings and for the same remaining maturities. Other loans, including variable rate loans, are adjusted for differences in loan characteristics.
Financial Liabilities
The fair value of demand deposits, savings accounts, and certain money market deposits is the amount payable on demand at the reporting date. The fair value of fixed-maturity certificates of deposit is estimated using the rates currently offered for deposits of similar remaining maturities. These estimates do not take into consideration the value of core deposit intangibles. Generally, the carrying amount of short-term borrowings is a reasonable estimate of fair value. The fair values of securities sold under agreements to repurchase (included in short-term borrowings) and long-term debt are estimated using the rates offered for similar borrowings.
Commitments to Extend Credit and Standby Letters of Credit
The majority of the Company’s commitments to grant loans and standby letters of credit are written to carry current market interest rates if converted to loans. Because commitments to extend credit and letters of credit are generally unassignable by the Company or the borrower, they only have value to the Company and the borrower and, therefore, it is impractical to assign any value to these commitments.
The estimated fair values of the Company’s financial instruments as of December 31 are as follows:
|
2010
|
2009
|
|||||||||||||||
|
Estimated
|
Estimated
|
|||||||||||||||
|
Carrying
|
Fair
|
Carrying
|
Fair
|
|||||||||||||
|
(Dollars in thousands)
|
Amount
|
Value
|
Amount
|
Value
|
||||||||||||
|
Financial assets
|
||||||||||||||||
|
Cash and cash equivalents
|
$ | 77,964 | $ | 77,964 | $ | 75,646 | $ | 75,646 | ||||||||
|
Investment securities
|
105,782 | 105,906 | 106,535 | 106,607 | ||||||||||||
|
Loans
|
895,404 | 908,745 | 916,557 | 934,362 | ||||||||||||
|
Less: allowance for loan losses
|
(14,227 | ) | - | (10,876 | ) |
-
|
||||||||||
|
Total
|
$ | 1,064,923 | $ | 1,092,615 | $ | 1,087,862 | $ | 1,116,615 | ||||||||
|
Financial liabilities
|
||||||||||||||||
|
Deposits
|
$ | 979,516 | $ | 983,257 | $ | 990,937 | $ | 999,016 | ||||||||
|
Short-term borrowings
|
16,041 | 16,041 | 20,404 | 20,404 | ||||||||||||
|
Long-term debt
|
932 | 982 | 1,429 | 1,530 | ||||||||||||
|
Total
|
$ | 996,489 | $ | 1,000,280 | $ | 1,012,770 | $ | 1,020,950 | ||||||||
NOTE 20. DERIVATIVE INSTRUMENTS AND HEDGING ACTIVITIES
ASC 815, “Derivatives and Hedging”, defines derivatives, requires that derivatives be carried at fair value on the balance sheet and provides for hedge accounting when certain conditions are met. Changes in the fair values of derivative instruments designated as “cash flow” hedges, to the extent the hedges are highly effective, are recorded in other comprehensive income, net of taxes. Ineffective portions of cash flow hedges, if any, are recognized in current period earnings. The net interest settlement on cash flow hedges is treated as an adjustment of the interest income or interest expense of the hedged assets or liabilities. As part of its overall interest rate risk management strategy,
the Company uses derivative instruments to hedge its exposure to changes in interest rates. The Company does not use derivatives for any trading or other speculative purposes.
68
During the second quarter of 2009, the Company entered into five-year interest rate swap agreements with notional amounts of $70 million to effectively fix the interest rate on $70 million of the Company’s money market deposit accounts at 2.97%. Because the interest rate swaps did not qualify for hedge accounting, the Company restructured the original transactions and purchased interest rate caps for $6.5 million during the third quarter of 2009. The interest rate caps qualified for hedge accounting. At December 31, 2010 and 2009, the aggregate fair value of these derivatives was an asset of $2.0 million and $6.2 million, respectively. Interest expense included a net interest settlement of $429 thousand and $8 thousand for 2010 and 2009, respectively. For 2009, other
noninterest income included a gain relating to the swap transactions of $420 thousand which was recorded in the second quarter of 2009.
By entering into derivative instrument contracts, the Company exposes itself, from time to time, to counterparty credit risk. Counterparty credit risk is the risk that the counterparty will fail to perform under the terms of the derivative contract. When the fair value of a derivative contract is in an asset position, the counterparty has a liability to the Company, which creates credit risk for the Company. The Company attempts to minimize this risk by selecting counterparties with investment grade credit ratings, limiting its exposure to any single counterparty and regularly monitoring its market position with each counterparty. Also to minimize risk, the Company obtained counterparty collateral which was recorded in other liabilities. At December 31, 2010
and 2009, the counterparty collateral was $1.4 million and $4.8 million, respectively.
NOTE 21. FINANCIAL INSTRUMENTS WITH OFF-BALANCE SHEET RISK
In the normal course of business, to meet the financing needs of its customers, the Banks are parties to financial instruments with off-balance sheet risk. These financial instruments include commitments to extend credit and standby letters of credit. The Banks’ exposure to credit loss in the event of nonperformance by the other party to these financial instruments is represented by the contractual amount of the instruments. The Banks use the same credit policies in making commitments and conditional obligations as they do for on-balance sheet instruments. The Banks generally require collateral or other security to support the financial instruments with credit risk. The amount of collateral or other security is determined based on management’s
credit evaluation of the counterparty. The Banks evaluate each customer’s creditworthiness on a case-by-case basis.
Commitments to extend credit are agreements to lend to a customer as long as there is no violation of any condition established in the contract. Letters of credit are conditional commitments issued by the Company to guarantee the performance of a customer to a third party. Letters of credit and other commitments generally have fixed expiration dates or other termination clauses and may require payment of a fee. Because many of the letters of credit and commitments are expected to expire without being drawn upon, the total commitment amount does not necessarily represent future cash requirements.
Commitments outstanding as of December 31 are as follows:
|
(Dollars in thousands)
|
2010
|
2009
|
||||||
|
Commitments to extend credit
|
$ | 137,078 | $ | 147,339 | ||||
|
Letters of credit
|
15,586 | 18,957 | ||||||
|
Total
|
$ | 152,664 | $ | 166,296 | ||||
NOTE 22. CONTINGENCIES
In the normal course of business, the Company and its subsidiaries may become involved in litigation arising from banking, financial, and other activities. Management, after consultation with legal counsel, does not anticipate that the future liability, if any, arising out of current proceedings will have a material effect on the Company’s financial condition, operating results, or liquidity.
69
NOTE 23. PARENT COMPANY FINANCIAL INFORMATION
Condensed financial information for Shore Bancshares, Inc. (Parent Company Only) is as follows:
|
Condensed Balance Sheets
|
||||||||
|
December 31,
|
||||||||
|
(Dollars in thousands)
|
2010
|
2009
|
||||||
|
Assets
|
||||||||
|
Cash
|
$ | 1,344 | $ | 324 | ||||
|
Investment in subsidiaries
|
123,570 | 129,727 | ||||||
|
Premises and equipment, net
|
2,877 | 3,003 | ||||||
|
Other assets
|
1,422 | 1,705 | ||||||
|
Total assets
|
$ | 129,213 | $ | 134,759 | ||||
|
Liabilities
|
||||||||
|
Accrued interest payable
|
$ | 139 | $ | 149 | ||||
|
Short-term borrowings
|
- | 3,378 | ||||||
|
Deferred tax liability
|
1,458 | 1,275 | ||||||
|
Other liabilities
|
971 | 718 | ||||||
|
Long-term debt
|
4,132 | 1,429 | ||||||
|
Total liabilities
|
6,700 | 6,949 | ||||||
|
Stockholders’ equity
|
||||||||
|
Common stock
|
84 | 84 | ||||||
|
Warrant
|
1,543 | 1,543 | ||||||
|
Additional paid in capital
|
30,242 | 29,872 | ||||||
|
Retained earnings
|
92,458 | 96,151 | ||||||
|
Accumulated other comprehensive (loss) income
|
(1,814 | ) | 160 | |||||
|
Total stockholders’ equity
|
122,513 | 127,810 | ||||||
|
Total liabilities and stockholders’ equity
|
$ | 129,213 | $ | 134,759 | ||||
70
|
Condensed Statements of (Loss) Income
|
||||||||||||
|
For the Years Ended December 31,
|
||||||||||||
|
(Dollars in thousands)
|
2010
|
2009
|
2008
|
|||||||||
|
Income
|
||||||||||||
|
Dividends from subsidiaries
|
$ | 2,786 | $ | 5,725 | $ | 6,131 | ||||||
|
Management and other fees from subsidiaries
|
6,095 | 5,952 | 5,285 | |||||||||
|
Other income
|
70 | 76 | 76 | |||||||||
|
Interest income
|
1 | 68 | 20 | |||||||||
|
Total income
|
8,952 | 11,821 | 11,512 | |||||||||
|
Expenses
|
||||||||||||
|
Interest Expense
|
172 | 87 | 121 | |||||||||
|
Salaries and employee benefits
|
4,120 | 4,351 | 4,111 | |||||||||
|
Occupancy and equipment expense
|
494 | 427 | 367 | |||||||||
|
Other operating expenses
|
1,499 | 1,476 | 1,268 | |||||||||
|
Total expenses
|
6,285 | 6,341 | 5,867 | |||||||||
|
Income before income tax expense and equity in undistributed net income of subsidiaries
|
2,667 | 5,480 | 5,645 | |||||||||
|
Income tax expense (benefit)
|
151 | 125 | (86 | ) | ||||||||
|
Income before equity in undistributed net income of subsidiaries
|
2,516 | 5,355 | 5,731 | |||||||||
|
Equity in undistributed net (loss) income of subsidiaries
|
(4,183 | ) | 1,918 | 5,739 | ||||||||
|
Net (loss) income
|
(1,667 | ) | 7,273 | 11,470 | ||||||||
|
Preferred stock dividends and discount accretion
|
- | 1,876 | - | |||||||||
|
Net (loss) income available to common stockholders
|
$ | (1,667 | ) | $ | 5,397 | $ | 11,470 | |||||
71
|
Condensed Statements of Cash Flows
|
||||||||||||
|
For the Years Ended December 31,
|
||||||||||||
|
(Dollars in thousands)
|
2010
|
2009
|
2008
|
|||||||||
|
Cash flows from operating activities:
|
||||||||||||
|
Net (loss) income
|
$ | (1,667 | ) | $ | 7,273 | $ | 11,470 | |||||
|
Adjustments to reconcile net (loss) income to cash provided by operating activities:
|
||||||||||||
|
Equity in undistributed net loss (income) of subsidiaries
|
4,183 | (1,918 | ) | (5,739 | ) | |||||||
|
Depreciation
|
235 | 215 | 233 | |||||||||
|
Loss on disposals of premises and equipment
|
- | - | 1 | |||||||||
|
Stock-based compensation expense
|
390 | 102 | 91 | |||||||||
|
Excess tax benefits from stock-based arrangements
|
(20 | ) | (5 | ) | (4 | ) | ||||||
|
Net decrease (increase) in other assets
|
308 | (808 | ) | (169 | ) | |||||||
|
Net increase in other liabilities
|
406 | 114 | 592 | |||||||||
|
Net cash provided by operating activities
|
3,835 | 4,973 | 6,475 | |||||||||
|
Cash flows from investing activities:
|
||||||||||||
|
Purchases of premises and equipment
|
(109 | ) | (333 | ) | (122 | ) | ||||||
|
Investment in unconsolidated subsidiary
|
(25 | ) | - | - | ||||||||
|
Investment in subsidiaries
|
- | (3,400 | ) | (85 | ) | |||||||
|
Net cash used by investing activities
|
(134 | ) | (3,733 | ) | (207 | ) | ||||||
|
Cash flows from financing activities:
|
||||||||||||
|
Net (decrease) increase in short-term borrowings
|
(3,378 | ) | 3,378 | - | ||||||||
|
Proceeds from long-term debt
|
3,200 | - | - | |||||||||
|
Repayment of long-term debt
|
(497 | ) | (518 | ) | (538 | ) | ||||||
|
Excess tax benefits from stock-based arrangements
|
20 | 5 | 4 | |||||||||
|
Proceeds from issuance of preferred stock and warrant
|
- | 25,000 | - | |||||||||
|
Redemption of preferred stock
|
- | (23,525 | ) | - | ||||||||
|
Proceeds from issuance of common stock
|
- | 2 | 138 | |||||||||
|
Preferred stock dividends paid
|
- | (1,808 | ) | - | ||||||||
|
Common stock dividends paid
|
(2,026 | ) | (5,386 | ) | (5,377 | ) | ||||||
|
Net cash used by financing activities
|
(2,681 | ) | (2,852 | ) | (5,773 | ) | ||||||
|
Net increase (decrease) in cash and cash equivalents
|
1,020 | (1,612 | ) | 495 | ||||||||
|
Cash and cash equivalents at beginning of year
|
324 | 1,936 | 1,441 | |||||||||
|
Cash and cash equivalents at end of year
|
$ | 1,344 | $ | 324 | $ | 1,936 | ||||||
72
NOTE 24. QUARTERLY FINANCIAL RESULTS (unaudited)
A summary of selected consolidated quarterly financial data for the two years ended December 31, 2010, is reported as follows:
|
(In thousands, except per share data)
|
First
Quarter
|
Second
Quarter
|
Third
Quarter
|
Fourth
Quarter
|
||||||||||||
|
2010
|
||||||||||||||||
|
Interest income
|
$ | 13,828 | $ | 13,967 | $ | 13,837 | $ | 13,829 | ||||||||
|
Net interest income
|
10,395 | 10,691 | 10,687 | 10,866 | ||||||||||||
|
Provision for credit losses
|
7,617 | 4,917 | 4,193 | 4,392 | ||||||||||||
|
(Loss) income before income taxes
|
(2,661 | ) | 654 | (1,492 | ) | 1,340 | ||||||||||
|
Net (loss) income
|
(1,562 | ) | 445 | (1,400 | ) | 850 | ||||||||||
|
Basic (loss) earnings per common share
|
$ | (0.19 | ) | $ | 0.05 | $ | (0.17 | ) | $ | 0.10 | ||||||
|
Diluted (loss) earnings per common share
|
$ | (0.19 | ) | $ | 0.05 | $ | (0.17 | ) | $ | 0.10 | ||||||
|
2009
|
||||||||||||||||
|
Interest income
|
$ | 14,466 | $ | 14,630 | $ | 14,913 | $ | 14,780 | ||||||||
|
Net interest income
|
10,058 | 10,086 | 10,428 | 10,806 | ||||||||||||
|
Provision for credit losses
|
1,935 | 1,681 | 1,702 | 3,668 | ||||||||||||
|
Income before income taxes
|
3,590 | 3,059 | 3,148 | 1,888 | ||||||||||||
|
Net income
|
2,213 | 1,893 | 1,951 | 1,216 | ||||||||||||
|
Preferred stock dividends and discount accretion
|
337 | 1,539 | - | - | ||||||||||||
|
Net income available to common stockholders
|
1,876 | 354 | 1,951 | 1,216 | ||||||||||||
|
Basic earnings per common share
|
$ | 0.22 | $ | 0.04 | $ | 0.23 | $ | 0.14 | ||||||||
|
Diluted earnings per common share
|
$ | 0.22 | $ | 0.04 | $ | 0.23 | $ | 0.14 | ||||||||
Earnings per share are based on quarterly results and may not be additive to the annual earnings per share amounts.
NOTE 25. SEGMENT REPORTING
The Company operates two primary business segments: Community Banking and Insurance Products and Services. The Community Banking business provides services to consumers and small businesses on the Eastern Shore of Maryland and in Delaware through its 19-branch network. Community banking activities include small business services, retail brokerage, trust services and consumer banking products and services. Loan products available to consumers include mortgage, home equity, automobile, marine, and installment loans, credit cards and other secured and unsecured personal lines of credit. Small business lending includes commercial mortgages, real estate development loans, equipment and operating loans, as well as secured and unsecured lines of credit, credit cards, accounts
receivable financing arrangements, and merchant card services. As a result of the 2010 annual assessment for goodwill impairment, it was determined that goodwill at Felton Bank, one of the banks in our Community Banking segment, was impaired. The Company recorded goodwill impairment charges of $1.5 million reflected in the table below in noninterest expense.
Through the Insurance Products and Services business, the Company provides a full range of insurance products and services to businesses and consumers in the Company’s market areas. Products include property and casualty, life, marine, individual health and long-term care insurance. Pension and profit sharing plans and retirement plans for executives and employees are available to suit the needs of individual businesses. As a result of the 2010 annual assessment for goodwill and other intangible assets impairment, it was determined that goodwill and other intangible assets at TSGIA, a wholesale insurance agency in our Insurance Products and Services segment, were impaired. The Company recorded goodwill impairment charges of $1.5 million and other intangible
assets impairment charges of $51 thousand reflected in the table below in noninterest expense.
73
Selected financial information by business segments is included in the following table:
|
Community
|
Insurance Products
|
Parent
|
||||||||||||||
|
(Dollars in thousands)
|
Banking
|
and Services
|
Company
|
Total
|
||||||||||||
|
2010
|
||||||||||||||||
|
Interest income
|
$ | 55,293 | $ | 168 | $ | - | $ | 55,461 | ||||||||
|
Interest expense
|
(12,752 | ) | - | (70 | ) | (12,822 | ) | |||||||||
|
Provision for credit losses
|
(21,119 | ) | - | - | (21,119 | ) | ||||||||||
|
Noninterest income
|
7,308 | 10,739 | (6 | ) | 18,041 | |||||||||||
|
Noninterest expense
|
(24,328 | ) | (11,410 | ) | (5,982 | ) | (41,720 | ) | ||||||||
|
Net intersegment (expense) income
|
(5,418 | ) | (521 | ) | 5,939 | - | ||||||||||
|
(Loss) income before taxes
|
(1,016 | ) | (1,024 | ) | (119 | ) | (2,159 | ) | ||||||||
|
Income tax benefit (expense)
|
232 | 233 | 27 | 492 | ||||||||||||
|
Net (loss) income
|
$ | (784 | ) | $ | (791 | ) | $ | (92 | ) | $ | (1,667 | ) | ||||
|
Total assets
|
$ | 1,108,712 | $ | 18,759 | $ | 2,840 | $ | 1,130,311 | ||||||||
|
2009
|
||||||||||||||||
|
Interest income
|
$ | 58,722 | $ | 67 | $ | - | $ | 58,789 | ||||||||
|
Interest expense
|
(17,324 | ) | - | (87 | ) | (17,411 | ) | |||||||||
|
Provision for credit losses
|
(8,986 | ) | - | - | (8,986 | ) | ||||||||||
|
Noninterest income
|
7,774 | 11,767 | - | 19,541 | ||||||||||||
|
Noninterest expense
|
(23,256 | ) | (10,882 | ) | (6,110 | ) | (40,248 | ) | ||||||||
|
Net intersegment (expense) income
|
(5,481 | ) | (470 | ) | 5,951 | - | ||||||||||
|
Income (loss) before taxes
|
11,449 | 482 | (246 | ) | 11,685 | |||||||||||
|
Income tax (expense) benefit
|
(4,323 | ) | (182 | ) | 93 | (4,412 | ) | |||||||||
|
Net income (loss)
|
$ | 7,126 | $ | 300 | $ | (153 | ) | $ | 7,273 | |||||||
|
Total assets
|
$ | 1,133,673 | $ | 19,390 | $ | 3,453 | $ | 1,156,516 | ||||||||
|
2008
|
||||||||||||||||
|
Interest income
|
$ | 61,400 | $ | 74 | $ | - | $ | 61,474 | ||||||||
|
Interest expense
|
(21,434 | ) | - | (121 | ) | (21,555 | ) | |||||||||
|
Provision for credit losses
|
(3,337 | ) | - | - | (3,337 | ) | ||||||||||
|
Noninterest income
|
7,644 | 12,707 | (1 | ) | 20,350 | |||||||||||
|
Noninterest expense
|
(20,864 | ) | (11,967 | ) | (5,539 | ) | (38,370 | ) | ||||||||
|
Net intersegment (expense) income
|
(4,763 | ) | (412 | ) | 5,175 | - | ||||||||||
|
Income (loss) before taxes
|
18,646 | 402 | (486 | ) | 18,562 | |||||||||||
|
Income tax (expense) benefit
|
(7,124 | ) | (154 | ) | 186 | (7,092 | ) | |||||||||
|
Net income (loss)
|
$ | 11,522 | $ | 248 | $ | (300 | ) | $ | 11,470 | |||||||
|
Total assets
|
$ | 1,021,715 | $ | 20,146 | $ | 2,780 | $ | 1,044,641 | ||||||||
NOTE 26. PREFERRED STOCK
On January 9, 2009, Shore Bancshares, Inc. participated in the Troubled Asset Relief Program Capital Purchase Program of the United States Department of the Treasury (the “Treasury”) by issuing 25,000 shares of Fixed Rate Cumulative Perpetual Preferred Stock, Series A (the “Preferred Stock”) and a common stock purchase warrant covering 172,970 shares of common stock (the “Warrant”) to the Treasury for a total sales price of $25 million. On April 15, 2009, Shore Bancshares, Inc. redeemed all 25,000 shares of the Preferred Stock from Treasury for $25 million, plus accrued dividends of $208 thousand. At the time of the redemption, the Preferred Stock had a carrying value of $23.5 million. The difference between the redemption price and carrying
value represented an additional accelerated deemed dividend of $1.5 million. Total dividends paid on the Preferred Stock was $1.8 million for 2009. Shore Bancshares, Inc. has the right to repurchase the Warrant at its fair market value, but has not yet decided to do so. The Treasury must liquidate any portion of the Warrant not repurchased by Shore Bancshares, Inc. The Warrant may be exercised at any time until January 9, 2019, at an exercise price of $21.68 per share, or an aggregate exercise price of approximately $3.75 million. The Warrant counts as tangible common equity.
74
|
Item 9.
|
Changes in and Disagreements with Accountants on Accounting and Financial Disclosure.
|
None.
|
Item 9A.
|
Controls and Procedures.
|
The Company maintains disclosure controls and procedures that are designed to ensure that information required to be disclosed in the Company’s reports filed under the Exchange Act with the SEC, such as this annual report, is recorded, processed, summarized and reported within the time periods specified in those rules and forms, and that such information is accumulated and communicated to the Company’s management, including the President and Chief Executive Officer (“CEO”) and the Principal Accounting Officer (“PAO”), as appropriate, to allow for timely decisions regarding required disclosure. A control system, no matter how well conceived and operated, can provide only reasonable, not absolute, assurance that the objectives of the control system are
met. Further, the design of a control system must reflect the fact that there are resource constraints, and the benefits of controls must be considered relative to their costs. These inherent limitations include the realities that judgments in decision-making can be faulty, and that breakdowns can occur because of simple error or mistake. Additionally, controls can be circumvented by the individual acts of some persons, by collusion of two or more people, or by management override of the control. The design of any system of controls also is based in part upon certain assumptions about the likelihood of future events, and there can be no assurance that any design will succeed in achieving its stated goals under all potential future conditions; over time, control may become inadequate because of changes in conditions, or the degree of compliance with the policies or procedures may deteriorate.
An evaluation of the effectiveness of these disclosure controls as of December 31, 2010 was carried out under the supervision and with the participation of the Company’s management, including the CEO and the PAO. Based on that evaluation, the Company’s management, including the CEO and the PAO, has concluded that the Company’s disclosure controls and procedures are, in fact, effective at the reasonable assurance level.
During the fourth quarter of 2010, there was no change in the Company’s internal control over financial reporting that has materially affected, or is reasonably likely to materially affect, the Company’s internal control over financial reporting.
As required by Section 404 of the Sarbanes-Oxley Act of 2002, management has performed an evaluation and testing of the Company’s internal control over financial reporting as of December 31, 2010. Management’s report on the Company’s internal control over financial reporting and the related attestation report of the Company’s independent registered public accounting firm are included in Item 8 of Part II of this annual report, and each such report is incorporated into this Item 9A by reference thereto.
Item 9B. Other Information.
None.
PART III
|
Item 10.
|
Directors, Executive Officers and Corporate Governance.
|
The Company has adopted a Code of Ethics that applies to all of its directors, officers, and employees, including its principal executive officer, principal financial officer, principal accounting officer, or controller, or persons performing similar functions. A written copy of the Company’s Code of Ethics will be provided to stockholders, free of charge, upon request to: W. David Morse, Secretary, Shore Bancshares, Inc., 18 E. Dover Street, Easton, Maryland 21601 or (410) 822-1400.
All other information required by this item is incorporated herein by reference to the Company’s definitive proxy statement to be filed in connection with the 2011 Annual Meeting of Stockholders.
|
Item 11.
|
Executive Compensation.
|
The information required by this item is incorporated herein by reference to the Company’s definitive proxy statement to be filed in connection with the 2011 Annual Meeting of Stockholders.
75
|
Item 12.
|
Security Ownership of Certain Beneficial Owners and Management and Related Stockholder Matters.
|
EQUITY COMPENSATION PLAN INFORMATION
The Company maintains two equity compensation plans under which it may issue shares of common stock or grant other equity-based awards to employees, officers, and/or directors of the Company and its subsidiaries: (i) the Shore Bancshares, Inc. 2006 Stock and Incentive Compensation Plan (the “2006 Plan”), which authorizes the grant of stock options, stock appreciation rights, stock awards, stock units, and performance units; and (ii) the Shore Bancshares, Inc. 1998 Stock Option Plan, which authorizes the grant of stock options (the “1998 Option Plan”). The Company’s ability to grant options under the 1998 Option Plan expired on March 3, 2008 pursuant to the terms of that plan, but stock options granted under that plan were outstanding as of December 31,
2010. Each of these plans was approved by the Company’s Board of Directors and its stockholders.
The following table contains information about these equity compensation plans as of December 31, 2010:
|
Plan Category
|
Number of securities to be
issued upon exercise of
outstanding options,
warrants and rights
|
Weighted-average exercise
price of outstanding
options, warrants, and
rights
|
Number of securities
remaining available for
future issuance under
equity compensation plans
[excluding securities
reflected in column (a)]
|
|||||||||
|
(a)
|
(b)
|
(c)
|
||||||||||
|
Equity compensation plans approved by security holders (1)
|
8,420 | $ | 13.17 | 575,217 | ||||||||
|
Equity compensation plans not approved by security holders
|
- | - | - | |||||||||
|
Total
|
8,420 | $ | 13.17 | 575,217 | ||||||||
|
(1)
|
In addition to stock options and stock appreciation rights, the 2006 Plan permits the grant of stock awards, stock units, and performance units, and the shares available for issuance shown in column (c) may be granted pursuant to such awards. Subject to the anti-dilution provisions of the Omnibus Plan, the maximum number of shares of restricted stock that may be granted to any participant in any calendar year is 45,000; the maximum number of restricted stock units that may be granted to any one participant in any calendar year is 45,000; and the maximum dollar value of performance units that may be granted to any one participant in any calendar year is $1,500,000. As of December 31, 2010, the Company has granted 56,755 shares of restricted stock that are not reflected in column (a) of this table.
|
All other information required by this item is incorporated herein by reference to the Company’s definitive proxy statement to be filed in connection with the 2011 Annual Meeting of Stockholders.
|
Item 13.
|
Certain Relationships and Related Transactions, and Director Independence.
|
The information required by this item is incorporated herein by reference to the Company’s definitive proxy statement to be filed in connection with the 2011 Annual Meeting of Stockholders.
|
Item 14.
|
Principal Accountant Fees and Services.
|
The information required by this item is incorporated herein by reference to the Company’s definitive proxy statement to be filed in connection with the 2011 Annual Meeting of Stockholders.
76
PART IV
|
Item 15.
|
Exhibits and Financial Statement Schedules.
|
(a)(1), (2) and (c) Financial statements and schedules:
Report of Independent Registered Public Accounting Firm
Consolidated Balance Sheets at December 31, 2010 and 2009
Consolidated Statements of (Loss) Income — Years Ended December 31, 2010, 2009, and 2008
Consolidated Statements of Changes in Stockholders’ Equity — Years Ended December 31, 2010, 2009, and 2008
Consolidated Statements of Comprehensive (Loss) Income — Years Ended December 31, 2010, 2009, and 2008
Consolidated Statements of Cash Flows — Years Ended December 31, 2010, 2009, and 2008
Notes to Consolidated Financial Statements for the years ended December 31, 2010, 2009, and 2008
(a)(3) and (b) Exhibits required to be filed by Item 601 of Regulation S-K:
The exhibits filed or furnished with this annual report are shown on the Exhibit Index that follows the signatures to this annual report, which index is incorporated herein by reference.
SIGNATURES
Pursuant to the requirements of Section 13 or 15(d) of the Securities Exchange Act of 1934, the Registrant has caused this report to be signed on its behalf by the undersigned, thereunto duly authorized.
|
Shore Bancshares, Inc.
|
||
|
Date: March 15, 2011
|
By:
|
/s/ W. Moorhead Vermilye
|
|
W. Moorhead Vermilye
|
||
|
Chief Executive Officer
|
||
Pursuant to the requirements of the Securities Exchange Act of 1934, this report has been signed below by the following persons on behalf of the Registrant and in the capacities and on the dates indicated.
|
/s/ Herbert L. Andrew, III
|
Director
|
March 15, 2011
|
||
|
Herbert L. Andrew, III
|
||||
|
/s/ Blenda W. Armistead
|
Director
|
March 15, 2011
|
||
|
Blenda W. Armistead
|
||||
|
/s/ Lloyd L. Beatty, Jr.
|
Director
|
March 15, 2011
|
||
|
Lloyd L. Beatty, Jr.
|
||||
|
/s/ William W. Duncan
|
Director
|
March 15, 2011
|
||
|
William W. Duncan
|
||||
|
/s/ James A. Judge
|
Director
|
March 15, 2011
|
||
|
James A. Judge
|
||||
|
/s/ Neil R. LeCompte
|
Director
|
March 15, 2011
|
||
|
Neil R. LeCompte
|
||||
|
/s/ Jerry F. Pierson
|
Director
|
March 15, 2011
|
||
|
Jerry F. Pierson
|
||||
|
/s/ Christopher F. Spurry
|
Director
|
March 15, 2011
|
||
|
Christopher F. Spurry
|
||||
|
/s/ F. Winfield Trice, Jr.
|
Director
|
March 15, 2011
|
||
|
F. Winfield Trice, Jr.
|
||||
|
/s/ John H. Wilson
|
Director
|
March 15, 2011
|
||
|
John H. Wilson
|
||||
|
/s/ W. Moorhead Vermilye
|
Director
|
March 15, 2011
|
||
|
W. Moorhead Vermilye
|
Chief Executive Officer
|
|||
|
/s/ Susan E. Leaverton
|
Treasurer/
|
March 15, 2011
|
||
|
Susan E. Leaverton
|
|
Principal Accounting Officer
|
|
77
EXHIBIT LIST
|
Exhibit No.
|
Description
|
|
|
3.1(i)
|
Amended and Restated Articles of Incorporation (incorporated by reference to Exhibit 3.1 of the Company’s Form 8-K filed on December 14, 2000)
|
|
|
3.1(ii)
|
Articles Supplementary relating to the Fixed Rate Cumulative Perpetual Preferred Stock, Series A (incorporated by reference Exhibit 4.1 of the Company’s Form 8-K filed on January 13, 2009)
|
|
|
3.1(iii)
|
Articles Supplementary relating to the reclassification of Fixed Rate Cumulative Perpetual Preferred Stock, Series A, as common stock (incorporated by reference Exhibit 3.1(i) of the Company’s Form 8-K filed on June 17, 2009)
|
|
|
3.2(i)
|
Amended and Restated By-Laws (filed herewith)
|
|
|
3.2(ii)
|
First Amendment to Amended and Restated By-Laws (filed herewith)
|
|
|
3.2(iii)
|
Second Amendment to Amended and Restated By-Laws (filed herewith)
|
|
|
3.2(iv)
|
Third Amendment to Amended and Restated By-Laws (filed herewith)
|
|
|
4.1
|
Letter Agreement, including the related Securities Purchase Agreement – Standard Terms, dated January 9, 2009 by and between the Company and the U.S. Department of Treasury (incorporated by reference to Exhibit 10.1 of the Company’s Form 8-K filed on January 13, 2009)
|
|
|
4.2
|
Letter Agreement dated as of April 15, 2009 between the Company and the U.S. Department of the Treasury (incorporated by reference to Exhibit 10.1 to the Company’s Form 8-K filed on April 16, 2009)
|
|
|
4.3
|
Substitute Common Stock Purchase Warrant dated January 9, 2009 issued to the U.S. Department of Treasury (incorporated by reference to Exhibit 4.1 of the Company’s Form 8-K filed on June 4, 2009)
|
|
|
10.1
|
Form of Employment Agreement with W. Moorhead Vermilye (incorporated by reference to Appendix XIII of Exhibit 2.1 of the Company’s Form 8-K filed on July 31, 2000).
|
|
|
10.2
|
Summary of Compensation Arrangement for Lloyd L. Beatty, Jr. (incorporated by reference to Exhibit 10.1 of the Company’s Form 8-K filed on August 1, 2006).
|
|
|
10.3
|
Amended Summary of Compensation Arrangement for William W. Duncan, Jr. (incorporated by reference to Exhibit 10.1 of the Company’s Form 8-K filed on February 14, 2007, as amended by Form 8-K/A filed on May 3, 2007).
|
|
|
10.4
|
Summary of Compensation Arrangement between Centreville National Bank and F. Winfield Trice, Jr. (incorporated by reference to Exhibit 10.1 of the Company’s Form 8-K filed on August 13, 2007).
|
|
|
10.5
|
Employment Agreement between The Avon-Dixon Agency, LLC and Mark M. Freestate (incorporated by reference to Exhibit 10.6 of the Company’s Annual Report on Form 10-K for the year ended December 31, 2006).
|
|
|
10.6
|
Shore Bancshares, Inc. Management Incentive Plan (incorporated by reference to Exhibit 10.1 of the Company’s Form 8-K filed on April 21, 2010).
|
|
|
10.7
|
Shore Bancshares, Inc. Amended and Restated Executive Deferred Compensation Plan (incorporated by reference to Exhibit 10.2 of the Company’s Form 8-K filed on February 14, 2007)
|
|
|
10.8
|
Deferral Election, Investment Designation, and Beneficiary Designation Forms under the Shore Bancshares, Inc. Amended and Restated Executive Deferred Compensation Plan (incorporated herein by reference to Exhibit 10.1 to the Company’s Form 8-K filed on October 2, 2006).
|
78
|
10.9
|
Form of Centreville National Bank of Maryland Director Indexed Fee Continuation Plan Agreement with Messrs. Freestate and Pierson (incorporated by reference to Exhibit 10.2 to the Company’s Form 8-K filed on December 12, 2006).
|
|
|
10.10
|
Form of Amended and Restated Director Indexed Fee Continuation Plan Agreement between Centreville National Bank and Messrs. Freestate and Pierson (incorporated by reference to Exhibit 10.2 of the Company’s Current Report on Form 8-K filed on January 7, 2009).
|
|
|
10.11
|
Form of Centreville National Bank Life Insurance Endorsement Split Dollar Plan Agreement with Messrs. Freestate and Pierson (incorporated by reference to Exhibit 10.3 to the Company’s Form 8-K filed on December 12, 2006).
|
|
|
10.12
|
Talbot Bank of Easton, Maryland Supplemental Deferred Compensation Plan (incorporated by reference to Exhibit 10.7 of the Company’s Quarterly Report on Form 10-Q for the period ended September 30, 2005).
|
|
|
10.13
|
First Amendment to The Talbot Bank of Easton, Maryland Supplemental Deferred Compensation Plan for the benefit of W. Moorhead Vermilye (incorporated by reference to Exhibit 10.1 of the Company’s Current Report on Form 8-K filed on January 7, 2009).
|
|
|
10.14
|
Talbot Bank of Easton, Maryland Supplemental Deferred Compensation Plan Trust Agreement (incorporated by reference to Exhibit 10.7 of the Company’s Quarterly Report on Form 10-Q for the period ended September 30, 2005).
|
|
|
10.15
|
1998 Stock Option Plan (incorporated by reference to Exhibit 10 of the Company’s Registration Statement on Form S-8 filed with the SEC on September 25, 1998 (Registration No. 333-64319)).
|
|
|
10.16
|
Talbot Bancshares, Inc. Employee Stock Option Plan (incorporated by reference to Exhibit 10 of the Company’s Registration Statement on Form S-8 filed May 4, 2001 (Registration No. 333-60214)).
|
|
|
10.17
|
Shore Bancshares, Inc. 2006 Stock and Incentive Compensation Plan (incorporated by reference to Appendix A of the Company’s 2006 definitive proxy statement filed on March 24, 2006).
|
|
|
10.18
|
Form of Restricted Stock Award Agreement under the 2006 Stock and Incentive Compensation Plan (incorporated by reference to Exhibit 10.1 to the Company’s Form 8-K filed on April 11, 2007).
|
|
|
10.19
|
Changes to Director Compensation Arrangements (incorporated by reference to Exhibit 10.1 of the Company’s Form 8-K filed on February 6, 2006).
|
|
|
21
|
Subsidiaries of the Company (included in the “BUSINESS—General” section of Item 1 of Part I of this Annual Report on Form 10-K).
|
|
|
23
|
Consent of Stegman & Company (filed herewith).
|
|
|
31.1
|
Certifications of the CEO pursuant to Section 302 of the Sarbanes-Oxley Act (filed herewith).
|
|
|
31.2
|
Certifications of the PAO pursuant to Section 302 of the Sarbanes-Oxley Act (filed herewith).
|
|
|
32
|
|
Certification pursuant to Section 906 of the Sarbanes-Oxley Act (furnished herewith).
|
79