Attached files
| file | filename |
|---|---|
| EX-99.1 - EX-99.1 - eHealth, Inc. | exhibit9912020q2earnin.htm |
| 8-K - 8-K - eHealth, Inc. | ehth-20200723.htm |

Q2 2020 Financial Results Conference Call Slides July 23, 2020
Safe Harbor Statement Forward-Looking Statements This presentation includes forward-looking statements within the meaning of the federal securities laws. Forward-looking statements generally relate to future events or our future financial or operating performance. Forward-looking statements in this presentation include, but are not limited to, the following: our long term financial goals, including projections and targets for revenue, adjusted EBITDA, adjusted EBITDA margin, operating cash flow, and lifetime values; our estimates regarding Medicare membership; our expectations of Medicare Major Medical online application percentage and Medicare Advantage Plan member turnover rate; and our guidance for the full year ending December 31, 2020, including our guidance for total revenue and revenue from our Medicare segment and our Individual, Family and Small Business segment, GAAP net income, Adjusted EBITDA, profit from our Medicare segment and our Individual, Family and Small Business segment, Corporate shared service expense, cash used in operations and cash used for capital expenditures, and GAAP net income per diluted share and non-GAAP net income per diluted share. Our expectations and beliefs regarding these matters may not materialize, and actual results in future periods are subject to risks and uncertainties that could cause actual results to differ materially from those projected. These risks include those set forth in our filings with the Securities and Exchange Commission, including our latest Form 10-Q and 10-K. The forward-looking statements in this presentation are based on information available to us as of today, and we disclaim any obligation to update any forward looking statements, except as required by law. Non-GAAP Information This presentation includes both GAAP and non-GAAP financial measures. The presentation of non-GAAP financial information is not intended to be considered in isolation or as a substitute for results prepared in accordance with GAAP. A reconciliation of the non-GAAP financial measures included in this presentation to the most directly comparable GAAP financial measures is available in the earnings release issued by eHealth, Inc. on July 23, 2020 announcing its second quarter 2020 results. However, we have not reconciled our projected EBITDA from 2021 through 2024 to our projected GAAP net income, because we cannot reasonably predict certain items in the reconciliation, including stock-based compensation expense and provision to income taxes, and the reconciliation is not available without unreasonable effort. Management uses both GAAP and non-GAAP information in evaluating and operating its business internally and as such has determined that it is important to provide this information to investors. . 1
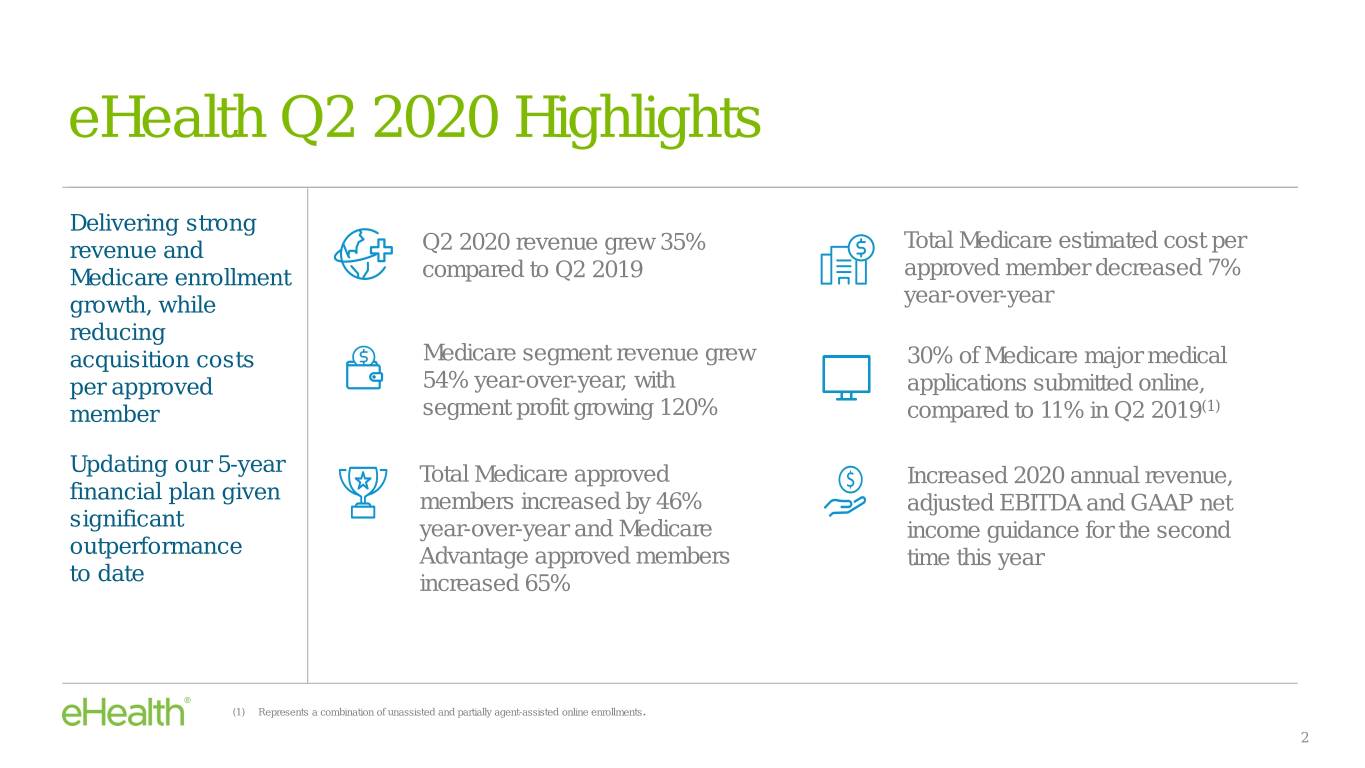
eHealth Q2 2020 Highlights Delivering strong revenue and Q2 2020 revenue grew 35% Total Medicare estimated cost per Medicare enrollment compared to Q2 2019 approved member decreased 7% growth, while year-over-year reducing acquisition costs Medicare segment revenue grew 30% of Medicare major medical per approved 54% year-over-year, with applications submitted online, member segment profit growing 120% compared to 11% in Q2 2019(1) Updating our 5-year Total Medicare approved Increased 2020 annual revenue, financial plan given members increased by 46% adjusted EBITDA and GAAP net significant year-over-year and Medicare income guidance for the second outperformance Advantage approved members time this year to date increased 65% (1) Represents a combination of unassisted and partially agent-assisted online enrollments. 2
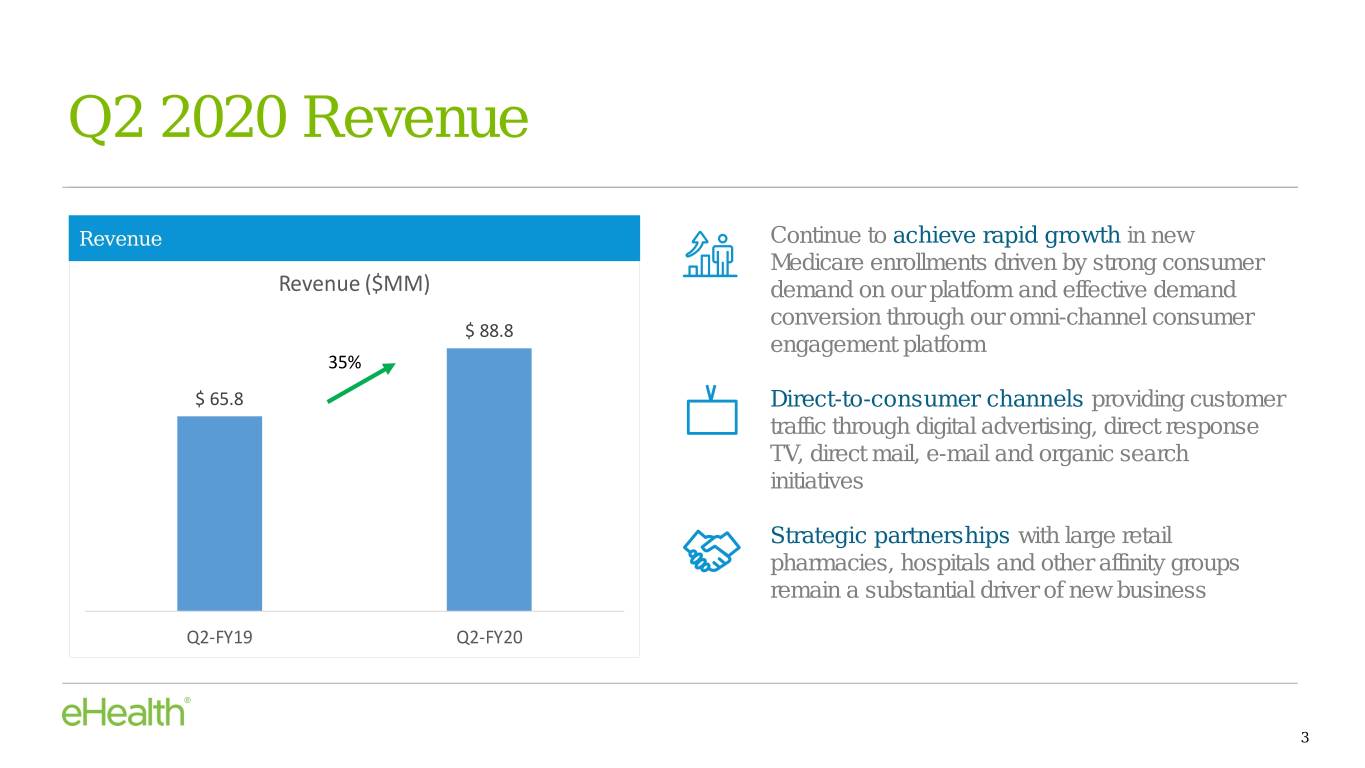
Q2 2020 Revenue Revenue Continue to achieve rapid growth in new Medicare enrollments driven by strong consumer Revenue ($MM) demand on our platform and effective demand conversion through our omni-channel consumer $ 88.8 engagement platform 35% $ 65.8 Direct-to-consumer channels providing customer traffic through digital advertising, direct response TV, direct mail, e-mail and organic search initiatives Strategic partnerships with large retail pharmacies, hospitals and other affinity groups remain a substantial driver of new business Q2-FY19 Q2-FY20 3
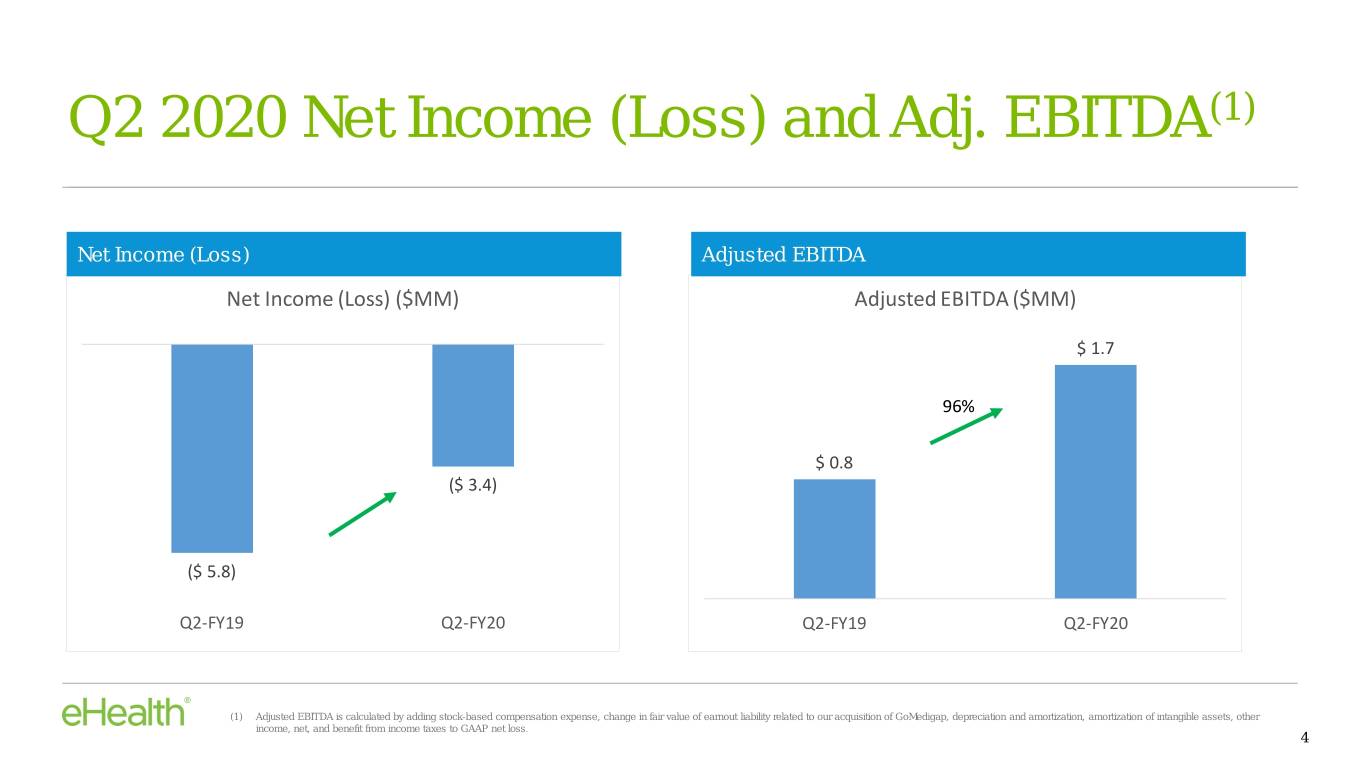
Q2 2020 Net Income (Loss) and Adj. EBITDA(1) Net Income (Loss) Adjusted EBITDA Net Income (Loss) ($MM) Adjusted EBITDA ($MM) $ 1.7 96% $ 0.8 ($ 3.4) 41% ($ 5.8) Q2-FY19 Q2-FY20 Q2-FY19 Q2-FY20 Exceeded expectations due to significant growth in Medicare enrollments (1) Adjusted EBITDA is calculated by adding stock-based compensation expense, change in fair value of earnout liability related to our acquisition of GoMedigap, depreciation and amortization, amortization of intangible assets, other income, net, and benefit from income taxes to GAAP net loss. 4
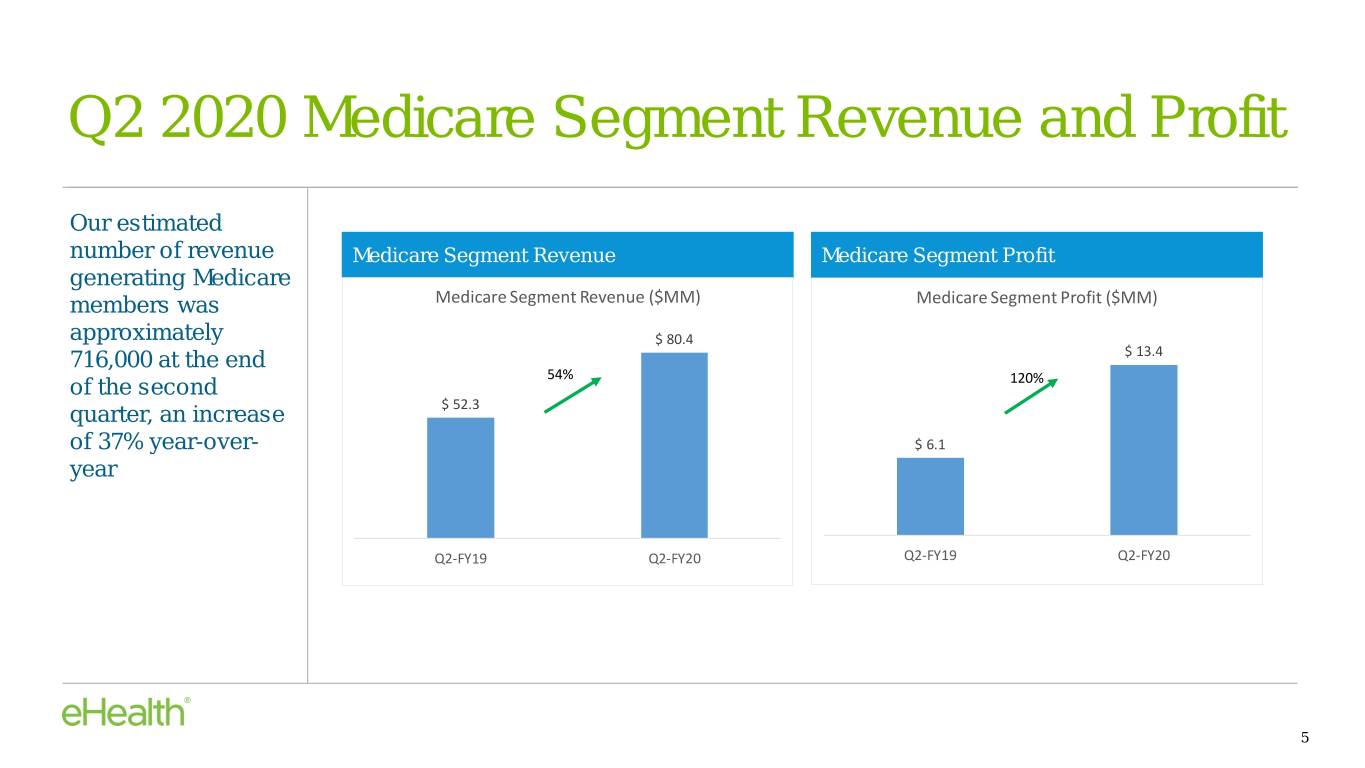
Q2 2020 Medicare Segment Revenue and Profit Our estimated number of revenue Medicare Segment Revenue Medicare Segment Profit generating Medicare members was Medicare Segment Revenue ($MM) Medicare Segment Profit ($MM) approximately $ 80.4 716,000 at the end $ 13.4 54% of the second 120% quarter, an increase $ 52.3 of 37% year-over- $ 6.1 year Q2-FY19 Q2-FY20 Q2-FY19 Q2-FY20 5
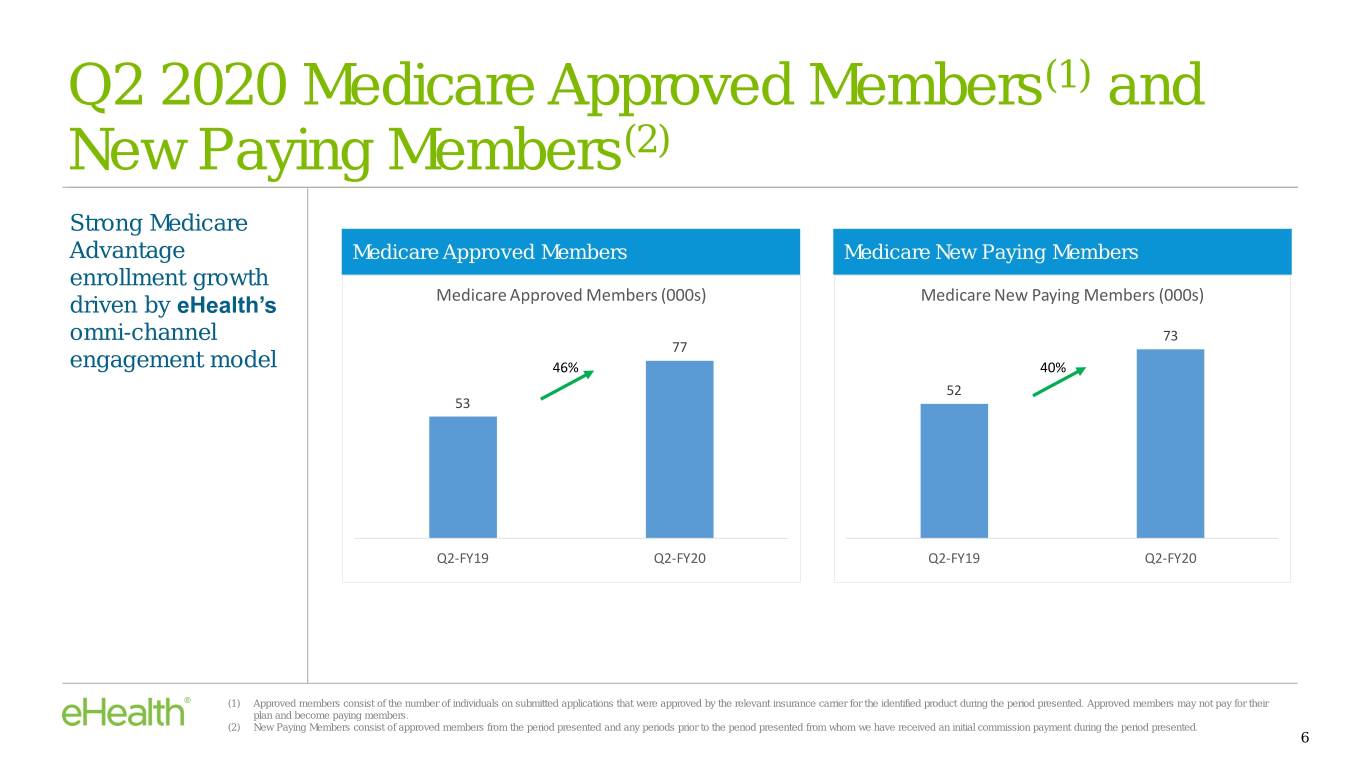
Q2 2020 Medicare Approved Members(1) and New Paying Members(2) Strong Medicare Advantage Medicare Approved Members Medicare New Paying Members enrollment growth driven by eHealth’s Medicare Approved Members (000s) Medicare New Paying Members (000s) omni-channel 73 77 engagement model 46% 40% 52 53 Q2-FY19 Q2-FY20 Q2-FY19 Q2-FY20 (1) Approved members consist of the number of individuals on submitted applications that were approved by the relevant insurance carrier for the identified product during the period presented. Approved members may not pay for their plan and become paying members. (2) New Paying Members consist of approved members from the period presented and any periods prior to the period presented from whom we have received an initial commission payment during the period presented. 6
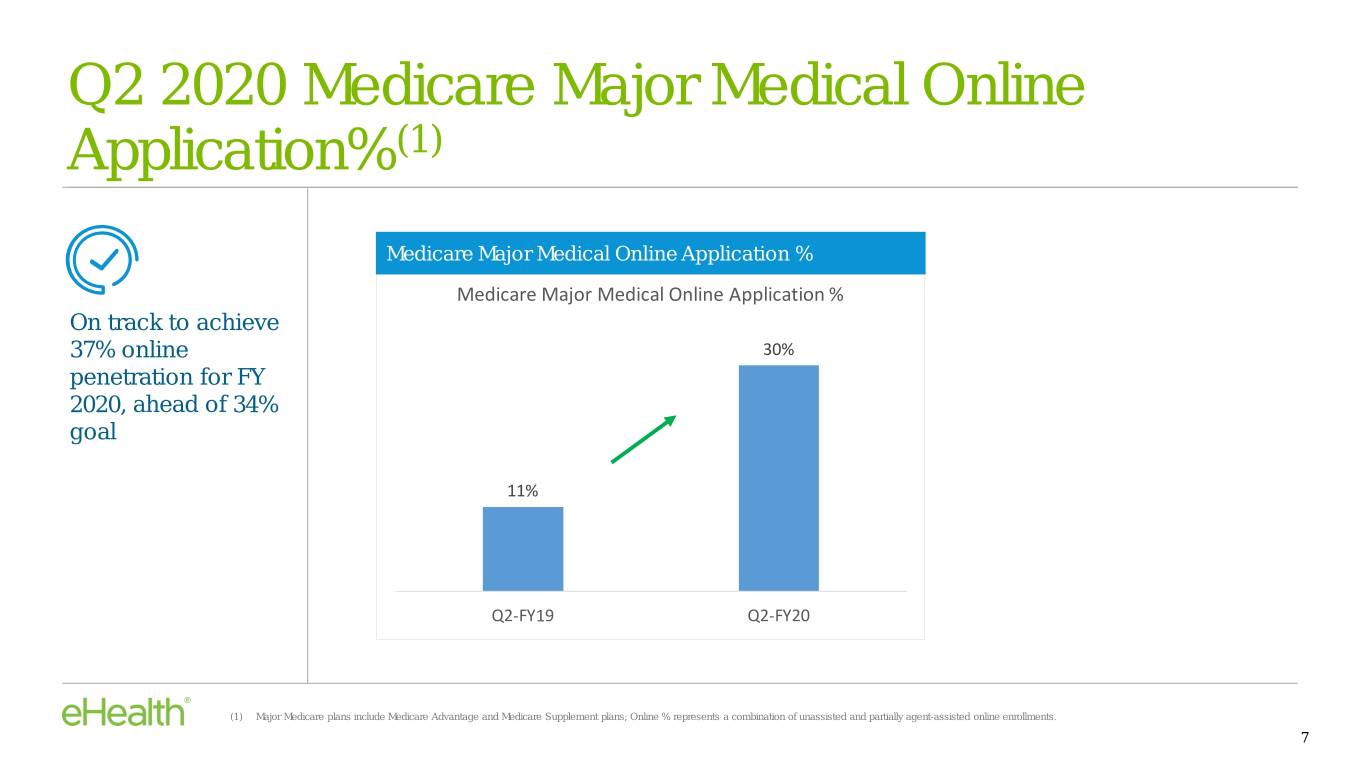
Q2 2020 Medicare Major Medical Online Application%(1) Medicare Major Medical Online Application % Medicare Major Medical Online Application % On track to achieve 37% online 30% penetration for FY 2020, ahead of 34% goal 11% Q2-FY19 Q2-FY20 (1) Major Medicare plans include Medicare Advantage and Medicare Supplement plans; Online % represents a combination of unassisted and partially agent-assisted online enrollments. 7
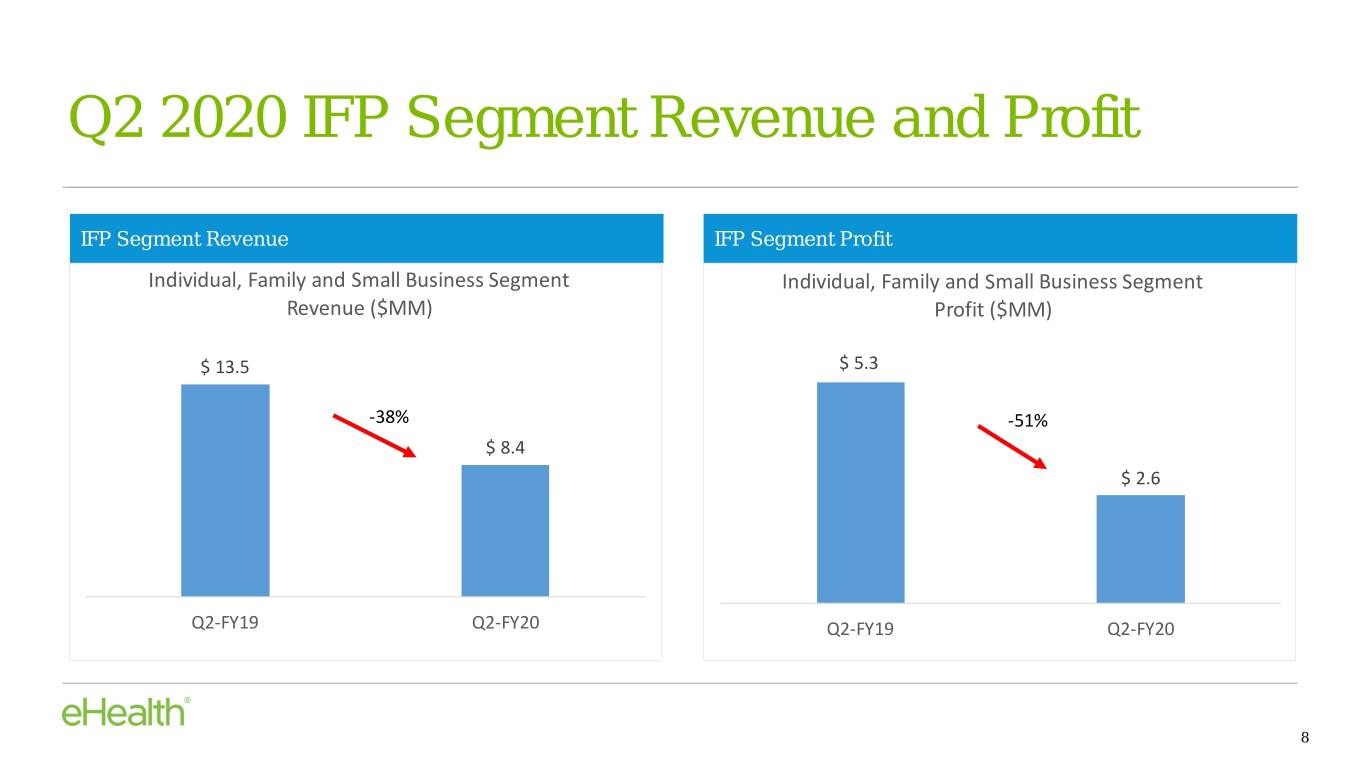
Q2 2020 IFP Segment Revenue and Profit IFP Segment Revenue IFP Segment Profit Individual, Family and Small Business Segment Individual, Family and Small Business Segment Revenue ($MM) Profit ($MM) $ 13.5 $ 5.3 -38% -51% $ 8.4 $ 2.6 Q2-FY19 Q2-FY20 Q2-FY19 Q2-FY20 8
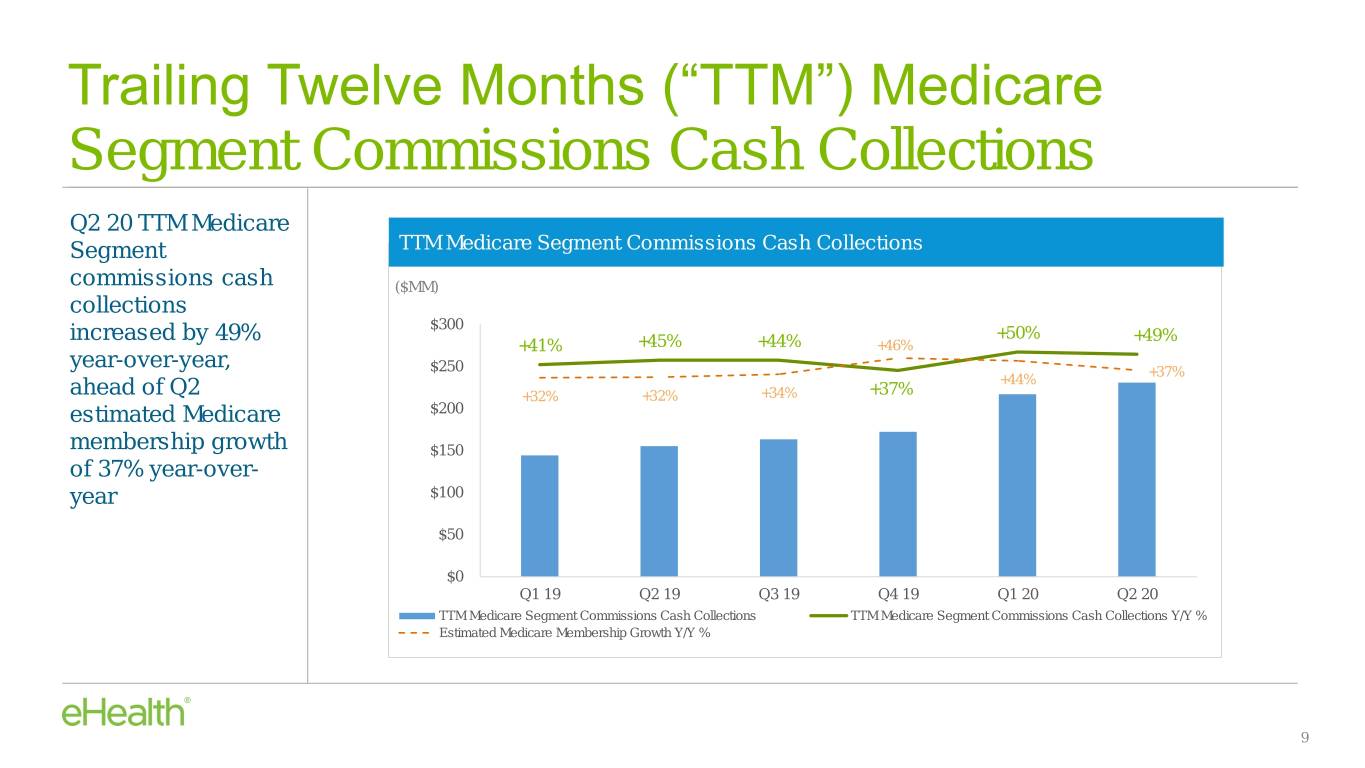
Trailing Twelve Months (“TTM”) Medicare Segment Commissions Cash Collections Q2 20 TTM Medicare Segment TTM Medicare Segment Commissions Cash Collections commissions cash ($MM) collections $300 increased by 49% +50% +49% +41% +45% +44% +46% year-over-year, $250 +37% +44% ahead of Q2 +32% +32% +34% +37% estimated Medicare $200 membership growth $150 of 37% year-over- year $100 $50 $0 Q1 19 Q2 19 Q3 19 Q4 19 Q1 20 Q2 20 TTM Medicare Segment Commissions Cash Collections TTM Medicare Segment Commissions Cash Collections Y/Y % Estimated Medicare Membership Growth Y/Y % 9
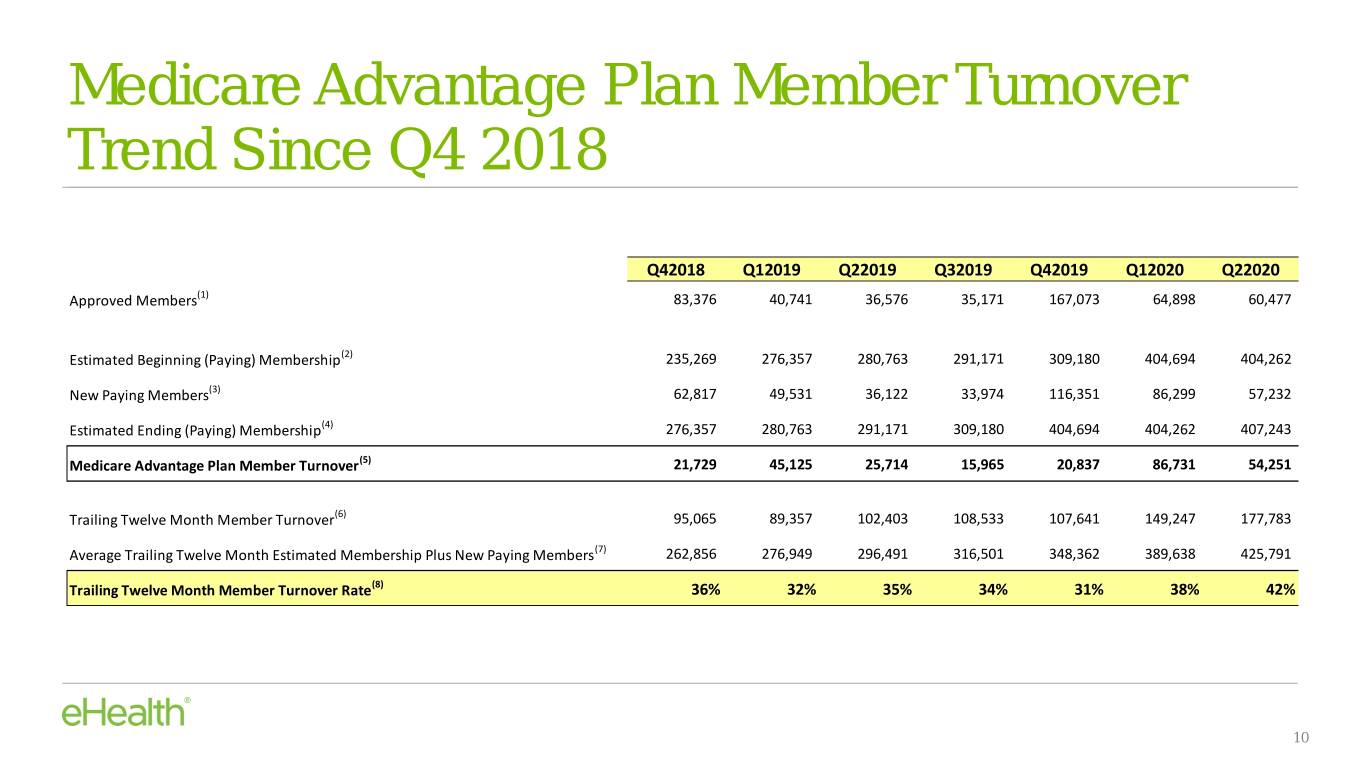
Medicare Advantage Plan Member Turnover Trend Since Q4 2018 Q42018 Q12019 Q22019 Q32019 Q42019 Q12020 Q22020 Approved Members(1) 83,376 40,741 36,576 35,171 167,073 64,898 60,477 Estimated Beginning (Paying) Membership(2) 235,269 276,357 280,763 291,171 309,180 404,694 404,262 New Paying Members(3) 62,817 49,531 36,122 33,974 116,351 86,299 57,232 Estimated Ending (Paying) Membership(4) 276,357 280,763 291,171 309,180 404,694 404,262 407,243 Medicare Advantage Plan Member Turnover(5) 21,729 45,125 25,714 15,965 20,837 86,731 54,251 Trailing Twelve Month Member Turnover(6) 95,065 89,357 102,403 108,533 107,641 149,247 177,783 Average Trailing Twelve Month Estimated Membership Plus New Paying Members(7) 262,856 276,949 296,491 316,501 348,362 389,638 425,791 Trailing Twelve Month Member Turnover Rate(8) 36% 32% 35% 34% 31% 38% 42% 10
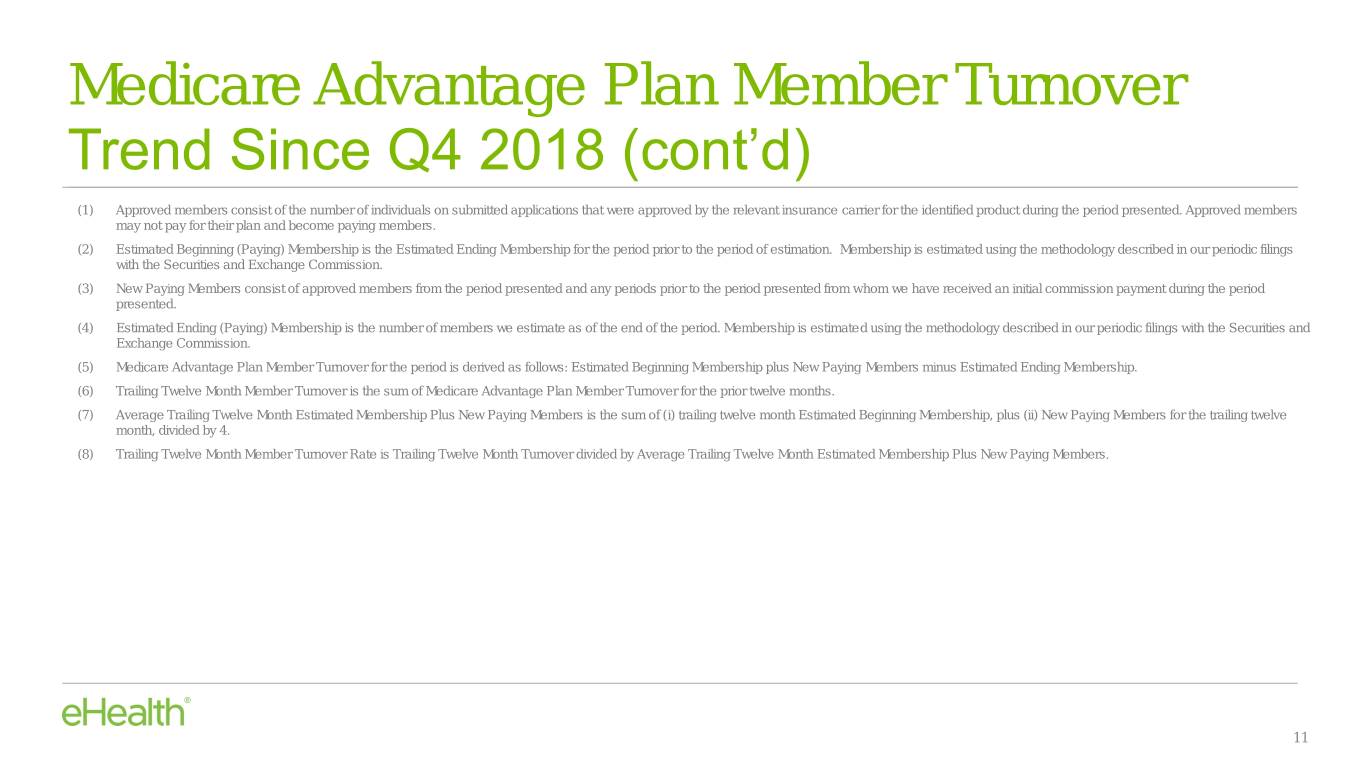
Medicare Advantage Plan Member Turnover Trend Since Q4 2018 (cont’d) (1) Approved members consist of the number of individuals on submitted applications that were approved by the relevant insurance carrier for the identified product during the period presented. Approved members may not pay for their plan and become paying members. (2) Estimated Beginning (Paying) Membership is the Estimated Ending Membership for the period prior to the period of estimation. Membership is estimated using the methodology described in our periodic filings with the Securities and Exchange Commission. (3) New Paying Members consist of approved members from the period presented and any periods prior to the period presented from whom we have received an initial commission payment during the period presented. (4) Estimated Ending (Paying) Membership is the number of members we estimate as of the end of the period. Membership is estimated using the methodology described in our periodic filings with the Securities and Exchange Commission. (5) Medicare Advantage Plan Member Turnover for the period is derived as follows: Estimated Beginning Membership plus New Paying Members minus Estimated Ending Membership. (6) Trailing Twelve Month Member Turnover is the sum of Medicare Advantage Plan Member Turnover for the prior twelve months. (7) Average Trailing Twelve Month Estimated Membership Plus New Paying Members is the sum of (i) trailing twelve month Estimated Beginning Membership, plus (ii) New Paying Members for the trailing twelve month, divided by 4. (8) Trailing Twelve Month Member Turnover Rate is Trailing Twelve Month Turnover divided by Average Trailing Twelve Month Estimated Membership Plus New Paying Members. 11
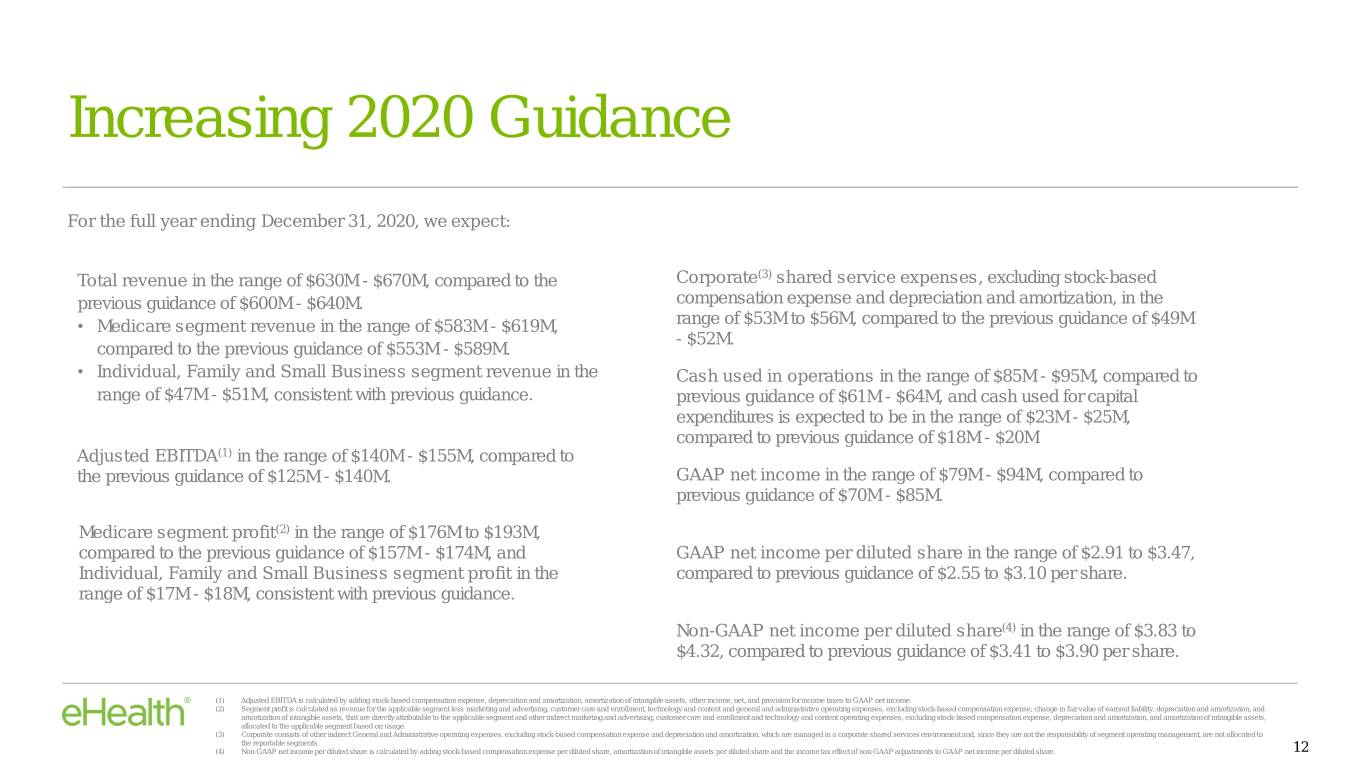
Increasing 2020 Guidance For the full year ending December 31, 2020, we expect: Total revenue in the range of $630M - $670M, compared to the Corporate(3) shared service expenses, excluding stock-based previous guidance of $600M - $640M. compensation expense and depreciation and amortization, in the • Medicare segment revenue in the range of $583M - $619M, range of $53M to $56M, compared to the previous guidance of $49M - $52M. compared to the previous guidance of $553M - $589M. • Individual, Family and Small Business segment revenue in the Cash used in operations in the range of $85M - $95M, compared to range of $47M - $51M, consistent with previous guidance. previous guidance of $61M - $64M, and cash used for capital expenditures is expected to be in the range of $23M - $25M, compared to previous guidance of $18M - $20M Adjusted EBITDA(1) in the range of $140M - $155M, compared to the previous guidance of $125M - $140M. GAAP net income in the range of $79M - $94M, compared to previous guidance of $70M - $85M. Medicare segment profit(2) in the range of $176M to $193M, compared to the previous guidance of $157M - $174M, and GAAP net income per diluted share in the range of $2.91 to $3.47, Individual, Family and Small Business segment profit in the compared to previous guidance of $2.55 to $3.10 per share. range of $17M - $18M, consistent with previous guidance. Non-GAAP net income per diluted share(4) in the range of $3.83 to $4.32, compared to previous guidance of $3.41 to $3.90 per share. (1) Adjusted EBITDA is calculated by adding stock-based compensation expense, depreciation and amortization, amortization of intangible assets, other income, net, and provision for income taxes to GAAP net income. (2) Segment profit is calculated as revenue for the applicable segment less marketing and advertising, customer care and enrollment, technology and content and general and administrative operating expenses, excluding stock-based compensation expense, change in fair value of earnout liability, depreciation and amortization, and amortization of intangible assets, that are directly attributable to the applicable segment and other indirect marketing and advertising, customer care and enrollment and technology and content operating expenses, excluding stock-based compensation expense, depreciation and amortization, and amortization of intangible assets, allocated to the applicable segment based on usage. (3) Corporate consists of other indirect General and Administrative operating expenses, excluding stock-based compensation expense and depreciation and amortization, which are managed in a corporate shared services environment and, since they are not the responsibility of segment operating management, are not allocated to the reportable segments. (4) Non-GAAP net income per diluted share is calculated by adding stock-based compensation expense per diluted share, amortization of intangible assets per diluted share and the income tax effect of non-GAAP adjustments to GAAP net income per diluted share. 12
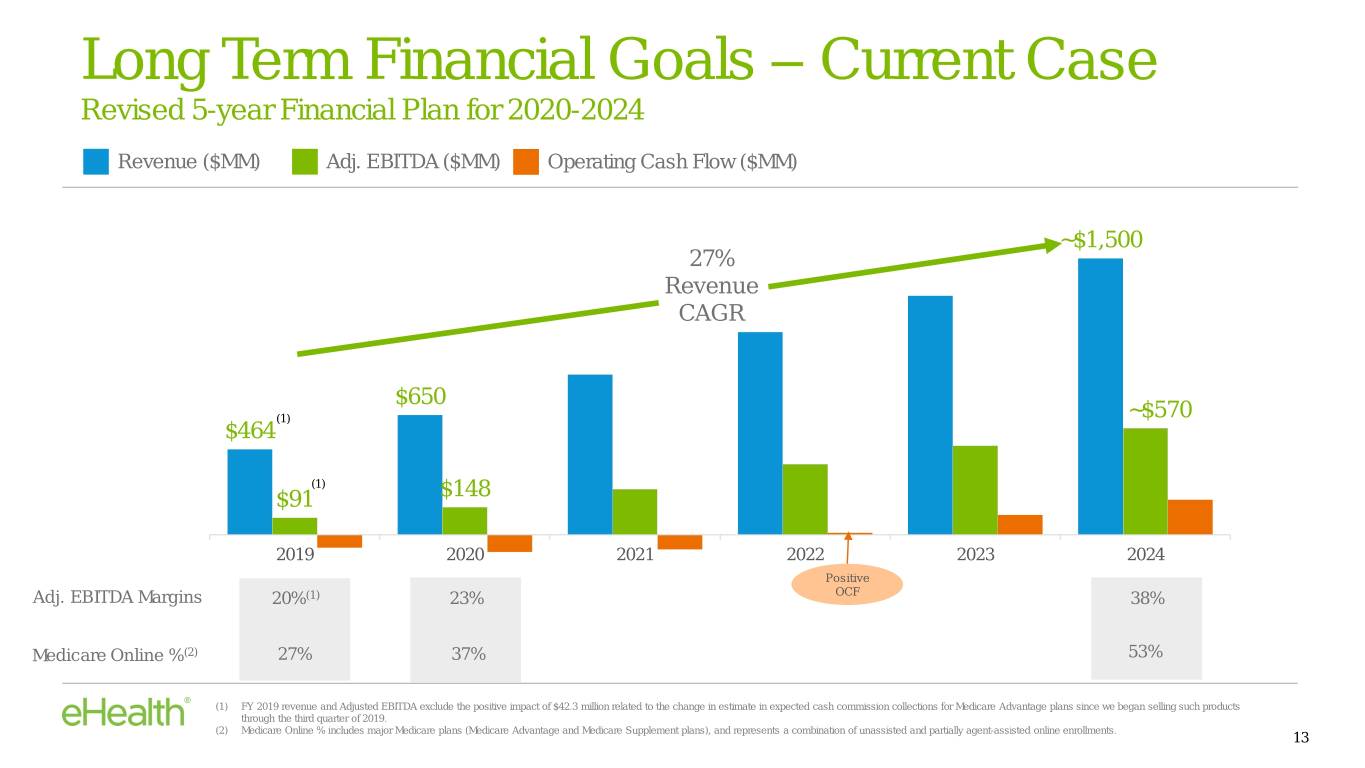
Long Term Financial Goals – Current Case Revised 5-year Financial Plan for 2020-2024 Revenue ($MM) Adj. EBITDA ($MM) Operating Cash Flow ($MM) ~$1,500 27% Revenue CAGR $650 (1) ~$570 $464 (1) $91 $148 2019 2020 2021 2022 2023 2024 Positive Adj. EBITDA Margins 20%(1) 23% OCF 38% Medicare Online %(2) 27% 37% 53% (1) FY 2019 revenue and Adjusted EBITDA exclude the positive impact of $42.3 million related to the change in estimate in expected cash commission collections for Medicare Advantage plans since we began selling such products through the third quarter of 2019. (2) Medicare Online % includes major Medicare plans (Medicare Advantage and Medicare Supplement plans), and represents a combination of unassisted and partially agent-assisted online enrollments. 13
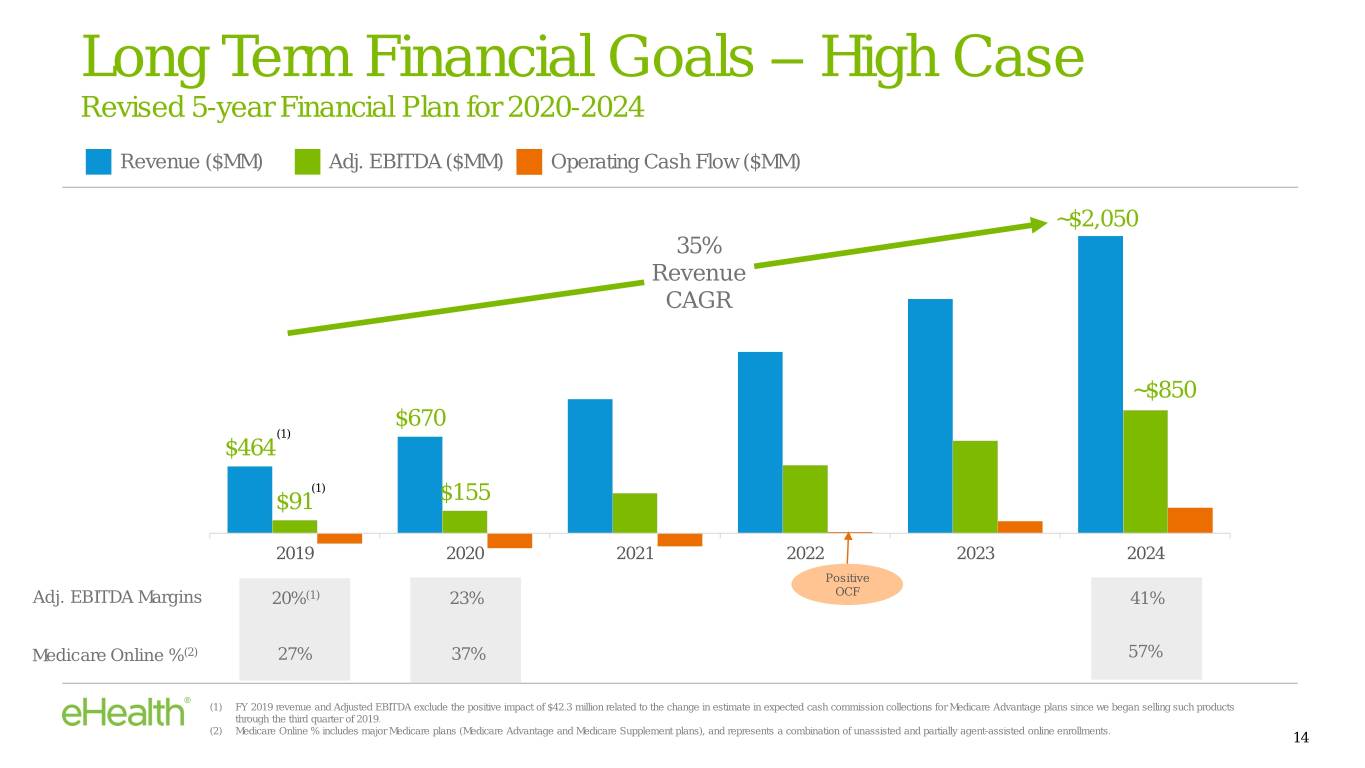
Long Term Financial Goals – High Case Revised 5-year Financial Plan for 2020-2024 Revenue ($MM) Adj. EBITDA ($MM) Operating Cash Flow ($MM) ~$2,050 35% Revenue CAGR ~$850 $670 (1) $464 (1) $91 $155 2019 2020 2021 2022 2023 2024 Positive Adj. EBITDA Margins 20%(1) 23% OCF 41% Medicare Online %(2) 27% 37% 57% (1) FY 2019 revenue and Adjusted EBITDA exclude the positive impact of $42.3 million related to the change in estimate in expected cash commission collections for Medicare Advantage plans since we began selling such products through the third quarter of 2019. (2) Medicare Online % includes major Medicare plans (Medicare Advantage and Medicare Supplement plans), and represents a combination of unassisted and partially agent-assisted online enrollments. 14
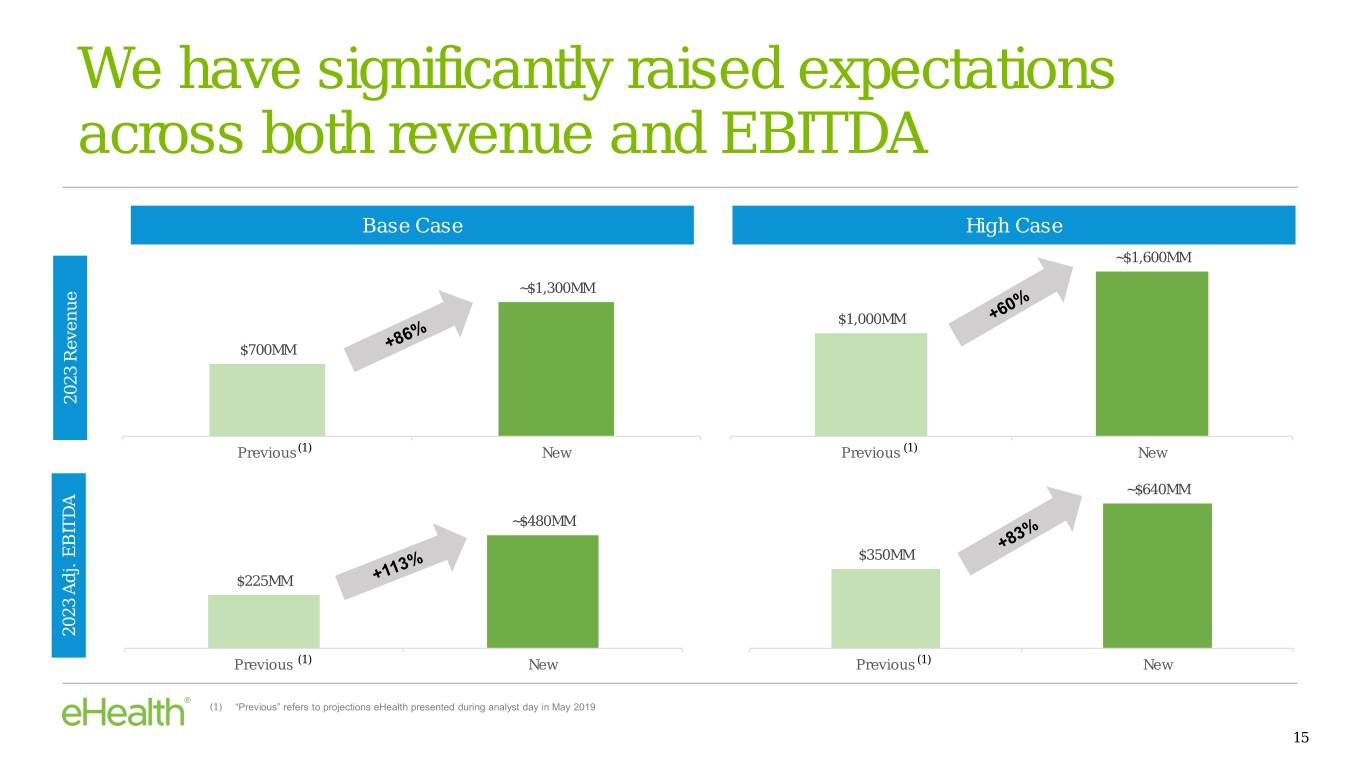
We have significantly raised expectations across both revenue and EBITDA Base Case High Case ~$1,600MM ~$1,300MM $1,000MM $700MM 2023 Revenue 2023 Previous(1) New Previous (1) New ~$640MM ~$480MM $350MM $225MM 2023 Adj. Adj. EBITDA 2023 Previous (1) New Previous(1) New (1) “Previous” refers to projections eHealth presented during analyst day in May 2019 15
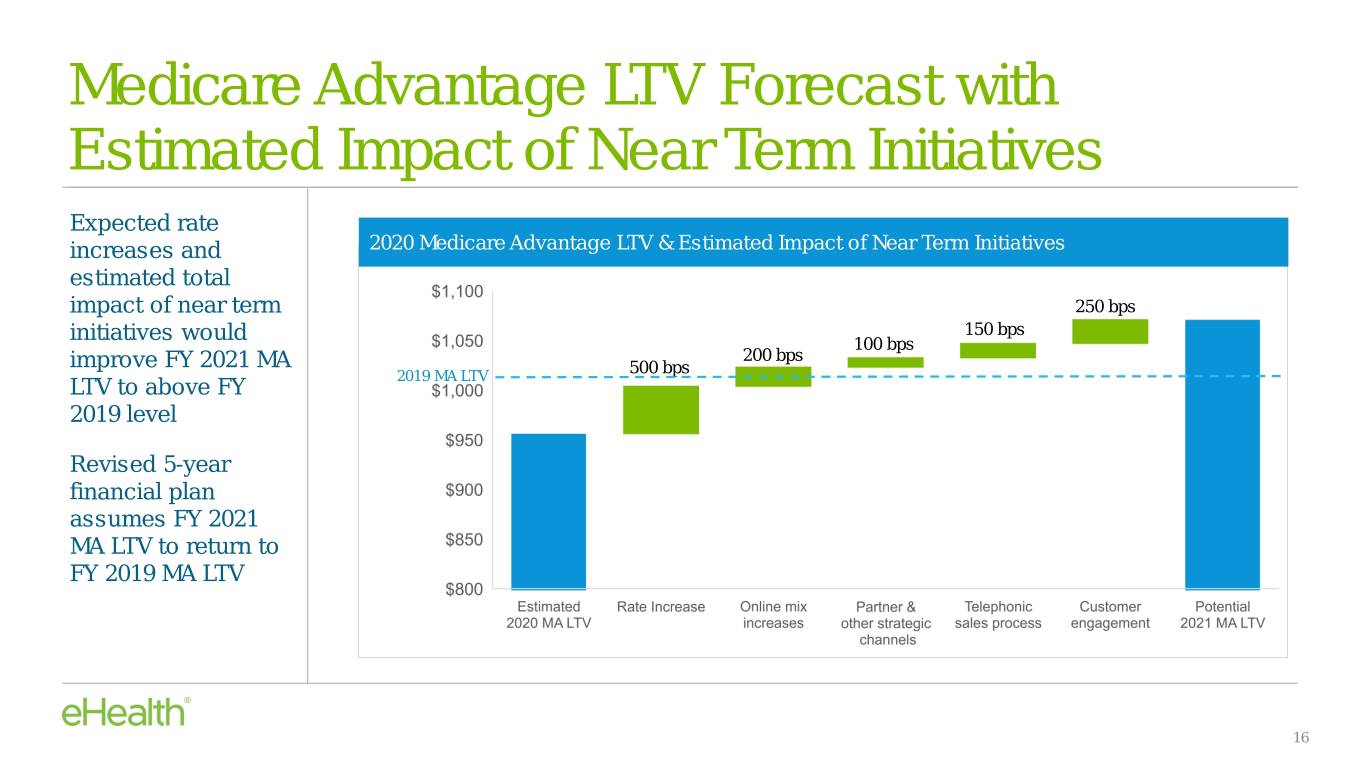
Medicare Advantage LTV Forecast with Estimated Impact of Near Term Initiatives Expected rate increases and 2020 Medicare Advantage LTV & Estimated Impact of Near Term Initiatives estimated total impact of near term 250 bps initiatives would 150 bps 100 bps 200 bps improve FY 2021 MA 500 bps LTV to above FY 2019 MA LTV 2019 level Revised 5-year financial plan assumes FY 2021 MA LTV to return to FY 2019 MA LTV 16
