Attached files
| file | filename |
|---|---|
| 8-K - FORM 8-K - LAKELAND BANCORP INC | d19501d8k.htm |

Exhibit 99.1 SECOND QUARTER 2020 INVESTORS PRESENTATION Exhibit 99.1 SECOND QUARTER 2020 INVESTORS PRESENTATION

Forward-Looking Statements The information disclosed in this document, global capital markets, changes in economic including the statements regarding the conditions nationally, regionally and in the prospective impact of COVID-19 and borrowers’ Company’s markets, the nature and timing of intentions of requesting a second 90 day loan actions of the Federal Reserve Board and other deferment, includes various forward-looking regulators, the nature and timing of legislation statements that are made in reliance upon the and regulation affecting the financial services safe harbor provisions of the Private Securities industry, government intervention in the U.S. Litigation Reform Act of 1995. The words financial system, changes in federal and state tax “anticipates”, “projects”, “intends”, “estimates”, laws, changes in levels of market interest rates, “expects”, “believes”, “plans”, “may”, “will”, pricing pressures on loan and deposit products, “should”, “could”, “likely”, “uncertain” and other credit risks of the Company’s lending and leasing similar expressions are intended to identify such activities, successful implementation, deployment forward-looking statements. The Company and upgrades of new and existing technology, cautions that these forward-looking statements systems, services and products, customers’ are necessarily speculative and speak only as of acceptance of the Company’s products and the date made, and are subject to numerous services and competition. Any statements made assumptions, risks and uncertainties, all of which by the Company that are not historical facts may change over time. Actual results could differ should be considered to be forward-looking materially from such forward-looking statements. statements. The Company is not obligated to The following factors, among others, could cause update and does not undertake to update any of actual results to differ materially and adversely its forward-looking statements made herein. from such forward-looking statements: changes in the financial services industry and the U.S. and 2 Forward-Looking Statements The information disclosed in this document, global capital markets, changes in economic including the statements regarding the conditions nationally, regionally and in the prospective impact of COVID-19 and borrowers’ Company’s markets, the nature and timing of intentions of requesting a second 90 day loan actions of the Federal Reserve Board and other deferment, includes various forward-looking regulators, the nature and timing of legislation statements that are made in reliance upon the and regulation affecting the financial services safe harbor provisions of the Private Securities industry, government intervention in the U.S. Litigation Reform Act of 1995. The words financial system, changes in federal and state tax “anticipates”, “projects”, “intends”, “estimates”, laws, changes in levels of market interest rates, “expects”, “believes”, “plans”, “may”, “will”, pricing pressures on loan and deposit products, “should”, “could”, “likely”, “uncertain” and other credit risks of the Company’s lending and leasing similar expressions are intended to identify such activities, successful implementation, deployment forward-looking statements. The Company and upgrades of new and existing technology, cautions that these forward-looking statements systems, services and products, customers’ are necessarily speculative and speak only as of acceptance of the Company’s products and the date made, and are subject to numerous services and competition. Any statements made assumptions, risks and uncertainties, all of which by the Company that are not historical facts may change over time. Actual results could differ should be considered to be forward-looking materially from such forward-looking statements. statements. The Company is not obligated to The following factors, among others, could cause update and does not undertake to update any of actual results to differ materially and adversely its forward-looking statements made herein. from such forward-looking statements: changes in the financial services industry and the U.S. and 2

Corporate Profile § LBAI - NASDAQ § Founded in 1969 § 51 Branches - Serving Northern/Central NJ & Hudson Valley, NY § 8 Regional Commercial Lending Centers § 1 Commercial Loan Production Office § Financial Snapshot § Assets $7.5 Billion § Loans $5.8 Billion § Deposits $6.1 Billion (1) § Market Cap $578 Million 1 Stock Price as of June 30, 2020 - $ 11.43 3 Corporate Profile § LBAI - NASDAQ § Founded in 1969 § 51 Branches - Serving Northern/Central NJ & Hudson Valley, NY § 8 Regional Commercial Lending Centers § 1 Commercial Loan Production Office § Financial Snapshot § Assets $7.5 Billion § Loans $5.8 Billion § Deposits $6.1 Billion (1) § Market Cap $578 Million 1 Stock Price as of June 30, 2020 - $ 11.43 3
Who We Are Half a century after opening for business in Newfoundland, NJ. We have grown to a network of over 50 offices, committed to meeting the financial needs of local residents & businesses, and are proud to be characterized as the following. Traditional Commercial Bank Conservative & Consistent Scarce & Valuable Franchise Banking Philosophy § Relationship Lender § One of the Largest Publically § Diversified Commercial Real Traded Banks in NJ § Low Risk Model Estate Portfolio § One of the Lowest Cost of § Disciplined Acquirer (1) § Focus is NOT Multifamily Lending Funds in the State (1) Source: S&P Global Q2 2020 for NJ banks w ith total assets greater than $500 million. 4 Who We Are Half a century after opening for business in Newfoundland, NJ. We have grown to a network of over 50 offices, committed to meeting the financial needs of local residents & businesses, and are proud to be characterized as the following. Traditional Commercial Bank Conservative & Consistent Scarce & Valuable Franchise Banking Philosophy § Relationship Lender § One of the Largest Publically § Diversified Commercial Real Traded Banks in NJ § Low Risk Model Estate Portfolio § One of the Lowest Cost of § Disciplined Acquirer (1) § Focus is NOT Multifamily Lending Funds in the State (1) Source: S&P Global Q2 2020 for NJ banks w ith total assets greater than $500 million. 4

Balanced Loan Portfolio (1) Loan Composition Loan Portfolio Growth Consumer Residential CAGR excluding acquisitions: 11.1% $330 Mortgage Equipment 6% CAGR: 15.9% $335 Finance $5,769 6% $116 2% $5,141 Construction $299 $4,460 5% $4,157 $3,874 C&I $728 $2,968 12% CRE $3,961 69% CRE / Capital 2015 2016 2017 2018 2019 2020 Q2 (2) 454% (1) Acquired loans of $580 in 2016, $426 in 2019 (2) Represents Lakeland Bank’s CRE to total risk based capital ratio, as of June 30, 2020, per regulatory 5 guidelines Balanced Loan Portfolio (1) Loan Composition Loan Portfolio Growth Consumer Residential CAGR excluding acquisitions: 11.1% $330 Mortgage Equipment 6% CAGR: 15.9% $335 Finance $5,769 6% $116 2% $5,141 Construction $299 $4,460 5% $4,157 $3,874 C&I $728 $2,968 12% CRE $3,961 69% CRE / Capital 2015 2016 2017 2018 2019 2020 Q2 (2) 454% (1) Acquired loans of $580 in 2016, $426 in 2019 (2) Represents Lakeland Bank’s CRE to total risk based capital ratio, as of June 30, 2020, per regulatory 5 guidelines

Commercial Loan Portfolio Commercial Portfolio Growth Commercial Loan Composition $5,104 Owner Occupied 19% $4,468 Multifamily 17% $3,801 $3,511 Retail 15% $3,184 Industrial 10% $2,244 Office 10% Mixed 9% Other 6% Portfolio Commercial Constr. 5% *W Avg. LTV 58% *W Avg. DSCR 1.7 Comm'l Res 1-4 5% 2015 2016 2017 2018 2019 2020 Q2 Fam CRE C&I Residential Constr. 2% Construction Equipment Finance Hotels/Resturants 2% * W Avg. LTV and DSCR as of most recent financial review 6 Commercial Loan Portfolio Commercial Portfolio Growth Commercial Loan Composition $5,104 Owner Occupied 19% $4,468 Multifamily 17% $3,801 $3,511 Retail 15% $3,184 Industrial 10% $2,244 Office 10% Mixed 9% Other 6% Portfolio Commercial Constr. 5% *W Avg. LTV 58% *W Avg. DSCR 1.7 Comm'l Res 1-4 5% 2015 2016 2017 2018 2019 2020 Q2 Fam CRE C&I Residential Constr. 2% Construction Equipment Finance Hotels/Resturants 2% * W Avg. LTV and DSCR as of most recent financial review 6
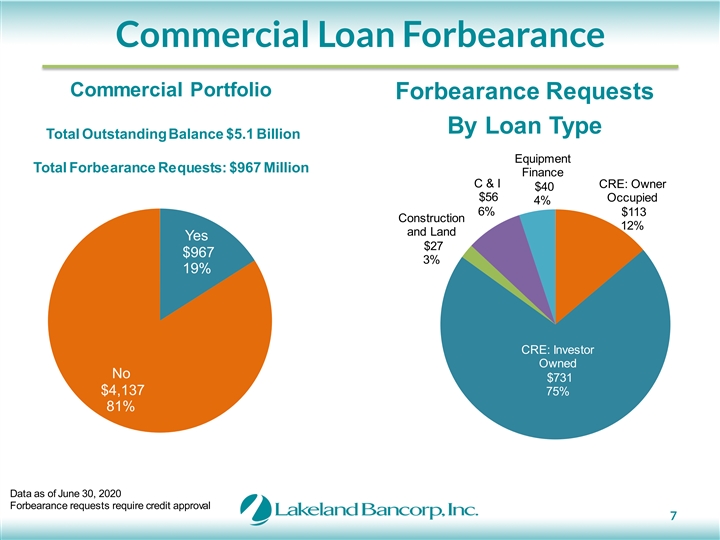
Commercial Loan Forbearance Commercial Portfolio Forbearance Requests By Loan Type Total Outstanding Balance $5.1 Billion Equipment Total Forbearance Requests: $967 Million Finance C & I CRE: Owner $40 $56 Occupied 4% 6% $113 Construction 12% and Land Yes $27 $967 3% 19% CRE: Investor Owned No $731 $4,137 75% 81% Data as of June 30, 2020 Forbearance requests require credit approval 7 Commercial Loan Forbearance Commercial Portfolio Forbearance Requests By Loan Type Total Outstanding Balance $5.1 Billion Equipment Total Forbearance Requests: $967 Million Finance C & I CRE: Owner $40 $56 Occupied 4% 6% $113 Construction 12% and Land Yes $27 $967 3% 19% CRE: Investor Owned No $731 $4,137 75% 81% Data as of June 30, 2020 Forbearance requests require credit approval 7

Commercial Loan Forbearance Request Detail Forbearance Requests of $967M by Property Type Commercial Loans Retail $182 with Recourse Mixed Use $131 Owner Occupied $113 No Office $105 21% Multi Family $102 Industrial $78 Commercial $52 Special Use $43 Yes 79% Hotels $40 Equip Finance $40 1-4 Family $30 Construction $27 Healthcare $14 Restaurants $8 Hospitality $2 Data as of June 30, 2020 8 Commercial Loan Forbearance Request Detail Forbearance Requests of $967M by Property Type Commercial Loans Retail $182 with Recourse Mixed Use $131 Owner Occupied $113 No Office $105 21% Multi Family $102 Industrial $78 Commercial $52 Special Use $43 Yes 79% Hotels $40 Equip Finance $40 1-4 Family $30 Construction $27 Healthcare $14 Restaurants $8 Hospitality $2 Data as of June 30, 2020 8

nd Commercial Loan 2 Deferment Outlook Includes Commercial Loans and Equipment Finance nd 2 Deferment Necessary? Based on inquiries of all $174 Million commercial loan borrowers 18% who were approved for a $136 first 90 day payment Million deferment ($967 million), 14% $657 the vast majority have Million 68% indicated they will not request a second 90 day payment deferment. Request Second Deferment No Yes Uncertain As of June 30, 2020 based on inquiries of borrowers on initial 90 day loan deferment 9 nd Commercial Loan 2 Deferment Outlook Includes Commercial Loans and Equipment Finance nd 2 Deferment Necessary? Based on inquiries of all $174 Million commercial loan borrowers 18% who were approved for a $136 first 90 day payment Million deferment ($967 million), 14% $657 the vast majority have Million 68% indicated they will not request a second 90 day payment deferment. Request Second Deferment No Yes Uncertain As of June 30, 2020 based on inquiries of borrowers on initial 90 day loan deferment 9

Commercial Loan 2nd Deferment Requests • Summary of our exposure by property type to Borrowers who indicated they will request a second 90 day payment deferment. • The low loan to value ratios will act as a loss mitigant. 2nd Deferment Request # of ($ in millions) Exposure Loans WA LTV Retail $37 20 49% Mixed Use $32 11 62% Hospitality $28 3 49% Owner Occupied $19 19 48% Office $14 7 50% Special Use $7 7 43% Industrial $3 2 25% 1-4 Family Residential $2 5 43% Multi Family - - N/A Healthcare - - N/A CRE Subtotal $140 74 55% Construction $12 2 48% Commercial & Industrial $16 13 31% Equipment Finance $5 19 - Total Deferred Loans $174 108 51% As of June 30, 2020 based on inquiries of borrowers on initial 90 day loan deferment 10 Commercial Loan 2nd Deferment Requests • Summary of our exposure by property type to Borrowers who indicated they will request a second 90 day payment deferment. • The low loan to value ratios will act as a loss mitigant. 2nd Deferment Request # of ($ in millions) Exposure Loans WA LTV Retail $37 20 49% Mixed Use $32 11 62% Hospitality $28 3 49% Owner Occupied $19 19 48% Office $14 7 50% Special Use $7 7 43% Industrial $3 2 25% 1-4 Family Residential $2 5 43% Multi Family - - N/A Healthcare - - N/A CRE Subtotal $140 74 55% Construction $12 2 48% Commercial & Industrial $16 13 31% Equipment Finance $5 19 - Total Deferred Loans $174 108 51% As of June 30, 2020 based on inquiries of borrowers on initial 90 day loan deferment 10

Deferment Exposures by Property Type $200 $180 $160 $140 $120 $100 $80 $60 $40 $20 $ First Deferment Likely Second Deferment Request* Uncertain on Second Deferment Request* *As of June 30, 2020 based on inquiries of borrowers on initial 90 day loan deferment 11 In Millions Deferment Exposures by Property Type $200 $180 $160 $140 $120 $100 $80 $60 $40 $20 $ First Deferment Likely Second Deferment Request* Uncertain on Second Deferment Request* *As of June 30, 2020 based on inquiries of borrowers on initial 90 day loan deferment 11 In Millions
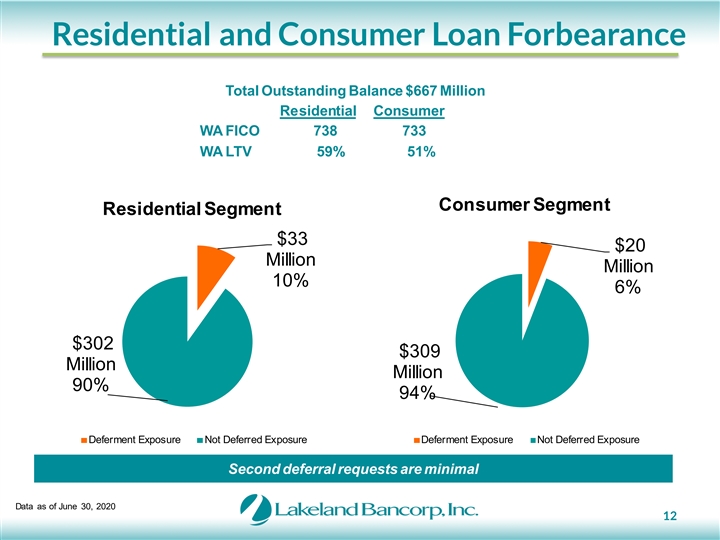
Residential and Consumer Loan Forbearance Total Outstanding Balance $667 Million Residential Consumer WA FICO 738 733 WA LTV 59% 51% Consumer Segment Residential Segment $33 $20 Million Million 10% 6% $302 $309 Million Million 90% 94% Deferment Exposure Not Deferred Exposure Deferment Exposure Not Deferred Exposure Second deferral requests are minimal Data as of June 30, 2020 12 Residential and Consumer Loan Forbearance Total Outstanding Balance $667 Million Residential Consumer WA FICO 738 733 WA LTV 59% 51% Consumer Segment Residential Segment $33 $20 Million Million 10% 6% $302 $309 Million Million 90% 94% Deferment Exposure Not Deferred Exposure Deferment Exposure Not Deferred Exposure Second deferral requests are minimal Data as of June 30, 2020 12

Strong Asset Quality (1) Nonaccruals / Loans (%) NPAs / Loans + OREO (%) 1.40% 2.00% 1.05% 1.50% 1.22% 0.77% 0.74% 1.14% 0.70% 0.57% 1.00% 0.66% 0.41% 0.62% 0.53% 0.33% 0.50% 0.27% 0.35% 0.50% 0.00% 0.00% 2015 2016 2017 2018 2019 2020 Q2 2015 2016 2017 2018 2019 2020 Q2 Reserves / Nonaccrual Loans (%) NCOs / Avg. Loans (%) 0.50% 350.0% 310.7% 300.0% 0.40% 259.7% 250.0% 0.30% 189.2% 200.0% 176.1% 0.19% 136.0% 0.20% 150.0% 122.4% 100.0% 0.10% 0.06% 0.05% 0.05% 50.0% 0.01% 0.00% 0.00% 0.0% 2015 2016 2017 2018 2019 2020 YTD 2015 2016 2017 2018 2019 2020 Q2 (0.10%) (1) NPAs include Troubled Debt Restructurings. 13 Strong Asset Quality (1) Nonaccruals / Loans (%) NPAs / Loans + OREO (%) 1.40% 2.00% 1.05% 1.50% 1.22% 0.77% 0.74% 1.14% 0.70% 0.57% 1.00% 0.66% 0.41% 0.62% 0.53% 0.33% 0.50% 0.27% 0.35% 0.50% 0.00% 0.00% 2015 2016 2017 2018 2019 2020 Q2 2015 2016 2017 2018 2019 2020 Q2 Reserves / Nonaccrual Loans (%) NCOs / Avg. Loans (%) 0.50% 350.0% 310.7% 300.0% 0.40% 259.7% 250.0% 0.30% 189.2% 200.0% 176.1% 0.19% 136.0% 0.20% 150.0% 122.4% 100.0% 0.10% 0.06% 0.05% 0.05% 50.0% 0.01% 0.00% 0.00% 0.0% 2015 2016 2017 2018 2019 2020 YTD 2015 2016 2017 2018 2019 2020 Q2 (0.10%) (1) NPAs include Troubled Debt Restructurings. 13
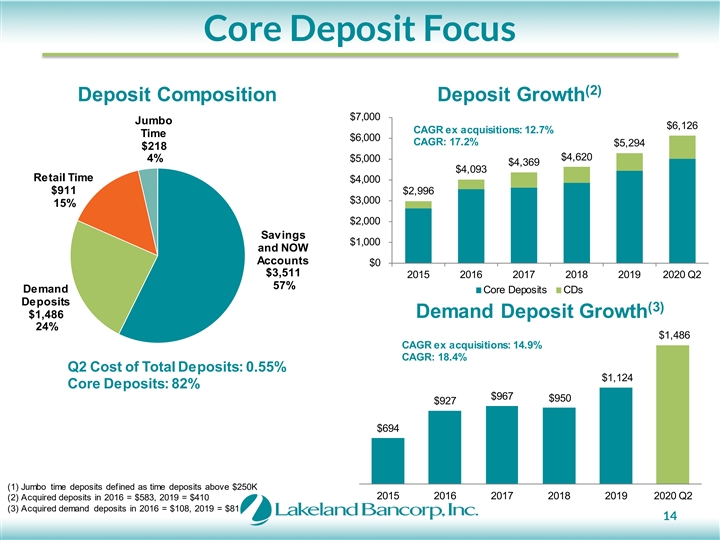
Core Deposit Focus (2) Deposit Composition Deposit Growth $7,000 Jumbo $6,126 CAGR ex acquisitions: 12.7% Time $6,000 CAGR: 17.2% $5,294 $218 $4,620 4% $5,000 $4,369 $4,093 Retail Time $4,000 $911 $2,996 $3,000 15% $2,000 Savings $1,000 and NOW Accounts $0 $3,511 2015 2016 2017 2018 2019 2020 Q2 57% Demand Core Deposits CDs Deposits (3) $1,486 Demand Deposit Growth 24% $1,486 CAGR ex acquisitions: 14.9% CAGR: 18.4% Q2 Cost of Total Deposits: 0.55% $1,124 Core Deposits: 82% $967 $950 $927 $694 (1) Jumbo time deposits defined as time deposits above $250K 2015 2016 2017 2018 2019 2020 Q2 (2) Acquired deposits in 2016 = $583, 2019 = $410 (3) Acquired demand deposits in 2016 = $108, 2019 = $81 14 Core Deposit Focus (2) Deposit Composition Deposit Growth $7,000 Jumbo $6,126 CAGR ex acquisitions: 12.7% Time $6,000 CAGR: 17.2% $5,294 $218 $4,620 4% $5,000 $4,369 $4,093 Retail Time $4,000 $911 $2,996 $3,000 15% $2,000 Savings $1,000 and NOW Accounts $0 $3,511 2015 2016 2017 2018 2019 2020 Q2 57% Demand Core Deposits CDs Deposits (3) $1,486 Demand Deposit Growth 24% $1,486 CAGR ex acquisitions: 14.9% CAGR: 18.4% Q2 Cost of Total Deposits: 0.55% $1,124 Core Deposits: 82% $967 $950 $927 $694 (1) Jumbo time deposits defined as time deposits above $250K 2015 2016 2017 2018 2019 2020 Q2 (2) Acquired deposits in 2016 = $583, 2019 = $410 (3) Acquired demand deposits in 2016 = $108, 2019 = $81 14

(1) NJ Deposit Market Share Number in Market of Market Share Institution Branches ($mm) (%) Rank 1 Valley National Bancorp 166 18, 121 20.7 2 Investors Bancorp Inc. 112 15, 605 17.8 3 OceanFirst Financial Corp. 79 7,192 8.2 4 Provident Financial Services Inc. 81 6,686 7.6 5 Columbia Financial Inc. (MHC) 61 5,663 6.5 6 Lakeland Bancorp Inc. 51 5,029 5.7 7 ConnectOne Bancorp Inc. 29 4,809 5.5 8 Kearny Financial Corp. 52 4,174 4.8 9 Peapack-Gladstone Financial Corp. 20 4,104 4.7 10 Spencer Savings Bank SLA 24 2,112 2.4 Top 10 New Jersey Banks 675 73,495 83.9 Total NJ Banks In Market 915 87,621 100.0 (1) Banks Headquartered in New Jersey Source: S&P Global as of June 2019. 15 (1) NJ Deposit Market Share Number in Market of Market Share Institution Branches ($mm) (%) Rank 1 Valley National Bancorp 166 18, 121 20.7 2 Investors Bancorp Inc. 112 15, 605 17.8 3 OceanFirst Financial Corp. 79 7,192 8.2 4 Provident Financial Services Inc. 81 6,686 7.6 5 Columbia Financial Inc. (MHC) 61 5,663 6.5 6 Lakeland Bancorp Inc. 51 5,029 5.7 7 ConnectOne Bancorp Inc. 29 4,809 5.5 8 Kearny Financial Corp. 52 4,174 4.8 9 Peapack-Gladstone Financial Corp. 20 4,104 4.7 10 Spencer Savings Bank SLA 24 2,112 2.4 Top 10 New Jersey Banks 675 73,495 83.9 Total NJ Banks In Market 915 87,621 100.0 (1) Banks Headquartered in New Jersey Source: S&P Global as of June 2019. 15

Investment Securities Portfolio Securities Composition Equities, CRA 2% § $939 million, or 13% of assets Government & § Primarily used for liquidity purposes Agencies 18% § Short term agencies, MBS, and municipals Municipals MBS/CMO/ABS § Municipal Bond portfolio rated AA or higher 98% 12% 65% § Average Yield for Q2: 2.34% Corporate Debt § Weighted Average Life: 3.5 years 3% § Effective Duration: 1.9 years § AFS is 88% of portfolio / HTM is 12% 16 Investment Securities Portfolio Securities Composition Equities, CRA 2% § $939 million, or 13% of assets Government & § Primarily used for liquidity purposes Agencies 18% § Short term agencies, MBS, and municipals Municipals MBS/CMO/ABS § Municipal Bond portfolio rated AA or higher 98% 12% 65% § Average Yield for Q2: 2.34% Corporate Debt § Weighted Average Life: 3.5 years 3% § Effective Duration: 1.9 years § AFS is 88% of portfolio / HTM is 12% 16

Mergers & Acquisitions Highlands Bancorp Harmony Bank Pascack Bancorp Legacy Highlands (4) Legacy Harmony (3) Legacy Pascack (7) LPOs (2) LPOs (2) LPOs (2) Announcement Date: 8/23/2018 Announcement Date: 2/18/2016 Announcement Date: 8/4/2015 Assets: $488mm Assets: $295mm Assets: $403mm Deal Value: $56.7mm Deal Value: $32.0mm Deal Value: $43.8mm Price/TBV: 1.89x Price/TBV: 1.29x Price/TBV: 1.31x EPS Accretion: 4.0% EPS Accretion: 1.0% EPS Accretion: 4.5% TBV Dilution: ~1.5% TBV Dilution: ~0.5% TBV Dilution: ~2.7% TBV Earnback: < 2 Years TBV Earnback: 3.5 Years TBV Earnback: 3.5 Years Board Seats: None Board Seats: None Board Seats: Lawrence Inserra Jr. Rationale Rationale Rationale • Expanding presence in Sussex, Passaic and • Expansion into • Growth opportunity in Bergen/Essex Counties Morris counties Middlesex/Monmouth/Ocean Counties • Exclusive negotiations • Low execution risk and achievable cost • Leverage Existing Commercial Loan savings Production Office • Exclusive negotiations Note: Represents data at announcement date 17 Mergers & Acquisitions Highlands Bancorp Harmony Bank Pascack Bancorp Legacy Highlands (4) Legacy Harmony (3) Legacy Pascack (7) LPOs (2) LPOs (2) LPOs (2) Announcement Date: 8/23/2018 Announcement Date: 2/18/2016 Announcement Date: 8/4/2015 Assets: $488mm Assets: $295mm Assets: $403mm Deal Value: $56.7mm Deal Value: $32.0mm Deal Value: $43.8mm Price/TBV: 1.89x Price/TBV: 1.29x Price/TBV: 1.31x EPS Accretion: 4.0% EPS Accretion: 1.0% EPS Accretion: 4.5% TBV Dilution: ~1.5% TBV Dilution: ~0.5% TBV Dilution: ~2.7% TBV Earnback: < 2 Years TBV Earnback: 3.5 Years TBV Earnback: 3.5 Years Board Seats: None Board Seats: None Board Seats: Lawrence Inserra Jr. Rationale Rationale Rationale • Expanding presence in Sussex, Passaic and • Expansion into • Growth opportunity in Bergen/Essex Counties Morris counties Middlesex/Monmouth/Ocean Counties • Exclusive negotiations • Low execution risk and achievable cost • Leverage Existing Commercial Loan savings Production Office • Exclusive negotiations Note: Represents data at announcement date 17

Franchise Growth Total Tangible Book Value Per Core Earnings Per (1) (2) Assets Share Share CAGR: 9.8% CAGR: 15.8% $11.60 $11.18 $1.43 $7,489 $10.22 $1.32 $6,711 $9.38 $8.70 $5,806 $1.11 $5,406 $1.02 $7.62 $5,093 $0.88 $3,870 $0.47 2015 2016 2017 2018 2019 2020 Q2 2015 2016 2017 2018 2019 2020 Q2 2015 2016 2017 2018 2019 2020 YTD (1) Acquired total assets of $732 in 2016, $496 in 2019 (2) Core earnings per share excludes non-recurring items, merger related expenses and related 18 gains/losses on sale of securities Franchise Growth Total Tangible Book Value Per Core Earnings Per (1) (2) Assets Share Share CAGR: 9.8% CAGR: 15.8% $11.60 $11.18 $1.43 $7,489 $10.22 $1.32 $6,711 $9.38 $8.70 $5,806 $1.11 $5,406 $1.02 $7.62 $5,093 $0.88 $3,870 $0.47 2015 2016 2017 2018 2019 2020 Q2 2015 2016 2017 2018 2019 2020 Q2 2015 2016 2017 2018 2019 2020 YTD (1) Acquired total assets of $732 in 2016, $496 in 2019 (2) Core earnings per share excludes non-recurring items, merger related expenses and related 18 gains/losses on sale of securities
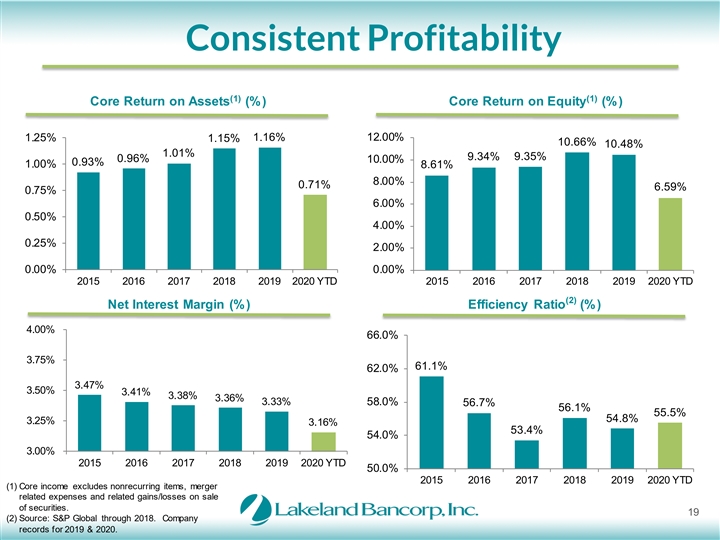
Consistent Profitability (1) (1) Core Return on Assets (%) Core Return on Equity (%) 1.25% 1.16% 12.00% 1.15% 10.66% 10.48% 1.01% 9.34% 9.35% 0.96% 10.00% 0.93% 1.00% 8.61% 8.00% 0.71% 6.59% 0.75% 6.00% 0.50% 4.00% 0.25% 2.00% 0.00% 0.00% 2015 2016 2017 2018 2019 2020 YTD 2015 2016 2017 2018 2019 2020 YTD (2) Net Interest Margin (%) Efficiency Ratio (%) 4.00% 66.0% 3.75% 61.1% 62.0% 3.47% 3.50% 3.41% 3.38% 3.36% 3.33% 58.0% 56.7% 56.1% 55.5% 54.8% 3.25% 3.16% 53.4% 54.0% 3.00% 2015 2016 2017 2018 2019 2020 YTD 50.0% 2015 2016 2017 2018 2019 2020 YTD (1) Core income excludes nonrecurring items, merger related expenses and related gains/losses on sale of securities. 19 (2) Source: S&P Global through 2018. Company records for 2019 & 2020. Consistent Profitability (1) (1) Core Return on Assets (%) Core Return on Equity (%) 1.25% 1.16% 12.00% 1.15% 10.66% 10.48% 1.01% 9.34% 9.35% 0.96% 10.00% 0.93% 1.00% 8.61% 8.00% 0.71% 6.59% 0.75% 6.00% 0.50% 4.00% 0.25% 2.00% 0.00% 0.00% 2015 2016 2017 2018 2019 2020 YTD 2015 2016 2017 2018 2019 2020 YTD (2) Net Interest Margin (%) Efficiency Ratio (%) 4.00% 66.0% 3.75% 61.1% 62.0% 3.47% 3.50% 3.41% 3.38% 3.36% 3.33% 58.0% 56.7% 56.1% 55.5% 54.8% 3.25% 3.16% 53.4% 54.0% 3.00% 2015 2016 2017 2018 2019 2020 YTD 50.0% 2015 2016 2017 2018 2019 2020 YTD (1) Core income excludes nonrecurring items, merger related expenses and related gains/losses on sale of securities. 19 (2) Source: S&P Global through 2018. Company records for 2019 & 2020.
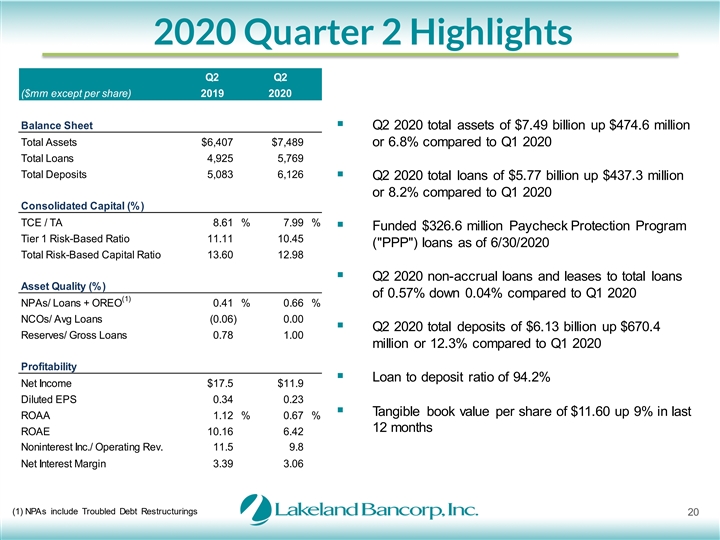
2020 Quarter 2 Highlights Q2 Q2 ($mm except per share) 2019 2020 Balance Sheet § Q2 2020 total assets of $7.49 billion up $474.6 million Total Assets $6,407 $7,489 or 6.8% compared to Q1 2020 Total Loans 4,925 5,769 Total Deposits 5,083 6,126 § Q2 2020 total loans of $5.77 billion up $437.3 million or 8.2% compared to Q1 2020 Consolidated Capital (%) TCE / TA 8.61 % 7.99 % § Funded $326.6 million Paycheck Protection Program Tier 1 Risk-Based Ratio 11.11 10.45 ( PPP ) loans as of 6/30/2020 Total Risk-Based Capital Ratio 13.60 12.98 § Q2 2020 non-accrual loans and leases to total loans Asset Quality (%) of 0.57% down 0.04% compared to Q1 2020 (1) NPAs/ Loans + OREO 0.41 % 0.66 % NCOs/ Avg Loans (0.06) 0.00 § Q2 2020 total deposits of $6.13 billion up $670.4 Reserves/ Gross Loans 0.78 1.00 million or 12.3% compared to Q1 2020 Profitability § Loan to deposit ratio of 94.2% Net Income $17.5 $11.9 Diluted EPS 0.34 0.23 § Tangible book value per share of $11.60 up 9% in last ROAA 1.12 % 0.67 % 12 months ROAE 10.16 6.42 Noninterest Inc./ Operating Rev. 11.5 9.8 Net Interest Margin 3.39 3.06 (1) NPAs include Troubled Debt Restructurings 20 2020 Quarter 2 Highlights Q2 Q2 ($mm except per share) 2019 2020 Balance Sheet § Q2 2020 total assets of $7.49 billion up $474.6 million Total Assets $6,407 $7,489 or 6.8% compared to Q1 2020 Total Loans 4,925 5,769 Total Deposits 5,083 6,126 § Q2 2020 total loans of $5.77 billion up $437.3 million or 8.2% compared to Q1 2020 Consolidated Capital (%) TCE / TA 8.61 % 7.99 % § Funded $326.6 million Paycheck Protection Program Tier 1 Risk-Based Ratio 11.11 10.45 ( PPP ) loans as of 6/30/2020 Total Risk-Based Capital Ratio 13.60 12.98 § Q2 2020 non-accrual loans and leases to total loans Asset Quality (%) of 0.57% down 0.04% compared to Q1 2020 (1) NPAs/ Loans + OREO 0.41 % 0.66 % NCOs/ Avg Loans (0.06) 0.00 § Q2 2020 total deposits of $6.13 billion up $670.4 Reserves/ Gross Loans 0.78 1.00 million or 12.3% compared to Q1 2020 Profitability § Loan to deposit ratio of 94.2% Net Income $17.5 $11.9 Diluted EPS 0.34 0.23 § Tangible book value per share of $11.60 up 9% in last ROAA 1.12 % 0.67 % 12 months ROAE 10.16 6.42 Noninterest Inc./ Operating Rev. 11.5 9.8 Net Interest Margin 3.39 3.06 (1) NPAs include Troubled Debt Restructurings 20
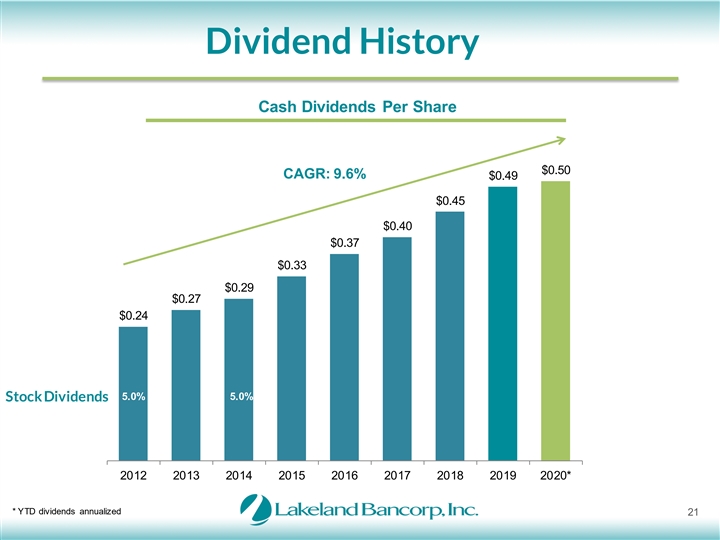
Dividend History Cash Dividends Per Share $0.50 CAGR: 9.6% $0.49 $0.45 $0.40 $0.37 $0.33 $0.29 $0.27 $0.24 5.0% 5.0% Stock Dividends 2012 2013 2014 2015 2016 2017 2018 2019 2020* * YTD dividends annualized 21 Dividend History Cash Dividends Per Share $0.50 CAGR: 9.6% $0.49 $0.45 $0.40 $0.37 $0.33 $0.29 $0.27 $0.24 5.0% 5.0% Stock Dividends 2012 2013 2014 2015 2016 2017 2018 2019 2020* * YTD dividends annualized 21
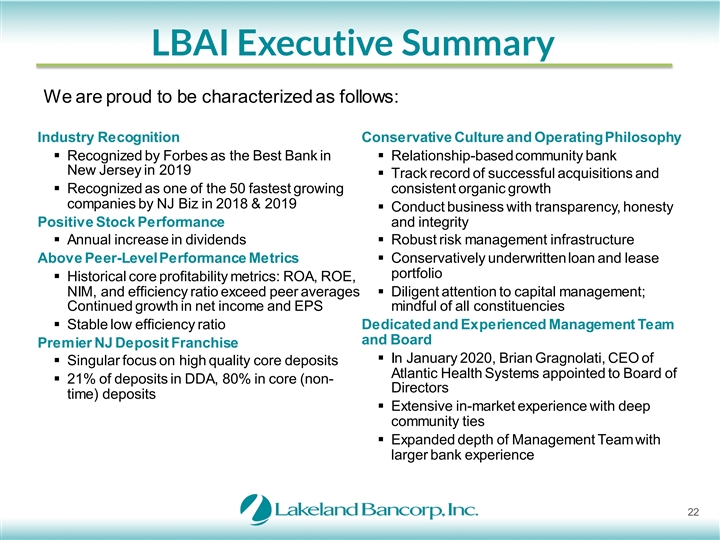
LBAI Executive Summary We are proud to be characterized as follows: Industry Recognition Conservative Culture and Operating Philosophy § Recognized by Forbes as the Best Bank in § Relationship-based community bank New Jersey in 2019 § Track record of successful acquisitions and § Recognized as one of the 50 fastest growing consistent organic growth companies by NJ Biz in 2018 & 2019 § Conduct business with transparency, honesty Positive Stock Performance and integrity § Annual increase in dividends § Robust risk management infrastructure Above Peer-Level Performance Metrics § Conservatively underwritten loan and lease portfolio § Historical core profitability metrics: ROA, ROE, § Diligent attention to capital management; NIM, and efficiency ratio exceed peer averages Continued growth in net income and EPS mindful of all constituencies § Stable low efficiency ratio Dedicated and Experienced Management Team and Board Premier NJ Deposit Franchise § In January 2020, Brian Gragnolati, CEO of § Singular focus on high quality core deposits Atlantic Health Systems appointed to Board of § 21% of deposits in DDA, 80% in core (non- Directors time) deposits § Extensive in-market experience with deep community ties § Expanded depth of Management Team with larger bank experience 22 LBAI Executive Summary We are proud to be characterized as follows: Industry Recognition Conservative Culture and Operating Philosophy § Recognized by Forbes as the Best Bank in § Relationship-based community bank New Jersey in 2019 § Track record of successful acquisitions and § Recognized as one of the 50 fastest growing consistent organic growth companies by NJ Biz in 2018 & 2019 § Conduct business with transparency, honesty Positive Stock Performance and integrity § Annual increase in dividends § Robust risk management infrastructure Above Peer-Level Performance Metrics § Conservatively underwritten loan and lease portfolio § Historical core profitability metrics: ROA, ROE, § Diligent attention to capital management; NIM, and efficiency ratio exceed peer averages Continued growth in net income and EPS mindful of all constituencies § Stable low efficiency ratio Dedicated and Experienced Management Team and Board Premier NJ Deposit Franchise § In January 2020, Brian Gragnolati, CEO of § Singular focus on high quality core deposits Atlantic Health Systems appointed to Board of § 21% of deposits in DDA, 80% in core (non- Directors time) deposits § Extensive in-market experience with deep community ties § Expanded depth of Management Team with larger bank experience 22
250 Oak Ridge Road | Oak Ridge, NJ 07438 | t: 973-697-2000 | LakelandBank.com | Stock symbol: LBAI 250 Oak Ridge Road | Oak Ridge, NJ 07438 | t: 973-697-2000 | LakelandBank.com | Stock symbol: LBAI