Attached files
| file | filename |
|---|---|
| EX-32.1 - EX-32.1 - LAKELAND BANCORP INC | d295650dex321.htm |
| EX-31.2 - EX-31.2 - LAKELAND BANCORP INC | d295650dex312.htm |
| EX-31.1 - EX-31.1 - LAKELAND BANCORP INC | d295650dex311.htm |
| EX-24.1 - EX-24.1 - LAKELAND BANCORP INC | d295650dex241.htm |
| EX-23.1 - EX-23.1 - LAKELAND BANCORP INC | d295650dex231.htm |
| EX-21.1 - EX-21.1 - LAKELAND BANCORP INC | d295650dex211.htm |
| EX-12.1 - EX-12.1 - LAKELAND BANCORP INC | d295650dex121.htm |
| EX-10.29 - EX-10.29 - LAKELAND BANCORP INC | d295650dex1029.htm |
Table of Contents
UNITED STATES
SECURITIES AND EXCHANGE COMMISSION
Washington, DC 20549
FORM 10-K
(Mark One)
| ☒ | ANNUAL REPORT PURSUANT TO SECTION 13 OR 15(d) OF THE SECURITIES EXCHANGE ACT OF 1934 |
FOR THE FISCAL YEAR ENDED DECEMBER 31, 2016.
OR
| ☐ | TRANSITION REPORT PURSUANT TO SECTION 13 or 15(d) OF THE SECURITIES EXCHANGE ACT OF 1934 |
FOR THE TRANSITION PERIOD FROM TO .
Commission file number: 000-17820
LAKELAND BANCORP, INC.
(Exact name of registrant as specified in its charter)
| New Jersey | 22-2953275 | |||
| (State or other jurisdiction of incorporation or organization) |
(I.R.S. Employer Identification No.) |
250 Oak Ridge Road,
Oak Ridge, New Jersey 07438
(Address of principal executive offices) (Zip code)
Registrant’s telephone number, including area code: (973) 697-2000
Securities registered pursuant to Section 12(b) of the Act:
| Title of each class |
Name of each exchange on which registered | |
| Common Stock, no par value | NASDAQ |
Securities registered pursuant to Section 12(g) of the Act: None
Indicate by check mark if the registrant is a well-known seasoned issuer, as defined in Rule 405 of the Securities Act. Yes ☐ No ☒
Indicate by check mark if the registrant is not required to file reports pursuant to Section 13 or Section 15(d) of the Exchange Act. Yes ☐ No ☒
Indicate by check mark whether the registrant (1) has filed all reports required to be filed by Section 13 or 15(d) of the Securities Exchange Act of 1934 during the preceding 12 months (or for such shorter period that the registrant was required to file such reports), and (2) has been subject to such filing requirements for the past 90 days. Yes ☒ No ☐
Indicate by check mark whether the registrant has submitted electronically and posted on its corporate Web site, if any, every Interactive Data File required to be submitted and posted pursuant to Rule 405 of Regulation S-T (§232.405 of this chapter) during the preceding 12 months (or for such shorter period that the registrant was required to submit and post such files). Yes ☒ No ☐
Indicate by check mark if disclosure of delinquent filers pursuant to Item 405 of Regulation S-K is not contained herein, and will not be contained, to the best of registrant’s knowledge, in definitive proxy or information statements incorporated by reference in Part III of this Form 10-K or any amendment to this Form 10-K. ☐
Indicate by check mark whether the registrant is a large accelerated filer, an accelerated filer, a non-accelerated filer or a smaller reporting company. See definitions of “large accelerated filer,” “accelerated filer” and “smaller reporting company” in Rule 12b-2 of the Exchange Act:
| Large accelerated filer | ☐ | Accelerated filer | ☒ | |||
| Non-accelerated filer | ☐ | Smaller Reporting Company | ☐ |
Indicate by a check mark whether the registrant is a shell company (as defined in Rule 12b-2 of the Exchange Act). Yes ☐ No ☒
As of June 30, 2016, the aggregate market value of the registrant’s common stock held by non-affiliates of the registrant was approximately $436,000,000, based on the closing sale price as reported on the NASDAQ Global Select Market.
The number of shares outstanding of the registrant’s common stock, as of March 1, 2017, was 47,328,608.
DOCUMENTS INCORPORATED BY REFERENCE:
Lakeland Bancorp, Inc’s. Proxy Statement for its 2017 Annual Meeting of Shareholders (Part III).
Table of Contents
Form 10-K Index
| PAGE | ||||||
| PART I | ||||||
| Item 1. | 1 | |||||
| Item 1A. | 13 | |||||
| Item 1B. | 20 | |||||
| Item 2. | 20 | |||||
| Item 3. | 20 | |||||
| Item 3A. | 20 | |||||
| Item 4. | 21 | |||||
| PART II | ||||||
| Item 5. | 22 | |||||
| Item 6. | 24 | |||||
| Item 7. | Management’s Discussion and Analysis of Financial Condition and Results of Operations |
26 | ||||
| Item 7A. | 55 | |||||
| Item 8. | 56 | |||||
| Item 9. | Changes in and Disagreements with Accountants on Accounting and Financial Disclosure |
116 | ||||
| Item 9A. | 116 | |||||
| Item 9B. | 119 | |||||
| PART III | ||||||
| Item 10. | 119 | |||||
| Item 11. | 119 | |||||
| Item 12. | Security Ownership of Certain Beneficial Owners and Management and Related Stockholder Matters |
119 | ||||
| Item 13. | Certain Relationships and Related Transactions, and Director Independence |
119 | ||||
| Item 14. | 120 | |||||
| PART IV | ||||||
| Item 15. | 120 | |||||
| Item 16. | 123 | |||||
| Signatures | 124 | |||||
-i-
Table of Contents
GENERAL
Lakeland Bancorp, Inc. (the “Company” or “Lakeland Bancorp”) is a bank holding company headquartered in Oak Ridge, New Jersey. The Company was organized in March of 1989 and commenced operations on May 19, 1989, upon the consummation of the acquisition of all of the outstanding stock of Lakeland Bank, formerly named Lakeland State Bank (“Lakeland” or the “Bank” or “Lakeland Bank”). Through Lakeland, the Company operates 52 New Jersey branch offices in Bergen, Essex, Morris, Ocean, Passaic, Somerset, Sussex and Union counties; six New Jersey regional commercial lending centers in Bernardsville, Jackson, Montville, Newton, Teaneck and Waldwick; and two commercial loan production offices serving Middlesex and Monmouth counties in New Jersey and the Hudson Valley region of New York. Lakeland offers an extensive suite of financial products and services for businesses and consumers.
The Company has shown substantial growth through a combination of organic growth and acquisitions. Since 1998, the Company has acquired seven community banks with an aggregate asset total of approximately $1.8 billion, including the acquisition of Pascack Community Bank and its parent, Pascack Bancorp, Inc. (collectively referred to as “Pascack”), which closed on January 7, 2016, and the acquisition of Harmony Bank (“Harmony”), which closed on July 1, 2016. All of the acquired banks have been merged into Lakeland and their holding companies, if applicable, have been merged into the Company.
At December 31, 2016, Lakeland Bancorp had total consolidated assets of $5.1 billion, total consolidated deposits of $4.1 billion, total consolidated loans, net of the allowance for loan and lease losses, of $3.8 billion and total consolidated stockholders’ equity of $550.0 million.
This Annual Report on Form 10-K contains certain forward-looking statements within the meaning of the Private Securities Litigation Reform Act of 1995 (“Forward-Looking Statements”). Such statements are subject to risks and uncertainties that could cause actual results to differ materially from those projected in such Forward-Looking Statements. Certain factors which could materially affect such results and the future performance of the Company are described in Item 1A - Risk Factors of this Annual Report on Form 10-K.
Unless otherwise indicated, all weighted average, actual shares and per share information contained in this Annual Report on Form 10-K have been adjusted retroactively for the effect of stock dividends, including the Company’s 5% stock dividend which was distributed on June 17, 2014.
Commercial Bank Services
Through Lakeland, the Company offers a broad range of lending, depository, and related financial services to individuals and small to medium sized businesses located primarily in northern and central New Jersey, the Hudson Valley region in New York, and surrounding areas. In the lending area, these services include short and medium term loans, lines of credit, letters of credit, inventory and accounts receivable financing, real estate construction loans, mortgage loans, small business administration (“SBA”) loans, and merchant credit card services. In addition to commercial real estate loans, Lakeland makes commercial and industrial loans. These types of loans can diversify the Company’s exposure in a depressed real estate market. Lakeland’s equipment financing division provides a solution to small and medium sized companies who prefer to lease equipment over other financial alternatives. Lakeland’s asset based loan department provides commercial borrowers with another lending alternative.
Depository products include demand deposits, as well as savings, money market and time accounts. The Company also offers wire transfer, internet banking, mobile banking and night depository services to the business community and municipal relationships. In addition, Lakeland offers cash management services, such as remote capture of deposits and overnight sweep repurchase agreements.
-1-
Table of Contents
Consumer Banking
Lakeland also offers a broad range of consumer banking services, including checking accounts, savings accounts, NOW accounts, money market accounts, certificates of deposit, internet banking, secured and unsecured loans, consumer installment loans, mortgage loans, and safe deposit services.
As a result of the merger with Somerset Hills Bancorp in 2013, Lakeland expanded its mortgage division by acquiring a mortgage company subsidiary and a 50% interest in a title company. In 2015, Lakeland transitioned the personnel from the mortgage subsidiary to Lakeland, and Lakeland now originates all mortgages.
Other Services
Investment and advisory services for individuals and businesses are also available.
Competition
Lakeland faces considerable competition in its market areas for deposits and loans from other depository institutions. Many of Lakeland’s depository institution competitors have substantially greater resources, broader geographic markets, and higher lending limits than Lakeland and are also able to provide more services and make greater use of media advertising. In recent years, intense market demands, economic pressures, increased customer awareness of products and services, and the availability of electronic services have forced banking institutions to diversify their services and become more cost-effective.
Lakeland also competes with credit unions, brokerage firms, insurance companies, money market mutual funds, consumer finance companies, mortgage companies and other financial companies, some of which are not subject to the same degree of regulation and restrictions as Lakeland in attracting deposits and making loans. Interest rates on deposit accounts, convenience of facilities, products and services, and marketing are all significant factors in the competition for deposits. Competition for loans comes from other commercial banks, savings institutions, insurance companies, consumer finance companies, credit unions, mortgage banking firms and other institutional lenders. Lakeland primarily competes for loan originations through its structuring of loan transactions and the overall quality of service it provides. Competition is affected by the availability of lendable funds, general and local economic conditions, interest rates, and other factors that are not readily predictable.
The Company expects that competition will continue in the future.
Concentration
The Company is not dependent for deposits or exposed by loan concentrations to a single customer or a small group of customers the loss of any one or more of which would have a material adverse effect upon the financial condition of the Company.
Employees
At December 31, 2016, the Company had 592 full-time equivalent employees. None of these employees is covered by a collective bargaining agreement. The Company considers relations with its employees to be good.
SUPERVISION AND REGULATION
General
The Company is a registered bank holding company under the federal Bank Holding Company Act of 1956, as amended (the “Holding Company Act”), and is required to file with the Federal Reserve Board an annual report and such additional information as the Federal Reserve Board may require pursuant to the Holding Company Act. The Company is subject to examination by the Federal Reserve Board.
-2-
Table of Contents
Lakeland is a state chartered banking association subject to supervision and examination by the Department of Banking and Insurance of the State of New Jersey (the “Department”) and the Federal Deposit Insurance Corporation (the “FDIC”). The regulations of the State of New Jersey and FDIC govern most aspects of Lakeland’s business, including reserves against deposits, loans, investments, mergers and acquisitions, borrowings, dividends, and location of branch offices. Lakeland is subject to certain restrictions imposed by law on, among other things, (i) the maximum amount of obligations of any one person or entity which may be outstanding at any one time, (ii) investments in stock or other securities of the Company or any subsidiary of the Company, and (iii) the taking of such stock or securities as collateral for loans to any borrower.
The Holding Company Act
The Holding Company Act limits the activities which may be engaged in by the Company and its subsidiaries to those of banking, the ownership and acquisition of assets and securities of banking organizations, and the management of banking organizations, and to certain non-banking activities which the Federal Reserve Board finds, by order or regulation, to be so closely related to banking or managing or controlling a bank as to be a proper incident thereto. The Federal Reserve Board is empowered to differentiate between activities by a bank holding company or a subsidiary thereof and activities commenced by acquisition of a going concern.
With respect to non-banking activities, the Federal Reserve Board has by regulation determined that several non-banking activities are closely related to banking within the meaning of the Holding Company Act and thus may be performed by bank holding companies. Although the Company’s management periodically reviews other avenues of business opportunities that are included in that regulation, the Company has no present plans to engage in any of these activities other than providing investment brokerage services.
With respect to the acquisition of banking organizations, the Company is required to obtain the prior approval of the Federal Reserve Board before it may, by merger, purchase or otherwise, directly or indirectly acquire all or substantially all of the assets of any bank or bank holding company, if, after such acquisition, it will own or control more than 5% of the voting shares of such bank or bank holding company.
Regulation of Bank Subsidiaries
There are various legal limitations, including Sections 23A and 23B of the Federal Reserve Act, which govern the extent to which a bank subsidiary may finance or otherwise supply funds to its holding company or its holding company’s non-bank subsidiaries. Under federal law, no bank subsidiary may, subject to certain limited exceptions, make loans or extensions of credit to, or investments in the securities of, its parent or the non-bank subsidiaries of its parent (other than direct subsidiaries of such bank which are not financial subsidiaries) or take their securities as collateral for loans to any borrower. Each bank subsidiary is also subject to collateral security requirements for any loans or extensions of credit permitted by such exceptions.
Commitments to Affiliated Institutions
The policy of the Federal Reserve Board provides that a bank holding company is expected to act as a source of financial strength to its subsidiary banks and to commit resources to support such subsidiary banks in circumstances in which it might not do so absent such policy.
Interstate Banking
The Riegle-Neal Interstate Banking and Branching Efficiency Act of 1994 permits bank holding companies to acquire banks in states other than their home state, regardless of applicable state law. New Jersey enacted legislation to authorize interstate banking and branching and the entry into New Jersey of foreign country banks. New Jersey did not authorize de novo branching into the state. However, under federal law, federal savings banks, which meet certain conditions, may branch de novo into a state, regardless of state law. The Dodd-Frank
-3-
Table of Contents
Wall Street Reform and Consumer Protection Act (the “Dodd-Frank Act”) removes the restrictions on interstate branching contained in the Riegle-Neal Act, and allows national banks and state banks to establish branches in any state if, under the laws of the state in which the branch is to be located, a state bank chartered by that state would be permitted to establish the branch.
Gramm-Leach-Bliley Act of 1999
The Gramm-Leach-Bliley Financial Services Modernization Act of 1999 (the “Modernization Act”) became effective in early 2000. The Modernization Act:
| • | allows bank holding companies meeting management, capital, and Community Reinvestment Act standards to engage in a substantially broader range of non-banking activities than previously was permissible, including insurance underwriting and making merchant banking investments in commercial and financial companies; if a bank holding company elects to become a financial holding company, it files a certification, effective in 30 days, and thereafter may engage in certain financial activities without further approvals (Lakeland Bancorp is such a financial holding company); |
| • | allows insurers and other financial services companies to acquire banks; |
| • | removes various restrictions that previously applied to bank holding company ownership of securities firms and mutual fund advisory companies; and |
| • | establishes the overall regulatory structure applicable to bank holding companies that also engage in insurance and securities operations. |
The Modernization Act also modified other financial laws, including laws related to financial privacy and community reinvestment.
The USA PATRIOT Act
As part of the Uniting and Strengthening America by Providing Appropriate Tools Required to Intercept and Obstruct Terrorism Act of 2001, Congress adopted the International Money Laundering Abatement and Financial Anti-Terrorism Act of 2001 (collectively, the “USA PATRIOT Act”). By way of amendments to the Bank Secrecy Act, Title III of the USA PATRIOT Act encourages information sharing among bank regulatory agencies and law enforcement bodies. Further, certain provisions of Title III impose affirmative obligations on a broad range of financial institutions, including banks, thrifts, brokers, dealers, credit unions, money transfer agents and parties registered under the Commodity Exchange Act.
Among other requirements, Title III of the USA PATRIOT Act imposes the following requirements with respect to financial institutions:
| • | All financial institutions must establish anti-money laundering programs that include, at a minimum: (i) internal policies, procedures, and controls; (ii) specific designation of an anti-money laundering compliance officer; (iii) ongoing employee training programs; and (iv) an independent audit function to test the anti-money laundering program. |
| • | The Secretary of the Department of the Treasury, in conjunction with other bank regulators, was authorized to issue regulations that provide for minimum standards with respect to customer identification at the time new accounts are opened. |
| • | Financial institutions that establish, maintain, administer, or manage private banking accounts or correspondent accounts in the United States for non-United States persons or their representatives (including foreign individuals visiting the United States) are required to establish appropriate, specific and, where necessary, enhanced due diligence policies, procedures, and controls designed to detect and report money laundering. |
-4-
Table of Contents
| • | Financial institutions are prohibited from establishing, maintaining, administering or managing correspondent accounts for foreign shell banks (foreign banks that do not have a physical presence in any country), and will be subject to certain record keeping obligations with respect to correspondent accounts of foreign banks. |
| • | Bank regulators are directed to consider a holding company’s effectiveness in combating money laundering when ruling on Federal Reserve Act and Bank Merger Act applications. |
The United States Treasury Department has issued a number of implementing regulations which address various requirements of the USA PATRIOT Act and are applicable to financial institutions such as Lakeland. These regulations impose obligations on financial institutions to maintain appropriate policies, procedures and controls to detect, prevent and report money laundering and terrorist financing and to verify the identity of their customers. Banking agencies have strictly enforced various anti-money laundering and suspicious activity reporting requirements using formal and informal enforcement tools to cause banks to comply with these provisions.
Sarbanes-Oxley Act of 2002
The Sarbanes-Oxley Act of 2002 (the “SOA”) added new legal requirements for public companies affecting corporate governance, accounting and corporate reporting, to increase corporate responsibility and to protect investors.
The SOA addresses, among other matters:
| • | audit committees for all reporting companies; |
| • | certification of financial statements by the chief executive officer and the chief financial officer; |
| • | the forfeiture of bonuses or other incentive-based compensation and profits from the sale of an issuer’s securities by directors and senior officers in the twelve month period following initial publication of any financial statements that later require restatement; |
| • | a prohibition on insider trading during pension plan black out periods; |
| • | disclosure of off-balance sheet transactions; |
| • | a prohibition on personal loans to directors and officers (other than loans made by an insured depository institution (as defined in the Federal Deposit Insurance Act), if the loan is subject to the insider lending restrictions of Section 22(h) of the Federal Reserve Act); |
| • | expedited filing requirements for Form 4’s; |
| • | disclosure of a code of ethics and filing a Form 8-K for a change or waiver of such code; |
| • | “real time” filing of periodic reports; |
| • | the formation of a public accounting oversight board; |
| • | auditor independence; and |
| • | various increased criminal penalties for violations of the securities laws. |
The Securities and Exchange Commission (the “SEC”) has enacted various rules to implement various provisions of the SOA with respect to, among other matters, disclosure in periodic filings pursuant to the Exchange Act. Each of the national stock exchanges, including the NASDAQ Stock Market where Lakeland Bancorp’s common stock is listed, have corporate governance listing standards, including rules strengthening director independence requirements for boards, and requiring the adoption of charters for the nominating and corporate governance, compensation and audit committees.
-5-
Table of Contents
Regulation W
Transactions between a bank and its “affiliates” are quantitatively and qualitatively restricted under the Federal Reserve Act. The Federal Deposit Insurance Act applies Sections 23A and 23B to insured nonmember banks in the same manner and to the same extent as if they were members of the Federal Reserve System. The Federal Reserve Board has also issued Regulation W, which codifies prior regulations under Sections 23A and 23B of the Federal Reserve Act and interpretative guidance with respect to affiliate transactions. Regulation W incorporates the exemption from the affiliate transaction rules but expands the exemption to cover the purchase of any type of loan or extension of credit from an affiliate. Affiliates of a bank include, among other entities, the bank’s holding company and companies that are under common control with the bank. The Company is considered to be an affiliate of Lakeland. In general, subject to certain specified exemptions, a bank or its subsidiaries are limited in their ability to engage in “covered transactions” with affiliates:
| • | to an amount equal to 10% of the bank’s capital and surplus, in the case of covered transactions with any one affiliate; and |
| • | to an amount equal to 20% of the bank’s capital and surplus, in the case of covered transactions with all affiliates. |
In addition, a bank and its subsidiaries may engage in covered transactions and other specified transactions only on terms and under circumstances that are substantially the same, or at least as favorable to the bank or its subsidiary, as those prevailing at the time for comparable transactions with nonaffiliated companies. A “covered transaction” includes:
| • | a loan or extension of credit to an affiliate; |
| • | a purchase of, or an investment in, securities issued by an affiliate; |
| • | a purchase of assets from an affiliate, with some exceptions; |
| • | the acceptance of securities issued by an affiliate as collateral for a loan or extension of credit to any party; and |
| • | the issuance of a guarantee, acceptance or letter of credit on behalf of an affiliate. |
In addition, under Regulation W:
| • | a bank and its subsidiaries may not purchase a low-quality asset from an affiliate; |
| • | covered transactions and other specified transactions between a bank or its subsidiaries and an affiliate must be on terms and conditions that are consistent with safe and sound banking practices; and |
| • | with some exceptions, each loan or extension of credit by a bank to an affiliate must be secured by certain types of collateral with a market value ranging from 100% to 130%, depending on the type of collateral, of the amount of the loan or extension of credit. |
Regulation W generally excludes all non-bank and non-savings association subsidiaries of banks from treatment as affiliates, except to the extent that the Federal Reserve Board decides to treat these subsidiaries as affiliates.
Community Reinvestment Act
Under the Community Reinvestment Act (“CRA”), as implemented by FDIC regulations, a state bank has a continuing and affirmative obligation consistent with its safe and sound operation to help meet the credit needs of its entire community, including low and moderate income neighborhoods. The CRA does not establish specific lending requirements or programs for financial institutions nor does it limit an institution’s discretion to develop the types of products and services that it believes are best suited to its particular community. The CRA requires the FDIC, in connection with its examination of a state non-member bank, to assess the bank’s record of meeting
-6-
Table of Contents
the credit needs of its community and to take that record into account in its evaluation of certain applications by the bank. Under the FDIC’s CRA evaluation system, the FDIC focuses on three tests: (i) a lending test, to evaluate the institution’s record of making loans in its service areas; (ii) an investment test, to evaluate the institution’s record of investing in community development projects, affordable housing and programs benefiting low or moderate income individuals and businesses; and (iii) a service test, to evaluate the institution’s delivery of services through its branches, ATMs and other offices. The CRA also requires all institutions to make public disclosure of their CRA ratings. Lakeland Bank received an “outstanding” CRA rating in its most recent examination.
Securities and Exchange Commission
The common stock of the Company is registered with the SEC under the Exchange Act. As a result, the Company and its officers, directors, and major stockholders are obligated to file certain reports with the SEC. The Company is subject to proxy and tender offer rules promulgated pursuant to the Exchange Act. You may read and copy any document the Company files with the SEC at the SEC’s Public Reference Room at 100 F Street, N.E., Washington, D.C. 20549. Please call the SEC at 1-800-SEC-0330 for further information about the Public Reference Room. The SEC maintains a website at http://www.sec.gov that contains reports, proxy and information statements, and other information regarding issuers that file electronically with the SEC, such as the Company.
The Company maintains a website at http://www.lakelandbank.com. The Company makes available on its website the proxy statements and reports on Forms 8-K, 10-K and 10-Q that it files with the SEC as soon as reasonably practicable after such material is electronically filed with or furnished to the SEC. Additionally, the Company has adopted and posted on its website a Code of Ethics that applies to its principal executive officer, principal financial officer and principal accounting officer. The Company intends to disclose any amendments to or waivers of the Code of Ethics on its website.
Effect of Government Monetary Policies
The earnings of the Company are and will be affected by domestic economic conditions and the monetary and fiscal policies of the United States government and its agencies. The monetary policies of the Federal Reserve Board have had, and will likely continue to have, an important impact on the operating results of commercial banks through the Board’s power to implement national monetary policy in order to, among other things, curb inflation or combat a recession. The Federal Reserve Board has a major effect upon the levels of bank loans, investments and deposits through its open market operations in United States government securities and through its regulation of, among other things, the discount rate of borrowings of banks and the reserve requirements against bank deposits. It is not possible to predict the nature and impact of future changes in monetary fiscal policies.
Dividend Restrictions
The Company is a legal entity separate and distinct from Lakeland. Virtually all of the revenue of the Company available for payment of dividends on its capital stock will result from amounts paid to the Company by Lakeland. All such dividends are subject to various limitations imposed by federal and state laws and by regulations and policies adopted by federal and state regulatory agencies. Under state law, a bank may not pay dividends unless, following the dividend payment, the capital stock of the bank would be unimpaired and either (a) the bank will have a surplus of not less than 50% of its capital stock, or, if not, (b) the payment of the dividend will not reduce the surplus of the bank.
If, in the opinion of the FDIC, a bank under its jurisdiction is engaged in or is about to engage in an unsafe or unsound practice (which could include the payment of dividends), the FDIC may require, after notice and hearing, that such bank cease and desist from such practice or, as a result of an unrelated practice, require the
-7-
Table of Contents
bank to limit dividends in the future. The Federal Reserve Board has similar authority with respect to bank holding companies. In addition, the Federal Reserve Board and the FDIC have issued policy statements which provide that insured banks and bank holding companies should generally only pay dividends out of current operating earnings. Regulatory pressures to reclassify and charge off loans and to establish additional loan loss reserves can have the effect of reducing current operating earnings and thus impacting an institution’s ability to pay dividends. Further, as described herein, the regulatory authorities have established guidelines with respect to the maintenance of appropriate levels of capital by a bank or bank holding company under their jurisdiction. Compliance with the standards set forth in these policy statements and guidelines could limit the amount of dividends which the Company and Lakeland may pay. Banking institutions that fail to maintain the minimum capital ratios, or that maintain the requisite minimum capital ratios but do so at a level below the minimum capital ratios plus the new capital conservation buffer, will face constraints on their ability to pay dividends. See “Capital Requirements” below.
Capital Requirements
Pursuant to the Federal Deposit Insurance Corporation Improvement Act of 1991 (FDICIA), each federal banking agency has promulgated regulations, specifying the levels at which a financial institution would be considered “well capitalized,” “adequately capitalized,” “undercapitalized,” “significantly undercapitalized,” or “critically undercapitalized,” and to take certain mandatory and discretionary supervisory actions based on the capital level of the institution. To qualify to engage in financial activities under the Gramm-Leach-Bliley Act, all depository institutions must be “well capitalized.” The financial holding company of a bank will be put under directives to raise its capital levels or divest its activities if the depository institution falls from that level.
In July 2013, the Federal Reserve Board, the FDIC and the Comptroller of the Currency adopted final rules establishing a new comprehensive capital framework for U.S. banking organizations (the “Basel Rules”). The Basel Rules implement the Basel Committee’s December 2010 framework, commonly referred to as Basel III, for strengthening international capital standards as well as certain provisions of the Dodd-Frank Act, as discussed below. The Basel Rules substantially revise the risk-based capital requirements applicable to bank holding companies and depository institutions, including Lakeland Bancorp and Lakeland Bank, compared to prior U.S. risk-based capital rules. The Basel Rules define the components of capital and address other issues affecting the numerator in banking institutions’ regulatory capital ratios. The Basel Rules also address risk weights and other issues affecting the denominator in banking institutions’ regulatory capital ratios and replace the existing risk-weighting approach, which was derived from Basel I capital accords of the Basel Committee, with a more risk-sensitive approach based, in part, on the standardized approach in the Basel Committee’s 2004 Basel II capital accords. The Basel Rules also implement the requirements of Section 939A of the Dodd-Frank Act to remove references to credit ratings from the federal banking agencies’ rules.
The Basel Rules became effective for us on January 1, 2015 (subject to phase-in periods for certain components).
For bank holding companies and banks like Lakeland Bancorp and Lakeland Bank, January 1, 2015 was the start date for compliance with the revised minimum regulatory capital ratios and for determining risk-weighted assets under what the Basel Rules call a “standardized approach.” As of January 1, 2015, Lakeland Bancorp and Lakeland Bank were required to maintain the following minimum capital ratios, expressed as a percentage of risk-weighted assets:
| • | Common Equity Tier 1 Capital Ratio of 4.5% (this is referred to as the “CET1”); |
| • | Tier 1 Capital Ratio (CET1 capital plus “Additional Tier 1 capital”) of 6.0%; and |
| • | Total Capital Ratio (Tier 1 capital plus Tier 2 capital) of 8.0%. |
In addition, Lakeland Bancorp and Lakeland Bank are subject to a leverage ratio of 4% (calculated as Tier 1 capital to average consolidated assets as reported on the consolidated financial statements).
-8-
Table of Contents
The Basel Rules also require a “capital conservation buffer.” When fully phased in on January 1, 2019, Lakeland Bancorp and Lakeland Bank will be required to maintain a 2.5% capital conservation buffer, in addition to the minimum capital ratios described above, effectively resulting in the following minimum capital ratios on January 1, 2019:
| • | CET1 of 7.0%; |
| • | Tier 1 Capital Ratio of 8.5%; and |
| • | Total Capital Ratio of 10.5%. |
The purpose of the capital conservation buffer is to ensure that banking organizations conserve capital when it is needed most, allowing them to weather periods of economic stress. Banking institutions with a CET1, Tier 1 Capital Ratio and Total Capital Ratio above the minimum capital ratios but below the minimum capital ratios plus the capital conservation buffer will face constraints on their ability to pay dividends, repurchase equity and pay discretionary bonuses to executive officers, based on the amount of the shortfall. The implementation of the capital conservation buffer began on January 1, 2016 at the 0.625% level (thus effectively resulting in minimum capital ratios as of January 1, 2016 for CET1, Tier 1 Capital Ratio and Total Capital Ratio of 5.125%, 6.625% and 8.625%, respectively), and increases by 0.625% on each subsequent January 1 until it reaches 2.5% on January 1, 2019.
The Basel Rules also adopted a “countercyclical capital buffer,” which is not applicable to Lakeland Bancorp or Lakeland Bank. That buffer is applicable only to “advanced approaches banking organizations,” which generally are those with consolidated total assets of at least $250 billion.
The Basel Rules provide for several deductions from and adjustments to CET1, which are being phased in between January 1, 2015 and January 1, 2018. For example, mortgage servicing rights, deferred tax assets dependent upon future taxable income and significant investments in common equity issued by nonconsolidated financial entities must be deducted from CET1 to the extent that any one of those categories exceeds 10% of CET1 or all such categories in the aggregate exceed 15% of CET1.
Under prior capital standards, the effects of accumulated other comprehensive income items included in capital were excluded for the purposes of determining regulatory capital ratios. Under the Basel Rules, the effects of certain accumulated other comprehensive income items are not excluded; however, banking organizations such as Lakeland Bancorp and Lakeland Bank may make a one-time permanent election to continue to exclude these items effective as of January 1, 2015. Lakeland Bancorp and Lakeland Bank made such an election to continue to exclude these items.
While the Basel Rules generally require the phase-out of non-qualifying capital instruments such as trust preferred securities and cumulative perpetual preferred stock, holding companies with less than $15 billion in total consolidated assets as of December 31, 2009, such as Lakeland Bancorp, may permanently include non-qualifying instruments that were issued and included in Tier 1 or Tier 2 capital prior to May 19, 2010 in Additional Tier 1 or Tier 2 capital until they redeem such instruments or until the instruments mature.
The Basel Rules prescribe a standardized approach for calculating risk-weighted assets that expands the risk-weighting categories from the previous four categories (0%, 20%, 50% and 100%) to a much larger and more risk-sensitive number of categories, depending on the nature of the assets, generally ranging from 0% for U.S. Government and agency securities, to 600% for certain equity exposures, and resulting in higher risk weights for a variety of asset categories. In addition, the Basel Rules provide more advantageous risk weights for derivatives and repurchase-style transactions cleared through a qualifying central counterparty and increase the scope of eligible guarantors and eligible collateral for purposes of credit risk mitigation.
Consistent with the Dodd-Frank Act, the Basel Rules adopt alternatives to credit ratings for calculating the risk-weighting for certain assets.
-9-
Table of Contents
With respect to Lakeland Bank, the Basel Rules revise the “prompt corrective action” regulations under Section 38 of the Federal Deposit Insurance Act by (i) introducing a CET1 ratio requirement at each capital quality level (other than critically undercapitalized), with the required CET1 ratio being 6.5% for well-capitalized status (a new standard); (ii) increasing the minimum Tier 1 capital ratio requirement for each category, with the minimum Tier 1 capital ratio for well-capitalized status being 8% (increased from 6%); and (iii) requiring a leverage ratio of 5% to be well-capitalized (increased from the previously required leverage ratio of 3% or 4%). The Basel Rules do not change the total risk-based capital requirement for any “prompt corrective action” category.
Effective as of January 1, 2015, the FDIC’s regulations implementing these provisions of FDICIA provide that an institution will be classified as “well capitalized” if it (i) has a total risk-based capital ratio of at least 10.0 percent, (ii) has a Tier 1 risk-based capital ratio of at least 8.0 percent, (iii) has a CET1 ratio of at least 6.5 percent, (iv) has a Tier 1 leverage ratio of at least 5.0 percent, and (v) meets certain other requirements. An institution will be classified as “adequately capitalized” if it (i) has a total risk-based capital ratio of at least 8.0 percent, (ii) has a Tier 1 risk-based capital ratio of at least 6.0 percent, (iii) has a CET1 ratio of at least 4.5 percent, (iv) has a Tier 1 leverage ratio of at least 4.0 percent, and (v) does not meet the definition of “well capitalized.” An institution will be classified as “undercapitalized” if it (i) has a total risk-based capital ratio of less than 8.0 percent, (ii) has a Tier 1 risk-based capital ratio of less than 6.0 percent, (iii) has a CET1 ratio of less than 4.5 percent or (iv) has a Tier 1 leverage ratio of less than 4.0 percent. An institution will be classified as “significantly undercapitalized” if it (i) has a total risk-based capital ratio of less than 6.0 percent, (ii) has a Tier 1 risk-based capital ratio of less than 4.0 percent, (iii) has a CET1 ratio of less than 3.0 percent or (iv) has a Tier 1 leverage ratio of less than 3.0 percent. An institution will be classified as “critically undercapitalized” if it has a tangible equity to total assets ratio that is equal to or less than 2.0 percent. An insured depository institution may be deemed to be in a lower capitalization category if it receives an unsatisfactory examination rating. Similar categories apply to bank holding companies. When the capital conservation buffer is fully phased in, the capital ratios applicable to depository institutions under the Basel Rules will exceed the ratios to be considered well-capitalized under the prompt corrective action regulations.
As of December 31, 2016, Lakeland Bancorp and Lakeland Bank met all capital requirements under the Basel Rules as then in effect, and the Company believes that as of such date, it would meet all capital requirements under the Basel Rules on a fully phased-in basis, if the full phase-in of such requirements were currently in effect.
Volcker Rule
In December 2013, the Federal Reserve Board, the FDIC and several other governmental regulatory agencies issued final rules to implement the Volcker Rule contained in section 619 of the Dodd-Frank Act, generally to become effective on July 21, 2015. The Federal Reserve extended the Volcker Rule’s conformance period until July 21, 2017. The Volcker Rule prohibits an insured depository institution and its affiliates from (i) engaging in “proprietary trading” and (ii) investing in or sponsoring certain types of funds (defined as “Covered Funds”) subject to certain limited exceptions. The Company does not own any interests in any hedge funds or private equity funds that are designated “Covered Funds” under the Volcker Rule.
Federal Deposit Insurance and Premiums
Lakeland’s deposits are insured up to applicable limits by the Deposit Insurance Fund (“DIF”) of the FDIC and are subject to deposit insurance assessments to maintain the DIF. As a result of the Dodd-Frank Act, the basic federal deposit insurance limit was permanently increased to at least $250,000.
In November 2010, the FDIC approved a rule to change the assessment base from adjusted domestic deposits to average consolidated total assets minus average tangible equity, as required by the Dodd-Frank Act. These new assessment rates began in the second quarter of 2011 and were paid at the end of September 2011.
-10-
Table of Contents
Since the new base is larger than the current base, the FDIC’s rule lowered the total base assessment rates to between 2.5 and 9 basis points for banks in the lowest risk category, and 30 to 45 basis points for banks in the highest risk category. The Company paid $2.2 million in total FDIC assessments in 2016 and $2.1 million in 2015.
Pursuant to the Dodd-Frank Act, the FDIC has established 2.0% as the designated reserve ratio (“DRR”), that is, the ratio of the DIF to insured deposits. The FDIC has adopted a plan under which it will meet the statutory minimum DRR of 1.35% by September 30, 2020, the deadline imposed by the Dodd-Frank Act. The Dodd-Frank Act requires the FDIC to offset the effect on institutions with assets less than $10 billion of the increase in the statutory minimum DRR to 1.35% from the former statutory minimum of 1.15%. In March 2016, the FDIC adopted a rule that imposes a surcharge on the quarterly assessments of insured depository institutions with total consolidated assets of $10 billion or more. The surcharge will equal an annual rate of 4.5 basis points applied to the institution’s assessment base, with certain adjustments.
In addition to deposit insurance assessments, the FDIC is required to continue to collect from institutions payments for the servicing of obligations of the Financing Corporation (“FICO”) that were issued in connection with the resolution of savings and loan associations, so long as such obligations remain outstanding. Lakeland paid a FICO premium of approximately $231,000 in 2016 and expects to pay a similar amount in 2017.
The Dodd-Frank Act
The Dodd-Frank Act, which was signed into law on July 21, 2010, significantly changed the bank regulatory landscape and has impacted and will continue to have a broad impact on the financial services industry as a result of significant regulatory and compliance changes, including, among other things, (i) enhanced resolution authority over troubled and failing banks and their holding companies; (ii) increased capital and liquidity requirements; (iii) increased regulatory examination fees; (iv) changes to assessments to be paid to the FDIC for federal deposit insurance; and (v) numerous other provisions designed to improve supervision and oversight of, and strengthening safety and soundness for, the financial services sector. Generally, the Dodd-Frank Act became effective the day after it was signed into law, but different effective dates apply to specific sections of the law.
The following is a summary of certain provisions of the Dodd-Frank Act:
| • | Minimum Capital Requirements. The Dodd-Frank Act requires new capital rules and the application of the same leverage and risk-based capital requirements that apply to insured depository institutions to most bank holding companies. In addition to making bank holding companies subject to the same capital requirements as their bank subsidiaries, these provisions (often referred to as the Collins Amendment to the Dodd-Frank Act) were also intended to eliminate or significantly reduce the use of hybrid capital instruments, especially trust preferred securities, as regulatory capital. See “Capital Requirements” for a description of new capital requirements adopted by U.S. federal banking regulators in 2013 and the treatment of trust preferred securities under such rules. |
| • | Deposit Insurance. The Dodd-Frank Act makes permanent the $250,000 deposit insurance limit for insured deposits. Amendments to the Federal Deposit Insurance Act also revised the assessment base against which an insured depository institution’s deposit insurance premiums paid to the Deposit Insurance Fund (“DIF”) are calculated. Under the amendments, the assessment base is no longer the institution’s deposit base, but rather its average consolidated total assets less its average tangible equity during the assessment period. Additionally, the Dodd-Frank Act makes changes to the minimum designated reserve ratio of the DIF, increasing the minimum from 1.15 percent to 1.35 percent of the estimated amount of total insured deposits and eliminating the requirement that the FDIC pay dividends to depository institutions when the reserve ratio exceeds certain thresholds. In December 2010, the FDIC increased the designated reserve ratio to 2.0 percent. |
| • | Shareholder Votes. The Dodd-Frank Act requires publicly traded companies like Lakeland Bancorp to give shareholders a non-binding vote on executive compensation and so-called “golden parachute” payments in certain circumstances. |
-11-
Table of Contents
| • | Transactions with Affiliates. The Dodd-Frank Act enhances the requirements for certain transactions with affiliates under Section 23A and 23B of the Federal Reserve Act, including an expansion of the definition of “covered transactions” and increasing the amount of time for which collateral requirements regarding covered transactions must be maintained. These requirements became effective during 2011. |
| • | Transactions with Insiders. Insider transaction limitations are expanded through the strengthening of loan restrictions to insiders and the expansion of the types of transactions subject to the various limits, including derivative transactions, repurchase agreements, reverse repurchase agreements and securities lending or borrowing transactions. Restrictions are also placed on certain asset sales to and from an insider to an institution, including requirements that such sales be on market terms and, in certain circumstances, approved by the institution’s board of directors. These requirements became effective during 2011. |
| • | Enhanced Lending Limits. The Dodd-Frank Act strengthened the previous limits on a depository institution’s credit exposure to one borrower which limited a depository institution’s ability to extend credit to one person (or group of related persons) in an amount exceeding certain thresholds. The Dodd-Frank Act expanded the scope of these restrictions to include credit exposure arising from derivative transactions, repurchase agreements, and securities lending and borrowing transactions. |
| • | Compensation Practices. The Dodd-Frank Act provides that the appropriate federal regulators must establish standards prohibiting as an unsafe and unsound practice any compensation plan of a bank holding company or other “covered financial institution” that provides an insider or other employee with “excessive compensation” or compensation that gives rise to excessive risk or could lead to a material financial loss to such firm. In June 2010, prior to the Dodd-Frank Act, the bank regulatory agencies promulgated the Interagency Guidance on Sound Incentive Compensation Policies, which sets forth three key principles concerning incentive compensation arrangements: |
| • | such arrangements should provide employees incentives that balance risk and financial results in a manner that does not encourage employees to expose the financial institution to imprudent risks; |
| • | such arrangements should be compatible with effective controls and risk management; and |
| • | such arrangements should be supported by strong corporate governance with effective and active oversight by the financial institution’s board of directors. |
Together, the Dodd-Frank Act and guidance from the bank regulatory agencies on compensation may impact the Company’s compensation practices.
| • | The Consumer Financial Protection Bureau (“Bureau”). The Dodd-Frank Act created the Bureau within the Federal Reserve. The Bureau is tasked with establishing and implementing rules and regulations under certain federal consumer protection laws with respect to the conduct of providers of certain consumer financial products and services. The Bureau has rulemaking authority over many of the statutes governing products and services offered to bank consumers. In addition, the Dodd-Frank Act permits states to adopt consumer protection laws and regulations that are more stringent than those regulations promulgated by the Bureau and state attorneys general are permitted to enforce consumer protection rules adopted by the Bureau against state-chartered institutions. The Bureau has examination and enforcement authority over all banks and savings institutions with more than $10 billion in assets. Institutions with $10 billion or less in assets, such as the Bank, will continue to be examined for compliance with the consumer laws by their primary bank regulators. |
| • | De Novo Banking. The Dodd-Frank Act allows de novo interstate branching by banks. |
Final rules have been issued which implement the ability-to-repay and qualified mortgage (QM) provisions of the Truth in Lending Act, as amended by the Dodd-Frank Act (the “QM Rule”). The QM Rule impacted our mortgage originations when it became effective in January 2014. The ability-to-repay provision requires creditors
-12-
Table of Contents
to make reasonable, good faith determinations that borrowers are able to repay their mortgages before extending the credit based on a number of factors and consideration of financial information about the borrower from reasonably reliable third-party documents. Under the Dodd-Frank Act and the QM Rule, loans meeting the definition of “qualified mortgage” are entitled to a presumption that the lender satisfied the ability-to-repay requirements. The presumption is a conclusive presumption/safe harbor for prime loans meeting the QM requirements, and a rebuttable presumption for higher-priced/subprime loans meeting the QM requirements. The definition of a “qualified mortgage” incorporates the statutory requirements, such as not allowing negative amortization or terms longer than 30 years. The QM Rule also adds an explicit maximum 43 percent debt-to-income ratio for borrowers if the loan is to meet the QM definition, though some mortgages that meet GSE, FHA and VA underwriting and eligibility guidelines may, for a period not to exceed seven years, meet the QM definition without being subject to the 43 percent debt-to-income limits. We cannot assure you that existing or future regulations will not have a material adverse impact on our residential mortgage loan business or the housing markets in which we participate.
In addition, provisions in the Dodd-Frank Act which have revised the capital requirements of the Company and the Bank could require the Company and the Bank to seek additional sources of capital in the future. See “Capital Requirements.”
The Dodd-Frank Act contains numerous other provisions affecting financial institutions of all types, many of which may have an impact on our operating environment in substantial and unpredictable ways. Consequently, the Dodd-Frank Act is likely to continue to increase our cost of doing business, it may limit or expand our permissible activities, and it may affect the competitive balance within our industry and market areas.
Proposed Legislation
From time to time proposals are made in the United States Congress, the New Jersey Legislature, and before various bank regulatory authorities, which would alter the powers of, and place restrictions on, different types of banking organizations. It is impossible to predict the impact, if any, of potential legislative trends on the business of the Company and its subsidiaries.
In accordance with federal law providing for deregulation of interest on all deposits, banks and thrift organizations are now unrestricted by law or regulation from paying interest at any rate on most time deposits. It is not clear whether deregulation and other pending changes in certain aspects of the banking industry will result in further increases in the cost of funds in relation to prevailing lending rates.
Our business, financial condition, operating results and cash flows can be affected by a number of factors, including, but not limited to, those set forth below, any one of which could cause our actual results to vary materially from recent results or from our anticipated future results.
The Dodd-Frank Act could materially and adversely affect us by increasing compliance costs, heightening our risk of noncompliance with applicable regulations, and changing the competitive landscape in the banking industry.
On July 21, 2010, the Dodd-Frank Wall Street Reform and Consumer Protection Act of 2010, or the Dodd-Frank Act, was signed into law. The Dodd-Frank Act has resulted in sweeping changes in the regulation of financial institutions. As discussed in the section herein entitled “Business-Supervision and Regulation,” the Dodd-Frank Act contains numerous provisions that affect all banks and bank holding companies. Some of the provisions in the Dodd-Frank Act were subject to regulatory rule-making and implementation, the full effects of which are not yet known. Although we cannot predict the full and specific impact and long-term effects that the Dodd-Frank Act and the regulations promulgated thereunder will have on us and our prospects, our target
-13-
Table of Contents
markets and the financial industry more generally, we believe that the Dodd-Frank Act and the regulations promulgated thereunder are likely to continue to impose additional administrative and regulatory burdens that will obligate us to continue to incur additional expenses and will continue to adversely affect our margins and profitability. For example, the elimination of the prohibition on the payment of interest on demand deposits could materially increase our interest expense, depending on our competitors’ responses. Provisions in the legislation mandating modification of the capital requirements applicable to the Company and the Bank, and the resulting adoption by federal regulators of the new capital requirements described under “Business-Supervision and Regulation-Capital Requirements,” could require the Company and the Bank to seek additional sources of capital in the future. More stringent consumer protection regulations could materially and adversely affect our profitability.
President Donald Trump has stated that he intends to relax financial regulations, including various provisions of the Dodd-Frank Act and the rules implementing those provisions. The nature and extent of future legislative and regulatory changes affecting financial institutions remains very unpredictable at this time.
The Company and the Bank are subject to more stringent capital and liquidity requirements.
The Dodd-Frank Act also imposes more stringent capital requirements on bank holding companies such as Lakeland Bancorp by, among other things, imposing leverage ratios on bank holding companies and prohibiting new trust preferred issuances from counting as Tier I capital. These restrictions will limit our future capital strategies. Under the Dodd-Frank Act, our currently outstanding trust preferred securities will continue to count as Tier I capital, but we will be unable to issue replacement or additional trust preferred securities which would count as Tier I capital.
As further described above under “Business-Supervision and Regulation-Capital Requirements,” we were required to meet new capital requirements beginning on January 1, 2015. In addition, beginning in 2016, banks and bank holding companies were required to maintain a capital conservation buffer on top of minimum risk-weighted asset ratios. The implementation of the capital conservation buffer began on January 1, 2016 at the 0.625% level, and increases by 0.625% on each subsequent January 1 until it reaches 2.5% when fully phased in on January 1, 2019. Banking institutions which do not maintain capital in excess of the capital conservation buffer face constraints on the payment of dividends, equity repurchases and compensation based on the amount of the shortfall. Accordingly, if the Bank fails to maintain the applicable minimum capital ratios and the capital conservation buffer, distributions to Lakeland Bancorp may be prohibited or limited.
Future increases in minimum capital requirements could adversely affect our net income. Furthermore, our failure to comply with the minimum capital requirements could result in our regulators taking formal or informal actions against us which could restrict our future growth or operations.
The Company’s future growth may require the Company to raise additional capital in the future, but that capital may not be available when it is needed or may be available only at an excessive cost.
The Company is required by regulatory authorities to maintain adequate levels of capital to support its operations. The Company anticipates that current capital levels will satisfy regulatory requirements for the foreseeable future. The Company, however, may at some point choose to raise additional capital to support its continued growth. The Company’s ability to raise additional capital will depend, in part, on conditions in the capital markets at that time, which are outside of the Company’s control. Accordingly, the Company may be unable to raise additional capital, if and when needed, on terms acceptable to the Company, or at all. If the Company cannot raise additional capital when needed, its ability to further expand operations through internal growth and acquisitions could be materially impacted. In the event of a material decrease in the Company’s stock price, future issuances of equity securities could result in dilution of existing shareholder interests.
-14-
Table of Contents
A decrease in our ability to borrow funds could adversely affect our liquidity.
Our ability to obtain funding from the Federal Home Loan Bank or through our overnight federal funds lines with other banks could be negatively affected if we experienced a substantial deterioration in our financial condition or if such funding became restricted due to deterioration in the financial markets. While we have a contingency funds management plan to address such a situation if it were to occur (such plan includes deposit promotions, the sale of securities and the curtailment of loan growth, if necessary), a significant decrease in our ability to borrow funds could adversely affect our liquidity.
We are subject to interest rate risk and variations in interest rates may negatively affect our financial performance.
We are unable to predict actual fluctuations of market interest rates. Rate fluctuations are influenced by many factors, including:
| • | inflation or deflation |
| • | excess growth or recession; |
| • | a rise or fall in unemployment; |
| • | tightening or expansion of the money supply; |
| • | domestic and international disorder; |
| • | instability in domestic and foreign financial markets; and |
| • | actions taken or statements made by the Federal Reserve Board. |
Both increases and decreases in the interest rate environment may reduce our profits. We expect that we will continue to realize income from the difference or “spread” between the interest we earn on loans, securities and other interest-earning assets, and the interest we pay on deposits, borrowings and other interest-bearing liabilities. Our net interest spreads are affected by the differences between the maturities and repricing characteristics of our interest-earning assets and interest-bearing liabilities. Our interest-earning assets may not reprice as slowly or rapidly as our interest-bearing liabilities. Changes in market interest rates could materially and adversely affect our net interest spread, asset quality, levels of prepayments, cash flows, market value of our securities portfolio, loan and deposit growth, costs and yields on loans and deposits and our overall profitability. Competition for our deposits has increased significantly as a result of the recent low interest rate environment.
Declines in value may adversely impact our investment portfolio.
As of December 31, 2016, the Company had approximately $606.7 million and $147.6 million in available for sale and held to maturity investment securities, respectively. We may be required to record impairment charges on our investment securities if they suffer a decline in value that is considered other-than-temporary. Numerous factors, including lack of liquidity for sales of certain investment securities, absence of reliable pricing information for investment securities, adverse changes in business climate, adverse actions by regulators, or unanticipated changes in the competitive environment could have a negative effect on our investment portfolio in future periods. If an impairment charge is significant enough it could affect the ability of Lakeland to upstream dividends to the Company, which could have a material adverse effect on our liquidity and our ability to pay dividends to shareholders and could also negatively impact our regulatory capital ratios.
The Company may incur impairment to goodwill.
We review our goodwill at least annually. Our valuation methodology for assessing impairment requires management to make judgments and assumptions based on historical experience and to rely on projections of future operating performance. We operate in a competitive environment and projections of future operating
-15-
Table of Contents
results and cash flows may vary significantly from actual results. Additionally, if our analysis results in an impairment to our goodwill, we would be required to record a non-cash charge to earnings in our financial statements during the period in which such impairment is determined to exist. Any such charge could have a material adverse effect on our results of operations and our stock price.
The extensive regulation and supervision to which we are subject impose substantial restrictions on our business.
The Company, Lakeland and certain non-bank subsidiaries are subject to extensive regulation and supervision. Banking regulations are primarily intended to protect depositors’ funds, federal deposit insurance funds and the banking system as a whole. Such laws are not designed to protect our shareholders. These regulations affect our lending practices, capital structure, investment practices, dividend policy and growth, among other things. Lakeland is also subject to a number of laws which, among other things, govern its lending practices and require the Bank to establish and maintain comprehensive programs relating to anti-money laundering and customer identification. The United States Congress and federal regulatory agencies continually review banking laws, regulations and policies for possible changes. Changes to statutes, regulations or regulatory policies, including changes in interpretation or implementation of statutes, regulations or policies, could affect us in substantial and unpredictable ways. Such changes could subject us to additional costs, limit the types of financial services and products we may offer and/or increase the ability of non-banks to offer competing financial services and products, among other things. Failure to comply with laws, regulations or policies could result in sanctions by regulatory agencies, civil money penalties and/or reputational damage, which could have a material adverse effect on our business, financial condition and results of operations.
Lakeland’s ability to pay dividends is subject to regulatory limitations which, to the extent that our holding company requires such dividends in the future, may affect our holding company’s ability to pay its obligations and pay dividends to shareholders.
As a bank holding company, the Company is a separate legal entity from Lakeland and its subsidiaries, and we do not have significant operations of our own. We currently depend on Lakeland’s cash and liquidity to pay our operating expenses and dividends to shareholders. The availability of dividends from Lakeland is limited by various statutes and regulations. The inability of the Company to receive dividends from Lakeland could adversely affect our financial condition, results of operations, cash flows and prospects and the Company’s ability to pay dividends.
In addition, as described under “Business-Supervision and Regulation-Capital Requirements,” beginning in 2016, banks and bank holding companies are required to maintain a capital conservation buffer on top of minimum risk-weighted asset ratios. The implementation of the capital conservation buffer began on January 1, 2016 at the 0.625% level, and increases by 0.625% on each subsequent January 1 until it reaches 2.5% when fully phased in on January 1, 2019. Banking institutions which do not maintain capital in excess of the capital conservation buffer will face constraints on the payment of dividends, equity repurchases and compensation based on the amount of the shortfall. Accordingly, if the Bank fails to maintain the applicable minimum capital ratios and the capital conservation buffer, distributions to Lakeland Bancorp may be prohibited or limited.
Our allowance for loan and lease losses may not be adequate to cover actual losses.
Like all commercial banks, Lakeland maintains an allowance for loan and lease losses to provide for loan and lease defaults and non-performance. If our allowance for loan and lease losses is not adequate to cover actual loan and lease losses, we may be required to significantly increase future provisions for loan and lease losses, which could materially and adversely affect our operating results. Our allowance for loan and lease losses is determined by analyzing historical loan and lease losses, current trends in delinquencies and charge-offs, plans for problem loan and lease resolution, the opinions of our regulators, changes in the size and composition of the loan and lease portfolio and industry information. We also consider the possible effects of economic events,
-16-
Table of Contents
which are difficult to predict. The amount of future losses is affected by changes in economic, operating and other conditions, including changes in interest rates, many of which are beyond our control. These losses may exceed our current estimates. Federal regulatory agencies, as an integral part of their examination process, review our loans and the allowance for loan and lease losses. While we believe that our allowance for loan and lease losses in relation to our current loan portfolio is adequate to cover current losses, we cannot assure you that we will not need to increase our allowance for loan and lease losses or that the regulators will not require us to increase this allowance. Future increases in our allowance for loan and lease losses could materially and adversely affect our earnings and profitability.
The concentration of our commercial real estate loan portfolio may subject us to increased regulatory analysis.
The FDIC, the Federal Reserve and the OCC have promulgated joint guidance on sound risk management practices for financial institutions with concentrations in commercial real estate (CRE) lending. The 2006 interagency guidance did not establish specific CRE lending limits or caps; rather, the guidance set forth supervisory criteria to serve as levels of bank CRE concentration above which certain financial institutions may be identified for further supervisory analysis. According to the guidelines, institutions could be subject to further analysis if (i) their loans for construction, land, and land development (CLD) represent 100% or more of the institution’s total risk-based capital, or (ii) their total non-owner-occupied CRE loans (including CLD loans), as defined, represent 300% or more of the institution’s total risk-based capital, and further, that the institution’s non-owner-occupied CRE loan portfolio has increased by 50% or more during the previous 36 months.
The Bank’s total reported CLD loans represented 40% of total risk-based capital at December 31, 2016. The Bank’s total reported CRE loans to total capital was 372% at December 31, 2016 while the Bank’s CRE portfolio has increased by 74% over the preceding 36 months.
The Bank’s CRE portfolio is segmented and spread among various property types including retail, office, multi-family, mixed use, small business administration (“SBA”), industrial, hospitality, healthcare, special use and residential and commercial construction. Management regularly reviews and evaluates its CRE portfolio, including concentrations within the various property types based on current market conditions and risk appetite as well as by utilizing stress testing on material exposures and believes its underwriting practices are sound.
There is no assurance that in the future we will not continue to exceed the levels set forth in the guidelines.
Our mortgage banking operations expose us to risks that are different than the risks associated with our retail banking operations.
The Bank’s mortgage banking operations expose us to risks that are different than our retail banking operations. Our mortgage banking operations are dependent upon the level of demand for residential mortgages. During higher and rising interest rate environments, the level of refinancing activity tends to decline, which can lead to reduced volumes of business and lower revenues that may not exceed our fixed costs to run the business. In addition, mortgages sold to third-party investors are typically subject to certain repurchase provisions related to borrower refinancing, defaults, fraud or other reasons stipulated in the applicable third-party investor agreements. If the fair value of a loan when repurchased is less than the fair value when sold, a bank may be required to charge such shortfall to earnings.
In addition, the “ability to repay” and “Qualified Mortgage” rules promulgated as required by the Dodd-Frank Act, may expose the Company to greater losses, reduced volume and litigation related expenses and delays in taking title to collateral real estate, if these loans do not perform and borrowers challenge whether the rules were satisfied when originating the loans.
-17-
Table of Contents
We are subject to various lending and other economic risks that could adversely affect our results of operations and financial condition.
Economic, political and market conditions, trends in industry and finance, legislative and regulatory changes, changes in governmental monetary and fiscal policies and inflation affect our business. These factors are beyond our control. A deterioration in economic conditions, particularly in New Jersey, could have the following consequences, any of which could materially adversely affect our business:
| • | loan and lease delinquencies may increase; |
| • | problem assets and foreclosures may increase; |
| • | demand for our products and services may decrease; and |
| • | collateral for loans made by us may decline in value, in turn reducing the borrowing ability of our customers. |
Deterioration in the real estate market, particularly in New Jersey, could adversely affect our business. A decline in real estate values in New Jersey would reduce our ability to recover on defaulted loans by selling the underlying real estate, which would increase the possibility that we may suffer losses on defaulted loans.
We may suffer losses in our loan portfolio despite our underwriting practices.
We seek to mitigate the risks inherent in our loan portfolio by adhering to specific underwriting practices. Although we believe that our underwriting criteria are appropriate for the various kinds of loans that we make, we may incur losses on loans that meet our underwriting criteria, and these losses may exceed the amounts set aside as reserves in our allowance for loan and lease losses.
We face intense competition from other financial services and financial services technology companies, and competitive pressures could adversely affect our business or financial performance.
The Company faces intense competition in all of its markets and geographic regions. The Company expects competitive pressures to intensify in the future, especially in light of legislative and regulatory initiatives arising out of the recent global economic crisis, technological innovations that alter the barriers to entry, current economic and market conditions, and government monetary and fiscal policies. Competition with financial services technology companies, or technology companies partnering with financial services companies, may be particularly intense, due to, among other things, differing regulatory environments. Competitive pressures may drive the Company to take actions that the Company might otherwise eschew, such as lowering the interest rates or fees on loans or raising the interest rates on deposits in order to keep or attract high-quality customers. These pressures also may accelerate actions that the Company might otherwise elect to defer, such as substantial investments in technology or infrastructure. Whatever the reason, actions that the Company takes in response to competition may adversely affect its results of operations and financial condition. These consequences could be exacerbated if the Company is not successful in introducing new products and other services, achieving market acceptance of its products and other services, developing and maintaining a strong customer base, or prudently managing expenses.
The inability to attract and retain key personnel could adversely affect our Company’s business.
The success of the Company depends partially on the ability to attract and retain a high level of experienced personnel. The inability to attract and retain key employees, as well as find suitable replacements, if necessary, could adversely affect the Company’s customer relationships and internal operations.
The inability to stay current with technological change could adversely affect our business model.
Financial institutions continually are required to maintain and upgrade technology in order to provide the most current products and services to their customers, as well as create operational efficiencies. This technology
-18-
Table of Contents
requires personnel resources, as well as significant costs to implement. Failure to successfully implement technological change could adversely affect the Company’s business, results of operations and financial condition.
The occurrence of any failure, breach, or interruption in service involving our systems or those of our service providers could damage our reputation, cause losses, increase our expenses, and result in a loss of customers, an increase in regulatory scrutiny, or expose us to civil litigation and possibly financial liability, any of which could adversely impact our financial condition, results of operations and the market price of our stock.
Communications and information systems are essential to the conduct of our business, as we use such systems to manage our customer relationships, our general ledger, our deposits and our loans. Our operations rely on the secure processing, storage and transmission of confidential and other information in our computer systems and networks. Although we take protective measures and endeavor to modify them as circumstances warrant, the security of our computer systems, software and networks may be vulnerable to breaches, unauthorized access, misuse, computer viruses or other malicious code and cyber attacks that could have a security impact. In addition, breaches of security may occur through intentional or unintentional acts by those having authorized or unauthorized access to our confidential or other information or the confidential or other information of our customers, clients or counterparties. If one or more of such events were to occur, the confidential and other information processed and stored in, and transmitted through, our computer systems and networks could potentially be jeopardized, or could otherwise cause interruptions or malfunctions in our operations or the operations of our customers, clients or counterparties. This could cause us significant reputational damage or result in our experiencing significant losses.
Furthermore, we may be required to expend significant additional resources to modify our protective measures or to investigate and remediate vulnerabilities or other exposures arising from operational and security risks. We also may be subject to litigation and financial losses that are either not insured against or not fully covered through any insurance we maintain. In addition, we routinely transmit and receive personal, confidential and proprietary information by e-mail and other electronic means. We have discussed and worked with our customers, clients and counterparties to develop secure transmission capabilities, but we do not have, and may be unable to put in place, secure capabilities with all of these constituents, and we may not be able to ensure that these third parties have appropriate controls in place to protect the confidentiality of such information.
While we have established policies and procedures to prevent or limit the impact of systems failures and interruptions, there can be no assurance that such events will not occur or that they will be adequately addressed if they do. In addition, we outsource certain aspects of our data processing to certain third-party providers. If our third-party providers encounter difficulties, or if we have difficulty in communication with them, our ability to adequately process and account for customer transactions could be affected, and our business operations could be adversely impacted. Threats to information security also exist in the processing of customer information through various other vendors and their personnel.
If we do not successfully integrate any banks that we may acquire in the future, the combined company may be adversely affected.
If we make acquisitions in the future, we will need to integrate the acquired entities into our existing business and systems. We may experience difficulties in accomplishing this integration or in effectively managing the combined company after any future acquisition. Any actual cost savings or revenue enhancements that we may anticipate from a future acquisition will depend on future expense levels and operating results, the timing of certain events and general industry, regulatory and business conditions. Many of these events will be beyond our control, and we cannot assure you that if we make any acquisitions in the future, we will be successful in integrating those businesses into our own.
-19-
Table of Contents
ITEM 1B - Unresolved Staff Comments.
Not Applicable.
At December 31, 2016, Lakeland Bank conducted business through 52 branch offices located in Bergen, Essex, Morris, Ocean, Passaic, Somerset, Sussex and Union counties in New Jersey. Lakeland Bank also operates six New Jersey regional commercial lending centers in Bernardsville, Jackson, Montville, Newton, Teaneck and Waldwick; and two commercial loan production offices serving Middlesex and Monmouth counties in New Jersey and the Hudson Valley region of New York. The Company’s principal office is located at 250 Oak Ridge Road, Oak Ridge, New Jersey 07438.
The aggregate net book value of premises and equipment was $52.2 million at December 31, 2016. As of December 31, 2016, 31 of the Company’s facilities were owned and 33 were leased for various terms.
There are no pending legal proceedings involving the Company or Lakeland other than those arising in the normal course of business. Management does not anticipate that the potential liability, if any, arising out of such legal proceedings will have a material effect on the financial condition or results of operations of the Company and Lakeland on a consolidated basis.
ITEM 3A - Executive Officers of the Registrant.
The following table sets forth the name and age of each current executive officer of the Company. Each officer is appointed by the Company’s Board of Directors. Unless otherwise indicated, the persons named below have held the position indicated for more than the past five years.
| Name and Age |
Officer of the Company Since |
Position with the Company, its Subsidiary Banks, and Business Experience | ||
| Thomas J. Shara Age 59 |
2008 |
President and CEO, Lakeland Bancorp, Inc. and Lakeland Bank (April 2, 2008 – Present); President and Chief Credit Officer (May 2007 - April 1, 2008) and Executive Vice President and Senior Commercial Banking Officer (February 2006 - May 2007), TD Banknorth, N.A.’s Mid-Atlantic Division. | ||
| Joseph F. Hurley Age 66 |
1999 | Executive Vice President and Chief Financial Officer of the Company (November 1999 – Present). | ||
| Robert A. Vandenbergh Age 65 |
1999 | Regional President – Lakeland Bank (May 31, 2013 – Present) and Senior Executive Vice President of the Company (October 2008 – Present); Chief Operating Officer of the Company (October 2008 – December 2016); Senior Executive Vice President and Chief Operating Officer of Lakeland Bank (October 2008 – January 29, 2013); President of Lakeland Bank (January 29, 2013 – May 31, 2013); Senior Executive Vice President and Chief Lending Officer of the Company (December 2006 – October 2008). | ||
-20-
Table of Contents
| Name and Age |
Officer of the Company Since |
Position with the Company, its Subsidiary Banks, and Business Experience | ||
| Ronald E. Schwarz Age 62 |
2009 | Senior Executive Vice President and Chief Revenue Officer of the Company (January 2016 – Present) and Chief Operating Officer of the Company (January 2017 – Present); Executive Vice President and Chief Retail Officer of the Company (June 2009 – December 2015); Executive Vice President and Market Executive of Sovereign Bank (June 2006 - June 2009). | ||
| David S. Yanagisawa Age 65 |
2008 | Executive Vice President and Chief Lending Officer of the Company (November 2008 – Present); Senior Vice President, TD Banknorth, N.A. (February 2006 - November 2008). | ||
| Timothy J. Matteson, Esq. Age 47 |
2008 | Executive Vice President, General Counsel and Corporate Secretary of the Company (March 2012 – Present); Chief Administrative Officer of the Company (January 2017 – Present); Senior Vice President and General Counsel of the Company (September 2008 – March 2012); Assistant General Counsel, Israel Discount Bank (November 2007 – September 2008); Senior Attorney and Senior Vice President, TD Banknorth, N.A. (February 2006 – May 2007); General Counsel and Senior Vice President, Hudson United Bancorp and Hudson United Bank (January 2005 – February 2006). | ||
| James M. Nigro Age 49 |
March 2016 | Executive Vice President, Chief Risk Officer of the Company (March 2016 – Present); Senior Vice President, Credit Risk Manager of The Provident Bank (December 2013 – March 2016); Senior Vice-President, Commercial Lending of Lakeland Bank (May 2013 – December 2013); Executive Vice President, Chief Lending Officer of Somerset Hills Bank (July 2001 – May 2013). | ||
| Thomas Splaine Age 51 |
May 2016 | First Senior Vice President and Chief Accounting Officer of the Company and Lakeland Bank (May 31, 2016 – Present); Senior Vice President, Financial Planning and Analysis and Investor Relations of Investors Bancorp, Inc. (January 2015 – December 2015); Senior Vice President and Chief Financial Officer of Investors Bancorp, Inc. (2008 – 2015). | ||
ITEM 4 - Mine Safety Disclosures.
Not applicable.
-21-
Table of Contents
| ITEM 5 — | Market for the Registrant’s Common Equity, Related Stockholder Matters and Issuer Purchases of Equity Securities. |
Shares of the common stock of Lakeland Bancorp, Inc. have been traded under the symbol “LBAI” on the NASDAQ Global Select Market (or the NASDAQ National Market) since February 22, 2000 and in the over the counter market prior to that date. As of December 31, 2016, there were 3,144 shareholders of record of the common stock. The following table sets forth the range of the high and low daily closing prices of the common stock as provided by NASDAQ and dividends declared for the periods presented.
| High | Low | Dividends Declared |
||||||||||
| Year ended December 31, 2016 |
||||||||||||
| First Quarter |
$ | 11.62 | $ | 9.81 | $ | 0.085 | ||||||
| Second Quarter |
11.76 | 10.26 | 0.095 | |||||||||
| Third Quarter |
14.04 | 11.14 | 0.095 | |||||||||
| Fourth Quarter |
19.75 | 13.20 | 0.095 | |||||||||
| High | Low | Dividends Declared |
||||||||||
| Year ended December 31, 2015 |
||||||||||||
| First Quarter |
$ | 11.66 | $ | 10.66 | $ | 0.075 | ||||||
| Second Quarter |
12.23 | 11.25 | 0.085 | |||||||||
| Third Quarter |
12.37 | 10.53 | 0.085 | |||||||||
| Fourth Quarter |
12.25 | 10.74 | 0.085 | |||||||||
Dividends on the Company’s common stock are within the discretion of the Board of Directors of the Company and are dependent upon various factors, including the future earnings and financial condition of the Company and Lakeland and bank regulatory policies.
The Bank Holding Company Act of 1956 restricts the amount of dividends the Company can pay. Accordingly, dividends should generally only be paid out of current earnings, as defined.
The New Jersey Banking Act of 1948 restricts the amount of dividends paid on the capital stock of New Jersey chartered banks. Accordingly, no dividends shall be paid by such banks on their capital stock unless, following the payment of such dividends, the capital stock of the bank will be unimpaired and the bank will have a surplus of not less than 50% of its capital stock, or, if not, the payment of such dividend will not reduce the surplus of the bank. Under this limitation, approximately $480.9 million was available for the payment of dividends from Lakeland Bank to the Company as of December 31, 2016.
Capital guidelines and other regulatory requirements may further limit the Company’s and Lakeland’s ability to pay dividends. See “Item 1 – Business – Supervision and Regulation – Dividend Restrictions” and “–Capital Requirements.”
-22-
Table of Contents
The following chart compares the Company’s cumulative total shareholder return (on a dividend reinvested basis) over the past five years with the NASDAQ Market Index and the Peer Group Index. The Peer Group Index is the Zacks Regional Northeast Banks Index, which consists of 95 Regional Northeast Banks.
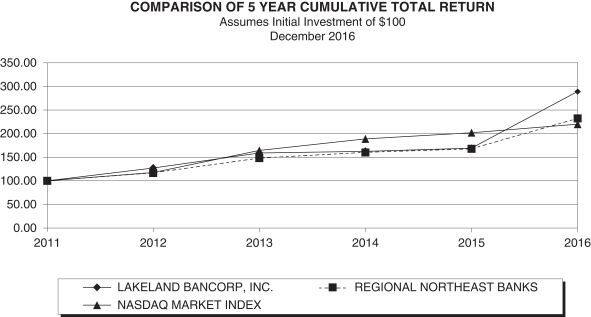
| Company/Market/Peer Group |
12/31/2011 | 12/31/2012 | 12/31/2013 | 12/31/2014 | 12/31/2015 | 12/31/2016 | ||||||||||||||||||
| Lakeland Bancorp, Inc. |
100.00 | 127.25 | 158.97 | 162.62 | 168.96 | 288.92 | ||||||||||||||||||
| NASDAQ Market Index |
100.00 | 117.45 | 164.57 | 188.84 | 201.98 | 219.89 | ||||||||||||||||||
| Regional Northeast Banks |
100.00 | 116.84 | 148.31 | 160.15 | 167.74 | 232.27 | ||||||||||||||||||
-23-
Table of Contents
Item 6 - Selected Financial Data.
SELECTED CONSOLIDATED FINANCIAL DATA
The following should be read in conjunction with Management’s Discussion and Analysis of Financial Condition and Results of Operations and the Company’s consolidated financial statements included in Items 7 and 8 of this report. The selective financial data set forth below has been derived from the Company’s audited consolidated financial statements.
| At or for the Years Ended December 31, | ||||||||||||||||||||
| 2016 | 2015 | 2014 | 2013 | 2012 | ||||||||||||||||
| (in thousands, except per share data) | ||||||||||||||||||||
| Income Statement |
||||||||||||||||||||
| Interest income |
$ | 163,296 | $ | 127,514 | $ | 122,503 | $ | 114,199 | $ | 110,959 | ||||||||||
| Interest expense |
17,647 | 10,874 | 8,937 | 9,657 | 15,446 | |||||||||||||||
|
|
|
|
|
|
|
|
|
|
|
|||||||||||
| Net interest income |
145,649 | 116,640 | 113,566 | 104,542 | 95,513 | |||||||||||||||
| Provision for loan and lease losses |
4,223 | 1,942 | 5,865 | 9,343 | 14,907 | |||||||||||||||
| Noninterest income excluding gains on investment securities and gain on debt extinguishment |
20,960 | 19,090 | 17,720 | 18,925 | 17,856 | |||||||||||||||
| Gains on sales of investment securities |
370 | 241 | 2 | 839 | 1,049 | |||||||||||||||
| Gain on early debt extinguishment |
— | 1,830 | — | 1,197 | — | |||||||||||||||
| Merger related expenses |
4,103 | 1,152 | — | 2,834 | — | |||||||||||||||
| Long-term debt prepayment fee |
— | 2,407 | — | 1,209 | 782 | |||||||||||||||
| Noninterest expenses |
95,814 | 83,652 | 79,135 | 74,698 | 66,891 | |||||||||||||||
|
|
|
|
|
|
|
|
|
|
|
|||||||||||
| Income before income taxes |
62,839 | 48,648 | 46,288 | 37,419 | 31,838 | |||||||||||||||
| Income tax provision |
21,321 | 16,167 | 15,159 | 12,450 | 10,096 | |||||||||||||||
|
|
|
|
|
|
|
|
|
|
|
|||||||||||
| Net income |
41,518 | 32,481 | 31,129 | 24,969 | 21,742 | |||||||||||||||
| Dividends on preferred stock and accretion |
— | — | — | — | 620 | |||||||||||||||
|
|
|
|
|
|
|
|
|
|
|
|||||||||||
| Net income available to common shareholders |
$ | 41,518 | $ | 32,481 | $ | 31,129 | $ | 24,969 | $ | 21,122 | ||||||||||
|
|
|
|
|
|
|
|
|
|
|
|||||||||||
| Per-Share Data (1) |
||||||||||||||||||||
| Weighted average shares outstanding: |
||||||||||||||||||||
| Basic |
42,912 | 37,844 | 37,749 | 34,742 | 29,000 | |||||||||||||||
| Diluted |
43,114 | 37,993 | 37,869 | 34,902 | 29,077 | |||||||||||||||
| Earnings per share: |
||||||||||||||||||||
| Basic |
$ | 0.96 | $ | 0.85 | $ | 0.82 | $ | 0.71 | $ | 0.72 | ||||||||||
| Diluted |
$ | 0.95 | $ | 0.85 | $ | 0.82 | $ | 0.71 | $ | 0.72 | ||||||||||
| Cash dividend per common share |
$ | 0.37 | $ | 0.33 | $ | 0.29 | $ | 0.27 | $ | 0.24 | ||||||||||
| Book value per common share |
$ | 11.65 | $ | 10.57 | $ | 10.01 | $ | 9.28 | $ | 9.00 | ||||||||||
| Tangible book value per common share (2) |
$ | 8.70 | $ | 7.62 | $ | 7.06 | $ | 6.31 | $ | 6.21 | ||||||||||
| Balance Sheet |
||||||||||||||||||||
| Investment securities available for sale and other (5) |
$ | 621,803 | $ | 456,436 | $ | 467,295 | $ | 439,044 | $ | 399,092 | ||||||||||
| Investment securities held to maturity |
147,614 | 116,740 | 107,976 | 101,744 | 96,925 | |||||||||||||||
| Loans and leases, net of deferred costs |
3,870,598 | 2,965,200 | 2,653,826 | 2,469,016 | 2,146,843 | |||||||||||||||
| Goodwill and other identifiable intangible assets |
139,091 | 111,519 | 111,934 | 112,398 | 87,111 | |||||||||||||||
| Total assets |
5,093,131 | 3,869,550 | 3,538,325 | 3,317,791 | 2,918,703 | |||||||||||||||
| Total deposits |
4,092,835 | 2,995,572 | 2,790,819 | 2,709,205 | 2,370,997 | |||||||||||||||
| Total core deposits (3) |
3,547,927 | 2,652,251 | 2,510,857 | 2,413,119 | 2,067,205 | |||||||||||||||
| Term borrowings |
365,650 | 303,143 | 243,736 | 160,238 | 136,548 | |||||||||||||||
| Total stockholders’ equity |
550,044 | 400,516 | 379,438 | 351,424 | 280,867 | |||||||||||||||
| Performance Ratios |
||||||||||||||||||||
| Return on average assets |
0.90 | % | 0.89 | % | 0.92 | % | 0.80 | % | 0.77 | % | ||||||||||
| Return on average tangible common equity (2) |
12.19 | % | 11.58 | % | 12.21 | % | 11.42 | % | 12.85 | % | ||||||||||
| Return on average equity |
8.75 | % | 8.28 | % | 8.48 | % | 7.78 | % | 8.42 | % | ||||||||||
| Efficiency ratio (2)(4) |
56.41 | % | 60.18 | % | 59.35 | % | 59.74 | % | 58.33 | % | ||||||||||
| Net interest margin (tax equivalent basis) |
3.41 | % | 3.47 | % | 3.64 | % | 3.69 | % | 3.70 | % | ||||||||||
| Loans to deposits |
94.57 | % | 98.99 | % | 95.09 | % | 91.13 | % | 90.55 | % | ||||||||||
| Capital Ratios |
||||||||||||||||||||
| Common equity to asset ratio |
10.80 | % | 10.35 | % | 10.72 | % | 10.59 | % | 9.62 | % | ||||||||||
| Tangible common equity to tangible assets (2) |
8.30 | % | 7.69 | % | 7.81 | % | 7.46 | % | 6.84 | % | ||||||||||
| Tier 1 leverage ratio (6) |
9.07 | % | 8.70 | % | 9.08 | % | 8.90 | % | 8.62 | % | ||||||||||
| Tier 1 risk-based capital ratio (6) |
10.85 | % | 10.53 | % | 11.76 | % | 11.73 | % | 11.52 | % | ||||||||||
| Total risk-based capital ratio (6) |
13.48 | % | 11.61 | % | 12.98 | % | 12.98 | % | 12.77 | % | ||||||||||
| CET1 ratio (6) |
10.11 | % | 9.54 | % | NA | NA | NA | |||||||||||||
| (1) | Restated for 5% stock dividends in 2014 and 2012. |
| (2) | A non-GAAP financial measure. See “Non-GAAP Financial Measures” for a reconciliation of such measures to data calculated in accordance with generally accepted accounting principles. |
-24-
Table of Contents
| (3) | Core deposits represent all deposits with the exception of time deposits. |
| (4) | Ratio represents noninterest expense, excluding other real estate expense, other repossessed asset expense, long-term debt prepayment fee, merger related expenses, provision for unfunded lending commitments and core deposit amortization, as a percentage of total revenue (calculated on a tax equivalent basis), excluding gains (losses) on securities and gain on debt extinguishment. Total revenue represents net interest income (calculated on a tax equivalent basis) plus noninterest income. |
| (5) | Includes investment in Federal Home Loan Bank and other membership stock, at cost. |
| (6) | Beginning March 31, 2015, these ratios were calculated according to the Basel III capital rules that took effect on January 1, 2015. |
-25-
Table of Contents
ITEM 7 – Management’s Discussion and Analysis of Financial Condition and Results of Operations.
This section presents a review of Lakeland Bancorp, Inc.’s consolidated results of operations and financial condition. You should read this section in conjunction with the selected consolidated financial data that is presented on the preceding page as well as the accompanying consolidated financial statements and notes to financial statements. As used in the following discussion, the term “Company” refers to Lakeland Bancorp, Inc. and “Lakeland” refers to the Company’s wholly owned banking subsidiary—Lakeland Bank.
Statements Regarding Forward-Looking Information
The information disclosed in this document includes various forward-looking statements that are made in reliance upon the safe harbor provisions of the Private Securities Litigation Reform Act of 1995 with respect to credit quality (including delinquency trends and the allowance for loan and lease losses), corporate objectives, and other financial and business matters. The words “anticipates,” “projects,” “intends,” “estimates,” “expects,” “believes,” “plans,” “may,” “will,” “should,” “could,” and other similar expressions are intended to identify such forward-looking statements. The Company cautions that these forward-looking statements are necessarily speculative and speak only as of the date made, and are subject to numerous assumptions, risks and uncertainties, all of which may change over time. Actual results could differ materially from such forward-looking statements.
In addition to the risk factors disclosed in Item 1A in this Annual Report on Form 10-K, the following factors, among others, could cause the Company’s actual results to differ materially and adversely from such forward-looking statements: changes in the financial services industry and the U.S. and global capital markets, changes in economic conditions nationally, regionally and in the Company’s markets, the nature and timing of actions of the Federal Reserve Board and other regulators, the nature and timing of legislation affecting the financial services industry, government intervention in the U.S. financial system, changes in levels of market interest rates, pricing pressures on loan and deposit products, credit risks of Lakeland’s lending and leasing activities, customers’ acceptance of Lakeland’s products and services, competition, and the failure to realize anticipated efficiencies and synergies following the Pascack and Harmony acquisitions.
The above-listed risk factors are not necessarily exhaustive, particularly as to possible future events, and new risk factors may emerge from time to time. Certain events may occur that could cause the Company’s actual results to be materially different than those described in the Company’s periodic filings with the Securities and Exchange Commission. Any statements made by the Company that are not historical facts should be considered to be forward-looking statements. The Company is not obligated to update and does not undertake to update any of its forward-looking statements made herein.
Strategy
The Company, through its wholly owned subsidiary, Lakeland Bank, currently operates 52 banking offices located in Northern and Central New Jersey. Lakeland offers a broad range of lending, depository, and related financial services to individuals and small to medium sized businesses located in its market areas. Lakeland also offers a broad range of consumer banking services, including lending, depository, safe deposit services and other non-traditional banking services.
Lakeland’s growth has come from a combination of organic growth and acquisitions. In addition to organic growth, through December 31, 2016, the Company has acquired seven community banks with an aggregate asset total of approximately $1.8 billion at the date of acquisition, including the acquisition of Somerset Hills Bancorp, Pascack Bancorp, Inc. and Harmony Bank. On January 7, 2016, the Company completed its acquisition of Pascack, with eight branches and an asset total of approximately $405.3 million. Three of the eight Pascack branches have been merged with Lakeland branches. On July 1, 2016, the Company completed its acquisition of Harmony, with three branches and an asset total of approximately $326.4 million. All acquired banks have been merged into Lakeland and their holding companies, if applicable, have been merged into the Company. In 2015,
-26-
Table of Contents
the Company opened two new Loan Production Offices (“LPOs”) that allowed Lakeland to expand geographically in New Jersey and to enter New York state for the first time. In March 2017, the company intends to open its first full service branch in New York state. The Company’s strategy is to continue growth both organically and through acquisition should opportunities allow. The Company continues to evaluate opportunities to increase market share by expanding within existing and contiguous markets.
The Company’s strategic aim is to provide an adequate return to its shareholders by focusing on profitable growth through services that meet the needs of its customers in its market areas. This will be accomplished by continuing to offer commercial and consumer loan, deposit and other financial product services in a changing economic and technological environment. The Company recognizes that there are more service delivery channels than the traditional branch office and has offered internet banking, mobile banking and cash management services to meet the needs of its business and consumer customers.
The Company’s results of operations are primarily dependent upon net interest income, the difference between interest earned on interest-earning assets and the interest paid on interest-bearing liabilities. For information on how interest rate change can influence the Company’s net interest income and how the Company manages its net interest income, see “Interest Rate Risk” below.
The Company generates noninterest income such as income from retail and business account fees, loan servicing fees, loan origination fees, appreciation in the cash surrender value of bank owned life insurance, income from loan or securities sales, fees from wealth management services and investment product sales, income from the origination and sale of residential mortgages and other fees. The Company’s operating expenses consist primarily of compensation and benefits expense, occupancy and equipment expense, data processing expense, the amortization of intangible assets, marketing and advertising expense and other general and administrative expenses. The Company’s results of operations are also affected by general economic conditions, changes in market interest rates, changes in asset quality, changes in asset values, actions of regulatory agencies and government policies.
The Company continues to control its expenses by continually reviewing its ongoing noninterest expense, including evaluating its salary expense, its ongoing service contract expense, marketing expenses and other expenses. The Company also controls its expenses by evaluating its infrastructure, which includes the consolidating and closing of branches in markets where it may have more branches than necessary. The Company closed one branch in 2014, three branches in 2015 and seven branches in 2016, including three of the eight acquired Pascack branches.
Critical Accounting Policies, Judgments and Estimates
The accounting and reporting policies of the Company and Lakeland conform with accounting principles generally accepted in the United States of America (“U.S. GAAP”) and predominant practices within the banking industry. The preparation of financial statements requires management to make estimates and assumptions that affect the reported amounts of assets and liabilities and disclosure of contingent assets and liabilities at the date of the financial statements. These estimates and assumptions also affect reported amounts of revenues and expenses during the reporting period. Actual results could differ from these estimates. Significant estimates implicit in these financial statements are as follows. For additional accounting policies and detail, refer to Note 1 to the consolidated financial statements included in item 8 of this report.
Allowance for loan and lease losses. The allowance for loan and lease losses is established through a provision for loan and lease losses charged to expense. Loan principal considered to be uncollectible by management is charged against the allowance for loan and lease losses. The allowance is an amount that management believes will be adequate to absorb losses on existing loans and leases that may become uncollectible based upon an evaluation of known and inherent risks in the loan and lease portfolio. The evaluation takes into consideration such factors as changes in the nature and size of the loan and lease portfolio,
-27-
Table of Contents
overall portfolio quality, specific problem loans and leases, and current economic conditions which may affect the borrowers’ ability to pay. The evaluation also analyzes historical losses by loan and lease category, and considers the resulting loss rates when determining the reserves on current loan and lease amounts. Additionally, management assesses the loss emergence period for each loan segment and adjusts each historical loss factor accordingly. The loss emergence period is the estimated time from the date of a loss event (such as a personal bankruptcy) to the actual recognition of the loss (typically via the first full or partial loan charge-off), and is determined based upon a study of our past loss experience by loan segment. Loss estimates for specified problem loans and leases are also detailed. All of the factors considered in the analysis of the adequacy of the allowance for loan and lease losses may be subject to change. To the extent actual outcomes differ from management estimates, additional provisions for loan and lease losses may be required that would adversely impact earnings in future periods.
The determination of the adequacy of the allowance for loan and lease losses and the periodic provisioning for estimated losses included in the consolidated financial statements is the responsibility of management and the Board of Directors. The evaluation process is undertaken on a quarterly basis.
Methodology employed for assessing the adequacy of the allowance consists of the following criteria:
| • | The establishment of specific reserve amounts for impaired loans and leases that have been designated as requiring attention by Lakeland. |
| • | The establishment of reserves for pools of homogeneous types of loans and leases not subject to specific review, including impaired loans under $500,000, leases, 1 – 4 family residential mortgages, and consumer loans. |
| • | The establishment of reserve amounts for the unimpaired loans and leases in each portfolio based upon the historical average loss experience as modified by management’s assessment of the loss emergence period for these portfolios and management’s evaluation of key environmental factors. |
Consideration is given to the results of ongoing credit quality monitoring processes, the adequacy and expertise of Lakeland’s lending staff, underwriting policies, loss histories, delinquency trends, and the cyclical nature of economic and business conditions. Since many of Lakeland’s loans depend on the sufficiency of collateral as a secondary source of repayment, any adverse trend in the real estate markets could affect underlying values available to protect Lakeland from loss.
A loan that management designates as impaired is reviewed for charge-off when it is placed on non-accrual status with a resulting charge-off if the loan is not secured by collateral having sufficient liquidation value to repay the loan. Charge-offs are recommended by the Chief Credit Officer and approved by the Board.
Loans and leases are considered impaired when, based on current information and events, it is probable that Lakeland will be unable to collect all amounts due in accordance with the original contractual terms of the loan agreement, including scheduled principal and interest payments. Impairment is measured based on the present value of expected cash flows discounted at the loan’s effective interest rate, or as a practical expedient, Lakeland may measure impairment based on a loan’s observable market price, or the fair value of the collateral, less estimated costs to sell, if the loan is collateral-dependent. Regardless of the measurement method, Lakeland measures impairment based on the fair value of the collateral when it is determined that foreclosure is probable. Most of Lakeland’s impaired loans are collateral-dependent. Lakeland groups impaired commercial loans under $500,000 into a homogeneous pool and collectively evaluates them. Interest received on impaired loans and leases may be recorded as interest income. However, if management is not reasonably certain that an impaired loan and lease will be repaid in full, or if a specific time frame to resolve full collection cannot yet be reasonably determined, all payments received are recorded as reductions of principal.
Fair value measurements and fair value of financial instruments. Fair values of financial instruments are volatile and may be influenced by a number of factors, including market interest rates, prepayment speeds,
-28-
Table of Contents
discount rates, credit ratings and yield curves. Fair values for investment securities are based on quoted market prices, where available. If quoted market prices are not available, fair values are based on the quoted prices of similar instruments or an estimate of fair value by using a range of fair value estimates in the market place as a result of the illiquid market specific to the type of security.
When the fair value of a security is below its amortized cost, and depending on the length of time the condition exists and the extent the fair value is below amortized cost, additional analysis is performed to determine whether an other-than-temporary impairment condition exists. Available for sale and held to maturity securities are analyzed quarterly for possible other-than-temporary impairment. The analysis considers (i) the length of time and the extent to which the fair value has been less than cost, (ii) the financial condition and near-term prospects of the issuer which may include projections of cash flows, and (iii) the intent and ability of the Company to retain its investment in the issuer for a period of time sufficient to allow for any anticipated recovery in fair value. Often, the information available to conduct these assessments is limited and rapidly changing, making estimates of fair value subject to judgment. If actual information or conditions are different than estimated, the extent of the impairment of the security may be different than previously estimated, which could have a material effect on the Company’s results of operations and financial condition.
Deferred income taxes. The Company accounts for income taxes under the asset and liability method of accounting for income taxes. Deferred tax assets and liabilities are determined based on the difference between the financial statement and tax bases of assets and liabilities as measured by the enacted tax rates that will be in effect when these differences reverse. Deferred tax expense is the result of changes in deferred tax assets and liabilities. The principal types of differences between assets and liabilities for financial statement and tax return purposes are allowance for loan and lease losses, core deposit intangible, deferred loan costs and deferred compensation.
The Company evaluates the realizability of its deferred tax assets by examining its earnings history and projected future earnings and by assessing whether it is more likely than not that carryforwards would not be realized. Based upon the majority of the Company’s deferred tax assets having no expiration date, the Company’s earnings history, and the projections of future earnings, the Company’s management believes that it is more likely than not that all of the Company’s deferred tax assets as of December 31, 2016 will be realized.
The Company evaluates tax positions that may be uncertain using a recognition threshold of more likely than not, and a measurement attribute for all tax positions taken or expected to be taken on a tax return, in order for those tax positions to be recognized in the financial statements. Additional information regarding the Company’s uncertain tax positions is set forth in Note 10 to the Notes to the audited Consolidated Financial Statements contained herein.
Goodwill and other identifiable intangible assets. Goodwill is presumed to have an indefinite useful life and is tested, at least annually, for impairment at the reporting unit level. Impairment exists when the carrying amount of goodwill exceeds its implied fair value. For purposes of our goodwill impairment testing, we have identified a single reporting unit, community banking.
U.S. GAAP permits an entity to make a qualitative assessment of whether it is more likely than not that a reporting unit’s fair value is less than its carrying amount before applying the two-step goodwill impairment test. The Company completed its annual qualitative assessment as of November 30, 2016 and concluded that there was less than a 50% probability that the fair value of the reporting unit is less than its carrying amount and, therefore, the two-step goodwill impairment test was not required.
Use of Non-GAAP Disclosures
Reported amounts are presented in accordance with U.S. GAAP. The Company’s management believes that the supplemental non-GAAP information, which consists of measurements and ratios based on tangible equity,
-29-
Table of Contents
tangible assets and the efficiency ratio, which excludes certain items considered to be non-recurring from earnings, is utilized by regulators and market analysts to evaluate a company’s financial condition and therefore, such information is useful to investors. These disclosures should not be viewed as a substitute for financial results determined in accordance with U.S. GAAP, nor are they necessarily comparable to non-GAAP performance measures which may be presented by other companies.
Financial Overview
The year ended December 31, 2016 represented a year of continued growth for the Company. As discussed in this management’s discussion and analysis:
| • | Net income was $41.5 million, or $0.95 per diluted share, for the year ended December 31, 2016 compared to net income of $32.5 million, or $0.85 per diluted share, for the same period in 2015, a 28% and 12% increase, respectively. Excluding merger related expenses and other items, net income for 2016 was $44.3 million, or $1.02 per diluted share, compared to $33.8 million, or $0.88 per diluted share, for 2015, a 31% and 16% increase, respectively. |
| • | Total loans and leases increased by $905.9 million, or 31%, in 2016 with organic growth of $325.6 million, or 11%. |
| • | Total deposits increased $1.10 billion, or 37%, in 2016 with organic growth of $514.7 million, or 17%, which included $125.4 million in noninterest-bearing deposits. |
| • | The Company’s net interest margin at 3.41% for 2016 was 6 basis points lower than 2015. |
| • | The efficiency ratio was 56.41% for 2016, as compared to 60.18% for 2015. The improvement in this ratio, in part, reflects the realization of cost savings from our acquisitions and the closure of seven branches in 2016. |
| • | On December 14, 2016, the Company announced that it had successfully completed an at-the-market common stock issuance. A total of 2,739,650 shares of the Company’s common stock were sold at a weighted average price of $18.25, representing gross proceeds to the Company of approximately $50.0 million. |
| • | On September 30, 2016, the Company closed the offering of $75.0 million of its Fixed-to-Floating Rate Subordinated Notes due September 30, 2026 (the “Notes”). The Notes bear interest at a rate of 5.125% per annum until September 2021 and the interest rate will then reset quarterly to the then current three-month LIBOR plus 397 basis points. |
| • | On July 1, 2016, the Company completed its acquisition of Harmony, which operated three branches in Ocean County, New Jersey, and had $326.4 million in total assets, $260.8 million in total loans and $278.1 million in total deposits. |
| • | On January 7, 2016, the Company completed its acquisition of Pascack. This acquisition added $405.3 million in total assets, $319.6 million in total loans and $304.5 million in total deposits. |
Net Income
Net income for 2016 was $41.5 million, or $0.95 per diluted share, compared to net income of $32.5 million, or $0.85 per diluted share, in 2015. Excluding merger related expenses and other items, net income for 2016 was $44.3 million, or $1.02 per diluted share, compared to $33.8 million, or $0.88 per diluted share, for 2015, a 31% and 16% increase, respectively. Net interest income at $145.6 million for 2016 increased $29.0 million compared to 2015 due to a $35.8 million increase in interest income partially offset by a $6.8 million increase in interest expense. The increase in net interest income reflects an increase in interest-earning assets resulting primarily from the Pascack and Harmony acquisitions as well as organic growth.
-30-
Table of Contents
Net Interest Income
Net interest income is the difference between interest income on earning assets and the cost of funds supporting those assets. The Company’s net interest income is determined by: (i) the volume of interest-earning assets that it holds and the yields that it earns on those assets, and (ii) the volume of interest-bearing liabilities that it has assumed and the rates that it pays on those liabilities.
Net interest income on a tax equivalent basis for 2016 was $146.6 million, compared to $117.5 million in 2015, resulting primarily from growth in average earning assets of $905.3 million. The net interest margin decreased from 3.47% in 2015 to 3.41% in 2016 primarily as a result of an 11 basis point increase in the cost of interest-bearing liabilities. The increase in the cost of interest-bearing deposits is primarily attributable to an increasingly competitive market for deposits as well as higher costing core deposits acquired in the Pascack and Harmony acquisitions. The increase in the cost of funds was partially mitigated by an increase in the yield on interest-earning assets of 3 basis points and an increase in interest income earned on free funds (interest-earning assets funded by noninterest-bearing liabilities) resulting from an increase in average noninterest-bearing deposits of $157.0 million. The components of net interest income will be discussed in greater detail below.
Interest income and expense volume/rate analysis. The following table shows the impact that changes in average balances of the Company’s assets and liabilities and changes in average interest rates have had on the Company’s net interest income over the past three years. This information is presented on a tax equivalent basis assuming a 35% tax rate. If a change in interest income or expense is attributable to a change in volume and a change in rate, the amount of the change is allocated proportionately.
| 2016 vs. 2015 | 2015 vs. 2014 | |||||||||||||||||||||||
| Increase (Decrease) Due to Change in: |
Total Change |
Increase (Decrease) Due to Change in: |
Total Change |
|||||||||||||||||||||
| Volume | Rate | Volume | Rate | |||||||||||||||||||||
| (in thousands) |
||||||||||||||||||||||||
| INTEREST INCOME |
||||||||||||||||||||||||
| Loans and leases |
$ | 33,166 | $ | 1,316 | $ | 34,482 | $ | 8,309 | $ | (3,601 | ) | $ | 4,708 | |||||||||||
| Taxable investment securities and other |
141 | 459 | 600 | 847 | (324 | ) | 523 | |||||||||||||||||
| Tax-exempt investment securities |
554 | (256 | ) | 298 | (159 | ) | (167 | ) | (326 | ) | ||||||||||||||
| Federal funds sold |
309 | 198 | 507 | (1 | ) | (8 | ) | (9 | ) | |||||||||||||||
|
|
|
|
|
|
|
|
|
|
|
|
|
|||||||||||||
| Total interest income |
34,170 | 1,717 | 35,887 | 8,996 | (4,100 | ) | 4,896 | |||||||||||||||||
|
|
|
|
|
|
|
|
|
|
|
|
|
|||||||||||||
| INTEREST EXPENSE |
||||||||||||||||||||||||
| Savings deposits |
50 | 51 | 101 | 8 | 2 | 10 | ||||||||||||||||||
| Interest-bearing transaction accounts |
1,019 | 1,487 | 2,506 | 135 | 151 | 286 | ||||||||||||||||||
| Time deposits |
1,513 | 637 | 2,150 | 109 | 286 | 395 | ||||||||||||||||||
| Borrowings |
1,089 | 927 | 2,016 | 1,352 | (106 | ) | 1,246 | |||||||||||||||||
|
|
|
|
|
|
|
|
|
|
|
|
|
|||||||||||||
| Total interest expense |
3,671 | 3,102 | 6,773 | 1,604 | 333 | 1,937 | ||||||||||||||||||
|
|
|
|
|
|
|
|
|
|
|
|
|
|||||||||||||
| NET INTEREST INCOME |
$ | 30,499 | $ | (1,385 | ) | $ | 29,114 | $ | 7,392 | $ | (4,433 | ) | $ | 2,959 | ||||||||||
|
|
|
|
|
|
|
|
|
|
|
|
|
|||||||||||||
-31-
Table of Contents
The following table reflects the components of the Company’s net interest income, setting forth for the years presented, (1) average assets, liabilities and stockholders’ equity, (2) interest income earned on interest-earning assets and interest expense paid on interest-bearing liabilities, (3) average yields earned on interest-earning assets and average rates paid on interest-bearing liabilities, (4) the Company’s net interest spread (i.e., the average yield on interest-earning assets less the average cost of interest-bearing liabilities) and (5) the Company’s net interest margin. Rates are computed on a tax equivalent basis assuming a 35% tax rate.
| 2016 | 2015 | 2014 | ||||||||||||||||||||||||||||||||||
| Average | Average | Average | ||||||||||||||||||||||||||||||||||
| Interest | Rates | Interest | Rates | Interest | Rates | |||||||||||||||||||||||||||||||
| Average | Income/ | Earned/ | Average | Income/ | Earned/ | Average | Income/ | Earned/ | ||||||||||||||||||||||||||||
| Balance | Expense | Paid | Balance | Expense | Paid | Balance | Expense | Paid | ||||||||||||||||||||||||||||
| (dollars in thousands) | ||||||||||||||||||||||||||||||||||||
| ASSETS |
||||||||||||||||||||||||||||||||||||
| Interest-earning assets: |
||||||||||||||||||||||||||||||||||||
| Loans and leases (1) |
$ | 3,562,882 | $ | 149,777 | 4.20 | % | $ | 2,773,601 | $ | 115,295 | 4.16 | % | $ | 2,568,056 | $ | 110,587 | 4.31 | % | ||||||||||||||||||
| Taxable investment securities and other |
518,905 | 11,163 | 2.15 | % | 512,145 | 10,563 | 2.06 | % | 470,144 | 10,040 | 2.14 | % | ||||||||||||||||||||||||
| Tax-exempt securities |
90,431 | 2,749 | 3.04 | % | 69,307 | 2,451 | 3.54 | % | 73,662 | 2,777 | 3.77 | % | ||||||||||||||||||||||||
| Federal funds sold (2) |
123,166 | 569 | 0.46 | % | 35,059 | 62 | 0.18 | % | 35,404 | 71 | 0.20 | % | ||||||||||||||||||||||||
|
|
|
|
|
|
|
|
|
|
|
|
|
|
|
|
|
|
|
|||||||||||||||||||
| Total interest-earning assets |
4,295,384 | 164,258 | 3.82 | % | 3,390,112 | 128,371 | 3.79 | % | 3,147,266 | 123,475 | 3.92 | % | ||||||||||||||||||||||||
| Noninterest-earning assets: |
||||||||||||||||||||||||||||||||||||
| Allowance for loan and lease losses |
(31,190 | ) | (31,062 | ) | (30,146 | ) | ||||||||||||||||||||||||||||||
| Other assets |
355,622 | 289,786 | 283,341 | |||||||||||||||||||||||||||||||||
|
|
|
|
|
|
|
|||||||||||||||||||||||||||||||
| TOTAL ASSETS |
$ | 4,619,816 | $ | 3,648,836 | $ | 3,400,461 | ||||||||||||||||||||||||||||||
|
|
|
|
|
|
|
|||||||||||||||||||||||||||||||
| LIABILITIES AND STOCKHOLDERS EQUITY |
||||||||||||||||||||||||||||||||||||
| Interest-bearing liabilities: |
||||||||||||||||||||||||||||||||||||
| Savings accounts |
$ | 485,004 | $ | 313 | 0.06 | % | $ | 399,431 | $ | 212 | 0.05 | % | $ | 384,715 | $ | 202 | 0.05 | % | ||||||||||||||||||
| Interest-bearing transaction accounts |
1,880,391 | 6,158 | 0.33 | % | 1,511,954 | 3,652 | 0.24 | % | 1,454,967 | 3,366 | 0.23 | % | ||||||||||||||||||||||||
| Time deposits |
506,487 | 4,041 | 0.80 | % | 303,682 | 1,891 | 0.62 | % | 283,905 | 1,496 | 0.53 | % | ||||||||||||||||||||||||
| Borrowings |
393,149 | 7,135 | 1.81 | % | 328,936 | 5,119 | 1.56 | % | 241,820 | 3,873 | 1.60 | % | ||||||||||||||||||||||||
|
|
|
|
|
|
|
|
|
|
|
|
|
|
|
|
|
|
|
|||||||||||||||||||
| Total interest-bearing liabilities |
3,265,031 | 17,647 | 0.54 | % | 2,544,003 | 10,874 | 0.43 | % | 2,365,407 | 8,937 | 0.38 | % | ||||||||||||||||||||||||
| Noninterest-bearing liabilities: |
||||||||||||||||||||||||||||||||||||
| Demand deposits |
852,629 | 695,630 | 652,685 | |||||||||||||||||||||||||||||||||
| Other liabilities |
27,616 | 16,982 | 15,159 | |||||||||||||||||||||||||||||||||
| Stockholders’ equity |
474,540 | 392,221 | 367,210 | |||||||||||||||||||||||||||||||||
|
|
|
|
|
|
|
|||||||||||||||||||||||||||||||
| TOTAL LIABILITIES AND STOCKHOLDERS’ EQUITY |
$ | 4,619,816 | $ | 3,648,836 | $ | 3,400,461 | ||||||||||||||||||||||||||||||
|
|
|
|
|
|
|
|||||||||||||||||||||||||||||||
| Net interest income/spread |
146,611 | 3.28 | % | 117,497 | 3.36 | % | 114,538 | 3.54 | % | |||||||||||||||||||||||||||
|
|
|
|
|
|
|
|||||||||||||||||||||||||||||||
| Tax equivalent basis adjustment |
962 | 857 | 972 | |||||||||||||||||||||||||||||||||
|
|
|
|
|
|
|
|||||||||||||||||||||||||||||||
| NET INTEREST INCOME |
$ | 145,649 | $ | 116,640 | $ | 113,566 | ||||||||||||||||||||||||||||||
|
|
|
|
|
|
|
|||||||||||||||||||||||||||||||
| Net interest margin (3) |
3.41 | % | 3.47 | % | 3.64 | % | ||||||||||||||||||||||||||||||
|
|
|
|
|
|
|
|||||||||||||||||||||||||||||||
| (1) | Includes non-accrual loans, the effect of which is to reduce the yield earned on loans, loans held for sale, and deferred loan fees. |
| (2) | Includes interest-bearing cash accounts. |
| (3) | Net interest income on a tax equivalent basis divided by interest-earning assets. |
Interest income on a tax equivalent basis increased from $128.4 million in 2015 to $164.3 million in 2016, an increase of $35.9 million, or 28%. The increase in interest income was primarily a result of the Pascack and Harmony acquisitions as well as organic growth in loans, as the average balance of loans and leases increased $789.3 million compared to 2015. The yield on average loans and leases of 4.20% in 2016 was 4 basis points
-32-
Table of Contents
greater than 2015. The yield on average taxable investment securities increased 9 basis points, while the yield on tax-exempt investment securities decreased by 50 basis points, compared to 2015. Interest on taxable investment securities in 2016 included $358,000 in income on called U.S. government agency securities. The decrease in yield on tax-exempt investment securities was primarily due to securities maturing at higher rates and new purchases of short-term securities at lower rates.
Interest income on a tax equivalent basis increased from $123.5 million in 2014 to $128.4 million in 2015, an increase of $4.9 million, or 4%. The increase in interest income was primarily due to a $205.5 million increase in average loans and leases partially offset by a decrease in the yield on interest-earning assets. The yield on average loans and leases at 4.16% in 2015 was 15 basis points lower than 2014, resulting primarily from strong growth in loans and leases originated or refinanced at lower rates. The yield on average taxable and tax exempt investment securities decreased by 8 and 23 basis points, respectively, compared to 2014. The decrease in yield on tax exempt investment securities was primarily due to maturing securities at higher rates and new purchases at lower rates.
Total interest expense increased from $10.9 million in 2015 to $17.6 million in 2016, an increase of $6.8 million, or 62%. The cost of average interest-bearing liabilities increased from 0.43% in 2015 to 0.54% in 2016. The yield on interest-bearing transaction accounts and time deposits increased by 9 basis points and 18 basis points, respectively. The increase in the yield on interest-bearing liabilities was due primarily to higher costing deposits acquired in the Pascack and Harmony acquisitions, an increase in the cost of borrowings, and an increasingly competitive market for deposits. As growth in loans exceeded growth in core deposits from 2015 to 2016, the Company utilized higher cost time deposits and term borrowings from the Federal Home Loan Bank of New York to fund loan growth. A change in the mix of deposits also contributed to the increase in the cost of funds. The percentage of time deposits to total interest-bearing liabilities increased from 12% in 2015 to 16% in 2016, while savings and interest-bearing transaction accounts decreased as a percentage of interest-bearing liabilities. Time deposits typically pay higher rates than savings and interest-bearing transaction accounts. Additionally, the $75.0 million subordinated debt offering in September 2016 added $1.0 million to the cost of borrowings in 2016.
Total interest expense increased from $8.9 million in 2014 to $10.9 million in 2015, an increase of $1.9 million, or 22%. The cost of average interest-bearing liabilities increased from 0.38% in 2014 to 0.43% in 2015. The increase in the cost of funds was primarily due to increases in average time deposits and borrowings. Borrowings as a percent of interest-bearing liabilities increased from 10% in 2014, to 13% in 2015, as average borrowings increased $87.1 million in that time period to help fund loan growth. Borrowings at a rate of 1.56% have a higher cost than interest-bearing deposits which had an average cost of 0.26% in 2015. Additionally, higher cost average time deposits totaling $303.7 million increased $19.8 million compared to 2014. Because loan growth exceeded growth in core deposits in 2015, the Company bid for higher cost time deposits and used term borrowings from the Federal Home Loan Bank of New York to fund loan growth.
Provision for Loan and Lease Losses
In determining the provision for loan and lease losses, management considers national and local economic conditions; trends in the portfolio including orientation to specific loan types or industries; experience, ability and depth of lending management in relation to the complexity of the portfolio; adequacy and adherence to policies, procedures and practices; levels and trends in delinquencies, impaired loans and leases and net charge-offs and the results of independent third party loan reviews.
The provision for loan and lease losses increased from $1.9 million in 2015 to $4.2 million in 2016. The increased provision during 2016 was primarily a result of increased net charge-offs of $3.9 million (0.11% of average loans), which were 120% higher than the $1.8 million (0.06% of average loans) for 2015. The increase in net charge-offs from 2015 to 2016 resulted from a $1.9 million reduction in recoveries during that time period.
-33-
Table of Contents
The provision for loan and lease losses decreased from $5.9 million in 2014 to $1.9 million in 2015. The lower provision during 2015 was primarily a result of reduced net charge-offs of $1.8 million (0.06% of average loans), which were 65% lower than the $5.0 million (0.19% of average loans) for 2014.
Noninterest Income
Noninterest income of $21.3 million in 2016 increased by $169,000 compared to 2015. Excluding a $1.8 million gain on debt extinguishment received in 2015, noninterest income increased $2.0 million from 2015 to 2016. Gains on sales of loans of $2.1 million and gain on investment securities of $370,000 in 2016 increased $442,000 and $129,000, respectively, compared to the same period last year. Income on bank owned life insurance at $2.6 million increased $545,000 compared to 2015. In 2016, an $864,000 death benefit was received on a bank owned life insurance policy, compared to a $435,000 death benefit received in 2015. Commissions and fees totaling $4.3 million decreased $219,000, due primarily to reduced financial services income. Other income totaling $1.8 million in 2016 was $969,000 higher than 2015, resulting primarily from an increase in swap income of $659,000 compared to 2015, as well as a $219,000 recovery from a Somerset Hills loan that was written off prior to the Lakeland Bank acquisition. Noninterest income represented 13% of total revenue in 2016. (Total revenue is defined as net interest income plus noninterest income).
Noninterest income at $21.2 million in 2015 increased by $3.4 million, or 19%, compared to 2014. Included in noninterest income during 2015 was a $1.8 million pre-tax gain on redemption and extinguishment of $10.0 million of Lakeland Bancorp Capital Trust IV debentures and $241,000 in gain on sales and calls of investment securities. Excluding these two items, noninterest income would have been $19.1 million, a $1.4 million increase compared to 2014. Gains on sales of loans at $1.7 million in 2015 was $1.1 million higher than 2014 due to increased origination and sale of residential mortgages. Income on bank owned life insurance at $2.0 million in 2015 was $564,000 greater than 2014 due primarily to death benefits received. Service charges on deposit accounts at $10.0 million decreased $499,000, or 5%, primarily due to a decline in overdraft fees. Other income totaling $800,000 in 2015 was $263,000 higher than 2014. Within other income, the Company recorded $396,000 in swap income compared to no swap income in 2014. The increase in swap income was partially offset by loss on disposal of assets relating to branch closures in 2015. Noninterest income represented 15% of total revenue in 2015.
Noninterest Expense
Noninterest expense totaling $99.9 million increased $12.7 million in 2016 from 2015. Included in noninterest expense during 2016 was $4.1 million in merger related expenses compared to $1.2 million in 2015. Noninterest expense in 2015 included a $2.4 million long-term debt prepayment fee. Excluding merger related expenses and the debt prepayment fee, total noninterest expense increased $12.2 million compared to 2015. Salary and employee benefits of $56.1 million increased by $7.5 million, or 15%, due primarily to the addition of the Pascack and Harmony employees as well as normal salary and benefit increases. Furniture and equipment expense, net occupancy expense and telecommunications expense increased $1.1 million, $979,000 and $183,000, respectively, compared to 2015 due to the addition of the Pascack and Harmony branches. Stationary, supplies and postage increased $198,000 compared to 2015 primarily due to mailing and supplies associated with the Pascack and Harmony acquisitions. FDIC insurance expense of $2.2 million in 2016 increased $162,000 compared to 2015, due to the addition of the Pascack and Harmony deposits. ATM and debit card expense of $1.6 million increased $184,000 compared to 2015 due primarily to the addition of Pascack and Harmony ATMs as well as an initiative during 2016 to replace debit cards with the increased security EMV chip cards. Data processing expense of $1.9 million increased $367,000 primarily due to increases in the cost of mobile banking, the addition of the Pascack and Harmony branches and because of the usage of Pascack and Harmony systems before the systems were integrated into Lakeland’s systems. Other expenses of $10.2 million in 2016 increased $1.2 million compared to 2015 due primarily to higher consulting, courier, director, insurance and investor relations expenses. The increase in courier expense is due to the outsourcing of the Company’s couriers which had previously impacted salary expense.
-34-
Table of Contents
Noninterest expense totaling $87.2 million increased $8.1 million in 2015 compared to 2014. Included in noninterest expense during 2015 was $2.4 million in long term debt prepayment fees and $1.2 million in merger related expenses. Excluding these two items, total noninterest expense would have been $83.7 million, a $4.5 million increase compared to 2014. Salary and employee benefits at $48.6 million increased by $3.5 million, or 8%, primarily due to the two new LPOs, as well as year-over-year incremental salary increases, pension expenses, increasing benefit costs and benefit increases. Furniture and equipment increased $325,000 in 2015 compared to 2014 due primarily to an increase in service contract and software licensing costs. Stationary, supplies and postage increased $126,000 compared to 2014 primarily due to special mailings and expenses related to the opening of the new LPOs. Marketing expense at $1.6 million in 2015 decreased $439,000 compared to 2014 primarily due to website redesign and TV commercial creation expenses during 2014 that the Company did not have in 2015. Data processing expense at $1.5 million increased $279,000 compared to 2014 due primarily to increases related to the Company’s mobile offerings. In 2015, other real estate owned and other repossessed asset expense at $181,000 decreased $53,000 compared to 2014 as a result of fewer transfers of loans into other real estate. Other expenses at $8.9 million increased $669,000 in 2015 compared to 2014, due primarily to an increase in the provision for unfunded lending commitments offset by a decline in professional fees.
The efficiency ratio, a non-GAAP measure, expresses the relationship between noninterest expense (excluding other real estate and other repossessed asset expense, long-term debt repayment fees, merger related expenses, provision for unfunded lending commitments and core deposit amortization) to total tax-equivalent revenue (excluding gains (losses) on securities and gain on debt extinguishment). In 2016, the Company’s efficiency ratio on a tax equivalent basis was 56.41% compared to 60.18% in 2015. The efficiency ratio was 59.35% in 2014.
| For the Year Ended December 31, | ||||||||||||||||||||
| 2016 | 2015 | 2014 | 2013 | 2012 | ||||||||||||||||
| (dollars in thousands) | ||||||||||||||||||||
| Calculation of Efficiency Ratio (a Non-GAAP Measure) |
||||||||||||||||||||
| Total noninterest expense |
$ | 99,917 | $ | 87,211 | $ | 79,135 | $ | 78,741 | $ | 67,673 | ||||||||||
| Less: |
||||||||||||||||||||
| Amortization of core deposit intangibles |
(734 | ) | (415 | ) | (464 | ) | (288 | ) | — | |||||||||||
| Other real estate owned and other repossessed asset expense |
(116 | ) | (181 | ) | (234 | ) | (24 | ) | (99 | ) | ||||||||||
| Merger related expenses |
(4,103 | ) | (1,152 | ) | — | (2,834 | ) | — | ||||||||||||
| Long-term debt prepayment fee |
— | (2,407 | ) | — | (1,209 | ) | (782 | ) | ||||||||||||
| Provision for unfunded lending commitments |
(438 | ) | (864 | ) | 65 | (55 | ) | (93 | ) | |||||||||||
|
|
|
|
|
|
|
|
|
|
|
|||||||||||
| Noninterest expense, as adjusted |
$ | 94,526 | $ | 82,192 | $ | 78,502 | $ | 74,331 | $ | 66,699 | ||||||||||
|
|
|
|
|
|
|
|
|
|
|
|||||||||||
| Net interest income |
$ | 145,649 | $ | 116,640 | $ | 113,566 | $ | 104,542 | $ | 95,513 | ||||||||||
| Noninterest income |
21,330 | 21,161 | 17,722 | 20,961 | 18,905 | |||||||||||||||
|
|
|
|
|
|
|
|
|
|
|
|||||||||||
| Total revenue |
166,979 | 137,801 | 131,288 | 125,503 | 114,418 | |||||||||||||||
| Plus: Tax-equivalent adjustment on municipal securities |
962 | 857 | 972 | 965 | 981 | |||||||||||||||
| Less: Gains on sales of investment securities and debt extinguishment |
(370 | ) | (2,071 | ) | (2 | ) | (2,036 | ) | (1,049 | ) | ||||||||||
|
|
|
|
|
|
|
|
|
|
|
|||||||||||
| Total revenue, as adjusted |
$ | 167,571 | $ | 136,587 | $ | 132,258 | $ | 124,432 | $ | 114,350 | ||||||||||
|
|
|
|
|
|
|
|
|
|
|
|||||||||||
| Efficiency ratio (Non-GAAP) |
56.41 | % | 60.18 | % | 59.35 | % | 59.74 | % | 58.33 | % | ||||||||||
|
|
|
|
|
|
|
|
|
|
|
|||||||||||
-35-
Table of Contents
Income Taxes
The Company’s effective income tax rate was 33.9%, 33.2% and 32.7%, in the years ended December 31, 2016, 2015 and 2014, respectively. The effective tax rate increase from 2015 to 2016 was primarily as a result of a decrease in tax advantaged items as a percent of pre-tax income. Contributing to the increase in the effective tax rate was the impact of non-deductible merger related expenses, offset by the impact of interest income from tax-exempt securities and income on bank owned life insurance policies. The effective tax rate increase in 2015 from 2014 was primarily a result of a decrease in tax advantaged items as a percentage of pre-tax income, as well as non-tax deductible merger related expenses included in pre-tax income in 2015. Tax advantaged items include interest income on tax-exempt securities and income on bank owned life insurance.
Financial Condition
Total assets increased from $3.87 billion at December 31, 2015 to $5.09 billion at December 31, 2016, an increase of $1.22 billion, or 32%. Total loans were $3.87 billion, an increase of $905.9 million, or 31%, from $2.97 billion at December 31, 2015. Total deposits were $4.09 billion, an increase of $1.10 billion from December 31, 2015. Total assets at year-end 2015 increased $331.2 million, or 9%, from year-end 2014.
Loans and Leases
Lakeland primarily serves New Jersey, the Hudson Valley region in New York and the surrounding areas. Its equipment finance division serves a broader market with a primary focus on the Northeast.
Gross loans and leases of $3.87 billion increased by $905.9 million from December 31, 2015, including Pascack and Harmony loans, which totaled $319.6 million and $260.8 million, respectively, at acquisition. Excluding Pascack’s and Harmony’s loans, total loans have increased $325.6 million, or 11%, from December 31, 2015, primarily in the commercial loans secured by real estate category. Excluding the impact of the Pascack and Harmony loans of $506.6 million, commercial loans secured by real estate increased $288.5 million, or 16%, from December 31, 2015 to December 31, 2016. Leases also increased $10.4 million, or 18%, resulting from increased demand for equipment financing. Excluding the impact of the Pascack and Harmony loans of $25.3 million, commercial, industrial and other increased $17.9 million, or 6%. Real estate-residential mortgages declined $50.4 million, or 13%, excluding the impact of Pascack and Harmony residential mortgages of $10.3 million. The decline in residential mortgages results from a decision to sell most of the residential loans that the Company originates. Excluding the impact of Pascack and Harmony loans totaling $25.5 million, real estate construction loans increased $67.5 million, or 57%, while home equity and consumer loans decreased $8.3 million, or 2%. Gross loans and leases at $2.97 billion as of December 31, 2015 increased $312.3 million, or 12%, compared to December 31, 2014, primarily in the commercial loans secured by real estate category.
-36-
Table of Contents
The following table sets forth the classification of Lakeland’s gross loans and leases by major category as of December 31 for each of the last five years:
| December 31, | ||||||||||||||||||||
| 2016 | 2015 | 2014 | 2013 | 2012 | ||||||||||||||||
| (in thousands) | ||||||||||||||||||||
| Commercial, secured by real estate |
$ | 2,556,601 | $ | 1,761,589 | $ | 1,529,761 | $ | 1,389,861 | $ | 1,125,137 | ||||||||||
| Commercial, industrial and other |
350,228 | 307,044 | 238,252 | 213,808 | 216,129 | |||||||||||||||
| Leases |
67,016 | 56,660 | 54,749 | 41,332 | 26,781 | |||||||||||||||
| Real estate - residential mortgage |
349,581 | 389,692 | 431,190 | 432,831 | 423,262 | |||||||||||||||
| Real estate - construction |
211,109 | 118,070 | 64,020 | 53,119 | 46,272 | |||||||||||||||
| Home equity and consumer |
339,360 | 334,891 | 337,642 | 339,338 | 309,626 | |||||||||||||||
|
|
|
|
|
|
|
|
|
|
|
|||||||||||
| Total loans and leases |
3,873,895 | 2,967,946 | 2,655,614 | 2,470,289 | 2,147,207 | |||||||||||||||
| Deferred fees |
(3,297 | ) | (2,746 | ) | (1,788 | ) | (1,273 | ) | (364 | ) | ||||||||||
|
|
|
|
|
|
|
|
|
|
|
|||||||||||
| Loans and leases, net |
$ | 3,870,598 | $ | 2,965,200 | $ | 2,653,826 | $ | 2,469,016 | $ | 2,146,843 | ||||||||||
|
|
|
|
|
|
|
|
|
|
|
|||||||||||
At December 31, 2016, there were no concentrations of loans or leases exceeding 10% of total loans and leases outstanding other than loans that are secured by real estate. Loan concentrations are considered to exist when there are amounts loaned to a multiple number of borrowers engaged in similar activities which would cause them to be similarly impacted by economic or other related conditions.
The following table sets forth maturities and sensitivity to changes in interest rates in commercial loans in Lakeland’s loan portfolio at December 31, 2016:
| Within One Year |
After One but Within Five Years |
After Five Years |
Total | |||||||||||||
| (in thousands) | ||||||||||||||||
| Commercial, secured by real estate |
$ | 105,835 | $ | 493,305 | $ | 1,957,461 | $ | 2,556,601 | ||||||||
| Commercial, industrial and other |
164,474 | 92,391 | 93,363 | 350,228 | ||||||||||||
| Real estate - construction |
102,242 | 39,131 | 69,736 | 211,109 | ||||||||||||
|
|
|
|
|
|
|
|
|
|||||||||
| Total |
$ | 372,551 | $ | 624,827 | $ | 2,120,560 | $ | 3,117,938 | ||||||||
|
|
|
|
|
|
|
|
|
|||||||||
| Predetermined rates |
$ | 65,355 | $ | 420,588 | $ | 356,187 | $ | 842,130 | ||||||||
| Floating or adjustable rates |
307,196 | 204,239 | 1,764,373 | 2,275,808 | ||||||||||||
|
|
|
|
|
|
|
|
|
|||||||||
| Total |
$ | 372,551 | $ | 624,827 | $ | 2,120,560 | $ | 3,117,938 | ||||||||
|
|
|
|
|
|
|
|
|
|||||||||
Risk Elements
Commercial loans and leases are placed on a non-accrual status with all accrued interest and unpaid interest reversed if (a) because of the deterioration in the financial position of the borrower they are maintained on a cash basis (which means payments are applied when and as received rather than on a regularly scheduled basis), (b) payment in full of interest or principal is not expected, or (c) principal and interest have been in default for a period of 90 days or more unless the obligation is both well-secured and in process of collection. Residential mortgage loans are placed on non-accrual status at the time principal and interest have been in default for a period of 90 days or more, except where there exists sufficient collateral to cover the defaulted principal and interest payments, and the loans are well-secured and in the process of collection. Consumer loans are generally placed on non-accrual status and reviewed for charge-off when principal and interest payments are four months in arrears unless the obligations are well-secured and in the process of collection. Interest thereafter on such charged-off consumer loans is taken into income when received only after full recovery of principal. As a general rule, a non-accrual asset may be restored to accrual status when none of its principal or interest is due and unpaid
-37-
Table of Contents
and satisfactory payments have been received for a sustained period (usually six months), or when it otherwise becomes well-secured and in the process of collection.
The following schedule sets forth certain information regarding Lakeland’s non-accrual (including troubled debt restructurings that are on non-accrual) and past due loans and leases and other real estate owned and other repossessed assets as of December 31, for each of the last five years:
| December 31, | ||||||||||||||||||||
| 2016 | 2015 | 2014 | 2013 | 2012 | ||||||||||||||||
| (dollars in thousands) | ||||||||||||||||||||
| Commercial, secured by real estate |
$ | 10,413 | $ | 10,446 | $ | 7,424 | $ | 7,697 | $ | 10,511 | ||||||||||
| Commercial, industrial and other |
167 | 103 | 308 | 88 | 1,476 | |||||||||||||||
| Leases, including leases held for sale |
153 | 316 | 88 | — | 32 | |||||||||||||||
| Real estate - residential mortgage |
6,048 | 8,664 | 9,246 | 6,141 | 8,733 | |||||||||||||||
| Real estate - construction |
1,472 | — | 188 | 831 | 4,031 | |||||||||||||||
| Home equity and consumer |
2,151 | 3,167 | 3,415 | 2,175 | 3,197 | |||||||||||||||
|
|
|
|
|
|
|
|
|
|
|
|||||||||||
| Total non-accrual loans and leases |
20,404 | 22,696 | 20,669 | 16,932 | 27,980 | |||||||||||||||
| Other real estate and other repossessed assets |
1,072 | 983 | 1,026 | 520 | 529 | |||||||||||||||
|
|
|
|
|
|
|
|
|
|
|
|||||||||||
| TOTAL NON-PERFORMING ASSETS |
$ | 21,476 | $ | 23,679 | $ | 21,695 | $ | 17,452 | $ | 28,509 | ||||||||||
|
|
|
|
|
|
|
|
|
|
|
|||||||||||
| Non-performing assets as a percentage of total assets |
0.42 | % | 0.61 | % | 0.61 | % | 0.53 | % | 0.98 | % | ||||||||||
|
|
|
|
|
|
|
|
|
|
|
|||||||||||
| Loans and leases past due 90 days or more and still accruing |
$ | 10 | $ | 331 | $ | 66 | $ | 1,997 | $ | 1,437 | ||||||||||
|
|
|
|
|
|
|
|
|
|
|
|||||||||||
| Troubled debt restructurings, still accruing |
$ | 8,802 | $ | 10,108 | $ | 10,579 | $ | 10,289 | $ | 7,336 | ||||||||||
|
|
|
|
|
|
|
|
|
|
|
|||||||||||
Non-accrual loans and leases decreased to $20.4 million on December 31, 2016 from $22.7 million at December 31, 2015. The decrease in non-accrual loans was primarily in residential mortgages which decreased $2.6 million, or 30%. Additionally, home equity and consumer non-accrual loans decreased $1.0 million. Offsetting these declines was an increase in real estate construction non-accruals due to the addition of one loan in the fourth quarter of 2016.
Non-accruals include 5 loan relationships between $500,000 and $1.0 million totaling $3.5 million, and 4 loan relationships exceeding $1.0 million totaling $6.1 million. All non-accrual loans and leases are in various stages of litigation, foreclosure, or workout. Non-accrual loans included $2.4 million and $2.5 million in troubled debt restructurings for the years ended December 31, 2016 and 2015, respectively.
At December 31, 2016 and 2015, Lakeland had $8.8 million and $10.1 million, respectively, in loans that were restructured and still accruing. Restructured loans are those loans where Lakeland has granted concessions to the borrower in payment terms, in rate and/or in maturity as a result of the financial condition of the borrower.
For 2016, the gross interest income that would have been recorded, had the loans and leases classified at year-end as impaired been performing in conformance with their original terms, was approximately $1.7 million. The amount of interest income actually recorded on those loans and leases for 2016 was $648,000. The resultant loss of $1.0 million for 2016 compares with prior year losses of $792,000 for 2015 and $1.1 million for 2014.
As of December 31, 2016, Lakeland had impaired loans and leases totaling $25.3 million (consisting primarily of non-accrual and restructured loans and leases), compared to $26.0 million at December 31, 2015. The valuation allowance of these loans and leases is based primarily on the fair value of the underlying collateral. Based upon such evaluation, $529,000 has been allocated to the allowance for loan and lease losses for impairment at December 31, 2016 compared to $843,000 at December 31, 2015. At December 31, 2016,
-38-
Table of Contents
Lakeland also had $28.7 million in loans and leases that were rated substandard that were not classified as non-performing or impaired compared to $46.6 million at December 31, 2015.
There were no additional loans or leases at December 31, 2016, other than those designated non-performing, impaired or substandard, where Lakeland was aware of any credit conditions of any borrowers that would indicate a strong possibility of the borrowers not complying with the present terms and conditions of repayment and which may result in such loans or leases being included as non-accrual, past due or renegotiated at a future date.
The following table sets forth for each of the five years ended December 31, 2016, the historical relationships among the amount of loans and leases outstanding, the allowance for loan and lease losses, the provision for loan and lease losses, the amount of loans and leases charged off and the amount of loan and lease recoveries:
| Years Ended December 31, | ||||||||||||||||||||
| 2016 | 2015 | 2014 | 2013 | 2012 | ||||||||||||||||
| (dollars in thousands) | ||||||||||||||||||||
| Allowance balance, beginning of the year |
$ | 30,874 | $ | 30,684 | $ | 29,821 | $ | 28,931 | $ | 28,416 | ||||||||||
|
|
|
|
|
|
|
|
|
|
|
|||||||||||
| Loans and leases charged off: |
||||||||||||||||||||
| Commercial, secured by real estate |
(410 | ) | (1,821 | ) | (2,282 | ) | (2,026 | ) | (7,287 | ) | ||||||||||
| Commercial, industrial and other |
(796 | ) | (205 | ) | (999 | ) | (1,324 | ) | (949 | ) | ||||||||||
| Leases |
(366 | ) | (548 | ) | (597 | ) | (206 | ) | (999 | ) | ||||||||||
| Real estate - residential mortgage |
(1,103 | ) | (375 | ) | (827 | ) | (1,257 | ) | (1,822 | ) | ||||||||||
| Real estate - construction |
— | (20 | ) | (25 | ) | (3,854 | ) | (2,888 | ) | |||||||||||
| Home equity and consumer |
(1,980 | ) | (1,511 | ) | (2,697 | ) | (1,624 | ) | (2,074 | ) | ||||||||||
|
|
|
|
|
|
|
|
|
|
|
|||||||||||
| Total loans and leases charged off |
(4,655 | ) | (4,480 | ) | (7,427 | ) | (10,291 | ) | (16,019 | ) | ||||||||||
|
|
|
|
|
|
|
|
|
|
|
|||||||||||
| Recoveries: |
||||||||||||||||||||
| Commercial, secured by real estate |
297 | 2,221 | 999 | 1,061 | 280 | |||||||||||||||
| Commercial, industrial and other |
202 | 183 | 1,039 | 260 | 428 | |||||||||||||||
| Leases |
31 | 26 | 19 | 121 | 504 | |||||||||||||||
| Real estate - residential mortgage |
8 | 63 | 42 | 99 | 66 | |||||||||||||||
| Real estate - construction |
18 | 106 | 106 | 14 | 43 | |||||||||||||||
| Home equity and consumer |
247 | 129 | 220 | 283 | 306 | |||||||||||||||
|
|
|
|
|
|
|
|
|
|
|
|||||||||||
| Total recoveries |
803 | 2,728 | 2,425 | 1,838 | 1,627 | |||||||||||||||
|
|
|
|
|
|
|
|
|
|
|
|||||||||||
| Net charge-offs |
(3,852 | ) | (1,752 | ) | (5,002 | ) | (8,453 | ) | (14,392 | ) | ||||||||||
| Provision for loan and lease losses |
4,223 | 1,942 | 5,865 | 9,343 | 14,907 | |||||||||||||||
|
|
|
|
|
|
|
|
|
|
|
|||||||||||
| Allowance balance, end of year |
$ | 31,245 | $ | 30,874 | $ | 30,684 | $ | 29,821 | $ | 28,931 | ||||||||||
|
|
|
|
|
|
|
|
|
|
|
|||||||||||
| Net charge-offs as a percentage of average loans and leases outstanding |
0.11 | % | 0.06 | % | 0.19 | % | 0.36 | % | 0.69 | % | ||||||||||
| Allowance as a percentage of year-end total loans and leases outstanding |
0.81 | % | 1.04 | % | 1.16 | % | 1.21 | % | 1.35 | % | ||||||||||
The ratio of the allowance for loan and lease losses to loans and leases outstanding reflects management’s evaluation of the underlying credit risk inherent in the loan portfolio as discussed above in “Critical Accounting Policies, Judgments and Estimates – Allowance for Loan and Lease Losses.”
In 2015, the Company refined and enhanced its assessment of the adequacy of the allowance for loan and lease losses by extending the lookback period on its commercial loan portfolios from three to five years and by extending the lookback period for all other portfolios from two to three years in order to capture more of the
-39-
Table of Contents
economic cycle. It also enhanced its qualitative factor framework to include a factor that captures the risk related to appraised real estate values, and how those values could change in relation to a change in capitalization rates. This enhancement is meant to increase the level of precision in the allowance for loan and lease losses. As a result, the Company will no longer have an “unallocated” segment in its allowance for loan and lease losses, as the risks and uncertainties meant to be captured by the unallocated allowance have been included in the qualitative framework for the respective portfolios. As such, the unallocated allowance has in essence been reallocated to the certain portfolios based on the risks and uncertainties it was meant to capture.
Non-performing loans and leases decreased from $22.7 million on December 31, 2015 to $20.4 million on December 31, 2016 and the allowance for loan and lease losses was 0.81% of total loans and leases on December 31, 2016 compared to 1.04% of total loans and leases on December 31, 2015. The reduction in the percentage of the allowance for loan and lease losses as a percent of total loans and leases was primarily due to loans resulting from the Pascack and Harmony acquisitions, which are accounted for under acquisition accounting and have no allowance for loan loss. Excluding the acquired loans, the allowance as a percent of total loans would be 0.98%. Management believes, based on appraisals and estimated selling costs, that the majority of its non-performing loans are well secured and that the reserves on its non-performing loans are adequate. Based upon the process employed and giving recognition to all accompanying factors related to the loan and lease portfolio, management considers the allowance for loan and lease losses to be adequate at December 31, 2016.
The overall balance of the allowance for loan and lease losses of $31.2 million at December 31, 2016 increased $371,000 from December 31, 2015, an increase of 1%. The change of the allowance within segments of the loan portfolio reflects changes in the non-performing loans and charge-off statistics within each segment as well as the level of growth within each segment. Loan reserves are based on a combination of historical charge-off experience, estimating the appropriate loss emergence and pre-emergence periods and assigning qualitative factors based on general economic conditions and specific bank portfolio characteristics.
The following table sets forth the allowance for loan and lease losses allocated by loan category and the percent of loans in each category to total loans at the dates indicated. The allowance for loan and lease losses allocated to each category is not necessarily indicative of future losses in any particular category and does not restrict the use of the allowance to absorb losses in other categories.
| December 31, | ||||||||||||||||||||||||||||||||||||||||
| 2016 | 2015 | 2014 | 2013 | 2012 | ||||||||||||||||||||||||||||||||||||
| Allowance | % of Loans in Each Category |
Allowance | % of Loans in Each Category |
Allowance | % of Loans in Each Category |
Allowance | % of Loans in Each Category |
Allowance | % of Loans in Each Category |
|||||||||||||||||||||||||||||||
| (dollars in thousands) | ||||||||||||||||||||||||||||||||||||||||
| Commercial, secured by real estate |
$ | 21,223 | 66.1 | % | $ | 20,223 | 59.4 | % | $ | 13,577 | 57.6 | % | $ | 14,463 | 56.2 | % | $ | 16,258 | 52.4 | % | ||||||||||||||||||||
| Commercial, industrial and other |
1,723 | 9.0 | % | 2,637 | 10.3 | % | 3,196 | 9.0 | % | 5,331 | 8.7 | % | 5,103 | 10.1 | % | |||||||||||||||||||||||||
| Leases |
548 | 1.7 | % | 460 | 1.9 | % | 582 | 2.1 | % | 504 | 1.7 | % | 578 | 1.2 | % | |||||||||||||||||||||||||
| Real estate - residential mortgage |
1,964 | 9.0 | % | 2,588 | 13.1 | % | 4,020 | 16.2 | % | 3,214 | 17.5 | % | 3,568 | 19.7 | % | |||||||||||||||||||||||||
| Real estate - construction |
2,352 | 5.4 | % | 1,591 | 4.0 | % | 553 | 2.4 | % | 542 | 2.2 | % | 587 | 2.2 | % | |||||||||||||||||||||||||
| Home equity and consumer |
3,435 | 8.8 | % | 3,375 | 11.3 | % | 6,333 | 12.7 | % | 2,737 | 13.7 | % | 2,837 | 14.4 | % | |||||||||||||||||||||||||
| Unallocated |
— | — | 2,423 | 3,030 | — | |||||||||||||||||||||||||||||||||||
|
|
|
|
|
|
|
|
|
|
|
|
|
|
|
|
|
|
|
|
|
|||||||||||||||||||||
| $ | 31,245 | 100.0 | % | $ | 30,874 | 100.0 | % | $ | 30,684 | 100.0 | % | $ | 29,821 | 100.0 | % | $ | 28,931 | 100.0 | % | |||||||||||||||||||||
|
|
|
|
|
|
|
|
|
|
|
|
|
|
|
|
|
|
|
|
|
|||||||||||||||||||||
-40-
Table of Contents
Investment Securities
The Company has classified its investment securities into the available for sale and held to maturity categories based on its intent and ability to hold the securities to maturity. The Company has no investment securities classified as trading securities.
The following table sets forth the carrying value of the Company’s investment securities, both available for sale and held to maturity, as of December 31 for each of the last three years. Investment securities available for sale are stated at fair value while securities held for maturity are stated at cost, adjusted for amortization of premiums and accretion of discounts.
| December 31, | ||||||||||||
| 2016 | 2015 | 2014 | ||||||||||
| (in thousands) | ||||||||||||
| U.S. Treasury and U.S. government agencies |
$ | 150,912 | $ | 127,610 | $ | 114,397 | ||||||
| Mortgage-backed securities, residential |
442,244 | 315,918 | 352,264 | |||||||||
| Mortgage-backed securities, multifamily |
12,246 | 12,279 | 7,235 | |||||||||
| Obligations of states and political subdivisions |
119,610 | 82,115 | 71,920 | |||||||||
| Equity securities |
21,882 | 18,645 | 17,574 | |||||||||
| Debt securities |
7,424 | 2,522 | 2,035 | |||||||||
|
|
|
|
|
|
|
|||||||
| $ | 754,318 | $ | 559,089 | $ | 565,425 | |||||||
|
|
|
|
|
|
|
|||||||
The Company also does not own any interests in any hedge funds or private equity funds that are designated “covered funds” under the Volcker Rule issued in December 2013. All of the Company’s mortgage-backed securities are issued by U.S. Government or U.S. Government sponsored entities.
-41-
Table of Contents
The following table sets forth the maturity distribution and weighted average yields (calculated on the basis of the stated yields to maturity, considering applicable premium or discount), on a fully taxable equivalent basis, of investment securities available for sale as of December 31, 2016, at fair value:
| Available for Sale |
Within One Year |
Over One but Within Five Years |
Over Five but Within Ten Years |
After Ten Years |
Total | |||||||||||||||
| (dollars in thousands) | ||||||||||||||||||||
| U.S. Treasury and U.S. government agencies |
||||||||||||||||||||
| Amount |
$ | 500 | $ | 70,523 | $ | 38,234 | $ | 8,102 | $ | 117,359 | ||||||||||
| Yield |
1.01 | % | 1.55 | % | 1.80 | % | 1.75 | % | 1.64 | % | ||||||||||
| Mortgage-backed securities, residential |
||||||||||||||||||||
| Amount |
5 | 1,664 | 49,199 | 352,670 | 403,538 | |||||||||||||||
| Yield |
4.21 | % | 2.89 | % | 2.28 | % | 2.08 | % | 2.10 | % | ||||||||||
| Mortgage-backed securities, multifamily |
||||||||||||||||||||
| Amount |
— | 5,178 | 5,009 | — | 10,187 | |||||||||||||||
| Yield |
— | % | 1.74 | % | 2.44 | % | — | % | 2.08 | % | ||||||||||
| Obligations of states and political subdivisions |
||||||||||||||||||||
| Amount |
1,302 | 17,211 | 25,336 | 4,477 | 48,326 | |||||||||||||||
| Yield |
4.21 | % | 3.46 | % | 2.58 | % | 3.33 | % | 3.00 | % | ||||||||||
| Debt securities |
||||||||||||||||||||
| Amount |
350 | — | 5,062 | — | 5,412 | |||||||||||||||
| Yield |
0.77 | % | — | % | 3.26 | % | — | % | 3.10 | % | ||||||||||
| Equity securities |
||||||||||||||||||||
| Amount |
21,882 | — | — | — | 21,882 | |||||||||||||||
| Yield |
1.93 | % | — | % | — | % | — | % | 1.93 | % | ||||||||||
|
|
|
|
|
|
|
|
|
|
|
|||||||||||
| Total securities |
||||||||||||||||||||
| Amount |
$ | 24,039 | $ | 94,576 | $ | 122,840 | $ | 365,249 | $ | 606,704 | ||||||||||
| Yield |
2.01 | % | 1.93 | % | 2.24 | % | 2.08 | % | 2.09 | % | ||||||||||
|
|
|
|
|
|
|
|
|
|
|
|||||||||||
-42-
Table of Contents
The following table sets forth the maturity distribution and weighted average yields (calculated on the basis of the stated yields to maturity, considering applicable premium or discount), on a fully taxable equivalent basis, of investment securities held to maturity as of December 31, 2016, at amortized cost:
| Held to Maturity |
Within One Year |
Over One but Within Five Years |
Over Five but Within Ten Years |
After Ten Years |
Total | |||||||||||||||
| (dollars in thousands) | ||||||||||||||||||||
| U.S. Treasury and U.S. government agencies |
||||||||||||||||||||
| Amount |
$ | — | $ | 16,440 | $ | 17,113 | $ | — | $ | 33,553 | ||||||||||
| Yield |
— | % | 1.92 | % | 2.00 | % | — | % | 1.96 | % | ||||||||||
| Mortgage-backed securities, residential |
||||||||||||||||||||
| Amount |
— | 2 | 275 | 38,429 | 38,706 | |||||||||||||||
| Yield |
— | % | 2.15 | % | 5.04 | % | 2.67 | % | 2.69 | % | ||||||||||
| Mortgage-backed securities, multifamily |
||||||||||||||||||||
| Amount |
— | 1,180 | — | 879 | 2,059 | |||||||||||||||
| Yield |
— | % | 1.83 | % | — | % | 2.36 | % | 2.06 | % | ||||||||||
| Obligations of states and political subdivisions |
||||||||||||||||||||
| Amount |
36,942 | 12,483 | 17,324 | 4,535 | 71,284 | |||||||||||||||
| Yield |
1.25 | % | 2.51 | % | 3.41 | % | 3.64 | % | 2.15 | % | ||||||||||
| Debt securities |
||||||||||||||||||||
| Amount |
— | 1,012 | 1,000 | — | 2,012 | |||||||||||||||
| Yield |
— | % | 5.76 | % | 5.95 | % | — | % | 5.85 | % | ||||||||||
|
|
|
|
|
|
|
|
|
|
|
|||||||||||
| Total securities |
||||||||||||||||||||
| Amount |
$ | 36,942 | $ | 31,117 | $ | 35,712 | $ | 43,843 | $ | 147,614 | ||||||||||
| Yield |
1.25 | % | 2.28 | % | 2.82 | % | 2.76 | % | 2.30 | % | ||||||||||
|
|
|
|
|
|
|
|
|
|
|
|||||||||||
Other Assets
Other assets increased from $20.4 million at December 31, 2015 to $30.6 million at December 31, 2016 primarily due to a $1.9 million increase in swap assets, a $5.8 million increase in deferred taxes and a $2.0 million increase in accounts receivable.
Deposits
Total deposits increased from $3.00 billion at December 31, 2015 to $4.09 billion at December 31, 2016, an increase of $1.10 billion, or 37%. Pascack’s and Harmony’s deposits totaled $304.5 million and $278.1 million respectively, at the time of acquisition. Noninterest-bearing deposits increased $233.5 million, or 34%, to $927.3 million. Excluding $108.1 million in Pascack and Harmony demand deposits, noninterest-bearing demand deposits have increased by $125.4 million, or 18%, from year-end 2015. Savings and interest-bearing transaction accounts and time deposits increased $662.1 million and $201.6 million, respectively. Excluding $337.6 million and $136.8 million, respectively, in Pascack and Harmony deposits, savings and interest-bearing transaction accounts and time deposits increased $324.5 million, or 17%, and $64.8 million or 19%, respectively.
Total deposits increased from $2.79 billion on December 31, 2014 to $3.00 billion on December 31, 2015, an increase of $204.8 million, or 7%.
-43-
Table of Contents
The average amount of deposits and the average rates paid on deposits for the years indicated are summarized in the following table:
| Year Ended December 31, 2016 |
Year Ended December 31, 2015 |
Year Ended December 31, 2014 |
||||||||||||||||||||||
| Average Balance |
Average Rate |
Average Balance |
Average Rate |
Average Balance |
Average Rate |
|||||||||||||||||||
| (dollars in thousands) | ||||||||||||||||||||||||
| Noninterest-bearing demand deposits |
$ | 852,629 | — | % | $ | 695,630 | — | % | $ | 652,685 | — | % | ||||||||||||
| Interest-bearing transaction accounts |
1,880,391 | 0.33 | % | 1,511,954 | 0.24 | % | 1,454,967 | 0.23 | % | |||||||||||||||
| Savings |
485,004 | 0.06 | % | 399,431 | 0.05 | % | 384,715 | 0.05 | % | |||||||||||||||
| Time deposits |
506,487 | 0.80 | % | 303,682 | 0.62 | % | 283,905 | 0.53 | % | |||||||||||||||
|
|
|
|
|
|
|
|
|
|
|
|
|
|||||||||||||
| Total |
$ | 3,724,511 | 0.28 | % | $ | 2,910,697 | 0.20 | % | $ | 2,776,272 | 0.18 | % | ||||||||||||
|
|
|
|
|
|
|
|
|
|
|
|
|
|||||||||||||
As of December 31, 2016, the aggregate amount of outstanding time deposits issued in amounts of $100,000 or more, broken down by time remaining to maturity, was as follows (in thousands):
| Maturity |
||||
| Within 3 months |
$ | 76,415 | ||
| Over 3 through 6 months |
62,987 | |||
| Over 6 through 12 months |
86,981 | |||
| Over 12 months |
103,311 | |||
|
|
|
|||
| Total |
$ | 329,694 | ||
|
|
|
|||
Derivatives
Lakeland enters into interest rate swaps (“swaps”) with loan customers to provide a facility to mitigate the fluctuations in the variable rate on the respective loans. These swaps are matched in offsetting terms to swaps that Lakeland enters into with an outside third party. The swaps are reported at fair value in other assets or other liabilities. Lakeland’s swaps qualify as derivatives, but are not designated as hedging instruments; thus any net gain or loss resulting from changes in the fair value is recognized in other noninterest income.
In 2016, the Company entered into two cash flow hedges in order to hedge the variable cash outflows associated with its subordinated debentures. The notional value of these hedges was $30.0 million. The Company’s objectives in using the cash flow hedge is to add stability to interest expense and to manage its exposure to interest rate movements. The Company used interest rate swaps designated as cash flow hedges which involved the receipt of variable amounts from a counterparty in exchange for the Company making fixed-rate payments over the life of the agreements without exchange of the underlying notional amount. In these particular hedges the Company is paying a third party an average of 1.10% in exchange for a payment at 3 month LIBOR over a five year period. The effective portion of changes in the fair value of derivatives designated and that qualify as cash flow hedges are recorded in accumulated other comprehensive income and are subsequently reclassified into earnings in the period that the hedged forecasted transaction affects earnings. During 2016, the Company did not record any hedge ineffectiveness.
Further discussion of Lakeland’s financial derivatives is set forth in Note 18 to the audited Consolidated Financial Statements.
Liquidity
“Liquidity” measures whether an entity has sufficient cash flow to meet its financial obligations and commitments on a timely basis. The Company is liquid when its subsidiary bank has the cash available to meet the borrowing and cash withdrawal requirements of customers and the Company can pay for current and planned expenditures and satisfy its debt obligations.
-44-
Table of Contents
Lakeland funds loan demand and operation expenses from several sources:
| • | Net income. Cash provided by operating activities was $50.1 million in 2016 compared to $40.8 million and $45.6 million in 2015 and 2014, respectively. |
| • | Deposits. Lakeland can offer new products or change its rate structure in order to increase deposits. In 2016, Lakeland generated $514.7 million in deposit growth, excluding the impact of Harmony and Pascack deposits, compared to $204.8 million in 2015. |
| • | Sales of securities and overnight funds. At year-end 2016, the Company had $606.7 million in securities designated “available for sale.” Of these securities, $387.0 million was pledged to secure public deposits and for other purposes required by applicable laws and regulations. |
| • | Repayments on loans and leases can also be a source of liquidity to fund further loan growth. |
| • | Overnight credit lines. As a member of the Federal Home Loan Bank of New York (“FHLB”), Lakeland has the ability to borrow overnight based on the market value of collateral pledged. Lakeland had no overnight borrowings from the FHLB on December 31, 2016. Lakeland also has overnight federal funds lines available for it to borrow up to $192.0 million. Lakeland had borrowings against these lines of $32.0 million at December 31, 2016. Lakeland also has the ability to utilize a line of credit from the FHLB to secure a portion of its public deposits. Lakeland may also borrow from the discount window of the Federal Reserve Bank of New York based on the market value of collateral pledged. Lakeland had no borrowings with the Federal Reserve Bank of New York as of December 31, 2016. |
| • | Other borrowings. Lakeland can also generate funds by utilizing long-term debt or securities sold under agreements to repurchase that would be collateralized by security or mortgage collateral. At times the market values of securities collateralizing our securities sold under agreements to repurchase may decline due to changes in interest rates and may necessitate our lenders to issue a “margin call” which requires the Company to pledge additional collateral to meet that margin call. For more information regarding the Company’s borrowings, see Note 8 to the Consolidated Financial Statements. |
Management and the Board monitor the Company’s liquidity through the Asset/Liability Committee, which monitors the Company’s compliance with certain regulatory ratios and other various liquidity guidelines.
The cash flow statements for the periods presented provide an indication of the Company’s sources and uses of cash, as well as an indication of the ability of the Company to maintain an adequate level of liquidity. A discussion of the cash flow statement for year ended December 31, 2016 follows.
Cash and cash equivalents totaling $175.8 million on December 31, 2016, increased $57.3 million from December 31, 2015. Operating activities provided $50.1 million in net cash. Investing activities used $442.8 million in net cash, primarily reflecting an increase in loans and leases and available for sale securities. Financing activities provided $450.0 million in net cash primarily reflecting a net increase in deposits of $515.4 million, $73.5 million in net proceeds from the issuance of subordinated debt and $48.7 million in net proceeds from the issuance of common stock, partially offset by declines in federal funds purchased and securities sold under agreements to repurchase of $94.9 million and net repayments of other borrowings of $76.9 million.
The Company’s management believes that its current level of liquidity is sufficient to meet its current and anticipated operational needs, including current loan commitments, deposit maturities and other obligations. This constitutes a forward-looking statement under the Private Securities Litigation Reform Act of 1995. Actual results could differ materially from anticipated results due to a variety of factors, including uncertainties relating to general economic conditions; unanticipated decreases in deposits; changes in or failure to comply with governmental regulations; and uncertainties relating to the analysis of the Company’s assessment of rate sensitive assets and rate sensitive liabilities and the extent to which market factors indicate that a financial institution such as Lakeland should match such assets and liabilities.
-45-
Table of Contents
Off Balance Sheet Arrangements and Aggregate Contractual Obligations
The following table sets forth contractual obligations and other commitments representing required cash outflows as of December 31, 2016. Interest on subordinated debentures and other borrowings is calculated based on current contractual interest rates.
| Payment Due Period | ||||||||||||||||||||
| Total | Within One Year |
After One but Within Three Years |
After Three but Within Five Years |
After Five Years |
||||||||||||||||
| (in thousands) | ||||||||||||||||||||
| Minimum annual rentals or noncancellable operating leases |
$ | 31,979 | $ | 3,179 | $ | 5,969 | $ | 5,130 | $ | 17,701 | ||||||||||
| Benefit plan commitments |
6,247 | 328 | 793 | 793 | 4,333 | |||||||||||||||
| Remaining contractual maturities of time deposits |
544,908 | 356,419 | 150,046 | 38,443 | — | |||||||||||||||
| Subordinated debentures |
104,784 | — | — | — | 104,784 | |||||||||||||||
| Loan commitments and lines of credit |
921,979 | 646,053 | 128,374 | 12,691 | 134,861 | |||||||||||||||
| Other borrowings |
260,866 | 115,039 | 130,826 | 5,001 | 10,000 | |||||||||||||||
| Interest on other borrowings (1) |
65,574 | 9,560 | 12,523 | 10,968 | 32,523 | |||||||||||||||
| Standby letters of credit |
15,170 | 14,577 | 481 | 32 | 80 | |||||||||||||||
|
|
|
|
|
|
|
|
|
|
|
|||||||||||
| Total |
$ | 1,951,507 | $ | 1,145,155 | $ | 429,012 | $ | 73,058 | $ | 304,282 | ||||||||||
|
|
|
|
|
|
|
|
|
|
|
|||||||||||
| (1) | Includes interest on other borrowings and subordinated debentures at a weighted rate of 2.80%. |
Interest Rate Risk
Closely related to the concept of liquidity is the concept of interest rate sensitivity (i.e., the extent to which assets and liabilities are sensitive to changes in interest rates). As a financial institution, the Company’s potential interest rate volatility is a primary component of its market risk. Fluctuations in interest rates will ultimately impact the level of income and expense recorded on a large portion of the Company’s assets and liabilities, and the market value of all interest-earning assets, other than those which possess a short term to maturity. Based upon the Company’s nature of operations, the Company is not subject to foreign currency exchange or commodity price risk. The Company does not own any trading assets.
The Company’s net income is largely dependent on net interest income. Net interest income is susceptible to interest rate risk to the extent that interest-bearing liabilities mature or reprice on a different basis than interest-earning assets. For example, when interest-bearing liabilities mature or reprice more quickly than interest-earning assets, an increase in market rates could adversely affect net interest income. Conversely, when interest-earning assets reprice more quickly than interest-bearing liabilities, an increase in market rates could increase net interest income.
The Company’s Board of Directors has adopted an Asset/Liability Policy designed to stabilize net interest income and preserve capital over a broad range of interest rate movements. This policy outlines guidelines and ratios dealing with, among others, liquidity, volatile liability dependence, investment portfolio composition, loan portfolio composition, loan-to-deposit ratio and gap analysis ratio. Key quantitative measurements include the percentage change of net interest income in various interest rate scenarios (net interest income at risk) and changes in the market value of equity in various rate environments (net portfolio value at risk). The Company’s performance as compared to the Asset/Liability Policy is monitored by its Board of Directors. In addition, to effectively administer the Asset/Liability Policy and to monitor exposure to fluctuations in interest rates, the Company maintains an Asset/Liability Committee (the “ALCO”), consisting of the Chief Executive Officer, the Regional Presidents, the Chief Financial Officer, Chief Revenue Officer, Chief Lending Officer, Chief Retail
-46-
Table of Contents
Officer, Chief Credit Officer, Chief Risk Officer, Chief Accounting Officer, certain other senior officers and certain directors. This committee meets quarterly to review the Company’s financial results and to develop strategies to implement the Asset/Liability Policy and to respond to market conditions.
The Company monitors and controls interest rate risk through a variety of techniques, including use of an interest rate risk management model. With the interest rate risk management model, the Company projects future net interest income, and then estimates the effect of various changes in interest rates and balance sheet growth rates on that projected net interest income. The Company also uses the interest rate risk management model to calculate the change in net portfolio value over a range of interest rate change scenarios.
Interest rate sensitivity modeling is done at a specific point in time and involves a variety of significant estimates and assumptions. Interest rate sensitivity modeling requires, among other things, estimates of how much and when yields and costs on individual categories of interest-earning assets and interest-bearing liabilities will respond to general changes in market rates, future cash flows and discount rates.
Net interest income simulation considers the relative sensitivities of the balance sheet including the effects of interest rate caps on adjustable rate mortgages and the relatively stable aspects of core deposits. As such, net interest income simulation is designed to address the probability of interest rate changes and the behavioral response of the balance sheet to those changes. Market Value of Portfolio Equity represents the fair value of the net present value of assets, liabilities and off-balance-sheet items. Changes in estimates and assumptions made for interest rate sensitivity modeling could have a significant impact on projected results and conclusions. These assumptions could include prepayment rates, sensitivity of non-maturity deposits, decay rates and other similar assumptions. Therefore, if our assumptions should change, this technique may not accurately reflect the impact of general interest rate movements on the Company’s net interest income or net portfolio value.
Management tries to ensure the accuracy of its model by back testing its results (comparing predicted results in past models with current data). It periodically reviews its prepayment assumptions, decay rates and other assumptions.
The starting point (or “base case”) for the following table is an estimate of the following year’s net interest income assuming that both interest rates and the Company’s interest-sensitive assets and liabilities remain at year-end levels. The net interest income estimated for 2016 (the base case) is $155.6 million. The information provided for net interest income assumes that changes in interest rates change gradually in equal increments (“rate ramp”) over the twelve month period.
| Changes in Interest Rates | ||||||||
| Rate Ramp |
+200 bp | -200 bp | ||||||
| Asset/Liability policy limit |
-5.0 | % | -5.0 | % | ||||
| December 31, 2016 |
-0.5 | % | -2.4 | % | ||||
| December 31, 2015 |
-1.4 | % | -1.6 | % | ||||
The ALCO’s policy review of interest rate risk includes policy limits for net interest income changes in various “rate shock” scenarios. Rate shocks assume that current interest rates change immediately. The information provided for net interest income assumes fluctuations or “rate shocks” for changes in interest rates as shown in the table below.
| Changes in Interest Rates | ||||||||||||||||
| Rate Shock |
+300 bp | +200 bp | +100 bp | -100 bp | ||||||||||||
| Asset/Liability policy limit |
-15.0 | % | -10.0 | % | -5.0 | % | -5.0 | % | ||||||||
| December 31, 2016 |
1.9 | % | 1.4 | % | 0.9 | % | -4.8 | % | ||||||||
| December 31, 2015 |
1.7 | % | 1.3 | % | 0.8 | % | -4.5 | % | ||||||||
-47-
Table of Contents
The base case for the following table is an estimate of the Company’s net portfolio value for the periods presented using current discount rates, and assuming the Company’s interest-sensitive assets and liabilities remain at year-end levels. The net portfolio value at December 31, 2016 (the base case) was $721.3 million. The information provided for the net portfolio value assumes fluctuations or rate shocks for changes in interest rates as shown in the table below.
| Changes in Interest Rates | ||||||||||||||||
| Rate Shock |
+300 bp | +200 bp | +100 bp | -100 bp | ||||||||||||
| Asset/Liability policy limit |
-25.0 | % | -20.0 | % | -10.0 | % | -10.0 | % | ||||||||
| December 31, 2016 |
-7.5 | % | -4.9 | % | -2.2 | % | 0.4 | % | ||||||||
| December 31, 2015 |
-10.2 | % | -6.5 | % | -2.9 | % | 0.3 | % | ||||||||
The information set forth above is based on significant estimates and assumptions, and constitutes a forward-looking statement under the Private Securities Litigation Reform Act of 1995.
The information in the above tables represent the policy scenario that the ALCO reviews on a quarterly basis. There are also other scenarios run that the ALCO examines that vary depending on the economic environment. These scenarios include a yield curve flattening scenario and scenarios that show more dramatic changes in rates. The committee uses the appropriate scenarios, depending on the economic environment, in its interest rate management decisions.
Certain shortcomings are inherent in the methodologies used in the above interest rate risk measurements. Modeling changes in net interest income requires the making of certain assumptions regarding prepayment and deposit decay rates, which may or may not reflect the manner in which actual yields and costs respond to changes in market interest rates. While management believes such assumptions are reasonable, there can be no assurance that assumed prepayment rates and decay rates will approximate actual future loan prepayment and deposit withdrawal activity. Moreover, the net interest income table presented assumes that the composition of interest sensitive assets and liabilities existing at the beginning of a period remains constant over the period being measured and also assumes that a particular change in interest rates is reflected uniformly across the yield curve regardless of the duration to maturity or repricing of specific assets and liabilities. Accordingly, although the net interest income table provides an indication of the Company’s interest rate risk exposure at a particular point in time, such measurement is not intended to and does not provide a precise forecast of the effect of changes in market interest rates on net interest income and will differ from actual results.
Capital Resources
Stockholders’ equity increased from $400.5 million on December 31, 2015 to $550.0 million on December 31, 2016. The increase in stockholders’ equity from December 31, 2015 to December 31, 2016 was primarily due to the issuance of $37.2 million of common stock for the acquisition of Pascack, the issuance of $36.7 million of common stock for the acquisition of Harmony, the issuance of $48.7 million of common stock in a capital raise and $41.5 million of net income, partially offset by the payment of cash dividends on common stock of $16.0 million.
Book value per common share (total common stockholders’ equity divided by the number of shares outstanding) increased from $10.57 on December 31, 2015 to $11.65 on December 31, 2016, primarily as a result of net income. Book value per common share was $10.01 on December 31, 2014. Tangible book value per share increased from $7.62 on December 31, 2015 to $8.70 on December 31, 2016. For more information see “Non-GAAP Financial Measures.”
The Company and Lakeland are subject to various regulatory capital requirements that are monitored by federal banking agencies. Failure to meet minimum capital requirements can lead to certain supervisory actions by regulators; any supervisory action could have a direct material adverse effect on the Company or Lakeland’s
-48-
Table of Contents
financial statements. As of December 31, 2016, the Company and Lakeland met all capital adequacy requirements to which they are subject.
The final rules implementing the Basel Committee on Banking Supervision’s (“BCBS”) capital guidelines for U.S. banks became effective for the Company on January 1, 2015, with full compliance with all of the final rule’s requirements phased in over a multi-year schedule, to be fully phased-in by January 1, 2019. As of December 31, 2016, the Company’s capital levels remained characterized as “well-capitalized” under the new rules.
On September 30, 2016, the Company completed an offering of $75.0 million fixed to floating rate subordinated notes due September 30, 2026. The notes bear interest at a rate of 5.125% per annum until September 30, 2021 and will then reset quarterly to the then current three-month LIBOR rate plus 397 basis points until maturity in September 2026 or their earlier redemption. The debt is included in Tier 2 capital for Lakeland Bancorp, Inc. On September 30, 2016, the Company contributed $69.9 million to Lakeland Bank’s capital, increasing the Bank’s capital ratios.
On December 14, 2016, the Company successfully completed an at-the-market common stock issuance. A total of 2,739,650 shares of the Company’s common stock were sold at a weighted average price of $18.25, representing gross proceeds to the Company of approximately $50.0 million. Net proceeds from the transaction, after the sales commission and other expenses, were approximately $48.7 million. The Company contributed $48.5 million to Lakeland Bank.
The following table reflects capital ratios of the Company and Lakeland as of December 31, 2016 and 2015:
| Tier 1 Capital to Total Average Assets Ratio December 31, |
Common EquityTier 1 to Risk-Weighted Assets Ratio December 31, |
Tier 1 Capital to Risk-Weighted |
Total Capital to Risk-Weighted |
|||||||||||||||||||||||||||||
| Capital Ratios |
2016 | 2015 | 2016 | 2015 | 2016 | 2015 | 2016 | 2015 | ||||||||||||||||||||||||
| The Company |
9.07 | % | 8.70 | % | 10.11 | % | 9.54 | % | 10.85 | % | 10.53 | % | 13.48 | % | 11.61 | % | ||||||||||||||||
| Lakeland Bank |
10.21 | % | 8.08 | % | 12.21 | % | 9.78 | % | 12.21 | % | 9.78 | % | 13.03 | % | 10.87 | % | ||||||||||||||||
| Required capital ratios including conservation buffer |
4.00 | % | 4.00 | % | 5.125 | % | 4.50 | % | 6.625 | % | 6.00 | % | 8.625 | % | 8.00 | % | ||||||||||||||||
| “Well capitalized” institution under FDIC regulations |
5.00 | % | 5.00 | % | 6.50 | % | 6.50 | % | 8.00 | % | 8.00 | % | 10.00 | % | 10.00 | % | ||||||||||||||||
Non-GAAP Financial Measures
| December 31, | ||||||||||||||||||||
| Calculation of Tangible Book Value Per Common Share |
2016 | 2015 | 2014 | 2013 | 2012 | |||||||||||||||
| (dollars in thousands) | ||||||||||||||||||||
| Total common stockholders’ equity at end of period - GAAP |
$ | 550,044 | $ | 400,516 | $ | 379,438 | $ | 351,424 | $ | 280,867 | ||||||||||
| Less: |
||||||||||||||||||||
| Goodwill |
135,747 | 109,974 | 109,974 | 109,974 | 87,111 | |||||||||||||||
| Other identifiable intangible assets, net |
3,344 | 1,545 | 1,960 | 2,424 | — | |||||||||||||||
|
|
|
|
|
|
|
|
|
|
|
|||||||||||
| Total tangible common stockholders’ equity at end of period - Non-GAAP |
$ | 410,953 | $ | 288,997 | $ | 267,504 | $ | 239,026 | $ | 193,756 | ||||||||||
|
|
|
|
|
|
|
|
|
|
|
|||||||||||
| Shares outstanding at end of period (1) |
47,223 | 37,906 | 37,911 | 37,874 | 31,212 | |||||||||||||||
|
|
|
|
|
|
|
|
|
|
|
|||||||||||
| Book value per share - GAAP (1) |
$ | 11.65 | $ | 10.57 | $ | 10.01 | $ | 9.28 | $ | 9.00 | ||||||||||
|
|
|
|
|
|
|
|
|
|
|
|||||||||||
| Tangible book value per share - Non-GAAP (1) |
$ | 8.70 | $ | 7.62 | $ | 7.06 | $ | 6.31 | $ | 6.21 | ||||||||||
|
|
|
|
|
|
|
|
|
|
|
|||||||||||
-49-
Table of Contents
| (1) | Adjusted for 5% stock dividends in 2014 and 2012. |
| Calculation of Tangible Common Equity to Tangible Assets |
December 31, | |||||||||||||||||||
| 2016 | 2015 | 2014 | 2013 | 2012 | ||||||||||||||||
| (dollars in thousands) | ||||||||||||||||||||
| Total tangible common stockholders’ equity at end of period - Non-GAAP |
$ | 410,953 | $ | 288,997 | $ | 267,504 | $ | 239,026 | $ | 193,756 | ||||||||||
|
|
|
|
|
|
|
|
|
|
|
|||||||||||
| Total assets at end of period - GAAP |
$ | 5,093,131 | $ | 3,869,550 | $ | 3,538,325 | $ | 3,317,791 | $ | 2,918,703 | ||||||||||
| Less: |
||||||||||||||||||||
| Goodwill |
135,747 | 109,974 | 109,974 | 109,974 | 87,111 | |||||||||||||||
| Other identifiable intangible assets, net |
3,344 | 1,545 | 1,960 | 2,424 | — | |||||||||||||||
|
|
|
|
|
|
|
|
|
|
|
|||||||||||
| Total tangible assets at end of period - Non-GAAP |
$ | 4,954,040 | $ | 3,758,031 | $ | 3,426,391 | $ | 3,205,393 | $ | 2,831,592 | ||||||||||
|
|
|
|
|
|
|
|
|
|
|
|||||||||||
| Common equity to assets - GAAP |
10.80 | % | 10.35 | % | 10.72 | % | 10.59 | % | 9.62 | % | ||||||||||
|
|
|
|
|
|
|
|
|
|
|
|||||||||||
| Tangible common equity to tangible assets - Non-GAAP |
8.30 | % | 7.69 | % | 7.81 | % | 7.46 | % | 6.84 | % | ||||||||||
|
|
|
|
|
|
|
|
|
|
|
|||||||||||
| Calculation of Return on Average Tangible Common Equity |
For the Years Ended December 31, | |||||||||||||||||||
| 2016 | 2015 | 2014 | 2013 | 2012 | ||||||||||||||||
| (dollars in thousands) | ||||||||||||||||||||
| Net income - GAAP |
$ | 41,518 | $ | 32,481 | $ | 31,129 | $ | 24,969 | $ | 21,742 | ||||||||||
|
|
|
|
|
|
|
|
|
|
|
|||||||||||
| Total average common stockholders’ equity - GAAP |
$ | 474,540 | $ | 392,221 | $ | 367,210 | $ | 320,923 | $ | 256,364 | ||||||||||
| Less: |
||||||||||||||||||||
| Average goodwill |
130,689 | 109,974 | 109,974 | 100,753 | 87,111 | |||||||||||||||
| Average other identifiable intangible assets, net |
3,225 | 1,759 | 2,200 | 1,513 | — | |||||||||||||||
|
|
|
|
|
|
|
|
|
|
|
|||||||||||
| Total average tangible common stockholders’ equity - Non-GAAP |
$ | 340,626 | $ | 280,488 | $ | 255,036 | $ | 218,657 | $ | 169,253 | ||||||||||
|
|
|
|
|
|
|
|
|
|
|
|||||||||||
| Return on average common stockholders’ equity - GAAP |
8.75 | % | 8.28 | % | 8.48 | % | 7.78 | % | 8.48 | % | ||||||||||
|
|
|
|
|
|
|
|
|
|
|
|||||||||||
| Return on average tangible common stockholders’ equity - Non-GAAP |
12.19 | % | 11.58 | % | 12.21 | % | 11.42 | % | 12.85 | % | ||||||||||
|
|
|
|
|
|
|
|
|
|
|
|||||||||||
-50-
Table of Contents
| For the Years Ended December 31, | ||||||||
| Reconciliation of Earnings Per Share |
2016 | 2015 | ||||||
| (in thousands, except per share amounts) | ||||||||
| Net income - GAAP |
$ | 41,518 | $ | 32,481 | ||||
| Non-routine transactions, net of tax |
||||||||
| Debt prepayment charges |
— | 1,424 | ||||||
| Gain on debt extinguishment |
— | (1,082 | ) | |||||
| Associated gain on sale of investment securities |
— | (102 | ) | |||||
| Tax deductible merger related expenses |
1,915 | 150 | ||||||
| Non tax deductible merger related expenses |
866 | 889 | ||||||
|
|
|
|
|
|||||
| Net effect of non-routine transactions |
$ | 2,781 | $ | 1,279 | ||||
|
|
|
|
|
|||||
| Net income available to common shareholders excluding non-routine transactions |
$ | 44,299 | 33,760 | |||||
| Less: earnings allocated to participating securities |
(396 | ) | (263 | ) | ||||
|
|
|
|
|
|||||
| $ | 43,903 | $ | 33,497 | |||||
| Weighted average shares - Basic |
42,912 | 37,843 | ||||||
| Weighted average shares - Diluted |
43,114 | 37,993 | ||||||
| Basic earnings per share, GAAP |
$ | 0.96 | $ | 0.85 | ||||
| Diluted earnings per share, GAAP |
$ | 0.95 | $ | 0.85 | ||||
|
|
|
|
|
|||||
| Basic earnings per share, adjusted for non-routine transactions |
$ | 1.02 | $ | 0.89 | ||||
| Diluted earnings per share, adjusted for non-routine transactions |
$ | 1.02 | $ | 0.88 | ||||
|
|
|
|
|
|||||
-51-
Table of Contents
Quarterly Financial Data
The following represents summarized quarterly financial data of the Company, which in the opinion of management reflected all adjustments, consisting only of non-recurring adjustments, necessary for a fair presentation of the Company’s results of operations.
| Quarter Ended | ||||||||||||||||
| March 31, | June 30, | September 30, | December 31, | |||||||||||||
| 2016 | 2016 | 2016 | 2016 | |||||||||||||
| (in thousands, except per share amounts) | ||||||||||||||||
| Total interest income |
$ | 37,571 | $ | 39,037 | $ | 43,005 | $ | 43,683 | ||||||||
| Total interest expense |
3,721 | 3,935 | 4,487 | 5,504 | ||||||||||||
|
|
|
|
|
|
|
|
|
|||||||||
| Net interest income |
33,850 | 35,102 | 38,518 | 38,179 | ||||||||||||
| Provision for loan and lease losses |
1,075 | 1,010 | 1,763 | 375 | ||||||||||||
| Noninterest income (excluding investment securities gains) |
4,497 | 4,885 | 6,417 | 5,161 | ||||||||||||
| Gains on investment securities, net |
370 | — | — | — | ||||||||||||
| Merger related expenses |
1,721 | 685 | 1,697 | — | ||||||||||||
| Core deposit intangible amortization |
167 | 164 | 201 | 202 | ||||||||||||
| Noninterest expense |
23,536 | 22,866 | 24,108 | 24,570 | ||||||||||||
|
|
|
|
|
|
|
|
|
|||||||||
| Income before taxes |
12,218 | 15,262 | 17,166 | 18,193 | ||||||||||||
| Income taxes |
4,110 | 5,132 | 5,839 | 6,240 | ||||||||||||
|
|
|
|
|
|
|
|
|
|||||||||
| Net income |
$ | 8,108 | $ | 10,130 | $ | 11,327 | $ | 11,953 | ||||||||
|
|
|
|
|
|
|
|
|
|||||||||
| Earnings per share of common stock |
||||||||||||||||
| Basic |
$ | 0.20 | $ | 0.24 | $ | 0.25 | $ | 0.26 | ||||||||
| Diluted |
$ | 0.20 | $ | 0.24 | $ | 0.25 | $ | 0.26 | ||||||||
| Quarter Ended | ||||||||||||||||
| March 31, | June 30, | September 30, | December 31, | |||||||||||||
| 2015 | 2015 | 2015 | 2015 | |||||||||||||
| (in thousands, except per share amounts) | ||||||||||||||||
| Total interest income |
$ | 30,992 | $ | 31,308 | $ | 32,159 | $ | 33,055 | ||||||||
| Total interest expense |
2,474 | 2,639 | 2,825 | 2,936 | ||||||||||||
|
|
|
|
|
|
|
|
|
|||||||||
| Net interest income |
28,518 | 28,669 | 29,334 | 30,119 | ||||||||||||
| Provision for loan and lease losses |
870 | 800 | 332 | — | ||||||||||||
| Noninterest income (excluding investment securities gains) |
4,738 | 4,941 | 4,684 | 4,826 | ||||||||||||
| Gains on investment securities, net |
— | 17 | 173 | 51 | ||||||||||||
| Gain on debt extinguishment |
— | — | 1,830 | — | ||||||||||||
| Long term debt prepayment fee |
— | — | 2,407 | — | ||||||||||||
| Merger related expenses |
— | — | 330 | 822 | ||||||||||||
| Core deposit intangible amortization |
111 | 107 | 98 | 99 | ||||||||||||
| Noninterest expense |
19,931 | 21,028 | 20,997 | 21,320 | ||||||||||||
|
|
|
|
|
|
|
|
|
|||||||||
| Income before taxes |
12,344 | 11,692 | 11,857 | 12,755 | ||||||||||||
| Income taxes |
4,014 | 3,830 | 4,032 | 4,291 | ||||||||||||
|
|
|
|
|
|
|
|
|
|||||||||
| Net income |
$ | 8,330 | $ | 7,862 | $ | 7,825 | $ | 8,464 | ||||||||
|
|
|
|
|
|
|
|
|
|||||||||
| Earnings per share of common stock |
||||||||||||||||
| Basic |
$ | 0.22 | $ | 0.21 | $ | 0.20 | $ | 0.22 | ||||||||
| Diluted |
$ | 0.22 | $ | 0.21 | $ | 0.20 | $ | 0.22 | ||||||||
-52-
Table of Contents
Recent Accounting Pronouncements
In January 2017, the Financial Accounting Standards Board (“FASB”) issued an update to simplify the test for goodwill impairment. This amendment eliminates Step 2 from the goodwill impairment test. The annual, or interim, goodwill impairment test is performed by comparing the fair value of a reporting unit with its carrying amount. An impairment charge should be recognized for the amount by which the carrying amount exceeds the reporting unit’s fair value. This update will be effective for the Company’s financial statements for fiscal years beginning after December 15, 2019. The adoption of this update is not expected to have a material impact on the Company’s financial statements.
In January 2017, the FASB issued an update that clarifies the definition of a business as it pertains to business combinations. This amendment affects all companies and other reporting organizations that must determine whether they have sold or acquired a business. This update will be effective for the Company’s financial statements for fiscal years beginning after December 15, 2017. The adoption of this update is not expected to have a material impact on the Company’s financial statements.
In September 2016, the FASB issued an accounting standards update to address diversity in presentation in how certain cash receipts and cash payments are presented and classified in the statement of cash flows. This update will be effective for financial statements issued for fiscal years and interim periods beginning after December 15, 2017. The adoption of this update is not expected to have a material impact on the Company’s financial statements.
In June 2016, the FASB issued an accounting standards update pertaining to the measurement of credit losses on financial instruments. This update requires the measurement of all expected credit losses for financial instruments held at the reporting date based on historical experience, current conditions, and reasonable and supportable financials. Financial institutions and other organizations will now use forward-looking information to better inform their credit loss estimates. This update is intended to improve financial reporting by requiring timelier recording of credit losses on loans and other financial instruments held by financial institutions and other organizations. This update will be effective for financial statements issued for fiscal years and interim periods beginning after December 15, 2019. The Company is currently assessing the impact that the guidance will have on the Company’s consolidated financial statements.
In March 2016, the FASB issued an accounting standards update to simplify employee share-based payment accounting. The areas for simplification in this update involve several aspects of the accounting for employee share-based payment transactions, including the income tax consequences, classification of awards as either equity or liabilities, and classification on the statement of cash flows. This update will be effective for financial statements issued for fiscal years and interim periods beginning after December 15, 2016. The adoption of this update is not expected to have a material impact on the Company’s financial statements.
In March 2016, the FASB issued an accounting standards update that requires that embedded derivatives be separated from the host contract and accounted for separately as derivatives if certain criteria are met, including the “clearly and closely related” criterion. The amendments in this update clarify the requirements for assessing whether contingent call or put options that can accelerate the payment of principal on debt instruments are clearly and closely related to their debt hosts. This update will be effective for financial statements issued for fiscal years and interim periods beginning after December 15, 2016. This guidance will be applied on a modified retrospective basis as of the beginning of the fiscal year that the amendment is effective. The adoption of this update is not expected to have a material impact on the Company’s financial statements.
In February 2016, FASB issued accounting guidance that requires all lessees to recognize a lease liability and a right-of-use asset, measured at the present value of the future minimum lease payments, at the lease commencement date. Lessor accounting remains largely unchanged under the new guidance. The guidance is effective for fiscal years beginning after December 15, 2018, including interim reporting periods within that reporting period, with early adoption permitted. A modified retrospective approach must be applied for leases existing at, or entered into after, the beginning of the earliest comparative period presented in the financial
-53-
Table of Contents
statements. The Company is currently assessing the impact of the new guidance on its Consolidated Financial Statements. The Company expects to recognize a right-of-use asset and a lease liability for its operating lease commitments. Please refer to Note 14 for the Company’s commitments under operating lease obligations.
In January 2016, the FASB issued an accounting standards update intended to improve the recognition and measurement of financial instruments. Specifically, the accounting standards update requires all equity instruments, with the exception of those that are accounted for under the equity method of accounting, to be measured at fair value with changes in the fair value recognized through net income. Additionally, public business entities are required to use the exit price notion when measuring the fair value of financial instruments for disclosure purposes. The amendments in this update also require an entity to present separately in other comprehensive income the portion of the total change in the fair value of a liability resulting from a change in the instrument-specific credit risk when the entity has elected to measure the liability at fair value in accordance with the fair value option for financial instruments. This amendment is effective for fiscal years, and interim periods within those fiscal years, beginning after December 15, 2017. The adoption of this update is not expected to have a material impact on the Company’s financial statements.
In September 2015, the FASB issued an accounting standards update simplifying the accounting for adjustments made to provisional amounts recognized in a business combination, eliminating the requirement to retrospectively account for those adjustments. To simplify the accounting for adjustments made to provisional amounts, the amendments in the accounting standards update require that the acquirer recognize adjustments to provisional amounts that are identified during the measurement period in the reporting period in which the adjustment amount is determined. The acquirer is required to also record, in the same period’s financial statements, the effect on earnings of changes in depreciation, amortization, or other income effects, if any, as a result of the change to the provisional amounts, calculated as if the accounting had been completed at the acquisition date. In addition, an entity is required to present separately on the face of the income statement or disclose in the notes to the financial statements the portion of the amount recorded in current-period earnings by line item that would have been recorded in previous reporting periods if the adjustment to the provisional amounts had been recognized as of the acquisition date. This amendment is effective for fiscal years, and interim periods within those fiscal years, beginning after December 15, 2015. The adoption of this update did not have a material impact on the Company’s financial statements.
In May 2015, the FASB issued an accounting standards update clarifying how investments valued using the net asset value practical expedient within the fair value hierarchy should be classified. The accounting standards update was issued to address diversity in practice by exempting investments measured using the net asset value expedient from categorization in the fair value hierarchy. This accounting standards update is effective for fiscal years, and interim periods within those fiscal years, beginning after December 15, 2015. The adoption of this update did not have a material impact on the Company’s financial statements.
In April 2015, the FASB issued an accounting standards update requiring that debt issuance costs related to a recognized debt liability be presented in the balance sheet as a direct deduction from the carrying amount of the debt liability consistent with the presentation of debt discounts. The purpose of this update is to simplify the presentation of debt issuance costs and to align the U.S. GAAP presentation of debt more closely with international accounting standards. In August 2015, the FASB issued a subsequent update which discussed presentation and subsequent measurement of debt issuance costs associated with line-of-credit arrangements. These amendments are effective for fiscal years, and interim periods within those fiscal years, beginning after December 15, 2015. The adoption of these updates did not have a material impact on the Company’s financial statements.
In January 2015, the FASB issued an accounting standards update regarding the elimination of the concept of the extraordinary items from the statement of operations. The purpose of this update is to simplify the statement of operations presentation and to align the U.S. GAAP income statement more closely with international accounting standards. This update is effective for fiscal years, and interim periods within those fiscal years, beginning after December 15, 2015. The adoption of this update did not have a material impact on the Company’s financial statements.
-54-
Table of Contents
In May 2014, the FASB issued an accounting standards update that clarifies the principles for recognizing revenue. The core principle of the guidance is that an entity should recognize revenue to depict the transfer of promised goods or services to a customer in an amount that reflects the consideration to which the entity expects to be entitled in exchange for these goods or services. To achieve that core principle, an entity should apply the following steps: (i) identify the contract(s) with a customer; (ii) identify the performance obligations in the contract; (iii) determine the transaction price; (iv) allocate the transaction price to the performance obligations in the contract; and (v) recognize revenue when (or as) the entity satisfies a performance obligation. In 2016, the FASB issued further implementation guidance regarding revenue recognition. This additional guidance included clarification on certain principal versus agent considerations within the implementation of the guidance as well as clarification related to identifying performance obligations and licensing. The guidance along with its updates is effective for fiscal years, and interim periods within those fiscal years, beginning after December 15, 2017. The Company is still evaluating the potential impact on the Company’s financial statements. In evaluating this standard, management has determined that the majority of revenue earned by the Company is from revenue streams not included in the scope of this standard and therefore management does not expect the new revenue recognition guidance to have a material impact on its consolidated financial statements.
Effects of Inflation
The impact of inflation, as it affects banks, differs substantially from the impact on non-financial institutions. Banks have assets which are primarily monetary in nature and which tend to move with inflation. This is especially true for banks with a high percentage of rate sensitive interest-earning assets and interest-bearing liabilities. A bank can further reduce the impact of inflation with proper management of its rate sensitivity gap. This gap represents the difference between interest rate sensitive assets and interest rate sensitive liabilities. Lakeland attempts to structure its assets and liabilities and manages its gap to protect against substantial changes in interest rate scenarios, in order to minimize the potential effects of inflation.
Item 7A - Quantitative and Qualitative Disclosures About Market Risk.
See Item 7 - “Management’s Discussion and Analysis of Financial Condition and Results of Operations.”
-55-
Table of Contents
Item 8 - Financial Statements and Supplementary Data.
Report of Independent Registered Public Accounting Firm
The Board of Directors and Stockholders
Lakeland Bancorp, Inc.:
We have audited the accompanying consolidated balance sheets of Lakeland Bancorp, Inc. and Subsidiaries (the Company) as of December 31, 2016 and 2015, and the related consolidated statements of income, comprehensive income, changes in stockholders’ equity, and cash flows for each of the years in the three-year period ended December 31, 2016. These consolidated financial statements are the responsibility of the Company’s management. Our responsibility is to express an opinion on these consolidated financial statements based on our audits.
We conducted our audits in accordance with the auditing standards of the Public Company Accounting Oversight Board (United States). Those standards require that we plan and perform the audit to obtain reasonable assurance about whether the financial statements are free of material misstatement. An audit includes examining, on a test basis, evidence supporting the amounts and disclosures in the financial statements, assessing the accounting principles used and significant estimates made by management, as well as evaluating the overall financial statement presentation. We believe that our audits provide a reasonable basis for our opinion.
In our opinion, the consolidated financial statements referred to above present fairly, in all material respects, the financial position of Lakeland Bancorp, Inc. and Subsidiaries as of December 31, 2016 and 2015 and the results of their operations and their cash flows for each of the years in the three-year period ended December 31, 2016, in conformity with U.S. generally accepted accounting principles.
We also have audited, in accordance with the standards of the Public Company Accounting Oversight Board (United States), the Company’s internal control over financial reporting as of December 31, 2016, based on criteria established in Internal Control – Integrated Framework (2013) issued by the Committee of Sponsoring Organizations of the Treadway Commission (COSO), and our report dated March 15, 2017 expressed an unqualified opinion on the effectiveness of the Company’s internal control over financial reporting.
/s/ KPMG LLP
Short Hills, New Jersey
March 15, 2017
-56-
Table of Contents
Lakeland Bancorp, Inc. and Subsidiaries
CONSOLIDATED BALANCE SHEETS
| December 31, | ||||||||
| 2016 | 2015 | |||||||
| (dollars in thousands) | ||||||||
| ASSETS |
||||||||
| Cash |
$ | 169,149 | $ | 113,894 | ||||
| Interest-bearing deposits due from banks |
6,652 | 4,599 | ||||||
|
|
|
|
|
|||||
| Total cash and cash equivalents |
175,801 | 118,493 | ||||||
| Investment securities, available for sale, at fair value |
606,704 | 442,349 | ||||||
| Investment securities, held to maturity, at amortized cost with fair value of $146,990 in 2016 and $117,594 in 2015 |
147,614 | 116,740 | ||||||
| Federal Home Loan Bank and other membership stock, at cost |
15,099 | 14,087 | ||||||
| Loans, net of deferred fees |
3,870,598 | 2,965,200 | ||||||
| Less: allowance for loan and lease losses |
31,245 | 30,874 | ||||||
|
|
|
|
|
|||||
| Net loans |
3,839,353 | 2,934,326 | ||||||
| Loans held for sale |
1,742 | 1,233 | ||||||
| Premises and equipment - net |
52,236 | 35,881 | ||||||
| Accrued interest receivable |
12,557 | 9,208 | ||||||
| Goodwill |
135,747 | 109,974 | ||||||
| Other identifiable intangible assets |
3,344 | 1,545 | ||||||
| Bank owned life insurance |
72,384 | 65,361 | ||||||
| Other assets |
30,550 | 20,353 | ||||||
|
|
|
|
|
|||||
| TOTAL ASSETS |
$ | 5,093,131 | $ | 3,869,550 | ||||
|
|
|
|
|
|||||
| LIABILITIES AND STOCKHOLDERS’ EQUITY |
||||||||
| LIABILITIES: |
||||||||
| Deposits: |
||||||||
| Noninterest-bearing |
$ | 927,270 | $ | 693,741 | ||||
| Savings and interest-bearing transaction accounts |
2,620,657 | 1,958,510 | ||||||
| Time deposits through $250 thousand |
404,680 | 270,623 | ||||||
| Time deposits over $250 thousand |
140,228 | 72,698 | ||||||
|
|
|
|
|
|||||
| Total deposits |
4,092,835 | 2,995,572 | ||||||
| Federal funds purchased and securities sold under agreements to repurchase |
56,354 | 151,234 | ||||||
| Other borrowings |
260,866 | 271,905 | ||||||
| Subordinated debentures |
104,784 | 31,238 | ||||||
| Other liabilities |
28,248 | 19,085 | ||||||
|
|
|
|
|
|||||
| TOTAL LIABILITIES |
4,543,087 | 3,469,034 | ||||||
|
|
|
|
|
|||||
| STOCKHOLDERS’ EQUITY: |
||||||||
| Common stock, no par value; authorized 70,000,000 shares; issued shares, 47,222,914 at December 31, 2016 and 37,906,481 at December 31, 2015 |
510,861 | 386,287 | ||||||
| Retained earnings |
38,590 | 13,079 | ||||||
| Accumulated other comprehensive income |
593 | 1,150 | ||||||
|
|
|
|
|
|||||
| TOTAL STOCKHOLDERS’ EQUITY |
550,044 | 400,516 | ||||||
|
|
|
|
|
|||||
| TOTAL LIABILITIES AND STOCKHOLDERS’ EQUITY |
$ | 5,093,131 | $ | 3,869,550 | ||||
|
|
|
|
|
|||||
The accompanying notes are an integral part of these statements.
-57-
Table of Contents
Lakeland Bancorp, Inc. and Subsidiaries
CONSOLIDATED STATEMENTS OF INCOME
| Years Ended December 31, | ||||||||||||
| 2016 | 2015 | 2014 | ||||||||||
| (in thousands, except per share data) | ||||||||||||
| INTEREST INCOME |
||||||||||||
| Loans, leases and fees |
$ | 149,777 | $ | 115,295 | $ | 110,587 | ||||||
| Federal funds sold and interest-bearing deposits with banks |
569 | 62 | 71 | |||||||||
| Taxable investment securities and other |
11,163 | 10,563 | 10,040 | |||||||||
| Tax-exempt investment securities |
1,787 | 1,594 | 1,805 | |||||||||
|
|
|
|
|
|
|
|||||||
| TOTAL INTEREST INCOME |
163,296 | 127,514 | 122,503 | |||||||||
|
|
|
|
|
|
|
|||||||
| INTEREST EXPENSE |
||||||||||||
| Deposits |
10,512 | 5,755 | 5,064 | |||||||||
| Federal funds purchased and securities sold under agreements to repurchase |
69 | 110 | 78 | |||||||||
| Other borrowings |
7,066 | 5,009 | 3,795 | |||||||||
|
|
|
|
|
|
|
|||||||
| TOTAL INTEREST EXPENSE |
17,647 | 10,874 | 8,937 | |||||||||
|
|
|
|
|
|
|
|||||||
| NET INTEREST INCOME |
145,649 | 116,640 | 113,566 | |||||||||
| Provision for loan and lease losses |
4,223 | 1,942 | 5,865 | |||||||||
|
|
|
|
|
|
|
|||||||
| NET INTEREST INCOME AFTER PROVISION FOR LOAN AND LEASE LOSSES |
141,426 | 114,698 | 107,701 | |||||||||
| NONINTEREST INCOME |
||||||||||||
| Service charges on deposit accounts |
10,157 | 10,024 | 10,523 | |||||||||
| Commissions and fees |
4,349 | 4,568 | 4,634 | |||||||||
| Income on bank owned life insurance |
2,562 | 2,017 | 1,453 | |||||||||
| Gain on debt extinguishment |
— | 1,830 | — | |||||||||
| Gains on sales of loans |
2,123 | 1,681 | 573 | |||||||||
| Gain on sales and calls of investment securities, net |
370 | 241 | 2 | |||||||||
| Other income |
1,769 | 800 | 537 | |||||||||
|
|
|
|
|
|
|
|||||||
| TOTAL NONINTEREST INCOME |
21,330 | 21,161 | 17,722 | |||||||||
|
|
|
|
|
|
|
|||||||
| NONINTEREST EXPENSE |
||||||||||||
| Salaries and employee benefits |
56,107 | 48,640 | 45,167 | |||||||||
| Net occupancy expense |
9,935 | 8,956 | 8,865 | |||||||||
| Furniture and equipment |
8,017 | 6,930 | 6,605 | |||||||||
| FDIC insurance expense |
2,248 | 2,086 | 2,019 | |||||||||
| Stationery, supplies and postage |
1,727 | 1,529 | 1,403 | |||||||||
| Marketing expense |
1,672 | 1,586 | 2,025 | |||||||||
| Data processing expense |
1,891 | 1,524 | 1,245 | |||||||||
| Telecommunications expense |
1,631 | 1,448 | 1,386 | |||||||||
| ATM and debit card expense |
1,582 | 1,398 | 1,432 | |||||||||
| Core deposit intangible amortization |
734 | 415 | 464 | |||||||||
| Other real estate and repossessed asset expense |
116 | 181 | 234 | |||||||||
| Long-term debt prepayment fee |
— | 2,407 | — | |||||||||
| Merger related expenses |
4,103 | 1,152 | — | |||||||||
| Other expenses |
10,154 | 8,959 | 8,290 | |||||||||
|
|
|
|
|
|
|
|||||||
| TOTAL NONINTEREST EXPENSE |
99,917 | 87,211 | 79,135 | |||||||||
|
|
|
|
|
|
|
|||||||
| Income before provision for income taxes |
62,839 | 48,648 | 46,288 | |||||||||
| Provision for income taxes |
21,321 | 16,167 | 15,159 | |||||||||
|
|
|
|
|
|
|
|||||||
| NET INCOME |
$ | 41,518 | $ | 32,481 | $ | 31,129 | ||||||
|
|
|
|
|
|
|
|||||||
| PER SHARE OF COMMON STOCK: |
||||||||||||
| Basic earnings |
$ | 0.96 | $ | 0.85 | $ | 0.82 | ||||||
|
|
|
|
|
|
|
|||||||
| Diluted earnings |
$ | 0.95 | $ | 0.85 | $ | 0.82 | ||||||
|
|
|
|
|
|
|
|||||||
| Cash dividends |
$ | 0.37 | $ | 0.33 | $ | 0.29 | ||||||
|
|
|
|
|
|
|
|||||||
The accompanying notes are an integral part of these statements.
-58-
Table of Contents
Lakeland Bancorp, Inc. and Subsidiaries
CONSOLIDATED STATEMENTS OF COMPREHENSIVE INCOME
| For the Years Ended December 31, | ||||||||||||
| 2016 | 2015 | 2014 | ||||||||||
| (in thousands) | ||||||||||||
| NET INCOME |
$ | 41,518 | $ | 32,481 | $ | 31,129 | ||||||
| OTHER COMPREHENSIVE INCOME (LOSS), NET OF TAX: |
||||||||||||
| Unrealized (losses) gains on securities available for sale |
(1,038 | ) | (220 | ) | 6,180 | |||||||
| Less: reclassification for securities gains included in net income |
233 | 157 | 2 | |||||||||
| Unrealized gains on derivatives |
672 | — | — | |||||||||
| Change in pension liability, net |
42 | 4 | 20 | |||||||||
|
|
|
|
|
|
|
|||||||
| Other comprehensive (loss) income |
(557 | ) | (373 | ) | 6,198 | |||||||
|
|
|
|
|
|
|
|||||||
| TOTAL COMPREHENSIVE INCOME |
$ | 40,961 | $ | 32,108 | $ | 37,327 | ||||||
|
|
|
|
|
|
|
|||||||
The accompanying notes are an integral part of these statements.
-59-
Table of Contents
Lakeland Bancorp, Inc. and Subsidiaries
CONSOLIDATED STATEMENTS OF CHANGES IN STOCKHOLDERS’ EQUITY
For the Years Ended December 31, 2016, 2015 and 2014
| Common Stock | Retained Earnings (Accumulated Deficit) |
Accumulated Other Comprehensive Income (Loss) |
Total | |||||||||||||
| (in thousands) | ||||||||||||||||
| At December 31, 2013 |
$ | 364,637 | $ | (8,538 | ) | $ | (4,675 | ) | $ | 351,424 | ||||||
| Net income |
— | 31,129 | — | 31,129 | ||||||||||||
| Other comprehensive income, net of tax |
— | — | 6,198 | 6,198 | ||||||||||||
| Stock based compensation |
1,390 | — | — | 1,390 | ||||||||||||
| Stock dividend |
18,266 | (18,266 | ) | — | — | |||||||||||
| Issuance of stock to dividend reinvestment and stock purchase plan |
382 | (305 | ) | — | 77 | |||||||||||
| Retirement of restricted stock |
(104 | ) | — | — | (104 | ) | ||||||||||
| Exercise of stock options, net of excess tax benefits |
160 | — | — | 160 | ||||||||||||
| Cash dividends, common stock |
— | (10,836 | ) | — | (10,836 | ) | ||||||||||
|
|
|
|
|
|
|
|
|
|||||||||
| At December 31, 2014 |
$ | 384,731 | $ | (6,816 | ) | $ | 1,523 | $ | 379,438 | |||||||
|
|
|
|
|
|
|
|
|
|||||||||
| Net income |
— | 32,481 | — | 32,481 | ||||||||||||
| Other comprehensive loss, net of tax |
— | — | (373 | ) | (373 | ) | ||||||||||
| Stock based compensation |
1,605 | — | — | 1,605 | ||||||||||||
| Issuance of stock |
22 | — | — | 22 | ||||||||||||
| Retirement of restricted stock |
(254 | ) | — | — | (254 | ) | ||||||||||
| Exercise of stock options, net of excess tax benefits |
183 | — | — | 183 | ||||||||||||
| Cash dividends, common stock |
— | (12,586 | ) | — | (12,586 | ) | ||||||||||
|
|
|
|
|
|
|
|
|
|||||||||
| At December 31, 2015 |
$ | 386,287 | $ | 13,079 | $ | 1,150 | $ | 400,516 | ||||||||
|
|
|
|
|
|
|
|
|
|||||||||
| Net income |
— | 41,518 | — | 41,518 | ||||||||||||
| Other comprehensive loss, net of tax |
— | — | (557 | ) | (557 | ) | ||||||||||
| Stock based compensation |
1,899 | — | — | 1,899 | ||||||||||||
| Issuance of stock for Pascack acquisition |
37,221 | — | — | 37,221 | ||||||||||||
| Issuance of stock for Harmony acquisition |
36,654 | — | — | 36,654 | ||||||||||||
| Issuance of stock |
48,678 | — | — | 48,678 | ||||||||||||
| Retirement of restricted stock |
(206 | ) | — | — | (206 | ) | ||||||||||
| Exercise of stock options, net of excess tax benefits |
328 | — | — | 328 | ||||||||||||
| Cash dividends, common stock |
— | (16,007 | ) | — | (16,007 | ) | ||||||||||
|
|
|
|
|
|
|
|
|
|||||||||
| At December 31, 2016 |
$ | 510,861 | $ | 38,590 | $ | 593 | $ | 550,044 | ||||||||
|
|
|
|
|
|
|
|
|
|||||||||
The accompanying notes are an integral part of these statements.
-60-
Table of Contents
Lakeland Bancorp, Inc. and Subsidiaries
CONSOLIDATED STATEMENTS OF CASH FLOWS
| Years Ended December 31, | ||||||||||||
| 2016 | 2015 | 2014 | ||||||||||
| (in thousands) | ||||||||||||
| CASH FLOWS FROM OPERATING ACTIVITIES: |
||||||||||||
| Net income |
$ | 41,518 | $ | 32,481 | $ | 31,129 | ||||||
| Adjustments to reconcile net income to net cash provided by operating activities: |
||||||||||||
| Net amortization of premiums, discounts and deferred loan fees and costs |
4,581 | 4,151 | 3,456 | |||||||||
| Depreciation and amortization |
3,961 | 3,410 | 3,454 | |||||||||
| Amortization of intangible assets |
734 | 415 | 464 | |||||||||
| Provision for loan and lease losses |
4,223 | 1,942 | 5,865 | |||||||||
| Stock based compensation |
1,899 | 1,605 | 1,390 | |||||||||
| Loans originated for sale |
(85,365 | ) | (71,833 | ) | (23,386 | ) | ||||||
| Proceeds from sales of loans |
86,859 | 72,873 | 24,573 | |||||||||
| Gains on sales of securities |
(370 | ) | (241 | ) | (2 | ) | ||||||
| Gains on sales of loans held for sale |
(2,003 | ) | (1,681 | ) | (573 | ) | ||||||
| Gains on proceeds from bank owned life insurance policies |
(864 | ) | (435 | ) | — | |||||||
| Gains on debt redemption and extinguishment |
— | (1,830 | ) | — | ||||||||
| Gains on other real estate and other repossessed assets |
(248 | ) | (102 | ) | (258 | ) | ||||||
| Loss (Gain) on sale of premises and equipment |
117 | (6 | ) | (65 | ) | |||||||
| Long-term debt prepayment penalty |
— | 2,407 | — | |||||||||
| Deferred tax benefit |
(987 | ) | (824 | ) | (34 | ) | ||||||
| Increase in other assets |
(5,600 | ) | (5,257 | ) | (879 | ) | ||||||
| Increase in other liabilities |
1,618 | 3,691 | 495 | |||||||||
|
|
|
|
|
|
|
|||||||
| NET CASH PROVIDED BY OPERATING ACTIVITIES |
50,073 | 40,766 | 45,629 | |||||||||
|
|
|
|
|
|
|
|||||||
| CASH FLOWS FROM INVESTING ACTIVITIES: |
||||||||||||
| Net cash acquired in acquisitions |
68,751 | — | — | |||||||||
| Proceeds from repayments and maturities of available for sale securities: |
79,425 | 71,368 | 55,810 | |||||||||
| Proceeds from repayments and maturities of held to maturity securities: |
28,421 | 24,453 | 22,508 | |||||||||
| Proceeds from sales of available for sale securities: |
15,654 | 33,613 | 15,719 | |||||||||
| Proceeds from sales of held to maturity securities: |
— | — | 1,301 | |||||||||
| Purchase of available for sale securities: |
(245,699 | ) | (92,904 | ) | (90,630 | ) | ||||||
| Purchase of held to maturity securities: |
(59,715 | ) | (33,811 | ) | (30,556 | ) | ||||||
| Proceeds from redemptions of Federal Home Loan Bank stock |
3,054 | 456 | 4,624 | |||||||||
| Purchases of Federal Home Loan Bank stock |
(323 | ) | (4,697 | ) | (6,532 | ) | ||||||
| Purchase of bank owned life insurance |
— | (7,000 | ) | — | ||||||||
| Death benefit proceeds from bank owned life insurance policy |
2,129 | 1,186 | — | |||||||||
| Net increase in loans and leases |
(334,040 | ) | (315,067 | ) | (191,910 | ) | ||||||
| Proceeds from sales of bank premises and equipment |
21 | 696 | 118 | |||||||||
| Purchases of premises and equipment |
(3,977 | ) | (4,838 | ) | (2,492 | ) | ||||||
| Proceeds from sales of other real estate and other repossessed assets |
3,545 | 1,608 | 1,484 | |||||||||
|
|
|
|
|
|
|
|||||||
| NET CASH USED IN INVESTING ACTIVITIES |
(442,754 | ) | (324,937 | ) | (220,556 | ) | ||||||
|
|
|
|
|
|
|
|||||||
| CASH FLOWS FROM FINANCING ACTIVITIES: |
||||||||||||
| Net increase in deposits |
515,437 | 204,854 | 81,783 | |||||||||
| (Decrease) increase in federal funds purchased and securities sold under agreements to repurchase |
(94,880 | ) | 42,299 | 26,944 | ||||||||
| Proceeds from other borrowings |
14,921 | 117,000 | 168,498 | |||||||||
| Repayments of other borrowings |
(91,798 | ) | (50,000 | ) | (85,000 | ) | ||||||
| Redemption of subordinated debentures, net |
— | (8,170 | ) | — | ||||||||
| Net proceeds from issuance of subordinated debt |
73,516 | — | — | |||||||||
| Exercise of stock options |
285 | 124 | 90 | |||||||||
| Net proceeds from issuance of common stock |
48,678 | 22 | 77 | |||||||||
| Retirement of restricted stock |
(206 | ) | (254 | ) | (104 | ) | ||||||
| Excess tax benefits |
43 | 59 | 70 | |||||||||
| Dividends paid |
(16,007 | ) | (12,586 | ) | (10,836 | ) | ||||||
|
|
|
|
|
|
|
|||||||
| NET CASH PROVIDED BY FINANCING ACTIVITIES |
449,989 | 293,348 | 181,522 | |||||||||
|
|
|
|
|
|
|
|||||||
| Net increase in cash and cash equivalents |
57,308 | 9,177 | 6,595 | |||||||||
| Cash and cash equivalents, beginning of year |
118,493 | 109,316 | 102,721 | |||||||||
|
|
|
|
|
|
|
|||||||
| CASH AND CASH EQUIVALENTS, END OF YEAR |
$ | 175,801 | $ | 118,493 | $ | 109,316 | ||||||
|
|
|
|
|
|
|
|||||||
-61-
Table of Contents
Lakeland Bancorp, Inc. and Subsidiaries
CONSOLIDATED STATEMENTS OF CASH FLOWS (Continued)
| Years Ended December 31, | ||||||||||||
| 2016 | 2015 | 2014 | ||||||||||
| (in thousands) | ||||||||||||
| Supplemental schedule of non-cash investing and financing activities: |
||||||||||||
| Cash paid during the period for income taxes |
$ | 21,744 | $ | 16,737 | $ | 15,057 | ||||||
| Cash paid during the period for interest |
16,435 | 10,770 | 8,882 | |||||||||
| Transfer of loans and leases into other repossessed assets and other real estate owned |
3,386 | 1,462 | 1,867 | |||||||||
| Acquisitions of Pascack and Harmony: |
||||||||||||
| Non-cash assets acquired: |
||||||||||||
| Federal Home Loan Bank stock |
3,742 | — | — | |||||||||
| Investment securities held for maturity |
10,810 | — | — | |||||||||
| Investment securities available for sale |
7,474 | — | — | |||||||||
| Loans, including loans held for sale |
580,390 | — | — | |||||||||
| Goodwill and other intangible assets, net |
28,703 | — | — | |||||||||
| Other assets |
31,908 | — | — | |||||||||
| Total non-cash assets acquired |
663,027 | — | — | |||||||||
| Liabilities assumed: |
||||||||||||
| Deposits |
(582,526 | ) | — | — | ||||||||
| Other borrowings |
(66,622 | ) | — | — | ||||||||
| Other liabilities |
(8,755 | ) | — | — | ||||||||
| Total liabilities assumed |
(657,903 | ) | — | — | ||||||||
| Common stock issued |
73,875 | — | — | |||||||||
The accompanying notes are an integral part of these statements.
-62-
Table of Contents
Lakeland Bancorp, Inc. and Subsidiaries
NOTES TO CONSOLIDATED FINANCIAL STATEMENTS
NOTE 1 - SUMMARY OF ACCOUNTING POLICIES
Lakeland Bancorp, Inc. (the “Company”) is a bank holding company whose principal activity is the ownership and management of its wholly owned subsidiary, Lakeland Bank (“Lakeland”). Lakeland operates under a state bank charter and provides full banking services and, as a state bank, is subject to regulation by the New Jersey Department of Banking and Insurance. Lakeland generates commercial, mortgage and consumer loans and receives deposits from customers located primarily in Northern and Central New Jersey. Through a third party, Lakeland also provides non-deposit products, such as securities brokerage services, including mutual funds and variable annuities.
Lakeland operates as a commercial bank offering a wide variety of commercial loans and leases and, to a lesser degree, consumer credits. Its primary strategic aim is to establish a reputation and market presence as the “small and middle market business bank” in its principal markets. Lakeland funds its loans primarily by offering time, savings and money market, and demand deposit accounts to both commercial enterprises and individuals. Additionally, it originates residential mortgage loans, and services such loans which are owned by other investors. Lakeland also has an equipment finance division which provides equipment lease financing primarily to small and medium sized business clients and an asset based lending department which specializes in utilizing particular assets to fund the working capital needs of borrowers.
The Company and Lakeland are subject to regulations of certain state and federal agencies and, accordingly, are periodically examined by those regulatory authorities. As a consequence of the extensive regulation of commercial banking activities, Lakeland’s business is particularly susceptible to being affected by state and federal legislation and regulations.
Basis of Financial Statement Presentation
The accounting and reporting policies of the Company and its subsidiaries conform with accounting principles generally accepted in the United States of America (“U.S. GAAP”) and predominant practices within the banking industry. The consolidated financial statements include the accounts of the Company, Lakeland, Lakeland NJ Investment Corp., Lakeland Investment Corp., Lakeland Equity, Inc. and Lakeland Preferred Equity, Inc. All intercompany balances and transactions have been eliminated.
The preparation of financial statements requires management to make estimates and assumptions that affect the reported amounts of assets and liabilities and disclosure of contingent assets and liabilities at the date of the financial statements. These estimates and assumptions also affect reported amounts of revenues and expenses during the reporting period. Actual results could differ from these estimates. Significant estimates in these financial statements are as follows.
The principal estimates that are particularly susceptible to significant change in the near term relate to the allowance for loan and lease losses, the valuation of the Company’s investment securities portfolio, the realizability of the Company’s deferred tax asset and the analysis of goodwill and intangible impairment. The policies regarding these estimates are discussed below.
The Company’s operating segments are components of its enterprise for which separate financial information is available and is evaluated regularly by the chief operating decision maker in deciding how to allocate resources and assess performance. The Company’s chief operating decision maker is its Chief Executive Officer. All of the Company’s financial services activities are interrelated, and each activity is dependent and assessed based on how each of the activities of the Company supports the others. For example, commercial lending is dependent upon the ability of Lakeland to fund itself with retail deposits and other borrowings and to manage interest rate and credit risk. The situation is also similar for consumer and residential mortgage lending. Moreover, the Company primarily operates in one market area, Northern and Central New Jersey and contiguous areas. Therefore, all significant operating decisions are based upon
-63-
Table of Contents
analysis of the Company as one operating segment or unit. Accordingly, the Company has determined that it has one operating segment and thus one reporting segment.
Cash and Due from Banks
Cash and cash equivalents are defined as cash on hand, cash items in the process of collection, amounts due from banks and federal funds sold with an original maturity of three months or less. A portion of Lakeland’s cash on hand and on deposit with the Federal Reserve Bank was required to meet regulatory reserve and clearing requirements.
Investment Securities
Investment securities are classified in one of three categories: held to maturity, trading, or available for sale. Investments in debt securities, for which management has both the ability and intent to hold to maturity, are carried at cost, adjusted for the amortization of premiums and accretion of discounts computed by the effective interest method. Investments in debt and equity securities, which management believes may be sold prior to maturity due to changes in interest rates, prepayment risk, liquidity requirements, or other factors, are classified as available for sale. Net unrealized gains and losses for such securities, net of tax effect, are reported as other comprehensive income (loss) and excluded from the determination of net income. The Company does not engage in securities trading. Gains or losses on disposition of investment securities are based on the net proceeds and the adjusted carrying amount of the securities sold using the specific identification method. Losses are recorded through the statement of income when the impairment is considered other-than-temporary, even if a decision to sell has not been made.
The Company evaluates its portfolio for impairment each quarter. In estimating other-than-temporary losses, the Company considers the length of time and the extent to which the fair value has been less than cost, the financial condition and near-term prospects of the issuer, and whether the Company is more likely than not to sell the security before recovery of its cost basis. If a security has been impaired for more than twelve months, and the impairment is deemed other-than-temporary, a write down will occur in that quarter. If a loss is deemed to be other-than-temporary, it is recognized as a realized loss in the income statement with the security assigned a new cost basis.
If the Company intends to sell an impaired security, the Company records an other-than-temporary loss in an amount equal to the entire difference between the fair value and amortized cost. If a security is determined to be other-than-temporarily impaired, but the Company does not intend to sell the security, only the credit portion of the estimated loss is recognized in earnings in gain (loss) on securities, with the other portion of the loss recognized in other comprehensive income. If a determination is made that an equity security is other-than-temporarily impaired, the unrealized loss will be recognized as an other-than-temporary impairment charge in noninterest income as a component of gain (loss) on investment securities.
Loans and Leases and Allowance for Loan and Lease Losses
Loans and leases that management has the intent and ability to hold for the foreseeable future or until maturity or payoff are stated at the amount of unpaid principal and are net of unearned discount, unearned loan fees and an allowance for loan and lease losses.
Interest income is accrued as earned on a simple interest basis, adjusted for prepayments. All unamortized fees and costs related to the loan are amortized over the life of the loan using the interest method. Accrual of interest is discontinued on a loan or lease when management believes, after considering economic and business conditions and collection efforts, that the borrower’s financial condition is such that full collection of interest and principal is doubtful. When a loan or lease is placed on such non-accrual status, all accumulated accrued interest receivable is reversed out of current period income.
-64-
Table of Contents
Commercial loans and leases are placed on a non-accrual status with all accrued interest and unpaid interest reversed if (a) because of the deterioration in the financial position of the borrower they are maintained on a cash basis (which means payments are applied when and as received rather than on a regularly scheduled basis), (b) payment in full of interest or principal is not expected, or (c) principal and interest have been in default for a period of 90 days or more unless the obligation is both well-secured and in process of collection. Residential mortgage loans are placed on non-accrual status at the time principal and interest have been in default for a period of 90 days or more, except where there exists sufficient collateral to cover the defaulted principal and interest payments, and the loans are well-secured and in the process of collection. Consumer loans are generally placed on non-accrual and reviewed for charge-off when principal and interest payments are four months in arrears unless the obligations are well-secured and in the process of collection. Interest thereafter on such charged-off consumer loans is taken into income when received only after full recovery of principal. As a general rule, a non-accrual asset may be restored to accrual status when none of its principal or interest is due and unpaid, satisfactory payments have been received for a sustained period (usually six months), or when it otherwise becomes well-secured and in the process of collection.
Loans and leases are considered impaired when, based on current information and events, it is probable that Lakeland will be unable to collect all amounts due in accordance with the original contractual terms of the loan agreement, including scheduled principal and interest payments. Impairment is measured based on the present value of expected cash flows discounted at the loan’s effective interest rate, or as a practical expedient, Lakeland may measure impairment based on a loan’s observable market price, or the fair value of the collateral, less estimated costs to sell, if the loan is collateral-dependent. Regardless of the measurement method, Lakeland measures impairment based on the fair value of the collateral when it is determined that foreclosure is probable. Most of Lakeland’s impaired loans are collateral-dependent. Lakeland groups impaired commercial loans under $500,000 into a homogeneous pool and collectively evaluates them.
Interest received on impaired loans and leases may be recorded as interest income. However, if management is not reasonably certain that an impaired loan and lease will be repaid in full, or if a specific time frame to resolve full collection cannot yet be reasonably determined, all payments received are recorded as reductions of principal.
Purchased Credit-Impaired (“PCI”) loans are loans acquired through acquisition or purchased at a discount that is due, in part, to credit quality. PCI loans are accounted for in accordance with ASC Subtopic 310-30 and are initially recorded at fair value (as determined by the present value of expected future cash flows) with no valuation allowance (i.e., the allowance for loan losses). The difference between the undiscounted cash flows expected at acquisition and the initial carrying amount (fair value) of the covered loans, or the “accretable yield,” is recognized as interest income utilizing the level-yield method over the life of the loans. Contractually required payments for interest and principal that exceed the undiscounted cash flows expected at acquisition, or the “non-accretable difference,” are not recognized as a yield adjustment, as a loss accrual or a valuation allowance. Reclassifications of the non-accretable difference to the accretable yield may occur subsequent to the loan acquisition dates due to increases in expected cash flows of the loans and results in an increase in yield on a prospective basis. Valuation allowances (recognized in the allowance for loan and lease losses) on these impaired loans reflect only losses incurred after the acquisition (representing all cash flows that were expected at acquisition but currently are not expected to be received).
Loans are classified as troubled debt restructured loans in cases where borrowers experience financial difficulties and Lakeland makes certain concessionary modifications to contractual terms. Restructured loans typically involve a modification of terms such as a reduction of the stated interest rate, an extended moratorium of principal payments and/or an extension of the maturity date at a stated interest rate lower than the current market rate for a new loan with similar risk. Nonetheless, restructured loans are classified as impaired loans.
If an obligation has been restructured, it will continue to be classified as restructured until the obligation is fully repaid or until it meets all of the following criteria: 1) the borrower is no longer
-65-
Table of Contents
experiencing financial difficulties, 2) the rate is not less than the rate provided for similar credit risk, 3) other terms are no less favorable than similar new debt and 4) no concessions were granted (any prior principal forgiveness is deemed to be an ongoing concession).
The allowance for loan and lease losses is established through a provision for loan and lease losses charged to expense. Loan principal considered to be uncollectible by management is charged against the allowance for loan and lease losses. The allowance is an amount that management believes will be adequate to absorb losses on existing loans and leases that may become uncollectible based upon an evaluation of known and inherent risks in the loan and lease portfolio. The evaluation takes into consideration such factors as changes in the nature and size of the loan and lease portfolio, overall portfolio quality, specific problem loans and leases, and current economic conditions which may affect the borrowers’ ability to pay. The evaluation also analyzes historical losses by loan and lease category, and considers the resulting loss rates when determining the reserves on current loan and lease total amounts. Additionally, management assesses the loss emergence period for each loan segment and adjusts each historical loss factor accordingly. The loss emergence period is the estimated time from the date of a loss event (such as a personal bankruptcy) to the actual recognition of the loss (typically via the first full or partial loan charge-off), and is determined based upon a study of our past loss experience by loan segment. Loss reserves for specified problem loans and leases are also detailed. All of the factors considered in the analysis of the adequacy of the allowance for loan and lease losses may be subject to change. To the extent actual outcomes differ from management estimates, additional provisions for loan and lease losses may be required that would adversely impact earnings in future periods.
The determination of the adequacy of the allowance for loan and lease losses and the periodic provisioning for estimated losses included in the consolidated financial statements is the responsibility of management and the Board of Directors. The evaluation process is undertaken on a quarterly basis.
Methodology employed for assessing the adequacy of the allowance consists of the following criteria:
| • | The establishment of reserve amounts for all impaired loans and leases that have been designated as requiring attention by Lakeland. |
| • | The establishment of reserves for pools of homogeneous types of loans and leases not subject to specific review, including impaired loans under $500,000, leases, 1 – 4 family residential mortgages, and consumer loans. |
| • | The establishment of reserve amounts for the unimpaired loans and leases in each portfolio based upon the historical average loss experience as modified by management’s assessment of the loss emergence period for these portfolios and management’s evaluation of key factors. |
Consideration is given to the results of ongoing credit quality monitoring processes, the adequacy and expertise of Lakeland’s lending staff, underwriting policies, loss histories, delinquency trends, and the cyclical nature of economic and business conditions. Since many of Lakeland’s loans depend on the sufficiency of collateral as a secondary source of repayment, any adverse trend in the real estate markets could affect underlying values available to protect Lakeland from loss.
A loan that management designates as impaired is reviewed for charge-off when it is placed on non-accrual status with a resulting charge-off if the loan is not secured by collateral having sufficient liquidation value to repay the loan. Charge-offs are recommended by the Chief Credit Officer and approved by the Board.
Mortgage loans originated and intended for sale in the secondary market are carried at the lower of aggregate cost or estimated fair value. Gains and losses on sales of loans are specifically identified and accounted for in accordance with U.S. GAAP which requires that an entity engaged in mortgage banking activities classify the retained mortgage-backed security or other interest, which resulted from the securitization of a mortgage loan held for sale, based upon its ability and intent to sell or hold these investments.
-66-
Table of Contents
Bank Premises and Equipment
Bank premises and equipment, including leasehold improvements, are stated at cost less accumulated depreciation. Depreciation expense is computed on the straight-line method over the estimated useful lives of the assets. Leasehold improvements are depreciated over the shorter of the estimated useful lives of the improvements or the terms of the related leases.
Other Real Estate Owned and Other Repossessed Assets
Other real estate owned (OREO) and other repossessed assets, representing property acquired through foreclosure (or deed-in-lieu-of-foreclosure), are carried at fair value less estimated disposal costs of the acquired property. Costs relating to holding the assets are charged to expense. An allowance for OREO or other repossessed assets is established, through charges to expense, to maintain properties at fair value less estimated costs to sell. Operating results of OREO and other repossessed assets, including rental income and operating expenses, are included in other expenses.
Mortgage Servicing
Lakeland performs various servicing functions on loans owned by others. A fee, usually based on a percentage of the outstanding principal balance of the loan, is received for these services. At December 31, 2016 and 2015, Lakeland was servicing approximately $26.9 million and $30.0 million, respectively, of loans for others.
Lakeland originates certain mortgages under a definitive plan to sell or securitize those loans and service the loans owned by the investor. Upon the transfer of the mortgage loans in a sale or a securitization, Lakeland records the servicing assets retained. Lakeland records mortgage servicing rights and the loans based on relative fair values at the date of origination and evaluates the mortgage servicing rights for impairment at each reporting period. Lakeland also originates loans that it sells to other banks and investors and does not retain the servicing rights.
Mortgage Servicing Rights
When mortgage loans are sold with servicing retained, servicing rights are initially recorded at fair value with the income statement effect recorded in gains on sales of loans. Fair value is based on market prices for comparable mortgage servicing contracts, when available, or alternatively, is based on a valuation model that calculates the present value of estimated future net servicing income. All classes of servicing assets are subsequently measured using the amortization method which requires servicing rights to be amortized into noninterest income in proportion to, and over the period of, the estimated future net servicing income of the underlying loans. As of December 31, 2016 and 2015, Lakeland had originated mortgage servicing rights of $124,000 and $167,000, respectively.
Under the amortization measurement method, Lakeland subsequently measures servicing rights at fair value at each reporting date and records any impairment in value of servicing assets in earnings in the period in which the impairment occurs. The fair values of servicing rights are subject to significant fluctuations as a result of changes in estimated and actual prepayment speeds and default rates and losses. Servicing fee income, which is reported on the income statement as commissions and fees, is recorded for fees earned for servicing loans. The fees are based on a contractual percentage of the outstanding principal or a fixed amount per loan, and are recorded as income when earned.
Transfers of Financial Assets
Transfers of financial assets are accounted for as sales, when control over the assets has been surrendered. Control over transferred assets is deemed to be surrendered when (1) the assets have been
-67-
Table of Contents
isolated from the Company, put presumptively beyond the reach of the transferor and its creditors even in bankruptcy or other receivership, (2) the transferee obtains the right (free of conditions that constrain it from taking advantage of that right) to pledge or exchange the transferred assets and (3) the Company does not maintain effective control over the transferred assets through an agreement to repurchase them before their maturity or the ability to unilaterally cause the holder to return specific assets.
Derivatives
Lakeland enters into interest rate swaps (“swaps”) with loan customers to provide a facility to mitigate the fluctuations in the variable rate on the respective loans. These swaps are matched in offsetting terms to swaps that Lakeland enters into with an outside third party. The swaps are reported at fair value in other assets or other liabilities. Lakeland’s swaps qualify as derivatives, but are not designated as hedging instruments, thus any net gain or loss resulting from changes in the fair value is recognized in other noninterest income.
The credit risk associated with derivatives executed with customers is similar as that involved in extending loans and is subject to normal credit policies. Collateral is obtained based on management’s assessment of the customer. The positions of customer derivatives are recorded at fair value and changes in value are included in noninterest income on the consolidated statement of income.
Cash flow hedges are used primarily to minimize the variability in cash flows of assets or liabilities, or forecasted transactions caused by interest rate fluctuations. Changes in the fair value of derivatives designated as cash flow hedges are recorded in accumulated other comprehensive income and are reclassified into the line item in the income statement in which the hedged item is recorded in the same period the hedged item affects earnings. Hedge ineffectiveness and gains and losses on the component of a derivative excluded in assessing hedge effectiveness are recorded in the same income statement line item.
Further discussion of Lakeland’s financial derivatives is set forth in Note 18 to the Consolidated Financial Statements.
Earnings Per Share
Earnings per share is calculated on the basis of the weighted average number of common shares outstanding during the year. Basic earnings per share excludes dilution and is computed by dividing income available to common shareholders by the weighted average common shares outstanding during the period. Diluted earnings per share takes into account the potential dilution that could occur if securities or other contracts to issue common stock were exercised and converted into common stock. Unless otherwise indicated, all weighted average, actual shares or per share information in the financial statements have been adjusted retroactively for the effect of stock dividends.
Employee Benefit Plans
The Company has certain employee benefit plans covering substantially all employees. The Company accrues such costs as incurred.
We recognize the overfunded or underfunded status of pension and postretirement benefit plans in accordance with U.S. GAAP. Actuarial gains and losses, prior service costs or credits, and any remaining transition assets or obligations are recognized as a component of Accumulated Other Comprehensive Income, net of tax effects, until they are amortized as a component of net periodic benefit cost.
Comprehensive Income (Loss)
The Company reports comprehensive income (loss) in addition to net income from operations. Other comprehensive income (loss) Includes items recorded directly in equity such as unrealized gains or losses on securities available for sale as well unrealized gains (losses) recorded on derivatives and benefit plans.
-68-
Table of Contents
Goodwill and Other Identifiable Intangible Assets
Goodwill is presumed to have an indefinite useful life and is tested, at least annually, for impairment at the reporting unit level. Impairment exists when the carrying amount of goodwill exceeds its implied fair value. For purposes of our goodwill impairment testing, we have identified a single reporting unit, community banking.
U.S. GAAP permits an entity to make a qualitative assessment of whether it is more likely than not that a reporting unit’s fair value is less than its carrying amount before applying the two-step goodwill impairment test. The Company completed its annual qualitative assessment as of November 30, 2016 and concluded that there was less than a 50% probability that the fair value of the reporting unit is less than its carrying amount and, therefore, the two-step goodwill impairment test was not required.
Bank Owned Life Insurance
Lakeland invests in bank owned life insurance (“BOLI”). BOLI involves the purchasing of life insurance by Lakeland on a chosen group of employees. Lakeland is owner and beneficiary of the policies. At December 31, 2016 and 2015, Lakeland had $72.4 million and $65.4 million, respectively, in BOLI. Income earned on BOLI was $2.6 million, $2.0 million and $1.5 million for the years ended December 31, 2016, 2015 and 2014, respectively. BOLI is accounted for using the cash surrender value method and is recorded at its net realizable value.
Deferred Income Taxes
The Company accounts for income taxes under the asset and liability method of accounting for income taxes. Deferred tax assets and liabilities are determined based on the difference between the financial statement and tax bases of assets and liabilities as measured by the enacted tax rates that will be in effect when these differences reverse. Deferred tax expense is the result of changes in deferred tax assets and liabilities. The principal types of differences between assets and liabilities for financial statement and tax return purposes are allowance for loan and lease losses, core deposit intangibles, deferred loan fees and deferred compensation.
The Company evaluates tax positions that may be uncertain using a recognition threshold of more-likely-than-not, and a measurement attribute for all tax positions taken or expected to be taken on a tax return, in order for those tax positions to be recognized in the financial statements. Additional information regarding the Company’s uncertain tax positions is set forth in Note 10 to the Consolidated Financial Statements.
Variable Interest Entities
Management has determined that Lakeland Bancorp Capital Trust II and Lakeland Bancorp Capital Trust IV (collectively, “the Trusts”) qualify as variable interest entities. The Trusts issued mandatorily redeemable preferred stock to investors and loaned the proceeds to the Company. The Trusts hold, as their sole asset, subordinated debentures issued by the Company. The Company is not considered the primary beneficiary of the Trusts, therefore the Trusts are not consolidated in the Company’s financial statements.
The Company’s maximum exposure to the Trusts is $30.0 million at December 31, 2016 which is the Company’s liability to the Trusts and includes the Company’s investment in the Trusts.
The Federal Reserve has issued guidance on the regulatory capital treatment for the trust preferred securities issued by the Trusts. The rule retains the current maximum percentage of total capital permitted for trust preferred securities at 25%, but enacts other changes to the rules governing trust preferred securities that affect their use as part of the collection of entities known as “restricted core capital elements.” The rule allows bank holding companies to continue to count trust preferred securities as Tier 1 Capital. The
-69-
Table of Contents
Company’s capital ratios continue to be categorized as “well-capitalized” under the regulatory framework for prompt corrective action. Under the Collins Amendment to the Dodd-Frank Wall Street Reform and Consumer Protection Act, any new issuance of trust preferred securities by the Company would not be eligible as regulatory capital.
New Accounting Pronouncements
In January 2017, the Financial Accounting Standards Board (“FASB”) issued an update to simplify the test for goodwill impairment. This amendment eliminates Step 2 from the goodwill impairment test. The annual, or interim, goodwill impairment test is performed by comparing the fair value of a reporting unit with its carrying amount. An impairment charge should be recognized for the amount by which the carrying amount exceeds the reporting unit’s fair value. This update will be effective for the Company’s financial statements for fiscal years beginning after December 15, 2019. The adoption of this update is not expected to have a material impact on the Company’s financial statements.
In January 2017, the FASB issued an update that clarifies the definition of a business as it pertains to business combinations. This amendment affects all companies and other reporting organizations that must determine whether they have sold or acquired a business. This update will be effective for the Company’s financial statements for fiscal years beginning after December 15, 2017. The adoption of this update is not expected to have a material impact on the Company’s financial statements.
In September 2016, the FASB issued an accounting standards update to address diversity in presentation in how certain cash receipts and cash payments are presented and classified in the statement of cash flows. This update will be effective for financial statements issued for fiscal years and interim periods beginning after December 15, 2017. The adoption of this update is not expected to have a material impact on the Company’s financial statements.
In June 2016, the FASB issued an accounting standards update pertaining to the measurement of credit losses on financial instruments. This update requires the measurement of all expected credit losses for financial instruments held at the reporting date based on historical experience, current conditions, and reasonable and supportable financials. Financial institutions and other organizations will now use forward-looking information to better inform their credit loss estimates. This update is intended to improve financial reporting by requiring timelier recording of credit losses on loans and other financial instruments held by financial institutions and other organizations. This update will be effective for financial statements issued for fiscal years and interim periods beginning after December 15, 2019. The Company is currently assessing the impact that the guidance will have on the Company’s consolidated financial statements.
In March 2016, the FASB issued an accounting standards update to simplify employee share-based payment accounting. The areas for simplification in this update involve several aspects of the accounting for employee share-based payment transactions, including the income tax consequences, classification of awards as either equity or liabilities, and classification on the statement of cash flows. This update will be effective for financial statements issued for fiscal years and interim periods beginning after December 15, 2016. The adoption of this update is not expected to have a material impact on the Company’s financial statements.
In March 2016, the FASB issued an accounting standards update that requires that embedded derivatives be separated from the host contract and accounted for separately as derivatives if certain criteria are met, including the “clearly and closely related” criterion. The amendments in this update clarify the requirements for assessing whether contingent call or put options that can accelerate the payment of principal on debt instruments are clearly and closely related to their debt hosts. This update will be effective for financial statements issued for fiscal years and interim periods beginning after December 15, 2016. This guidance will be applied on a modified retrospective basis as of the beginning of the fiscal year that the amendment is effective. The adoption of this update is not expected to have a material impact on the Company’s financial statements.
-70-
Table of Contents
In February 2016, FASB issued accounting guidance that requires all lessees to recognize a lease liability and a right-of-use asset, measured at the present value of the future minimum lease payments, at the lease commencement date. Lessor accounting remains largely unchanged under the new guidance. The guidance is effective for fiscal years beginning after December 15, 2018, including interim reporting periods within that reporting period, with early adoption permitted. A modified retrospective approach must be applied for leases existing at, or entered into after, the beginning of the earliest comparative period presented in the financial statements. The Company is currently assessing the impact of the new guidance on its consolidated financial statements. The Company expects to recognize a right-of-use asset and a lease liability for its operating lease commitments. Please refer to Note 14 for the Company’s commitments under operating lease obligations.
In January 2016, the FASB issued an accounting standards update intended to improve the recognition and measurement of financial instruments. Specifically, the accounting standards update requires all equity instruments, with the exception of those that are accounted for under the equity method of accounting, to be measured at fair value with changes in the fair value recognized through net income. Additionally, public business entities are required to use the exit price notion when measuring the fair value of financial instruments for disclosure purposes. The amendments in this update also require an entity to present separately in other comprehensive income the portion of the total change in the fair value of a liability resulting from a change in the instrument-specific credit risk when the entity has elected to measure the liability at fair value in accordance with the fair value option for financial instruments. This amendment is effective for fiscal years, and interim periods within those fiscal years, beginning after December 15, 2017. The adoption of this update is not expected to have a material impact on the Company’s financial statements.
In September 2015, the FASB issued an accounting standards update simplifying the accounting for adjustments made to provisional amounts recognized in a business combination, eliminating the requirement to retrospectively account for those adjustments. To simplify the accounting for adjustments made to provisional amounts, the amendments in the accounting standards update require that the acquirer recognize adjustments to provisional amounts that are identified during the measurement period in the reporting period in which the adjustment amount is determined. The acquirer is required to also record, in the same period’s financial statements, the effect on earnings of changes in depreciation, amortization, or other income effects, if any, as a result of the change to the provisional amounts, calculated as if the accounting had been completed at the acquisition date. In addition, an entity is required to present separately on the face of the income statement or disclose in the notes to the financial statements the portion of the amount recorded in current-period earnings by line item that would have been recorded in previous reporting periods if the adjustment to the provisional amounts had been recognized as of the acquisition date. This amendment is effective for fiscal years, and interim periods within those fiscal years, beginning after December 15, 2015. The adoption of this update did not have a material impact on the Company’s financial statements.
In May 2015, the FASB issued an accounting standards update clarifying how investments valued using the net asset value practical expedient within the fair value hierarchy should be classified. The accounting standards update was issued to address diversity in practice by exempting investments measured using the net asset value expedient from categorization in the fair value hierarchy. This accounting standards update is effective for fiscal years, and interim periods within those fiscal years, beginning after December 15, 2015. The adoption of this update did not have a material impact on the Company’s financial statements.
In April 2015, the FASB issued an accounting standards update requiring that debt issuance costs related to a recognized debt liability be presented in the balance sheet as a direct deduction from the carrying amount of the debt liability consistent with the presentation of debt discounts. The purpose of this update is to simplify the presentation of debt issuance costs and to align the U.S. GAAP presentation of debt more closely with international accounting standards. In August 2015, the FASB issued a subsequent update which discussed presentation and subsequent measurement of debt issuance costs associated with line-of-credit arrangements. These amendments are effective for fiscal years, and interim periods within those
-71-
Table of Contents
fiscal years, beginning after December 15, 2015. The adoption of these updates did not have a material impact on the Company’s financial statements.
In January 2015, the FASB issued an accounting standards update regarding the elimination of the concept of the extraordinary items from the statement of operations. The purpose of this update is to simplify the statement of operations presentation and to align the U.S. GAAP income statement more closely with international accounting standards. This update is effective for fiscal years, and interim periods within those fiscal years, beginning after December 15, 2015. The adoption of this update did not have a material impact on the Company’s financial statements.
In May 2014, the FASB issued an accounting standards update that clarifies the principles for recognizing revenue. The core principle of the guidance is that an entity should recognize revenue to depict the transfer of promised goods or services to a customer in an amount that reflects the consideration to which the entity expects to be entitled in exchange for these goods or services. To achieve that core principle, an entity should apply the following steps: (i) identify the contract(s) with a customer; (ii) identify the performance obligations in the contract; (iii) determine the transaction price; (iv) allocate the transaction price to the performance obligations in the contract; and (v) recognize revenue when (or as) the entity satisfies a performance obligation. In 2016, the FASB issued further implementation guidance regarding revenue recognition. This additional guidance included clarification on certain principal versus agent considerations within the implementation of the guidance as well as clarification related to identifying performance obligations and licensing. The guidance along with its updates is effective for fiscal years, and interim periods within those fiscal years, beginning after December 15, 2017. The Company is still evaluating the potential impact on the Company’s financial statements. In evaluating this standard, management has determined that the majority of revenue earned by the Company is from revenue streams not included in the scope of this standard and therefore management does not expect the new revenue recognition guidance to have a material impact on its consolidated financial statements.
NOTE 2 - ACQUISITIONS
Harmony Bank
On July 1, 2016, the Company completed its acquisition of Harmony Bank (“Harmony”), a bank located in Ocean County, NJ. Effective upon the opening of business on July 1, 2016, Harmony was merged into Lakeland Bank. Harmony operated three branches in Ocean County, New Jersey. This merger allows the Company to expand its presence to Ocean County. The merger agreement provided that shareholders of Harmony would receive 1.25 shares of the Company’s common stock for each share of Harmony Bank common stock that they owned at the effective time of the merger. The Company issued an aggregate of 3,201,109 shares of its common stock in the merger. Outstanding Harmony stock options were paid out in cash at the difference between $14.31 (Lakeland’s closing stock price on July 1, 2016 of $11.45 multiplied by 1.25) and the average strike price of $9.07 for a total cash payment of $869,000.
During the fourth quarter of 2016, the Company revised the estimate of the fair value of the acquired assets as of the acquisition date as a result of additional information obtained. The adjustment, related to the fair market value of certain loans, resulted in a $645,000 decrease to goodwill.
-72-
Table of Contents
The acquisition was accounted for under the acquisition method of accounting. Accordingly, the assets acquired and liabilities assumed in the acquisition were recorded at their estimated fair values based on management’s best estimates using information available at the date of the acquisition, including the use of a third party valuation specialist. The fair values are preliminary estimates and subject to adjustment for up to one year after the closing date of the acquisition. The following table summarizes the estimated fair value of the acquired assets and liabilities assumed at the date of acquisition for Harmony, net of cash consideration paid.
| (in thousands) | ||||
| Cash and cash equivalents |
$ | 27,809 | ||
| Securities available for sale |
7,474 | |||
| Securities held to maturity |
6,885 | |||
| Federal Home Loan Bank stock |
780 | |||
| Loans |
260,815 | |||
| Premises and equipment |
3,125 | |||
| Goodwill |
10,462 | |||
| Identifiable intangible assets |
1,416 | |||
| Accrued interest receivable and other assets |
7,673 | |||
|
|
|
|||
| Total assets acquired |
326,439 | |||
|
|
|
|||
| Deposits |
(278,060 | ) | ||
| Other borrowings |
(9,314 | ) | ||
| Other liabilities |
(2,411 | ) | ||
|
|
|
|||
| Total liabilities assumed |
(289,785 | ) | ||
|
|
|
|||
| Net assets acquired |
$ | 36,654 | ||
|
|
|
|||
Loans acquired in the Harmony acquisition were recorded at fair value, and there was no carryover related allowance for loan and lease losses. The fair values of loans acquired from Harmony were estimated using cash flow projections based on the remaining maturity and repricing terms. Cash flows were adjusted for estimated future credit losses and the rate of prepayments. Projected cash flows were then discounted to present value using a risk-adjusted market rate for similar loans.
The following is a summary of the loans accounted for in accordance with ASC 310-30 that were acquired in the Harmony acquisition as of the closing date.
| Acquired Credit Impaired Loans |
||||
| (in thousands) | ||||
| Contractually required principal and interest at acquisition |
$ | 1,264 | ||
| Contractual cash flows not expected to be collected (non-accretable difference) |
398 | |||
|
|
|
|||
| Expected cash flows at acquisition |
866 | |||
| Interest component of expected cash flows (accretable difference) |
97 | |||
|
|
|
|||
| Fair value of acquired loans |
$ | 769 | ||
|
|
|
|||
The core deposit intangible totaled $1.0 million and is being amortized over its estimated useful life of approximately 10 years using an accelerated method. The goodwill will be evaluated annually for impairment. The goodwill is not deductible for tax purposes.
The fair values of deposit liabilities with no stated maturities such as checking, money market and savings accounts, were assumed to equal the carrying amounts since these deposits are payable on demand.
-73-
Table of Contents
The fair values of certificates of deposits and IRAs represent the present value of contractual cash flows discounted at market rates for similar certificates of deposit.
Pascack Bancorp
On January 7, 2016, the Company completed its acquisition of Pascack Bancorp, Inc. (“Pascack”), a bank holding company headquartered in Waldwick, New Jersey. Pascack was the parent of Pascack Community Bank, which operated 8 branches in Bergen and Essex Counties in New Jersey. This acquisition enabled the Company to broaden its presence in Bergen and Essex counties. Effective as of the close of business on January 7, 2016, Pascack merged into the Company, and Pascack Community Bank merged into Lakeland Bank. The merger agreement provided that the shareholders of Pascack would receive, at their election, for each outstanding share of Pascack common stock that they owned at the effective time of the merger, either 0.9576 shares of Lakeland Bancorp common stock or $11.35 in cash, subject to proration as described in the merger agreement, so that 90% of the aggregate merger consideration was shares of Lakeland Bancorp common stock and 10% was cash. Lakeland Bancorp issued 3,314,284 shares of its common stock in the merger and paid approximately $4.5 million in cash, including the cash paid in connection with the cancellation of Pascack stock options. Outstanding Pascack stock options were paid out in cash at the difference between $11.35 and an average strike price of $7.37 for a total cash payment of $122,000. This transaction resulted in $15.3 million of goodwill and generated $1.5 million in core deposit intangibles.
During the second quarter of 2016, the Company revised the estimated fair value of the acquired assets as of the acquisition date as the result of additional information obtained. The adjustment related to the fair market value of certain fixed assets which resulted in a $158,000 decrease in goodwill.
The acquisition was accounted for under the acquisition method of accounting. Accordingly, the assets acquired and liabilities assumed in the acquisition were recorded at their estimated fair values based on management’s best estimates using information available at the date of the acquisition, including the use of a third party valuation specialist. The fair values are preliminary estimates and subject to adjustment for up to one year after the closing date of the acquisition. The following table summarizes the estimated fair value of the acquired assets and liabilities assumed at the date of acquisition for Pascack, net of cash consideration paid.
| (in thousands) | ||||
| Cash and cash equivalents |
$ | 40,942 | ||
| Securities held to maturity |
3,925 | |||
| Federal Home Loan Bank stock |
2,962 | |||
| Loans |
319,575 | |||
| Premises and equipment |
14,438 | |||
| Goodwill |
15,311 | |||
| Identifiable intangible assets |
1,514 | |||
| Accrued interest receivable and other assets |
6,672 | |||
|
|
|
|||
| Total assets acquired |
405,339 | |||
|
|
|
|||
| Deposits |
(304,466 | ) | ||
| Other borrowings |
(57,308 | ) | ||
| Other liabilities |
(6,344 | ) | ||
|
|
|
|||
| Total liabilities assumed |
(368,118 | ) | ||
|
|
|
|||
| Net assets acquired |
$ | 37,221 | ||
|
|
|
Loans acquired in the Pascack acquisition were recorded at fair value, and there was no carryover related allowance for loan and lease losses. The fair values of loans acquired from Pascack were estimated
-74-
Table of Contents
using cash flow projections based on the remaining maturity and repricing terms. Cash flows were adjusted for estimated future credit losses and the rate of prepayments. Projected cash flows were then discounted to present value using a risk-adjusted market rate for similar loans.
The following is a summary of the loans accounted for in accordance with ASC 310-30 that were acquired in the Pascack acquisition as of the closing date.
| Acquired Credit Impaired Loans |
||||
| (in thousands) | ||||
| Contractually required principal and interest at acquisition |
$ | 4,932 | ||
| Contractual cash flows not expected to be collected (non-accretable difference) |
4,030 | |||
|
|
|
|||
| Expected cash flows at acquisition |
902 | |||
| Interest component of expected cash flows (accretable difference) |
85 | |||
|
|
|
|||
| Fair value of acquired loans |
$ | 817 | ||
|
|
|
|||
The core deposit intangible totaled $1.5 million and is being amortized over its estimated useful life of approximately 10 years using an accelerated method. The goodwill will be evaluated annually for impairment. The goodwill is not deductible for tax purposes.
The fair values of deposit liabilities with no stated maturities such as checking, money market and savings accounts, were assumed to equal the carrying amounts since these deposits are payable on demand. The fair values of certificates of deposits and IRAs represent the present value of contractual cash flows discounted at market rates for similar certificates of deposit.
Direct costs related to the Pascack and Harmony acquisitions were expensed as incurred. During the year ended December 31, 2016 and 2015, the Company incurred $4.1 million and $1.2 million, respectively, of merger and acquisition integration-related expenses, which have been separately stated in the Company’s consolidated statements of income.
-75-
Table of Contents
Supplemental Pro Forma Financial Information
The following table provides unaudited condensed pro forma financial information assuming that the Pascack and Harmony acquisitions had been completed as of January 1, 2016, for the year ended December 31, 2016 and as of January 1, 2015 for the year ended December 31, 2015. The table below has been prepared for comparative purposes only and is not necessarily indicative of the actual results that would have been attained had the acquisitions occurred as of the beginning of the periods presented, nor is it indicative of future results. Furthermore, the unaudited pro forma information does not reflect management’s estimate of any revenue-enhancing opportunities nor anticipated cost savings or the impact of conforming certain accounting policies of the acquired companies to the Company’s policies that may have occurred as a result of the integration and consolidation of Pascack’s and Harmony’s operations. The pro forma information shown reflects adjustments related to certain purchase accounting fair value adjustments; amortization of core deposit and other intangibles; and related income tax effects. The Company has not provided separate information regarding revenue and earnings of Pascack since the acquisition because of the manner in which Pascack’s branches and lending team were immediately merged into Lakeland’s branches and lending team, making such information impracticable to provide. Harmony contributed net interest income, net income and earnings per share of $6.6 million, $3.3 million and $0.07, respectively, for the year ended December 31, 2016.
| Pro-Forma December 31, 2016 |
Pro-Forma December 31, 2015 |
|||||||
| (in thousands, except per share amounts) | ||||||||
| Net interest income |
$ | 151,556 | $ | 140,702 | ||||
| Provision for loan losses |
4,223 | 1,942 | ||||||
| Noninterest income |
21,859 | 22,428 | ||||||
| Noninterest expense |
100,512 | 103,965 | ||||||
| Net income |
45,378 | 38,109 | ||||||
| Earnings per share: |
||||||||
| Fully diluted |
$ | 1.01 | $ | 0.86 | ||||
NOTE 3 - EARNINGS PER SHARE
The Company uses the two class method to compute earnings per common share. Participating securities include non-vested restricted stock. The following tables present the computation of basic and diluted earnings per share for the periods presented.
| Year Ended December 31, 2016 |
Income (Numerator) |
Shares (Denominator) |
Per Share Amount |
|||||||||
| (in thousands, except per share amounts) | ||||||||||||
| Basic earnings per share |
||||||||||||
| Net income available to common shareholders |
$ | 41,518 | 42,912 | $ | 0.97 | |||||||
| Less: earnings allocated to participating securities |
(396 | ) | — | (0.01 | ) | |||||||
|
|
|
|
|
|
|
|||||||
| Net income available to common shareholders |
$ | 41,122 | 42,912 | $ | 0.96 | |||||||
| Effect of dilutive securities |
||||||||||||
| Stock options and restricted stock |
— | 202 | (0.01 | ) | ||||||||
|
|
|
|
|
|
|
|||||||
| Diluted earnings per share |
||||||||||||
| Net income available to common shareholders plus assumed conversions |
$ | 41,122 | 43,114 | $ | 0.95 | |||||||
|
|
|
|
|
|
|
|||||||
-76-
Table of Contents
There were no antidilutive options to purchase common stock to be excluded from the above computation.
| Year Ended December 31, 2015 |
Income (Numerator) |
Shares (Denominator) |
Per Share Amount |
|||||||||
| (in thousands, except per share amounts) | ||||||||||||
| Basic earnings per share |
||||||||||||
| Net income available to common shareholders |
$ | 32,481 | 37,844 | $ | 0.86 | |||||||
| Less: earnings allocated to participating securities |
(263 | ) | — | (0.01 | ) | |||||||
|
|
|
|
|
|
|
|||||||
| Net income available to common shareholders |
$ | 32,218 | 37,844 | $ | 0.85 | |||||||
| Effect of dilutive securities |
||||||||||||
| Stock options and restricted stock |
— | 149 | — | |||||||||
|
|
|
|
|
|
|
|||||||
| Diluted earnings per share |
||||||||||||
| Net income available to common shareholders plus assumed conversions |
$ | 32,218 | 37,993 | $ | 0.85 | |||||||
|
|
|
|
|
|
|
|||||||
There were no antidilutive options to purchase common stock to be excluded from the above computation.
| Year Ended December 31, 2014 |
Income (Numerator) |
Shares (Denominator) |
Per Share Amount |
|||||||||
| (in thousands, except per share amounts) | ||||||||||||
| Basic earnings per share |
||||||||||||
| Net income available to common shareholders |
$ | 31,129 | 37,749 | $ | 0.82 | |||||||
| Less: earnings allocated to participating securities |
(222 | ) | — | 0.00 | ||||||||
|
|
|
|
|
|
|
|||||||
| Net income available to common shareholders |
$ | 30,907 | 37,749 | $ | 0.82 | |||||||
| Effect of dilutive securities |
||||||||||||
| Stock options and restricted stock |
— | 120 | — | |||||||||
|
|
|
|
|
|
|
|||||||
| Diluted earnings per share |
||||||||||||
| Net income available to common shareholders plus assumed conversions |
$ | 30,907 | 37,869 | $ | 0.82 | |||||||
|
|
|
|
|
|
|
|||||||
Options to purchase 115,831 shares of common stock at a weighted average of $12.06 per share were not included in the computation of diluted earnings per share because the option price and the grant date price were greater than the average market price during the period.
-77-
Table of Contents
NOTE 4 - INVESTMENT SECURITIES
The amortized cost, gross unrealized gains and losses, and the fair value of the Company’s available for sale and held to maturity securities are as follows:
| December 31, 2016 | December 31, 2015 | |||||||||||||||||||||||||||||||
| Amortized Cost |
Gross Unrealized Gains |
Gross Unrealized Losses |
Fair Value |
Amortized Cost |
Gross Unrealized Gains |
Gross Unrealized Losses |
Fair Value |
|||||||||||||||||||||||||
| (in thousands) | (in thousands) | |||||||||||||||||||||||||||||||
| AVAILABLE FOR SALE |
||||||||||||||||||||||||||||||||
| U.S. Treasury and U.S. government agencies |
$ | 118,537 | $ | 102 | $ | (1,280 | ) | $ | 117,359 | $ | 97,617 | $ | 190 | $ | (674 | ) | $ | 97,133 | ||||||||||||||
| Mortgage-backed securities, residential |
406,851 | 1,174 | (4,487 | ) | 403,538 | 280,018 | 1,717 | (2,283 | ) | 279,452 | ||||||||||||||||||||||
| Mortgage-backed securities, multifamily |
10,192 | 30 | (35 | ) | 10,187 | 10,249 | — | (129 | ) | 10,120 | ||||||||||||||||||||||
| Obligations of states and political subdivisions |
48,868 | 391 | (933 | ) | 48,326 | 35,639 | 910 | (51 | ) | 36,498 | ||||||||||||||||||||||
| Debt securities |
5,350 | 63 | (1 | ) | 5,412 | 498 | 3 | — | 501 | |||||||||||||||||||||||
| Equity securities |
17,314 | 5,000 | (432 | ) | 21,882 | 16,550 | 2,393 | (298 | ) | 18,645 | ||||||||||||||||||||||
|
|
|
|
|
|
|
|
|
|
|
|
|
|
|
|
|
|||||||||||||||||
| $ | 607,112 | $ | 6,760 | $ | (7,168 | ) | $ | 606,704 | $ | 440,571 | $ | 5,213 | $ | (3,435 | ) | $ | 442,349 | |||||||||||||||
|
|
|
|
|
|
|
|
|
|
|
|
|
|
|
|
|
|||||||||||||||||
| December 31, 2016 | December 31, 2015 | |||||||||||||||||||||||||||||||
| Amortized Cost |
Gross Unrealized Gains |
Gross Unrealized Losses |
Fair Value |
Amortized Cost |
Gross Unrealized Gains |
Gross Unrealized Losses |
Fair Value |
|||||||||||||||||||||||||
| (in thousands) | (in thousands) | |||||||||||||||||||||||||||||||
| HELD TO MATURITY |
||||||||||||||||||||||||||||||||
| U.S. government agencies |
$ | 33,553 | $ | 144 | $ | (430 | ) | $ | 33,267 | $ | 30,477 | $ | 289 | $ | (94 | ) | $ | 30,672 | ||||||||||||||
| Mortgage-backed securities, residential |
38,706 | 369 | (598 | ) | 38,477 | 36,466 | 411 | (426 | ) | 36,451 | ||||||||||||||||||||||
| Mortgage-backed securities, multifamily |
2,059 | — | (44 | ) | 2,015 | 2,159 | — | (60 | ) | 2,099 | ||||||||||||||||||||||
| Obligations of states and political subdivisions |
71,284 | 269 | (385 | ) | 71,168 | 45,617 | 809 | (156 | ) | 46,270 | ||||||||||||||||||||||
| Debt securities |
2,012 | 51 | — | 2,063 | 2,021 | 81 | — | 2,102 | ||||||||||||||||||||||||
|
|
|
|
|
|
|
|
|
|
|
|
|
|
|
|
|
|||||||||||||||||
| $ | 147,614 | $ | 833 | $ | (1,457 | ) | $ | 146,990 | $ | 116,740 | $ | 1,590 | $ | (736 | ) | $ | 117,594 | |||||||||||||||
|
|
|
|
|
|
|
|
|
|
|
|
|
|
|
|
|
|||||||||||||||||
The following table lists contractual maturities of investment securities classified as available for sale and held to maturity. Expected maturities will differ from contractual maturities because borrowers may have the right to call or prepay obligations with or without call or prepayment penalties.
| Available for Sale | Held to Maturity | |||||||||||||||
| Amortized | Fair | Amortized | Fair | |||||||||||||
| December 31, 2016 |
Cost | Value | Cost | Value | ||||||||||||
| (in thousands) | ||||||||||||||||
| Due in one year or less |
$ | 2,145 | $ | 2,152 | $ | 36,942 | $ | 36,873 | ||||||||
| Due after one year through five years |
87,659 | 87,734 | 29,935 | 30,085 | ||||||||||||
| Due after five years through ten years |
70,239 | 68,632 | 35,437 | 35,044 | ||||||||||||
| Due after ten years |
12,712 | 12,579 | 4,535 | 4,496 | ||||||||||||
|
|
|
|
|
|
|
|
|
|||||||||
| 172,755 | 171,097 | 106,849 | 106,498 | |||||||||||||
| Mortgage-backed securities |
417,043 | 413,725 | 40,765 | 40,492 | ||||||||||||
| Equity securities |
17,314 | 21,882 | — | — | ||||||||||||
|
|
|
|
|
|
|
|
|
|||||||||
| Total securities |
$ | 607,112 | $ | 606,704 | $ | 147,614 | $ | 146,990 | ||||||||
|
|
|
|
|
|
|
|
|
|||||||||
-78-
Table of Contents
The following table shows proceeds from sales of securities, gross gains and gross losses on sales and calls of securities for the periods indicated:
| Years Ended December 31, | ||||||||||||
| 2016 | 2015 | 2014 | ||||||||||
| (in thousands) | ||||||||||||
| Sale proceeds |
$ | 15,654 | $ | 33,613 | $ | 17,020 | ||||||
| Gross gains |
370 | 304 | 346 | |||||||||
| Gross losses |
— | (63 | ) | (344 | ) | |||||||
The above sale proceeds in 2014 include sales of $1.4 million in held to maturity mortgage-backed securities of which the Company had already collected over 90% of the principal outstanding. The Company realized $73,000 in gains on sales of these securities.
Gains or losses on sales of securities are based on the net proceeds and the adjusted carrying amount of the securities sold using the specific identification method.
Securities with a carrying value of approximately $443.4 million and $347.7 million at December 31, 2016 and 2015, respectively, were pledged to secure public deposits and for other purposes required by applicable laws and regulations.
The following table indicates the length of time individual securities have been in a continuous unrealized loss position at December 31, 2016 and 2015:
| December 31, 2016 |
Less than 12 Months | 12 Months or Longer | Total | |||||||||||||||||||||||||
| Fair Value | Unrealized Losses |
Fair Value | Unrealized Losses |
Number of Securities |
Fair Value | Unrealized Losses |
||||||||||||||||||||||
| (dollars in thousands) | ||||||||||||||||||||||||||||
| AVAILABLE FOR SALE |
||||||||||||||||||||||||||||
| U.S. Treasury and U.S. government agencies |
$ | 94,153 | $ | 1,280 | $ | — | $ | — | 18 | $ | 94,153 | $ | 1,280 | |||||||||||||||
| Mortgage-backed securities, residential |
292,873 | 4,078 | 15,453 | 409 | 91 | 308,326 | 4,487 | |||||||||||||||||||||
| Mortgage-backed securities, multifamily |
5,178 | 35 | — | — | 1 | 5,178 | 35 | |||||||||||||||||||||
| Obligations of states and political subdivisions |
29,904 | 933 | — | — | 54 | 29,904 | 933 | |||||||||||||||||||||
| Debt securities |
350 | 1 | — | — | 1 | 350 | 1 | |||||||||||||||||||||
| Equity securities |
6,030 | 94 | 4,720 | 338 | 2 | 10,750 | 432 | |||||||||||||||||||||
|
|
|
|
|
|
|
|
|
|
|
|
|
|
|
|||||||||||||||
| $ | 428,488 | $ | 6,421 | $ | 20,173 | $ | 747 | 167 | $ | 448,661 | $ | 7,168 | ||||||||||||||||
|
|
|
|
|
|
|
|
|
|
|
|
|
|
|
|||||||||||||||
| HELD TO MATURITY |
||||||||||||||||||||||||||||
| U.S. government agencies |
$ | 17,147 | $ | 430 | $ | — | $ | — | 3 | $ | 17,147 | $ | 430 | |||||||||||||||
| Mortgage-backed securities, residential |
27,909 | 535 | 1,061 | 63 | 15 | 28,970 | 598 | |||||||||||||||||||||
| Mortgage-backed securities, multifamily |
2,015 | 44 | — | — | 2 | 2,015 | 44 | |||||||||||||||||||||
| Obligations of states and political subdivisions |
50,302 | 384 | 401 | 1 | 43 | 50,703 | 385 | |||||||||||||||||||||
|
|
|
|
|
|
|
|
|
|
|
|
|
|
|
|||||||||||||||
| $ | 97,373 | $ | 1,393 | $ | 1,462 | $ | 64 | 63 | $ | 98,835 | $ | 1,457 | ||||||||||||||||
|
|
|
|
|
|
|
|
|
|
|
|
|
|
|
|||||||||||||||
-79-
Table of Contents
| December 31, 2015 |
Less than 12 Months | 12 Months or Longer | Total | |||||||||||||||||||||||||
| Fair Value | Unrealized Losses |
Fair Value | Unrealized Losses |
Number of securities |
Fair Value | Unrealized Losses |
||||||||||||||||||||||
| (dollars in thousands) | ||||||||||||||||||||||||||||
| AVAILABLE FOR SALE |
||||||||||||||||||||||||||||
| U.S. Treasury and U.S. government agencies |
$ | 80,192 | $ | 674 | $ | — | $ | — | 16 | $ | 80,192 | $ | 674 | |||||||||||||||
| Mortgage-backed securities, residential |
103,749 | 1,043 | 50,095 | 1,240 | 50 | 153,844 | 2,283 | |||||||||||||||||||||
| Mortgage-backed securities, multifamily |
10,120 | 129 | — | — | 2 | 10,120 | 129 | |||||||||||||||||||||
| Obligations of states and political subdivisions |
2,051 | 4 | 1,466 | 47 | 7 | 3,517 | 51 | |||||||||||||||||||||
| Debt securities |
— | — | — | — | — | — | — | |||||||||||||||||||||
| Equity securities |
247 | 24 | 4,643 | 274 | 3 | 4,890 | 298 | |||||||||||||||||||||
|
|
|
|
|
|
|
|
|
|
|
|
|
|
|
|||||||||||||||
| $ | 196,359 | $ | 1,874 | $ | 56,204 | $ | 1,561 | 78 | $ | 252,563 | $ | 3,435 | ||||||||||||||||
|
|
|
|
|
|
|
|
|
|
|
|
|
|
|
|||||||||||||||
| HELD TO MATURITY |
||||||||||||||||||||||||||||
| U.S. government agencies |
$ | 15,683 | $ | 94 | $ | — | $ | — | 3 | $ | 15,683 | $ | 94 | |||||||||||||||
| Mortgage-backed securities, residential |
20,283 | 262 | 6,687 | 164 | 11 | 26,970 | 426 | |||||||||||||||||||||
| Mortgage-backed securities, multifamily |
1,223 | 18 | 876 | 42 | 2 | 2,099 | 60 | |||||||||||||||||||||
| Obligations of states and political subdivisions |
9,181 | 149 | 2,043 | 7 | 15 | 11,224 | 156 | |||||||||||||||||||||
|
|
|
|
|
|
|
|
|
|
|
|
|
|
|
|||||||||||||||
| $ | 46,370 | $ | 523 | $ | 9,606 | $ | 213 | 31 | $ | 55,976 | $ | 736 | ||||||||||||||||
|
|
|
|
|
|
|
|
|
|
|
|
|
|
|
|||||||||||||||
Management has evaluated the securities in the above table and has concluded that none of the securities with unrealized losses has impairments that are other-than-temporary. Fair value below cost is solely due to interest rate movements and is deemed temporary.
Investment securities, including the mortgage-backed securities and corporate securities, are evaluated on a periodic basis to determine if factors are identified that would require further analysis. In evaluating the Company’s securities, management considers the following items:
| • | The Company’s ability and intent to hold the securities, including an evaluation of the need to sell the security to meet certain liquidity measures, or whether the Company has sufficient levels of cash to hold the identified security in order to recover the entire amortized cost of the security; |
| • | The financial condition of the underlying issuer; |
| • | The credit ratings of the underlying issuer and if any changes in the credit rating have occurred; |
| • | The length of time the security’s fair value has been less than amortized cost; and |
| • | Adverse conditions related to the security or its issuer if the issuer has failed to make scheduled payments or other factors. |
If the above factors indicate an additional analysis is required, management will perform a discounted cash flow analysis evaluating the security.
As of December 31, 2016, the equity securities include investments in other financial institutions for market appreciation purposes. These equities had a purchase price of $2.8 million and market value of $7.8 million as of December 31, 2016.
As of December 31, 2016, equity securities also included $14.1 million in investment funds that do not have a quoted market price, but use net asset value per share or its equivalent to measure fair value.
The investment funds include $3.3 million in funds that are primarily invested in community development loans that are guaranteed by the Small Business Administration (SBA). Because the funds are primarily guaranteed by the federal government there are minimal changes in market value between accounting periods. These funds can be redeemed within 60 day’s notice at the net asset value less unpaid management fees with the approval of the fund manager. As of December 31, 2016, the net amortized cost equaled the market value of the investment. There are no unfunded commitments related to this investment.
-80-
Table of Contents
The investment funds also include $10.8 million in funds that are invested in government guaranteed loans, mortgage-backed securities, small business loans and other instruments supporting affordable housing and economic development. The Company may redeem these funds at the net asset value calculated at the end of the current business day less any unpaid management fees. As of December 31, 2016, the amortized cost of these securities was $11.2 million and the fair value was $10.8 million. There are no restrictions on redemptions for the holdings in these investments other than the notice required by the fund manager. There are no unfunded commitments related to this investment.
NOTE 5 - LOANS AND LEASES AND OTHER REAL ESTATE
The following sets forth the composition of Lakeland’s loan and lease portfolio:
| December 31, | ||||||||
| 2016 | 2015 | |||||||
| (in thousands) | ||||||||
| Commercial, secured by real estate |
$ | 2,556,601 | $ | 1,761,589 | ||||
| Commercial, industrial and other |
350,228 | 307,044 | ||||||
| Leases |
67,016 | 56,660 | ||||||
| Real estate - residential mortgage |
349,581 | 389,692 | ||||||
| Real estate - construction |
211,109 | 118,070 | ||||||
| Home equity and consumer |
339,360 | 334,891 | ||||||
|
|
|
|
|
|||||
| Total loans and leases |
3,873,895 | 2,967,946 | ||||||
| Less deferred fees |
(3,297 | ) | (2,746 | ) | ||||
|
|
|
|
|
|||||
| Loans and leases, net of deferred fees |
$ | 3,870,598 | $ | 2,965,200 | ||||
|
|
|
|
|
|||||
As of December 31, 2016 and 2015, home equity and consumer loans included overdraft deposit balances of $364,000 and $705,000, respectively. At December 31, 2016 and December 31, 2015, Lakeland had $942.0 million and $738.7 million in loans pledged for potential borrowings at the Federal Home Loan Bank of New York (“FHLB”).
Purchased Credit Impaired Loans
The carrying value of loans acquired in the Pascack acquisition and accounted for in accordance with ASC Subtopic 310-30, “Loans and Debt Securities Acquired with Deteriorated Credit Quality,” was $627,000 at December 31, 2016, which was $190,000 less than the balance at the time of acquisition on January 7, 2016. The carrying value of loans acquired in the Harmony acquisition was $781,000 at December 31, 2016 which was substantially the same as the balance at acquisition date on July 1, 2016. Under ASC Subtopic 310-30, these loans, referred to as purchased credit impaired (“PCI”) loans, may be aggregated and accounted for as pools of loans if the loans being aggregated have common risk characteristics. The Company elected to account for the loans with evidence of credit deterioration individually rather than aggregate them into pools.
The following table presents changes in the accretable yield for PCI loans (in thousands). There were no PCI loans in 2015.
| Year Ended December 31, 2016 |
||||
| Balance, beginning of period |
$ | — | ||
| Acquisitions |
182 | |||
| Accretion |
(98 | ) | ||
| Net reclassification non-accretable difference |
61 | |||
|
|
|
|||
| Balance, end of period |
$ | 145 | ||
|
|
|
|||
-81-
Table of Contents
Portfolio Segments
Lakeland currently manages its credit products and the respective exposure to credit losses (credit risk) by the following specific portfolio segments which are levels at which Lakeland develops and documents its systematic methodology to determine the allowance for loan and lease losses attributable to each respective portfolio segment. These segments are:
| • | Commercial, secured by real estate - consists of commercial mortgage loans secured by owner occupied properties and non-owner occupied properties. The loans secured by owner occupied properties involve a variety of property types to conduct the borrower’s operations. The primary source of repayment for this type of loan is the cash flow from the business and is based upon the borrower’s financial health and the ability of the borrower and the business to repay. The loans secured by non-owner occupied properties involve investment properties for warehouse, retail, office space, etc., with a history of occupancy and cash flow. This commercial real estate category contains mortgage loans to the developers and owners of commercial real estate where the borrower intends to operate or sell the property at a profit and use the income stream or proceeds from the sale(s) to repay the loan. |
| • | Commercial, industrial and other - are loans made to provide funds for equipment and general corporate needs. Repayment of a loan primarily uses the funds obtained from the operation of the borrower’s business. Commercial loans also include lines of credit that are utilized to finance a borrower’s short-term credit needs and/or to finance a percentage of eligible receivables and inventory. |
| • | Leases - includes a small portfolio of equipment leases, which consists of leases primarily for essential equipment used by small to medium sized businesses. |
| • | Real estate - residential mortgage - contains permanent mortgage loans principally to consumers secured by residential real estate. Residential real estate loans are evaluated for the adequacy of repayment sources at the time of approval, based upon measures including credit scores, debt-to-income ratios, and collateral values. Loans may be either conforming or non-conforming. |
| • | Real estate-construction - construction loans, as defined, are intended to finance the construction of commercial properties and include loans for the acquisition and development of land. Construction loans represent a higher degree of risk than permanent real estate loans and may be affected by a variety of factors such as the borrower’s ability to control costs and adhere to time schedules and the risk that constructed units may not be absorbed by the market within the anticipated time frame or at the anticipated price. The loan commitment on these loans often includes an interest reserve that allows the lender to periodically advance loan funds to pay interest charges on the outstanding balance of the loan. |
| • | Home equity and consumer - includes primarily home equity loans and lines, installment loans, personal lines of credit and automobile loans. The home equity category consists mainly of loans and revolving lines of credit to consumers which are secured by residential real estate. These loans are typically secured with second mortgages on the homes, although many are secured with first mortgages. Other consumer loans include installment loans used by customers to purchase automobiles, boats and recreational vehicles. |
-82-
Table of Contents
Non-accrual and Past Due Loans
The following schedule sets forth certain information regarding Lakeland’s non-accrual loans and leases, its other real estate owned and other repossessed assets, and accruing troubled debt restructurings (“TDRs”) (in thousands):
| At December 31, | ||||||||
| 2016 | 2015 | |||||||
| Commercial, secured by real estate |
$ | 10,413 | $ | 10,446 | ||||
| Commercial, industrial and other |
167 | 103 | ||||||
| Leases |
153 | 316 | ||||||
| Real estate - residential mortgage |
6,048 | 8,664 | ||||||
| Real estate - construction |
1,472 | — | ||||||
| Home equity and consumer |
2,151 | 3,167 | ||||||
|
|
|
|
|
|||||
| Total non-accrual loans and leases |
20,404 | 22,696 | ||||||
| Other real estate and other repossessed assets |
1,072 | 983 | ||||||
|
|
|
|
|
|||||
| TOTAL NON-PERFORMING ASSETS |
$ | 21,476 | $ | 23,679 | ||||
|
|
|
|
|
|||||
| Troubled debt restructurings, still accruing |
$ | 8,802 | $ | 10,108 | ||||
|
|
|
|
|
|||||
Non-accrual loans included $2.4 million and $2.5 million of TDRs for the years ended December 31, 2016 and 2015, respectively. As of December 31, 2016, the Company had $3.7 million in residential mortgages and consumer home equity loans included in the table above that were in the process of foreclosure.
An age analysis of past due loans, segregated by class of loans as of December 31, 2016 and 2015 is as follows:
| December 31, 2016 |
30-59 Days Past Due |
60-89 Days Past Due |
Greater Than 89 Days |
Total Past Due |
Current | Total Loans and Leases |
Recorded Investment Greater than 89 Days and Still Accruing |
|||||||||||||||||||||
| (in thousands) | ||||||||||||||||||||||||||||
| Commercial, secured by real estate |
$ | 6,082 | $ | 1,234 | $ | 9,313 | $ | 16,629 | $ | 2,539,972 | $ | 2,556,601 | $ | — | ||||||||||||||
| Commercial, industrial and other |
1,193 | 213 | 42 | 1,448 | 348,780 | 350,228 | — | |||||||||||||||||||||
| Leases |
132 | 78 | 153 | 363 | 66,653 | 67,016 | — | |||||||||||||||||||||
| Real estate - residential mortgage |
2,990 | 1,057 | 5,330 | 9,377 | 340,204 | 349,581 | — | |||||||||||||||||||||
| Real estate - construction |
3,409 | — | 1,472 | 4,881 | 206,228 | 211,109 | — | |||||||||||||||||||||
| Home equity and consumer |
1,260 | 129 | 2,049 | 3,438 | 335,922 | 339,360 | 10 | |||||||||||||||||||||
|
|
|
|
|
|
|
|
|
|
|
|
|
|
|
|||||||||||||||
| $ | 15,066 | $ | 2,711 | $ | 18,359 | $ | 36,136 | $ | 3,837,759 | $ | 3,873,895 | $ | 10 | |||||||||||||||
|
|
|
|
|
|
|
|
|
|
|
|
|
|
|
|||||||||||||||
| December 31, 2015 |
30-59 Days Past Due |
60-89 Days Past Due |
Greater Than 89 Days |
Total Past Due |
Current | Total Loans and Leases |
Recorded Investment Greater than 89 Days and Still Accruing |
|||||||||||||||||||||
| (in thousands) | ||||||||||||||||||||||||||||
| Commercial, secured by real estate |
$ | 1,465 | $ | 693 | $ | 7,853 | $ | 10,011 | $ | 1,751,578 | $ | 1,761,589 | $ | — | ||||||||||||||
| Commercial, industrial and other |
205 | — | 103 | 308 | 306,736 | 307,044 | — | |||||||||||||||||||||
| Leases |
62 | 26 | 316 | 404 | 56,256 | 56,660 | — | |||||||||||||||||||||
| Real estate - residential mortgage |
1,361 | 725 | 7,472 | 9,558 | 380,134 | 389,692 | — | |||||||||||||||||||||
| Real estate - construction |
— | — | — | — | 118,070 | 118,070 | — | |||||||||||||||||||||
| Home equity and consumer |
876 | 141 | 3,498 | 4,515 | 330,376 | 334,891 | 331 | |||||||||||||||||||||
|
|
|
|
|
|
|
|
|
|
|
|
|
|
|
|||||||||||||||
| $ | 3,969 | $ | 1,585 | $ | 19,242 | $ | 24,796 | $ | 2,943,150 | $ | 2,967,946 | $ | 331 | |||||||||||||||
|
|
|
|
|
|
|
|
|
|
|
|
|
|
|
|||||||||||||||
-83-
Table of Contents
Impaired Loans
Lakeland’s policy regarding impaired loans is discussed in Note 1 – Summary of Accounting Policies – Loans and Leases and Allowance for Loan and Lease Losses. The Company defines impaired loans as all non-accrual loans with recorded investments of $500,000 or greater. Impaired loans also includes all loans modified in troubled debt restructurings.
| December 31, 2016 |
Recorded Investment in Impaired Loans |
Contractual Unpaid Principal Balance |
Related Allowance |
Interest Income Recognized |
Average Investment in Impaired Loans |
|||||||||||||||
| (in thousands) | ||||||||||||||||||||
| Loans without related allowance: |
||||||||||||||||||||
| Commercial, secured by real estate |
$ | 12,764 | $ | 13,195 | $ | — | $ | 229 | $ | 13,631 | ||||||||||
| Commercial, industrial and other |
603 | 603 | — | 24 | 1,109 | |||||||||||||||
| Leases |
— | — | — | — | — | |||||||||||||||
| Real estate - residential mortgage |
1,880 | 3,146 | — | 16 | 2,430 | |||||||||||||||
| Real estate - construction |
1,471 | 1,471 | — | — | 12 | |||||||||||||||
| Home equity and consumer |
139 | 139 | — | — | 388 | |||||||||||||||
| Loans with related allowance: |
||||||||||||||||||||
| Commercial, secured by real estate |
5,860 | 6,142 | 392 | 273 | 6,549 | |||||||||||||||
| Commercial, industrial and other |
349 | 349 | 12 | 17 | 360 | |||||||||||||||
| Leases |
— | — | — | — | 1 | |||||||||||||||
| Real estate - residential mortgage |
1,031 | 1,100 | 31 | 30 | 1,011 | |||||||||||||||
| Real estate - construction |
— | — | — | — | — | |||||||||||||||
| Home equity and consumer |
1,188 | 1,211 | 94 | 59 | 1,184 | |||||||||||||||
| Total: |
||||||||||||||||||||
| Commercial, secured by real estate |
$ | 18,624 | $ | 19,337 | $ | 392 | $ | 502 | $ | 20,180 | ||||||||||
| Commercial, industrial and other |
952 | 952 | 12 | 41 | 1,469 | |||||||||||||||
| Leases |
— | — | — | — | 1 | |||||||||||||||
| Real estate - residential mortgage |
2,911 | 4,246 | 31 | 46 | 3,441 | |||||||||||||||
| Real estate - construction |
1,471 | 1,471 | — | — | 12 | |||||||||||||||
| Home equity and consumer |
1,327 | 1,350 | 94 | 59 | 1,572 | |||||||||||||||
|
|
|
|
|
|
|
|
|
|
|
|||||||||||
| $ | 25,285 | $ | 27,356 | $ | 529 | $ | 648 | $ | 26,675 | |||||||||||
|
|
|
|
|
|
|
|
|
|
|
|||||||||||
-84-
Table of Contents
| December 31, 2015 |
Recorded Investment in Impaired Loans |
Contractual Unpaid Principal Balance |
Related Allowance |
Interest Income Recognized |
Average Investment in Impaired Loans |
|||||||||||||||
| (in thousands) | ||||||||||||||||||||
| Loans without related allowance: |
||||||||||||||||||||
| Commercial, secured by real estate |
$ | 14,065 | $ | 14,712 | $ | — | $ | 344 | $ | 12,928 | ||||||||||
| Commercial, industrial and other |
209 | 887 | — | 14 | 749 | |||||||||||||||
| Leases |
— | — | — | — | — | |||||||||||||||
| Real estate - residential mortgage |
2,195 | 2,242 | — | — | 2,096 | |||||||||||||||
| Real estate - construction |
— | — | — | — | 94 | |||||||||||||||
| Home equity and consumer |
574 | 575 | — | 5 | 762 | |||||||||||||||
| Loans with related allowance: |
||||||||||||||||||||
| Commercial, secured by real estate |
5,721 | 5,918 | 598 | 271 | 6,249 | |||||||||||||||
| Commercial, industrial and other |
1,023 | 1,023 | 77 | 32 | 717 | |||||||||||||||
| Leases |
6 | 6 | 1 | — | — | |||||||||||||||
| Real estate - residential mortgage |
832 | 865 | 73 | 37 | 840 | |||||||||||||||
| Real estate - construction |
380 | 380 | 21 | 13 | 308 | |||||||||||||||
| Home equity and consumer |
1,001 | 1,013 | 73 | 54 | 1,006 | |||||||||||||||
| Total: |
||||||||||||||||||||
| Commercial, secured by real estate |
$ | 19,786 | $ | 20,630 | $ | 598 | $ | 615 | $ | 19,177 | ||||||||||
| Commercial, industrial and other |
1,232 | 1,910 | 77 | 46 | 1,466 | |||||||||||||||
| Leases |
6 | 6 | 1 | — | — | |||||||||||||||
| Real estate - residential mortgage |
3,027 | 3,107 | 73 | 37 | 2,936 | |||||||||||||||
| Real estate - construction |
380 | 380 | 21 | 13 | 402 | |||||||||||||||
| Home equity and consumer |
1,575 | 1,588 | 73 | 59 | 1,768 | |||||||||||||||
|
|
|
|
|
|
|
|
|
|
|
|||||||||||
| $ | 26,006 | $ | 27,621 | $ | 843 | $ | 770 | $ | 25,749 | |||||||||||
|
|
|
|
|
|
|
|
|
|
|
|||||||||||
| December 31, 2014 |
Recorded Investment in Impaired Loans |
Contractual Unpaid Principal Balance |
Related Allowance |
Interest Income Recognized |
Average Investment in Impaired Loans |
|||||||||||||||
| (in thousands) | ||||||||||||||||||||
| Loans without related allowance: |
||||||||||||||||||||
| Commercial, secured by real estate |
$ | 14,172 | $ | 15,520 | $ | — | $ | 436 | $ | 16,092 | ||||||||||
| Commercial, industrial and other |
327 | 1,697 | — | 43 | 1,513 | |||||||||||||||
| Real estate - residential mortgage |
1,681 | 1,681 | — | — | 308 | |||||||||||||||
| Real estate - construction |
188 | 552 | — | — | 464 | |||||||||||||||
| Home equity and consumer |
741 | 741 | — | 7 | 153 | |||||||||||||||
| Loans with related allowance: |
||||||||||||||||||||
| Commercial, secured by real estate |
5,666 | 5,818 | 634 | 156 | 3,858 | |||||||||||||||
| Commercial, industrial and other |
425 | 425 | 10 | 9 | 342 | |||||||||||||||
| Real estate - residential mortgage |
1,238 | 1,238 | 217 | 19 | 438 | |||||||||||||||
| Home equity and consumer |
1,255 | 1,255 | 1,031 | 41 | 975 | |||||||||||||||
| Total: |
||||||||||||||||||||
| Commercial, secured by real estate |
$ | 19,838 | $ | 21,338 | $ | 634 | $ | 592 | $ | 19,950 | ||||||||||
| Commercial, industrial and other |
752 | 2,122 | 10 | 52 | 1,855 | |||||||||||||||
| Real estate - residential mortgage |
2,919 | 2,919 | 217 | 19 | 746 | |||||||||||||||
| Real estate - construction |
188 | 552 | — | — | 464 | |||||||||||||||
| Home equity and consumer |
1,996 | 1,996 | 1,031 | 48 | 1,128 | |||||||||||||||
|
|
|
|
|
|
|
|
|
|
|
|||||||||||
| $ | 25,693 | $ | 28,927 | $ | 1,892 | $ | 711 | $ | 24,143 | |||||||||||
|
|
|
|
|
|
|
|
|
|
|
|||||||||||
Interest which would have been accrued on impaired loans and leases during 2016, 2015 and 2014 was $1.7 million, $1.6 million and $1.8 million, respectively.
-85-
Table of Contents
Credit Quality Indicators
The class of loans are determined by internal risk rating. Management closely and continually monitors the quality of its loans and leases and assesses the quantitative and qualitative risks arising from the credit quality of its loans and leases. It is the policy of Lakeland to require that a Credit Risk Rating be assigned to all commercial loans and loan commitments. The Credit Risk Rating System has been developed by management to provide a methodology to be used by Loan Officers, Department Heads and Senior Management in identifying various levels of credit risk that exist within Lakeland’s loan portfolios. The risk rating system assists Senior Management in evaluating Lakeland’s loan portfolio, analyzing trends and determining the proper level of required reserves to be recommended to the Board. In assigning risk ratings, management considers, among other things, a borrower’s debt service coverage, earnings strength, loan to value ratios, industry conditions and economic conditions. Management categorizes loans and commitments into a one (1) to nine (9) numerical structure with rating 1 being the strongest rating and rating 9 being the weakest. Ratings 1 through 5W are considered “Pass” ratings. “Pass” ratings on loans are given to loans that management considers to be of acceptable or better quality. A rating of 5W, or “Watch” is a loan that requires more than the usual amount of monitoring due to declining earnings, strained cash flow, increasing leverage and/or weakening market. These borrowers generally have limited additional debt capacity and modest coverage and average or below average asset quality, margins and market share. Rating 6, “Other Assets Especially Mentioned” is used for loans exhibiting identifiable credit weakness which if not checked or corrected could weaken the loan quality or inadequately protect the bank’s credit position at some future date. Rating 7, “Substandard,” is used on loans that are inadequately protected by the current sound worth and paying capacity of the obligors or of the collateral pledged, if any. A substandard loan has a well-defined weakness or weaknesses that may jeopardize the liquidation of the debt. Rating 8, “Doubtful,” are loans that exhibit all of the weaknesses inherent in substandard loans, but have the added characteristics that the weaknesses make collection or liquidation in full improbable on the basis of existing facts. Rating 9, “Loss,” is a rating for loans or portions of loans that are considered uncollectible and of such little value that their continuance as bankable loans is not warranted.
The following table shows Lakeland’s commercial loan portfolio as of December 31, 2016 and 2015, by the risk ratings discussed above (in thousands):
| December 31, 2016 |
Commercial, Secured by Real Estate |
Commercial, Industrial and Other |
||||||||||
| RISK RATING | Real Estate - Construction |
|||||||||||
| 1 |
$ | — | $ | 1,449 | $ | — | ||||||
| 2 |
— | 26,743 | — | |||||||||
| 3 |
82,102 | 36,644 | — | |||||||||
| 4 |
729,281 | 135,702 | 28,177 | |||||||||
| 5 |
1,615,331 | 129,366 | 175,595 | |||||||||
| 5W - Watch |
68,372 | 6,395 | 1,223 | |||||||||
| 6 - Other assets especially mentioned |
33,015 | 5,242 | — | |||||||||
| 7 - Substandard |
28,500 | 8,687 | 6,114 | |||||||||
| 8 - Doubtful |
— | — | — | |||||||||
| 9 - Loss |
— | — | — | |||||||||
|
|
|
|
|
|
|
|||||||
| Total |
$ | 2,556,601 | $ | 350,228 | $ | 211,109 | ||||||
|
|
|
|
|
|
|
|||||||
-86-
Table of Contents
| December 31, 2015 |
Commercial, Secured by Real Estate |
Commercial, Industrial and Other |
||||||||||
| RISK RATING | Real Estate - Construction |
|||||||||||
| 1 |
$ | — | $ | 3,517 | $ | — | ||||||
| 2 |
— | 9,662 | — | |||||||||
| 3 |
65,199 | 56,895 | — | |||||||||
| 4 |
526,909 | 111,702 | 19,125 | |||||||||
| 5 |
1,044,888 | 105,301 | 94,535 | |||||||||
| 5W - Watch |
43,342 | 4,259 | 146 | |||||||||
| 6 - Other assets especially mentioned |
34,570 | 4,105 | 1,851 | |||||||||
| 7 - Substandard |
46,681 | 11,603 | 2,413 | |||||||||
| 8 - Doubtful |
— | — | — | |||||||||
| 9 - Loss |
— | — | — | |||||||||
|
|
|
|
|
|
|
|||||||
| Total |
$ | 1,761,589 | $ | 307,044 | $ | 118,070 | ||||||
|
|
|
|
|
|
|
|||||||
This table does not include residential mortgage loans, consumer loans, or leases because they are evaluated on their payment status.
Allowance for Loan and Lease Losses
In 2015, the Company refined and enhanced its assessment of the adequacy of the allowance for loan and lease losses by extending the lookback period on its commercial loan portfolios from three years to five years and by extending the lookback period for all other portfolios from two to three years in order to capture more of the economic cycle. It also enhanced its qualitative factor framework to include a factor that captures the risk related to appraised real estate values, and how those values could change in relation to a change in capitalization rates. This enhancement is meant to increase the level of precision in the allowance for loan and lease losses. As a result, the Company will no longer have an “unallocated” segment in its allowance for loan losses, as the risks and uncertainties meant to be captured by the unallocated allowance have been included in the qualitative framework for the respective portfolios. As such, the unallocated allowance has in essence been reallocated to the certain portfolios based on the risks and uncertainties it was meant to capture.
-87-
Table of Contents
The following table details activity in the allowance for loan and lease losses by portfolio segment and the related recorded investment in loans and leases for the years ended December 31, 2016, 2015 and 2014:
| December 31, 2016 |
Commercial, Secured by Real Estate |
Commercial, Industrial and Other |
Leases | Real Estate - Residential Mortgage |
Real Estate - Construction |
Home Equity and Consumer |
Total | |||||||||||||||||||||
| (in thousands) | ||||||||||||||||||||||||||||
| Beginning balance |
$ | 20,223 | $ | 2,637 | $ | 460 | $ | 2,588 | $ | 1,591 | $ | 3,375 | $ | 30,874 | ||||||||||||||
| Charge-offs |
(410 | ) | (796 | ) | (366 | ) | (1,103 | ) | — | (1,980 | ) | (4,655 | ) | |||||||||||||||
| Recoveries |
297 | 202 | 31 | 8 | 18 | 247 | 803 | |||||||||||||||||||||
| Provision |
1,113 | (320 | ) | 423 | 471 | 743 | 1,793 | 4,223 | ||||||||||||||||||||
|
|
|
|
|
|
|
|
|
|
|
|
|
|
|
|||||||||||||||
| Ending balance |
$ | 21,223 | $ | 1,723 | $ | 548 | $ | 1,964 | $ | 2,352 | $ | 3,435 | $ | 31,245 | ||||||||||||||
|
|
|
|
|
|
|
|
|
|
|
|
|
|
|
|||||||||||||||
| Ending balance: Individually evaluated for impairment |
$ | 392 | $ | 12 | $ | — | $ | 31 | $ | — | $ | 94 | $ | 529 | ||||||||||||||
| Ending balance: Collectively evaluated for impairment |
20,831 | 1,711 | 548 | 1,933 | 2,352 | 3,341 | $ | 30,716 | ||||||||||||||||||||
|
|
|
|
|
|
|
|
|
|
|
|
|
|
|
|||||||||||||||
| Ending balance |
$ | 21,223 | $ | 1,723 | $ | 548 | $ | 1,964 | $ | 2,352 | $ | 3,435 | $ | 31,245 | ||||||||||||||
|
|
|
|
|
|
|
|
|
|
|
|
|
|
|
|||||||||||||||
| LOANS AND LEASES |
||||||||||||||||||||||||||||
| Ending balance: Individually evaluated for impairment |
$ | 18,624 | $ | 952 | $ | — | $ | 2,911 | $ | 1,471 | $ | 1,327 | $ | 25,285 | ||||||||||||||
| Ending balance: Collectively evaluated for impairment |
2,536,858 | 349,001 | 67,016 | 346,670 | 209,638 | 338,019 | $ | 3,847,202 | ||||||||||||||||||||
| Ending balance: Loans acquired with deteriorated credit quality |
1,119 | 275 | — | — | — | 14 | 1,408 | |||||||||||||||||||||
|
|
|
|
|
|
|
|
|
|
|
|
|
|
|
|||||||||||||||
| Ending balance (1) |
$ | 2,556,601 | $ | 350,228 | $ | 67,016 | $ | 349,581 | $ | 211,109 | $ | 339,360 | $ | 3,873,895 | ||||||||||||||
|
|
|
|
|
|
|
|
|
|
|
|
|
|
|
|||||||||||||||
| (1) | Excludes deferred fees |
-88-
Table of Contents
| December 31, 2015 |
Commercial, Secured by Real Estate |
Commercial, Industrial and Other |
Leases | Real Estate - Residential Mortgage |
Real Estate - Construction |
Home Equity and Consumer |
Unallocated | Total | ||||||||||||||||||||||||
| (in thousands) | ||||||||||||||||||||||||||||||||
| Beginning balance |
$ | 13,577 | $ | 3,196 | $ | 582 | $ | 4,020 | $ | 553 | $ | 6,333 | $ | 2,423 | $ | 30,684 | ||||||||||||||||
| Charge-offs |
(1,821 | ) | (205 | ) | (548 | ) | (375 | ) | (20 | ) | (1,511 | ) | — | (4,480 | ) | |||||||||||||||||
| Recoveries |
2,221 | 183 | 26 | 63 | 106 | 129 | — | 2,728 | ||||||||||||||||||||||||
| Provision |
6,246 | (537 | ) | 400 | (1,120 | ) | 952 | (1,576 | ) | (2,423 | ) | 1,942 | ||||||||||||||||||||
|
|
|
|
|
|
|
|
|
|
|
|
|
|
|
|
|
|||||||||||||||||
| Ending balance |
$ | 20,223 | $ | 2,637 | $ | 460 | $ | 2,588 | $ | 1,591 | $ | 3,375 | $ | — | $ | 30,874 | ||||||||||||||||
|
|
|
|
|
|
|
|
|
|
|
|
|
|
|
|
|
|||||||||||||||||
| Ending balance: Individually evaluated for impairment |
$ | 598 | $ | 77 | $ | 1 | $ | 73 | $ | 21 | $ | 73 | $ | — | $ | 843 | ||||||||||||||||
| Ending balance: Collectively evaluated for impairment |
19,625 | 2,560 | 459 | 2,515 | 1,570 | 3,302 | — | $ | 30,031 | |||||||||||||||||||||||
|
|
|
|
|
|
|
|
|
|
|
|
|
|
|
|
|
|||||||||||||||||
| Ending balance |
$ | 20,223 | $ | 2,637 | $ | 460 | $ | 2,588 | $ | 1,591 | $ | 3,375 | $ | — | $ | 30,874 | ||||||||||||||||
|
|
|
|
|
|
|
|
|
|
|
|
|
|
|
|
|
|||||||||||||||||
| LOANS AND LEASES | ||||||||||||||||||||||||||||||||
| Ending balance: Individually evaluated for impairment |
$ | 19,786 | $ | 1,232 | $ | 6 | $ | 3,027 | $ | 380 | $ | 1,575 | $ | — | $ | 26,006 | ||||||||||||||||
| Ending balance: Collectively evaluated for impairment |
1,741,803 | 305,812 | 56,654 | 386,665 | 117,690 | 333,316 | — | $ | 2,941,940 | |||||||||||||||||||||||
|
|
|
|
|
|
|
|
|
|
|
|
|
|
|
|
|
|||||||||||||||||
| Ending balance (1) |
$ | 1,761,589 | $ | 307,044 | $ | 56,660 | $ | 389,692 | $ | 118,070 | $ | 334,891 | $ | — | $ | 2,967,946 | ||||||||||||||||
|
|
|
|
|
|
|
|
|
|
|
|
|
|
|
|
|
|||||||||||||||||
| (1) | Excludes deferred fees |
-89-
Table of Contents
| December 31, 2014 |
Commercial, Secured by Real Estate |
Commercial, Industrial and Other |
Leases | Real Estate - Residential Mortgage |
Real Estate - Construction |
Home Equity and Consumer |
Unallocated | Total | ||||||||||||||||||||||||
| (in thousands) | ||||||||||||||||||||||||||||||||
| Beginning balance |
$ | 14,463 | $ | 5,331 | $ | 504 | $ | 3,214 | $ | 542 | $ | 2,737 | $ | 3,030 | $ | 29,821 | ||||||||||||||||
| Charge-offs |
(2,282 | ) | (999 | ) | (597 | ) | (827 | ) | (25 | ) | (2,697 | ) | — | (7,427 | ) | |||||||||||||||||
| Recoveries |
999 | 1,039 | 19 | 42 | 106 | 220 | — | 2,425 | ||||||||||||||||||||||||
| Provision |
397 | (2,175 | ) | 656 | 1,591 | (70 | ) | 6,073 | (607 | ) | 5,865 | |||||||||||||||||||||
|
|
|
|
|
|
|
|
|
|
|
|
|
|
|
|
|
|||||||||||||||||
| Ending balance |
$ | 13,577 | $ | 3,196 | $ | 582 | $ | 4,020 | $ | 553 | $ | 6,333 | $ | 2,423 | $ | 30,684 | ||||||||||||||||
|
|
|
|
|
|
|
|
|
|
|
|
|
|
|
|
|
|||||||||||||||||
| Ending balance: Individually evaluated for impairment |
$ | 634 | $ | 10 | $ | — | $ | 217 | $ | — | $ | 1,031 | $ | — | $ | 1,892 | ||||||||||||||||
| Ending balance: Collectively evaluated for impairment |
12,943 | 3,186 | 582 | 3,803 | 553 | 5,302 | 2,423 | $ | 28,792 | |||||||||||||||||||||||
|
|
|
|
|
|
|
|
|
|
|
|
|
|
|
|
|
|||||||||||||||||
| Ending balance |
$ | 13,577 | $ | 3,196 | $ | 582 | $ | 4,020 | $ | 553 | $ | 6,333 | $ | 2,423 | $ | 30,684 | ||||||||||||||||
|
|
|
|
|
|
|
|
|
|
|
|
|
|
|
|
|
|||||||||||||||||
| LOANS AND LEASES |
||||||||||||||||||||||||||||||||
| Ending balance: Individually evaluated for impairment |
$ | 19,838 | $ | 752 | $ | — | $ | 2,919 | $ | 188 | $ | 1,996 | $ | — | $ | 25,693 | ||||||||||||||||
| Ending balance: Collectively evaluated for impairment |
1,509,923 | 237,500 | 54,749 | 428,271 | 63,832 | 335,646 | — | $ | 2,629,921 | |||||||||||||||||||||||
|
|
|
|
|
|
|
|
|
|
|
|
|
|
|
|
|
|||||||||||||||||
| Ending balance (1) |
$ | 1,529,761 | $ | 238,252 | $ | 54,749 | $ | 431,190 | $ | 64,020 | $ | 337,642 | $ | — | $ | 2,655,614 | ||||||||||||||||
|
|
|
|
|
|
|
|
|
|
|
|
|
|
|
|
|
|||||||||||||||||
| (1) | Excludes deferred fees |
Lakeland also maintains a reserve for unfunded lending commitments which are included in other liabilities. This reserve was $2.5 million and $2.0 million at December 31, 2016 and December 31, 2015, respectively. Lakeland analyzes the adequacy of the reserve for unfunded lending commitments in conjunction with its analysis of the adequacy of the allowance for loan and lease losses. For more information on this analysis, see “Risk Elements” in Management’s Discussion and Analysis.
Troubled Debt Restructurings
TDRs are those loans where significant concessions have been made due to borrowers’ financial difficulties. Restructured loans typically involve a modification of terms such as a reduction of the stated interest rate, an extended moratorium of principal payments and/or an extension of the maturity date at a stated interest rate lower than the current market rate of a new loan with similar risk. Lakeland considers the potential losses on these loans as well as the remainder of its impaired loans when considering the adequacy of the allowance for loan losses.
-90-
Table of Contents
The following table summarizes loans that have been restructured during the periods presented:
| For the Year Ended December 31, 2016 |
For the Year Ended December 31, 2015 |
|||||||||||||||||||||||
| Number of Contracts |
Pre- Modification Outstanding Recorded Investment |
Post- Modification Outstanding Recorded Investment |
Number of Contracts |
Pre- Modification Outstanding Recorded Investment |
Post- Modification Outstanding Recorded Investment |
|||||||||||||||||||
| (dollars in thousands) | ||||||||||||||||||||||||
| Commercial, secured by real estate |
1 | $ | 303 | $ | 303 | 2 | $ | 1,458 | $ | 1,458 | ||||||||||||||
| Commercial, industrial and other |
— | — | — | 3 | 1,934 | 1,934 | ||||||||||||||||||
| Leases |
— | — | — | 1 | 14 | 14 | ||||||||||||||||||
| Real estate - residential mortgage |
1 | 255 | 255 | — | — | — | ||||||||||||||||||
| Real estate - construction |
— | — | — | 1 | 396 | 396 | ||||||||||||||||||
| Home equity and consumer |
3 | 285 | 285 | 1 | 9 | 9 | ||||||||||||||||||
|
|
|
|
|
|
|
|
|
|
|
|
|
|||||||||||||
| 5 | $ | 843 | $ | 843 | 8 | $ | 3,811 | $ | 3,811 | |||||||||||||||
|
|
|
|
|
|
|
|
|
|
|
|
|
|||||||||||||
The following table presents loans modified as TDRs within the previous 12 months from December 31, 2016 and 2015 that have defaulted during the subsequent twelve months:
| For the Year Ended December 31, 2016 |
For the Year Ended December 31, 2015 |
|||||||||||||||
| Number of Contracts |
Recorded Investment |
Number of Contracts |
Recorded Investment |
|||||||||||||
| (dollars in thousands) | ||||||||||||||||
| Commercial, secured by real estate |
— | $ | — | — | $ | — | ||||||||||
| Real estate - residential mortgage |
1 | 255 | — | — | ||||||||||||
| Home equity and consumer |
1 | 162 | — | — | ||||||||||||
|
|
|
|
|
|
|
|
|
|||||||||
| 2 | $ | 417 | — | $ | — | |||||||||||
|
|
|
|
|
|
|
|
|
|||||||||
Related Party Loans
Lakeland has entered into lending transactions in the ordinary course of business with directors, executive officers, principal stockholders and affiliates of such persons on similar terms, including interest rates and collateral, as those prevailing for comparable transactions with other borrowers not related to Lakeland. At December 31, 2016 and 2015, loans to these related parties amounted to $22.3 million and $28.4 million, respectively. There were new loans of $5.8 million to related parties and repayments of $11.9 million from related parties in 2016.
Mortgages Held for Sale
Residential mortgages originated by the bank and held for sale in the secondary market are carried at the lower of cost or fair market value. Fair value is generally determined by the value of purchase commitments on individual loans. Losses are recorded as a valuation allowance and charged to earnings. As of December 31, 2016, Lakeland had $1.7 million in mortgages held for sale compared to $1.2 million as of December 31, 2015.
-91-
Table of Contents
Leases
Future minimum lease payments of lease receivables are as follows (in thousands):
| 2017 |
$ | 24,007 | ||
| 2018 |
18,588 | |||
| 2019 |
12,874 | |||
| 2020 |
7,962 | |||
| 2021 |
2,982 | |||
| Thereafter |
603 | |||
|
|
|
|||
| $ | 67,016 | |||
|
|
|
Other Real Estate and Other Repossessed Assets
At December 31, 2016, Lakeland had other real estate owned and other repossessed assets of $1.1 million and $9,000, respectively. The other real estate owned that the Company held at December 31, 2016 included $1.1 million in residential property acquired as a result of foreclosure proceedings or through a deed in lieu of foreclosure. At December 31, 2015, Lakeland had other real estate owned and other repossessed assets of $934,000 and $49,000, respectively. The other real estate owned that the Company held at December 31, 2015 included $805,000 in residential property acquired as a result of foreclosure proceedings or through a deed in lieu of foreclosure. For the years ended December 31, 2016, 2015 and 2014, Lakeland had writedowns of $0, $119,000 and $135,000, respectively, on other real estate and other repossessed assets which are included in other real estate and repossessed asset expense in the Statement of Income.
NOTE 6 - PREMISES AND EQUIPMENT
| Estimated | December 31, | |||||||||||
| Useful Lives | 2016 | 2015 | ||||||||||
| (in thousands) | ||||||||||||
| Land |
Indefinite | $ | 10,981 | $ | 6,039 | |||||||
| Buildings and building improvements |
10 to 50 years | 49,475 | 35,469 | |||||||||
| Leasehold improvements |
10 to 25 years | 12,967 | 10,361 | |||||||||
| Furniture, fixtures and equipment |
2 to 30 years | 33,692 | 35,900 | |||||||||
|
|
|
|
|
|||||||||
| 107,115 | 87,769 | |||||||||||
| Less accumulated depreciation and amortization |
54,879 | 51,888 | ||||||||||
|
|
|
|
|
|||||||||
| $ | 52,236 | $ | 35,881 | |||||||||
|
|
|
|
|
|||||||||
Depreciation expense was $5.0 million, $4.0 million and $3.9 million for the years ended December 31, 2016, 2015 and 2014, respectively.
NOTE 7 - TIME DEPOSITS
At December 31, 2016, the schedule of maturities of certificates of deposit is as follows (in thousands):
| Year |
||||
| 2017 |
$ | 356,419 | ||
| 2018 |
117,231 | |||
| 2019 |
32,815 | |||
| 2020 |
34,439 | |||
| 2021 |
4,004 | |||
|
|
|
|||
| $ | 544,908 | |||
|
|
|
|||
-92-
Table of Contents
NOTE 8 - DEBT
Lines of Credit
As a member of the Federal Home Loan Bank of New York (FHLB), Lakeland has the ability to borrow overnight based on the market value of collateral pledged. As of December 31, 2016 and 2015, there were no overnight borrowings from the FHLB. As of December 31, 2016, Lakeland also had overnight federal funds lines available for it to borrow up to $192.0 million. Lakeland had borrowed $32.0 million and $115.0 million against these lines as of December 31, 2016 and 2015, respectively. Lakeland may also borrow from the discount window of the Federal Reserve Bank of New York based on the market value of collateral pledged. Lakeland had no borrowings with the Federal Reserve Bank of New York as of December 31, 2016 or 2015.
Federal Funds Purchased and Securities Sold Under Agreements to Repurchase
Short-term borrowings at December 31, 2016 and 2015 consisted of short-term securities sold under agreements to repurchase and federal funds purchased. Securities underlying the agreements were under Lakeland’s control. The following tables summarize information relating to securities sold under agreements to repurchase and federal funds purchased for the years presented. For purposes of the tables, the average amount outstanding was calculated based on a daily average.
| Federal Funds Purchased | 2016 | 2015 | 2014 | |||||||||
| (dollars in thousands) | ||||||||||||
| Balance at December 31 |
$ | 32,000 | $ | 115,000 | $ | 81,000 | ||||||
| Interest rate at December 31 |
0.85 | % | 0.65 | % | 0.35 | % | ||||||
| Maximum amount outstanding at any month-end during the year |
$ | 133,434 | $ | 130,000 | $ | 117,000 | ||||||
| Average amount outstanding during the year |
$ | 8,708 | $ | 22,734 | $ | 17,605 | ||||||
| Weighted average interest rate during the year |
0.71 | % | 0.45 | % | 0.39 | % | ||||||
| Securities Sold Under Agreements to Repurchase | 2016 | 2015 | 2014 | |||||||||
| (dollars in thousands) | ||||||||||||
| Balance at December 31 |
$ | 24,354 | $ | 36,234 | $ | 27,935 | ||||||
| Interest rate at December 31 |
0.02 | % | 0.02 | % | 0.02 | % | ||||||
| Maximum amount outstanding at any month-end during the year |
$ | 32,872 | $ | 40,140 | $ | 54,550 | ||||||
| Average amount outstanding during the year |
$ | 27,535 | $ | 31,293 | $ | 38,192 | ||||||
| Weighted average interest rate during the year |
0.03 | % | 0.03 | % | 0.03 | % | ||||||
Other Borrowings
FHLB Debt
At December 31, 2016, advances from the FHLB totaling $220.9 million will mature within four years. These advances are collateralized by certain securities and first mortgage loans. The advances had a weighted average interest rate of 1.81%.
At December 31, 2015, advances from the FHLB totaling $221.9 million will mature within three years. These advances are collateralized by certain securities and first mortgage loans. The advances had a weighted average interest rate of 1.38%.
-93-
Table of Contents
FHLB debt matures as follows (in thousands):
| 2017 |
$ | 115,039 | ||
| 2018 |
80,896 | |||
| 2019 |
19,930 | |||
| 2020 |
5,001 | |||
|
|
|
|||
| $ | 220,866 | |||
|
|
|
Long-term Securities Sold Under Agreements to Repurchase
At December 31, 2016, Lakeland had $40.0 million in long-term securities sold under agreements to repurchase compared to $50.0 million at December 31, 2015. These borrowings were able to be called at various dates starting in 2010. These borrowings are collateralized by certain securities. The borrowings had a weighted average interest rate of 3.26% and 2.80% on December 31, 2016 and December 31, 2015, respectively. These long-term securities sold under agreements to repurchase mature as follows (in thousands):
| 2017 |
$ | — | ||
| 2018 |
30,000 | |||
| 2019 |
— | |||
| Thereafter |
10,000 | |||
|
|
|
|||
| $ | 40,000 | |||
|
|
|
The above FHLB debt and long-term securities sold under agreements to repurchase are collateralized by certain securities. At times the market value of securities collateralizing our borrowings may decline due to changes in interest rates and may necessitate our lenders to issue a “margin call” which requires Lakeland to pledge additional securities to meet that margin call. As of December 31, 2016, the Company had $81.6 million in mortgage-backed securities pledged for its short-term and long-term securities sold under agreements to repurchase.
Subordinated Debentures
On September 30, 2016, the Company completed an offering of $75.0 million of fixed to floating rate subordinated notes due September 30, 2026. The notes will bear interest at a rate of 5.125% per annum until September 30, 2021 and will then reset quarterly to the then current three-month LIBOR plus 397 basis points until maturity in September, 2026, or their earlier redemption. The debt is included in Tier 2 capital for Lakeland Bancorp. Debt issuance costs totaled $1.5 million and are being amortized to maturity. Subordinated debt is presented net of issuance costs on the consolidated balance sheet.
In May 2007, the Company issued $20.6 million of junior subordinated debentures due August 31, 2037 to Lakeland Bancorp Capital Trust IV, a Delaware business trust. The distribution rate on these securities was 6.61% for 5 years and floats at LIBOR plus 152 basis points thereafter. The debentures are the sole asset of the Trust. The Trust issued 20,000 shares of trust preferred securities, $1,000 face value, for total proceeds of $20.0 million. The Company’s obligations under the debentures and related documents, taken together, constitute a full, irrevocable and unconditional guarantee on a subordinated basis by the Company of the Trust’s obligations under the preferred securities. The preferred securities are callable by the Company on or after August 1, 2012, or earlier if the deduction of related interest for federal income taxes is prohibited, treatment as Tier I capital is no longer permitted, or certain other contingencies arise. The preferred securities must be redeemed upon maturity of the debentures in 2037. On August 3, 2015, the Company acquired and extinguished $10.0 million of Lakeland Bancorp Capital Trust IV debentures and recorded a $1.8 million gain on the extinguishment of debt.
-94-
Table of Contents
In June 2003, the Company also issued $20.6 million of junior subordinated debentures due June 30, 2033 to Lakeland Bancorp Capital Trust II, a Delaware business trust. The distribution rate on these securities was 5.71% for 5 years and floats at LIBOR plus 310 basis points thereafter. The debentures are the sole asset of the Trust. The Trust issued 20,000 shares of trust preferred securities, $1,000 face value, for total proceeds of $20.0 million. The Company’s obligations under the debentures and related documents, taken together, constitute a full, irrevocable and unconditional guarantee on a subordinated basis by the Company of the Trust’s obligations under the preferred securities. The preferred securities are callable by the Company on or after June 30, 2008, or earlier if the deduction of related interest for federal income taxes is prohibited, treatment as Tier I capital is no longer permitted, or certain other contingencies arise. The preferred securities must be redeemed upon maturity of the debentures in 2033.
In June 2016, the Company entered into two cash flow swaps in order to hedge the variable cash outflows associated with the junior subordinated debentures issued to Lakeland Capital Trust II and Lakeland Capital Trust IV. For more information please see Note 18 – Derivatives.
NOTE 9 - STOCKHOLDERS’ EQUITY
On December 14, 2016, the Company successfully completed an at-the-market common stock issuance. A total of 2,739,650 shares of the Company’s common stock were sold at a weighted average price of $18.25, representing gross proceeds to the Company of approximately $50.0 million. Net proceeds from the transaction, after the sales commission and other expenses, were approximately $48.7 million.
On July 1, 2016, the Company completed its acquisition of Harmony Bank, a bank located in Ocean County, NJ. Lakeland Bancorp issued an aggregate of 3,201,109 shares of its common stock in the merger. Outstanding Harmony stock options were paid out in cash at the difference between $14.31 (Lakeland’s closing stock price on July 1, 2016 of $11.45 multiplied by 1.25) and the average strike price of $9.07 for a total cash payment of $869,000.
On January 7, 2016, the Company completed its acquisition of Pascack Bancorp, Inc. (“Pascack”), a bank holding company headquartered in Waldwick, New Jersey. Lakeland Bancorp issued 3,314,284 shares of its common stock in the merger and paid approximately $4.5 million in cash, including the cash paid in connection with the cancellation of Pascack stock options. Outstanding Pascack stock options were paid out in cash at the difference between $11.35 and an average strike price of $7.37 for a total cash payment of $122,000.
In the second quarter of 2014, the Company paid a 5% stock dividend.
NOTE 10 - INCOME TAXES
The components of income taxes are as follows:
| Years Ended December 31, |
||||||||||||
| 2016 | 2015 | 2014 | ||||||||||
| (in thousands) |
||||||||||||
| Current tax provision |
$ | 22,308 | $ | 16,991 | $ | 15,193 | ||||||
| Deferred tax benefit |
(987 | ) | (824 | ) | (34 | ) | ||||||
|
|
|
|
|
|
|
|||||||
| Total provision for income taxes |
$ | 21,321 | $ | 16,167 | $ | 15,159 | ||||||
|
|
|
|
|
|
|
|||||||
-95-
Table of Contents
The income tax provision reconciled to the income taxes that would have been computed at the statutory federal rate of 35% is as follows:
| Years Ended December 31, | ||||||||||||
| 2016 | 2015 | 2014 | ||||||||||
| (in thousands) | ||||||||||||
| Federal income tax, at statutory rates |
$ | 21,994 | $ | 17,028 | $ | 16,201 | ||||||
| Increase (deduction) in taxes resulting from: |
||||||||||||
| Tax-exempt income |
(1,671 | ) | (1,467 | ) | (1,387 | ) | ||||||
| State income tax, net of federal income tax effect |
552 | 132 | 337 | |||||||||
| Other, net |
446 | 474 | 8 | |||||||||
|
|
|
|
|
|
|
|||||||
| Provision for income taxes |
$ | 21,321 | $ | 16,167 | $ | 15,159 | ||||||
|
|
|
|
|
|
|
|||||||
The net deferred tax asset consisted of the following:
| December 31, | ||||||||
| 2016 | 2015 | |||||||
| Deferred tax assets: | (in thousands) | |||||||
| Allowance for loan and lease losses |
$ | 13,775 | $ | 13,445 | ||||
| Stock based compensation plans |
1,095 | 857 | ||||||
| Purchase accounting fair market value adjustments |
2,752 | 431 | ||||||
| Non-accrued interest |
730 | 632 | ||||||
| Deferred compensation |
2,648 | 2,207 | ||||||
| Depreciation and amortization |
1,486 | — | ||||||
| Other-than-temporary impairment loss on investment securities |
255 | 255 | ||||||
| Unrealized losses on securities available for sale |
292 | — | ||||||
| Unfunded pension benefits |
— | 9 | ||||||
| Other, net |
767 | 579 | ||||||
|
|
|
|
|
|||||
| Deferred tax assets |
23,800 | 18,415 | ||||||
|
|
|
|
|
|||||
| Deferred tax liabilities: |
||||||||
| Core deposit intangible from acquired companies |
1,366 | 631 | ||||||
| Undistributed income from subsidiary not consolidated for tax return purposes (REIT) |
924 | 845 | ||||||
| Deferred loan costs |
1,545 | 1,433 | ||||||
| Prepaid expenses |
641 | 549 | ||||||
| Depreciation and amortization |
— | 1,440 | ||||||
| Deferred gain on securities |
194 | 194 | ||||||
| Unfunded pension benefits |
18 | — | ||||||
| Unrealized gains on securities available for sale |
— | 622 | ||||||
| Unrealized gains on hedging derivative |
361 | — | ||||||
| Other |
841 | 591 | ||||||
|
|
|
|
|
|||||
| Deferred tax liabilities |
5,890 | 6,305 | ||||||
|
|
|
|
|
|||||
| Net deferred tax assets, included in other assets |
$ | 17,910 | $ | 12,110 | ||||
|
|
|
|
|
|||||
The Company recorded net deferred tax assets (liabilities) of $4.4 million and ($164,000) as a result of the acquisitions of Pascack and Harmony, respectively.
The Company evaluates the realizability of its deferred tax assets by examining its earnings history and projected future earnings and by assessing whether it is more likely than not that carryforwards would not be realized. Based upon the majority of the Company’s deferred tax assets having no expiration date, the Company’s earnings history, and the projections of future earnings, the Company’s management believes that it is more likely than not that all of the Company’s deferred tax assets as of December 31, 2016 will be realized.
-96-
Table of Contents
The Company evaluates tax positions that may be uncertain using a recognition threshold of more likely than not, and a measurement attribute for all tax positions taken or expected to be taken on a tax return, in order for those tax positions to be recognized in the financial statements. The Company had an unrecognized tax benefit of $111,000 as of December 31, 2013. In 2014, the Company reevaluated this unrecognized tax benefit and concluded that based on current information the tax position that it has taken is more likely than not to be upheld. Therefore, the Company recognized the tax benefit in the fourth quarter of 2014.
The Company is subject to U.S. federal income tax law as well as income tax of various state jurisdictions. Tax regulations within each jurisdiction are subject to the interpretation of the related tax laws and regulations and require significant judgment to apply. With few significant exceptions, the Company is no longer subject to U.S. federal examinations by tax authorities for the years before 2014 or to state and local examinations by tax authorities for the years before 2013.
NOTE 11 - EMPLOYEE BENEFIT PLANS
Profit Sharing Plan
The Company has a profit sharing plan for all its eligible employees. The Company’s annual contribution to the plan is determined by its Board of Directors. Annual contributions are allocated to participants on a point basis with accumulated benefits payable at retirement, or, at the discretion of the plan committee, upon termination of employment. Contributions made by the Company were approximately $600,000 a year for each of the years ended 2016, 2015, and 2014.
Benefit Obligations from Somerset Hills Acquisition
Somerset Hills, acquired by the Company in 2013, entered into a non-qualified Supplemental Executive Retirement Plan (“SERP”) with its former Chief Executive Officer and its Chief Financial Officer which entitles them to a benefit of $48,000 and $24,000, respectively, per year for 15 years after the earlier of retirement or death. The beneficiary of the Chief Financial Officer is currently being paid out under the plan. As of December 31, 2016 and 2015, the Company has a liability of $717,000 and $745,000, respectively, for these SERPs and has recognized an expense of $0, $95,000 and $109,000 in 2016, 2015 and 2014, respectively.
Retirement Savings Plans (401(k) plans)
Beginning in January 2002, the Company began contributing to its 401(k) plan. All eligible employees can contribute a portion of their annual salary with the Company matching up to 50% of the employee’s contributions. The Company’s contributions in 2016, 2015 and 2014 totaled $911,000, $760,000 and $740,000, respectively.
Pension Plan
Newton Trust Company, acquired by the Company in 2004, had a defined benefit pension plan (the Plan) that was frozen prior to the acquisition by the Company. All participants of the Plan ceased accruing benefits as of that date.
In 2014, the Company filed appropriate forms with the Internal Revenue Service and the Pension Benefit Guaranty Corporation to terminate the Plan and awaited approval from both entities. As a result of the Company’s intent to terminate the plan, the Company changed the portfolio allocation of the plan to minimize the fluctuation of the market value of the Plan’s assets. The Company also recorded a realized loss for the difference between the plan assets and the estimated payout of the plan of approximately $293,000 in 2014 and $238,000 in 2015.
-97-
Table of Contents
In 2015, the Company received the requisite approvals and terminated the plan. The Company made lump sum payments totaling $2.6 million as a result of this termination.
The accumulated benefit obligation as of December 31, 2015 is as follows:
| (in thousands) |
2015 | |||
| Accumulated postretirement benefit obligation |
$ | 2,334 | ||
| Interest cost |
14 | |||
| Actuarial loss |
213 | |||
| Divestiture curtailments or settlements |
(2,508 | ) | ||
| Estimated benefit payments |
(53 | ) | ||
|
|
|
|||
| Total accumulated postretirement benefit obligation |
— | |||
| Fair value of plan assets beginning of period |
2,020 | |||
| Return on plan assets |
9 | |||
| Benefits paid |
(2,561 | ) | ||
| Contribution |
532 | |||
|
|
|
|||
| Fair value of plan assets at end of year |
— | |||
| Funded status |
— | |||
| Unrecognized net actuarial loss |
— | |||
|
|
|
|||
| Liability |
$ | — | ||
|
|
|
|||
| Accumulated benefit obligation |
$ | — | ||
|
|
|
|||
The components of net periodic pension cost are as follows:
| (in thousands) |
2015 | 2014 | ||||||
| Amortization of actuarial loss |
$ | 84 | $ | 39 | ||||
| Interest cost on APBO |
14 | 94 | ||||||
| Expected return on plan assets |
(74 | ) | (95 | ) | ||||
|
|
|
|
|
|||||
| Net periodic postretirement cost |
$ | 24 | $ | 38 | ||||
|
|
|
|
|
|||||
Deferred Compensation Arrangements
High Point Financial Corp., a bank holding company acquired in 1999, had established deferred compensation arrangements for certain directors and executives of High Point Financial Corp. and its subsidiary, the National Bank of Sussex County. The deferred compensation plans differ, but generally provide for annual payments for ten to fifteen years following retirement. The Company’s liabilities under these arrangements are being accrued from the commencement of the plans over the participants’ remaining periods of service. The Company intends to fund its obligations under the deferred compensation arrangements with the increase in cash surrender value of life insurance policies that it has purchased on the respective participants. The deferred compensation plans do not hold any assets. For the years ended December 31, 2016, 2015 and 2014, there were expenses related to this plan of $3,000, $4,000 and $16,000, respectively. As of December 31, 2016 and 2015, the accrued liability for these plans was $214,000 and $241,000, respectively.
Supplemental Executive Retirement Plans
In 2003, the Company entered into a supplemental executive retirement plan (SERP) agreement with its former CEO that provides annual retirement benefits of $150,000 a year for a 15 year period when the former CEO reached the age of 65. Our former CEO retired and is receiving annual retirement benefits
-98-
Table of Contents
pursuant to the plan. In 2008, the Company entered into a SERP agreement with its current CEO that provides annual retirement benefits of $150,000 for a 15 year period when the CEO reaches the age of 65. In November 2008, the Company entered into a SERP with its Regional President and Chief Operating Officer that provides annual retirement benefits of $90,000 a year for a 10 year period upon his reaching the age of 65. In December 2014, the Company entered into a SERP with a Regional President that provides $84,500 a year for a 15 year period upon his reaching the age of 66 in November 2016. The Company intends to fund its obligations under the deferred compensation arrangements with the increase in cash surrender value of bank owned life insurance policies. In 2016, 2015 and 2014, the Company recorded compensation expense of $746,000, $814,000 and $359,000, respectively, for these plans.
Deferred Compensation Agreement
In February 2015, the Company entered into a Deferred Compensation Agreement with its CEO where it would contribute $16,500 monthly into a deferral account which would earn interest at an annual rate of the Company’s prior year return on equity, provided that the Company’s return on equity remained in a range of 0% to 15%. The Company has agreed to make such contributions each month that the CEO is actively employed from February 2015 through December 31, 2022. The expense incurred in 2016 and 2015 was $222,000 and $188,000, respectively, and the accrued liability at December 31, 2016 and 2015 was $410,000 and $188,000, respectively. Following the CEO’s normal retirement date, he shall be paid out in 180 consecutive monthly installments.
Elective Deferral Plan
In March 2015, the Company established an Elective Deferral Plan for eligible executives in which the executive may elect to contribute a portion of his base salary and bonus to a deferral account which will earn an interest rate of 75% of the Company’s prior year return on equity provided that the return on equity remains in the range of 0% to 15%. The Company recorded an expense of $22,000 and $3,000 in 2016 and 2015, respectively, and had a liability recorded of $512,000 and $190,000 at December 31, 2016 and 2015, respectively.
NOTE 12 - DIRECTORS RETIREMENT PLAN
The Company provides a plan that any director who became a member of the Board of Directors prior to 2009 who completes five years of service may retire and continue to be paid for a period of ten years at a rate ranging from $5,000 through $17,500 per annum, depending upon years of credited service. This plan is unfunded. The following tables present the status of the plan and the components of net periodic plan cost for the years then ended. The measurement date for the accumulated benefit obligation is December 31 of the years presented.
| December 31, | ||||||||
| 2016 | 2015 | |||||||
| (in thousands) | ||||||||
| Accrued plan cost included in other liabilities |
$ | 671 | $ | 702 | ||||
|
|
|
|
|
|||||
| Amount not recognized as component of net postretirement benefit cost |
||||||||
| Recognized in accumulated other comprehensive income Net actuarial gain |
$ |
(2 |
) |
$ |
(41 |
) | ||
| Unrecognized prior service cost |
— | — | ||||||
|
|
|
|
|
|||||
| Amounts not recognized as a component of net postretirement benefit (benefit) |
$ | (2 | ) | $ | (41 | ) | ||
|
|
|
|
|
|||||
-99-
Table of Contents
| Years ended December 31, | ||||||||||||
| 2016 | 2015 | 2014 | ||||||||||
| (in thousands) | ||||||||||||
| Net periodic plan cost included the following components: |
||||||||||||
| Service cost |
$ | 19 | $ | 19 | $ | 26 | ||||||
| Interest cost |
26 | 46 | 39 | |||||||||
| Amortization of prior service cost |
12 | 13 | 14 | |||||||||
|
|
|
|
|
|
|
|||||||
| $ | 57 | $ | 78 | $ | 79 | |||||||
|
|
|
|
|
|
|
|||||||
A discount rate of 3.68% and 3.87% was assumed in the plan valuation for 2016 and 2015, respectively. As the benefit amount is not dependent upon compensation levels, a rate of increase in compensation assumption was not utilized in the plan valuation.
The director’s retirement plan holds no plan assets. The benefits expected to be paid in each of the next five years and in aggregate for the five years thereafter are as follows (in thousands):
| 2017 |
$ | 70 | ||
| 2018 |
75 | |||
| 2019 |
63 | |||
| 2020 |
63 | |||
| 2021 |
37 | |||
| 2022 - 2026 |
223 |
The Company expects its contribution to the director’s retirement plan to be $70,000 in 2017.
The amount in accumulated other comprehensive income expected to be recognized as a component of net periodic benefit cost in 2017 is $1,000.
NOTE 13 - STOCK-BASED COMPENSATION
Employee Stock Option Plans
The Company’s shareholders approved the 2009 Equity Compensation Program, which authorizes the granting of incentive stock options, supplemental stock options, restricted shares and restricted stock units to employees of the Company, including those employees serving as officers and directors of the Company. The plan authorizes the issuance of up to 2.3 million shares in connection with options and awards granted under the 2009 program. The Company’s stock option grants under this plan expire 10 years from the date of grant, ninety days after termination of service other than for cause, or one year after death or disability of the grantee. In 2014, the Company began issuing restricted stock units (RSUs), some of which have performance conditions attached to them. The Company generally issues shares for option exercises from its treasury stock using the cost method or issues new shares if no treasury shares are available.
The Company established the 2000 Equity Compensation Program which authorizes the granting of incentive stock options, supplemental stock options and restricted stock to employees of the Company, which includes those employees serving as officers and directors of the Company. The plan authorized 2,613,185 shares of common stock of the Company. All of the Company’s stock option grants expire 10 years from the date of grant, thirty days after termination of service other than for cause, or one year after death or disability of the grantee. The Company has no option or restricted stock awards with market or performance conditions attached to them under the 2000 Equity Compensation Program. No further awards will be granted from the 2000 program.
The Company has outstanding stock options issued to its directors as well as options assumed under the Somerset Hills’ stock option plans at the time of merger. As of both December 31, 2016 and 2015, 111,829 options granted to directors were outstanding. As of December 31, 2016 and 2015, there were 23,415 and 64,057 options outstanding, respectively, under the Somerset Hills’ stock option plans.
-100-
Table of Contents
Excess tax benefits of stock based compensation were $67,000, $59,000 and $70,000 for the years 2016, 2015 and 2014, respectively.
A summary of the status of the Company’s option plans as of December 31, 2016 and the changes during the year ending on that date is represented below.
| Number of Shares |
Weighted Average Exercise Price |
Weighted Average Remaining Contractual Term (in Years) |
Aggregate Intrinsic Value |
|||||||||||||
| Outstanding, beginning of year |
175,892 | $ | 8.38 | $ | 602,236 | |||||||||||
| Granted |
— | — | ||||||||||||||
| Exercised |
(40,642 | ) | 7.00 | |||||||||||||
| Expired |
— | — | ||||||||||||||
| Forfeited |
— | — | ||||||||||||||
|
|
|
|||||||||||||||
| Outstanding, end of year |
135,250 | $ | 8.79 | 4.18 | $ | 1,450,533 | ||||||||||
|
|
|
|
|
|
|
|
|
|||||||||
| Options exercisable at year-end |
124,750 | $ | 8.72 | 3.99 | $ | 1,343,437 | ||||||||||
|
|
|
|
|
|
|
|
|
|||||||||
A summary of the Company’s non-vested options under the Company’s option plans as of December 31, 2016 and changes for the year then ended is presented below.
| Shares | Weighted- Average Grant-date Fair Value |
|||||||
| Non-vested, January 1, 2016 |
21,001 | $ | 3.31 | |||||
| Granted |
— | — | ||||||
| Vested |
(10,500 | ) | 3.31 | |||||
|
|
|
|||||||
| Non-vested, December 31, 2016 |
10,501 | $ | 3.31 | |||||
|
|
|
|
|
|||||
As of December 31, 2016, there was $14,000 of unrecognized compensation expense related to unvested stock options under the 2009 Equity Compensation Program. Compensation expense recognized for stock options was $35,000, $35,000 and $42,000 for 2016, 2015 and 2014, respectively.
The aggregate intrinsic values of options exercised in 2016 and 2015 were $292,000 and $68,000, respectively. Exercise of stock options during 2016 and 2015 resulted in cash receipts of $285,000 and $124,000, respectively. The total fair value of options that vested in 2016 and 2015 were $35,000 and $35,000, respectively.
Information regarding the Company’s restricted stock for the year ended December 31, 2016 is as follows:
| Number
of Shares |
Weighted Average Price |
|||||||
| Outstanding, January 1, 2016 |
73,500 | $ | 9.33 | |||||
| Granted |
23,952 | 10.02 | ||||||
| Vested |
(54,362 | ) | 9.33 | |||||
| Forfeited |
(215 | ) | 9.12 | |||||
|
|
|
|||||||
| Outstanding, December 31, 2016 |
42,875 | $ | 9.72 | |||||
|
|
|
|
|
|||||
-101-
Table of Contents
In 2016 the Company granted 23,952 shares of restricted stock to non-employee directors at a grant date fair value of $10.02 per share under the Company’s 2009 Equity Compensation Program. These shares will vest over a one year period, totaling $240,000 in compensation expense. No restricted stock was granted in 2015. In 2014, the Company granted 1,942 shares of restricted stock at a grant date fair value of $11.21 per share under the Company’s 2009 Equity Compensation Program. These shares vest over a five year period. Compensation expense on these shares is expected to average approximately $4,000 per year for the next five years.
The total fair value of the restricted stock vested during the year ended December 31, 2016 was approximately $507,000. Compensation expense recognized for restricted stock was $353,000, $497,000 and $707,000 in 2016, 2015 and 2014, respectively. There was approximately $74,000 in unrecognized compensation expense related to restricted stock grants as of December 31, 2016, which is expected to be recognized over a period of 0.38 years.
In 2016, the Company granted 180,926 RSUs at a weighted average grant date fair value of $10.45 per share under the Company’s 2009 Equity Compensation Program. These units vest within a range of two to three years. A portion of these RSUs will vest subject to certain performance conditions in the restricted stock unit agreement. There are also certain provisions in the compensation program which state that if a holder of the RSUs reaches a certain age and years of service, the person has effectively earned a portion of the RSUs at that time. Compensation expense on these restricted stock units is expected to average approximately $630,000 per year over a three year period. In 2015, the Company granted 137,009 RSUs at a weighted average grant date fair value of $11.08 per share under the Company’s 2009 Equity Compensation Program. These units vest within a range of two to three years. Compensation expense on these restricted stock units is expected to average approximately $506,000 per year over a three year period. In 2014, the Company granted 127,791 RSUs at a weighted average grant date fair value of $10.65 per share under the Company’s 2009 Equity Compensation Program. Compensation expense on these restricted stock units is expected to average $453,000 per year over a three year period. Compensation expense for restricted stock units was $1.5 million, $1.1 million and $641,000 in 2016, 2015 and 2014, respectively. There was approximately $1.4 million in unrecognized compensation expense related to restricted stock units as of December 31, 2016, which is expected to be recognized over a period of 1.2 years.
Information regarding the Company’s RSUs and changes during the year ended December 31, 2016 is as follows:
| Number of RSUs |
Weighted Average Price |
|||||||
| Outstanding, January 1, 2016 |
200,910 | $ | 10.87 | |||||
| Granted |
180,926 | 10.45 | ||||||
| Vested |
(66,749 | ) | 10.28 | |||||
| Forfeited |
(12,743 | ) | 10.72 | |||||
|
|
|
|||||||
| Outstanding, December 31, 2016 |
302,344 | $ | 10.76 | |||||
|
|
|
|
|
|||||
NOTE 14 - COMMITMENTS AND CONTINGENCIES
Lease Obligations
Lakeland is obligated under various non-cancelable operating leases on building and land used for office space and banking purposes. These leases contain renewal options and escalation clauses. Rent expense under long-term operating leases amounted to approximately $3.2 million, $2.7 million and $2.7 million for the years ended December 31, 2016, 2015 and 2014, respectively, including rent expense to related parties of $141,000 in 2016, $143,000 in 2015, and $139,000, in 2014. At December 31, 2016, the
-102-
Table of Contents
minimum commitments under all noncancellable leases with remaining terms of more than one year and expiring through 2033 are as follows (in thousands):
| Year |
||||
| 2017 |
$ | 3,179 | ||
| 2018 |
3,080 | |||
| 2019 |
2,889 | |||
| 2020 |
2,660 | |||
| 2021 |
2,470 | |||
| Thereafter |
17,701 | |||
|
|
|
|||
| $ | 31,979 | |||
|
|
|
|||
Litigation
There are no pending legal proceedings involving the Company or Lakeland other than those arising in the normal course of business. Management does not anticipate that the potential liability, if any, arising out of such legal proceedings will have a material effect on the financial condition or results of operations of the Company and Lakeland on a consolidated basis.
NOTE 15 - FINANCIAL INSTRUMENTS WITH OFF-BALANCE-SHEET RISK AND CONCENTRATIONS OF CREDIT RISK
Lakeland is party to financial instruments with off-balance-sheet risk in the normal course of business to meet the financing needs of its customers. These financial instruments include commitments to extend credit and standby letters of credit. Such financial instruments are recorded in the consolidated financial statements when they become payable. Those instruments involve, to varying degrees, elements of credit and interest rate risk in excess of the amount recognized in the consolidated balance sheets. The contract or notional amounts of those instruments reflect the extent of involvement Lakeland has in particular classes of financial instruments.
Lakeland’s exposure to credit loss in the event of non-performance by the other party to the financial instrument for commitments to extend credit and standby letters of credit is represented by the contractual or notional amount of those instruments. Lakeland uses the same credit policies in making commitments and conditional obligations as it does for on-balance-sheet instruments.
Lakeland generally requires collateral or other security to support financial instruments with credit risk. The approximate contract amounts are as follows:
| December 31, | ||||||||
| 2016 | 2015 | |||||||
| (in thousands) | ||||||||
| Financial instruments whose contract amounts represent credit risk |
||||||||
| Commitments to extend credit |
$ | 921,979 | $ | 773,058 | ||||
| Standby letters of credit and financial guarantees written |
15,170 | 11,060 | ||||||
At December 31, 2016 and 2015 there were $10,000 and $8,000, respectively, in commitments to lend additional funds to borrowers whose terms have been modified in troubled debt restructurings.
Commitments to extend credit are agreements to lend to a customer as long as there is no violation of any condition established in the contract. Commitments generally have fixed expiration dates or other
-103-
Table of Contents
termination clauses and may require payment of a fee. Since many of the commitments are expected to expire without being drawn upon, the total commitment amounts do not necessarily represent future cash requirements. Lakeland evaluates each customer’s creditworthiness on a case-by-case basis. The amount of collateral obtained, if deemed necessary by Lakeland upon extension of credit, is based on management’s credit evaluation.
Standby letters of credit are conditional commitments issued by Lakeland to guarantee the payment by or performance of a customer to a third party. The credit risk involved in issuing letters of credit is essentially the same as that involved in extending loan facilities to customers. Lakeland holds deposit accounts, residential or commercial real estate, accounts receivable, inventory and equipment as collateral to support those commitments for which collateral is deemed necessary. The extent of collateral held for those commitments at December 31, 2016 and 2015 varies based on management’s credit evaluation.
Lakeland issues financial and performance letters of credit. Financial letters of credit require Lakeland to make payment if the customer fails to make payment, as defined in the agreements. Performance letters of credit require Lakeland to make payments if the customer fails to perform certain non-financial contractual obligations. Lakeland defines the initial fair value of these letters of credit as the fees received from the customer. Lakeland records these fees as a liability when issuing the letters of credit and amortizes the fee over the life of the letter of credit.
The maximum potential undiscounted amount of future payments of these letters of credit as of December 31, 2016 is $15.2 million and they expire through 2024. Lakeland’s exposure under these letters of credit would be reduced by actual performance, subsequent termination by the beneficiaries and by any proceeds that Lakeland obtained in liquidating the collateral for the loans, which varies depending on the customer.
As of December 31, 2016, Lakeland had $922.0 million in loan and lease commitments, with $646.1 million maturing within one year, $128.4 million maturing after one year but within three years, $12.7 million maturing after three years but within five years, and $134.9 million maturing after five years. As of December 31, 2016, Lakeland had $15.2 million in standby letters of credit, with $14.6 million maturing within one year, $481,000 maturing after one year but within three years, $32,000 maturing after three years but within five years and $80,000 maturing after five years.
Lakeland grants loans primarily to customers in New Jersey, the Hudson Valley Region in New York State, and surrounding areas. Certain of Lakeland’s consumer loans and lease customers are more diversified nationally. Although Lakeland has a diversified loan portfolio, a large portion of its loans are secured by commercial or residential real property. Although Lakeland has a diversified loan portfolio, a substantial portion of its debtors’ ability to honor their contracts is dependent upon the economy. Commercial and standby letters of credit were granted primarily to commercial borrowers.
NOTE 16 - COMPREHENSIVE INCOME
The Company reports comprehensive income in addition to net income (loss) from operations. Comprehensive income is a more inclusive financial reporting methodology that includes disclosure of certain financial information that historically has not been recognized in the calculation of net income.
-104-
Table of Contents
The following table shows the changes in the balances of each of the components of other comprehensive income for the periods presented:
| Year Ended December 31, 2016 | ||||||||||||
| Before Tax Amount |
Tax Benefit (Expense) |
Net of Tax Amount |
||||||||||
| (in thousands) | ||||||||||||
| Unrealized losses on available for sale securities |
||||||||||||
| Unrealized holding losses arising during period |
$ | (1,816 | ) | $ | 778 | $ | (1,038 | ) | ||||
| Less reclassification adjustment for net gains realized in net income |
370 | (137 | ) | 233 | ||||||||
|
|
|
|
|
|
|
|||||||
| Net unrealized losses on available for sale securities |
(2,186 | ) | 915 | (1,271 | ) | |||||||
| Unrealized gain on derivatives |
1,033 | (361 | ) | 672 | ||||||||
| Change in pension liabilities |
70 | (28 | ) | 42 | ||||||||
|
|
|
|
|
|
|
|||||||
| Other comprehensive loss, net |
$ | (1,083 | ) | $ | 526 | $ | (557 | ) | ||||
|
|
|
|
|
|
|
|||||||
| Year Ended December 31, 2015 | ||||||||||||
| Before Tax Amount |
Tax Benefit (Expense) |
Net of Tax Amount |
||||||||||
| (in thousands) | ||||||||||||
| Unrealized losses on available for sale securities |
||||||||||||
| Unrealized holding losses arising during period |
$ | (375 | ) | $ | 155 | $ | (220 | ) | ||||
| Less reclassification adjustment for net gains realized in net income |
241 | (84 | ) | 157 | ||||||||
|
|
|
|
|
|
|
|||||||
| Net unrealized losses on available for sale securities |
(616 | ) | 239 | (377 | ) | |||||||
| Change in pension liabilities |
3 | 1 | 4 | |||||||||
|
|
|
|
|
|
|
|||||||
| Other comprehensive loss, net |
$ | (613 | ) | $ | 240 | $ | (373 | ) | ||||
|
|
|
|
|
|
|
|||||||
| Year Ended December 31, 2014 | ||||||||||||
| Before Tax Amount |
Tax Benefit (Expense) |
Net of Tax Amount |
||||||||||
| (in thousands) | ||||||||||||
| Unrealized gains on available for sale securities |
||||||||||||
| Unrealized holding gains arising during period |
$ | 9,663 | $ | (3,483 | ) | $ | 6,180 | |||||
| Less reclassification adjustment for net gains realized in net income |
3 | (1 | ) | 2 | ||||||||
|
|
|
|
|
|
|
|||||||
| Net unrealized gains on available for sale securities |
9,660 | (3,482 | ) | 6,178 | ||||||||
| Change in pension liabilities |
31 | (11 | ) | 20 | ||||||||
|
|
|
|
|
|
|
|||||||
| Other comprehensive income, net |
$ | 9,691 | $ | (3,493 | ) | $ | 6,198 | |||||
|
|
|
|
|
|
|
|||||||
-105-
Table of Contents
| For the Year Ended December 31, 2016 |
For the Year Ended December 31, 2015 |
For the Year Ended December 31, 2014 |
||||||||||||||||||||||||||||||||||||||
| Unrealized Gains and Losses on Available- for-Sale Securities |
Unrealized Gains (Losses) on Derivatives |
Pension Items |
Total | Unrealized Gains and Losses on Available- for-Sale Securities |
Pension Items |
Total | Unrealized Gains and Losses on Available- for-Sale Securities |
Pension Items |
Total | |||||||||||||||||||||||||||||||
| Beginning balance |
$ | 1,154 | $ | — | $ | (4 | ) | $ | 1,150 | $ | 1,531 | $ | (8 | ) | $ | 1,523 | $ | (4,647 | ) | $ | (28 | ) | $ | (4,675 | ) | |||||||||||||||
|
|
|
|
|
|
|
|
|
|
|
|
|
|
|
|
|
|
|
|
|
|||||||||||||||||||||
| (in thousands) | ||||||||||||||||||||||||||||||||||||||||
| Other comprehensive income (loss) before classifications |
(1,038 | ) | 672 | 42 | (324 | ) | (220 | ) | 4 | (216 | ) | 6,180 | 20 | 6,200 | ||||||||||||||||||||||||||
| Amounts reclassified from accumulated other comprehensive income |
(233 | ) | — | — | (233 | ) | (157 | ) | — | (157 | ) | (2 | ) | — | (2 | ) | ||||||||||||||||||||||||
|
|
|
|
|
|
|
|
|
|
|
|
|
|
|
|
|
|
|
|
|
|||||||||||||||||||||
| Net current period other comprehensive income (loss) |
(1,271 | ) | 672 | 42 | (557 | ) | (377 | ) | 4 | (373 | ) | 6,178 | 20 | 6,198 | ||||||||||||||||||||||||||
| Ending balance |
$ | (117 | ) | $ | 672 | $ | 38 | $ | 593 | $ | 1,154 | $ | (4 | ) | $ | 1,150 | $ | 1,531 | $ | (8 | ) | $ | 1,523 | |||||||||||||||||
|
|
|
|
|
|
|
|
|
|
|
|
|
|
|
|
|
|
|
|
|
|||||||||||||||||||||
Note: All amounts are net of tax.
NOTE 17 - FAIR VALUE MEASUREMENT AND FAIR VALUE OF FINANCIAL INSTRUMENTS
Fair Value Measurement
Fair value is defined as the price that would be received to sell an asset or paid to transfer a liability in the principal or most advantageous market for an asset or liability in an orderly transaction between market participants at the measurement date. U.S. GAAP establishes a fair value hierarchy that prioritizes the inputs to valuation techniques used to measure fair value into three broad levels giving the highest priority to unadjusted quoted prices in active markets for identical assets or liabilities (level 1 measurements) and the lowest level priority to unobservable inputs (level 3 measurements). The following describes the three levels of fair value hierarchy:
Level 1 - unadjusted quoted prices in active markets for identical assets or liabilities; includes U.S. Treasury Notes, and other U.S. Government Agency securities that actively trade in over-the-counter markets; equity securities and mutual funds that actively trade in over-the-counter markets.
Level 2 - quoted prices for similar assets or liabilities in active markets; or quoted prices for identical or similar assets or liabilities in markets that are not active; or inputs other than quoted prices that are observable for the asset or liability including yield curves, volatilities, and prepayment speeds.
Level 3 - unobservable inputs for the asset or liability that reflect the Company’s own assumptions about assumptions that market participants would use in the pricing of the asset or liability and that are consequently not based on market activity but on particular valuation techniques.
The Company’s assets that are measured at fair value on a recurring basis are its available for sale investment securities and its interest rate swaps. The Company obtains fair values on its securities using information from a third party servicer. If quoted prices for securities are available in an active market, those securities are classified as Level 1 securities. The Company has U.S. Treasury Notes and certain equity securities that are classified as Level 1 securities. Level 2 securities were primarily comprised of U.S. Agency bonds, residential mortgage-backed securities, obligations of state and political subdivisions and corporate securities. Fair values were estimated primarily by obtaining quoted prices for similar assets in active markets or through the use of pricing models supported with market data information. Standard inputs
-106-
Table of Contents
include benchmark yields, reported trades, broker-dealer quotes, issuer spreads, bids and offers. On a quarterly basis, the Company reviews the pricing information received from the Company’s third party pricing service. This review includes a comparison to non-binding third-party quotes.
The fair values of derivatives are based on valuation models using current market terms (including interest rates and fees), the remaining terms of the agreements and the credit worthiness of the counter-party as of the measurement date (Level 2).
The following table sets forth the Company’s financial assets that were accounted for at fair value on a recurring basis as of the periods presented by level within the fair value hierarchy. During the year ended December 31, 2016 and 2015, the Company did not make any transfers between recurring Level 1 fair value measurements and recurring Level 2 fair value measurements. Financial assets and liabilities are classified in their entirety based on the lowest level of input that is significant to the fair value measurement:
| December 31, 2016 |
Quoted Prices in Active Markets for Identical Assets (Level 1) |
Significant Other Observable Inputs (Level 2) |
Significant Unobservable Inputs (Level 3) |
Total Fair Value |
||||||||||||
| (in thousands) | ||||||||||||||||
| Assets: |
||||||||||||||||
| Investment securities, available for sale |
||||||||||||||||
| U.S. Treasury and government agencies |
$ | 5,931 | $ | 111,428 | $ | — | $ | 117,359 | ||||||||
| Mortgage-backed securities |
— | 413,725 | — | 413,725 | ||||||||||||
| Obligations of states and political subdivisions |
— | 48,326 | — | 48,326 | ||||||||||||
| Corporate debt securities |
— | 5,412 | — | 5,412 | ||||||||||||
| Equity securities |
7,748 | 14,134 | — | 21,882 | ||||||||||||
|
|
|
|
|
|
|
|
|
|||||||||
| Total securities available for sale |
13,679 | 593,025 | — | 606,704 | ||||||||||||
| Other Assets(1) |
— | 3,378 | — | 3,378 | ||||||||||||
|
|
|
|
|
|
|
|
|
|||||||||
| Total Assets |
$ | 13,679 | $ | 596,403 | $ | — | $ | 610,082 | ||||||||
|
|
|
|
|
|
|
|
|
|||||||||
| Liabilities: |
||||||||||||||||
| Other Liabilities(1) |
$ | — | $ | 2,345 | $ | — | $ | 2,345 | ||||||||
|
|
|
|
|
|
|
|
|
|||||||||
| Total Liabilities |
$ | — | $ | 2,345 | $ | — | $ | 2,345 | ||||||||
|
|
|
|
|
|
|
|
|
|||||||||
| (1) | Derivatives |
-107-
Table of Contents
| December 31, 2015 |
Quoted Prices in Active Markets for Identical Assets (Level 1) |
Significant Other Observable Inputs (Level 2) |
Significant Unobservable Inputs (Level 3) |
Total Fair Value |
||||||||||||
| (in thousands) | ||||||||||||||||
| Assets: |
||||||||||||||||
| Investment securities, available for sale |
||||||||||||||||
| U.S. Treasury and government agencies |
$ | 4,888 | $ | 92,245 | $ | — | $ | 97,133 | ||||||||
| Mortgage-backed securities |
— | 289,572 | — | 289,572 | ||||||||||||
| Obligations of states and political subdivisions |
— | 36,498 | — | 36,498 | ||||||||||||
| Corporate debt securities |
— | 501 | — | 501 | ||||||||||||
| Equity securities |
5,052 | 13,593 | — | 18,645 | ||||||||||||
|
|
|
|
|
|
|
|
|
|||||||||
| Total securities available for sale |
9,940 | 432,409 | — | 442,349 | ||||||||||||
| Other Assets(1) |
— | 1,518 | — | 1,518 | ||||||||||||
|
|
|
|
|
|
|
|
|
|||||||||
| Total Assets |
$ | 9,940 | $ | 433,927 | $ | — | $ | 443,867 | ||||||||
|
|
|
|
|
|
|
|
|
|||||||||
| Liabilities: |
||||||||||||||||
| Other Liabilities(1) |
$ | — | $ | 1,518 | $ | — | $ | 1,518 | ||||||||
|
|
|
|
|
|
|
|
|
|||||||||
| Total Liabilities |
$ | — | $ | 1,518 | $ | — | $ | 1,518 | ||||||||
|
|
|
|
|
|
|
|
|
|||||||||
| (1) | Non-hedging interest rate derivatives |
The following table sets forth the Company’s financial assets subject to fair value adjustments (impairment) on a non-recurring basis. Assets are classified in their entirety based on the lowest level of input that is significant to the fair value measurement:
| December 31, 2016 |
(Level 1) | (Level 2) | (Level 3) | Total Fair Value |
||||||||||||
| (in thousands) | ||||||||||||||||
| Assets: |
||||||||||||||||
| Impaired Loans and Leases |
$ | — | $ | — | $ | 25,285 | $ | 25,285 | ||||||||
| Loans held for sale |
— | 1,742 | — | 1,742 | ||||||||||||
| Other real estate owned and other repossessed assets |
— | — | 1,072 | 1,072 | ||||||||||||
| December 31, 2015 |
(Level 1) | (Level 2) | (Level 3) | Total Fair Value |
||||||||||||
| (in thousands) | ||||||||||||||||
| Assets: |
||||||||||||||||
| Impaired Loans and Leases |
$ | — | $ | — | $ | 26,006 | $ | 26,006 | ||||||||
| Loans held for sale |
— | 1,233 | — | 1,233 | ||||||||||||
| Other real estate owned and other repossessed assets |
— | — | 983 | 983 | ||||||||||||
Impaired loans and leases are evaluated and valued at the time the loan is identified as impaired at the lower of cost or market value. Because most of Lakeland’s impaired loans are collateral dependent, fair value is generally measured based on the value of the collateral, less estimated costs to sell, securing these loans and leases and is classified at a level 3 in the fair value hierarchy. Collateral may be real estate, accounts receivable, inventory, equipment and/or other business assets. The value of the real estate is assessed based on appraisals by qualified third party licensed appraisers. The appraisers may use the income approach to value the collateral using discount rates (with ranges of 5-11%) or capitalization rates (with ranges of 5-9%) to evaluate the property. The value of the equipment may be determined by an appraiser, if significant, inquiry through a recognized valuation resource, or by the value on the borrower’s financial statements. Field examiner reviews on business assets may be conducted based on the loan exposure and
-108-
Table of Contents
reliance on this type of collateral. Appraised and reported values may be discounted based on management’s historical knowledge, changes in market conditions from the time of valuation, and/or management’s expertise and knowledge of the client and client’s business. Impaired loans and leases are reviewed and evaluated on at least a quarterly basis for additional impairment and adjusted accordingly, based on the same factors identified above.
The Company has a held for sale loan portfolio that consists of residential mortgages that are being sold in the secondary market. The Company records these mortgages at the lower of cost or fair market value. Fair value is generally determined by the value of purchase commitments.
Other real estate owned (OREO) and other repossessed assets, representing property acquired through foreclosure, are carried at fair value less estimated disposal costs of the acquired property. Fair value on other real estate owned is based on the appraised value of the collateral using discount rates or capitalization rates similar to those used in impaired loan valuation. The fair value of other repossessed assets is estimated by inquiry through a recognized valuation resource.
Changes in the assumptions or methodologies used to estimate fair values may materially affect the estimated amounts. Changes in economic conditions, locally or nationally, could impact the value of the estimated amounts of impaired loans, OREO and other repossessed assets.
Fair Value of Certain Financial Instruments
Estimated fair values have been determined by the Company using the best available data and an estimation methodology suitable for each category of financial instruments. Management is concerned that there may not be reasonable comparability between institutions due to the wide range of permitted assumptions and methodologies in the absence of active markets. This lack of uniformity gives rise to a high degree of subjectivity in estimating financial instrument fair values.
The estimation methodologies used, the estimated fair values, and recorded book balances at December 31, 2016 and December 31, 2015 are outlined below.
This summary, as well as the table below, excludes financial assets and liabilities for which carrying value approximates fair value. For financial assets, these include cash and cash equivalents. For financial liabilities, these include noninterest-bearing demand deposits, savings and interest-bearing transaction accounts and federal funds sold and securities sold under agreements to repurchase. The estimated fair value of demand, savings and interest-bearing transaction accounts is the amount payable on demand at the reporting date. Carrying value is used because there is no stated maturity on these accounts, and the customer has the ability to withdraw the funds immediately. Also excluded from this summary and the following table are those financial instruments recorded at fair value on a recurring basis, as previously described.
The fair value of investment securities held to maturity was measured using information from the same third-party servicer used for investment securities available for sale using the same methodologies discussed above. Investment securities held to maturity includes $34.6 million in short-term municipal bond anticipation notes and $1.0 million in subordinated debt that are non-rated and do not have an active secondary market or information readily available on standard financial systems. As a result, the securities are classified as Level 3 securities. These are investments that management performs a credit analysis on before investing in these securities.
Federal Home Loan Bank of New York (FHLB) stock is an equity interest that can be sold to the issuing FHLB, to other FHLBs, or to other member banks at its par value. Because ownership of these securities is restricted, they do not have a readily determinable fair value. As such, the Company’s FHLB stock is recorded at cost or par value and is evaluated for impairment each reporting period by considering the ultimate recoverability of the investment rather than temporary declines in value. The Company’s evaluation primarily includes an evaluation of liquidity, capitalization, operating performance, commitments, and regulatory or legislative events.
-109-
Table of Contents
The net loan portfolio at December 31, 2016 and December 31, 2015 has been valued using a present value discounted cash flow where market prices were not available. The discount rate used in these calculations is the estimated current market rate for new loans with similar credit risk. The valuation of our loan portfolio is consistent with accounting guidance but does not fully incorporate the exit price approach.
For fixed maturity certificates of deposit, fair value was estimated based on the present value of discounted cash flows using the rates currently offered for deposits of similar remaining maturities. The carrying amount of accrued interest payable approximates its fair value.
The fair value of long-term debt is based upon the discounted value of contractual cash flows. The Company estimates the discount rate using the rates currently offered for similar borrowing arrangements. The fair value of subordinated debentures is based on bid/ask prices from brokers for similar types of instruments.
The fair values of commitments to extend credit and standby letters of credit are estimated using the fees currently charged to enter into similar agreements, taking into account the remaining terms of the agreements and the present creditworthiness of the counterparties. For fixed-rate loan commitments, fair value also considers the difference between current levels of interest rates and the committed rates. The fair value of guarantees and letters of credit is based on fees currently charged for similar agreements or on the estimated cost to terminate them or otherwise settle the obligations with the counterparties at the reporting date. The fair values of commitments to extend credit and standby letters of credit are deemed immaterial.
The following table presents the carrying values, fair values and placement in the fair value hierarchy of the Company’s financial instruments as of December 31, 2016 and December 31, 2015:
| December 31, 2016 |
Carrying Value |
Fair Value |
Quoted Prices in Active Markets for Identical Assets (Level 1) |
Significant Other Observable Inputs (Level 2) |
Significant Unobservable Inputs (Level 3) |
|||||||||||||||
| (in thousands) | ||||||||||||||||||||
| Financial Assets: |
||||||||||||||||||||
| Investment securities held to maturity |
$ | 147,614 | $ | 146,990 | $ | — | $ | 111,403 | $ | 35,587 | ||||||||||
| Federal Home Loan and other membership bank stock |
15,099 | 15,099 | — | 15,099 | — | |||||||||||||||
| Loans and leases, net |
3,839,353 | 3,832,465 | — | — | 3,832,465 | |||||||||||||||
| Financial Liabilities: |
||||||||||||||||||||
| Certificates of deposit |
544,908 | 543,399 | — | 543,399 | — | |||||||||||||||
| Other borrowings |
260,866 | 264,586 | — | 264,586 | — | |||||||||||||||
| Subordinated debentures |
104,784 | 94,476 | — | — | 94,476 | |||||||||||||||
| December 31, 2015 |
||||||||||||||||||||
| Financial Assets: |
||||||||||||||||||||
| Investment securities held to maturity |
$ | 116,740 | $ | 117,594 | $ | — | $ | 110,293 | $ | 7,301 | ||||||||||
| Federal Home Loan and other membership bank stock |
14,087 | 14,087 | — | 14,087 | — | |||||||||||||||
| Loans and leases, net |
2,934,326 | 2,930,188 | — | — | 2,930,188 | |||||||||||||||
| Financial Liabilities: |
||||||||||||||||||||
| Certificates of deposit |
343,321 | 341,998 | — | 341,998 | — | |||||||||||||||
| Other borrowings |
271,905 | 275,409 | — | 275,409 | — | |||||||||||||||
| Subordinated debentures |
31,238 | 24,366 | — | — | 24,366 | |||||||||||||||
-110-
Table of Contents
NOTE 18 - DERIVATIVES
Lakeland is a party to interest rate derivatives that are not designated as hedging instruments. Under a program, Lakeland executes interest rate swaps with commercial lending customers to facilitate their respective risk management strategies. These interest rate swaps with customers are simultaneously offset by interest rate swaps that Lakeland executes with a third party, such that Lakeland minimizes its net risk exposure resulting from such transactions. Because the interest rate swaps associated with this program do not meet the strict hedge accounting requirements, changes in the fair value of both the customer swaps and the offsetting swaps are recognized directly in earnings. The changes in the fair value of the swaps offset each other, except for the credit risk of the counterparties, which is determined by taking into consideration the risk rating, probability of default and loss given default for all counterparties. As of December 31, 2016 and 2015, Lakeland had $7.5 million and $2.5 million, respectively, in securities pledged for collateral on its interest rate swaps.
In June 2016, the Company entered into two cash flow hedges in order to hedge the variable cash outflows associated with its floating rate subordinated debentures (See Note 8). The notional value of these hedges was $30.0 million. The Company’s objective in using the cash flow hedge is to add stability to interest expense and to manage its exposure to interest rate movements. The Company used interest rate swaps designated as cash flow hedges which involved the receipt of variable amounts from a counterparty in exchange for the Company making fixed-rate payments over the life of the agreements without exchange of the underlying notional amount. In these particular hedges the Company is paying a third party an average of 1.10% in exchange for a payment at 3 month LIBOR. The effective portion of changes in the fair value of derivatives designated and that qualify as cash flow hedges are recorded in accumulated other comprehensive income and are subsequently reclassified into earnings in the period that the hedged forecasted transaction affects earnings. During the year ended December 31, 2016, the Company did not record any hedge ineffectiveness. The Company recognized $49,000 of accumulated other comprehensive income that was reclassified into interest expense during 2016.
Amounts reported in accumulated other comprehensive income related to derivatives will be reclassified to interest expense as interest payments are made on the Company’s debt. During the next twelve months, the Company estimates that $30,000 will be reclassified as an increase to interest expense should the rate environment remain the same.
The following table presents summary information regarding these derivatives for the periods presented (dollars in thousands):
| December 31, 2016 |
Notional Amount | Average Maturity (Years) |
Weighted Average Rate Fixed |
Weighted Average Variable Rate |
Fair Value | |||||||||||||
| Customer interest rate swaps |
$ | 129,252 | 10.9 | 4.030 | % | 1 Mo. LIBOR + 2.10 | $ | (2,345 | ) | |||||||||
| 3rd party interest rate swaps |
(129,252 | ) | 10.9 | 4.030 | % | 1 Mo. LIBOR + 2.10 | 2,345 | |||||||||||
| Interest rate swap (cash flow hedge) |
30,000 | 4.5 | 1.10 | % | 3 Mo. LIBOR | 1,033 | ||||||||||||
| December 31, 2015 |
Notional Amount | Average Maturity (Years) |
Weighted Average Rate Fixed |
Weighted Average Variable Rate |
Fair Value | |||||||||||||
| Customer interest rate swaps |
$ | 35,664 | 14.6 | 4.540 | % | 1 Mo. LIBOR + 2.00 | $ | 1,518 | ||||||||||
| 3rd party interest rate swaps |
(35,664 | ) | 14.6 | 4.540 | % | 1 Mo. LIBOR + 2.00 | (1,518 | ) | ||||||||||
NOTE 19 - REGULATORY MATTERS
The Bank Holding Company Act of 1956 restricts the amount of dividends the Company can pay. Accordingly, dividends should generally only be paid out of current earnings, as defined.
The New Jersey Banking Act of 1948 restricts the amount of dividends paid on the capital stock of New Jersey chartered banks. Accordingly, no dividends shall be paid by such banks on their capital stock unless, following the payment of such dividends, the capital stock of Lakeland will be unimpaired, and: (1) Lakeland will have a surplus, as defined, of not less than 50% of its capital stock, or, if not, (2) the
-111-
Table of Contents
payment of such dividend will not reduce the surplus, as defined, of Lakeland. Under these limitations, approximately $480.9 million was available for payment of dividends from Lakeland to the Company as of December 31, 2016.
The Company and Lakeland are subject to various regulatory capital requirements administered by the federal banking agencies. Failure to meet minimum capital requirements can initiate certain mandatory – and possible additional discretionary – actions by regulators that, if undertaken, could have a direct material effect on the Company’s and Lakeland’s consolidated financial statements. Under capital adequacy guidelines and the regulatory framework for prompt corrective action, the Company must meet specific capital guidelines that involve quantitative measures of the Company’s and Lakeland’s assets, liabilities and certain off-balance-sheet items as calculated under regulatory accounting practices. The Company’s and Lakeland’s capital amounts and classifications are also subject to qualitative judgments by the regulators about components, risk weightings and other factors.
Quantitative measures established by regulations to ensure capital adequacy require the Company and Lakeland to maintain minimum amounts and ratios (set forth in the table below) of total and Tier 1 capital (as defined in the regulations) to risk-weighted assets, and of Tier 1 capital to average assets. Management believes, as of December 31, 2016, that the Company and Lakeland met all capital adequacy requirements to which they are subject.
As of December 31, 2016, the most recent notification from the FDIC categorized Lakeland as well capitalized under the regulatory framework for prompt corrective action. To be categorized as well capitalized, Lakeland must maintain minimum total risk-based, Tier 1 risk-based, common equity Tier 1 capital and Tier 1 leverage ratios as set forth in the table below. There are no conditions or events since that notification that management believes have changed the institution’s category.
As of December 31, 2016 and 2015, the Company and Lakeland have the following capital ratios based on the then current regulations:
| Actual | For Capital Adequacy Purposes |
To Be Well Capitalized Under Prompt Corrective Action Provisions |
||||||||||||||||||||||
| December 31, 2016 |
Amount | Ratio | Amount | Ratio | Amount | Ratio | ||||||||||||||||||
| (dollars in thousands) | ||||||||||||||||||||||||
| Total capital (to risk-weighted assets) |
||||||||||||||||||||||||
| Company |
$ | 549,391 | 13.48 | % | > $ | 325,965 | > 8.00 | % | N/A | N/A | ||||||||||||||
| Lakeland |
530,458 | 13.03 | 325,561 | 8.00 | > $ | 406,952 | > 10.00 | % | ||||||||||||||||
| Tier 1 capital (to risk-weighted assets) |
||||||||||||||||||||||||
| Company |
$ | 442,124 | 10.85 | % | > $ | 244,474 | > 6.00 | % | N/A | N/A | ||||||||||||||
| Lakeland |
496,737 | 12.21 | 244,171 | 6.00 | > $ | 325,561 | > 8.00 | % | ||||||||||||||||
| Common equity Tier 1 capital (to risk-weighted assets) |
||||||||||||||||||||||||
| Company |
$ | 412,124 | 10.11 | % | > $ | 183,355 | > 4.50 | % | N/A | N/A | ||||||||||||||
| Lakeland |
496,737 | 12.21 | 183,128 | 4.50 | > $ | 264,519 | > 6.50 | % | ||||||||||||||||
| Tier 1 capital (to average assets) |
||||||||||||||||||||||||
| Company |
$ | 442,124 | 9.07 | % | > $ | 194,927 | > 4.00 | % | N/A | N/A | ||||||||||||||
| Lakeland |
496,737 | 10.21 | 194,691 | 4.00 | > $ | 243,364 | > 5.00 | % | ||||||||||||||||
-112-
Table of Contents
| To Be Well Capitalized Under | ||||||||||||||||||||||||
| For Capital Adequacy | Prompt Corrective Action | |||||||||||||||||||||||
| Actual | Purposes | Provisions | ||||||||||||||||||||||
| December 31, 2015 | Amount | Ratio | Amount | Ratio | Amount | Ratio | ||||||||||||||||||
| (dollars in thousands) | ||||||||||||||||||||||||
| Total capital (to risk-weighted assets) |
||||||||||||||||||||||||
| Company |
$ | 351,779 | 11.61 | % | > $ | 242,299 | > 8.00 | % | N/A | N/A | ||||||||||||||
| Lakeland |
328,574 | 10.87 | 241,880 | 8.00 | > $ | 302,350 | > 10.00 | % | ||||||||||||||||
| Tier 1 capital (to risk-weighted assets) |
||||||||||||||||||||||||
| Company |
$ | 318,867 | 10.53 | % | > $ | 181,724 | > 6.00 | % | N/A | N/A | ||||||||||||||
| Lakeland |
295,662 | 9.78 | 181,410 | 6.00 | > $ | 241,880 | > 8.00 | % | ||||||||||||||||
| Common equity Tier 1 capital (to risk-weighted assets) |
||||||||||||||||||||||||
| Company |
$ | 288,867 | 9.54 | % | > $ | 136,293 | > 4.50 | % | N/A | N/A | ||||||||||||||
| Lakeland |
295,662 | 9.78 | 136,057 | 4.50 | > $ | 196,527 | > 6.50 | % | ||||||||||||||||
| Tier 1 capital (to average assets) |
||||||||||||||||||||||||
| Company |
$ | 318,867 | 8.70 | % | > $ | 146,594 | > 4.00 | % | N/A | N/A | ||||||||||||||
| Lakeland |
295,662 | 8.08 | 146,453 | 4.00 | > $ | 183,066 | > 5.00 | % | ||||||||||||||||
The final rules implementing the Basel Committee on Banking Supervisions capital guidelines for U.S. Banks became effective for the Company on January 1, 2015, with full compliance with all the final rule’s requirements phased in over a multi-year schedule, to be fully phased in by January 1, 2019. The Basel Rules require a “capital conservation buffer.” When fully phased in on January 1, 2019, the Company and Lakeland will be required to maintain a 2.5% capital conservation buffer in addition to the minimum capital ratios set forth in the above table. The implementation of the capital conservation buffer began on January 1, 2016 at the 0.625% level and increases by 0.625% every January 1 until it reaches 2.5% on January 1, 2019.
NOTE 20 – GOODWILL AND OTHER INTANGIBLE ASSETS
The Company has recorded goodwill of $135.7 million and $110.0 million at December 31, 2016 and December 31, 2015, respectively, which includes $10.5 million from the Harmony merger in 2016, $15.3 million from the Pascack merger in 2016 and $110.0 million from prior acquisitions.
Core Deposit Intangible was $3.3 million on December 31, 2016 compared to $1.5 million on December 31, 2015. The Company recorded $1.0 million, $1.5 million and $2.7 million in core deposit intangible for the Harmony, Pascack and Somerset Hills acquisitions, respectively. In 2016, it has amortized $734,000 in core deposit intangible including $275,000, $366,000 and $93,000 for Pascack, Somerset Hills and Harmony, respectively. The estimated future amortization expense for each of the succeeding five years ended December 31 is as follows (in thousands):
| For the Year Ended |
Somerset Hills |
Pascack | Harmony | |||||||||
| 2017 |
$ | 316 | $ | 248 | $ | 176 | ||||||
| 2018 |
267 | 220 | 157 | |||||||||
| 2019 |
218 | 193 | 139 | |||||||||
| 2020 |
168 | 165 | 120 | |||||||||
| 2021 |
119 | 138 | 102 | |||||||||
-113-
Table of Contents
NOTE 21 - CONDENSED FINANCIAL INFORMATION – PARENT COMPANY ONLY
CONDENSED BALANCE SHEETS
| December 31, | ||||||||
| 2016 | 2015 | |||||||
| (in thousands) | ||||||||
| ASSETS |
||||||||
| Cash and due from banks |
$ | 11,675 | $ | 15,921 | ||||
| Investment securities, available for sale |
7,757 | 5,060 | ||||||
| Investment securities, held to maturity |
1,000 | 1,000 | ||||||
| Investment in subsidiaries |
631,500 | 406,538 | ||||||
| Other assets |
5,018 | 3,265 | ||||||
|
|
|
|
|
|||||
| TOTAL ASSETS |
$ | 656,950 | $ | 431,784 | ||||
|
|
|
|
|
|||||
| LIABILITIES AND STOCKHOLDERS’ EQUITY |
||||||||
| Other liabilities |
$ | 2,122 | $ | 30 | ||||
| Subordinated debentures |
104,784 | 31,238 | ||||||
| Total stockholders’ equity |
550,044 | 400,516 | ||||||
|
|
|
|
|
|||||
| TOTAL LIABILITIES AND STOCKHOLDERS’ EQUITY |
$ | 656,950 | $ | 431,784 | ||||
|
|
|
|
|
|||||
CONDENSED STATEMENTS OF OPERATIONS
| Years Ended December 31, | ||||||||||||
| 2016 | 2015 | 2014 | ||||||||||
| (in thousands) | ||||||||||||
| INCOME |
||||||||||||
| Dividends from subsidiaries |
$ | 20,687 | $ | 23,376 | $ | 16,581 | ||||||
| Other income |
199 | 1,987 | 102 | |||||||||
|
|
|
|
|
|
|
|||||||
| TOTAL INCOME |
20,886 | 25,363 | 16,683 | |||||||||
|
|
|
|
|
|
|
|||||||
| EXPENSE |
||||||||||||
| Interest on subordinated debentures |
2,171 | 1,009 | 1,068 | |||||||||
| Noninterest expenses |
442 | 605 | 313 | |||||||||
|
|
|
|
|
|
|
|||||||
| TOTAL EXPENSE |
2,613 | 1,614 | 1,381 | |||||||||
|
|
|
|
|
|
|
|||||||
| Income before (benefit) provision for income taxes |
18,273 | 23,749 | 15,302 | |||||||||
| Income taxes (benefit) provision |
(845 | ) | 67 | (447 | ) | |||||||
|
|
|
|
|
|
|
|||||||
| Income before equity in undistributed income of subsidiaries |
19,118 | 23,682 | 15,749 | |||||||||
| Equity in undistributed income of subsidiaries |
22,400 | 8,799 | 15,380 | |||||||||
|
|
|
|
|
|
|
|||||||
| NET INCOME AVAILABLE TO COMMON SHAREHOLDERS |
$ | 41,518 | $ | 32,481 | $ | 31,129 | ||||||
|
|
|
|
|
|
|
|||||||
-114-
Table of Contents
CONDENSED STATEMENTS OF CASH FLOWS
| Years Ended December 31, | ||||||||||||
| 2016 | 2015 | 2014 | ||||||||||
| (in thousands) | ||||||||||||
| CASH FLOWS FROM OPERATING ACTIVITIES |
||||||||||||
| Net income |
$ | 41,518 | $ | 32,481 | $ | 31,129 | ||||||
| Adjustments to reconcile net income to net cash provided by (used in) operating activities: |
||||||||||||
| Gain on securities |
— | (29 | ) | — | ||||||||
| Amortization of subordinated debt costs |
30 | — | — | |||||||||
| Gain on early extinguishment of debt |
— | (1,830 | ) | — | ||||||||
| (Increase) decrease in other assets |
(922 | ) | 3,861 | (174 | ) | |||||||
| Increase (decrease) in other liabilities |
1,010 | 176 | (46 | ) | ||||||||
| Equity in undistributed income of subsidiaries |
(22,400 | ) | (8,799 | ) | (15,380 | ) | ||||||
|
|
|
|
|
|
|
|||||||
| NET CASH PROVIDED BY OPERATING ACTIVITIES |
19,236 | 25,860 | 15,529 | |||||||||
|
|
|
|
|
|
|
|||||||
| CASH FLOWS FROM INVESTING ACTIVITIES |
||||||||||||
| Net cash used in acquisition |
(5,356 | ) | — | — | ||||||||
| Purchases of available for sale securities |
(62 | ) | (56 | ) | (471 | ) | ||||||
| Purchases of held to maturity securities |
— | (1,000 | ) | — | ||||||||
| Sale of land held for sale |
— | — | 60 | |||||||||
| Proceeds from sale of available for sale securities |
— | 29 | — | |||||||||
| Contribution to subsidiary |
(124,373 | ) | — | — | ||||||||
|
|
|
|
|
|
|
|||||||
| NET CASH USED IN INVESTING ACTIVITIES |
(129,791 | ) | (1,027 | ) | (411 | ) | ||||||
|
|
|
|
|
|
|
|||||||
| CASH FLOWS FROM FINANCING ACTIVITIES |
||||||||||||
| Cash dividends paid on common and preferred stock |
(16,007 | ) | (12,586 | ) | (10,836 | ) | ||||||
| Issuance of stock to the dividend reinvestment and stock purchase plan |
— | — | 77 | |||||||||
| Proceeds from issuance of common stock, net |
48,678 | 22 | — | |||||||||
| Proceeds from issuance of subordinated debt, net |
73,516 | — | — | |||||||||
| Redemption of subordinated debentures, net |
— | (8,170 | ) | — | ||||||||
| Retirement of restricted stock |
(206 | ) | (254 | ) | (104 | ) | ||||||
| Excess tax benefits |
43 | 59 | 70 | |||||||||
| Exercise of stock options |
285 | 124 | 90 | |||||||||
|
|
|
|
|
|
|
|||||||
| NET CASH PROVIDED BY (USED IN) FINANCING ACTIVITIES |
106,309 | (20,805 | ) | (10,703 | ) | |||||||
|
|
|
|
|
|
|
|||||||
| Net increase (decrease) in cash and cash equivalents |
(4,246 | ) | 4,028 | 4,415 | ||||||||
| Cash and cash equivalents, beginning of year |
15,921 | 11,893 | 7,478 | |||||||||
|
|
|
|
|
|
|
|||||||
| CASH AND CASH EQUIVALENTS, END OF YEAR |
$ | 11,675 | $ | 15,921 | $ | 11,893 | ||||||
|
|
|
|
|
|
|
|||||||
-115-
Table of Contents
ITEM 9 – Changes in and Disagreements with Accountants on Accounting and Financial Disclosure.
Not Applicable
ITEM 9A – Controls and Procedures.
Disclosure Controls
As of the end of the period covered by this Annual Report on Form 10-K, the Company’s management, including the Chief Executive Officer and Chief Financial Officer, carried out an evaluation of the Company’s disclosure controls and procedures (as defined in Rules 13a-15(e) and 15d-15(e) under the Securities Exchange Act of 1934) pursuant to Securities Exchange Act Rule 15d-15(b).
Based on their evaluation as of December 31, 2016, the Company’s Chief Executive Officer and Chief Financial Officer have concluded that the Company’s disclosure controls and procedures (as defined in Rules 13a-15(e) and 15d-15(e) under the Securities Exchange Act of 1934) are effective in ensuring that the information required to be disclosed by the Company in the reports that the Company files or submits under the Securities Exchange Act of 1934 is recorded, processed, summarized and reported within the time periods specified in SEC rules and forms and are operating in an effective manner and that such information is accumulated and communicated to our management, including our Chief Executive Officer and Chief Financial Officer, as appropriate to allow timely decisions regarding required disclosure.
Management’s Report on Internal Control Over Financial Reporting
The management of Lakeland Bancorp, Inc. and its subsidiaries (the “Company”) is responsible for establishing and maintaining adequate internal control over financial reporting as defined in Rule 13a-15(f) and 15d-15(f) under the Securities Exchange Act of 1934.
The Company’s internal control over financial reporting is a process designed to provide reasonable assurance regarding the reliability of financial reporting and the preparation of financial statements for external purposes in accordance with generally accepted accounting principles and includes those policies and procedures that:
| • | Pertain to the maintenance of records that, in reasonable detail, accurately and fairly reflect the transactions and dispositions of the assets of the Company; |
| • | Provide reasonable assurance that transactions are recorded as necessary to permit preparation of financial statements in accordance with generally accepted accounting principles, and that receipts and expenditures of the Company are being made only in accordance with authorizations of management and the board of directors of the Company; and |
| • | Provide reasonable assurance regarding prevention or timely detection of unauthorized acquisition, use or disposition of the Company’s assets that could have a material effect on the financial statements. |
Because of its inherent limitations, internal control over financial reporting may not prevent or detect misstatements. Also, projections of any evaluation of effectiveness to future periods are subject to risk that controls may become inadequate because of changes in conditions or because of declines in the degree of compliance with policies or procedures.
The Company’s management assessed the effectiveness of the Company’s internal control over financial reporting as of December 31, 2016. In making this assessment, the Company’s management used the criteria set forth by the Committee of Sponsoring Organizations of the Treadway Commission (“COSO”) in Internal Control-Integrated Framework (2013).
As of December 31, 2016, based on management’s assessment, the Company’s internal control over financial reporting was effective.
-116-
Table of Contents
Our independent registered public accounting firm, KPMG LLP, audited our internal control over financial reporting as of December 31, 2016. Their report, dated March 15, 2017, expressed an unqualified opinion on our internal control over financial reporting.
Remediation of Material Weakness
As previously disclosed in the Company’s Annual Report on Form 10-K for the year ended December 31, 2015 (the “2015 Form 10-K”), during the fourth quarter of 2015, management identified a material weakness in internal controls over the completeness and accuracy of the information used to determine the qualitative component of the allowance for loan and lease losses estimate. This material weakness in internal controls occurred due to the control operator not executing the review control, as designed, of the completeness and accuracy of the information used in the qualitative component of the allowance for loan and lease losses estimate as of December 31, 2015. No restatement of prior period financial statements and no change in previously issued financial results were required as a result of this weakness in internal control. Management took steps to remediate this weakness by enhancing review controls, including adding an additional independent level of review over the information used to determine the qualitative component in the allowance for loan and lease losses estimation process. Management evaluated these new controls and procedures and, as stated above, determined that the Company’s internal control over financial reporting was effective as of December 31, 2016.
Changes in Internal Controls Over Financial Reporting
Other than the changes described above, there have been no changes in the Company’s internal control over financial reporting that occurred during the quarter ended December 31, 2016 that have materially affected, or are reasonably likely to materially affect, the Company’s internal control over financial reporting.
-117-
Table of Contents
Report of Independent Registered Public Accounting Firm
The Board of Directors and Stockholders
Lakeland Bancorp, Inc.:
We have audited Lakeland Bancorp, Inc. (a New Jersey Corporation) and its subsidiaries’ (the Company) internal control over financial reporting as of December 31, 2016, based on criteria established in Internal Control – Integrated Framework (2013) issued by the Committee of Sponsoring Organizations of the Treadway Commission (COSO). The Company’s management is responsible for maintaining effective internal control over financial reporting and for its assessment of the effectiveness of internal control over financial reporting, included in the accompanying Management’s Report on Internal Control over Financial Reporting. Our responsibility is to express an opinion on the Company’s internal control over financial reporting based on our audit.
We conducted our audit in accordance with the standards of the Public Company Accounting Oversight Board (United States). Those standards require that we plan and perform the audit to obtain reasonable assurance about whether effective internal control over financial reporting was maintained in all material respects. Our audit included obtaining an understanding of internal control over financial reporting, assessing the risk that a material weakness exists, and testing and evaluating the design and operating effectiveness of internal control based on the assessed risk. Our audit also included performing such other procedures as we considered necessary in the circumstances. We believe that our audit provides a reasonable basis for our opinion.
A company’s internal control over financial reporting is a process designed to provide reasonable assurance regarding the reliability of financial reporting and the preparation of financial statements for external purposes in accordance with generally accepted accounting principles. A company’s internal control over financial reporting includes those policies and procedures that (1) pertain to the maintenance of records that, in reasonable detail, accurately and fairly reflect the transactions and dispositions of the assets of the company; (2) provide reasonable assurance that transactions are recorded as necessary to permit preparation of financial statements in accordance with generally accepted accounting principles, and that receipts and expenditures of the company are being made only in accordance with authorizations of management and directors of the company; and (3) provide reasonable assurance regarding prevention or timely detection of unauthorized acquisition, use, or disposition of the company’s assets that could have a material effect on the financial statements.
Because of its inherent limitations, internal control over financial reporting may not prevent or detect misstatements. Also, projections of any evaluation of effectiveness to future periods are subject to the risk that controls may become inadequate because of changes in conditions, or that the degree of compliance with the policies or procedures may deteriorate.
In our opinion, the Company maintained, in all material respects, effective internal control over financial reporting as of December 31, 2016, based on criteria established in Internal Control – Integrated Framework (2013) issued by COSO.
We also have audited, in accordance with the standards of the Public Company Accounting Oversight Board (United States), the consolidated balance sheets of the Company as of December 31, 2016 and 2015, and the related consolidated statements of income, comprehensive income, changes in stockholders’ equity, and cash flows for each of the years in the three-year period ended December 31, 2016, and our report dated March 15, 2017 expressed an unqualified opinion on those consolidated financial statements.
/s/ KPMG LLP
Short Hills, New Jersey
March 15, 2017
-118-
Table of Contents
None.
ITEM 10 - Directors, Executive Officers and Corporate Governance.
The Company responds to this Item by incorporating by reference the material responsive to this Item in the Company’s definitive proxy statement for its 2017 Annual Meeting of Shareholders.
ITEM 11 - Executive Compensation.
The Company responds to this Item by incorporating by reference the material responsive to this Item in the Company’s definitive proxy statement for its 2017 Annual Meeting of Shareholders.
ITEM 12 - Security Ownership of Certain Beneficial Owners and Management and Related Stockholder Matters.
The Company responds to this Item by incorporating by reference the material responsive to this Item in the Company’s definitive proxy statement for its 2017 Annual Meeting of Shareholders.
EQUITY COMPENSATION PLAN INFORMATION
The following table gives information about the Company’s common stock that may be issued upon the exercise of options under the Company’s Amended and Restated 2000 Equity Compensation Program and the Company’s 2009 Equity Compensation Program as of December 31, 2016. These plans were the Company’s only equity compensation plans in existence as of December 31, 2016. The 2009 Equity Compensation Program is the successor to the 2000 Equity Compensation Program, and no additional awards will be granted under the 2000 Equity Compensation Program. No warrants or rights may be granted, or are outstanding, under the 2000 or the 2009 Equity Compensation Programs.
| Plan Category |
(a) Number Of |
(b) Weighted-Average |
(c) Number Of Securities Reflected In Column (a)) |
|||||||||
| Equity Compensation Plans Approved by Shareholders |
457,055 | $ | 9.16 | 1,411,766 | ||||||||
| Equity Compensation Plans Not Approved by Shareholders |
— | — | — | |||||||||
| TOTAL |
457,055 | $ | 9.16 | 1,411,766 | ||||||||
The number in column (a) does not include a total of 23,415 shares of Lakeland common stock that are issuable upon the exercise of options assumed in the Somerset Hills merger with a weighted average exercise price of $7.03.
ITEM 13 - Certain Relationships and Related Transactions, and Director Independence.
The Company responds to this Item by incorporating by reference the material responsive to this Item in the Company’s definitive proxy statement for its 2017 Annual Meeting of Shareholders.
-119-
Table of Contents
ITEM 14 - Principal Accounting Fees and Services.
The Company responds to this Item by incorporating by reference the material responsive to this Item in the Company’s definitive proxy statement for its 2017 Annual Meeting of Shareholders.
ITEM 15 - Exhibits and Financial Statement Schedules.
(a) 1. The following portions of the Company’s consolidated financial statements are set forth in Item 8 of this Annual Report:
| (i) | Consolidated Balance Sheets as of December 31, 2016 and 2015. |
| (ii) | Consolidated Statements of Operations for each of the three years in the period ended December 31, 2016. |
| (iii) | Consolidated Statements of Changes in Stockholders’ Equity for each of the three years in the period ended December 31, 2016. |
| (iv) | Consolidated Statements of Cash Flows for each of the three years in the period ended December 31, 2016. |
| (v) | Notes to Consolidated Financial Statements. |
| (vi) | Report of Independent Registered Public Accounting Firm. |
| (vii) | Report of Former Independent Registered Public Accounting Firm. |
(a) 2. Financial Statement Schedules
All financial statement schedules are omitted as the information, if applicable, is presented in the consolidated financial statements or notes thereto.
(a) 3. Exhibits
| 2.1 | Agreement and Plan of Merger, dated as of August 3, 2015, by and between the Registrant and Pascack Bancorp, Inc., is incorporated by reference to Exhibit 2.1 to the Registrant’s Current Report on Form 8-K filed with the SEC on August 4, 2015. | |||
| 2.2 | Agreement and Plan of Merger, dated as of February 17, 2016, by and among the Registrant, Lakeland Bank and Harmony Bank, is incorporated by reference to Exhibit 2.1 to the Registrant’s Current Report on Form 8-K filed with the SEC on February 18, 2016. | |||
| 3.1 | Registrant’s Restated Certificate of Incorporation, dated May 19, 2005, including Certificate of Amendment dated February 4, 2009 to the Registrant’s Restated Certificate of Incorporation, is incorporated by reference to Exhibit 3.1 to the Registrant’s Current Report on Form 8-K filed with the SEC on February 9, 2009. | |||
| 3.2 | Certificate of Amendment, dated January 29, 2009, to the Registrant’s Restated Certificate of Incorporation is incorporated by reference to Exhibit 3.1 to the Registrant’s Current Report on Form 8-K filed with the SEC on February 3, 2009. | |||
| 3.3 | Certificate of Amendment, dated May 8, 2013, to the Registrant’s Restated Certificate of Incorporation is incorporated by reference to Exhibit 3.1 to the Registrant’s Current Report on Form 8-K filed with the SEC on May 14, 2013. | |||
| 3.4 | Registrant’s Amended and Restated Bylaws are incorporated by reference to Exhibit 3.3 to the Registrant’s Annual Report on Form 10-K for the year ended December 31, 2012. | |||
| 4.1 | Indenture, dated as of September 30, 2016, between Lakeland Bancorp, Inc. and U.S. Bank National Association, as Trustee, is incorporated by reference to Exhibit 4.1 to the Registrant’s Current Report on Form 8-K filed with the SEC on September 30, 2016. | |||
-120-
Table of Contents
| 4.2 | First Supplemental Indenture, dated as of September 30, 2016, between Lakeland Bancorp, Inc. and U.S. Bank National Association, as Trustee, is incorporated by reference to Exhibit 4.2 to the Registrant’s Current Report on Form 8-K filed with the SEC on September 30, 2016. | |||
| 10.1 | Lakeland Bancorp, Inc. Amended and Restated 2000 Equity Compensation Program is incorporated by reference to Appendix A to the Registrant’s definitive proxy materials for its 2005 Annual Meeting of Shareholders. | |||
| 10.2 | Lakeland Bancorp, Inc. 2009 Equity Compensation Program, as amended and restated effective February 27, 2014, is incorporated by reference to Exhibit 10.1 to the Registrant’s Current Report on Form 8-K filed with the SEC on February 28, 2014. | |||
| 10.3 | Employment Agreement, dated as of April 2, 2008 and executed on May 22, 2008, among Lakeland Bancorp, Inc., Lakeland Bank and Thomas J. Shara, is incorporated by reference to Exhibit 10.1 to the Registrant’s Current Report on Form 8-K filed with the SEC on May 28, 2008. | |||
| 10.4 | Supplemental Executive Retirement Plan Agreement for Thomas J. Shara, effective as of April 2, 2008, among Lakeland Bancorp, Inc., Lakeland Bank and Thomas J. Shara is incorporated by reference to Exhibit 10.2 to the Registrant’s Current Report on Form 8-K filed with the SEC on May 28, 2008. | |||
| 10.5 | Change of Control Agreement dated March 1, 2001, among Lakeland Bancorp, Inc., Lakeland Bank and Joseph F. Hurley is incorporated by reference to Exhibit 10.8 to the Registrant’s Annual Report on Form 10-K for the year ended December 31, 2000. | |||
| 10.6 | Change of Control Agreement dated March 1, 2001, among Lakeland Bancorp, Inc., Lakeland Bank and Robert A. Vandenbergh is incorporated by reference to Exhibit 10.9 to the Registrant’s Annual Report on Form 10-K for the year ended December 31, 2000. | |||
| 10.7 | Amendments to Change of Control Agreements, dated March 10, 2003, among Lakeland Bancorp, Inc., Lakeland Bank and each of Joseph F. Hurley and Robert A. Vandenbergh are incorporated by reference to Exhibit 10.13 to the Registrant’s Annual Report on Form 10-K for the year ended December 31, 2002. | |||
| 10.8 | Lakeland Bancorp, Inc. Directors’ Deferred Compensation Plan, as amended and restated, is incorporated by reference to Exhibit 10.6 to the Registrant’s Current Report on Form 8-K filed with the SEC on December 30, 2008. | |||
| 10.9 | Change in Control, Severance and Employment Agreement, dated as of November 24, 2008, among Lakeland Bancorp, Inc., Lakeland Bank and David S. Yanagisawa, is incorporated by reference to Exhibit 10.9 of the Registrant’s Current Report on Form 8-K filed with the SEC on December 30, 2008. | |||
| 10.10 | Second Amendatory Agreement to Change in Control Agreement, dated as of December 31, 2008, among Lakeland Bancorp, Inc., Lakeland Bank and Joseph F. Hurley, is incorporated by reference to Exhibit 10.2 to the Registrant’s Current Report on Form 8-K filed with the SEC on December 30, 2008. | |||
| 10.11 | Second Amendatory Agreement to Change in Control Agreement, dated as of December 31, 2008, among Lakeland Bancorp, Inc., Lakeland Bank and Robert A. Vandenbergh, is incorporated by reference to Exhibit 10.5 to the Registrant’s Current Report on Form 8-K filed with the SEC on December 30, 2008. | |||
| 10.12 | Supplemental Executive Retirement Plan Agreement, effective as of December 23, 2008, among Lakeland Bancorp, Inc., Lakeland Bank and Robert A. Vandenbergh, is incorporated by reference to Exhibit 10.7 to the Registrant’s Current Report on Form 8-K filed with the SEC on December 30, 2008. | |||
-121-
Table of Contents
| 10.13 | Amendment No. 3 to Salary Continuation Agreement, dated as of December 31, 2008, among Lakeland Bancorp, Inc., Lakeland Bank and Robert A. Vandenbergh, is incorporated by reference to Exhibit 10.8 to the Registrant’s Current Report on Form 8-K filed with the SEC on December 30, 2008. | |||
| 10.14 | Change in Control Agreement, dated as of June 12, 2009, among Lakeland Bancorp, Inc., Lakeland Bank and Ronald E. Schwarz, is incorporated by reference to Exhibit 10.25 to the Registrant’s Annual Report on Form 10-K for the year ended December 31, 2010. | |||
| 10.15 | Somerset Hills Bancorp 2001 Combined Stock Option Plan is incorporated by reference to Exhibit 4.6 to the Registrant’s Registration Statement on Form S-8 filed with the SEC on June 3, 2013. | |||
| 10.16 | Somerset Hills Bancorp 2007 Equity Incentive Plan is incorporated by reference to Exhibit 4.7 to the Registrant’s Registration Statement on Form S-8 filed with the SEC on June 3, 2013. | |||
| 10.17 | Somerset Hills Bancorp 2012 Equity Incentive Plan is incorporated by reference to Exhibit 4.8 to the Registrant’s Registration Statement on Form S-8 filed with the SEC on June 3, 2013. | |||
| 10.18 | Change of Control Agreement, dated October 31, 2013, among Lakeland Bancorp, Inc., Lakeland Bank and Timothy J. Matteson, is incorporated by reference to Exhibit 10.2 to the Registrant’s Quarterly Report on Form 10-Q for the quarter ended September 30, 2013. | |||
| 10.19 | Deferred Compensation Agreement, dated February 27, 2015, among Lakeland Bancorp, Inc., Lakeland Bank and Thomas J. Shara, is incorporated by reference to Exhibit 10.1 to the Registrant’s Current Report on Form 8-K filed with the SEC on March 2, 2015. | |||
| 10.20 | Lakeland Bancorp, Inc. Elective Deferral Plan is incorporated by reference to Exhibit 10.1 to the Registrant’s Current Report on Form 8-K filed with the SEC on March 20, 2015. | |||
| 10.21 | Amendment, dated August 7, 2015, to Employment Agreement, dated April 2, 2008 and executed May 22, 2008, among Lakeland Bancorp, Inc., Lakeland Bank and Thomas J. Shara, is incorporated by reference to Exhibit 10.1 to the Registrant’s Current Report on Form 8-K filed with the SEC on August 7, 2015. | |||
| 10.22 | Amendment, dated August 7, 2015, to Change in Control Agreement, dated March 1, 2001, as amended by agreements dated March 10, 2003 and December 31, 2008, among Lakeland Bancorp, Inc., Lakeland Bank and Joseph F. Hurley, is incorporated by reference to Exhibit 10.2 to the Registrant’s Current Report on Form 8-K filed with the SEC on August 7, 2015. | |||
| 10.23 | Amendment, dated August 7, 2015, to Change in Control Agreement, dated March 1, 2001, as amended by agreements dated March 10, 2003 and December 31, 2008, among Lakeland Bancorp, Inc., Lakeland Bank and Robert A. Vandenbergh, is incorporated by reference to Exhibit 10.3 to the Registrant’s Current Report on Form 8-K filed with the SEC on August 7, 2015. | |||
| 10.24 | Amendment, dated August 7, 2015, to Change in Control Agreement, dated June 12, 2009, among Lakeland Bancorp, Inc., Lakeland Bank and Ronald E. Schwarz, is incorporated by reference to Exhibit 10.4 to the Registrant’s Current Report on Form 8-K filed with the SEC on August 7, 2015. | |||
| 10.25 | Amendment, dated August 7, 2015, to Change in Control Agreement, dated November 24, 2008, as amended, among Lakeland Bancorp, Inc., Lakeland Bank and David S. Yanagisawa, is incorporated by reference to Exhibit 10.5 to the Registrant’s Quarterly Report on Form 10-Q for the period ended June 30, 2015. | |||
| 10.26 | Amendment, dated August 7, 2015, to Change in Control Agreement, dated October 31, 2013, as amended, among Lakeland Bancorp, Inc., Lakeland Bank and Timothy J. Matteson, is incorporated by reference to Exhibit 10.8 to the Registrant’s Quarterly Report on Form 10-Q for the period ended June 30, 2015. | |||
-122-
Table of Contents
| 10.27 | Change in Control Agreement, dated as of April 11, 2016, among Lakeland Bancorp, Inc., Lakeland Bank and James Nigro, is incorporated by reference to Exhibit 10.1 to the Registrant’s Quarterly Report on Form 10-Q filed with the SEC on May 10, 2016. | |||
| 10.28 | Amendatory Agreement, dated as of January 1, 2017, to Change in Control Agreement, dated as of March 1, 2001, as amended, among Lakeland Bancorp, Inc., Lakeland Bank and Robert A. Vandenbergh, is incorporated by reference to Exhibit 10.1 to the Registrant’s Current Report on Form 8-K filed with the SEC on January 4, 2017. | |||
| 10.29 | Amendatory Agreement to Change in Control Agreement, dated as of February 23, 2017, among Lakeland Bancorp, Inc., Lakeland Bank and David S. Yanagisawa. | |||
| 12.1 | Statement of Ratios of Earnings to Fixed Charges. | |||
| 21.1 | Subsidiaries of Registrant. | |||
| 23.1 | Consent of KPMG LLP. | |||
| 24.1 | Power of Attorney. | |||
| 31.1 | Certification of Chief Executive Officer pursuant to Section 302 of the Sarbanes-Oxley Act of 2002. | |||
| 31.2 | Certification of Chief Financial Officer pursuant to Section 302 of the Sarbanes-Oxley Act of 2002. | |||
| 32.1 | Certification of Chief Executive Officer and Chief Financial Officer pursuant to Section 906 of the Sarbanes-Oxley Act of 2002. | |||
| 101.INS | XBRL Instance Document | |||
| 101.SCH | XBRL Taxonomy Extension Schema Document | |||
| 101.CAL | XBRL Taxonomy Extension Calculation Linkbase Document | |||
| 101.DEF | XBRL Taxonomy Extension Definition Linkbase Document | |||
| 101.LAB | XBRL Taxonomy Extension Label Linkbase Document | |||
| 101.PRE | XBRL Taxonomy Extension Presentation Linkbase Document | |||
Not applicable.
-123-
Table of Contents
Pursuant to the requirements of Section 13 or 15(d) of the Securities Exchange Act of 1934, the registrant has duly caused this report to be signed on its behalf by the undersigned, thereunto duly authorized.
| LAKELAND BANCORP, INC. | ||||||
| Dated: March 15, 2017 | By: | /s/ Thomas J. Shara | ||||
| Thomas J. Shara | ||||||
| President and Chief Executive Officer | ||||||
Pursuant to the requirements of the Securities Exchange Act of 1934, this report has been signed by the following persons on behalf of the registrant and in the capacities and on the dates indicated.
| Signature |
Capacity |
Date | ||
| /s/ Bruce D. Bohuny* Bruce D. Bohuny |
Director | March 15, 2017 | ||
| /s/ Mary Ann Deacon* Mary Ann Deacon |
Director | March 15, 2017 | ||
| /s/ Edward B. Deutsch* Edward B. Deutsch |
Director | March 15, 2017 | ||
| /s/ Brian Flynn* Brian Flynn |
Director | March 15, 2017 | ||
| /s/ Mark J. Fredericks* Mark J. Fredericks |
Director | March 15, 2017 | ||
| /s/ Janeth C. Hendershot* Janeth C. Hendershot |
Director | March 15, 2017 | ||
| /s/ Lawrence R. Inserra, Jr.* Lawrence R. Inserra, Jr. |
Director | March 15, 2017 | ||
| /s/ Thomas J. Marino* Thomas J. Marino |
Director | March 15, 2017 | ||
| /s/ Robert E. McCracken* Robert E. McCracken |
Director | March 15, 2017 | ||
| /s/ Robert B. Nicholson, III* Robert B. Nicholson, III |
Director | March 15, 2017 | ||
| /s/ Joseph P. O’Dowd* Joseph P. O’Dowd |
Director | March 15, 2017 | ||
-124-
Table of Contents
| Signature |
Capacity |
Date | ||
| /s/ Thomas J. Shara Thomas J. Shara |
Director, President and Chief Executive Officer (Principal Executive Officer) | March 15, 2017 | ||
| /s/ Stephen R. Tilton, Sr.* Stephen R. Tilton, Sr. |
Director | March 15, 2017 | ||
| /s/ Joseph F. Hurley Joseph F. Hurley |
Executive Vice President and Chief Financial Officer (Principal Financial Officer) | March 15, 2017 | ||
| /s/ Thomas Splaine Thomas Splaine |
First Senior Vice President & Chief Accounting Officer (Principal Accounting Officer) | March 15, 2017 | ||
| *By: | /s/ Thomas J. Shara Thomas J. Shara Attorney-in-Fact |
March 15, 2017 |
-125-