Attached files
| file | filename |
|---|---|
| EX-99.1 - EX-99.1 - PLEXUS CORP | plxsq3f20earningsrelea.htm |
| 8-K - 8-K - PLEXUS CORP | plxs-20200722.htm |

Fiscal third quarter 2020 financial results July 23, 2020
PLEXUS CORP. Safe harbor and fair disclosure statement Any statements made during our call today and information included in the supporting material that is not historical in nature, such as statements in the future tense and statements that include "believe," "expect," "intend," "plan," "anticipate," and similar terms and concepts, are forward-looking statements. Forward-looking statements are not guarantees since there are inherent difficulties in predicting future results, and actual results could differ materially from those expressed or implied in the forward- looking statements. For a list of factors that could cause actual results to differ materially from those discussed, please refer to the Company’s periodic SEC filings, particularly the risk factors in our Form 10-K filing for the fiscal year ended September 28, 2019, as supplemented by our Form 10-Q filed with the SEC on May 8, 2020, and the Safe Harbor and Fair Disclosure statement in yesterday’s press release. Plexus provides non-GAAP supplemental information, such as ROIC, economic return, and free cash flow, because those measures are used for internal management goals and decision making, and because they provide additional insight into financial performance. In addition, management uses these and other non-GAAP measures, such as adjusted operating income, adjusted operating margin, adjusted net income, and adjusted earnings per share, to provide a better understanding of core performance for purposes of period-to-period comparisons. For a full reconciliation of non-GAAP supplemental information please refer to yesterday’s press release and our periodic SEC filings. 2
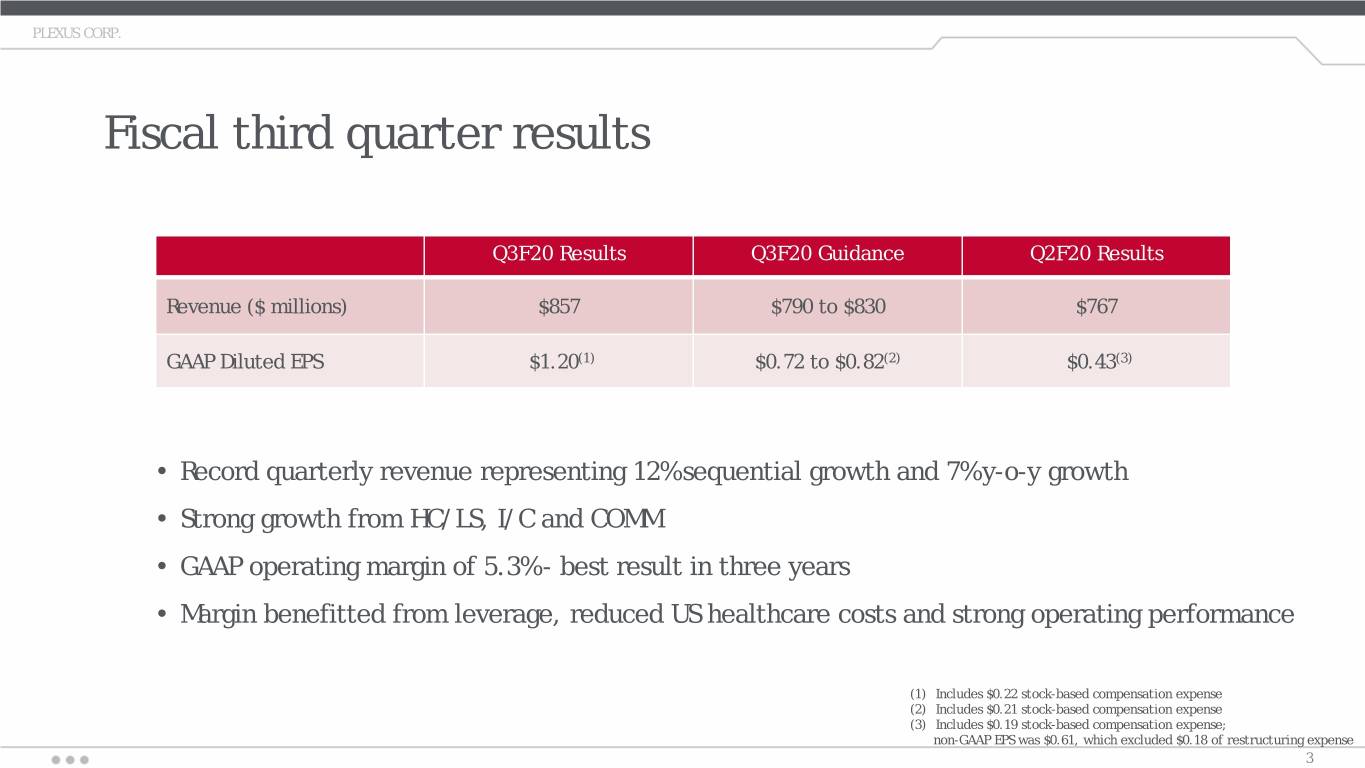
PLEXUS CORP. Fiscal third quarter results Q3F20 Results Q3F20 Guidance Q2F20 Results Revenue ($ millions) $857 $790 to $830 $767 GAAP Diluted EPS $1.20(1) $0.72 to $0.82(2) $0.43(3) • Record quarterly revenue representing 12% sequential growth and 7% y-o-y growth • Strong growth from HC/LS, I/C and COMM • GAAP operating margin of 5.3% - best result in three years • Margin benefitted from leverage, reduced US healthcare costs and strong operating performance (1) Includes $0.22 stock-based compensation expense (2) Includes $0.21 stock-based compensation expense (3) Includes $0.19 stock-based compensation expense; non-GAAP EPS was $0.61, which excluded $0.18 of restructuring expense 3
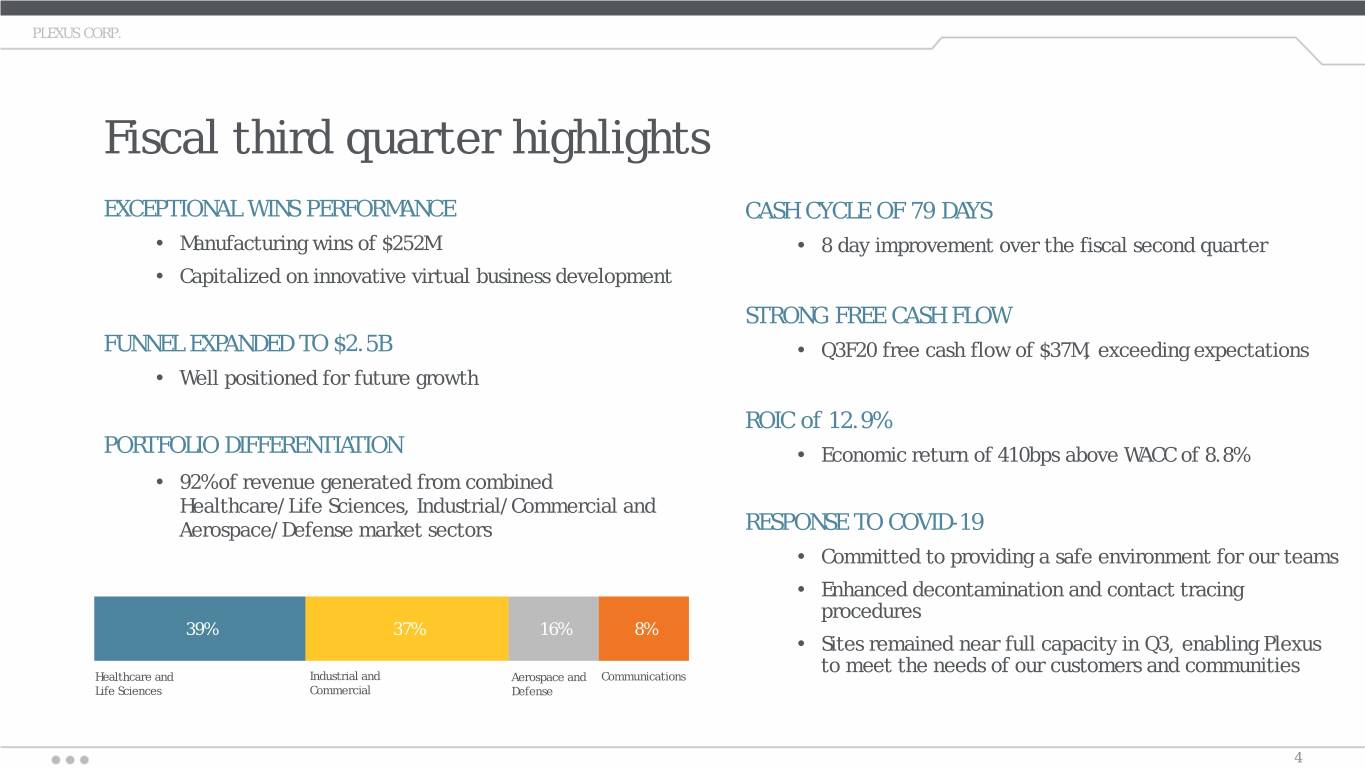
PLEXUS CORP. Fiscal third quarter highlights EXCEPTIONAL WINS PERFORMANCE CASH CYCLE OF 79 DAYS • Manufacturing wins of $252M • 8 day improvement over the fiscal second quarter • Capitalized on innovative virtual business development STRONG FREE CASH FLOW FUNNEL EXPANDED TO $2.5B • Q3F20 free cash flow of $37M, exceeding expectations • Well positioned for future growth ROIC of 12.9% PORTFOLIO DIFFERENTIATION • Economic return of 410bps above WACC of 8.8% • 92% of revenue generated from combined Healthcare/Life Sciences, Industrial/Commercial and Aerospace/Defense market sectors RESPONSE TO COVID-19 • Committed to providing a safe environment for our teams • Enhanced decontamination and contact tracing procedures 39% 37% 16% 8% • Sites remained near full capacity in Q3, enabling Plexus to meet the needs of our customers and communities Healthcare and Industrial and Aerospace and Communications Life Sciences Commercial Defense 4
PLEXUS CORP. 5
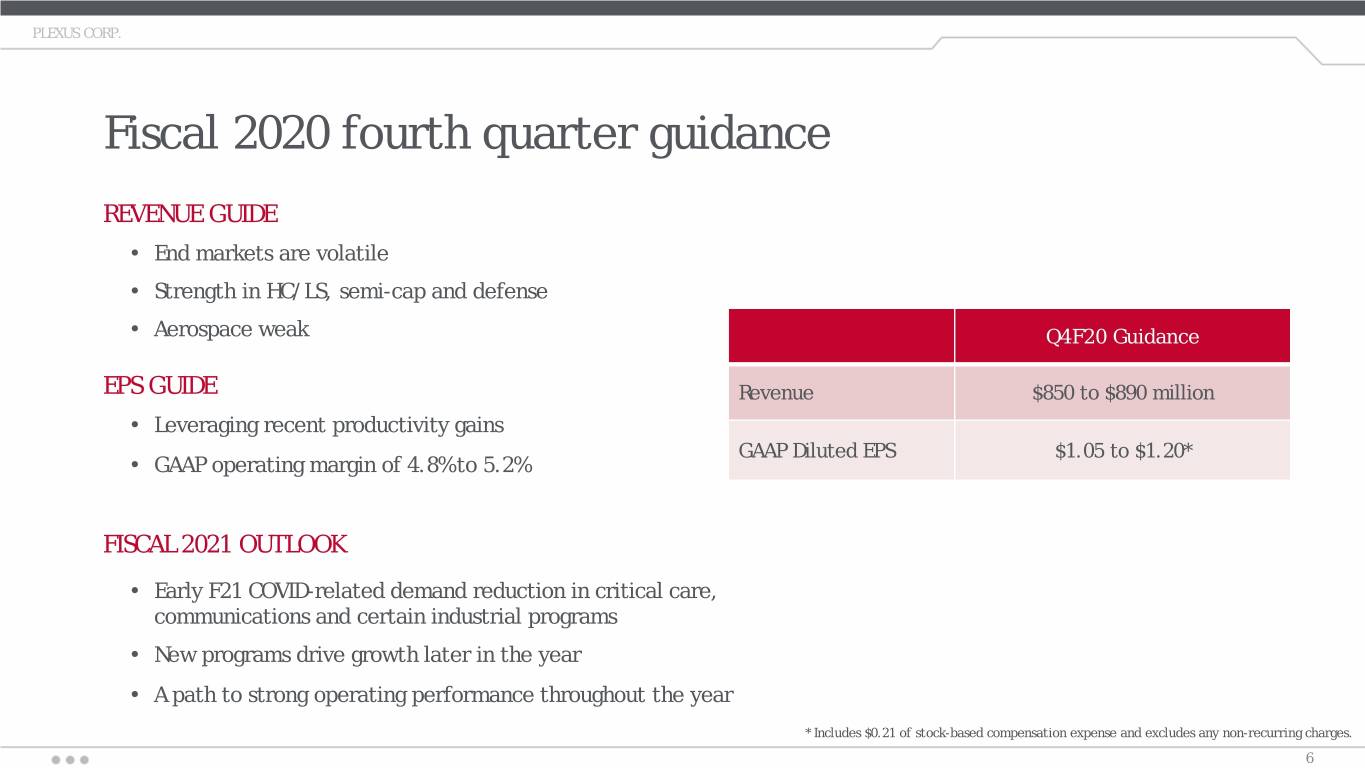
PLEXUS CORP. Fiscal 2020 fourth quarter guidance REVENUE GUIDE • End markets are volatile • Strength in HC/LS, semi-cap and defense • Aerospace weak Q4F20 Guidance EPS GUIDE Revenue $850 to $890 million • Leveraging recent productivity gains GAAP Diluted EPS $1.05 to $1.20* • GAAP operating margin of 4.8% to 5.2% FISCAL 2021 OUTLOOK • Early F21 COVID-related demand reduction in critical care, communications and certain industrial programs • New programs drive growth later in the year • A path to strong operating performance throughout the year * Includes $0.21 of stock-based compensation expense and excludes any non-recurring charges. 6
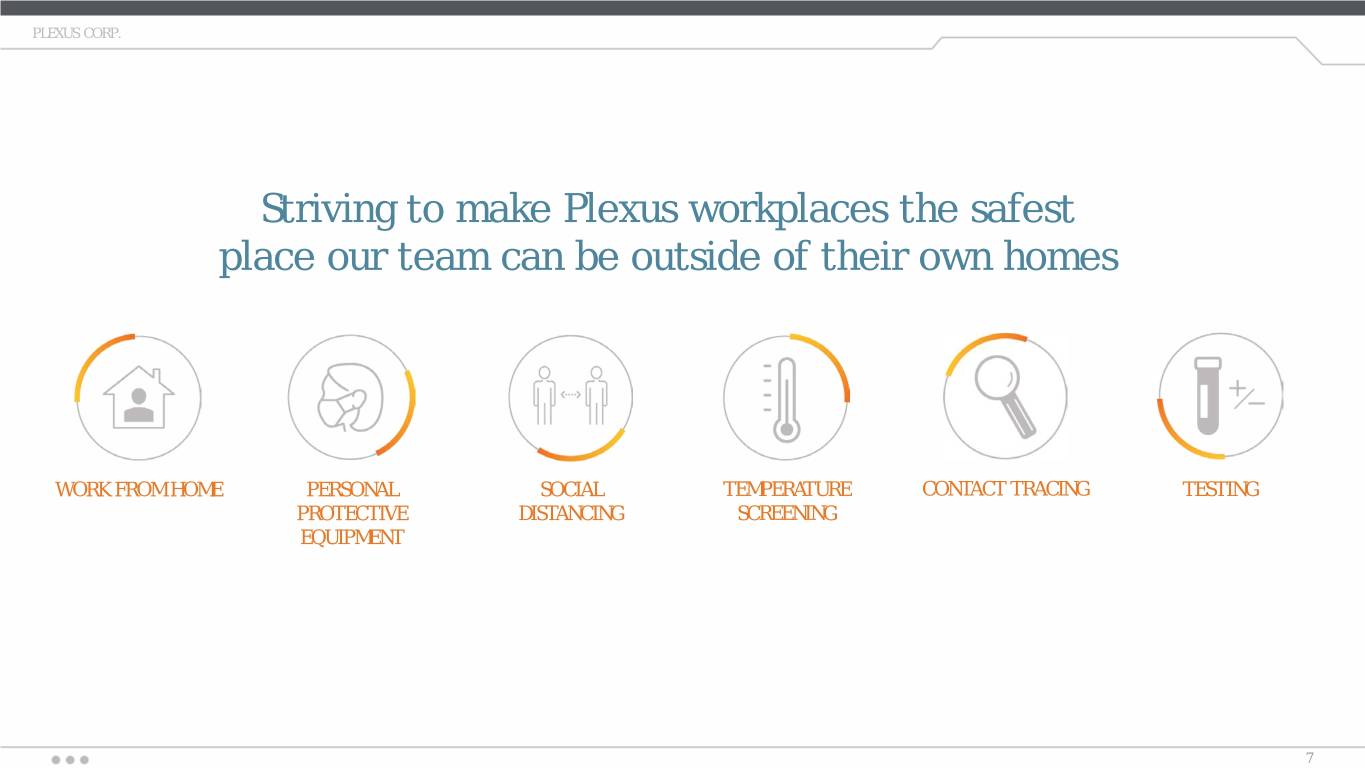
PLEXUS CORP. Striving to make Plexus workplaces the safest place our team can be outside of their own homes WORK FROM HOME PERSONAL SOCIAL TEMPERATURE CONTACT TRACING TESTING PROTECTIVE DISTANCING SCREENING EQUIPMENT 7
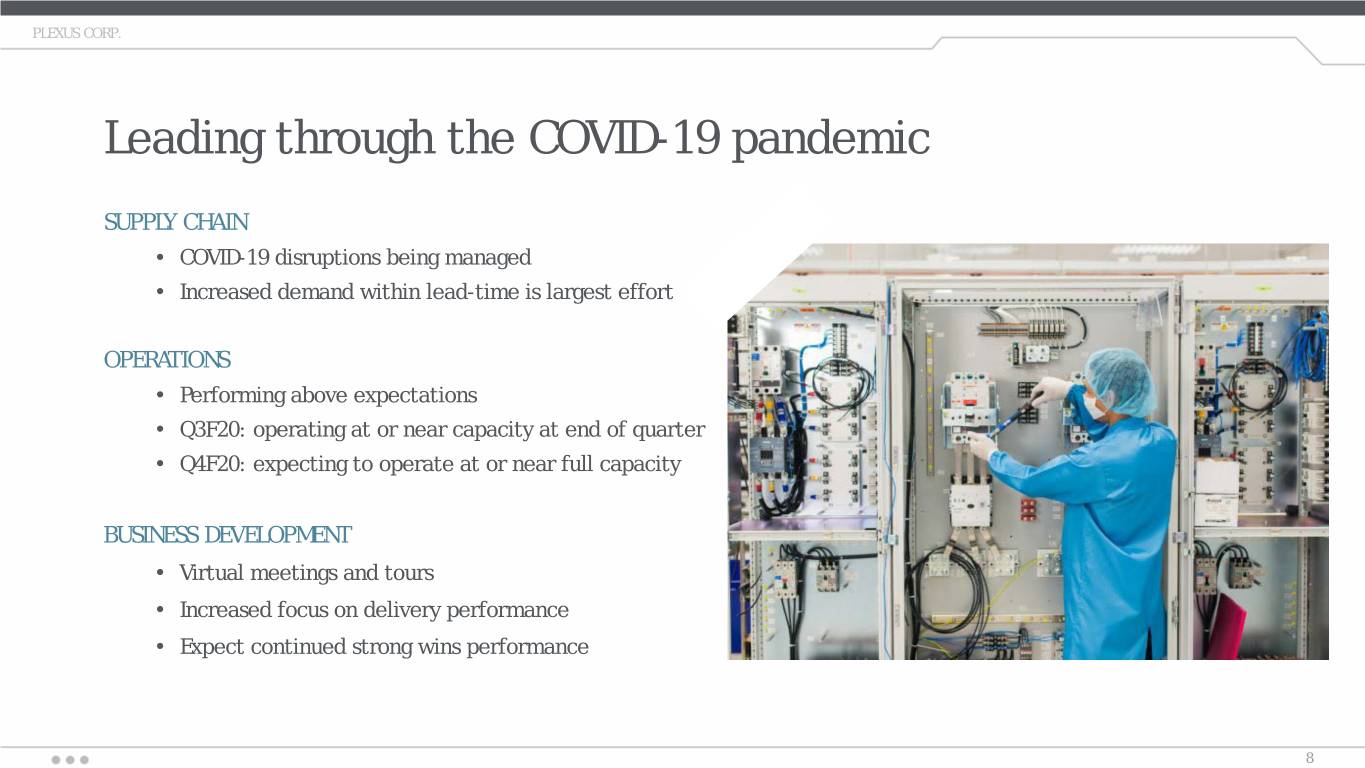
PLEXUS CORP. Leading through the COVID-19 pandemic SUPPLY CHAIN • COVID-19 disruptions being managed • Increased demand within lead-time is largest effort OPERATIONS • Performing above expectations • Q3F20: operating at or near capacity at end of quarter • Q4F20: expecting to operate at or near full capacity BUSINESS DEVELOPMENT • Virtual meetings and tours • Increased focus on delivery performance • Expect continued strong wins performance 8
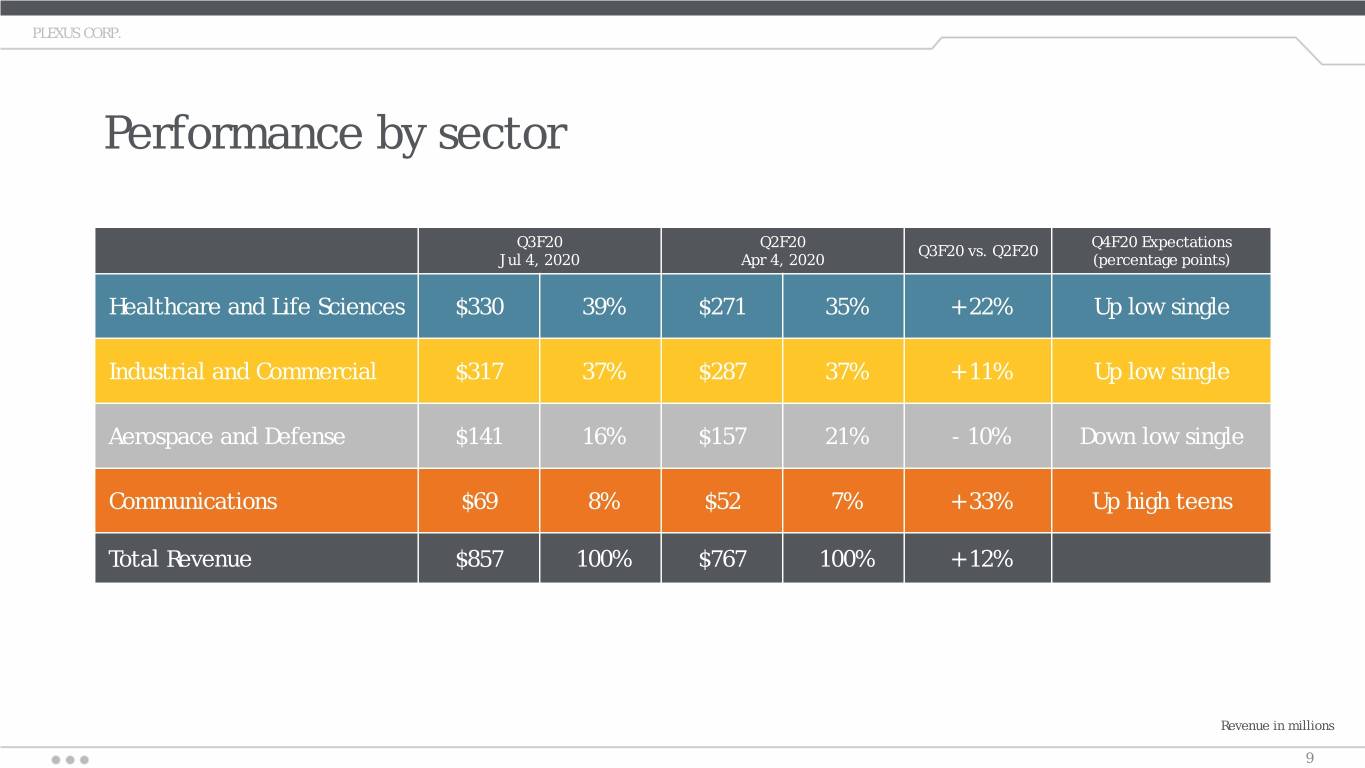
PLEXUS CORP. Performance by sector Q3F20 Q2F20 Q4F20 Expectations Q3F20 vs. Q2F20 Jul 4, 2020 Apr 4, 2020 (percentage points) Healthcare and Life Sciences $330 39% $271 35% + 22% Up low single Industrial and Commercial $317 37% $287 37% + 11% Up low single Aerospace and Defense $141 16% $157 21% - 10% Down low single Communications $69 8% $52 7% + 33% Up high teens Total Revenue $857 100% $767 100% + 12% Revenue in millions 9
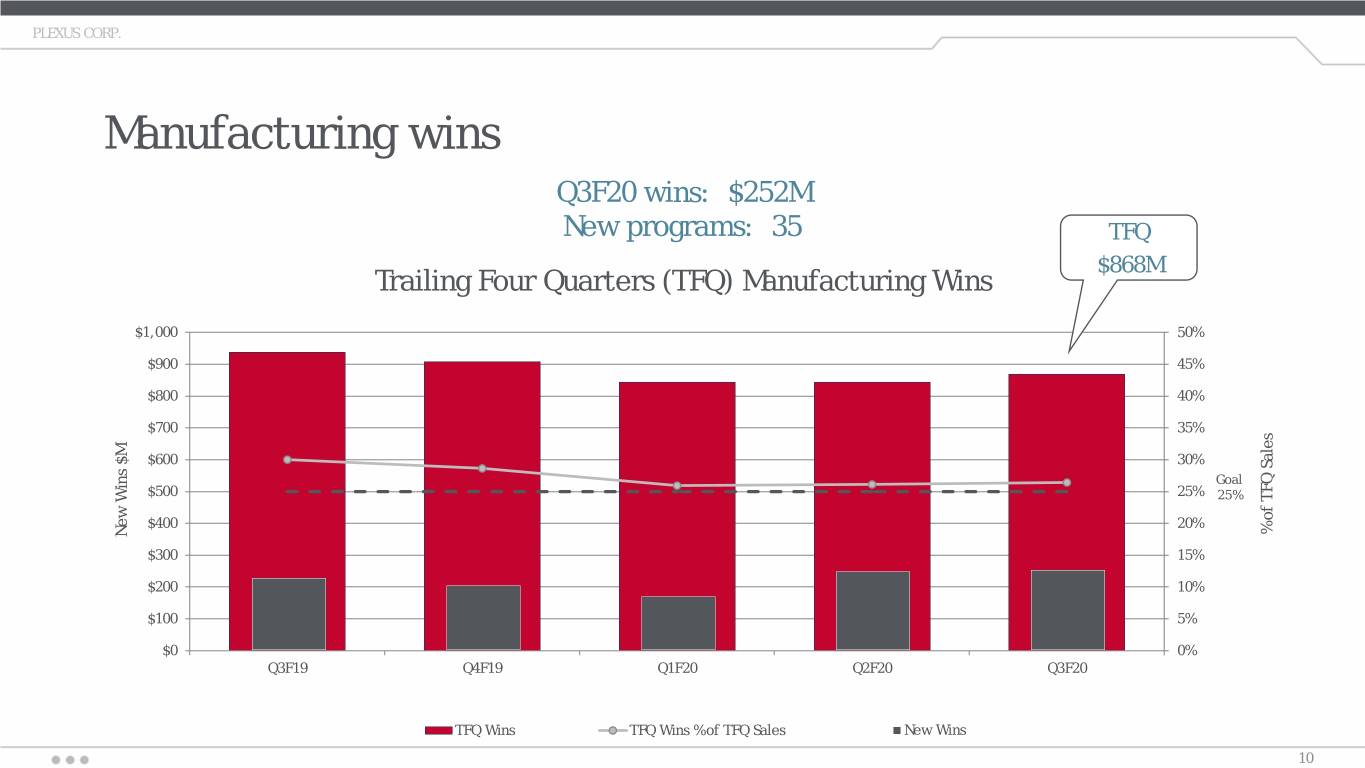
PLEXUS CORP. Manufacturing wins Q3F20 wins: $252M New programs: 35 TFQ $868M Trailing Four Quarters (TFQ) Manufacturing Wins $1,000 50% $900 45% $800 40% $700 35% $600 30% Goal $500 25% 25% $400 20% % of TFQ Sales% of New Wins $M $300 15% $200 10% $100 5% $0 0% Q3F19 Q4F19 Q1F20 Q2F20 Q3F20 TFQ Wins TFQ Wins % of TFQ Sales New Wins 10
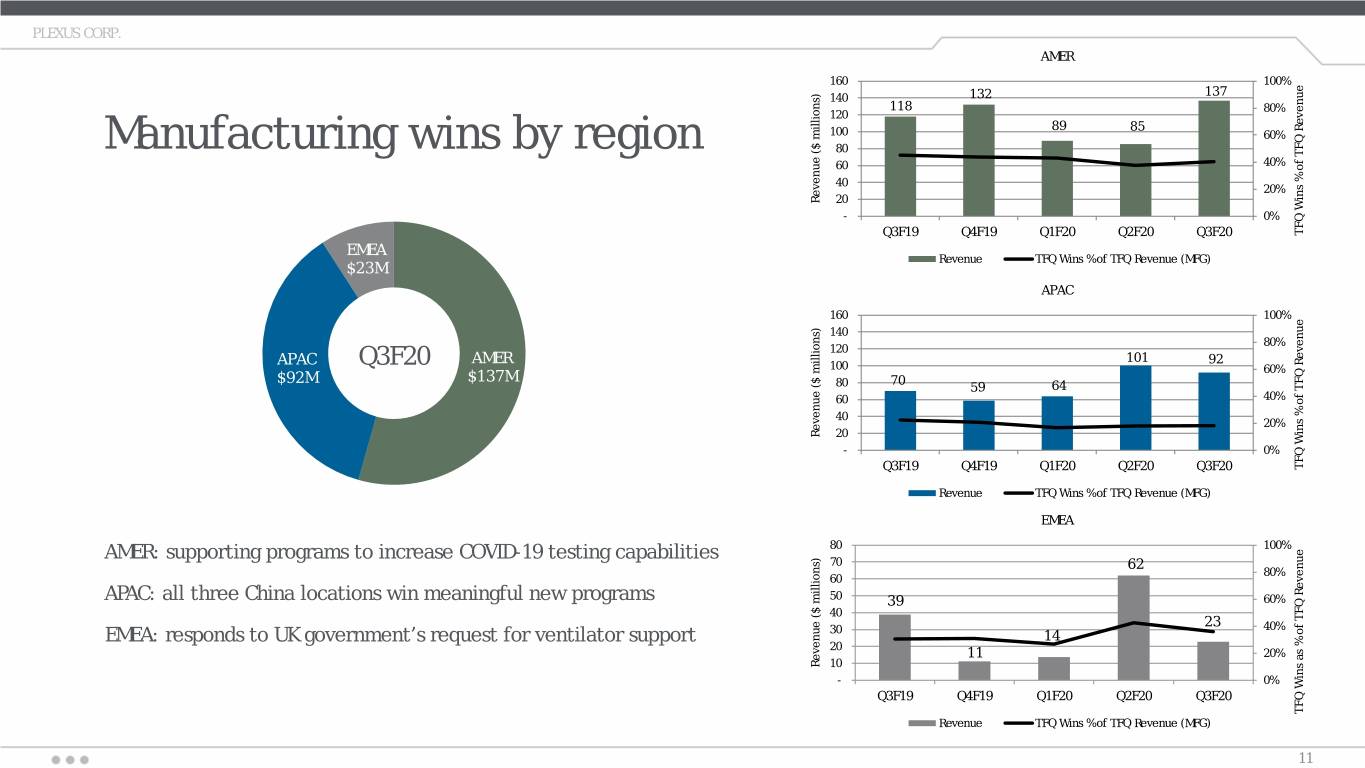
PLEXUS CORP. AMER 160 100% 140 132 137 118 80% 120 89 85 100 60% Manufacturing wins by region 80 60 40% 40 20% Revenue ($ ($ millions) Revenue 20 - 0% Q3F19 Q4F19 Q1F20 Q2F20 Q3F20 Revenue % TFQ of Wins TFQ EMEA Revenue TFQ Wins % of TFQ Revenue (MFG) $23M APAC 160 100% 140 80% 120 APAC AMER 101 92 Q3F20 100 60% $92M $137M 70 80 59 64 60 40% 40 20% Revenue ($ ($ millions) Revenue 20 - 0% Q3F19 Q4F19 Q1F20 Q2F20 Q3F20 Revenue % TFQ of Wins TFQ Revenue TFQ Wins % of TFQ Revenue (MFG) EMEA AMER: supporting programs to increase COVID-19 testing capabilities 80 100% 70 62 80% 60 APAC: all three China locations win meaningful new programs 50 39 60% 40 23 40% EMEA: responds to UK government’s request for ventilator support 30 14 20 11 20% Revenue ($ ($ millions) Revenue 10 - 0% Q3F19 Q4F19 Q1F20 Q2F20 Q3F20 TFQ Wins as % of TFQ Revenue % TFQ as of Wins TFQ Revenue TFQ Wins % of TFQ Revenue (MFG) 11
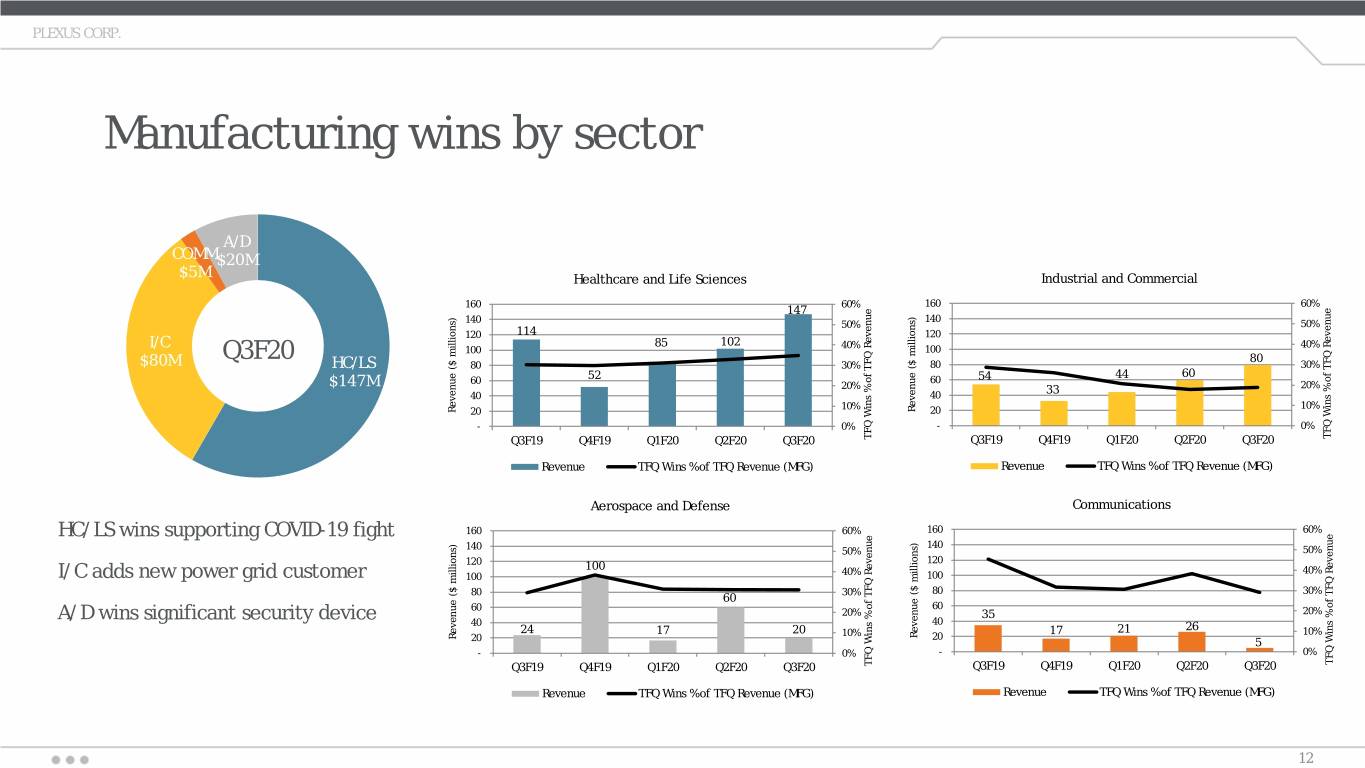
PLEXUS CORP. Manufacturing wins by sector A/D COMM $20M $5M Healthcare and Life Sciences Industrial and Commercial 160 60% 160 60% 147 140 140 50% 50% 120 114 120 85 102 40% 40% I/C 100 100 Q3F20 80 $80M HC/LS 80 30% 80 30% 52 44 60 $147M 60 60 54 20% 33 20% 40 40 10% 10% Revenue ($ millions) Revenue ($ millions) 20 20 - 0% - 0% TFQTFQof Wins Revenue % Q3F19 Q4F19 Q1F20 Q2F20 Q3F20 TFQTFQof Wins Revenue % Q3F19 Q4F19 Q1F20 Q2F20 Q3F20 Revenue TFQ Wins % of TFQ Revenue (MFG) Revenue TFQ Wins % of TFQ Revenue (MFG) Aerospace and Defense Communications HC/LS wins supporting COVID-19 fight 160 60% 160 60% 140 140 50% 50% 120 120 100 40% 40% I/C adds new power grid customer 100 100 80 30% 80 30% 60 60 60 20% 35 20% A/D wins significant security device 40 40 24 17 20 17 21 26 10% 10% Revenue ($ millions) Revenue ($ millions) 20 20 5 - 0% - 0% TFQTFQof Wins Revenue % Q3F19 Q4F19 Q1F20 Q2F20 Q3F20 TFQTFQof Wins Revenue % Q3F19 Q4F19 Q1F20 Q2F20 Q3F20 Revenue TFQ Wins % of TFQ Revenue (MFG) Revenue TFQ Wins % of TFQ Revenue (MFG) 12
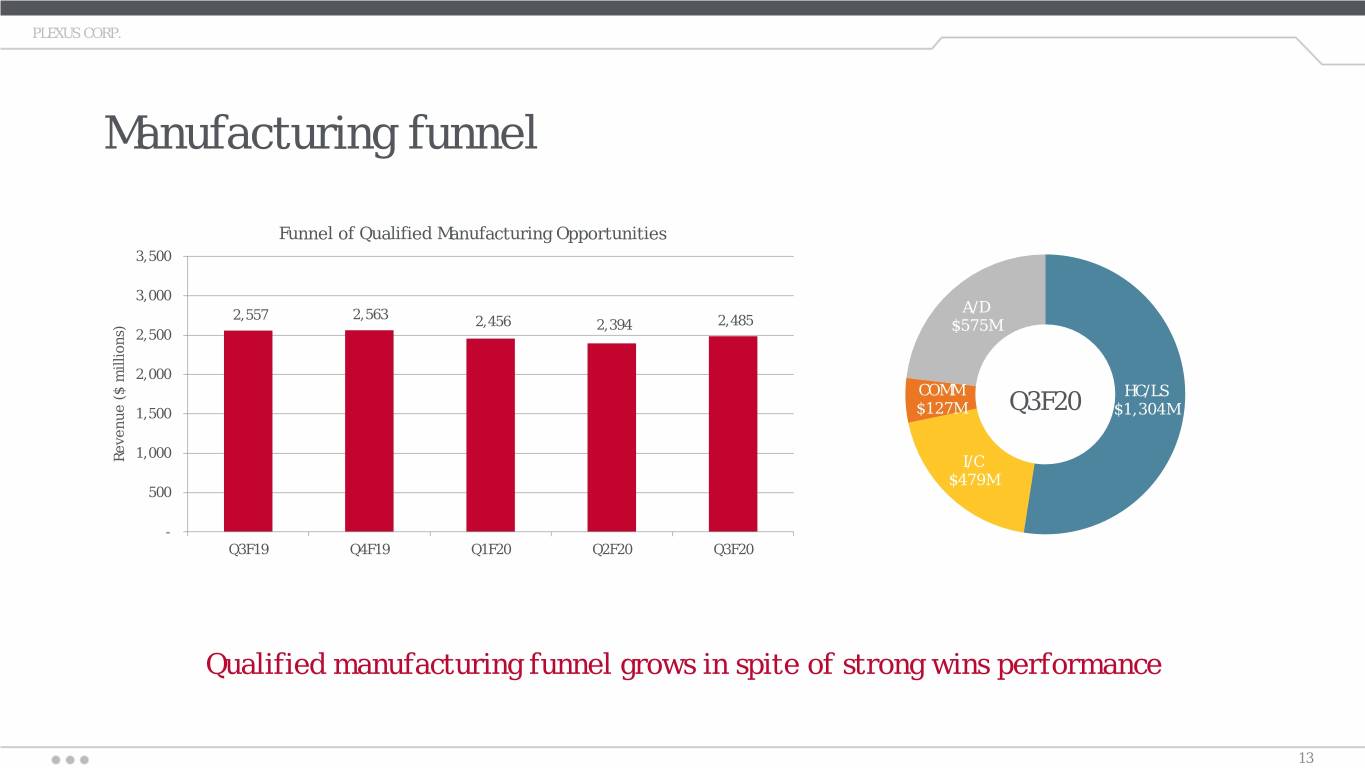
PLEXUS CORP. Manufacturing funnel Funnel of Qualified Manufacturing Opportunities 3,500 3,000 2,557 2,563 A/D 2,456 2,394 2,485 $575M 2,500 2,000 COMM HC/LS 1,500 $127M Q3F20 $1,304M 1,000 Revenue ($ ($ millions) Revenue I/C $479M 500 - Q3F19 Q4F19 Q1F20 Q2F20 Q3F20 Qualified manufacturing funnel grows in spite of strong wins performance 13
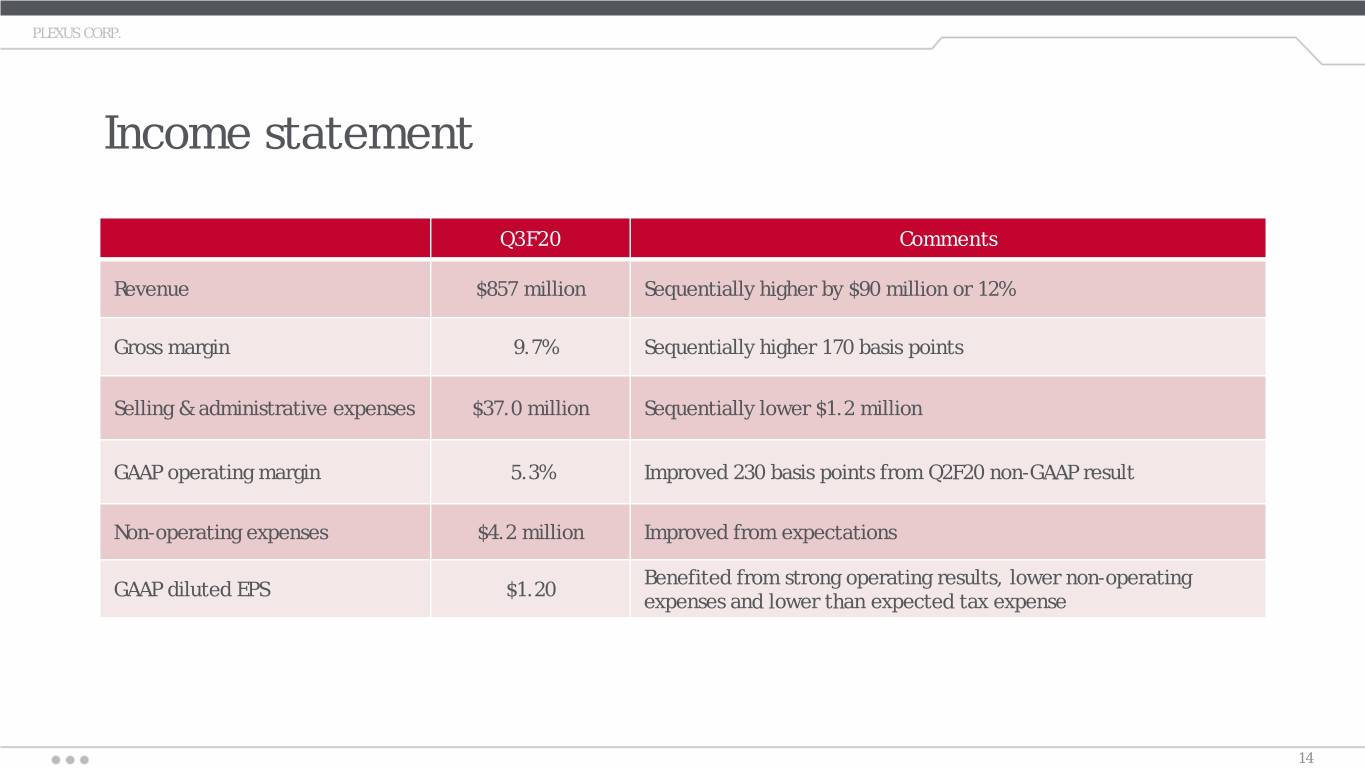
PLEXUS CORP. Income statement Q3F20 Comments Revenue $857 million Sequentially higher by $90 million or 12% Gross margin 9.7% Sequentially higher 170 basis points Selling & administrative expenses $37.0 million Sequentially lower $1.2 million GAAP operating margin 5.3% Improved 230 basis points from Q2F20 non-GAAP result Non-operating expenses $4.2 million Improved from expectations Benefited from strong operating results, lower non-operating GAAP diluted EPS $1.20 expenses and lower than expected tax expense 14
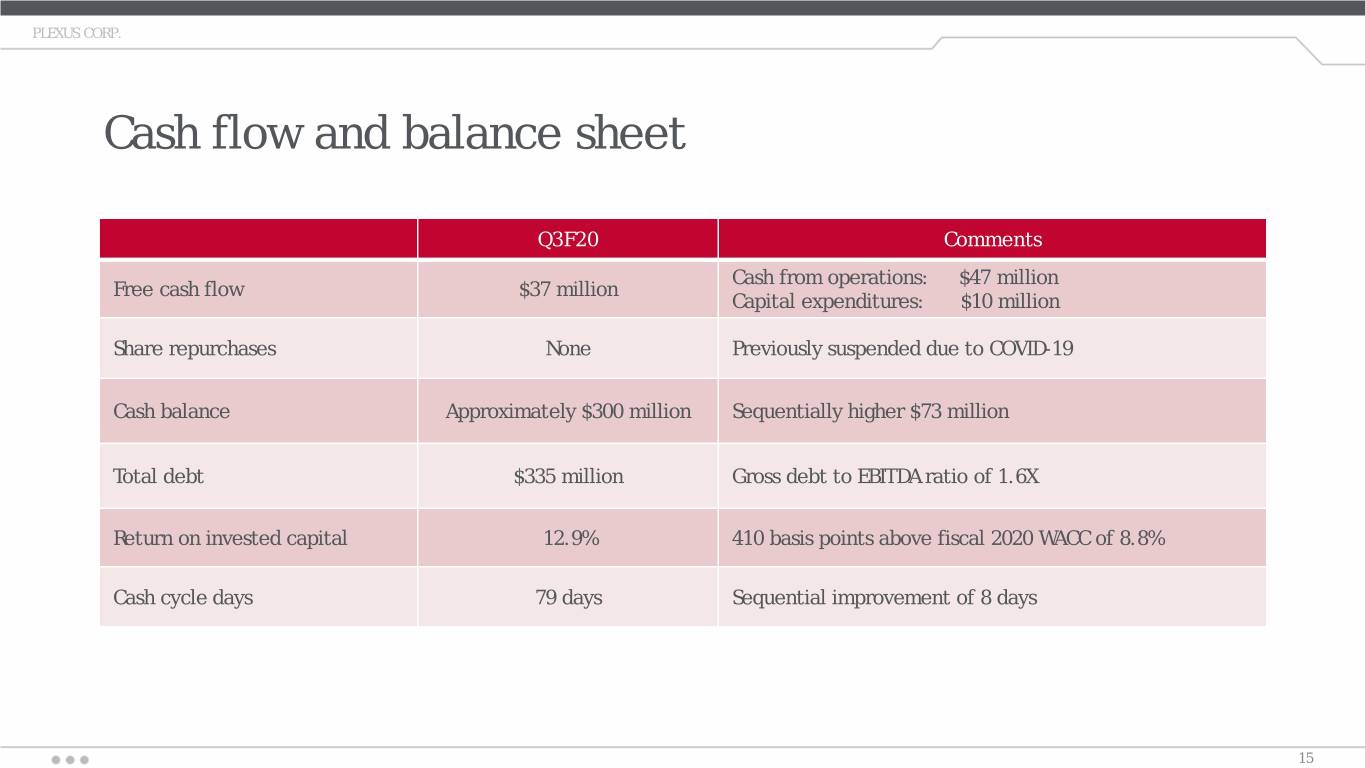
PLEXUS CORP. Cash flow and balance sheet Q3F20 Comments Cash from operations: $47 million Free cash flow $37 million Capital expenditures: $10 million Share repurchases None Previously suspended due to COVID-19 Cash balance Approximately $300 million Sequentially higher $73 million Total debt $335 million Gross debt to EBITDA ratio of 1.6X Return on invested capital 12.9% 410 basis points above fiscal 2020 WACC of 8.8% Cash cycle days 79 days Sequential improvement of 8 days 15
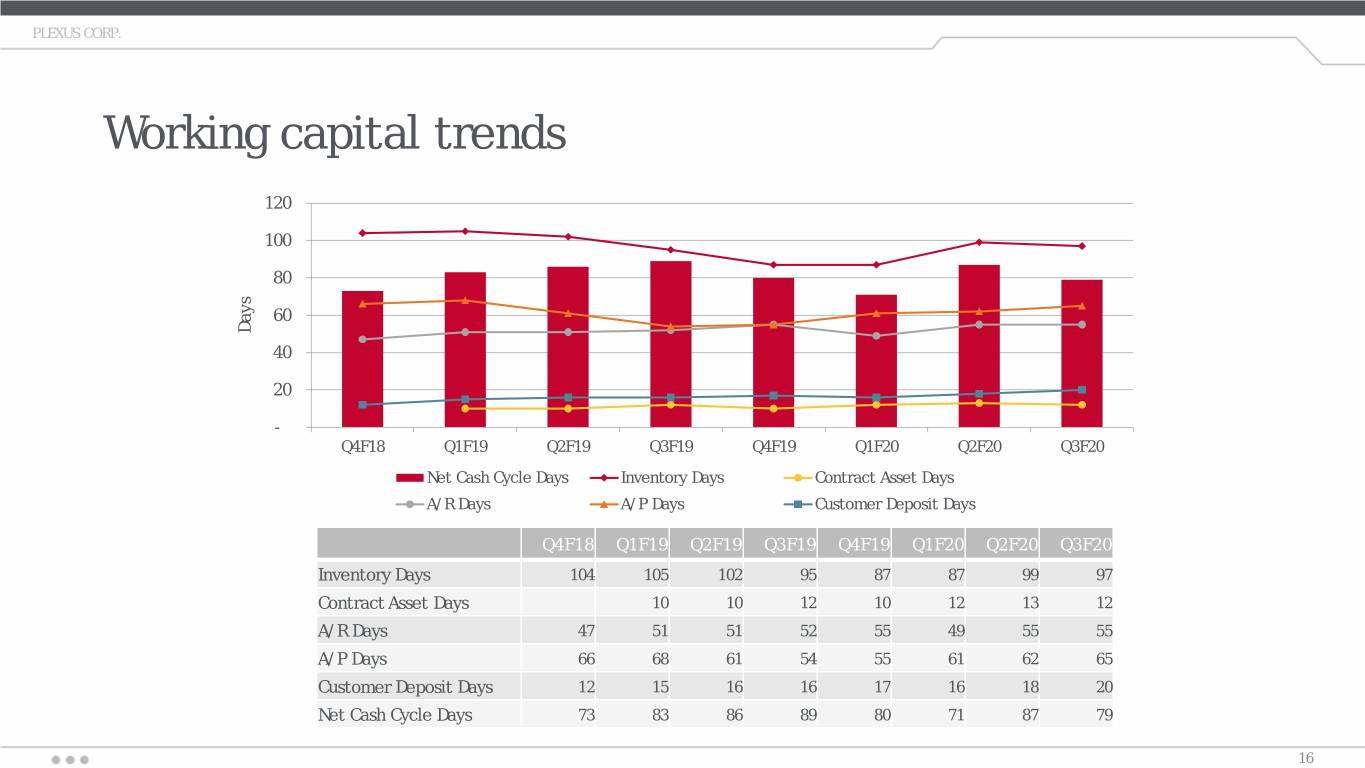
PLEXUS CORP. Working capital trends 120 100 80 60 Days 40 20 - Q4F18 Q1F19 Q2F19 Q3F19 Q4F19 Q1F20 Q2F20 Q3F20 Net Cash Cycle Days Inventory Days Contract Asset Days A/R Days A/P Days Customer Deposit Days Q4F18 Q1F19 Q2F19 Q3F19 Q4F19 Q1F20 Q2F20 Q3F20 Inventory Days 104 105 102 95 87 87 99 97 Contract Asset Days 10 10 12 10 12 13 12 A/R Days 47 51 51 52 55 49 55 55 A/P Days 66 68 61 54 55 61 62 65 Customer Deposit Days 12 15 16 16 17 16 18 20 Net Cash Cycle Days 73 83 86 89 80 71 87 79 16
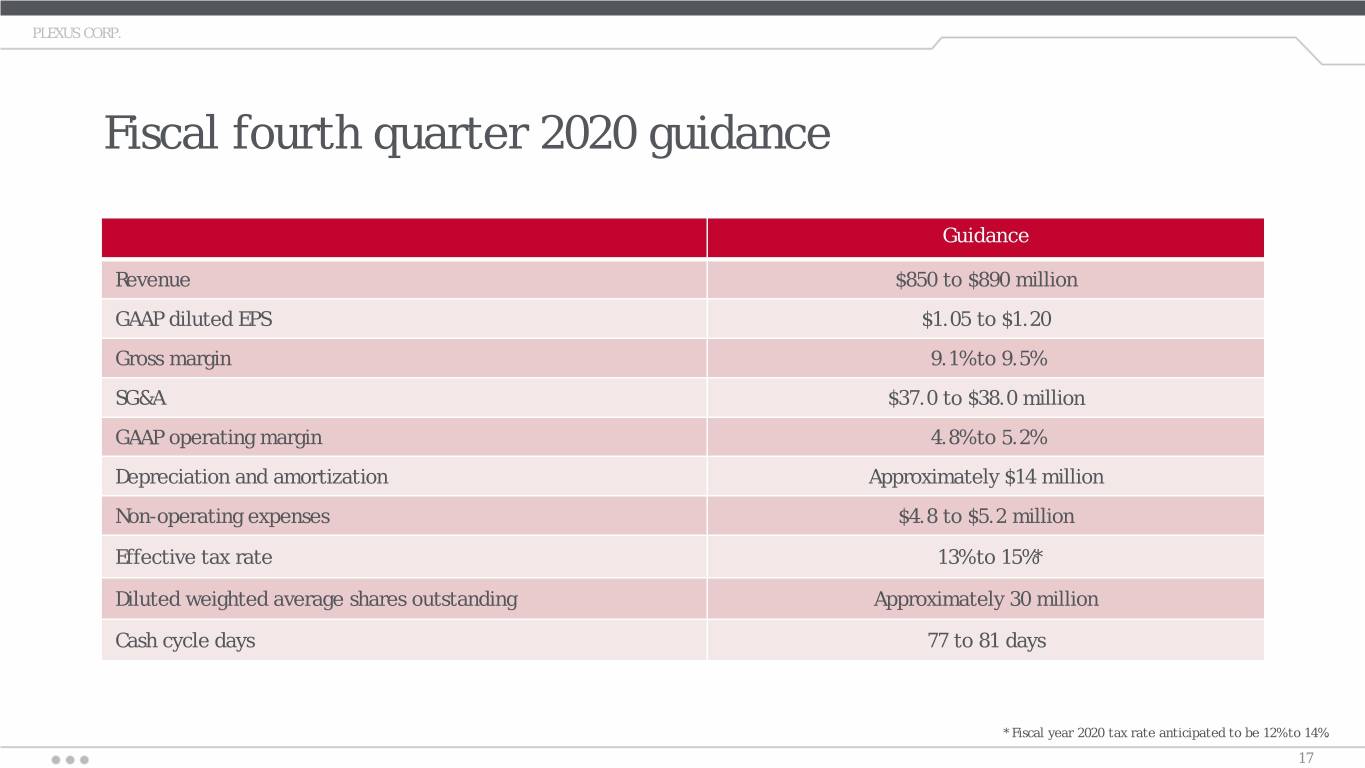
PLEXUS CORP. Fiscal fourth quarter 2020 guidance Guidance Revenue $850 to $890 million GAAP diluted EPS $1.05 to $1.20 Gross margin 9.1% to 9.5% SG&A $37.0 to $38.0 million GAAP operating margin 4.8% to 5.2% Depreciation and amortization Approximately $14 million Non-operating expenses $4.8 to $5.2 million Effective tax rate 13% to 15%* Diluted weighted average shares outstanding Approximately 30 million Cash cycle days 77 to 81 days * Fiscal year 2020 tax rate anticipated to be 12% to 14%. 17

Q&A Thank you. 18
