Attached files
| file | filename |
|---|---|
| EX-99.1 - EXHIBIT 99.1 - Hudson Pacific Properties, Inc. | a8-k6292020991.htm |
| 8-K - 8-K - Hudson Pacific Properties, Inc. | a8-k6292020.htm |

STRATEGIC JOINT VENTURE TRANSACTION ANNOUNCEMENT JUNE 29, 2020 REIMAGINING NOW. TO CREATE WHAT’S NEXT. This document is not an offer to sell or solicitation of an offer to buy any securities. Any offers to sell or solicitations to buy securities shall be made by means of a prospectus approved for that purpose.

Forward-Looking Statements and Non-GAAP Financial Measures FORWARD-LOOKING STATEMENTS This presentation, wherein Hudson Pacific Properties, Inc. is referred to as the “Company,” “Hudson Pacific,” “we,” “us,” or “our,” contains forward-looking statements within the meaning of Section 27A of the Securities Act of 1933, as amended, and Section 21E of the6 Securities Exchange Act of 1934, as amended. Future events and actual results, financial and otherwise, may differ materially from the% r esuof ABRlts discussed in these forward-looking statements, and you should not rely on forward-looking statements as predictions of future events. Forward-looking statements involve numerous risks and uncertainties that could significantly affect anticipated results in the future and, accordingly, such results may differ materially from those expressed in any forward-looking statement made by us. For complete a discussion of important risks related to our business and an investment in its securities, including risks with the potential to impact forward-looking statements, see the “Risk Factors” section of our Annual Report on Form 10-K filed with the Securities and Exchange Commission, or SEC, as well as risks described in other documents we file with the SEC. You are cautioned that the information contained herein speaks only as of the date hereof, and we assume no obligation to update any forward-looking information, whether the result of new information, future events or otherwise. % of ABR USE OF NON-GAAP FINANCIAL MEASURES The information in this21 presentation includes non-GAAP financial measures, which are accompanied by what we consider the most directly comparable financial% ofmeasures ABR calculated and presented in accordance with generally accepted accounting principles in the U.S. (“GAAP”). We have also provided in this presentation quantitative reconciliations of differences between the most directly comparable GAAP and non-GAAP financial measures discussed herein. Definitions of these non-GAAP financial measures, including our definition of “Company’s Share,” can be found on pp. 13-14 of this presentation. This presentation assumes that the joint venture is fully consolidated. 2

New Joint Venture to Expand Studio Platform Hudson Pacific has entered into a new joint venture with Blackstone whereby funds affiliated with Blackstone Property Partners will acquire a 49% interest in Hudson Pacific’s Hollywood Media Portfolio based on a gross valuation of $1.65 billion. Transaction Highlights Studios(1): Sunset Bronson, Sunset Gower, Sunset Las Palmas Hollywood Media Portfolio Office: ICON, EPIC, CUE, 6040 Sunset (Technicolor), Harlow Total Existing Square Feet(2) 1,224,403 (Studio) | 965,988 (Office) Gross Portfolio Value $1.65 billion Ownership 51% Hudson Pacific | 49% Blackstone Parties considering asset-level financing (targeting up to $900 million) Anticipated Financing at closing or thereafter Anticipated Cash Proceeds to Hudson Pacific(3) $808.5 million or up to $1.268 billion with asset-level financing On or before September 1, 2020, with $50.0 million non-refundable Expected Closing deposit paid on June 29, 2020 1) Includes additional land and density rights associated with the three studios. 2) Based on management’s current estimates, which may differ from square footage in Hudson Pacific’s Q1 2020 Supplemental Report. 3) Before closing adjustments or financing costs. Assumes Hudson Pacific’s ratable share of debt targeting up to $900 million of asset-level 3 financing.

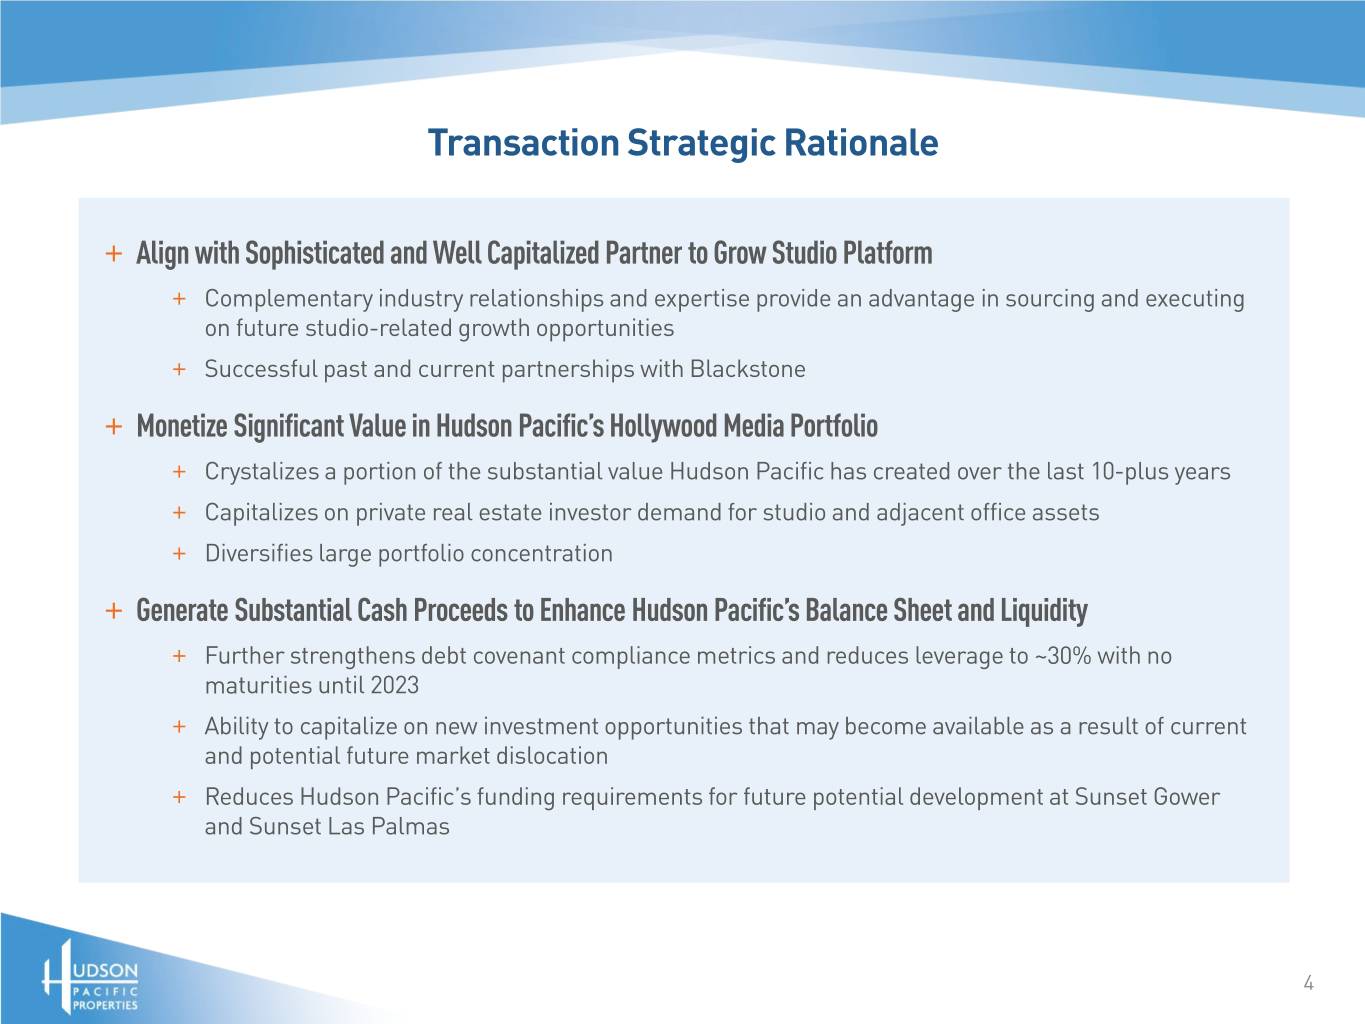
Transaction Strategic Rationale + Align with Sophisticated and Well Capitalized Partner to Grow Studio Platform + Complementary industry relationships and expertise provide an advantage in sourcing and executing on future studio-related growth opportunities + Successful past and current partnerships with Blackstone + Monetize Significant Value in Hudson Pacific’s Hollywood Media Portfolio + Crystalizes a portion of the substantial value Hudson Pacific has created over the last 10-plus years + Capitalizes on private real estate investor demand for studio and adjacent office assets + Diversifies large portfolio concentration + Generate Substantial Cash Proceeds to Enhance Hudson Pacific’s Balance Sheet and Liquidity + Further strengthens debt covenant compliance metrics and reduces leverage to ~30% with no maturities until 2023 + Ability to capitalize on new investment opportunities that may become available as a result of current and potential future market dislocation + Reduces Hudson Pacific’s funding requirements for future potential development at Sunset Gower and Sunset Las Palmas 4

Transaction Key Terms and Metrics Joint Venture Structure Distributions Pro rata (51% Hudson Pacific / 49% Blackstone) Approximately $7.0 million in estimated annual fees for management, leasing Hudson Pacific Fees and construction, with promote Hudson Pacific Sources and Uses Sources (1) $808.5 million or up to $1.268 billion with asset-level financing $305.0 million to repay revolving credit facilities(2) $475.0 million to repay unsecured Term Loans B and D (due 2Q and 4Q 2022, Uses respectively) Remainder for potential future investments and/or share repurchases, and for general corporate purposes Implied Yields(3) 5.0% (based on cash NOI) Joint Venture 5.4% (based on GAAP NOI) 5.4% (based on cash NOI to Hudson Pacific’s retained interest, adjusted for fees) Hudson Pacific 5.8% (based on GAAP NOI to Hudson Pacific’s retained interest, adjusted for fees) 1) Before closing adjustments or financing costs. Assumes Hudson Pacific’s ratable share of $900 million of asset-level financing. 2) Based on the estimated balances on Hudson Pacific’s revolving facility secured by Sunset Bronson/ICON/CUE and its unsecured revolving credit facility at closing. Assumes draw on unsecured facility to repay the $64.5 million loan secured by Met Park North due August 1, 2020. 3) Yields calculated based on the $1.65 billion gross portfolio valuation before closing adjustments and estimated Q4 2020 annualize cash and 5 GAAP NOI as applicable.

Hollywood Media Portfolio Assets The joint venture’s 2.2 million-square-foot portfolio(1) includes three studio lots on 40-plus acres with 35 stages and five Class A office buildings in Los Angeles—the entertainment capital of the world. Sunset Gower Studios Sunset Bronson Studios Sunset Las Palmas Studios 6040 Sunset 531,756 SF 12 Stages 308,026 SF 10 Stages 384,621 SF 13 Stages 114,958 SF Technicolor (at Sunset Gower) ICON CUE EPIC Harlow 326,792 SF Netflix 94,386 SF Netflix 301,127 SF Netflix 128,725 SF Under Construction (at Sunset Bronson) (at Sunset Bronson) (adjacent to Sunset Gower (at Sunset Las Palmas) and Bronson) Studio Office 1) Based on management’s current estimates, which may differ from square 6 footage in Hudson Pacific’s Q1 2020 Supplemental Report.

Hudson Pacific’s Vision and Execution Anticipating the content wars, Hudson Pacific assembled and built three premier media campuses, implementing institutional quality operations and attracting leading media companies to the heart of Hollywood. Studio Office 7

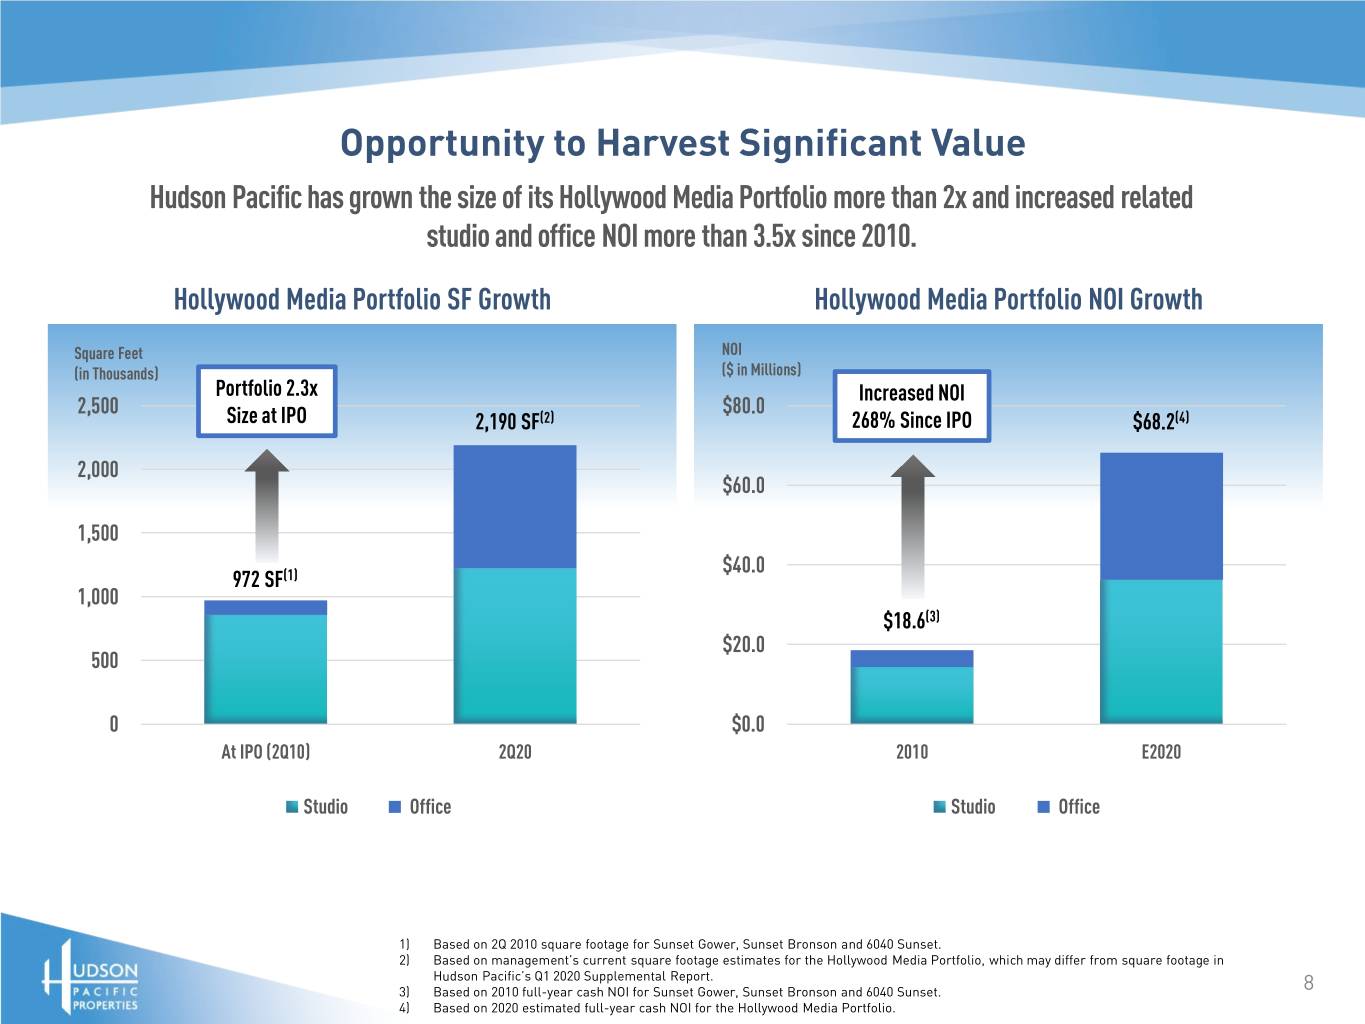
Opportunity to Harvest Significant Value Hudson Pacific has grown the size of its Hollywood Media Portfolio more than 2x and increased related studio and office NOI more than 3.5x since 2010. Hollywood Media Portfolio SF Growth Hollywood Media Portfolio NOI Growth Square Feet NOI (in Thousands) ($ in Millions) Portfolio 2.3x Increased NOI 2,500 $80.0 Size at IPO 2,190 SF(2) 268% Since IPO $68.2(4) 2,000 $60.0 1,500 $40.0 972 SF(1) 1,000 $18.6(3) $20.0 500 0 $0.0 At IPO (2Q10) 2Q20 2010 E2020 Studio Office Studio Office 1) Based on 2Q 2010 square footage for Sunset Gower, Sunset Bronson and 6040 Sunset. 2) Based on management’s current square footage estimates for the Hollywood Media Portfolio, which may differ from square footage in Hudson Pacific’s Q1 2020 Supplemental Report. 3) Based on 2010 full-year cash NOI for Sunset Gower, Sunset Bronson and 6040 Sunset. 8 4) Based on 2020 estimated full-year cash NOI for the Hollywood Media Portfolio.

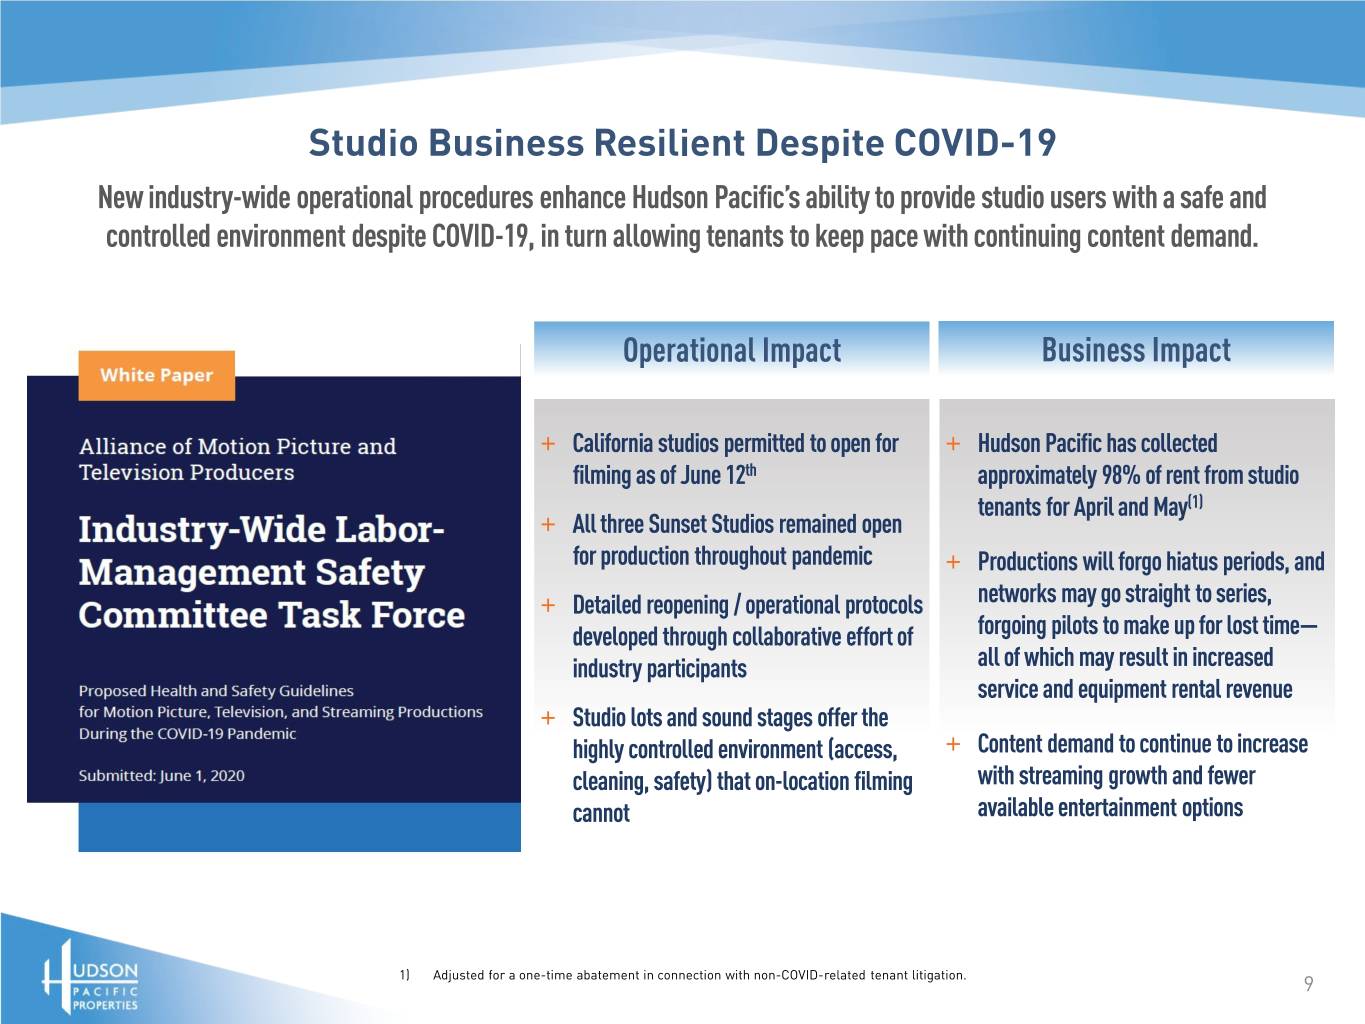
Studio Business Resilient Despite COVID-19 New industry-wide operational procedures enhance Hudson Pacific’s ability to provide studio users with a safe and controlled environment despite COVID-19, in turn allowing tenants to keep pace with continuing content demand. Operational Impact Business Impact + California studios permitted to open for + Hudson Pacific has collected filming as of June 12th approximately 98% of rent from studio tenants for April and May(1) + All three Sunset Studios remained open for production throughout pandemic + Productions will forgo hiatus periods, and + Detailed reopening / operational protocols networks may go straight to series, developed through collaborative effort of forgoing pilots to make up for lost time— industry participants all of which may result in increased service and equipment rental revenue + Studio lots and sound stages offer the highly controlled environment (access, + Content demand to continue to increase cleaning, safety) that on-location filming with streaming growth and fewer cannot available entertainment options 1) Adjusted for a one-time abatement in connection with non-COVID-related tenant litigation. 9

Capital Allocation for Development Pipeline Blackstone will be Hudson Pacific’s development partner at Sunset Gower and Sunset Las Palmas, diversifying funding sources for the construction of the lots’ remaining 1.1 million square feet(1) of excess land density. Potential Additional ~487,000 SF ~618,000 SF Density(1) Expect to complete In early stages of entitlements by year- developing master Estimated end 2020 with the plan—approximately Timing ability to commence three years away construction in mid- / from full late 2021 entitlements 1) Additional density based on management’s current estimates, which may differ from Hudson Pacific’s Q1 2020 Supplemental report, and are subject to entitlement approvals not yet obtained. 10

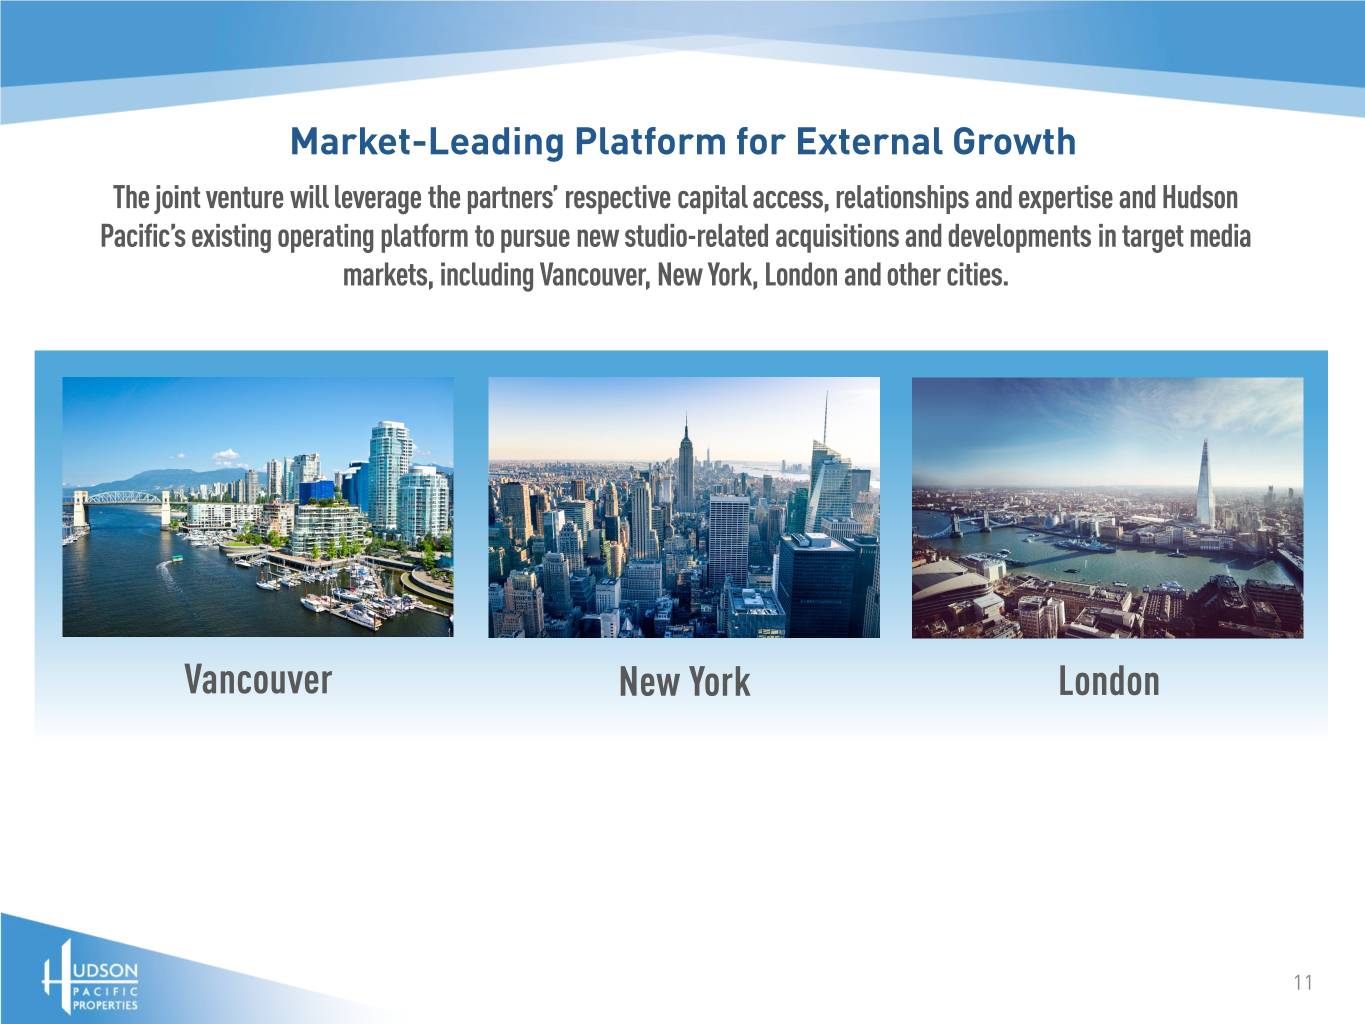
Market-Leading Platform for External Growth The joint venture will leverage the partners’ respective capital access, relationships and expertise and Hudson Pacific’s existing operating platform to pursue new studio-related acquisitions and developments in target media markets, including Vancouver, New York, London and other cities. New York Vancouver New York London 11

Transaction Financial Impact Estimated FY 2020 FFO Adjustment (without impact of potential financing)(1) $0.04-$0.06 decrease per diluted share Q1 2020 Q1 2020 Q1 2020 Actual Proforma Proforma Without Debt(2)(3) With Debt(2)(4) Financial Covenant Analysis Unsecured Revolving Credit Facility, Term Loan and Private Placement Total liabilities to total asset value ≤ 60% 36.2% 27.3% 36.1% Unsecured indebtedness to unencumbered asset value ≤ 60% 44.2% 35.9% 33.1% Adjusted EBITDA to fixed charges ≥ 1.5x 3.5x 4.2x TBD(5) Secured indebtedness to total asset value ≤ 45% 5.3% 4.6% 14.6%(6) Unencumbered NOI to unsecured interest expense ≥ 2.0x 3.3x 4.1x 3.7x Unsecured Registered Senior Notes Debt to total assets ≤ 60% 43.1% 29.8% 41.4% Total unencumbered assets to unsecured debt ≥ 150% 214.1% 321.4% 279.8% Consolidated income available for debt service to annual debt service charge ≥ 1.5x 3.9x 4.8 x TBD(5) Secured debt to total assets ≤ 45% 5.9% 5.0% 16.6% Company Share of Debt, Net / Company's Share of Market Capitalization 42.1% 30.4% 30.4% Adjusted EBITDAre (Annualized) / Consolidated Debt, Net(7) 6.8x 4.9x 5.9x Liquidity(8) (in millions) $1,141.0 $1,167.0 $1,634.0 1) Assumes closing as of September 1, 2020. Amounts reflect the sources and uses assumptions on p.5 of this presentation without the impact of any potential financing at or after closing. 2) Proforma amounts are not reasonably reconcilable due to estimates required. 3) Proforma amounts based on Q1 2020 reported amounts adjusted for estimated impact of $808.5 million of sources and corresponding uses as described on p. 5 of this presentation. 4) Proforma amounts based on Q1 2020 reported amounts adjusted for estimated impact of $1.268 billion of sources and corresponding uses as described on p. 5 of this presentation. 5) Subject to rates and terms of any potential asset-level financing at or after closing. 6) Assumes $900 million of asset-level financing. 7) See reconciliation on p. 15 of this presentation. 8) Liquidity comprised of cash on hand, Hudson Pacific’s unsecured revolving credit facility and its construction loan secured by One Westside 12 and 10850 Pico assuming use of proceeds as described on p. 5.

Definitions Adjusted EBITDAre: Adjusted EBITDAre represents net income (loss) before interest, income taxes, depreciation and amortization, and before our share interest and depreciation from the unconsolidated real estate entity and further adjusted to eliminate the impact of certain non-cash items and items that we do not consider indicative of our ongoing performance. We believe that Adjusted EBITDAre is useful because it allows investors and management to evaluate and compare our performance from period to period in a meaningful and consistent manner, in addition to standard financial measurements under GAAP. Adjusted EBITDAre is not a measurement of financial performance under GAAP and should not be considered as an alternative to income attributable to common shareholders, as an indicator of operating performance or any measure of performance derived in accordance with GAAP. Our calculation of Adjusted EBITDAre may be different from the calculation used by other companies and, accordingly, comparability may be limited. Company’s Share: Non-GAAP financial measures calculated as the consolidated amount, in accordance with GAAP, plus the Company’s share of the amount from the Company’s unconsolidated joint ventures (calculated based upon the Company’s percentage ownership interest), minus the Company’s partners’ share of the amount from the Company’s consolidated joint ventures (calculated based upon the partners’ percentage ownership interests). Management believes that presenting the “Company’s Share” of these measures provides useful information to investors regarding the Company’s financial condition and/or results of operations because the Company has several significant joint ventures and in some cases, the Company exercises significant influence over, but does not control, the joint venture, in which case GAAP requires that the Company account for the joint venture entity using the equity method of accounting and the Company does not consolidate it for financial reporting purposes. In other cases, GAAP requires that the Company consolidate the venture even though the Company’s partner(s) owns a significant percentage interest. As a result, management believes that presenting the Company’s Share of various financial measures in this manner can help investors better understand the Company’s financial condition and/or results of operations after taking into account its true economic interest in these joint ventures. Company’s Share of Debt: Similar to Consolidated Debt except it includes the Company’s Share of unconsolidated joint venture debt and excludes partner’s share of consolidated joint venture partner debt. Company’s Share of Market Capitalization: Similar to Consolidated Market Capitalization except it includes the Company’s Share of Debt. Consolidated Debt: Equal to the sum of (i) Unsecured and Secured Debt and (ii) Series A preferred units. Consolidated Market Capitalization: Equal to the sum of (i) Unsecured and Secured Debt, (ii) series A preferred units and (iii) common equity capitalization. Common equity capitalization represents the total Shares of Common Stock/Units Outstanding at End of Period multiplied by the closing price at quarter end. Consolidated Unsecured and Secured Debt: Excludes in-substance defeased debt related to our Hudson Pacific/Macerich joint venture and unamortized deferred financing costs and unamortized loan discounts/premiums related to our registered senior debt. The full amount of debt related to the Hill7 joint venture are included. Consolidated Debt, Net: Similar to Consolidated debt, less consolidated cash and cash equivalents. Company’s Share of Debt, Net: Similar to Company’s Share of Debt, except it includes the Company’s Share of unconsolidated joint venture cash and cash equivalents and excludes partner’s share of consolidated joint venture cash and cash equivalents. 13

Definitions (Cont.) Funds from Operations (“FFO”): Non-GAAP financial measure we believe is a useful supplemental measure of our performance. We calculate FFO in accordance with the White Paper on FFO approved by the Board of Governors of the National Association of Real Estate Investment Trusts. The White Paper defines FFO as net income or loss calculated in accordance with generally accepted accounting principles in the United States (“GAAP”), excluding gains and losses from sales of depreciable real estate and impairment write-downs associated with depreciable real estate, plus the Company’s Share of real estate-related depreciation and amortization (excluding amortization of deferred financing costs and depreciation of non-real estate assets). The calculation of FFO includes the Company’s Share of amortization of deferred revenue related to tenant-funded tenant improvements and excludes the depreciation of the related tenant improvement assets. We believe that FFO is a useful supplemental measure of our operating performance. The exclusion from FFO of gains and losses from the sale of operating real estate assets allows investors and analysts to readily identify the operating results of the assets that form the core of our activity and assists in comparing those operating results between periods. Also, because FFO is generally recognized as the industry standard for reporting the operations of REITs, it facilitates comparisons of operating performance to other REITs. However, other REITs may use different methodologies to calculate FFO, and accordingly, our FFO may not be comparable to all other REITs. Implicit in historical cost accounting for real estate assets in accordance with GAAP is the assumption that the value of real estate assets diminishes predictably over time. Since real estate values have historically risen or fallen with market conditions, many industry investors and analysts have considered presentations of operating results for real estate companies using historical cost accounting alone to be insufficient. Because FFO excludes depreciation and amortization of real estate assets, we believe that FFO along with the required GAAP presentations provides a more complete measurement of our performance relative to our competitors and a more appropriate basis on which to make decisions involving operating, financing and investing activities than the required GAAP presentations alone would provide. We use FFO per share to calculate annual cash bonuses for certain employees. However, FFO should not be viewed as an alternative measure of our operating performance because it does not reflect either depreciation and amortization costs or the level of capital expenditures and leasing costs necessary to maintain the operating performance of our properties, which are significant economic costs and could materially impact our results from operations. Net Operating Income (“NOI”): We evaluate performance based upon property NOI from continuing operations. NOI is not a measure of operating results or cash flows from operating activities or cash flows as measured by GAAP and should not be considered an alternative to income from continuing operations, as an indication of our performance, or as an alternative to cash flows as a measure of liquidity, or our ability to make distributions. All companies may not calculate NOI in the same manner. We consider NOI to be a useful performance measure to investors and management because when compared across periods, NOI reflects the revenues and expenses directly associated with owning and operating our properties and the impact to operations from trends in occupancy rates, rental rates and operating costs, providing a perspective not immediately apparent from income from continuing operations. We calculate NOI as net income (loss) excluding corporate general and administrative expenses, depreciation and amortization, impairments, gains/losses on sales of real estate, interest expense, transaction-related expenses and other non-operating items. We define NOI as operating revenues (including rental revenues, other property-related revenue, tenant recoveries and other operating revenues), less property- level operating expenses (which includes external management fees, if any, and property-level general and administrative expenses). NOI on a cash basis is NOI adjusted to exclude the effect of straight-line rent and other non-cash adjustments required by GAAP. We believe that NOI on a cash basis is helpful to investors as an additional measure of operating performance because it eliminates straight-line rent and other non-cash adjustments to revenue and expenses. 14

Reconciliation of Consolidated Debt, Net to Adjusted EBITDAre (Annualized) Quarter To Date Three Months Ended March 31, 2020 Net income (loss) $ 13,949 Interest income—Consolidated (1,025) Interest expense—Consolidated 26,417 Depreciation and amortization—Consolidated 73,763 EBITDA 113,104 Unconsolidated real estate entity depreciation and amortization 1,381 Unconsolidated real estate entity interest expense 930 EBITDAre 115,415 Unrealized loss on non-real estate investment 581 Other (income) expense (314) Transaction-related expenses 102 Non-cash compensation expense 4,895 Straight-line rent receivables, net (13,344) Non-cash amortization of below-market rents, net (2,544) Non-cash amortization of below-market ground rents, net 577 Amortization of lease incentive costs 472 Adjusted EBITDAre 105,840 Studio cash NOI (9,001) Office property adjusted EBITDAre 96,839 x Annualization factor 4 Annualized office property adjusted EBITDAre 387,356 Trailing 12-mo studio cash NOI 37,017 Adjusted EBITDAre (Annualized) 424,373 Q1-2020 Q1-2020 Q1-2020 Proforma Proforma Actual without debt proceeds with debt proceeds Total Consolidated unsecured and secured debt 3,260,352 2,225,851 3,125,851 Less: Consolidated cash and cash equivalents (392,136) (166,135) (625,135) Consolidated debt, net 2,868,216 2,059,716 2,500,716 Adjusted EBITDAre (annualized) / Consolidated debt, net 6.8x 4.9x 5.9x 15

Reconciliation of Consolidated Debt, Net and Cash and Cash Equivalents Total Consolidated unsecured and secured debt as of 31/31/2020 3,260,352 Less paydown of: Line of credit (490,000) Term Loan B (350,000) Term Loan D (125,000) Debt secured by Met Park North (64,500) Revolving Sunset Bronson Studios/ICON/CUE facility (5,001) Total Consolidated unsecured and secured debt without proforma debt 2,225,851 Proforma debt related to this transaction 900,000 Total Consolidated unsecured and secured debt with proforma debt 3,125,851 Consolidated cash and cash equivalents as of 3/31/2020 392,136 Plus gross proceeds of transaction without debt 808,500 Less paydown of: Line of credit (490,000) Term Loan B (350,000) Term Loan D (125,000) Debt secured by Met Park North (64,500) Revolving Sunset Bronson Studios/ICON/CUE facility (5,001) Consolidated cash and cash equivalents wihout proforma debt 166,135 Proforma distribution of debt proceeds related to this transaction 459,000 Consolidated cash and cash equivalents wih proforma debt 625,135 16

Contact: Laura Campbell SVP, Investor Relations & Marketing (310) 622-1702 lcampbell@hudsonppi.com
