Attached files
UNITED STATES
SECURITIES AND EXCHANGE COMMISSION
Washington, D.C. 20549
FORM 10-K
(Mark One)
[X] ANNUAL REPORT PURSUANT TO SECTION 13 OR 15(d) OF THE SECURITIES EXCHANGE ACT OF 1934
For the fiscal year ended December 31, 2017
or
[ ] TRANSITION REPORT PURSUANT TO SECTION 13 OR 15(d) OF THE SECURITIES EXCHANGE ACT OF 1934
For the transition period from_____to_____
Commission file number 001-34789 (Hudson Pacific Properties, Inc.)
Commission file number: 333-202799-01 (Hudson Pacific Properties, L.P.)
Hudson Pacific Properties, Inc.
Hudson Pacific Properties, L.P.
(Exact name of registrant as specified in its charter)
Hudson Pacific Properties, Inc. | Maryland (State or other jurisdiction of incorporation or organization) | 27-1430478 (I.R.S. Employer Identification Number) | ||
Hudson Pacific Properties, L.P. | Maryland (State or other jurisdiction of incorporation or organization) | 80-0579682 (I.R.S. Employer Identification Number) | ||
11601 Wilshire Blvd., Ninth Floor, Los Angeles, California 90025
(Address of principal executive offices) (Zip Code)
(310) 445-5700
(Registrant’s telephone number, including area code)
Securities registered pursuant to Section 12(b) of the Act:
Registrant | Title of each class | Name of each exchange on which registered | ||
Hudson Pacific Properties, Inc. | Common Stock, $.01 par value | New York Stock Exchange | ||
Securities registered pursuant to Section 12(g) of the Act:
Registrant | Title of each class | Name of each exchange on which registered | ||
Hudson Pacific Properties, L.P. | Common Units Representing Limited Partnership Interests | None | ||
Indicate by check mark if the registrant is a well-known seasoned issuer, as defined in Rule 405 of the Securities Act.
Hudson Pacific Properties, Inc. Yes x No o Hudson Pacific Properties, L.P. Yes o No x
Indicate by check mark if the registrant is not required to file reports pursuant to Section 13 or Section 15(d) of the Act.
Hudson Pacific Properties, Inc. Yes o No x Hudson Pacific Properties, L.P. Yes o No x
Indicate by check mark whether the registrant (1) has filed all reports required to be filed by Section 13 or 15(d) of the Securities Exchange Act of 1934 during the preceding 12 months (or for such shorter period that the registrant was required to file such reports), and (2) has been subject to such filing requirements for the past 90 days.
Hudson Pacific Properties, Inc. Yes x No o Hudson Pacific Properties, L.P. Yes x No o
Indicate by check mark whether the registrant has submitted electronically and posted on its corporate website, if any, every Interactive Data File required to be submitted and posted pursuant to Rule 405 of Regulation S-T (§232.405 of this chapter) during the preceding 12 months (or for such shorter period that the registrant was required to submit and post such files).
Hudson Pacific Properties, Inc. Yes x No o Hudson Pacific Properties, L.P. Yes x No o
Indicate by check mark if disclosure of delinquent filers pursuant to Item 405 of Regulation S-K (§229.405 of this chapter) is not contained herein, and will not be contained, to the best of registrant’s knowledge, in definitive proxy or information statements incorporated by reference in Part III of this Form 10-K or any amendment to this Form 10-K. o
Indicate by check mark whether the registrant is a large accelerated filer, an accelerated filer, a non-accelerated filer, smaller reporting company, or an emerging growth company. See the definitions of “large accelerated filer,” “accelerated filer,” “smaller reporting company,” and “emerging growth company” in Rule 12b-2 of the Exchange Act.
Hudson Pacific Properties, Inc.
Large accelerated filer x | Accelerated filer o | Non-accelerated filer o |
(Do not check if a smaller reporting company) | ||
Smaller reporting company o | Emerging growth company o | |
Hudson Pacific Properties, L.P.
Large accelerated filer o | Accelerated filer o | Non-accelerated filer x |
(Do not check if a smaller reporting company) | ||
Smaller reporting company o | Emerging growth company o | |
If an emerging growth company, indicate by check mark if the registrant has elected not to use the extended transition period for complying with any new or revised financial accounting standards provided pursuant to Section 13(a) of the Exchange Act. o
Indicate by check mark whether the registrant is a shell company (as defined in Rule 12b-2 of the Act.)
Hudson Pacific Properties, Inc. Yes o No x Hudson Pacific Properties, L.P. Yes o No x
As of June 30, 2017, the aggregate market value of common stock held by non-affiliates of the registrant (assuming for these purposes, but without conceding, that all executive officers and directors are “affiliates” of the registrant) was $5.23 billion based upon the last sales price on June 30, 2017 for the registrant’s Common Stock.
There is no public trading market for the common units of limited partnership interest of Hudson Pacific Properties, L.P. As a result, the aggregate market value of the common units of limited partnership interest held by non-affiliates of Hudson Pacific Properties, L.P. cannot be determined.
The number of shares of common stock of Hudson Pacific Properties, Inc. outstanding at February 9, 2018 was 156,679,052.
DOCUMENTS INCORPORATED BY REFERENCE
Portions of the proxy statement for the registrant’s 2018 Annual Meeting of Stockholders to be held May 24, 2018 are incorporated by reference in Part III of this Annual Report on Form 10-K. The proxy statement will be filed by the registrant with the United States Securities and Exchange Commission, or the SEC, not later than 120 days after the end of the registrant’s fiscal year.
EXPLANATORY NOTE
This report combines the annual reports on Form 10-K for the period ended December 31, 2017 of Hudson Pacific Properties, Inc., a Maryland corporation, and Hudson Pacific Properties, L.P., a Maryland limited partnership. Unless otherwise indicated or unless the context requires otherwise, all references in this report to “we,” “us,” “our,” or “our Company” refer to Hudson Pacific Properties, Inc. together with its consolidated subsidiaries, including Hudson Pacific Properties, L.P. Unless otherwise indicated or unless the context requires otherwise, all references to “our operating partnership” or “the operating partnership” refer to Hudson Pacific Properties, L.P. together with its consolidated subsidiaries.
Hudson Pacific Properties, Inc. is a real estate investment trust, or REIT, and the sole general partner of our operating partnership. As of December 31, 2017, Hudson Pacific Properties, Inc. owned approximately 99.6% of the outstanding common units of partnership interest (including unvested restricted units) in our operating partnership, or common units. The remaining approximately 0.4% of outstanding common units at December 31, 2017 were owned by certain of our executive officers and directors, certain of their affiliates and other outside investors. As the sole general partner of our operating partnership, Hudson Pacific Properties, Inc. has the full, exclusive and complete responsibility for our operating partnership’s day-to-day management and control.
We believe combining the annual reports on Form 10-K of Hudson Pacific Properties, Inc. and the operating partnership into this single report results in the following benefits:
• | enhancing investors’ understanding of our Company and our operating partnership by enabling investors to view the business as a whole in the same manner as management views and operates the business; |
• | eliminating duplicative disclosure and providing a more streamlined and readable presentation because a substantial portion of the disclosures apply to both our Company and our operating partnership; and |
• | creating time and cost efficiencies through the preparation of one combined report instead of two separate reports. |
There are a few differences between our Company and our operating partnership, which are reflected in the disclosures in this report. We believe it is important to understand the differences between our Company and our operating partnership in the context of how we operate as an interrelated, consolidated company. Hudson Pacific Properties, Inc. is a REIT, the only material assets of which are the units of partnership interest in our operating partnership. As a result, Hudson Pacific Properties, Inc. does not conduct business itself, other than acting as the sole general partner of our operating partnership, issuing equity from time to time and guaranteeing certain debt of our operating partnership. Hudson Pacific Properties, Inc. itself does not issue any indebtedness but guarantees some of the debt of our operating partnership. Our operating partnership, which is structured as a partnership with no publicly traded equity, holds substantially all of the assets of our Company and conducts substantially all of our business. Except for net proceeds from equity issuances by Hudson Pacific Properties, Inc., which are generally contributed to our operating partnership in exchange for units of partnership interest in our operating partnership, our operating partnership generates the capital required by our Company’s business through its operations, its incurrence of indebtedness or through the issuance of units of partnership interest in our operating partnership.
Non-controlling interest, stockholders’ equity and partners’ capital are the main areas of difference between the consolidated financial statements of our Company and those of our operating partnership. The common units in our operating partnership are accounted for as partners’ capital in our operating partnership’s consolidated financial statements and, to the extent not held by our Company, as a non-controlling interest in our Company’s consolidated financial statements. The differences between stockholders’ equity, partners’ capital and non-controlling interest result from the differences in the equity issued by our Company and our operating partnership.
To help investors understand the significant differences between our Company and our operating partnership, this report presents the consolidated financial statements separately for our Company and our operating partnership. All other sections of this report, including “Selected Financial Data,” “Management’s Discussion and Analysis of Financial Condition and Results of Operations” and “Quantitative and Qualitative Disclosures About Market Risk,” are presented together for our Company and our operating partnership.
In order to establish that the Chief Executive Officer and the Chief Financial Officer of each entity have made the requisite certifications and that our Company and our operating partnership are compliant with Rule 13a-15 or Rule 15d-15 of the Securities Exchange Act of 1934, or the Exchange Act and 18 U.S.C. §1350, this report also includes separate Part II, Item 9A “Controls and Procedures” sections and separate Exhibit 31 and 32 certifications for each of Hudson Pacific Properties, Inc. and our operating partnership.
2
HUDSON PACIFIC PROPERTIES, INC. AND HUDSON PACIFIC PROPERTIES, L.P.
ANNUAL REPORT ON FORM 10-K
TABLE OF CONTENTS
Page | |||
ITEM 1. | |||
ITEM 1A. | |||
ITEM 1B. | |||
ITEM 2. | |||
ITEM 3. | |||
ITEM 4. | |||
ITEM 5. | |||
ITEM 6. | |||
ITEM 7. | |||
ITEM 7A. | |||
ITEM 8. | |||
ITEM 9. | |||
ITEM 9A. | |||
ITEM 9B. | |||
ITEM 10. | |||
ITEM 11. | |||
ITEM 12. | |||
ITEM 13. | |||
ITEM 14. | |||
ITEM 15. | |||
3
PART I
ITEM 1. Business
Company Overview
We are a vertically integrated real estate company focused on acquiring, repositioning, developing and operating high-quality office and state-of-the-art media and entertainment properties in high-growth, high-barrier-to-entry submarkets throughout Northern and Southern California and the Pacific Northwest. We invest across the risk-return spectrum, favoring opportunities where we can employ leasing, capital investment and management expertise to create additional value. As of December 31, 2017, our portfolio included office properties, comprising an aggregate of approximately 13.3 million square feet, and media and entertainment properties, comprising approximately 1.2 million square feet of sound-stage, office and supporting production facilities. We also own undeveloped density rights for approximately 3.0 million square feet of future office and residential space.
We were formed as a Maryland corporation in 2009 to succeed to the business of Hudson Capital, LLC, a Los Angeles-based real estate investment firm founded by Victor J. Coleman, our Chief Executive Officer. On June 29, 2010, we completed our initial public offering (“IPO”). We own our interests in all of our properties and conduct substantially all of our business through our operating partnership, of which we serve as the sole general partner.
Business and Growth Strategies
We invest in Class-A office and media and entertainment properties located in high barrier-to-entry, innovation-centric submarkets with significant growth potential. Our positioning within these submarkets allows us to attract and retain quality, growth companies as tenants, many in the technology and media and entertainment sectors. The purchase of properties with a value-add component, typically through off-market transactions, also facilitates our growth. These types of assets afford us the opportunity to capture embedded rent growth and occupancy upside, and to strategically invest capital to reposition and redevelop assets to generate additional cash flow. We take a more measured approach to ground-up development, with most under-construction, planned or potential projects located on ancillary sites part of existing operating assets. Management expertise across disciplines supports execution at all levels of the Company’s operations. In particular, aggressive leasing and proactive asset management, combined with a focus on conservatively managing our balance sheet, are central to our strategy.
Major Tenants
As of December 31, 2017, the 15 largest tenants in our office portfolio represented approximately 37.3% of the total annualized base rent generated by our office properties. As of December 31, 2017, our two largest tenants were Google, Inc. and Netflix, Inc., which together accounted for 9.8% of the annualized base rent generated by our office properties.
For further detail regarding major tenants, see Item 2 “Properties—Tenant Diversification of Office Portfolio.”
Our Competitive Position
We believe the following competitive strengths distinguish us from other real estate owners and operators and will enable us to capitalize on opportunities in the market to successfully expand and operate our portfolio.
• | Experienced Management Team with a Proven Track Record of Acquiring and Operating Assets and Managing a Public Office REIT. Our senior management team has an average of over 25 years of experience in the commercial real estate industry, with a focus on acquiring, repositioning, developing and operating office properties in Northern and Southern California and the Pacific Northwest. |
• | Committed and Incentivized Management Team. Our senior management team is dedicated to our successful operation and growth, with no competing real estate business interests outside of our Company. Additionally, as of December 31, 2017, our senior management team owned approximately 1.5% of our common stock on a fully diluted basis, thereby aligning management’s interests with those of our stockholders. |
• | Northern and Southern California and the Pacific Northwest Focus with Local and Regional Expertise. We are primarily focused on acquiring and managing office properties in Northern and Southern California and the Pacific Northwest, where our senior management has significant expertise and relationships. Our markets are supply-constrained as a result of the scarcity of available land, high construction costs and restrictive entitlement processes. We believe our experience, in-depth market knowledge and meaningful industry relationships with |
4
brokers, tenants, landlords, lenders and other market participants enhance our ability to identify and capitalize on attractive acquisition opportunities, particularly those that arise in Northern and Southern California and the Pacific Northwest.
• | Long-Standing Relationships that Provide Access to an Extensive Pipeline of Investment and Leasing Opportunities. We have an extensive network of long-standing relationships with real estate developers, individual and institutional real estate owners, national and regional lenders, brokers, tenants and other participants in the Northern and Southern California and Pacific Northwest real estate markets. These relationships have historically provided us with access to attractive acquisition opportunities, including opportunities with limited or no prior marketing by sellers. We believe they will continue to provide us access to an ongoing pipeline of attractive acquisition opportunities and additional growth capital, both of which may not be available to our competitors. Additionally, we focus on establishing strong relationships with our tenants in order to understand their long-term business needs, which we believe enhances our ability to retain quality tenants, facilitates our leasing efforts and maximizes cash flows from our properties. |
• | Growth-Oriented, Flexible and Conservative Capital Structure. We have remained well-capitalized since our IPO, including through 14 offerings (including two public offerings of 8.375% Series B Cumulative Preferred Stock, ten public offerings of our common stock, one private placement of our common stock and one public offering of senior notes) and continuous offerings under our at-the-market (“ATM”) program for aggregate total proceeds of approximately $3.81 billion (before underwriters’ discounts and transaction costs) as of December 31, 2017. Available cash on hand and our unsecured credit facility provide us with a significant amount of capital to pursue acquisitions and execute our growth strategy, while maintaining a flexible and conservative capital structure. As of December 31, 2017, we had total borrowing capacity of approximately $400.0 million under our unsecured revolving credit facility, $100.0 million of which had been drawn. Based on the closing price of our common stock of $34.25 on December 31, 2017, we had a debt-to-market capitalization ratio (counting Series A preferred units in our operating partnership, or Series A preferred units, as debt) of approximately 31.2%. We believe our access to capital and flexible and conservative capital structure provide us with an advantage over many of our private and public competitors as we look to take advantage of growth opportunities. |
We have access to and are actively pursuing a pipeline of potential acquisitions consistent with our investment strategy. We believe our significant expertise in operating in the Northern and Southern California and Pacific Northwest office sectors and extensive, long-term relationships with real estate owners, developers and lenders, coupled with our conservative capital structure and access to capital, will allow us to capitalize on current market opportunities.
On April 1, 2015, we completed the acquisition of the EOP Northern California Portfolio (“EOP Acquisition”) from certain affiliates of Blackstone Group L.P. (“Blackstone”). The EOP Acquisition consisted of 26 high-quality office assets totaling approximately 8.2 million square feet and two development parcels located throughout Northern California. The total consideration paid for the EOP Acquisition, before certain credits, prorations and closing costs, included a cash payment of $1.75 billion and an aggregate of 63,474,791 shares of common stock of Hudson Pacific Properties, Inc. and common units in our operating partnership. Following a common stock offering and common unit repurchase on January 10, 2017, Blackstone informed us that they no longer owned common stock or common units in the Company or the operating partnership.
Competition
We compete with a number of developers, owners and operators of office and commercial real estate, many of which own properties similar to ours in the same markets in which our properties are located and some of which have greater financial resources than we do. In operating and managing our portfolio, we compete for tenants based on a number of factors, including location, rental rates, security, flexibility and expertise to design space to meet prospective tenants’ needs and the manner in which our properties are operated, maintained and marketed. As leases at our properties expire, we may encounter significant competition to renew or re-let space in light of competing properties within the markets in which we operate. As a result, we may be required to provide rent concessions or abatements, incur charges for tenant improvements and other inducements, including early termination rights or below-market renewal options, or we may not be able to timely lease vacant space. In that case, our financial condition, results of operations and cash flows may be adversely affected.
We also face competition when pursuing acquisition and disposition opportunities. Our competitors may be able to pay higher property acquisition prices, may have private access to acquisition opportunities not available to us and may otherwise be in a better position to acquire a property. Competition may also increase the price required to consummate an acquisition opportunity and generally reduce the demand for commercial office space in our markets. Likewise, competition
5
with sellers of similar properties to locate suitable purchasers may result in us receiving lower proceeds from a sale or in us not being able to dispose of a property at a time of our choosing due to the lack of an acceptable return.
For further discussion of the potential impact of competitive conditions on our business, see Item 1A “Risk Factors.”
Segment and Geographic Financial Information
We report our results of operations through two segments: (i) office properties and (ii) media and entertainment properties. As of December 31, 2017, the office properties reporting segment included 51 properties, totaling approximately 13.3 million square feet strategically located in many of our target markets, while the media and entertainment reporting segment included three properties, totaling approximately 1.2 million square feet.
All of our business is conducted in Northern and Southern California and the Pacific Northwest. For information about our revenues and other financial information, see our consolidated financial statements included in this report and Part II, Item 7 “Management’s Discussion and Analysis of Financial Condition and Results of Operations—Results of Operations.”
Employees
At December 31, 2017, we had 293 employees. At December 31, 2017, four of our employees were subject to collective bargaining agreements. Each of these employees are on-site at the Sunset Bronson Studios property. We believe that relations with our employees are good.
Principal Executive Offices
Our principal executive offices are located at 11601 Wilshire Blvd., Ninth Floor, Los Angeles, California 90025 and our telephone number is (310) 445-5700. We believe that our current facilities are adequate for our present operations.
Regulation
General
Our properties are subject to various covenants, laws, ordinances and regulations, including regulations relating to common areas and fire and safety requirements. We believe that each of the properties in our portfolio have the necessary permits and approvals to operate its business.
Americans with Disabilities Act
Our properties must comply with Title III of the Americans with Disabilities Act (“ADA”) to the extent that such properties are “public accommodations” as defined by the ADA. The ADA may require removal of structural barriers to access by persons with disabilities in certain public areas of our properties where such removal is readily achievable. We have developed and undertaken continuous capital improvement programs at certain properties in the past. These capital improvement programs will continue to progress and certain ADA upgrades will continue to be integrated into the planned improvements, specifically at the media and entertainment properties where we are able to utilize in-house construction crews to minimize costs for required ADA-related improvements. However, some of our properties may currently be in noncompliance with the ADA. Such noncompliance could result in the incurrence of additional costs to attain compliance, the imposition of fines or an award of damages to private litigants. The obligation to make readily achievable accommodations is an ongoing one, and we will continue to assess our properties and to make alterations as appropriate in this respect.
Environmental Matters
Under various federal, state and local laws and regulations relating to the environment, as a current or former owner or operator of real property, we may be liable for costs and damages resulting from the presence or discharge of hazardous or toxic substances, waste or petroleum products at, on, in, under, or migrating from such property, including costs to investigate and clean up such contamination and liability for natural resources. Such laws often impose liability without regard to whether the owner or operator knew of, or was responsible for, the presence of such contamination, and the liability may be joint and several. These liabilities could be substantial and the cost of any required remediation, removal, fines, or other costs could exceed the value of the property and/or our aggregate assets. In addition, the presence of contamination or the failure to remediate contamination at our properties may expose us to third-party liability for costs of remediation and/or personal or property damage or materially adversely affect our ability to sell, lease or develop our properties or to borrow using the
6
properties as collateral. In addition, environmental laws may create liens on contaminated sites in favor of the government for damages and costs it incurs to address such contamination. Moreover, if contamination is discovered on our properties, environmental laws may impose restrictions on the manner in which property may be used or businesses may be operated, and these restrictions may require substantial expenditures.
Some of our properties contain, have contained, or are adjacent to or near other properties that have contained or currently contain storage tanks for the storage of petroleum products or other hazardous or toxic substances. Similarly, some of our properties were used in the past for commercial or industrial purposes, or are currently used for commercial purposes, that involve or involved the use of petroleum products or other hazardous or toxic substances, or are adjacent to or near properties that have been or are used for similar commercial or industrial purposes. As a result, some of our properties have been or may be impacted by contamination arising from the release of such hazardous substances or petroleum products. Where we have deemed appropriate, we have taken steps to address identified contamination or mitigate risks associated with such contamination; however, we are unable to ensure that further actions will not be necessary. As a result of the foregoing, we could potentially incur material liabilities.
Independent environmental consultants have conducted Phase I Environmental Site Assessments at all of the properties in our portfolio using the American Society for Testing and Materials (“ASTM”) Practice E 1527-05. A Phase I Environmental Site Assessment is a report prepared for real estate holdings that identifies potential or existing environmental contamination liabilities. Site assessments are intended to discover and evaluate information regarding the environmental condition of the surveyed property and surrounding properties. These assessments do not generally include soil samplings, subsurface investigations or asbestos or lead surveys. None of the recent site assessments identified any known past or present contamination that we believe would have a material adverse effect on our business, assets or operations. However, the assessments are limited in scope and may have failed to identify all environmental conditions or concerns. A prior owner or operator of a property or historic operations at our properties may have created a material environmental condition that is not known to us or the independent consultants preparing the site assessments. Material environmental conditions may have arisen after the review was completed or may arise in the future, and future laws, ordinances or regulations may impose material additional environmental liability.
Environmental laws also govern the presence, maintenance and removal of asbestos-containing building materials (“ACBM”) or lead-based paint (“LBP”) and may impose fines and penalties for failure to comply with these requirements or expose us to third party liability (e.g., liability for personal injury associated with exposure to asbestos). Such laws require that owners or operators of buildings containing ACBM and LBP (and employers in such buildings) properly manage and maintain the asbestos and lead, adequately notify or train those who may come into contact with asbestos or lead, and undertake special precautions, including removal or other abatement, if asbestos or lead would be disturbed during renovation or demolition of a building. Some of our properties contain ACBM and/or LBP and we could be liable for such damages, fines or penalties.
In addition, the properties in our portfolio also are subject to various federal, state, and local environmental and health and safety requirements, such as state and local fire requirements. Moreover, some of our tenants routinely handle and use hazardous or regulated substances and waste as part of their operations at our properties, which are subject to regulation. Such environmental and health and safety laws and regulations could subject us or our tenants to liability resulting from these activities. Environmental liabilities could affect a tenant’s ability to make rental payments to us. In addition, changes in laws could increase the potential liability for noncompliance. We sometimes require our tenants to comply with environmental and health and safety laws and regulations and to indemnify us for any related liabilities. But in the event of the bankruptcy or inability of any of our tenants to satisfy such obligations, we may be required to satisfy such obligations. In addition, we may be held directly liable for any such damages or claims regardless of whether we knew of, or were responsible for, the presence or disposal of hazardous or toxic substances or waste and irrespective of tenant lease provisions. The costs associated with such liability could be substantial and could have a material adverse effect on us.
When excessive moisture accumulates in buildings or on building materials, mold growth may occur, particularly if the moisture problem remains undiscovered or is not addressed over a period of time. Some molds may produce airborne toxins or irritants. Indoor air quality issues can also stem from inadequate ventilation, chemical contamination from indoor or outdoor sources, and other biological contaminants such as pollen, viruses and bacteria. Indoor exposure to airborne toxins or irritants above certain levels can be alleged to cause a variety of adverse health effects and symptoms, including allergic or other reactions. As a result, the presence of significant mold or other airborne contaminants at any of our properties could require us to undertake a costly remediation program to contain or remove the mold or other airborne contaminants from the affected property or increase indoor ventilation. In addition, the presence of significant mold or other airborne contaminants could expose us to liability from our tenants, employees of our tenants or others if property damage or personal injury occurs. We are not presently aware of any material adverse indoor air quality issues at our properties.
7
Corporate Sustainability and Giving
We are committed to high performance sustainable operations. All of our office properties are benchmarked in the U.S. Environmental Protection Agency’s ENERGY STAR Portfolio Manager, with 50% of the portfolio achieving an ENERGY STAR certification, and all developments are or will be Leadership in Energy & Environmental Design (“LEED”) certified. We are keenly focused on developing and operating innovative, energy and water efficient world class properties that also incorporate robust recycling and green cleaning best practices. In keeping with our continuous process improvement approach, in 2017 we developed and began implementing a Sustainability Strategic Plan to ensure the appropriate evolution of sustainability execution, with a focus on ways to drive positive financial and environmental outcomes for shareholders, tenants, employees and the communities in which we invest.
We are also committed to corporate social responsibility as part of our culture and value proposition to stakeholders. We uphold the highest business ethics, are committed to best-in-class standards for the health and safety for our employees, tenants and service provider partners, and have a robust community-giving program. Specifically, we support and encourage our employees’ contributions to charitable organizations. To assist employees’ charitable giving and augment the impact of their charitable dollars, we created the Hudson Pacific Properties Charitable Giving Program. This program encourages employees to contribute to qualifying charitable organizations by matching donations and providing additional paid time off for volunteerism and providing donations to qualifying nonprofit organizations to which our employees volunteer.
Available Information
On the Investor Relations page on our Company’s Website at investors.hudsonpacificproperties.com we post the following filings as soon as reasonably practicable after they are electronically filed with or furnished to the SEC: our Annual Report on Form 10-K, our Quarterly Reports on Form 10-Q, our Current Reports on Form 8-K and any amendments to those reports filed or furnished pursuant to Section 13(a) or 15(d) of the Exchange Act. All such filings are available to be viewed on our Investor Relations page on our Website free of charge. Also available on our Investor Relations page on our Website, free of charge, are our corporate governance guidelines, the charters of the nominating and corporate governance, audit and compensation committees of our board of directors and our code of business conduct and ethics (which applies to all directors and employees, including our Principal Executive Officer, Principal Financial Officer and Principal Accounting Officer). Information contained on or hyperlinked from our Website is not incorporated by reference into, and should not be considered part of, this Annual Report on Form 10-K or our other filings with the SEC. A copy of this Annual Report on Form 10-K is available without charge upon written request to: Investor Relations, Hudson Pacific Properties, Inc., 11601 Wilshire Blvd., Ninth Floor, Los Angeles, California 90025.
8
ITEM 1A. Risk Factors
Forward-looking Statements
Certain written and oral statements made or incorporated by reference from time to time by us or our representatives in this Annual Report on Form 10-K, other filings or reports filed with the SEC, press releases, conferences, or otherwise, are “forward-looking statements” within the meaning of the Private Securities Litigation Reform Act of 1995 (set forth in Section 27A of the Securities Act of 1933, as amended, or the Securities Act, as amended, and Section 21E of the Exchange Act). In particular, statements relating to our liquidity and capital resources, portfolio performance and results of operations contain forward-looking statements. Furthermore, all of the statements regarding future financial performance (including anticipated funds from operations, or FFO, market conditions and demographics) are forward-looking statements. We are including this cautionary statement to make applicable and take advantage of the safe harbor provisions of the Private Securities Litigation Reform Act of 1995 for any such forward-looking statements. We caution investors that any forward-looking statements presented in this Annual Report on Form 10-K, or that management may make orally or in writing from time to time, are based on management’s beliefs and assumptions made by, and information currently available to, management. When used, the words “anticipate,” “believe,” “expect,” “intend,” “may,” “might,” “plan,” “estimate,” “project,” “should,” “will,” “result” and similar expressions that do not relate solely to historical matters are intended to identify forward-looking statements. Such statements are subject to risks, uncertainties and assumptions and may be affected by known and unknown risks, trends, uncertainties and factors that are beyond our control. Should one or more of these risks or uncertainties materialize, or should underlying assumptions prove incorrect, actual results may vary materially from those anticipated, estimated or projected. We expressly disclaim any responsibility to update forward-looking statements, whether as a result of new information, future events or otherwise. Accordingly, investors should use caution in relying on past forward-looking statements, which were based on results and trends at the time they were made, to anticipate future results or trends.
Some of the risks and uncertainties that may cause our actual results, performance, liquidity or achievements to differ materially from those expressed or implied by forward-looking statements include, among others, the following:
• | adverse economic or real estate developments in our target markets; |
• | general economic conditions; |
• | defaults on, early terminations of or non-renewal of leases by tenants; |
• | fluctuations in interest rates and increased operating costs; |
• | our failure to obtain necessary outside financing or maintain an investment grade rating; |
• | our failure to generate sufficient cash flows to service our outstanding indebtedness and maintain dividend payments; |
• | lack or insufficient amounts of insurance; |
• | decreased rental rates or increased vacancy rates; |
• | difficulties in identifying properties to acquire and completing acquisitions; |
• | our failure to successfully operate acquired properties and operations; |
• | our failure to maintain our status as a REIT; |
• | environmental uncertainties and risks related to adverse weather conditions and natural disasters; |
• | financial market fluctuations; |
• | risks related to acquisitions generally, including the diversion of management’s attention from ongoing business operations and the impact on customers, tenants, lenders, operating results and business; |
• | the inability to successfully integrate acquired properties, realize the anticipated benefits of acquisitions or capitalize on value creation opportunities; |
9
• | the impact of changes in the tax laws as a result of recent federal tax reform legislation and uncertainty as to how some of those changes may be applied; |
• | changes in real estate and zoning laws and increases in real property tax rates; and |
• | other factors affecting the real estate industry generally. |
Set forth below are some (but not all) of the factors that could adversely affect our business and financial performance. Moreover, we operate in a highly competitive and rapidly changing environment. New risk factors emerge from time to time, and it is not possible for management to predict all such risk factors, nor can it assess the impact of all such risk factors on our business or the extent to which any factor, or combination of factors, may cause actual results to differ materially from those contained in any forward-looking statements. Given these risks and uncertainties, investors should not place undue reliance on forward-looking statements as a prediction of actual results.
Risks Related to Our Properties and Our Business
Our properties are located in Northern and Southern California and the Pacific Northwest, and we are susceptible to adverse economic conditions, local regulations and natural disasters affecting those markets.
Our properties are located in Northern and Southern California and the Pacific Northwest, which exposes us to greater economic risks than if we owned a more geographically dispersed portfolio. Further, our properties are concentrated in certain areas, including Los Angeles, San Francisco, Silicon Valley and Seattle, exposing us to risks associated with those specific areas. We are susceptible to adverse developments in the economic and regulatory environments of Northern and Southern California and the Pacific Northwest (such as business layoffs or downsizing, industry slowdowns, relocations of businesses, increases in real estate and other taxes, costs of complying with governmental regulations or increased regulation), as well as to natural disasters that occur in our markets (such as earthquakes, wind, landslides, droughts, fires and other events). In addition, the State of California has had historical periods of budgetary constraints and is regarded as more litigious and more highly regulated and taxed than many other states, all of which may reduce demand for office space in California. Any adverse developments in the economy or real estate market in Northern and Southern California or the Pacific Northwest, or any decrease in demand for office space resulting from the California regulatory or business environment, could adversely impact our financial condition, results of operations, cash flow and the per share trading price of our securities.
We derive a significant portion of our rental revenue from tenants in the technology and media and entertainment industries, which makes us particularly susceptible to demand for rental space in those industries.
A significant portion of our rental revenue is derived from tenants in the technology and media and entertainment industries. Consequently, we are susceptible to adverse developments affecting the demand by tenants in these industries for office, production and support space in Northern and Southern California and the Pacific Northwest and, more particularly, in Hollywood and the South of Market area of the San Francisco submarket. As we continue our development and potential acquisition activities in markets populated by knowledge-and creative-based tenants in the technology and media and entertainment industries, our tenant mix could become more concentrated, further exposing us to risks in those industries. Any adverse development in the technology and media and entertainment industries could adversely affect our financial condition, results of operations, cash flow and the per share trading price of our securities.
We may be unable to identify and complete acquisitions of properties that meet our criteria, which may impede our growth.
Our business strategy includes the acquisition of underperforming office properties. These activities require us to identify suitable acquisition candidates or investment opportunities that meet our criteria and are compatible with our growth strategies. We continue to evaluate the market of available properties and may attempt to acquire properties when strategic opportunities exist. However, we may be unable to acquire any of the properties that we may identify as potential acquisition opportunities in the future. Our ability to acquire properties on favorable terms, or at all, may be exposed to the following significant risks:
• | potential inability to acquire a desired property because of competition from other real estate investors with significant capital, including publicly traded REITs, private equity investors and institutional investment funds, which may be able to accept more risk than we can prudently manage, including risks with respect to the geographic proximity of investments and the payment of higher acquisition prices; |
10
• | we may incur significant costs and divert management attention in connection with evaluating and negotiating potential acquisitions, including ones that we are subsequently unable to complete; |
• | even if we enter into agreements for the acquisition of properties, these agreements are typically subject to customary conditions to closing, including the satisfactory completion of our due diligence investigations; and |
• | we may be unable to finance the acquisition on favorable terms or at all. |
If we are unable to finance property acquisitions or acquire properties on favorable terms, or at all, our financial condition, results of operations, cash flow and the per share trading price of our securities could be adversely affected. In addition, failure to identify or complete acquisitions of suitable properties could slow our growth.
Our future acquisitions may not yield the returns we expect.
Our future acquisitions and our ability to successfully operate the properties we acquire in such acquisitions may be exposed to the following significant risks:
• | even if we are able to acquire a desired property, competition from other potential acquirers may significantly increase the purchase price; |
• | we may acquire properties that are not accretive to our results upon acquisition, and we may not successfully manage and lease those properties to meet our expectations; |
• | our cash flow may be insufficient to meet our required principal and interest payments; |
• | we may spend more than budgeted amounts to make necessary improvements or renovations to acquired properties; |
• | we may be unable to quickly and efficiently integrate new acquisitions, particularly acquisitions of portfolios of properties, into our existing operations; |
• | market conditions may result in higher than expected vacancy rates and lower than expected rental rates; and |
• | we may acquire properties subject to liabilities and without any recourse, or with only limited recourse, with respect to unknown liabilities such as liabilities for clean-up of undisclosed environmental contamination, claims by tenants, vendors or other persons dealing with the former owners of the properties, liabilities incurred in the ordinary course of business and claims for indemnification by general partners, directors, officers and others indemnified by the former owners of the properties. |
If we cannot operate acquired properties to meet our financial expectations, our financial condition, results of operations, cash flow and the per share trading price of our securities could be adversely affected.
We may acquire properties or portfolios of properties through tax deferred contribution transactions, which could result in stockholder dilution and limit our ability to sell such assets.
In the future we may acquire properties or portfolios of properties through tax deferred contribution transactions in exchange for partnership interests in our operating partnership, which may result in stockholder dilution. This acquisition structure may have the effect of, among other things, reducing the amount of tax depreciation we could deduct over the tax life of the acquired properties, and may require that we agree to protect the contributors’ ability to defer recognition of taxable gain through restrictions on our ability to dispose of the acquired properties and/or the allocation of partnership debt to the contributors to maintain their tax bases. These restrictions could limit our ability to sell an asset at a time, or on terms, that would be favorable absent such restrictions.
Our growth depends on external sources of capital that are outside of our control and may not be available to us on commercially reasonable terms or at all.
In order to maintain our qualification as a REIT, we are required to meet various requirements under the Internal Revenue Code of 1986, as amended, or the Code, including that we distribute annually at least 90% of our net taxable income, excluding any net capital gain. In addition, we will be subject to federal corporate income tax to the extent that we distribute less than 100% of our net taxable income, including any net capital gains. Because of these distribution requirements, we may
11
not be able to fund future capital needs, including any necessary acquisition financing, from operating cash flow. Consequently, we intend to rely on third-party sources to fund our capital needs. We may not be able to obtain the financing on favorable terms or at all. Any additional debt we incur will increase our leverage and likelihood of default. Our access to third-party sources of capital depends, in part, on:
• | general market conditions; |
• | the market’s perception of our growth potential; |
• | our current debt levels; |
• | our current and expected future earnings; |
• | our cash flow and cash distributions; and |
• | the market price per share of our common stock. |
The credit markets can experience significant disruptions. If we cannot obtain capital from third-party sources, we may not be able to acquire or develop properties when strategic opportunities exist, meet the capital and operating needs of our existing properties, satisfy our debt service obligations or make the cash distributions to our stockholders necessary to maintain our qualification as a REIT.
Failure to hedge effectively against interest rate changes may adversely affect our financial condition, results of
operations, cash flow, cash available for distribution, including cash available for payment of dividends on and the per share trading price of our securities.
If interest rates increase, then so will the interest costs on our unhedged variable rate debt, which could adversely affect our cash flow and our ability to pay principal and interest on our debt and our ability to make distributions to our stockholders. Further, rising interest rates could limit our ability to refinance existing debt when it matures. We seek to manage our exposure to interest rate volatility by using interest rate hedging arrangements that involve risk, such as the risk that counterparties may fail to honor their obligations under these arrangements, and that these arrangements may not be effective in reducing our exposure to interest rate changes. Failure to hedge effectively against interest rate changes may materially adversely affect our financial condition, results of operations, cash flow, cash available for distribution, including cash available for payment of dividends on and the per share trading price of our securities. In addition, while such agreements are intended to lessen the impact of rising interest rates on us, they also expose us to the risk that the other parties to the agreements will not perform, we could incur significant costs associated with the settlement of the agreements, the agreements will be unenforceable and the underlying transactions will fail to qualify as highly-effective cash flow hedges under Financial Accounting Standards Board (“FASB”), Accounting Standards Codification (“ASC”) Topic 815, Derivative and Hedging.
Mortgage debt obligations expose us to the possibility of foreclosure, which could result in the loss of our investment in a property or group of properties subject to mortgage debt.
Incurring mortgage and other secured debt obligations increases our risk of property losses because defaults on indebtedness secured by properties may result in foreclosure actions initiated by lenders and ultimately our loss of the property securing any loans for which we are in default. Any foreclosure on a mortgaged property or group of properties could adversely affect the overall value of our portfolio of properties. For tax purposes, a foreclosure of any of our properties that is subject to a nonrecourse mortgage loan would be treated as a sale of the property for a purchase price equal to the outstanding balance of the debt secured by the mortgage. If the outstanding balance of the debt secured by the mortgage exceeds our tax basis in the property, we would recognize taxable income on foreclosure, but would not receive any cash proceeds.
Our unsecured revolving credit facility, registered senior notes, term loan facility and note purchase agreement restrict our ability to engage in some business activities.
Our unsecured revolving credit facility, registered senior notes, term loan facility and note purchase agreement contain customary negative covenants and other financial and operating covenants that, among other things:
• | restrict our ability to incur additional indebtedness; |
• | restrict our ability to make certain investments; |
12
• | restrict our ability to merge with another company; |
• | restrict our ability to make distributions to stockholders; and |
• | require us to maintain financial coverage ratios. |
These limitations restrict our ability to engage in some business activities, which could adversely affect our financial condition, results of operations, cash flow, cash available for distributions to our stockholders, and per share trading price of our securities. In addition, failure to meet any of these covenants, including the financial coverage ratios, could cause an event of default under and/or accelerate some or all of our indebtedness, which would have a material adverse effect on us. Furthermore, our unsecured revolving credit facility and term loan facility contain specific cross-default provisions with respect to specified other indebtedness, giving the lenders the right to declare a default if we are in default under other loans in some circumstances.
Adverse economic and geopolitical conditions and dislocations in the credit markets could have a material adverse effect on our financial condition, results of operations, cash flow and per share trading price of our securities.
Volatility in the United States and international capital markets and concern over a return to recessionary conditions in global economies, and the California economy in particular, may adversely affect our financial condition, results of operations, cash flow and the per share trading price of our securities as a result of the following potential consequences, among others:
• | significant job losses in the financial and professional services industries may occur, which may decrease demand for our office space, causing market rental rates and property values to be negatively impacted; |
• | our ability to obtain financing on terms and conditions that we find acceptable, or at all, may be limited, which could reduce our ability to pursue acquisition and development opportunities and refinance existing debt, reduce our returns from our acquisition and development activities and increase our future interest expense; |
• | reduced values of our properties may limit our ability to dispose of assets at attractive prices or to obtain debt financing secured by our properties and may reduce the availability of unsecured loans; and |
• | one or more lenders under our unsecured revolving credit facility could refuse to fund their financing commitment to us or could fail and we may not be able to replace the financing commitment of any such lenders on favorable terms, or at all. |
We have a limited operating history with respect to some of our properties and may not be able to operate them successfully.
Our Sunset Las Palmas Studios property has only been under our management since it was acquired in 2017. This property may have characteristics or deficiencies unknown to us that could affect its valuation or revenue potential. In addition, there can be no assurance that the operating performance of this property will not decline under our management. We cannot assure you that we will be able to operate this property successfully.
We face significant competition, which may decrease or prevent increases in the occupancy and rental rates of our properties.
We compete with numerous developers, owners and operators of office properties, many of which own properties similar to ours in the same submarkets in which our properties are located. If our competitors offer space at rental rates below current market rates, or below the rental rates we currently charge our tenants, we may lose existing or potential tenants and we may be pressured to reduce our rental rates below those we currently charge or to offer more substantial rent abatements, tenant improvements, early termination rights or below-market renewal options in order to retain tenants when our tenants’ leases expire. As a result, our financial condition, results of operations, cash flow and the per share trading price of our securities could be adversely affected.
13
We depend on significant tenants, and several of our properties are single-tenant properties or are currently occupied by single tenants.
As of December 31, 2017, the 15 largest tenants in our office portfolio represented approximately 37.3%
of the total annualized base rent generated by our office properties. The inability of a significant tenant to pay rent or the bankruptcy or insolvency of a significant tenant may adversely affect the income produced by our properties. If a tenant becomes bankrupt or insolvent, federal law may prohibit us from evicting such tenant based solely upon such bankruptcy or insolvency. In addition, a bankrupt or insolvent tenant may be authorized to reject and terminate its lease with us. Any claim against such tenant for unpaid, future rent would be subject to a statutory cap that might be substantially less than the remaining rent owed under the lease. As of December 31, 2017, our two largest tenants were Google, Inc. and Netflix, Inc., which together accounted for 9.8% of the annualized base rent generated by our office properties. If Google, Inc. and Netflix, Inc. were to experience a downturn or a weakening of financial condition resulting in a failure to make timely rental payments or causing a lease default, we may experience delays in enforcing our rights as landlord and may incur substantial costs in protecting our investment. Any such event described above could have an adverse effect on our financial condition, results of operations, cash flow and the per share trading price of our securities.
We may be unable to renew leases, lease vacant space or re-let space as leases expire.
As of December 31, 2017, approximately 10.5% of the square footage of the office properties in our portfolio was available (taking into account uncommenced leases signed as of December 31, 2017), and an additional approximately 13.8% of the square footage of the office properties in our portfolio is scheduled to expire in 2018 (includes leases scheduled to expire on December 31, 2017). Furthermore, substantially all of the square footage of the media and entertainment properties in our portfolio (other than KTLA and Netflix, Inc. leases at Sunset Bronson Studios) are typically short-term leases of one year or less. We cannot assure you that leases will be renewed or that our properties will be re-let at net effective rental rates equal to or above the current average net effective rental rates or that substantial rent abatements, tenant improvements, early termination rights or below-market renewal options will not be offered to attract new tenants or retain existing tenants. If the rental rates for our properties decrease, our existing tenants do not renew their leases or we do not re-let a significant portion of our available space and space for which leases will expire, our financial condition, results of operations, cash flow and per share trading price of our securities could be adversely affected.
We may be required to make rent or other concessions and/or significant capital expenditures to improve our properties in order to retain and attract tenants, causing our financial condition, results of operations, cash flow and per share trading price of our securities to be adversely affected.
To the extent adverse economic conditions continue in the real estate market and demand for office space remains low, we expect that, upon expiration of leases at our properties, we will be required to make rent or other concessions to tenants, accommodate requests for renovations, build-to-suit remodeling and other improvements or provide additional services to our tenants. As a result, we may have to make significant capital or other expenditures in order to retain tenants whose leases expire and to attract new tenants in sufficient numbers. Additionally, we may need to raise capital to make such expenditures. If we are unable to do so or capital is otherwise unavailable, we may be unable to make the required expenditures. This could result in non-renewals by tenants upon expiration of their leases, which could adversely affect our financial condition, results of operations, cash flow and the per share trading price of our securities.
The actual rents we receive for the properties in our portfolio may be less than our asking rents, and we may experience lease roll-down from time to time.
As a result of various factors, including competitive pricing pressure in our submarkets, adverse conditions in the Northern or Southern California or the Pacific Northwest real estate markets, a general economic downturn and the desirability of our properties compared to other properties in our submarkets, we may be unable to realize the asking rents across the properties in our portfolio. In addition, the degree of discrepancy between our asking rents and the actual rents we are able to obtain may vary both from property to property and among different leased spaces within a single property. If we are unable to obtain rental rates that are on average comparable to our asking rents across our portfolio, then our ability to generate cash flow growth will be negatively impacted. In addition, depending on asking rental rates at any given time as compared to expiring leases in our portfolio, from time to time rental rates for expiring leases may be higher than starting rental rates for new leases.
14
Some of our properties are subject to ground leases, the termination or expiration of which could cause us to lose our interest in, and the right to receive rental income from, such properties.
Eleven of our properties are subject to ground leases (including properties with a portion of the land subject to a ground lease). See Part IV, Item 15(a) “Financial Statement and Schedules—Note 7 to the Consolidated Financial Statements—Future Minimum Base Rents and Lease Payments Future Minimum Rents” for more information regarding our ground lease agreements. If any of these ground leases are terminated following a default or expire without being extended, we may lose our interest in the related property and may no longer have the right to receive any of the rental income from such property, which would adversely affect our financial condition, results of operations, cash flow and the per share trading price of our securities.
The ground sublease for the Del Amo property is subject and subordinate to a ground lease, the termination of which could result in a termination of the ground sublease.
The property on which the Del Amo building is located is subleased by Del Amo Fashion Center Operating Company, L.L.C., or Del Amo, through a long-term ground sublease. The ground sublease is subject and subordinate to the terms of a ground lease between the fee owner of the Del Amo property and the sub-landlord under the ground sublease. The fee owner has not granted to the subtenant under the ground sublease any rights of non-disturbance. Accordingly, a termination of the ground lease for any reason, including a rejection thereof by the ground tenant under the ground lease in a bankruptcy proceeding, could result in a termination of the ground sublease. In the event of a termination of the ground sublease, we may lose our interest in the Del Amo building and may no longer have the right to receive any of the rental income from the Del Amo building. In addition, our lack of any non-disturbance rights from the fee owner may impair our ability to obtain financing for the Del Amo building.
Our success depends on key personnel whose continued service is not guaranteed.
Our continued success and our ability to manage anticipated future growth depend, in large part, upon the efforts of key personnel who have extensive market knowledge and relationships and exercise substantial influence over our operational, financing, acquisition and disposition activity. Many of our other senior executives have extensive experience and strong reputations in the real estate industry, which aid us in identifying opportunities, having opportunities brought to us, and negotiating with tenants and build-to-suit prospects. The loss of services of one or more members of our senior management team, or our inability to attract and retain highly qualified personnel, could adversely affect our business, diminish our investment opportunities and weaken our relationships with lenders, business partners, existing and prospective tenants and industry personnel, which could adversely affect our financial condition, results of operations, cash flow and the per share trading price of our securities.
Potential losses, including from adverse weather conditions, natural disasters and title claims, may not be covered by insurance.
We carry commercial property (including earthquake), liability and terrorism coverage on all the properties in our portfolio (most are covered under a blanket insurance policy while a few are under individual policies), in addition to other coverages, such as trademark and pollution coverage, that may be appropriate for certain of our properties. We have selected policy specifications and insured limits that we believe to be appropriate and adequate given the relative risk of loss, the cost of the coverage and industry practice. However, we do not carry insurance for losses such as those arising from riots or war because such coverage is not available or is not available at commercially reasonable rates. Some of our policies, like those covering losses due to terrorism or earthquakes, are insured subject to limitations involving large deductibles or co-payments and policy limits that may not be sufficient to cover losses, which could affect certain of our properties that are located in areas particularly susceptible to natural disasters. All of the properties we currently own are located in Northern and Southern California and the Pacific Northwest, areas especially susceptible to earthquakes. In addition, we may discontinue earthquake, terrorism or other insurance on some or all of our properties in the future if the cost of premiums for any such policies exceeds, in our judgment, the value of the coverage discounted for the risk of loss. As a result, we may be required to incur significant costs in the event of adverse weather conditions and natural disasters. If we or one or more of our tenants experiences a loss that is uninsured or that exceeds policy limits, we could lose the capital invested in the damaged properties as well as the anticipated future cash flows from those properties. In addition, if the damaged properties are subject to recourse indebtedness, we would continue to be liable for the indebtedness, even if these properties were irreparably damaged. Furthermore, we may not be able to obtain adequate insurance coverage at reasonable costs in the future as the costs associated with property and casualty renewals may be higher than anticipated. In the event that we experience a substantial or comprehensive loss of one of our properties, we may not be able to rebuild such property to its existing specifications. Further reconstruction or improvement of such a property would likely require significant upgrades to meet zoning and building code requirements.
15
Future terrorist activity or engagement in war by the United States may have an adverse effect on our financial condition and operating results.
Terrorist attacks in the United States and other acts of terrorism or war may result in declining economic activity, which could harm the demand for and the value of our properties. A decrease in demand could make it difficult for us to renew or re-lease our properties at these sites at lease rates equal to or above historical rates. Terrorist activities also could directly impact the value of our properties through damage, destruction, or loss, and the availability of insurance for these acts may be less, and cost more, which could adversely affect our financial condition. To the extent that our tenants are impacted by future attacks, their businesses similarly could be adversely affected, including their ability to continue to honor their existing leases.
Terrorist attacks and engagement in war by the United States also may adversely affect the markets in which our securities trade and may cause further erosion of business and consumer confidence and spending and may result in increased volatility in national and international financial markets and economies. Any one of these events may cause decline in the demand for our office and media and entertainment leased space, delay the time in which our new or renovated properties reach stabilized occupancy, increase our operating expenses, such as those attributable to increased physical security for our properties, and limit our access to capital or increase our cost of raising capital.
We may become subject to litigation, which could have an adverse effect on our financial condition, results of operations, cash flow and the per share trading price of our securities.
In the future we may become subject to litigation, including claims relating to our operations, offerings, and otherwise in the ordinary course of business. Some of these claims may result in significant defense costs and potentially significant judgments against us, some of which are not, or cannot be, insured against. We generally intend to vigorously defend ourselves; however, we cannot be certain of the ultimate outcomes of any claims that may arise in the future. Resolution of these types of matters against us may result in our having to pay significant fines, judgments or settlements, which, if uninsured, or if the fines, judgments and settlements exceed insured levels, could adversely impact our earnings and cash flows, thereby having an adverse effect on our financial condition, results of operations, cash flow and per share trading price of our securities. Certain litigation or the resolution of certain litigation may affect the availability or cost of some of our insurance coverage, which could adversely impact our results of operations and cash flows, expose us to increased risks that would be uninsured, and/or adversely impact our ability to attract officers and directors.
Joint venture investments could be adversely affected by our lack of sole decision-making authority, our reliance on co-venturers’ financial condition and disputes between us and our co-venturers.
On January 7, 2015, we entered into a joint venture with the Canada Pension Plan Investment Board (“CPPIB”), through which CPPIB purchased a 45% interest in our 1455 Market office property. On October 7, 2016, we entered into another joint venture with CPPIB to acquire the Hill7 property. In addition to our joint ventures with CPPIB, we may co-invest in the future with other third parties through partnerships, joint ventures or other entities, acquiring non-controlling interests in or sharing responsibility for managing the affairs of a property, partnership, joint venture or other entity. These investments may, under certain circumstances, involve risks not present were a third party not involved, including the possibility that partners or co-venturers might become bankrupt or fail to fund their share of required capital contributions. Partners or co-venturers may have economic or other business interests or goals which are inconsistent with our business interests or goals, and may be in a position to take actions contrary to our policies or objectives, and they may have competing interests in our markets that could create conflict of interest issues. Such investments may also have the potential risk of impasses on decisions, such as a sale, because neither we nor the partner or co-venturer would have full control over the partnership or joint venture. In addition, prior consent of our joint venture partners may be required for a sale or transfer to a third party of our interests in the joint venture, which would restrict our ability to dispose of our interest in the joint venture. If we become a limited partner or non-managing member in any partnership or limited liability company and such entity takes or expects to take actions that could jeopardize our status as a REIT or require us to pay tax, we may be forced to dispose of our interest in such entity. Disputes between us and partners or co-venturers may result in litigation or arbitration that would increase our expenses and prevent our officers and/or directors from focusing their time and effort on our business. Consequently, actions by or disputes with partners or co-venturers might result in subjecting properties owned by the partnership or joint venture to additional risk. In addition, we may in certain circumstances be liable for the actions of our third-party partners or co-venturers. Our joint ventures may be subject to debt and, in the current volatile credit market, the refinancing of such debt may require equity capital calls.
16
If we fail to maintain an effective system of integrated internal controls, we may not be able to accurately report our financial results.
Effective internal and disclosure controls are necessary for us to provide reliable financial reports and effectively prevent fraud and to operate successfully as a public company. If we cannot provide reliable financial reports or prevent fraud, our reputation and operating results would be harmed. As part of our ongoing monitoring of internal controls we may discover material weaknesses or significant deficiencies in our internal controls. As a result of weaknesses that may be identified in our internal controls, we may also identify certain deficiencies in some of our disclosure controls and procedures that we believe require remediation. If we discover weaknesses, we will make efforts to improve our internal and disclosure controls. However, there is no assurance that we will be successful. Any failure to maintain effective controls or timely effect any necessary improvement of our internal and disclosure controls could harm operating results or cause us to fail to meet our reporting obligations, which could affect our ability to remain listed with the NYSE. Ineffective internal and disclosure controls could also cause investors to lose confidence in our reported financial information, which would likely have a negative effect on the per share trading price of our securities.
We face risks associated with security breaches through cyber attacks, cyber intrusions or otherwise, as well as other significant disruptions of our information technology (“IT”) networks and related systems.
We face risks associated with security breaches, whether through cyber attacks or cyber intrusions, malware, computer viruses, attachments to e-mails, persons inside our organization or persons with access to systems inside our organization, and other significant disruptions of our IT networks and related systems. The risk of a security breach or disruption, particularly through cyber attacks or cyber intrusions, including by computer hackers, foreign governments and cyber terrorists, has generally increased as the number, intensity and sophistication of attempted attacks and intrusions from around the world have recently increased. Our IT networks and related systems are essential to the operation of our business and our ability to perform day-to-day operations (including managing our building systems) and, in some cases, may be critical to the operations of certain of our tenants. Although we make efforts to maintain the security and integrity of our IT networks and related systems, and we have implemented various measures to manage the risk of a security breach or disruption, there can be no assurance that our security efforts and measures will be effective or that attempted security breaches or disruptions would not be successful or damaging. Even the most well-protected information, networks, systems and facilities remain potentially vulnerable because the techniques used in such attempted security breaches evolve and generally are not recognized until launched against a target, and in some cases are designed not to be detected and, in fact, may not be detected. Accordingly, we may be unable to anticipate these techniques or to implement adequate security barriers or other preventative measures, and thus it is impossible for us to entirely mitigate this risk.
A security breach or other significant disruption involving our IT networks and related systems could:
• | disrupt the proper functioning of our networks and systems and therefore our operations and/or those of certain of our tenants; |
• | result in misstated financial reports, violations of loan covenants, and/or missed reporting deadlines; |
• | result in our inability to properly monitor our compliance with the rules and regulations regarding our qualification as a REIT; |
• | result in the unauthorized access to, and destruction, loss, theft, misappropriation or release of proprietary, confidential, sensitive or otherwise valuable information of ours or others, which others could use to compete against us or for disruptive, destructive or otherwise harmful purposes and outcomes; |
• | result in our inability to maintain the building systems relied upon by our tenants for the efficient use of their leased space; |
• | require significant management attention and resources to remedy any resulting damages; |
• | subject us to claims for breach of contract, damages, credits, penalties or termination of leases or other agreements; or |
• | damage our reputation among our tenants and investors generally. |
Any or all of the foregoing could have an adverse effect on our financial condition, results of operations, cash flow and the per share trading price of our securities.
17
Our business and operations would suffer in the event of IT networks and related systems failures.
Despite system redundancy and the planned implementation of a disaster recovery plan and security measures for our IT networks and related systems, our systems are vulnerable to damage from any number of sources, including computer viruses, energy blackouts, natural disasters, terrorism, war, and telecommunication failure. We rely on our IT networks and related systems, including the Internet, to process, transmit and store electronic information and to manage or support a variety of our business processes, including financial transactions and keeping of records, which may include personal identifying information of tenants and lease data. We rely on commercially available systems, software, tools and monitoring to provide security for processing, transmitting and storing confidential tenant information, such as individually identifiable information relating to financial accounts. Any failure to maintain proper function, security and availability of our IT networks and related systems could interrupt our operations, damage our reputation and subject us to liability claims or regulatory penalties. Further, we are dependent on our personnel and, although we are working to implement a formal disaster recovery plan to assist our employees and to facilitate their maintaining continuity of operations after events such as energy blackouts, natural disasters, terrorism, war, and telecommunication failures, we can provide no assurance that any of the foregoing events would not have an adverse effect on our results of operations.
Risks Related to the Real Estate Industry
Our performance and value are subject to risks associated with real estate assets and the real estate industry.
Our ability to pay expected dividends to our stockholders depends on our ability to generate revenues in excess of expenses, pay scheduled principal payments on debt and pay capital expenditure requirements. Events and conditions generally applicable to owners and operators of real property that are beyond our control may decrease cash available for distribution and the value of our properties. These events include many of the risks set forth above under “—Risks Related to Our Properties and Our Business,” as well as the following:
• | local oversupply or reduction in demand for office or media and entertainment-related space; |
• | adverse changes in financial conditions of buyers, sellers and tenants of properties; |
• | vacancies or our inability to rent space on favorable terms, including possible market pressures to offer tenants rent abatements, tenant improvements, early termination rights or below-market renewal options, and the need to periodically repair, renovate and re-let space; |
• | increased operating costs, including insurance premiums, utilities, real estate taxes and state and local taxes; |
• | civil unrest, acts of war, terrorist attacks and natural disasters, including earthquakes and floods, which may |
result in uninsured or underinsured losses;
• | decreases in the underlying value of our real estate; and |
• | changing submarket demographics. |
In addition, periods of economic downturn or recession, rising interest rates or declining demand for real estate, or the public perception that any of these events may occur, could result in a general decline in rents or an increased incidence of defaults under existing leases, which would adversely affect our financial condition, results of operations, cash flow and per share trading price of our securities.
Illiquidity of real estate investments could significantly impede our ability to respond to adverse changes in the performance of our properties and harm our financial condition.
The real estate investments made, and to be made, by us are relatively difficult to sell quickly. As a result, our ability to promptly sell one or more properties in our portfolio in response to changing economic, financial and investment conditions is limited. Return of capital and realization of gains, if any, from an investment generally will occur upon disposition or refinancing of the underlying property. We may be unable to realize our investment objectives by sale, other disposition or refinancing at attractive prices within any given period of time or may otherwise be unable to complete any exit strategy. In particular, our ability to dispose of one or more properties within a specific time period is subject to certain limitations imposed by our tax protection agreements, as well as weakness in or even the lack of an established market for a property, changes in the
18
financial condition or prospects of prospective purchasers, changes in national or international economic conditions, such as the current economic downturn, and changes in laws, regulations or fiscal policies of jurisdictions in which the property is located.
In addition, the Code imposes restrictions on a REIT’s ability to dispose of properties that are not applicable to other types of real estate companies. In particular, the tax laws applicable to REITs effectively require that we hold our properties for investment, rather than primarily for sale in the ordinary course of business, which may cause us to forgo or defer sales of properties that otherwise would be in our best interest.
Therefore, we may not be able to vary our portfolio in response to economic or other conditions promptly or on favorable terms, which may adversely affect our financial condition, results of operations, cash flow and per share trading price of our securities.
We could incur significant costs related to government regulation and litigation over environmental matters.
Under various federal, state and local laws and regulations relating to the environment, as a current or former owner or operator of real property, we may be liable for costs and damages resulting from the presence or discharge of hazardous or toxic substances, waste or petroleum products at, on, in, under or migrating from such property, including costs to investigate, clean up such contamination and liability for harm to natural resources. Such laws often impose liability without regard to whether the owner or operator knew of, or was responsible for, the presence of such contamination, and the liability may be joint and several. These liabilities could be substantial and the cost of any required remediation, removal, fines or other costs could exceed the value of the property and/or our aggregate assets. In addition, the presence of contamination or the failure to remediate contamination at our properties may expose us to third-party liability for costs of remediation and/or personal or property damage or materially adversely affect our ability to sell, lease or develop our properties or to borrow using the properties as collateral. In addition, environmental laws may create liens on contaminated sites in favor of the government for damages and costs it incurs to address such contamination. Moreover, if contamination is discovered on our properties, environmental laws may impose restrictions on the manner in which property may be used or businesses may be operated, and these restrictions may require substantial expenditures. Some of our properties have been or may be impacted by contamination arising from current or prior uses of the property, or adjacent properties, for commercial or industrial purposes. Such contamination may arise from spills of petroleum or hazardous substances or releases from tanks used to store such materials. As a result, we could potentially incur material liability for these issues, which could adversely impact our financial condition, results of operations, cash flow and the per share trading price of our securities.
Environmental laws also govern the presence, maintenance and removal of ACBM and LBP and may impose fines and penalties for failure to comply with these requirements or expose us to third-party liability (e.g., liability for personal injury associated with exposure to asbestos or lead). Such laws require that owners or operators of buildings containing ACBM and LBP (and employers in such buildings) properly manage and maintain the asbestos and lead, adequately notify or train those who may come into contact with asbestos or lead, and undertake special precautions, including removal or other abatement, if asbestos or lead would be disturbed during renovation or demolition of a building. Some of our properties contain ACBM and/or LBP and we could be liable for such damages, fines or penalties.
In addition, the properties in our portfolio also are subject to various federal, state and local environmental and health and safety requirements, such as state and local fire requirements. Moreover, some of our tenants routinely handle and use hazardous or regulated substances and wastes as part of their operations at our properties, which are subject to regulation. Such environmental and health and safety laws and regulations could subject us or our tenants to liability resulting from these activities. Environmental liabilities could affect a tenant’s ability to make rental payments to us. In addition, changes in laws could increase the potential liability for noncompliance. This may result in significant unanticipated expenditures or may otherwise materially and adversely affect our operations, or those of our tenants, which could in turn have an adverse effect on us.
We cannot assure you that costs or liabilities incurred as a result of environmental issues will not affect our ability to make distributions to our stockholders or that such costs or other remedial measures will not have an adverse effect on our financial condition, results of operations, cash flow and the per share trading price of our securities. If we do incur material environmental liabilities in the future, we may face significant remediation costs, and we may find it difficult to sell any affected properties.
Our properties may contain or develop harmful mold or suffer from other air quality issues, which could lead to liability for adverse health effects and costs of remediation.
When excessive moisture accumulates in buildings or on building materials, mold growth may occur, particularly if the moisture problem remains undiscovered or is not addressed over a period of time. Some molds may produce airborne toxins
19
or irritants. Indoor air quality issues can also stem from inadequate ventilation, chemical contamination from indoor or outdoor sources, and other biological contaminants such as pollen, viruses and bacteria. Indoor exposure to airborne toxins or irritants above certain levels can be alleged to cause a variety of adverse health effects and symptoms, including allergic or other reactions. As a result, the presence of significant mold or other airborne contaminants at any of our properties could require us to undertake a costly remediation program to contain or remove the mold or other airborne contaminants from the affected property or increase indoor ventilation. In addition, the presence of significant mold or other airborne contaminants could expose us to liability from our tenants, employees of our tenants or others if property damage or personal injury is alleged to have occurred.
We may incur significant costs complying with various federal, state and local laws, regulations and covenants that are applicable to our properties.
The properties in our portfolio are subject to various covenants and federal, state and local laws and regulatory requirements, including permitting and licensing requirements. Local regulations, including municipal or local ordinances, zoning restrictions and restrictive covenants imposed by community developers may restrict our use of our properties and may require us to obtain approval from local officials or restrict our use of our properties and may require us to obtain approval from local officials of community standards organizations at any time with respect to our properties, including prior to acquiring a property or when undertaking renovations of any of our existing properties. Among other things, these restrictions may relate to fire and safety, seismic or hazardous material abatement requirements. There can be no assurance that existing laws and regulatory policies will not adversely affect us or the timing or cost of any future acquisitions or renovations, or that additional regulations will not be adopted that increase such delays or result in additional costs. Our growth strategy may be affected by our ability to obtain permits, licenses and zoning relief. Our failure to obtain such permits, licenses and zoning relief or to comply with applicable laws could have an adverse effect on our financial condition, results of operations, cash flow and per share trading price of our securities.
In addition, federal and state laws and regulations, including laws such as the ADA, impose further restrictions on our properties and operations. Under the ADA, all public accommodations must meet federal requirements related to access and use by disabled persons. Some of our properties may currently be in non-compliance with the ADA. If one or more of the properties in our portfolio is not in compliance with the ADA or any other regulatory requirements, we may be required to incur additional costs to bring the property into compliance and we might incur governmental fines or the award of damages to private litigants. In addition, we do not know whether existing requirements will change or whether future requirements will require us to make significant unanticipated expenditures that will adversely impact our financial condition, results of operations, cash flow and per share trading price of our securities.
We are exposed to risks associated with property development.
We may engage in development and redevelopment activities with respect to certain of our properties. To the extent that we do so, we will be subject to certain risks, including the availability and pricing of financing on favorable terms or at all; construction and/or lease-up delays; cost overruns, including construction costs that exceed our original estimates; contractor and subcontractor disputes, strikes, labor disputes or supply disruptions; failure to achieve expected occupancy and/or rent levels within the projected time frame, if at all; and delays with respect to obtaining or the inability to obtain necessary zoning, occupancy, land use and other governmental permits, and changes in zoning and land use laws. These risks could result in substantial unanticipated delays or expenses and, under certain circumstances, could prevent completion of development activities once undertaken, any of which could have an adverse effect on our financial condition, results of operations, cash flow and per share trading price of our securities.
Risks Related to Our Organizational Structure
The Series A preferred units that were issued to some contributors in connection with our IPO in exchange for the contribution of their properties have certain preferences, which could limit our ability to pay dividends or other distributions to the holders of our securities or engage in certain business combinations, recapitalizations or other fundamental changes.
In exchange for the contribution of properties to our portfolio in connection with our IPO, some contributors received Series A preferred units in our operating partnership, which units have an aggregate liquidation preference of approximately $10.2 million and have a preference as to distributions and upon liquidation that could limit our ability to pay dividends on common stock. The Series A preferred units are senior to any other class of securities our operating partnership may issue in the future without the consent of the holders of the Series A preferred units. As a result, we will be unable to issue partnership units in our operating partnership senior to the Series A preferred units without the consent of the holders of Series A preferred units. Any preferred stock in our Company that we issue will be subordinate to the Series A preferred units. In addition, we may only
20
engage in a fundamental change, including a recapitalization, a merger and a sale of all or substantially all of our assets, as a result of which our common stock ceases to be publicly traded or common units cease to be exchangeable (at our option) for publicly traded shares of our stock, without the consent of holders of Series A preferred units if following such transaction we will maintain certain leverage ratios and equity requirements, and pay certain minimum tax distributions to holders of our outstanding Series A preferred units. Alternatively, we may redeem all or any portion of the then outstanding Series A preferred units for cash (at a price per unit equal to the redemption price). In addition, these provisions could increase the cost of any such fundamental change transaction, which may discourage a merger, combination or change of control that might involve a premium price for our common stock or that our stockholders otherwise believe to be in their best interests.
Conflicts of interest exist or could arise in the future between the interests of our stockholders and the interests of holders of units in our operating partnership, which may impede business decisions that could benefit our stockholders.
Conflicts of interest exist or could arise in the future as a result of the relationships between us and our affiliates, on the one hand, and our operating partnership or any partner thereof, on the other. Our directors and officers have duties to our Company under applicable Maryland law in connection with their management of our Company. At the same time, we, as the general partner of our operating partnership, have fiduciary duties and obligations to our operating partnership and its limited partners under Maryland law and the partnership agreement of our operating partnership in connection with the management of our operating partnership. Our fiduciary duties and obligations as general partner to our operating partnership and its partners may come into conflict with the duties of our directors and officers to our Company.
Additionally, the partnership agreement provides that we and our directors and officers will not be liable or accountable to our operating partnership for losses sustained, liabilities incurred or benefits not derived if we, or such director or officer acted in good faith. The partnership agreement also provides that we will not be liable to the operating partnership or any partner for monetary damages for losses sustained, liabilities incurred or benefits not derived by the operating partnership or any limited partner, except for liability for our intentional harm or gross negligence. Moreover, the partnership agreement provides that our operating partnership is required to indemnify us and our directors, officers and employees, officers and employees of the operating partnership and our designees from and against any and all claims that relate to the operations of our operating partnership, except (i) if the act or omission of the person was material to the matter giving rise to the action and either was committed in bad faith or was the result of active and deliberate dishonesty, (ii) for any transaction for which the indemnified party received an improper personal benefit, in money, property or services or otherwise, in violation or breach of any provision of the partnership agreement or (iii) in the case of a criminal proceeding, if the indemnified person had reasonable cause to believe that the act or omission was unlawful. No reported decision of a Maryland appellate court has interpreted provisions similar to the provisions of the partnership agreement of our operating partnership that modify and reduce our fiduciary duties or obligations as the general partner or reduce or eliminate our liability for money damages to the operating partnership and its partners, and we have not obtained an opinion of counsel as to the enforceability of the provisions set forth in the partnership agreement that purport to modify or reduce the fiduciary duties that would be in effect were it not for the partnership agreement.
Our charter and bylaws, the partnership agreement of our operating partnership and Maryland law contain provisions that may delay, defer or prevent a change of control transaction, even if such a change in control may be in your interest, and as a result may depress the market price of our securities.
Our charter contains certain ownership limits. Our charter contains various provisions that are intended to preserve our qualification as a REIT and, subject to certain exceptions, authorize our directors to take such actions as are necessary or appropriate to preserve our qualification as a REIT. For example, our charter prohibits the actual, beneficial or constructive ownership by any person of more than 9.8% in value or number of shares, whichever is more restrictive, of the outstanding shares of our common stock, and more than 9.8% in value of the aggregate outstanding shares of all classes and series of our stock. Our board of directors, in its sole and absolute discretion, may exempt a person, prospectively or retroactively, from these ownership limits if certain conditions are satisfied. The restrictions on ownership and transfer of our stock may:
• | discourage a tender offer or other transactions or a change in management or of control that might involve a premium price for our common stock or that our stockholders otherwise believe to be in their best interests; or |
• | result in the transfer of shares acquired in excess of the restrictions to a trust for the benefit of a charitable beneficiary and, as a result, the forfeiture by the acquirer of the benefits of owning the additional shares. |
We could increase the number of authorized shares of stock, classify and reclassify unissued stock and issue stock without stockholder approval. Our board of directors has the power under our charter to amend our charter to increase the aggregate number of shares of stock or the number of shares of stock of any class or series that we are authorized to issue, to
21
authorize us to issue authorized but unissued shares of our common stock or preferred stock and to classify or reclassify any unissued shares of our common stock or preferred stock into one or more classes or series of stock and set the terms of such newly classified or reclassified shares. Although our board of directors has no such intention at the present time, it could establish a class or series of preferred stock that could, depending on the terms of such series, delay, defer or prevent a transaction or a change of control that might involve a premium price for our securities or that our stockholders otherwise believe to be in their best interest.
Certain provisions of Maryland law could inhibit changes in control, which may discourage third parties from conducting a tender offer or seeking other change of control transactions that our stockholders otherwise believe to be in their best interest. Certain provisions of the Maryland General Corporation Law (“the MGCL”) may have the effect of inhibiting a third party from making a proposal to acquire us or of impeding a change of control under circumstances that otherwise could be in the best interest of our stockholders, including:
• | “business combination” provisions that, subject to limitations, prohibit certain business combinations between us and an “interested stockholder” (defined generally as any person who beneficially owns 10% or more of the voting power of our shares or an affiliate thereof or an affiliate or associate of ours who was the beneficial owner, directly or indirectly, of 10% or more of the voting power of our then outstanding voting stock at any time within the two-year period immediately prior to the date in question) for five years after the most recent date on which the stockholder becomes an interested stockholder, and thereafter impose fair price and/or supermajority and stockholder voting requirements on these combinations; and |
• | “control share” provisions that provide that “control shares” of our Company (defined as shares that, when aggregated with other shares controlled by the stockholder, entitle the stockholder to exercise one of three increasing ranges of voting power in electing directors) acquired in a “control share acquisition” (defined as the direct or indirect acquisition of ownership or control of issued and outstanding “control shares”) have no voting rights except to the extent approved by our stockholders by the affirmative vote of at least two-thirds of all the votes entitled to be cast on the matter, excluding all interested shares. |
As permitted by the MGCL, we have elected, by resolution of our board of directors, to exempt from the business combination provisions of the MGCL, any business combination that is first approved by our disinterested directors and, pursuant to a provision in our bylaws, to exempt any acquisition of our stock from the control share provisions of the MGCL. However, our board of directors may by resolution elect to repeal the exemption from the business combination provisions of the MGCL and may by amendment to our bylaws opt into the control share provisions of the MGCL at any time in the future.
Certain provisions of the MGCL permit our board of directors, without stockholder approval and regardless of what is currently provided in our charter or bylaws, to implement certain corporate governance provisions, some of which (for example, a classified board) are not currently applicable to us. These provisions may have the effect of limiting or precluding a third party from making an unsolicited acquisition proposal for us or of delaying, deferring or preventing a change in control of us under circumstances that otherwise could be in the best interest of our stockholders. Our charter contains a provision whereby we have elected to be subject to the provisions of Title 3, Subtitle 8 of the MGCL relating to the filling of vacancies on our board of directors.
Certain provisions in the partnership agreement of our operating partnership may delay or prevent unsolicited acquisitions of us. Provisions in the partnership agreement of our operating partnership may delay or make more difficult unsolicited acquisitions of us or changes of our control. These provisions could discourage third parties from making proposals involving an unsolicited acquisition of us or change of our control, although some stockholders might consider such proposals, if made, desirable. These provisions include, among others:
• | redemption rights of qualifying parties; |
• | transfer restrictions on units; |
• | our ability, as general partner, in some cases, to amend the partnership agreement and to cause the operating partnership to issue units with terms that could delay, defer or prevent a merger or other change of control of us or our operating partnership without the consent of the limited partners; |
• | the right of the limited partners to consent to transfers of the general partnership interest and mergers or other transactions involving us under specified circumstances; and |
22
• | restrictions on debt levels and equity requirements pursuant to the terms of our Series A preferred units, as well as required distributions to holders of Series A preferred units of our operating partnership, following certain changes of control of us. |
Our charter, bylaws, the partnership agreement of our operating partnership and Maryland law also contain other provisions that may delay, defer or prevent a transaction or a change of control that our stockholders otherwise believe to be in their best interest.
Our board of directors may change our investment and financing policies without stockholder approval and we may become more highly leveraged, which may increase our risk of default under our debt obligations.
Our investment and financing policies are exclusively determined by our board of directors. Accordingly, our stockholders do not control these policies. Further, our organizational documents do not limit the amount or percentage of indebtedness, funded or otherwise, that we may incur. Our board of directors may alter or eliminate our current policy on borrowing at any time without stockholder approval. If this policy changed, we could become more highly leveraged, which could result in an increase in our debt service. Higher leverage also increases the risk of default on our obligations. In addition, a change in our investment policies, including the manner in which we allocate our resources across our portfolio or the types of assets in which we seek to invest, may increase our exposure to interest rate risk, real estate market fluctuations and liquidity risk. Changes to our policies with regards to the foregoing could adversely affect our financial condition, results of operations, cash flow and per share trading price of our securities.
Our rights and the rights of our stockholders to take action against our directors and officers are limited.
Our charter eliminates the liability of our directors and officers to us and our stockholders for monetary damages, except for liability resulting from:
• | actual receipt of an improper benefit or profit in money, property or services; or |
• | a final judgment based upon a finding of active and deliberate dishonesty by the director or officer that was material to the cause of action adjudicated. |
In addition, our charter authorizes us to obligate our Company, and our bylaws require us, to indemnify our directors and officers for actions taken by them in those and certain other capacities to the maximum extent permitted by Maryland law. As a result, we and our stockholders may have more limited rights against our directors and officers than might otherwise exist. Accordingly, in the event that actions taken in good faith by any of our directors or officers impede the performance of our Company, your ability to recover damages from such director or officer will be limited.
Tax protection agreements could limit our ability to sell or otherwise dispose of certain properties.
In connection with our formation transactions for our IPO, we entered into tax protection agreements with certain third-party contributors that provide that if we dispose of any interest with respect to certain properties in a taxable transaction during the period from the closing of our IPO on June 29, 2010 through certain specified dates ranging through 2027, we will indemnify the third-party contributors for certain tax liabilities payable as a result of the sale (as well as tax liabilities payable as a result of the reimbursement payment). Certain contributors’ rights under the tax protection agreements with respect to these properties will, however, expire at various times (depending on the rights of such partner) during the period beginning in 2017 and prior to the expiration, in 2027, of the maximum period for indemnification. If we were to trigger the tax protection provisions under these agreements, we would be required to pay damages, if any, in the amount of certain taxes payable by these contributors (plus additional damages in the amount of the taxes incurred as a result of such payment). In addition, although it may otherwise be in our stockholders’ best interest that we sell one of these properties, it may be economically prohibitive for us to do so because of these obligations.
Our tax protection agreements may require our operating partnership to maintain certain debt levels that otherwise would not be required to operate our business.
Our tax protection agreements provide that during the period from the closing of our IPO on June 29, 2010, through certain specified dates ranging through 2027, our operating partnership will offer certain holders of units who continue to hold the units received in respect of the formation transactions the opportunity to guarantee debt. If we fail to make such opportunities available, we will be required to indemnify such holders for certain tax liabilities, if any, resulting from our failure to make such opportunities available to them (and any tax liabilities payable as a result of the indemnity payment). We
23
agreed to these provisions in order to assist certain contributors in deferring the recognition of taxable gain as a result of and after the formation transactions. These obligations may require us to maintain more or different indebtedness than we would otherwise require for our business.
We are a holding company with no direct operations and, as such, we rely on funds received from our operating partnership to pay liabilities, and the interests of our stockholders are structurally subordinated to all liabilities and obligations of our operating partnership and its subsidiaries.
We are a holding company and conduct substantially all of our operations through our operating partnership. We do not have, apart from an interest in our operating partnership, any independent operations. As a result, we rely on distributions from our operating partnership to pay any dividends we might declare on our common stock. We also rely on distributions from our operating partnership to meet our obligations, including any tax liability on taxable income allocated to us from our operating partnership. In addition, because we are a holding company, claims of our equity holders will be structurally subordinated to all existing and future liabilities and obligations (whether or not for borrowed money) of our operating partnership and its subsidiaries and subordinate to the rights of holders of Series A preferred units. Therefore, in the event of our bankruptcy, liquidation or reorganization, our assets and those of our operating partnership and its subsidiaries will be available to satisfy the claims of our stockholders only after all of our and our operating partnership’s and its subsidiaries’ liabilities and obligations have been paid in full.
Risks Related to Our Status as a REIT
Failure to qualify as a REIT would have significant adverse consequences to us and the value of our stock.
We have elected to be taxed as a REIT for federal income tax purposes commencing with our taxable year ended December 31, 2010. We believe that we have operated in a manner that has allowed us to qualify as a REIT for federal income tax purposes commencing with such taxable year, and we intend to continue operating in such manner. We have not requested and do not plan to request a ruling from the Internal Revenue Service, or IRS, that we qualify as a REIT, and the statements in this Annual Report are not binding on the IRS or any court. Therefore, we cannot assure you that we have qualified as a REIT, or that we will remain qualified as such in the future. If we lose our REIT status, we will face serious tax consequences that would substantially reduce the funds available for distribution to you for each of the years involved because:
• | we would not be allowed a deduction for distributions to stockholders in computing our taxable income and would be subject to federal corporate income tax on our taxable income; |
• | we also could be subject to the federal alternative minimum tax for taxable years prior to 2018 and possibly increased state and local taxes; and |
• | unless we are entitled to relief under applicable statutory provisions, we could not elect to be taxed as a REIT for four taxable years following the year during which we were disqualified. |
Any such corporate tax liability could be substantial and would reduce our cash available for, among other things, our operations and distributions to stockholders. In addition, if we fail to qualify as a REIT, we would not be required to make distributions to our stockholders. As a result of all these factors, our failure to qualify as a REIT also could impair our ability to expand our business and raise capital, and could materially and adversely affect the value of our securities.
Qualification as a REIT involves the application of highly technical and complex Code provisions for which there are only limited judicial and administrative interpretations. The complexity of these provisions and of the applicable Treasury regulations that have been promulgated under the Code, or the Treasury Regulations, is greater in the case of a REIT that, like us, holds its assets through a partnership. The determination of various factual matters and circumstances not entirely within our control may affect our ability to qualify as a REIT. In order to qualify as a REIT, we must satisfy a number of requirements, including requirements regarding the ownership of our stock and requirements regarding the composition of our assets and our gross income. Also, we must make distributions to stockholders aggregating annually at least 90% of our net taxable income, excluding net capital gains.
We own and may acquire direct or indirect interests in one or more entities that have elected or will elect to be taxed as REITs under the Code (each, a “Subsidiary REIT”). A Subsidiary REIT is subject to the various REIT qualification requirements and other limitations described herein that are applicable to us. If a Subsidiary REIT were to fail to qualify as a REIT, then (i) that Subsidiary REIT would become subject to federal income tax, (ii) shares in such Subsidiary REIT would cease to be qualifying assets for purposes of the asset tests applicable to REITs, and (iii) it is possible that we would fail certain
24
of the asset tests applicable to REITs, in which event we would fail to qualify as a REIT unless we could avail ourselves of certain relief provisions.
In addition, legislation, new regulations, administrative interpretations or court decisions may materially adversely affect our investors, our ability to qualify as a REIT for federal income tax purposes or the desirability of an investment in a REIT relative to other investments.
Even if we qualify as a REIT for federal income tax purposes, we may be subject to some federal, state and local income, property and excise taxes on our income or property and, in certain cases, a 100% penalty tax, in the event we sell property as a dealer. In addition, our taxable REIT subsidiaries will be subject to tax as regular corporations in the jurisdictions they operate.
If our operating partnership failed to qualify as a partnership for federal income tax purposes, we would cease to qualify as a REIT and suffer other adverse consequences.
We believe that our operating partnership is properly treated as a partnership for federal income tax purposes. As a partnership, our operating partnership is not subject to federal income tax on its income. Instead, each of its partners, including us, is allocated, and may be required to pay tax with respect to, its share of our operating partnership’s income. We cannot assure you, however, that the IRS will not challenge the status of our operating partnership or any other subsidiary partnership in which we own an interest as a partnership for federal income tax purposes, or that a court would not sustain such a challenge. If the IRS were successful in treating our operating partnership or any such other subsidiary partnership as an entity taxable as a corporation for federal income tax purposes, we would fail to meet the gross income tests and certain of the asset tests applicable to REITs and, accordingly, we would likely cease to qualify as a REIT. Also, the failure of our operating partnership or any subsidiary partnerships to qualify as a partnership would cause it to become subject to federal and state corporate income tax, which could reduce significantly the amount of cash available for debt service and for distribution to its partners, including us.
The tax imposed on REITs engaging in “prohibited transactions” may limit our ability to engage in transactions that would be treated as sales for federal income tax purposes.
A REIT’s net income from prohibited transactions is subject to a 100% penalty tax. In general, prohibited transactions are sales or other dispositions of property, other than foreclosure property, held primarily for sale to customers in the ordinary course of business. Although we do not intend to hold any properties that would be characterized as held for sale to customers in the ordinary course of our business, such characterization is a factual determination and we cannot assure you that the IRS would agree with our characterization of our properties or that we will always be able to make use of the available safe harbors, which, if met, would prevent any such sales from being treated as prohibited transactions.
Our ownership of taxable REIT subsidiaries is subject to certain restrictions, and we will be required to pay a 100% penalty tax on certain income or deductions if our transactions with our taxable REIT subsidiaries are not conducted on arm’s length terms.
We currently own an interest in one taxable REIT subsidiary and may acquire securities in additional taxable REIT subsidiaries in the future. A taxable REIT subsidiary is a corporation other than a REIT in which a REIT directly or indirectly holds stock, and that has made a joint election with such REIT to be treated as a taxable REIT subsidiary. If a taxable REIT subsidiary owns more than 35% of the total voting power or value of the outstanding securities of another corporation, such other corporation will also be treated as a taxable REIT subsidiary. Other than some activities relating to lodging and health care facilities, a taxable REIT subsidiary may generally engage in any business, including the provision of customary or non-customary services to tenants of its parent REIT. A taxable REIT subsidiary is subject to federal income tax as a regular C corporation. In addition, a 100% excise tax will be imposed on certain transactions between a taxable REIT subsidiary and its parent REIT that are not conducted on an arm’s length basis. A REIT’s ownership of securities of a taxable REIT subsidiary is not subject to the 5% or 10% asset tests applicable to REITs. Not more than 25% of our total assets may be represented by securities, including securities of taxable REIT subsidiaries, other than those securities includable in the 75% asset test. Further, for taxable years beginning after December 31, 2017, not more than 20% of the value of our total assets may be represented by securities of taxable REIT subsidiaries. We anticipate that the aggregate value of the stock and other securities of any taxable REIT subsidiaries that we own will be less than 20% of the value of our total assets, and we will monitor the value of these investments to ensure compliance with applicable asset test limitations. In addition, we intend to structure our transactions with any taxable REIT subsidiaries that we own to ensure that they are entered into on arm’s length terms to avoid incurring the 100% excise tax described above. There can be no assurance, however, that we will be able to comply with these limitations or avoid application of the 100% excise tax discussed above.
25
To maintain our REIT status, we may be forced to borrow funds during unfavorable market conditions.
To qualify as a REIT, we generally must distribute to our stockholders at least 90% of our net taxable income each year, excluding net capital gains, and we will be subject to regular corporate income taxes to the extent that we distribute less than 100% of our net taxable income each year. In addition, we will be subject to a 4% nondeductible excise tax on the amount, if any, by which distributions paid by us in any calendar year are less than the sum of 85% of our ordinary income, 95% of our capital gain net income and 100% of our undistributed income from prior years. In order to maintain our REIT status and avoid the payment of income and excise taxes, we may need to borrow funds to meet the REIT distribution requirements even if the then prevailing market conditions are not favorable for these borrowings. These borrowing needs could result from, among other things, differences in timing between the actual receipt of cash and inclusion of income for federal income tax purposes, or the effect of non-deductible capital expenditures, the creation of reserves or required debt or amortization payments. These sources, however, may not be available on favorable terms or at all. Our access to third-party sources of capital depends on a number of factors, including the market’s perception of our growth potential, our current debt levels, the market price of our common stock, and our current and potential future earnings. We cannot assure you that we will have access to such capital on favorable terms at the desired times, or at all, which may cause us to curtail our investment activities and/or to dispose of assets at inopportune times, and could adversely affect our financial condition, results of operations, cash flow, cash available for distributions to our stockholders, and per share trading price of our securities.
Complying with REIT requirements may affect our profitability and may force us to liquidate or forgo otherwise attractive investments.
To qualify as a REIT, we must continually satisfy tests concerning, among other things, the nature and diversification of our assets, the sources of our income and the amounts we distribute to our stockholders. We may be required to liquidate or forgo otherwise attractive investments in order to satisfy the asset and income tests or to qualify under certain statutory relief provisions. We also may be required to make distributions to stockholders at disadvantageous times or when we do not have funds readily available for distribution. As a result, having to comply with the distribution requirement could cause us to: (i) sell assets in adverse market conditions; (ii) borrow on unfavorable terms; or (iii) distribute amounts that would otherwise be invested in future acquisitions, capital expenditures or repayment of debt. Accordingly, satisfying the REIT requirements could have an adverse effect on our business results, profitability and ability to execute our business plan. Moreover, if we are compelled to liquidate our investments to meet any of these asset, income or distribution tests, or to repay obligations to our lenders, we may be unable to comply with one or more of the requirements applicable to REITs or may be subject to a 100% tax on any resulting gain if such sales constitute prohibited transactions.
Dividends payable by REITs do not qualify for the reduced tax rates available for some dividends.
The maximum tax rate applicable to “qualified dividend income” payable to U.S. stockholders that are individuals, trusts and estates is 20%. Dividends payable by REITs, however, generally are not eligible for these reduced rates. Under recently enacted tax legislation (the “2017 Tax Legislation”), U.S. stockholders that are individuals, trusts and estates generally may deduct up to 20% of the ordinary dividends (e.g., dividends not designated as capital gain dividends or qualified dividend income) received from a REIT for taxable years beginning after December 31, 2017 and before January 1, 2026. Although this deduction reduces the effective tax rate applicable to certain dividends paid by REITs (generally to 29.6% assuming the shareholder is subject to the 37% maximum rate), such tax rate is still higher than the tax rate applicable to corporate dividends that constitute qualified dividend income. Accordingly, investors who are individuals, trusts and estates may perceive investments in REITs to be relatively less attractive than investments in the stocks of non-REIT corporations that pay dividends, which could materially and adversely affect the value of the shares of REITs, including the per share trading price of our securities.
The power of our board of directors to revoke our REIT election without stockholder approval may cause adverse consequences to our stockholders and unitholders.
Our charter provides that our board of directors may revoke or otherwise terminate our REIT election, without the approval of our stockholders, if it determines that it is no longer in our best interest to continue to qualify as a REIT. If we cease to qualify as a REIT, we would become subject to U.S. federal income tax on our taxable income and would no longer be required to distribute most of our taxable income to our stockholders and accordingly, distributions Hudson Pacific Properties, L.P. makes to its unitholders could be similarly reduced.
26
Legislative or other actions affecting REITs could have a negative effect on our investors and us.
The rules dealing with federal income taxation are constantly under review by persons involved in the legislative process and by the IRS and the United States Department of the Treasury. Changes to the tax laws, with or without retroactive application, could adversely affect our investors or us. We cannot predict how changes in the tax laws might affect our investors or us. New legislation, Treasury Regulations, administrative interpretations or court decisions could significantly and negatively affect our ability to qualify as a REIT, the federal income tax consequences of such qualification, or the federal income tax consequences of an investment in us. Also, the law relating to the tax treatment of other entities, or an investment in other entities, could change, making an investment in such other entities more attractive relative to an investment in a REIT.
The 2017 Tax Legislation has significantly changed the U.S. federal income taxation of U.S. businesses and their owners, including REITs and their stockholders. Changes made by the 2017 Tax Legislation that could affect us and our stockholders include:
• | temporarily reducing individual U.S. federal income tax rates on ordinary income; the highest individual U.S. federal income tax rate has been reduced from 39.6% to 37% for taxable years beginning after December 31, 2017 and before January 1, 2026; |
• | permanently eliminating the progressive corporate tax rate structure, which previously imposed a maximum corporate tax rate of 35%, and replacing it with a flat corporate tax rate of 21%; |
• | permitting a deduction for certain pass-through business income, including dividends received by our stockholders from us that are not designated by us as capital gain dividends or qualified dividend income, which will allow individuals, trusts, and estates to deduct up to 20% of such amounts for taxable years beginning after December 31, 2017 and before January 1, 2026; |
• | reducing the highest rate of withholding with respect to our distributions to non-U.S. stockholders that are treated as attributable to gains from the sale or exchange of U.S. real property interests from 35% to 21%; |
• | limiting our deduction for net operating losses arising in taxable years beginning after December 31, 2017 to 80% of our REIT taxable income (determined without regard to the dividends paid deduction); |
• | generally limiting the deduction for net business interest expense in excess of 30% of a business’s “adjusted taxable income,” except for taxpayers that engage in certain real estate businesses (including most equity REITs) and elect out of this rule (provided that such electing taxpayers must use an alternative depreciation system with longer depreciation periods); and |
• | eliminating the corporate alternative minimum tax. |
Many of these changes that are applicable to us are effective beginning with our 2018 taxable year, without any transition periods or grandfathering for existing transactions. The legislation is unclear in many respects and could be subject to potential amendments and technical corrections, as well as interpretations and implementing regulations by the IRS and the U.S. Department of the Treasury, any of which could lessen or increase the impact of the legislation. In addition, it is unclear how these U.S. federal income tax changes will affect state and local taxation, which often uses federal taxable income as a starting point for computing state and local tax liabilities. While some of the changes made by the tax legislation may adversely affect us in one or more reporting periods and prospectively, other changes may be beneficial in the future. We continue to work with our tax advisors and auditors to determine the full impact that the 2017 Tax Legislation as a whole will have on us.
ITEM 1B. Unresolved Staff Comments
None.
ITEM 2. Properties
As of December 31, 2017, our portfolio consisted of 54 properties (52 wholly-owned properties and two properties owned by joint ventures), located in 13 California submarkets and in three Seattle submarkets, totaling approximately 14.5 million square feet.
27
Our in-service office properties include stabilized office properties and lease-up office properties. Stabilized office properties consist of Same-Store properties and Non-Same-Store properties. Same-Store properties include all of the properties owned and included in our stabilized portfolio as of January 1, 2016 and still owned and included in the stabilized portfolio as of December 31, 2017. Lease-up properties are defined as those properties that have not yet reached 92.0% occupancy since the date they were acquired or placed under redevelopment or development.
The following table sets forth certain information relating to each of the in-service office properties, redevelopment, development and held for sale properties owned as of December 31, 2017:
Percent Leased(2) | Annualized Base Rent(3) | Annualized Base Rent Per Square Foot(4) | ||||||||||||||
Location | Submarket | Square Feet(1) | ||||||||||||||
SAME-STORE(5) | ||||||||||||||||
Greater Seattle, Washington | ||||||||||||||||
Northview Center | Lynnwood | 182,009 | 94.8 | % | $ | 3,544,226 | $ | 21.23 | ||||||||
Met Park North | South Lake Union | 190,748 | 95.8 | 5,296,965 | 28.99 | |||||||||||
Merrill Place | Pioneer Square | 163,768 | 95.8 | 4,738,713 | 30.66 | |||||||||||
505 First | Pioneer Square | 288,140 | 97.4 | 6,455,866 | 23.00 | |||||||||||
83 King | Pioneer Square | 185,206 | 100.0 | 4,742,559 | 28.64 | |||||||||||
Subtotal | 1,009,871 | 96.8 | % | 24,778,329 | $ | 26.07 | ||||||||||
San Francisco Bay Area, California | ||||||||||||||||
1455 Market(6) | San Francisco | 1,025,833 | 99.7 | % | $ | 40,472,477 | $ | 39.56 | ||||||||
275 Brannan | San Francisco | 54,673 | 100.0 | 3,261,352 | 59.65 | |||||||||||
625 Second | San Francisco | 138,080 | 100.0 | 8,664,372 | 62.77 | |||||||||||
875 Howard | San Francisco | 286,270 | 100.0 | 12,197,068 | 42.63 | |||||||||||
901 Market | San Francisco | 206,697 | 100.0 | 11,004,655 | 55.41 | |||||||||||
Rincon Center | San Francisco | 580,850 | 94.4 | 30,361,087 | 55.39 | |||||||||||
Towers at Shore Center | Redwood Shores | 334,483 | 83.2 | 16,381,859 | 58.84 | |||||||||||
Skyway Landing | Redwood Shores | 247,173 | 88.9 | 9,944,188 | 46.87 | |||||||||||
3176 Porter (formerly Lockheed) | Palo Alto | 42,899 | 100.0 | 3,011,716 | 70.20 | |||||||||||
3400 Hillview | Palo Alto | 207,857 | 100.0 | 13,735,024 | 66.08 | |||||||||||
Clocktower Square | Palo Alto | 100,344 | 79.0 | 4,112,028 | 78.83 | |||||||||||
Foothill Research Center | Palo Alto | 195,376 | 100.0 | 12,920,752 | 66.14 | |||||||||||
Campus Center | Milpitas | 471,580 | 100.0 | 15,845,088 | 33.60 | |||||||||||
1740 Technology | North San Jose | 206,876 | 98.0 | 7,466,150 | 36.81 | |||||||||||
Concourse | North San Jose | 944,386 | 96.9 | 28,212,197 | 32.50 | |||||||||||
Skyport Plaza | North San Jose | 418,086 | 99.1 | 13,639,733 | 33.59 | |||||||||||
Subtotal | 5,461,463 | 96.7 | % | $ | 231,229,746 | $ | 44.59 | |||||||||
Los Angeles, California | ||||||||||||||||
6922 Hollywood | Hollywood | 205,523 | 87.7 | % | $ | 8,493,830 | $ | 47.13 | ||||||||
6040 Sunset (formerly Technicolor Building) | Hollywood | 114,958 | 100.0 | 5,220,427 | 45.41 | |||||||||||
3401 Exposition | West Los Angeles | 63,376 | 100.0 | 2,783,957 | 43.93 | |||||||||||
10900 Washington | West Los Angeles | 9,919 | 100.0 | 422,549 | 42.60 | |||||||||||
10950 Washington | West Los Angeles | 159,025 | 100.0 | 6,717,466 | 42.24 | |||||||||||
Element LA | West Los Angeles | 284,037 | 100.0 | 15,871,935 | 55.88 | |||||||||||
Del Amo | Torrance | 113,000 | 100.0 | 3,327,208 | 29.44 | |||||||||||
Subtotal | 949,838 | 97.3 | % | $ | 42,837,372 | $ | 46.33 | |||||||||
Total Same-Store | 7,421,172 | 96.8 | % | $ | 298,845,447 | $ | 42.32 | |||||||||
NON-SAME-STORE | ||||||||||||||||
San Francisco Bay Area, California | ||||||||||||||||
555 Twin Dolphin | Redwood Shores | 198,936 | 93.1 | % | $ | 9,595,641 | $ | 51.83 | ||||||||
Page Mill Center | Palo Alto | 176,245 | 99.9 | 12,090,642 | 68.64 | |||||||||||
28
Percent Leased(2) | Annualized Base Rent(3) | Annualized Base Rent Per Square Foot(4) | ||||||||||||||
Location | Submarket | Square Feet(1) | ||||||||||||||
Page Mill Hill | Palo Alto | 182,676 | 87.1 | 10,371,206 | 65.16 | |||||||||||
Subtotal | 557,857 | 93.3 | % | $ | 32,057,489 | $ | 61.60 | |||||||||
Los Angeles, California | ||||||||||||||||
ICON | Hollywood | 325,757 | 100.0 | % | $ | 17,800,735 | $ | 54.64 | ||||||||
Subtotal | 325,757 | 100.0 | % | $ | 17,800,735 | $ | 54.64 | |||||||||
Total Non-Same-Store | 883,614 | 95.8 | % | $ | 49,858,224 | $ | 58.92 | |||||||||
Total Stabilized | 8,304,786 | 96.7 | % | $ | 348,703,671 | $ | 44.10 | |||||||||
LEASE-UP | ||||||||||||||||
Greater Seattle, Washington | ||||||||||||||||
Hill7(7) | South Lake Union | 284,527 | 100.0 | % | $ | 9,371,541 | $ | 36.57 | ||||||||
Subtotal | 284,527 | 100.0 | % | $ | 9,371,541 | $ | 36.57 | |||||||||
San Francisco Bay Area, California | ||||||||||||||||
Peninsula Office Park | San Mateo | 447,739 | 89.0 | % | $ | 18,550,336 | $ | 47.24 | ||||||||
Metro Center | Foster City | 730,215 | 79.6 | 27,571,653 | 47.45 | |||||||||||
333 Twin Dolphin | Redwood Shores | 182,789 | 74.6 | 7,735,117 | 56.73 | |||||||||||
Shorebreeze | Redwood Shores | 230,932 | 71.5 | 8,730,444 | 56.09 | |||||||||||
Palo Alto Square | Palo Alto | 333,254 | 76.8 | 20,373,010 | 79.61 | |||||||||||
Techmart | Santa Clara | 284,440 | 88.9 | 10,536,177 | 43.71 | |||||||||||
Gateway | North San Jose | 609,093 | 81.3 | 15,811,721 | 34.48 | |||||||||||
Metro Plaza | North San Jose | 456,921 | 76.5 | 12,382,999 | 35.55 | |||||||||||
Subtotal | 3,275,383 | 80.4 | % | $ | 121,691,457 | $ | 47.36 | |||||||||
Los Angeles, California | ||||||||||||||||
11601 Wilshire | West Los Angeles | 500,475 | 88.1 | % | $ | 17,876,406 | $ | 41.66 | ||||||||
Subtotal | 500,475 | 88.1 | % | $ | 17,876,406 | $ | 41.66 | |||||||||
Total Lease-Up | 4,060,385 | 82.7 | % | $ | 148,939,404 | $ | 45.76 | |||||||||
Total In-Service | 12,365,171 | 92.1 | % | $ | 497,643,075 | $ | 44.58 | |||||||||
REDEVELOPMENT | ||||||||||||||||
Greater Seattle, Washington | ||||||||||||||||
95 Jackson (formerly Merrill Place Theater Building) | Pioneer Square | 31,659 | 79.2 | % | $ | — | $ | — | ||||||||
Subtotal | 31,659 | 79.2 | % | $ | — | $ | — | |||||||||
Los Angeles, California | ||||||||||||||||
MaxWell | Downtown Los Angeles | 99,090 | — | % | $ | — | $ | — | ||||||||
Fourth & Traction | Downtown Los Angeles | 120,937 | — | — | — | |||||||||||
604 Arizona | West Los Angeles | 44,260 | 100.0 | — | — | |||||||||||
Subtotal | 264,287 | 16.7 | % | $ | — | $ | — | |||||||||
Total Redevelopment | 295,946 | 23.4 | % | $ | — | $ | — | |||||||||
DEVELOPMENT | ||||||||||||||||
Greater Seattle, Washington | ||||||||||||||||
450 Alaskan | Pioneer Square | 170,974 | 67.6 | % | $ | 3,584,540 | $ | 38.00 | ||||||||
Subtotal | 170,974 | 67.6 | % | $ | 3,584,540 | $ | 38.00 | |||||||||
Los Angeles, California | ||||||||||||||||
CUE | Hollywood | 91,953 | 100.0 | % | $ | — | $ | — | ||||||||
Subtotal | 91,953 | 100.0 | % | $ | — | $ | — | |||||||||
29
Percent Leased(2) | Annualized Base Rent(3) | Annualized Base Rent Per Square Foot(4) | ||||||||||||||
Location | Submarket | Square Feet(1) | ||||||||||||||
Total Development | 262,927 | 78.9 | % | $ | 3,584,540 | $ | 38.00 | |||||||||
HELD FOR SALE | ||||||||||||||||
San Francisco Bay Area, California | ||||||||||||||||
2600 Campus Drive (building 6 of Peninsula Office Park) | San Mateo | 63,050 | — | % | $ | — | $ | — | ||||||||
2180 Sand Hill | Palo Alto | 45,613 | 94.6 | 4,228,529 | 97.97 | |||||||||||
Embarcadero Place | Palo Alto | 197,402 | 77.2 | 6,969,599 | 45.74 | |||||||||||
Subtotal | 306,065 | 63.9 | % | $ | 11,198,128 | $ | 57.27 | |||||||||
Los Angeles, California | ||||||||||||||||
9300 Wilshire | West Los Angeles | 61,422 | 78.9 | % | $ | 2,276,443 | $ | 46.99 | ||||||||
Subtotal | 61,422 | 78.9 | % | $ | 2,276,443 | $ | 46.99 | |||||||||
Total Held for Sale | 367,487 | 66.4 | % | $ | 13,474,571 | $ | 55.23 | |||||||||
Total Redevelopment, Development and Held for Sale | 926,360 | 56.2 | % | $ | 17,059,111 | $ | 50.42 | |||||||||
_____________
(1) | Determined by management based upon estimated leasable square feet, which may be less or more than the Building Owners and Managers Association (“BOMA”) rentable area. Square footage may change over time due to re-measurement or re-leasing. |
(2) | Calculated as (i) square footage under commenced and uncommenced leases as of December 31, 2017, divided by (ii) total square feet, expressed as a percentage. |
(3) | Presented on an annualized basis and is calculated by multiplying (i) base rental payments (defined as cash base rents (before abatements)) under commenced leases as of December 31, 2017, by (ii) 12. Annualized base rent does not reflect tenant reimbursements. |
(4) | Calculated as (i) annualized base rent divided by (ii) square footage under commenced leases as of December 31, 2017. Annualized base rent does not reflect tenant reimbursements. |
(5) | Defined as all of the properties owned and included in our stabilized portfolio as of January 1, 2016 and still owned and included in the stabilized portfolio as of December 31, 2017. |
(6) | We have a 55% ownership interest in the consolidated joint venture that owns the 1455 Market property. |
(7) | We have a 55% ownership interest in the consolidated joint venture that owns the Hill7 property. |
The following table sets forth certain information relating to each of the land properties owned as of December 31, 2017:
Location | Submarket | Square Feet(1) | Percent of Total | |||||
San Francisco Bay Area, California | ||||||||
Cloud10 (formerly Skyport Plaza) | North San Jose | 350,000 | 11.5 | % | ||||
Campus Center | Milpitas | 946,350 | 31.1 | |||||
Subtotal | 1,296,350 | 42.6 | % | |||||
Los Angeles, California | ||||||||
EPIC | Hollywood | 300,000 | 9.8 | % | ||||
Sunset Bronson Studios—Lot D(2) | Hollywood | 19,816 | 0.7 | |||||
Sunset Gower Studios—Redevelopment | Hollywood | 423,396 | 13.9 | |||||
Sunset Las Palmas Studios—Harlow (formerly 1021 Seward)(3) | Hollywood | 106,125 | 3.5 | |||||
Sunset Las Palmas Studios—Redevelopment | Hollywood | 400,000 | 13.1 | |||||
Element LA | West Los Angeles | 500,000 | 16.4 | |||||
Subtotal | 1,749,337 | 57.4 | % | |||||
TOTAL | 3,045,687 | 100.0 | % | |||||
_____________
(1) | Square footage for land assets represents management’s estimate of developable square feet, the majority of which remains subject to entitlement approvals that have not yet been obtained. |
(2) | Square footage for Sunset Bronson Studios—Lot D represents management’s estimate of developable square feet for 33 residential units. |
(3) | Square footage for Sunset Las Palmas Studios—Harlow would require the demolition of approximately 45,000 square feet of existing improvements. |
30
Leases at our media and entertainment properties are typically short-term leases of one year or less, other than the KTLA and Netflix, Inc. leases at our Sunset Bronson Studios property. The following table sets forth certain information relating to each of the media and entertainment properties owned as of December 31, 2017:
Property | Square Feet | Percent Leased | Annual Base Rent(2) | Annual Base Rent Per Leased Square Foot(3) | |||||||||||
Sunset Gower Studios | 564,976 | (1) | 88.5 | % | $ | 16,733,352 | $ | 33.47 | |||||||
Sunset Bronson Studios | 308,026 | 94.9 | 11,197,439 | 38.30 | |||||||||||
Total Same-Store Media & Entertainment | 873,002 | 90.7 | % | (2) | $ | 27,930,791 | (3) | $ | 35.26 | (4) | |||||
Sunset Las Palmas Studios(5) | 376,925 | 76.1 | |||||||||||||
Total Non-Same-Store Media & Entertainment | 376,925 | 76.1 | % | (6) | |||||||||||
Total Media & Entertainment | 1,249,927 | ||||||||||||||
_____________
(1) | Square footage for Sunset Gower Studios excludes 6,650 square feet of restaurant space that was taken off-line for redevelopment during the third quarter of 2017. |
(2) | Percent leased for Same-Store Media and Entertainment properties is the average percent leased for the 12 months ended December 31, 2017. |
(3) | Annual base rent for Same-Store Media and Entertainment properties reflects actual base rent for the 12 months ended December 31, 2017, excluding tenant reimbursements. |
(4) | Annual base rent per leased square foot for the Same-Store Media and Entertainment properties is calculated as (i) annual base rent divided by (ii) square footage under lease as of December 31, 2017. |
(5) | The base rent for Sunset Las Palmas Studios for the eight months ended December 31, 2017 is $7.8 million ($41.11 per leased square foot), excluding tenant reimbursements. |
(6) | Percent leased for Non-Same-Store Media and Entertainment properties is the average percent leased for the eight months ended December 31, 2017. |
Office Portfolio
Our office portfolio consists of 51 office properties comprising an aggregate of approximately 13.3 million square feet. As of December 31, 2017, our in-service office properties were approximately 92.1% leased (giving effect to leases signed but not commenced as of that date). All of our office properties are located in Northern and Southern California and the Pacific Northwest. As of December 31, 2017, the weighted average remaining lease term for our stabilized office portfolio was 4.8 years.
31
Tenant Diversification of Office Portfolio
Our office portfolio is currently leased to a variety of companies. The following table sets forth information regarding the 15 largest tenants in our office portfolio based on annualized base rent as of December 31, 2017:
Property | Number of | Lease Expiration | Total Leased Square Feet | Percentage of Office Portfolio Square Feet | Annualized Base Rent(1) | Percentage of Office Portfolio Annualized Base Rent | |||||||||||||||
Tenant | Leases | Properties | |||||||||||||||||||
Google, Inc.(2) | Various | 3 | 3 | Various | 472,189 | 3.6 | % | $ | 32,636,370 | 6.3 | % | ||||||||||
Netflix, Inc.(3) | ICON | 1 | 1 | 12/31/2026 | 325,757 | 2.5 | 17,800,735 | 3.5 | |||||||||||||
Cisco Systems, Inc.(4) | Various | 2 | 2 | Various | 474,576 | 3.6 | 15,946,113 | 3.1 | |||||||||||||
Riot Games, Inc.(5) | Element LA | 1 | 1 | 3/31/2030 | 284,037 | 2.1 | 15,871,935 | 3.1 | |||||||||||||
Uber Technologies, Inc.(6) | 1455 Market | 1 | 1 | 2/28/2025 | 309,811 | 2.3 | 15,042,228 | 2.9 | |||||||||||||
Qualcomm | Skyport Plaza | 2 | 1 | 7/31/2022 | 376,817 | 2.8 | 13,276,016 | 2.6 | |||||||||||||
Salesforce.com(7) | Rincon Center | 2 | 1 | Various | 265,394 | 2.0 | 13,260,782 | 2.6 | |||||||||||||
Square, Inc.(8) | 1455 Market | 1 | 1 | 9/27/2023 | 338,910 | 2.5 | 11,761,423 | 2.3 | |||||||||||||
Stanford(9) | Various | 4 | 3 | Various | 151,249 | 1.1 | 10,615,279 | 2.1 | |||||||||||||
GSA(10) | Various | 5 | 5 | Various | 194,485 | 1.5 | 9,139,692 | 1.8 | |||||||||||||
EMC Corporation(11) | Various | 3 | 2 | Various | 294,756 | 2.2 | 8,055,636 | 1.6 | |||||||||||||
NetSuite, Inc.(12) | Peninsula Office Park | 2 | 1 | Various | 166,667 | 1.3 | 8,020,100 | 1.6 | |||||||||||||
NFL Enterprises(13) | Various | 2 | 2 | 12/31/2023 | 167,606 | 1.3 | 7,140,016 | 1.4 | |||||||||||||
Nutanix, Inc.(14) | Various | 2 | 2 | 3/31/2021 | 176,446 | 1.3 | 6,751,364 | 1.3 | |||||||||||||
White & Case LLP(15) | Palo Alto Square | 2 | 1 | Various | 66,363 | 0.5 | 5,829,623 | 1.1 | |||||||||||||
Total | 33 | 27 | 4,065,063 | 30.6 | % | $ | 191,147,312 | 37.3 | % | ||||||||||||
_____________
(1) | Annualized base rent is calculated by multiplying (i) base rental payments (defined as cash base rents (before abatements)) under commenced leases as of December 31, 2017, by (ii) 12. Annualized base rent does not reflect tenant reimbursements. |
(2) | Google, Inc. expirations by property and square footage: (i) 207,857 square feet at 3400 Hillview expiring on November 30, 2021; (ii) 97,872 square feet at Foothill Research Center expiring on February 28, 2025 and (iii) 166,460 square feet at Rincon Center on February 29, 2028. |
(3) | Netflix, Inc. is expected to take possession of an additional 52,626 square feet at CUE during the first quarter of 2018 and 39,327 square feet at CUE during the fourth quarter of 2018. |
(4) | Cisco Systems, Inc. expirations by property and square footage: (i) 471,580 square feet at Campus Center expiring on December 31, 2017 and (ii) 2,996 square feet at Concourse expiring March 31, 2018. Campus Center was taken off-line for redevelopment on January 1, 2018. |
(5) | Riot Games, Inc. may elect to exercise their early termination right effective March 31, 2025. |
(6) | Uber Technologies, Inc. is expected to take possession of an additional 15,209 square feet at 1455 Market during the first quarter of 2018. |
(7) | Salesforce.com expirations by square footage: (i) 83,016 square feet expiring on July 31, 2025; (ii) 83,372 square feet expiring on April 30, 2027; (iii) 93,028 square feet expiring on October 31, 2028 and (iv) 5,978 square feet of month-to-month storage space. This tenant may elect to exercise their early termination right with respect to 74,966 square feet between August 1, 2021 and September 30, 2021. |
(8) | Square, Inc. is expected to take possession of an additional 26,011 square feet at 1455 Market during the third quarter of 2018. |
(9) | Stanford expirations by property and square footage: (i) Board of Trustees Stanford 18,753 square feet at Page Mill Hill expiring February 28, 2019; (ii) Stanford Healthcare 63,201 square feet at Page Mill Center expiring June 30, 2019; (iii) Stanford University 26,080 square feet at Palo Alto Square expiring on December 31, 2019 and (iv) Board of Trustees Stanford 43,215 square feet at Page Mill Center expiring December 31, 2022. |
(10) | GSA expirations by property and square footage: (i) 5,266 square feet at Rincon Center expiring March 7, 2018; (ii) 71,729 square feet at 1455 Market expiring on February 19, 2019; (iii) 28,993 square feet at Northview Center expiring on April 4, 2020; (iv) 28,316 square feet at Rincon Center expiring May 31, 2020; (v) 41,793 square feet at 901 Market expiring on July 31, 2021 and (vi) 18,388 square feet at Concourse expiring on May 7, 2024. This tenant may elect to exercise their early termination right at 901 Market with respect to 41,793 square feet any time after November 1, 2017 with 120 days prior written notice. |
(11) | EMC expirations by property and square footage: (i) 66,510 square feet at 875 Howard expiring on June 30, 2019; (ii) 185,292 square feet at 505 First expiring on October 18, 2021 and (iii) 42,954 square feet at 505 First expiring on December 31, 2023. |
(12) | NetSuite, Inc. expirations by square footage: (i) 37,597 square feet expiring on August 31, 2019 and (ii) 129,070 square feet expiring on May 31, 2022. |
(13) | NFL Enterprises by property and square footage: (i) 157,687 square feet at 10950 Washington and (ii) 9,919 square feet at 10900 Washington. This tenant may elect to exercise their early termination right with respect to 167,606 square feet effective December 31, 2022. |
(14) | Nutanix, Inc. expirations by square footage: (i) 148,325 square feet at 1740 Technology and (ii) 28,121 square feet at Metro Plaza. At 1740 Technology, Nutanix is expected to take possession of an additional 19,027 square feet during the second quarter of 2018 and 8,652 square feet during the fourth quarter of 2018. |
(15) | White & Case LLP expirations by square footage at Palo Alto Square: (i) 26,490 square feet on January 14, 2018 and (ii) 39,873 square feet on January 31, 2028. |
32
Lease Distribution of Office Portfolio
The following table sets forth information relating to the distribution of leases in our office portfolio, based on net rentable square feet under lease as of December 31, 2017:
Square Feet Under Lease | Number of Leases | Percentage of All Leases | Total Leased Square Feet | Percentage of Office Portfolio Leased Square Feet | Annualized Base Rent(1) | Percentage of Office Portfolio Annualized Base Rent | |||||||||||||
2,500 or Less | 252 | 28.9 | % | 367,337 | 3.1 | % | $ | 15,488,708 | 2.9 | % | |||||||||
2,501-10,000 | 369 | 42.2 | 1,892,796 | 15.9 | 86,640,667 | 16.1 | |||||||||||||
10,001-20,000 | 82 | 9.4 | 1,166,050 | 9.8 | 56,835,075 | 10.6 | |||||||||||||
20,001-40,000 | 63 | 7.2 | 1,777,484 | 14.9 | 87,583,849 | 16.4 | |||||||||||||
40,001-100,000 | 37 | 4.2 | 2,266,243 | 19.0 | 104,350,966 | 19.5 | |||||||||||||
Greater than 100,000 | 19 | 2.2 | 3,873,907 | 32.5 | 163,802,920 | 30.6 | |||||||||||||
Building management use | 24 | 2.7 | 156,532 | 1.3 | — | — | |||||||||||||
Signed leases not commenced | 28 | 3.2 | 412,720 | 3.5 | 20,735,630 | 3.9 | |||||||||||||
Office Portfolio Total: | 874 | 100.0 | % | 11,913,069 | 100.0 | % | $ | 535,437,815 | 100.0 | % | |||||||||
_____________
(1) | Annualized base rent is calculated by multiplying (i) base rental payments (defined as cash base rents (before abatements)), including uncommenced leases, as of December 31, 2017 (ii) by 12. Annualized base rent does not reflect tenant reimbursements. |
33
Lease Expirations of Office Portfolio
The following table sets forth a summary schedule of the lease expirations for leases in place as of December 31, 2017 plus available space, for each of the ten full calendar years beginning January 1, 2017 at the properties in our office portfolio. Unless otherwise stated in the footnotes, the information set forth in the table assumes that tenants exercise no renewal options.
Year of Lease Expiration | Expiring Leases | Square Footage of Expiring Leases | Percentage of Office Portfolio Square Feet | Annualized Base Rent(1) | Percentage of Office Portfolio Annualized Base Rent | Annualized Base Rent Per Leased Square Foot(2) | ||||||||||||||
Vacant | 1,378,462 | 10.5 | % | |||||||||||||||||
2017(3) | 19 | 728,519 | 5.5 | $ | 25,038,886 | 4.6 | % | $ | 34.37 | |||||||||||
2018 | 161 | 1,092,776 | 8.3 | 48,431,136 | 9.1 | 44.32 | ||||||||||||||
2019 | 162 | 1,670,751 | 12.6 | 75,658,067 | 14.2 | 45.28 | ||||||||||||||
2020 | 128 | 1,142,245 | 8.6 | 53,934,005 | 10.1 | 47.22 | ||||||||||||||
2021 | 98 | 1,313,784 | 9.9 | 55,100,389 | 10.3 | 41.94 | ||||||||||||||
2022 | 86 | 1,175,667 | 8.9 | 52,550,007 | 9.8 | 44.70 | ||||||||||||||
2023 | 42 | 1,122,788 | 8.5 | 41,446,929 | 7.8 | 36.91 | ||||||||||||||
2024 | 35 | 599,925 | 4.5 | 29,965,786 | 5.6 | 49.95 | ||||||||||||||
2025 | 17 | 708,427 | 5.4 | 34,980,819 | 6.6 | 49.38 | ||||||||||||||
2026 | 14 | 561,905 | 4.2 | 31,082,496 | 5.8 | 55.32 | ||||||||||||||
Thereafter | 26 | 1,164,442 | 8.8 | 64,871,598 | 12.2 | 55.71 | ||||||||||||||
Building management use | 24 | 156,532 | 1.2 | — | — | — | ||||||||||||||
Signed leases not commenced(4) | 28 | 412,720 | 3.1 | 20,735,630 | 3.9 | 50.24 | ||||||||||||||
Total/Weighted Average(5) | 840 | 13,228,943 | 100.0 | % | $ | 533,795,748 | 100.0 | % | $ | 45.04 | ||||||||||
_____________
(1) | Rent data for our office properties is presented on an annualized basis without regard to cancellation options. Annualized base rent for office properties is calculated by multiplying (i) base rental payments (defined as cash base rents (before abatements)) as of December 31, 2017, by (ii) 12. Annualized base rent does not reflect tenant reimbursements. |
(2) | Annualized base rent per square foot for all lease expiration years is calculated as (i) base rental payments (defined as cash base rents (before abatements)) under commenced leases, divided by (ii) square footage under commenced leases as of December 31, 2017. |
(3) | Included within the expiring square footage for 2017 is 471,850 square feet related to the Cisco Systems, Inc. lease at Campus Center. |
(4) | Annualized base rent per leased square foot and annualized base rent per square foot at expiration for signed leases not commenced reflects uncommenced leases for space not occupied as of December 31, 2017 and is calculated as (i) base rental payments (defined as cash base rents (before abatements)) under uncommenced leases for vacant space as of December 31, 2017, divided by (ii) square footage under uncommenced leases as of December 31, 2017. |
(5) | Total expiring square footage does not include 62,588 square feet of month-to-month leases. |
34
Historical Office Tenant Improvements and Leasing Commissions
The following table sets forth certain historical information regarding tenant improvement and leasing commission costs for tenants at our office properties:
Year Ended December 31, | ||||||||||||
2017 | 2016 | 2015 | ||||||||||
Renewals (1) | ||||||||||||
Number of leases | 110 | 124 | 90 | |||||||||
Square feet | 865,937 | 1,588,437 | 661,724 | |||||||||
Tenant improvement costs per square foot (2)(3) | $ | 5.46 | $ | 9.19 | $ | 12.00 | ||||||
Leasing commission costs per square foot (2) | 5.63 | 7.59 | 6.71 | |||||||||
Total tenant improvement and leasing commission costs (2) | $ | 11.09 | $ | 16.78 | $ | 18.71 | ||||||
New leases (4) | ||||||||||||
Number of leases | 135 | 140 | 135 | |||||||||
Square feet | 1,263,707 | 1,321,824 | 924,832 | |||||||||
Tenant improvement costs per square foot (2)(3) | $ | 50.32 | $ | 52.56 | $ | 34.55 | ||||||
Leasing commission costs per square foot (2) | 15.81 | 16.28 | 13.70 | |||||||||
Total tenant improvement and leasing commission costs (2) | $ | 66.13 | $ | 68.84 | $ | 48.25 | ||||||
Total | ||||||||||||
Number of leases | 245 | 264 | 225 | |||||||||
Square feet | 2,129,644 | 2,910,261 | 1,586,556 | |||||||||
Tenant improvement costs per square foot (2)(3) | $ | 32.08 | $ | 28.89 | $ | 25.14 | ||||||
Leasing commission costs per square foot (2) | 11.67 | 11.53 | 10.78 | |||||||||
Total tenant improvement and leasing commission costs (2) | $ | 43.75 | $ | 40.42 | $ | 35.92 | ||||||
_____________
(1) | Excludes retained tenants that have relocated or expanded into new space within our portfolio. |
(2) | Assumes all tenant improvement and leasing commissions are paid in the calendar year in which the lease is executed, which may be different than the year in which they were actually paid. |
(3) | Tenant improvement costs are based on negotiated tenant improvement allowances set forth in leases, or, for any lease in which a tenant improvement allowance was not specified, the aggregate cost originally budgeted at the time the lease commenced. |
(4) | Includes retained tenants that have relocated or expanded into new space within our portfolio. |
35
Historical Office Leasing Activity
The following table sets forth certain historical information regarding leasing activity for our office properties:
Total Square Feet | |||||||||
Year Ended December 31, | |||||||||
2017 | 2016 | 2015 | |||||||
Vacant space available at the beginning of period | 1,573,433 | 2,150,780 | 806,559 | ||||||
Expirations as of the last day of the prior period | 64,254 | 241,474 | 61,586 | ||||||
Adjustment for remeasured square footage | 30,108 | (3,631 | ) | (3,633 | ) | ||||
Properties acquired vacant space | — | 256,611 | 1,561,081 | ||||||
Properties placed in service | — | — | 166,800 | ||||||
Properties disposed vacant space | (79,156 | ) | (231,589 | ) | (54,268 | ) | |||
Leases expiring or terminated during the period | 1,499,147 | 1,252,708 | 683,567 | ||||||
Total space available for lease | 3,087,786 | 3,666,353 | 3,221,692 | ||||||
Leases with new tenants | 889,863 | 798,026 | 533,577 | ||||||
Lease renewals | 526,981 | 650,133 | 139,188 | ||||||
Leases signed (uncommenced) at the end of the period | 292,480 | 644,761 | 398,147 | ||||||
Total space leased | 1,709,324 | 2,092,920 | 1,070,912 | ||||||
Vacant space available for lease at the end of the period | 1,378,462 | 1,573,433 | 2,150,780 | ||||||
Media and Entertainment Portfolio
Our portfolio of operating properties includes three properties that we consider to be media and entertainment properties, comprising an aggregate of 1.2 million square feet located in the heart of Hollywood in Southern California. We define our media and entertainment properties as those properties in our portfolio that are primarily used for the physical production of media content, such as television programs, feature films, commercials, music videos and photographs. These properties feature a fully-integrated environment within which our media and entertainment-focused tenants can access production, post-production, traditional office component and support facilities that enables them to conduct their business in a collaborative and efficient setting.
Leasing Characteristics
The duration of typical lease terms for tenants of media and entertainment properties tends to be shorter than those of traditional office properties. Generally, lease terms are one year or less, as tenants are never certain as to whether their productions will continue to be carried by networks or cable channels. However, historically, many entertainment tenants have exercised renewal options such that their actual tenancy is extended for multiple years. Additionally, occupancy levels for sound stage space and office and support space tend to run in parallel, as a majority of stage users also require office and support space. In addition, we require tenants at our media and entertainment properties to use our facilities for items such as lighting, equipment rental, parking, power, HVAC and telecommunications (telephone and internet). Accordingly, our other property-related revenues typically track overall occupancy of our media and entertainment properties. As a result of the short-term nature of the leases into which we enter at our media and entertainment properties, and because entertainment industry tenants generally do not shoot on weekends due to higher costs, we believe stabilized occupancy rates at our media and entertainment properties are lower than those rates achievable at our traditional office assets, where tenants enter into longer-term lease arrangements.
Description of our Properties
Sunset Gower Studios, Hollywood, California
Sunset Gower Studios is a 15.7-acre media and entertainment property. The property, a fixture in the Los Angeles-based entertainment industry since it was built in the 1920s, served as Columbia Pictures’ headquarters through 1972 and is now one of the largest independent media and entertainment properties in the United States. Sunset Gower Studios offers 12 stages and typically serves as home to single-camera television and motion picture production tenants.
36
Sunset Bronson Studios, Hollywood, California
Sunset Bronson Studios is a 10.6-acre media and entertainment property. The property, which was built in phases from 1924 through 1981, formerly served as Warner Brothers Studios’ headquarters and has been continuously operated as a media and entertainment property since the 1920s. The property includes a Historical-Cultural Monument designation for the Site of the Filming of the First Talking Film (The Jazz Singer) that is specific to the building structure that fronts Sunset Boulevard. Sunset Bronson Studios offers 11 stages and caters to multi-camera television productions, such as game shows, talk shows or courtroom shows that record in video and require a control room to manage and edit the productions’ multiple cameras.
Sunset Las Palmas Studios, Hollywood, California
In May 2017, we acquired Sunset Las Palmas Studios, a 15-acre media and entertainment property. The property, which was built in 1919, has played host to iconic television shows such as I Love Lucy, The Addams Family, and Jeopardy!, as well as a scores of films including The Karate Kid, When Harry Met Sally..., The Player and Hell’s Angels. Sunset Las Palmas Studios offers 12 stages, with a mix of single camera and multi-camera productions. The primary focus is production requiring multi-camera stages and control rooms, with notable current tenants including Comedy Central, ABC and The Walt Disney Company.
ITEM 3. Legal Proceedings
From time to time, we are a party to various lawsuits, claims and other legal proceedings arising out of, or incident to, our ordinary course of business. We are not currently a party, as plaintiff or defendant, to any legal proceedings that we believe to be material or that, individually or in the aggregate, would be expected to have a material adverse effect on our business, financial condition, results of operations or cash flows if determined adversely to us.
ITEM 4. Mine Safety Disclosures
Not applicable.
37
PART II
ITEM 5. Market for Hudson Pacific Properties, Inc. Common Equity, Related Stockholder Matters and Issuer Purchases of Equity Securities
Overview
As of February 9, 2018, Hudson Pacific Properties, Inc. had approximately 156,679,052 shares of common stock outstanding, including unvested restricted stock grants. Hudson Pacific Properties, Inc. common stock has traded on the NYSE under the symbol “HPP” since June 24, 2010. The quarterly high, low and closing prices of our common stock from January 1, 2016 through December 31, 2017, as reported by the NYSE, are set forth below for the periods indicated.
Distributions
We intend to make distributions each taxable year (not including a return of capital for federal income tax purposes) equal to at least 90% of our taxable income. We intend to pay regular quarterly dividend distributions to our stockholders. Currently, we pay distributions to our stockholders quarterly in March, June, September and December. Dividends are made to those stockholders who are stockholders as of the dividend record date. Dividends are paid at the discretion of our board of directors and dividend amounts depend on our available cash flows, financial condition and capital requirements, the annual distribution requirements under the REIT provisions of the Code and such other factors as our board of directors deem relevant.
On December 31, 2017, the reported closing sale price per share of our common stock on the NYSE was $34.25. The following table shows our dividends declared, and the high, low and closing sale prices for our common stock as reported by the NYSE for the periods indicated:
Fiscal year 2017 | High | Low | Close | Per Share of Common Stock Dividends Declared | ||||||||||||
First quarter | $ | 36.75 | $ | 33.48 | $ | 34.64 | $ | 0.25 | ||||||||
Second quarter | 36.14 | 32.41 | 34.19 | 0.25 | ||||||||||||
Third quarter | 34.54 | 31.53 | 33.53 | 0.25 | ||||||||||||
Fourth quarter | 35.90 | 32.94 | 34.25 | 0.25 | ||||||||||||
Fiscal year 2016 | High | Low | Close | Per Share of Common Stock Dividends Declared | ||||||||||||
First quarter | $ | 29.60 | $ | 22.77 | $ | 28.92 | $ | 0.20 | ||||||||
Second quarter | 30.18 | 26.79 | 29.18 | 0.20 | ||||||||||||
Third quarter | 34.38 | 28.85 | 32.87 | 0.20 | ||||||||||||
Fourth quarter | 35.84 | 31.58 | 34.78 | 0.20 | ||||||||||||
The closing sale price for our common stock on February 9, 2018, as reported by the NYSE, was $29.21. As of February 9, 2018, there were 68 stockholders of record of our common stock.
Issuer Purchases of Equity Securities
During the three months ended December 31, 2017, certain employees surrendered common shares owned by them to satisfy their statutory federal income tax obligation associated with the vesting of restricted common shares of beneficial interest issued under our 2010 Incentive Award Plan.
38
The following table summarizes all of the repurchases of Hudson Pacific Properties, Inc. equity securities during the fourth quarter of 2017:
Period | Total Number of Shares Purchased | Average Price Paid Per Share(1) | Total Number Of Shares Purchased As Part Of Publicly Announced Plans Or Programs | Maximum Number Of Shares That May Yet Be Purchased Under The Plans Or Programs | |||||||
October 1 - October 31, 2017 | — | $ | — | N/A | N/A | ||||||
November 1 - November 30, 2017 | — | — | N/A | N/A | |||||||
December 1 - December 31, 2017 | 343,127 | 34.25 | N/A | N/A | |||||||
Total | 343,127 | $ | 34.25 | N/A | N/A | ||||||
_____________
(1) | The price paid per share is based on the closing price of our common stock, as reported by the NYSE, as of the date of the determination of the statutory federal tax income. |
Equity Compensation Plan Information
Our equity compensation plan information required by this item is incorporated by reference to the information in Part III, Item 12 “Security Ownership of Certain Beneficial Owners and Management and Related Stockholder Matters” of this Annual Report on Form 10-K.
39
Market for Hudson Pacific Properties, L.P. Common Capital, Related Unitholder Matters and Issuer Purchases of Units
There is no established public trading market for our operating partnership’s common units. As of February 9, 2018, there were six holders of record of common units (including through our general partnership interest).
As of February 9, 2018, our operating partnership had 569,045 common units outstanding that were not owned by us. There is no active trading market for our operating partnership units.
The following table reports the distributions per common unit declared during the years ended December 31, 2017 and 2016, respectively.
Fiscal year 2017 | Per Unit Distributions Declared | |||
First quarter | $ | 0.25 | ||
Second quarter | 0.25 | |||
Third quarter | 0.25 | |||
Fourth quarter | 0.25 | |||
Fiscal year 2016 | Per Unit Distributions Declared | |||
First quarter | $ | 0.20 | ||
Second quarter | 0.20 | |||
Third quarter | 0.20 | |||
Fourth quarter | 0.20 | |||
Recent Sales of Unregistered Securities
During the fourth quarter of December 31, 2017, our operating partnership issued partnership units in private placements in reliance on the exemption from registration provided by Section 4(a)(2) of the Securities Act, in the amounts and for the consideration set forth below:
During the fourth quarter of December 31, 2017, the Company issued an aggregate of 642,835 shares of its common stock in connection with restricted stock awards for no cash consideration, out of which 343,127 shares of common stock were forfeited to the Company in connection with restricted stock awards for a net issuance of 299,708 shares of common stock. For each share of common stock issued by the Company in connection with such an award, our operating partnership issued a restricted common unit to the Company as provided in our operating partnership’s partnership agreement. During the fourth quarter of December 31, 2017, our operating partnership issued an aggregate of 642,835 common units to the Company.
All other issuances of unregistered equity securities of our operating partnership during the year ended December 31, 2017 have previously been disclosed in filings with the SEC. For all issuances of units to the Company, our operating partnership relied on the Company’s status as a publicly traded NYSE-listed company with over $6.62 billion in total consolidated assets and as our operating partnership’s majority owner and sole general partner as the basis for the exemption under Section 4(a)(2) of the Securities Act.
40
Issuer Purchases of Equity Securities
The following table summarizes all of the repurchases of operating partnership equity securities during the fourth quarter of 2017:
Period | Total Number of Units Purchased | Average Price Paid Per Unit(1) | Total Number Of Units Purchased As Part Of Publicly Announced Plans Or Programs | Maximum Number Of Units That May Yet Be Purchased Under The Plans Or Programs | |||||||
October 1 - October 31, 2017 | — | $ | — | N/A | N/A | ||||||
November 1 - November 30, 2017 | — | — | N/A | N/A | |||||||
December 1 - December 31, 2017 | 343,127 | 34.25 | N/A | N/A | |||||||
Total | 343,127 | $ | 34.25 | N/A | N/A | ||||||
_____________
(1) | The price paid per unit is based on the closing price of our common stock, as reported by the NYSE, as of the date of the determination of the statutory federal tax income. |
Equity Compensation Plan Information
Our equity compensation plan information required by this item is incorporated by reference to the information in Part III, Item 12 “Security Ownership of Certain Beneficial Owners and Management and Related Stockholder Matters” of this Annual Report on Form 10-K.
41
Stock Performance Graph
The information below shall not be deemed to be “soliciting material” or to be “filed” with the SEC or subject to Regulation 14A or 14C, other than as provided in Item 201 of Regulation S-K, or to the liabilities of Section 18 of the Exchange Act, except to the extent we specifically request that such information be treated as soliciting material or specifically incorporate it by reference into a filing under the Securities Act or the Exchange Act.
The following graph shows our cumulative total stockholder return for the five-year period ending on December 31, 2017. The graph assumes a $100 investment in each of the indices on December 31, 2012 and the reinvestment of all dividends. The graph also shows the cumulative total returns of the Standard & Poor’s 500 Stock Index (“S&P 500”), and industry peer groups. Our stock price performance shown in the following graph is not indicative of future stock price performance.
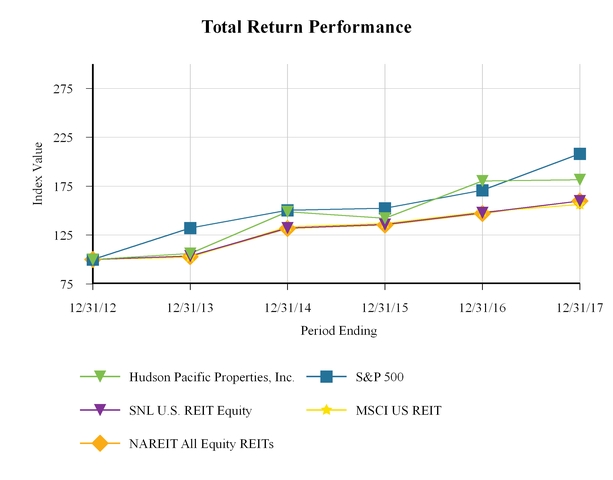
Period Ending | ||||||||||||||||||
Index | 12/31/12 | 12/31/13 | 12/31/14 | 12/31/15 | 12/31/16 | 12/31/17 | ||||||||||||
Hudson Pacific Properties, Inc. | 100.00 | 106.28 | 148.97 | 142.18 | 180.37 | 181.58 | ||||||||||||
S&P 500 | 100.00 | 132.39 | 150.51 | 152.59 | 170.84 | 208.14 | ||||||||||||
SNL U.S. REIT Equity | 100.00 | 103.72 | 132.24 | 135.89 | 147.96 | 159.94 | ||||||||||||
MSCI US REIT | 100.00 | 102.47 | 133.60 | 136.97 | 148.75 | 156.29 | ||||||||||||
NAREIT All Equity REITs | 100.00 | 102.86 | 131.69 | 135.42 | 147.11 | 159.86 | ||||||||||||
42
ITEM 6. Selected Financial Data
The following tables set forth selected consolidated financial and operating data. The financial information has been derived from our historical Consolidated Balance Sheets, Statements of Operations, and Statements of Cash Flows and is adjusted for the impact of subsequent accounting changes that require retrospective applications, if any. The following data should be read in conjunction with our financial statements and the related notes, see Part IV, Item 15(a) and Item 7, “Management’s Discussion and Analysis of Financial Condition and Results of Operations” included below in this report.
HUDSON PACIFIC PROPERTIES, INC. and HUDSON PACIFIC PROPERTIES, L.P. (in thousands) | ||||||||||||||
Year Ended December 31, | ||||||||||||||
2017 | 2016 | 2015 | 2014 | 2013 | ||||||||||
Statements of Operations Data: | ||||||||||||||
Total Office revenues | 667,110 | 593,236 | 481,718 | 213,786 | 165,441 | |||||||||
Total Media & Entertainment revenues | 61,029 | 46,403 | 39,132 | 39,629 | 40,117 | |||||||||
Income from operations | 136,603 | 89,407 | 47,388 | 48,677 | 27,960 | |||||||||
HUDSON PACIFIC PROPERTIES, INC. | |||||||||||||||||||
Year Ended December 31, | |||||||||||||||||||
2017 | 2016 | 2015 | 2014 | 2013 | |||||||||||||||
Basic and diluted per share amounts: | |||||||||||||||||||
Net income (loss) attributable to common stockholders—basic | $ | 0.44 | $ | 0.26 | $ | (0.19 | ) | $ | 0.15 | $ | (0.27 | ) | |||||||
Net income (loss) attributable to common stockholders—diluted | $ | 0.44 | $ | 0.25 | $ | (0.19 | ) | $ | 0.15 | $ | (0.27 | ) | |||||||
Weighted average shares of common stock outstanding—basic | 153,488,730 | 106,188,902 | 85,927,216 | 65,792,447 | 55,182,647 | ||||||||||||||
Weighted average shares of common stock outstanding—diluted | 153,882,814 | 110,369,055 | 85,927,216 | 66,509,447 | 55,182,647 | ||||||||||||||
Dividends declared per common share | $ | 1.000 | $ | 0.800 | $ | 0.575 | $ | 0.500 | $ | 0.500 | |||||||||
43
HUDSON PACIFIC PROPERTIES, INC. and HUDSON PACIFIC PROPERTIES, L.P. (in thousands) | ||||||||||||||||||||
As of December 31, | ||||||||||||||||||||
2017 | 2016 | 2015 | 2014 | 2013 | ||||||||||||||||
Balance Sheet Data:(1) | ||||||||||||||||||||
Investment in real estate, net | $ | 5,889,943 | $ | 6,050,933 | $ | 5,500,462 | $ | 2,036,638 | $ | 1,918,988 | ||||||||||
Total assets | 6,622,070 | 6,678,998 | 6,254,035 | 2,335,509 | 2,124,904 | |||||||||||||||
Notes payable, net | 2,421,380 | 2,688,010 | 2,260,716 | 912,683 | 924,938 | |||||||||||||||
Total liabilities | 2,700,929 | 2,966,071 | 2,514,821 | 1,050,317 | 1,011,563 | |||||||||||||||
6.25% Series A cumulative redeemable preferred units of the operating partnership | 10,177 | 10,177 | 10,177 | 10,177 | 10,475 | |||||||||||||||
Series B cumulative redeemable preferred stock | — | — | — | 145,000 | 145,000 | |||||||||||||||
Other data: | ||||||||||||||||||||
Cash flows provided by (used in) | ||||||||||||||||||||
Operating activities | $ | 292,959 | $ | 226,774 | $ | 175,783 | $ | 63,483 | $ | 43,975 | ||||||||||
Investing activities | $ | (333,038 | ) | $ | (524,897 | ) | $ | (1,797,699 | ) | $ | (246,361 | ) | $ | (424,042 | ) | |||||
Financing activities | $ | 33,167 | $ | 334,754 | $ | 1,658,641 | $ | 170,590 | $ | 393,947 | ||||||||||
Stabilized office properties leased rate as of end of period(2) | 96.7 | % | 96.4 | % | 95.3 | % | 94.6 | % | 95.4 | % | ||||||||||
In-Service office properties leased rate as of end of period(3) | 92.1 | % | 91.2 | % | 90.1 | % | N/A | N/A | ||||||||||||
Same-Store Media & Entertainment occupied rate as of end of period(4) | 90.7 | % | 89.1 | % | 78.5 | % | 71.6 | % | 69.9 | % | ||||||||||
Non-Same-Store Media & Entertainment occupied rate as of end of period(5) | 76.1 | % | N/A | N/A | N/A | N/A | ||||||||||||||
_____________
(1) | These balances are presented as stated in their respective Form 10-Ks, with the exception of subsequent accounting changes that require retrospective applications. |
(2) | Stabilized office properties include Same-Store and Non-Same-Store properties. |
(3) | In-service office properties include stabilized and lease-up office properties. |
(4) | Percent leased for Same-Store Media and Entertainment properties is the average percent leased for the 12 months ended December 31, 2017. |
(5) | Percent leased for Non-Same-Store Media and Entertainment properties is the average percent leased for the eight months ended December 31, 2017. |
44
ITEM 7. Management’s Discussion and Analysis of Financial Condition and Results of Operations
The following discussion relates to our consolidated financial statements and should be read in conjunction with the consolidated financial statements and the related notes, see Part IV, Item 15(a) “Financial Statements and Schedules.” Statements in this Item 7 contain forward-looking statements. Such statements are subject to risks, uncertainties and assumptions and may be affected by known and unknown risks, trends, uncertainties and factors that are beyond our control. Should one or more of these risks or uncertainties materialize, or should underlying assumptions prove incorrect, actual results may vary materially from those anticipated, estimated or projected. In particular, information concerning projected future occupancy rates, rental rate increases, property development timing and investment amounts contain forward-looking statements. Furthermore, all of the statements regarding future financial performance (including anticipated funds from operations (“FFO”) market conditions and demographics) are forward-looking statements. Numerous factors will affect our actual results, some of which are beyond our control. These include the breadth and duration of the current economic recession and its impact on our tenants, the strength of commercial and industrial real estate markets, market conditions affecting tenants, competitive market conditions, interest rate levels, volatility in our stock price and capital market conditions. Accordingly, investors should use caution and not place undue reliance on this information, which speaks only as of the date of this report. We expressly disclaim any responsibility to update any forward-looking information, whether as a result of new information, future events, or otherwise, except to the extent we are required to do so in connection with our ongoing requirements under federal securities laws to disclose material information.
For a discussion of important risks related to our business, and related to investing in our securities, including risks that could cause actual results and events to differ materially from results and events referred to in the forward-looking statements see Part I, Item 1A “Risk Factors.” In light of these risks, uncertainties and assumptions, the forward-looking events discussed in this report might not occur.
Executive Summary
Through our interest in Hudson Pacific Properties, L.P. (our operating partnership) and its subsidiaries, at December 31, 2017, our consolidated office portfolio consisted of approximately 13.3 million square feet of in-service, redevelopment, development and held for sale properties. Additionally, as of December 31, 2017, our media and entertainment portfolio consisted of 1.2 million square feet of in-service and redevelopment properties.
As of December 31, 2017, our consolidated in-service office portfolio was 92.1% leased (including leases not yet commenced). Our Same-Store media and entertainment properties were 90.7% leased for the average percent leased for the 12 months ended December 31, 2017. Our Non-Same-Store media and entertainment property was 76.1% leased for the average percent leased for the eight months ended December 31, 2017.
Current Year Highlights
Acquisitions
During 2017, we continued to focus on strategic acquisitions by investing across the risk-return spectrum, favoring opportunities where we can employ leasing, capital investments and management expertise to create additional value. We purchased Sunset Las Palmas Studios (formerly Hollywood Center Studios), a 373,150 square-foot media and entertainment campus with future development rights consisting of 13 stages, production offices and support space on 15 acres. Additionally, we purchased the ground lease related to our 11601 Wilshire property. The following table summarizes the properties acquired in 2017:
Property | Submarket | Month of Acquisition | Square Feet | Purchase Price(1) (in millions) | |||||||
Sunset Las Palmas Studios(2) | Hollywood | May 2017 | 369,000 | $ | 200.0 | ||||||
11601 Wilshire land(3) | West Los Angeles | June 2017 | N/A | 50.0 | |||||||
6666 Santa Monica(4) | Hollywood | June 2017 | 4,150 | 3.2 | |||||||
Total | 373,150 | $ | 253.2 | ||||||||
_____________
45
(1) | Represents purchase price before certain credits, prorations and closing costs. |
(2) | The purchase price above does not include equipment purchased by us for $2.8 million, which was transacted separately from the studio acquisition. In April 2017, we drew $150.0 million under the unsecured revolving credit facility to fund the acquisition. |
(3) | On July 1, 2016, we purchased a partial interest in land held as a tenancy in common in conjunction with our acquisition of the 11601 Wilshire property. The land interest held as a tenancy in common was accounted for as an equity method investment. On June 15, 2017, we purchased the remaining interest, which was fair valued and allocated to land and building. |
(4) | This parcel is adjacent to the Sunset Las Palmas Studios property. |
Dispositions
We disposed of four office properties during 2017 that were non-strategic assets in our portfolio. These dispositions resulted in $45.6 million of gains. The following table summarizes the properties sold in 2017:
Property | Month of Disposition | Square Feet | Sales Price(1) (in millions) | ||||||
222 Kearny | February 2017 | 148,797 | $ | 51.8 | |||||
3402 Pico | March 2017 | 50,687 | 35.0 | ||||||
Pinnacle I and Pinnacle II(2) | November 2017 | 623,777 | 350.0 | ||||||
Total | 823,261 | $ | 436.8 | ||||||
_____________
(1) | Represents gross sales price before certain credits, prorations and closing costs. |
(2) | The consolidated joint venture that owned Pinnacle I and Pinnacle II sold the properties to affiliates of Blackstone. In conjunction with the sale, the $216.0 million debt secured by these properties was assumed by the purchasers. |
Held for Sale
As of December 31, 2017, we had four properties that met the criteria to be classified as held for sale. The following table summarizes properties classified as held for sale as of December 31, 2017:
Property | Purchase and Sale Executed | Square Feet | Sales Price(1) (in millions) | ||||||
2180 Sand Hill | November 2017 | 45,613 | $ | 82.5 | |||||
2600 Campus Drive (building 6 of Peninsula Office Park) | December 2017 | 63,050 | 22.5 | ||||||
Embarcadero Place | December 2017 | 197,402 | 136.0 | ||||||
9300 Wilshire | December 2017 | 61,422 | 13.8 | ||||||
Total | 367,487 | $ | 254.8 | ||||||
____________
(1) | Represents gross sales price before certain credits, prorations and closing costs. |
Redevelopment/Development
Properties are selected for redevelopment when we believe the result of doing so will render a higher economic return. We may engage in the development or redevelopment of office properties when market conditions support a favorable risk-adjusted return. A redevelopment can consist of a range of improvements to a property, and may constitute a complete structural renovation of a building or remodeling select areas to make the property more attractive to tenants. Redevelopment and development properties are excluded from our in-service portfolio to maintain consistency in evaluating our performance from period to period. The redevelopment and development process is generally capital-intensive and occurs over the course of several months or years. Commonly associated with newly-acquired properties, redevelopment efforts may also occur at properties we currently own. At December 31, 2017, there were a total of four properties included in property under development in our Consolidated Balance Sheets: 95 Jackson (formerly Merrill Place Theater Building), MaxWell, CUE and EPIC.
Financings
In January 2017, we completed an underwritten public offering of 8,881,575 shares of common stock for total proceeds, net of transaction costs, of approximately $310.9 million. Proceeds were used to repurchase 8,881,575 common units in the operating partnership from Blackstone and Farallon Capital Management, LLC (“the Farallon Funds”).
46
In March 2017, we completed an underwritten public offering of 9,775,000 shares of common stock for total proceeds, net of transaction costs, of approximately $337.5 million. Proceeds from the offering were used to fully repay a $255.0 million balance outstanding under our unsecured revolving credit facility and for our acquisition of Sunset Las Palmas.
In October 2017, we completed our inaugural public offering of $400.0 million registered senior notes due November 1, 2027. The net proceeds from the offering, after deducting the underwriting discounts and offering expenses, were approximately $396.7 million and were used to repay $150.0 million of our 5-year term loan due April 2020 with the remainder of the net proceeds, together with cash on hand, used to repay $250.0 million outstanding under our unsecured revolving credit facility.
In November 2017, the consolidated joint venture that owned Pinnacle I and Pinnacle II sold the properties to affiliates of Blackstone for $350.0 million. In conjunction with the sale, the $216.0 million debt secured by these properties was assumed by the purchasers. Additionally, we used proceeds from the sale and cash on hand to repay $100.0 million of our 5-year term loan due November 2020.
Factors That May Influence Our Operating Results
Business and Strategy
We invest in Class-A office and media and entertainment properties located in high barrier-to-entry, innovation-centric submarkets with significant growth potential. Our positioning within these submarkets allows us to attract and retain quality growth companies as tenants, many of which are in the technology and media and entertainment sectors. The purchase of properties with a value-add component, typically through off-market transactions, also facilitates our growth. These types of assets afford us the opportunity to capture embedded rent growth and occupancy upside, and to strategically invest capital to reposition and redevelop assets to generate additional cash flow. We take a more measured approach to ground-up development, with most under-construction, planned or potential projects located on ancillary sites part of existing operating assets. Management expertise across disciplines supports execution at all levels of our operations. In particular, aggressive leasing and proactive asset management, combined with a focus on conservatively managing our balance sheet, are central to our strategy.
Rental Revenue
The amount of net rental revenue generated by the properties in our portfolio depends principally on our ability to maintain the occupancy rates of currently leased space and to lease currently available space and space that becomes available from lease terminations. As of December 31, 2017, the percent leased for our in-service office properties was approximately 92.1% (or 90.3%, excluding leases signed but not commenced as of that date). As of December 31, 2017, the percent leased, based on a 12-month trailing average, was approximately 90.7% and 76.1% for same-store media and entertainment and non-same-store media and entertainment properties, respectively. The amount of rental revenue generated by us also depends on our ability to maintain or increase rental rates at our properties. We believe that the average rental rates for our office properties are generally below the current average quoted market rate. We believe the average rental rates for our media and entertainment properties are generally equal to current average quoted market rates. Negative trends in one or more of these factors could adversely affect our rental revenue in future periods. Future economic downturns or regional downturns affecting our submarkets or downturns in our tenants’ industries that impair our ability to renew or re-let space and the ability of our tenants to fulfill their lease commitments, as in the case of tenant bankruptcies, could adversely affect our ability to maintain or increase rental rates at our properties. In addition, growth in rental revenue will also partially depend on our ability to acquire additional properties that meet our investment criteria.
Conditions in Our Markets
The properties in our portfolio are all located in Northern and Southern California and the Pacific Northwest. Positive or negative changes in economic or other conditions in Northern and Southern California or the Pacific Northwest, including state budgetary shortfalls, employment rates, natural hazards and other factors, may impact our overall performance.
47
Operating Expenses
Our operating expenses generally consist of utilities, property and ad valorem taxes, insurance and site maintenance costs. Increases in these expenses over tenants’ base years are generally passed on to tenants in our full-service gross leased properties and are generally paid in full by tenants in our net lease properties. Certain of our properties have been reassessed for property tax purposes as a result of our IPO or their subsequent acquisition and other reassessments remain pending. In the case of completed reassessments, the amount of property taxes we pay reflects the valuations established with the county assessors for the relevant locations of each property as of IPO or their subsequent acquisition. With respect to pending reassessments, we similarly expect the amount of property taxes we pay to reflect the valuations established with such county assessors.
Taxable REIT Subsidiary
Hudson Pacific Services, Inc., or our services company, is a Maryland corporation that is wholly owned by our operating partnership. We have elected, together with our services company, to treat our services company as a taxable REIT subsidiary for federal income tax purposes, and we may form additional taxable REIT subsidiaries in the future. Our services company generally may provide both customary and non-customary services to our tenants and engage in other activities that we may not engage in directly without adversely affecting our qualification as a REIT. Our services company and its wholly owned subsidiaries provide a number of services to certain tenants at our media and entertainment properties and, from time to time, one or more taxable REIT subsidiaries may provide services to our tenants at these and other properties. In addition, our operating partnership has contributed some or all of its interests in certain wholly owned subsidiaries or their assets to our services company. We currently lease space to wholly owned subsidiaries of our services company at our media and entertainment properties and may, from time to time, enter into additional leases with one or more taxable REIT subsidiaries. Any income earned by our taxable REIT subsidiaries will not be included in our taxable income for purposes of the 75% or 95% gross income tests, except to the extent such income is distributed to us as a dividend, in which case such dividend income will qualify under the 95%, but not the 75%, gross income test. Because a taxable REIT subsidiary is subject to federal income tax, and state and local income tax (where applicable), as a regular C corporation, the income earned by our taxable REIT subsidiaries generally will be subject to an additional level of tax as compared to the income earned by our other subsidiaries.
Critical Accounting Policies
The preparation of financial statements in conformity with GAAP requires management to make estimates and assumptions that affect the reported amounts of assets and liabilities and disclosure of commitments and contingencies as of the date of the financial statements and the reported amounts of revenues and expenses during the reporting period. On an ongoing basis, we evaluate our estimates, including those related to acquiring, developing and assessing the carrying values of our real estate properties, our accrued liabilities, and our performance-based equity compensation awards. We base our estimates on historical experience, current market conditions, and various other assumptions that are believed to be reasonable under the circumstances. Actual results could materially differ from these estimates. The following critical accounting policies discussion reflect what we believe are the most significant estimates, assumptions and judgements used in the preparation of our consolidated financial statements. See Part IV, Item 15 “Financial Statement and Schedules—Note 2 to the Consolidated Financial Statements—Summary of Significant Accounting Policies” for details on our significant accounting policies.
Investment in Real Estate Properties
Acquisitions
Our acquisitions are accounted for using the acquisition method. The results of operations for each of these acquisitions are included in our Consolidated Statements of Operations from the date of acquisition.
During the fourth quarter of 2016 we early adopted ASU 2017-01, Business Combinations (Topic 805): Clarifying the Definition of a Business (“ASU 2017-01”), which changes the definition of a business. Acquisitions of integrated sets of assets and activities that do not meet the definition of a business are accounted for as an asset acquisition.
We evaluate each acquisition of real estate to determine if the integrated set of assets and activities acquired meet the definition of a business and need to be accounted for as a business combination in accordance with ASC 805, Business Combinations. An integrated set of assets and activities would fail to qualify as a business if either (i) substantially all of the fair value of the gross assets acquired is concentrated in either a single identifiable asset or a group of similar identifiable assets or (ii) the integrated set of assets and activities is lacking, at a minimum, an input and a substantive process that together significantly contribute to the ability to create outputs (i.e., revenue generated before and after the transaction). An acquired process is considered substantive if (i) the process includes an organized workforce (or includes an acquired contract that
48
provides access to an organized workforce), that is skilled, knowledgeable, and experienced in performing the process, (ii) the process cannot be replaced without significant cost, effort, or delay or (iii) the process is considered unique or scarce.
Acquisitions of real estate will generally not meet the revised definition of a business because substantially all of the fair value is concentrated in a single identifiable asset or group of similar identifiable assets (i.e., land, buildings and improvements and related intangible assets or liabilities) or because the acquisition does not include a substantive process in the form of an acquired workforce or an acquired contract that cannot be replaced without significant cost, effort or delay.
When we acquire properties that are considered asset acquisitions, the purchase price, which includes transaction-related expenses, is allocated based on relative fair value of the assets acquired and liabilities assumed. Assets acquired and liabilities assumed include, but are not limited to, land, building and improvements, intangible assets related to above-and below-market leases, intangible assets related to in-place leases, debt and other assumed assets and liabilities. The purchase price accounting is finalized in the period of acquisition.
The fair value of tangible assets of an acquired property considers the value of the property as if it was vacant. The fair value of acquired “above- and below-” market leases are based on the estimated cash flow projections utilizing discount rates that reflect the risks associated with the leases acquired. The amount recorded is based on the present value of the difference between (i) the contractual amounts to be paid pursuant to each in-place lease and (ii) management’s estimate of fair market lease rates for each in-place lease, measured over a period equal to the remaining term of the lease for above-market leases and the initial term plus the extended below-market term for any leases with below-market renewal options. Other intangible assets acquired include amounts for in-place lease values that are based on our evaluation of the specific characteristics of each tenant’s lease. Factors considered include estimates of carrying costs during hypothetical expected lease-up periods, market conditions and costs to execute similar leases. In estimating carrying costs, we include estimates of lost rents at market rates during the hypothetical expected lease-up periods, which are dependent on local market conditions. In estimating costs to execute similar leases, we consider leasing commissions, legal and other related costs.
Cost Capitalization
We capitalize direct construction and development costs, including predevelopment costs, interest, property taxes, insurance and other costs directly related and essential to the acquisition, development or construction of a real estate project. Indirect development costs, including salaries and benefits, office rent, and associated costs for those individuals directly responsible for and who spend their time on development activities are also capitalized and allocated to the projects to which they relate. Construction and development costs are capitalized while substantial activities are ongoing to prepare an asset for its intended use. We consider a construction project as substantially complete and held available for occupancy upon the completion of tenant improvements but no later than one year after cessation of major construction activity. Costs incurred after a project is substantially complete and ready for its intended use, or after development activities have ceased, are expensed as they are incurred. Costs previously capitalized related to abandoned acquisitions or developments are charged to earnings. Expenditures for repairs and maintenance are expensed as they are incurred.
Operating Properties
The properties are generally carried at cost less accumulated depreciation and amortization. We compute depreciation and amortization using the straight-line method over the estimated useful lives of the assets as represented in the table below:
Asset Description | Estimated useful life (years) | |
Building and improvements | Shorter of the ground lease term or 39 | |
Land improvements | 15 | |
Furniture and fixtures | 5 to 7 | |
Tenant improvements | Shorter of the estimated useful life or the lease term | |
We amortize above- and below-market lease intangibles over the remaining non-cancellable lease terms and bargain renewal periods, if applicable. The in-place lease intangibles are amortized over the remaining non-cancellable lease term. When tenants vacate prior to the expiration of their lease, the amortization of intangible assets and liabilities is accelerated. We amortize above- and below-market ground lease intangibles over the remaining non-cancellable lease terms.
49
Impairment of Long-Lived Assets
We assess the carrying value of real estate assets and related intangibles for impairment on a quarterly basis and whenever events or changes in circumstances indicate that the carrying amount of an asset or asset group may not be recoverable in accordance with generally accepted accounting principles in the United States (“GAAP”). Impairment losses are recorded on real estate assets held for investment when indicators of impairment are present and the future undiscounted cash flows estimated to be generated by those assets are less than the assets’ carrying amount. We recognize impairment losses to the extent the carrying amount exceeds the fair value of the properties.
Allowance for Doubtful Accounts
We maintain an allowance for doubtful accounts for estimated losses resulting from tenant defaults or the inability of tenants to make contractual rent and tenant recovery payments. We monitor the liquidity and creditworthiness of our tenants and operators on an ongoing basis. This evaluation considers industry and economic conditions, property performance, credit enhancements and other factors. We evaluate the collectability of accounts receivable based on a combination of factors. The allowance for doubtful accounts is based on specific identification of uncollectible accounts and our historical collection experience. We recognize an allowance for doubtful accounts based on the length of time the receivables are past due, the current business environment and our historical experience. Historical experience has been within management’s expectations. For straight-line rent amounts, our assessment is based on amounts estimated to be recoverable over the term of the lease. We evaluate the collectability of straight-line rent receivables based on length of time the related rental receivables are past due, the current business environment and historical experience.
Revenue Recognition
We recognize rental revenue from tenants on a straight-line basis over the lease term when collectability is reasonably assured and the tenant has taken possession or controls the physical use of the leased asset. If the lease provides for tenant improvements, we determine whether the tenant improvements, for accounting purposes, are owned by the tenant or us. When we are the owner of the tenant improvements, the tenant is not considered to have taken physical possession or have control of the physical use of the leased asset until the tenant improvements are substantially completed. When the tenant is the owner of the tenant improvements, any tenant improvement allowance that is funded is treated as a lease incentive and amortized as a reduction of revenue over the lease term. Tenant improvement ownership is determined based on various factors including, but not limited to:
• | whether the lease stipulates how and on what a tenant improvement allowance may be spent; |
• | whether the tenant or landlord retains legal title to the improvements at the end of the lease term; |
• | whether the tenant improvements are unique to the tenant or general-purpose in nature; and |
• | whether the tenant improvements are expected to have any residual value at the end of the lease. |
Certain leases provide for additional rents contingent upon a percentage of the tenant’s revenue in excess of specified base amounts or other thresholds. Such revenue is recognized when actual results reported by the tenant, or estimates of tenant results, exceed the base amount or other thresholds. Such revenue is recognized only after the contingency has been removed (when the related thresholds are achieved), which may result in the recognition of rental revenue in periods subsequent to when such payments are received.
Other property-related revenue is revenue that is derived from the tenants’ use of lighting, equipment rental, parking, power, HVAC and telecommunications (telephone and internet). Other property-related revenue is recognized when these items are provided.
Tenant recoveries related to reimbursement of real estate taxes, insurance, repairs and maintenance, and other operating expenses are recognized as revenue in the period during which the applicable expenses are incurred. The reimbursements are recognized and presented gross, as we are generally the primary obligor with respect to purchasing goods and services from third-party suppliers, have discretion in selecting the supplier and bear the associated credit risk.
We recognize gains on sales of properties upon the closing of the transaction with the purchaser. Gains on properties sold are recognized using the full accrual method when (i) the collectability of the sales price is reasonably assured, (ii) we are not obligated to perform significant activities after the sale, (iii) the initial investment from the buyer is sufficient and (iv) other
50
profit recognition criteria have been satisfied. Gains on sales of properties may be deferred in whole or in part until the requirements for gain recognition have been met.
The new standard related to revenue recognition does not have a material impact on our consolidated financial statements. See Part IV, Item 15 “Financial Statement and Schedules—Note 2 to the Consolidated Financial Statements—Summary of Significant Accounting Policies.”
Stock-Based Compensation
Compensation cost of restricted stock, restricted stock units and performance units under our equity incentive award plans are accounted for under ASC 718, Compensation-Stock Compensation (“ASC 718”). For time-based awards, stock-based compensation is valued based on the quoted closing price of our common stock on the applicable grant date and discounted for any hold restrictions. For performance-based awards, stock-based compensation is valued utilizing a Monte Carlo Simulation to estimate the probability of the performance vesting conditions being satisfied.
The stock-based compensation is amortized through the final vesting period on a straight-line basis and graded vesting basis for time-based awards and performance-based awards, respectively. Pursuant to the adoption of ASU 2016-09, we account for forfeitures of awards as they occur.
Our compensation committee will regularly consider the accounting implications of significant compensation decisions, especially in connection with decisions that relate to our equity incentive award plans and programs.
Income Taxes
Our property-owning subsidiaries are limited liability companies and are treated as pass-through entities or disregarded entities (or, in the case of the entities that own the 1455 Market and Hill7 properties, REITs) for federal income tax purposes. Accordingly, no provision has been made for federal income taxes in the accompanying consolidated financial statements for the activities of these entities.
We have elected to be taxed as a REIT under the Code commencing with our taxable year ended December 31, 2010. We believe that we have operated in a manner that has allowed us to qualify as a REIT for federal income tax purposes commencing with such taxable year, and we intend to continue operating in such manner. To qualify as a REIT, we are required to distribute at least 90% of our net taxable income, excluding net capital gains, to our stockholders and meet the various other requirements imposed by the Code relating to such matters as operating results, asset holdings, distribution levels and diversity of stock ownership.
Provided that we continue to qualify for taxation as a REIT, we are generally not subject to corporate level income tax on the earnings distributed currently to our stockholders. If we fail to qualify as a REIT in any taxable year, and are unable to avail ourselves of certain savings provisions set forth in the Code, all of our taxable income would be subject to federal corporate income tax, including any applicable alternative minimum tax for taxable years prior to 2018. Unless entitled to relief under specific statutory provisions, we would be ineligible to elect to be treated as a REIT for the four taxable years following the year for which we lose our qualification. It is not possible to state whether in all circumstances we would be entitled to this statutory relief.
We own and may acquire direct or indirect interests in one or more Subsidiary REITs. A Subsidiary REIT is subject to the various REIT qualification requirements and other limitations described herein that are applicable to us. If a Subsidiary REIT were to fail to qualify as a REIT, then (i) that Subsidiary REIT would become subject to federal income tax, (ii) shares in such REIT would cease to be qualifying assets for purposes of the asset tests applicable to REITs and (iii) it is possible that we would fail certain of the asset tests applicable to REITs, in which event we would fail to qualify as a REIT unless we could avail ourselves of certain relief provisions.
We believe that our operating partnership is properly treated as a partnership for federal income tax purposes. As a partnership, our operating partnership is not subject to federal income tax on its income. Instead, each of its partners, including us, is allocated, and may be required to pay tax with respect to, its share of our operating partnership’s income. As such, no provision for federal income taxes has been included for the operating partnership.
We have elected, together with one of our subsidiaries, to treat such subsidiary as a taxable REIT subsidiary (“TRS”) for federal income tax purposes. Certain activities that we may undertake, such as non-customary services for our tenants and
51
holding assets that we cannot hold directly, will be conducted by a TRS. A TRS is subject to federal and, where applicable, state and local income taxes on its net income.
We are subject to the statutory requirements of the states in which we conduct business.
We periodically evaluate our tax positions to determine whether it is more likely than not that such positions would be sustained upon examination by a tax authority for all open tax years, as defined by the statute of limitations, based on their technical merits. As of December 31, 2017, we have not established a liability for uncertain tax positions.
We and our TRS file income tax returns with the U.S. federal government and various state and local jurisdictions. We and our TRS are no longer subject to tax examinations by tax authorities for years prior to 2012. Generally, we have assessed our tax positions for all open years, which include 2012 to 2016, and concluded that there are no material uncertainties to be recognized.
52
Results of Operations
The following table identifies the properties in our portfolio as of December 31, 2017:
Properties | Acquisition Date | Acquisition/Estimated Rentable Square Feet | Consideration Paid (In thousands) | ||||||
Predecessor properties: | |||||||||
875 Howard | 2/15/2007 | 286,270 | $ | — | |||||
Sunset Gower Studios | 8/17/2007 | 545,673 | — | ||||||
Sunset Bronson Studios | 1/30/2008 | 308,026 | — | ||||||
6040 Sunset (formerly Technicolor Building)(1) | 8/17/2007 | 114,958 | — | ||||||
Properties acquired after IPO: | |||||||||
Del Amo | 8/13/2010 | 113,000 | 27,327 | ||||||
9300 Wilshire(2) | 8/24/2010 | 61,224 | 14,684 | ||||||
1455 Market(3) | 12/16/2010 | 1,025,833 | 92,365 | ||||||
Rincon Center | 12/16/2010 | 580,850 | 184,571 | ||||||
10950 Washington | 12/22/2010 | 159,024 | 46,409 | ||||||
604 Arizona | 7/26/2011 | 44,260 | 21,373 | ||||||
275 Brannan | 8/19/2011 | 54,673 | 12,370 | ||||||
625 Second | 9/1/2011 | 138,080 | 57,119 | ||||||
6922 Hollywood | 11/22/2011 | 205,523 | 92,802 | ||||||
6050 Sunset & 1445 N. Beachwood | 12/16/2011 | 20,032 | 6,502 | ||||||
10900 Washington | 4/5/2012 | 9,919 | 2,605 | ||||||
901 Market | 6/1/2012 | 206,199 | 90,871 | ||||||
Element LA (includes 1861 Bundy) | 9/5/2012 & 9/23/2013 | 284,037 | 99,936 | ||||||
1455 Gordon | 9/21/2012 | 5,921 | 2,385 | ||||||
3401 Exposition | 5/22/2013 | 63,376 | 25,722 | ||||||
Seattle Portfolio (83 King, 505 First, Met Park North and Northview Center) | 7/31/2013 | 844,980 | 368,389 | ||||||
Merrill Place | 2/12/2014 | 193,153 | 57,034 | ||||||
EOP Northern California Portfolio (see table on next page for property list) | 4/1/2015 | 7,120,686 | 3,489,541 | ||||||
Fourth & Traction(4) | 5/22/2015 | 120,937 | 49,250 | ||||||
MaxWell (formerly known as 405 Mateo)(5) | 8/17/2015 | 83,285 | 40,000 | ||||||
11601 Wilshire(6) | 7/1/2016 & 6/15/2017 | 500,475 | 361,000 | ||||||
Hill7(7) | 10/7/2016 | 285,680 | 179,800 | ||||||
Page Mill Hill | 12/12/2016 | 182,676 | 150,000 | ||||||
Sunset Las Palmas Studios (includes 6666 Santa Monica) | 5/1/2017 & 6/29/2017 | 373,150 | 203,200 | ||||||
Development Properties(8): | |||||||||
ICON(9) | N/A | 325,757 | N/A | ||||||
450 Alaskan(10) | N/A | 170,974 | N/A | ||||||
CUE(11) | N/A | 91,953 | N/A | ||||||
95 Jackson (formerly Merrill Place Theater Building)(12) | N/A | 31,659 | N/A | ||||||
EPIC(13) | N/A | 300,000 | N/A | ||||||
Total | 14,852,243 | $ | 5,675,255 | ||||||
_____________
(1) | We acquired this property in August 2007 and completed its development in June 2008. |
(2) | This property was classified as held for sale as of December 31, 2017 and the sale is expected to close during the first quarter of 2018. |
(3) | We have a 55% ownership interest in the consolidated joint venture that owns the 1455 Market property. |
(4) | This development was completed in the second quarter of 2017. |
(5) | We estimate this development will be completed in the fourth quarter of 2018 and stabilized in the second quarter of 2019. As a result of this development, the estimated rentable square footage increased to 99,090. |
(6) | We acquired the building and partial interest in the land on July 1, 2016 and acquired the remaining interest in the land on June 15, 2017. |
(7) | We have a 55% ownership interest in the consolidated joint venture that owns the Hill7 property. |
(8) | Properties that were related to acquisitions that were subsequently developed by us. |
53
(9) | The land related to this development was included in our acquisition of Sunset Bronson Studios. We completed this development in the fourth quarter of 2016. |
(10) | The land related to this development was included in our acquisition of Merrill Place. We completed this development in the third quarter of 2017. |
(11) | The land related to this development was included in our acquisition of Sunset Bronson Studios. We completed this development in the third quarter of 2017 and it is estimated to be stabilized in the second quarter of 2019. |
(12) | The land related to this development was included in our acquisition of Merrill Place. We estimate this development will be completed in the first quarter of 2018 and stabilized in the fourth quarter of 2018. |
(13) | The land related to this development was included in our acquisition of Sunset Bronson Studios. We estimate this development will be completed in the first quarter of 2020 and stabilized in the third quarter of 2021. |
The following table identifies each of the properties that we owned as of December 31, 2017 that were acquired as part of the EOP Acquisition:
Properties | Acquisition Square Feet | ||
1740 Technology | 206,876 | ||
2180 Sand Hill(1) | 45,613 | ||
333 Twin Dolphin | 182,789 | ||
3176 Porter (formerly Lockheed) | 42,899 | ||
3400 Hillview | 207,857 | ||
555 Twin Dolphin | 198,936 | ||
Campus Center | 471,580 | ||
Clocktower Square | 100,344 | ||
Concourse | 944,386 | ||
Embarcadero Place(1) | 197,402 | ||
Foothill Research Center | 195,376 | ||
Gateway | 609,093 | ||
Metro Center | 730,215 | ||
Metro Plaza | 456,921 | ||
Page Mill Center | 176,245 | ||
Palo Alto Square | 328,251 | ||
Peninsula Office Park(2) | 510,789 | ||
Shorebreeze | 230,932 | ||
Skyport Plaza | 418,086 | ||
Skyway Landing | 247,173 | ||
Techmart | 284,440 | ||
Towers at Shore Center | 334,483 | ||
Total | 7,120,686 | ||
_____________
(1) | These properties were classified as held for sale as of December 31, 2017. Embarcadero Place was sold on January 25, 2018. The sale of 2180 Sand Hill is expected to close during the first quarter of 2018. |
(2) | Building 6 of this property, 63,050 square feet, was classified as held for sale as of December 31, 2017 and subsequently sold on January 31, 2018. |
54
The following table identifies each of the properties that were disposed through December 31, 2017:
Property | Disposition Date | Square Feet | Sales Price(1) (in millions) | ||||||
City Plaza | 7/12/2013 | 333,922 | $ | 56.0 | |||||
Tierrasanta | 7/16/2014 | 112,300 | 19.5 | ||||||
First Financial | 3/6/2015 | 223,679 | 89.0 | ||||||
Bay Park Plaza | 9/29/2015 | 260,183 | 90.0 | ||||||
Bayhill Office Center | 1/14/2016 | 554,328 | 215.0 | ||||||
Patrick Henry | 4/7/2016 | 70,520 | 19.0 | ||||||
One Bay Plaza | 6/1/2016 | 195,739 | 53.4 | ||||||
12655 Jefferson | 11/4/2016 | 100,756 | 80.0 | ||||||
222 Kearny | 2/4/2017 | 148,797 | 51.8 | ||||||
3402 Pico | 3/21/2017 | 50,687 | 35.0 | ||||||
Pinnacle I and Pinnacle II(2) | 11/16/2017 | 623,777 | 350.0 | ||||||
Total(3)(4) | 2,674,688 | $ | 1,058.7 | ||||||
_____________
(1) | Represents gross sales price before certain credits, prorations and closing costs. |
(2) | We sold our ownership interest in the consolidated joint venture that owned these properties to certain affiliates of Blackstone. |
(3) | Excludes the disposition of a 45% interest in our 1455 Market property in 2015. |
(4) | Excludes our sale of an option to acquire land at 9300 Culver in 2016. |
All amounts and percentages used in this discussion of our results of operations are calculated using the numbers presented in the financial statements contained in this report rather than the rounded numbers appearing in this discussion. The dollar amounts included in the tables in this discussion of our results of operations are presented in thousands.
55
Comparison of the year ended December 31, 2017 to the year ended December 31, 2016
Net Operating Income
We evaluate performance based upon property net operating income (“NOI”) from continuing operations. NOI is not a measure of operating results or cash flows from operating activities or cash flows as measured by GAAP and should not be considered an alternative to income from continuing operations, as an indication of our performance, or as an alternative to cash flows as a measure of liquidity, or our ability to make distributions. All companies may not calculate NOI in the same manner. We consider NOI to be a useful performance measure to investors and management because when compared across periods, NOI reflects the revenues and expenses directly associated with owning and operating our properties and the impact to operations from trends in occupancy rates, rental rates and operating costs, providing a perspective not immediately apparent from income from continuing operations. We calculate NOI as net income (loss) excluding corporate general and administrative expenses, depreciation and amortization, impairments, gains/losses on sales of real estate, interest expense, transaction-related expenses and other non-operating items. We define NOI as operating revenues (including rental revenues, other property-related revenue, tenant recoveries and other operating revenues), less property-level operating expenses (which includes external management fees, if any, and property-level general and administrative expenses). NOI on a cash basis is NOI on a GAAP basis, adjusted to exclude the effect of straight-line rent and other non-cash adjustments required by GAAP. We believe that NOI on a cash basis is helpful to investors as an additional measure of operating performance because it eliminates straight-line rent and other non-cash adjustments to revenue and expenses.
Management further analyzes NOI by evaluating the performance from the following property groups:
• | Same-Store properties, which include all of the properties owned and included in our stabilized portfolio as of January 1, 2016 and still owned and included in the stabilized portfolio as of December 31, 2017; and |
• | Non-Same-Store properties, held for sale properties, development projects, redevelopment properties, and lease-up properties as of December 31, 2017 and other properties not owned or not in operation from January 1, 2016 through December 31, 2017. |
The following table reconciles net income to NOI:
Year Ended December 31, | |||||||||||||||
2017 | 2016 | Dollar Change | Percentage Change | ||||||||||||
Net income | $ | 94,561 | $ | 43,758 | $ | 50,803 | 116.1 | % | |||||||
Adjustments: | |||||||||||||||
Interest expense | 90,037 | 76,044 | 13,993 | 18.4 | |||||||||||
Interest income | (97 | ) | (260 | ) | 163 | (62.7 | ) | ||||||||
Unrealized loss on ineffective portion of derivatives | 70 | 1,436 | (1,366 | ) | (95.1 | ) | |||||||||
Transaction-related expenses | 598 | 376 | 222 | 59.0 | |||||||||||
Other income | (2,992 | ) | (1,558 | ) | (1,434 | ) | 92.0 | ||||||||
Gains on sale of real estate | (45,574 | ) | (30,389 | ) | (15,185 | ) | 50.0 | ||||||||
Income from operations | 136,603 | 89,407 | 47,196 | 52.8 | |||||||||||
Adjustments: | |||||||||||||||
General and administrative | 54,459 | 52,400 | 2,059 | 3.9 | |||||||||||
Depreciation and amortization | 283,570 | 269,087 | 14,483 | 5.4 | |||||||||||
NOI | $ | 474,632 | $ | 410,894 | $ | 63,738 | 15.5 | % | |||||||
Same-Store NOI | $ | 287,498 | $ | 262,077 | $ | 25,421 | 9.7 | % | |||||||
Non-Same-Store NOI | 187,134 | 148,817 | 38,317 | 25.7 | |||||||||||
NOI | $ | 474,632 | $ | 410,894 | $ | 63,738 | 15.5 | % | |||||||
56
The following table summarizes certain statistics of our Same-Store Office and Media and Entertainment properties:
Year Ended December 31, | |||||||
2017 | 2016 | ||||||
Same-Store Office statistics: | |||||||
Number of properties | 28 | 28 | |||||
Rentable square feet | 7,421,172 | 7,421,172 | |||||
Ending % leased | 96.8 | % | 95.5 | % | |||
Ending % occupied | 95.1 | % | 95.1 | % | |||
Average % occupied for the period | 94.7 | % | 94.6 | % | |||
Average annual rental rate per square foot | $ | 42.32 | $ | 38.92 | |||
Same-Store Media and Entertainment statistics: | |||||||
Number of properties | 2 | 2 | |||||
Rentable square feet | 873,002 | 873,002 | |||||
Average % occupied for the period | 90.7 | % | 89.2 | % | |||
The following table gives further detail on our NOI:
Year Ended December 31, | |||||||||||||||||||
2017 | 2016 | ||||||||||||||||||
Same-Store | Non-Same-Store | Total | Same-Store | Non-Same-Store | Total | ||||||||||||||
Revenues | |||||||||||||||||||
Office | |||||||||||||||||||
Rental | $ | 300,584 | $ | 244,869 | $ | 545,453 | $ | 282,058 | $ | 204,898 | $ | 486,956 | |||||||
Tenant recoveries | 60,312 | 31,932 | 92,244 | 56,988 | 27,398 | 84,386 | |||||||||||||
Parking and other | 17,678 | 11,735 | 29,413 | 12,621 | 9,273 | 21,894 | |||||||||||||
Total Office revenues | 378,574 | 288,536 | 667,110 | 351,667 | 241,569 | 593,236 | |||||||||||||
Media & Entertainment | |||||||||||||||||||
Rental | 28,674 | 7,855 | 36,529 | 26,837 | — | 26,837 | |||||||||||||
Tenant recoveries | 1,105 | 231 | 1,336 | 1,884 | — | 1,884 | |||||||||||||
Other property-related revenue | 18,254 | 4,551 | 22,805 | 17,380 | — | 17,380 | |||||||||||||
Other | 348 | 11 | 359 | 302 | — | 302 | |||||||||||||
Total Media & Entertainment revenues | 48,381 | 12,648 | 61,029 | 46,403 | — | 46,403 | |||||||||||||
Total revenues | 426,955 | 301,184 | 728,139 | 398,070 | 241,569 | 639,639 | |||||||||||||
Operating expenses | |||||||||||||||||||
Office operating expenses | 113,188 | 105,685 | 218,873 | 110,183 | 92,752 | 202,935 | |||||||||||||
Media & Entertainment operating expenses | 26,269 | 8,365 | 34,634 | 25,810 | — | 25,810 | |||||||||||||
Total operating expenses | 139,457 | 114,050 | 253,507 | 135,993 | 92,752 | 228,745 | |||||||||||||
Office NOI | 265,386 | 182,851 | 448,237 | 241,484 | 148,817 | 390,301 | |||||||||||||
Media & Entertainment NOI | 22,112 | 4,283 | 26,395 | 20,593 | — | 20,593 | |||||||||||||
NOI | $ | 287,498 | $ | 187,134 | $ | 474,632 | $ | 262,077 | $ | 148,817 | $ | 410,894 | |||||||
57
The following table gives further detail on our change in NOI:
Year Ended December 31, 2017 as compared to the Year Ended December 31, 2016 | |||||||||||||||||
Same-Store | Non-Same-Store | Total | |||||||||||||||
Dollar Change | Percent Change | Dollar Change | Percent Change | Dollar Change | Percent Change | ||||||||||||
Revenues | |||||||||||||||||
Office | |||||||||||||||||
Rental | $ | 18,526 | 6.6 | % | $ | 39,971 | 19.5 | % | $ | 58,497 | 12.0 | % | |||||
Tenant recoveries | 3,324 | 5.8 | 4,534 | 16.5 | 7,858 | 9.3 | |||||||||||
Parking and other | 5,057 | 40.1 | 2,462 | 26.6 | 7,519 | 34.3 | |||||||||||
Total Office revenues | 26,907 | 7.7 | 46,967 | 19.4 | 73,874 | 12.5 | |||||||||||
Media & Entertainment | |||||||||||||||||
Rental | 1,837 | 6.8 | 7,855 | 100.0 | 9,692 | 36.1 | |||||||||||
Tenant recoveries | (779 | ) | (41.3 | ) | 231 | 100.0 | (548 | ) | (29.1 | ) | |||||||
Other property-related revenue | 874 | 5.0 | 4,551 | 100.0 | 5,425 | 31.2 | |||||||||||
Other | 46 | 15.2 | 11 | 100.0 | 57 | 18.9 | |||||||||||
Total Media & Entertainment revenues | 1,978 | 4.3 | 12,648 | 100.0 | 14,626 | 31.5 | |||||||||||
Total revenues | 28,885 | 7.3 | 59,615 | 24.7 | 88,500 | 13.8 | |||||||||||
Operating expenses | |||||||||||||||||
Office operating expenses | 3,005 | 2.7 | 12,933 | 13.9 | 15,938 | 7.9 | |||||||||||
Media & Entertainment operating expenses | 459 | 1.8 | 8,365 | 100.0 | 8,824 | 34.2 | |||||||||||
Total operating expenses | 3,464 | 2.5 | 21,298 | 23.0 | 24,762 | 10.8 | |||||||||||
Office NOI | 23,902 | 9.9 | 34,034 | 22.9 | 57,936 | 14.8 | |||||||||||
Media & Entertainment NOI | 1,519 | 7.4 | 4,283 | 100.0 | 5,802 | 28.2 | |||||||||||
NOI | $ | 25,421 | 9.7 | % | $ | 38,317 | 25.7 | % | $ | 63,738 | 15.5 | % | |||||
NOI increased $63.7 million, or 15.5%, for the year ended December 31, 2017 as compared to the year ended December 31, 2016, primarily resulting from:
• | $23.9 million, or 9.9%, increase in NOI from our Same-Store Office properties resulting primarily from increased rental revenues relating to leases signed at our 1455 Market (Uber Technologies, Inc. and Bank of America), 875 Howard (Glu Mobile, Inc. and Snap, Inc.), 625 Second (Github, Inc. and Ziff Davis, LLC) and Rincon Center (Google, Inc.) properties at a higher rate than expiring leases. The increase was also due to a reduction in above-market lease amortization at our Towers at Shore Center property. Parking and other revenues increased primarily due to lease termination fees related to our Campus Center property. Tenant recoveries increased primarily due to higher recoveries for our 1455 Market property, partially offset by prior year property tax reassessments for our Rincon Center property. Office operating expenses increased due to higher repairs and maintenance costs and higher property tax expenses at our 1455 Market property, partially offset by property tax reassessments related to the prior year for our Rincon Center property. |
• | $34.0 million, or 22.9%, increase in NOI from our Non-Same-Store Office store properties resulting primarily from the commencement of Netflix, Inc.’s lease at our ICON property in the first quarter of 2017 and acquisitions in 2016, which include 11601 Wilshire (acquired in July 2016), Hill7 (acquired in October 2016) and Page Mill Hill (acquired in December 2016), collectively referred to as the “2016 Acquisitions.” The increase was partially offset by the sale of our One Bay Plaza (sold in June 2016), 12655 Jefferson (sold in November 2016), 222 Kearny (sold in February 2017), Pinnacle I and Pinnacle II (sold in November 2017) properties. Rental revenues increased primarily due to leases signed at our Metro Center (Qualys, Inc., BrightEdge Technologies, Inc. and Scale Management, LLC) property at a higher rate than expiring leases, partially offset by lower revenues from our 604 Arizona property, which was taken off-line for a redevelopment project. Office operating expenses increased due to the commencement of Netflix, Inc.’s lease at our ICON property, the 2016 Acquisitions and higher operating expense at our Metro Center property, partially offset by the sale of our One Bay Plaza property. |
58
• | $1.5 million, or 7.4%, increase in NOI from our Same-Store Media and Entertainment properties resulting primarily from higher rental revenues and other property-related revenues, partially offset by lower tenant recoveries. The increase was primarily a result of an increase in occupancy and production at Sunset Bronson Studios, partially offset by lower recoveries primarily due to a reimbursement in connection with the reconciliation of prior year operating expense recoveries under the lease with KTLA at Sunset Bronson Studios. |
• | $4.3 million, or 100.0%, increase in NOI from our Non-Same-Store Media and Entertainment property resulting from our acquisition of Sunset Las Palmas Studios in May 2017. |
Office NOI
Same-Store
Same-Store office rental revenues increased $18.5 million, or 6.6%, to $300.6 million for the year ended December 31, 2017 compared to $282.1 million for the year ended December 31, 2016. The increase was primarily due to leases signed at our 1455 Market (Uber Technologies, Inc. and Bank of America), 875 Howard (Glu Mobile, Inc. and Snap, Inc.), 625 Second (Github, Inc. and Ziff Davis, LLC) and Rincon Center (Google, Inc.) properties at a higher rate than expiring leases. The increase was also due to a reduction in above-market lease amortization at our Towers at Shore Center property.
Same-Store office tenant recoveries increased by $3.3 million, or 5.8%, to $60.3 million for the year ended December 31, 2017 compared to $57.0 million for the year ended December 31, 2016. The increase was primarily related to higher recoveries for our 1455 Market property, partially offset by property tax reassessments related to the prior year for our Rincon Center property.
Same-Store office parking and other revenues increased by $5.1 million, or 40.1%, to $17.7 million for the year ended December 31, 2017 compared to $12.6 million for the year ended December 31, 2016. The increase was primarily due to lease termination fees related to our Campus Center property.
Same-Store office operating expenses increased $3.0 million, or 2.7%, to $113.2 million for the year ended December 31, 2017 compared to $110.2 million for the year ended December 31, 2016. The increase was primarily due to higher repairs and maintenance costs and higher property tax expenses at our 1455 Market property, partially offset by property tax reassessments related to the prior year for our Rincon Center property.
Non-Same-Store
Non-Same-Store office rental revenues increased $40.0 million, or 19.5%, to $244.9 million for the year ended December 31, 2017 compared to $204.9 million for the year ended December 31, 2016. The increase was primarily due to the commencement of Netflix, Inc.’s lease at our ICON property in the first quarter of 2017 and the 2016 Acquisitions, partially offset by the sale of our One Bay Plaza (sold in June 2016), 12655 Jefferson (sold in November 2016), 222 Kearny (sold in February 2017), Pinnacle I and Pinnacle II (sold in November 2017) properties. The increase was also attributable to leases signed at our Metro Center (Qualys, Inc., BrightEdge Technologies, Inc. and Scale Management, LLC) property at a higher rate than expiring leases, partially offset by lower revenues from our 604 Arizona property, which was taken off-line for a redevelopment project.
Non-Same-Store office tenant recoveries increased $4.5 million, or 16.5%, to $31.9 million for the year ended December 31, 2017 compared to $27.4 million for the year ended December 31, 2016. The increase was primarily due the commencement of Netflix, Inc.’s lease at our ICON property and the 2016 Acquisitions, partially offset by the sale of our One Bay Plaza, 222 Kearny, Pinnacle I and Pinnacle II properties.
Non-Same-Store office parking and other revenues increased $2.5 million, or 26.6%, to $11.7 million for the year ended December 31, 2017 compared to $9.3 million for the year ended December 31, 2016. The increase was primarily due the commencement of Netflix, Inc.’s lease at our ICON property and the 2016 Acquisitions, partially offset by the sale of our 222 Kearny, Pinnacle I and Pinnacle II properties.
Non-Same-Store office operating expenses increased by $12.9 million, or 13.9%, to $105.7 million for the year ended December 31, 2017 compared to $92.8 million for the year ended December 31, 2016. The increase was primarily due to the commencement of Netflix, Inc.’s lease at our ICON property, the 2016 Acquisitions and higher operating expense at our Metro Center property, partially offset by the sale of our One Bay Plaza property.
59
Media & Entertainment NOI
Same-Store
Same-Store Media and Entertainment revenues increased by $2.0 million, or 4.3%, to $48.4 million for the year ended December 31, 2017 compared to $46.4 million for the year ended December 31, 2016. The increase was primarily attributable to a $1.8 million increase in rental revenues to $28.7 million and a $0.9 million increase in other property-related revenues to $18.3 million. The increase in rental revenues and other property-related revenues were primarily due to higher occupancy and production at Sunset Bronson Studios. This was partially offset by lower recoveries primarily due to a reimbursement in connection with the reconciliation of prior year operating expense recoveries under the lease with KTLA at Sunset Bronson Studios.
Same-Store Media and entertainment operating expenses increased by $0.5 million, or 1.8%, to $26.3 million for the year ended December 31, 2017 compared to $25.8 million for the year ended December 31, 2016. The increase was due to an overall increase in occupancy and production.
Non-Same-Store
Non-Same-Store Media and Entertainment revenues were $12.6 million for the year ended December 31, 2017. Non-Same-Store Media and Entertainment operating expenses were $8.4 million for the year ended December 31, 2017. We acquired Sunset Las Palmas Studios in May 2017, which caused the increase in revenues and expenses.
Other Expense (Income)
Interest expense increased $14.0 million, or 18.4%, to $90.0 million for the year ended December 31, 2017 compared to $76.0 million for the year ended December 31, 2016. The increase in interest expense was primarily attributable to higher weighted average debt outstanding in 2017 as compared to 2016, primarily due to $200.0 million of private placement borrowings in the third quarter of 2016 and $101.0 million of borrowings related to our Hill7 property in the fourth quarter of 2016.
We recognized unrealized loss on our derivatives of $70.0 thousand for the year ended December 31, 2017 as compared to $1.4 million for the year ended December 31, 2016. The unrealized loss was related to a portion of our derivatives that was evaluated to be ineffective. In July 2016, we amended the interest rate swaps to add a 0.00% floor to one-month LIBOR and then de-designated the original swaps and designated the amended swaps as a hedge in order to minimize the ineffective portion of the original derivatives.
Other income increased $1.4 million, or 92.0%, to $3.0 million for the year ended December 31, 2017 compared to $1.6 million for the year ended December 31, 2016. The change was primarily due to increased income related to a joint venture we entered into June 16, 2016 to co-originate a loan secured by land in Santa Clara, California.
During 2017, we completed the sale of our 222 Kearny, 3402 Pico, Pinnacle I and Pinnacle II properties, resulting in gains of $45.6 million for the year ended December 31, 2017. We recognized a $30.4 million gain on sale of real estate for the year ended December 31, 2016 from the sale of our Bayhill Office Center, Patrick Henry, One Bay Plaza and 12655 Jefferson properties.
General and administrative expenses include wages and salaries for corporate-level employees, accounting, legal and other professional services, office supplies, entertainment, travel, and automobile expenses, telecommunications and computer-related expenses and other miscellaneous items. General and administrative expenses increased $2.1 million, or 3.9%, to $54.5 million for the year ended December 31, 2017 compared to $52.4 million for the year ended December 31, 2016. The increase in general and administrative expenses was primarily attributable to the adoption of the 2017 Hudson Pacific Properties, Inc. Outperformance Program and increased staffing to meet operational needs.
Depreciation and amortization expense increased $14.5 million, or 5.4%, to $283.6 million for the year ended December 31, 2017 compared to $269.1 million for the year ended December 31, 2016. The increase was primarily related to depreciation expenses associated with the 2016 Acquisitions, our ICON property and the acquisition of Sunset Las Palmas Studios, partially offset by the reduction of depreciation expense as a result of the sale of our One Bay Plaza, 222 Kearny, Pinnacle I and Pinnacle II properties.
60
Comparison of the year ended December 31, 2016 to the year ended December 31, 2015
Management further evaluates NOI by evaluating the performance from the following property groups:
• | Same-Store properties, which include all of the properties owned and included in our stabilized portfolio as of January 1, 2015 and still owned and included in the stabilized portfolio as of December 31, 2016; and |
• | Non-Same-Store properties, development projects, redevelopment properties, and lease-up properties as of December 31, 2016; and other properties not owned or in operation from January 1, 2015 through December 31, 2016. The activity from the EOP acquisition is included in non-same store properties. |
The following table reconciles net income (loss) to NOI:
Year Ended December 31, | |||||||||||||||
2016 | 2015 | Dollar Change | Percentage Change | ||||||||||||
Net income (loss) | $ | 43,758 | $ | (16,082 | ) | $ | 59,840 | 372.1 | % | ||||||
Adjustments: | |||||||||||||||
Interest expense | 76,044 | 50,667 | 25,377 | 50.1 | |||||||||||
Interest income | (260 | ) | (124 | ) | (136 | ) | 109.7 | ||||||||
Unrealized loss on ineffective portion of derivatives | 1,436 | — | 1,436 | 100.0 | |||||||||||
Transaction-related expenses | 376 | 43,336 | (42,960 | ) | (99.1 | ) | |||||||||
Other (income) expense | (1,558 | ) | 62 | (1,620 | ) | (2,612.9 | ) | ||||||||
Gains on sale of real estate | (30,389 | ) | (30,471 | ) | 82 | (0.3 | ) | ||||||||
Income from operations | 89,407 | 47,388 | 42,019 | 88.7 | |||||||||||
Adjustments: | |||||||||||||||
General and administrative | 52,400 | 38,534 | 13,866 | 36.0 | |||||||||||
Depreciation and amortization | 269,087 | 245,071 | 24,016 | 9.8 | |||||||||||
NOI | $ | 410,894 | $ | 330,993 | $ | 79,901 | 24.1 | % | |||||||
Same-Store NOI | $ | 155,989 | $ | 137,148 | $ | 18,841 | 13.7 | % | |||||||
Non-Same-Store NOI | 254,905 | 193,845 | 61,060 | 31.5 | |||||||||||
NOI | $ | 410,894 | $ | 330,993 | $ | 79,901 | 24.1 | % | |||||||
The following table summarizes certain statistics of our Same-Store Office and Media and Entertainment properties:
Year Ended December 31, | |||||||
2016 | 2015 | ||||||
Same-Store Office statistics: | |||||||
Number of properties | 20 | 20 | |||||
Rentable square feet | 4,433,689 | 4,433,689 | |||||
Ending % leased | 96.2 | % | 94.0 | % | |||
Ending % occupied | 95.4 | % | 92.4 | % | |||
Average % occupied for the period | 93.0 | % | 92.8 | % | |||
Average annual rental rate per square foot | $ | 36.36 | $ | 34.01 | |||
Same-Store Media and Entertainment statistics: | |||||||
Number of properties | $ | 2.00 | $ | 2.00 | |||
Rentable square feet | 879,652 | 879,652 | |||||
Average % occupied for the period | 89.1 | % | 78.5 | % | |||
61
The following table gives further detail on our NOI:
Year Ended December 31, | |||||||||||||||||||
2016 | 2015 | ||||||||||||||||||
Same-Store | Non-Same-Store | Total | Same Store | Non-Same-Store | Total | ||||||||||||||
Revenues | |||||||||||||||||||
Office | |||||||||||||||||||
Rental | $ | 156,258 | $ | 330,698 | $ | 486,956 | $ | 144,822 | $ | 249,721 | $ | 394,543 | |||||||
Tenant recoveries | 28,463 | 55,923 | 84,386 | 27,703 | 38,532 | 66,235 | |||||||||||||
Parking and other | 16,096 | 5,798 | 21,894 | 15,450 | 5,490 | 20,940 | |||||||||||||
Total Office revenues | 200,817 | 392,419 | 593,236 | 187,975 | 293,743 | 481,718 | |||||||||||||
Media & Entertainment | |||||||||||||||||||
Rental | 26,837 | — | 26,837 | 23,027 | — | 23,027 | |||||||||||||
Tenant recoveries | 1,884 | — | 1,884 | 943 | — | 943 | |||||||||||||
Other property-related revenue | 17,380 | — | 17,380 | 14,849 | — | 14,849 | |||||||||||||
Other | 302 | — | 302 | 313 | — | 313 | |||||||||||||
Total Media & Entertainment revenues | 46,403 | — | 46,403 | 39,132 | — | 39,132 | |||||||||||||
Total revenues | 247,220 | 392,419 | 639,639 | 227,107 | 293,743 | 520,850 | |||||||||||||
Operating expenses | |||||||||||||||||||
Office operating expenses | 65,421 | 137,514 | 202,935 | 66,233 | 99,898 | 166,131 | |||||||||||||
Media & Entertainment operating expenses | 25,810 | — | 25,810 | 23,726 | — | 23,726 | |||||||||||||
Total operating expenses | 91,231 | 137,514 | 228,745 | 89,959 | 99,898 | 189,857 | |||||||||||||
Office NOI | 135,396 | 254,905 | 390,301 | 121,742 | 193,845 | 315,587 | |||||||||||||
Media & Entertainment NOI | 20,593 | — | 20,593 | 15,406 | — | 15,406 | |||||||||||||
NOI | $ | 155,989 | $ | 254,905 | $ | 410,894 | $ | 137,148 | $ | 193,845 | $ | 330,993 | |||||||
62
The following tables gives further detail on our change in NOI:
Year Ended December 31, 2016 as compared to the Year Ended December 31, 2015 | |||||||||||||||||
Same-Store | Non-Same-Store | Total | |||||||||||||||
Dollar Change | Percent Change | Dollar Change | Percent Change | Dollar Change | Percent Change | ||||||||||||
Revenues | |||||||||||||||||
Office | |||||||||||||||||
Rental | $ | 11,436 | 7.9 | % | $ | 80,977 | 32.4 | % | $ | 92,413 | 23.4 | % | |||||
Tenant recoveries | 760 | 2.7 | 17,391 | 45.1 | 18,151 | 27.4 | |||||||||||
Parking and other | 646 | 4.2 | 308 | 5.6 | 954 | 4.6 | |||||||||||
Total Office revenues | 12,842 | 6.8 | 98,676 | 33.6 | 111,518 | 23.2 | |||||||||||
Media & Entertainment | |||||||||||||||||
Rental | 3,810 | 16.5 | — | — | 3,810 | 16.5 | |||||||||||
Tenant recoveries | 941 | 99.8 | — | — | 941 | 99.8 | |||||||||||
Other property-related revenue | 2,531 | 17.0 | — | — | 2,531 | 17.0 | |||||||||||
Other | (11 | ) | (3.5 | ) | — | — | (11 | ) | (3.5 | ) | |||||||
Total Media & Entertainment revenues | 7,271 | 18.6 | — | — | 7,271 | 18.6 | |||||||||||
Total revenues | 20,113 | 8.9 | 98,676 | 33.6 | 118,789 | 22.8 | |||||||||||
Operating expenses | |||||||||||||||||
Office operating expenses | (812 | ) | (1.2 | ) | 37,616 | 37.7 | 36,804 | 22.2 | |||||||||
Media & Entertainment operating expenses | 2,084 | 8.8 | — | — | 2,084 | 8.8 | |||||||||||
Total operating expenses | 1,272 | 1.4 | 37,616 | 37.7 | 38,888 | 20.5 | |||||||||||
Office NOI | 13,654 | 11.2 | 61,060 | 31.5 | 74,714 | 23.7 | |||||||||||
Media & Entertainment NOI | 5,187 | 33.7 | — | — | 5,187 | 33.7 | |||||||||||
NOI | $ | 18,841 | 13.7 | % | $ | 61,060 | 31.5 | % | $ | 79,901 | 24.1 | % | |||||
NOI increased $79.9 million, or 24.1%, for the year ended December 31, 2016 as compared to the year ended December 31, 2015, primarily resulting from:
• | $13.7 million, or 11.2%, increase in NOI from our same-store office properties resulting primarily from higher rents related to new leases signed at our 1455 Market (Uber and Vevo) and 625 Second (Anaplan, Metamarkets and Github) properties at higher rents than expiring leases, and increased tenant recoveries due to increased property tax recoveries arising from the reassessment of 6040 Sunset and Element LA. The increase was partially offset by straight-line rent write-off related to our 875 Howard property (Heald College) recognized in the second quarter of 2015 and decreased tenant recoveries due to lower property tax recoveries resulting from the reassessment of the 1455 Market property. |
• | $61.1 million, or 31.5%, increase in net operating income from our non-same-store properties driven primarily by the EOP Acquisition and 2016 acquisitions. The increase was also related to higher rents and occupancy due to lease-up of our Element LA (Riot Games), 901 Market (Saks), Page Mill Center (Toyota Research Institute and Stanford), Skyport Plaza (Qualcomm), 3176 Porter and Metro Center (BrightEdge) properties. The increase was partially offset by the sale of our First Financial (sold in March 2015), Bay Park Plaza (sold in September 2015), Bayhill Office Center (sold in January 2016) and One Bay Plaza (sold in June 2016) properties. |
• | $5.2 million, or 33.7%, increase in NOI from our same-store media and entertainment properties resulting primarily from higher occupancy at Sunset Bronson Studios and Sunset Gower Studios. In the first quarter of 2015, we decided to take certain buildings and stages offline to facilitate our ICON and CUE developments and other longer-term plans for the Sunset Bronson Studios property. In addition, other property-related revenues increased primarily due to the completion of parking structures at Sunset Bronson Studios and Sunset Gower Studios in the fourth quarter of 2015. The increase in other property-related revenue largely resulting from higher production activity and revenues associated with lighting and grip at Sunset Bronson Studios. |
63
Office NOI
Same-Store
Same-Store office rental revenue increased $11.4 million, or 7.9%, to $156.3 million for the year ended December 31, 2016 compared to $144.8 million for the year ended December 31, 2015. The increase is primarily due to rental income relating to new leases signed at our 1455 Market (Uber and Vevo) and 625 Second (Anaplan, Metamarkets and Github) properties at higher rents than expiring leases. The increase was partially offset by a straight-line rent write-off related to the 875 Howard property (Heald College) recognized in the second quarter of 2015.
Same-Store office tenant recoveries increased by $0.8 million, or 2.7%, to $28.5 million for the year ended December 31, 2016 compared to $27.7 million for the year ended December 31, 2015. The increase is primarily related to increased property tax recovery resulting from reassessments of the 6040 Sunset and Element LA properties, partially offset by lower property tax recovery resulting from a reassessment of the 1455 Market property.
Same-Store office parking and other revenue was $16.1 million for the year ended December 31, 2016, relatively flat as compared to $15.5 million for the year ended December 31, 2015.
Same-Store office operating expenses were $65.4 million for the year ended December 31, 2016, relatively flat as compared to $66.2 million for the year ended December 31, 2015.
Non-Same-Store
Non-Same-Store office rental revenue increased $81.0 million, or 32.4%, to $330.7 million for the year ended December 31, 2016 compared to $249.7 million for the year ended December 31, 2015, driven primarily by the EOP Acquisition and 11601 Wilshire acquisition. The increase was also related to higher rents and occupancy attributable to lease-up of our Element LA (Riot Games), 901 Market (Saks), Page Mill Center (Toyota Research Institute and Stanford), Skyport Plaza (Qualcomm), 3176 Porter and Metro Center (BrightEdge) properties. The increase was partially offset by the sale of our First Financial (sold in March 2015), Bay Park Plaza (sold in September 2015), Bayhill Office Center (sold in January 2016) and One Bay Plaza (sold in June 2016) properties.
Non-Same-Store office tenant recoveries increased $17.4 million, or 45.1%, to $55.9 million for the year ended December 31, 2016 compared to $38.5 million for the year ended December 31, 2015. The increase is primarily attributable to the EOP Acquisition, 11601 Wilshire acquisition, and 100% occupancy at our Element LA property, partially offset by the sale of our First Financial (sold in March 2015), Bay Park Plaza (sold in September 2015), Bayhill Office Center (sold in January 2016), and One Bay Plaza (sold in June 2016) properties.
Non-Same-Store office parking and other revenue was $5.8 million for the year ended December 31, 2016, relatively flat as compared to $5.5 million for the year ended December 31, 2015.
Non-Same-Store office operating expenses increased by $37.6 million, or 37.7%, to $137.5 million for the year ended December 31, 2016 compared to $99.9 million for the year ended December 31, 2015. The increase is primarily attributable to the EOP Acquisition, 11601 Wilshire acquisition, and 100% occupancy at our Element LA property, partially offset by the sale of our First Financial (sold in March 2015), Bay Park Plaza (sold in September 2015), Bayhill Office Center (sold in January 2016) and One Bay Plaza (sold in June 2016) properties.
Same-Store Media & Entertainment
Same-Store Media and entertainment rental revenue, tenant recoveries and other property-related revenue increased by $7.3 million or 18.6% to $46.4 million for the year ended December 31, 2016 compared to $39.1 million for the year ended December 31, 2015. The increase is primarily attributable to a $3.8 million increase in rental revenues to $26.8 million and a $2.5 million increase in other property-related revenue to $17.4 million. The increase in rental revenue is primarily due to higher occupancy at Sunset Gower Studios and Sunset Bronson Studios. The increase in other property-related revenue largely resulting from higher production activity and revenues associated with lighting and grip at Sunset Bronson Studios during the year ended December 31, 2016 as compared to the same period in 2015.
Same-Store Media and entertainment operating expenses increased by $2.1 million, or 8.8%, to $25.8 million for the year ended December 31, 2016 compared to $23.7 million for the year ended December 31, 2015. The increase is primarily attributable to higher occupancy at Sunset Gower Studios and Sunset Bronson Studios
64
Other Expense (Income)
General and administrative expenses include wages and salaries for corporate-level employees, accounting, legal and other professional services, office supplies, entertainment, travel, and automobile expenses, telecommunications and computer-related expenses, and other miscellaneous items. General and administrative expenses increased $13.9 million, or 36.0%, to $52.4 million for the year ended December 31, 2016 compared to $38.5 million for the year ended December 31, 2015. The increase in general and administrative expenses was primarily attributable to stock-compensation awards, office expenses, shareholder relations costs and increased staffing to meet operational needs arising from growth related to the EOP Acquisition.
Depreciation and amortization expense increased $24.0 million, or 9.8%, to $269.1 million for the year ended December 31, 2016 compared to $245.1 million for the year ended December 31, 2015. The increase was primarily related to depreciation expenses associated with properties in the EOP Acquisition and acquisitions in 2016. The remaining increase is related to tenant improvement depreciation expense associated with the lease-up of our Element LA and 1455 Market properties, lease termination at our Rincon Center property, and increase in depreciation expense at Sunset Gower Studios related to the recently completed parking garage, partially offset by the reduction of depreciation expense as a result of the sale of our 2015 and 2016 disposed properties, and increased depreciation expense related to our 875 Howard property (Heald College) due to an early termination in the second quarter of 2015.
Interest expense increased $25.4 million, or 50.1%, to $76.0 million for the year ended December 31, 2016 compared to $50.7 million for the year ended December 31, 2015. At December 31, 2016, we had $2.71 billion, before deferred loan costs recorded net against the loan balance, of notes payable, compared to $2.28 billion at December 31, 2015. The increase was primarily attributable to $400.0 million of term loans and private placement borrowings and additional borrowings related to our Hill7 loan, partially offset by interest savings related to our paydown of our five-year term loan due April 2020, repayment of our indebtedness associated with our 901 Market property, and paydown on our indebtedness associated with our Sunset Gower Studios/Sunset Bronson Studios property. The increase in interest expense was further offset by increased capitalized interest primarily due to the ICON, CUE, Fourth & Traction, and MaxWell developments, partially offset by lower capitalized interest primarily due to Element LA redevelopment during the year ended December 31, 2016 compared to the same period in 2015.
We recognized unrealized loss of $1.4 million related to a portion of our derivatives that was evaluated to be ineffective in 2016. In July 2016, we amended the interest rate swaps to add a 0.00% floor to one-month LIBOR, and then de-designated the original swap and designated the amended swaps as a hedge in order to minimize the ineffective portion of the original derivatives.
Transaction-related expenses decreased $43.0 million, or 99.1%, to $0.4 million for the year ended December 31, 2016 compared to $43.3 million for the year ended December 31, 2015. We incurred $43.3 million of acquisition-related expenses associated with the EOP Acquisition and incurred $0.4 million of acquisition-related expenses associated with the acquisition of our 11601 Wilshire property purchased on July 1, 2016.
During 2016 we completed the sale of our Bayhill Office Center, Patrick Henry, One Bay Plaza, and 12655 Jefferson properties and sale related to our option to acquire land at 9300 Culver, which generated gains of $30.4 million for the year ended December 31, 2016 compared to a $30.5 million gain on sale of real estate for the year ended December 31, 2015 resulting from the sale of our First Financial and Bay Park Plaza properties.
Liquidity and Capital Resources
We have remained capitalized since our initial public offering through public offerings, private placements and continuous offerings under our at-the-market (“ATM”) program. We currently expect that our principal sources of funds to meet our short-term and long-term liquidity requirements for working capital, strategic acquisitions, capital expenditures, tenant improvements, leasing costs, dividends and distributions, and repayments of outstanding debt financing will include:
• | Cash on hand, cash reserves and net cash provided by operations; |
• | Proceeds from additional equity securities; |
• | Our ATM program; |
• | Borrowings under the operating partnership’s unsecured revolving credit facility; and |
65
• | Proceeds from additional secured or unsecured debt financings or offerings. |
Liquidity Sources
We had approximately $78.9 million of cash and cash equivalents at December 31, 2017. Our principal source of operating cash flow is related to leasing and operating the properties in our portfolio. Our properties provide a relatively consistent stream of cash flow that provides us with resources to pay operating expenses, debt service and fund quarterly dividend and distribution requirements.
Our ability to access the equity capital markets will be dependent on a number of factors as well, including general market conditions for REITs and market perceptions about us.
We have an ATM program that allows us to sell up to $125.0 million of common stock, $20.1 million of which has been sold through December 31, 2017. Any future sales will depend on several factors, including, but not limited to, market conditions, the trading price of our common stock and our capital needs. We have no obligation to sell the remaining shares available for sale under this program.
As of December 31, 2017, we had total borrowing capacity of $400.0 million under our unsecured revolving credit facility, $100.0 million of which had been drawn.
Our ability to incur additional debt will be dependent on a number of factors, including our degree of leverage, the value of our unencumbered assets and borrowing restrictions that may be imposed by lenders. If we incur additional debt, the risks associated with our leverage, including our ability to service our debt, would increase.
Based on the closing price of our common stock of $34.25 as of December 31, 2017, our ratio of debt to total market capitalization was approximately 31.2% (counting Series A preferred units as debt) as of December 31, 2017.
Market capitalization | December 31, 2017 | |||
Notes payable(1) | $ | 2,439,311 | ||
Series A preferred units | 10,177 | |||
Common equity capitalization(2) | 5,400,294 | |||
Total market capitalization | $ | 7,849,782 | ||
Series A preferred units & debt/total market capitalization | 31.2 | % | ||
_____________
(1) | Notes payable excludes unamortized deferred financing costs and loan discount. |
(2) | Common equity capitalization represents the shares of common stock (including unvested restricted shares), OP units outstanding and dilutive shares multiplied by the closing price of our stock at the end of the period. |
66
Outstanding Indebtedness
The following table sets forth information as of December 31, 2017 and December 31, 2016 with respect to our outstanding indebtedness:
December 31, 2017 | December 31, 2016 | Interest Rate(1) | Contractual Maturity Date | |||||||||
UNSECURED NOTES PAYABLE | ||||||||||||
Unsecured Revolving Credit Facility(2) | $ | 100,000 | $ | 300,000 | LIBOR + 1.15% to 1.85% | 4/1/2019 | (3) | |||||
5-Year Term Loan due April 2020(2)(4) | 300,000 | 450,000 | LIBOR + 1.30% to 2.20% | 4/1/2020 | ||||||||
5-Year Term Loan due November 2020(2) | 75,000 | 175,000 | LIBOR + 1.30% to 2.20% | 11/17/2020 | ||||||||
7-Year Term Loan due April 2022(2)(5) | 350,000 | 350,000 | LIBOR + 1.60% to 2.55% | 4/1/2022 | ||||||||
7-Year Term Loan due November 2022(2)(6) | 125,000 | 125,000 | LIBOR + 1.60% to 2.55% | 11/17/2022 | ||||||||
Series A Notes | 110,000 | 110,000 | 4.34% | 1/2/2023 | ||||||||
Series E Notes | 50,000 | 50,000 | 3.66% | 9/15/2023 | ||||||||
Series B Notes | 259,000 | 259,000 | 4.69% | 12/16/2025 | ||||||||
Series D Notes | 150,000 | 150,000 | 3.98% | 7/6/2026 | ||||||||
Registered Senior Notes(7) | 400,000 | — | 3.95% | 11/1/2027 | ||||||||
Series C Notes | 56,000 | 56,000 | 4.79% | 12/16/2027 | ||||||||
TOTAL UNSECURED NOTES PAYABLE | 1,975,000 | 2,025,000 | ||||||||||
SECURED NOTES PAYABLE | ||||||||||||
Rincon Center(8)(9) | 98,392 | 100,409 | 5.13% | 5/1/2018 | ||||||||
Sunset Gower Studios/Sunset Bronson Studios | 5,001 | 5,001 | LIBOR + 2.25% | 3/4/2019 | (3) | |||||||
Met Park North(10) | 64,500 | 64,500 | LIBOR + 1.55% | 8/1/2020 | ||||||||
10950 Washington(8) | 27,418 | 27,929 | 5.32% | 3/11/2022 | ||||||||
Element LA | 168,000 | 168,000 | 4.59% | 11/6/2025 | ||||||||
Hill7(11) | 101,000 | 101,000 | 3.38% | 11/6/2028 | ||||||||
Pinnacle I(12) | — | 129,000 | 3.95% | 11/7/2022 | ||||||||
Pinnacle II(12) | — | 87,000 | 4.30% | 6/11/2026 | ||||||||
TOTAL SECURED NOTES PAYABLE | 464,311 | 682,839 | ||||||||||
TOTAL NOTES PAYABLE | 2,439,311 | 2,707,839 | ||||||||||
Held for sale balances(12) | — | (216,000 | ) | |||||||||
Unamortized deferred financing costs and loan discounts(13) | (17,931 | ) | (18,513 | ) | ||||||||
TOTAL NOTES PAYABLE, NET | $ | 2,421,380 | $ | 2,473,326 | ||||||||
_____________
(1) | Interest rate with respect to indebtedness is calculated on the basis of a 360-day year for the actual days elapsed. Interest rates are as of December 31, 2017, which may be different than the interest rates as of December 31, 2015 for corresponding indebtedness. |
(2) | We have the option to make an irrevocable election to change the interest rate depending on our credit rating. As of December 31, 2017, no such election had been made. |
(3) | The maturity date may be extended once for an additional one-year term. |
(4) | In July 2016, $300.0 million of the term loan was effectively fixed at 2.75% to 3.65% per annum through the use of two interest rate swaps. See Part IV, Item 15(a) “Financial Statement and Schedules—Note 6 to the Consolidated Financial Statements—Derivatives” for details. |
(5) | In July 2016, the outstanding balance of the term loan was effectively fixed at 3.36%% to 4.31% per annum through the use of two interest rate swaps. See Part IV, Item 15(a) “Financial Statement and Schedules—Note 6 to the Consolidated Financial Statements—Derivatives” for details. |
(6) | In June 2016, the outstanding balance of the term loan was effectively fixed at 3.03% to 3.98% per annum through the use of an interest rate swap. See Part IV, Item 15(a) “Financial Statement and Schedules—Note 6 to the Consolidated Financial Statements—Derivatives” for details. |
(7) | On October 2, 2017, we completed an underwritten public offering of $400.0 million of senior notes, which were issued at 99.815% of par. |
(8) | Monthly debt service includes annual debt amortization payments based on a 30-year amortization schedule with a balloon payment at maturity. |
(9) | On February 1, 2018, we repaid the full outstanding balance of the mortgage loan secured by our Rincon Center property. |
(10) | This loan bears interest only. Interest on the full loan amount has been effectively fixed at 3.71% per annum through use of an interest rate swap. See Part IV, Item 15(a) “Financial Statement and Schedules—Note 6 to the Consolidated Financial Statements—Derivatives” for details. |
(11) | We have a 55% ownership interest in the consolidated joint venture that owns the Hill7 property. The full amount of the loan is shown. This loan bears interest only at 3.38% until November 6, 2026, at which time the interest rate will increase and monthly debt service will include principle payments with a balloon payment at maturity. |
(12) | On November 16, 2017, we sold our ownership interest in the consolidated join venture that owned Pinnacle I and Pinnacle II. The debt balances related to these properties were classified as held for sale at December 31, 2016. |
(13) | Excludes deferred financing costs related to properties held for sale and amounts related to establishing our unsecured revolving credit facility. |
67
The operating partnership was in compliance with its financial covenants as of December 31, 2017.
Liquidity Uses
Contractual Obligations
The following table provides information with respect to our commitments at December 31, 2017, including any guaranteed or minimum commitments under contractual obligations.
Payments Due by Period | ||||||||||||||||||||
Contractual Obligation | Total | Less than 1 year | 1-3 years | 3-5 years | More than 5 years | |||||||||||||||
Principal payments on mortgage loans(1) | $ | 2,439,311 | $ | 98,930 | $ | 545,664 | $ | 500,717 | $ | 1,294,000 | ||||||||||
Interest payments—fixed rate(1)(2) | 469,218 | 57,477 | 111,509 | 110,370 | 189,862 | |||||||||||||||
Interest payments—variable rate(3) | 101,147 | 30,357 | 49,004 | 21,786 | — | |||||||||||||||
Capital improvements(4) | 239,272 | 239,272 | — | — | — | |||||||||||||||
Ground leases(5) | 452,825 | 14,111 | 28,322 | 28,322 | 382,070 | |||||||||||||||
Total | $ | 3,701,773 | $ | 440,147 | $ | 734,499 | $ | 661,195 | $ | 1,865,932 | ||||||||||
_____________
(1) | Amount includes debt secured by our Rincon Center property that was paid in full on February 1, 2018. The mortgage loan was scheduled to mature in May 2018. |
(2) | Interest rates with respect to indebtedness are calculated on the basis of a 360-day year for the actual days elapsed. Reflects our projected interest obligations for fixed rate debts. |
(3) | Interest rates with respect to indebtedness are calculated on the basis of a 360-day year for the actual days elapsed. Reflects our projected interest obligations for variable rate debts, including those that are effectively fixed as a result of derivatives and in instances where interest is paid based on a LIBOR margin, we used the average December LIBOR and current margin based on the leverage ratio as of December 31, 2017. |
(4) | Amount represents capital improvement commitments related to development and redevelopment projects and contractual obligations related to tenant improvements as of December 31, 2017. Contractual obligations, of $1.0 million, related to properties classified as held for sale as of December 31, 2017 are included in the amounts disclosed. |
(5) | Reflects minimum lease payments through the contractual lease expiration date before the impact of extension options. Refer to Part IV, Item 15(a) “Financial Statement and Schedules—Note 7 to the Consolidated Financial Statements—Future Minimum Rent and Lease Payments” for details of our ground lease agreements. Contractual obligations of $1.1 million related to 9300 Wilshire, which is classified as held for sale as of December 31, 2017, is included in the amounts disclosed. |
Off-Balance Sheet Arrangements
At December 31, 2017, we did not have any off-balance sheet arrangements.
Cash Flows
Comparison of the year ended December 31, 2017 to the year ended December 31, 2016 is as follows:
Year Ended December 31, | ||||||||||||||
2017 | 2016 | Dollar Change | Percentage Change | |||||||||||
Net cash provided by operating activities | $ | 292,959 | $ | 226,774 | $ | 66,185 | 29.2 | % | ||||||
Net cash used in investing activities | (333,038 | ) | (524,897 | ) | 191,859 | (36.6 | ) | |||||||
Net cash provided by financing activities | 33,167 | 334,754 | (301,587 | ) | (90.1 | ) | ||||||||
Cash and cash equivalents and restricted cash were $101.3 million and $108.2 million at December 31, 2017 and 2016, respectively.
68
Operating Activities
Net cash provided by operating activities increased by $66.2 million, or 29.2%, to $293.0 million for the year ended December 31, 2017 as compared to $226.8 million for the year ended December 31, 2016. The change resulted primarily from an increase in cash NOI, as defined, from our office and media and entertainment properties, driven by our Sunset Las Palmas Studios acquisition, the 2016 Acquisitions and higher rental revenue across our portfolio, partially offset by lower cash NOI related to One Bay Plaza (sold in June 2016), 12655 Jefferson (sold in November 2016), 222 Kearny (sold in February 2017), Pinnacle I and Pinnacle II (sold in November 2017) properties.
Investing Activities
Net cash used in investing activities decreased by $191.9 million, or 36.6%, to $333.0 million for the year ended December 31, 2017 as compared to $524.9 million for year ended December 31, 2016. The change resulted primarily from a reduction in cash used to acquire real estate, partially offset by a reduction in proceeds from sales of real estate properties and an increase in cash used for additions to investment in real estate.
Financing Activities
Net cash provided by financing activities decreased by $301.6 million, or 90.1%, to $33.2 million for the year ended December 31, 2017 as compared to $334.8 million for the year ended December 31, 2016. The change resulted primarily from a reduction in proceeds from the sale of stock and a reduction in proceeds from notes payable, partially offset by a reduction in payment for redemption of common units in our operating partnership.
Non-GAAP Supplemental Financial Measure: Funds From Operations
We calculate FFO in accordance with the White Paper on FFO approved by the Board of Governors of the National Association of Real Estate Investment Trusts. The White Paper defines FFO as net income or loss calculated in accordance with GAAP, excluding extraordinary items, as defined by GAAP, gains and losses from sales of depreciable real estate and impairment write-downs associated with depreciable real estate, plus real estate-related depreciation and amortization (excluding amortization of deferred financing costs and depreciation of non-real estate assets) and after adjustment for unconsolidated partnerships and joint ventures. The calculation of FFO includes the amortization of deferred revenue related to tenant-funded tenant improvements and excludes the depreciation of the related tenant improvement assets. We believe that FFO is a useful supplemental measure of our operating performance. The exclusion from FFO of gains and losses from the sale of operating real estate assets allows investors and analysts to readily identify the operating results of the assets that form the core of our activity and assists in comparing those operating results between periods. Also, because FFO is generally recognized as the industry standard for reporting the operations of REITs, it facilitates comparisons of operating performance to other REITs. However, other REITs may use different methodologies to calculate FFO, and accordingly, our FFO may not be comparable to all other REITs.
Implicit in historical cost accounting for real estate assets in accordance with GAAP is the assumption that the value of real estate assets diminishes predictably over time. Since real estate values have historically risen or fallen with market conditions, many industry investors and analysts have considered presentations of operating results for real estate companies using historical cost accounting alone to be insufficient. Because FFO excludes depreciation and amortization of real estate assets, we believe that FFO along with the required GAAP presentations provides a more complete measurement of our performance relative to our competitors and a more appropriate basis on which to make decisions involving operating, financing and investing activities than the required GAAP presentations alone would provide. We use FFO per share to calculate annual cash bonuses for certain employees.
However, FFO should not be viewed as an alternative measure of our operating performance because it does not reflect either depreciation and amortization costs or the level of capital expenditures and leasing costs necessary to maintain the operating performance of our properties, which are significant economic costs and could materially impact our results from operations.
69
The following table presents a reconciliation of net income to FFO:
Year Ended December 31, | |||||||
2017 | 2016 | ||||||
Net income | $ | 94,561 | $ | 43,758 | |||
Adjustments: | |||||||
Depreciation and amortization of real estate assets | 281,773 | 267,245 | |||||
Gains on sale of real estate | (45,574 | ) | (30,389 | ) | |||
FFO attributable to non-controlling interests | (24,068 | ) | (18,817 | ) | |||
Net income attributable to preferred units | (636 | ) | (636 | ) | |||
FFO to common stockholders and unitholders | $ | 306,056 | $ | 261,161 | |||
ITEM 7A. Quantitative and Qualitative Disclosures About Market Risk
The primary market risk we face is interest rate risk. Our future income, cash flows and fair values relevant to financial instruments are dependent upon prevalent market interest rates. Market risk refers to the risk of loss from adverse changes in market prices and interest rates. As more fully described below, we use derivatives to manage, or hedge, interest rate risks related to our borrowings. We only enter into contracts with major financial institutions based on their credit rating and other factors. For a summary of our outstanding indebtedness, see Item 7 “Management’s Discussion and Analysis of Financial Condition and Results of Operations—Liquidity and Capital Resources.” For a summary of our derivatives, refer to Part IV, Item 15(a) “Financial Statement and Schedules—Note 6 to the Consolidated Financial Statements—Derivatives.”
Interest risk amounts were determined by considering the impact of hypothetical interest rates on our financial instruments. These analyses do not consider the effect of any change in overall economic activity that could occur in that environment. Further, in the event of a change of that magnitude, we may take actions to further mitigate our exposure to the change. However, due to the uncertainty of the specific actions that would be taken and their possible effects, these analyses assume no changes in our financial structure.
As of December 31, 2017, we had a $64.5 million mortgage loan secured by our Met Park North property. The full loan is subject to a derivative that swaps one-month LIBOR to a fixed rate of 2.16% through the loan’s maturity on August 1, 2020. Therefore, the interest rate is effectively hedged at 3.71%.
An additional $300.0 million of the 5-Year Term Loan due April 2020 has been effectively hedged through two interest rate swaps, each with a notional amount of $150.0 million. Both derivatives swap one-month LIBOR, which includes a 0.00% floor, to a fixed rate of 1.45% through the loan’s maturity. Therefore, the interest rate is effectively hedged within a range of 2.75% to 3.65%.
An additional $350.0 million of the 7-Year Term Loan due April 2022 has been effectively hedged through two interest rate swaps. Both derivatives swap one-month LIBOR, which includes a 0.00% floor, to a fixed rate of 1.76% through the loan’s maturity. Therefore, the interest rate is effectively hedged within a range of 3.36% to 4.31%.
An additional $125.0 million of the 7-Year Term Loan due November 2022 has been effectively hedged through an interest rate swap. The derivative swapped one-month LIBOR, which includes a 0.00% floor, to a fixed rate of 1.43% through the loan’s maturity. Therefore, the interest rate is effectively hedged within a range of 3.03% to 3.98%.
The remaining variable rate debt, which includes the $100.0 million drawn under our unsecured revolving credit facility, the $75.0 million loan drawn under our 5-Year Term Loan due November 2020 and the $5.0 million on our mortgage loan secured by Sunset Gower Studios/Sunset Bronson Studios, is not subject to derivatives. For sensitivity purposes, if one-month LIBOR as of December 31, 2017 was to increase by 100 basis points, or 1.0%, the resulting increase in annual interest expense would impact our future earnings and cash flows by $1.8 million.
As of December 31, 2017, we had outstanding notes payable of $2.44 billion (before $17.9 million of net deferred financing costs and loan discounts), of which $1.02 billion, or 41.8%, was variable rate debt. $839.5 million of the variable rate debt is subject to derivatives. As of December 31, 2017, the estimated fair value of our fixed rate secured mortgage loans was $1.40 billion. The estimated fair value of our variable rate debt equals the carrying value.
70
ITEM 8. Financial Statements and Supplementary Data
Our consolidated financial statements included in this Annual Report on Form 10-K are listed in Part IV, Item 15(a) of this report.
ITEM 9. Changes in and Disagreements with Accountants on Accounting and Financial Disclosure
Not applicable.
ITEM 9A. Controls and Procedures
Disclosure Controls and Procedures (Hudson Pacific Properties, Inc.)
Hudson Pacific Properties, Inc. maintains disclosure controls and procedures (as defined in Rule 13a-15(e) or Rule 15d-15(e) under the Exchange Act) that are designed to ensure that information required to be disclosed in Hudson Pacific Properties, Inc.’s reports under the Exchange Act is processed, recorded, summarized and reported within the time periods specified in the SEC’s rules and forms and that such information is accumulated and communicated to management, including the Chief Executive Officer and Chief Financial Officer, as appropriate, to allow for timely decisions regarding required disclosure. In designing and evaluating the disclosure controls and procedures, management recognizes that any controls and procedures, no matter how well designed and operated, can provide only reasonable assurance of achieving the desired control objectives, and management is required to apply its judgment in evaluating the cost-benefit relationship of possible controls and procedures.
As required by Rule 13a-15(b) under the Exchange Act, Hudson Pacific Properties, Inc. carried out an evaluation, under the supervision and with the participation of management, including the Chief Executive Officer and Chief Financial Officer, of the effectiveness of the design and operation of the disclosure controls and procedures as of the end of the period covered by this report.
Based on the foregoing, our Chief Executive Officer and Chief Financial Officer concluded, as of that time, that Hudson Pacific Properties, Inc.’s disclosure controls and procedures were effective in providing a reasonable level of assurance that information Hudson Pacific Properties, Inc. is required to disclose in reports that Hudson Pacific Properties, Inc. files under the Exchange Act is processed, recorded, summarized and reported within the time periods specified in the SEC’s rules and forms and that such information is accumulated and communicated to management, including the Chief Executive Officer and Chief Financial Officer, as appropriate, to allow for timely decisions regarding required disclosure.
Disclosure Controls and Procedures (Hudson Pacific Properties, L.P.)
Hudson Pacific Properties, L.P. maintains disclosure controls and procedures (as defined in Rule 13a-15(e) or Rule 15d-15(e) under the Exchange Act) that are designed to ensure that information required to be disclosed in Hudson Pacific Properties, L.P.’s reports under the Exchange Act is processed, recorded, summarized and reported within the time periods specified in the SEC’s rules and forms and that such information is accumulated and communicated to management, including the Chief Executive Officer and Chief Financial Officer of Hudson Pacific Properties, Inc. (the sole general partner of Hudson Pacific Properties, L.P.), as appropriate, to allow for timely decisions regarding required disclosure. In designing and evaluating the disclosure controls and procedures, management recognizes that any controls and procedures, no matter how well designed and operated, can provide only reasonable assurance of achieving the desired control objectives, and management is required to apply its judgment in evaluating the cost-benefit relationship of possible controls and procedures.
As required by Rule 13a-15(b) under the Exchange Act, Hudson Pacific Properties, L.P. carried out an evaluation, under the supervision and with the participation of management, including the Chief Executive Officer and Chief Financial Officer of Hudson Pacific Properties, Inc. (the sole general partner of Hudson Pacific Properties, L.P.), of the effectiveness of the design and operation of the disclosure controls and procedures as of the end of the period covered by this report.
Based on the foregoing, the Chief Executive Officer and Chief Financial Officer of Hudson Pacific Properties, Inc. (the sole general partner of Hudson Pacific Properties, L.P.) concluded, as of that time, that Hudson Pacific Properties, L.P.’s disclosure controls and procedures were effective in providing a reasonable level of assurance that information Hudson Pacific Properties, L.P. is required to disclose in reports that Hudson Pacific Properties, L.P. files under the Exchange Act is processed, recorded, summarized and reported within the time periods specified in the SEC’s rules and forms and that such information is accumulated and communicated to management, including the Chief Executive Officer and Chief Financial
71
Officer of Hudson Pacific Properties, Inc. (the sole general partner of Hudson Pacific Properties, L.P.), as appropriate, to allow for timely decisions regarding required disclosure.
Changes in Internal Control Over Financial Reporting (Hudson Pacific Properties, Inc.)
There have been no changes that occurred during the fourth quarter of the year covered by this report in Hudson Pacific Properties, Inc.’s internal control over financial reporting identified in connection with the evaluation referenced above that have materially affected, or are reasonably likely to materially affect, our internal control over financial reporting.
Changes in Internal Control Over Financial Reporting (Hudson Pacific Properties, L.P.)
There have been no changes that occurred during the fourth quarter of the year covered by this report in Hudson Pacific Properties, L.P.’s internal control over financial reporting identified in connection with the evaluation referenced above that have materially affected, or are reasonably likely to materially affect, our internal control over financial reporting.
Management’s Annual Report on Internal Control over Financial Reporting (Hudson Pacific Properties, Inc.)
Management is responsible for establishing and maintaining adequate internal control over financial reporting, as defined in Rules 13a-15(f) and 15d-15(f) under the Exchange Act.
Hudson Pacific Properties, Inc.’s system of internal control is designed to provide reasonable assurance regarding the reliability of financial reporting and preparation of Hudson Pacific Properties, Inc.’s financial statements for external reporting purposes in accordance with GAAP. Hudson Pacific Properties, Inc.’s management, including the Chief Executive Officer and Chief Financial Officer, assessed the effectiveness of Hudson Pacific Properties, Inc.’s internal control over financial reporting as of December 31, 2017. In conducting its assessment, management used the criteria issued by the Committee of Sponsoring Organizations of the Treadway Commission on Internal Control-Integrated Framework (2013 Framework). Based on this assessment, management concluded that, as of December 31, 2017, Hudson Pacific Properties, Inc.’s internal control over financial reporting was effective based on those criteria.
Management, including the Chief Executive Officer and Chief Financial Officer of Hudson Pacific Properties, Inc., does not expect that Hudson Pacific Properties, Inc.’s disclosure controls and procedures, or Hudson Pacific Properties, Inc.’s internal controls will prevent all error and fraud. A control system, no matter how well conceived and operated, can provide only reasonable, not absolute, assurance that the objectives of the control system are met. Further, the design of a control system must reflect the fact that there are resource constraints and the benefit of controls must be considered relative to their costs. Because of the inherent limitations in all control systems, no evaluation of controls can provide absolute assurance that all control issues and instances of fraud, if any, have been detected.
Management’s Annual Report on Internal Control over Financial Reporting (Hudson Pacific Properties, L.P.)
Management is responsible for establishing and maintaining adequate internal control over financial reporting, as defined in Rules 13a-15(f) and 15d-15(f) under the Exchange Act.
Hudson Pacific Properties, L.P.’s system of internal control is designed to provide reasonable assurance regarding the reliability of financial reporting and preparation of Hudson Pacific Properties, L.P.’s financial statements for external reporting purposes in accordance with GAAP. Hudson Pacific Properties, L.P.’s management, including the Chief Executive Officer and Chief Financial Officer of Hudson Pacific Properties, Inc. (the sole general partner of Hudson Pacific Properties, L.P.), assessed the effectiveness of Hudson Pacific Properties, L.P.’s internal control over financial reporting as of December 31, 2017. In conducting its assessment, management used the criteria issued by the Committee of Sponsoring Organizations of the Treadway Commission on Internal Control-Integrated Framework (2013 Framework). Based on this assessment, management concluded that, as of December 31, 2017, Hudson Pacific Properties, L.P.’s internal control over financial reporting was effective based on those criteria.
Management, including the Chief Executive Officer and Chief Financial Officer of Hudson Pacific Properties, Inc. (the sole general partner of Hudson Pacific Properties, L.P.), does not expect that Hudson Pacific Properties, L.P.’s disclosure controls and procedures, or Hudson Pacific Properties, L.P.’s internal controls will prevent all error and fraud. A control system, no matter how well conceived and operated, can provide only reasonable, not absolute, assurance that the objectives of the control system are met. Further, the design of a control system must reflect the fact that there are resource constraints and the benefit of controls must be considered relative to their costs. Because of the inherent limitations in all control
72
systems, no evaluation of controls can provide absolute assurance that all control issues and instances of fraud, if any, have been detected.
Attestation Report of the Registered Accounting Firm (Hudson Pacific Properties, Inc.)
The effectiveness of Hudson Pacific Properties, Inc.’s internal control over financial reporting as of December 31, 2017, has been audited by Ernst & Young LLP, the independent registered public accounting firm that audited the consolidated financial statements included in this annual report, as stated in their report appearing on page F-2, which expresses an unqualified opinion on the effectiveness of Hudson Pacific Properties, Inc.’s internal control over financial reporting as of December 31, 2017.
ITEM 9B. Other Information
Not applicable.
73
PART III
ITEM 10. Directors, Executive Officers and Corporate Governance
The information required by Item 10 is incorporated by reference from our definitive proxy statement for our annual stockholders’ meeting presently scheduled to be held in May 2018. We intend to disclose any amendment to, or waiver from, our code of ethics within four business days following the date of the amendment or waiver.
ITEM 11. Executive Compensation
The information required by Item 11 is incorporated by reference from our definitive proxy statement for our annual stockholders’ meeting presently scheduled to be held in May 2018.
ITEM 12. Security Ownership of Certain Beneficial Owners and Management and Related Stockholder Matters
The information required by Item 12 is incorporated by reference from our definitive proxy statement for our annual stockholders’ meeting presently scheduled to be held in May 2018.
ITEM 13. Certain Relationships and Related Transactions, and Director Independence
The information required by Item 13 is incorporated by reference from our definitive proxy statement for our annual stockholders’ meeting presently scheduled to be held in May 2018.
ITEM 14. Principal Accountant Fees and Services
The information required by Item 14 is incorporated by reference from our definitive proxy statement for our annual stockholders’ meeting presently scheduled to be held in May 2018.
PART IV
ITEM 15. Exhibits, Financial Statement Schedules
(a)(1) and (2) Financial Statements and Schedules
The following consolidated financial information is included as a separate section of this Annual Report on Form 10-K:
74
FINANCIAL STATEMENTS OF HUDSON PACIFIC PROPERTIES, INC. | ||
FINANCIAL STATEMENTS OF HUDSON PACIFIC PROPERTIES, L.P. | ||
All other schedules are omitted since the required information is not present in amounts sufficient to require submission of the schedule or because the information required is included in the financial statements and notes thereto.
75
(3) Exhibits
Incorporated by Reference | ||||||||||
Exhibit No. | Description | Form | File No. | Exhibit No. | Filing Date | |||||
3.1 | S-11/A | 333-164916 | 3.1 | May 12, 2010 | ||||||
3.2 | S-11/A | 333-170751 | 3.3 | December 6, 2010 | ||||||
3.3 | 8-K | 001-34789 | 3.1 | January 12, 2015 | ||||||
3.4 | 10-K | 001-34789 | 10.1 | February 26, 2016 | ||||||
3.5 | 10-Q | 001-34789 | 3.4 | November 4, 2016 | ||||||
4.1 | S-11/A | 333-164916 | 4.1 | June 14, 2010 | ||||||
4.2 | 8-K | 001-34789 | 4.1 | October 2, 2017 | ||||||
4.3 | 8-K | 001-34789 | 4.2 | October 2, 2017 | ||||||
10.1 | S-11 | 333-170751 | 10.2 | November 22, 2010 | ||||||
10.2 | S-11 | 333-170751 | 10.3 | November 22, 2010 | ||||||
10.3 | S-11 | 333-170751 | 10.5 | November 22, 2010 | ||||||
10.4 | S-11 | 333-170751 | 10.6 | November 22, 2010 | ||||||
10.5 | S-11 | 333-170751 | 10.7 | November 22, 2010 | ||||||
10.6 | S-11 | 333-170751 | 10.8 | November 22, 2010 | ||||||
10.7 | S-11 | 333-170751 | 10.10 | November 22, 2010 | ||||||
10.8 | S-11 | 333-170751 | 10.11 | November 22, 2010 | ||||||
10.9 | S-11 | 333-170751 | 10.12 | November 22, 2010 | ||||||
10.10 | S-11 | 333-170751 | 10.13 | November 22, 2010 | ||||||
10.11 | S-11 | 333-170751 | 10.14 | November 22, 2010 | ||||||
10.12 | S-11/A | 333-164916 | 10.5 | June 14, 2010 | ||||||
10.13 | S-11/A | 333-170751 | 10.17 | December 6, 2010 | ||||||
10.14 | S-11/A | 333-164916 | 10.11 | April 9, 2010 | ||||||
10.15 | S-11/A | 333-164916 | 10.12 | April 9, 2010 | ||||||
10.16 | S-11/A | 333-164916 | 10.13 | April 9, 2010 | ||||||
10.17 | S-11/A | 333-164916 | 10.14 | April 9, 2010 | ||||||
10.18 | S-11/A | 333-164916 | 10.16 | April 9, 2010 | ||||||
10.19 | S-11/A | 333-164916 | 10.17 | April 9, 2010 | ||||||
10.20 | 8-K | 001-34789 | 10.3 | July 1, 2010 | ||||||
10.21 | S-11/A | 333-164916 | 10.20 | June 11, 2010 | ||||||
76
Incorporated by Reference | ||||||||||
Exhibit No. | Description | Form | File No. | Exhibit No. | Filing Date | |||||
10.22 | S-11/A | 333-164916 | 10.24 | June 22, 2010 | ||||||
10.23 | S-11/A | 333-164916 | 10.25 | June 22, 2010 | ||||||
10.24 | S-11/A | 333-164916 | 10.26 | June 22, 2010 | ||||||
10.25 | S-11/A | 333-164916 | 10.27 | June 22, 2010 | ||||||
10.26 | S-11/A | 333-164916 | 10.28 | June 22, 2010 | ||||||
10.27 | S-11/A | 333-164916 | 10.29 | June 22, 2010 | ||||||
10.28 | 8-K | 001-34789 | 10.5 | July 1, 2010 | ||||||
10.29 | S-11/A | 333-170751 | 10.45 | December 6, 2010 | ||||||
10.30 | 8-K | 001-34789 | 10.1 | December 21, 2010 | ||||||
10.31 | S-11 | 333-173487 | 10.48 | April 14, 2011 | ||||||
10.32 | S-11 | 333-173487 | 10.49 | April 14, 2011 | ||||||
10.33 | 8-K | 001-34789 | 4.1 | May 4, 2011 | ||||||
10.34 | 8-K | 001-34789 | 10.1 | May 4, 2011 | ||||||
10.35 | 8-K | 001-34789 | 10.1 | January 6, 2012 | ||||||
10.36 | 8-K | 001-34789 | 10.1 | January 7, 2013 | ||||||
10.37 | 8-K | 001-34789 | 10.1 | July 1, 2013 | ||||||
10.38 | 10-Q | 001-34789 | 10.66 | November 7, 2013 | ||||||
10.39 | 8-K | 001-34789 | 99.1 | November 22, 2013 | ||||||
10.40 | 8-K | 001-34789 | 10.1 | January 3, 2014 | ||||||
10.41 | 10-K | 001-34789 | 10.70 | March 3, 2014 | ||||||
10.42 | 10-Q | 001-34789 | 10.76 | August 7, 2014 | ||||||
10.43 | 10-Q | 001-34789 | 10.77 | August 7, 2014 | ||||||
10.44 | 10-Q | 001-34789 | 10.78 | August 7, 2014 | ||||||
10.45 | 10-Q | 001-34789 | 10.79 | August 7, 2014 | ||||||
10.46 | 8-K | 001-34789 | 10.1 | December 11, 2014 | ||||||
77
Incorporated by Reference | ||||||||||
Exhibit No. | Description | Form | File No. | Exhibit No. | Filing Date | |||||
10.47 | 8-K | 001-34789 | 10.2 | December 11, 2014 | ||||||
10.48 | 10-K | 001-34789 | 10.84 | March 2, 2015 | ||||||
10.49 | 8-K | 001-34789 | 10.1 | January 2, 2015 | ||||||
10.50 | 8-K | 001-34789 | 10.1 | January 12, 2015 | ||||||
10.51 | 8-K | 001-34789 | 10.1 | March 12, 2015 | ||||||
10.52 | 8-K | 001-34789 | 10.2 | March 12, 2015 | ||||||
10.53 | 10-Q | 001-34789 | 10.91 | August 10, 2015 | ||||||
10.54 | 10-Q | 001-34789 | 10.93 | November 6, 2015 | ||||||
10.55 | 8-K | 001-34789 | 10.2 | November 20, 2015 | ||||||
10.56 | 8-K | 001-34789 | 10.3 | November 20, 2015 | ||||||
10.57 | 8-K | 001-34789 | 10.4 | November 20, 2015 | ||||||
10.58 | 8-K | 001-34789 | 10.2 | December 21, 2015 | ||||||
10.59 | 8-K | 001-34789 | 10.3 | December 21, 2015 | ||||||
10.60 | 8-K | 001-34789 | 10.4 | December 21, 2015 | ||||||
10.61 | 8-K | 001-34789 | 10.5 | December 21, 2015 | ||||||
10.62 | 8-K | 001-34789 | 10.6 | December 21, 2015 | ||||||
10.63 | 10-K | 001-34789 | 10.95 | February 26, 2016 | ||||||
10.64 | 10-K | 001-34789 | 10.96 | February 26, 2016 | ||||||
10.65 | 8-K | 001-34789 | 10.1 | March 21, 2016 | ||||||
10.66 | 8-K | 001-34789 | 10.2 | March 21, 2016 | ||||||
10.67 | 10-Q | 001-34789 | 10.8 | August 4, 2016 | ||||||
10.68 | 8-K | 001-34789 | 10.1 | February 10, 2017 | ||||||
10.69 | 8-K | 001-34789 | 10.2 | February 10, 2017 | ||||||
10.70 | 8-K | 001-34789 | 10.1 | May 25, 2017 | ||||||
10.71 | 10-Q | 001-34789 | 10.2 | November 6, 2017 | ||||||
10.72 | ||||||||||
10.73 | ||||||||||
12.1 | ||||||||||
12.2 | ||||||||||
21.1 | ||||||||||
23.1 | ||||||||||
31.1 | ||||||||||
78
Incorporated by Reference | ||||||||||
Exhibit No. | Description | Form | File No. | Exhibit No. | Filing Date | |||||
31.2 | ||||||||||
31.3 | ||||||||||
31.4 | ||||||||||
32.1 | ||||||||||
32.2 | ||||||||||
99.1 | 8-K | 001-34789 | 99.1 | January 23, 2012 | ||||||
101 | The following financial information from Hudson Pacific Properties, Inc.’s Annual Report on Form 10-K for the year ended December 31, 2017 formatted in XBRL (eXtensible Business Reporting Language): (i) Consolidated Balance Sheets, (ii) Consolidated Statements of Operations, (iii) Consolidated Statements of Comprehensive Income (Loss), (iv) Consolidated Statements of Equity, (v) Consolidated Statements of Capital, (vi) Consolidated Statements of Cash Flows and (vii) Notes to Consolidated Financial Statements** | |||||||||
* | Denotes a management contract or compensatory plan or arrangement. | |||||||||
** | Pursuant to Rule 406T of Regulation S-T, the interactive data files on Exhibit 101 hereto are deemed not filed or part of a registration statement or prospectus for purposes of Section 11 or 12 of the Securities Act of 1933, as amended, are deemed not filed for purposes of Section 18 of the Securities and Exchange Act of 1934, as amended, and otherwise are not subject to liability under those sections. | |||||||||
79
SIGNATURES
Pursuant to the requirements of Section 13 or 15(d) of the Securities Exchange Act of 1934, Hudson Pacific Properties, Inc. has duly caused this report to be signed on its behalf by the undersigned, thereunto duly authorized.
HUDSON PACIFIC PROPERTIES, INC. | |
February 15, 2018 | /s/ VICTOR J. COLEMAN |
VICTOR J. COLEMAN | |
Chief Executive Officer (Principal Executive Officer) | |
POWER OF ATTORNEY
KNOW ALL PERSONS BY THESE PRESENTS, that each person whose signature appears below does hereby constitute and appoint Victor J. Coleman and Mark T. Lammas, and each of them singly, our true and lawful attorneys with full power to them, and each of them singly, to sign for us and in our names in the capacities indicated below, the Form 10-K filed herewith and any and all amendments to said Form 10-K, and generally to do all such things in our names and in our capacities as officers and directors to enable Hudson Pacific Properties, Inc. to comply with the provisions of the Securities Exchange Act of 1934, as amended, and all requirements of the Securities and Exchange Commission in connection therewith, hereby ratifying and confirming our signatures as they may be signed by our said attorneys, or any of them, to said Form 10-K and any and all amendments thereto.
Pursuant to the requirements of the Securities Exchange Act of 1934, as amended, this report has been signed below by the following persons on behalf of the registrant and in the capacities and on the dates indicated.
Signature | Title | Date | ||
/S/ VICTOR J. COLEMAN | Chief Executive Officer, President and Chairman of the Board of Directors (Principal Executive Officer) | February 15, 2018 | ||
Victor J. Coleman | ||||
/S/ MARK T. LAMMAS | Chief Operating Officer, Chief Financial Officer and Treasurer (Principal Financial Officer) | February 15, 2018 | ||
Mark T. Lammas | ||||
/S/ HAROUT K. DIRAMERIAN | Chief Accounting Officer (Principal Accounting Officer) | February 15, 2018 | ||
Harout K. Diramerian | ||||
/S/ THEODORE R. ANTENUCCI | Director | February 15, 2018 | ||
Theodore R. Antenucci | ||||
/S/ RICHARD B. FRIED | Director | February 15, 2018 | ||
Richard B. Fried | ||||
/S/ JONATHAN M. GLASER | Director | February 15, 2018 | ||
Jonathan M. Glaser | ||||
/S/ ROBERT L. HARRIS II | Director | February 15, 2018 | ||
Robert L. Harris II | ||||
/S/ MARK D. LINEHAN | Director | February 15, 2018 | ||
Mark D. Linehan | ||||
/S/ ROBERT M. MORAN, JR. | Director | February 15, 2018 | ||
Robert M. Moran, Jr. | ||||
/S/ MICHAEL NASH | Director | February 15, 2018 | ||
Michael Nash | ||||
/S/ BARRY A. PORTER | Director | February 15, 2018 | ||
Barry A. Porter | ||||
/S/ ANDREA L. WONG | Director | February 15, 2018 | ||
Andrea L. Wong | ||||
80
SIGNATURES
Pursuant to the requirements of Section 13 or 15(d) of the Securities Exchange Act of 1934, Hudson Pacific Properties, L.P. has duly caused this report to be signed on its behalf by the undersigned, thereunto duly authorized.
HUDSON PACIFIC PROPERTIES, L.P. | |
February 15, 2018 | /s/ VICTOR J. COLEMAN |
VICTOR J. COLEMAN | |
Chief Executive Officer (Principal Executive Officer) | |
POWER OF ATTORNEY
KNOW ALL PERSONS BY THESE PRESENTS, that each person whose signature appears below does hereby constitute and appoint Victor J. Coleman and Mark T. Lammas, and each of them singly, our true and lawful attorneys with full power to them, and each of them singly, to sign for us and in our names in the capacities indicated below, the Form 10-K filed herewith and any and all amendments to said Form 10-K, and generally to do all such things in our names and in our capacities as officers and directors to enable Hudson Pacific Properties, Inc. to comply with the provisions of the Securities Exchange Act of 1934, as amended, and all requirements of the Securities and Exchange Commission in connection therewith, hereby ratifying and confirming our signatures as they may be signed by our said attorneys, or any of them, to said Form 10-K and any and all amendments thereto.
Pursuant to the requirements of the Securities Exchange Act of 1934, as amended, this report has been signed below by the following persons on behalf of the registrant and in the capacities and on the dates indicated.
Signature | Title | Date | ||
/S/ VICTOR J. COLEMAN | Chief Executive Officer, President and Chairman of the Board of Directors (Principal Executive Officer) | February 15, 2018 | ||
Victor J. Coleman | ||||
/S/ MARK T. LAMMAS | Chief Operating Officer, Chief Financial Officer and Treasurer (Principal Financial Officer) | February 15, 2018 | ||
Mark T. Lammas | ||||
/S/ HAROUT K. DIRAMERIAN | Chief Accounting Officer (Principal Accounting Officer) | February 15, 2018 | ||
Harout K. Diramerian | ||||
/S/ THEODORE R. ANTENUCCI | Director | February 15, 2018 | ||
Theodore R. Antenucci | ||||
/S/ RICHARD B. FRIED | Director | February 15, 2018 | ||
Richard B. Fried | ||||
/S/ JONATHAN M. GLASER | Director | February 15, 2018 | ||
Jonathan M. Glaser | ||||
/S/ ROBERT L. HARRIS II | Director | February 15, 2018 | ||
Robert L. Harris II | ||||
/S/ MARK D. LINEHAN | Director | February 15, 2018 | ||
Mark D. Linehan | ||||
/S/ ROBERT M. MORAN, JR. | Director | February 15, 2018 | ||
Robert M. Moran, Jr. | ||||
/S/ MICHAEL NASH | Director | February 15, 2018 | ||
Michael Nash | ||||
/S/ BARRY A. PORTER | Director | February 15, 2018 | ||
Barry A. Porter | ||||
/S/ ANDREA L. WONG | Director | February 15, 2018 | ||
Andrea L. Wong | ||||
81
Report of Management on Internal Control over Financial Reporting
The management of Hudson Pacific Properties, Inc. is responsible for establishing and maintaining adequate internal control over financial reporting, as defined in Rules 13a-15(f) and 15d-15(f) under the Securities Exchange Act of 1934.
Our system of internal control is designed to provide reasonable assurance regarding the reliability of financial reporting and preparation of our financial statements for external reporting purposes in accordance with United States generally accepted accounting principles. Our management, including the undersigned Chief Executive Officer and Chief Financial Officer, assessed the effectiveness of our internal control over financial reporting as of December 31, 2017. In conducting its assessment, management used the criteria issued by the Committee of Sponsoring Organizations of the Treadway Commission on Internal Control—Integrated Framework (2013 Framework). Based on this assessment, management concluded that, as of December 31, 2017, our internal control over financial reporting was effective based on those criteria.
Management, including our Chief Executive Officer and Chief Financial Officer, does not expect that our disclosure controls and procedures, or our internal controls will prevent all error and fraud. A control system, no matter how well conceived and operated, can provide only reasonable, not absolute, assurance that the objectives of the control system are met. Further, the design of a control system must reflect the fact that there are resource constraints and the benefit of controls must be considered relative to their costs. Because of the inherent limitations in all control systems, no evaluation of controls can provide absolute assurance that all control issues and instances of fraud, if any, have been detected.
The effectiveness of our internal control over financial reporting as of December 31, 2017, has been audited by Ernst & Young LLP, the independent registered public accounting firm that audited the consolidated financial statements included in this annual report, as stated in their report appearing on page F-2, which expresses an unqualified opinion on the effectiveness of our internal control over financial reporting as of December 31, 2017.
/S/ VICTOR J. COLEMAN |
Victor J. Coleman |
Chief Executive Officer, President and Chairman of the Board of Directors |
/S/ MARK T. LAMMAS |
Mark T. Lammas |
Chief Operating Officer, Chief Financial Officer and Treasurer |
F- 1
Report of Independent Registered Public Accounting Firm on Internal Control Over Financial Reporting
To the Board of Directors and Stockholders of
Hudson Pacific Properties, Inc.
Opinion on Internal Control over Financial Reporting
We have audited Hudson Pacific Properties, Inc.’s internal control over financial reporting as of December 31, 2017, based on criteria established in Internal Control-Integrated Framework issued by the Committee of Sponsoring Organizations of the Treadway Commission (2013 Framework) (the COSO criteria). In our opinion, Hudson Pacific Properties, Inc. (the Company) maintained, in all material respects, effective internal control over financial reporting as of December 31, 2017, based on the COSO criteria.
We also have audited, in accordance with the standards of the Public Company Accounting Oversight Board (United States) (PCAOB), the consolidated balance sheets of Hudson Pacific Properties, Inc. as of December 31, 2017 and 2016, and the related consolidated statements of operations, comprehensive income (loss), equity, and cash flows for each of the three years in the period ended December 31, 2017, and the related notes and financial statement schedule listed in the Index at Item 15(a), and our report dated February 15, 2018 expressed an unqualified opinion thereon.
Basis for Opinion
The Company’s management is responsible for maintaining effective internal control over financial reporting, and for its assessment of the effectiveness of internal control over financial reporting included in the accompanying Report of Management on Internal Control over Financial Reporting. Our responsibility is to express an opinion on the Company’s internal control over financial reporting based on our audit. We are a public accounting firm registered with the PCAOB and are required to be independent with respect to the Company in accordance with the U.S. federal securities laws and the applicable rules and regulations of the Securities and Exchange Commission and the PCAOB.
We conducted our audit in accordance with the standards of the PCAOB. Those standards require that we plan and perform the audit to obtain reasonable assurance about whether effective internal control over financial reporting was maintained in all material respects.
Our audit included obtaining an understanding of internal control over financial reporting, assessing the risk that a material weakness exists, testing and evaluating the design and operating effectiveness of internal control based on the assessed risk, and performing such other procedures as we considered necessary in the circumstances. We believe that our audit provides a reasonable basis for our opinion.
Definition and Limitations of Internal Control Over Financial Reporting
A company’s internal control over financial reporting is a process designed to provide reasonable assurance regarding the reliability of financial reporting and the preparation of financial statements for external purposes in accordance with generally accepted accounting principles. A company’s internal control over financial reporting includes those policies and procedures that (1) pertain to the maintenance of records that, in reasonable detail, accurately and fairly reflect the transactions and dispositions of the assets of the company; (2) provide reasonable assurance that transactions are recorded as necessary to permit preparation of financial statements in accordance with generally accepted accounting principles, and that receipts and expenditures of the company are being made only in accordance with authorizations of management and directors of the company; and (3) provide reasonable assurance regarding prevention or timely detection of unauthorized acquisition, use or disposition of the company’s assets that could have a material effect on the financial statements.
Because of its inherent limitations, internal control over financial reporting may not prevent or detect misstatements. Also, projections of any evaluation of effectiveness to future periods are subject to the risk that controls may become inadequate because of changes in conditions, or that the degree of compliance with the policies or procedures may deteriorate.
/s/ Ernst & Young LLP
Los Angeles, California
February 15, 2018
F- 2
Report of Independent Registered Public Accounting Firm
The Board of Directors and Stockholders of
Hudson Pacific Properties, Inc.
Opinion on the Financial Statements
We have audited the accompanying consolidated balance sheets of Hudson Pacific Properties, Inc. (the “Company”), as of December 31, 2017 and 2016, and the related consolidated statements of operations, comprehensive income (loss), equity, and cash flows for each of the three years in the period ended December 31, 2017, and the related notes and financial statement schedule listed in the Index at Item 15(a) (collectively referred to as the “consolidated financial statements”). In our opinion, the consolidated financial statements present fairly, in all material respects, the consolidated financial position of the Company at December 31, 2017 and 2016, and the consolidated results of its operations and its cash flows for each of the three years in the period ended December 31, 2017, in conformity with U.S. generally accepted accounting principles.
We also have audited, in accordance with the standards of the Public Company Accounting Oversight Board (United States) (PCAOB), the Company’s internal control over financial reporting as of December 31, 2017, based on criteria established in Internal Control-Integrated Framework issued by the Committee of Sponsoring Organizations of the Treadway Commission (2013 Framework) and our report dated February 15, 2018 expressed an unqualified opinion thereon.
Adoption of ASC No. 2017-01
As discussed in Note 2 to the consolidated financial statements, the Company changed its method for accounting for property acquisitions effective October 1, 2016 when the Company adopted ASU 2017-01, Business Combinations (Topic 805): Clarifying the Definition of a Business.
Basis for Opinion
These financial statements are the responsibility of the Company’s management. Our responsibility is to express an opinion on the Company’s financial statements based on our audits. We are a public accounting firm registered with the PCAOB and are required to be independent with respect to the Company in accordance with the U.S. federal securities laws and the applicable rules and regulations of the Securities and Exchange Commission and the PCAOB.
We conducted our audits in accordance with the standards of the PCAOB. Those standards require that we plan and perform the audit to obtain reasonable assurance about whether the financial statements are free of material misstatement, whether due to error or fraud. Our audits included performing procedures to assess the risks of material misstatement of the financial statements, whether due to error or fraud, and performing procedures that respond to those risks. Such procedures included examining, on a test basis, evidence regarding the amounts and disclosures in the financial statements. Our audits also included evaluating the accounting principles used and significant estimates made by management, as well as evaluating the overall presentation of the financial statements. We believe that our audits provide a reasonable basis for our opinion.
/s/ Ernst & Young LLP
We have served as the Company’s auditor since 2009.
Los Angeles, California
February 15, 2018
F- 3
HUDSON PACIFIC PROPERTIES, INC.
CONSOLIDATED BALANCE SHEETS
(in thousands, except share data)
December 31, 2017 | December 31, 2016 | ||||||
ASSETS | |||||||
Investment in real estate, at cost | $ | 6,423,441 | $ | 5,878,480 | |||
Accumulated depreciation and amortization | (533,498 | ) | (375,207 | ) | |||
Investment in real estate, net | 5,889,943 | 5,503,273 | |||||
Cash and cash equivalents | 78,922 | 83,015 | |||||
Restricted cash | 22,358 | 25,177 | |||||
Accounts receivable, net | 4,363 | 7,007 | |||||
Straight-line rent receivables, net | 109,457 | 79,209 | |||||
Deferred leasing costs and lease intangible assets, net | 244,554 | 288,929 | |||||
Prepaid expenses and other assets, net | 61,138 | 77,214 | |||||
Assets associated with real estate held for sale | 211,335 | 615,174 | |||||
TOTAL ASSETS | $ | 6,622,070 | $ | 6,678,998 | |||
LIABILITIES AND EQUITY | |||||||
Notes payable, net | $ | 2,421,380 | $ | 2,473,326 | |||
Accounts payable and accrued liabilities | 163,107 | 114,674 | |||||
Lease intangible liabilities, net | 49,930 | 73,267 | |||||
Security deposits and prepaid rent | 64,031 | 66,878 | |||||
Derivative liabilities | 265 | 1,303 | |||||
Liabilities associated with real estate held for sale | 2,216 | 236,623 | |||||
TOTAL LIABILITIES | 2,700,929 | 2,966,071 | |||||
6.25% Series A cumulative redeemable preferred units of the operating partnership | 10,177 | 10,177 | |||||
EQUITY | |||||||
Hudson Pacific Properties, Inc. stockholders’ equity: | |||||||
Common stock, $0.01 par value, 490,000,000 authorized, 155,602,508 shares and 136,492,235 shares outstanding at December 31, 2017 and 2016, respectively | 1,556 | 1,364 | |||||
Additional paid-in capital | 3,622,988 | 3,109,394 | |||||
Accumulated other comprehensive income | 13,227 | 9,496 | |||||
Accumulated deficit | — | (16,971 | ) | ||||
Total Hudson Pacific Properties, Inc. stockholders’ equity | 3,637,771 | 3,103,283 | |||||
Non-controlling interest—members in consolidated entities | 258,602 | 304,608 | |||||
Non-controlling interest—units in the operating partnership | 14,591 | 294,859 | |||||
TOTAL EQUITY | 3,910,964 | 3,702,750 | |||||
TOTAL LIABILITIES AND EQUITY | $ | 6,622,070 | $ | 6,678,998 | |||
F- 4
HUDSON PACIFIC PROPERTIES, INC.
CONSOLIDATED STATEMENTS OF OPERATIONS
(in thousands, except share data)
Year Ended December 31, | |||||||||||
2017 | 2016 | 2015 | |||||||||
REVENUES | |||||||||||
Office | |||||||||||
Rental | $ | 545,453 | $ | 486,956 | $ | 394,543 | |||||
Tenant recoveries | 92,244 | 84,386 | 66,235 | ||||||||
Parking and other | 29,413 | 21,894 | 20,940 | ||||||||
Total Office revenues | 667,110 | 593,236 | 481,718 | ||||||||
Media & Entertainment | |||||||||||
Rental | 36,529 | 26,837 | 23,027 | ||||||||
Tenant recoveries | 1,336 | 1,884 | 943 | ||||||||
Other property-related revenue | 22,805 | 17,380 | 14,849 | ||||||||
Other | 359 | 302 | 313 | ||||||||
Total Media & Entertainment revenues | 61,029 | 46,403 | 39,132 | ||||||||
TOTAL REVENUES | 728,139 | 639,639 | 520,850 | ||||||||
OPERATING EXPENSES | |||||||||||
Office operating expenses | 218,873 | 202,935 | 166,131 | ||||||||
Media & Entertainment operating expenses | 34,634 | 25,810 | 23,726 | ||||||||
General and administrative | 54,459 | 52,400 | 38,534 | ||||||||
Depreciation and amortization | 283,570 | 269,087 | 245,071 | ||||||||
TOTAL OPERATING EXPENSES | 591,536 | 550,232 | 473,462 | ||||||||
INCOME FROM OPERATIONS | 136,603 | 89,407 | 47,388 | ||||||||
OTHER EXPENSE (INCOME) | |||||||||||
Interest expense | 90,037 | 76,044 | 50,667 | ||||||||
Interest income | (97 | ) | (260 | ) | (124 | ) | |||||
Unrealized loss on ineffective portion of derivatives | 70 | 1,436 | — | ||||||||
Transaction-related expenses | 598 | 376 | 43,336 | ||||||||
Other (income) expense | (2,992 | ) | (1,558 | ) | 62 | ||||||
TOTAL OTHER EXPENSES | 87,616 | 76,038 | 93,941 | ||||||||
INCOME (LOSS) BEFORE GAINS ON SALE OF REAL ESTATE | 48,987 | 13,369 | (46,553 | ) | |||||||
Gains on sale of real estate | 45,574 | 30,389 | 30,471 | ||||||||
NET INCOME (LOSS) | 94,561 | 43,758 | (16,082 | ) | |||||||
Net income attributable to preferred stock and units | (636 | ) | (636 | ) | (12,105 | ) | |||||
Original issuance costs of redeemed Series B preferred stock | — | — | (5,970 | ) | |||||||
Net income attributable to participating securities | (1,003 | ) | (766 | ) | (356 | ) | |||||
Net income attributable to non-controlling interest in consolidated entities | (24,960 | ) | (9,290 | ) | (3,853 | ) | |||||
Net (income) loss attributable to non-controlling interest in the operating partnership | (375 | ) | (5,848 | ) | 21,969 | ||||||
Net income (loss) attributable to Hudson Pacific Properties, Inc. common stockholders | $ | 67,587 | $ | 27,218 | $ | (16,397 | ) | ||||
Basic and diluted per share amounts: | |||||||||||
Net income (loss) attributable to common stockholders—basic | $ | 0.44 | $ | 0.26 | $ | (0.19 | ) | ||||
Net income (loss) attributable to common stockholders—diluted | $ | 0.44 | $ | 0.25 | $ | (0.19 | ) | ||||
Weighted average shares of common stock outstanding—basic | 153,488,730 | 106,188,902 | 85,927,216 | ||||||||
Weighted average shares of common stock outstanding—diluted | 153,882,814 | 110,369,055 | 85,927,216 | ||||||||
The accompanying notes are an integral part of these consolidated financial statements.
F- 5
HUDSON PACIFIC PROPERTIES, INC.
CONSOLIDATED STATEMENTS OF COMPREHENSIVE INCOME (LOSS)
(in thousands)
Year Ended December 31, | |||||||||||
2017 | 2016 | 2015 | |||||||||
Net income (loss) | $ | 94,561 | $ | 43,758 | $ | (16,082 | ) | ||||
Other comprehensive income: change in fair value of derivatives | 7,398 | 5,942 | 2,597 | ||||||||
Comprehensive income (loss) | 101,959 | 49,700 | (13,485 | ) | |||||||
Comprehensive income attributable to preferred stock and units | (636 | ) | (636 | ) | (12,105 | ) | |||||
Comprehensive income attributable to redemption of Series B preferred stock | — | — | (5,970 | ) | |||||||
Comprehensive income attributable to participating securities | (1,003 | ) | (766 | ) | (356 | ) | |||||
Comprehensive income attributable to non-controlling interest in consolidated entities | (24,960 | ) | (9,290 | ) | (3,853 | ) | |||||
Comprehensive (income) loss attributable to non-controlling interest in the operating partnership | (420 | ) | (1,213 | ) | 20,734 | ||||||
Comprehensive income (loss) attributable to Hudson Pacific Properties, Inc. common stockholders | $ | 74,940 | $ | 37,795 | $ | (15,035 | ) | ||||
The accompanying notes are an integral part of these consolidated financial statements.
F- 6
HUDSON PACIFIC PROPERTIES, INC.
CONSOLIDATED STATEMENTS OF EQUITY
(in thousands, except share data)
Hudson Pacific Properties, Inc. Stockholders’ Equity | ||||||||||||||||||||||||||
Shares of Common Stock | Stock Amount | Series B Redeemable Preferred Stock | Additional Paid-in Capital | Accumulated Deficit | Accumulated Other Comprehensive (Loss) Income | Non-controlling interest—Units in the operating partnership | Non-controlling interest—Members in Consolidated Entities | Total Equity | ||||||||||||||||||
Balance, December 31, 2014 | 66,797,816 | $ | 668 | $ | 145,000 | $ | 1,070,833 | $ | (34,884 | ) | $ | (2,443 | ) | $ | 52,851 | $ | 42,990 | $ | 1,275,015 | |||||||
Contributions | — | — | — | — | — | — | — | 217,795 | 217,795 | |||||||||||||||||
Distributions | — | — | — | — | — | — | — | (2,013 | ) | (2,013 | ) | |||||||||||||||
Proceeds from sale of common stock, net of underwriters’ discount and transaction costs | 12,650,000 | 127 | — | 380,493 | — | — | — | — | 380,620 | |||||||||||||||||
Redemption of Series B preferred stock | — | — | (145,000 | ) | — | — | — | — | — | (145,000 | ) | |||||||||||||||
Issuance of common units for acquisition properties | — | — | — | — | — | — | 1,814,936 | — | 1,814,936 | |||||||||||||||||
Issuance of unrestricted stock | 8,820,482 | 87 | — | 285,358 | — | — | — | — | 285,445 | |||||||||||||||||
Issuance of restricted stock | 36,223 | — | — | — | — | — | — | — | — | |||||||||||||||||
Shares withheld to satisfy tax withholding | (85,469 | ) | — | — | (5,128 | ) | — | — | — | — | (5,128 | ) | ||||||||||||||
Declared dividend | — | — | (11,469 | ) | (50,244 | ) | — | — | (25,631 | ) | — | (87,344 | ) | |||||||||||||
Amortization of stock-based compensation | — | — | — | 8,832 | — | — | — | — | 8,832 | |||||||||||||||||
Net income (loss) | — | — | 11,469 | — | (10,071 | ) | — | (21,969 | ) | 3,853 | (16,718 | ) | ||||||||||||||
Change in fair value of derivatives | — | — | — | — | — | 1,362 | 1,235 | — | 2,597 | |||||||||||||||||
Exchange of common units in the operating partnership for common stock | 934,728 | 9 | — | 20,835 | — | — | (20,844 | ) | — | — | ||||||||||||||||
Balance, December 31, 2015 | 89,153,780 | 891 | — | 1,710,979 | (44,955 | ) | (1,081 | ) | 1,800,578 | 262,625 | 3,729,037 | |||||||||||||||
Contributions | — | — | — | — | — | — | — | 33,996 | 33,996 | |||||||||||||||||
Distributions | — | — | — | — | — | — | — | (1,303 | ) | (1,303 | ) | |||||||||||||||
Proceeds from sale of common stock, net of underwriters’ discount and transaction costs | 47,010,695 | 470 | — | 1,449,111 | — | — | — | — | 1,449,581 | |||||||||||||||||
Issuance of unrestricted stock | 590,520 | 6 | — | — | — | — | — | — | 6 | |||||||||||||||||
Shares withheld to satisfy tax withholding | (262,760 | ) | (3 | ) | — | (8,424 | ) | — | — | — | — | (8,427 | ) | |||||||||||||
Declared dividend | — | — | — | (90,005 | ) | — | — | (27,814 | ) | — | (117,819 | ) | ||||||||||||||
Amortization of stock-based compensation | — | — | — | 13,609 | — | — | 1,045 | — | 14,654 | |||||||||||||||||
Net income | — | — | — | — | 27,984 | — | 5,848 | 9,290 | 43,122 | |||||||||||||||||
Change in fair value of derivatives | — | — | — | — | — | 10,577 | (4,635 | ) | — | 5,942 | ||||||||||||||||
Redemption of common units in the operating partnership | — | — | — | 34,124 | — | — | (1,480,163 | ) | — | (1,446,039 | ) | |||||||||||||||
Balance, December 31, 2016 | 136,492,235 | 1,364 | — | 3,109,394 | (16,971 | ) | 9,496 | 294,859 | 304,608 | 3,702,750 | ||||||||||||||||
Contributions | — | — | — | — | — | — | — | 3,870 | 3,870 | |||||||||||||||||
The accompanying notes are an integral part of these consolidated financial statements.
F- 7
HUDSON PACIFIC PROPERTIES, INC.
CONSOLIDATED STATEMENTS OF EQUITY—(Continued)
(in thousands, except share data)
Hudson Pacific Properties, Inc. Stockholders’ Equity | ||||||||||||||||||||||||||
Shares of Common Stock | Stock Amount | Series B Redeemable Preferred Stock | Additional Paid-in Capital | Accumulated Deficit | Accumulated Other Comprehensive (Loss) Income | Non-controlling interest—Units in the operating partnership | Non-controlling interest—Members in Consolidated Entities | Total Equity | ||||||||||||||||||
Distributions | — | — | — | — | — | — | — | (74,836 | ) | (74,836 | ) | |||||||||||||||
Proceeds from sale of common stock, net of underwriters’ discount and transaction costs | 18,656,575 | 187 | — | 647,195 | — | — | — | — | 647,382 | |||||||||||||||||
Issuance of unrestricted stock | 917,086 | 9 | — | (9 | ) | — | — | — | — | — | ||||||||||||||||
Shares withheld to satisfy tax withholding | (463,388 | ) | (4 | ) | — | (16,037 | ) | — | — | — | — | (16,041 | ) | |||||||||||||
Declared dividend | — | — | — | (106,269 | ) | (51,619 | ) | — | (656 | ) | — | (158,544 | ) | |||||||||||||
Amortization of stock-based compensation | — | — | — | 13,249 | — | — | 2,666 | — | 15,915 | |||||||||||||||||
Net income | — | — | — | — | 68,590 | — | 375 | 24,960 | 93,925 | |||||||||||||||||
Change in fair value of derivatives | — | — | — | — | — | 7,353 | 45 | — | 7,398 | |||||||||||||||||
Redemption of common units in the operating partnership | — | — | — | (24,535 | ) | — | (3,622 | ) | (282,698 | ) | — | (310,855 | ) | |||||||||||||
Balance, December 31, 2017 | 155,602,508 | $ | 1,556 | $ | — | $ | 3,622,988 | $ | — | $ | 13,227 | $ | 14,591 | $ | 258,602 | $ | 3,910,964 | |||||||||
The accompanying notes are an integral part of these consolidated financial statements.
F- 8
Year Ended December 31, | |||||||||||
2017 | 2016 | 2015 | |||||||||
CASH FLOWS FROM OPERATING ACTIVITIES | |||||||||||
Net income (loss) | $ | 94,561 | $ | 43,758 | $ | (16,082 | ) | ||||
Adjustments to reconcile net income (loss) to net cash provided by operating activities: | |||||||||||
Depreciation and amortization | 283,570 | 269,087 | 245,071 | ||||||||
Non-cash portion of interest expense | 6,032 | 4,464 | 4,746 | ||||||||
Amortization of stock-based compensation | 15,079 | 14,144 | 8,421 | ||||||||
Straight-line rents | (29,638 | ) | (29,079 | ) | (29,392 | ) | |||||
Straight-line rent expenses | 433 | 1,023 | 408 | ||||||||
Amortization of above- and below-market leases, net | (18,062 | ) | (19,734 | ) | (22,073 | ) | |||||
Amortization of above- and below-market ground lease, net | 2,505 | 2,160 | 1,642 | ||||||||
Amortization of lease incentive costs | 1,546 | 1,388 | 581 | ||||||||
Other non-cash adjustments(1) | 883 | 707 | (246 | ) | |||||||
Gains on sale of real estate | (45,574 | ) | (30,389 | ) | (30,471 | ) | |||||
Change in operating assets and liabilities: | |||||||||||
Accounts receivable | 1,929 | 15,088 | (5,734 | ) | |||||||
Deferred leasing costs and lease intangibles | (32,244 | ) | (43,476 | ) | (28,980 | ) | |||||
Prepaid expenses and other assets | 233 | (7,312 | ) | (17,032 | ) | ||||||
Accounts payable and accrued liabilities | 19,447 | (4,426 | ) | 18,342 | |||||||
Security deposits and prepaid rent | (7,741 | ) | 9,371 | 46,582 | |||||||
Net cash provided by operating activities | 292,959 | 226,774 | 175,783 | ||||||||
CASH FLOWS FROM INVESTING ACTIVITIES | |||||||||||
Additions to investment property | (302,447 | ) | (258,718 | ) | (170,590 | ) | |||||
Property acquisitions | (257,734 | ) | (630,145 | ) | (1,804,597 | ) | |||||
Contributions to unconsolidated entities | (1,071 | ) | (37,228 | ) | — | ||||||
Distributions from unconsolidated entities | 15,964 | — | — | ||||||||
Proceeds from repayment of notes receivable | — | 28,892 | — | ||||||||
Proceeds from sales of real estate | 212,250 | 372,302 | 177,488 | ||||||||
Net cash used in investing activities | (333,038 | ) | (524,897 | ) | (1,797,699 | ) | |||||
CASH FLOWS FROM FINANCING ACTIVITIES | |||||||||||
Proceeds from notes payable | 766,660 | 1,318,000 | 2,234,687 | ||||||||
Payments of notes payable | (822,526 | ) | (888,607 | ) | (913,694 | ) | |||||
Proceeds from issuance of common stock, net | 647,382 | 1,449,581 | 380,620 | ||||||||
Payments for redemption of common units in the operating partnership | (310,855 | ) | (1,446,039 | ) | — | ||||||
Redemption of Series B preferred stock | — | — | (145,000 | ) | |||||||
Distributions paid to common stock and unitholders | (158,544 | ) | (117,819 | ) | (75,875 | ) | |||||
Distributions paid to preferred stock and unitholders | (636 | ) | (636 | ) | (12,071 | ) | |||||
Contributions from non-controlling member in consolidated entities | 3,870 | 33,996 | 217,795 | ||||||||
Distributions to non-controlling member in consolidated entities | (74,836 | ) | (1,303 | ) | (2,013 | ) | |||||
Payments to satisfy tax withholding | (16,041 | ) | (8,427 | ) | (5,128 | ) | |||||
Payments of loan costs | (1,307 | ) | (3,992 | ) | (20,680 | ) | |||||
Net cash provided by financing activities | 33,167 | 334,754 | 1,658,641 | ||||||||
Net (decrease) increase in cash and cash equivalents and restricted cash | (6,912 | ) | 36,631 | 36,725 | |||||||
Cash and cash equivalents and restricted cash—beginning of period | 108,192 | 71,561 | 34,836 | ||||||||
Cash and cash equivalents and restricted cash—end of period | $ | 101,280 | $ | 108,192 | $ | 71,561 | |||||
The accompanying notes are an integral part of these consolidated financial statements.
F- 9
HUDSON PACIFIC PROPERTIES, INC.
CONSOLIDATED STATEMENTS OF CASH FLOWS—(Continued)
(in thousands)
Year Ended December 31, | |||||||||||
2017 | 2016 | 2015 | |||||||||
Supplemental disclosure of cash flow information | |||||||||||
Cash paid for interest, net of capitalized interest | $ | 77,234 | $ | 82,491 | $ | 50,208 | |||||
NON-CASH INVESTING AND FINANCING ACTIVITIES | |||||||||||
Accounts payable and accrued liabilities for real estate investments | $ | (19,587 | ) | $ | (37,364 | ) | $ | (27,972 | ) | ||
Reclassification of investment in unconsolidated entities for real estate investments | $ | 7,835 | $ | — | $ | — | |||||
Relief of debt in conjunction with sale of real estate | $ | (216,000 | ) | $ | — | $ | — | ||||
Proceeds from sale of real estate | $ | 216,000 | $ | — | $ | — | |||||
Issuance of common stock in connection with property acquisition | $ | — | $ | — | $ | 87 | |||||
Additional paid-in capital in connection with property acquisition | $ | — | $ | — | $ | 285,358 | |||||
Non-controlling common units in the operating partnership in connection with property acquisition | $ | — | $ | — | $ | 1,814,936 | |||||
_____________
(1) | Represents bad debt expense/recovery, amortization of discount and net origination fees on purchased and originated loans and unrealized loss/gain on ineffective portion of derivative instruments. |
The accompanying notes are an integral part of these consolidated financial statements.
F- 10
Report of Independent Registered Public Accounting Firm
The Partners of Hudson Pacific Properties, L.P.
Opinion of the Financial Statements
We have audited the accompanying consolidated balance sheets of Hudson Pacific Properties, L.P. (the “Operating Partnership”), as of December 31, 2017 and 2016, and the related consolidated statements of operations, comprehensive income (loss), capital, and cash flows for each of the three years in the period ended December 31, 2017, and the related notes and financial statement schedule listed in the Index at Item 15(a) (collectively referred to as the “consolidated financial statements”). In our opinion, the consolidated financial statements present fairly, in all material respects, the consolidated financial position of the Operating Partnership at December 31, 2017 and 2016, and the consolidated results of its operations and its cash flows for each of the three years in the period ended December 31, 2017, in conformity with U.S. generally accepted accounting principles.
Adoption of ASC No. 2017-01
As discussed in Note 2 to the consolidated financial statements, the Operating Partnership changed its method for accounting for property acquisitions effective October 1, 2016 when the Operating Partnership adopted ASU 2017-01, Business Combinations (Topic 805): Clarifying the Definition of a Business.
Basis for Opinion
These financial statements are the responsibility of the Operating Partnership’s management. Our responsibility is to express an opinion on the Operating Partnership’s financial statements based on our audits. We are a public accounting firm registered with the Public Company Accounting Oversight Board (United States) (PCAOB) and are required to be independent with respect to the Operating Partnership in accordance with the U.S. federal securities laws and the applicable rules and regulations of the Securities and Exchange Commission and the PCAOB.
We conducted our audits in accordance with the standards of the PCAOB. Those standards require that we plan and perform the audit to obtain reasonable assurance about whether the financial statements are free of material misstatement, whether due to error or fraud. The Operating Partnership is not required to have, nor were we engaged to perform, an audit of its internal control over financial reporting. As part of our audits we are required to obtain an understanding of internal control over financial reporting but not for the purpose of expressing an opinion on the effectiveness of the Operating Partnership’s internal control over financial reporting. Accordingly, we express no such opinion.
Our audits included performing procedures to assess the risks of material misstatement of the financial statements, whether due to error or fraud, and performing procedures that respond to those risks. Such procedures included examining, on a test basis, evidence regarding the amounts and disclosures in the financial statements. Our audits also included evaluating the accounting principles used and significant estimates made by management, as well as evaluating the overall presentation of the financial statements. We believe that our audits provide a reasonable basis for our opinion.
/s/ Ernst & Young LLP
We have served as the Operating Partnership’s auditor since 2015.
Los Angeles, California
February 15, 2018
The accompanying notes are an integral part of these consolidated financial statements.
F- 11
HUDSON PACIFIC PROPERTIES, L.P.
CONSOLIDATED BALANCE SHEETS
(in thousands, except unit data)
December 31, 2017 | December 31, 2016 | ||||||
ASSETS | |||||||
Investment in real estate, at cost | $ | 6,423,441 | $ | 5,878,480 | |||
Accumulated depreciation and amortization | (533,498 | ) | (375,207 | ) | |||
Investment in real estate, net | 5,889,943 | 5,503,273 | |||||
Cash and cash equivalents | 78,922 | 83,015 | |||||
Restricted cash | 22,358 | 25,177 | |||||
Accounts receivable, net | 4,363 | 7,007 | |||||
Straight-line rent receivables, net | 109,457 | 79,209 | |||||
Deferred leasing costs and lease intangible assets, net | 244,554 | 288,929 | |||||
Prepaid expenses and other assets, net | 61,138 | 77,214 | |||||
Assets associated with real estate held for sale | 211,335 | 615,174 | |||||
TOTAL ASSETS | $ | 6,622,070 | $ | 6,678,998 | |||
LIABILITIES | |||||||
Notes payable, net | $ | 2,421,380 | $ | 2,473,326 | |||
Accounts payable and accrued liabilities | 163,107 | 114,674 | |||||
Lease intangible liabilities, net | 49,930 | 73,267 | |||||
Security deposits and prepaid rent | 64,031 | 66,878 | |||||
Derivative liabilities | 265 | 1,303 | |||||
Liabilities associated with real estate held for sale | 2,216 | 236,623 | |||||
TOTAL LIABILITIES | 2,700,929 | 2,966,071 | |||||
6.25% Series A cumulative redeemable preferred units of the operating partnership | 10,177 | 10,177 | |||||
CAPITAL | |||||||
Hudson Pacific Properties, L.P. partners’ capital: | |||||||
Common units, 156,171,553 and 145,942,855 issued and outstanding at December 31, 2017 and 2016, respectively. | 3,639,086 | 3,392,264 | |||||
Accumulated other comprehensive income | 13,276 | 5,878 | |||||
Total Hudson Pacific Properties, L.P. partners' capital | 3,652,362 | 3,398,142 | |||||
Non-controlling interest—members in consolidated entities | 258,602 | 304,608 | |||||
TOTAL CAPITAL | $ | 3,910,964 | $ | 3,702,750 | |||
TOTAL LIABILITIES AND CAPITAL | $ | 6,622,070 | $ | 6,678,998 | |||
The accompanying notes are an integral part of these consolidated financial statements.
F- 12
HUDSON PACIFIC PROPERTIES, L.P.
CONSOLIDATED STATEMENTS OF OPERATIONS
(in thousands, except unit data)
Year Ended December 31, | |||||||||||
2017 | 2016 | 2015 | |||||||||
REVENUES | |||||||||||
Office | |||||||||||
Rental | $ | 545,453 | $ | 486,956 | $ | 394,543 | |||||
Tenant recoveries | 92,244 | 84,386 | 66,235 | ||||||||
Parking and other | 29,413 | 21,894 | 20,940 | ||||||||
Total Office revenues | 667,110 | 593,236 | 481,718 | ||||||||
Media & Entertainment | |||||||||||
Rental | 36,529 | 26,837 | 23,027 | ||||||||
Tenant recoveries | 1,336 | 1,884 | 943 | ||||||||
Other property-related revenue | 22,805 | 17,380 | 14,849 | ||||||||
Other | 359 | 302 | 313 | ||||||||
Total Media & Entertainment revenues | 61,029 | 46,403 | 39,132 | ||||||||
TOTAL REVENUES | 728,139 | 639,639 | 520,850 | ||||||||
OPERATING EXPENSES | |||||||||||
Office operating expenses | 218,873 | 202,935 | 166,131 | ||||||||
Media & Entertainment operating expenses | 34,634 | 25,810 | 23,726 | ||||||||
General and administrative | 54,459 | 52,400 | 38,534 | ||||||||
Depreciation and amortization | 283,570 | 269,087 | 245,071 | ||||||||
TOTAL OPERATING EXPENSES | 591,536 | 550,232 | 473,462 | ||||||||
INCOME FROM OPERATIONS | 136,603 | 89,407 | 47,388 | ||||||||
OTHER EXPENSE (INCOME) | |||||||||||
Interest expense | 90,037 | 76,044 | 50,667 | ||||||||
Interest income | (97 | ) | (260 | ) | (124 | ) | |||||
Unrealized loss on ineffective portion of derivatives | 70 | 1,436 | — | ||||||||
Transaction-related expenses | 598 | 376 | 43,336 | ||||||||
Other (income) expense | (2,992 | ) | (1,558 | ) | 62 | ||||||
TOTAL OTHER EXPENSES | 87,616 | 76,038 | 93,941 | ||||||||
INCOME (LOSS) BEFORE GAINS ON SALE OF REAL ESTATE | 48,987 | 13,369 | (46,553 | ) | |||||||
Gains on sale of real estate | 45,574 | 30,389 | 30,471 | ||||||||
NET INCOME (LOSS) | 94,561 | 43,758 | (16,082 | ) | |||||||
Net income attributable to non-controlling interest in consolidated entities | (24,960 | ) | (9,290 | ) | (3,853 | ) | |||||
Net income (loss) attributable to Hudson Pacific Properties, L.P. | 69,601 | 34,468 | (19,935 | ) | |||||||
Net income attributable to preferred stock and units | (636 | ) | (636 | ) | (12,105 | ) | |||||
Original issuance costs of redeemed Series B preferred stock | — | — | (5,970 | ) | |||||||
Total preferred distributions | (636 | ) | (636 | ) | (18,075 | ) | |||||
Net income attributable to participating securities | (1,003 | ) | (766 | ) | (356 | ) | |||||
Net income (loss) available to common unitholders | $ | 67,962 | $ | 33,066 | $ | (38,366 | ) | ||||
Basic and diluted per unit amounts: | |||||||||||
Net income (loss) attributable to common unitholders—basic | $ | 0.44 | $ | 0.23 | $ | (0.30 | ) | ||||
Net income (loss) attributable to common unitholders—diluted | $ | 0.44 | $ | 0.23 | $ | (0.30 | ) | ||||
Weighted average shares of common units outstanding—basic | 154,276,773 | 145,595,246 | 128,948,077 | ||||||||
Weighted average shares of common units outstanding—diluted | 154,670,857 | 146,739,246 | 128,948,077 | ||||||||
The accompanying notes are an integral part of these consolidated financial statements.
F- 13
HUDSON PACIFIC PROPERTIES, L.P.
CONSOLIDATED STATEMENTS OF COMPREHENSIVE INCOME (LOSS)
(in thousands)
Year Ended December 31, | |||||||||||
2017 | 2016 | 2015 | |||||||||
Net income (loss) | $ | 94,561 | $ | 43,758 | $ | (16,082 | ) | ||||
Other comprehensive income: change in fair value of derivatives | 7,398 | 5,942 | 2,597 | ||||||||
Comprehensive income (loss) | 101,959 | 49,700 | (13,485 | ) | |||||||
Comprehensive income attributable to preferred stock and units | (636 | ) | (636 | ) | (12,105 | ) | |||||
Comprehensive income attributable to redemption of Series B preferred stock | — | — | (5,970 | ) | |||||||
Comprehensive income attributable to participating securities | (1,003 | ) | (766 | ) | (356 | ) | |||||
Comprehensive income attributable to non-controlling interest in consolidated entities | (24,960 | ) | (9,290 | ) | (3,853 | ) | |||||
Comprehensive income (loss) attributable to Hudson Pacific Properties, L.P. partners’ capital | $ | 75,360 | $ | 39,008 | $ | (35,769 | ) | ||||
The accompanying notes are an integral part of these consolidated financial statements.
F- 14
HUDSON PACIFIC PROPERTIES, L.P.
CONSOLIDATED STATEMENTS OF CAPITAL
(in thousands, except unit data)
Partners’ Capital | ||||||||||||||||||||
Preferred Units | Number of Common Units | Common Units | Accumulated Other Comprehensive (Loss) Income | Total Partners’ Capital | Non-controlling Interest— Members in Consolidated Entities | Total Capital | ||||||||||||||
Balance, December 31, 2014 | $ | 145,000 | 69,180,379 | $ | 1,089,686 | $ | (2,661 | ) | $ | 1,232,025 | $ | 42,990 | $ | 1,275,015 | ||||||
Contributions | — | — | — | — | — | 217,795 | 217,795 | |||||||||||||
Distributions | — | — | — | — | — | (2,013 | ) | (2,013 | ) | |||||||||||
Proceeds from sale of common units, net of underwriters’ discount and transaction costs | — | 12,650,000 | 380,620 | — | 380,620 | — | 380,620 | |||||||||||||
Issuance of unrestricted units | — | 63,668,962 | 2,100,381 | — | 2,100,381 | — | 2,100,381 | |||||||||||||
Issuance of restricted units | — | 36,223 | — | — | — | — | — | |||||||||||||
Units withheld to satisfy tax withholding | — | (85,469 | ) | (5,128 | ) | — | (5,128 | ) | — | (5,128 | ) | |||||||||
Declared distributions | (11,469 | ) | — | (75,875 | ) | — | (87,344 | ) | — | (87,344 | ) | |||||||||
Amortization of unit-based compensation | — | — | 8,832 | — | 8,832 | — | 8,832 | |||||||||||||
Net income (loss) | 11,469 | — | (32,040 | ) | — | (20,571 | ) | 3,853 | (16,718 | ) | ||||||||||
Change in fair value of derivatives | — | — | — | 2,597 | 2,597 | — | 2,597 | |||||||||||||
Redemption of Series B preferred stock | (145,000 | ) | — | — | — | (145,000 | ) | — | (145,000 | ) | ||||||||||
Balance, December 31, 2015 | — | 145,450,095 | 3,466,476 | (64 | ) | 3,466,412 | 262,625 | 3,729,037 | ||||||||||||
Contributions | — | — | — | — | — | 33,996 | 33,996 | |||||||||||||
Distributions | — | — | — | — | — | (1,303 | ) | (1,303 | ) | |||||||||||
Proceeds from sale of common units, net of underwriters’ discount and transaction costs | — | 47,010,695 | 1,449,581 | — | 1,449,581 | — | 1,449,581 | |||||||||||||
Issuance of unrestricted units | — | 590,520 | 6 | — | 6 | — | 6 | |||||||||||||
Units withheld to satisfy tax withholding | — | (262,760 | ) | (8,427 | ) | — | (8,427 | ) | — | (8,427 | ) | |||||||||
Declared distributions | — | — | (117,819 | ) | — | (117,819 | ) | — | (117,819 | ) | ||||||||||
Amortization of unit based compensation | — | — | 14,654 | — | 14,654 | — | 14,654 | |||||||||||||
Net income | — | — | 33,832 | — | 33,832 | 9,290 | 43,122 | |||||||||||||
Change in fair value of derivatives | — | — | — | 5,942 | 5,942 | — | 5,942 | |||||||||||||
Repurchase of operating partnership units | — | (46,845,695 | ) | (1,446,039 | ) | — | (1,446,039 | ) | — | (1,446,039 | ) | |||||||||
Balance, December 31, 2016 | — | 145,942,855 | 3,392,264 | 5,878 | 3,398,142 | 304,608 | 3,702,750 | |||||||||||||
Contributions | — | — | — | — | — | 3,870 | 3,870 | |||||||||||||
Distributions | — | — | — | — | — | (74,836 | ) | (74,836 | ) | |||||||||||
Proceeds from sale of common units, net of underwriters’ discount and transaction costs | — | 18,656,575 | 647,382 | — | 647,382 | — | 647,382 | |||||||||||||
Issuance of unrestricted units | — | 917,086 | — | — | — | — | — | |||||||||||||
Units withheld to satisfy tax withholding | — | (463,388 | ) | (16,041 | ) | — | (16,041 | ) | — | (16,041 | ) | |||||||||
Declared distributions | — | — | (158,544 | ) | — | (158,544 | ) | — | (158,544 | ) | ||||||||||
Amortization of unit based compensation | — | — | 15,915 | — | 15,915 | — | 15,915 | |||||||||||||
Net income | — | — | 68,965 | — | 68,965 | 24,960 | 93,925 | |||||||||||||
Change in fair value of derivatives | — | — | — | 7,398 | 7,398 | — | 7,398 | |||||||||||||
Redemption of common units | — | (8,881,575 | ) | (310,855 | ) | — | (310,855 | ) | — | (310,855 | ) | |||||||||
Balance, December 31, 2017 | $ | — | 156,171,553 | $ | 3,639,086 | $ | 13,276 | $ | 3,652,362 | $ | 258,602 | $ | 3,910,964 | |||||||
The accompanying notes are an integral part of these consolidated financial statements.
F- 15
Year Ended December 31, | |||||||||||
2017 | 2016 | 2015 | |||||||||
CASH FLOWS FROM OPERATING ACTIVITIES | |||||||||||
Net income (loss) | $ | 94,561 | $ | 43,758 | $ | (16,082 | ) | ||||
Adjustments to reconcile net income (loss) to net cash provided by operating activities: | |||||||||||
Depreciation and amortization | 283,570 | 269,087 | 245,071 | ||||||||
Non-cash portion of interest expense | 6,032 | 4,464 | 4,746 | ||||||||
Amortization of unit-based compensation | 15,079 | 14,144 | 8,421 | ||||||||
Straight-line rents | (29,638 | ) | (29,079 | ) | (29,392 | ) | |||||
Straight-line rent expenses | 433 | 1,023 | 408 | ||||||||
Amortization of above- and below-market leases, net | (18,062 | ) | (19,734 | ) | (22,073 | ) | |||||
Amortization of above- and below-market ground lease, net | 2,505 | 2,160 | 1,642 | ||||||||
Amortization of lease incentive costs | 1,546 | 1,388 | 581 | ||||||||
Other non-cash adjustments(1) | 883 | 707 | (246 | ) | |||||||
Gains on sale of real estate | (45,574 | ) | (30,389 | ) | (30,471 | ) | |||||
Change in operating assets and liabilities: | |||||||||||
Accounts receivable | 1,929 | 15,088 | (5,734 | ) | |||||||
Deferred leasing costs and lease intangibles | (32,244 | ) | (43,476 | ) | (28,980 | ) | |||||
Prepaid expenses and other assets | 233 | (7,312 | ) | (17,032 | ) | ||||||
Accounts payable and accrued liabilities | 19,447 | (4,426 | ) | 18,342 | |||||||
Security deposits and prepaid rent | (7,741 | ) | 9,371 | 46,582 | |||||||
Net cash provided by operating activities | 292,959 | 226,774 | 175,783 | ||||||||
CASH FLOWS FROM INVESTING ACTIVITIES | |||||||||||
Additions to investment property | (302,447 | ) | (258,718 | ) | (170,590 | ) | |||||
Property acquisitions | (257,734 | ) | (630,145 | ) | (1,804,597 | ) | |||||
Contributions to unconsolidated entities | (1,071 | ) | (37,228 | ) | — | ||||||
Distributions from unconsolidated entities | 15,964 | — | — | ||||||||
Proceeds from repayment of notes receivable | — | 28,892 | — | ||||||||
Proceeds from sales of real estate investments | 212,250 | 372,302 | 177,488 | ||||||||
Net cash used in investing activities | (333,038 | ) | (524,897 | ) | (1,797,699 | ) | |||||
CASH FLOWS FROM FINANCING ACTIVITIES | |||||||||||
Proceeds from notes payable | 766,660 | 1,318,000 | 2,234,687 | ||||||||
Payments of notes payable | (822,526 | ) | (888,607 | ) | (913,694 | ) | |||||
Proceeds from issuance of common units, net | 647,382 | 1,449,581 | 380,620 | ||||||||
Payments for redemption of common units | (310,855 | ) | (1,446,039 | ) | — | ||||||
Redemption of Series B preferred stock | — | — | (145,000 | ) | |||||||
Distributions paid to common unitholders | (158,544 | ) | (117,819 | ) | (75,875 | ) | |||||
Distributions paid to preferred unitholders | (636 | ) | (636 | ) | (12,071 | ) | |||||
Contributions from non-controlling member in consolidated real estate entities | 3,870 | 33,996 | 217,795 | ||||||||
Distributions to non-controlling member in consolidated real estate entities | (74,836 | ) | (1,303 | ) | (2,013 | ) | |||||
Payments to satisfy tax withholding | (16,041 | ) | (8,427 | ) | (5,128 | ) | |||||
Payments of loan costs | (1,307 | ) | (3,992 | ) | (20,680 | ) | |||||
Net cash provided by financing activities | 33,167 | 334,754 | 1,658,641 | ||||||||
Net (decrease) increase in cash and cash equivalents and restricted cash | (6,912 | ) | 36,631 | 36,725 | |||||||
Cash and cash equivalents and restricted cash—beginning of period | 108,192 | 71,561 | 34,836 | ||||||||
Cash and cash equivalents and restricted cash—end of period | $ | 101,280 | $ | 108,192 | $ | 71,561 | |||||
The accompanying notes are an integral part of these consolidated financial statements.
F- 16
HUDSON PACIFIC PROPERTIES, L.P.
CONSOLIDATED STATEMENTS OF CASH FLOWS—(Continued)
(in thousands)
Year Ended December 31, | |||||||||||
2017 | 2016 | 2015 | |||||||||
Supplemental disclosure of cash flow information | |||||||||||
Cash paid for interest, net capitalized interest | $ | 77,234 | $ | 82,491 | $ | 50,208 | |||||
NON-CASH INVESTING AND FINANCING ACTIVITIES | |||||||||||
Accounts payable and accrued liabilities for real estate investments | $ | (19,587 | ) | $ | (37,364 | ) | $ | (27,972 | ) | ||
Reclassification of investment in unconsolidated entities for real estate investments | $ | 7,835 | $ | — | $ | — | |||||
Relief of debt in conjunction with sale of real estate | $ | (216,000 | ) | $ | — | $ | — | ||||
Proceeds from sale of real estate | $ | 216,000 | $ | — | $ | — | |||||
Common units in the operating partnership in connection with property acquisition | $ | — | $ | — | $ | 2,100,381 | |||||
_____________
(1) | Represents bad debt expense/recovery, amortization of discount and net origination fees on purchased and originated loans and unrealized loss/gain on ineffective portion of derivative instruments. |
The accompanying notes are an integral part of these consolidated financial statements.
F- 17
Hudson Pacific Properties, Inc. and Hudson Pacific Properties, L.P.
Notes to Consolidated Financial Statements
(Tabular amounts in thousands, except square footage and share/unit data)
1. Organization
Hudson Pacific Properties, Inc. is a Maryland corporation formed on November 9, 2009 as a fully integrated, self-administered and self-managed real estate investment trust (“REIT”). Through its controlling interest in the operating partnership and its subsidiaries, Hudson Pacific Properties, Inc. owns, manages, leases, acquires and develops real estate, consisting primarily of office and media and entertainment properties. Unless otherwise indicated or unless the context requires otherwise, all references in these financial statements to “the Company” refer to Hudson Pacific Properties, Inc. together with its consolidated subsidiaries, including Hudson Pacific Properties, L.P. Unless otherwise indicated or unless the context requires otherwise, all references to “our operating partnership” or “the operating partnership” refer to Hudson Pacific Properties, L.P. together with its consolidated subsidiaries.
On April 1, 2015, the Company completed the acquisition of the EOP Northern California Portfolio (“EOP Acquisition”) from Blackstone Real Estate Partners V and VI (“Blackstone”). The EOP Acquisition consisted of 26 high-quality office assets totaling approximately 8.2 million square feet and two development parcels located throughout Northern California. The total consideration paid for the EOP Acquisition before certain credits, prorations and closing costs included a cash payment of $1.75 billion and an aggregate of 63,474,791 shares of common stock of Hudson Pacific Properties, Inc. and common units in the operating partnership.
The Company’s portfolio consists of properties located throughout Northern and Southern California and the Pacific Northwest. The following table summarizes the Company’s portfolio as of December 31, 2017:
Segments | Number of Properties | Square Feet (unaudited) | ||||
Office | 51 | 13,291,531 | ||||
Media & Entertainment | 3 | 1,249,927 | ||||
Total(1) | 54 | 14,541,458 | ||||
_________________
(1) | Includes redevelopment, development and held for sale properties. |
2. Summary of Significant Accounting Policies
Basis of Presentation
The accompanying consolidated financial statements of the Company and the operating partnership are prepared in accordance with generally accepted accounting principles in the United States (“GAAP”). Any reference to the number of properties, acres and square footage are unaudited and outside the scope of the Company’s independent registered public accounting firm’s audit of the Company’s financial statements in accordance with the standards of the United States Public Company Accounting Oversight Board (“PCAOB”).
Certain amounts in the consolidated financial statements for the prior periods have been reclassified to conform to the current year presentation. Included in the reclassified amounts are properties held for sale. These amounts are related to 3402 Pico, which was sold on March 21, 2017, Pinnacle I and Pinnacle II, which were sold on November 16, 2017 as well as four other properties, which were classified as held for sale as of December 31, 2017. See Note 3 for details of the properties classified as held for sale.
Principles of Consolidation
The consolidated financial statements of the Company include the accounts of the Company, the operating partnership and all wholly owned and controlled subsidiaries. The consolidated financial statements of the operating partnership include the accounts of the operating partnership and all wholly owned and controlled subsidiaries. All intercompany balances and transactions have been eliminated in the consolidated financial statements.
Under the consolidation guidance, we first evaluate an entity using the variable interest model, then the voting model. The Company ultimately consolidates all entities that the Company controls through either majority ownership or voting rights,
including all variable interest entities (“VIEs”) of which the Company is considered the primary beneficiary. The Company accounts for all other unconsolidated joint ventures using the cost or equity method of accounting. In addition, we continually evaluate each legal entity that is not wholly owned for reconsideration based on changing circumstances.
VIEs are defined as entities in which equity investors do not have:
• | the characteristics of a controlling financial interest; |
• | sufficient equity at risk for the entity to finance its activities without additional subordinated financial support from other parties; and/or |
• | the entity is structured with non-substantive voting rights. |
The entity that consolidates a VIE is known as its primary beneficiary and is generally the entity with both the power to direct the activities that most significantly affect the VIE’s economic performance and the right to receive benefits from the VIE or the obligation to absorb losses of the VIE that could be significant to the VIE. As of December 31, 2017, the Company has determined that three joint ventures and our operating partnership met the definition of a VIE. Two of the joint ventures are consolidated entities and one joint venture is a non-consolidated entity.
Consolidated Entities
On November 16, 2017, the Company sold its 65.0% ownership interest in the single joint venture that owned both Pinnacle I and Pinnacle II. As a result of the disposition, the Company no longer consolidates Pinnacle and Pinnacle II.
As of December 31, 2017, the operating partnership has determined that two of its joint ventures met the definition of a VIE and are consolidated:
Property | Ownership interest | ||
1455 Market | 55.0 | % | |
Hill7 | 55.0 | % | |
As of December 31, 2017, the Company has determined that our operating partnership met the definition of a VIE and is consolidated. Substantially all of the assets and liabilities of the Company are related to these VIEs.
Non-consolidated Entities
On June 15, 2017, the Company purchased the remaining interest in land at its 11601 Wilshire property. Refer to Note 3 for details. As a result of the purchase, the Company is now consolidating the interest in land.
On June 16, 2016, the Company entered into a joint venture to co-originate a loan secured by land in Santa Clara, California. The assets of the joint venture consist of notes receivable. As of December 31, 2017, the Company has determined this joint venture meets the definition of a VIE, however, it is not the primary beneficiary. Due to its significant influence over the non-consolidated entity, the Company accounts for it using the equity method of accounting. Under the equity method, the Company initially records the investment at cost and subsequently adjusts for equity in earnings or losses and cash contributions and distributions. The Company’s net equity investment of $14.2 million is reflected within prepaid expenses and other assets on the Consolidated Balance Sheets which represents the Company’s maximum exposure for loss. The Company’s share of net income or loss from the entity is included within other (income) expense on the Consolidated Statements of Operations. The Company owns 21% of the non-consolidated entity.
Use of Estimates
The preparation of financial statements in conformity with GAAP requires management to make estimates and assumptions that affect the reported amounts of assets and liabilities and disclosure of commitments and contingencies at the date of the financial statements and the reported amounts of revenues and expenses during the reporting period. On an ongoing basis, the Company evaluates its estimates, including those related to acquiring, developing and assessing the carrying values of its real estate properties, its accrued liabilities, and its performance-based equity compensation awards. The Company bases
F- 18
Hudson Pacific Properties, Inc. and Hudson Pacific Properties, L.P.
Notes to Consolidated Financial Statements—(Continued)
(Tables in thousands, except square footage and share data)
its estimates on historical experience, current market conditions, and various other assumptions that are believed to be reasonable under the circumstances. Actual results could materially differ from these estimates.
Investment in Real Estate Properties
Acquisitions
The Company evaluates each acquisition of real estate to determine if the integrated set of assets and activities acquired meet the definition of a business and need to be accounted for as a business combination in accordance with ASC 805, Business Combinations. An integrated set of assets and activities would fail to qualify as a business if either (i) substantially all of the fair value of the gross assets acquired is concentrated in either a single identifiable asset or a group of similar identifiable assets or (ii) the integrated set of assets and activities is lacking, at a minimum, an input and a substantive process that together significantly contribute to the ability to create outputs (i.e., revenue generated before and after the transaction). An acquired process is considered substantive if (i) the process includes an organized workforce (or includes an acquired contract that provides access to an organized workforce), that is skilled, knowledgeable, and experienced in performing the process (ii) the process cannot be replaced without significant cost, effort, or delay or (iii) the process is considered unique or scarce.
Acquisitions of real estate will generally not meet the revised definition of a business because substantially all of the fair value is concentrated in a single identifiable asset or group of similar identifiable assets (i.e., land, buildings and improvements and related intangible assets or liabilities) or because the acquisition does not include a substantive process in the form of an acquired workforce or an acquired contract that cannot be replaced without significant cost, effort or delay.
When the Company acquires properties that are considered business combinations, assets acquired and liabilities assumed are fair valued at the acquisition date. Assets acquired and liabilities assumed include, but are not limited to, land, building and improvements, intangible assets related to above-and below-market leases, intangible assets related to in-place leases, debt and other assumed assets and liabilities. The initial accounting for a business combination is based on management’s preliminary assessment, which may differ when final information becomes available. Subsequent adjustments made to the initial purchase price assignment are made within the measurement period, which typically does not exceed one year, within the Consolidated Balance Sheets. Acquisition-related expenses associated with business combinations are expensed in the period incurred which is included in the transaction-related expenses line item of the Consolidated Statements of Operations.
When the Company acquires properties that are considered asset acquisitions, the purchase price is allocated based on relative fair value of the assets acquired and liabilities assumed. There is no measurement period concept for asset acquisitions, with the purchase price accounting being final in the period of acquisition. Additionally, acquisition-related expenses associated with asset acquisitions are capitalized as part of the purchase price.
The Company assesses fair value based on Level 2 and Level 3 inputs within the fair value framework, which includes estimated cash flow projections that utilize appropriate discount, capitalization rates, renewal probability and available market information, which includes market rental rate and market rent growth rates. Estimates of future cash flows are based on a number of factors including historical operating results, known and anticipated trends, and market and economic conditions.
The fair value of tangible assets of an acquired property considers the value of the property as if it were vacant. The fair value of acquired “above- and below-” market leases are based on the estimated cash flow projections utilizing discount rates that reflect the risks associated with the leases acquired. The amount recorded is based on the present value of the difference between (i) the contractual amounts to be paid pursuant to each in-place lease and (ii) management’s estimate of fair market lease rates for each in-place lease, measured over a period equal to the remaining term of the lease for above-market leases and the initial below-market term plus the extended term for any leases with below-market renewal options. Other intangible assets acquired include amounts for in-place lease values that are based on the Company’s evaluation of the specific characteristics of each tenant’s lease. Factors considered include estimates of carrying costs during hypothetical expected lease-up periods, market conditions and costs to execute similar leases. In estimating carrying costs, the Company includes estimates of lost rents at market rates during the hypothetical expected lease-up periods, which are dependent on local market conditions. In estimating costs to execute similar leases, the Company considers leasing commissions and legal and other related costs.
F- 19
Hudson Pacific Properties, Inc. and Hudson Pacific Properties, L.P.
Notes to Consolidated Financial Statements—(Continued)
(Tables in thousands, except square footage and share data)
Cost Capitalization
The Company capitalizes direct construction and development costs, including redevelopment costs, interest, property taxes, insurance and other costs directly related and essential to the acquisition, development or construction of a real estate project. Indirect development costs, including salaries and benefits, office rent, and associated costs for those individuals directly responsible for and who spend their time on development activities are also capitalized and allocated to the projects to which they relate. Construction and development costs are capitalized while substantial activities are ongoing to prepare an asset for its intended use. The Company considers a construction project as substantially complete and held available for occupancy upon the completion of tenant improvements but no later than one year after cessation of major construction activity. Costs incurred after a project is substantially complete and ready for its intended use, or after development activities have ceased, are expensed as they are incurred. Costs previously capitalized that related to abandoned acquisitions or developments are charged to earnings. Expenditures for repairs and maintenance are expensed as they are incurred.
The Company recognized the following capitalized costs:
Year Ended December 31, | ||||||||||||
2017 | 2016 | 2015 | ||||||||||
Capitalized personnel costs | $ | 10,853 | $ | 9,347 | $ | 7,349 | ||||||
Capitalized interest | 10,655 | 11,307 | 6,516 | |||||||||
Operating Properties
The properties are generally carried at cost, less accumulated depreciation and amortization. The Company computes depreciation and amortization using the straight-line method over the estimated useful lives of the assets as represented in the table below:
Asset Description | Estimated useful life (years) | |
Building and improvements | Shorter of the ground lease term or 39 | |
Land improvements | 15 | |
Furniture and fixtures | 5 to 7 | |
Tenant improvements | Shorter of the estimated useful life or the lease term | |
The Company amortizes above- and below-market lease intangibles over the remaining non-cancellable lease terms and bargain renewal periods, if applicable. The in-place lease intangibles are amortized over the remaining non-cancellable lease term. When tenants vacate prior to the expiration of lease, the amortization of intangible assets and liabilities are accelerated. The Company amortizes above- and below-market ground lease intangibles over the remaining non-cancellable lease terms.
Held for sale
The Company classifies properties as held for sale when certain criteria set forth in Accounting Standards Codification (“ASC”) 360, Property, Plant, and Equipment, are met. These criteria include (i) whether the Company is committed to a plan to sell, (ii) whether the asset or disposal group is available for immediate sale, (iii) whether an active program to locate a buyer and other actions required to complete the plan to sell have been initiated, (iv) whether the sale of the asset or disposal group is probable (i.e., likely to occur) and the transfer is expected to qualify for recognition as a completed sale within one year, (v) whether the long-lived asset or disposal group is being actively marketed for sale at a price that is reasonable in relation to its current fair value, (vi) whether actions necessary to complete the plan indicate that it is unlikely significant changes to the plan will be made or that the plan will be withdrawn. At the time a property is classified as held for sale, the Company reclassifies its assets and liabilities to held for sale in the Consolidated Balance Sheets for the periods presented and ceases recognizing depreciation expense. Properties held for sale are reported at the lower of their carrying value or their estimated fair value, less estimated costs to sell.
According to ASC 205, Presentation of Financial Statements, the Company does not present the operating results in net loss from discontinued operations for disposals if they do not represent a strategic shift in the Company’s business. There were no discontinued operations for the years ended December 31, 2017, 2016, and 2015.
F- 20
Hudson Pacific Properties, Inc. and Hudson Pacific Properties, L.P.
Notes to Consolidated Financial Statements—(Continued)
(Tables in thousands, except square footage and share data)
Impairment of Long-Lived Assets
The Company assesses the carrying value of real estate assets and related intangibles for impairment on a quarterly basis and whenever events or changes in circumstances indicate that the carrying amount of an asset or asset group may not be recoverable in accordance with GAAP. Impairment losses are recorded on real estate assets held for investment when indicators of impairment are present and the future undiscounted cash flows estimated to be generated by those assets are less than the assets’ carrying amount. The Company recognizes impairment losses to the extent the carrying amount exceeds the fair value of the properties. No impairment indicators have been noted and the Company recorded no impairment charges during the years ended December 31, 2017, 2016 and 2015.
Goodwill
Goodwill represents the excess of acquisition cost over the fair value of net tangible and identifiable intangible assets acquired and liabilities assumed in business acquisitions. The Company does not amortize this asset but instead analyzes it on a quarterly basis for impairment. No impairment indicators have been noted during the years ended December 31, 2017 and 2016, respectively. Goodwill is included in the prepaid expenses and other assets, net line item on the Consolidated Balance Sheets.
Cash, Cash Equivalents and Restricted Cash
Cash and cash equivalents are defined as cash on hand and in banks, plus all short-term investments with a maturity of three months or less when purchased. Restricted cash primarily consists of amounts held by lenders to fund reserves such as capital improvements, taxes, insurance, debt service and operating expenditures.
The Company maintains some of its cash in bank deposit accounts that, at times, may exceed the federally insured limit. No losses have been experienced related to such accounts.
Pursuant to the adoption of ASU 2016-18, the Company included restricted cash with cash and cash equivalents in the Consolidated Statements of Cash Flows, which resulted in an increase of $7.2 million and $0.9 million in the net cash provided by operating activities line item in the Consolidated Statements of Cash Flows for the years ended December 31, 2016 and 2015.
The following table provides a reconciliation of cash and cash equivalents and restricted cash at the beginning and end of the periods presented:
December 31, | |||||||||||
2017 | 2016 | 2015(1) | |||||||||
Beginning of period: | |||||||||||
Cash and cash equivalents | $ | 83,015 | $ | 53,551 | $ | 17,753 | |||||
Restricted cash | 25,177 | 18,010 | 17,083 | ||||||||
Total | $ | 108,192 | $ | 71,561 | $ | 34,836 | |||||
End of period: | |||||||||||
Cash and cash equivalents | $ | 78,922 | $ | 83,015 | $ | 53,551 | |||||
Restricted cash | 22,358 | 25,177 | 18,010 | ||||||||
Total | $ | 101,280 | $ | 108,192 | $ | 71,561 | |||||
_____________
(1) | Includes restricted cash that was previously included in assets held for sale as of December 31, 2014. |
Accounts Receivable, net
Accounts receivable consist of amounts due for monthly rents and other charges. The Company maintains an allowance for doubtful accounts for estimated losses resulting from tenant defaults or the inability of tenants to make contractual rent and tenant recovery payments. The Company monitors the liquidity and creditworthiness of its tenants and operators on an ongoing basis. This evaluation considers industry and economic conditions, property performance, credit
F- 21
Hudson Pacific Properties, Inc. and Hudson Pacific Properties, L.P.
Notes to Consolidated Financial Statements—(Continued)
(Tables in thousands, except square footage and share data)
enhancements, length of time the receivables are past due, specific identification of uncollectible amounts, historical experience and other relevant factors. Historical experience has been within management’s expectations.
The following table represents the Company’s accounts receivable, net as of:
December 31, 2017 | December 31, 2016 | |||||||
Accounts receivable | $ | 6,835 | $ | 8,834 | ||||
Allowance for doubtful accounts | (2,472 | ) | (1,827 | ) | ||||
Accounts receivable, net(1) | $ | 4,363 | $ | 7,007 | ||||
_____________
(1) | Excludes balances related to properties that have been classified as held for sale. |
Straight-line Rent Receivables, net
For straight-line rent amounts, the Company’s assessment is based on amounts estimated to be recoverable over the term of the lease. The Company evaluates the collectability of straight-line rent receivables based on the length of time the related rental receivables are past due, the current business environment and the Company’s historical experience.
The following table represents the Company’s straight-line rent receivables, net as of:
December 31, 2017 | December 31, 2016 | |||||||
Straight-line rent receivables | $ | 109,457 | $ | 79,345 | ||||
Allowance for doubtful accounts | — | (136 | ) | |||||
Straight-line rent receivables, net(1) | $ | 109,457 | $ | 79,209 | ||||
_____________
(1) | Excludes balances related to properties that have been classified as held for sale. |
Prepaid Expenses and Other Assets, net
Prepaid expenses and other assets primarily consists of investments in unconsolidated entities, goodwill and derivative assets. These balances were presented separately on the 2016 Form 10-K, however, these accounts have been reclassified on our Consolidated Balance Sheets to conform to the current year’s presentation.
The following table represents the Company’s prepaid expenses and other assets, net as of:
December 31, 2017 | December 31, 2016 | |||||||
Investment in unconsolidated entities | $ | 14,240 | $ | 37,228 | ||||
Goodwill | 8,754 | 8,754 | ||||||
Derivative assets | 12,586 | 5,935 | ||||||
Other | 25,558 | 25,297 | ||||||
Prepaid expenses and other assets, net(1) | $ | 61,138 | $ | 77,214 | ||||
_____________
(1) | Excludes balances related to properties that have been classified as held for sale. |
Security Deposits and Prepaid Rent
The security deposits and prepaid rent balances were presented separately on the 2016 Form 10-K, however, these accounts have been reclassified on our Consolidated Balance Sheets to conform to the current year’s presentation.
F- 22
Hudson Pacific Properties, Inc. and Hudson Pacific Properties, L.P.
Notes to Consolidated Financial Statements—(Continued)
(Tables in thousands, except square footage and share data)
The following table represents the Company’s security deposits and prepaid rent as of:
December 31, 2017 | December 31, 2016 | |||||||
Security deposits | $ | 36,458 | $ | 29,837 | ||||
Prepaid rent | 27,573 | 37,041 | ||||||
Security deposits and prepaid rent(1) | $ | 64,031 | $ | 66,878 | ||||
_____________
(1) Excludes balances related to properties that have been classified as held for sale.
Segment Reporting
The Company’s reporting segments are based on the Company’s method of internal reporting, which classifies its operations into two reporting segments: (i) office properties and (ii) media and entertainment properties. The Company evaluates performance based upon net operating income of the combined properties in each segment. The media and entertainment segment is immaterial, and therefore separate income information by segment has not been presented. Asset information by segment is not reported because the Company does not use this measure to assess performance or make decisions to allocate resources.
Revenue Recognition
The Company recognizes rental revenue from tenants on a straight-line basis over the lease term when collectability is reasonably assured and the tenant has taken possession or controls the physical use of the leased asset. If the lease provides for tenant improvements, the Company determines whether the tenant improvements, for accounting purposes, are owned by the tenant or the Company. When the Company is the owner of the tenant improvements, the tenant is not considered to have taken physical possession or have control of the physical use of the leased asset until the tenant improvements are substantially completed. When the tenant is the owner of the tenant improvements, any tenant improvement allowance that is funded is treated as a lease incentive and amortized as a reduction of revenue over the lease term. Tenant improvement ownership is determined based on various factors including, but not limited to:
• | whether the lease stipulates how and on what a tenant improvement allowance may be spent; |
• | whether the tenant or landlord retains legal title to the improvements at the end of the lease term; |
• | whether the tenant improvements are unique to the tenant or general-purpose in nature; and |
• | whether the tenant improvements are expected to have any residual value at the end of the lease. |
Certain leases provide for additional rents contingent upon a percentage of the tenant’s revenue in excess of specified base amounts or other thresholds. Such revenue is recognized when actual results reported by the tenant, or estimates of tenant results, exceed the base amount or other thresholds. Such revenue is recognized only after the contingency has been removed (when the related thresholds are achieved), which may result in the recognition of rental revenue in periods subsequent to when such payments are received.
Other property-related revenue is revenue that is derived from the tenants’ use of lighting, equipment rental, parking, power, HVAC and telecommunications (telephone and Internet). Other property-related revenue is recognized when these items are provided.
Tenant recoveries related to reimbursement of real estate taxes, insurance, repairs and maintenance, and other operating expenses are recognized as revenue in the period during which the applicable expenses are incurred. The reimbursements are recognized and presented gross, as the Company is generally the primary obligor with respect to purchasing goods and services from third-party suppliers, has discretion in selecting the supplier and bears the associated credit risk.
The Company recognizes gains on sales of properties upon the closing of the transaction with the purchaser. Gains on properties sold are recognized using the full accrual method when (i) the collectability of the sales price is reasonably assured, (ii) the Company is not obligated to perform significant activities after the sale, (iii) the initial investment from the buyer is
F- 23
Hudson Pacific Properties, Inc. and Hudson Pacific Properties, L.P.
Notes to Consolidated Financial Statements—(Continued)
(Tables in thousands, except square footage and share data)
sufficient and (iv) other profit recognition criteria have been satisfied. Gains on sales of properties may be deferred in whole or in part until the requirements for gain recognition have been met.
Deferred Financing Costs and Debt Discount/Premium
Deferred financing costs are amortized over the contractual loan term into interest expense on the Consolidated Statements of Operations. Deferred financing costs, and related amortization, related to the unsecured revolving credit facility and undrawn term loans are presented within prepaid expenses and other assets, net in the Consolidated Balance Sheets. All other deferred financing costs, and related amortization, are included in the notes payable, net line item in the Consolidated Balance Sheets.
Debt discounts and premiums are amortized and accreted on a straight-line basis over the contractual loan term, which approximates the effective interest method, into interest expense on the Consolidated Statements of Operations. Discounts are recorded as additional interest expense and premiums are recorded as a reduction to interest expense.
Derivative Instruments
The Company manages interest rate risk associated with borrowings by entering into derivative instruments. The Company recognizes all derivative instruments on the Consolidated Balance Sheets on a gross basis at fair value. Derivative instruments that are not effective hedges are adjusted to fair value and the changes in fair value are reflected as income or expense. If the derivative instrument is an effective hedge, depending on the nature of the hedge, changes in the fair value are either offset against the change in fair value of the hedged assets, liabilities, or firm commitments through earnings, or recognized in other comprehensive income (loss), which is a component of equity. The ineffective portion of a derivative instrument’s change in fair value is immediately recognized in earnings.
Stock-Based Compensation
Compensation cost of restricted stock, restricted stock units and performance units under the Company’s equity incentive award plans are accounted for under ASC 718, Compensation-Stock Compensation (“ASC 718”). The Company accounts for forfeitures of awards as they occur.
Income Taxes
The Company’s property-owning subsidiaries are limited liability companies and are treated as pass-through entities or disregarded entities (or, in the case of the entities that own the 1455 Market and Hill7 properties, REITs) for federal income tax purposes. Accordingly, no provision has been made for federal income taxes in the accompanying consolidated financial statements for the activities of these entities.
The Company has elected to be taxed as a REIT under the Internal Revenue Code of 1986, as amended (the “Code”) commencing with its taxable year ended December 31, 2010. The Company believes that it has operated in a manner that has allowed the Company to qualify as a REIT for federal income tax purposes commencing with such taxable year, and the Company intends to continue operating in such manner. To qualify as a REIT, the Company is required to distribute at least 90% of its net taxable income, excluding net capital gains, to the Company’s stockholders and to meet the various other requirements imposed by the Code relating to such matters as operating results, asset holdings, distribution levels and diversity of stock ownership.
Provided that it continues to qualify for taxation as a REIT, the Company is generally not subject to corporate level income tax on the earnings distributed currently to its stockholders. If the Company fails to qualify as a REIT in any taxable year, and is unable to avail itself of certain savings provisions set forth in the Code, all of its taxable income would be subject to federal income tax at regular corporate rates, including any applicable alternative minimum tax. Unless entitled to relief under specific statutory provisions, the Company would be ineligible to elect to be treated as a REIT for the four taxable years following the year for which the Company loses its qualification. It is not possible to state whether in all circumstances the Company would be entitled to this statutory relief.
The Company may acquire direct or indirect interests in one or more Subsidiary REITs. A Subsidiary REIT is subject to the various REIT qualification requirements and other limitations described herein that are applicable to the Company. If a subsidiary REIT were to fail to qualify as a REIT, then (i) that Subsidiary REIT would become subject to federal income tax, (ii) shares in such REIT would cease to be qualifying assets for purposes of the asset tests applicable to REITs and (iii) it is
F- 24
Hudson Pacific Properties, Inc. and Hudson Pacific Properties, L.P.
Notes to Consolidated Financial Statements—(Continued)
(Tables in thousands, except square footage and share data)
possible that the Company would fail certain of the asset tests applicable to REITs, in which event the Company would fail to qualify as a REIT unless the Company could avail itself of certain relief provisions.
The Company believes that its operating partnership is properly treated as a partnership for federal income tax purposes. As a partnership, the Company’s operating partnership is not subject to federal income tax on its income. Instead, each of its partners, including the Company, is allocated, and may be required to pay tax with respect to, its share of the operating partnership’s income. As such, no provision for federal income taxes has been included for the operating partnership.
The Company has elected, together with one of the Company’s subsidiaries, to treat such subsidiary as a taxable REIT subsidiary (“TRS”) for federal income tax purposes. Certain activities that the Company may undertake, such as non-customary services for the Company’s tenants and holding assets that the Company cannot hold directly, will be conducted by a TRS. A TRS is subject to federal and, where applicable, state income taxes on its net income. The Company’s TRS did not have significant tax provisions or deferred income tax items for 2017, 2016 or 2015.
The Company is subject to the statutory requirements of the states in which it conducts business.
The Company periodically evaluates its tax positions to determine whether it is more likely than not that such positions would be sustained upon examination by a tax authority for all open tax years, as defined by the statute of limitations, based on their technical merits. As of December 31, 2017, the Company has not established a liability for uncertain tax positions.
The Company and its TRS file income tax returns with the U.S. federal government and various state and local jurisdictions. The Company and its TRS are no longer subject to tax examinations by tax authorities for years prior to 2012. Generally, the Company has assessed its tax positions for all open years, which include 2012 to 2016, and concluded that there are no material uncertainties to be recognized.
Fair Value of Assets and Liabilities
Under GAAP, the Company is required to measure certain financial instruments at fair value on a recurring basis. In addition, the Company is required to measure other financial instruments and balances at fair value on a non-recurring basis (e.g., carrying value of impaired real estate and long-lived assets). Fair value is defined as the price that would be received upon the sale of an asset or paid to transfer a liability in an orderly transaction between market participants on the measurement date. The GAAP fair value framework uses a three-tiered approach. Fair value measurements are classified and disclosed in one of the following three categories:
• | Level 1: unadjusted quoted prices in active markets that are accessible at the measurement date for identical assets or liabilities; |
• | Level 2: quoted prices for similar instruments in active markets, quoted prices for identical or similar instruments in markets that are not active, and model-derived valuations in which significant inputs and significant value drivers are observable in active markets; and |
• | Level 3: prices or valuation techniques where little or no market data is available that requires inputs that are both significant to the fair value measurement and unobservable. |
When available, the Company utilizes quoted market prices from an independent third-party source to determine fair value and classifies such items in Level 1 or Level 2. In instances where the market for a financial instrument is not active, regardless of the availability of a nonbinding quoted market price, observable inputs might not be relevant and could require the Company to make a significant adjustment to derive a fair value measurement. Additionally, in an inactive market, a market price quoted from an independent third party may rely more on models with inputs based on information available only to that independent third party. When the Company determines the market for a financial instrument owned by the Company to be illiquid or when market transactions for similar instruments do not appear orderly, the Company uses several valuation sources (including internal valuations, discounted cash flow analysis and quoted market prices) and establishes a fair value by assigning weights to the various valuation sources.
Changes in assumptions or estimation methodologies can have a material effect on these estimated fair values. In this regard, the derived fair value estimates cannot be substantiated by comparison to independent markets and, in many cases, may not be realized in an immediate settlement of the instrument.
F- 25
Hudson Pacific Properties, Inc. and Hudson Pacific Properties, L.P.
Notes to Consolidated Financial Statements—(Continued)
(Tables in thousands, except square footage and share data)
The Company considers the following factors to be indicators of an inactive market: (i) there are few recent transactions, (ii) price quotations are not based on current information, (iii) price quotations vary substantially either over time or among market makers (for example, some brokered markets), (iv) indexes that previously were highly correlated with the fair values of the asset or liability are demonstrably uncorrelated with recent indications of fair value for that asset or liability, (v) there is a significant increase in implied liquidity risk premiums, yields, or performance indicators (such as delinquency rates or loss severities) for observed transactions or quoted prices when compared with the Company’s estimate of expected cash flows, considering all available market data about credit and other nonperformance risk for the asset or liability, (vi) there is a wide bid-ask spread or significant increase in the bid-ask spread, (vii) there is a significant decline or absence of a market for new issuances (that is, a primary market) for the asset or liability or similar assets or liabilities, and (viii) little information is released publicly (for example, a principal-to-principal market).
The Company considers the following factors to be indicators of non-orderly transactions: (i) there was not adequate exposure to the market for a period before the measurement date to allow for marketing activities that are usual and customary for transactions involving such assets or liabilities under current market conditions, (ii) there was a usual and customary marketing period, but the seller marketed the asset or liability to a single market participant, (iii) the seller is in or near bankruptcy or receivership (that is, distressed), or the seller was required to sell to meet regulatory or legal requirements (that is, forced), and (iv) the transaction price is an outlier when compared with other recent transactions for the same or similar assets or liabilities.
Recently Issued Accounting Pronouncements
Changes to GAAP are established by the Financial Accounting Standards Board (“the FASB”) in the form of Accounting Standards Update (“ASU”). The following ASUs were issued from 2016 to 2017 and have been adopted by the Company:
Standard | Description | Effect on the Financial Statements or Other Significant Matters | ||
ASU 2017-04, Intangibles—Goodwill and Other (Topic 350): Simplifying the Test for Goodwill Impairment | This guidance removes step two from the goodwill impairment test. As a result, an entity should perform its annual, or interim, goodwill impairment test by comparing the fair value of a reporting unit with its carrying amount and should recognize an impairment charge for the amount by which the carrying amount exceeds the reporting unit’s fair value; however, the loss recognized should not exceed the total amount of goodwill allocated to that reporting unit. | The Company early adopted this guidance during the second quarter of 2017 and applied it prospectively. The adoption did not have an impact on the Company’s consolidated financial statements. | ||
ASU 2017-03, Accounting Changes and Error Corrections (Topic 250) and Investments—Equity Method and Joint Ventures (Topic 323): Amendments to SEC Paragraphs Pursuant to Staff Announcements at the September 22, 2016 and November 17, 2016 EITF Meetings (SEC Update) | The guidance in this ASU is based on two SEC staff announcements made at the September 2016 and November 2016 EITF meetings. In the September meeting, the SEC announced that a registrant should disclose the potential material effects of the ASUs related to revenues, leases and credit losses on financial instruments. As a result of the November meeting, the ASU conforms to ASC 323 to the guidance issued in ASU 2014-01 related to investments in qualified affordable housing projects. | The Company adopted this guidance during the first quarter of 2017 and applied it prospectively. With the adoption, the Company provided updates on its implementation of the ASUs related to revenue, leases and credit losses on financial instruments. Please refer to sections below for updates on the implementation of revenue and lease ASUs. The ASU related to credit losses on financial instruments could have a material impact on trade receivables and the Company is currently assessing the impact of this ASU on its consolidated financial statements and notes to the consolidated financial statements. | ||
ASU 2017-01, Business Combinations (Topic 805): Clarifying the Definition of a Business | This update amends the guidance for determining whether a transaction involves the purchase or disposal of a business or an asset. The amendments clarify that when substantially all of the fair value of the gross assets acquired or disposed of is concentrated in a single identifiable asset or a group of similar assets, the set of assets and activities is not a business. | The Company early adopted the guidance in the fourth quarter of 2016. The adoption of this guidance changed the accounting for the transaction costs for acquisitions of operating properties treated as asset acquisitions such that transaction costs are capitalized as part of the purchase price of the acquisition instead of being expensed as transaction-related expenses. | ||
F- 26
Hudson Pacific Properties, Inc. and Hudson Pacific Properties, L.P.
Notes to Consolidated Financial Statements—(Continued)
(Tables in thousands, except square footage and share data)
Standard | Description | Effect on the Financial Statements or Other Significant Matters | ||
ASU 2016-19, Technical Corrections and Improvements | The technical corrections make minor change to certain aspects of the FASB ASC, including changes to resolve differences between current and pre-Codification guidance, updates to wording, references to avoid misapplication and textual simplifications to increase the Codification’s utility and understandability and minor amendments to guidance that are not expected to have a significant effect on current accounting practice or create a significant administrative cost to most entities. | The Company adopted this guidance during the first quarter of 2017 and applied it prospectively. The adoption did not have a material impact on the Company’s consolidated financial statements. | ||
ASU 2016-18, Statement of Cash Flows (Topic 230): Restricted Cash (a consensus of the FASB Emerging Issues Task Force) | This guidance requires entities to include restricted cash and restricted cash equivalents with cash and cash equivalents when reconciling the beginning of period and end of period total amounts shown on the statement of cash flows. | The Company early adopted this guidance during the second quarter of 2017 and applied it retrospectively. Pursuant to the adoption, the Company revised the Consolidated Statement of Cash Flows and disclosed the reconciliation to the related captions in the Consolidated Balance Sheets. | ||
ASU 2016-17, Consolidation (Topic 810): Interests Held through Related Parties That Are under Common Control | This guidance outlines how a single decisionmaker of a VIE should treat indirect interests held through other related parties that are under common control with the reporting entity when determining whether it is the primary beneficiary of that VIE. | The Company adopted this guidance during the first quarter of 2017 and applied it retrospectively. The adoption did not have a material impact on the Company’s consolidated financial statements and did not change the consolidation conclusion. | ||
ASU 2016-15, Classification of Certain Cash Receipts and Cash Payments | This ASU clarifies how certain transactions should be classified in the statement of cash flows, including debt prepayment costs, contingent consideration payments made after a business combination and distributions received from equity method investments. The ASU provides two approaches to determine the classification of cash distributions received from equity method investments: (i) the “cumulative earnings” approach, under which distributions up to the amount of cumulative equity in earnings recognized will be classified as cash inflows from operating activities, and those in excess of that amount will be classified as cash inflows from investing activities and (ii) the “nature of the distribution” approach, under which distributions will be classified based on the nature of the underlying activity that generated cash distributions. The guidance requires a Company to elect either the “cumulative earnings” approach or the “nature of the distribution” approach at the time of adoption. | The Company early adopted this guidance during the second quarter of 2017 and applied it retrospectively. Pursuant to the adoption, the Company elected the “nature of the distribution” approach related to the distributions received from its equity method investments. The adoption did not have an impact on the Company’s Consolidated Statements of Cash Flows. | ||
ASU 2016-07, Investments—Equity Method and Joint Ventures (Topic 323), Simplifying the Transition to the Equity Method of Accounting | The guidance eliminates the requirement that an investor retrospectively apply equity method accounting when an investment that it had accounted for by another method initially qualifies for use of the equity method. The guidance also requires an investor that has an available-for-sale security that subsequently qualifies for the equity method to recognize in net income the unrealized holding gains or losses in accumulated other comprehensive income related to that security when it begins applying the equity method. It is required to apply this guidance prospectively. | The Company adopted this guidance during the first quarter of 2017 and applied it prospectively. The adoption did not have a material impact on the Company’s consolidated financial statements. | ||
ASU 2016-06, Investments—Derivatives and Hedging (Topic 815), Contingent Put and Call Options in Debt Instruments | The guidance requires a four-step decision sequence when assessing whether an embedded contingent put or call option is clearly and closely related to the debt host instrument. | The Company adopted this guidance during the first quarter of 2017 and applied it prospectively. The adoption did not have an impact on the Company’s consolidated financial statements. | ||
ASU 2016-05, Derivatives and Hedging (Topic 815), Effect of Derivative Contract Novations on Existing Hedge Accounting Relationships | The guidance states that the novation of a derivative contract (e.g., a change in the counterparty) in a hedge accounting relationship does not, in and of itself, require de-designation of that hedge accounting relationship. The hedge accounting relationship could continue uninterrupted if all of the other hedge accounting criteria are met, including the expectation that the hedge will be highly effective when the creditworthiness of the new counterparty to the derivative contract is considered. Either a prospective or a modified retrospective approach can be applied. | The Company adopted this guidance during the first quarter of 2017 and applied it prospectively. The adoption did not have a material impact on the Company’s consolidated financial statements. | ||
F- 27
Hudson Pacific Properties, Inc. and Hudson Pacific Properties, L.P.
Notes to Consolidated Financial Statements—(Continued)
(Tables in thousands, except square footage and share data)
Update on ASC 606, Revenue from Contracts with Customers (“ASC 606”), implementation
The new revenue standard was amended through various ASU’s. The ASU’s that impact the Company are ASU 2016-08, Revenue from Contracts with Customers—Principal versus Agent Considerations (Reporting Revenue Gross versus Net) and ASU 2014-09, Revenue from Contracts with Customers.
Issued on March 17, 2016, ASU 2016-08 clarifies certain aspects of the principal-versus-agent guidance in its new revenue recognition standard related to the determination of whether an entity is a principal-versus-agent and the determination of the nature of each specified good or service. Issued on May 28, 2014, ASU 2014-09 outlines a single comprehensive model for entities to use in accounting for revenues arising from contracts with customers and specifically notes that lease contracts with customers are a scope exception.
ASC 606 provides practical expedients associated with the determination of whether a significant financing component exists and the expedient for recording an immediate expense for certain incremental costs of obtaining a contract with a customer. This ASU is effective for annual reporting periods (including interim periods) beginning after December 15, 2017. Either the full retrospective approach (to the beginning of its contracts) or modified retrospective approach (from the beginning of the latest fiscal year of adoption) is permitted.
The Company has compiled an inventory of its sources of revenues and has preliminarily identified three revenue streams, which include other property related revenues, tenant recoveries and parking and other. Two of these revenue streams will be accounted for under ASC 606 when it becomes effective on January 1, 2018. The remaining revenue stream, tenant recoveries, which is integral to the Company’s leasing revenues, will be accounted for under ASC 606 on January 1, 2019, when the Company adopts ASC 842, Leases (“ASC 842”). Under the current ASC 842 guidance, the Company would be required to classify our tenant recoveries into lease and non-lease components. In January 2018, the FASB issued a proposed amendment to ASC 842 which if elected allows the Company to classify tenant recoveries as a single lease component and ASC 606 would then not apply.
The Company has completed its implementation of ASC 606 and has concluded that the recognition of revenues will not be materially impacted by this standard. The Company adopted ASC 606 on January 1, 2018 using the modified retrospective approach and is using the practical expedients associated with expensing incremental costs of obtaining a contract with a customer with terms of one year or less.
Update on ASC 842, Leases, implementation
On February 25, 2016, the FASB issued ASU 2016-02, Leases, to amend the accounting guidance for leases and set out the principles for the recognition, measurement, presentation and disclosure of leases for both parties to a lease agreement (i.e., lessees and lessors). This ASU is effective for annual reporting periods (including interim periods) beginning after December 15, 2018. A modified retrospective approach must be applied for leases that exist or are entered into after January 1, 2017, the beginning of the earliest comparative period presented in the 2019 consolidated financial statements, with a cumulative adjustment to the opening balance of accumulated deficit on January 1, 2017, and restatement of the amounts presented prior to January 1, 2019.
In January 2018, the FASB issued a proposed amendment to ASU 842 that would provide an entity the optional transition method to initially account for the impact of the adoption with a cumulative adjustment to accumulated deficit on the effective date of the ASU, January 1, 2019 rather than January 1, 2017, which would eliminate the need to restate amounts presented prior to January 1, 2019.
This guidance requires all lessees to record a lease liability at lease inception, with a corresponding right of use asset, except for short-term leases. Lessor accounting will not be fundamentally changed.
ASC 842 provides practical expedients that allow entities to not (i) reassess whether any expired or existing contracts are considered or contain leases; (ii) reassess the lease classification for any expired or existing leases; and (iii) reassess initial direct costs for any existing leases.
The Company plans to adopt the standard on January 1, 2019 and expects to elect the use of practical expedients. If the proposed amendment to ASU 842 is adopted, the Company would elect the transition method for adoption as described above.
F- 28
Hudson Pacific Properties, Inc. and Hudson Pacific Properties, L.P.
Notes to Consolidated Financial Statements—(Continued)
(Tables in thousands, except square footage and share data)
Lessor Accounting
The Company recognized rental revenues and tenant recoveries of $675.6 million for the year ended December 31, 2017. This ASU requires companies to identify lease and non-lease components of a lease agreement. Lease components relate to the right to use the leased asset and non-lease components relate to payments for goods or services that are transferred separately from the right to use the underlying asset. Total lease consideration is allocated to lease and non-lease components on a relative standalone basis. The recognition of revenues related to lease components will be governed by ASC 842 while revenue related to non-lease components will be subject to ASC 606.
Under current accounting standards, the Company recognizes rental revenue from tenants on a straight-line basis over the lease term when collectability is reasonably assured and the tenant has taken possession or controls the physical use of the leased asset. Tenant recoveries related to reimbursement of real estate taxes, insurance, repairs and maintenance and other operating expenses are recognized as revenue in the period during which the applicable expenses are incurred. The reimbursements are recognized and presented gross, as we are generally the primary obligor with respect to purchasing goods and services from third-party suppliers, have discretion in selecting the supplier and bear the associated credit risk.
In the FASB-proposed amendment to ASU 842, lessors can elect, as a practical expedient, not to allocate the total consideration to lease and non-lease components based on their relative standalone selling prices. If adopted, this practical expedient will allow lessors to elect a combined single lease component presentation if (i) the timing and pattern of the revenue recognition of the combined single lease component is the same, and (ii) the related lease component and, the combined single lease component would be classified as an operating lease.
The Company has not completed its analysis of this ASU. If the proposed practical expedient mentioned above is adopted and elected, tenant recoveries that qualify as non-lease components will be combined under a single lease component presentation. However, without the proposed practical expedient, the Company expects that it will continue to recognize the lease revenue component using an approach that is substantially equivalent to existing guidance. The Company expects that tenant recoveries will be separated into lease and non-lease components. Tenant recoveries that are categorized as lease components will generally be variable consideration with revenue recognized as the recoverable services are provided. Tenant recoveries that are categorized as non-lease components will be recognized at either a point in time or over time based on the pattern of transfer of the underlying goods or services to our tenants.
The ASU also requires lessors to capitalize only those costs that are defined as initial direct costs. Under the current accounting standards, the Company capitalizes initial direct and indirect leasing costs. During the year ended December 31, 2017, the Company capitalized $8.9 million of indirect leasing costs. Under this new ASU, these costs will be expensed as incurred.
Lessee Accounting
As of December 31, 2017, the future undiscounted minimum lease payments under the Company’s ground leases totaled $452.8 million. This guidance requires lessees to record a lease liability at lease inception, with a corresponding right-of-use asset, except for short-term leases. The Company continues to evaluate the amount of right-of-use asset and lease liability that will ultimately be recorded with respect to its ground leases agreements, where it is the lessee.
F- 29
Hudson Pacific Properties, Inc. and Hudson Pacific Properties, L.P.
Notes to Consolidated Financial Statements—(Continued)
(Tables in thousands, except square footage and share data)
Other recently issued ASUs
The Company considers the applicability and impact of all ASUs. The following table lists the recently issued ASUs that have not been adopted by the Company. The list excludes those ASUs that are not expected to have a material impact on the Company’s consolidated financial statements and the ASUs related to the ASC 606 and ASC 842 which are discussed above.
Standard | Description | Effective Date | Effect on the Financial Statements or Other Significant Matters | |||
ASU 2017-12, Derivatives and Hedging (Topic 815): Targeted Improvements to Accounting for Hedging Activities | The guidance eliminates the requirement to separately measure and report hedge ineffectiveness and generally requires the entire change in the fair value of a hedging instrument to be presented in the same income statement line as the hedged item. Therefore, a cumulative effect adjustment related to elimination of ineffectiveness measurement is required to be recorded to the opening balance of accumulated deficit as of the beginning of the fiscal year of adoption for cash flow hedges. The guidance also eases certain documentation and assessment requirements and modifies the accounting for components excluded from the assessment of hedge effectiveness. This guidance must be applied using a modified retrospective approach. | Effective for annual reporting periods (including interim periods) beginning after December 15, 2018 | The Company is currently evaluating the impact of this standard on its consolidated financial statements and notes to the consolidated financial statements. The Company expects that the adoption would impact derivative instruments that have portions of ineffectiveness. The Company plans to early adopt this guidance during the first quarter in 2018 and apply it using the modified retrospective approach. | |||
ASU 2017-09, Compensation—Stock Compensation (Topic 718): Scope of Modification Accounting | The guidance clarifies when changes to the terms or conditions of a share-based payment award must be accounted for as modifications. This guidance must be applied prospectively. | Effective for annual reporting periods (including interim periods) beginning after December 15, 2017 | The Company does not currently expect a material impact of this ASU on its consolidated financial statements and notes to the consolidated financial statements. The Company plans to adopt this guidance during the first quarter in 2018. | |||
ASU 2017-05, Other Income—Gains and Losses from the Derecognition of Nonfinancial Assets (Subtopic 610-20): Clarifying the Scope of Asset Derecognition Guidance and Accounting for Partial Sales of Nonfinancial Assets | The guidance updates the definition of an in substance nonfinancial asset and clarifies the scope of ASC 610-20 on the sale or transfer of nonfinancial assets to noncustomers, including partial sales. It also clarifies the derecognition guidance for nonfinancial assets to conform with the new revenue recognition standard. Either a full or modified retrospective approach can be applied. | Effective for annual reporting periods (including interim periods) beginning after December 15, 2017 | The Company currently expects that the adoption of this ASU could have a material impact on its consolidated financial statements; however, such impact will not be known until the Company disposes of any of its investments in real estate properties, which would all be sales of nonfinancial assets. The Company plans to adopt this guidance during the first quarter in 2018 and apply it using the modified retrospective approach. | |||
ASU 2016-13, Financial Instruments—Credit Losses | This guidance sets forth a new impairment model for financial instruments, the current expected credit loss (“CECL”) model, which is based on expected losses rather than incurred losses. Under the CECL model, an entity recognizes as an allowance its estimate of expected credit losses. | Effective for annual reporting periods (including interim periods) beginning after December 15, 2019 | The Company is currently evaluating the impact of this standard. | |||
ASU 2016-01, Financial Instruments—Overall (Subtopic 825-10), Recognition and Measurement of Financial Assets and Financial Liabilities. | This guidance provides a new measurement alternative for equity investments that do not have readily determinable fair values and do not qualify for the net asset value practical expedient. Under this alternative, these investments can be measured at cost, less any impairment, plus or minus changes resulting from observable price changes in orderly transactions for the identical or a similar investment of the same issuer. | Effective for annual reporting periods (including interim periods) beginning after December 15, 2017 | The Company is currently evaluating the impact of this standard. | |||
F- 30
Hudson Pacific Properties, Inc. and Hudson Pacific Properties, L.P.
Notes to Consolidated Financial Statements—(Continued)
(Tables in thousands, except square footage and share data)
3. Investment in Real Estate
The following table summarizes the Company’s investment in real estate, at cost as of:
December 31, 2017 | December 31, 2016 | ||||||
Land | $ | 1,302,907 | $ | 1,155,037 | |||
Building and improvements | 4,480,993 | 4,069,005 | |||||
Tenant improvements | 411,706 | 354,940 | |||||
Furniture and fixtures | 8,608 | 4,264 | |||||
Property under development | 219,227 | 295,234 | |||||
Investment in real estate, at cost(1) | $ | 6,423,441 | $ | 5,878,480 | |||
_____________
(1) | Excludes balances related to properties that have been classified as held for sale. |
Acquisitions
The following table summarizes the information on the acquisitions completed in 2017 and 2016:
Property | Submarket | Segment | Month of Acquisition | Square Feet | Purchase Price(1) (in millions) | ||||||||
Sunset Las Palmas Studios(2) | Hollywood | Media and Entertainment | May 2017 | 369,000 | $ | 200.0 | |||||||
11601 Wilshire land(3) | West Los Angeles | Office | June 2017 | N/A | 50.0 | ||||||||
6666 Santa Monica(4) | Hollywood | Media and Entertainment | June 2017 | 4,150 | 3.2 | ||||||||
Total acquisitions in 2017 | 373,150 | $ | 253.2 | ||||||||||
11601 Wilshire(5) | West Los Angeles | Office | July 2016 | 500,475 | $ | 311.0 | |||||||
Hill7(6) | South Lake Union | Office | October 2016 | 285,680 | 179.8 | ||||||||
Page Mill Hill(7) | Palo Alto | Office | December 2016 | 182,676 | 150.0 | ||||||||
Total acquisitions in 2016 | 968,831 | $ | 640.8 | ||||||||||
_____________
(1) | Represents purchase price before certain credits, prorations and closing costs. |
(2) | The property consists of stages, production office and support space on 15 acres near Sunset Gower Studios and Sunset Bronson Studios. The purchase price above does not include equipment purchased by the Company for $2.8 million, which was transacted separately from the studio acquisition. In April 2017, the Company drew $150.0 million under the unsecured revolving credit facility to fund the acquisition. |
(3) | On July 1, 2016 the Company purchased a partial interest in land held as a tenancy in common in conjunction with its acquisition of the 11601 Wilshire property. The land interest held as a tenancy in common was accounted for as an equity method investment. On June 15, 2017, the Company purchased the remaining interest, which was fair valued and allocated to land and building. |
(4) | This parcel is adjacent to the Sunset Las Palmas Studios property. |
(5) | Previously owned by an affiliate of Blackstone, the property has served as the Company’s corporate headquarters since its IPO. The Company funded this acquisition with proceeds from the unsecured revolving credit facility. |
(6) | The Company purchased the property through a joint venture with the Canadian Pension Plan Investment Board. The Company has a 55% ownership interest in the consolidated joint venture. In conjunction with the acquisition, the joint venture closed a secured non-recourse loan in the amount of $101.0 million. |
(7) | The Company funded this acquisition with proceeds from the unsecured revolving credit facility. |
The Company’s acquisitions in 2017 did not meet the definition of a business and were therefore accounted for as asset acquisitions. In accordance with asset acquisitions, the purchase price includes capitalized acquisition costs. The following table represents the Company’s final aggregate purchase price accounting, as of the respective acquisition dates, for each of the Company’s acquisitions completed in 2017:
Sunset Las Palmas Studios(1) | 11601 Wilshire land | 6666 Santa Monica | Total | |||||||||||||
Investment in real estate | $ | 202,723 | $ | 50,034 | $ | 3,091 | $ | 255,848 | ||||||||
Deferred leasing costs and in-place lease intangibles(2) | 1,741 | — | 145 | 1,886 | ||||||||||||
Total assets assumed | $ | 204,464 | $ | 50,034 | $ | 3,236 | $ | 257,734 | ||||||||
_____________
F- 31
Hudson Pacific Properties, Inc. and Hudson Pacific Properties, L.P.
Notes to Consolidated Financial Statements—(Continued)
(Tables in thousands, except square footage and share data)
(1) | The purchase price allocation includes equipment purchased by the Company of $2.8 million. |
(2) | Represents weighted-average amortization period of 1.2 years. |
The following table represents the final purchase price accounting for each of the Company’s acquisitions completed in 2016:
11601 Wilshire | Hill7 | Page Mill Hill | Total | ||||||||||||
Investment in real estate, net | $ | 292,382 | $ | 173,967 | $ | 131,402 | $ | 597,751 | |||||||
Land interest(1) | 7,836 | — | — | 7,836 | |||||||||||
Above-market leases(2) | 167 | — | 307 | 474 | |||||||||||
Below-market ground leases(3) | 212 | — | 12,125 | 12,337 | |||||||||||
Deferred leasing costs and lease intangibles(4) | 13,884 | 7,617 | 14,697 | 36,198 | |||||||||||
Below-market leases(5) | (6,562 | ) | (1,417 | ) | (8,636 | ) | (16,615 | ) | |||||||
Net asset and liabilities assumed | $ | 307,919 | $ | 180,167 | $ | 149,895 | $ | 637,981 | |||||||
_____________
(1) | Represents the fair value of the Company’s interest in the land which was included in investment in unconsolidated entities in the Consolidated Balance Sheets at December 31, 2016. On June 15, 2017, the Company purchased the remaining interest, which was fair valued and allocated to land and building. Refer to the 2017 acquisitions above for details. |
(2) | Represents weighted-average amortization period of 5.4 years. |
(3) | Represents weighted-average amortization period of 33.2 years. |
(4) | Represents weighted-average amortization period of 5.8 years. |
(5) | Represents weighted-average amortization period of 6.4 years. |
Dispositions
The following table summarizes the properties sold in 2017, 2016 and 2015. These properties were considered non-strategic to the Company’s portfolio:
Property | Month of Disposition | Square Feet | Sales Price(1) (in millions) | |||||
222 Kearny | February 2017 | 148,797 | $ | 51.8 | ||||
3402 Pico | March 2017 | 50,687 | 35.0 | |||||
Pinnacle I and Pinnacle II(2) | November 2017 | 623,777 | 350.0 | |||||
Total dispositions in 2017 | 823,261 | $ | 436.8 | |||||
Bayhill Office Center | January 2016 | 554,328 | $ | 215.0 | ||||
Patrick Henry | April 2016 | 70,520 | 19.0 | |||||
One Bay Plaza | June 2016 | 195,739 | 53.4 | |||||
12655 Jefferson | November 2016 | 100,756 | 80.0 | |||||
Total dispositions in 2016(3) | 921,343 | $ | 367.4 | |||||
First Financial | March 2015 | 223,679 | $ | 89.0 | ||||
Bay Park Plaza | September 2015 | 260,183 | 90.0 | |||||
Total dispositions in 2015(4) | 483,862 | $ | 179.0 | |||||
_____________
(1) | Represents gross sales price before certain credits, prorations and closing costs. |
(2) | The consolidated joint venture that owned Pinnacle I and Pinnacle II sold the properties to affiliates of Blackstone. In conjunction with the sale, the $216.0 million debt secured by these properties was assumed by the purchasers. |
(3) | Excludes the sale of an option to acquire land at 9300 Culver on December 6, 2016. |
(4) | Excludes the 45% ownership interest in 1455 Market completed on January 7, 2015. |
The disposition of these properties resulted in gains of $45.6 million, $30.4 million and $30.5 million for the years ended December 31, 2017, 2016 and 2015, respectively. Included in gains on sale of real estate line item on the Consolidated Statements of Operations in 2016 is a gain of $7.5 million related to a sale of an option to purchase land at 9300 Culver.
F- 32
Hudson Pacific Properties, Inc. and Hudson Pacific Properties, L.P.
Notes to Consolidated Financial Statements—(Continued)
(Tables in thousands, except square footage and share data)
Held for sale
As of December 31, 2017, the Company had four properties that met the criteria to be classified as held for sale. The following table summarizes properties classified as held for sale as of December 31, 2017:
Property | Purchase and Sale Executed | Square Feet | Sales Price(1) (in millions) | ||||||
2180 Sand Hill | November 2017 | 45,613 | $ | 82.5 | |||||
2600 Campus Drive (building 6 of Peninsula Office Park) | December 2017 | 63,050 | 22.5 | ||||||
Embarcadero Place | December 2017 | 197,402 | 136.0 | ||||||
9300 Wilshire | December 2017 | 61,422 | 13.8 | ||||||
Total | 367,487 | $ | 254.8 | ||||||
____________
(1) | Represents gross sales price before certain credits, prorations and closing costs. |
As of December 31, 2016, the Company had eight properties that met the criteria to be classified as held for sale which includes the properties sold during 2017.
The following table summarizes the components of assets and liabilities associated with real estate held for sale as of:
December 31, 2017 | December 31, 2016 | ||||||
ASSETS | |||||||
Investment in real estate, net | $ | 204,895 | $ | 580,261 | |||
Accounts receivable, net | 85 | 183 | |||||
Straight-line rent receivables, net | 2,234 | 8,849 | |||||
Deferred leasing costs and lease intangible assets, net | 4,063 | 23,078 | |||||
Prepaid expenses and other assets, net | 58 | 2,803 | |||||
Assets associated with real estate held for sale | $ | 211,335 | $ | 615,174 | |||
LIABILITIES | |||||||
Notes payable, net | $ | — | $ | 214,684 | |||
Accounts payable and accrued liabilities | 782 | 8,816 | |||||
Lease intangible liabilities, net | 95 | 6,890 | |||||
Security deposits and prepaid rent | 1,339 | 6,233 | |||||
Liabilities associated with real estate held for sale | $ | 2,216 | $ | 236,623 | |||
F- 33
Hudson Pacific Properties, Inc. and Hudson Pacific Properties, L.P.
Notes to Consolidated Financial Statements—(Continued)
(Tables in thousands, except square footage and share data)
4. Deferred Leasing Costs and Lease Intangibles, net
The following summarizes the Company’s deferred leasing costs and lease intangibles, net as of
December 31, 2017 | December 31, 2016 | ||||||
Above-market leases | $ | 19,222 | $ | 23,075 | |||
Accumulated amortization | (15,731 | ) | (12,645 | ) | |||
Above-market leases, net | 3,491 | 10,430 | |||||
Deferred leasing costs and in-place lease intangibles | 311,599 | 343,807 | |||||
Accumulated amortization | (132,426 | ) | (129,830 | ) | |||
Deferred leasing costs and in-place lease intangibles, net | 179,173 | 213,977 | |||||
Below-market ground leases | 68,388 | 68,601 | |||||
Accumulated amortization | (6,498 | ) | (4,079 | ) | |||
Below-market ground leases, net | 61,890 | 64,522 | |||||
Deferred leasing costs and lease intangible assets, net(1) | $ | 244,554 | $ | 288,929 | |||
Below-market leases | $ | 105,233 | $ | 127,950 | |||
Accumulated amortization | (56,265 | ) | (55,689 | ) | |||
Below-market leases, net | 48,968 | 72,261 | |||||
Above-market ground leases | 1,095 | 1,095 | |||||
Accumulated amortization | (133 | ) | (89 | ) | |||
Above-market ground leases, net | 962 | 1,006 | |||||
Lease intangible liabilities, net(1) | $ | 49,930 | $ | 73,267 | |||
_____________
(1) | Excludes balances related to properties that have been classified as held for sale. |
The Company recognized the following amortization related to deferred leasing costs and lease intangibles:
For the Year Ended December 31, | |||||||||||
2017 | 2016 | 2015 | |||||||||
Above-market leases(1) | $ | (6,953 | ) | $ | (11,259 | ) | $ | (12,534 | ) | ||
Below-market leases(1) | 25,015 | 30,993 | 34,607 | ||||||||
Deferred leasing costs and in-place lease intangibles(2) | (72,883 | ) | (84,492 | ) | (91,965 | ) | |||||
Above-market ground leases(3) | 43 | 43 | 46 | ||||||||
Below-market ground leases(3) | (2,548 | ) | (2,203 | ) | (1,688 | ) | |||||
_____________
(1) | Amortization is recorded in revenues in the Consolidated Statements of Operations. |
(2) | Amortization is recorded in depreciation and amortization expenses and office rental revenues in the Consolidated Statements of Operations. |
(3) | Amortization is recorded in office operating expenses in the Consolidated Statements of Operations. |
F- 34
Hudson Pacific Properties, Inc. and Hudson Pacific Properties, L.P.
Notes to Consolidated Financial Statements—(Continued)
(Tables in thousands, except square footage and share data)
The following table provides information regarding the Company’s estimated amortization of deferred leasing costs and lease intangibles as of December 31, 2017:
For the Year Ended December 31, | Above-market lease | Deferred lease cost and in-place lease intangibles | Below-market ground lease | Below-market lease | Above-market ground lease | |||||||||||||||
2018 | $ | (1,529 | ) | $ | (41,300 | ) | $ | (2,410 | ) | $ | 14,713 | $ | 43 | |||||||
2019 | (1,014 | ) | (31,533 | ) | (2,410 | ) | 11,317 | 43 | ||||||||||||
2020 | (466 | ) | (22,966 | ) | (2,410 | ) | 8,514 | 43 | ||||||||||||
2021 | (327 | ) | (18,224 | ) | (2,410 | ) | 6,084 | 43 | ||||||||||||
2022 | (106 | ) | (13,068 | ) | (2,410 | ) | 3,575 | 43 | ||||||||||||
Thereafter | (49 | ) | (52,082 | ) | (49,840 | ) | 4,765 | 747 | ||||||||||||
Total(1) | $ | (3,491 | ) | $ | (179,173 | ) | $ | (61,890 | ) | $ | 48,968 | $ | 962 | |||||||
_____________
(1) | Excludes balances related to properties that have been classified as held for sale. |
5. Notes Payable, net
The following table sets forth information with respect to the amounts included in notes payable, net as of:
December 31, 2017 | December 31, 2016 | Interest Rate(1) | Contractual Maturity Date | |||||||||
UNSECURED NOTES PAYABLE | ||||||||||||
Unsecured Revolving Credit Facility(2) | $ | 100,000 | $ | 300,000 | LIBOR + 1.15% to 1.85% | 4/1/2019 | (3) | |||||
5-Year Term Loan due April 2020(2)(4) | 300,000 | 450,000 | LIBOR + 1.30% to 2.20% | 4/1/2020 | ||||||||
5-Year Term Loan due November 2020(2) | 75,000 | 175,000 | LIBOR + 1.30% to 2.20% | 11/17/2020 | ||||||||
7-Year Term Loan due April 2022(2)(5) | 350,000 | 350,000 | LIBOR + 1.60% to 2.55% | 4/1/2022 | ||||||||
7-Year Term Loan due November 2022(2)(6) | 125,000 | 125,000 | LIBOR + 1.60% to 2.55% | 11/17/2022 | ||||||||
Series A Notes | 110,000 | 110,000 | 4.34% | 1/2/2023 | ||||||||
Series E Notes | 50,000 | 50,000 | 3.66% | 9/15/2023 | ||||||||
Series B Notes | 259,000 | 259,000 | 4.69% | 12/16/2025 | ||||||||
Series D Notes | 150,000 | 150,000 | 3.98% | 7/6/2026 | ||||||||
Registered Senior Notes(7) | 400,000 | — | 3.95% | 11/1/2027 | ||||||||
Series C Notes | 56,000 | 56,000 | 4.79% | 12/16/2027 | ||||||||
TOTAL UNSECURED NOTES PAYABLE | 1,975,000 | 2,025,000 | ||||||||||
SECURED NOTES PAYABLE | ||||||||||||
Rincon Center(8)(9) | 98,392 | 100,409 | 5.13% | 5/1/2018 | ||||||||
Sunset Gower Studios/Sunset Bronson Studios | 5,001 | 5,001 | LIBOR + 2.25% | 3/4/2019 | (3) | |||||||
Met Park North(10) | 64,500 | 64,500 | LIBOR + 1.55% | 8/1/2020 | ||||||||
10950 Washington(8) | 27,418 | 27,929 | 5.32% | 3/11/2022 | ||||||||
Element LA | 168,000 | 168,000 | 4.59% | 11/6/2025 | ||||||||
Hill7(11) | 101,000 | 101,000 | 3.38% | 11/6/2028 | ||||||||
Pinnacle I(12) | — | 129,000 | 3.95% | 11/7/2022 | ||||||||
Pinnacle II(12) | — | 87,000 | 4.30% | 6/11/2026 | ||||||||
TOTAL SECURED NOTES PAYABLE | 464,311 | 682,839 | ||||||||||
TOTAL NOTES PAYABLE | 2,439,311 | 2,707,839 | ||||||||||
Held for sale balances(12) | — | (216,000 | ) | |||||||||
Unamortized deferred financing costs and loan discounts(13) | (17,931 | ) | (18,513 | ) | ||||||||
TOTAL NOTES PAYABLE, NET | $ | 2,421,380 | $ | 2,473,326 | ||||||||
_____________
(1) | Interest rate with respect to indebtedness is calculated on the basis of a 360-day year for the actual days elapsed. Interest rates are as of December 31, 2017, which may be different than the interest rates as of December 31, 2016 for corresponding indebtedness. |
(2) | The Company has the option to make an irrevocable election to change the interest rate depending on the Company’s credit rating. As of December 31, 2017, no such election had been made. |
(3) | The maturity date may be extended once for an additional one-year term. |
F- 35
Hudson Pacific Properties, Inc. and Hudson Pacific Properties, L.P.
Notes to Consolidated Financial Statements—(Continued)
(Tables in thousands, except square footage and share data)
(4) | In July 2016, $300.0 million of the term loan was effectively fixed at 2.75% to 3.65% per annum through the use of two interest rate swaps. See Note 6 for details. |
(5) | In July 2016, the outstanding balance of the term loan was effectively fixed at 3.36%% to 4.31% per annum through the use of two interest rate swaps. See Note 6 for details. |
(6) | In June 2016, the outstanding balance of the term loan was effectively fixed at 3.03% to 3.98% per annum through the use of an interest rate swap. See Note 6 for details. |
(7) | On October 2, 2017, the Company completed an underwritten public offering of $400.0 million of senior notes, which were issued at 99.815% of par. |
(8) | Monthly debt service includes annual debt amortization payments based on a 30-year amortization schedule with a balloon payment at maturity. |
(9) | On February 1, 2018, the Company repaid the full outstanding balance of the mortgage loan secured by our Rincon Center property. |
(10) | This loan bears interest only. Interest on the full loan amount has been effectively fixed at 3.71% per annum through use of an interest rate swap. See Note 6 for details. |
(11) | The Company has a 55% ownership interest in the consolidated joint venture that owns the Hill7 property. The full amount of the loan is shown. This loan bears interest only at 3.38% until November 6, 2026, at which time the interest rate will increase and monthly debt service will include principle payments with a balloon payment at maturity. |
(12) | On November 16, 2017, the Company sold its ownership interest in the consolidated joint venture that owned Pinnacle I and Pinnacle II. The debt balances related to these properties were classified as held for sale at December 31, 2016. |
(13) | Excludes deferred financing costs related to properties held for sale and amounts related to establishing the Company’s unsecured revolving credit facility. |
Current Year Activity
On November 16, 2017, the consolidated joint venture that owned Pinnacle I and Pinnacle II sold the properties to certain affiliates of Blackstone for $350.0 million, before credits, prorations and closing costs, including the assumption of $216.0 million of secured notes payable. The loan balance related to these properties as of December 31, 2016 is reflected in liabilities associated with real estate held for sale in the Consolidated Balance Sheets. The Company used proceeds from the sale and cash on hand to repay $100.0 million of the Company's 5-year term loan due November 2020.
On October 2, 2017, the operating partnership completed an underwritten public offering of $400.0 million senior notes due November 1, 2027. The net proceeds from the offering, after deducting the underwriting discounts and offering expenses, were approximately $396.7 million and was used to repay $150.0 million of the Company’s 5-year term loan due April 2020 with the remainder of the net proceeds, together with cash on hand, used to repay $250.0 million outstanding under the Company’s unsecured revolving credit facility.
Indebtedness
The Company presents its financial statements on a consolidated basis. Notwithstanding such presentation, except to the extent expressly indicated, such as in the case of the project financing for Sunset Gower Studios and Sunset Bronson Studios, the Company’s separate property-owning subsidiaries are not obligors of or under the debt of their respective affiliates and each property-owning subsidiary’s separate liabilities do not constitute obligations of its respective affiliates.
Loan agreements include events of default that the Company believes are usual for loan and transactions of this type. As of the date of this filing, there have been no events of default associated with the Company’s loans.
Certain loan agreements require that some or all receipts collected from properties are deposited in lockbox accounts under the control of the lenders to fund reserves such as capital improvements, taxes, insurance, debt service and operating expenditures. Included in restricted cash on the Company’s Consolidated Balance Sheets at December 31, 2017 and December 31, 2016 are lockbox and reserve funds as follows:
Property | December 31, 2017 | December 31, 2016 | ||||||
Rincon Center | $ | 14,220 | $ | 16,291 | ||||
Element LA | 3,581 | 2,627 | ||||||
Hill7 | 2,392 | 1,643 | ||||||
10950 Washington | 1,406 | 1,249 | ||||||
Pinnacle I | — | 1,811 | ||||||
Pinnacle II | — | 1,382 | ||||||
Total | $ | 21,599 | $ | 25,003 | ||||
F- 36
Hudson Pacific Properties, Inc. and Hudson Pacific Properties, L.P.
Notes to Consolidated Financial Statements—(Continued)
(Tables in thousands, except square footage and share data)
The following table provides information regarding the Company’s future minimum principal payments due on the Company’s notes payable (before the impact of extension options, if applicable) as of December 31, 2017:
For the Year Ended December 31, | Annual Principal Payments | |||
2018 | $ | 98,930 | ||
2019 | 105,569 | |||
2020 | 440,095 | |||
2021 | 632 | |||
2022 | 500,085 | |||
Thereafter | 1,294,000 | |||
Total | $ | 2,439,311 | ||
Senior Unsecured Notes Payable
Registered Senior Notes
On October 2, 2017, our operating partnership completed an underwritten public offering of $400.0 million in senior notes due November 1, 2027. The notes were issued at 99.815% of par, with a coupon of 3.95%. The notes are fully and unconditionally guaranteed by the Company.
Term Loan Agreement
On November 17, 2015, the operating partnership entered into a term loan credit agreement with a group of lenders for an unsecured $175.0 million 5-year delayed draw term loan with a maturity date of November 2020 (“5-Year Term Loan due November 2020”) and an unsecured $125.0 million 7-year delayed draw term loan with a maturity date of November 2022 (“7-Year Term Loan due November 2022”). These term loans were fully drawn on May 3, 2016.
Interest on the term loan agreement is generally to be paid based upon, at our option, either (i) LIBOR plus the applicable LIBOR margin or (ii) a specified base rate plus the applicable base rate margin, dependent on the operating partnership’s leverage ratio. The applicable LIBOR margin will range from 1.30% to 2.20% for the 5-Year Term Loan due November 2020, depending on our Leverage Ratio (as defined in the term loan agreement) and 1.60% to 2.55% for the 7-Year Term Loan due November 2022, depending on our Leverage Ratio (as defined in the term loan agreement). Beginning on February 13, 2016, each term loan is subject to an unused commitment fee of .20%.
The operating partnership has the right to terminate or reduce unused commitments under either term loan in the term loan agreement without penalty or premium. Subject to the satisfaction of certain conditions, the operating partnership has the right to increase the availability of either or both of the term loans so long as the aggregate commitments under both term loans do not exceed $475.0 million.
If the Company obtains a credit rating for the Company’s senior unsecured long-term indebtedness, the operating partnership may make an irrevocable election to change the interest rate. During 2016, its senior unsecured long-term indebtedness was assigned an investment grade rating. The Company has not made the credit rating election.
Credit Facility Agreement
The operating partnership maintains and periodically amends its credit facility agreement with a group of lenders. On April 1, 2015, the agreement was amended and restated to, among other things, (i) extend the maturity date of the unsecured revolving credit facility with a one-year extension option, (ii) increase available revolving credit from $300.0 million to $400.0 million, (iii) increase the five-year term loan from $150.0 million to $550.0 million and extend the maturity date to April 2020 (“5-Year Term Loan due April 2020”) and (iv) add a $350.0 million seven-year term loan with a maturity date of April 2022 (“7-Year Term Loan due April 2022”). On November 17, 2015, the operating partnership amended and restated the credit facility agreement (“Amended and Restated Credit Facility Agreement”) to align certain terms therein with the less restrictive terms of the term loan agreement. The 5-Year Term Loan due April 2020 and the 7-Year Term Loan due April 2022 were used towards the EOP Acquisition.
F- 37
Hudson Pacific Properties, Inc. and Hudson Pacific Properties, L.P.
Notes to Consolidated Financial Statements—(Continued)
(Tables in thousands, except square footage and share data)
The unsecured revolving credit facility is available for various purposes, including payment of redevelopment and development costs incurred in connection with properties owned by the operating partnership or any subsidiary, to finance capital expenditures and the repayment of indebtedness of the Company, the operating partnership and its subsidiaries, to provide for general working capital needs of the Company, the operating partnership and its subsidiaries, and for general corporate purposes of the Company, the operating partnership and its subsidiaries.
Interest on the unsecured revolving credit facility is generally to be paid based upon, at our option, either (i) LIBOR plus the applicable LIBOR margin or (ii) a specified base rate plus the applicable base rate margin, dependent on the operating partnership’s leverage ratio. Unused amounts under the Amended and Restated Credit Facility Agreement are not subject to a separate fee.
Subject to the satisfaction of certain conditions and lender commitments, the operating partnership may increase the availability of the credit facility agreement so long as the aggregate commitments under the unsecured revolving credit facility do not exceed $2.0 billion.
If the Company obtains a credit rating for the Company’s senior unsecured long-term indebtedness, the operating partnership may make an irrevocable election to change the interest rate and facility fee. During 2016, our senior unsecured long-term indebtedness was assigned an investment grade rating. The Company has not made the credit rating election.
The operating partnership continues to be the borrower under the Amended and Restated Credit Facility Agreement, and the Company and all subsidiaries that own unencumbered properties will continue to provide guarantees unless the Company obtains and maintains a credit rating of at least BBB- from S&P or Baa3 from Moody’s, in which case such guarantees are not required except under limited circumstances.
The following table summarizes borrowing capacity and outstanding borrowings under the unsecured revolving credit facility as of:
December 31, 2017 | December 31, 2016 | ||||||
Outstanding borrowings(1) | $ | 100,000 | $ | 300,000 | |||
Remaining borrowing capacity(1) | 300,000 | 100,000 | |||||
Total borrowing capacity | $ | 400,000 | $ | 400,000 | |||
Interest rate(2) | LIBOR + 1.15% to 1.85% | ||||||
Facility fee-annual rate(2) | 0.20% or 0.35% | ||||||
Contractual maturity date(3) | 4/1/2019 | ||||||
_________________
(1) | On January 30, 2018, the Company borrowed an additional $100.0 million bringing the total outstanding borrowings to $200.0 million. |
(2) | The rate is based on the operating partnership’s leverage ratio. |
(3) | The maturity date may be extended once for an additional one-year term. |
Guaranteed Senior Notes
On November 16, 2015, the operating partnership entered into a note purchase agreement with various purchasers, which provides for the private placement of $425.0 million of guaranteed senior notes by the operating partnership, of which (i) $110.0 million are designated as 4.34% Series A guaranteed senior notes due January 2, 2023 (the “Series A Notes”), (ii) $259.0 million are designated as 4.69% Series B guaranteed senior notes due December 16, 2025 (the “Series B Notes”) and (iii) $56.0 million are designated as 4.79% Series C guaranteed senior notes due December 16, 2027 (the “Series C Notes”). These notes were issued on December 16, 2015 and upon issuance, the notes pay interest semi-annually on the 16th day of June and December in each year until their respective maturities.
On July 6, 2016, the Company entered into a private placement of debt for $150.0 million of 3.98% guaranteed senior notes due July 6, 2026 (the “Series D Notes”). Upon issuance, the notes pay interest semi-annually on the 6th day of January and July in each year until maturity. The Company also secured an additional $50.0 million of funds from a private placement of 3.66% guaranteed senior notes due September 15, 2023 (the “Series E Notes”), which were drawn on September 15, 2016. Upon issuance, the notes pay interest semi-annually on the 15th day of March and September in each year until maturity.
F- 38
Hudson Pacific Properties, Inc. and Hudson Pacific Properties, L.P.
Notes to Consolidated Financial Statements—(Continued)
(Tables in thousands, except square footage and share data)
The operating partnership may prepay at any time all or, from time to time, any part of the guaranteed senior notes in an amount not less than 5% of the aggregate principal amount of any series of guaranteed senior notes then outstanding in the case of a partial prepayment, at 100% of the principal amount so prepaid plus a make-whole premium.
The operating partnership’s obligations under guaranteed senior notes will be fully and unconditionally guaranteed by the Company. Subsidiaries of the Company will also issue unconditional guarantees upon the occurrence of certain conditions, including such subsidiaries providing guarantees under the Amended and Restated Credit Facility Agreement, by and among the operating partnership, the financial institutions party thereto, and Wells Fargo Bank, National Association as administrative agent.
Debt Covenants
The operating partnership’s ability to borrow under the unsecured notes payable remains subject to ongoing compliance with financial and other covenants as defined in their respective agreements. Certain financial covenant ratios are subject to change in the occurrence of material acquisitions as defined in the respective agreements. Other covenants include certain limitations on dividend payouts and distributions, limits on certain types of investments outside of the operating partnership’s primary business and other customary affirmative and negative covenants.
The following table summarizes existing covenants and their covenant levels, when considering the most restrictive term:
Covenant Ratio | Covenant Level | |
Leverage ratio | less than 60% | |
Unencumbered leverage ratio | less than 60% | |
Fixed charge coverage ratio | greater than 1.5x | |
Secured indebtedness leverage ratio | less than 45% | |
Unsecured interest coverage ratio | greater than 2x | |
The operating partnership was in compliance with its financial covenants as of December 31, 2017.
Repayment Guarantees
Registered Senior Notes
The Company has fully and unconditionally guaranteed the operating partnership’s registered senior notes of $400.0 million due November 1, 2027.
Sunset Gower Studios and Sunset Bronson Studios Loan
In connection with the loan secured by the Sunset Gower Studios and Sunset Bronson Studios properties, the Company has guaranteed in favor of and promised to pay to the lender 19.5% of the principal payable under the loan in the event the borrower, a wholly-owned entity of the operating partnership, does not do so. At December 31, 2017, the outstanding balance was $5.0 million, which results in a maximum guarantee amount for the principal under this loan of $1.0 million. Furthermore, the Company agreed to guarantee the completion of the construction improvements, including tenant improvements, as defined in the agreement, in the event of any default of the borrower. If the borrower fails to complete the remaining required work, the guarantor agrees to perform timely all of the completion obligations, as defined in the agreement. As of the date of this filing, there has been no event of default associated with this loan.
Other Loans
Although the rest of the operating partnership’s loans are secured and non-recourse, the operating partnership provides limited customary secured debt guarantees for items such as voluntary bankruptcy, fraud, misapplication of payments and environmental liabilities.
F- 39
Hudson Pacific Properties, Inc. and Hudson Pacific Properties, L.P.
Notes to Consolidated Financial Statements—(Continued)
(Tables in thousands, except square footage and share data)
Interest Expense
The following table represents a reconciliation from the gross interest expense to the amount on the interest expense line item in the Consolidated Statements of Operations:
Year Ended December 31, | ||||||||||||
2017 | 2016 | 2015 | ||||||||||
Gross interest expense(1) | $ | 94,660 | $ | 82,887 | $ | 52,437 | ||||||
Capitalized interest | (10,655 | ) | (11,307 | ) | (6,516 | ) | ||||||
Amortization of deferred financing costs and loan discount/premium, net | 6,032 | 4,464 | 4,746 | |||||||||
Interest expense | $ | 90,037 | $ | 76,044 | $ | 50,667 | ||||||
_________________
(1) | Includes interest on the Company’s notes payable and hedging activities and extinguishment costs related to partial paydowns in our term loans of $1.1 million during the year ended December 31, 2017. |
6. Derivatives
The Company enters into derivatives in order to hedge interest rate risk. As of December 31, 2017 and 2016, the Company had six interest rate swaps with aggregate notional amounts of $839.5 million. These derivatives were designated as effective cash flow hedges for accounting purposes.
The Company’s derivatives are classified as Level 2 and their fair values are derived from estimated values obtained from observable market data for similar instruments.
5-Year Term Loan due April 2020 and 7-Year Term Loan due April 2022
On April 1, 2015, the Company effectively hedged $300.0 million of the 5-Year Term Loan due April 2020 through two interest rate swaps, each with a notional amount of $150.0 million, which, effective as of May 1, 2015, swapped one-month LIBOR to a fixed rate of 1.36% through the loan’s maturity. Therefore, the interest rate is effectively fixed at 2.66% to 3.56%, depending on the operating partnership’s leverage ratio. The unhedged portion bears interest at a rate equal to one-month LIBOR plus 1.30% to 2.20%, depending on the operating partnership’s leverage ratio.
The Company also effectively hedged its $350.0 million 7-Year Term Loan due April 2022 through two interest rate swaps, which, effective as of May 1, 2015, swapped one-month LIBOR to a fixed rate of 1.61% through the loan’s maturity. Therefore, the interest rate is effectively fixed at 3.21% to 4.16%, depending on the operating partnership’s leverage ratio.
In July 2016, the derivatives described above were amended to include a 0.00% floor to one-month LIBOR and then de-designated the original swap and designated the amended swap as a hedge in order to minimize the ineffective portion of the original derivatives. Therefore, the effective interest rate increased to a range of 2.75% to 3.65% with respect to $300.0 million of the 5-Year Term Loan due April 2020 and 3.36% to 4.31% with respect to the 7-Year Term Loan due April 2022, in each case per annum. The interest rate within the range is based on the operating partnership’s leverage ratio. The amount included in accumulated other comprehensive income (loss) prior to the de-designation is amortized into interest expense over the remaining original terms of the derivatives.
The Company recognized an unrealized loss of $70 thousand and $1.4 million during the years ended December 31, 2017 and 2016, respectively, reflected on the unrealized loss on ineffective portion of derivatives line item on the Consolidated Statement of Operations. There was no recognized unrealized loss or gain during the year ended December 31, 2015.
7-Year Term Loan due November 2022
On May 3, 2016, the Company entered into a derivative with respect to $125.0 million of the 7-Year Term Loan due November 2022. This derivative became effective on June 1, 2016 and swapped one-month LIBOR, which includes a 0.00% floor, to a fixed rate of 1.43% through the loan’s maturity.
F- 40
Hudson Pacific Properties, Inc. and Hudson Pacific Properties, L.P.
Notes to Consolidated Financial Statements—(Continued)
(Tables in thousands, except square footage and share data)
Met Park North
On July 31, 2013, the Company closed a seven-year loan totaling $64.5 million with Union Bank, N.A., secured by the Met Park North property. The loan bears interest at a rate equal to one-month LIBOR plus 1.55%. The full loan is subject to an interest rate contract that swaps one-month LIBOR to a fixed rate of 2.16% through the loan’s maturity on August 1, 2020.
Overall
The fair market value of derivatives is presented on a gross basis in prepaid and other expenses, net and derivative liabilities line items on the Consolidated Balance Sheets. The derivative assets as of December 31, 2017 and 2016 were $12.6 million and $5.9 million, respectively. The derivative liabilities as of December 31, 2017 and 2016 were $0.3 million and $1.3 million, respectively.
The Company reclassifies into earnings in the same period during which the hedged forecasted transaction affects earnings. As of December 31, 2017, the Company expects $1.5 million of unrealized gain included in accumulated other comprehensive loss will be reclassified to interest expense in the next 12 months.
7. Future Minimum Base Rents and Lease Payments Future Minimum Rents
The Company’s properties are leased to tenants under operating leases with initial term expiration dates ranging from 2018 to 2033.
The following table summarizes the future minimum base rents (excluding tenant reimbursements for operating expenses and termination fees related to tenants exercising early termination options) for properties as of December 31, 2017:
Year ended | Non-cancellable | Subject to early termination options | Total(1)(2) | |||||||||
2018 | $ | 476,777 | $ | 4,002 | $ | 480,779 | ||||||
2019 | 445,032 | 11,775 | 456,807 | |||||||||
2020 | 376,361 | 20,232 | 396,593 | |||||||||
2021 | 315,588 | 32,772 | 348,360 | |||||||||
2022 | 246,997 | 45,437 | 292,434 | |||||||||
Thereafter | 805,449 | 124,383 | 929,832 | |||||||||
Total | $ | 2,666,204 | $ | 238,601 | $ | 2,904,805 | ||||||
_____________
(1) | Excludes rents under leases at the Company’s media and entertainment properties with terms of one year or less. |
(2) | Includes properties classified as held for sale as of December 31, 2017. |
F- 41
Hudson Pacific Properties, Inc. and Hudson Pacific Properties, L.P.
Notes to Consolidated Financial Statements—(Continued)
(Tables in thousands, except square footage and share data)
Future Minimum Lease Payments
The following table summarizes the Company’s ground lease terms related to properties that are held subject to long-term non-cancellable ground lease obligations as of December 31, 2017:
Property | Expiration Date | Notes | ||
3400 Hillview | 10/31/2040 | The ground rent is the greater of the minimum annual rent or percentage annual rent. The minimum annual rent until October 31, 2017 is the lesser of 10% of Fair Market Value (“FMV”) of the land or $1.0 million grown at 75% of the cumulative increases in consumer price index (“CPI”) from October 1989. Thereafter, minimum annual rent is the lesser of 10% of FMV of the land or the minimum annual rent as calculated as of November 1, 2017 plus 75% of subsequent cumulative CPI changes. Percentage annual rent is gross income multiplied by 24.125%. This lease was prepaid through October 31, 2017. | ||
9300 Wilshire | 8/14/2032 | The ground rent is the greater of minimum annual rent or percentage annual rent. Percentage annual rent is gross income multiplied by 6%. The property related to this ground lease is expected to be sold in the first quarter of 2018. | ||
Clocktower Square | 9/26/2056 | The ground rent is minimum annual rent (adjusted every 10 years) plus 25% of adjusted gross income (“AGI”) less minimum annual rent. | ||
Del Amo | 6/30/2049 | Rent under the ground sublease is $1.00 per year, with the sublessee being responsible for all impositions, insurance premiums, operating charges, maintenance charges, construction costs and other charges, costs and expenses that arise or may be contemplated under any provisions of the ground sublease. | ||
Foothill Research Center | 6/30/2039 | The ground rent is the greater of the minimum annual rent or percentage annual rent. The minimum annual rent is the lesser of 10% of FMV of the land or the previous year’s minimum annual rent plus 75% of CPI increase. Percentage annual rent is gross income multiplied by 24.125%. | ||
3176 Porter (formerly Lockheed) | 7/31/2040 | The ground rent is the greater of the minimum annual rent or percentage annual rent. The minimum annual rent is the lesser of 10% of FMV of the land or the previous year’s minimum annual rent plus 75% of CPI increase. Percentage annual rent is Lockheed’s base rent multiplied by 24.125%. | ||
Metro Center | 4/29/2054 | Every 10 years rent adjusts to 7.233% of FMV of the land (since 2008) and adjusts to reflect the change in CPI from the preceding FMV adjustment date (since 2013). | ||
Page Mill Center | 11/30/2041 | The ground rent is minimum annual rent (adjusted on 1/1/2019 and 1/1/2029) plus 25% of AGI, less minimum annual rent. | ||
Page Mill Hill | 11/17/2049 | The ground rent is minimum annual rent (adjusted every 10 years) plus 60% of the average of the percentage annual rent for the previous 7 lease years. | ||
Palo Alto Square | 11/30/2045 | The ground rent is minimum annual rent (adjusted every 10 years starting 1/1/2022) plus 25% of AGI less minimum annual rent. | ||
Sunset Gower Studios | 3/31/2060 | Every 7 years rent adjusts to 7.5% of FMV of the land. | ||
Techmart | 5/31/2053 | Rent subject to a 10% increase every 5 years. | ||
Contingent rental expense is recorded in the period in which the contingent event becomes probable. The following table summarizes rental expense for ground leases and a corporate office lease:
For the Year Ended December 31, | |||||||||||
2017 | 2016 | 2015 | |||||||||
Contingent rental expense | $ | 8,775 | $ | 8,651 | $ | 3,843 | |||||
Minimum rental expense | 12,412 | 12,085 | 9,196 | ||||||||
F- 42
Hudson Pacific Properties, Inc. and Hudson Pacific Properties, L.P.
Notes to Consolidated Financial Statements—(Continued)
(Tables in thousands, except square footage and share data)
The following table provides information regarding the Company’s future minimum lease payments for its ground leases (before the impact of extension options, if applicable) as of December 31, 2017:
For the Year Ended December 31, | Ground Leases(1)(2) | |||
2018 | $ | 14,111 | ||
2019 | 14,161 | |||
2020 | 14,161 | |||
2021 | 14,161 | |||
2022 | 14,161 | |||
Thereafter | 382,070 | |||
Total | $ | 452,825 | ||
_____________
(1) | In situations where ground lease obligation adjustments are based on third-party appraisals of fair market land value, CPI adjustments and/or percentage of gross income that exceeds the minimum annual rent, the future minimum lease amounts above include the lease rental obligations in effect as of December 31, 2017. |
(2) | Balance includes future minimum ground lease obligation for 9300 Wilshire which is expected to be sold in the first quarter of 2018. |
8. Fair Value of Financial Instruments
The Company’s financial assets and liabilities measured and reported at fair value on a recurring basis include the following as of:
December 31, 2017 | December 31, 2016 | ||||||||||||||||||||||||||||||
Level 1 | Level 2 | Level 3 | Total | Level 1 | Level 2 | Level 3 | Total | ||||||||||||||||||||||||
Derivative assets(1) | $ | — | $ | 12,586 | $ | — | $ | 12,586 | $ | — | $ | 5,935 | $ | — | $ | 5,935 | |||||||||||||||
Derivative liabilities | — | 265 | — | 265 | — | 1,303 | — | 1,303 | |||||||||||||||||||||||
_____________
(1) | Included in the prepaid expenses and other assets, net line item in the Consolidated Balance Sheets. |
Other Financial Instruments
The carrying values of cash and cash equivalents, restricted cash, accounts receivable, accounts payable and accrued liabilities are reasonable estimates of fair value, using Level 1 inputs, because of the short-term nature of these instruments. Fair values for notes payable are estimates based on rates currently prevailing for similar instruments of similar maturities using Level 2 inputs.
The table below represents the carrying value and fair value of the Company’s notes payable as of:
December 31, 2017 | December 31, 2016 | ||||||||||||||
Carrying Value | Fair Value | Carrying Value | Fair Value | ||||||||||||
Unsecured notes payable(1)(2) | $ | 1,974,278 | $ | 1,960,560 | $ | 2,025,000 | $ | 2,011,210 | |||||||
Secured notes payable(3) | 464,311 | 458,441 | 682,839 | 669,924 | |||||||||||
_____________
(1) | Amounts represent notes payable excluding unamortized deferred financing costs. |
(2) | The $400.0 million senior registered notes were issued at a discount. The discount, net of amortization was $722 thousand at December 31, 2017 and is included within unsecured notes payable. |
(3) | Includes balances related to properties that have been classified as held for sale. |
9. Stock-Based Compensation
The Company’s 2010 Incentive Plan permits the Company’s board of directors (“the Board”) to grant, among other things, restricted stock, restricted stock units and performance-based awards. At our annual meeting of stockholders on May 24, 2017, stockholders approved an amended and restatement of the 2010 Incentive Plan (the “2010 Plan”), which included an increase in the maximum number of shares that may be issued or awarded. Each restricted share, restricted stock unit and common share issued reduces the share reserve by 5.14 shares. As of December 31, 2017, 3,961,867 common shares were available for grant under the 2010 Plan. The calculation of shares available for grant is determined after taking into account
F- 43
Hudson Pacific Properties, Inc. and Hudson Pacific Properties, L.P.
Notes to Consolidated Financial Statements—(Continued)
(Tables in thousands, except square footage and share data)
unvested restricted stock, unvested RSUs, awards under our one-time retention performance-based awards, and awards under our outstanding outperformance programs, assuming the maximum bonus pool eligible ultimately is earned and based on a stock price of $34.25.
The Board awards restricted shares to non-employee Board members on an annual basis as part of such Board members’ annual compensation and to newly elected non-employee board members in accordance with the Non-Employee Director Compensation Program. The time-based awards are generally issued in the second quarter, in conjunction with the director’s election to the Board and the individual share awards vest in equal annual installments over the applicable service vesting period, which is three years.
The Board awards time-based restricted shares to employees on an annual basis as part of the employees’ annual compensation. The time-based awards are generally issued in the fourth quarter, and the individual share awards vest in equal annual installments over the applicable service vesting period, which is generally three years. Additionally, certain restricted share awards are subject to a mandatory holding period upon vesting if the grantee is a named executive officer.
The compensation committee of our Board (“Compensation Committee”) annually adopts a Hudson Pacific Properties, Inc. Outperformance Program (“OPP Plan”) under our 2010 Plan. With respect to OPP Plan awards granted through 2017, to the extent an award is earned following the completion of a three-year performance period, 50% of the earned award will vest in full at the end of the three-year performance period and 25% of the earned award will vest in equal annual installments over the two years thereafter, subject to the participant’s continued employment. OPP Plan awards are settled in common stock and in the case of certain executives, awards are settled in performance units in our operating partnership. In February 2017, the Compensation Committee adopted the 2017 OPP Plan. The 2017 OPP Plan is substantially similar to the previous OPP Plans except for (i) the performance period is January 1, 2017 to December 31, 2019 (ii) the maximum bonus pool is $20.0 million and (iii) the two-year post-performance vesting period was replaced with a two-year mandatory holding period upon vesting.
In December 2015, the Compensation Committee of the Board awarded a one-time special retention award to certain executives. The grants consist of time-based awards and performance-based awards. The time-based awards vest in equal 25% installments over a four-year period, subject to the participant’s continued employment. The performance-based awards vest over a four-year period, subject to the achievement of applicable performance goals and the participant’s continued employment.
Time-Based Awards
The stock-based compensation is valued based on the quoted closing price of the Company’s common stock on the applicable grant date and discounted for the hold restriction in accordance with ASC 718. The stock-based compensation is amortized through the final vesting period on a straight-line basis. Forfeitures of awards are recognized as they occur.
Performance-Based Awards
OPP Plan
An award under the OPP Plan is ultimately earned to the extent the Company outperforms a predetermined total shareholder return (“TSR”) goal and/or achieves goals with respect to the outperformance of its peers in a particular REIT index. The ultimate aggregate award cannot exceed the predetermined maximum bonus pool. The following table outlines key components of the 2017 and 2016 OPP Plans:
2017 OPP Plan | 2016 OPP Plan | ||
Maximum bonus pool, in millions | $20.0 | $17.5 | |
Performance period | 1/1/2017 to 12/31/2019 | 1/1/2016 to 12/31/2018 | |
The stock-based compensation costs of the OPP Plans were valued in accordance with ASC 718, utilizing a Monte Carlo simulation to estimate the probability of the performance vesting conditions being satisfied. The stock-based compensation is amortized through the final vesting period under a graded vesting expense recognition schedule. Forfeitures of awards are recognized as they occur.
F- 44
Hudson Pacific Properties, Inc. and Hudson Pacific Properties, L.P.
Notes to Consolidated Financial Statements—(Continued)
(Tables in thousands, except square footage and share data)
The per unit fair value of OPP award granted was estimated on the date of grant using the following assumptions in the Monte Carlo valuation:
2017 | 2016 | 2015 | |||
Expected price volatility for the Company | 24.00% | 24.00% | 22.00% | ||
Expected price volatility for the particular REIT index | 17.00% | 17.00% | 22.00% | ||
Risk-free rate | 1.47% | 1.09% | 1.13% | ||
Dividend yield | 2.30 | 2.40 | 1.50 | ||
One-Time Retention Awards
At the end of each year in the four-year performance period and over the four-year performance period, the ultimate award is earned if the Company outperforms a predetermined TSR goal and/or achieves goals with respect to its outperformance of its peers in a particular REIT index.
The stock-based compensation costs were valued in accordance with ASC 718, utilizing a Monte Carlo simulation to estimate the probability of the performance vesting conditions being satisfied. The stock-based compensation is amortized through the final vesting period under a graded vesting expense recognition schedule. Forfeitures of awards are recognized as they occur.
The per unit fair value of one-time retention award granted was estimated on the date of grant using the following assumptions in the Monte Carlo valuation:
Assumptions | |
Expected price volatility for the Company | 23.00% |
Expected price volatility for the particular REIT index | 18.00% |
Risk-free rate | 1.63% |
Dividend yield | 3.20 |
Summary of Unvested Share Activity
The following table summarizes the activity and status of all unvested awards:
2017 | 2016 | 2015 | |||||||||||||||||||
Shares | Weighted-Average Grant-Date Fair Value | Shares | Weighted-Average Grant-Date Fair Value | Shares | Weighted-Average Grant-Date Fair Value | ||||||||||||||||
Unvested at January 1 | 887,179 | $ | 31.09 | 827,950 | $ | 28.92 | 543,707 | $ | 26.43 | ||||||||||||
Granted | 918,884 | 34.37 | 489,826 | 30.95 | 629,504 | 29.01 | |||||||||||||||
Vested | (705,508 | ) | 31.42 | (430,597 | ) | 26.75 | (335,544 | ) | 24.80 | ||||||||||||
Canceled | (13,369 | ) | 32.14 | — | — | (9,717 | ) | 38.17 | |||||||||||||
Unvested at December 31 | 1,087,186 | $ | 33.64 | 887,179 | $ | 31.09 | 827,950 | $ | 28.92 | ||||||||||||
Year Ended December 31, | Non-Vested Shares Issued | Weighted Average Grant-Date Fair Value | Vested Shares | Total Vest-Date Fair Value (in thousands) | ||||||||||
2017 | 918,884 | $ | 34.37 | (705,508 | ) | $ | 24,155 | |||||||
2016 | 489,826 | 30.95 | (430,597 | ) | 14,736 | |||||||||
2015 | 629,504 | 29.01 | (335,544 | ) | 9,606 | |||||||||
F- 45
Hudson Pacific Properties, Inc. and Hudson Pacific Properties, L.P.
Notes to Consolidated Financial Statements—(Continued)
(Tables in thousands, except square footage and share data)
Share-based Compensation Recorded
The following table presents the classification and amount recognized for stock-based compensation related to the Company’s awards:
For the Year Ended December 31, | |||||||||||
2017 | 2016 | 2015 | |||||||||
Expensed stock compensation(1) | $ | 15,079 | $ | 14,144 | $ | 8,421 | |||||
Capitalized stock compensation(2) | 836 | 510 | 411 | ||||||||
Total stock compensation(3) | $ | 15,915 | $ | 14,654 | $ | 8,832 | |||||
_________________
(1) | Amounts are recorded in general and administrative expenses in the Consolidated Statements of Operations. |
(2) | Amounts are recorded in deferred leasing costs and lease intangible assets, net and investment in real estate, at cost in the Consolidated Balance Sheets. |
(3) | Amounts are recorded in additional paid-in capital and non-controlling interest—units in the operating partnership in the Consolidated Balance Sheets. |
As of December 31, 2017, total unrecognized compensation cost related to unvested share-based payments was $31.2 million, and is expected to be recognized over a weighted-average period of two years.
10. Earnings Per Share
Hudson Pacific Properties, Inc.
The Company calculates basic earnings per share by dividing the net income (loss) available to common stockholders for the period by the weighted average number of common shares outstanding during the period. Hudson Pacific Properties, Inc. calculates diluted earnings per share by dividing the diluted net income (loss) available to common stockholders for the period by the weighted average number of common shares and dilutive instruments outstanding during the period using the treasury stock method or the if-converted method, whichever is more dilutive. Unvested time-based RSUs and unvested OPP awards that contain nonforfeitable rights to dividends are participating securities and are included in the computation of earnings per share pursuant to the two-class method.
The following table reconciles the numerator and denominator in computing the Company’s basic and diluted earnings per share for net income (loss) available to common stockholders:
For the Year Ended December 31, | |||||||||||
2017 | 2016 | 2015 | |||||||||
Numerator: | |||||||||||
Basic net income (loss) available to common stockholders | $ | 67,587 | $ | 27,218 | $ | (16,397 | ) | ||||
Effect of dilutive instruments | — | 451 | — | ||||||||
Diluted net income (loss) available to common stockholders | $ | 67,587 | $ | 27,669 | $ | (16,397 | ) | ||||
Denominator: | |||||||||||
Basic weighted average common shares outstanding | 153,488,730 | 106,188,902 | 85,927,216 | ||||||||
Effect of dilutive instruments(1) | 394,084 | 4,180,153 | — | ||||||||
Diluted weighted average common shares outstanding | 153,882,814 | 110,369,055 | 85,927,216 | ||||||||
Basic earnings per common share | $ | 0.44 | $ | 0.26 | $ | (0.19 | ) | ||||
Diluted earnings per common share | $ | 0.44 | $ | 0.25 | $ | (0.19 | ) | ||||
_____________
(1) | The Company includes unvested awards and convertible common units as contingently issuable shares in the computation of diluted earnings per share once the market criteria are met, assuming that the end of the reporting period is the end of the contingency period. Any anti-dilutive securities are excluded from the diluted earnings per share calculation. |
Hudson Pacific Properties, L.P.
The operating partnership calculates basic earnings per share by dividing the net income available to common unitholders for the period by the weighted average number of common units outstanding during the period. The operating partnership calculates diluted earnings per share by dividing the diluted net income available to common unitholders for the period by the weighted average number of common units and dilutive instruments outstanding during the period using the
F- 46
Hudson Pacific Properties, Inc. and Hudson Pacific Properties, L.P.
Notes to Consolidated Financial Statements—(Continued)
(Tables in thousands, except square footage and share data)
treasury stock method or the if-converted method, whichever is more dilutive. Unvested time-based RSUs and unvested OPP awards that contain nonforfeitable rights to dividends are participating securities and are included in the computation of earnings per unit pursuant to the two-class method.
The following table reconciles the numerator and denominator in computing the operating partnership’s basic and diluted earnings per unit for net income (loss) available to common unitholders:
For the Year Ended December 31, | |||||||||||
2017 | 2016 | 2015 | |||||||||
Numerator: | |||||||||||
Basic net income (loss) available to common unitholders | $ | 67,962 | $ | 33,066 | $ | (38,366 | ) | ||||
Effective of dilutive instruments | — | 451 | — | ||||||||
Diluted net income (loss) available to common unitholders | $ | 67,962 | $ | 33,517 | $ | (38,366 | ) | ||||
Denominator: | |||||||||||
Basic weighted average common units outstanding | 154,276,773 | 145,595,246 | 128,948,077 | ||||||||
Effect of dilutive instruments(1) | 394,084 | 1,144,000 | — | ||||||||
Diluted weighted average common units outstanding | 154,670,857 | 146,739,246 | 128,948,077 | ||||||||
Basic earnings per common unit | $ | 0.44 | $ | 0.23 | $ | (0.30 | ) | ||||
Diluted earnings per common unit | $ | 0.44 | $ | 0.23 | $ | (0.30 | ) | ||||
_____________
(1) | The operating partnership includes unvested awards as contingently issuable units in the computation of diluted earnings per unit once the market criteria are met, assuming that the end of the reporting period is the end of the contingency period. Any anti-dilutive securities are excluded from the diluted earnings per unit calculation. |
11. Equity
The table below presents the effect of the Company’s derivatives on accumulated other comprehensive income (“OCI”):
Hudson Pacific Properties, Inc. Stockholder’s Equity | Non-controlling interests | Total Equity | |||||||||
Balance at January 1, 2015 | $ | (2,443 | ) | $ | (218 | ) | $ | (2,661 | ) | ||
Unrealized loss recognized in OCI due to change in fair value | (4,976 | ) | (2,687 | ) | (7,663 | ) | |||||
Loss reclassified from OCI into income (as interest expense) | 6,338 | 3,922 | 10,260 | ||||||||
Net change in OCI | 1,362 | 1,235 | 2,597 | ||||||||
Balance at December 31, 2015 | (1,081 | ) | 1,017 | (64 | ) | ||||||
Unrealized loss recognized in OCI due to change in fair value | 4,122 | (6,989 | ) | (2,867 | ) | ||||||
Loss reclassified from OCI into income (as interest expense) | 6,455 | 2,354 | 8,809 | ||||||||
Net change in OCI | 10,577 | (4,635 | ) | 5,942 | |||||||
Balance at December 31, 2016 | 9,496 | (3,618 | ) | 5,878 | |||||||
Unrealized loss recognized in OCI due to change in fair value | 3,011 | 18 | 3,029 | ||||||||
Loss reclassified from OCI into income (as interest expense) | 4,342 | 27 | 4,369 | ||||||||
Net change in OCI | 7,353 | 45 | 7,398 | ||||||||
Reclassification related to redemption of common units in the operating partnership | (3,622 | ) | 3,622 | — | |||||||
Balance at December 31, 2017 | $ | 13,227 | $ | 49 | $ | 13,276 | |||||
F- 47
Hudson Pacific Properties, Inc. and Hudson Pacific Properties, L.P.
Notes to Consolidated Financial Statements—(Continued)
(Tables in thousands, except square footage and share data)
Non-controlling Interests
Common units in the operating partnership
Common units of the operating partnership and shares of common stock of the Company have essentially the same economic characteristics, as they share equally in the total net income or loss distributions of the operating partnership. Investors who own common units have the right to cause the operating partnership to repurchase any or all of their common units for cash equal to the then-current market value of one share of common stock or, at the Company’s election, issue shares of the Company’s common stock in exchange for common units on a one-for-one basis.
The following table summarizes the ownership of common units, excluding unvested restricted units as of:
December 31, 2017 | December 31, 2016 | December 31, 2015 | |||||||
Company-owned common units in the operating partnership | 155,602,508 | 136,492,235 | 89,153,780 | ||||||
Company’s ownership interest percentage | 99.6 | % | 93.5 | % | 61.3 | % | |||
Non-controlling common units in the operating partnership(1) | 569,045 | 9,450,620 | 56,296,315 | ||||||
Non-controlling ownership interest percentage(1) | 0.4 | % | 6.5 | % | 38.7 | % | |||
_____________
(1) | Represents common units held by certain of the Company’s executive officers and directors, certain of their affiliates and other outside investors. |
The following table summarizes the activity related to common units from January 1, 2016 to December 31, 2017:
Non-controlling interest in common units | |||
Balance at January 1, 2016 | 56,296,315 | ||
May redemption (1) | (10,117,223 | ) | |
July redemption (1) | (19,195,373 | ) | |
November redemption (1) | (17,533,099 | ) | |
Balance at December 31, 2016 | 9,450,620 | ||
January redemption (1) | (8,881,575 | ) | |
Balance at December 31, 2017 | 569,045 | ||
_____________
(1) | The common unitholders requested the operating partnership repurchase common units and the Company elected, in accordance with the limited partnership agreement of the operating partnership, to settle in cash to satisfy the redemption. The Company funded the redemptions using the proceeds from registered underwritten public offering of common stock. |
Performance units are partnership interests in the operating partnership. Each performance unit awarded will be deemed equivalent to an award of one share of common stock under the 2010 Plan, reducing the availability for other equity awards on a one-for-one basis. Under the terms of the performance units, the operating partnership will revalue its assets for tax purposes upon the occurrence of certain specified events, and any increase in valuation from the time of grant until such event will be allocated first to the holders of performance units to equalize the capital accounts of such holders with the capital accounts of common unitholders. Subject to any agreed upon exceptions, once vested and having achieved parity with common unitholders, performance units are convertible into common units in the operating partnership on a one-for-one basis.
6.25% Series A cumulative redeemable preferred units of the operating partnership
There are 407,066 Series A preferred units of partnership interest in the operating partnership, or Series A preferred units, which are not owned by the Company. These Series A preferred units are entitled to preferential distributions at a rate of 6.25% per annum on the liquidation preference of $25.00 per unit and became convertible at the option of the holder into common units or redeemable into cash or, at the Company’s election, exchangeable for registered shares of common stock, after June 29, 2013. For a description of the conversion and redemption rights of the Series A preferred units, please see “Description of the Partnership Agreement of Hudson Pacific Properties, L.P.—Material Terms of Our Series A Preferred Units” in the Company’s June 23, 2010 Prospectus.
F- 48
Hudson Pacific Properties, Inc. and Hudson Pacific Properties, L.P.
Notes to Consolidated Financial Statements—(Continued)
(Tables in thousands, except square footage and share data)
8.375% Series B cumulative redeemable preferred stock
5,800,000 shares of 8.375% Series B cumulative redeemable preferred stock of Hudson Pacific Properties, Inc., with a liquidation preference of $25.00 per share, $0.01 par value per share, were outstanding in 2014 and until they were redeemed in 2015. Dividends on the Series B preferred stock were cumulative from the date of original issue and payable quarterly on or about the last calendar day of each March, June, September and December at the rate of 8.375% per annum of its $25.00 per share liquidation preference.
On December 10, 2015, the Company redeemed its Series B preferred stock in whole for cash at a redemption price of $25.00 per share, plus accrued and unpaid dividends to, but not including, the date of redemption. During the year ended December 31, 2015, the Company recognized a non-recurring non-cash allocation of additional loss for purposes of computing earnings per share of $6.0 million as a reduction to net income available to common stockholders for the Company and common unitholder for the operating partnership for the original issuance costs related to the Series B preferred stock.
The following table reconciles the net income (loss) allocated to common stock and operating partnership units on the Consolidated Statements of Equity to the common stock and the common unit net income (loss) allocation on the Consolidated Statements of Operations for the years ended:
Hudson Pacific Properties, Inc. | Hudson Pacific Properties, L.P. | |||||||||||||||||||||||
2017 | 2016 | 2015 | 2017 | 2016 | 2015 | |||||||||||||||||||
Net income (loss) allocation for common stock/units on the Consolidated Statements of Equity/Capital | $ | 68,590 | $ | 27,984 | $ | (10,071 | ) | $ | 68,965 | $ | 33,832 | $ | (32,040 | ) | ||||||||||
Net income attributable to participating securities | (1,003 | ) | (766 | ) | (356 | ) | (1,003 | ) | (766 | ) | (356 | ) | ||||||||||||
Series B transaction costs allocation | — | — | (5,970 | ) | — | — | (5,970 | ) | ||||||||||||||||
Net income (loss) allocation for common stock/units on the Consolidated Statements of Operations | $ | 67,587 | $ | 27,218 | $ | (16,397 | ) | $ | 67,962 | $ | 33,066 | $ | (38,366 | ) | ||||||||||
Common Stock Activity
The Company has remained capitalized since the initial public offerings through public offerings, its note purchase agreement and continuous offerings under our at-the-market, or ATM, program.
The following table summarizes the common stock offering in 2015, 2016 and 2017:
Number of Common Shares | ||
January 20, 2015 (1) | 12,650,000 | |
April 1, 2015 (2) | 8,626,311 | |
May 16, 2016 (3) | 10,117,223 | |
July 21, 2016 (3) | 19,195,373 | |
November 28, 2016 (3) | 17,533,099 | |
January 10, 2017 (3) | 8,881,575 | |
March 3, 2017 (4) | 9,775,000 | |
_____________
(1) | Represents a common stock offering of 11,000,000 shares of common stock and the exercise of the underwriters’ option to purchase an additional 1,650,000 shares of our common stock at the public offering price of $31.75 per share. Total proceeds from the public offering, after underwriters’ discount, were approximately $385.6 million (before transaction costs). |
(2) | Represents a common stock issuance in connection with the EOP Acquisition. The issuance of common stock is part of the consideration paid. |
(3) | Proceeds from the offering were used to repurchase common units in the operating partnership. |
(4) | Represents a common stock offering of 9,775,000 shares of common stock. Proceeds from the offering were used to fully repay a $255.0 million balance outstanding under its unsecured revolving credit facility. |
The Company’s ATM program permits sales of up to $125.0 million of common stock. The Company did not utilize the ATM program during 2017. A cumulative total of $20.1 million has been sold as of December 31, 2017.
F- 49
Hudson Pacific Properties, Inc. and Hudson Pacific Properties, L.P.
Notes to Consolidated Financial Statements—(Continued)
(Tables in thousands, except square footage and share data)
The following table summarizes the ATM activity:
2017 | 2016 | 2015 | ||||
Shares of common stock sold during the period | — | 165,000 | — | |||
Common stock price ranges | N/A | $33.54 to $33.95 | N/A | |||
Share repurchase program
On January 20, 2016, the Board authorized a share repurchase program to buy up to $100.0 million of the outstanding common stock of Hudson Pacific Properties, Inc. No share repurchases have been made through December 31, 2017.
Dividends
During the year ended December 31, 2017, the Company declared dividends on its common stock and non-controlling interest in common units in the operating partnership of $1.000 per share and unit. The Company also declared dividends on its Series A preferred partnership interests of $1.5625 per unit. The fourth quarter 2017 dividends were paid on December 28, 2017 to stockholders and unitholders of record on December 18, 2017.
Taxability of Dividends
Earnings and profits, which determine the taxability of distributions to stockholders, may differ from income reported for financial reporting purposes due to the differences for federal income tax purposes in the treatment of loss on extinguishment of debt, revenue recognition, compensation expense and the basis of depreciable assets and estimated useful lives used to compute depreciation.
The Company’s dividends related to its common stock will be classified for U.S. federal income tax purposes as follows (unaudited):
Ordinary Dividends | ||||||||||||||||||||||||||
Record Date | Payment Date | Distributions Per Share | Total | Non-qualified | Qualified | Capital Gain Distributions(1) | Return of Capital | |||||||||||||||||||
3/20/2017 | 3/30/2017 | $ | 0.25000 | $ | 0.14633 | $ | 0.14633 | $ | — | $ | 0.04023 | $ | 0.06345 | |||||||||||||
6/20/2017 | 6/30/2017 | 0.25000 | 0.14633 | 0.14633 | — | 0.04023 | 0.06345 | |||||||||||||||||||
9/19/2017 | 9/29/2017 | 0.25000 | 0.14633 | 0.14633 | — | 0.04023 | 0.06345 | |||||||||||||||||||
12/18/2017 | 12/28/2017 | 0.25000 | 0.14633 | 0.14633 | — | 0.04023 | 0.06345 | |||||||||||||||||||
Totals | $ | 1.00000 | $ | 0.58532 | $ | 0.58532 | $ | — | $ | 0.16092 | $ | 0.25380 | ||||||||||||||
100 | % | 58.532 | % | 16.09 | % | 25.38 | % | |||||||||||||||||||
_____________
(1) | $0.03000 of the $0.04023 capital gain distributions should be characterized as unrecaptured Section 1250 gain. |
12. Related Party Transactions
Employment Agreements
The Company has entered into employment agreements with certain executive officers, effective January 1, 2016, that provide for various severance and change in control benefits and other terms and conditions of employment.
Lease and Subsequent Purchase of Corporate Headquarters from Blackstone
On July 26, 2006, the Company’s predecessor, Hudson Capital, LLC, entered into a lease agreement and subsequent amendments with landlord Trizec Holdings Cal, LLC (an affiliate of Blackstone) for the Company’s corporate headquarters at 11601 Wilshire. The Company amended the lease to increase its occupancy to 40,120 square feet commencing on September 1, 2015. On December 16, 2015, the Company entered into an amendment of that lease to expand the space to approximately 42,371 square feet and to extend the term by an additional three years, to a total of ten years, through August 31, 2025. On July 1, 2016, the Company purchased the 11601 Wilshire property from affiliates of Blackstone for $311.0 million (before credits, prorations and closing costs). Michael Nash, a director on the Board, is a senior managing director of an affiliate of Blackstone.
F- 50
Hudson Pacific Properties, Inc. and Hudson Pacific Properties, L.P.
Notes to Consolidated Financial Statements—(Continued)
(Tables in thousands, except square footage and share data)
Disposal of Pinnacle I and Pinnacle II to certain affiliates of Blackstone
On November 16, 2017, the consolidated joint venture that owned Pinnacle I and Pinnacle II sold the properties to certain affiliates of Blackstone for $350.0 million, before credits, prorations and closing costs, including the assumption of $216.0 million of secured notes payable. Michael Nash, a director on the Board, is a senior managing director of an affiliate of Blackstone.
Disposal of 222 Kearny to certain affiliates of Farallon Funds
On February 14, 2017, the Company sold its 222 Kearny property to a joint venture, a partner of which is an affiliate of the Farallon Funds. Richard B. Fried, a director on the Board, is a managing member of the Farallon Funds.
JMG Capital Lease at 11601 Wilshire
JMG Capital Management LLC leases approximately 6,638 square feet at the Company’s 11601 Wilshire property pursuant to an eight-year lease at an aggregate rate of approximately $279 thousand annualized rent per year. Jonathan M. Glaser, a director on the Board, is the founder and managing member of JMG Capital Management LLC. JMG Capital Management LLC was a tenant of the property at the time it was purchased by the Company in 2016.
During 2017, JMG Capital Management LLC assigned the lease to a third party and as a result is no longer a lessee at our 11601 Wilshire property as of December 31, 2017.
Agreement Related to EOP Acquisition
On April 1, 2015, the Company completed the EOP Acquisition from certain affiliates of Blackstone, which consisted of 26 high-quality office assets totaling approximately 8.2 million square feet and two development parcels located throughout the Northern California region. The total consideration paid for the EOP Acquisition before certain credits, prorations and closing costs included a cash payment of $1.75 billion and an aggregate of 63,474,791 shares of common stock of Hudson Pacific Properties, Inc. and common units in the operating partnership. In connection with the EOP Acquisition, the Company, the operating partnership and Blackstone entered into a stockholders agreement, which conferred Blackstone certain rights, including the right to nominate up to three of the Company’s directors. Additionally, the Company entered into a registration rights agreement with Blackstone providing for customary registration rights with respect to the equity consideration paid in the EOP Acquisition. Following a common stock offering and common unit repurchase on January 10, 2017, the stockholders agreement and the registration rights agreement automatically terminated on that date.
Common Stock Offerings and Common Unit Redemptions
On January 10, 2017, the Company, Blackstone and the Farallon Funds completed a public offering of 18,673,808 shares of common stock, consisting of 8,881,575 shares offered by the Company and 9,792,233 shares offered by the selling stockholders. The offering generated net proceeds for the Company and the selling stockholders of approximately $310.9 million and $342.7 million, respectively, before expenses. The Company used the net proceeds that it received from the offering to redeem 8,881,575 common units held by Blackstone and the Farallon Funds.
The Company did not receive any proceeds from the sale of the common stock by the selling stockholders in the offerings described above but it paid approximately half of the expenses of the offerings with respect to the shares of common stock sold by the Farallon Funds and all of the expenses with respect to the shares of common stock sold by Blackstone, in each case, other than underwriting discounts, which were borne by the selling stockholders.
13. Commitments and Contingencies
Legal
From time to time, the Company is party to various lawsuits, claims and other legal proceedings arising out of, or incident to, the ordinary course of business. Management believes, based in part upon consultation with legal counsel, that the ultimate resolution of all such claims will not have a material adverse effect on the Company’s results of operations, financial position or cash flows. As of December 31, 2017, the risk of material loss from such legal actions impacting the Company’s financial condition or results from operations has been assessed as remote.
F- 51
Hudson Pacific Properties, Inc. and Hudson Pacific Properties, L.P.
Notes to Consolidated Financial Statements—(Continued)
(Tables in thousands, except square footage and share data)
Concentrations
As of December 31, 2017, 90% of the Company’s properties were located in California, which exposes the Company to greater economic risks than if it owned a more geographically dispersed portfolio.
A significant portion of the Company’s rental revenue is derived from tenants in the media and entertainment and technology industries. As of December 31, 2017, approximately 16% and 34% of rentable square feet were related to the tenants in the media and entertainment and technology industries, respectively.
As of December 31, 2017, the Company’s 15 largest tenants represented approximately 29% of its rentable square feet and no single tenant accounted for more than 10%.
Letters of Credit
As of December 31, 2017, the Company has outstanding letters of credit totaling approximately $2.5 million under the unsecured revolving credit facility. The letters of credit are primarily related to utility company security deposit requirements.
14. Quarterly Financial Information (unaudited)
The tables below present selected quarterly information for 2017 and 2016 for the Company:
For the Three Months Ended(1) | |||||||||||||||
December 31, 2017 | September 30, 2017 | June 30, 2017 | March 31, 2017 | ||||||||||||
Total revenues | $ | 189,333 | $ | 190,021 | $ | 180,500 | $ | 168,285 | |||||||
Income from operations | 43,832 | 36,160 | 28,108 | 28,503 | |||||||||||
Net income | 48,944 | 14,510 | 6,954 | 24,153 | |||||||||||
Net income attributable to the Company’s stockholders | 32,455 | 11,064 | 3,553 | 20,515 | |||||||||||
Net income attributable to common stockholders’ per share—basic | 0.21 | 0.07 | 0.02 | 0.14 | |||||||||||
Net income attributable to common stockholders’ per share—diluted | 0.21 | 0.07 | 0.02 | 0.14 | |||||||||||
For the Three Months Ended(1) | |||||||||||||||
December 31, 2016 | September 30, 2016 | June 30, 2016 | March 31, 2016 | ||||||||||||
Total revenues | $ | 167,198 | $ | 164,583 | $ | 154,321 | $ | 153,537 | |||||||
Income from operations | 26,845 | 23,740 | 19,811 | 19,011 | |||||||||||
Net income | 28,530 | 5,217 | 4,035 | 5,976 | |||||||||||
Net income attributable to the Company’s stockholders | 22,279 | 1,847 | 839 | 2,253 | |||||||||||
Net income attributable to common stockholders’ per share—basic | 0.18 | 0.02 | 0.01 | 0.03 | |||||||||||
Net income attributable to common stockholders’ per share— diluted | 0.18 | 0.02 | 0.01 | 0.03 | |||||||||||
_____________
(1) | The summation of the quarterly financial data may not equal the annual number reported on the consolidated statements of operations due to rounding. |
15. Subsequent Events
Financing
On January 23, 2018, the Company borrowed an additional $100.0 million under its unsecured revolving credit facility. On February 1, 2018, the Company used proceeds from the draw to pay in full the debt secured by our Rincon Center property; this loan was expected to mature in May 2018.
F- 52
Hudson Pacific Properties, Inc. and Hudson Pacific Properties, L.P.
Notes to Consolidated Financial Statements—(Continued)
(Tables in thousands, except square footage and share data)
Dispositions
On January 25, 2018, the Company sold its Embarcadero Place property for $136.0 million (before credits, prorations and closing costs).
On January 31, 2018, the Company sold its 2600 Campus Drive (building 6 of Peninsula Office Park) property for $22.5 million (before credits, prorations and closing costs).
Hudson Pacific Properties, Inc. 2018 Outperformance Program
On February 14, 2018, the Compensation Committee adopted the 2018 Outperformance Program (“2018 OPP”) under our 2010 Plan. The 2018 OPP authorizes grants of incentive awards linked to our absolute and relative TSR over the performance period beginning on January 1, 2018 and ending on the earlier to occur of December 31, 2020 or the date on which we experience a change in control. Each 2018 OPP award confers a percentage participation right in a dollar-denominated bonus pool that is settled in either Company common stock or performance units of the operating partnership, as well as certain dividend equivalent or distribution rights.
Upon adoption of the 2018 OPP, the Compensation Committee granted Victor J. Coleman, Mark T. Lammas, Christopher Barton, Alex Vouvalides and Josh Hatfield, each of whom is a named executive officer, OPP awards of 24%, 13.75%, 6.4%, 9.15% and 6.4% respectively. The awards for each were granted in the form of performance units.
Under the 2018 OPP, a bonus pool of up to (but not exceeding) $25 million will be determined at the end of the performance period as the sum of: (i) 3% of the amount by which our TSR during the performance period exceeds 7% simple annual TSR (the absolute TSR component), plus (ii) 3% of the amount by which our TSR performance exceeds that of the SNL US Office REIT Index (on a percentage basis) over the performance period (the relative TSR component), except that the relative TSR component will be reduced on a linear basis from 100% to 25% for absolute TSR performance ranging from 7% to 0% simple annual TSR over the performance period. In addition, the relative TSR component may be a negative value equal to 3% of the amount by which we underperform the SNL US Office REIT Index by more than 3% per year during the performance period (if any). The target bonus pool is equal to $4.8 million, which would be attained if the Company achieves during the performance period (i) a TSR is equal to that of the SNL US Office REIT Index and (ii) a 8% simple annual TSR.
At the end of the three-year performance period, named executive officers who remain employed with us will vest in a number of performance units based on their percentage interest in the bonus pool (and determined based on the value of the common stock at the end of the performance period), and such vested performance units and will continue to be subject to an additional two-year holding (i.e., no-sell) period. However, if the performance period is terminated prior to December 31, 2020 in connection with a change in control, 2018 OPP awards will be paid entirely in fully vested performance units immediately prior to the change in control.
In addition to these performance units, each 2018 OPP award entitles its holder to a cash payment equal to the aggregate distributions or dividends that would have been paid during the performance period on the total number of performance units that performance-vest had such performance units been outstanding throughout the performance period. The cash payment will be reduced by the aggregate amount of the distributions received during the performance period on the total number of performance units granted.
If a participant’s employment is terminated without “cause,” for “good reason” or due to the participant’s death or disability during the performance period (referred to as qualifying terminations), the participant will be paid his or her 2018 OPP award at the end of the performance period entirely in fully vested performance units (except for the performance period distribution/dividend equivalent, which will be paid in cash at the end of the performance period). Any such payment will be pro-rated in the case of a termination without “cause” or for “good reason” by reference to the participant’s period of employment during the performance period.
The foregoing description of terms of the 2018 OPP is qualified in its entirety by reference to the text of the 2018 Outperformance Award Agreements, which are attached hereto as Exhibits 10.72 and 10.73 and are incorporated herein by reference.
F- 53
Hudson Pacific Properties, Inc. And Hudson Pacific Properties, L.P.
Schedule III—Real Estate and Accumulated Depreciation
December 31, 2017
(In thousands)
Initial Costs | Cost Capitalized Subsequent to Acquisition | Gross Carrying Amount | ||||||||||||||||||||||||||||||||||||||
Property name | Encumbrances | Land | Building & Improvements | Improvements | Carrying Costs | Land | Building & Improvements | Total | Accumulated Depreciation(4) | Year Built / Renovated | Year Acquired | |||||||||||||||||||||||||||||
Office | ||||||||||||||||||||||||||||||||||||||||
875 Howard, San Francisco Bay Area, CA | $ | — | $ | 18,058 | $ | 41,046 | $ | 17,544 | $ | 1,936 | $ | 18,058 | $ | 60,526 | 78,584 | $ | (13,944 | ) | Various | 2007 | ||||||||||||||||||||
6040 Sunset (formerly Technicolor Building), Los Angeles, CA | — | 6,599 | 27,187 | 25,032 | 3,088 | 6,599 | 55,307 | 61,906 | (19,426 | ) | 2008 | 2008 | ||||||||||||||||||||||||||||
ICON, Los Angeles, CA | — | — | — | 146,009 | 5,497 | — | 151,506 | 151,506 | (5,494 | ) | 2017 | 2008 | ||||||||||||||||||||||||||||
CUE, Los Angeles, CA | — | — | — | 35,837 | 1,326 | — | 37,163 | 37,163 | — | Ongoing | 2008 | |||||||||||||||||||||||||||||
EPIC, Los Angeles, CA | — | — | — | 23,783 | 852 | — | 24,635 | 24,635 | — | Ongoing | 2008 | |||||||||||||||||||||||||||||
Del Amo, Los Angeles, CA | — | — | 18,000 | 2,458 | — | — | 20,458 | 20,458 | (4,767 | ) | 1986 | 2010 | ||||||||||||||||||||||||||||
1455 Market, San Francisco Bay Area, CA | — | 41,226 | 34,990 | 55,661 | — | 41,226 | 90,651 | 131,877 | (12,725 | ) | 1976 | 2010 | ||||||||||||||||||||||||||||
Rincon Center, San Francisco Bay Area, CA(1)(2) | 98,392 | 58,251 | 110,656 | 22,396 | — | 58,251 | 133,052 | 191,303 | (24,373 | ) | 1940/1989 | 2010 | ||||||||||||||||||||||||||||
10950 Washington, Los Angeles, CA(2) | 27,418 | 17,979 | 25,110 | 745 | — | 17,979 | 25,855 | 43,834 | (4,978 | ) | 1957/1974 | 2010 | ||||||||||||||||||||||||||||
604 Arizona, Los Angeles, CA | — | 5,620 | 14,745 | 1,332 | 423 | 5,620 | 16,500 | 22,120 | (2,566 | ) | 1950/2005 | 2011 | ||||||||||||||||||||||||||||
275 Brannan, San Francisco Bay Area, CA | — | 4,187 | 8,063 | 14,029 | 1,115 | 4,187 | 23,207 | 27,394 | (6,253 | ) | 1905 | 2011 | ||||||||||||||||||||||||||||
625 Second, San Francisco Bay Area, CA | — | 10,744 | 42,650 | 3,319 | — | 10,744 | 45,969 | 56,713 | (8,564 | ) | 1906/1999 | 2011 | ||||||||||||||||||||||||||||
6922 Hollywood, Los Angeles, CA | — | 16,608 | 72,392 | 8,302 | — | 16,608 | 80,694 | 97,302 | (15,166 | ) | 1967 | 2011 | ||||||||||||||||||||||||||||
10900 Washington | — | 1,400 | 1,200 | 738 | — | 1,400 | 1,938 | 3,338 | (661 | ) | 1973 | 2012 | ||||||||||||||||||||||||||||
901 Market, San Francisco Bay Area, CA | — | 17,882 | 79,305 | 13,606 | — | 17,882 | 92,911 | 110,793 | (15,115 | ) | 1912/1985 | 2012 | ||||||||||||||||||||||||||||
Element LA, Los Angeles, CA(2) | 168,000 | 79,769 | 19,755 | 85,349 | 10,391 | 79,769 | 115,495 | 195,264 | (10,203 | ) | 1949 | 2012, 2013 | ||||||||||||||||||||||||||||
3401 Exposition, Los Angeles, CA | — | 14,120 | 11,319 | 11,046 | 1,028 | 14,120 | 23,393 | 37,513 | (2,844 | ) | 1961 | 2013 | ||||||||||||||||||||||||||||
505 First, Greater Seattle, WA | — | 22,917 | 133,034 | 3,905 | 22,917 | 136,939 | 159,856 | (17,885 | ) | Various | 2013 | |||||||||||||||||||||||||||||
83 King, Greater Seattle, WA | — | 12,982 | 51,403 | 5,300 | 12,982 | 56,703 | 69,685 | (8,345 | ) | Various | 2013 | |||||||||||||||||||||||||||||
Met Park North, Greater Seattle, WA(2) | 64,500 | 28,996 | 71,768 | 608 | — | 28,996 | 72,376 | 101,372 | (10,016 | ) | 2000 | 2013 | ||||||||||||||||||||||||||||
Northview Center, Greater Seattle, WA | — | 4,803 | 41,191 | 918 | — | 4,803 | 42,109 | 46,912 | (6,020 | ) | 1991 | 2013 | ||||||||||||||||||||||||||||
Merrill Place, Greater Seattle, WA | — | 27,684 | 29,824 | 16,287 | 784 | 27,684 | 46,895 | 74,579 | (5,251 | ) | Various | 2014 | ||||||||||||||||||||||||||||
450 Alaskan, Greater Seattle, WA | — | — | — | 73,226 | 2,542 | — | 75,768 | 75,768 | (201 | ) | Ongoing | 2014 | ||||||||||||||||||||||||||||
Palo Alto Square, San Francisco Bay Area, CA | — | — | 326,033 | 17,448 | — | — | 343,481 | 343,481 | (31,719 | ) | 1971 | 2015 | ||||||||||||||||||||||||||||
3400 Hillview, San Francisco Bay Area, CA | — | — | 159,641 | 2,453 | — | — | 162,094 | 162,094 | (20,037 | ) | 1991 | 2015 | ||||||||||||||||||||||||||||
F- 54
Initial Costs | Cost Capitalized Subsequent to Acquisition | Gross Carrying Amount | ||||||||||||||||||||||||||||||||||||||
Property name | Encumbrances | Land | Building & Improvements | Improvements | Carrying Costs | Land | Building & Improvements | Total | Accumulated Depreciation(4) | Year Built / Renovated | Year Acquired | |||||||||||||||||||||||||||||
Foothill Research Center, San Francisco Bay Area, CA | — | — | 133,994 | 3,011 | — | — | 137,005 | 137,005 | (19,269 | ) | 1991 | 2015 | ||||||||||||||||||||||||||||
Page Mill Center, San Francisco Bay Area, CA | — | — | 147,625 | 6,748 | — | — | 154,373 | 154,373 | (19,348 | ) | 1970/2016 | 2015 | ||||||||||||||||||||||||||||
Clocktower Square, San Francisco Bay Area, CA | — | — | 93,949 | 539 | — | — | 94,488 | 94,488 | (7,875 | ) | 1983 | 2015 | ||||||||||||||||||||||||||||
3176 Porter (formerly Lockheed), San Francisco Bay Area, CA | — | — | 34,561 | (292 | ) | — | — | 34,269 | 34,269 | (3,732 | ) | 1991 | 2015 | |||||||||||||||||||||||||||
Towers at Shore Center, San Francisco Bay Area, CA | — | 72,673 | 144,188 | 7,924 | — | 72,673 | 152,112 | 224,785 | (13,102 | ) | 2001 | 2015 | ||||||||||||||||||||||||||||
Skyway Landing, San Francisco Bay Area, CA | — | 37,959 | 63,559 | 2,812 | — | 37,959 | 66,371 | 104,330 | (6,923 | ) | 2001 | 2015 | ||||||||||||||||||||||||||||
Shorebreeze, San Francisco Bay Area, CA | — | 69,448 | 59,806 | 7,556 | — | 69,448 | 67,362 | 136,810 | (5,805 | ) | 1985/1989 | 2015 | ||||||||||||||||||||||||||||
555 Twin Dolphin, San Francisco Bay Area, CA | — | 40,614 | 73,457 | 5,409 | — | 40,614 | 78,866 | 119,480 | (7,074 | ) | 1989 | 2015 | ||||||||||||||||||||||||||||
333 Twin Dolphin, San Francisco Bay Area, CA | — | 36,441 | 64,892 | 8,275 | — | 36,441 | 73,167 | 109,608 | (7,136 | ) | 1985 | 2015 | ||||||||||||||||||||||||||||
Peninsula Office Park, San Francisco Bay Area, CA | — | 98,206 | 93,780 | 12,094 | — | 98,206 | 105,874 | 204,080 | (12,121 | ) | Various | 2015 | ||||||||||||||||||||||||||||
Metro Center, San Francisco Bay Area, CA | — | — | 313,683 | 39,566 | — | — | 353,249 | 353,249 | (31,341 | ) | Various | 2015 | ||||||||||||||||||||||||||||
Concourse, San Francisco Bay Area, CA | — | 45,085 | 224,271 | 9,585 | — | 45,085 | 233,856 | 278,941 | (23,035 | ) | Various | 2015 | ||||||||||||||||||||||||||||
Gateway, San Francisco Bay Area, CA | — | 33,117 | 121,217 | 26,159 | — | 33,117 | 147,376 | 180,493 | (14,718 | ) | Various | 2015 | ||||||||||||||||||||||||||||
Metro Plaza, San Francisco Bay Area, CA | — | 16,038 | 106,156 | 9,929 | — | 16,038 | 116,085 | 132,123 | (10,924 | ) | 1986 | 2015 | ||||||||||||||||||||||||||||
1740 Technology, San Francisco Bay Area, CA | — | 8,052 | 49,486 | 3,555 | — | 8,052 | 53,041 | 61,093 | (7,032 | ) | 1985 | 2015 | ||||||||||||||||||||||||||||
Skyport Plaza, San Francisco Bay Area, CA | — | 29,033 | 153,844 | (6,501 | ) | — | 29,033 | 147,343 | 176,376 | (10,401 | ) | 2000/2001 | 2015 | |||||||||||||||||||||||||||
Techmart, San Francisco Bay Area, CA | — | — | 66,660 | 10,598 | — | — | 77,258 | 77,258 | (8,244 | ) | 1986 | 2015 | ||||||||||||||||||||||||||||
Campus Center, San Francisco Bay Area, CA | — | 59,460 | 79,604 | 7,834 | — | 59,460 | 87,438 | 146,898 | (15,374 | ) | N/A | 2015 | ||||||||||||||||||||||||||||
Fourth & Traction, Los Angeles, CA | — | 12,140 | 37,110 | 38,529 | 6,139 | 12,140 | 81,778 | 93,918 | — | Various | 2015 | |||||||||||||||||||||||||||||
MaxWell, Los Angeles, CA | — | 13,040 | 26,960 | 17,795 | 3,729 | 13,040 | 48,484 | 61,524 | — | Various | 2015 | |||||||||||||||||||||||||||||
11601 Wilshire, Los Angeles, CA | — | 28,978 | 321,273 | 17,641 | — | 28,978 | 338,914 | 367,892 | (15,876 | ) | 1983 | 2016, 2017 | ||||||||||||||||||||||||||||
Hill7, Greater Seattle, WA(2) | 101,000 | 36,888 | 137,079 | 13,394 | — | 36,888 | 150,473 | 187,361 | (5,466 | ) | 2015 | 2016 | ||||||||||||||||||||||||||||
Page Mill Hill, San Francisco Bay Area, CA | — | — | 131,402 | 1,958 | — | — | 133,360 | 133,360 | (5,046 | ) | 1975 | 2016 | ||||||||||||||||||||||||||||
Media & Entertainment | — | |||||||||||||||||||||||||||||||||||||||
F- 55
Initial Costs | Cost Capitalized Subsequent to Acquisition | Gross Carrying Amount | ||||||||||||||||||||||||||||||||||||||
Property name | Encumbrances | Land | Building & Improvements | Improvements | Carrying Costs | Land | Building & Improvements | Total | Accumulated Depreciation(4) | Year Built / Renovated | Year Acquired | |||||||||||||||||||||||||||||
Sunset Gower Studios, Los Angeles, CA(3) | 5,001 | 79,320 | 64,697 | 31,416 | 207 | 79,320 | 96,320 | 175,640 | (23,644 | ) | Various | 2007, 2011, 2012 | ||||||||||||||||||||||||||||
Sunset Bronson Studios, Los Angeles, CA(3) | — | 77,698 | 32,374 | 31,543 | 422 | 77,698 | 64,339 | 142,037 | (11,485 | ) | Various | 2008 | ||||||||||||||||||||||||||||
Sunset Las Palmas Studios, Los Angeles, CA | 118,892 | 86,922 | 4,773 | 13 | 118,892 | 91,708 | 210,600 | (1,974 | ) | Various | 2017 | |||||||||||||||||||||||||||||
Total before held for sale reclass | 464,311 | 1,302,907 | 4,181,861 | 899,181 | 39,492 | 1,302,907 | 5,120,534 | 6,423,441 | (533,498 | ) | ||||||||||||||||||||||||||||||
Real estate held for sale: | ||||||||||||||||||||||||||||||||||||||||
9300 Wilshire, Los Angeles, CA | — | — | 10,718 | 2,024 | — | — | 12,742 | 12,742 | (4,195 | ) | 1964/2002 | 2010 | ||||||||||||||||||||||||||||
Embarcadero Place, San Francisco Bay Area, CA | — | 41,050 | 77,006 | 3,273 | — | 41,050 | 80,279 | 121,329 | (7,155 | ) | 1984 | 2015 | ||||||||||||||||||||||||||||
2180 Sand Hill, San Francisco Bay Area, CA | — | 13,663 | 50,559 | 385 | — | 13,663 | 50,944 | 64,607 | (3,749 | ) | 1973 | 2015 | ||||||||||||||||||||||||||||
2600 Campus Drive (building 6 of Peninsula Office Park), San Francisco Bay Area, CA | — | 11,700 | 10,400 | 30 | — | 11,700 | 10,430 | 22,130 | (814 | ) | Various | 2015 | ||||||||||||||||||||||||||||
Total | $ | 464,311 | $ | 1,369,320 | $ | 4,330,544 | $ | 904,893 | $ | 39,492 | $ | 1,369,320 | $ | 5,274,929 | $ | 6,644,249 | $ | (549,411 | ) | |||||||||||||||||||||
_____________
(1) | The loan was paid in full on February 1, 2018. |
(2) | These properties are encumbered under our unsecured revolving credit facility, which, as of December 31, 2017, had an outstanding balance of $100.0 million. |
(3) | The encumbrance amount relates to both Sunset Gower Studios and Sunset Bronson Studios. See description of notes payable in Part IV, Item 15(a) “Financial Statement and Schedules—Note 5 to the Consolidated Financial Statements-Notes Payable, net.” |
(4) | The Company computes depreciation using the straight-line method over the estimated useful lives over the shorter of the ground lease term or 39 years for building and improvements, 15 years for land improvements and over the shorter of asset life or life of the lease for tenant improvements. |
The aggregate gross cost of property included above for federal income tax purposes approximated $6.2 billion, unaudited as of December 31, 2017.
F- 56
The following table reconciles the historical cost of total real estate held for investment and accumulated depreciation from January 1, 2015 to December 31, 2017:
Year Ended December 31, | ||||||||||||
2017 | 2016 | 2015 | ||||||||||
Total investment in real estate, beginning of year | $ | 6,507,484 | $ | 5,976,526 | $ | 2,239,741 | ||||||
Additions during period: | ||||||||||||
Acquisitions | 255,848 | 597,751 | 3,699,289 | |||||||||
Improvements, capitalized costs | 330,809 | 296,399 | 198,561 | |||||||||
Total additions during period | 586,657 | 894,150 | 3,897,850 | |||||||||
Deductions during period | ||||||||||||
Disposal (fully depreciated assets and early terminations) | (41,337 | ) | (27,451 | ) | (13,556 | ) | ||||||
Cost of property sold | (408,555 | ) | (335,741 | ) | (147,509 | ) | ||||||
Total deductions during period | (449,892 | ) | (363,192 | ) | (161,065 | ) | ||||||
Ending balance, before reclassification to assets associated with real estate held for sale | 6,644,249 | 6,507,484 | 5,976,526 | |||||||||
Reclassification to assets associated with real estate held for sale | (220,808 | ) | (629,004 | ) | (353,067 | ) | ||||||
Total investment in real estate, end of year | $ | 6,423,441 | $ | 5,878,480 | $ | 5,623,459 | ||||||
Total accumulated depreciation, beginning of year | $ | (423,950 | ) | $ | (272,724 | ) | $ | (142,561 | ) | |||
Additions during period: | ||||||||||||
Depreciation of real estate | (206,838 | ) | (182,219 | ) | (151,066 | ) | ||||||
Total additions during period | (206,838 | ) | (182,219 | ) | (151,066 | ) | ||||||
Deductions during period: | ||||||||||||
Deletions | 37,925 | 25,622 | 12,999 | |||||||||
Write-offs due to sale | 43,452 | 5,371 | 7,904 | |||||||||
Total deductions during period | 81,377 | 30,993 | 20,903 | |||||||||
Ending balance, before reclassification to assets associated with real estate held for sale | (549,411 | ) | (423,950 | ) | (272,724 | ) | ||||||
Reclassification to assets associated with real estate held for sale | 15,913 | 48,743 | 8,865 | |||||||||
Total accumulated depreciation, end of year | $ | (533,498 | ) | $ | (375,207 | ) | $ | (263,859 | ) | |||
F- 57