Attached files
| file | filename |
|---|---|
| 8-K - 8-K - HANCOCK WHITNEY CORP | hwc-8k_20200617.htm |
KBW Virtual Southeast Bank Conference Reference Slides 6/17/2020 Exhibit 99.1
This presentation contains forward-looking statements within the meaning of section 27A of the Securities Act of 1933, as amended, and section 21E of the Securities Exchange Act of 1934, as amended. Forward-looking statements that we may make include statements regarding our expectations regarding our performance and financial condition, balance sheet and revenue growth, the provision for credit losses, loan growth expectations, management’s predictions about charge-offs for loans, including energy-related credits, the impact of significant decreases in oil and gas prices on our energy portfolio, the impact of the COVID-19 pandemic on the economy and our operations, including any resurgence of COVID-19, the adequacy of our enterprise risk management framework, the impact of the MidSouth acquisition or future business combinations on our performance and financial condition, including our ability to successfully integrate the businesses, success of revenue-generating initiatives, the effectiveness of derivative financial instruments and hedging activities to manage risks, projected tax rates, increased cybersecurity risks, including potential business disruptions or financial losses, the adequacy of our internal controls over financial reporting, the financial impact of regulatory requirements and tax reform legislation, the impact of the change in the referenced rate reform, deposit trends, credit quality trends, changes in interest rates, net interest margin trends, future expense levels, future profitability, improvements in expense to revenue (efficiency) ratio, purchase accounting impacts, accretion levels and expected returns. Also, any statement that does not describe historical or current facts is a forward-looking statement. These statements often include the words “believes,” “expects,” “anticipates,” “estimates,” “intends,” “plans,” “forecast,” “goals,” “targets,” “initiatives,” “focus,” “potentially,” “probably,” “projects,” “outlook", or similar expressions or future conditional verbs such as “may,” “will,” “should,” “would,” and “could.” Forward-looking statements are based upon the current beliefs and expectations of management and on information currently available to management. Our statements speak as of the date hereof, and we do not assume any obligation to update these statements or to update the reasons why actual results could differ from those contained in such statements in light of new information or future events. Given the many unknowns and risks being heavily weighted to the downside, our forward-looking statements are subject to the risk that conditions will be substantially different than we are currently expecting. If efforts to contain COVID-19 are unsuccessful and restrictions on movement last into the third quarter or beyond, the recession would be much longer and much more severe. Ineffective fiscal stimulus, or an extended delay in implementing it, are also major downside risks. The deeper the recession is, and the longer it lasts, the more it will damage consumer fundamentals and sentiment. This could both prolong the recession, and/or make any recovery weaker. Similarly, the recession could damage business fundamentals, and an extended global recession due to COVID-19 would weaken the U.S. recovery. As a result, the outbreak and its consequences, including responsive measures to manage it, have had and are likely to continue to have an adverse effect, possibly materially, on our business and financial performance by adversely affecting, possibly materially, the demand and profitability of our products and services, the valuation of assets and our ability to meet the needs of our customers. Forward-looking statements are subject to significant risks and uncertainties. Any forward-looking statement made in this release is subject to the safe harbor protections set forth in the Private Securities Litigation Reform Act of 1995. Investors are cautioned against placing undue reliance on such statements. Actual results may differ materially from those set forth in the forward-looking statements. Additional factors that could cause actual results to differ materially from those described in the forward-looking statements can be found in Part I, “Item 1A. Risk Factors” in our Annual Report on Form 10-K for the year ended December 31, 2019, Part II, “Item 1A. Risk Factors” in our Quarterly Report on Form 10-Q for the quarter ended March 31, 2020 and in other periodic reports that we file with the SEC. Important cautionary statement about forward-looking statements
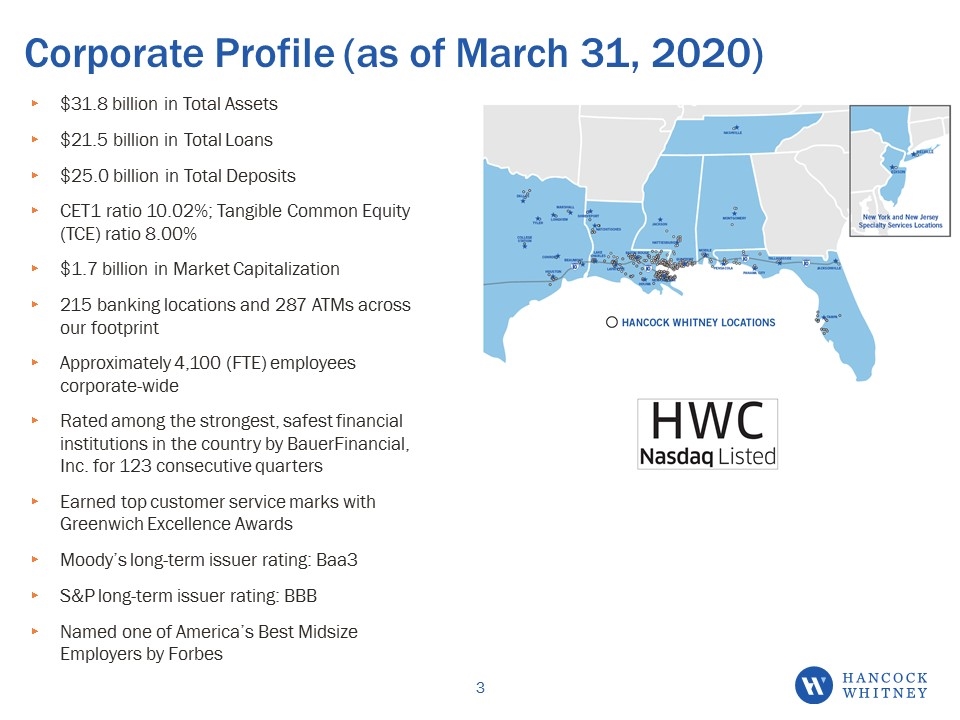
Corporate Profile (as of March 31, 2020) $31.8 billion in Total Assets $21.5 billion in Total Loans $25.0 billion in Total Deposits CET1 ratio 10.02%; Tangible Common Equity (TCE) ratio 8.00% $1.7 billion in Market Capitalization 215 banking locations and 287 ATMs across our footprint Approximately 4,100 (FTE) employees corporate-wide Rated among the strongest, safest financial institutions in the country by BauerFinancial, Inc. for 123 consecutive quarters Earned top customer service marks with Greenwich Excellence Awards Moody’s long-term issuer rating: Baa3 S&P long-term issuer rating: BBB Named one of America’s Best Midsize Employers by Forbes
COVID-19 Response Employees Modified normal business operations and procedures, where feasible; approximately 50% of almost 3,000 non-financial center associates continue to work remotely Associate training 100% virtual; candidate recruiting activities are conducted via phone and virtual teleconference platforms Board of Directors and members of executive management have elected to contribute a portion of their compensation to the Hancock Whitney Associate Assistance Fund to help associates in need Recognized non-exempt Retail Financial Center job associates with a $1,000 bonus Consumers & Businesses 97% of our financial centers opened their lobbies after Memorial Day, and with consultation from health care experts we are safely staffing our operational areas in a “journey back to normal” Assisting clients via online and mobile banking and through the call center Offered fee waivers on certain products Penalty-free CD withdrawals MMDA & savings excessive withdrawal fees Overdraft protection transfer fees Checking account reopening fees Offered loan payment deferrals Business and consumer loans and lines of credit Credit cards Auto loans Extended credit where appropriate to existing and qualified new clients
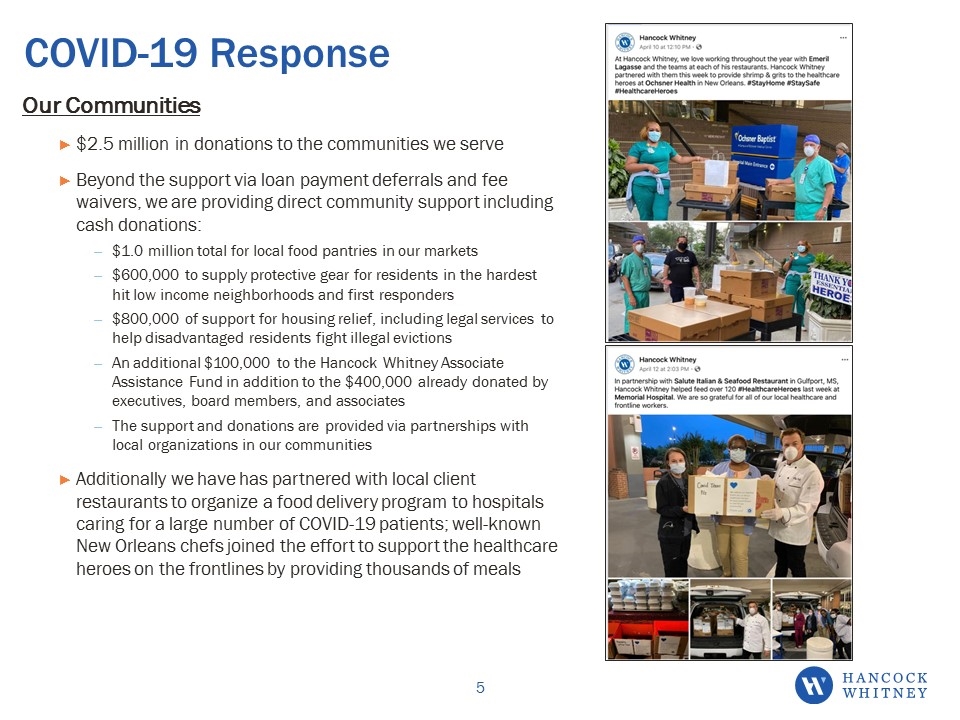
COVID-19 Response Our Communities $2.5 million in donations to the communities we serve Beyond the support via loan payment deferrals and fee waivers, we are providing direct community support including cash donations: $1.0 million total for local food pantries in our markets $600,000 to supply protective gear for residents in the hardest hit low income neighborhoods and first responders $800,000 of support for housing relief, including legal services to help disadvantaged residents fight illegal evictions An additional $100,000 to the Hancock Whitney Associate Assistance Fund in addition to the $400,000 already donated by executives, board members, and associates The support and donations are provided via partnerships with local organizations in our communities Additionally we have has partnered with local client restaurants to organize a food delivery program to hospitals caring for a large number of COVID-19 patients; well-known New Orleans chefs joined the effort to support the healthcare heroes on the frontlines by providing thousands of meals
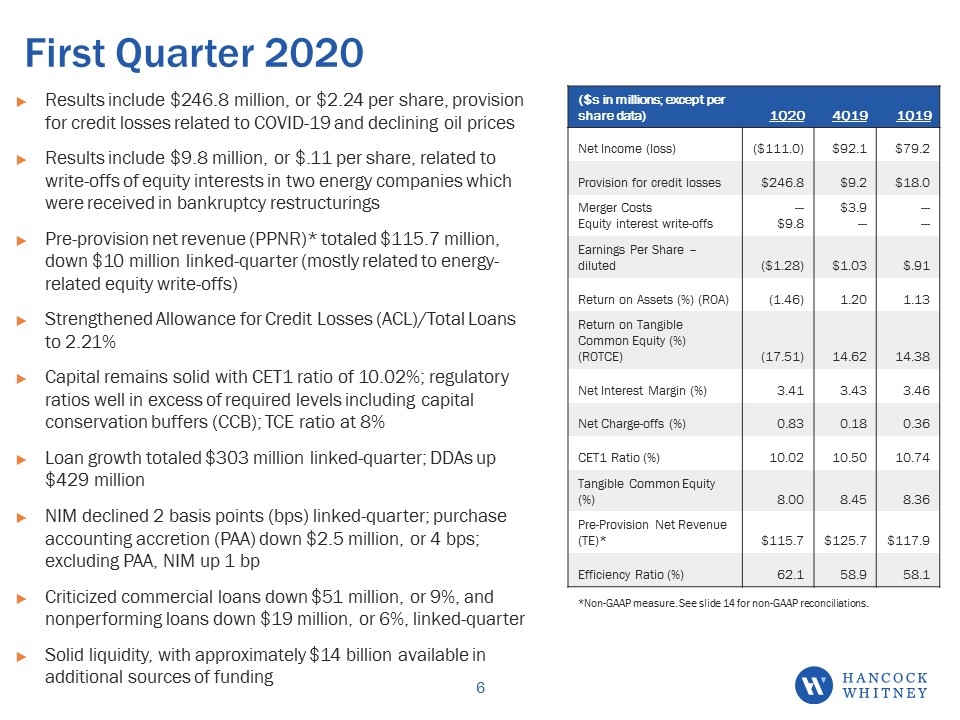
First Quarter 2020 Results include $246.8 million, or $2.24 per share, provision for credit losses related to COVID-19 and declining oil prices Results include $9.8 million, or $.11 per share, related to write-offs of equity interests in two energy companies which were received in bankruptcy restructurings Pre-provision net revenue (PPNR)* totaled $115.7 million, down $10 million linked-quarter (mostly related to energy-related equity write-offs) Strengthened Allowance for Credit Losses (ACL)/Total Loans to 2.21% Capital remains solid with CET1 ratio of 10.02%; regulatory ratios well in excess of required levels including capital conservation buffers (CCB); TCE ratio at 8% Loan growth totaled $303 million linked-quarter; DDAs up $429 million NIM declined 2 basis points (bps) linked-quarter; purchase accounting accretion (PAA) down $2.5 million, or 4 bps; excluding PAA, NIM up 1 bp Criticized commercial loans down $51 million, or 9%, and nonperforming loans down $19 million, or 6%, linked-quarter Solid liquidity, with approximately $14 billion available in additional sources of funding ($s in millions; except per share data) 1Q20 4Q19 1Q19 Net Income (loss) ($111.0) $92.1 $79.2 Provision for credit losses $246.8 $9.2 $18.0 Merger Costs Equity interest write-offs --- $9.8 $3.9 --- --- --- Earnings Per Share – diluted ($1.28) $1.03 $.91 Return on Assets (%) (ROA) (1.46) 1.20 1.13 Return on Tangible Common Equity (%) (ROTCE) (17.51) 14.62 14.38 Net Interest Margin (%) 3.41 3.43 3.46 Net Charge-offs (%) 0.83 0.18 0.36 CET1 Ratio (%) 10.02 10.50 10.74 Tangible Common Equity (%) 8.00 8.45 8.36 Pre-Provision Net Revenue (TE)* $115.7 $125.7 $117.9 Efficiency Ratio (%) 62.1 58.9 58.1 *Non-GAAP measure. See slide 14 for non-GAAP reconciliations.
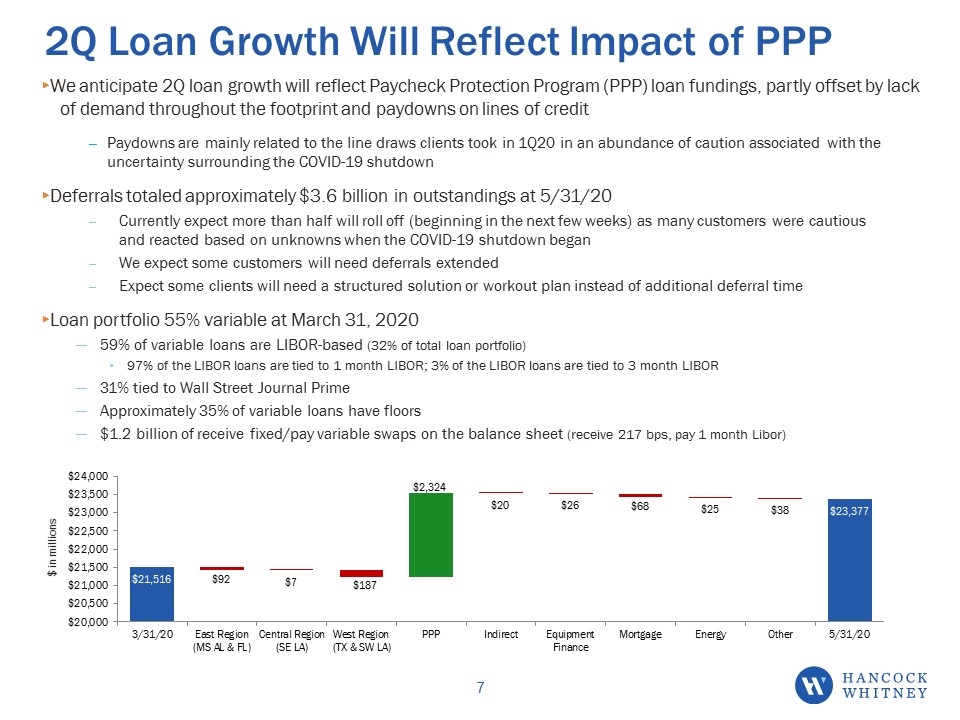
2Q Loan Growth Will Reflect Impact of PPP We anticipate 2Q loan growth will reflect Paycheck Protection Program (PPP) loan fundings, partly offset by lack of demand throughout the footprint and paydowns on lines of credit Paydowns are mainly related to the line draws clients took in 1Q20 in an abundance of caution associated with the uncertainty surrounding the COVID-19 shutdown Deferrals totaled approximately $3.6 billion in outstandings at 5/31/20 Currently expect more than half will roll off (beginning in the next few weeks) as many customers were cautious and reacted based on unknowns when the COVID-19 shutdown began We expect some customers will need deferrals extended Expect some clients will need a structured solution or workout plan instead of additional deferral time Loan portfolio 55% variable at March 31, 2020 59% of variable loans are LIBOR-based (32% of total loan portfolio) 97% of the LIBOR loans are tied to 1 month LIBOR; 3% of the LIBOR loans are tied to 3 month LIBOR 31% tied to Wall Street Journal Prime Approximately 35% of variable loans have floors $1.2 billion of receive fixed/pay variable swaps on the balance sheet (receive 217 bps, pay 1 month Libor)
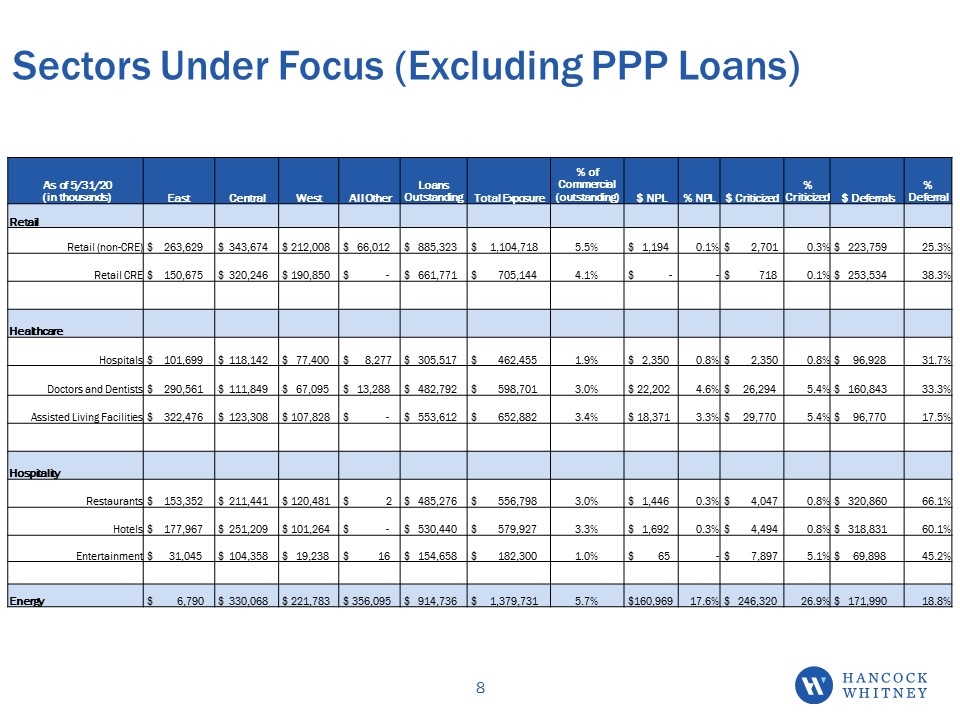
Sectors Under Focus (Excluding PPP Loans) As of 5/31/20 (in thousands) East Central West All Other Loans Outstanding Total Exposure % of Commercial (outstanding) $ NPL % NPL $ Criticized % Criticized $ Deferrals % Deferral Retail Retail (non-CRE) $ 263,629 $ 343,674 $ 212,008 $ 66,012 $ 885,323 $ 1,104,718 5.5% $ 1,194 0.1% $ 2,701 0.3% $ 223,759 25.3% Retail CRE $ 150,675 $ 320,246 $ 190,850 $ - $ 661,771 $ 705,144 4.1% $ - - $ 718 0.1% $ 253,534 38.3% Healthcare Hospitals $ 101,699 $ 118,142 $ 77,400 $ 8,277 $ 305,517 $ 462,455 1.9% $ 2,350 0.8% $ 2,350 0.8% $ 96,928 31.7% Doctors and Dentists $ 290,561 $ 111,849 $ 67,095 $ 13,288 $ 482,792 $ 598,701 3.0% $ 22,202 4.6% $ 26,294 5.4% $ 160,843 33.3% Assisted Living Facilities $ 322,476 $ 123,308 $ 107,828 $ - $ 553,612 $ 652,882 3.4% $ 18,371 3.3% $ 29,770 5.4% $ 96,770 17.5% Hospitality Restaurants $ 153,352 $ 211,441 $ 120,481 $ 2 $ 485,276 $ 556,798 3.0% $ 1,446 0.3% $ 4,047 0.8% $ 320,860 66.1% Hotels $ 177,967 $ 251,209 $ 101,264 $ - $ 530,440 $ 579,927 3.3% $ 1,692 0.3% $ 4,494 0.8% $ 318,831 60.1% Entertainment $ 31,045 $ 104,358 $ 19,238 $ 16 $ 154,658 $ 182,300 1.0% $ 65 - $ 7,897 5.1% $ 69,898 45.2% Energy $ 6,790 $ 330,068 $ 221,783 $ 356,095 $ 914,736 $ 1,379,731 5.7% $160,969 17.6% $ 246,320 26.9% $ 171,990 18.8%
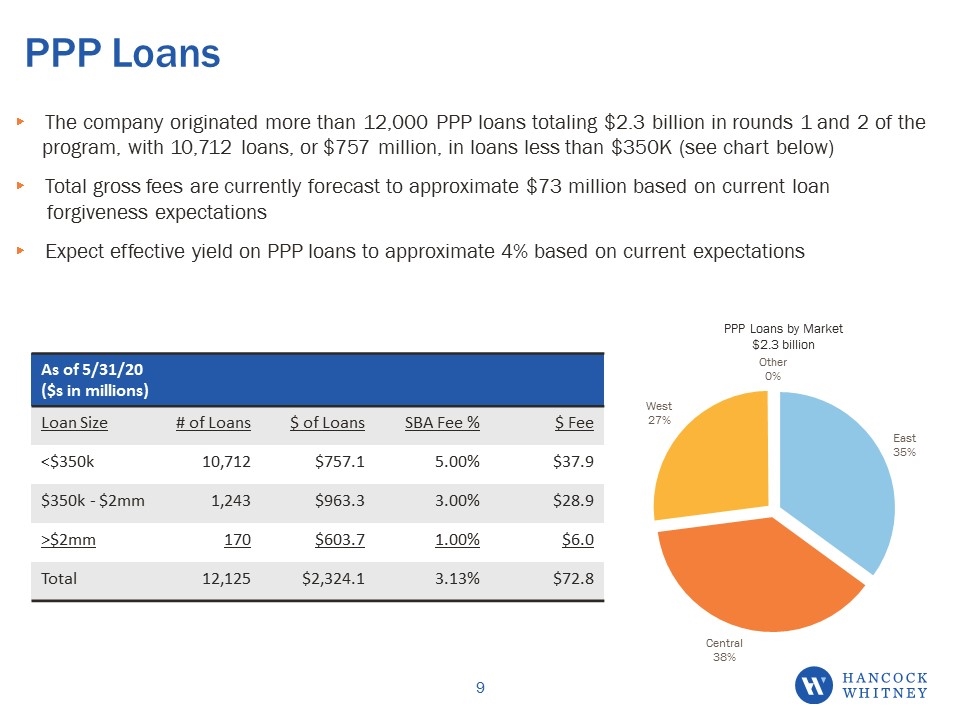
PPP Loans The company originated more than 12,000 PPP loans totaling $2.3 billion in rounds 1 and 2 of the program, with 10,712 loans, or $757 million, in loans less than $350K (see chart below) Total gross fees are currently forecast to approximate $73 million based on current loan forgiveness expectations Expect effective yield on PPP loans to approximate 4% based on current expectations PPP Loans by Market $2.3 billion As of 5/31/20 ($s in millions) Loan Size # of Loans $ of Loans SBA Fee % $ Fee <$350k 10,712 $757.1 5.00% $37.9 $350k - $2mm 1,243 $963.3 3.00% $28.9 >$2mm 170 $603.7 1.00% $6.0 Total 12,125 $2,324.1 3.13% $72.8
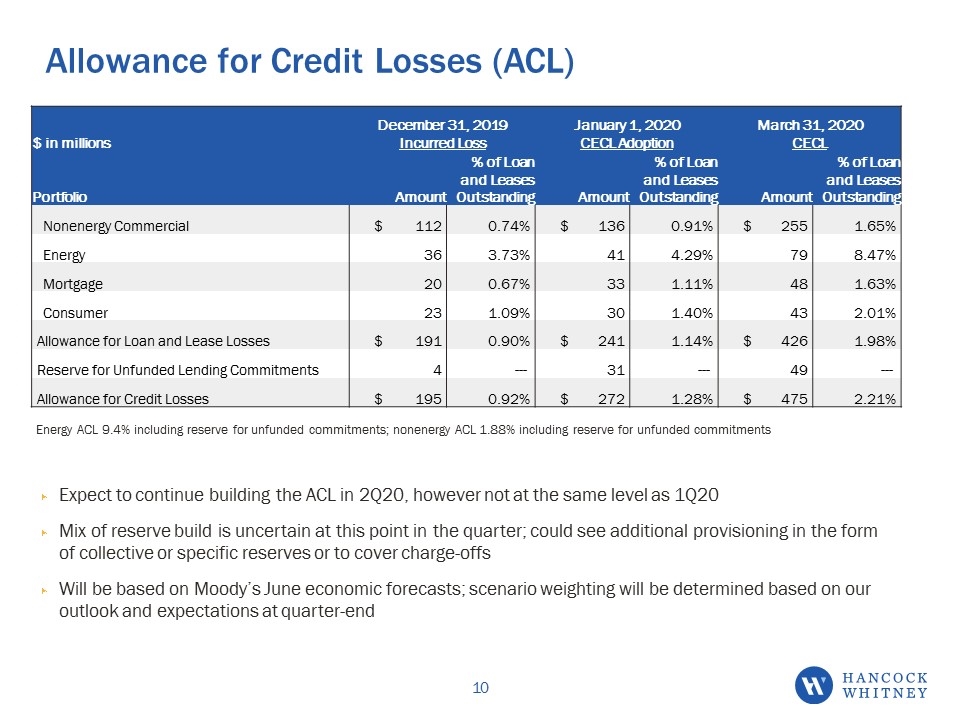
Allowance for Credit Losses (ACL) Expect to continue building the ACL in 2Q20, however not at the same level as 1Q20 Mix of reserve build is uncertain at this point in the quarter; could see additional provisioning in the form of collective or specific reserves or to cover charge-offs Will be based on Moody’s June economic forecasts; scenario weighting will be determined based on our outlook and expectations at quarter-end $ in millions December 31, 2019 Incurred Loss January 1, 2020 CECL Adoption March 31, 2020 CECL Portfolio Amount % of Loan and Leases Outstanding Amount % of Loan and Leases Outstanding Amount % of Loan and Leases Outstanding Nonenergy Commercial $ 112 0.74% $ 136 0.91% $ 255 1.65% Energy 36 3.73% 41 4.29% 79 8.47% Mortgage 20 0.67% 33 1.11% 48 1.63% Consumer 23 1.09% 30 1.40% 43 2.01% Allowance for Loan and Lease Losses $ 191 0.90% $ 241 1.14% $ 426 1.98% Reserve for Unfunded Lending Commitments 4 --- 31 --- 49 --- Allowance for Credit Losses $ 195 0.92% $ 272 1.28% $ 475 2.21% Energy ACL 9.4% including reserve for unfunded commitments; nonenergy ACL 1.88% including reserve for unfunded commitments
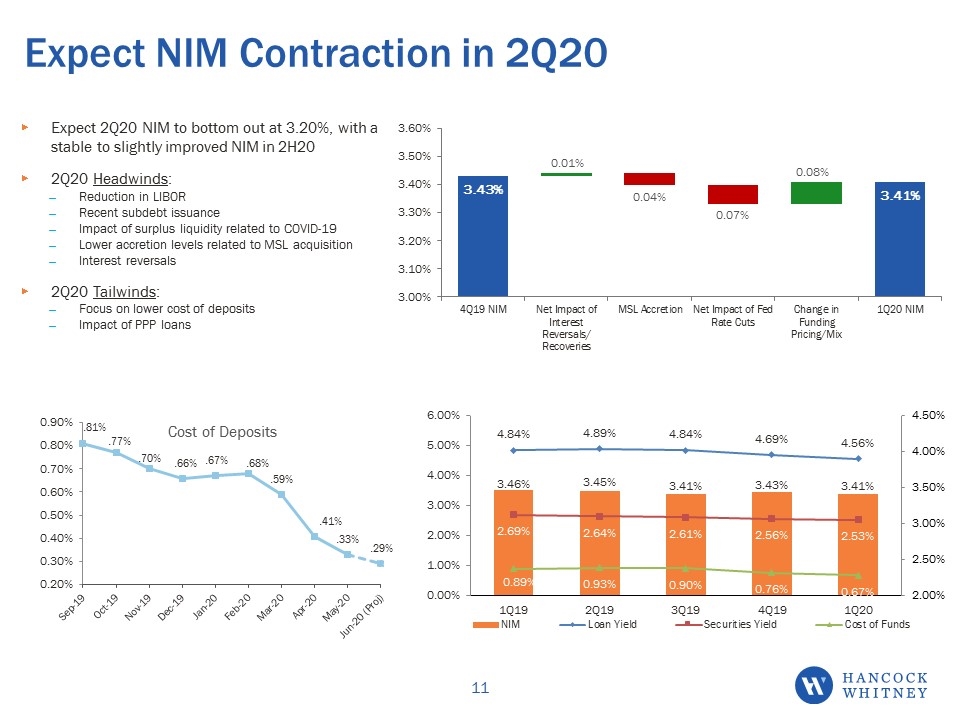
Expect 2Q20 NIM to bottom out at 3.20%, with a stable to slightly improved NIM in 2H20 2Q20 Headwinds: Reduction in LIBOR Recent subdebt issuance Impact of surplus liquidity related to COVID-19 Lower accretion levels related to MSL acquisition Interest reversals 2Q20 Tailwinds: Focus on lower cost of deposits Impact of PPP loans Expect NIM Contraction in 2Q20
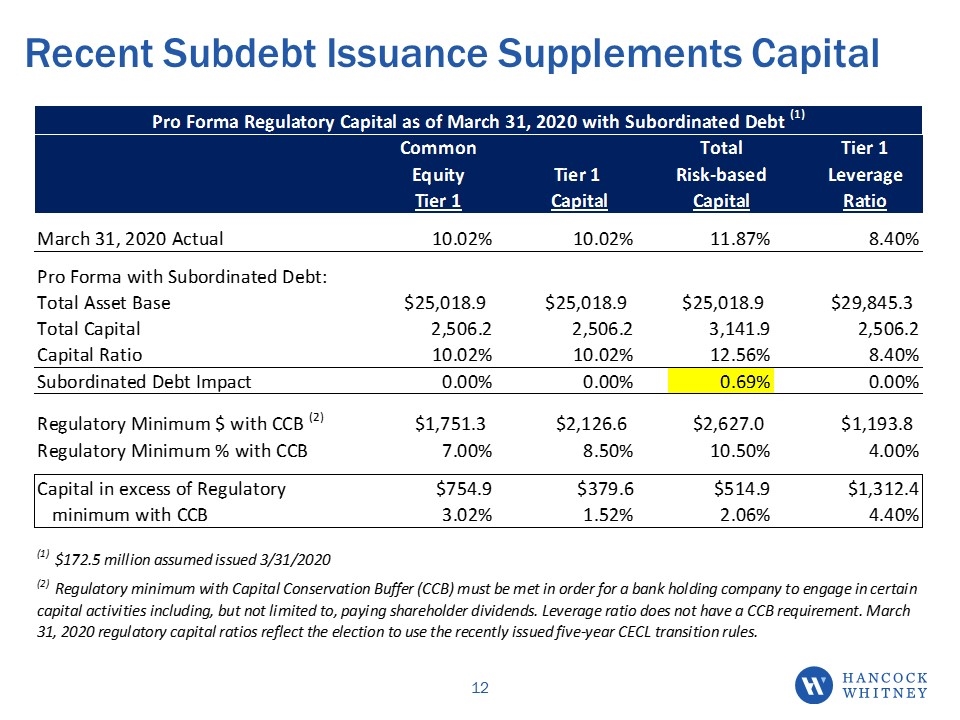
Recent Subdebt Issuance Supplements Capital
Non-GAAP Reconciliations
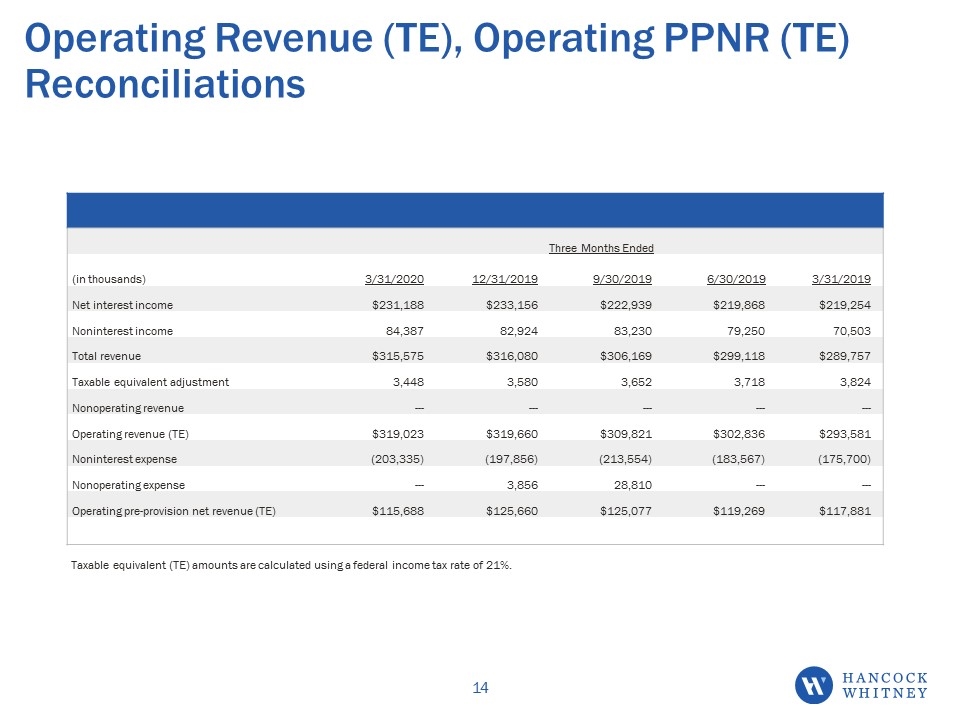
Operating Revenue (TE), Operating PPNR (TE) Reconciliations Three Months Ended (in thousands) 3/31/2020 12/31/2019 9/30/2019 6/30/2019 3/31/2019 Net interest income $231,188 $233,156 $222,939 $219,868 $219,254 Noninterest income 84,387 82,924 83,230 79,250 70,503 Total revenue $315,575 $316,080 $306,169 $299,118 $289,757 Taxable equivalent adjustment 3,448 3,580 3,652 3,718 3,824 Nonoperating revenue --- --- --- --- --- Operating revenue (TE) $319,023 $319,660 $309,821 $302,836 $293,581 Noninterest expense (203,335) (197,856) (213,554) (183,567) (175,700) Nonoperating expense --- 3,856 28,810 --- --- Operating pre-provision net revenue (TE) $115,688 $125,660 $125,077 $119,269 $117,881 Taxable equivalent (TE) amounts are calculated using a federal income tax rate of 21%.
KBW Virtual Southeast Bank Conference Reference Slides 6/17/2020
