Attached files
| file | filename |
|---|---|
| 8-K - 8-K - LAKE SHORE BANCORP, INC. | lsbk-20200520x8k.htm |
 1 Annual Shareholders’ Meeting May 20, 2020 LS Bancorp JPG.png
 2 Agenda LS Bancorp JPG.pngCall to Order - Gary W. Winger, Chairman Introduction of Officers, Directors and Director Nominees Secretary’s Report Presentation of Proposals Executive Management Report to Shareholders Vote Report Adjournment
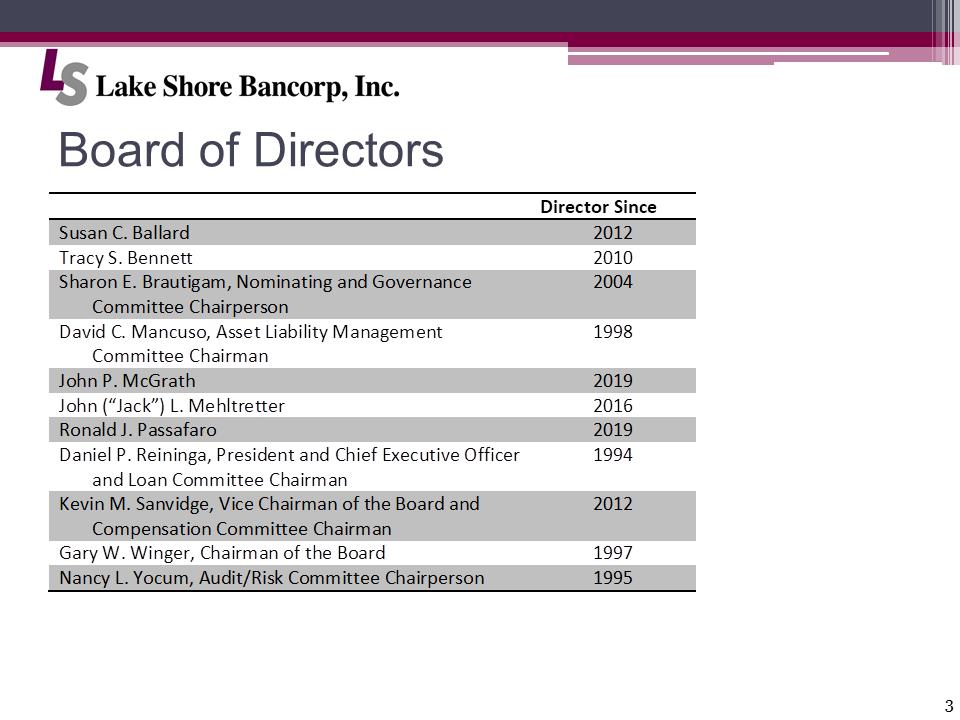 3 Board of Directors LS Bancorp JPG.png Director Since Susan C. Ballard 2012 Tracy S. Bennett 2010 Sharon E. Brautigam, Nominating and Corporate Governance Committee Chairperson 2004 David C. Mancuso, Asset/Liability Committee Chairman 1998 John P. McGrath 2019 John (“Jack”) L. Mehltretter 2016 Ronald J. Passafaro 2019 Daniel P. Reininga, President and Chief Executive Officer and Loan Committee Chairman 1994 Kevin M. Sanvidge, Vice Chairman of the Board, Compensation Committee Chairman 2012 Gary W. Winger, Chairman of the Board 1997 Nancy L. Yocum, Audit/Risk Committee Chair 1995
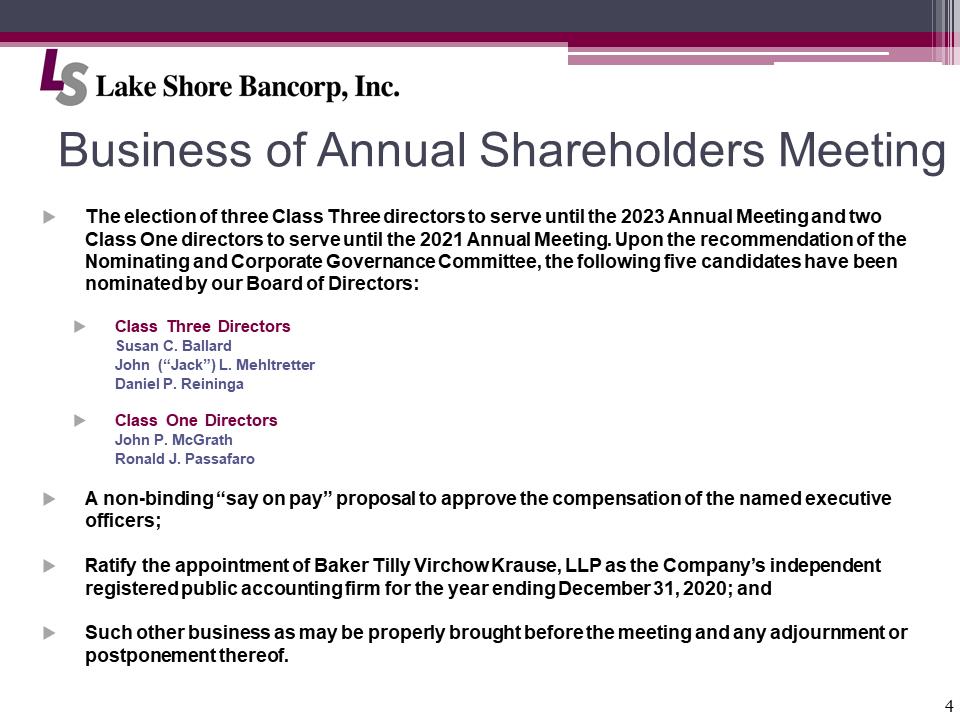 4 Business of Annual Shareholders Meeting LS Bancorp JPG.pngThe election of three Class Three directors to serve until the 2023 Annual Meeting and two Class One directors to serve until the 2021 Annual Meeting. Upon the recommendation of the Nominating and Corporate Governance Committee, the following five candidates have been nominated by our Board of Directors: Class Three Directors Susan C. Ballard John (“Jack”) L. Mehltretter Daniel P. Reininga Class One Directors John P. McGrath Ronald J. Passafaro A non-binding “say on pay” proposal to approve the compensation of the named executive officers; Ratify the appointment of Baker Tilly Virchow Krause, LLP as the Company’s independent registered public accounting firm for the year ending December 31, 2020; and Such other business as may be properly brought before the meeting and any adjournment or postponement thereof.
 5 Executive Management Presentation LS Bancorp JPG.pngDaniel P. Reininga, President and Chief Executive Officer
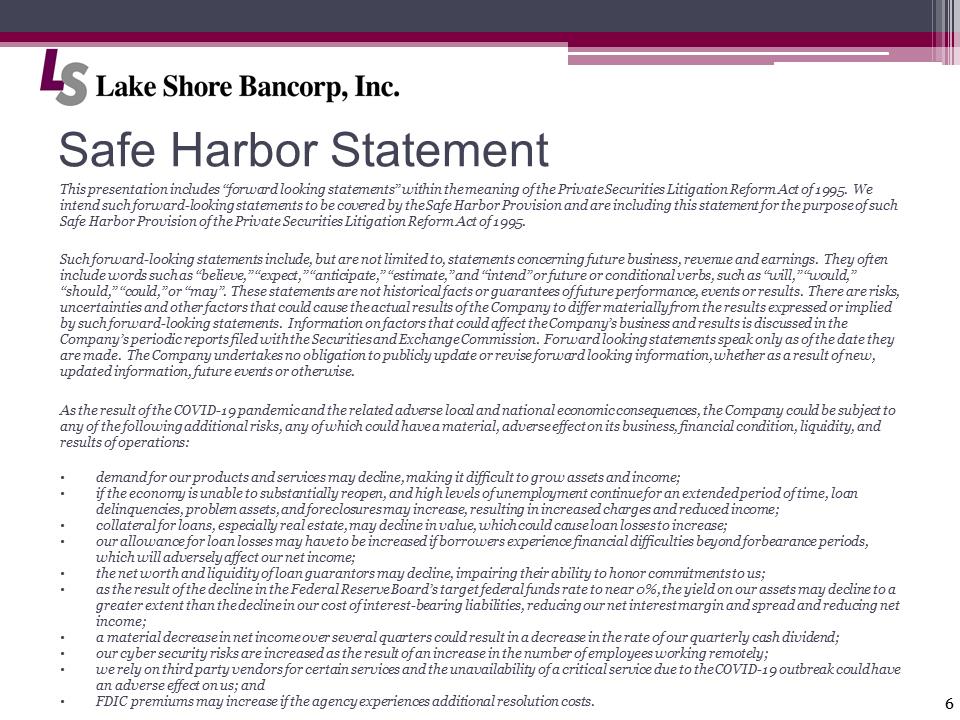 6 Safe Harbor Statement LS Bancorp JPG.pngThis presentation includes “forward looking statements” within the meaning of the Private Securities Litigation Reform Act of 1995. We intend such forward-looking statements to be covered by the Safe Harbor Provision and are including this statement for the purpose of such Safe Harbor Provision of the Private Securities Litigation Reform Act of 1995. Such forward-looking statements include, but are not limited to, statements concerning future business, revenue and earnings. They often include words such as “believe,” “expect,” “anticipate,” “estimate,” and “intend” or future or conditional verbs, such as “will,” “would,” “should,” “could,” or “may”. These statements are not historical facts or guarantees of future performance, events or results. There are risks, uncertainties and other factors that could cause the actual results of the Company to differ materially from the results expressed or implied by such forward-looking statements. Information on factors that could affect the Company’s business and results is discussed in the Company’s periodic reports filed with the Securities and Exchange Commission. Forward looking statements speak only as of the date they are made. The Company undertakes no obligation to publicly update or revise forward looking information, whether as a result of new, updated information, future events or otherwise. As the result of the COVID-19 pandemic and the related adverse local and national economic consequences, the Company could be subject to any of the following additional risks, any of which could have a material, adverse effect on its business, financial condition, liquidity, and results of operations: •demand for our products and services may decline, making it difficult to grow assets and income; •if the economy is unable to substantially reopen, and high levels of unemployment continue for an extended period of time, loan delinquencies, problem assets, and foreclosures may increase, resulting in increased charges and reduced income; •collateral for loans, especially real estate, may decline in value, which could cause loan losses to increase; •our allowance for loan losses may have to be increased if borrowers experience financial difficulties beyond forbearance periods, which will adversely affect our net income; •the net worth and liquidity of loan guarantors may decline, impairing their ability to honor commitments to us; •as the result of the decline in the Federal Reserve Board’s target federal funds rate to near 0%, the yield on our assets may decline to a greater extent than the decline in our cost of interest-bearing liabilities, reducing our net interest margin and spread and reducing net income; •a material decrease in net income over several quarters could result in a decrease in the rate of our quarterly cash dividend; •our cyber security risks are increased as the result of an increase in the number of employees working remotely; •we rely on third party vendors for certain services and the unavailability of a critical service due to the COVID-19 outbreak could have an adverse effect on us; and •FDIC premiums may increase if the agency experiences additional resolution costs.
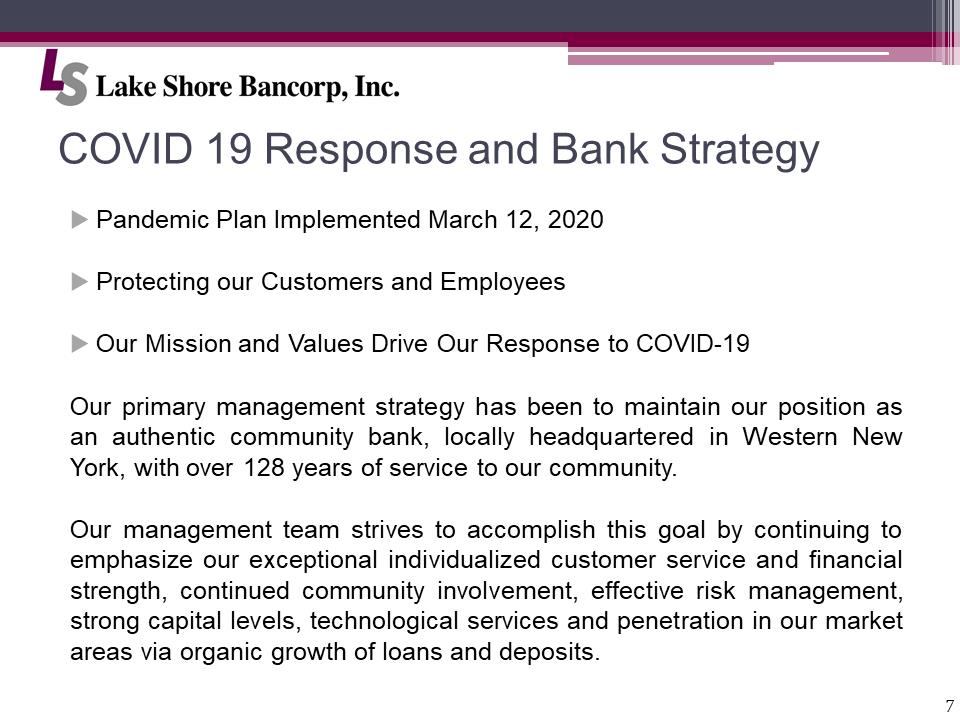 7 COVID 19 Response and Bank Strategy LS Bancorp JPG.pngPandemic Plan Implemented March 12, 2020 Protecting our Customers and Employees Our Mission and Values Drive Our Response to COVID-19 Our primary management strategy has been to maintain our position as an authentic community bank, locally headquartered in Western New York, with over 128 years of service to our community. Our management team strives to accomplish this goal by continuing to emphasize our exceptional individualized customer service and financial strength, continued community involvement, effective risk management, strong capital levels, technological services and penetration in our market areas via organic growth of loans and deposits.
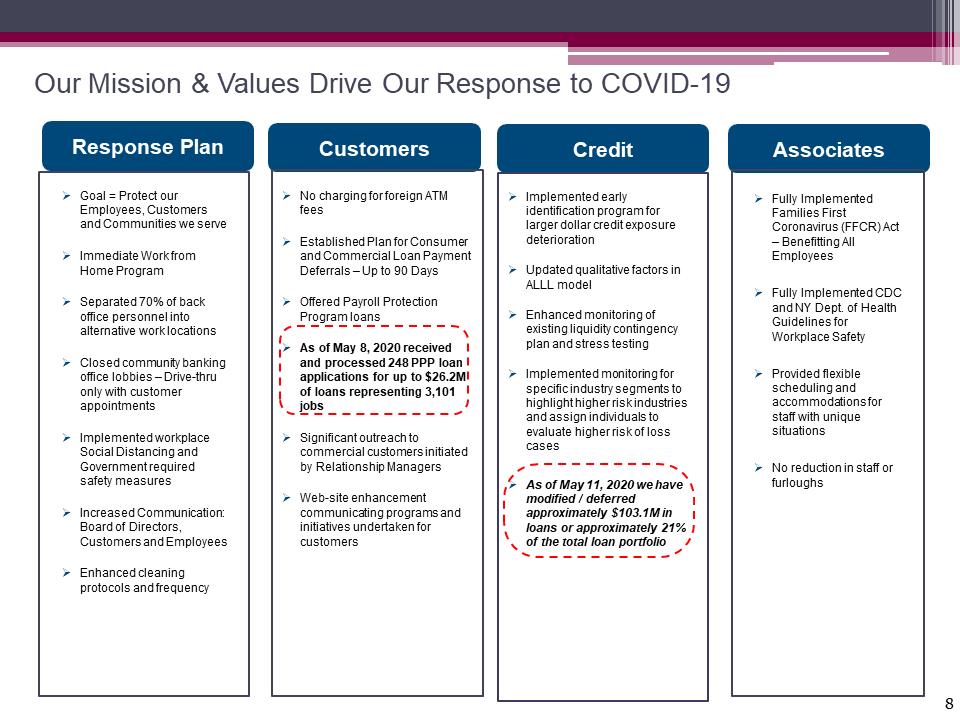 8 Our Mission & Values Drive Our Response to COVID-19 Customers Associates Response Plan Goal = Protect our Employees, Customers and Communities we serve Immediate Work from Home Program Separated 70% of back office personnel into alternative work locations Closed community banking office lobbies – Drive-thru only with customer appointments Implemented workplace Social Distancing and Government required safety measures Increased Communication: Board of Directors, Customers and Employees Enhanced cleaning protocols and frequency No charging for foreign ATM fees Established Plan for Consumer and Commercial Loan Payment Deferrals – Up to 90 Days Offered Payroll Protection Program loans As of May 8, 2020 received and processed 248 PPP loan applications for up to $26.2M of loans representing 3,101 jobs Significant outreach to commercial customers initiated by Relationship Managers Web-site enhancement communicating programs and initiatives undertaken for customers Credit Implemented early identification program for larger dollar credit exposure deterioration Updated qualitative factors in ALLL model Enhanced monitoring of existing liquidity contingency plan and stress testing Implemented monitoring for specific industry segments to highlight higher risk industries and assign individuals to evaluate higher risk of loss cases As of May 11, 2020 we have modified / deferred approximately $103.1M in loans or approximately 21% of the total loan portfolio Fully Implemented Families First Coronavirus (FFCR) Act – Benefitting All Employees Fully Implemented CDC and NY Dept. of Health Guidelines for Workplace Safety Provided flexible scheduling and accommodations for staff with unique situations No reduction in staff or furloughs
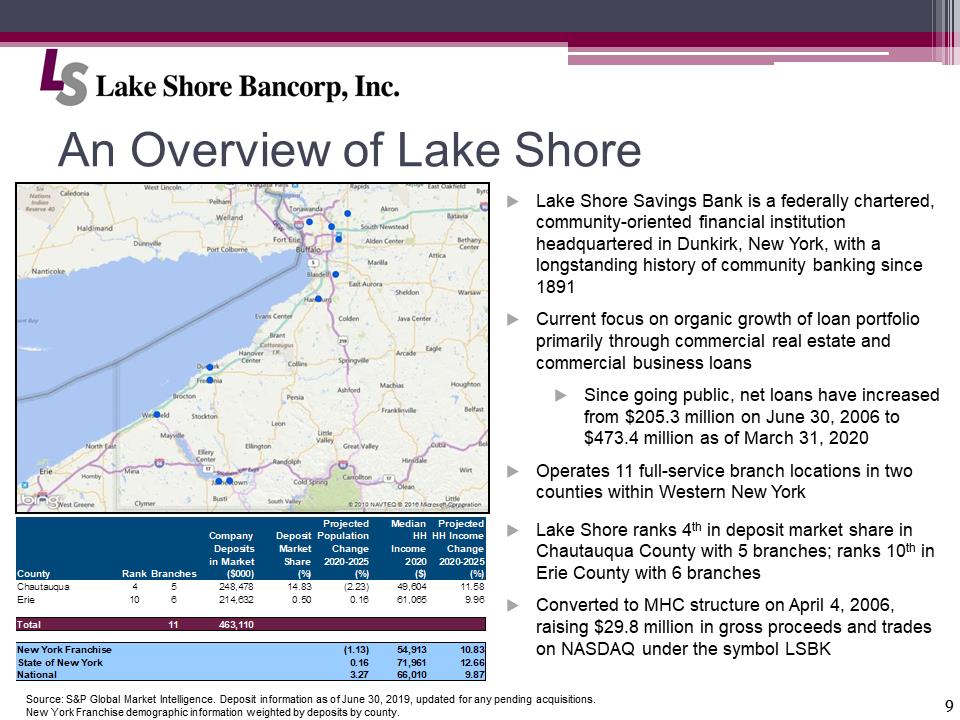 9 An Overview of Lake Shore LS Bancorp JPG.pnghttps://maps.snl.com/arcgisoutput/Utilities/PrintingTools_GPServer/_ags_5648a30321784a39a89ed894a10948f2.jpgSource: S&P Global Market Intelligence. Deposit information as of June 30, 2019, updated for any pending acquisitions. New York Franchise demographic information weighted by deposits by county. CountyRankBranchesCompanyDepositsin Market($000)DepositMarketShare(%)ProjectedPopulationChange2020-2025(%)MedianHHIncome2020($)ProjectedHH IncomeChange2020-2025(%)Chautauqua45248,47814.83(2.23)49,60411.58Erie106214,6320.500.1661,0659.96Total11463,110New York Franchise(1.13)54,91310.83State of New York0.1671,96112.66National3.2766,0109.87Lake Shore Savings Bank is a federally chartered, community-oriented financial institution headquartered in Dunkirk, New York, with a longstanding history of community banking since 1891 Current focus on organic growth of loan portfolio primarily through commercial real estate and commercial business loans Since going public, net loans have increased from $205.3 million on June 30, 2006 to $473.4 million as of March 31, 2020 Operates 11 full-service branch locations in two counties within Western New York Lake Shore ranks 4th in deposit market share in Chautauqua County with 5 branches; ranks 10th in Erie County with 6 branches Converted to MHC structure on April 4, 2006, raising $29.8 million in gross proceeds and trades on NASDAQ under the symbol LSBK
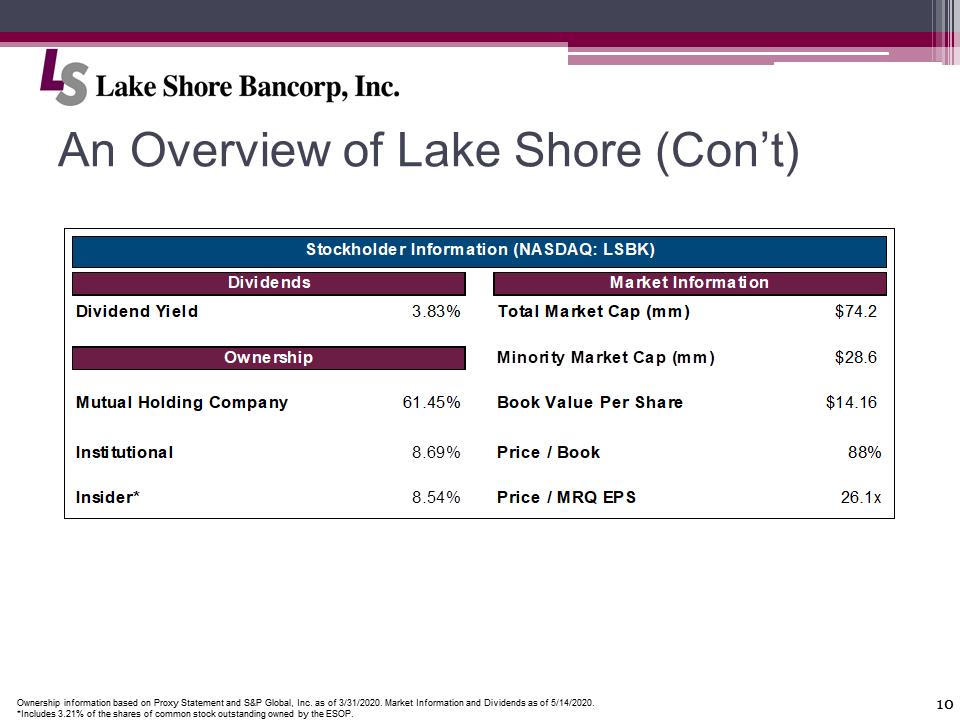 10 An Overview of Lake Shore (Con’t) LS Bancorp JPG.pngDividendsMarket InformationDividend Yield3.83%Total Market Cap (mm)$74.2OwnershipMinority Market Cap (mm)$28.6Mutual Holding Company61.45%Book Value Per Share$14.16Institutional8.69%Price / Book88%Insider*8.54%Price / MRQ EPS26.1xStockholder Information (NASDAQ: LSBK)Ownership information based on Proxy Statement and S&P Global, Inc. as of 3/31/2020. Market Information and Dividends as of 5/14/2020. *Includes 3.21% of the shares of common stock outstanding owned by the ESOP.
 11 Positioned for Growth LS Bancorp JPG.pngDedicated to Community Banking Model Focus on High-Quality, Personalized Customer Service Enhanced Operating Efficiency Enterprise Risk Mitigation Safe, Reasonable, Sustainable Growth
 12 Customer Value LS Bancorp JPG.pngContinue to deploy Technology Driven Solutions, geared at driving optimum customer experience and efficiency LS Rewards debit card program Converted P2P payment system to Zelle from Pop Money Optimization of the mobile experience for the LSSB website Enhanced business banking products
 13 Technology LS Bancorp JPG.pngImproved network infrastructure Deployed new telecommunications system Seamless mobility Strictly a financial sector vendor Cybersecurity Enhancements Cloud based with enhance mobility Network Backbone, enhanced security Due diligence started on core solutions for best customer facing solutions Virtualization project enabling remote access and enhanced security capabilities
 14 Continue to…. LS Bancorp JPG.pngEmpower our employees focusing on professional development Promote Ethical Behavior Support the Communities we serve
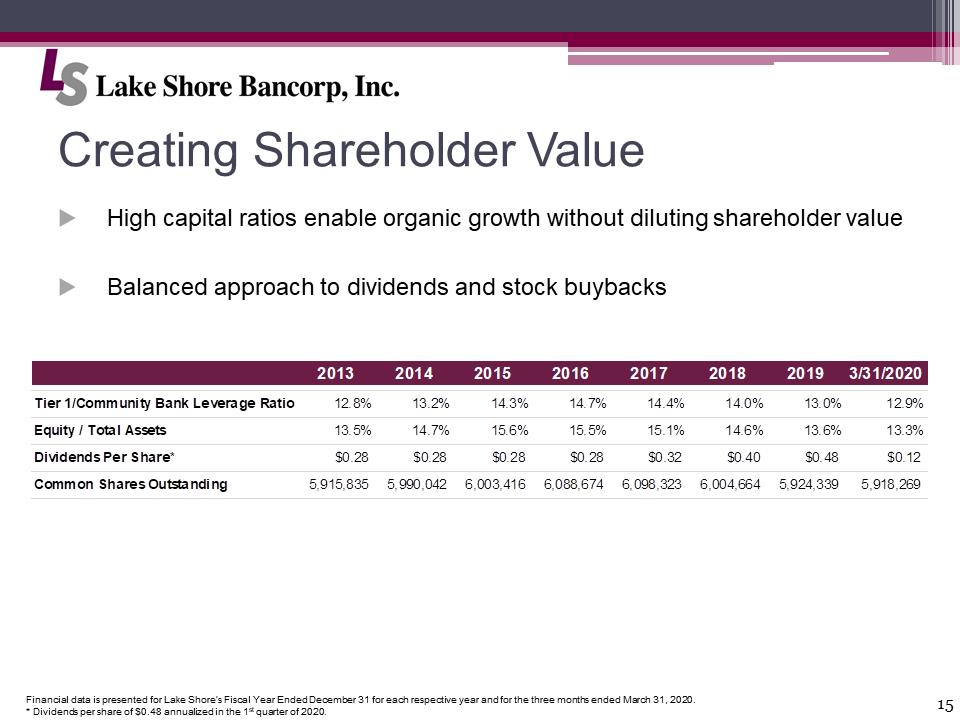 15 Creating Shareholder Value LS Bancorp JPG.pngFinancial data is presented for Lake Shore’s Fiscal Year Ended December 31 for each respective year and for the three months ended March 31, 2020. * Dividends per share of $0.48 annualized in the 1st quarter of 2020. High capital ratios enable organic growth without diluting shareholder value Balanced approach to dividends and stock buybacks Balanced approach to dividends and stock buybacks 20132014201520162017201820193/31/2020Tier 1/Community Bank Leverage Ratio12.8%13.2%14.3%14.7%14.4%14.0%13.0%12.9%Equity / Total Assets13.5%14.7%15.6%15.5%15.1%14.6%13.6%13.3%Dividends Per Share*$0.28$0.28$0.28$0.28$0.32$0.40$0.48$0.12Common Shares Outstanding5,915,8355,990,0426,003,4166,088,6746,098,3236,004,6645,924,3395,918,269
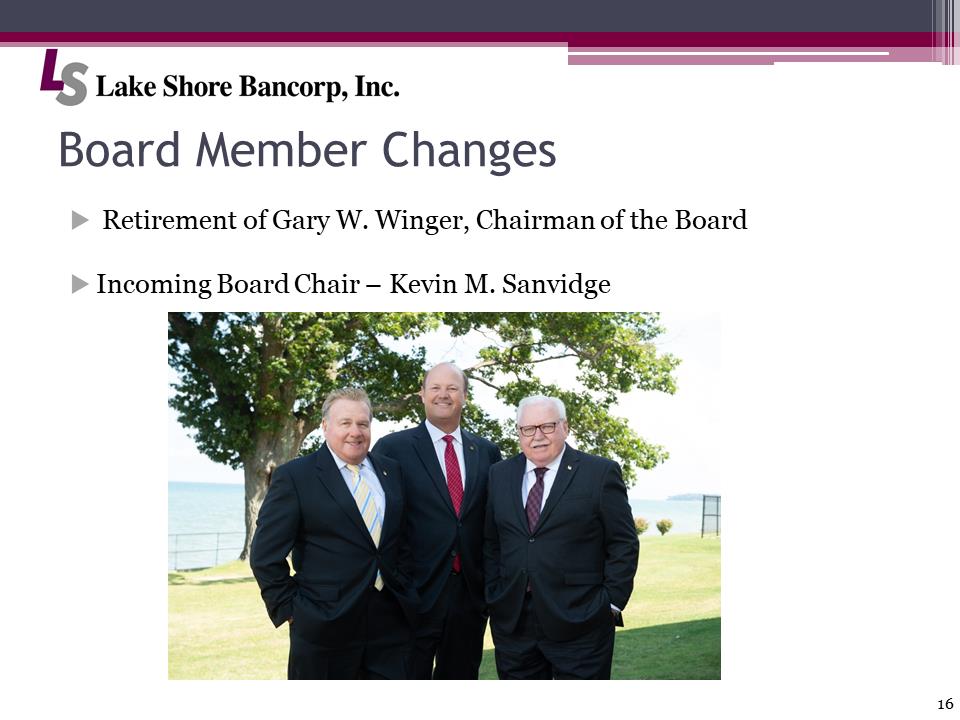 16 Board Member Changes LS Bancorp JPG.png Retirement of Gary W. Winger, Chairman of the Board Incoming Board Chair – Kevin M. Sanvidge
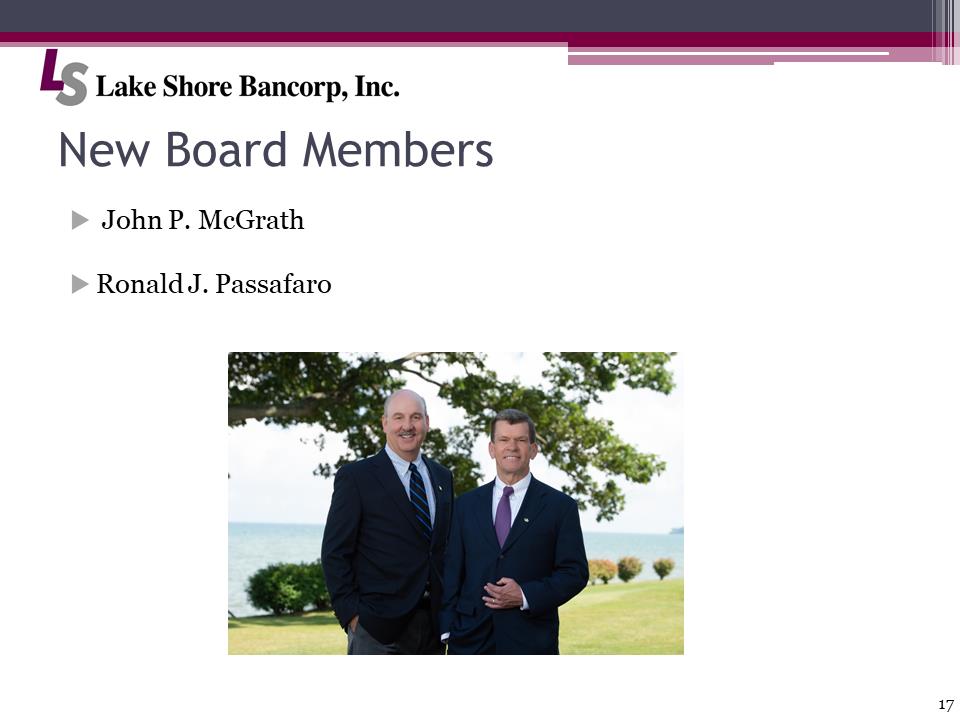 17 New Board Members LS Bancorp JPG.png John P. McGrath Ronald J. Passafaro
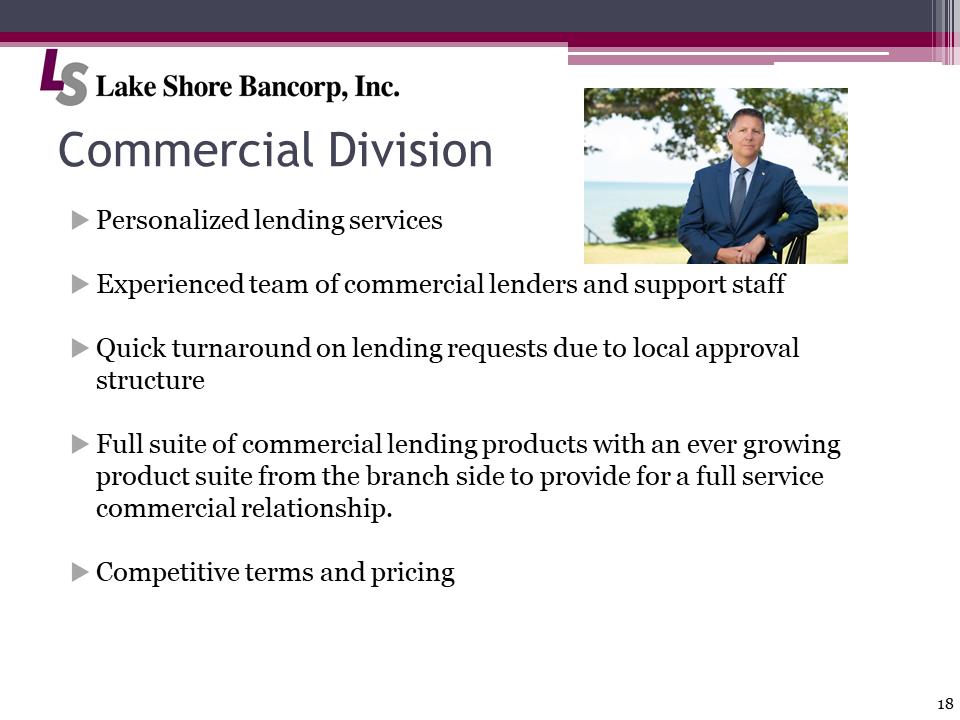 18 Commercial Division LS Bancorp JPG.pngPersonalized lending services Experienced team of commercial lenders and support staff Quick turnaround on lending requests due to local approval structure Full suite of commercial lending products with an ever growing product suite from the branch side to provide for a full service commercial relationship. Competitive terms and pricing
 19 Summary LS Bancorp JPG.pngAfter more than 128 years in business, we continue to be a local bank that cares about its customers and communities. At Lake Shore Savings, that has always meant “Putting People First”. We will continue to put our customers, communities and shareholders “First”, as we adopt new technology, products and services to meet the future needs of our customers.
 20 Financial Highlights LS Bancorp JPG.pngRachel A. Foley, Chief Financial Officer and Treasurer
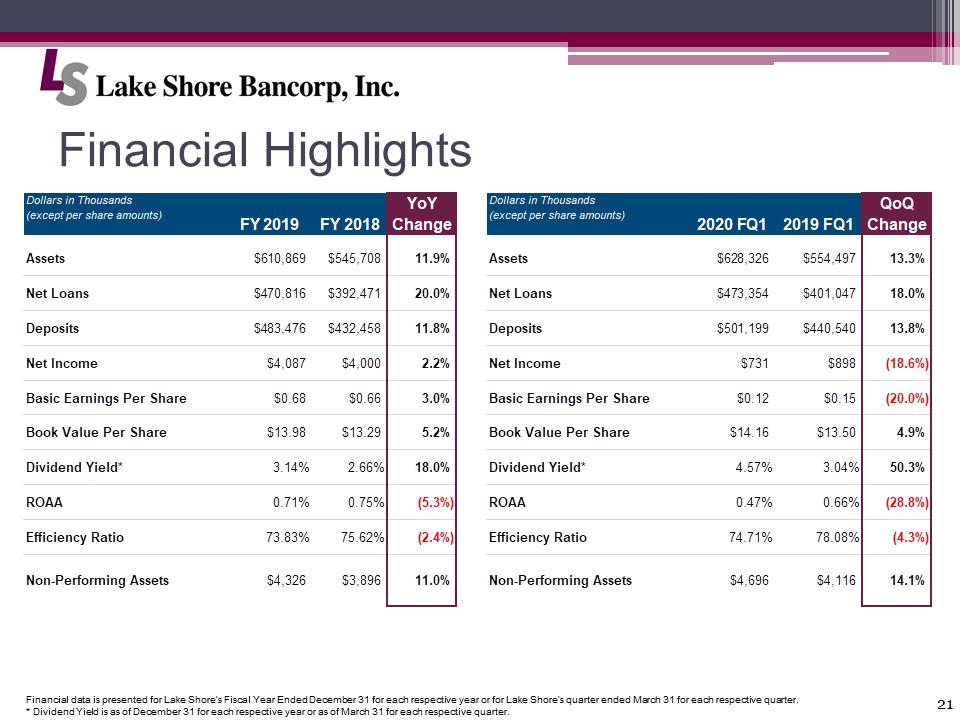 21 Financial Highlights LS Bancorp JPG.pngFinancial data is presented for Lake Shore’s Fiscal Year Ended December 31 for each respective year or for Lake Shore’s quarter ended March 31 for each respective quarter. * Dividend Yield is as of December 31 for each respective year or as of March 31 for each respective quarter. Dollars in Thousands(except per share amounts)FY 2019FY 2018YoY ChangeAssets$610,869$545,70811.9%Net Loans$470,816$392,47120.0%Deposits$483,476$432,45811.8%Net Income$4,087$4,0002.2%Basic Earnings Per Share $0.68$0.663.0%Book Value Per Share$13.98$13.295.2%Dividend Yield*3.14%2.66%18.0%ROAA0.71%0.75%(5.3%)Efficiency Ratio73.83%75.62%(2.4%)Non-Performing Assets$4,326$3,89611.0%Dollars in Thousands(except per share amounts)2020 FQ12019 FQ1QoQ ChangeAssets$628,326$554,49713.3%Net Loans$473,354$401,04718.0%Deposits$501,199$440,54013.8%Net Income$731$898(18.6%)Basic Earnings Per Share $0.12$0.15(20.0%)Book Value Per Share$14.16$13.504.9%Dividend Yield*4.57%3.04%50.3%ROAA0.47%0.66%(28.8%)Efficiency Ratio74.71%78.08%(4.3%)Non-Performing Assets$4,696$4,11614.1%
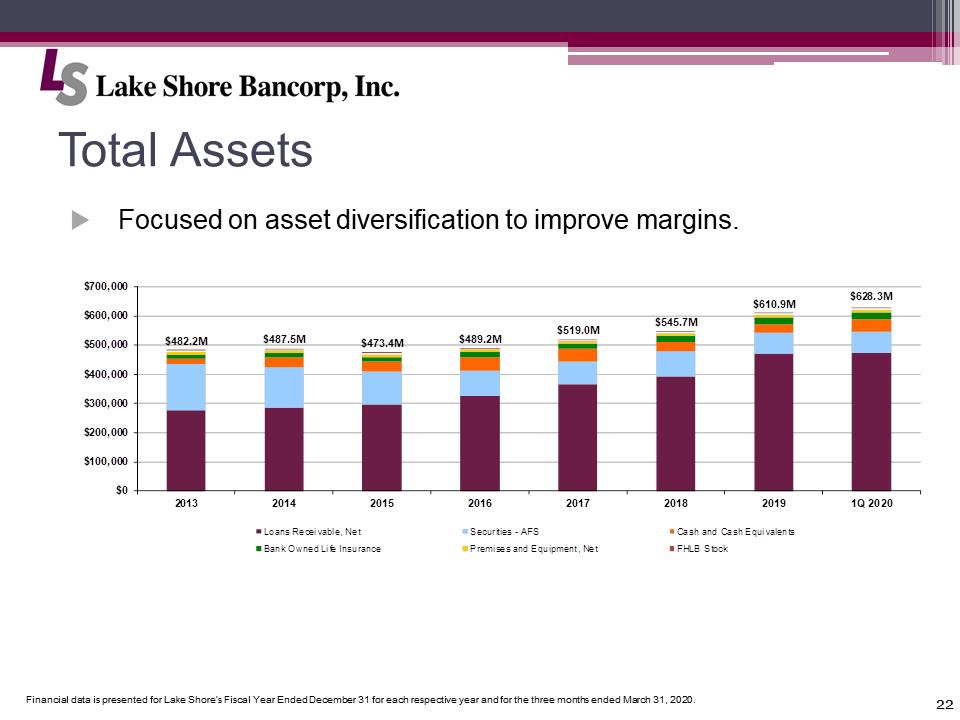 22 Total Assets LS Bancorp JPG.pngFinancial data is presented for Lake Shore’s Fiscal Year Ended December 31 for each respective year and for the three months ended March 31, 2020. Focused on asset diversification to improve margins. $482.2M$487.5M$473.4M$489.2M$519.0M$545.7M$610.9M$628.3M$0$100,000$200,000$300,000$400,000$500,000$600,000$700,00020132014201520162017201820191Q 2020Loans Receivable, NetSecurities - AFSCash and Cash EquivalentsBank Owned Life InsurancePremises and Equipment, NetFHLB Stock
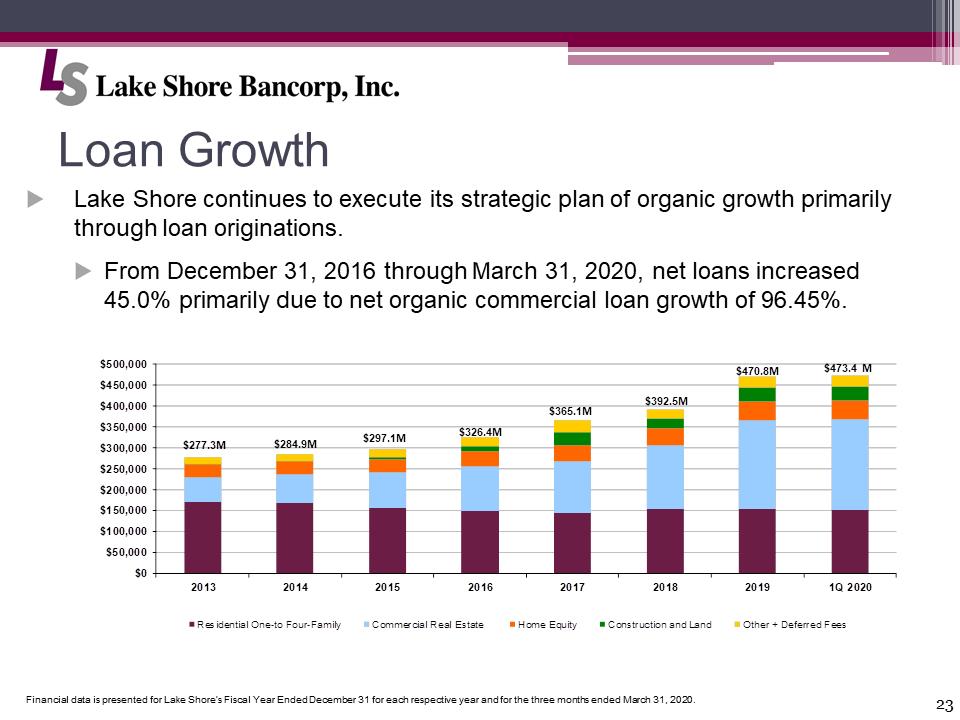 23 Loan Growth LS Bancorp JPG.pngFinancial data is presented for Lake Shore’s Fiscal Year Ended December 31 for each respective year and for the three months ended March 31, 2020. $277.3M$284.9M$297.1M$326.4M$365.1M$392.5M$470.8M$473.4 M$0$50,000$100,000$150,000$200,000$250,000$300,000$350,000$400,000$450,000$500,00020132014201520162017201820191Q 2020Residential One-to Four-FamilyCommercial Real EstateHome EquityConstruction and LandOther + Deferred FeesLake Shore continues to execute its strategic plan of organic growth primarily through loan originations. From December 31, 2016 through March 31, 2020, net loans increased 45.0% primarily due to net organic commercial loan growth of 96.45%.
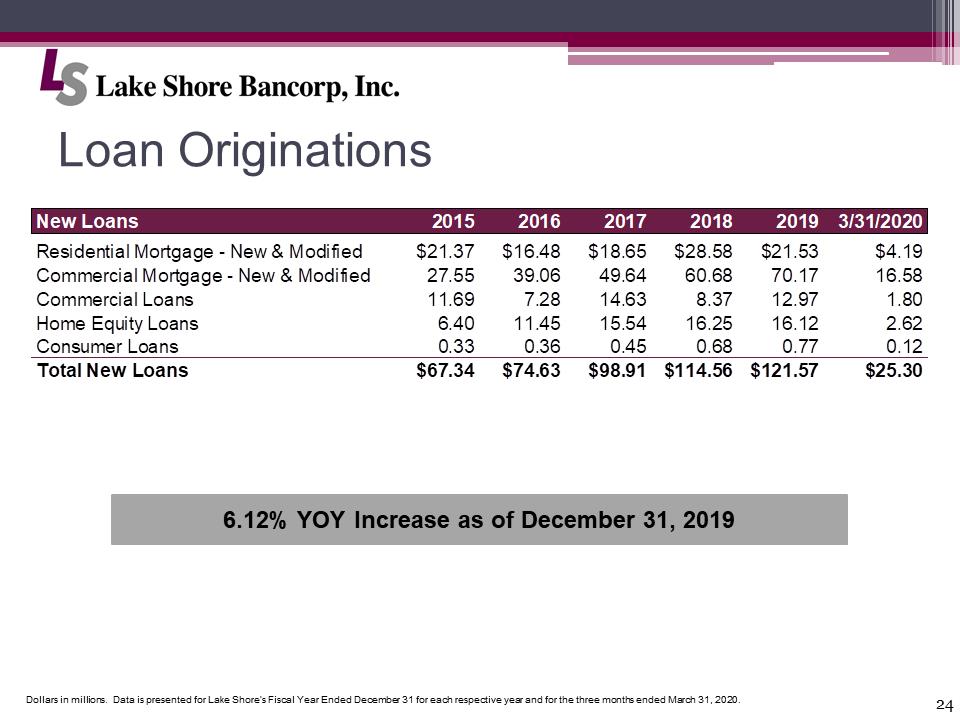 24 Loan Originations LS Bancorp JPG.pngDollars in millions. Data is presented for Lake Shore’s Fiscal Year Ended December 31 for each respective year and for the three months ended March 31, 2020. 6.12% YOY Increase as of December 31, 2019 New Loans201520162017201820193/31/2020Residential Mortgage - New & Modified$21.37$16.48$18.65$28.58$21.53$4.19Commercial Mortgage - New & Modified27.5539.0649.6460.6870.1716.58Commercial Loans11.697.2814.638.3712.971.80Home Equity Loans6.4011.4515.5416.2516.122.62Consumer Loans0.330.360.450.680.770.12Total New Loans$67.34$74.63$98.91$114.56$121.57$25.30
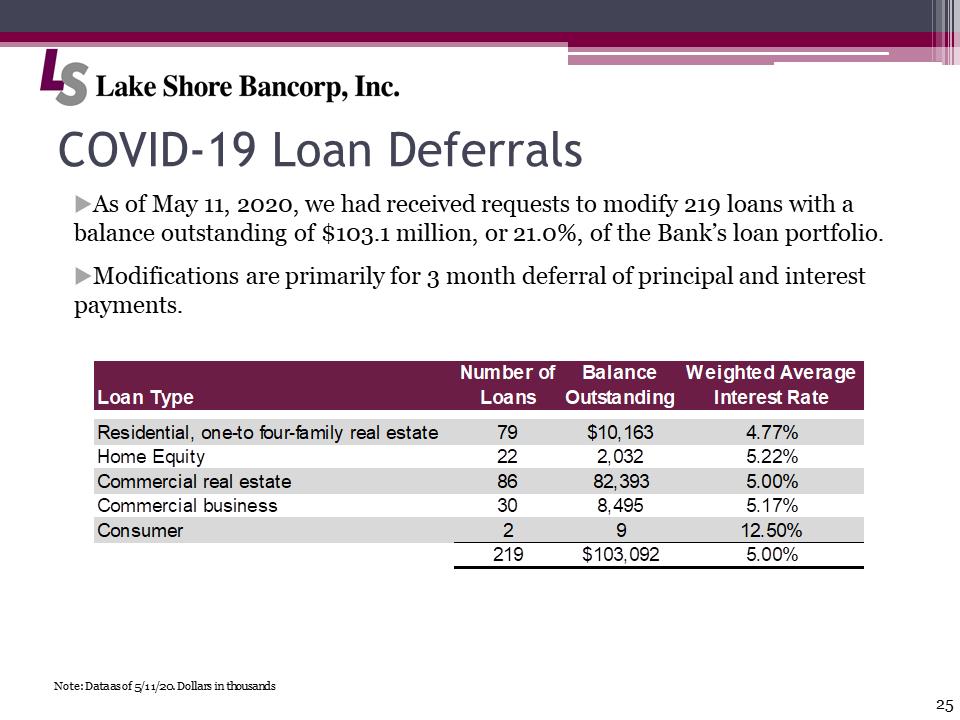 25 COVID-19 Loan Deferrals LS Bancorp JPG.pngAs of May 11, 2020, we had received requests to modify 219 loans with a balance outstanding of $103.1 million, or 21.0%, of the Bank’s loan portfolio. Modifications are primarily for 3 month deferral of principal and interest payments. Note: Data as of 5/11/20. Dollars in thousands
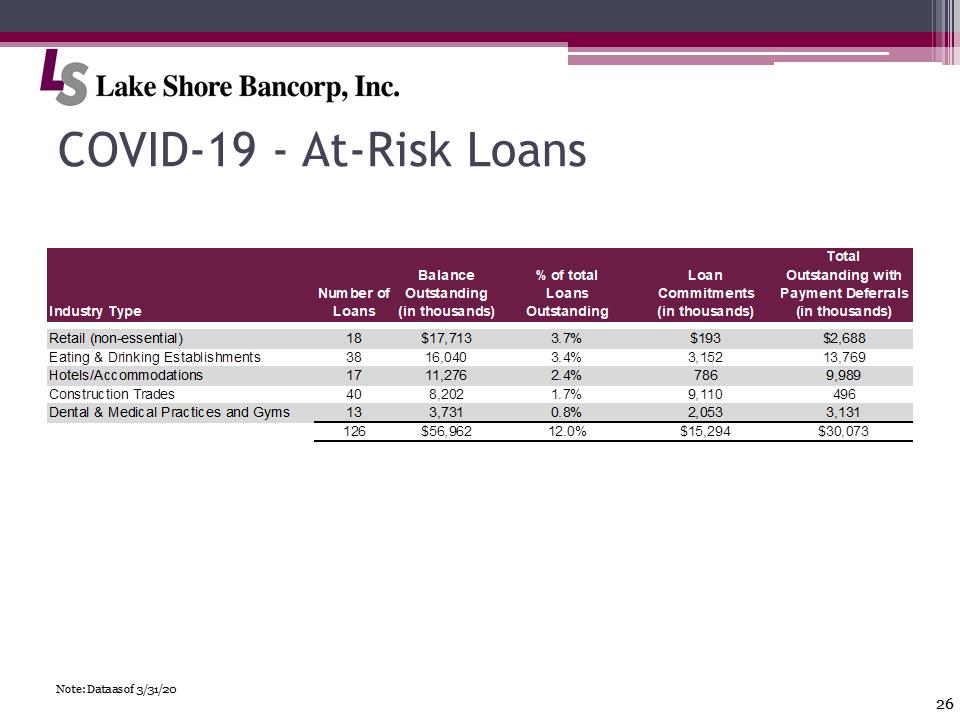 26 COVID-19 - At-Risk Loans LS Bancorp JPG.pngNote: Data as of 3/31/20
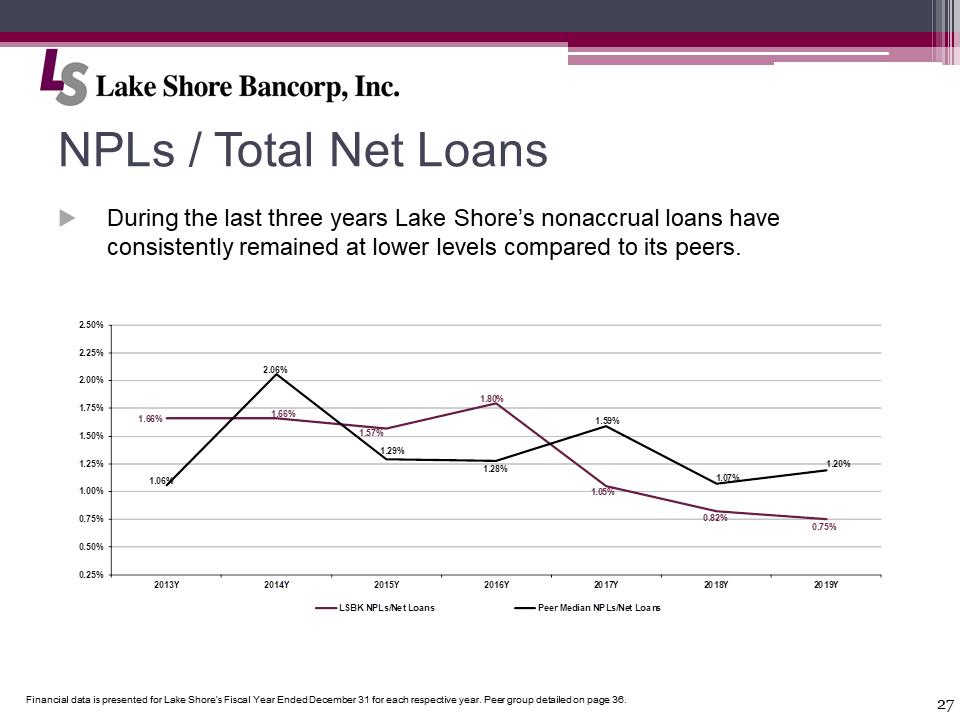 27 NPLs / Total Net Loans LS Bancorp JPG.pngDuring the last three years Lake Shore’s nonaccrual loans have consistently remained at lower levels compared to its peers. Financial data is presented for Lake Shore’s Fiscal Year Ended December 31 for each respective year. Peer group detailed on page 36. 1.66%1.66%1.57%1.80%1.05%0.82%0.75%1.06%2.06%1.29%1.28%1.59%1.07%1.20%0.25%0.50%0.75%1.00%1.25%1.50%1.75%2.00%2.25%2.50%2013Y2014Y2015Y2016Y2017Y2018Y2019YLSBK NPLs/Net LoansPeer Median NPLs/Net Loans
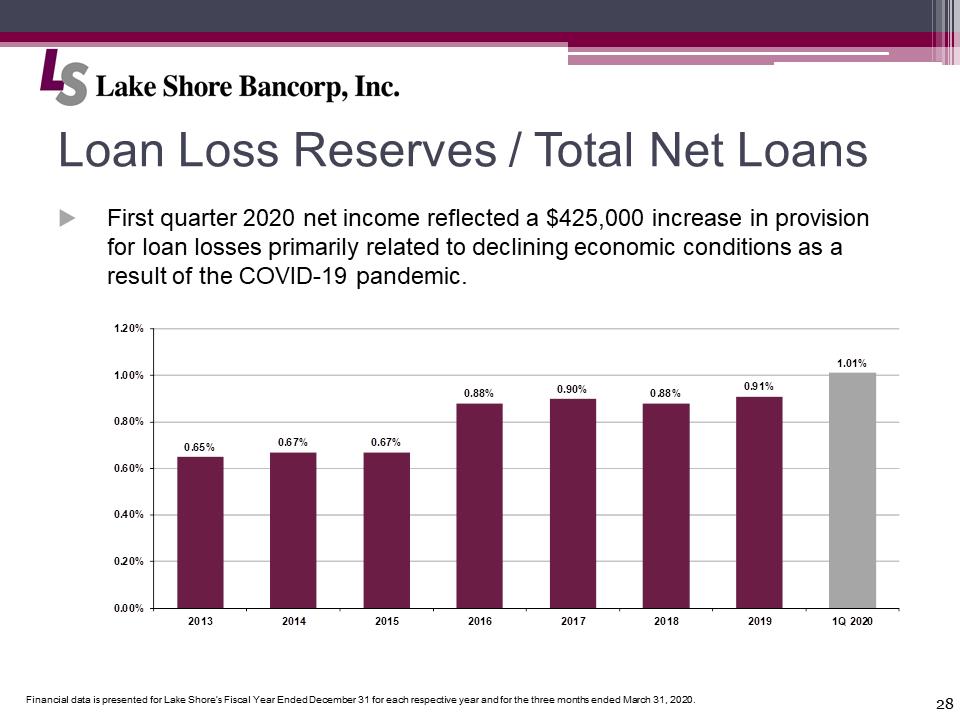 28 Loan Loss Reserves / Total Net Loans LS Bancorp JPG.pngFinancial data is presented for Lake Shore’s Fiscal Year Ended December 31 for each respective year and for the three months ended March 31, 2020. 0.65%0.67%0.67%0.88%0.90%0.88%0.91%1.01%0.00%0.20%0.40%0.60%0.80%1.00%1.20%20132014201520162017201820191Q 2020First quarter 2020 net income reflected a $425,000 increase in provision for loan losses primarily related to declining economic conditions as a result of the COVID-19 pandemic.
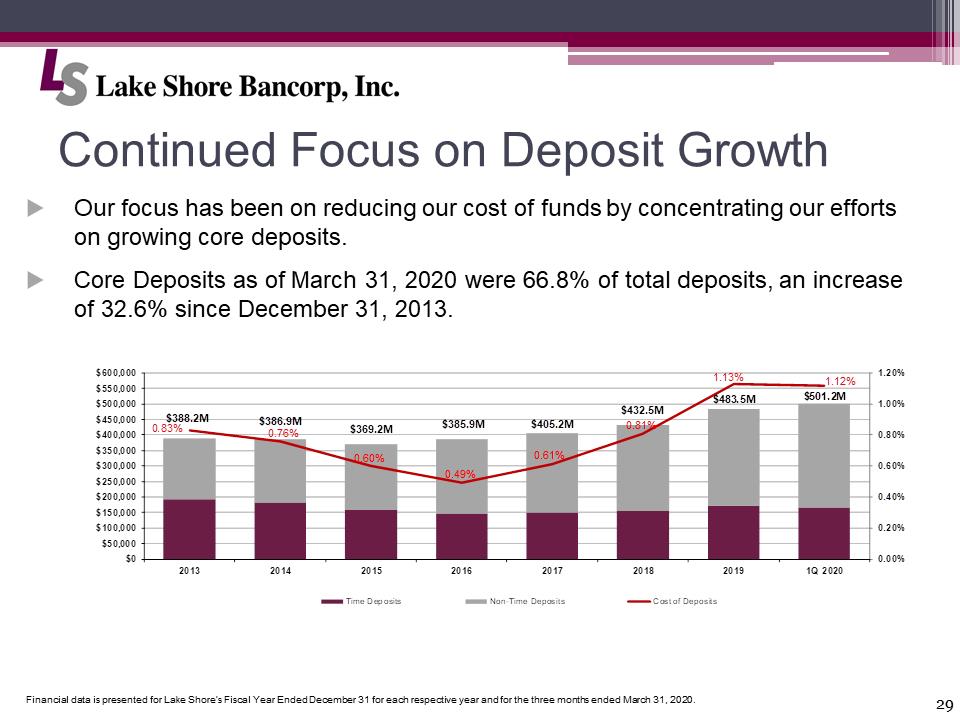 29 Continued Focus on Deposit Growth LS Bancorp JPG.pngFinancial data is presented for Lake Shore’s Fiscal Year Ended December 31 for each respective year and for the three months ended March 31, 2020. $388.2M$386.9M$369.2M$385.9M$405.2M$432.5M$483.5M$501.2M0.83%0.76%0.60%0.49%0.61%0.81%1.13%1.12%0.00%0.20%0.40%0.60%0.80%1.00%1.20%$0$50,000$100,000$150,000$200,000$250,000$300,000$350,000$400,000$450,000$500,000$550,000$600,00020132014201520162017201820191Q 2020Time DepositsNon-Time DepositsCost of DepositsOur focus has been on reducing our cost of funds by concentrating our efforts on growing core deposits. Core Deposits as of March 31, 2020 were 66.8% of total deposits, an increase of 32.6% since December 31, 2013.
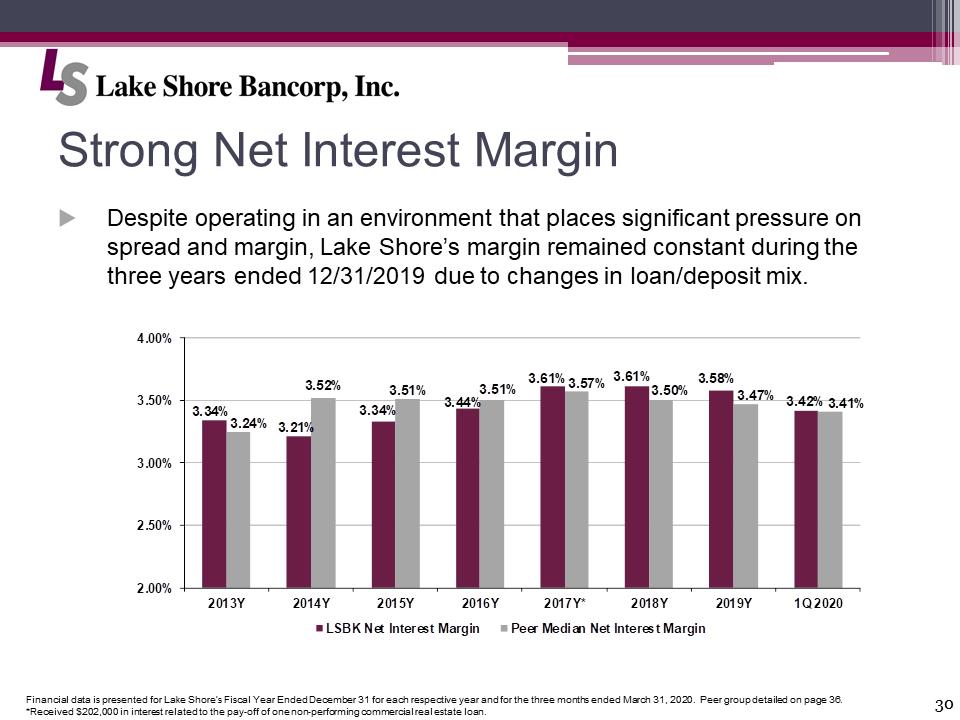 30 Strong Net Interest Margin LS Bancorp JPG.pngFinancial data is presented for Lake Shore’s Fiscal Year Ended December 31 for each respective year and for the three months ended March 31, 2020. Peer group detailed on page 36. *Received $202,000 in interest related to the pay-off of one non-performing commercial real estate loan. Despite operating in an environment that places significant pressure on spread and margin, Lake Shore’s margin remained constant during the three years ended 12/31/2019 due to changes in loan/deposit mix. 3.34%3.21%3.34%3.44%3.61%3.61%3.58%3.42%3.24%3.52%3.51%3.51%3.57%3.50%3.47%3.41%2.00%2.50%3.00%3.50%4.00%2013Y2014Y2015Y2016Y2017Y*2018Y2019Y1Q 2020LSBK Net Interest MarginPeer Median Net Interest Margin
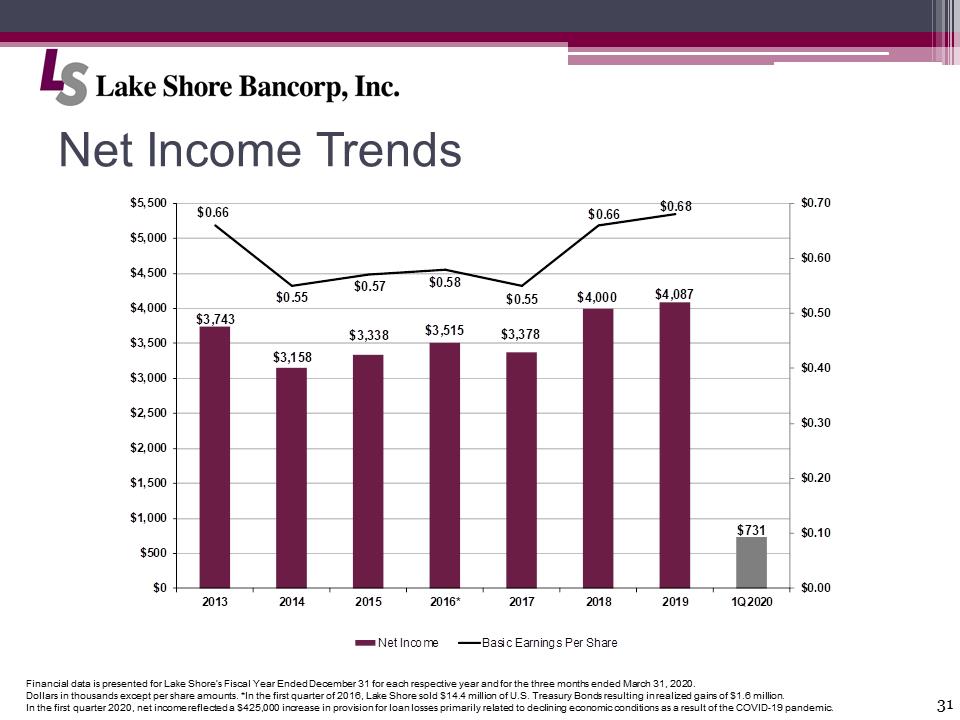 31 Net Income Trends LS Bancorp JPG.pngFinancial data is presented for Lake Shore’s Fiscal Year Ended December 31 for each respective year and for the three months ended March 31, 2020. Dollars in thousands except per share amounts. *In the first quarter of 2016, Lake Shore sold $14.4 million of U.S. Treasury Bonds resulting in realized gains of $1.6 million. In the first quarter 2020, net income reflected a $425,000 increase in provision for loan losses primarily related to declining economic conditions as a result of the COVID-19 pandemic. $3,743$3,158$3,338$3,515$3,378$4,000$4,087$731$0.66$0.55$0.57$0.58$0.55$0.66$0.68$0.00$0.10$0.20$0.30$0.40$0.50$0.60$0.70$0$500$1,000$1,500$2,000$2,500$3,000$3,500$4,000$4,500$5,000$5,5002013201420152016*2017201820191Q2020Net IncomeBasic Earnings Per Share
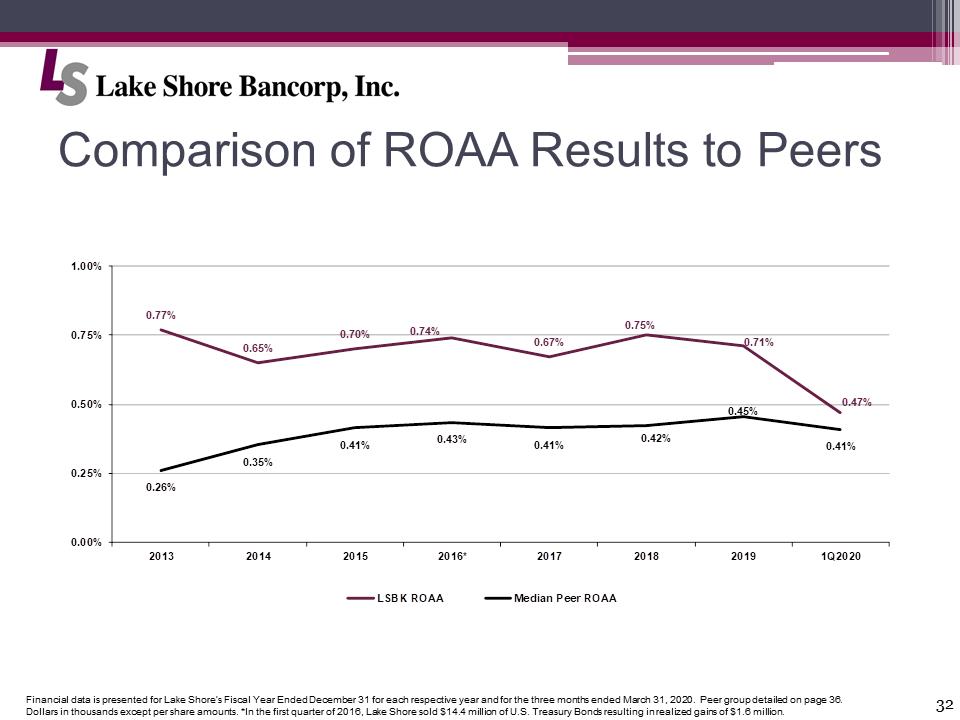 32 Comparison of ROAA Results to Peers LS Bancorp JPG.pngFinancial data is presented for Lake Shore’s Fiscal Year Ended December 31 for each respective year and for the three months ended March 31, 2020. Peer group detailed on page 36. Dollars in thousands except per share amounts. *In the first quarter of 2016, Lake Shore sold $14.4 million of U.S. Treasury Bonds resulting in realized gains of $1.6 million. 0.77%0.65%0.70%0.74%0.67%0.75%0.71%0.47%0.26%0.35%0.41%0.43%0.41%0.42%0.45%0.41%0.00%0.25%0.50%0.75%1.00%2013201420152016*2017201820191Q2020LSBK ROAAMedian Peer ROAA
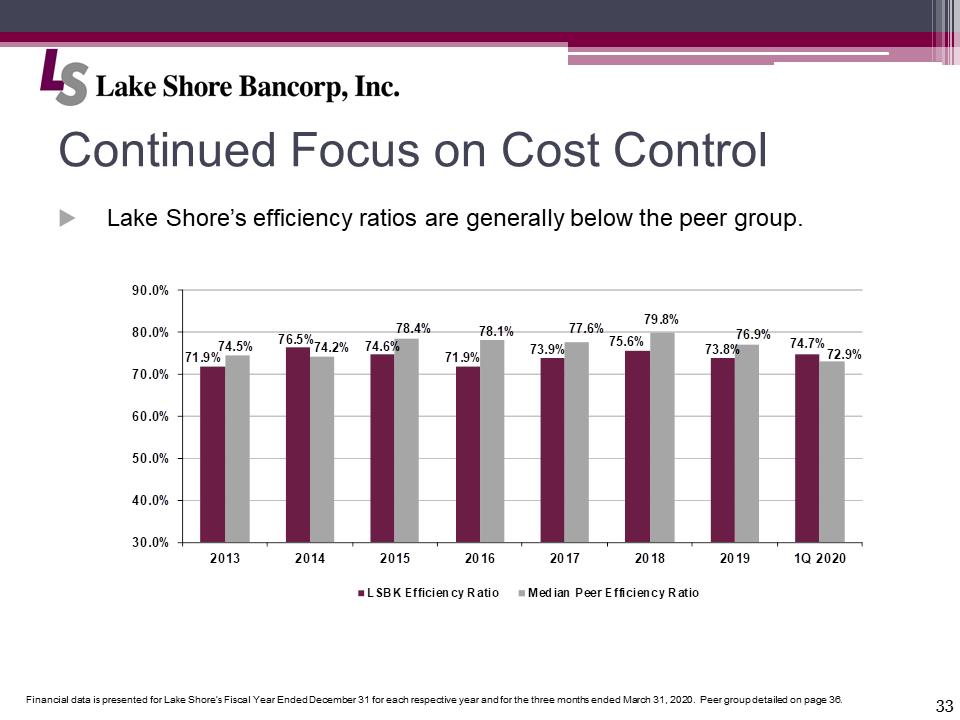 33 Continued Focus on Cost Control LS Bancorp JPG.pngFinancial data is presented for Lake Shore’s Fiscal Year Ended December 31 for each respective year and for the three months ended March 31, 2020. Peer group detailed on page 36. Lake Shore’s efficiency ratios are generally below the peer group. 71.9%76.5%74.6%71.9%73.9%75.6%73.8%74.7%74.5%74.2%78.4%78.1%77.6%79.8%76.9%72.9%30.0%40.0%50.0%60.0%70.0%80.0%90.0%20132014201520162017201820191Q 2020LSBK Efficiency RatioMedian Peer Efficiency Ratio
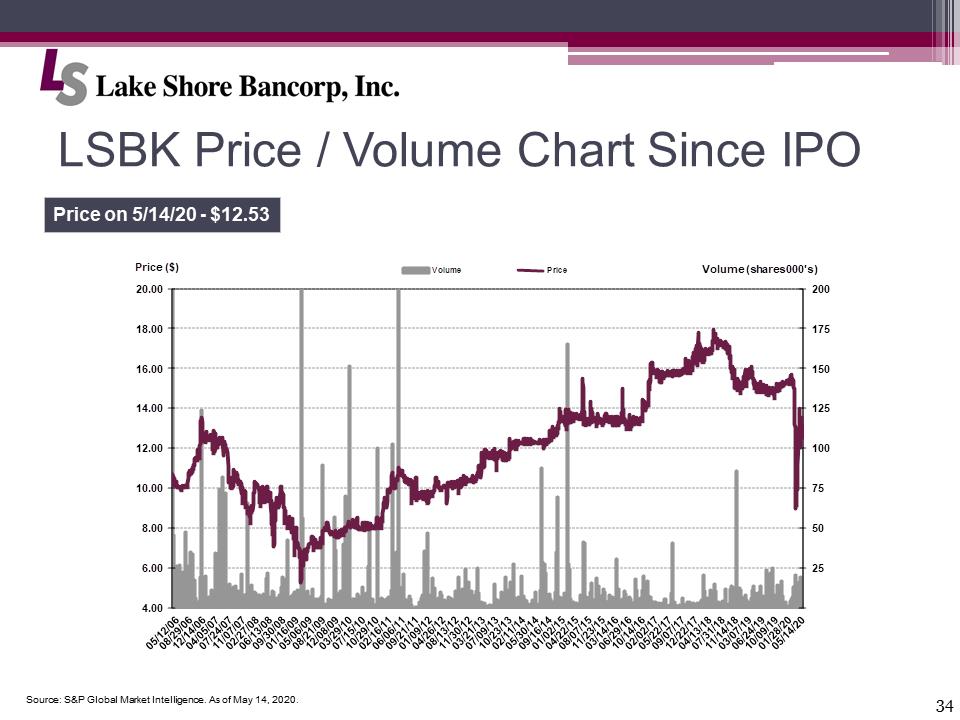 34 LSBK Price / Volume Chart Since IPO LS Bancorp JPG.pngSource: S&P Global Market Intelligence. As of May 14, 2020. Price on 5/14/20 - $12.53 4.006.008.0010.0012.0014.0016.0018.0020.00255075100125150175200Price ($)Volume (shares 000's)VolumePrice
 35 LS Bancorp JPG.pngQUESTIONS & ANSWERS
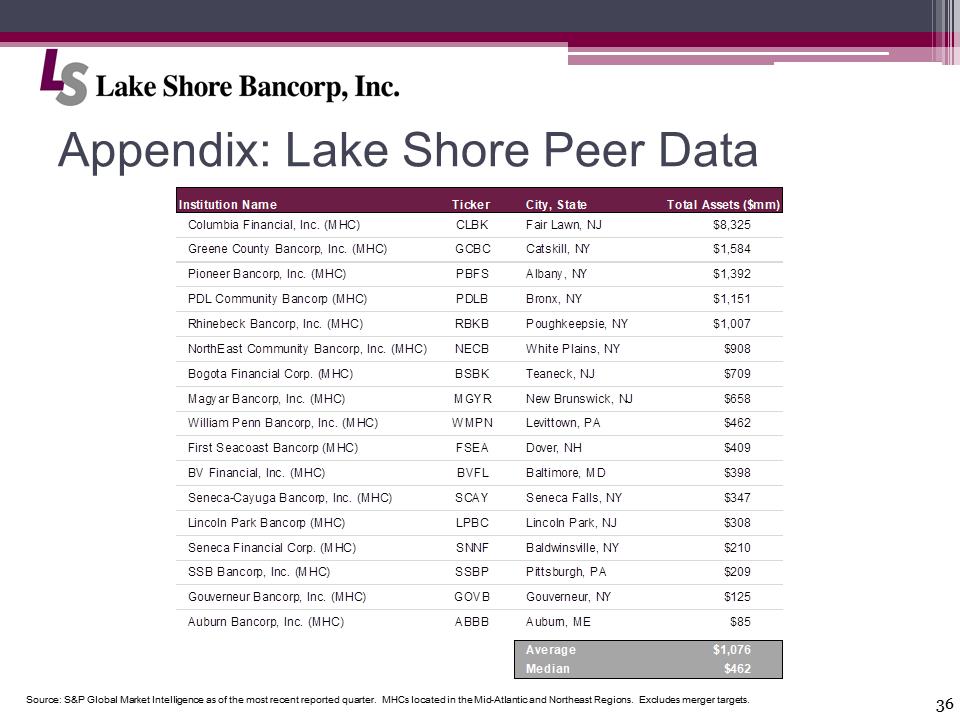 36 LS Bancorp JPG.pngAppendix: Lake Shore Peer Data Source: S&P Global Market Intelligence as of the most recent reported quarter. MHCs located in the Mid-Atlantic and Northeast Regions. Excludes merger targets. Institution Name Ticker City, State Total Assets ($mm)Columbia Financial, Inc. (MHC)CLBKFair Lawn, NJ$8,325Greene County Bancorp, Inc. (MHC)GCBCCatskill, NY$1,584Pioneer Bancorp, Inc. (MHC)PBFSAlbany, NY$1,392PDL Community Bancorp (MHC)PDLBBronx, NY$1,151Rhinebeck Bancorp, Inc. (MHC)RBKBPoughkeepsie, NY$1,007NorthEast Community Bancorp, Inc. (MHC)NECBWhite Plains, NY$908Bogota Financial Corp. (MHC)BSBKTeaneck, NJ$709Magyar Bancorp, Inc. (MHC)MGYRNew Brunswick, NJ$658William Penn Bancorp, Inc. (MHC)WMPNLevittown, PA$462First Seacoast Bancorp (MHC)FSEADover, NH$409BV Financial, Inc. (MHC)BVFLBaltimore, MD$398Seneca-Cayuga Bancorp, Inc. (MHC)SCAYSeneca Falls, NY$347Lincoln Park Bancorp (MHC)LPBCLincoln Park, NJ$308Seneca Financial Corp. (MHC)SNNFBaldwinsville, NY$210SSB Bancorp, Inc. (MHC)SSBPPittsburgh, PA$209Gouverneur Bancorp, Inc. (MHC)GOVBGouverneur, NY$125Auburn Bancorp, Inc. (MHC)ABBBAuburn, ME$85Average$1,076Median$462
 37 LS Bancorp JPG.pngLake Shore, MHC Annual Meeting of Members Call to Order Introduction of Proposal to Elect Directors Tabulation of Votes Adjournment