Attached files
| file | filename |
|---|---|
| EX-32.2 - CERTIFICATION - HyreCar Inc. | f10k2019ex32-2_hyrecarinc.htm |
| EX-32.1 - CERTIFICATION - HyreCar Inc. | f10k2019ex32-1_hyrecarinc.htm |
| EX-31.2 - CERTIFICATION - HyreCar Inc. | f10k2019ex31-2_hyrecarinc.htm |
| EX-31.1 - CERTIFICATION - HyreCar Inc. | f10k2019ex31-1_hyrecarinc.htm |
| EX-23.1 - CONSENT OF DBBMCKENNON, INDEPENDENT REGISTERED PUBLIC ACCOUNTING FIRM - HyreCar Inc. | f10k2019ex23-1_hyrecarinc.htm |
| EX-4.1 - DESCRIPTION OF THE REGISTRANT'S SECURITIES - HyreCar Inc. | f10k2019ex4-1_hyrecarinc.htm |
UNITED STATES
SECURITIES AND EXCHANGE COMMISSION
Washington, D.C. 20549
FORM 10-K
(Mark one)
☒ Annual Report Pursuant to Section 13 or 15(d) of the Securities Exchange Act of 1934
For the fiscal year ended December 31, 2019
Or
☐ Transition Report Pursuant to Section 13 or 15(d) of the Securities Exchange Act of 1934
For the transition period from __________ to __________
Commission file number 001-38561
HyreCar Inc.
(Exact name of Registrant as specified in its charter)
| Delaware | 47-2480487 | |
| (State or other jurisdiction of | (I.R.S. Employer | |
| incorporation or organization) | Identification No.) | |
| 355 South Grand Avenue, Suite 1650 | ||
| Los Angeles, CA | 90071 | |
| (Address of principal executive offices) | (Zip Code) |
Registrant’s telephone number, including area code: (888) 688-6769
Securities registered pursuant to Section 12(b) of the Act:
| Title of Each Class | Trading Symbol(s) | Name of Each Exchange on Which Registered | ||
| Common Stock, par value $0.00001 per share | HYRE | The Nasdaq Stock Market LLC |
Securities registered pursuant to Section 12(g) of the Act: None
Indicate by check mark if the registrant is a well-known seasoned issuer, as defined in Rule 405 of the Securities Act. Yes ☐ No ☒
Indicate by check mark if the registrant is not required to file reports pursuant to Section 13 or Section 15(d) of the Act. Yes ☐ No ☒
Indicate by check mark whether the registrant: (1) has filed all reports required to be filed by Section 13 or 15(d) of the Securities Exchange Act of 1934 during the preceding 12 months (or for such shorter period that the registrant was required to file such reports) and (2) has been subject to such filing requirements for the past 90 days. Yes ☒ No ☐
Indicate by check mark whether the registrant has submitted electronically every Interactive Data File required to be submitted pursuant to Rule 405 of Regulation S-T (§232.405 of this chapter) during the preceding 12 months (or for such shorter period that the registrant was required to submit such files). Yes ☒ No ☐
Indicate by check mark if disclosure of delinquent filers pursuant to Item 405 of Regulation S-K is not contained herein, and will not be contained, to the best of the registrant’s knowledge, in definitive proxy or information statements incorporated by reference in Part III of this Form 10-K or any amendment to this Form 10-K. ☐
Indicate by check mark whether the registrant is a large accelerated filer, an accelerated filer, a non-accelerated filer or a smaller reporting company. See the definitions of “large accelerated filer,” “accelerated filer,” and “smaller reporting company” in Rule 12b-2 of the Exchange Act. (Check one):
| Large accelerated filer ☐ | Accelerated filer ☐ | Non-accelerated filer ☒ | Smaller reporting company ☒ |
| Emerging growth company ☒ |
If an emerging growth company, indicate by check mark if the registrant has elected not to use the extended transition period for complying with any new or revised financial accounting standards provided pursuant to Section 13(a) of the Exchange Act. ☐
Indicate by check mark whether the registrant is a shell company (as defined in Rule 12b-2 of the Act). Yes ☐ No ☒
The aggregate market value of the registrant’s common stock held by non-affiliates of the registrant was $42,782,523 as of June 28, 2019, the last business day of the registrants most recently completed second quarter based on the closing price of the common stock on the Nasdaq Capital Market. Solely for purposes of this disclosure, shares of common stock held by executive officers and directors of the registrant as of such date have been excluded because such persons may be deemed to be affiliates. This determination of executive officers and directors as affiliates is not necessarily a conclusive determination for any other purposes.
16,468,335 shares of common stock were issued and outstanding as of April 14, 2020.
DOCUMENTS INCORPORATED BY REFERENCE
Portions of the Registrant’s definitive proxy statement relating to its 2020 annual meeting of stockholders (the “2020 Proxy Statement”) are incorporated by reference into Part III of this Annual Report on Form 10-K where indicated. The 2020 Proxy Statement will be filed with the Securities and Exchange Commission (the “SEC”) within 120 days after the end of the fiscal year to which this report relates.
TABLE OF CONTENTS
-i-
This Annual Report on Form 10-K contains forward-looking statements which are made pursuant to the safe harbor provisions of Section 27A of the Securities Act of 1933, as amended (the “Securities Act”), and Section 21E of the Securities Exchange Act of 1934, as amended (the “Exchange Act”). These statements may be identified by such forward-looking terminology as “may,” “will,” “should,” “expects,” “intends,” “plans,” “anticipates,” “believes,” “estimates,” “predicts,” “potential,” “continue” or the negative of these terms or other comparable terminology. Our forward-looking statements are based on a series of expectations, assumptions, estimates and projections about our company, are not guarantees of future results or performance and involve substantial risks and uncertainty. We may not actually achieve the plans, intentions or expectations disclosed in these forward-looking statements. Actual results or events could differ materially from the plans, intentions and expectations disclosed in these forward-looking statements. Our business and our forward-looking statements involve substantial known and unknown risks and uncertainties, including the risks and uncertainties inherent in our statements regarding:
| ● | our ability to add new customers or increase listings or rentals on our platform; |
| ● | our ability to expand and train our sales team; |
| ● | the potential benefits of and our ability to maintain our relationships with ridesharing companies, and establish or maintain future collaborations or strategic relationships or obtain additional funding; |
| ● | our marketing capabilities and strategy; |
| ● | our ability to maintain a cost-effective insurance program; |
| ● | our ability to retain the continued service of our key professionals and to identify, hire and retain additional qualified professionals; |
| ● | our competitive position, and developments and projections relating to our competitors and our industry; |
| ● | our estimates regarding expenses, future revenue, capital requirements and needs for additional financing; and |
| ● | the impact of laws and regulations. |
All of our forward-looking statements are as of the date of this Annual Report on Form 10-K only. In each case, actual results may differ materially from such forward-looking information. We can give no assurance that such expectations or forward-looking statements will prove to be correct. An occurrence of, or any material adverse change in, one or more of the risk factors or risks and uncertainties referred to in this Annual Report on Form 10-K or included in our other public disclosures or our other periodic reports or other documents or filings filed with or furnished to the SEC could materially and adversely affect our business, prospects, financial condition and results of operations. Except as required by law, we do not undertake or plan to update or revise any such forward-looking statements to reflect actual results, changes in plans, assumptions, estimates or projections or other circumstances affecting such forward-looking statements occurring after the date of this Annual Report on Form 10-K, even if such results, changes or circumstances make it clear that any forward-looking information will not be realized. Any public statements or disclosures by us following this Annual Report on Form 10-K that modify or impact any of the forward-looking statements contained in this Annual Report on Form 10-K will be deemed to modify or supersede such statements in this Annual Report on Form 10-K.
This Annual Report on Form 10-K may include market data and certain industry data and forecasts, which we may obtain from internal company surveys, market research, consultant surveys, publicly available information, reports of governmental agencies and industry publications, articles and surveys. Industry surveys, publications, consultant surveys and forecasts generally state that the information contained therein has been obtained from sources believed to be reliable, but the accuracy and completeness of such information is not guaranteed. While we believe that such studies and publications are reliable, we have not independently verified market and industry data from third-party sources.
-ii-
Throughout this Annual Report on Form 10-K, the “Company,” “HyreCar,” “we,” “us,” and “our” refers to HyreCar Inc. and “our board of directors” or our “Board” refers to the board of directors of HyreCar Inc.
Overview
HyreCar Inc. was formed as a corporation in the State of Delaware on November 24, 2014. Our founders identified the need for a car-sharing platform for individuals who wanted to drive for ride-sharing companies such as Uber Technologies Inc. (“Uber”) and Lyft, Inc. (“Lyft”), but whose automobiles could not meet the standards imposed by the ride-sharing companies. For example, Uber maintains strict guidelines regarding the types of cars a driver can use. Although guidelines relating to cars can differ by state, in general the use of two door coupes, motorcycles and cars that are 12 years or older are excluded. Our founders, before deciding to purchase qualifying sedans that met Uber’s strict guidelines, first inquired as to whether there were any rental options available from Uber that would allow them to drive for the ride-sharing platform. To their surprise, there were no rental options available, other than a shadow industry of individuals renting cars to one another.
HyreCar is a car-sharing marketplace that allows car owners (collectively, “Owners”) to rent their idle cars to ride-sharing service drivers (collectively, “Drivers”). By sourcing vehicles from individual Owners, part-time Drivers may easily enter and exit the market and our business model allows us to satisfy fluctuating transportation demand in cities around the United States by matching Owners and Drivers. In 2019 we began to diversify our vehicle supply to include commercial owners of vehicles including car dealerships and fleet owners, which has helped us to increase our activity levels later in the year, and now commercial vehicles account for more than three-quarters of the rental days on our platform.
Our business is based on a proprietary car-sharing marketplace developed to (i) onboard Owners and Drivers, (ii) facilitate the matching of Owners and Drivers and (iii) log rental activity for Owners and Drivers. All transactions related to the rental (including, but not limited to, background checks, rentals, deposits and insurance costs) are run securely through the HyreCar platform. Drivers and Owners access their rental or car dashboards through a unique login. Drivers can easily initiate, terminate or extend a rental through the platform while Owners can manage their car or fleet of cars through the platform.
We believe we have a competitive advantage with our commercial automobile insurance policy that covers both Owners and Drivers. The policy is specifically designed to cover the period of time in which a Driver is operating an Owner’s vehicle while not actively operating a vehicle on a ride-sharing platform, such as Uber or Lyft. During the periods when Drivers are actively operating on a ride-sharing platform, the insurance subordinates to the state mandated insurance provided by the ride-sharing business. To our knowledge, we are the only provider of this car-matching service which is made possible by this unique insurance product.
To date, the majority of our growth has been from the dealer sales efforts to build sustainable vehicle supply focused on key markets through the United States. Our car supply has changed from mostly individuals which is where we started to now more the three quarters of our car supply and rental days coming from the commercial side of the business – consisting primarily of dealers and large fleet owners. We have seen a particular emphasis on states in the southern portion of the United States in late 2019, and now the majority of our daily rental days come from a handful of states in the Southern United States including California, Georgia, Maryland and Texas. We have also increased driver leads matched in those same kay markets, which has been achieved through organic search traffic and paid search advertising. Going forward we will direct advertising dollars strategically because we believe that online channels and offline brand awareness will provide substantial opportunities for growth.
-1-
Industry and Market Opportunities
Our company was founded to capitalize on a combination of two growth markets: ridesharing (an industry led by Uber and Lyft) and car-sharing (an industry led by companies such as Turo, Inc. and ZipCar, Inc.). Our customers are the Drivers that use our car-sharing platform to rent a car and then use that car to make money driving for either Uber or Lyft. Finding enough cars and drivers to meet demand has been a problem for ride-sharing companies. Recently we have expanded our business to add additional delivery services with companies like Instacart and Postmates,
The transportation industry represents a massive market. In the United States alone, consumer expenditures on transportation were approximately $1.3 trillion in 2019, and transportation was the second largest household expenditure after housing and was almost twice as large as healthcare and three times as large as entertainment. We believe we are still in the very early phases of capturing this massive opportunity. In 2019, ridesharing accounted for just seven percent of total vehicle miles travelled in the United States and in a 2016 survey, 57% of U.S. respondents who used sharing services said that well-priced and convenient offerings could cause them to give up ownership altogether.
We have added over 25,000 Drivers, matching them with Owner vehicles that have been used on the Uber and Lyft platforms over the past several years. During the years ended December 31, 2019 and 2018, we added approximately 11,000 and 7,000 new Drivers, respectively, into cars so that they could drive for Uber and Lyft. These numbers represent an equivalent 157.1% growth rate in new drivers onto the HyreCar platform year over year.
Ride-sharing Industry (Uber and Lyft)
The growth in ridesharing over the past few years has kicked off a transportation revolution. Smart phones are now used as ride hailing apps, transactions are processed seamlessly through online platforms and transportation as a service is becoming more and more personalized. The industry has experienced tremendous traction. According to a July 2016 post on TechCrunch, it took Uber six years, to December 2015, to complete a billion rides and by the end of 2019, Uber announced that it had completed its two-billionth ride.
Transportation Network Companies (“TNCs”) like Uber and Lyft have reported high demand from Drivers but many of these Drivers do not own a car that qualifies for their platforms. Uber reported that it had 3.9 million drivers and Lyft reported that it had 1.9 million drivers in North America at the end of 2018. In 2016, a spokesperson for Uber estimated that approximately 10% to 15% of their potential drivers/partners do not own a qualifying car. Further, Lyft estimates that there are approximately 60,000 people in the city of Chicago alone that want to drive for their platform, but do not currently own a qualifying car, and General Motors also estimates that there are approximately 160,000 potential drivers in the DC Metro area, Baltimore, Chicago and Boston who do not own a qualifying car.
Accordingly, TNCs are actively taking steps to satisfy their driver demand by setting up programs designed to get eligible drivers into qualified cars, including such programs as the Enterprise/Uber partnership, the Lyft Express Driver partnership with Hertz and Pep Boys and the General Motor’s Maven program. These programs serve as a validation that there is a healthy market to pair eligible drivers with qualified cars.
Food and Package Industry (Instacart and Grubhub)
With the growth in food, package and grocery delivery services such as Uber Eats, Postmates, Grubub and Instacart, Hyrecar expects driver demand for services like HyreCar to continue into 2021. With expected revenues for all food delivery companies to top $123B in 2020 and expectations to increase to $164B by 2024. Drivers participating into the Gig economy are diversifying their sources of income across many different TNCs and delivery services. Over 61% of all HyreCar drivers are active drivers for both rideshare and delivery service companies. The package and food delivery companies have seen tremendous demand in the first quarter of 2020, and expect continued growth into 2021 as more and more households move away from traditional in store purchase to online and mobile purchases for the same goods.
Car-sharing Industry
Shared mobility market began to rapidly develop around 2010-2011 when the total number of its users exceeded one million. In 2017, there were already around 10 million people using this type of service, and according to a study by Frost & Sullivan, by 2025 their numbers will reach 36 million, maintaining the annual growth rate of 16.4%. Global Market Insights forecasts the value of the global car sharing market in 2024 at $11 billion. At present, the leading shared mobility markets are the U.S. and Western Europe, while experts predict that Asia will experience the fastest growth in this field. HyreCar will be able to capitalize on this opportunity as existing demand from traditional taxi and public transportation options is transferred to shared transportation. Further, growth is expected from this opportunity as the accelerating trend of the mass ease-of-use and availability of shared transportation permanently shifts driving habits away from personal vehicle ownership. Evidence of this decline, while not yet a national trend, can be seen in large cities as vehicle ownership is beginning to decline. Longer term, we envision a potential impact on the auto industry as a whole from a subset of people permanently changing their driving habits and selling their cars entirely in favor of using shared transportation.
-2-
Competition
The key differentiator between HyreCar and our competitors is our asset light model, which allows us to connect excess car inventory to drivers without actually owning or managing the vehicles. This allows our prices to be competitive with other vehicle solutions because we do not have the monthly vehicle overhead or infrastructure costs that our competitors may have. Other advantages include the following:
| 1. | Pay-As-You-Go: Drivers using our platform are not locked into lengthy lease agreements, monthly contracts or subscription fees. Our payment model is upfront and transparent. While our competitors engage in auto-debiting payment for the rented vehicle from the Drivers’ accounts, regardless of their current account balance, under our platform Drivers pay for the term of rental up-front, extend if they are financially able, and return the rented vehicle whenever they need with no “strings” attached. We are the only company providing this type of fluid and frictionless car transaction for Uber and Lyft drivers. |
| 2. | Convenience: In some cases, drivers are renting a car from their neighbors. They walk down the street, take the keys and go. With Hertz, FlexDrive, Fair or Avis, only one or two retail outlets participate in the Uber and Lyft programs. |
| 3. | Fungibility: For most of HyreCar’s drivers, the ability to use the same car for rideshare and food delivery is an important reason why they choose our platform. Coupled with a comprehensive protection program that includes insurance and other services, drivers are attracted to this unique service not offered by our competition. |
Among vehicle solutions for ride-sharing rentals, there are Hertz, FlexDrive, Fair, Avis and HyreCar. These car rental companies are similar in one way: they operate in the U.S. and provide cars drivers to rent and drive on the Uber or Lyft platform. However, their business models vary widely.
Fair.com (“Fair”) was a very strong competitor starting in mid-2019 after it entered into a vehicle supply partnership with Uber, following Uber’s spring 2019 Initial Public Offering. Fair was offering promotional weekly rates to Uber drivers which presented a competitive threat in certain marketing, particularly in California. The partnership came to an end in February 2020 when Uber announced it was ending this “Fair Go” partnership, and as a result Fair has exited the weekly rental business and began repossessing cars from more than 10,000 drivers mostly in the state of California in March 2020.
A comparative analysis of markets, pricing limitations and age requirements are as follows:
 |
 |
 |
 |
 | |
| Available Markets | Nationwide | ATL, Boston, Chicago, Denver, Los Angeles, Orange County, Miami, New Orleans and the San Francisco Bay Area | ATL, Austin, Houston, Los Angeles, Philadelphia and San Francisco | Primarily California |
Atlanta,
Austin, Boston, Charlotte, Chicago, Cincinnati, Cleveland, Columbus, Dallas, Denver, Houston, Indianapolis, Las Vegas, Los
Angeles, Miami, St. Paul, Nashville, New Jersey, Philadelphia, Pittsburgh, Portland, Raleigh-Durham, San Diego, San Francisco,
Seattle, St Louis and Washington, D.C. |
| Rental Minimum | Minimum 2 days rental | Minimum 7 days rental and can only extend in 7 days increments 3 times then car has to be returned after 28 days for inspection. | Minimum
7 days rental Disqualified from Express Pay and driving bonuses |
Minimum 7 days but you can keep car as long as you want, after 3 days per 100 miles return policy | Minimum 7 days rental |
| Service Limitation | None, a Driver can drive for Lyft, Uber, Uber Eats, DoorDash, Postmates, etc. | Lyft only | Lyft only | Uber only | Uber only |
| Deposit | None | $200 | $250 | $185 | None |
| Average Weekly Rates | Owners set pricing average at $250 per week | $240 per week plus tax and mileage fees | $209 per week, taken directly out of earnings | $185 per week | $150 plus tax for 700 miles or $214 plus tax per week unlimited miles |
| Age Requirement | 21 | 25 | 25 | 21 | 25 |
| Other | Variety of different locations depending on the market to be picked up in 24 hours | Not available at all Hertz locations. Appointments do not always mean vehicles are available, can take weeks. | Pick up at CarMax locations. Must set an appointment day in advance, can take weeks to get into a car. |
Uber cancelled the Fair Go weekly rental partnership in February 2020. | Avis locations, must rent in advance with appointment |
-3-
Our Strengths
Using our website platform or mobile applications (iOS and Android), vehicle Owners can post their cars to our marketplace and Drivers can browse car inventory prior to rental. Once a Driver finds a car, he or she creates a profile, enters his or her personal information and credentials (including, address, city, state, a copy of applicable state issued driver’s license, Uber or Lyft credentials and social security number) and submits a credit card for payment. We then perform a criminal background check, DMV driving record check, Homeland Security Watch-list and Sex Offender database check. HyreCar’s screening criteria is stricter than Uber and Lyft’s background check and we are focused on maintaining a safe user experience and ensuring that all transactions between owners and drivers are processed through a secure web platform. The attraction and vetting of qualified gig economy drivers is a primary reason why commercial automobile businesses around the country are increasingly working with the Company.
Why Drivers Use Our Service
| ● | Attractive Market: Drivers’ ability to earn income by driving for a ride-sharing business. |
| ● | Pay-As-You-Go: Drivers are not locked into long-term lease agreements, long-term monthly payments or subscription fees. |
| ● | Convenience: Drivers can pick up the car from someone close by. Time from registration to getting behind the wheel currently averages under 48 hours. |
| ● | Transparency and Trust: There are no hidden fees and only Owners that have been properly screened are permitted to use the platform. |
| ● | Customer Experience: Application of game-design elements (i.e. gamification) of the platform keeps Drivers engaged. |
Why Owners Use Our Service
Data from a national survey of driving behavior indicates that private vehicles are in use 5% or less during any given day, or about one hour per day. Given the excess capacity of vehicle hours, higher vehicle utilization rates, and lower vehicle ownership rates, we expect a consumer shift towards acceptance of car-sharing. Based on the results of the survey, we believe our platform is advantageous for the following reasons:
| ● | Passive Income: We often match Owners with long term Drivers, which provides the Owners with a steady source of passive income resulting from our seamless re-booking process. |
| ● | Insurance: Liability policy fills the gaps left by personal and ride-sharing policies. |
| ● | Review of Drivers: Drivers must pass our extensive background checks and most Drivers have also passed the Uber and Lyft background checks. |
Insurance Coverage
A key component to our business is our commercial auto insurance coverage. The two-sided nature of our platform means that we need to insure both the Driver and the Owner. Prior to any rental the Driver and Owner are provided an insurance ID card that lists the driver’s name and the vehicle identification number. Insurance is typically generated twenty-four hours in advance of the commencement of the rental through to when the Owner confirms drop-off of the rented vehicle by the Driver. The vehicle pick-up and drop-off is all managed through our platform. An Owner takes pictures of his or her vehicle prior to pressing the “Confirm Pick-up” button on the HyreCar mobile app. (If pictures are not taken and the button is not pressed, it provides grounds for a claim denial; subsequent liability and/or physical damage rests solely on the Driver and Owner.) After the rental is completed, the Owner presses the “Confirm Drop-off” button on the HyreCar mobile app and the rental ends.
-4-
American Business Insurance Services (“ABI”) is our insurance broker and YRisk is our mobility-focused managing general underwriter, YRisk was sold by our incumbent insurance company American International Group (NYSE: AIG) to The Hartford (NYSE: HIG) in December 2018 and is currently a subsidiary of HIG. We moved our annual car insurance policy to The Hartford for the plan year from April 2019 to May 2020 under superior pricing and terms. ABI handles all of our back-end insurance generation and processing through an API connection with HyreCar databases. ABI is a top broker in the United States for the Taxi and Livery business. Mr. David Haley, president of ABI, sits on our strategic advisory board.
For insurance purposes a vehicle rental is broken into four distinct driving periods. Period 0 is when the Driver has picked a vehicle up from the Owner and is driving with the Uber or Lyft app turned-off. Period 1 is when the Driver has the Uber or Lyft app turned-on but has not yet accepted a fare. Period 2 is when the Driver has accepted a fare and is on the way to pick-up a passenger. Period 3 is when a passenger is in the vehicle. The HyreCar policy is specifically written to cover periods in which the Drivers are operating HyreCar vehicles OFF the Uber or Lyft platform (period 0). During the periods when Drivers are operating ON the Uber or Lyft platform (periods 1, 2 and 3), the HyreCar insurance subordinates to state mandated insurance provided by Uber and Lyft. This enables us to keep insurance costs and liability low by leveraging state mandated insurance policies provided by the TNCs.
Business Structure and Strategy
We operate out of our corporate office in Los Angeles, California. Our technology platform allows for a relatively small staff compared to the size and reach of our business. For example, our platform matches drivers and owners in all 50 U.S. States and the District of Columbia with no physical presence in those states, with the exception of California. Our business structure is divided into three distinct departments: General and Administrative, Sales and Marketing and Research and Development.
Sales and Marketing are vital to our future profitability and growth. Most of our customers need to be sold into a car because they are initially reluctant to pay upfront fees. Early interactions with our customers indicated that if customers were walked through the process once by a member of our sales and marketing team, the customers were more inclined to use and continue to use our services for a longer period of time.
We have expanded the sales team to a total of 42 employees, including 3 managers, which are divided into a Driver team and an Owner team. The Driver team has a total of 16 sales agents and Driver team members make a large volume of calls a day to new customer leads with a mandate to facilitate drivers into cars via the HyreCar platform. The Owner team has a total of 14 sales agents split evenly into the following three regions: west coast states, central states and east coast states. The Owner sales team’s primary objective is to get Owners to list their cars on the HyreCar platform. As the sales team has become more efficient as we have scaled, we don’t expect the need to add headcount as rapidly through 2020 in order for us to continue to achieve forecasted revenue growth rates.
Leveraging headcount more efficiently is a key assumption that we believe drives profitability. The ability to grow topline revenue without significant increases to operating expense is achieved through a combination of marketing, sales, support and technology. Attribution of organic bookings is directly related to the quality of marketing leads generated and user interface/experience enhancements (UI/UX) per technology development. HyreCar has invested in a partnership with a leading SEO firm to continue maximizing organic rankings on Google search pages. Additionally, new market automation tools have allowed HyreCar to communicate directly with its drivers with specially curated messaging to increase awareness of available vehicles and incentive programs for each target DMA and market segment. The company’s expectation is that both aspects contribute to low operating expense growth in relation to revenue, which in-turn, the company believes, will lead to higher gross profit in 2020.
We currently operate with one technology development team in the United States, including multiple full-time developers based out of our home office in Los Angeles. These teams are tasked with maintaining the current codebase and website, and incrementally adding enhancement to the Owner and Driver application and website to support our expansion into institutional car supply nationally.
Support and operations underpin the company. New Dealer onboarding, insurance claims management, owner payment resolutions, Driver payment resolutions, collections, chat support, email support, phone support, late rentals, car recovery, Driver verifications, insurance generation and insurance verification all work together to create what we believe is a “best in class” customer service experience. Currently, we have 14 in-house customer support staff in our Los Angeles office as well as 40 independent contractors located in the Central Time Zone through our outsourced partner who we added in mid-2019. Our plan is to focus our domestic customer support team on being client-facing for larger commercial accounts and scale by outsourcing as we continue to grow. We believe that customer service is critical to our goal of bringing new Drivers/Owners onto the platform and retaining those customers who have already utilized our services.
-5-
Revenue Model
We generate revenue by taking a fee out of each rental processed on our platform. Each rental transaction represents a Driver renting a car from an Owner. Drivers pay a daily rental rate set by the Car Owner, plus a 10% HyreCar Driver Fee and direct daily insurance costs. Owners receive their daily rental rate minus a 15-25% HyreCar Owner Fee. For example, as of December 31, 2019, the average daily rental rate of a HyreCar vehicle nationally is approximately $38.00 (“Daily Rental Rate”), plus a 10% HyreCar Driver fee ($3.80) and daily direct insurance fee of $13.00, totaling $54.80 in total daily gross billings in paid by the Driver via a credit card transaction. On average approximately 80% of the daily rental or $30.40 is transferred to the Owner via our merchant processing partner. HyreCar earns revenues from the two revenue share fees and the insurance totaling approximately $24.40 per day. Accordingly, the GAAP reportable revenue recognized by HyreCar is $24.40 in this example transaction as detailed in the following table:
| Daily Gross Revenue Example | Daily Net (GAAP) Revenue Example | |||||||||
| National Avenger Daily Rental Rate | $ | 38.00 | HyreCar Owner Fee (20% Avg) | $ | 7.60 | |||||
| Driver Fee | $ | 3.80 | HyreCar Driver Fee (10% rate) | $ | 3.80 | |||||
| Daily Insurance Fee | $ | 13.00 | Insurance Fee (100% of fee) | $ | 13.00 | |||||
| Daily Gross Billing Paid by Driver | $ | 54.80 | Daily Avenger Net Revenue | $ | 24.40 | |||||
Gross billings is an important measure by which we evaluate and manage our business. We define gross billings as the amount billed to Drivers, without any adjustments for amounts paid to Owners or refunds. It is important to note that gross billings is a non-GAAP measure and as such, is not recorded in our consolidated financial statements as revenue. However, we use gross billings to asses our business growth, scale of operations and our ability to generate gross billings is strongly correlated to our ability to generate revenues. Gross billings may also be used to calculate net revenue margin, defined as the company’s GAAP reportable revenue over gross billings. Using the definition of net revenue margin and the example above, HyreCar’s net revenue margin is equal to approximately 44.3% ($15,854,924 HyreCar’s GAAP revenue over $35,819,000 Total Gross Billings). A breakout of revenue components is provided in the section of this Annual Report on Form 10-K titled “Management’s Discussion and Analysis of Financial Condition and Results of Operations” and the footnotes to our audited consolidated financial statements.
Marketing Plan
Our marketing team periodically reviews keyword searches using Google Analytics. Thirty keywords and phrases were chosen and analyzed, allowing the team to determine in which cities the persons searching for the keywords and phrases were located. For example, approximately 400,000 people in Los Angeles googled key words like, “rent a car for Uber,” “Uber,” and “Uber Leasing.” Overlaying our customer demographics with the Google search results created a Driver/Owner affinity population of approximately 25 million potential customers, with the bulk of the 25 million concentrated in 16 core geographic locations. Our key geographies currently consist of ten key metropolitan statistical areas (MSA) based on the driver demand for ridesharing and delivery activity as part of the gig economy with large population bases. As we built out the institutional car supply through year ended December 31, 2019, our historical car supply constraints were addressed. Further, we have started focusing more locally on approximately ten key metropolitan markets primarily in the southern United States. Currently more than 75% of our car supply comes from commercial versus individual sources, with half of our rental days come from four southern states.
-6-
Insurance Opportunity
A large percentage of our cost of revenues is direct insurance expense, which we pay to the insurance company. The premiums are broken into two categories, liability insurance and physical damage. The unique nature of our insurance enables us to keep insurance costs and liability low by leveraging state mandated insurance policies provided by the Transportation Network Companies.
In addition to self-insurance, the company is also working with our Managing General Underwriter (“MGU”) to develop new and innovative insurance products. The company has proposed a new type of owner “lay-up” insurance and higher insurance level for fleet vehicle owners on the HyreCar platform. Lay-up insurance replaces the need for an owner’s personal auto insurance policy and would represent significant cost savings when compared to other insurance options available in the market today. Offering this type of insurance product benefits the company in multiple verticals, including reduced insurance claim expense, greater customer retention and stickiness to the HyreCar platform. Our MGU has begun piloting lay-up insurance to vehicle owners.
Regulation
The California Public Utilities Commission (“CPUC”) was the first state regulatory body to impose rules and guidelines for ridesharing in the United States. The CPUC designated Uber and Lyft as “transportation network companies” or TNCs. The CPUC guidelines became the standard for all states across the U.S. Most states have adopted some form of the guidelines. California is one of the strictest states when it comes to regulating the TNCs. Our insurance works within the California guidelines which make it easily adoptable by future state mandates outside of California.
Changes in government regulation of our business have the potential to materially alter our business practices or our operational results. Depending on the jurisdiction, those changes may come about through the issuance of new laws and regulations or changes in the interpretation of existing laws and regulations by a court, regulatory body or governmental official. Sometimes those changes may have not just prospective but also retroactive effect; this is particularly true when a change is made through reinterpretation of laws or regulations that have been in effect for some time. Moreover, changes in regulation that may seem neutral on their face may have either more or less impact on us than on ride-sharing businesses, depending on the circumstances. Potential changes in law or regulation that may affect us relate to insurance intermediaries, customer privacy, data security and rate regulation.
In addition, our operations also could be affected by any limitation in the fuel supply or by any imposition of mandatory allocation or rationing regulations. We are not aware of any current proposal to impose such a regime in the U.S. or internationally. Such a regime could, however, be quickly imposed if there was a serious disruption in the fuel supply for any reason, including an act of war, terrorist incident or other problem, such as the devastation caused by hurricane Harvey, affecting the petroleum supply, refining, distribution or pricing.
Employees
As of April 14, 2020, we employ 86 full-time personnel primarily in our headquarters location in downtown Los Angeles, California.
Our Corporate Information
We were incorporated as a Delaware corporation on November 24, 2014. Our principal executive offices are located at 355 South Grand Avenue, Suite 1650, Los Angeles, California 90071, and our telephone number is (888) 688-6769.
Available Information
Our website address is www.hyrecar.com. The contents of, or information accessible through, our website are not part of this Annual Report on Form 10-K, and our website address is included in this document as an inactive textual reference only. We make our filings with the SEC, including our Annual Report on Form 10-K, Quarterly Reports on Form 10-Q, Current Reports on Form 8-K and all amendments to those reports, available free of charge on our website as soon as reasonably practicable after we file such reports with, or furnish such reports to, the SEC. The public may read and copy the materials we file with the SEC at the SEC’s Public Reference Room at 100 F Street, NE, Washington, DC 20549. The public may also obtain information on the operation of the Public Reference Room by calling the SEC at 1-800-SEC-0330. Additionally, the SEC maintains an internet site that contains reports, proxy and information statements and other information. The address of the SEC’s website is www.sec.gov. The information contained in the SEC’s website is not intended to be a part of this filing.
-7-
You should carefully consider the risks described below, as well as general economic and business risks and the other information in this Annual Report on Form 10-K. The occurrence of any of the events or circumstances described below or other adverse events could have a material adverse effect on our business, results of operations and financial condition and could cause the trading price of our common stock to decline. Additional risks or uncertainties not presently known to us or that we currently deem immaterial may also harm our business.
Risks Related to Our Business and Our Industry
Our limited operating history makes it difficult to evaluate our current business and prospects and may increase the risks associated with your investment.
We were founded in 2014. Our limited operating history makes it difficult to evaluate our current business and prospects and plan for and model our future growth. We have encountered and will continue to encounter risks and uncertainties frequently encountered by rapidly growing companies in developing markets. If our assumptions regarding these risks and uncertainties are incorrect or change in response to changes in the ridesharing or car-sharing market, our results of operations and financial results could differ materially from our plans and forecasts. Although we have experienced rapid growth since our inception, there is no assurance that such growth will continue. Any success we may experience in the future will depend in large part on our ability to, among other things:
| ● | maintain and expand our customer base and the ways in which customers use our platform; |
| ● | expand revenue from existing customers through increased or broader use of our platform; |
| ● | improve the performance and capabilities of our platform through research and development; |
| ● | effectively expand our business domestically and internationally, which will require that we rapidly expand our sales force and fill key management positions; and |
| ● | successfully compete with other companies that currently provide, or may in the future provide, solutions like ours. |
If we are unable to achieve our key objectives, including the objectives listed above, our business and results of operations will be adversely affected, and the fair market value of our securities could decline.
If we do not respond appropriately, the evolution of the automotive industry towards autonomous vehicles and mobility on demand services could adversely affect our business.
The automotive industry is increasingly focused on the development of advanced driver assistance technologies, with the goal of developing and introducing a commercially viable, fully automated driving experience. The high development cost of active safety and autonomous driving technologies may result in a higher risk of exposure to the success of new or disruptive technologies different than those being developed by us. There has also been an increase in consumer preferences for mobility on demand services, such as car and ridesharing, as opposed to automobile ownership, which may result in a long-term reduction in the number of vehicles per capita. These evolving areas have also attracted increased competition from entrants outside the traditional automotive industry. If we do not continue to innovate to develop or acquire new and compelling products that capitalize upon new technologies in response to OEM and consumer preferences, this could have an adverse impact on our results of operations.
-8-
If we do not effectively expand and train our direct sales force, we may be unable to add new customers or increase sales to our existing customers, and our business will be adversely affected.
We continue to be substantially dependent on our direct sales force to obtain new customers and increase sales with existing customers. There is significant competition for sales personnel with the skills and technical knowledge that we require. Our ability to achieve significant revenue growth will depend, in large part, on our success in recruiting, training and retaining sufficient numbers of sales personnel to support our growth. New hires require significant training and may take significant time before they achieve full productivity. Our recent hires and planned hires may not become productive as quickly as we expect, and we may be unable to hire or retain sufficient numbers of qualified individuals in the markets where we do business or plan to do business. In addition, because we continue to grow rapidly, a large percentage of our sales force is new to our company. If we are unable to hire and train a sufficient number of effective sales personnel, or the sales personnel we hire are not successful in obtaining new customers or increasing sales to our existing customer base, our business will be adversely affected.
Fluctuating economic conditions make it difficult to predict revenue for a particular period, and a shortfall in revenue may harm our operating results.
Our revenue depends significantly on general economic conditions and the demand for products in the ridesharing and car-sharing market. Economic weakness, customer financial difficulties, global macroeconomic shocks such as the recent coronavirus outbreak, and constrained spending on ridesharing may result in decreased revenue and earnings. Such factors could make it difficult to accurately forecast our sales and operating results.
On January 30, 2019 the World Health Organization declared the COVID-19 coronavirus outbreak a “Public Health Emergency of International Concern” and on March 10, 2020, declared it to be a pandemic. Actions taken around the world to help mitigate the spread of the coronavirus include restrictions on travel, and quarantines in certain areas, and forced closures for certain types of public places and businesses. The COVID-19 coronavirus and actions taken to mitigate it have had and are expected to continue to have an adverse impact on the economies and financial markets of many countries, including the geographical area in which the Company operates. While it is unknown how long these conditions will last and what the complete financial effect will be to the company, to date, the Company has experienced a revenue decrease of approximately one-third of net sales from the beginning to the end of March 2020 due to lower driver demand and car supply shortages in certain metropolitan markets. Our concentrations in large metropolitan markets make it reasonably possible that we are vulnerable to the risk of a significant near-term impact. In response, the Company has moved aggressively to diversity its business from to include delivery in addition to ridesharing.
The Company worked closely with our primary banking partner to apply for a Small Business Administration (SBA) Paycheck Protection Program Loan in the amount of $2,004,175 as an existing client on April 9, 2020. The application was processed through the SBA system, the loan was approved and funded, with the Company receiving the full loan proceeds of $2,004,175 in its bank account on April 13, 2020.
We have no formal contracts with either Uber or Lyft and our current relationships with either of these companies could change in the future, which could adversely affect our revenues.
Although we have deployed drivers and cars to the systems of both Uber and Lyft since our operations began in 2015, there is currently no formal contractual relationship in place with either company. We have an arrangement with Lyft that allows us to activate our Drivers through Lyft’s sign-up portal; however, this is an oral arrangement that has not been memorialized in a written agreement. Consequently, each of these relationships could be discontinued at any time. In addition, virtually all of our revenue is generated by cars and drivers operating on both the Uber or Lyft platform and therefore this concentration represents a high degree of risk to us and to potential investors.
The ride-sharing model may not continue to grow, which would adversely affect our business.
Our business and future growth is significantly dependent on the continued success of each of Uber, Lyft, and other software-based systems that have come into the marketplace to compete with standard taxicab transportation organizations.
While the effect of those companies has been to decrease the cost and therefore increase the utilization of ride-sharing, there can be no assurance that consumer utilization of these systems will continue to grow, or that competition and the resulting price pressure will not undermine the viability of these types of systems, thereby adversely affecting our business.
Our unique peer to peer structure could be duplicated and our inability to accurately predict user behavior could negatively impact our sales business.
Although to date neither Uber nor Lyft have endeavored to develop a peer-to-peer system to match drivers and car owners as we are doing, there can be no assurance that either one of these companies or other competitors subsequently entering the marketplace will not endeavor to do so, and there can be no assurance that such competition will not have a negative impact on our business.
Furthermore, although several attempts to match up fleets of cars owned by operators with Uber and Lyft drivers have failed, there can be no assurance that other entities will not enter the marketplace on this basis with economic and logistical models that solve the problems that caused this failure.
-9-
The market forecasts included in this Annual Report on Form 10-K may prove to be inaccurate, and even if the markets in which we operate achieve growth, we cannot assure you our business will grow at similar rates, if at all.
Growth forecasts are subject to significant uncertainty and are based on assumptions and estimates, which may not prove to be accurate. Forecasts relating to the expected growth in the ride-sharing market, including the forecasts or projections referenced in this Annual Report, may prove to be inaccurate. Even if the ride-sharing market experiences the forecasted growth, we may not grow our business at similar rates, or at all. Our growth is subject to many factors, including our success in implementing our business strategy, which is subject to many risks and uncertainties. Accordingly, the forecasts of market growth included in this Annual Report should not be taken as indicative of our future growth.
We rely on third-party insurance policies to insure auto-related risks. If insurance coverage is insufficient for the needs of our business or our insurance providers are unable to meet their obligations, we may not be able to mitigate the risks facing our business, which could adversely affect our business, financial condition and results of operations.
We procure third-party insurance policies which provide coverage for both Owners and Drivers on our platform. If the amount of one or more auto-related claims were to exceed our applicable aggregate coverage limits, we may bear the excess liability. Insurance providers have raised premiums and deductibles for many businesses and may do so in the future. As a result, our insurance and claims expense could increase. Our business, financial condition and results of operations could be adversely affected if (i) cost per claim, premiums or the number of claims significantly exceeds our historical experience and coverage limits, (ii) we experience a claim in excess of coverage limits, (iii) our insurance providers fail to pay insurance claims, or (iv) we experience a claim for which coverage is not provided.
Our actual losses may exceed our insurance reserves, which could adversely affect our financial condition and results of operations.
We establish insurance reserves for claims incurred but not yet paid and claims incurred but not yet reported and any related estimable expenses, and we periodically evaluate and, as necessary, adjust our insurance reserves as our experience develops or new information is learned. We employ various predictive modeling actuarial techniques and make numerous assumptions based on limited historical experience and industry statistics to estimate our insurance reserves. Estimating the number and severity of claims, as well as related judgment or settlement amounts, is inherently difficult, subjective, and speculative. A number of external factors can affect the actual losses incurred for any given claim, including the length of time the claim remains open, fluctuations in healthcare costs, legislative and regulatory developments and judicial developments. Additionally, we may encounter in the future, instances of insurance fraud, which could increase our actual insurance-related costs. For any of the foregoing reasons, our actual losses for claims and related expenses may deviate, individually or in the aggregate, from the insurance reserves reflected in our consolidated financial statements. If we determine that our estimated insurance reserves are inadequate, we may be required to increase such reserves at the time of the determination, which could result in an increase to our net loss in the period in which the deficiency is determined and negatively impact our financial condition and results of operations.
Our operations are dependent on our current management. The loss of any member of our management team could adversely affect our operations and financial results.
We are highly dependent upon the retention of the services of our current executive management team, specifically Joseph Furnari, Mike Furnari, Henry Park and Scott Brogi. The loss of any one of these individuals could adversely affect our operations and financial results. Our business also depends on our ability to attract and retain additional highly qualified management, technical, operating, and sales and marketing personnel. We do not currently maintain key person life insurance policies on any of our employees. We do not have fixed term employment agreements with any of our management employees, all of whom could terminate their relationship with us at any time.
-10-
Our results of operations are likely to vary significantly from period to period, which could cause the price of our common stock to decline.
Our results of operations have varied significantly from period to period. For example, the months of January, February and March are traditionally very slow for transportation demand. We expect that our results of operations will continue to vary as a result of a number of factors, many of which are outside of our control and may be difficult to predict, including:
| ● | our ability to attract and retain new customers; | |
| ● | the budgeting cycles and purchasing practices of customers; | |
| ● | the timing and success of new service introductions by us or our competitors or any other change in the competitive landscape of the ridesharing or car-sharing market, including consolidation among our competitors; | |
| ● | our ability to successfully expand our business domestically and internationally; | |
| ● | changes in our pricing policies or those of our competitors; | |
| ● | any disruption in, or termination of, our relationship with our insurance carriers or ride sharing companies with which we do business; | |
| ● | the cost and potential outcomes of future litigation, if any; | |
| ● | seasonality in our business; | |
| ● | general economic conditions, both domestic and foreign, assuming we expand into foreign markets; | |
| ● | future accounting pronouncements or changes in our accounting policies or practices; and | |
| ● | the amount and timing of operating costs and capital expenditures related to the expansion of our business. |
Any of the above factors, individually or in the aggregate, may result in significant fluctuations in our financial and other operating results from period to period. As a result of this variability, our historical results of operations should not be relied upon as an indication of future performance. Moreover, this variability and unpredictability could result in our failure to meet our operating plan or the expectations of investors or analysts for any period. If we fail to meet such expectations for these or other reasons, the price of our common stock could fall substantially, and we could face costly lawsuits, including securities class action suits.
We have had operating losses each year and quarterly period since our inception and may not achieve or maintain profitability in the future.
We have incurred operating losses each year and every quarterly period since inception. For the years ended December 31, 2019 and 2018, our operating loss was $12,689,558 and $9,158,663, respectively. We expect our operating expenses to decrease in the future as we curtail expenditures by scaling back certain sales and marketing and research and development expenses. Our revenue growth may slow or our revenue may decline for a number of other reasons, including reduced demand for our services, economic weakness, global macroeconomic shocks such as the recent coronavirus outbreak, increased competition, a decrease in the growth or size of the ride-sharing or car-sharing market or any failure to capitalize on growth opportunities. Any failure to increase our revenue as we grow our business could prevent us from achieving or maintaining profitability. If we are unable to meet these risks and challenges as we encounter them, our business, financial condition and results of operations may suffer.
We face intense competition and could lose market share to our competitors, which could adversely affect our business, financial condition and results of operations.
The market for ridesharing and car-sharing services is intensely competitive and characterized by rapid changes in technology, customer requirements, industry standards and frequent new service introductions and improvements. We anticipate continued challenges from current competitors, as well as by new entrants into the industry. If we are unable to anticipate or effectively react to these competitive challenges, our competitive position could weaken, and we could experience a decline in our growth rate or revenue that could adversely affect our business and results of operations.
-11-
Changes in government regulations could have an adverse impact on our business.
Currently, there are few laws regulating our business, however, as our business matures, this may change. Changes in government regulation of our business have the potential to materially alter our business practices, or our operational results. Depending on the jurisdiction, those changes may come about through the issuance of new laws and regulations or changes in the interpretation of existing laws and regulations by a court, regulatory body or governmental official. Sometimes those changes may have not just prospective but also retroactive effect; this is particularly true when a change is made through reinterpretation of laws or regulations that have been in effect for some time. Moreover, changes in regulation that may seem neutral on their face may have either more or less impact on us than on ride-sharing businesses, depending on the circumstances. Potential changes in law or regulation that may affect us relate to insurance intermediaries, customer privacy, data security and rate regulation.
Any material limitation in the fuel supply could adversely affect our business.
Our operations could be adversely affected by any limitation in the fuel supply or by any imposition of mandatory allocation or rationing regulations. We are not aware of any current proposal to impose such a regime in the U.S. or internationally. Such a regime could, however, be quickly imposed if there was a serious disruption in the fuel supply for any reason, including an act of war, terrorist incident or other problem, such as the devastation caused by hurricane Harvey, affecting the petroleum supply, refining, distribution or pricing.
A security breach or other disruption to our information technology systems or our platform could result in the loss, theft, misuse, or unauthorized disclosure of user or sensitive company information, could disrupt our operations, or could frustrate or thwart our users’ ability to access our products and services, which could damage our relationships with users and partners, may cause our users and partners to cut back on or stop using our products and services altogether, could expose us to litigation or regulatory proceedings, or harm to our reputation, any of which could seriously harm our business.
Our business involves the storage and transmission of a significant amount of personal and/or confidential information, including the personal information of our users, the personal information of our drivers and employees, information relating to user preferences, confidential information of our partners, and our own proprietary financial, operational and strategic information. The protection of our information, as well as information relating to our users, drivers, partners, and employees, is vitally important to us as the loss, theft, misuse, or unauthorized disclosure of such information could lead to significant reputational or competitive harm, result in litigation involving us or our business partners, expose us to regulatory proceedings, and cause us to incur substantial liability or expenses.
As has been well documented in the media, the frequency, intensity, and sophistication of cyber-attacks and data security incidents has significantly increased in recent years. As with many businesses, we are subject to numerous data privacy and security risks, which may prevent us from maintaining the privacy of personal, confidential, and sensitive information, result in the disruption of our business, and require us to expend significant resources attempting to secure and protect such information and respond to incidents, any of which could seriously harm our business. Due to the increased risk of these types of attacks and incidents, we expend significant resources on information technology and data security tools, measures, and processes designed to protect personal, confidential or sensitive information and to ensure an effective response to any cyber-attack or data security incident. Whether or not these measures are ultimately successful, the expenditures could have an adverse impact on our financial condition and results of operations and divert management’s attention from pursuing our strategic objectives.
In addition, although we take the security of our information technology systems and platform seriously, our efforts to protect the personal and confidential information of our users, drivers, partners, employees, and company may be unsuccessful due to the actions of third parties, malicious code, software bugs, or other technical malfunctions. Despite our security efforts, because the techniques used to obtain unauthorized access to information technology systems and our platform are constantly evolving and, in some cases, becoming more sophisticated and harder to detect, we may be unable to anticipate these techniques or implement adequate preventive measures in response, and cyber-attacks or data incidents could remain undetected for some period, which could potentially result in greater harm to our systems, our platform, and the information stored and transmitted by our systems. In addition, and despite our security efforts and training, our employees may also inadvertently or intentionally cause security incidents that could result in the unauthorized disclosure of personal or confidential information, and third parties may attempt to fraudulently induce employees or users to disclose information to gain access to our data or our users’ data. If any of these events occur, our confidential information or our users’ personal information could be accessed, acquired, disclosed, or used without authorization, which could harm our relationships with users, put us at a competitive disadvantage, result in the deterioration of our users’ confidence in us, cause our partners to reconsider their relationship with our company or impose more onerous contractual provisions, and subject us to potential litigation, liability, fines, and penalties. For example, we could be subject to regulatory or other actions pursuant to domestic privacy laws, including newer regulations such as the California Consumer Privacy Act. This could result in costly investigations and litigation, civil or criminal penalties, operational changes, and negative publicity that could adversely affect our reputation.
Further, some of our partners may store personal or confidential information that we share with them. If these third parties fail to implement adequate data-security practices or fail to comply with our terms and policies, our users’ data may be improperly accessed, acquired, or disclosed. And even if these third parties take all these steps, their networks and information technology systems may still suffer a security breach, which could compromise our users’ data or our company data. Any incidents where our users’ information or confidential company information is accessed without authorization, improperly disclosed, or misused, or incidents that violate our terms of service or policies, could damage our reputation and our brand and diminish our competitive position. Maintaining the trust of our users is important to sustain our growth, retention, and user engagement. Concerns over our privacy practices, whether actual or unfounded, could damage our reputation and brand and deter users, advertisers, and partners from using our products and services. Any of these occurrences could seriously harm our business.
-12-
Risks Related to Our Common Stock
The price of our common stock may fluctuate substantially.
You should consider an investment in our common stock to be risky, and you should invest in our common stock only if you can withstand a significant loss and wide fluctuations in the market value of your investment. Some factors that may cause the market price of our common stock to fluctuate, in addition to the other risks mentioned in this “Risk Factors” section and elsewhere in this Annual Report, are:
| ● | sale of our common stock by our shareholders, executives, and directors; | |
| ● | volatility and limitations in trading volumes of our shares of common stock; | |
| ● | our ability to obtain financings to conduct and complete research and development activities including, but not limited to, our clinical trials, and other business activities; | |
| ● | the timing and success of introductions of new products by us or our competitors or any other change in the competitive dynamics of our industry, including consolidation among competitors; | |
| ● | our ability to attract new customers; | |
| ● | changes in our capital structure or dividend policy, future issuances of securities, sales of large blocks of common stock by our shareholders; | |
| ● | our cash position; | |
| ● | announcements and events surrounding financing efforts, including debt and equity securities; | |
| ● | our inability to enter into new markets or develop new products; | |
| ● | reputational issues; | |
| ● | announcements of acquisitions, partnerships, collaborations, joint ventures, new products, capital commitments, or other events by us or our competitors; | |
| ● | changes in general economic, political and market conditions in or any of the regions in which we conduct our business; | |
| ● | changes in industry conditions or perceptions; | |
| ● | analyst research reports, recommendation and changes in recommendations, price targets, and withdrawals of coverage; | |
| ● | departures and additions of key personnel; | |
| ● | disputes and litigations related to intellectual properties, proprietary rights, and contractual obligations; | |
| ● | changes in applicable laws, rules, regulations, or accounting practices and other dynamics; and | |
| ● | other events or factors, many of which may be out of our control, including but not limited to pandemics, war, or other acts of God. |
In addition, if the market for stocks in our industry or industries related to our industry, or the stock market in general, experiences a loss of investor confidence, the trading price of our common stock could decline for reasons unrelated to our business, financial condition and results of operations. If any of the foregoing occurs, it could cause our stock price to fall and may expose us to lawsuits that, even if unsuccessful, could be costly to defend and a distraction to management.
-13-
We may acquire other companies or technologies, which could divert our management’s attention, result in dilution to our stockholders and otherwise disrupt our operations and adversely affect our operating results.
We may in the future seek to acquire or invest in businesses, applications and services or technologies that we believe could complement or expand our services, enhance our technical capabilities or otherwise offer growth opportunities. The pursuit of potential acquisitions may divert the attention of management and cause us to incur various expenses in identifying, investigating and pursuing suitable acquisitions, whether or not they are consummated.
In addition, we do not have any experience in acquiring other businesses. If we acquire additional businesses, we may not be able to integrate the acquired personnel, operations and technologies successfully, or effectively manage the combined business following the acquisition. We also may not achieve the anticipated benefits from the acquired business due to a number of factors, including:
| ● | inability to integrate or benefit from acquired technologies or services in a profitable manner; | |
| ● | unanticipated costs or liabilities associated with the acquisition; | |
| ● | difficulty integrating the accounting systems, operations and personnel of the acquired business; | |
| ● | difficulties and additional expenses associated with supporting legacy products and hosting infrastructure of the acquired business; | |
| ● | difficulty converting the customers of the acquired business onto our platform and contract terms, including disparities in the revenue, licensing, support or professional services model of the acquired company; | |
| ● | diversion of management’s attention from other business concerns; | |
| ● | adverse effects to our existing business relationships with business partners and customers as a result of the acquisition; | |
| ● | the potential loss of key employees; | |
| ● | use of resources that are needed in other parts of our business; and | |
| ● | use of substantial portions of our available cash to consummate the acquisition. |
In addition, a significant portion of the purchase price of companies we acquire may be allocated to acquired goodwill and other intangible assets, which must be assessed for impairment at least annually. In the future, if our acquisitions do not yield expected returns, we may be required to take charges to our operating results based on this impairment assessment process, which could adversely affect our results of operations.
Acquisitions could also result in dilutive issuances of equity securities or the incurrence of debt, which could adversely affect our operating results. In addition, if an acquired business fails to meet our expectations, our operating results, business and financial position may suffer.
Market and economic conditions may negatively impact our business, financial condition and share price.
Concerns over inflation, energy costs, geopolitical issues, the U.S. mortgage market and a declining real estate market, unstable global credit markets and financial conditions, and volatile oil prices have led to periods of significant economic instability, diminished liquidity and credit availability, declines in consumer confidence and discretionary spending, diminished expectations for the global economy and expectations of slower global economic growth going forward, increased unemployment rates, and increased credit defaults in recent years. Our general business strategy may be adversely affected by any such economic downturns, volatile business environments and continued unstable or unpredictable economic and market conditions. If these conditions continue to deteriorate or do not improve, it may make any necessary debt or equity financing more difficult to complete, more costly, and more dilutive. Failure to secure any necessary financing in a timely manner and on favorable terms could have a material adverse effect on our growth strategy, financial performance, and share price and could require us to delay or abandon development or commercialization plans.
-14-
If securities or industry analysts do not publish research or reports, or publish unfavorable research or reports about our business, our stock price and trading volume may decline.
The trading market for our common stock will rely in part on the research and reports that industry or financial analysts publish about us, our business, our markets and our competitors. We do not control these analysts. If securities analysts do not cover our common stock, the lack of research coverage may adversely affect the market price of our common stock. Furthermore, if one or more of the analysts who do cover us downgrade our stock or if those analysts issue other unfavorable commentary about us or our business, our stock price would likely decline. If one or more of these analysts cease coverage of us or fails to regularly publish reports on us, we could lose visibility in the market and interest in our stock could decrease, which in turn could cause our stock price or trading volume to decline and may also impair our ability to expand our business with existing customers and attract new customers.
Future sales and issuances of our securities could result in additional dilution of the percentage ownership of our shareholders and could cause our share price to fall.
We expect that significant additional capital will be needed in the future to continue our planned operations, including research and development, increased marketing, hiring new personnel, commercializing our products and services, and continuing activities as an operating public company. To the extent we raise additional capital by issuing equity securities, our shareholders may experience substantial dilution. We may sell common stock, convertible securities or other equity securities in one or more transactions at prices and in a manner, we determine from time to time. If we sell common stock, convertible securities or other equity securities in more than one transaction, investors may be materially diluted by subsequent sales. Such sales may also result in material dilution to our existing shareholders, and new investors could gain rights superior to our existing shareholders.
We do not intend to pay cash dividends on our shares of common stock so any returns will be limited to the value of our shares.
We currently anticipate that we will retain future earnings for the development, operation and expansion of our business and do not anticipate declaring or paying any cash dividends for the foreseeable future. Any return to shareholders will therefore be limited to the increase, if any, of our share price.
We are an “emerging growth company” and will be able to avail ourselves of reduced disclosure requirements applicable to emerging growth companies, which could make our common stock less attractive to investors.
We are an “emerging growth company,” as defined in the Jumpstart Our Business Startups Act of 2012 (the “JOBS Act”), and we intend to take advantage of certain exemptions from various reporting requirements that are applicable to other public companies that are not “emerging growth companies” including not being required to comply with the auditor attestation requirements of Section 404(b) of the Sarbanes-Oxley Act, reduced disclosure obligations regarding executive compensation in our periodic reports and proxy statements, and exemptions from the requirements of holding a nonbinding advisory vote on executive compensation and shareholder approval of any golden parachute payments not previously approved. In addition, pursuant to Section 107 of the JOBS Act, as an “emerging growth company” we intend to take advantage of the extended transition period provided in Section 7(a)(2)(B) of the Securities Act, for complying with new or revised accounting standards. In other words, an “emerging growth company” can delay the adoption of certain accounting standards until those standards would otherwise apply to private companies. We cannot predict if investors will find our common stock less attractive because we may rely on these exemptions. If some investors find our common stock less attractive as a result, there may be a less active trading market for our common stock and our stock price may be more volatile. We may take advantage of these reporting exemptions until we are no longer an “emerging growth company.” We will remain an “emerging growth company” until the earliest of (i) the last day of the fiscal year in which we have total annual gross revenues of $1.07 billion or more; (ii) the last day of our fiscal year following the fifth anniversary of the date of the completion of this offering; (iii) the date on which we have issued more than $1 billion in nonconvertible debt during the previous three years; or (iv) the date on which we are deemed to be a large accelerated filer under the rules of the SEC.
-15-
We may be at risk of securities class action litigation.
We may be at risk of securities class action litigation. In the past, technology companies have experienced significant stock price volatility. If we face such litigation, it could result in substantial costs and a diversion of management’s attention and resources, which could harm our business and results in a decline in the market price of our common stock.
Financial reporting obligations of being a public company in the United States are expensive and time-consuming, and our management will be required to devote substantial time to compliance matters.
As a publicly traded company we will incur significant additional legal, accounting and other expenses that we did not incur as a privately company. The obligations of being a public company in the United States require significant expenditures and will place significant demands on our management and other personnel, including costs resulting from public company reporting obligations under the Securities Exchange Act of 1934, as amended (the “Exchange Act”) and the rules and regulations regarding corporate governance practices, including those under the Sarbanes-Oxley Act of 2002 (“Sarbanes-Oxley”) the Dodd-Frank Wall Street Reform and Consumer Protection Act, and the listing requirements of the stock exchange on which our securities are listed. These rules require the establishment and maintenance of effective disclosure and financial controls and procedures, internal control over financial reporting and changes in corporate governance practices, among many other complex rules that are often difficult to implement, monitor and maintain compliance with. Moreover, despite recent reforms made possible by the JOBS Act, the reporting requirements, rules, and regulations will make some activities more time-consuming and costly, particularly after we are no longer an “emerging growth company.” In addition, we expect these rules and regulations to make it more difficult and more expensive for us to obtain director and officer liability insurance. Our management and other personnel will need to devote a substantial amount of time to ensure that we comply with all of these requirements and to keep pace with new regulations, otherwise we may fall out of compliance and risk becoming subject to litigation or being delisted, among other potential problems.
If we fail to comply with the rules under Sarbanes-Oxley related to accounting controls and procedures in the future, or, if we discover material weaknesses and other deficiencies in our internal control and accounting procedures, our stock price could decline significantly and raising capital could be more difficult.
Section 404 of Sarbanes-Oxley requires annual management assessments of the effectiveness of our internal control over financial reporting. If we fail to comply with the rules under Sarbanes-Oxley related to disclosure controls and procedures in the future, or, if we discover material weaknesses and other deficiencies in our internal control and accounting procedures, our stock price could decline significantly and raising capital could be more difficult. If material weaknesses or significant deficiencies are discovered or if we otherwise fail to achieve and maintain the adequacy of our internal control, we may not be able to ensure that we can conclude on an ongoing basis that we have effective internal controls over financial reporting in accordance with Section 404 of Sarbanes-Oxley. Moreover, effective internal controls are necessary for us to produce reliable financial reports and are important to helping prevent financial fraud. If we cannot provide reliable financial reports or prevent fraud, our business and operating results could be harmed, investors could lose confidence in our reported financial information, and the trading price of our common stock could drop significantly.
Comprehensive tax reform bills could adversely affect our business and financial condition.
In 2017, the U.S. government enacted comprehensive federal income tax legislation that included significant changes to the taxation of business entities. These changes include, among others, a permanent reduction to the corporate income tax rate. Notwithstanding the reduction in the corporate income tax rate, the overall impact of this tax reform is uncertain, and our business and financial condition could be adversely affected. This Annual Report does not discuss any such tax legislation or the manner in which it might affect purchasers of our common stock. We urge our shareholders to consult with their legal and tax advisors with respect to any such legislation and the potential tax consequences of investing in our common stock.
-16-
Anti-takeover provisions in our charter documents and under the General Corporation Law of the State of Delaware could make an acquisition of us more difficult and may prevent attempts by our stockholders to replace or remove our management.
Provisions in our amended and restated certificate of incorporation and our bylaws may delay or prevent an acquisition of us or a change in our management. These provisions include a classified board of directors, a prohibition on actions by written consent of our stockholders, and the ability of the board of directors to issue preferred stock without stockholder approval. In addition, because we are incorporated in Delaware, we are governed by the provisions of Section 203 of the Delaware General Corporation Law, or the DGCL, which prohibits stockholders owning in excess of 15% of the outstanding combined organization voting stock from merging or combining with the combined organization. Although we believe these provisions collectively will provide for an opportunity to receive higher bids by requiring potential acquirers to negotiate with our board of directors, they would apply even if the offer may be considered beneficial by some stockholders. In addition, these provisions may frustrate or prevent any attempts by our stockholders to replace or remove then-current management by making it more difficult for stockholders to replace members of the board of directors, which is responsible for appointing the members of management.
Anti-takeover provisions in our charter documents could discourage, delay or prevent a change in control of us and may affect the trading price of our common stock.
Our corporate documents and the DGCL contain provisions that may enable our board of directors to resist a change in control of us even if a change in control were to be considered favorable by our stockholders. These provisions:
| ● | stagger the terms of our board of directors and require 66 and 2/3% stockholder voting to remove directors, who may only be removed for cause; | |
| ● | authorize our board of directors to issue “blank check” preferred stock and to determine the rights and preferences of those shares, which may be senior to our common stock, without prior stockholder approval; | |
| ● | establish advance notice requirements for nominating directors and proposing matters to be voted on by stockholders at stockholders’ meetings; | |
| ● | prohibit our stockholders from calling a special meeting and prohibit stockholders from acting by written consent; | |
| ● | require 66 and 2/3% stockholder voting to effect certain amendments to our certificate of incorporation and bylaws; and | |
| ● | prohibit cumulative voting in the election of directors, which limits the ability of minority stockholders to elect director candidates. |
These provisions could discourage, delay or prevent a transaction involving a change in control of us. These provisions could also discourage proxy contests and make it more difficult for stockholders to elect directors of their choosing and cause us to take other corporate actions our stockholders desire.
-17-
Our amended and restated certificate of incorporation designates the Court of Chancery of the State of Delaware as the sole and exclusive forum for certain types of actions and proceedings that may be initiated by our stockholders, which could limit our stockholders’ ability to obtain a favorable judicial forum for disputes with us or our directors, officers, employees or agents.
Our amended and restated certificate of incorporation provides that, unless we consent in writing to an alternative forum, the Court of Chancery of the State of Delaware will be the sole and exclusive forum for any derivative action or proceeding brought on our behalf, any action asserting a claim of breach of a fiduciary duty owed by any of our directors, officers, employees or agents to us or our stockholders, any action asserting a claim arising pursuant to any provision of the DGCL, our amended and restated certificate of incorporation or our amended and restated bylaws or any action asserting a claim that is governed by the internal affairs doctrine, in each case subject to the Court of Chancery having personal jurisdiction over the indispensable parties named as defendants therein and the claim not being one which is vested in the exclusive jurisdiction of a court or forum other than the Court of Chancery or for which the Court of Chancery does not have subject matter jurisdiction. Any person purchasing or otherwise acquiring any interest in any shares of our common stock shall be deemed to have notice of and to have consented to this provision of our amended and restated certificate of incorporation. This choice of forum provision may limit our stockholders’ ability to bring a claim in a judicial forum that it finds favorable for disputes with us or our directors, officers, employees or agents, which may discourage such lawsuits against us and our directors, officers, employees and agents even though an action, if successful, might benefit our stockholders. Stockholders who do bring a claim in the Court of Chancery could face additional litigation costs in pursuing any such claim, particularly if they do not reside in or near Delaware. The Court of Chancery may also reach different judgments or results than would other courts, including courts where a stockholder considering an action may be located or would otherwise choose to bring the action, and such judgments or results may be more favorable to us than to our stockholders. Alternatively, if a court were to find this provision of our amended and restated certificate of incorporation inapplicable to, or unenforceable in respect of, one or more of the specified types of actions or proceedings, we may incur additional costs associated with resolving such matters in other jurisdictions, which could have a material adverse effect on our business, financial condition or results of operations.
Item 1B. Unresolved Staff Comments
None.
Our corporate headquarters are located in Los Angeles, California and our current lease for this office space extends through June 30, 2021. We believe that our existing facilities are suitable and adequate to meet our current needs. We intend to add new facilities or expand existing facilities as we add employees, and we believe that suitable additional or substitute space will be available as needed to accommodate any such expansion of our operations.
Except as may be set forth below, we are not a party to any legal proceedings, and we are not aware of any claims or actions pending or threatened against us. In the future, we might from time to time become involved in litigation relating to claims arising from our ordinary course of business, the resolution of which we do not anticipate would have a material adverse impact on our financial position, results of operations or cash flows.
On November 13, 2018, two founders of the Company (the “Claimant Founders”), initiated two lawsuits in the Superior Court of California, County of San Francisco, entitled Nathaniel Farber v. HyreCar Inc., Case No. CGC-18-571257 and Josiah Larkin v. HyreCar Inc., Case No. CGC-18-571258. The complaints for the lawsuits, which were largely duplicative, alleged that the Company breached a Settlement Agreement by and between the Company and the Claimant Founders by not allowing the Claimant Founders to sell stock in the Company’s initial public offering (“IPO”), failing to buyback Claimant Founders’ stock at the time of the IPO, allowing the issuance of certain stock without proportionately increasing the stock ownership of Claimant Founders, and not providing certain required information to the Claimant Founders. The Company strongly disagreed with all of the allegations and has vigorously contested both lawsuits. The Company believes that, at all times, its actions have been consistent with the terms, conditions, and context of the Settlement Agreement, as well as applicable law. Pursuant to a motion brought by the Company, the two lawsuits were joined for pretrial and trial purposes. The joined litigation is currently in the discovery phase. As the case has been litigated, the Claimant Founders have narrowed their allegations significantly. Mr. Larkin dismissed all of his claims in their entirety. Mr. Farber dismissed all of his allegations except for an allegation that the Company failed to buyback the Claimant Founders’ stock at the time of the IPO. HyreCar believes that this remaining claim is without merit and has filed a motion for summary judgment regarding the same. Mr. Farber has filed his own motion for summary judgment, which HyreCar believes lacks merit and will vigorously challenge. At this time, the Company is unable to estimate potential damage exposure, if any, related to the litigation.
Item 4. Mine Safety Disclosures
Not applicable.
-18-
Item 5. Market for Registrant’s Common Equity, Related Stockholder Matters and Issuer Purchases of Equity Securities
Market Information
On June 27, 2018, our common stock began trading on the Nasdaq Capital Market under the symbol “HYRE.” Prior to that time, there was no public market for our common stock.
Stockholders
As of April 14, 2020, there were 212 stockholders of record of our common stock. The actual number of holders of our common stock is greater than this number of record holders, and includes stockholders who are beneficial owners, but whose shares are held in street name by brokers or held by other nominees. This number of holders of record also does not include stockholders whose shares may be held in trust by other entities.
Dividend Policy
We have never paid or declared any cash dividends on our common stock, and we do not anticipate paying any cash dividends on our common stock in the foreseeable future. We intend to retain all available funds and any future earnings to fund the development and expansion of our business. Any future determination to pay dividends will be at the discretion of our board of directors and will depend upon a number of factors, including our results of operations, financial condition, future prospects, contractual restrictions, restrictions imposed by applicable law and other factors that our board of directors deems relevant.
Recent Sales of Unregistered Securities
During the year ended December 31, 2019, the Company issued common stock totaled 25,000 shares to consultants of the Company in consideration for services rendered.
During the year ended December 31, 2019, the Company issued 448,726 shares of our common stock upon the exercise of outstanding warrants.
The foregoing offers, sales and issuances were exempt from registration under Section 4(a)(2) of the Securities Act.
Equity Compensation Plans
The information required by Item 5 of Form 10-K regarding equity compensation plans is incorporated herein by reference to Item 12 of Part III of this Annual Report on Form 10-K.
Issuer Purchases of Equity Securities
We did not purchase any of our registered equity securities during the period covered by this Annual Report.
Item 6. Selected Financial Data
As a smaller reporting company, as such term is defined in 17 C.F.R. 229.10, we are not required to provide disclosure for this item.
-19-
Item 7. Management’s Discussion and Analysis of Financial Condition and Results of Operations
You should read the following discussion and analysis of our financial condition and results of operations together with our audited consolidated financial statements and the related notes and other financial information included elsewhere in this Annual Report on Form 10-K. Some of the information contained in this discussion and analysis or set forth elsewhere in this Annual Report, including information with respect to our plans and strategy for our business, include forward-looking statements that involve risks and uncertainties. You should review “Risk Factors” for a discussion of important factors that could cause our actual results to differ materially from the results described in or implied by the forward-looking statements contained in the following discussion and analysis.
Our Company
We operate in the car sharing marketplace for ride sharing through our proprietary platform. The Company has established a leading presence in Transportation as a Service (TaaS) through vehicle owners and institutions, such as franchise car dealerships, independent car dealerships and rental car companies, who have been disrupted by automotive asset sharing. We are based in Los Angeles, California but car owners and drivers can currently use the platform nationwide. We believe our unique revenue opportunity for both owners (“Owners”) and drivers (“Drivers”) is providing a safe, secure, and reliable marketplace.
We categorize our operations into one reportable business segment: Rental, consisting primarily of our vehicle rental operations in the United States.
Business and Trends
We primarily generate revenue by taking an Owner and Driver fee from each rental processed on our platform and through insurance related fees. Each rental transaction represents a Driver renting a car from an Owner. Drivers pay a daily, weekly or monthly rental rate, plus direct insurance costs and a 10% HyreCar Driver fee, while Owners receive their rental rate minus a 15-25% HyreCar Owner fee. The net revenue is currently approximately $25.00 per rental day to HyreCar. We have expanded the rental days serviced by our platform at a compound annual growth rate in excess of 60% to an annual level of more the 600,000 rental days in 2019 as displayed below:
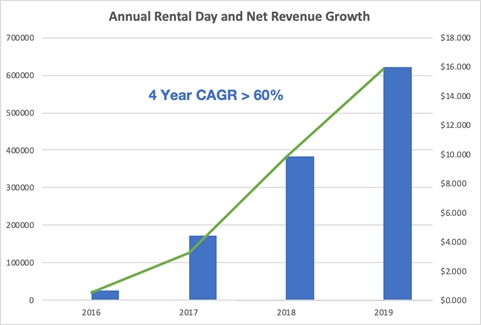
-20-
Gross billings are an important measure by which we evaluate and manage our business. We define gross billings as the amount billed to Drivers, without any adjustments for amounts paid to Owners, refunds or rebates. Gross billings include transactions from both our revenues recorded on a net and a gross basis. It is important to note that gross billings is a non-U.S. GAAP measure and as such, is not recorded in our consolidated financial statements as revenue. However, we use gross billings to asses our business growth, scale of operations and our ability to generate gross billings is strongly correlated to our ability to generate revenues. Gross billings may also be used to calculate net revenue margin, defined as the Company’s U.S. GAAP reportable revenue over gross billings. Using the definition of net revenue margin, HyreCar’s net revenue margin has increased to approximately 44.3% ($15,854,924 HyreCar’s 2019 U.S. GAAP revenue over $35,819,000 2019 Total Gross Billings).
Our operating results are subject to variability due to seasonality, macroeconomic conditions such as the recent coronavirus outbreak (“COVID-19”) and other factors. Car rental volumes tend to be associated with travel and driving holidays, where there is an influx of Uber and Lyft demand. Thus far in 2020, we have continued to operate in an uncertain and uneven economic environment marked by heightened economic and geopolitical risks due to the COVID-19 situation.
Our objective is to focus on strategically accelerating our growth, strengthening our position as a leading provider of vehicle rental services to ridesharing (Lyft and Uber) and delivery (Door Dash, Instacart, Postmates) drivers, continuing to enhance our customers’ rental experience, and controlling costs and driving efficiency throughout the organization. We operate in a high growth industry and we expect to continue to face challenges and risks. We seek to mitigate our exposure to risks in numerous ways, including delivering upon our core strategic initiatives, continued growth of fleet levels to match changes in demand for vehicle rentals, and appropriate investments in technology.
Some highlights from 2019 include:
| ● | Net rental days totaled approximately 621,000 rental days for the year ended December 31, 2019, an increase of approximately 236,000 rental days or 61.4% over the 385,000 rental days recognized during the year ended December 31, 2018, as the Company continued to expand its presence in key markets. |
| ● | Net revenues totaled $15,854,924 for the year ended December 31, 2019, an increase of $6,077,845 or 62.2% over the $9,777,079 recognized during the year ended December 31, 2018, primarily as a result of the higher net rental days year over year. | |
|
●
|
Cost of Sales totaled $9,842,543 for the year ended December 31, 2019, an increase of $4,710,464 or 91.8% over $5,132,079 recognized during the year ended December 31, 2018. The increase was primarily attributed to increase in net rental days revenues and classification of insurance claim costs from the operation of vehicles on the Company’s platform as costs of revenues. See Note 2 Summary of Significant Accounting Policies, Cost of Revenues.
|
|
● |
Gross profit totaled $6,012,381 for the year ended December 31, 2019, an increase of $1,367,381 or 29.4% over the $4,645,000 recognized during the year ended December 31, 2018. The increase in revenues and gross profit were primarily attributed to the growth of our business which resulted from scaling our business operations including marketing, sales, technology and changes to classification of insurance claim costs from the operation of vehicles on the Company’s platform as costs of revenues. See Note 2 Summary of Significant Accounting Policies, Cost of Revenues. |
| ● | Operating expenses, consisting of general and administrative, sales and marketing, and research and development expenses totaled $18,701,939 for the year ended December 31, 2019, an increase of $4,898,276 or 35.5% over $13,803,663 recognized during the year ended December 31, 2018. The increase in operating expenses was related to the scaling of our business across all functional areas. General and administrative totaled $8,561,755 for the year ended December 31, 2019, an increase of $961,020 or 12.6% over $7,600,735 recognized during the year ended December 31, 2018. The increase was primarily attributed to increase in headcount and salaries, legal, operations and support functions. Sales and marketing totaled $7,644,019 for the year ended December 31, 2019, an increase of $2,855,818 or 59.6% over $4,788,201 recognized during the year ended December 31, 2018. The increase was primarily attributed to increase in digital advertising, a dramatic increase to the sales team and addition of customer relationship management systems. Research and development totaled $2,496,165 for the year ended December 31, 2019, an increase of $1,081,438 or 76.4% over $1,414,727 recognized during the year ended December 31, 2018. The increase was primarily attributed to the growth in the technology team related to the enhancement and maintenance of our digital marketplace technology platform. |
| ● | Net loss totaled $12,518,377 for the year ended December 31, 2019, an increase of $1,274,474 or 11.3% over $11,243,903 recognized during the year ended December 31, 2018. The increase in net loss was driven by the higher operating costs described above, partially offset by the higher net revenues recognized during the year ended December 31, 2019. |
-21-
During the first quarter of 2020:
| ● | Net rental days increased 16.2% sequentially to approximately 229,000 rental days for the first fiscal quarter ended March 31, 2020 from approximately 197,000 rental days for the prior fiscal quarter ended December 31, 2019 and increased 65.9% from approximately 138,000 rental days for the prior fiscal year quarter ended March 31, 2019. |
Management’s Plan
We have incurred operating losses since Inception and historically relied on debt and equity financing for working capital. Going forward the Company intends to fund its operations through increased revenue from operations and the funds raised through public securities offerings. Our annualized rental day run rate increased to over 900,000 in the first quarter of 2020 before the COVID-19 situation occurred starting in early March 2020. This situation has had a dramatic negative impact on the ridesharing sector as evidenced by revenue drops at the TNCs. As our operations are platform agnostic, we are diversifying our business to include other gig economy service providers, including but not limited to, food and grocery delivery services, as demand for those services has significantly increased. This expands the opportunities for the drivers and owners on our platform and solidifies their connection to our Company.
As you can see in the chart below, our weekly rental days have decreased approximately 30% from all-time highs in early March through mid-April as our car supply supports the expansion of the gig economy. We are attempting to moderate the impact to our car owners and drivers, as well as to the Company itself. Much of our cost structure is variable in nature so that our costs for driver screening, insurance, merchant processing, and more has almost immediately decreased in line with these lower activity levels. Based on generally increasing revenues through the normal course of business and a high relative amount of variable costs, our additional cash generated from the funded PPP Loan from JPMorgan Chase for $2,004,175 received April 13, 2020, and our current capital as well as the access to additional capital, we believe the Company’s has sufficient resources to continue to operate its business for at least the next 12 months.
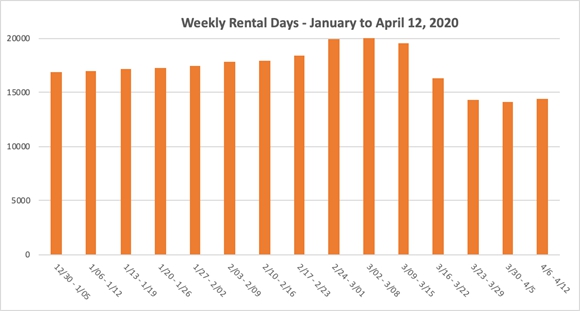
-22-
Components of Our Results of Operations
The following describes the various components that make up our results of operations, discussed below:
Revenue is earned from fees associated with matching Drivers to Owners of cars that meet the strict requirements imposed by ride-sharing services such as Uber and Lyft with Drivers. A Driver will typically rent a car through one transaction via our on-line marketplace. We recognize GAAP reportable revenue primarily from a transaction fee and an insurance fee when a car is rented on our platform when the Company 1) identifies the contract with the customer 2) identifies the performance obligations in the contract 3) determines the transaction price, 4) determines if an allocation of that transaction price is required to the performance obligations in the contract, and 5) recognizes revenue when or as the companies satisfies a performance obligation.
Cost of revenues primarily include direct fees paid for driver insurance, insurance claim payments based on the policy in effect at the time of loss, merchant processing fees, technology and hosting costs, and motor vehicle record fees incurred for paid driver applications. The Company has chosen to transition how it categorizes insurance claims for physical damage, liability claims and certain incidental expenses incurred as part of its protections plans to cost of revenues from Operating Expenses for the full year ended December 31, 2019 to adopt emerging industry norms and the changes made to our business practices around our insurance policies, and will present this financial information in this manner going forward, subject to additional changes in policies or business practices. This change simply moves the same amount of expense from Operating Expenses to Cost of Revenues and is earnings neutral.
General and administrative costs include all corporate and administrative functions that support our business. These costs also include payroll for officers and operational staff, stock-based compensation expense, consulting costs, professional fees, and other costs that are not included in cost of revenues. Research and development costs are related to activities such as user experience and user interface development, database development and maintenance, and technology related expenses to research, improve, implement, or maintain technology and systems utilized throughout our enterprise.
Other income/expense includes non-operating income and expenses including interest income and expense.
Results of Operations
December 31, 2019 compared to December 31, 2018
Revenues and Gross Profit. Revenues totaled $15,854,924 for the year ended December 31, 2019, an increase of $6,077,845 or 62.2% over the $9,777,079 recognized during the year ended December 31, 2018. Gross profit totaled $6,012,381 for the year ended December 31, 2019, an increase of $1,367,381 or 29.4% over the $4,645,000 recognized during the year ended December 31, 2018. The increase in revenues and gross profit were primarily attributed to the growth of our business which resulted from scaling our business operations including marketing, sales, technology and changes to classification of insurance claim costs from the operation of vehicles on the Company’s platform as costs of revenues. See Note 2 Summary of Significant Accounting Policies, Cost of Revenues.
Operating Expenses. Operating expenses, consisting of general and administrative, sales and marketing, and research and development expenses totaled $18,701,939 for the year ended December 31, 2019, an increase of $4,898,276 or 35.5% over $13,803,663 recognized during the year ended December 31, 2018. The increase in operating expenses was related to the scaling of our business across all functional areas. General and administrative totaled $8,561,755 for the year ended December 31, 2019, an increase of $961,020 or 12.6% over $7,600,735 recognized during the year ended December 31, 2018. The increase was primarily attributed to increase in headcount and salaries, legal, operations and support functions. Sales and marketing totaled $7,644,019 for the year ended December 31, 2019, an increase of $2,855,818 or 59.6% over $4,788,201 recognized during the year ended December 31, 2018. The increase was primarily attributed to increase in digital advertising, a dramatic increase to the sales team and addition of customer relationship management systems. Research and development totaled $2,496,165 for the year ended December 31, 2019, an increase of $1,081,438 or 76.4% over $1,414,727 recognized during the year ended December 31, 2018. The increase was primarily attributed to the growth in the technology team related to the enhancement and maintenance of our digital marketplace technology platform.
-23-
Loss from Operations. Loss from operations for the year ended December 31, 2019 was $12,689,558 as compared to a loss from operations of 9,158,663 for the year ended December 31, 2018. The increase in loss from operations was driven by the higher operating costs described above, partially offset by the higher net revenues recognized during the year.
Other (Income) Expense. For the year ended December 31, 2019, interest expense totaled $2,500 as compared to interest expense of $2,040,311 for the year ended December 31, 2018. The decrease as a result of interest charges for beneficial conversion features on convertible debt and the amortization of debt discounts in 2018, those charges no longer exist going forward after the IPO.
Net Loss. Net loss for the year ended December 31, 2019 was $12,518,377 as compared to a net loss for the year ended December 31, 2018 of $11,243,903. The increase in net loss was driven by the higher operating costs described above, partially offset by the higher net revenues recognized during the year.
Non-GAAP Financial Measure – Gross Billings
Gross billings is an important measure by which we evaluate and manage our business. We define gross billings as the amount billed to Drivers, without any adjustments for amounts paid to Owners or refunds. Gross billings include transactions from both our revenues recorded on a net and a gross basis. It is important to note that gross billings is a non-GAAP measure and as such, is not recorded in our consolidated financial statements as revenue. However, we use gross billings to asses our business growth, scale of operations and our ability to generate gross billings is strongly correlated to our ability to generate revenues. Gross billings may also be used to calculate net revenue margin, defined as the company’s GAAP reportable revenue over gross billings.
The table below sets forth a reconciliation of our GAAP reported revenues to gross billings for the years ended December 31, 2019 and 2018:
| 2019 | 2018 | |||||||
| Revenues (GAAP reported revenue) | $ | 15.854,924 | $ | 9,777,079 | ||||
| Add: Refunds, rebates and deferred revenue | 1,267,971 | 903,822 | ||||||
| Add: Owner payments (not recorded in consolidated financial statements) | 18,695,704 | 11,965,040 | ||||||
| Gross billings (non-GAAP measure not recorded in consolidated financial statements) | $ | 35,818,599 | $ | 22,645,941 | ||||
Liquidity and Capital Resources
As of December 31, 2019, our principal sources of liquidity were cash and cash equivalents of $10,657,140 compared to $6,764,870 as of December 31, 2018. Cash and cash equivalents consisted of money market deposit accounts denominated in U.S. dollars. As of March 31, 2020, our cash and cash equivalents is approximately $7,818,744 meaning that our quarterly cash burn has been reduced to approximately $2.8 million for the quarter ended March 31, 2020.
In June 2018, we received net proceeds of $11,340,000 upon the completion of our IPO. Further, in July 2019, we received net proceeds of $11,321,250 upon the completion of our secondary public offering.
Since our IPO, we have financed our operations primarily through our IPO, secondary public offering and payments received through our platform. We believe our existing cash and cash equivalent and proceeds from revenue generating activities will be sufficient to meet our working capital and capital expenditures needs over at least the next 12 months more fully described in Managements Plan above.
Our future capital requirements will depend on many factors, including, but not limited to our growth, our ability to attract and retain drivers and car owners on our platform, the continuing market acceptance of our offerings, the timing and extent of spending to support our efforts to improve our customer experience, actual insurance payments for which we have made reserves, the timing and extent of investment we are making in policy, government relations, and the expansion of sales and marketing activities. Further, we may in the future enter into arrangements to acquire or invest in businesses, products, services and technologies. We may decide to, or be required to, seek additional equity or debt financing for any of these reasons, or others that may arise. If we are unable to raise capital in the future, we may need to curtail expenditures by scaling back certain sales and marketing expenses.
-24-
Cash Flows
Net cash used in operating activities was $8,113,762 for the year ended December 31, 2019. This consisted primarily of a net loss of $12,518,377 offset by non-cash stock-based compensation expense of $1,988,626 largely driven by the recognition of costs related to stock options, RSUs, and shares issued for services. Additionally, there was an increase in insurance reserves of $984,450 and accounts payable of $1,375,704.
Net cash used in operating activities was for the year ended December 31, 2018 resulted in cash outflows of $6,515,069. This consisted primarily of a net loss of $11,243,903 offset by non-cash stock-based compensation expense of $2,280,842 and non-cash amortization of debt discount of $1,515,191. Additionally, there were an increase in accrued liabilities of $747,358 and insurance reserve of $348,442.
Net cash used in investing activities was $6,207 for the year ended December 31, 2019, which primarily consists of deposits.
Net cash used in investing activities was $197,676 for the year ended December 31, 2018, which primarily consists of purchases of property and equipment and investment in internally developed software, partially offset by deposits.
Net cash provided by financing activities was $12,012,239 for the year ended December 31, 2019, which primarily consists of gross proceeds of sale of common stock in our July 2019 secondary public offering of $12,075,000, exercise of warrants of $873,403, partially offset by offering costs of $1,017,623.
Net cash provided by financing activities was $13,263,672 for the year ended December 31, 2018, which primarily consists of net proceeds of $11,340,000 related to our June 2018 initial public offering, net proceeds from convertible debt of $2,778,579, partially offset by offering costs of $569,665 and repayments on notes payable totaling $350,000.
Capital Management
We aim to manage capital so that we will maintain optimal returns to shareholders and benefits for other stakeholders. We also aim to maintain a capital structure that ensures the lowest cost of capital available to the Company. We regularly review the Company’s capital structure and seek to take advantage of available opportunities to improve outcomes for the Company and its shareholders.
For the years ended December 31, 2019 and 2018, there were no dividends paid and we have no plans to commence the payment of dividends. We have no current plans to issue further shares on the market but will continue to assess market conditions and the company’s cash flow requirements to ensure the Company is appropriately funded.
There is no significant external borrowing at the reporting date. Neither the Company nor any of the subsidiaries are subject to externally imposed capital requirement.
Going Concern
The accompanying consolidated financial statements have been prepared on the basis that we will continue as a going concern, which contemplates realization of assets and the satisfaction of liabilities in the normal course of business. At December 31, 2019, we had an accumulated deficit of $29,015,134 and a working capital of $6,577,375. Our operating activities consume the majority of our cash resources. We anticipate that we will continue to incur operating losses and negative net cash flows from operations, as we navigate the COVID-19 situation.
As of the date of this report we had approximately $9,000,000 of cash and cash equivalents. Based on our additional cash generated from the funded PPP Loan from JPMorgan Chase for $2,004,175 received April 13, 2020, cash generated from our revenues, and our current capital as well as the access to additional capital, we believe the Company’s has sufficient resources to continue to operate its business for at least the next 12 months. If we are unable to raise sufficient additional funds, we will have to develop and implement a plan to extend payables, reduce expenditures, or scale back our business plan until sufficient additional capital is raised to support further operations. There can be no assurance that such a plan will be successful.
-25-
Critical Accounting Policies, Judgments and Estimates
Use of Estimates
The preparation of consolidated financial statements in conformity with U.S. GAAP requires management to make certain estimates and assumptions that affect the reported amounts of assets and liabilities, and the reported amount of revenues and expenses during the reporting period. Actual results could materially differ from these estimates. It is reasonably possible that changes in estimates will occur in the near term.
The Company’s most significant estimates and judgments involve recognition of revenue, insurance reserves, the measurement of the Company’s stock-based compensation, including the estimation of the underlying deemed fair value of common stock in periods prior to the date of the Company’s IPO, the estimation of the fair value of market-based awards, the valuation of warrants, allowance for doubtful accounts, estimates for future contingent customer incentive obligations, and the fair value of financial instruments.
Stock Based Compensation
The Company accounts for stock options issued to employees under ASC 718, Compensation – Stock Compensation. Under ASC 718, share-based compensation cost to employees is measured at the grant date, based on the estimated fair value of the award, and is recognized as expense over the employee’s requisite vesting period. The fair value of each stock option or warrant award is estimated on the date of grant using the Black-Scholes option valuation model.
The Company measures compensation expense for its non-employee stock-based compensation under ASC 505, Equity. The fair value of the option issued or committed to be issued is used to measure the transaction, as this is more reliable than the fair value of the services received. The fair value is measured at the value of the company’s common stock or equity award on the date that the commitment for performance by the counterparty has been reached or the counterparty’s performance is complete. The fair value of the equity instrument is charged directly to stock-based compensation expense and credited to additional paid-in capital.
Revenue Recognition
The Company generates the majority of its revenue from its ridesharing marketplace that connects vehicle owners and drivers and the related insurance issued for each rental.
The Company also recognizes revenue from other sources such as referrals, motor vehicle record fees (application fees), late rental fees, and other fees charged to drivers in specific situations.
The Company has adopted Accounting Standards Codification Topic 606 (“ASC 606”) – Revenue from Contracts with Customers, as of January 1, 2019 using the modified retrospective method. The adoption of ASC 606 did not materially impact the way the Company recognizes revenue.
In applying the guidance of ASC 606, the Company 1) identifies the contract with the customer 2) identifies the performance obligations in the contract 3) determines the transaction price, 4) determines if an allocation of that transaction price is required to the performance obligations in the contract, and 5) recognizes revenue when or as the companies satisfies a performance obligation.
Refunds may occur when the driver returns the owner vehicle early based on the terms of the original contract or cancels the rental prior to completing the exchange. In limited circumstances, the Company provides contingent consideration in the form of a rebate that is redeemable only if the customer completes a specific level of transaction over a specific time period. In such cases, the rebate or refund obligation is recognized as a reduction of revenues. The Company defers revenue in all instances when the earnings process is not yet complete.
-26-
The following is a breakout of revenue components by subcategory for the years ended December 31, 2019 and 2018.
| Year
ended December 31, 2019 | Year
ended December 31, 2018 | |||||||
| Insurance and administration fees | $ | 7,845,803 | $ | 5,090,441 | ||||
| Transaction fees | 6,623,894 | 3,479,004 | ||||||
| Other fees | 1,953,498 | 1,557,084 | ||||||
| Incentives and rebates | (568,271 | ) | (349,450 | ) | ||||
| Net revenue | $ | 15,854,924 | $ | 9,777,079 | ||||
Insurance and transaction fees are charged to a driver in a single transaction. Drivers currently do not have an option to decline insurance at any point during the transaction.
Principal Agent Considerations
The Company evaluates our service offerings to determine if we are acting as the principal or as an agent, which we consider in determining if revenue should be reported gross or net. One of our primary revenue sources is a transaction fee made from a confirmed booking of a vehicle on our platform. Key indicators that we evaluate to reach this determination include:
| ● | the terms and conditions of our contracts; | |
| ● | whether we are paid a fixed percentage of the arrangement’s consideration or a fixed fee for each transaction; | |
| ● | the party which sets the pricing with the end-user, has the credit risk and provides customer support; and | |
| ● | the party responsible for delivery/fulfillment of the product or service to the end consumer. |
We have determined that we act as the agent in the transaction for vehicle bookings, as we are not the primarily obligor of the arrangement and receive a fixed percentage of the transaction. Therefore, revenue is recognized on a net basis.
For other fees such as insurance fees and motor vehicle records (application fees) we have determined that revenue should be recorded on a gross basis. In such arrangements, the company sets pricing, has risk of economic loss, has certain credit risk, provides support services related to these transactions, and has decision making ability about service providers used.
Income Taxes
The company applies ASC 740 “Income Taxes” (“ASC 740”). Deferred income taxes are recognized for the tax consequences in future years of differences between the tax bases of assets and liabilities and their consolidated financial statements reported amounts at each period end, based on enacted tax laws and statutory tax rates applicable to the periods in which the differences are expected to affect taxable income. Valuation allowances are established, when necessary, to reduce deferred tax assets to the amount expected to be realized. The provision for income taxes represents the tax expense for the period, if any, and the change during the period in deferred tax assets and liabilities. At December 31, 2019 and 2018, the company has established a full allowance against all deferred tax assets.
ASC 740 also provides criteria for the recognition, measurement, presentation and disclosure of uncertain tax positions. A tax benefit from an uncertain position is recognized only if it is “more likely than not” that the position is sustainable upon examination by the relevant taxing authority based on its technical merit.
-27-
Internal Use Software
We incur software development costs to develop software programs to be used solely to meet our internal needs and cloud-based applications used to deliver our services. In accordance with ASC 350-40, Internal-Use Software, we capitalize development costs related to these software applications once the preliminary project stage is complete and it is probable that the project will be completed, and the software will be used to perform the function intended.
Insurance Reserve
The Company records a loss reserve for insurance deductible or physical damage that the Company pays to car owners based on the Company’s policy in relation to the insurance policy in effect at the time. This reserve represents an estimate for both reported accidents claims not yet paid, and claims incurred but not yet reported and are recorded on a non-discounted basis. The lag time in reported claims is minimal and as such represents a low risk of unreported claims being excluded from the loss reserve assessment. The adequacy of the reserve is monitored quarterly and is subject to adjustment in the future based upon changes in claims experience, including the number of incidents for which the Company is ultimately responsible and changes in the cost per claim, or changes to the Company’s policy as to what amounts of the deductible or claim will be paid by the Company.
Liability insurance claims may take several years to completely settle, and the Company has limited historical loss experience. Because of the limited operational history, the Company makes certain assumptions based on currently available information to estimate the reserves as well as third party claims adjuster data provided on existing claims. A number of factors can affect the actual cost of a claim, including the length of time the claim remains open, economic and healthcare cost trends and the results of related litigation. Furthermore, claims may emerge in future periods for events that occurred in a prior period that differs from expectations. Accordingly, actual losses may vary significantly from the estimated amounts reported in the consolidated financial statements. Reserves are continually reviewed and adjusted as necessary as experience develops or new information becomes known. However, ultimate results may differ from the Company’s estimates, which could result in losses over the Company’s reserved amounts. Such adjustments are recorded in general and administrative expenses.
Convertible Debt and Warrant
Convertible debt is accounted for under the guidelines established by ASC 470-20, Debt with Conversion and Other Options. ASC 470-20 governs the calculation of an embedded beneficial conversion and/or debt issued with warrants, which is treated as a discount to the instruments where derivative accounting does not apply. The discounts are accreted over the term of the debt.
The Company calculates the fair value of warrants and conversion features issued with convertible instruments using the Black-Scholes valuation method, using the same assumptions used for valuing employee options for purposes of ASC 718, Compensation – Stock Compensation, except the contractual life of the warrant or conversion feature is used. Under these guidelines, the Company allocates the value of the proceeds received from a convertible debt transaction between the conversion feature and any other detachable instruments (such as warrants) on a relative fair value basis. The allocated fair value is recorded as a debt discount or premium and is amortized over the expected term of the convertible debt to interest expense.
Off-Balance Sheet Arrangements
We did not have during the periods presented, nor do we currently have, any off-balance sheet arrangements as defined under applicable SEC rules.
Item 7A. Quantitative and Qualitative Disclosures about Market Risk
As a smaller reporting company, as such term is defined in 17 C.F.R. 229.10, we are not required to provide disclosure for this item.
-28-
Item 8. Consolidated Financial Statements and Supplementary Data
The consolidated financial statements required to be filed pursuant to this Item 8 are appended to this Annual Report. An index of those consolidated financial statements is found in Item 15.
Item 9. Changes in and Disagreements with Accountants on Accounting and Financial Disclosure
None.
Item 9A. Controls and Procedures
Evaluation of Disclosure Controls and Procedures
Our management, with the participation of our Chief Executive Officer and Chief Financial Officer (our principal executive officer and principal financial officer, respectively), evaluated the effectiveness of our disclosure controls and procedures as of December 31, 2019. The term “disclosure controls and procedures,” as defined in Rules 13a-15(e) and 15d-15(e) under the Securities Exchange Act of 1934, as amended, or the Exchange Act, means controls and other procedures of a company that are designed to ensure that information required to be disclosed by a company in the reports that it files or submits under the Exchange Act is recorded, processed, summarized and reported, within the time periods specified in the SEC’s rules and forms. Disclosure controls and procedures include, without limitation, controls and procedures designed to ensure that information required to be disclosed by a company in the reports that it files or submits under the Exchange Act is accumulated and communicated to the company’s management, including its principal executive and principal financial officers, as appropriate to allow timely decisions regarding required disclosure. Management recognizes that any controls and procedures, no matter how well designed and operated, can provide only reasonable assurance of achieving their objectives and management necessarily applies its judgment in evaluating the cost-benefit relationship of possible controls and procedures.
Based on the evaluation of our disclosure controls and procedures as of December 31, 2019, our Chief Executive Officer and Chief Financial Officer concluded that, as of such date, our disclosure controls and procedures are effective.
Management’s Annual Report on Internal Controls Over Financial Reporting
We are an “emerging growth company” under the JOBS Act, our independent registered public accounting firm will not be required to attest to the effectiveness of our internal control over financial reporting under Section 404 of the Sarbanes-Oxley Act as long as we are an emerging growth company.
Changes in Internal Control over Financial Reporting
No change in our internal control over financial reporting (as defined in Rules 13a-15(f) and 15d-15(f) under the Exchange Act) occurred during the three months ended December 31, 2019 that has materially affected, or is reasonably likely to materially affect, our internal control over financial reporting.
Not applicable.
-29-
Item 10. Directors, Executive Officers and Corporate Governance
The information required by this Item is incorporated herein by reference to the information that will be contained in our definitive proxy statement related to the 2019 Annual Meeting of Stockholders, or the Proxy Statement, which we intend to file with the SEC within 120 days of the end of our fiscal year pursuant to General Instruction G(3) of Form 10-K.
Item 11. Executive Compensation
The information required by this Item is incorporated herein by reference to the information that will be contained in our Proxy Statements, which we intend to file with the SEC within 120 days of the end of our fiscal year pursuant to General Instruction G(3) of Form 10-K.
Item 12. Security Ownership of Certain Beneficial Owners and Management and Related Stockholder Matters
The information required by this Item is incorporated herein by reference to the information that will be contained in our Proxy Statement, which we intend to file with the SEC within 120 days of the end of our fiscal year pursuant to General Instruction G(3) of Form 10-K.
Item 13. Certain Relationships and Related Transactions, and Director Independence
The information required by this Item is incorporated herein by reference to the information that will be contained in our Proxy Statement, which we intend to file with the SEC within 120 days of the end of our fiscal year pursuant to General Instruction G(3) of Form 10-K.
Item 14. Principal Accounting Fees and Services
The information required by this Item is incorporated herein by reference to the information that will be contained in our Proxy Statement which we intend to file with the SEC within 120 days of the end of our fiscal year pursuant to General Instruction G(3) of Form 10-K.
-30-
Item 15. Exhibits, Consolidated Financial Statements Schedules
| (a) | The following documents are filed as part of this report: |
| (1) | Consolidated Financial Statements: |
| (2) | Consolidated Financial Statement Schedules: |
All consolidated financial statement schedules have been omitted because they are not applicable, not required or the information required is shown in the financial statements or the notes thereto.
| (3) | Exhibits. |
| + | Indicates a management contract or any compensatory plan, contract or arrangement |
Not applicable.
-31-
REPORT OF INDEPENDENT REGISTERED PUBLIC ACCOUNTING FIRM
To the Shareholders and the Board of Directors of HyreCar Inc.
Opinion on the Financial Statements
We have audited the accompanying consolidated balance sheets of HyreCar Inc. and subsidiary (the “Company”) as of December 31, 2019 and 2018, the related consolidated statements of operations, consolidated statements of changes in stockholders’ equity (deficit), and cash flows for the years then ended, and the related notes (collectively referred to as the “consolidated financial statements”). In our opinion, the consolidated financial statements present fairly, in all material respects, the financial position of the Company as of December 31, 2019 and 2018, and the results of its operations and its cash flows for the years then ended, in conformity with accounting principles generally accepted in the United States of America.
Basis for Opinion
These consolidated financial statements are the responsibility of the Company’s management. Our responsibility is to express an opinion on the Company’s consolidated financial statements based on our audits. We are a public accounting firm registered with the Public Company Accounting Oversight Board (United States) (“PCAOB”) and are required to be independent with respect to the Company in accordance with the U.S. federal securities laws and the applicable rules and regulations of the Securities and Exchange Commission and the PCAOB.
We conducted our audits in accordance with the standards of the PCAOB. Those standards require that we plan and perform the audit to obtain reasonable assurance about whether the consolidated financial statements are free of material misstatement, whether due to error or fraud. The Company is not required to have, nor were we engaged to perform, an audit of its internal control over financial reporting. As part of our audits we are required to obtain an understanding of internal control over financial reporting but not for the purpose of expressing an opinion on the effectiveness of the Company’s internal control over financial reporting. Accordingly, we express no such opinion.
Our audits included performing procedures to assess the risks of material misstatement of the consolidated financial statements, whether due to error or fraud, and performing procedures that respond to those risks. Such procedures included examining, on a test basis, evidence regarding the amounts and disclosures in the consolidated financial statements. Our audits also included evaluating the accounting principles used and significant estimates made by management, as well as evaluating the overall presentation of the consolidated financial statements. We believe that our audits provide a reasonable basis for our opinion.
/s/ dbbmckennon
We have served as the Company’s auditor since 2016.
Newport Beach, California
April 14, 2020
F-1
CONSOLIDATED BALANCE SHEETS
| December 31, 2019 | December 31, 2018 | |||||||
| Assets | ||||||||
| Current assets: | ||||||||
| Cash and cash equivalent | $ | 10,657,140 | $ | 6,764,870 | ||||
| Accounts receivable | 84,680 | 161,177 | ||||||
| Deferred expenses | - | 20,927 | ||||||
| Other current assets | 379,425 | 128,337 | ||||||
| Total current assets | 11,121,245 | 7,075,311 | ||||||
| Property and equipment, net | 9,138 | 10,613 | ||||||
| Intangible assets, net | 153,905 | 221,623 | ||||||
| Other assets | 95,000 | 90,000 | ||||||
| Total assets | $ | 11,379,288 | $ | 7,397,547 | ||||
| Liabilities and Stockholders’ Equity | ||||||||
| Current liabilities: | ||||||||
| Accounts payable | $ | 2,232,629 | $ | 856,925 | ||||
| Accrued liabilities | 903,912 | 775,857 | ||||||
| Insurance reserve | 1,332,892 | 348,442 | ||||||
| Deferred revenue | 64,808 | 53,764 | ||||||
| Related party advances | 9,629 | 9,629 | ||||||
| Total current liabilities | 4,543,870 | 2,044,617 | ||||||
| Total liabilities | 4,543,870 | 2,044,617 | ||||||
Commitments and contingencies (Note 3) | ||||||||
Stockholders’ equity: | ||||||||
| Preferred stock, 15,000,000 shares authorized, par value $0.00001, 0 shares issued and outstanding as of December 31, 2019 and 2018, respectively | - | - | ||||||
| Common stock, 50,000,000 shares authorized, par value $0.00001, 16,393,171 and 11,708,041 shares issued and outstanding as of December 31, 2019 and 2018, respectively | 164 | 117 | ||||||
| Additional paid-in capital | 35,857,835 | 21,857,017 | ||||||
| Subscription receivable - related party | (7,447 | ) | (7,447 | ) | ||||
| Accumulated deficit | (29,015,134 | ) | (16,496,757 | ) | ||||
| Total stockholders’ equity | 6,835,418 | 5,352,930 | ||||||
| Total liabilities and stockholders’ equity | $ | 11,379,288 | $ | 7,397,547 | ||||
See accompanying notes to consolidated financial statements
F-2
CONSOLIDATED STATEMENTS OF OPERATIONS
| Year ended December 31, 2019 | Year ended December 31, 2018 | |||||||
| Revenues | $ | 15,854,924 | $ | 9,777,079 | ||||
| Cost of revenues | 9,842,543 | 5,132,079 | ||||||
| Gross profit | 6,012,381 | 4,645,000 | ||||||
| Operating Expenses: | ||||||||
| General and administrative | 8,561,755 | 7,600,735 | ||||||
| Sales and marketing | 7,644,019 | 4,788,201 | ||||||
| Research and development | 2,496,165 | 1,414,727 | ||||||
| Total operating expenses | 18,701,939 | 13,803,663 | ||||||
| Operating loss | (12,689,558 | ) | (9,158,663 | ) | ||||
| Other (income) expense | ||||||||
| Interest expense | 2,500 | 2,040,311 | ||||||
| Other (income) expense | (174,481 | ) | 44,129 | |||||
| Total other (income) expense | (171,981 | ) | 2,084,440 | |||||
| Loss before provision for income taxes | (12,517,577 | ) | (11,243,103 | ) | ||||
| Provision for income taxes | 800 | 800 | ||||||
| Net loss | $ | (12,518,377 | ) | $ | (11,243,903 | ) | ||
| Weighted average shares outstanding - basic and diluted | 13,956,793 | 8,557,796 | ||||||
| Weighted average net loss per share - basic and diluted | $ | (0.90 | ) | $ | (1.31 | ) | ||
See accompanying notes to consolidated financial statements
F-3
CONSOLIDATED STATEMENT OF STOCKHOLDER’S EQUITY
| Preferred Stock | Common Stock | Additional Paid-in | Subscription Receivable - Related | Accumulated | Total Stockholders’ | |||||||||||||||||||||||||||
| Shares | Amount | Shares | Amount | Capital | Parties | Deficit | Equity | |||||||||||||||||||||||||
| December 31, 2017 | 2,429,638 | $ | 1,591,886 | 5,252,953 | $ | 52 | $ | 2,553,672 | $ | (140,087 | ) | $ | (5,252,854 | ) | $ | (1,247,331 | ) | |||||||||||||||
| Conversion of Preferred Stock | (2,429,638 | ) | (1,591,886 | ) | 2,429,638 | 25 | 1,591,861 | - | - | - | ||||||||||||||||||||||
| Stock option compensation | - | - | - | - | 446,417 | - | - | 446,417 | ||||||||||||||||||||||||
| Stock option compensation on forfeitable restricted common stock | - | - | 274,285 | 3 | 1,371,422 | - | - | 1,371,425 | ||||||||||||||||||||||||
| Conversion of convertible debt | - | - | 1,231,165 | 12 | 3,136,996 | - | - | 3,137,008 | ||||||||||||||||||||||||
| Discount for warrants issued with convertible debt | - | - | - | - | 1,107,982 | - | - | 1,107,982 | ||||||||||||||||||||||||
| Discount for beneficial conversion feature on convertible debt | - | - | - | - | 368,757 | - | - | 368,757 | ||||||||||||||||||||||||
| Common stock issued for cash | - | - | 2,520,000 | 25 | 12,599,975 | - | - | 12,600,000 | ||||||||||||||||||||||||
| Offering costs associated with underwriters in public offering | - | - | - | - | (1,260,000 | ) | - | - | (1,260,000 | ) | ||||||||||||||||||||||
| Offering costs | - | - | - | - | (569,665 | ) | - | - | (569,665 | ) | ||||||||||||||||||||||
| Warrants issued for services | - | - | - | - | 463,000 | - | - | 463,000 | ||||||||||||||||||||||||
| Warrants issued to placement agent | - | - | - | - | 46,600 | - | - | 46,600 | ||||||||||||||||||||||||
| Subscription receivable relieved | - | - | - | - | - | 133,042 | - | 133,042 | ||||||||||||||||||||||||
| Interest on subscription receivable | - | - | - | - | - | (402 | ) | - | (402 | ) | ||||||||||||||||||||||
| Net loss | - | - | - | - | - | - | (11,243,903 | ) | (11,243,903 | ) | ||||||||||||||||||||||
| December 31, 2018 | - | - | 11,708,041 | $ | 117 | $ | 21,857,017 | $ | (7,447 | ) | $ | (16,496,757 | ) | $ | 5,352,930 | |||||||||||||||||
| Stock option compensation | - | - | - | - | 1,047,686 | - | - | 1,047,686 | ||||||||||||||||||||||||
| RSU compensation | - | - | - | - | 330,390 | - | - | 330,390 | ||||||||||||||||||||||||
| Stock options exercised for cash | - | - | 70,703 | 1 | 81,458 | - | - | 81,459 | ||||||||||||||||||||||||
| Shares issued for services | - | - | 136,000 | 1 | 610,549 | - | - | 610,550 | ||||||||||||||||||||||||
| Warrants exercised for cash | - | - | 274,224 | 3 | 873,400 | - | - | 873,403 | ||||||||||||||||||||||||
| Warrants exercised – cashless | - | - | 174,502 | 2 | (2 | ) | - | - | - | |||||||||||||||||||||||
| Shares issued to investor in prior offering | - | - | 2,513 | - | - | - | - | - | ||||||||||||||||||||||||
| Stock option exercised - cashless | - | - | 2,188 | - | - | - | - | - | ||||||||||||||||||||||||
| Common stock issued for cash | - | - | 4,025,000 | 40 | 12,074,960 | - | - | 12,075,000 | ||||||||||||||||||||||||
| Offering costs | - | - | - | - | (1,017,623 | ) | - | - | (1,017,623 | ) | ||||||||||||||||||||||
| Net loss | - | - | - | - | - | - | (12,518,377 | ) | (12,518,377 | ) | ||||||||||||||||||||||
| December 31, 2019 | - | - | 16,393,171 | $ | 164 | $ | 35,857,835 | $ | (7,447 | ) | $ | (29,015,134 | ) | $ | 6,835,418 | |||||||||||||||||
See accompanying notes to consolidated financial statements
F-4
CONSOLIDATED STATEMENTS OF CASH FLOWS
| Year ended December 31, 2019 |
Year ended December 31, 2018 |
|||||||
| CASH FLOWS FROM OPERATING ACTIVITIES: | ||||||||
| Net loss | $ | (12,518,377 | ) | $ | (11,243,903 | ) | ||
| Depreciation and amortization | 70,400 | 900 | ||||||
| Amortization of debt discount | - | 1,515,191 | ||||||
| Interest expense on beneficial conversion feature | - | 368,757 | ||||||
| Stock-based compensation | 1,988,626 | 2,280,842 | ||||||
| Changes in operating assets and liabilities: | - | |||||||
| Accounts receivable | 76,497 | (120,177 | ) | |||||
| Deferred expense | 20,927 | 14,226 | ||||||
| Other current assets | (251,088 | ) | (45,777 | ) | ||||
| Accounts payable | 1,375,704 | (362,530 | ) | |||||
| Accrued liabilities | 128,055 | 747,358 | ||||||
| Insurance reserve | 984,450 | 348,442 | ||||||
| Deferred revenues | 11,044 | 6,046 | ||||||
| Settlement paid | - | (24,444 | ) | |||||
| Net cash used in operating activities | (8,113,762 | ) | (6,515,069 | ) | ||||
| CASH FLOWS FROM INVESTING ACTIVITIES: | ||||||||
| Purchase of property and equipment and intangibles | (1,207 | ) | (233,136 | ) | ||||
| Deposits and other | (5,000 | ) | 35,460 | |||||
| Net cash used in investing activities | (6,207 | ) | (197,676 | ) | ||||
| CASH FLOWS FROM FINANCING ACTIVITIES: | ||||||||
| Proceeds from sale of common stock | 12,075,000 | 12,600,000 | ||||||
| Proceeds from exercise of warrants | 873,403 | - | ||||||
| Proceeds from exercise of stock options | 81,459 | - | ||||||
| Offering costs associated with underwriters in public offering | (753,750 | ) | (1,260,000 | ) | ||||
| Proceeds from convertible debt | - | 2,778,579 | ||||||
| Offering costs | (263,873 | ) | (637,547 | ) | ||||
| Repayment of note payable | - | (50,000 | ) | |||||
| Repayment of note payable - related parties | - | (300,000 | ) | |||||
| Receipt of subscription receivable | - | 132,640 | ||||||
| Net cash provided by financing activities | 12,012,239 | 13,263,672 | ||||||
| Increase in cash and cash equivalents | 3,892,270 | 6,550,927 | ||||||
| Cash and cash equivalents, beginning of period | 6,764,870 | 213,944 | ||||||
| Cash and cash equivalents, end of period | $ | 10,657,140 | $ | 6,764,870 | ||||
| Supplemental disclosures of cash flow information: | ||||||||
| Cash paid for interest | $ | - | $ | 64,414 | ||||
| Cash paid for income taxes | $ | 800 | $ | 800 | ||||
| Non cash investing and financing activities: | ||||||||
| Interest on subscription receivable | $ | - | 402 | |||||
| Discount on convertible notes with warrants | $ | - | $ | 1,107,982 | ||||
| Preferred stock converted to common stock | $ | - | $ | 1,591,886 | ||||
| Conversion of convertible notes and interest | $ | - | $ | 3,136,996 | ||||
| Discount from beneficial conversion feature | $ | - | $ | 368,757 | ||||
See accompanying notes to consolidated financial statements
F-5
NOTES TO CONSOLIDATED FINANCIAL STATEMENTS
NOTE 1 – NATURE OF OPERATIONS
HyreCar Inc. (which may be referred to as “HyreCar,” the “Company,” “we,” “us” or “our”) was incorporated on November 24, 2014 (“Inception”) in the State of Delaware. The Company’s headquarters is located in Los Angeles, California. The Company operates a web-based marketplace that allows car and fleet owners to rent their cars to Uber, Lyft and other gig economy service drivers safely, securely and reliably. The consolidated financial statements of HyreCar Inc. are prepared in accordance with accounting principles generally accepted in the United States of America (“U.S. GAAP”).
Follow-On Public Offering
On July 23, 2019 and July 29, 2019, the Company closed a follow-on public offering (the “Follow-On Public Offering”), in which the Company issued and sold 4,025,000 shares of common stock at a price of $3.00 per share for gross proceeds of $12,075,000, before deducting underwriters’ discounts and commissions totaling $603,750 and reimbursable expenses of $150,000. Accordingly, net proceeds from the offering totaled $11,321,250. In connection with the offering, we paid additional offering costs of $263,873.
NOTE 2 – SUMMARY OF SIGNIFICANT ACCOUNTING POLICIES
Management’s Plans
We have incurred operating losses since Inception and historically relied on debt and equity financing for working capital. Throughout the next 12 months, the Company intends to fund its operations through revenue from operations, the remaining capital raised through the Follow-On Public Offering and cash received on April 13, 2020 through a Paycheck Protection Plan Loan (“PPP Loan”) for $2,004,175. Based on the revenue and margin impact of the COVID-19 situation, we have already adjusted many of the variable expenses which make up a significant portion of our entire cost structure and continue to adjust other operating costs appropriate for the situation. The PPP Loan, in addition to our existing capital and the ability to reduce expense levels further if necessary depending on the duration of the COVID-19 situation, causes us to continue to believe the Company has sufficient resources to continue as a going concern.
Basis of Presentation and Use of Estimates
The preparation of consolidated financial statements in conformity with U.S. GAAP requires management to make certain estimates and assumptions that affect the reported amounts of assets and liabilities, and the reported amount of revenues and expenses during the reporting period. Actual results could materially differ from these estimates. It is reasonably possible that changes in estimates will occur in the near term.
The Company’s most significant estimates and judgments involve recognition of revenue and estimates for future contingent customer incentive obligations, calculating insurance reserves, the measurement of the Company’s stock-based compensation, including the estimation of the underlying deemed fair value of common stock in periods prior to the date of the Company’s initial public offering (“IPO”), the estimation of the fair value of market-based awards, the valuation of warrants, allowance for doubtful accounts, and the fair value of financial instruments.
The Company historically has classified insurance reserves related to insurance deductibles and damages paid by the Company as part of operating expenses within general and administrative costs rather than part of cost of revenues. In the prior years, the Company had a discretionary policy whereby it chose, on a selective basis, whether to pay for a driver’s insurance deductible and damages to a driver’s vehicle. This policy was akin to an incentive to maintain a the relationship with the effected parties, on a case-by-case basis, depending on the relationship between the owner and the Company as well as other factors.
F-6
The Company revised its insurance agreements and protection plans it offers to vehicle owners in 2019, whereby the Company was required to pay for certain insurance deductible and damages, showing that such expenses were no longer discretionary. The change in our insurance arrangements and policy with our customers, that required the Company to pay for such costs changed the nature of such costs to cost of revenues rather than operating expenses.
During 2019, these costs were presented as a part of general and administrative expense within the quarterly 10-Q filings. The Company concluded that the costs are more appropriately recorded in cost of revenues. The change is recorded through prospectively application starting in 2019 and does not affect net income or earnings per share as this moves the same total expenses formerly classified as operating expenses to cost of sales. The effects of the change are presented in the following table which includes an excerpt summary of the quarterly results of operations for fiscal year 2019:
| Previously Reported March 31, | Adjusted March 31, | Previously Reported June 30, | Adjusted June 30, | Previously Reported September 30, | Adjusted September 30, | |||||||||||||||||||
| Revenue | 3,510,725 | 3,510,725 | 3,801,092 | 3,801,092 | 3,710,272 | 3,710,272 | ||||||||||||||||||
| Cost of Revenues | 1,559,275 | 2,015,048 | 1,493,987 | 2,110,193 | 1,372,338 | 2,219,275 | ||||||||||||||||||
| Gross Profit | 1,951,450 | 1,495,677 | 2,307,105 | 1,690,899 | 2,337,934 | 1,490,997 | ||||||||||||||||||
| Operating Expenses: | ||||||||||||||||||||||||
| General and administrative | 2,035,552 | 1,579,779 | 2,544,152 | 1,927,946 | 3,189,040 | 2,342,103 | ||||||||||||||||||
| Sales and marketing | 1,164,791 | 1,164,791 | 1,272,836 | 1,272,836 | 2,271,892 | 2,271,892 | ||||||||||||||||||
| Research and development | 479,996 | 479,996 | 568,657 | 568,657 | 560,242 | 560,242 | ||||||||||||||||||
| Total operating expenses | 3,680,339 | 3,224,566 | 4,385,645 | 3,769,439 | 6,021,174 | 5,174,237 | ||||||||||||||||||
| Operating loss | (1,728,889 | ) | (1,728,889 | ) | (2,078,540 | ) | (2,078,540 | ) | (3,683,240 | ) | (3,683,240 | ) | ||||||||||||
Fair Value of Financial Instruments
Fair value is defined as the exchange price that would be received for an asset or paid to transfer a liability (an exit price) in the principal or most advantageous market for the asset or liability in an orderly transaction between market participants as of the measurement date. Applicable accounting guidance provides an established hierarchy for inputs used in measuring fair value that maximizes the use of observable inputs and minimizes the use of unobservable inputs by requiring that the most observable inputs be used when available. Observable inputs are inputs that market participants would use in valuing the asset or liability and are developed based on market data obtained from sources independent of the Company. Unobservable inputs are inputs that reflect the Company’s assumptions about the factors that market participants would use in valuing the asset or liability. There are three levels of inputs that may be used to measure fair value:
| Level 1 | - Observable inputs that reflect quoted prices (unadjusted) for identical assets or liabilities in active markets. |
| Level 2 | - Include other inputs that are directly or indirectly observable in the marketplace. |
| Level 3 | - Unobservable inputs which are supported by little or no market activity. |
The fair value hierarchy also requires an entity to maximize the use of observable inputs and minimize the use of unobservable inputs when measuring fair value.
Fair-value estimates discussed herein are based upon certain market assumptions and pertinent information available to management as of December 31, 2019 and 2018. The respective carrying value of certain on-balance-sheet financial instruments approximated their fair values. These financial instruments include cash and cash equivalents, accounts payable, and accrued liabilities. Fair values for these items were assumed to approximate carrying values because of their short-term nature or they are payable on demand.
F-7
Cash and Cash Equivalents
For purpose of the statement of cash flows, the Company considers institutional money market funds and all highly liquid debt instruments purchased with an original maturity of three months or less to be cash equivalents.
Accounts Receivable
Accounts receivable are reported net of allowance for expected losses. It represents the amount management expects to collect from outstanding balances. Differences between the amount due and the amount management expects to collect are charged to operations in the year in which those differences are determined, with an offsetting entry to a valuation allowance. As of December 31, 2019, and 2018, the Company has no reserve allowance. As of December 31, 2018, one customer made up 100% the balance in accounts receivable whereas there were no such concentrations as of December 31, 2019. The Company does not believe the loss of this customer would have a material impact on the Company’s financial position, results of operations, or cash flows.
Property and Equipment
Property and equipment are stated at cost. The Company’s fixed assets are depreciated using the straight-line method over the estimated useful life ranging from 3 to 5 years. Leasehold improvements are depreciated over the shorter of the useful life or lease life. Maintenance and repairs are charged to operations as incurred. Significant renewals and betterments are capitalized. At the time of retirement or other disposition of property and equipment, the cost and accumulated depreciation are removed from the accounts and any resulting gain or loss is reflected in operations. Property and equipment at December 31, 2019 was made up of equipment and software. Depreciation expense for the years ended December 31, 2019 and 2018 was $2,682 and $900, respectively.
Offering Costs
The Company accounts for offering costs in accordance with Accounting Standards Codification (“ASC”) 340, Other Assets and Deferred Costs. Prior to the completion of an offering, offering costs were capitalized as deferred offering costs on the consolidated balance sheets. The deferred offering costs are netted against the proceeds of the offering in consolidated statements of changes in stockholders’ equity (deficit) or the related debt, as applicable.
Internal Use Software
We incur software development costs to develop software programs to be used solely to meet our internal needs and cloud-based applications used to deliver our services. In accordance with Accounting Standards Codification (“ASC”) 350-40, Internal-Use Software, we capitalize development costs related to these software applications once a preliminary project stage is complete, funding has been committed, and it is probable that the project will be completed, and the software will be used to perform the function intended. As of December 31, 2019 and 2018, the Company has capitalized $221,623 of internal software related costs, which is included in intangible assets in the accompanying consolidated balance sheets and being amortized over 3 years. Amortization expense for the years ended December 31, 2019 and 2018 was $67,718 and $0, respectively.
Impairment of Long-Lived assets
The long-lived assets held and used by the Company are reviewed for impairment no less frequently than annually or whenever events or changes in circumstances indicate that the carrying amount of an asset may not be recoverable. In the event facts and circumstances indicate that the cost of any long-lived assets may be impaired, an evaluation of recoverability is performed. There were no impairment losses during the years ended December 31, 2019 and 2018. There can be no assurance, however, that market conditions will not change or demand for the Company’s products and services will continue, which could result in impairment of long-lived assets in the future.
F-8
Deferred Rent
The Company recognizes rental expense on a straight-line basis from the time of the lease commencement date through the end of the lease. As of December 31, 2019 and 2018, the Company recognized deferred rent resulting from future escalating lease payments and abated rent totaling $98,000 and $73,886, which is included in accrued liabilities in the accompanying consolidated balance sheets.
Insurance Reserves
The Company records a loss reserve for insurance deductible or physical damage that the Company pays to car owners based on the Company’s policy in relation to the insurance policy in effect at the time. This reserve represents an estimate for both reported accidents claims not yet paid, and claims incurred but not yet reported and are recorded on a non-discounted basis. The lag time in reported claims is minimal and as such represents a low risk of unreported claims being excluded from the loss reserve assessment. The adequacy of the reserve is monitored quarterly and is subject to adjustment in the future based upon changes in claims experience, including the number of incidents for which the Company is ultimately responsible and changes in the cost per claim, or changes to the Company’s policy as to what amounts of the deductible or claim will be paid by the Company. As of December 31, 2019 and 2018, $1,332,892 and $348,442 was included in the accompanying consolidated balance sheets, respectively, related to the loss reserve, where the expense is included in costs of revenues in 2019 and general and administrative expense in 2018, as further described above.
Liability insurance claims may take several years to completely settle, and the Company has limited historical loss experience. Because of the limited operational history, the Company makes certain assumptions based on currently available information to estimate the reserves as well as third party claims adjuster data provided on existing claims. A number of factors can affect the actual cost of a claim, including the length of time the claim remains open, economic and healthcare cost trends and the results of related litigation. Furthermore, claims may emerge in future periods for events that occurred in a prior period that differs from expectations. Accordingly, actual losses may vary significantly from the estimated amounts reported in the consolidated financial statements. Reserves are continually reviewed and adjusted as necessary as experience develops or new information becomes known. However, ultimate results may differ from the Company’s estimates, which could result in losses over the Company’s reserved amounts. Such adjustments are recorded in general and administrative expenses.
Convertible Debt and Warrant
Convertible debt is accounted for under the guidelines established by ASC 470-20, Debt with Conversion and Other Options. ASC 470-20 governs the calculation of an embedded beneficial conversion and/or debt issued with warrants, which is treated as a discount to the instruments where derivative accounting does not apply. The discounts are accreted over the term of the debt.
The Company calculates the fair value of warrants and conversion features issued with convertible instruments using the Black-Scholes valuation method, using the same assumptions used for valuing employee options for purposes of ASC 718, Compensation – Stock Compensation, except the contractual life of the warrant or conversion feature is used. Under these guidelines, the Company allocates the value of the proceeds received from a convertible debt transaction between the conversion feature and any other detachable instruments (such as warrants) on a relative fair value basis. The allocated fair value is recorded as a debt discount or premium and is amortized over the expected term of the convertible debt to interest expense.
Preferred Stock
ASC 480, Distinguishing Liabilities from Equity, includes standards for how an issuer of equity classifies and measures on its consolidated balance sheets certain financial instruments with characteristics of both liabilities and equity.
Management is required to determine the presentation for the preferred stock because of the redemption and conversion provisions, among other provisions. Specifically, management is required to determine whether the embedded conversion feature in the preferred stock is clearly and closely related to the host instrument, and whether the bifurcation of the conversion feature is required and whether the conversion feature should be accounted for as a derivative instrument. If the host instrument and conversion feature are determined to be clearly and closely related (both more akin to equity), derivative liability accounting under ASC 815, Derivatives and Hedging, is not required. Management determined the host contract of the preferred stock is more akin to equity, and accordingly, derivative liability accounting is not required by the Company. The Company has presented preferred stock within the consolidated statements of changes in stockholders’ equity (deficit) section of the consolidated balance sheets.
F-9
Costs incurred directly for the issuance of the preferred stock were recorded as a reduction of gross proceeds received by the Company, resulting in a discount to the preferred stock.
In connection with the closing of the Company’s Initial Public Offering (“IPO”), all outstanding shares of convertible preferred stock were converted into 2,429,638 shares of common stock.
Revenue Recognition
The Company generates the majority of its revenue from its ridesharing marketplace that connects vehicle owners and drivers and the related insurance issued for each rental.
The Company also recognizes revenue from other sources such as referrals, motor vehicle record fees (application fees), late rental fees, and other fees charged to drivers in specific situations.
The Company has adopted Accounting Standards Codification Topic 606 (“ASC 606”) – Revenue from Contracts with Customers, as of January 1, 2019 using the modified retrospective method. The adoption of ASC 606 did not materially impact the way the Company recognizes revenue.
In applying the guidance of ASC 606, the Company 1) identifies the contract with the customer 2) identifies the performance obligations in the contract 3) determines the transaction price, 4) determines if an allocation of that transaction price is required to the performance obligations in the contract, and 5) recognizes revenue when or as the companies satisfies a performance obligation.
Refunds may occur when the driver returns the owner vehicle early based on the terms of the original contract or cancels the rental prior to completing the exchange. In limited circumstances, the Company provides contingent consideration in the form of a rebate that is redeemable only if the customer completes a specific level of transaction over a specific time period. In such cases, the rebate or refund obligation is recognized as a reduction of revenues. The Company defers revenue in all instances when the earnings process is not yet complete.
The following is a breakout of revenue components by subcategory for the years ended December 31, 2019 and 2018.
| 2019 | 2018 | |||||||
| Insurance and administration fees | $ | 7,845,803 | $ | 5,090,441 | ||||
| Transaction fees | 6,623,894 | 3,479,004 | ||||||
| Other fees | 1,953,498 | 1,557,084 | ||||||
| Incentives and rebates | (568,271 | ) | (349,450 | ) | ||||
| Net revenue | $ | 15,854,924 | $ | 9,777,079 | ||||
Insurance and transaction fees are charged to a driver in a single transaction. Drivers currently do not have an option to decline insurance at any point during the transaction.
Principal Agent Considerations
The Company evaluates our service offerings to determine if we are acting as the principal or as an agent, which we consider in determining if revenue should be reported gross or net. One of our primary revenue source is a transaction fee made from a confirmed booking of a vehicle on our platform. Key indicators that we evaluate to reach this determination include:
| ● | the terms and conditions of our contracts; |
F-10
| ● | whether we are paid a fixed percentage of the arrangement’s consideration or a fixed fee for each transaction; |
| ● | the party which sets the pricing with the end-user, has the credit risk and provides customer support; and |
| ● | the party responsible for delivery/fulfilment of the product or service to the end consumer. |
We have determined we act as the agent in the transaction for vehicle bookings, as we are not the primary obligor of the arrangement and receive a fixed percentage of the transaction. Therefore, revenue is recognized on a net basis.
For other fees such as insurance, referrals, and motor vehicle records (application fees) we have determined revenue should be recorded on a gross basis. In such arrangements, the Company sets pricing, has risk of economic loss, has certain credit risk, provides support services related to these transactions, and has decision making ability about service providers used.
Cost of Revenues
Cost of revenues primarily include direct fees paid for driver insurance, insurance claim payments based on the policy in effect at the time of loss as more fully described above, merchant processing fees, technology and hosting costs, and motor vehicle record fees incurred for paid driver applications.
Advertising
The Company expenses the cost of advertising and promotions as incurred. Advertising expense was $3,120,151 and $2,086,826 for the years ended December 31, 2019 and 2018, respectively.
Research and Development
We incur research and development costs during the process of researching and developing our technologies and future offerings. Our research and development costs consist primarily of non-capitalized development and maintenance costs. We expense these costs as incurred unless such costs qualify for capitalization under applicable guidance.
Stock-Based Compensation
The Company accounts for stock options issued to employees under ASC 718, Compensation – Stock Compensation. Under ASC 718, stock-based compensation cost to employees is measured at the grant date, based on the estimated fair value of the award, and is recognized as expense over the employee’s requisite vesting period. The fair value of each stock option or warrant award is estimated on the date of grant using the Black-Scholes option valuation model.
The Company measures compensation expense for its non-employee stock-based compensation under ASC 505, Equity. The fair value of the option issued or committed to be issued is used to measure the transaction, as this is more reliable than the fair value of the services received. The fair value is measured at the value of the Company’s common stock or equity award on the date that the commitment for performance by the counterparty has been reached or the counterparty’s performance is complete.
Stock-based compensation is included in operating expenses in the consolidated statements of operations as follows:
| Year ended December 31, 2019 | Year ended December 31, 2018 | |||||||
| General and administrative | $ | 1,565,602 | $ | 2,083,269 | ||||
| Sales and marketing | 304,792 | 149,586 | ||||||
| Research and development | $ | 118,823 | $ | 47,987 | ||||
F-11
Income Taxes
The Company applies ASC 740, Income Taxes (“ASC 740”). Deferred income taxes are recognized for the tax consequences in future years of differences between the tax bases of assets and liabilities and their consolidated financial statements reported amounts at each period end, based on enacted tax laws and statutory tax rates applicable to the periods in which the differences are expected to affect taxable income. Valuation allowances are established, when necessary, to reduce deferred tax assets to the amount expected to be realized. The provision for income taxes represents the tax expense for the period, if any, and the change during the period in deferred tax assets and liabilities. At December 31, 2019 and 2018, the Company has established a full allowance against all deferred tax assets.
ASC 740 also provides criteria for the recognition, measurement, presentation and disclosure of uncertain tax positions. A tax benefit from an uncertain position is recognized only if it is “more likely than not” that the position is sustainable upon examination by the relevant taxing authority based on its technical merit.
Loss per Common Share
The Company presents basic loss per share (“EPS”) and diluted EPS on the face of the consolidated statements of operations. Basic loss per share is computed as net loss divided by the weighted average number of common shares outstanding for the period. For periods in which we incur a net loss, the effects of potentially dilutive securities would be antidilutive and would be excluded from diluted EPS calculations. For the year ended December 31, 2019 and 2018, there were 2,753,945 and 2,726,464 options or warrants excluded, and 341,000 and 0 restricted stock units excluded, respectively.
Concentration of Credit Risk
The Company maintains its cash with a major financial institution located in the United States of America which it believes to be credit worthy. Balances are insured by the Federal Deposit Insurance Corporation up to $250,000. At times, the Company maintains balances in excess of the federally insured limits.
Other Concentrations
The Company has historically relied on a single insurance broker and one underwriter to provide all automobile insurance on vehicles in service over the last few years. There are multiple brokers and carriers who issue this type of insurance coverage, and the Company is regularly making reviewing leading insurers in the transportation and mobility sectors as this is an important part of our operations. The company does not believe the loss of our current broker or underwriter would have a material effect on our operations.
New Accounting Standards
In February 2016, the Financial Accounting Standards Board (“FASB”) issued Accounting Standards Update (“ASU”) No. 2016-02, Leases (Topic 842), specifying the accounting for leases, which supersedes the leases requirements in Topic 840, Leases. The objective of Topic 842 is to establish the principles that lessees and lessors shall apply to report useful information to users of consolidated financial statements about the amount, timing, and uncertainty of cash flows arising from a lease. Lessees are permitted to make an accounting policy election to not recognize the asset and liability for leases with a term of twelve months or less. Lessors’ accounting is largely unchanged from the previous accounting standard. In addition, Topic 842 expands the disclosure requirements of lease arrangements. Lessees and lessors will use a modified retrospective transition approach, which includes several practical expedients. This guidance is effective for fiscal years, and interim periods within those fiscal years, beginning after December 15, 2020 for emerging growth companies, with early adoption permitted. The Company has reviewed the provisions of the new standard, but it is not expected to have a significant impact on the Company.
In May 2014, the FASB issued ASU No. 2014-09, Revenue from Contracts with Customers (Topic 606) and has issued subsequent amendments to this guidance. This new standard replaced all then current guidance on this topic and eliminate all industry-specific guidance. The new revenue recognition standard provides a unified model to determine when and how revenue is recognized. The core principle is that a company should recognize revenue to depict the transfer of promised goods or services to customers in an amount that reflects the consideration for which the entity expects to be entitled in exchange for those goods or services. The guidance was effective for interim and annual periods beginning after December 15, 2017 for public business entities and December 31, 2018 for all other entities. The Company adopted ASC 606 as of January 1, 2019 using the modified retrospective method and based on our analysis did not have a material effect on revenue recognition.
F-12
In June 2016, the FASB issued guidance that sets forth a current expected credit loss impairment model for financial assets, which replaces the current incurred loss model, and in 2018 and 2019 issued amendments and updates to the new standard. This model requires a financial asset (or group of financial assets), including trade receivables, measured at amortized cost to be presented at the net amount expected to be collected with an allowance for credit losses deducted from the amortized cost basis. The allowance for credit losses should reflect management’s current estimate of credit losses that are expected to occur over the remaining life of a financial asset. This guidance is effective for annual periods beginning after December 15, 2019 and interim periods within those annual periods using a modified retrospective transition method. The Company has reviewed the provisions of the new standard, but it is not expected to have a significant impact on the Company.
In December 2019, the FASB issued guidance that simplifies the accounting for income taxes by removing certain exceptions in existing guidance and improves consistency in application by clarifying and amending existing guidance. This guidance is effective for annual periods beginning after December 15, 2020, and interim periods within those annual periods, where the transition method varies depending upon the specific amendment. Early adoption is permitted, including adoption in any interim period. An entity that elects to early adopt the amendments in an interim period should reflect any adjustments as of the beginning of the annual period that includes that interim period, and all amendments must be adopted in the same period. The Company has reviewed the provisions of the new standard, but it is not expected to have a significant impact on the Company.
The FASB issues ASUs to amend the authoritative literature in ASC. There have been several ASUs to date, including those above, that amend the original text of ASC. Management believes that those issued to date either (i) provide supplemental guidance, (ii) are technical corrections, (iii) are not applicable to us or (iv) are not expected to have a significant impact our consolidated financial statements.
NOTE 3 – COMMITMENTS AND CONTINGENCIES
Settlement and Legal
Except as may be set forth below, we are not a party to any legal proceedings, and we are not aware of any claims or actions pending or threatened against us. In the future, we might from time to time become involved in litigation relating to claims arising from our ordinary course of business, the resolution of which we do not anticipate would have a material adverse impact on our financial position, results of operations or cash flows.
On November 13, 2018, two founders of the Company (the “Claimant Founders”), initiated two lawsuits in the Superior Court of California, County of San Francisco, entitled Nathaniel Farber v. HyreCar Inc., Case No. CGC-18-571257 and Josiah Larkin v. HyreCar Inc., Case No. CGC-18-571258. The complaints for the lawsuits, which were largely duplicative, alleged that the Company breached a Settlement Agreement by and between the Company and the Claimant Founders by not allowing the Claimant Founders to sell stock in the Company’s initial public offering (“IPO”), failing to buyback Claimant Founders’ stock at the time of the IPO, allowing the issuance of certain stock without proportionately increasing the stock ownership of Claimant Founders, and not providing certain required information to the Claimant Founders. The Company strongly disagreed with all of the allegations and has vigorously contested both lawsuits. The Company believes that, at all times, its actions have been consistent with the terms, conditions, and context of the Settlement Agreement, as well as applicable law. Pursuant to a motion brought by the Company, the two lawsuits were joined for pretrial and trial purposes. The joined litigation is currently in the discovery phase. As the case has been litigated, the Claimant Founders have narrowed their allegations significantly. Mr. Larkin dismissed all of his claims in their entirety. Mr. Farber dismissed all of his allegations except for an allegation that the Company failed to buyback the Claimant Founders’ stock at the time of the IPO. HyreCar believes that this remaining claim is without merit and has filed a motion for summary judgment regarding the same. Mr. Farber has filed his own motion for summary judgment, which HyreCar believes lacks merit and will vigorously challenge. At this time, the Company is unable to estimate potential damage exposure, if any, related to the litigation.
F-13
Agreements
In November 2017, the Company entered into a 180-day agreement with a third-party broker/dealer to assist in raising funds under a private placement. For their services, they were to receive five percent (5%) of the gross proceeds under the placement as a success fee defined by the agreement, non-callable warrants equal to ten percent (10%) of the aggregate number of shares of common stock, or in the case of non-convertible securities, the aggregate number of shares of common stock issuable as if the non-convertible securities were convertible into common stock at the public stock price on the date of closing if the Company is public or valuation per share on the date of closing if the Company is private (excluding warrants) sold to potential investors in the placement. The warrants were to entitle the holder to purchase securities of the Company at the same terms as issued under the placement, except that the exercise price of the warrants would be 110% of the lesser of (a) the price at which securities (excluding the value of any warrants) are issued or (b) the exercise price of any warrants issued to entities funding the placement. The agreement also called for $20,000 due upon execution of the agreement and non-accountable expense cash fees equal to three percent (3%) of the gross proceeds due and payable immediately upon the closing of the placement. The compensation terms of this agreement were modified on June 22, 2018 prior to the IPO such that 15,445 warrants were issued with a five-year term and exercise price of $2.80. The Company valued the warrants similar to stock options in Note 5 which was recorded as a discount on the related debt, Accordingly, the Company recorded $46,600 of interest expense related to the accretion of the discount upon conversion of the 2018 Convertible Notes. See Note 4 for 2018 Convertible Notes related to this agreement.
Other
In November 2017, the Company entered into a lease in Los Angeles, California commencing April 1, 2018, with the ability to occupy the facility in January 2018. The lease term is 39 months from the commencement date. Annual base rent is as follows: 2020 - $356,145, 2021 - $183,489, respectively. The lease required a deposit of $90,000. Per the lease agreement, the monthly rate will range from $27,708 to $31,167 a month prior to discounts and abatements that may apply. The Company also rents office furniture and incurs ancillary fees for building services and shared expenses. Rent expense for the years ended December 31, 2019 and 2018 was $274,969 and $321,681, respectively.
NOTE 4 – DEBT AND LIABILITIES
Accrued Liabilities
A summary of accrued liabilities for the years ended December 31, 2019 and 2018 is as follows:
| 2019 | 2018 | |||||||
| Accrued payables | $ | 394,896 | $ | 425,307 | ||||
| Driver deposits | 161,601 | 192,769 | ||||||
| Deferred rent | 98,000 | 73,886 | ||||||
| Payroll liabilities | 161,113 | 3,154 | ||||||
| Other accrued liabilities | 88,302 | 53,741 | ||||||
| Accrued liabilities | $ | 903,912 | $ | 775,857 | ||||
F-14
2017 Notes Payable
In April and May 2017, the Company issued promissory notes to related parties totaling $300,000 and a third party totaling $50,000 with the same terms and conditions (collectively, the “2017 Notes”) and issued five-year warrants to purchase up to 200,000 shares of common stock with an exercise price of $2.10 per share. The Company calculated the relative fair value of the warrants using a Black-Scholes option pricing model with similar inputs as disclosed for stock options in Note 5, resulting in a discount of $84,031. During the year ended December 31, 2018, the Company accreted the remaining $25,025 of this discount to interest expense. The outstanding balance of the 2017 Notes has been repaid as of December 31, 2018.
2018 Convertible Notes and Warrants
During the first and second quarter of 2018, pursuant to a securities purchase agreement, the Company issued and sold senior secured convertible promissory notes (the “2018 Convertible Notes”) to accredited investors in the aggregate principal amount of $3,046,281. Gross principal amounts were net of $267,702 withheld for net proceeds of $2,778,579. The Company incurred additional offering costs of $67,882 for a total debt discount of $335,584, which was fully amortized by the IPO date. The 2018 Convertible Notes bore interest at the rate of 13% per annum and were due eight months from the original issue date, which ranged from September to December 2018 (the “Maturity Dates”). The 2018 Convertible Notes provided that the principal and all accrued and unpaid interest on the 2018 Convertible Notes were convertible into shares of common stock at a conversion rate equal to the lesser of $2.5480 per share or seventy percent (70%) of the IPO price per share. Upon pricing the IPO, at the option of the holders, all outstanding principal plus accrued interest underlying the 2018 Convertible Notes was converted into 1,231,165 shares of common stock at a conversion rate of $2.5480. Upon conversion, the contingent beneficial conversion feature was no longer contingent, and resulted in a discount and immediate accretion of such discount in the amount of $368,757 which was charged to interest expense in the accompanying consolidated statements of operations during the year ended December 31, 2018.
In connection with the issuance of the 2018 Convertible Notes, each holder also received contingent five-year warrants to purchase common stock in an amount equal to 50% of the shares of common stock that the holder was entitled to in connection with the conversion of the holder’s 2018 Convertible Note when such note first became convertible, which was at the time the IPO was priced. Prior to the 2018 Convertible Note being convertible, the holder did not have a right to exercise these warrants. At the IPO pricing date, 615,585 warrants to purchase common stock became exercisable upon the conversion of the outstanding balance of the 2018 Convertible Notes, including accrued interest. The warrants have an exercise price of 125% of the conversion price, or $3.185. The Company calculated the fair value of the warrants at $1,741,334 using a Black-Scholes pricing model. The Company valued the warrants at $2.8288 per warrant using a common stock fair value of $5.00, a term of five years, a volatility of 45% and a risk-free interest rate of 2.75%. The Company allocated the debt proceeds on a relative fair value basis between the note and warrant, in which the Company recognized a note discount for $1,107,982. This was immediately recognized in interest expense as of the note conversion date.
NOTE 5 – STOCKHOLDERS’ DEFICIT
Preferred Stock
The Company is authorized to issue 15,000,000 shares of preferred stock, $0.00001 par value per share. Of these, the Company designated 4,471,489 shares as Series Seed 1 Convertible Preferred Stock (“Series Seed 1”). Each share of Series Seed 1 is entitled to cast the number of votes equal to the number of whole shares of common stock into which the shares of Series Seed 1 held are convertible as of the record date. Series Seed 1 and common stock vote together as a single class, except as provided by law or by other provisions of the certificate of incorporation.
F-15
Each share of Series Seed 1 shall be convertible, at the option of the holder and at any time, into such number of shares of common stock as determined by dividing the Series Seed 1 original issue price by $0.71, subject to customary adjustments for stock dividends, stock splits, or other recapitalization with respect to the Series Seed 1.
On June 29, 2018, at the closing of the IPO, all outstanding shares of Series Seed 1 Convertible Preferred Stock were automatically converted into 2,429,638 shares of our common stock. As of December 31, 2019 and 2018, there were no shares of Series Seed I Preferred outstanding, respectively.
Common Stock
The Company is authorized to issue 50,000,000 shares of common stock, $0.00001 par value per share.
Initial Public Offering
On June 29, 2018, the Company closed its IPO, in which the Company issued and sold 2,520,000 shares of common stock at $5.00 per share for gross proceeds of $12,600,000, net of underwriters’ discounts and commissions totaling $1,260,000. Accordingly, net proceeds from the IPO totaled $11,340,000, before deducting offering costs of $569,665.
Collateralized Restricted Stock Purchases
In 2016, the Company issued 1,032,387 shares of restricted common stock to related parties that vest as follows: 33% upon a sale of securities for gross proceeds of at least $250,000 in one or more transactions and the remaining 67% vest monthly over three years, becoming fully vested in April 2019. For consideration of these shares, the related parties entered into note agreements totaling $138,700 that call for the principal and interest to be paid back in ten years from the date of the loan. The notes bear interest at 1%. The loans are secured by the related shares of common stock. On May 31, 2018, the board of directors determined that it was in the best interest of the Company, in order to comply with the requirements of Section 402 of the Sarbanes-Oxley Act of 2002 prior to filing the IPO registration statement with the SEC, to (i) issue a bonus to those related parties serving as an officer and/or director of the Company in the amount owed by each party. Each such related party bonus was used to repay and terminate the note agreements. An aggregate of $131,400 in principal was repaid and terminated along with accrued interest thereon. Remaining balance of $7,447 is outstanding to a related party that is not serving as an officer or director of the Company. As of December 31, 2019, all shares were vested.
Stock Options
In 2016, the Board of Directors adopted the HyreCar Inc. 2016 Incentive Plan (the “2016 Plan”). The 2016 Plan provides for the grant of equity awards to highly qualified personnel, including stock options, restricted stock, stock appreciation rights, and restricted stock units to purchase shares of common stock. Up to 2,227,777 shares of common stock may be issued pursuant to awards granted under the 2016 Plan. The 2016 Plan is administered by the Board of Directors, and expires ten years after adoption, unless terminated earlier by the Board.
In 2018, the Board of Directors adopted the HyreCar Inc. 2018 Incentive Plan (the “2018 Plan”). The 2018 Plan provides for the grant of equity awards to purchase shares of common stock. Up to 3,000,000 shares of common stock may be issued pursuant to awards granted under the 2018 Plan, subject to increases that occur starting in 2021. The 2018 Plan is administered by the Board of Directors, and expires ten years after adoption, unless terminated earlier by the Board.
F-16
During the year ended December 31, 2019 and 2018, the board of directors approved the grant of 1,125,000 and 697,500 stock options to various contractors and employees, respectively. The 2019 granted options had an exercise prices ranging from $3.20 - $5.53, expire in ten years, and had vesting periods from two to four years. The 2018 granted options had an exercise prices ranging from $2.21 - $5.00, expire in ten years, and had vesting periods from two to four years.
The total grant date fair value of options granted to employees was approximately $2,077,801 and $1,120,995 for the years ended December 31, 2019 and 2018, respectively.
A summary of our stock option activity for the years ended December 31, 2019 and 2018, is as follows:
| Number of shares | Weighted average exercise price | Weighted average remaining contractual life (years) | Intrinsic value | |||||||||||||
| Outstanding at December 31, 2017 | 1,021,171 | $ | 1.04 | 9.30 | ||||||||||||
| Granted | 697,500 | $ | 3.73 | - | ||||||||||||
| Exercised | - | - | - | |||||||||||||
| Forfeited or expired | (238,232 | ) | 3.59 | - | ||||||||||||
| Outstanding at December 31, 2018 | 1,480,439 | $ | 1.90 | 8.80 | $ | - | ||||||||||
| Granted | 1,125,000 | 3.41 | - | - | ||||||||||||
| Exercised | (72,891 | ) | 3.09 | - | - | |||||||||||
| Forfeited or expired | (279,342 | ) | 2.51 | - | - | |||||||||||
| Outstanding at December 31, 2019 | 2,253,206 | $ | 2.60 | 8.19 | $ | 64,761 | ||||||||||
| Exercisable at December 31, 2018 | 549,877 | $ | 0.98 | 8.40 | $ | - | ||||||||||
| Exercisable at December 31, 2019 | 892,508 | $ | 1.82 | 7.30 | $ | 724,208 | ||||||||||
The aggregate intrinsic value is calculated as the difference between the exercise price of the underlying awards and the closing stock price of $2.63 of common stock on December 31, 2019
Stock-based compensation expense for stock options for the years ended December 31, 2019 and 2018 was $1,047,686 and $446,417 respectively.
As of December 31, 2019, the total estimated remaining stock-based compensation expense for unvested stock options is approximately $1,758,562 which is expected to be recognized over a weighted average period of 2.3 years.
The Company estimates the fair value of stock options that contain service and/or performance conditions using the Black-Scholes option pricing model. The range of input assumptions used by the Company were as follows:
| Year Ended | ||||||||
| December 31, 2019 | December 31, 2018 | |||||||
| Expected volatility | 45 | % | 45 | % | ||||
| Risk-free interest rate | 1.73 – 2.39 | % | 1.95 – 2.99 | % | ||||
| Expected life in years | 5.56 | 5.39 – 6.25 | ||||||
| Expected dividend yield | 0 | % | 0 | % | ||||
F-17
The Company recognizes stock option forfeitures as they occur as there is insufficient historical data to accurately determine future forfeitures rates.
The risk-free interest rate assumption for options granted is based upon observed interest rates on the United States government securities appropriate for the expected term of the Company’s stock options.
The expected term of stock options is calculated using the simplified method which takes into consideration the contractual life and vesting terms of the options.
The Company determined the expected volatility assumption for options granted using the historical volatility of comparable public company’s common stock. The Company will continue to monitor peer companies and other relevant factors used to measure expected volatility for future stock option grants, until such time that the Company’s common stock has enough market history to use historical volatility.
The dividend yield assumption for options granted is based on the Company’s history and expectation of dividend payouts. The Company has never declared or paid any cash dividends on its common stock, and the Company does not anticipate paying any cash dividends in the foreseeable future.
Management estimated the fair value of common stock prior to the IPO date by looking at a market approach which takes into consideration past sales of our common and preferred stock, as well Company developments to date.
Restricted Stock Units and Shares Issued for Services
A summary of activity with our restricted stock units for the year ended December 31, 2019, is as follows:
| Number of shares | Weighted average grant date fair value per share | |||||||
| Unvested as of December 31, 2018 | - | - | ||||||
| Granted | 760,000 | $ | 4.44 | |||||
| Vested | (37,875 | ) | 2.07 | |||||
| Forfeited | (418,975 | ) | (4.70 | ) | ||||
| Unvested as of December 31, 2019 | 303,150 | $ | 3.58 | |||||
During the year ended December 31, 2019, the Company granted 360,000 restricted stock units to employees and 400,000 forfeitable restricted stock units to a consultant. The 360,000 restricted stock units vest between one and four years. The 400,000 restricted stock units vest upon achieving specific performance and strategic milestones. As none of the milestones were achieved, the 400,000 restricted stock units were forfeited during the year ended December 31, 2019.
During the year ended December 31, 2019, the Company granted 135,000 common shares in exchange for legal, consulting, and media services provided during the year. The grants had a total fair value of $607,550 based on the closing price of the Company’s common stock on the grant date.
During the year ended December 31, 2018, the Company granted 264,285 shares of restricted common stock to three consultants for services. All shares of restricted common stock fully vested upon the IPO. Accordingly, stock-based compensation of $1,321,425 was recognized during the year ended December 31, 2018, which is included in general and administrative expenses in the accompanying consolidated statements of operations.
F-18
During the year ended December 31, 2018, the Company also granted 10,000 shares of restricted common stock to a consultant for services which fully vested upon the IPO. The Company recognized stock-based compensation expense of $50,000 during the year ended December 31, 2018 for the vesting of the 10,000 shares of restricted common stock. In addition, the Company also agreed to issue the consultant an aggregate of 825,000 shares of restricted common stock with the issuance of 275,000 shares of restricted common stock upon each of three milestones. These milestones were not met and as of December 31, 2018, these equity awards were forfeited due to termination of service with the Company.
Stock-based compensation related to restricted stock units and forfeitable restricted common stock issued for services for the year ended December 31, 2019 and 2018 was $330,390 and $1,371,425, respectively. As of December 31, 2019, unrecognized compensation expense related to the unvested restricted stock units is $933,684 and is expected to be recognized over approximately 2.4 years.
Warrants
A summary of activity with our warrants for the years ended December 31, 2019 and 2018, is as follows:
| Number of shares | Weighted average exercise price |
Weighted average remaining contractual life (years) | ||||||||||
| Outstanding at December 31, 2017 | 323,659 | $ | 1.97 | 4.59 | ||||||||
| Granted | 1,046,025 | - | - | |||||||||
| Exercised | - | - | - | |||||||||
| Forfeited or expired | (123,659 | ) | - | - | ||||||||
| Outstanding at December 31, 2018 | 1,246,025 | $ | 3.60 | 3.60 | ||||||||
| Granted | - | - | - | |||||||||
| Exercised | (745,286) | - | - | |||||||||
| Forfeited or expired | - | - | - | |||||||||
| Outstanding at December 31, 2019 | 500,739 | $ | 3.71 | 2.68 | ||||||||
During the year ended December 31, 2019 several warrant holders exercised 274,224 warrants for cash proceeds of $873,403, and 471,062 warrants were exercised in cashless exercises, which resulted in the issuance of 174,502 shares of common stock.
On June 22, 2018, in connection with our IPO, 123,659 warrants from a prior private placement were amended to (i) decrease the amount of shares that can be purchased at an exercise price of $2.00 per share to 60,392 shares of common stock and (ii) reduce the remaining 63,267 shares to 28,993 shares at a modified exercise price of $7.50 per share, due to the fact that such placement agent warrants were earned 180 days immediately preceding the filing date of the IPO registration statement.
Relating to the 2018 Convertible Notes, warrants to purchase up to 615,585 shares of our common stock at a price of $3.185 per share were issued to the holders of such notes, and 15,455 were issued to the broker/dealer.
Relating to the IPO, the Company agreed to issue warrants to purchase up to 75,600 shares of common stock to the underwriters in connection with this primary offering, exercisable at $6.25 per share (125% of the public offering price in the IPO). The value of the warrants nets against the equity related funds raised but also is added back to equity for a net zero effect on equity.
In June 2018, the Company entered into agreements with two service provider firms pursuant to which the Company agreed to pay cash compensation and issue warrants to purchase up to an aggregate amount of 250,000 shares of common stock. The warrants are fully vested and non-forfeitable. The warrants range from three (3) or five (5) years and are exercisable for $5.00. Accordingly, stock-based compensation of $463,000 was recognized in general and administrative expenses in the accompanying consolidated statements of operations for the year ended December 31, 2108.
The Company used the Black-Scholes pricing model to value the above warrants, which had similar inputs to stock options included in the stock option section above except for the expected life of the warrants, which was set to match the related term of the warrant.
As of December 31, 2019 and 2018, all warrants granted as of such dates were vested.
NOTE 6 – RELATED PARTY TRANSACTIONS
Related Party Advances
From time to time prior to 2017, the Company received advances from related parties for short-term working capital. Such advances are considered short-term and non-interest bearing and due on demand. As of December 31, 2019 and 2018 $9,629, remained outstanding.
Notes Payable
See Note 4 for disclosure of notes payable to related parties.
F-19
Insurance
The president of the Company’s primary insurance broker is also a minority stockholder and holder of warrants from the 2017 Notes. As of December 31, 2019 and 2018, the Company had outstanding balances to the insurer totaling $101,167 and $275,290, included in accounts payable, respectively. During the years ended December 31, 2019 and 2018, the Company paid the insurer approximately $5,008,000 and $4,304,000, respectively.
NOTE 7 – INCOME TAXES
The following table presents the current and deferred tax provision for federal and state income taxes for the years ended December 31, 2019, and 2018:
| Current tax provision | ||||||||
| Federal | $ | - | $ | - | ||||
| State | 800 | 800 | ||||||
| Total | $ | 800 | $ | 800 | ||||
| Deferred tax provision (benefit) | ||||||||
| Federal | $ | (2,024,000 | ) | $ | (1,482,000 | ) | ||
| State | (674,000 | ) | (410,000 | ) | ||||
| Valuation allowance | 2,698,000 | 1,892,000 | ||||||
| Total | - | - | ||||||
| Total provision for income taxes | $ | 800 | $ | 800 | ||||
The components of our deferred tax assets (liabilities) for federal and state income taxes consisted of the following as of December 31, 2019 and 2018:
| 2019 | 2018 | |||||||
| Deferred tax asset attributable to: | ||||||||
| Net operating loss carryover | $ | 5,956,000 | $ | 3,258,000 | ||||
| Valuation allowance | (5,956,000 | ) | (3,258,000 | ) | ||||
| Net deferred tax asset | $ | - | $ | - | ||||
No federal tax provision has been provided for the years ended December 31, 2019 and 2018 due to the losses incurred during such periods. The Company’s effective tax rate is different from the federal statutory rate of 21% due primarily to operating losses that receive no tax benefit because of a valuation allowance recorded for such losses.
| 2019 | 2018 | |||||||
| Statutory US Federal tax rate | 21.0 | % | 21.0 | % | ||||
| Permanent differences: | ||||||||
| State income taxes, net of Federal benefit | 7.0 | % | 7.0 | % | ||||
| Stock compensation | -1.4 | % | -4.8 | % | ||||
| Other | -0.5 | % | -4.8 | % | ||||
| Temporary differences | -5.4 | % | -0.9 | % | ||||
| Valuation allowance | -21.8 | % | -17.5 | % | ||||
| Total | 0.0 | % | 0.0 | % | ||||
Based on federal tax returns to be filed through December 31, 2019, we had available approximately $21,270,000 in recalculated U.S. and state tax net operating loss carry forwards, pursuant to the Tax Reform Act of 1986, which assesses the utilization of a Company’s net operating loss carry forwards resulting from retaining continuity of its business operations and changes within its ownership structure. Net operating loss carry forwards prior to 2018 start to expire in 2035 or 20 years for federal income and state tax reporting purposes.
F-20
NOTE 8 – SUBSEQUENT EVENTS
On January 30, 2019 the World Health Organization declared the COVID-19 coronavirus outbreak a “Public Health Emergency of International Concern” and on March 10, 2020, declared it to be a pandemic. Actions taken around the world to help mitigate the spread of the coronavirus include restrictions on travel, and quarantines in certain areas, and forced closures for certain types of public places and businesses. The COVID-19 coronavirus and actions taken to mitigate it have had and are expected to continue to have an adverse impact on the economies and financial markets of many countries, including the geographical area in which the Company operates. While it is unknown how long these conditions will last and what the complete financial effect will be to the company, to date, the Company has experienced a revenue decrease of approximately one-third of net sales from the beginning to the end of March 2020 due to lower driver demand and car supply shortages in certain metropolitan markets. Our concentrations in large metropolitan markets make it reasonably possible that we are vulnerable to the risk of a significant near-term impact. In response, the Company has moved aggressively to diversity its business from to include delivery in addition to ridesharing.
The Company worked closely with our primary banking partner JPMorgan Chase to apply for a Small Business Administration (SBA) Paycheck Protection Program Loan in the amount of $2,004,175 as an existing client on April 9, 2020. The application was processed through the SBA system, the loan was approved and funded, with the Company receiving the full loan proceeds of $2,004,175 in its bank account on April 13, 2020.
F-21
Pursuant to the requirements of the Securities Exchange Act of 1934, the Registrant has duly caused this report to be signed on its behalf by the undersigned thereunto duly authorized on this 14th day of April 2020.
| HYRECAR INC. | ||
| By: | /s/ Joseph Furnari | |
| Joseph Furnari | ||
| Chief Executive Officer | ||
| By: | /s/ Scott Brogi | |
| Scott Brogi | ||
| Chief Financial Officer | ||
Pursuant to the requirements of the Securities Act of 1934, this annual report on Form 10-K has been signed below by the following persons on behalf of the registrant and in the capacities and on the dates indicated.
| Signature | Title | Date | ||
| /s/ Joseph Furnari | Chief Executive Officer and Director | April 14, 2020 | ||
| Joseph Furnari | (Principal Executive Officer) | |||
| /s/ Scott Brogi | Chief Financial Officer | April 14, 2020 | ||
| Scott Brogi | (Principal Financial and Accounting Officer) | |||
| /s/ Grace Mellis | Director | April 14, 2020 | ||
| Grace Mellis | ||||
| /s/ Brooke Skinner Ricketts | Director | April 14, 2020 | ||
| Brooke Skinner Ricketts | ||||
| /s/ Michael Root | Director | April 14, 2020 | ||
| Michael Root | ||||
| /s/ Jayaprakash Vijayan | Director | April 14, 2020 | ||
| Jayaprakash Vijayan |
-32-