Attached files
UNITED
STATES
SECURITIES AND EXCHANGE COMMISSION
Washington, D.C. 20549
FORM 10-K
ANNUAL REPORT PURSUANT TO SECTION 13 OR 15(d) OF THE SECURITIES EXCHANGE ACT OF 1934
For the fiscal year ended December 31, 2019
or
TRANSITION REPORT PURSUANT TO SECTION 13 OR 15(d) OF THE SECURITIES EXCHANGE ACT OF 1934
| BrewBilt Manufacturing Inc. |
| (Exact name of registrant as specified in its charter) |

www.brewbilt.com
| Vet Online Supply, Inc. |
| (Prior name of registrant) |
| Florida | 000-55787 | 47-0990750 | ||
| (State
or other jurisdiction of incorporation) |
(Commission File Number) |
(I.R.S.
Employer Identification No.) | ||
110
Spring Hill Road #10
Grass Valley, CA 95945
(Address of principal executive offices)
(530)
802-5023
(Registrant’s telephone number, including area code)
Indicate by check mark if the registrant is a well-known seasoned issuer, as defined in Rule 405 of the Securities Act.
Yes o No x
Indicate by check mark if the registrant is not required to file reports pursuant to Section 13 or Section 15(d) of the Act.
Yes o No x
Indicate by check mark whether the registrant (1) has filed all reports required to be filed by Section 13 or 15(d) of the Securities Exchange Act of 1934 during the preceding 12 months (or for such shorter period that the registrant was required to file such reports) and (2) has been subject to such filing requirements for the past 90 days.
Yes x No o
Indicate by check mark whether the registrant has submitted electronically and posted on its corporate Web site, if any, every Interactive Data File required to be submitted and posted pursuant to Rule 405 of Regulation S-T (§ 232.405 of this chapter) during the preceding 12 months (or for such shorter period that the registrant was required to submit and post such files).
Yes x No o
Indicate by check mark if disclosure of delinquent filers pursuant to Item 405 of Regulation S-K is not contained herein, and will not be contained, to the best of registrant’s knowledge, in definitive proxy or information statements incorporated by reference in Part III of this Form 10-K or any amendment to this Form 10-K. x
Indicate by check mark whether the registrant is a large accelerated filer, an accelerated filer, a non-accelerated filer, smaller reporting company, or an emerging growth company. See the definitions of “large accelerated filer,” “accelerated filer,” “smaller reporting company,” and “emerging growth company” in Rule 12b-2 of the Exchange Act.
| Large accelerated filer | o | Accelerated filer | o |
| Non-accelerated filer | o (Do not check if a smaller reporting company) | Smaller reporting company | x |
| Emerging growth company | x{ | ||
If an emerging growth company, indicate by check mark if the registrant has elected not to use the extended transition period for complying with any new or revised financial accounting standards provided pursuant to Section 13(a) of the Exchange Act. o{
Indicate by check mark whether the registrant is a shell company (as defined in Rule 12b-2 of the Exchange Act).
Yes o No x
Indicate the number of shares outstanding of each of the registrant’s classes of common stock as of the latest practicable date.
As of March 31, 2020, the Registrant had 34,595,672 shares of common stock issued and outstanding.
Documents incorporated by reference: None
1
TABLE OF CONTENTS
2
FORWARD-LOOKING STATEMENTS
This Annual Report on Form 10-K (“Annual Report”) contains forward-looking statements. These statements relate to future events or our future financial performance. In some cases, you can identify forward-looking statements by terminology such as “may,” “should,” “expects,” “plans,” “anticipates,” “believes,” “estimates,” “predicts,” “potential,” or “continue” or the negative of these terms or other comparable terminology.
Forward looking statements are made based on management’s beliefs, estimates and opinions on the date the statements are made, and we undertake no obligation to update forward-looking statements if these beliefs, estimates and opinions or other circumstances should change. Although we believe that the expectations reflected in the forward-looking statements are reasonable, we cannot guarantee future results, levels of activity, performance or achievements. Except as required by applicable law, including the securities laws of the United States, we do not intend to update any of the forward-looking statements to conform these statements to actual results.
The safe harbors of forward-looking statements provided by Section 21E of the Exchange Act are unavailable to issuers of penny stock. As we issued securities at a price below $5.00 per share, our shares are considered penny stock and such safe harbors set forth under the Private Securities Litigation Reform Act of 1995 are unavailable to us.
Our financial statements are stated in United States dollars and are prepared in accordance with United States generally accepted accounting principles.
In this annual report, unless otherwise specified, all dollar amounts are expressed in United States dollars and all references to “common stock” refer to the common shares in our capital stock.
As used in this Annual Report, the terms “we,” “us,” “Company,” “our”, and “BrewBilt” mean BrewBilt Manufacturing, Inc., unless otherwise indicated.
Company Overview
Located in Grass Valley, CA, BrewBilt is one of the only California companies that custom designs, hand crafts, and integrates processing, fermentation and distillation processing systems for the craft beer, cannabis and hemp industries using “Best in Class” American made components integrated with stainless steel processing vessels using only American made steel. Founded in 2014, the company began in a backyard shop by Jeff Lewis with a vision of creating a profitable company in “Rural America” by hiring excellent personnel, designing and fabricating products to exceed customer’s expectations and compensating craftsmen with living wages and profit sharing to financially sustain their families within the community. Mr. Lewis has 15+ years of experience as a craft beer brewer, a custom tank/vessel designer, fabrication and integration expert and business owner who initially founded Portland Kettle Works, a nationally recognized manufacturer of craft beer brewing equipment located in the Northwest. The Company has grown from 3 employees in 2015 to 9 in 2017.
BrewBilt has been built by having strong relationships with local suppliers of raw materials, equipment and services in California, an aggressive referral network of satisfied customers nationwide, and an Advisory Board consisting of successful business leaders that provide valuable product feedback and business expertise to management. The craft brewing & spirits industries continue to grow worldwide. California is where craft brewing began and now has over 900 operating breweries – being centrally located in this booming market was a large draw for BrewBilt to locate its manufacturing facility in the Sierra foothills.
3
All BrewBilt products are designed and fabricated as “food grade” quality which enables the company to build vessels for food & beverage processing, the company is now building systems that are pharmaceutical grade for clients involved in distillation for the cannabis and hemp industries, thus making the revenue potential much greater. BrewBilt buys materials and components mostly from California suppliers which enables them to closely monitor quality, while the company’s revenues are generated from sales to customers throughout the country. The company is aggressively pursuing international orders and has held meetings with the Center for International Trade Development and U.S. Commercial Service to develop international opportunities. Presently, a great deal of sales interest in coming from Mexico, Japan, Europe and Australia.
BrewBilt competes against a number of companies, most of which are selling mass produced equipment from China made from less costly inferior quality Chinese steel which often is neither food nor pharmaceutical grade quality. While this broader market is very competitive, there continues to be little competition and strong market demand for higher quality, custom designed, hand crafted and integrated systems that BrewBilt produces.
In July of 2016, BrewBilt moved from the small facility in Nevada City, CA to lease an eight thousand (8,000) square foot manufacturing facility in Grass Valley, CA. This facility was purchased by BrewBilt in January 2018 and upgraded with substantial tenant improvements. BrewBilt is prepared to expand again by leasing an additional seventy-six hundred (7,600) square feet in the same facility. BrewBilt obtains the majority of its leads through customer referrals and from online marketplaces. The company’s website is being expanded for online sales to include online educational/marketing videos that feature the company and its expanded integrated product line for the cannabis and hemp industries. BrewBilt has also created distribution sales agreements with individuals and companies to represent BrewBilt in both the domestic and international markets.
The former company, Vet Online Supply© continues to engage in the online sale of its own holistic product line for pets. These are holistic pet products designed to help with arthritis, compromised immune systems, stress responses, aggression and digestive issues and may also be useful in treating acute ailments like sprains and strains, torn ligaments, bone breaks and even during post-operative care to reduce swelling, pain and stiffness. The Vet Online web-based eCommerce platform will continue to offer products for the next 12 months to further evaluate the efficacy in continuing its operations within the pet industry. The website offers our existing clients the ability to purchase our products by placing their order any time of day at their convenience.
Merger Transaction
On November 22, 2019, Vet Online Supply and Brewbilt Manufacturing (“BrewBilt”) entered into an Agreement and Plan of Merger (the “Merger Agreement”) and completed a merger, whereby Brewbilt merged with and into Vet Online Supply, with BrewBilt remaining as the surviving entity (the “Merger”). Under U.S. generally accepted accounting principles, the merger is treated as a “reverse merger” under the purchase method of accounting, with BrewBilt as the accounting acquirer.
Pursuant with the Merger Asset Purchase Agreement, the Board of Directors has authorized that BrewBilt shall sell, assign and transfer all of its right, title and interest to its IP, fixed assets and “know how” to the Company (collectively, the “Seller’s Assets”). Vet Online Supply and BrewBilt mutually agree that BrewBilt will assign certain assets and provide the “Know-How” regarding the designing and building of the finest craft brewing equipment in the industry today. As consideration for the IP, fixed assets and the “Know -How”, the Company shall issue, or cause to be issued, $5,000,000 worth of Preferred Series A Stock (PAR $.001) within thirty (30) days from the date of the agreement. The number of Preferred Series A shares to be issued is 500,000 shares at a price of $10.00 per share and convertible pursuant the conversion rights as specified in the Articles of Incorporation and certificate of designation for VTNL. BrewBilt has designated that the said stock be issued in the name of its President, Jeffrey Lewis.
The Board of Directors dismissed Daniel Rushford as an officer and director, specifically as the Chief Executive Officer, Chairman of the Board, and Corporate (President) of the Company effective November 22, 2019. Effective November 22, 2019, Daniel Rushford will have a new revised Employment Agreement which appoints him as Manager of the CBD Pet Supply Division, a non-director/officer position which includes returning to Treasury 1,000 Preferred Series B Control Shares, and an annual salary of $36,000. Unpaid wages will accrue interest at 6% per annum and may be converted to restricted common stock at fair market value at the time of conversion.
4
The Board of Directors appointed Jeffrey Lewis as the new Chief Executive Officer, Chairman of the Board, Corporate President, Secretary, and Treasurer of the Company, effective November 22, 2019. Jeffrey will be provided an Employment Agreement that includes the issuance of 1,000 Preferred Series B Control Shares, and an annual salary of $200,000. Unpaid wages will accrue interest at 6% per annum and may be converted to restricted common stock at fair market value at the time of conversion.
Jeffrey Lewis is 46 years old. As the founder of BrewBilt Manufacturing, LLC, a multiple million-dollar sales and manufacturing company, he has 15 years of experience managing engineering, design and fabrication teams that custom design and fabricate integrated stainless steel distillation and brewing systems for the beverage, pharmaceutical, cannabis and hemp industries. Mr. Lewis has been a part of the design team which builds CBD cold-water and alcohol -based extraction systems in the US, and he will take charge of VTNL, and continue to drive his products into both the cannabis and brewing markets.
Our Market Opportunity
The craft beer industry offers a value of $26 billion in the United States, yet it is still an area of the economy which offers untapped potential. It is one of the fastest-growing segments of the beverage manufacturing industry today. The amount of consumer interest has been nothing short of incredible. Growth rates in sales, employment opportunities, and the total volume of beer produced have all been in double-digit percentages since 2010.
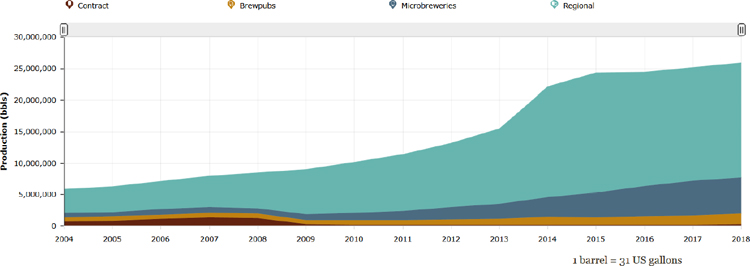
At a time when the overall beer industry saw a decrease in sales of 1% in 2017, the craft beer industry saw 5% growth. 70% of the volume that is produced by active breweries for the industry provide regional sales in the United States. 22% of the organizations are classified as microbreweries. Approximately 6% are brewpubs, while 1% list themselves as a contract brewing organization.
In 2017, there were over 196 million barrels of beer produced for sale in the United States. This volume was a 1.2% decrease from the year before. The craft beer industry still saw a 5% increase in volume as well, producing 24.8 million barrels of beer.
There are four distinct craft beer industry market segments: microbreweries, brewpubs, contactor brewers, and regional crafters. Home-brewers are sometimes grouped in with this data as well.
Essential Craft Beer Industry Statistics
California had the largest output for the craft beer industry and 2016, offering $7.3 billion in total impact. Pennsylvania finished in second during the year, with a $5.8 billion impact. They were followed by Texas ($4.5 billion), New York ($3.4 billion), and Florida ($3.1 billion). The overall beer market in the United States has a value of $111.4 billion. Although the craft beer segment has a 12.7% share of the total volume in the country, it represents over 20% of the total dollar sales that were achieved in 2017. The dollar sales growth of craft beer products in the United States was 8% in 2017. In 2017, even though there were almost 1,000 new brewery openings which occurred in the United States, there were also 165 closures that happened. This figure represents a closing rate of 2.6%, which is a 42% increase over 2016 figures one 116 craft breweries shut their doors. Adults in the United States consume an average of 26.9 gallons of beer each year, according to the National Beer Wholesalers Association. About one out of every four registered breweries in the United States are listed as a brewpub. That means the products they create for consumers are meant for direct sales that occur on their premises. The average brewery with this classification will produce about 1,000 barrels of beer each year. 95% of the breweries which are operating in the United States today produced less than 15,000 barrels of beer each year. That classifies the operation as a microbrewery if 75% or more of the beer the company produces is sold off-site About 40% of the sales that occur each year for the craft beer industry happen during the months of June, July, or August. Almost 90% of adults over the age of 21 in the United States live within 10 miles of at least one brewery. Most of these operations qualify as a craft beer producer. There are more than 700 different craft breweries operating in California right now, making it the largest source of products for the industry today.
5
The most popular variety of craft beer that is currently produced by the industry is India Pale Ale, or IPA, which contributes over $1 billion in sales each year. The top three craft beer brands in the United States in 2017 were Sierra Nevada, Samuel Adams, and Blue Moon. The brands with the highest levels of sales growth were Deschutes, Lagunitas, and Goose Island. There are over 135,000 employees working right now in small brewing businesses which support the craft beer industry in the United States. That was an increase of 6,000 positions from the year before. Vermont is the U.S. state with the highest number of craft beer breweries per capita, with 11.5 currently listed as operational. 14% of Americans say that they drink at least one beer every week. 57% of Millennials who count themselves as beer drinkers say that they consume a craft beer weekly. Colorado is the third-largest provider of craft beer products in the United States. There are currently 348 craft breweries operational, creating an economic impact of $3.03 billion each year. Over 1.5 million barrels of craft beer are produced there each year. 6% of adults over the age of 21 say that they consume at least one beer every day. 1 in 4 households which drink beer will include their favorite beverage with their holiday meal plans, especially during Thanksgiving and Christmas. 1 in 5 households say that they like to include a beer as their beverage when making a home cooked meal to consume. There are more than 4,000 different brewers in the United States which have made the decision to adopt the independent craft brewer seal. This figure represents about 85% of the volume that the craft beer industry produces each year at every level of sales, from local to national. Only 5% of the active breweries which fit the definition of a craft beer producer are not reinvesting their tax savings from recent legislative changes into their business. Most are trying to hire new employees, purchase equipment to expand their product line, or improve the benefits they have available to their workers. Some are even increasing the amount of money they give to charity. There were almost 400 IPA entries in 2018 during the Great American Beer Festival®, making it one of the competition’s most popular categories. 80% of the breweries that made the list of Top 50 beer producers in the United States qualify as being part of the craft beer industry. The three best new craft breweries in terms of total dollar sales in 2016 all came from Texas. Austin Beer Works, Live Oak Brewing Company, and Eighth Wonder Brewery combined to earn over $1.2 million in sales from their products. Half of adult beer drinkers in the United States say that they make their purchasing decisions based on the quality of the products that are available to them instead of shopping by price alone.
Since 2014, craft beer production in the United States has risen in total sales by 5.7%. Through 2018, the number of active businesses in the industry has grown by 14.1%, while the number of employment opportunities has increased by 9.2%. Every one of the 50 states in the U.S., and just over 25% of the 3,143 counties that are in the country have at least one operational brewery which supports the craft industry. In Loudoun County, which is about 30 miles outside of Washington, DC, 10 of the 12 breweries that were in business in 2016 had opened their doors since 2012. Out of the 2,802 craft breweries that were registered in the County Business Patterns program as of 2016, over 2,600 of them had 49 or fewer employees. Not a single state in the U.S. saw a decline in the overall number of breweries that were operational between 2012-2016.
Since 2016, the total number of breweries that are currently operational in California have doubled. Clark County, Washington saw the largest overall increase of craft breweries in 2016, with 13 different businesses opening their doors to start production activities. Adams County, Colorado came in second with 6, tied with Will County, Illinois, Hampshire County, Massachusetts, and Monmouth County, New Jersey. Although the number of breweries and employment opportunities continue to rise in the United States, the average wages for workers in this industry are declining. The average employee earned $969 per week in 2016 compared to $1,293 per week in 2006. The craft beer industry, in combination with macrobreweries, were responsible for over 50% of the employment opportunities gained in the area of beverage manufacturing in the United States between 2010-2016. 25% of the jobs which are available in the beverage manufacturing sector involve craft beer or macrobrewery employment.
Approximately 240 million Americans are of legal drinking age today, which represents a potential market of 73% of all individuals. About 36% of these adults say that they never consume alcohol. 83% of the beer that Americans drink each year comes from a domestic brewery. In 2014, the craft beer industry was able to have its first year where it made an economic impact of over $1 billion. The average craft brewery in the United States employs about 2 workers, earning revenues of approximately $1.4 million per year. Although the states in the southeast represent 25% of the population base in the U.S., only 15% of craft breweries decide to open their doors in this region. In 2018, about 40% of consumers said that they drink craft beer each year, with 68% of the customers being men. Only 14% of the industry customers identify with a racial or ethnic minority, which means there are numerous opportunities to expand into different demographics. 65% of households in the United States say that they support the idea of having a craft brewery in their neighborhood. Only 46% of people say that they support extending the tax breaks for the craft brewing industry beyond 2019 when they are scheduled to sunset. 38% of people who are active in the craft beer industry said that the aluminum tariffs implemented by the Trump administration will have a negative impact on their business. 13% of industry professionals thought that tariffs placed on China and Canada could actually benefit their business. 74% of craft beer industry professionals say that they are in favor of posting nutritional and calorie information for their products. 47% of consumers who identify themselves as craft beer drinkers say that they prefer a crisp beer which is balanced and clean between malt and hop flavors. American lager, wheat ale, kolsch, and blonde ale represented 40% of the craft beer industry’s growth volume in 2018. When asked what type of alcohol-based beverage that they preferred, 40% of consumers in 2017 said that beer was their first choice. Wine has consistently placed second since 2002. The craft a brewing industry in the United States contributed over $76 billion of economic impact to the American economy in 2017. This figure represents direct and indirect employment opportunities for more than 500,000 people. Wholesalers, retailers, and breweries are all included in this data. The top 5 states for output in the craft beer industry totaled more than $27 billion in 2017.
6
Industry Overview
In 2008, there were just over 1,500 breweries in the United States. As of late 2018, there were 7,450+ breweries in America. That’s growth of nearly 500% in ten years – for a market that had been stagnant for decades. Millennials interest in craft beer and microbreweries in a staple of its generation and the trend isn’t slowing down. From 2017 to 2018, nearly 1,000 new breweries opened in the US. Combine that with the rise of brewpubs, home-brewing kits, and the overall microbrewery culture and the numbers become even more impressive.
Recent U.S. Brewery Count
| 2014 | 2015 | 2016 | 2017 | 2018 | 2017 to 2018 % Change | |||||||
| Craft | 3,814 | 4,628 | 5,539 | 6,490 | 7,346 | +13.2 | ||||||
| Regional Craft Breweries | 135 | 178 | 186 | 202 | 230 | +13.9 | ||||||
| Microbreweries | 2,076 | 2,626 | 3,251 | 3,933 | 4,522 | +15.0 | ||||||
| Brewpubs | 1,603 | 1,824 | 2,102 | 2,355 | 2,594 | +10.1 | ||||||
| Large/Non-Craft | 46 | 44 | 67 | 106 | 104 | |||||||
| Total U.S. Breweries | 3,869 | 4,672 | 5,606 | 6,596 | 7,450 | +12.9 |
Here are the leading statistics that show the explosion and continued growth of craft beer and breweries in 2019:
Overall U.S. beer volume sales were down 1% in 2018, whereas craft brewer sales continued to grow at a rate of 4% by volume, reaching 13.2% of the U.S. beer market by volume. Craft production grew the most for microbreweries.
Retail dollar sales of craft increased 7%, up to $27.6 billion, and now account for more than 24% of the $114.2 billion U.S. beer market.
These statistics use the craft brewer definition of small and independent brewer. More up-to-date statistics and analysis can be found in the insights and analysis section of the website.
7
Historical Craft Brewery Production by Category
Craft Beer Statistics
Craft beer made up for 24 percent of the total US beer sales market in 2018. Retail craft beer sales hit $27.6B in 2018, up 7 percent from the previous year. Craft beer sales by volume were up 3.9 percent in the previous year, while overall beer sales were slightly down by .8 percent. Craft beer sales by volume made up 13.2 percent of the overall beer marketplace share. Blue Moon was the leading craft-beer brand in 2018 at $338M. The most popular craft-beer type in the US is the IPA.
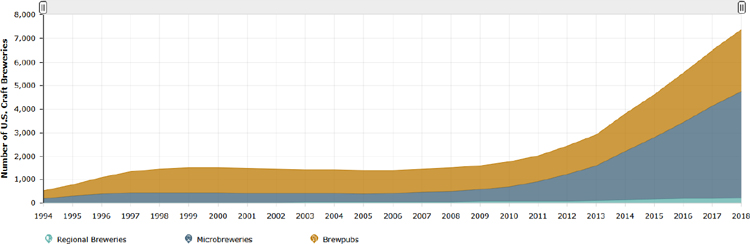
Microbrewery Statistics
In 2018 there were 7,450 overall breweries in the US including brewpubs, microbreweries, and regional breweries. a 411% increase in overall breweries in the US. In 2018 there were 4,522 microbreweries in the US, making up nearly 61% of the total brewery market share. Since 2010, there has been a 729% increase in microbreweries in the US. In 2018, 1,049 new craft breweries opened while 219 closed. Almost a quarter of US breweries were classified as brewpubs that only brew beer for direct-to-consumer sale on brewery-restaurant premises. California has the most active breweries of any state in the US at 1,236. California also led the US in terms of total economic impact of their breweries at $7.3B. Mississippi has the fewest breweries of any state in the US at 19. Vermont has the most breweries per capita at 11.5. Vermont also produces most pints per capita at 151.2. Montana and Maine are tied at 2nd on the list of most breweries per capita at 9.6. Colorado leads the US in terms of economic impact per capita $764, with Maine in second at $667. Over 90% of Americans live within 10 miles of a craft brewery.
U.S. Craft Brewery Count by Category
8
Craft Beer Industry Trends and Analysis
Although the interest in the craft beer industry is far from gone, the opportunities for growth for new businesses may have already peaked. With thousands of new breweries operating across the United States and around the world, the market is becoming increasingly crowded with multiple products in all economies. Although saturation may still be sometime away, it is inevitable that there will be an increasing level of pullback that occurs as the industry matures.
The amount of deceleration that the craft beer industry experiences will likely be dependent upon how many consumers decide to shift from a macro-brewery to products to items produced by the firms which are able to survive. There is already a steep drop occurring for the largest beverage manufacturers in the sector, which means the most established names and highest quality products have an opportunity to continue growing at an impressive rate.
Industrial brewers have already taken notice of this trend. Anheuser-Busch InBev purchased Goose Island in 2011 for about $39 million, which was their first of numerous acquisitions that are similar. Large companies have numerous ways to push into the market instead of only relying on the pull of consumers.
Even then, we still anticipate a 5-year growth pattern averaging 4% annually through 2024, with the potential to extend that influence through to a 10-year forecast as well. Consumers are asking for better products with more flavor choices today, which means the craft beer industry is in the perfect position to cash in on this trend.
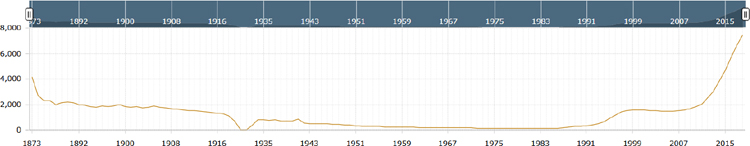
Historical U.S. Brewery Count
Slide the bar at the top of the graph to see number of breweries from 1873 to present day.
9
Current Operations
Located in Grass Valley, CA, BrewBilt is one of the only California companies that custom designs, hand crafts, and integrates processing, fermentation and distillation processing systems for the craft beer, cannabis and hemp industries using “Best in Class” American made components integrated with stainless steel processing vessels using only American made steel. Founded in 2014, the company began in a backyard shop by Jeff Lewis with a vision of creating a profitable company in “Rural America” by hiring excellent personnel, designing and fabricating products to exceed customer’s expectations and compensating craftsmen with living wages and profit sharing to financially sustain their families within the community. Mr. Lewis has 15+ years experience as a craft beer brewer, a custom tank/vessel designer, fabrication and integration expert and business owner who initially founded Portland Kettle Works, a nationally recognized manufacturer of craft beer brewing equipment located in the Northwest. The Company has grown from 3 employees in 2015 to 9 in 2017. Since inception, BrewBilt has successfully grown its business by closing sales of approximately $350,000 in 2015, $900,000 in 2016, $1,500,000 in 2017, $1,800,000 in 2018 and $1,600,000 in 2019 YTD ending September 30. BrewBilt has been built by having strong relationships with local suppliers of raw materials, equipment and services in California, an aggressive referral network of satisfied customers nationwide, and an Advisory Board consisting of successful business leaders that provide valuable product feedback and business expertise to management. The craft brewing & spirits industries continue to grow worldwide. California is where craft brewing began and now has over 900 operating breweries – being centrally located in this booming market was a large draw for BrewBilt to locate its manufacturing facility in the Sierra foothills. All BrewBilt products are designed and fabricated as “food grade” quality which enables the company to build vessels for food & beverage processing , the company is now building systems that are pharmaceutical grade for clients involved in distillation for the cannabis and hemp industries, thus making the revenue potential much greater. BrewBilt buys materials and components mostly from California suppliers which enables them to closely monitor quality, while the company’s revenues are generated from sales to customers throughout the country. The company is aggressively pursuing international orders and has held meetings with the Center for International Trade Development and U.S. Commercial Service to develop international opportunities. Presently, a great deal of sales interest in coming from Mexico, Japan, Europe and Australia. BrewBilt competes against a number of companies, most of which are selling mass produced equipment from China made from less costly inferior quality Chinese steel which often neither food nor pharmaceutical grade quality. While this broader market is very competitive, there continues to be little competition and strong market demand for higher quality, custom designed, hand crafted and integrated systems that BrewBilt produces. In July of 2016, BrewBilt moved from the small facility in Nevada City, CA to lease an eight thousand (8,000) square foot manufacturing facility in Grass Valley, CA. This facility was purchased by BrewBilt in January 2018 and upgraded with substantial tenant improvements. BrewBilt is prepared to expand again by leasing an additional seventy-six hundred (7,600) square feet in the same facility. BrewBilt obtains the majority of its leads through customer referrals and from online marketplaces. The company’s website is being expanded for online sales to include online educational/marketing videos that feature the company and its expanded integrated product line for the cannabis and hemp industries. BrewBilt has also created distribution sales agreements with individuals and companies to represent BrewBilt in both the domestic and international markets.
Products
BrewBilt is one of the only California companies that custom designs, hand crafts, and integrates processing, fermentation and distillation processing systems for the craft beer, cannabis and hemp industries using “Best in Class” American made components integrated with stainless steel processing vessels using only American made steel.
All BrewBilt products are designed and fabricated as “food grade” quality which enables the company to build vessels for food & beverage processing , the company is now building systems that are pharmaceutical grade for clients involved in distillation for the cannabis and hemp industries, thus making the revenue potential much greater. BrewBilt buys materials and components mostly from California suppliers which enables them to closely monitor quality, while the company’s revenues are generated from sales to customers throughout the country. The company is aggressively pursuing international orders and has held meetings with the Center for International Trade Development and U.S. Commercial Service to develop international opportunities. Presently, a great deal of sales interest in coming from Mexico, Japan, Europe and Australia.
10
Vet Online Supply Inc. (the “Company”) is a Florida corporation incorporated on May 31, 2014. The Company engages in the online sale of its own holistic product line for pets, as well as targeting the larger Big-Box Pet retail suppliers, and during the first quarter of 2018, discontinued its legacy veterinarian supplies lines. The company discontinued its legacy line of products to increase margins and profitability with its own brand-name holistic products. These new holistic pet products are designed to help with arthritis, compromised immune systems, stress responses, aggression and digestive issues and may also be useful in treating acute ailments like sprains and strains, torn ligaments, bone breaks and even during post-operative care to reduce swelling, pain and stiffness. The Company’s web-based eCommerce platform with our products is on our website, www.vetonlinesupplies.com. The website gives our potential clients the ability to purchase quality pet products by placing their order any time of day at their convenience.
Distribution channels include its existing online retail sales platform and fulfillment, and direct sales through its global manufacturing sales representative network. Although selling pet products online is not entirely new to the company, we anticipate that this medium will continue to grow as our brand continues to achieve recognition. We believe that by providing high quality holistic pet products at competitive prices and to customers online, Vet Online Supply hopes to become a ‘go-to’ solution for pet owners everywhere. In addition, online vs. catalogue has the benefit of, among other things, search tools and accounts that remember previous purchases, and expedited ordering.
Marketing
California had the largest output for the craft beer industry and 2016, offering $7.3 billion in total impact. Pennsylvania finished in second during the year, with a $5.8 billion impact. They were followed by Texas ($4.5 billion), New York ($3.4 billion), and Florida ($3.1 billion). The overall beer market in the United States has a value of $111.4 billion. Although the craft beer segment has a 12.7% share of the total volume in the country, it represents over 20% of the total dollar sales that were achieved in 2017. The dollar sales growth of craft beer products in the United States was 8% in 2017. In 2017, even though there were almost 1,000 new brewery openings which occurred in the United States, there were also 165 closures that happened. This figure represents a closing rate of 2.6%, which is a 42% increase over 2016 figures one 116 craft breweries shut their doors. Adults in the United States consume an average of 26.9 gallons of beer each year. (National Beer Wholesalers Association) About one out of every four registered breweries in the United States are listed as a brewpub. That means the products they create for consumers are meant for direct sales that occur on their premises. The average brewery with this classification will produce about 1,000 barrels of beer each year. 95% of the breweries which are operating in the United States today produced less than 15,000 barrels of beer each year. That classifies the operation as a microbrewery if 75% or more of the beer the company produces is sold off-site About 40% of the sales that occur each year for the craft beer industry happen during the months of June, July, or August. Almost 90% of adults over the age of 21 in the United States live within 10 miles of at least one brewery. Most of these operations qualify as a craft beer producer.
Competition
BrewBilt competes against a number of companies, most of which are selling mass produced equipment from China made from less costly inferior quality Chinese steel which often is neither food nor pharmaceutical grade quality. While this broader market is very competitive, there continues to be little competition and strong market demand for higher quality, custom designed, hand crafted and integrated systems that BrewBilt produces.
We compete for the sales of pet products with existing websites that sell similar products. Our principal competitors include but are not limited to: Petco; MWI Veterinary Supply; California Veterinary Supply; Lampert Vet Supply; Valley Vet Supply; and Miller Vet Supply, all of which offer online products. Numerous other second tier resellers are also in the marketplace.
11
Most, if not all, of our competitors have greater name and brand recognition and access to greater amounts of capital and established relationships with a larger base of current and potential customers. Because of their size and bargaining power, our competitors may be able to purchase supplies and products at lower prices than us in the initial stages of our development. As a result, our operations may be significantly and negatively impacted by our larger, more established competitors. In particular, once we are able to fund our full marketing program, if we are not able to generate enough revenue by attracting new and businesses and/or by enticing our customers to buy our products, we may be forced to cease operations.
Our ability to compete successfully will depend, in part, on the quality of our products, size of our database of customers, as well as our marketing efforts and our ability to anticipate and respond to various competitive factors affecting the industry. These factors include the introduction of new products and technologies, changes in consumer preferences, demographic trends, economic conditions, and pricing strategies of competitors. As a result of competition, we may be required to:
| ● | increase overall spending to ensure we are offering the best quality products and pricing to our customers; |
| ● | continually assess and evaluate our specials and other offers to ensure that we are offering the most compelling and affordable products |
| ● | increase our advertising, promotional spending, commissions and other customer acquisition costs. |
Employees and Consultants
As of the date of this filing, BrewBilt as 6 employees. Samuel Berry is a Director. Our suppliers include various consultants for manufacturing, new business development and marketing.
Legal Proceedings
We know of no material, existing or pending legal proceedings against our Company, nor are we involved as a plaintiff in any material proceeding or pending litigation. There are no proceedings in which our director, officer or any affiliates, or any registered or beneficial shareholder, is an adverse party or has a material interest adverse to our interest.
Recent Developments
None.
The Company is a smaller reporting company as defined by Rule 12b-2 of the Securities Exchange Act of 1934 and is not required to provide the information under this item.
ITEM 1B. UNRESOLVED STAFF COMMENTS
None.
12
In January 2018, BrewBilt began leasing an eight thousand square foot manufacturing facility located at 110 Spring Hill Dr #10, Grass Valley, CA 95945. The Company is preparing to expand again by leasing an additional seventy-six hundred (7,600) square feet in the same facility.
In the ordinary course of business, the Company may become involved in legal proceedings from time to time. The Company is not currently party to any legal proceedings, nor is it aware of any material pending legal proceedings.
ITEM 4. MINE SAFTEY DISCLOSURES
Not applicable to our operations.
ITEM 5. MARKET FOR REGISTRANT’S COMMON EQUITY, RELATED STOCKHOLDER MATTERS AND ISSUER PURCHASES OF EQUITY SECURITIES
Common Stock
Our common stock is currently quoted on the OTC Markets. Our common stock has been quoted on the OTC Markets since September 14, 2016 trading under the symbol “VTNL”. Because we are quoted on the OTC Markets, our securities may be less liquid, receive less coverage by security analysts and news media, and generate lower prices than might otherwise be obtained if they were listed on a national securities exchange.
The following table sets forth the high and low closing prices for our common stock per quarter as reported by the OTCQB for the period from January 1, 2019 through December 31, 2019, and January 1, 2018 through December 31, 2018, based on our fiscal year end December 31. These prices represent quotations between dealers without adjustment for retail mark-up, markdown or commission and may not represent actual transactions.
| For the Year Ended December 31 | ||||||||
| 2019 | 2018 | |||||||
| High | Low | High | Low | |||||
| First Quarter | 0.0002 | 0.0001 | 0.0047 | 0.0001 | ||||
| Second Quarter | 0.0001 | 0.0001 | 0.0019 | 0.0008 | ||||
| Third Quarter | 0.0001 | 0.0001 | 0.0011 | 0.0005 | ||||
| Fourth Quarter | 0.3030 | 0.0030 | 0.0006 | 0.0001 | ||||
Penny Stock Regulations Restrictions on Marketability
The SEC has adopted rules that regulate broker-dealer practices in connection with transactions in penny stocks. Penny stocks are generally equity securities with a market price of less than $5.00, other than securities registered on certain national securities exchanges or quoted on the NASDAQ system, provided that current price and volume information with respect to transactions in such securities is provided by the exchange or system. The penny stock rules require a broker-dealer, prior to a transaction in a penny stock, to deliver a standardized risk disclosure document prepared by the SEC, that: (a) contains a description of the nature and level of risk in the market for penny stocks in both public offerings and secondary trading, (b) contains a description of the broker’s or dealer’s duties to the customer and of the rights and remedies available to the customer with respect to a violation of such duties or other requirements of the securities laws, (c) contains a brief, clear, narrative description of a dealer market, including bid and ask prices for penny stocks and the significance of the spread between the bid and ask price, (d) contains a toll-free telephone number for inquiries on disciplinary actions, (e) defines significant terms in the disclosure document or in the conduct of trading in penny stocks, and (f) contains such other information and is in such form, including language, type size and format, as the SEC shall require by rule or regulation.
13
The broker-dealer also must provide, prior to effecting any transaction in a penny stock, the customer with (a) bid and offer quotations for the penny stock, (b) the compensation of the broker-dealer and its salesperson in the transaction, (c) the number of shares to which such bid and ask prices apply, or other comparable information relating to the depth and liquidity of the market for such stock, and (d) a monthly account statement showing the market value of each penny stock held in the customer’s account.
In addition, the penny stock rules require that prior to a transaction in a penny stock not otherwise exempt from those rules, the broker-dealer must make a special written determination that the penny stock is a suitable investment for the purchaser and receive the purchaser’s written acknowledgment of the receipt of a risk disclosure statement, a written agreement as to transactions involving penny stocks, and a signed and dated copy of a written suitability statement.
These disclosure requirements may have the effect of reducing the trading activity for our common stock once we obtain a listing on a regulated market. Therefore, stockholders may have difficulty selling their shares of our common stock.
Record Holders
The Company’s common shares are issued in registered form. Vstock Transfer LLC, 18 Lafayette Place Woodmere, NY, 11598, (212) 828-8436, is the registrar and transfer agent for the Company’s common shares.
As of December 31, 2019, there were 10,343,330 shares of the registrant’s $0.001 par value common stock issued and outstanding, which were held by 34 shareholders of record.
Dividends
The Company has not declared any dividends on its common stock since the Company’s inception. There is no restriction in the Company’s Articles of Incorporation and Bylaws that will limit its ability to pay dividends on its common stock. However, the Company does not anticipate declaring and paying dividends to its shareholders in the near future.
Securities authorized for issuance under equity compensation plans
We have no compensation plans under which our equity securities are authorized for issuance.
Performance graph
We are a smaller reporting company as defined by Rule 12b-2 of the Exchange Act and are not required to provide the information required under this item.
Recent Sales of Unregistered Securities
During the year ended December 31, 2019, the holder of a convertible note converted $1,148 of accrued interest and $500 in conversion fees into 400,000 shares of common stock. The common stock was valued at $5,077 based on the market price of the Company’s stock on the date of conversion.
Recent issuances of unregistered securities subsequent to our fiscal year ended of December 31, 2019
During the three months ended March 31, 2020, the holders of a convertible note converted $87,314 of principal, accrued interest and conversion fees into 32,260,676 shares of common stock and 8,008,334 common shares were cancelled.
Issuer Repurchases of Equity Securities
None.
14
ITEM 6. SELECTED FINANCIAL DATA
We are a smaller reporting company as defined by Rule 12b-2 of the Securities Exchange Act of 1934 and are not required to provide the information under this item.
ITEM 7. MANAGEMENT’S DISCUSSION AND ANALYSIS OF FINANCIAL CONDITION AND RESULTS OF OPERATIONS
This Annual Report on Form 10-K contains forward-looking statements within the meaning of Section 27A of the Securities Act of 1933, as amended (the “Securities Act”) and Section 21E of the Securities Exchange Act of 1934, as amended (the “Exchange Act”). These forward-looking statements are not historical facts but rather are based on current expectations, estimates and projections. We may use words such as “anticipate,” “expect,” “intend,” “plan,” “believe,” “foresee,” “estimate” and variations of these words and similar expressions to identify forward-looking statements. These statements are not guarantees of future performance and are subject to certain risks, uncertainties and other factors, some of which are beyond our control, are difficult to predict and could cause actual results to differ materially from those expressed or forecasted. You should read this report completely and with the understanding that actual future results may be materially different from what we expect. The forward-looking statements included in this report are made as of the date of this report and should be evaluated with consideration of any changes occurring after the date of this Report. We will not update forward-looking statements even though our situation may change in the future and we assume no obligation to update any forward-looking statements, whether as a result of new information, future events or otherwise.
Results for the Year Ended December 31, 2019 Compared to the Year Ended December 31, 2018
Revenues:
The Company’s revenues were $1,589,728 for the year ended December 31, 2019 compared to $1,874,363 for the year ended December 31, 2018.
Cost of Sales:
The Company’s cost of materials was $1,209,341 for the year ended December 31, 2019, compared to $1,464,222 for the year ended December 31, 2018. The decrease was due to the decrease in customer orders.
Operating Expenses:
Operating expenses consisted primarily of consulting fees, professional fees, salaries and wages, office expenses and fees associated with preparing reports and SEC filings relating to being a public company. Operating expenses for the year ended December 31, 2019, and December 31, 2018, were $974,624 and $970,565, respectively. The increase was primarily attributable to an increase in salaries and wages and consulting fees.
Other Income (Expense):
Other income (expense) for the years ended December 31, 2019 and 2018 was $10,685,542 and $(41,162), respectively. Other income (expense) consisted of gain or loss on derivative valuation, gain or loss on disposal of assets, goodwill impairment and interest expense. The gain or loss on derivative valuation is directly attributable to the change in fair value of the derivative liability. Interest expense is primarily attributable the initial interest expense associated with the valuation of derivative instruments at issuance and the accretion of the convertible debentures over their respective terms. The variance primarily resulted from the fluctuation of the Company’s stock price which impacted the valuation of the derivative liabilities on the convertible debt.
15
Net Profit (Loss):
Net profit (loss) for the year ended December 31, 2019 was $10,091,305, compared with $(601,586) for the year ended December 31, 2018. The increased profit can be explained by the gain in fair value of the derivative instruments in the year ended December 31, 2019.
Impact of Inflation
We believe that the rate of inflation has had a negligible effect on our operations.
Liquidity and Capital Resources
| December 31, 2019 | December 31, 2018 | |||||||
| $ | $ | |||||||
| Current Assets | 435,164 | 1,415,199 | ||||||
| Current Liabilities | 6,109,932 | 2,304,695 | ||||||
| Working Capital (Deficit) | (5,674,768 | ) | (889,496 | ) | ||||
As of December 31, 2019, we had $1,444 and $949,010 in cash and total assets, as well as $6,810,482 in total liabilities as compared to $43,285 and $1,636,991 in cash and total assets, and $2,663,114 in total liabilities as of December 31, 2018. The decrease in cash was due to a decrease in customer orders. The increase in total liabilities was primarily attributed to the increase in notes payable, interest and derivative liabilities.
The Company requires additional capital to fully execute its marketing program and increase revenues. Presently we are relying on short term loans from our sole officer and director to meet operational shortfalls. There can be no assurance that continued funding will be available on satisfactory terms. We intend to raise additional capital through the sale of equity, loans or other short-term financing options.
| December 31, 2019 | December 31, 2018 | |||||||
| $ | $ | |||||||
| Cash Flows from (used in) Operating Activities | (68,516 | ) | 45,857 | |||||
| Cash Flows from (used in) Investing Activities | 22,408 | 66,432 | ||||||
| Cash Flows from (used in) Financing Activities | 4,267 | (84,866 | ) | |||||
| Net Increase (decrease) in Cash During Period | (41,841 | ) | 27,423 | |||||
During the year ended December 31, 2019, cash used in operating activities was $(68,516) compared to $45,857 for the year ended December 31, 2018. The variance is primarily resulted from the derivative liability fair value gain.
During the year ended December 31, 2019 cash used in investing activities was $22,408 compared to $66,432 for the year ended December 30, 2018. The variance is primary due to the effect of the reverse merger.
During the year ended December 30, 2019, cash from financing activity was $4,267 compared to $(84,866) for the year ended December 30, 2018. The variance primarily resulted from a decrease in contributed capital during the year ended December 30, 2019.
Off-Balance Sheet Arrangements
We have no significant off-balance sheet arrangements that have or are reasonably likely to have a current or future effect on our financial condition, revenues or expenses, results of operations, liquidity, capital expenditures or capital resources that are material to stockholders.
16
Significant Accounting Policies
Our discussion and analysis of our results of operations and liquidity and capital resources are based on our financial statements, which have been prepared in accordance with accounting principles generally accepted in the United States. The preparation of these financial statements requires us to make estimates and judgments that affect the reported amounts of assets, liabilities, revenues and expenses, and disclosure of contingent assets and liabilities. On an ongoing basis, we evaluate our estimates and judgments, including those related to revenue recognition, allowance for doubtful accounts, warranty liabilities, share-based payments, income taxes and litigation. We base our estimates on historical and anticipated results and trends and on various other assumptions that we believe are reasonable under the circumstances, including assumptions as to future events. These estimates form the basis for making judgments about the carrying values of assets and liabilities that are not readily apparent from other sources. By their nature, estimates are subject to an inherent degree of uncertainty. Actual results that differ from our estimates could have a significant adverse effect on our operating results and financial position. We believe that the significant accounting policies and assumptions as detailed in Note 1 to the financial statements contained herein may involve a higher degree of judgment and complexity than others.
Emerging Growth Company
We qualify as an “emerging growth company” under the JOBS Act. As a result, we are permitted to, and intend to, rely on exemptions from certain disclosure requirements. For so long as we are an emerging growth company, we will not be required to:
| ● | have an auditor report on our internal controls over financial reporting pursuant to Section 404(b) of the Sarbanes-Oxley Act; |
| ● | comply with any requirement that may be adopted by the Public Company Accounting Oversight Board regarding mandatory audit firm rotation or a supplement to the auditor’s report providing additional information about the audit and the financial statements (i.e., an auditor discussion and analysis); |
| ● | submit certain executive compensation matters to shareholder advisory votes, such as “say-on-pay” and “say-on-frequency;” and |
| ● | disclose certain executive compensation related items such as the correlation between executive compensation and performance and comparisons of the CEO’s compensation to median employee compensation. |
In addition, Section 107 of the JOBS Act also provides that an emerging growth company can take advantage of the extended transition period provided in Section 7(a)(2)(B) of the Securities Act for complying with new or revised accounting standards. In other words, an emerging growth company can delay the adoption of certain accounting standards until those standards would otherwise apply to private companies. We have elected to take advantage of the benefits of this extended transition period. Our financial statements may therefore not be comparable to those of companies that comply with such new or revised accounting standards.
We will remain an “emerging growth company” for up to five years, or until the earliest of (i) the last day of the first fiscal year in which our total annual gross revenues exceed $1 billion, (ii) the date that we become a “large accelerated filer” as defined in Rule 12b-2 under the Securities Exchange Act of 1934, which would occur if the market value of our ordinary shares that is held by non-affiliates exceeds $700 million as of the last business day of our most recently completed second fiscal quarter or (iii) the date on which we have issued more than $1 billion in non-convertible debt during the preceding three year period.
Contractual Obligations
We are a smaller reporting company as defined by Rule 12b-2 of the Securities Exchange Act of 1934 and are not required to provide the information under this item.
ITEM 7A. QUANTITATIVE AND QUALITATIVE DISCLOSURES ABOUT MARKET RISK
The Company does not hold any assets or liabilities requiring disclosure under this item.
17
ITEM 8. FINANCIAL STATEMENTS AND SUPPLEMENTARY DATA
BREWBILT MANUFACTURING INC.
FINANCIAL STATEMENTS
Table of Contents
18
Report of Independent Registered Public Accounting Firm
To the shareholders and the board of directors of BrewBilt Manufacturing, Inc.
Opinion on the Financial Statements
We have audited the accompanying consolidated balance sheets of BrewBilt Manufacturing, Inc. as of December 31, 2019 and 2018, the related statements of operations, stockholders’ equity (deficit), and cash flows for the years then ended, and the related notes (collectively referred to as the “financial statements”). In our opinion, the financial statements present fairly, in all material respects, the financial position of the Company as of December 31, 2019 and 2018, and the results of its operations and its cash flows for the years then ended, in conformity with accounting principles generally accepted in the United States.
Basis for Opinion
These financial statements are the responsibility of the Company’s management. Our responsibility is to express an opinion on the Company’s financial statements based on our audit. We are a public accounting firm registered with the Public Company Accounting Oversight Board (United States) (“PCAOB”) and are required to be independent with respect to the Company in accordance with the U.S. federal securities laws and the applicable rules and regulations of the Securities and Exchange Commission and the PCAOB.
We conducted our audit in accordance with the standards of the PCAOB. Those standards require that we plan and perform the audit to obtain reasonable assurance about whether the financial statements are free of material misstatement, whether due to error or fraud. The Company is not required to have, nor were we engaged to perform, an audit of its internal control over financial reporting. As part of our audits we are required to obtain an understanding of internal control over financial reporting but not for the purpose of expressing an opinion on the effectiveness of the Company’s internal control over financial reporting. Accordingly, we express no such opinion.
Our audit included performing procedures to assess the risks of material misstatement of the financial statements, whether due to error or fraud, and performing procedures that respond to those risks. Such procedures included examining, on a test basis, evidence regarding the amounts and disclosures in the financial statements. Our audit also included evaluating the accounting principles used and significant estimates made by management, as well as evaluating the overall presentation of the financial statements. We believe that our audit provides a reasonable basis for our opinion.
Substantial Doubt about the Company’s Ability to Continue as a Going Concern
The accompanying financial statements have been prepared assuming that the Company will continue as a going concern. As discussed in Note 2 to the financial statements, the Company’s significant operating losses raise substantial doubt about its ability to continue as a going concern. The financial statements do not include any adjustments that might result from the outcome of this uncertainty.
/S/ BF Borgers CPA PC
BF Borgers CPA PC
We have served as the Company’s auditor since 2015
Lakewood, CO
April 14, 2020
19
| BREWBILT MANUFACTURING INC. |
| CONDENSED CONSOLIDATED BALANCE SHEETS |
| (Audited) |
| December 31, | December 31, | |||||||
| 2019 | 2018 | |||||||
| ASSETS | ||||||||
| Current Assets | ||||||||
| Cash | $ | 1,444 | $ | 43,285 | ||||
| Accounts receivable | 323,779 | 987,454 | ||||||
| Earnings in excess of billings | 53,038 | 344,134 | ||||||
| Inventory | 47,280 | 35,513 | ||||||
| Prepaid expenses | 9,467 | 2,567 | ||||||
| Other current assets | 156 | 2,246 | ||||||
| Total current assets | 435,164 | 1,415,199 | ||||||
| Property, plant and equipment, net | 116,202 | 216,812 | ||||||
| Right-of-use asset | 392,664 | — | ||||||
| Security deposit | 4,980 | 4,980 | ||||||
| TOTAL ASSETS | $ | 949,010 | $ | 1,636,991 | ||||
| LIABILITIES | ||||||||
| Current Liabilities: | ||||||||
| Accounts payable | $ | 947,655 | $ | 299,403 | ||||
| Accrued interest | 250,592 | — | ||||||
| Accrued liabilities | 62,539 | 94,141 | ||||||
| Billings in excess of revenue | 1,511,096 | 1,905,346 | ||||||
| Convertible notes payable, net of discount | 829,384 | — | ||||||
| Derivative liabilities | 2,273,269 | — | ||||||
| Liability for unissued shares | 151,325 | — | ||||||
| Related party liabilities | 84,072 | 5,805 | ||||||
| Total Current Liabilities | 6,109,932 | 2,304,695 | ||||||
| Long term debt | 307,887 | 358,419 | ||||||
| Operating lease liabilities | 392,664 | — | ||||||
| Total liabilities | 6,810,483 | 2,663,114 | ||||||
| Commitments and contingencies | — | — | ||||||
| SHAREHOLDERS’ EQUITY | ||||||||
| Preferred stock, Series A: $0.001 par value; 30,000,000 shares authorized | 400 | — | ||||||
| 400,000 shares issued and outstanding at December 31, 2019 | ||||||||
| 0 shares issued and outstanding at December 31, 2018 | ||||||||
| Preferred stock, Series B: $0.001 par value; 1,000 shares authorized | 1 | — | ||||||
| 1,000 shares issued and outstanding at December 31, 2019 | ||||||||
| 0 shares issued and outstanding at December 31, 2018 | ||||||||
| Common stock, $0.001 par value; 5,000,000,000 authorized | 10,343 | — | ||||||
| 10,343,330 shares issued and outstanding at December 31, 2019 | ||||||||
| 0 shares issued and outstanding at December 31, 2018 | ||||||||
| Additional paid in capital | (15,240,774 | ) | (303,375 | ) | ||||
| Accumulated deficit | 9,368,557 | (722,748 | ) | |||||
| Total Shareholders’ Equity (Deficit) | (5,861,473 | ) | (1,026,123 | ) | ||||
| TOTAL LIABILITIES AND SHAREHOLDERS’ EQUITY (DEFICIT) | $ | 949,010 | $ | 1,636,991 | ||||
The accompanying notes are an integral part of these financial statements
20
| BREWBILT MANUFACTURING INC. |
| CONDENSED CONSOLIDATED STATEMENT OF OPERATIONS |
| (Audited) |
| Years ended | ||||||||
| December 31, | December 31, | |||||||
| 2019 | 2018 | |||||||
| Sales | $ | 1,589,728 | $ | 1,874,363 | ||||
| Cost of sales | 1,209,341 | 1,464,222 | ||||||
| Gross profit | 380,387 | 410,141 | ||||||
| Operating expenses: | ||||||||
| Consulting fees | 65,300 | 60,450 | ||||||
| G&A expenses | 378,147 | 393,746 | ||||||
| Professional fees | 15,539 | 22,259 | ||||||
| Salaries and wages | 515,638 | 494,110 | ||||||
| Total operating expenses | 974,624 | 970,565 | ||||||
| Loss from operations | (594,237 | ) | (560,424 | ) | ||||
| Other income (expense): | ||||||||
| Debt forgiveness | 3,822 | — | ||||||
| Gain (loss) on derivative liability valuation | 13,068,808 | — | ||||||
| Gain (loss) on disposal of asset | (13,769 | ) | — | |||||
| Goodwill impairment | (2,289,884 | ) | — | |||||
| Interest expense | (83,435 | ) | (41,162 | ) | ||||
| Total other expenses | 10,685,542 | (41,162 | ) | |||||
| Net income (loss) before income taxes | 10,091,305 | (601,586 | ) | |||||
| Income tax expense | — | — | ||||||
| Net income (loss) | $ | 10,091,305 | $ | (601,586 | ) | |||
| Per share information | ||||||||
| Weighted number of common shares outstanding, basic | 2,827,388 | — | ||||||
| Net income (loss) per common share | $ | 3.56913 | $ | — | ||||
| Weighted number of common shares outstanding, diluted (1) | 192,762,345 | — | ||||||
| Net income (loss) per common share | $ | 0.05235 | $ | — | ||||
The accompanying notes are an integral part of these financial statements
21
| BREWBILT MANUFACTURING INC. |
| CONDENSED CONSOLIDATED STATEMENT OF SHAREHOLDERS’ EQUITY (DEFICIT) |
| For the years ended December 31, 2019 and 2018 |
| (Audited) |
| Preferred Stock | Preferred Stock | Additional | Total | |||||||||||||||||||||||||||||||||
| Series A | Series B | Common Stock | Paid-In | Accumulated | Shareholders’ | |||||||||||||||||||||||||||||||
| Shares | Amount | Shares | Amount | Shares | Amount | Capital | Deficit | Equity | ||||||||||||||||||||||||||||
| Balance as of December 31, 2017 | — | $ | — | — | $ | — | — | $ | — | $ | (212,704 | ) | $ | (121,162 | ) | $ | (333,866 | ) | ||||||||||||||||||
| Capital contributions | — | — | — | — | — | — | 47,670 | — | 47,670 | |||||||||||||||||||||||||||
| Capital distributions | — | — | — | — | — | — | (138,341 | ) | — | (138,341 | ) | |||||||||||||||||||||||||
| Net loss | — | — | — | — | — | — | — | (601,586 | ) | (601,586 | ) | |||||||||||||||||||||||||
| Balance as of December 31, 2018 | — | — | — | — | — | — | (303,375 | ) | (722,748 | ) | (1,026,123 | ) | ||||||||||||||||||||||||
| Capital distributions | — | — | — | — | — | — | (65,671 | ) | — | (65,671 | ) | |||||||||||||||||||||||||
| Effect of reverse merger | 400,000 | 400 | 1,000 | 1 | 9,943,330 | 9,943 | (14,878,053 | ) | — | (14,867,709 | ) | |||||||||||||||||||||||||
| Conversion of promissory notes to stock | — | — | — | — | 400,000 | 400 | 9,000 | — | 9,400 | |||||||||||||||||||||||||||
| Derivative settlements | — | — | — | — | — | — | (2,675 | ) | — | (2,675 | ) | |||||||||||||||||||||||||
| Net profit | — | — | — | — | — | — | — | 10,091,305 | 10,091,305 | |||||||||||||||||||||||||||
| Balance as of December 31, 2019 | 400,000 | $ | 400 | 1,000 | $ | 1 | 10,343,330 | $ | 10,343 | $ | (15,240,774 | ) | $ | 9,368,557 | $ | (5,861,473 | ) | |||||||||||||||||||
The accompanying notes are an integral part of these financial statements
22
| BREWBILT MANUFACTURING INC. |
| CONDENSED CONSOLIDATED STATEMENTS OF CASH FLOWS |
| (Audited) |
| Years ended | ||||||||
| December 31, | ||||||||
| 2019 | 2018 | |||||||
| Cash flows from operating activities: | ||||||||
| Net income (loss) | $ | 10,091,305 | $ | (601,586 | ) | |||
| Adjustments to reconcile net income to net cash provided by operating activities: | ||||||||
| Amortization of convertible debt discount | 15,676 | — | ||||||
| Change in derivative liability | (13,068,808 | ) | — | |||||
| Goodwill impairment | 2,289,884 | — | ||||||
| Liability for unissued shares due to agreements | 500 | — | ||||||
| Loss on disposal of asset | 13,769 | — | ||||||
| Decrease (increase) in operating assets | ||||||||
| Accounts receivable | 663,675 | (34,054 | ) | |||||
| Earnings in excess of billings | 291,096 | 603,956 | ||||||
| Inventory | 5,608 | (3,952 | ) | |||||
| Prepaid expenses | (6,900 | ) | (6,081 | ) | ||||
| Other assets | 2,246 | 8,807 | ||||||
| Increase (decrease) in operating liabilities | ||||||||
| Accounts payable | 76,274 | (78,439 | ) | |||||
| Accrued interest | 33,594 | — | ||||||
| Accrued liabilities | (31,653 | ) | 27,031 | |||||
| Earnings in excess of revenues | (394,250 | ) | (14,272 | ) | ||||
| Long term debt | (50,532 | ) | 144,447 | |||||
| Net cash (used in) provided by operating activities | (68,516 | ) | 45,857 | |||||
| Cash flows from investing activities | ||||||||
| Effect of reverse merger | (64,433 | ) | — | |||||
| Property, plant and equipment, additions | (20,968 | ) | — | |||||
| Property, plant and equipment, reductions | 107,809 | 66,432 | ||||||
| Net cash (used in) provided by investing activities | 22,408 | 66,432 | ||||||
| Cash flows from financing activities: | ||||||||
| Contributed capital | — | (90,671 | ) | |||||
| Related party liabilities | 4,267 | 5,805 | ||||||
| Net cash (used in) provided for financing activities | 4,267 | (84,866 | ) | |||||
| Net increase (decrease) in cash | (41,841 | ) | 27,423 | |||||
| Cash, beginning of period | 43,285 | 15,862 | ||||||
| Cash, end of period | $ | 1,444 | $ | 43,285 | ||||
| Supplemental disclosures of cash flow information: | ||||||||
| Cash paid for income taxes | $ | — | $ | — | ||||
| Cash paid for interest | $ | — | $ | — | ||||
| Schedule of non-cash investing & financing activities: | ||||||||
| Lease adoption recognition | $ | 423,640 | $ | — | ||||
| Stock issued for debt conversion | $ | 1,148 | $ | — | ||||
The accompanying notes are an integral part of these financial statements
23
NOTE 1 – BASIS OF PRESENTATION AND SUMMARY OF SIGNIFICANT ACCOUNTING POLICIES
Organization and Description of Business
Located in Grass Valley, CA, BrewBilt is one of the only California companies that custom designs, hand crafts, and integrates processing, fermentation and distillation processing systems for the craft beer, cannabis and hemp industries using “Best in Class” American made components integrated with stainless steel processing vessels using only American made steel. Founded in 2014, the company began in a backyard shop by Jeff Lewis with a vision of creating a profitable company in “Rural America” by hiring excellent personnel, designing and fabricating products to exceed customer’s expectations and compensating craftsmen with living wages and profit sharing to financially sustain their families within the community. Mr. Lewis has 15+ years of experience as a craft beer brewer, a custom tank/vessel designer, fabrication and integration expert and business owner who initially founded Portland Kettle Works, a nationally recognized manufacturer of craft beer brewing equipment located in the Northwest. The Company has grown from 3 employees in 2015 to 9 in 2017.
BrewBilt has been built by having strong relationships with local suppliers of raw materials, equipment and services in California, an aggressive referral network of satisfied customers nationwide, and an Advisory Board consisting of successful business leaders that provide valuable product feedback and business expertise to management. The craft brewing & spirits industries continue to grow worldwide. California is where craft brewing began and now has over 900 operating breweries – being centrally located in this booming market was a large draw for BrewBilt to locate its manufacturing facility in the Sierra foothills.
All BrewBilt products are designed and fabricated as “food grade” quality which enables the company to build vessels for food & beverage processing , the company is now building systems that are pharmaceutical grade for clients involved in distillation for the cannabis and hemp industries, thus making the revenue potential much greater. BrewBilt buys materials and components mostly from California suppliers which enables them to closely monitor quality, while the company’s revenues are generated from sales to customers throughout the country. The company is aggressively pursuing international orders and has held meetings with the Center for International Trade Development and U.S. Commercial Service to develop international opportunities. Presently, a great deal of sales interest in coming from Mexico, Japan, Europe and Australia.
BrewBilt competes against a number of companies, most of which are selling mass produced equipment from China made from less costly inferior quality Chinese steel which often is neither food nor pharmaceutical grade quality. While this broader market is very competitive, there continues to be little competition and strong market demand for higher quality, custom designed, hand crafted and integrated systems that BrewBilt produces.
In July of 2016, BrewBilt moved from the small facility in Nevada City, CA to lease an eight thousand (8,000) square foot manufacturing facility in Grass Valley, CA. This facility was purchased by BrewBilt in January 2018 and upgraded with substantial tenant improvements. BrewBilt is prepared to expand again by leasing an additional seventy-six hundred (7,600) square feet in the same facility. BrewBilt obtains the majority of its leads through customer referrals and from online marketplaces. The company’s website is being expanded for online sales to include online educational/marketing videos that feature the company and its expanded integrated product line for the cannabis and hemp industries. BrewBilt has also created distribution sales agreements with individuals and companies to represent BrewBilt in both the domestic and international markets.
The former company, Vet Online Supply Inc. (the “Company”), a Florida corporation, was incorporated on May 31, 2014. Vet Online Supply Inc. manufactured and distributed wholistic CBD based pet products. On November 22, 2019, Vet Online Supply and Brewbilt Manufacturing (“BrewBilt”) entered into an Agreement and Plan of Merger (the “Merger Agreement”) and completed a merger, whereby Brewbilt merged with and into Vet Online Supply, with BrewBilt remaining as the surviving entity (the “Merger”). Under U.S. generally accepted accounting principles, the merger is treated as a “reverse merger” under the purchase method of accounting, with BrewBilt as the accounting acquirer.
24
Financial Statement Presentation
The audited financial statements of the Company have been prepared in accordance with accounting principles generally accepted in the United States of America (“U.S. GAAP”).
Fiscal year end
The Company has selected December 31 as its fiscal year end.
Use of Estimates
The preparation of financial statements in conformity with U.S. GAAP requires management to make estimates and assumptions that affect the amounts reported therein. Due to the inherent uncertainty involved in making estimates, actual results reported in future periods may be based upon amounts that differ from these estimates.
Cash Equivalents
The Company considers all highly liquid investments with maturities of 90 days or less from the date of purchase to be cash equivalents.
Revenue Recognition and Related Allowances
The Company recognizes revenue when obligations under the terms of a contract with its customer are satisfied; generally, this occurs with the transfer of control of its products. Revenue is measured as the amount of consideration expected to be received in exchange for transferring products. If the conditions for revenue recognition are not met, the Company defers the revenue and related cost of sales until all conditions are met. As of December 31, 2019 and December 31, 2018, the Company has deferred $1,511,096 and $1,905,346, respectively, in revenue, and $53,038 and $344,134 in cost of sales, respectively, related to customer orders in progress. These amounts are recorded as billings in excess of revenues and earnings in excess of billings in the accompanying balance sheets.
Accounts Receivable and Allowance for Doubtful Accounts
Accounts receivable are stated at the amount that management expects to collect from outstanding balances. Bad debts and allowances are provided based on historical experience and management’s evaluation of outstanding accounts receivable. Management evaluates past due or delinquency of accounts receivable based on the open invoices aged on due date basis. The allowance for doubtful accounts at December 31, 2019 and 2018 is $0.
Inventories
Inventories consist of raw materials, work in process and finished goods. Raw materials, which principally consist of raw stainless steel, raw stainless tubing, motors, pumps, and fittings, are stated at the lower of cost, determined on the first-in, first-out basis, or net realizable value.
In addition, the Company is a manufacturer of premium CBD infused holistic pet products and as such will maintain inventory on site. The company directly drop ships to customers when ordered. The Company has wholesale distributors that purchase products in bulk inventory.
Goodwill
The excess of the cost over the fair value of net assets of acquired in the Merger is recorded as goodwill. Goodwill is not subject to amortization, but is reviewed for impairment annually, or more frequently whenever events or changes in circumstances indicate the carrying value of goodwill may not be recoverable. An impairment charge would be recorded to the extent the carrying value of goodwill exceeds its estimated fair value. The testing of goodwill under established guidelines for impairment requires significant use of judgment and assumptions. Changes in forecasted operations and other assumptions could materially affect the estimated fair values. Changes in business conditions could potentially require adjustments to these asset valuations. At December 31, 2019, the Company reviewed the goodwill recorded in the Merger and determined that an impairment expense of $2,289,884 was required.
25
Warranty
The Company is a manufacturer of products which are shipped to our customers directly from the Company. For products that are made from raw materials, the Company offers a 6-year limited warranty. The parts provided by outside vendors as finished goods that are added to a system produced by the Company as components, have a manufacturers’ warranty that is passed on to the end user of the complete system. To date, BrewBilt has spent less than $5,000 over the past 5 years for repairs (under warranty) on products they have built, with most of the costs going to cover travel and lodging expenses. As of December 31, 2019 and December 31, 2018, the Company has recorded a liability of $5,000 and $5,000, respectively, for warranties, which is included in accrued liabilities in the accompanying balance sheet.
Accounts Payable and Accrued Expenses
Accounts payable and accrued expenses are carried at amortized cost and represent liabilities for goods and services provided to the Company prior to the end of the fiscal year that are unpaid and arise when the Company becomes obliged to make future payments in respect of the purchase of these goods and services.
Fair Value of Financial Instruments
Fair value is defined as the price that would be received upon sale of an asset or paid upon transfer of a liability in an orderly transaction between market participants at the measurement date and in the principal or most advantageous market for that asset or liability. The fair value should be calculated based on assumptions that market participants would use in pricing the asset or liability, not on assumptions specific to the entity. In addition, the fair value of liabilities should include consideration of non-performance risk including our own credit risk.
In addition to defining fair value, the standard expands the disclosure requirements around fair value and establishes a fair value hierarchy for valuation inputs is expanded. The hierarchy prioritizes the inputs into three levels based on the extent to which inputs used in measuring fair value are observable in the market. Each fair value measurement is reported in one of the three levels and which is determined by the lowest level input that is significant to the fair value measurement in its entirety.
These levels are:
Level 1 - inputs are based upon unadjusted quoted prices for identical instruments traded in active markets.
Level 2 - inputs are based upon quoted prices for similar instruments in active markets, quoted prices for identical or similar instruments in markets that are not active, and model-based valuation techniques for which all significant assumptions are observable in the market or can be corroborated by observable market data for substantially the full term of the assets or liabilities.
Level 3 - inputs are generally unobservable and typically reflect management’s estimates of assumptions that market participants would use in pricing the asset or liability. The fair values are therefore determined using model-based techniques that include option pricing models, discounted cash flow models, and similar techniques.
Financial assets and liabilities measured at fair value on a recurring basis:
| Input | December 31, 2019 | December 31, 2018 | ||||||||
| Level | Fair Value | Fair Value | ||||||||
| Derivative Liability | 3 | $ | 2,273,269 | $ | 0 | |||||
| Total Financial Liabilities | $ | 2,273,269 | $ | 0 | ||||||
In management’s opinion, the fair value of convertible notes payable and advances payable is approximate to carrying value as the interest rates and other features of these instruments approximate those obtainable for similar instruments in the current market. Unless otherwise noted, it is management’s opinion that the Company is not exposed to significant interest, exchange or credit risks arising from these financial instruments. As December 31, 2019 and December 31, 2018, the balances reported for cash, accounts receivable, prepaid expenses, accounts payable, and accrued liabilities, approximate the fair value because of their short maturities.
26
Income Taxes
The Company records deferred taxes in accordance with FASB ASC No. 740, Income Taxes. Deferred tax assets and liabilities are recognized for the future tax consequences attributable to temporary differences between the financial statement carrying amounts of existing assets and liabilities and loss carryforwards and their respective tax bases. Deferred tax assets and liabilities are measured using enacted tax rates expected to apply to taxable income in the years in which those temporary differences are expected to be recovered or settled. The effect of a change in tax rules on deferred tax assets and liabilities is recognized in operations in the year of change. A valuation allowance is recorded when it is “more likely-than-not” that a deferred tax asset will not be realized.
As of the date of this filing, the Company is current in filing their tax returns. The last return filed by the Company was December 31, 2018, and the Company has not accrued any potential penalties or interest from that period forward.
Basic and Diluted Loss Per Share
In accordance with ASC Topic 280 – “Earnings Per Share”, the basic loss per common share is computed by dividing net loss available to common stockholders by the weighted average number of common shares outstanding. Diluted loss per common share is computed similar to basic loss per common share except that the denominator is increased to include the number of additional common shares that would have been outstanding if the potential common shares had been issued and if the additional common shares were dilutive.
Recent Accounting Pronouncements
In May 2014, the FASB issued ASU No. 2014-09, Revenue from Contracts with Customers (Topic 606), which replaces existing revenue recognition guidance. The updated guidance requires companies to recognize revenue in a way that depicts the transfer of promised goods or services to customers in an amount that reflects the consideration to which the entity expects to be entitled in exchange for those goods or services. In addition, the new standard requires that reporting companies disclose the nature, amount, timing and uncertainty of revenue and cash flows arising from contracts with customers. The Company adopted the standard on January 1, 2018, using a modified retrospective approach, with the cumulative effect of initially applying the standard recognized in retained earnings at the date of adoption.
In February 2016, the FASB issued ASU 2016-02 (ASC Topic 842), Leases. The ASU amends a number of aspects of lease accounting, including requiring lessees to recognize operating leases with a term greater than one year on their balance sheet as a right-of-use asset and corresponding lease liability, measured at the present value of the lease payments. The amendments in this ASU are effective for fiscal years beginning after December 15, 2018, including interim periods within those fiscal years. Early adoption is permitted. The Company adopted the new lease guidance effective January 1, 2019.
NOTE 2 – GOING CONCERN
The Company has experienced net losses to date, and it has not generated sufficient revenue from operations to meet our operational overhead. We will need additional working capital to service debt and for ongoing operations, which raises substantial doubt about our ability to continue as a going concern. Management of the Company is preparing a strategy to meet operational shortfalls which may include equity funding, short term or long-term financing or debt financing, to enable the Company to reach profitable operations. Historically, the Company’s sole officer and director has provided short term loans to meet working capital shortfalls. We have recently entered into financing agreements with various third parties to meet our capital needs in fiscal 2020.
The accompanying financial statements do not include any adjustments related to the recoverability or classification of asset-carrying amounts or the amounts and classification of liabilities that may result should the Company be unable to continue as a going concern.
27
NOTE 3 – MERGER TRANSACTION
On November 22, 2019, Vet Online Supply and Brewbilt Manufacturing (“BrewBilt”) entered into an Agreement and Plan of Merger (the “Merger Agreement”) and completed a merger, whereby Brewbilt merged with and into Vet Online Supply, with BrewBilt remaining as the surviving entity (the “Merger”). Under U.S. generally accepted accounting principles, the merger is treated as a “reverse merger” under the purchase method of accounting, with BrewBilt as the accounting acquirer.
Pursuant with the Merger Asset Purchase Agreement, the Board of Directors has authorized that BrewBilt shall sell, assign and transfer all of its right, title and interest to its IP, fixed assets and “know how” to the Company (collectively, the “Seller’s Assets”). Vet Online Supply and BrewBilt mutually agree that BrewBilt will assign certain assets and provide the “Know-How” regarding the designing and building of the finest craft brewing equipment in the industry today. As consideration for the IP, fixed assets and the “Know -How”, the Company shall issue, or cause to be issued, $5,000,000 worth of Preferred Series A Stock (PAR $.001) within thirty (30) days from the date of the agreement. The number of Preferred Series A shares to be issued is 500,000 shares at a price of $10.00 per share and convertible pursuant the conversion rights as specified in the Articles of Incorporation and certificate of designation for VTNL. BrewBilt has designated that the said stock be issued in the name of its President, Jeffrey Lewis.
The Board of Directors dismissed Daniel Rushford as an officer and director, specifically as the Chief Executive Officer, Chairman of the Board, and Corporate (President) of the Company effective November 22, 2019. Effective November 22, 2019, Daniel Rushford will have a new revised Employment Agreement which appoints him as Manager of the CBD Pet Supply Division, a non-director/officer position which includes returning to Treasury 1,000 Preferred Series B Control Shares, and an annual salary of $36,000. Unpaid wages will accrue interest at 6% per annum and may be converted to restricted common stock at fair market value at the time of conversion.
NOTE 4 - PREPAID EXPENSES
Prepaid fees represent amounts paid in advance for future contractual benefits to be received. Contracting expenses paid in advance are recorded as a prepaid asset and then amortized to the statements of operations when services are rendered, or over the life of the contract using the straight-line method.
As of December 31, 2019, the Company accrued prepaid insurance expenses and employee wages of $9,467 and as of December 31, 2018, the Company accrued prepaid insurance expenses of $2,567.
NOTE 5 – PROPERTY AND EQUIPMENT
Property and equipment consisted of the following at December 31, 2019 and December 31, 2018:
| December 31, | December 31, | |||||||
| 2019 | 2018 | |||||||
| Computer Equipment | $ | 18,313 | $ | 14,877 | ||||
| Leasehold Improvements | 48,549 | 45,549 | ||||||
| Machinery | 250,762 | 243,848 | ||||||
| Vehicles | 6,717 | 98,796 | ||||||
| Total | 324,341 | 403,070 | ||||||
| Less accumulated depreciation | (208,139 | ) | (186,258 | ) | ||||
| Net | $ | 116,202 | $ | 216,812 | ||||
28
NOTE 6 – LEASES
The Company adopted the new lease guidance effective January 1, 2019 using the modified retrospective transition approach, applying the new standard to all of its leases existing at the date of initial application which is the effective date of adoption. Consequently, financial information will not be updated, and the disclosures required under the new standard will not be provided for dates and periods before January 1, 2019. We elected the package of practical expedients which permits us to not reassess (1) whether any expired or existing contracts are or contain leases, (2) the lease classification for any expired or existing leases, and (3) any initial direct costs for any existing leases as of the effective date. We did not elect the hindsight practical expedient which permits entities to use hindsight in determining the lease term and assessing impairment. The adoption of the lease standard did not change our previously reported consolidated statements of operations and did not result in a cumulative catch-up adjustment to opening equity. The adoption of the new guidance resulted in the recognition of ROU assets of $423,360 and lease liabilities of $423,360.
The interest rate implicit in lease contracts is typically not readily determinable. As such, the Company utilizes its incremental borrowing rate, which is the rate incurred to borrow on a collateralized basis over a similar term an amount equal to the lease payments in a similar economic environment. In calculating the present value of the lease payments, the Company elected to utilize its incremental borrowing rate based on the remaining lease terms as of the January 1, 2019 adoption date.
Operating lease ROU assets and operating lease liabilities are recognized based on the present value of the future minimum lease payments over the lease term at the commencement date. The operating lease ROU asset also includes any lease payments made and excludes lease incentives and initial direct costs incurred, if any. Our lease terms may include options to extend or terminate the lease when it is reasonably certain that we will exercise that option. Our lease has a remaining lease term of nine years.
The Company has elected the practical expedient to combine lease and non-lease components as a single component. The lease expense is recognized over the expected term on a straight-line basis. Operating leases are recognized on the balance sheet as right-of-use assets, current operating lease liabilities and non-current operating lease liabilities.
The new standard also provides practical expedients and certain exemptions for an entity’s ongoing accounting. We have elected the short-term lease recognition exemption for all leases that qualify. This means, for those leases where the initial lease term is one year or less or for which the ROU asset at inception is deemed immaterial, we will not recognize ROU assets or lease liabilities. Those leases are expensed on a straight-line basis over the term of the lease.
Operating Leases
On January 1, 2018, the Company entered into a standard office lease for approximately 8,000 square feet of space, located in the Wolf Creek Industrial Building at 110 Spring Hill Dr. #10 Grass Valley, CA 95945. The lease has a term of 10 years, from January 1, 2018 through January 1, 2028, with a monthly rent of $4,861.
ROU assets and lease liabilities related to our operating lease is as follows:
| December 31, | ||||
| 2019 | ||||
| Right-of-use assets | $ | 392,664 | ||
| Current lease liabilities | — | |||
| Non-current lease liabilities | $ | 392,664 | ||
29
NOTE 7 – ACCURED LIABILITIES
As of December 31, 2019 and 2018, accrued liabilities were comprised of the following:
| December 31, | ||||||||
| 2019 | 2018 | |||||||
| Accrued liabilities | ||||||||
| Accrued wages | $ | 5,784 | $ | 838 | ||||
| Credit card | 16,659 | 17,560 | ||||||
| Payroll liabilities | (644 | ) | 3,500 | |||||
| Sales tax payable | 35,740 | 67,243 | ||||||
| Warranty | 5,000 | 5,000 | ||||||
| Total accrued expenses | $ | 62,539 | $ | 94,141 | ||||
NOTE 8 – BILLINGS IN EXCESS OF REVENUE AND EARNINGS IN EXCESS OF BILLINGS
Billings in excess of revenue is related to contracted amounts that have been invoiced to customers for which remaining performance obligations must be completed before the Company can recognize the revenue. Earnings in excess of billings is related to the cost of sales associated with the customer products that are incomplete.
Changes in unearned revenue for the periods ended December 31, 2019 and December 31, 2018 were as follows:
| December 31, | ||||||||
| 2019 | 2018 | |||||||
| Unearned revenue, beginning of the period | $ | 1,905,346 | $ | 1,919,618 | ||||
| Billings in excess of revenue during the period | 536,420 | 272,871 | ||||||
| Recognition of unearned revenue in prior periods | (930,670 | ) | (287,143 | ) | ||||
| Unearned revenue, end of the period | $ | 1,511,096 | $ | 1,905,346 | ||||
The following table summarizes the Company’s estimated unrecognized contract revenue as of December 31, 2019, and the future periods within which the Company expects to recognize such revenue:
| Expected Future Revenue by Period | ||||||||||||||||||||
| Less than | Between | Between | More than | |||||||||||||||||
| 90 days | 3-6 months | 6-9 months | 1 year | Total | ||||||||||||||||
| Unrecognized contract revenue | $ | 240,744 | $ | 57,720 | $ | 871,814 | $ | 340,818 | $ | 1,511,096 | ||||||||||
As of December 31, 2019 and December 31, 2018, the Company has recorded $53,038 and $344,134, respectively in earnings in excess of billings for the cost of sales related to customer orders in progress.
NOTE 9 – CONVERTIBLE NOTES PAYABLE
As of December 31, 2019, notes payable were comprised of the following:
| Original | Original | Due | Interest | Conversion | December 31, | |||||||||||
| Note Amount | Note Date | Date | Rate | Rate | 2019 | |||||||||||
| APG Capital #2 | 31,500 | 6/25/2018 | 6/25/2019 | 12% | Variable | 31,500 | ||||||||||
| Auctus Fund #2 | 84,000 | 1/10/2018 | 10/10/2018 | 24% | Variable | 31,285 | ||||||||||
| Auctus Fund #3 | 175,000 | 2/6/2018 | 11/6/2018 | 24% | Variable | 175,000 | ||||||||||
| Auctus Fund #4 | 90,000 | 3/6/2018 | 12/6/2018 | 24% | Variable | 90,000 | ||||||||||
| Auctus Fund #5 | 100,000 | 6/14/2018 | 3/14/2019 | 24% | Variable | 100,000 | ||||||||||
| Auctus Fund #6 | 75,000 | 8/13/2018 | 5/13/2019 | 12% | Variable | 75,000 | ||||||||||
| Auctus Fund #7 | 25,000 | 10/11/2018 | 7/11/2019 | 12% | Variable | 25,000 | ||||||||||
| Auctus Fund #8 | 25,750 | 12/20/2018 | 9/20/2019 | 12% | Variable | 25,750 | ||||||||||
| Auctus Fund #9 | 57,000 | 4/12/2019 | 1/12/2020 | 12% | Variable | 57,000 | ||||||||||
| Auctus Fund #10 | 31,000 | 7/22/2020 | 7/22/2020 | 12% | Variable | 31,000 | ||||||||||
| EMA Financial #2 | 50,000 | 12/15/2017 | 12/15/2018 | 12% | Variable | 8,474 | ||||||||||
| EMA Financial #3 | 100,000 | 3/5/2018 | 3/5/2019 | 24% | Variable | 73,305 | ||||||||||
| EMA Financial #4 | 25,000 | 10/10/2018 | 7/10/2019 | 24% | Variable | 25,000 | ||||||||||
| Emerging Corp Cap #1 | 83,333 | 2/12/2018 | 2/11/2019 | 22% | Variable | 74,933 | ||||||||||
| Emerging Corp Cap #2 | 110,000 | 10/31/2018 | 10/31/2019 | 12% | Variable | 110,000 | ||||||||||
| Power Up Lending #8 | 33,000 | 6/25/2018 | 4/15/2019 | 12% | Variable | — | ||||||||||
| 933,247 | ||||||||||||||||
| Debt discount | (100,137 | ) | ||||||||||||||
| Financing costs./Original issue discount | (3,726 | ) | ||||||||||||||
| Notes payable, net of discount | $ | 829,384 | ||||||||||||||
30
All of the Company’s convertible notes have a conversion rate that is variable, and therefore, the Company has accounted for their conversion features as derivative instruments (see Note 10). The Company recorded amortization of $13,796 on their convertible note debt discounts and $1,880 on loan fees. As of December 31, 2019, the convertible notes payable are convertible into 136,100,371 shares of the Company’s common stock.
During the year ended December 31, 2019, the Company recorded interest expense of $23,211 on its convertible notes payable. During the year ended December 31, 2019, the Company recorded conversions of $1,148 of convertible note interest and $500 in conversion fees. As of December 31, 2019, the accrued interest balance was $240,709.
As of December 31, 2019, we have not attained profitable operations and are dependent upon obtaining financing to pursue any extensive acquisitions and activities.
NOTE 10 – DERIVATIVE LIABIITIES
The following table represents the Company’s derivative liability activity for the embedded conversion features for the year ending December 31, 2019:
| December 31, | ||||
| 2019 | ||||
| Balance at merger date | $ | 15,347,154 | ||
| Initial recognition of derivative liability | — | |||
| Conversion of derivative instruments to Common Stock | (5,077 | ) | ||
| Mark-to-Market adjustment to fair value | (13,068,808 | ) | ||
| Balance, end of period | $ | 2,273,269 | ||
During the year ended December 31, 2019, in conjunction with convertible notes payable accrued interest being converted into common stock of the Company, derivative liabilities were reduced by $5,077.
For the year ended December 31, 2019, the Company performed a final mark-to-market adjustment for the derivative liability related to the convertible notes and the carrying amount of the derivative liability related to the conversion feature and recognized a gain on the derivative liability valuation of $13,068,808.
The Company uses the Black-Scholes option pricing model to estimate fair value for those instruments convertible into common shares at inception, at conversion or extinguishment date, and at each reporting date. During the year ended December 31, 2019, the company used the following assumptions in their Black-Scholes model: (1) risk free interest rate 1.48% - 1.83%, (2) term of 0.25 years – 4.56 years, (3) expected stock volatility of 724.25% - 1,770.51%, (4) expected dividend rate of 0%, (5) common stock price of $0.0133 - $0.0235, and (6) exercise price of $0.001 - $0.01066.
These instruments were not issued with the intent of effectively hedging any future cash flow, fair value of any asset, liability or any net investment in a foreign operation. The instruments do not qualify for hedge accounting, and as such, all future changes in the fair value will be recognized in earnings until such time as the instruments are exercised, converted or expire.
31
NOTE 11 – RELATED PARTY TRANSACTIONS
Mr. Jef Lewis
On November 22, 2019, the Company appointed Jeffrey Lewis as the new Chief Executive Officer, Chairman of the Board, Corporate President, Secretary, and Treasurer of the Company. The Company and Mr. Lewis entered into an Employee Agreement that included the issuance of 1,000 Preferred Series B Control Shares, and an annual salary of $200,000. Unpaid wages will accrue interest at 6% per annum and may be converted to restricted common stock at fair market value at the time of conversion. During the year ended December 31, 2019, the Company accrued wages of $16,667 and paid wages of $10,822. During the year ended December 31, 2018, Mr. Lewis advanced the Company $5,805.
Pursuant to the Merger Agreement, the Company will issue $5,000,000 worth of Preferred Series A Stock to Mr. Lewis. The number of Preferred Series A shares to be issued is 500,000 shares at a price of $10.00 per share and convertible pursuant the conversion rights as specified in the Articles of Incorporation and Certificate of Designation for the Company. As of December 31, 2019, the shares have not been issued, and the Company recorded a liability for unissued shares in the amount of $500, goodwill of $2,289,884 and $2,289,334 to additional paid in capital.
Mr. Samuel Berry, Director
On November 22, 2019, the Company entered into a Consulting Agreement with Mr. Samuel Berry. Mr. Berry will receive an annual salary of $50,000, payable in quarterly installments at $12,500 per quarter. During the year ended December 31, 2019, the Company accrued $4,167 in consulting fees in connection to his agreement.
NOTE 12 – LONG TERM DEBT
As of December 31, 2019 and December 31, 2018, long term debt was comprised of the following:
| December 31, | ||||||||
| 2019 | 2018 | |||||||
| Long term debt | ||||||||
| Equipment lease | $ | 1,952 | $ | 8,543 | ||||
| Equipment loan | 115,614 | 131,747 | ||||||
| Line of credit | 96,664 | 100,811 | ||||||
| Vehicle loans | — | 52,184 | ||||||
| Other loan term loans | 93,657 | 65,134 | ||||||
| Total long-term debt | $ | 307,887 | $ | 358,419 | ||||
NOTE 13 – PREFERRED STOCK
On March 28, 2017, the Company filed an amendment to its articles of incorporation designating 20,000 shares of its authorized preferred stock, par value $0.001 as Series B Voting Preferred Stock. The Series B Voting Preferred Stock shall have the right to vote the shares on any matter requiring shareholder approval on the basis of 4 times the votes of all the issued and outstanding shares of common stock, as well as any issued and outstanding preferred stock.
32
On July 1, 2019, the Company filed a Certificate of Amendment to increase the number of authorized Series A Preferred Stock to 30,000,000, with a par value of $0.001. Each share of Preferred Series A Stock shall have a value of $10 per share and will convert into common stock at the closing price of the common stock on the date of conversion. The Series A stock shall have no voting rights on corporate matters, unless and until the Series A shares are converted into Common Shares, at which time they will have the same voting rights as all Common Shareholders have; their consent shall not be required for taking any corporate action.
Pursuant to the Merger Agreement dated November 22, 2019, the Company will issue $5,000,000 worth of Preferred Series A Stock to Mr. Lewis. The number of Preferred Series A shares to be issued is 500,000 shares at a price of $10.00 per share and convertible pursuant the conversion rights as specified in the Articles of Incorporation and Certificate of Designation for the Company. As of December 31, 2019, the shares have not been issued, and the Company recorded a liability for unissued shares in the amount of $500, goodwill of $2,289,884 and $2,289,334 to additional paid in capital.
As of December 31, 2019, 30,000,000 Series A Preferred shares and 1,000 Series B Preferred shares were authorized, of which 400,000 Series A shares were issued and outstanding, and 1,000 Series B shares were issued and outstanding.
NOTE 14 – COMMON STOCK
On April 22, 2019, the Company approved the authorization of a 1 for 3,000 reverse stock split of the Company’s outstanding shares of common stock. The Company’s financial statements have been retroactively adjusted for this stock split for all periods presented.
During the year ended December 31, 2019, the holder of a convertible note converted $1,148 of accrued interest and $500 in conversion fees into 400,000 shares of common stock. The common stock was valued at $5,077 based on the market price of the Company’s stock on the date of conversion.
As of December 31, 2019, 5,000,000,000 were authorized, of which 10,343,330 shares issued and outstanding.
Warrants
We account for common stock purchase warrants as derivative liabilities and debt issuance costs on the balance sheet at fair value, and changes in fair value during the periods presented in the statement of operations, which is revalued at each balance sheet date subsequent to the initial issuance of the warrant.
NOTE 15– INCOME TAX
Deferred income taxes are determined using the liability method for the temporary differences between the financial reporting basis and income tax basis of the Company’s assets and liabilities. Deferred income taxes are measured based on the tax rates expected to be in effect when the temporary differences are included in the Company’s tax return. Deferred tax assets and liabilities are recognized based on anticipated future tax consequences attributable to differences between financial statement carrying amounts of assets and liabilities and their respective tax bases.
The deferred tax asset and the valuation allowance consist of the following at December 31, 2019:
| December 31, | ||||
| 2019 | ||||
| Net operating loss | $ | 1,854,612 | ||
| Statutory rate | 21 | % | ||
| Expected tax recovery | 389,469 | |||
| Change in valuation allowance | (389,469 | ) | ||
| Income tax provision | $ | — | ||
| Components of deferred tax asset: | ||||
| Non-capital tax loss carry-forwards | 389,469 | |||
| Less: valuation allowance | (389,469 | ) | ||
| Net deferred tax asset | $ | — | ||
As of the date of this filing, the Company is current in filing their tax returns. The last return filed by the Company was December 31, 2018, and the Company has not accrued any potential penalties or interest from that period forward.
33
NOTE 16 – COMMITMENTS AND CONTINGENCIES
Consulting Agreements
On June 28, 2018, the Company entered into a Consulting Agreement (“Agreement”) with Charlie Johnson (“Johnson”) to expand its sales and marketing efforts to grow the Company’s revenue. The Company has agreed to pay a commission of 5% on each sale generated by Johnson, based upon the total contract amount received by the Company. In addition, the Company will pay Johnson $500 per day to assist customers in the installation of the Company’s equipment. The term of the Agreement is for one year and is renewable upon mutual consent.
On January 1, 2018, the Company entered into a Chief Financial Officer Compensation Agreement (“Agreement”) with Hanson & Associates, LLC with regards to being appointed the Chief Executive Officer and Member of the Board of Directors. Hanson & Associates, LLC is responsible for building long term relationships with financial institutions and will assist in developing the administrative and financial aspects of the company. The Company has agreed to pay Hanson & Associates, LLC $5,000 per month and pay an incentive bonus of 1% of the year end gross revenue for 2018. The term of the Agreement is for one year and is renewable upon mutual consent.
Distribution & Licensing Agreement
On November 19, 2019, the Company entered into a Distribution & Licensing Agreement with Bgreen Partners, Inc., a California Corporation. The Agreement provides exclusive rights to various cannabis and agricultural products inclusive of grow-containers and CBD Extraction Systems to be used for mobile processing. The IP and rights are valued at $4,000,000, based upon a five-year term. As consideration for the IP and rights, the Company issued 400,000 Preferred Series A shares at a price of $10.00 per share and convertible pursuant the conversion rights as specified in the Articles of Incorporation and certificate of designation for the Company.
Employee Agreement
On November 22, 2019, the Company entered into an Employment Agreement with Mr. Daniel Rushford. Mr. Rushford will receive an annual salary of $36,000 to be paid in equal monthly installments. Unpaid amounts will accrue annual interest of 6%. The term of the Consulting Agreement is for one year and is renewable upon mutual consent.
Lease
On January 1, 2018, the Company entered into a standard office lease for approximately 8,000 square feet of space, located in the Wolf Creek Industrial Building at 110 Spring Hill Dr. #10 Grass Valley, CA 95945. The lease has a term of 10 years, from January 1, 2018 through January 1, 2028, with a monthly rent of $4,861.
Service Agreement
On June 12, 2018, the Company entered into a preventative maintenance service agreement with Atlas Copco Compressions LLC. The agreement is for a period of 5 years, at a cost of $145.13 per month. During the years ended December 31, 2019 and December 31, 2018, the Company made payments of $1,742 and $870, respectively, in connection with this agreement.
NOTE 17 – SUBSEQUENT EVENTS
On March 25, 2020, the Company filed a Certificate of Amendment to increase the number of authorized common shares from 5,000,000,000 to 10,000,000,000 with a par value of $0.001.
34
ITEM 9. CHANGES IN AND DISAGREEMENTS WITH ACCOUNTANTS AND FINANCIAL DISCLOSURE
There are no changes in or disagreements with accountants on accounting and/or financial disclosure.
ITEM 9A. CONTROLS AND PROCEDURES
Evaluation of Disclosure Controls and Procedures
Our management, under supervision and with the participation of the Company’s Principal Executive Officer and Principal Financial Officer, evaluated the effectiveness of our disclosure controls and procedures, as defined under Exchange Act Rule 13a-15(e). Based upon this evaluation, the Principal Executive Officer and Principal Financial Officer concluded that, as of December 31, 2019, because of the material weakness in our internal control over financial reporting (“ICFR”) described below, our disclosure controls and procedures were not effective.
Disclosure controls and procedures are controls and other procedures that are designed to ensure that required information to be disclosed in our reports filed or submitted under the Securities Exchange Act is recorded, processed, summarized and reported within the time periods specified in the Securities and Exchange Commission’s rules and forms. Disclosure controls and procedures include, without limitation, controls and procedures designed to ensure that required information to be disclosed in our reports filed under the Exchange Act is accumulated and communicated to our management, including our principal executive officer and our principal financial officer, as appropriate, to allow timely decisions regarding required disclosure.
Management’s Report on Internal Control over Financial Reporting
Our management is responsible for establishing and maintaining adequate internal control over financial reporting, as defined under Exchange Act Rules 13a-15(f) and 14d-14(f). Our internal control over financial reporting is designed to provide reasonable assurance regarding the reliability of financial reporting and the preparation of financial statements for external purposes in accordance with generally accepted accounting principles.
All internal control systems, no matter how well designed, have inherent limitations and may not prevent or detect misstatements. Therefore, even those systems determined to be effective can only provide reasonable assurance with respect to financial reporting reliability and financial statement preparation and presentation. In addition, projections of any evaluation of effectiveness to future periods are subject to risk that controls become inadequate because of changes in conditions and that the degree of compliance with the policies or procedures may deteriorate.
Management assessed the effectiveness of our internal control over financial reporting as of December 31, 2019. In making the assessment, management used the criteria issued by the Committee of Sponsoring Organizations of the Treadway Commission (COSO) in Internal Control-Integrated Framework 2013. Based on its assessment, management concluded that, as of December 31, 2019, our internal control over financial reporting was not effective and that material weaknesses in ICFR existed as more fully described below.
As defined by Auditing Standard No. 5, “An Audit of Internal Control Over Financial Reporting that is Integrated with an Audit of Financial Statements” established by the Public Company Accounting Oversight Board (“PCAOB”), a material weakness is a deficiency or combination of deficiencies that results in more than a remote likelihood that a material misstatement of annual or interim financial statements will not be prevented or detected. In connection with the assessment described above, management identified the following control deficiencies that represent material weaknesses as of December 31, 2019:
| 1) | Lack of an independent audit committee or audit committee financial expert, and no independent directors. We do not have any members of the Board who are independent directors and we do not have an audit committee. We have a single officer and director. These factors may be counter to corporate governance practices as defined by the various stock exchanges and may lead to less supervision over management; |
| 2) | Insufficient written policies and procedures for accounting and financial reporting with respect to the requirements and application of US GAAP and SEC disclosure requirements; |
35
Management’s Remediation Initiatives
As of December 31, 2019, management assessed the effectiveness of our internal control over financial reporting. Based on that evaluation, it was concluded that during the period covered by this report, the internal controls and procedures were not effective due to deficiencies that existed in the design or operation of our internal controls over financial reporting. However, management believes these weaknesses did not have an effect on our financial results. During the course of our evaluation, we did not discover any fraud involving management or any other personnel who play a significant role in our disclosure controls and procedures or internal controls over financial reporting.
Due to a lack of financial and personnel resources, we are not able to, and do not intend to, immediately take any action to remediate these material weaknesses. We will not be able to do so until, if ever, we acquire sufficient financing and staff to do so. We will implement further controls as circumstances, cash flow, and working capital permits. Notwithstanding the assessment that our ICFR was not effective and that there were material weaknesses as identified in this report, we believe that our financial statements contained in our Annual Report on Form 10-K for the period ended December 31, 2019, fairly presents our financial position, results of operations, and cash flows for the periods covered, as identified, in all material respects.
Management believes that the material weaknesses set forth above were the result of the scale of our operations and intrinsic to our small size. Management also believes that these weaknesses did not have an effect on our financial results.
This Annual Report does not include an attestation report of the Company’s registered public accounting firm regarding internal control over financial reporting. Management’s report was not subject to attestation by the Company’s registered public accounting firm pursuant to the rules of the Securities and Exchange Commission that permit the Company to provide only management’s report in this annual report.
Changes in Internal Control over Financial Reporting
During the period covered by this report, there were no changes (including corrective actions with regard to significant deficiencies or material weaknesses) in our internal controls over financial reporting that occurred that have materially affected, or are reasonably likely to materially affect, our internal control over financial reporting.
None.
ITEM 10. DIRECTORS, EXECUTIVE OFFICERS AND CORPORATE GOVERNANCE
There are no family relationships among our directors and executive officers. Each director is elected at our annual meeting of shareholders and holds office until the next annual meeting of shareholders, or until his successor is elected and qualified. Also provided herein are brief descriptions of the business experience of each director, executive officer and advisor during the past five years and an indication of directorships held by each director in other companies subject to the reporting requirements under the Federal securities laws. None of our officers or directors is a party adverse to us or has a material interest adverse to us. Our Board of Directors is comprised of only one class of director.
36
The following table and text set forth the names and ages of all directors and executive officers as of December 31, 2019:
| Name | Age | Position with the Company | Position Held Since |
| Jef Lewis | 48 | President, Chief Executive Officer, Secretary, Treasurer and Director | November 22, 2019 |
| Samuel Berry | 41 | Director | November 22, 2019 |
The term of office for each director is one year, or until the next annual meeting of the shareholders.
Biographical Information
Mr. Jef Lewis
Jeffrey Lewis is 46 years old. As the founder of BrewBilt Manufacturing, LLC, a multiple million-dollar sales and manufacturing company, he has 15 years of experience managing engineering, design and fabrication teams that custom design and fabricate integrated stainless steel distillation and brewing systems for the beverage, pharmaceutical, cannabis and hemp industries. Mr. Lewis has been a part of the design team which builds CBD cold-water and alcohol -based extraction systems in the US, and he will take charge of VTNL, and continue to drive his products into both the cannabis and brewing markets.
Mr. Samuel L. Berry
As a member of the Board of Directors of the Company, Samuel Berry resides in San Diego, California. A graduate from Keene State College in New Hampshire with a Bachelor of Science, and a graduate from Florida International University with his Master of Science, Mr. Berry offers VTNL over 10 years of business experience in management related to fitness and health. Mr. Berry will take charge in new business development and oversight management for all products. More specifically, Mr. Berry will assist VTNL in branding the company’s new intellectual property related to new surgical instruments and Cannabis products for future development.
Significant Employees
We do not employ any non-officers who are expected to make a significant contribution to our business.
Involvement in Certain Legal Proceedings
To the best of the Company’s knowledge, other than as set forth herein, none of the following events occurred during the past ten years that are material to an evaluation of the ability or integrity of any of our executive officers or directors:
| 1. | A petition under the Federal bankruptcy laws or any state insolvency law was filed by or against, or a receiver, fiscal agent or similar officer was appointed by a court for the business or property of such person, or any partnership in which he was a general partner at or within two years before the time of such filing, or any corporation or business association of which he was an executive officer at or within two years before the time of such filing; |
| 2. | Such person was convicted in a criminal proceeding or is a named subject of a pending criminal proceeding (excluding traffic violations and other minor offenses); |
37
| 3. | Such person was the subject of any order, judgment, or decree, not subsequently reversed, suspended or vacated, of any court of competent jurisdiction, permanently or temporarily enjoining him from, or otherwise limiting, the following activities: |
| i. | Acting as a futures commission merchant, introducing broker, commodity trading advisor, commodity pool operator, floor broker, leverage transaction merchant, any other person regulated by the Commodity Futures Trading Commission, or an associated person of any of the foregoing, or as an investment adviser, underwriter, broker or dealer in securities, or as an affiliated person, director or employee of any investment company, bank, savings and loan association or insurance company, or engaging in or continuing any conduct or practice in connection with such activity; |
| ii. | Engaging in any type of business practice; or |
| iii. | Engaging in any activity in connection with the purchase or sale of any security or commodity or in connection with any violation of Federal or State securities laws or Federal commodities laws; |
| 4. | Such person was the subject of any order, judgment or decree, not subsequently reversed, suspended or vacated, of any Federal or State authority barring, suspending or otherwise limiting for more than 60 days the right of such person to engage in any activity described in paragraph (3)(i) above, or to be associated with persons engaged in any such activity; |
| 5. | Such person was found by a court of competent jurisdiction in a civil action or by the Commission to have violated any Federal or State securities law, and the judgment in such civil action or finding by the Commission has not been subsequently reversed, suspended, or vacated; |
| 6. | Such person was found by a court of competent jurisdiction in a civil action or by the Commodity Futures Trading Commission to have violated any Federal commodities law, and the judgment in such civil action or finding by the Commodity Futures Trading Commission has not been subsequently reversed, suspended or vacated; |
| 7. | Such person was the subject of, or a party to, any Federal or State judicial or administrative order, judgment, decree, or finding, not subsequently reversed, suspended or vacated, relating to an alleged violation of: |
| i. | Any Federal or State securities or commodities law or regulation; or |
| ii. | Any law or regulation respecting financial institutions or insurance companies including, but not limited to, a temporary or permanent injunction, order of disgorgement or restitution, civil money penalty or temporary or permanent cease-and-desist order, or removal or prohibition order; or |
| iii. | Any law or regulation prohibiting mail or wire fraud or fraud in connection with any business entity; or |
| 8. | Such person was the subject of, or a party to, any sanction or order, not subsequently reversed, suspended or vacated, of any self-regulatory organization, any registered entity (as defined in Section 1(a)(29) of the Commodity Exchange Act (7 U.S.C. 1(a)(29))), or any equivalent exchange, association, entity or organization that has disciplinary authority over its members or persons associated with a member. |
Committees of the Board of Directors
We do not presently have a separately constituted audit committee, compensation committee, nominating committee, executive committee or any other committee of our Board of Directors. As such, our entire Board of Directors acts as our audit committee.
38
Audit Committee Financial Expert
Our Board of Directors does not currently have any member who qualifies as an audit committee financial expert. We believe that the cost of retaining such a financial expert at this time is prohibitive. Further, because we are a development stage business, we believe the services of an audit committee financial expert are not necessary at this time.
Code of Ethics
We do not currently have a Code of Ethics applicable to our principal executive, financial and accounting officers.
Potential Conflict of Interest
Since we do not have an audit or compensation committee comprised of independent directors, the functions that would have been performed by such committees are performed by our Board of Directors. Thus, there is a potential conflict of interest in that our sole director has the authority to determine issues concerning management compensation, including his own, and audit issues that may affect management decisions. We are not aware of any other conflicts of interest with any of our officers or sole director.
Board of Director’s Role in Risk Oversight
The Board of Directors assesses on an ongoing basis the risks faced by the Company. These risks include financial, technological, competitive and operational risks. The Board of Directors dedicates time at each of its meetings to review and consider the relevant risks faced at that time. In addition, since the Company does not have an Audit Committee, the Board of Directors is also responsible for the assessment and oversight of the Company’s financial risk exposures.
ITEM 11. EXECUTIVE COMPENSATION
The table set forth below summarizes the annual and long-term compensation for services in all capacities to us payable to our officers and directors for the fiscal years ended December 31, 2018 and December 31, 2017. Our Board of Directors may adopt an incentive stock option plan for our executive officers that would result in additional compensation.
Summary Compensation Table
| Nonqualified | ||||||||||||||||||||||||||||||||||
| Non-Equity | Deferred | |||||||||||||||||||||||||||||||||
| Stock | Option | Incentive Plan | Compensation | All Other | ||||||||||||||||||||||||||||||
| Name and | Salary | Bonus | Awards | Awards | Compensation | Earnings | Compensation | Total | ||||||||||||||||||||||||||
| principal position | Year | ($) | ($) | ($) | ($) | ($) | ($) | ($) | ($) | |||||||||||||||||||||||||
| Jef Lewis | 2019 | 16,667 | — | — | — | — | — | — | 16,667 | |||||||||||||||||||||||||
| President, CEO, Secretary, | 2018 | — | — | — | — | — | — | — | — | |||||||||||||||||||||||||
| Treasurer and Director | ||||||||||||||||||||||||||||||||||
| Sam Berry | 2019 | 4,167 | — | — | — | — | — | — | 4,167 | |||||||||||||||||||||||||
| Director | 2018 | — | — | — | — | — | — | — | — | |||||||||||||||||||||||||
Narrative Disclosure to Summary Compensation Table
Mr. Jef Lewis, Chief Executive Officer
On November 22, 2019, the Company appointed Jeffrey Lewis as the new Chief Executive Officer, Chairman of the Board, Corporate President, Secretary, and Treasurer of the Company. The Company and Mr. Lewis entered into an Employee Agreement that included the issuance of 1,000 Preferred Series B Control Shares, and an annual salary of $200,000. Unpaid wages will accrue interest at 6% per annum and may be converted to restricted common stock at fair market value at the time of conversion. During the year ended December 31, 2019, the Company accrued wages of $16,667 and paid wages of $10,822.
39
Mr. Samuel Berry, Director
On November 22, 2019, the Company entered into a Consulting Agreement with Mr. Samuel Berry. Mr. Berry will receive an annual salary of $50,000, payable in quarterly installments at $12,500 per quarter. During the year ended December 31, 2019, the Company accrued $4,167 in consulting fees in connection to his agreement.
Long-Term Incentive Plan Awards
We do not have any long-term incentive plans that provide compensation intended to serve as incentive for performance.
Officer Compensation
Described above.
Director Compensation
Described above.
ITEM 12. SECURITY OWNERSHIP OF CERTAIN BENEFICIAL OWNERS AND MANAGEMENT AND RELATED STOCKHOLDER MATTERS
Security Ownership of Management
The following table sets forth certain information concerning the number of shares of our common stock owned beneficially as of December 31, 2018 by: (i) each of our directors; (ii) each of our named executive officers; and (iii) each person or group known by us to beneficially own more than 5% of our outstanding shares of common stock. Unless otherwise indicated, the shareholders listed below possess sole voting and investment power with respect to the shares they own.
| Amount and | ||||||||||
| Nature of | ||||||||||
| Name and Address of Beneficial | Title of | Beneficial | % of Common | |||||||
| Owners of Common Stock | Class | Ownership (1) | Stock (2) | |||||||
| Sam Berry | Common | 25,000 | 0.24 | % | ||||||
| 57 Muddy River Ln. | Stock | |||||||||
| Bowdoinham, ME 04008 | ||||||||||
| Total Officers and Directors | 25,000 | 0.00 | % | |||||||
| 5% Shareholders | Common | |||||||||
| Dan Rushford | Stock | 8,008,334 | 77.43 | % | ||||||
| 1. | The number and percentage of shares beneficially owned is determined under rules of the SEC and the information is not necessarily indicative of beneficial ownership for any other purpose. Under such rules, beneficial ownership includes any shares as to which the individual has sole or shared voting power or investment power and also any shares which the individual has the right to acquire within 60 days through the exercise of any stock option or other right. The persons named in the table have sole voting and investment power with respect to all shares of common stock shown as beneficially owned by them, subject to community property laws where applicable and the information contained in the footnotes to this table. |
| 2. | The percentage shown is based on denominator of 10,343,330 shares of common stock issued and outstanding for the company as of December 31, 2019. |
40
Securities Authorized for Issuance Under Equity Compensation Plans
As of December 31, 2019, we did not have any authorized Equity Compensation Plans. Further, we have no plans to create any such plan or plans during the fiscal year ending December 31, 2019.
Changes in Control
We are unaware of any contract or other arrangement that could result in a change of control of the Company.
ITEM 13. CERTAIN RELATIONSHIPS AND RELATED TRANSACTIONS, AND DIRECTOR INDEPENDENCE
Related Party Transactions
Mr. Jef Lewis
On November 22, 2019, the Company appointed Jeffrey Lewis as the new Chief Executive Officer, Chairman of the Board, Corporate President, Secretary, and Treasurer of the Company. The Company and Mr. Lewis entered into an Employee Agreement that included the issuance of 1,000 Preferred Series B Control Shares, and an annual salary of $200,000. Unpaid wages will accrue interest at 6% per annum and may be converted to restricted common stock at fair market value at the time of conversion. During the year ended December 31, 2019, the Company accrued wages of $16,667 and paid wages of $10,822. During the year ended December 31, 2018, Mr. Lewis advanced the Company $5,805.
Pursuant to the Merger Agreement, the Company will issue $5,000,000 worth of Preferred Series A Stock to Mr. Lewis. The number of Preferred Series A shares to be issued is 500,000 shares at a price of $10.00 per share and convertible pursuant the conversion rights as specified in the Articles of Incorporation and Certificate of Designation for the Company. As of December 31, 2019, the shares have not been issued, and the Company recorded a liability for unissued shares in the amount of $500, goodwill of $2,289,884 and $2,289,334 to additional paid in capital.
Mr. Samuel Berry, Director
On November 22, 2019, the Company entered into a Consulting Agreement with Mr. Samuel Berry. Mr. Berry will receive an annual salary of $50,000, payable in quarterly installments at $12,500 per quarter. During the year ended December 31, 2019, the Company accrued $4,167 in consulting fees in connection to his agreement.
Other than the foregoing, none of the following persons has any direct or indirect material interest in any transaction to which we were or are a party since the beginning of our last fiscal year, or in any proposed transaction to which we propose to be a party:
| (A) | any of our director(s) or executive officer(s); | |
| (B) | any nominee for election as one of our directors; | |
| (C) | any person who is known by us to beneficially own, directly or indirectly, shares carrying more than 5% of the voting rights attached to our Common Stock; or | |
| (D) | any member of the immediate family (including spouse, parents, children, siblings and in-laws) of any of the foregoing persons named in paragraph (A), (B) or (C) above. |
41
Director Independence
For purposes of determining director independence, we have applied the definitions set out in NASDAQ Rule 5605(a)(2). The OTCBB on which shares of Common Stock are quoted does not have any director independence requirements. The NASDAQ definition of “Independent Officer” means a person other than an Executive Officer or employee of the Company or any other individual having a relationship, which, in the opinion of the Company’s Board of Directors, would interfere with the exercise of independent judgment in carrying out the responsibilities of a director. According to the NASDAQ definition, we have no independent directors.
Review, Approval or Ratification of Transactions with Related Persons
We are a smaller reporting company as defined by Rule 12b-2 of the Securities Exchange Act of 1934 and are not required to provide the information under this item.
ITEM 14. PRINCIPAL ACCOUNTING FEES AND SERVICES
During the year ended December 31, 2019, the Company incurred auditing expenses of approximately $40,000, which includes audit and review engagement services. There were not other audit related services or tax fees incurred. There were no other audit related services or tax fees incurred.
| Exhibit Number | Description |
| 31.1 | Certification of the Chief Executive Officer required under Rule 13a-14(a)/15d-14(a) of the Exchange Act* |
| 31.2 | Certification of the Chief Financial Officer required under Rule 13a-14(a)/15d-14(a) of the Exchange Act* |
| 32.1 | Certification of the Chief Executive Officer and Chief Financial Officer required under Section 1350 of the Exchange Act* |
| 101.INS | XBRL Instance Document* |
| 101.SCH | XBRL Taxonomy Extension Schema* |
| 101.CAL | XBRL Taxonomy Extension Calculation Linkbase* |
| 101.DEF | XBRL Taxonomy Extension Definition Linkbase* |
| 101.LAB | XBRL Taxonomy Extension Label Linkbase* |
| 101.PRE | XBRL Taxonomy Extension Presentation Linkbase* |
| * | Filed herewith |
42
Pursuant to the requirements of Section 13 or 15(d) of the Securities Exchange Act of 1934, the registrant has duly caused this report to be signed on its behalf by the undersigned, thereunto duly authorized.
| BrewBilt Manufacturing Inc. | |
| Date: April 14, 2020 | By: /s/ Jef Lewis |
| Chief Executive Officer |
Pursuant to the requirements of the Securities Exchange Act of 1934, this report has been signed below by the following persons on behalf of the registrant and in the capacities and on the dates indicated.
| /s/ Jef Lewis | Chief Executive Officer and Director | April 14, 2019 | ||
| Jef Lewis | ||||
| /s/ Jef Lewis | Chief Financial Officer | April 14, 2020 | ||
| Jef Lewis |
43