Attached files
| file | filename |
|---|---|
| EX-32.2 - EX-32.2 - ONESPAWORLD HOLDINGS Ltd | osw-ex322_9.htm |
| EX-32.1 - EX-32.1 - ONESPAWORLD HOLDINGS Ltd | osw-ex321_8.htm |
| EX-31.2 - EX-31.2 - ONESPAWORLD HOLDINGS Ltd | osw-ex312_10.htm |
| EX-31.1 - EX-31.1 - ONESPAWORLD HOLDINGS Ltd | osw-ex311_11.htm |
| EX-23.1 - EX-23.1 - ONESPAWORLD HOLDINGS Ltd | osw-ex231_842.htm |
| EX-21.1 - EX-21.1 - ONESPAWORLD HOLDINGS Ltd | osw-ex211_753.htm |
| EX-4.1 - EX-4.1 - ONESPAWORLD HOLDINGS Ltd | osw-ex41_532.htm |
UNITED STATES
SECURITIES AND EXCHANGE COMMISSION
WASHINGTON, D.C. 20549
FORM 10-K
(Mark One)
|
☒ |
ANNUAL REPORT PURSUANT TO SECTION 13 OR 15(d) OF THE SECURITIES EXCHANGE ACT OF 1934 |
For the fiscal year ended December 31, 2019
OR
|
|
TRANSITION REPORT PURSUANT TO SECTION 13 OR 15(d) OF THE SECURITIES EXCHANGE ACT OF 1934 |
For the transition period from to
Commission File Number: 001-38843
OneSpaWorld Holdings Limited
(Exact name of registrant as specified in its charter)
|
Commonwealth of The Bahamas |
|
Not Applicable |
|
(State or other jurisdiction of incorporation or organization) |
|
(I.R.S. Employer Identification No.) |
|
|
|
|
|
Harry B. Sands, Lobosky Management Co. Ltd. Shirley House 253 Shirley Street P.O. Box N-624 City of Nassau, Island of New Providence, Commonwealth of The Bahamas |
|
Not Applicable |
|
(Address of principal executive offices) |
|
(Zip code) |
Registrant’s telephone number, including area code: (242) 356-0006
Securities registered pursuant to Section 12(b) of the Act:
|
Title of each class |
|
Trading Symbol(s) |
|
Name of each exchange on which registered |
|
Common Shares, par value (U.S.) $0.0001 per share |
|
OSW |
|
The Nasdaq Capital Market |
Indicate by check mark if the registrant is a well-known seasoned issuer, as defined in Rule 405 of the Securities Act. ☐ Yes ☒ No
Indicate by check mark if the registrant is not required to file reports pursuant to Section 13 or Section 15(d) of the Act. ☐ Yes ☒ No
Indicate by check mark whether the registrant: (1) has filed all reports required to be filed by Section 13 or 15(d) of the Securities Exchange Act of 1934 during the preceding 12 months (or for such shorter period that the registrant was required to file such reports), and (2) has been subject to such filing requirements for the past 90 days. ☒ Yes ☐ No.
Indicate by check mark whether the registrant has submitted electronically every Interactive Data File required to be submitted pursuant to Rule 405 of Regulation S-T (Section 232.405 of this chapter) during the preceding 12 months (or for such shorter period that the registrant was required to submit such files). ☒ Yes ☐ No
Indicate by check mark whether the registrant is a large accelerated filer, an accelerated filer, a non-accelerated filer, smaller reporting company, or an emerging growth company. See the definitions of “large accelerated filer,” “accelerated filer,” “smaller reporting company,” and “emerging growth company” in Rule 12b-2 of the Exchange Act.
|
Large accelerated filer |
☐ |
|
Accelerated filer |
☐ |
|
|
|
|
|
|
|
Non-accelerated filer |
☒ |
|
Smaller reporting company |
☐ |
|
|
|
|
|
|
|
|
|
|
Emerging growth company |
☒ |
If an emerging growth company, indicate by check mark if the registrant has elected not to use the extended transition period for complying with any new or revised financial accounting standards provided pursuant to Section 13(a) of the Exchange Act. ☐
Indicate by check mark whether the registrant is a shell company (as defined in Rule 12b-2 of the Act). ☐ Yes ☒ No
The aggregate market value of the registrant’s common shares held by non-affiliates was $810,087,550 as of June 28, 2019, based on the closing price of the common stock on the Nasdaq Capital Market on June 28, 2019, which is the last business day of the registrant’s most recently completed second fiscal quarter. For the sole purpose of this calculation, only shares held by members of the board of directors of the registrant were deemed to be held by affiliates of the registrant. This determination of affiliate status is not necessarily conclusive for other purposes.
As of December 31, 2019, the registrant had 61,119,398 common shares outstanding.
DOCUMENTS INCORPORATED BY REFERENCE
Portions of our Proxy Statement prepared for our 2020 Annual Meeting of Shareholders are incorporated by reference into Part III of this Annual Report on Form 10-K.
i
OneSpaWorld Holdings Limited (“OneSpaWorld,” the “Company,” “we,” “our, “us” and other similar terms refer to OneSpaWorld Holdings Limited and its consolidated subsidiaries).
1
CAUTIONARY STATEMENT REGARDING FORWARD-LOOKING STATEMENTS
From time to time, including in this report and other disclosures, we may issue “forward-looking” statements within the meaning of Section 27A of the Securities Act of 1933, as amended, and Section 21E of the Securities Exchange Act of 1934, as amended (the “Exchange Act”). These forward-looking statements reflect our current views about future events and are subject to known and unknown risks, uncertainties and other factors which may cause our actual results to differ materially from those expressed or implied by such forward-looking statements. We attempt, whenever possible, to identify these statements by using words like “will,” “may,” “could,” “should,” “would,” “believe,” “expect,” “anticipate,” “forecast,” “future,” “intend,” “plan,” “estimate” and similar expressions of future intent or the negative of such terms.
Such forward-looking statements include statements regarding:
|
|
• |
the demand for the Company’s services together with the possibility that the Company may be adversely affected by other economic, business, and/or competitive factors or changes in the business environment in which the Company operates; |
|
|
• |
changes in consumer preferences or the market for the Company’s services; changes in applicable laws or regulations; |
|
|
• |
the availability of competition for opportunities for expansion of the Company’s business; difficulties of managing growth profitably; |
|
|
• |
the loss of one or more members of the Company’s management team; |
|
|
• |
changes in the market for the products we offer for sale; |
|
|
• |
the impact of the coronavirus on our results of operation and liquidity for the foreseeable future; |
|
|
• |
other risks and uncertainties included from time to time in the Company’s reports (including all amendments to those reports) filed with the U.S. Securities and Exchange Commission; |
|
|
• |
other risks and uncertainties indicated in this Annual Report on Form 10-K, including those set forth under the section entitled “Risk Factors”; and |
|
|
• |
other statements preceded by, followed by or that include the words “estimate,” “plan,” “project,” “forecast,” “intend,” “expect,” “anticipate,” “believe,” “seek,” “target” or similar expressions. |
These forward-looking statements are based on information available as of the date of this report and current expectations, forecasts and assumptions, and involve a number of judgments, risks and uncertainties. Accordingly, forward-looking statements should not be relied upon as representing our views as of any subsequent date. We do not undertake any obligation to update forward-looking statements to reflect events or circumstances after the date they were made, whether as a result of new information, future events or otherwise, except as may be required under applicable securities laws.
As a result of a number of known and unknown risks and uncertainties, our actual results or performance may be materially different from those expressed or implied by these forward-looking statements. For a discussion of the risks involved in our business and investing in our common shares, see the section entitled “Risk Factors.”
Should one or more of these risks or uncertainties materialize, or should any of the underlying assumptions prove incorrect, actual results may vary in material respects from those expressed or implied by these forward-looking statements. You should not place undue reliance on these forward-looking statements.
2
Business Combination
OneSpaWorld Holdings Limited is the pre-eminent global operator of health and wellness centers onboard cruise ships and a leading operator of health and wellness centers at destination resorts worldwide. Our highly trained and experienced staff offer guests a comprehensive suite of premium health, fitness, beauty and wellness services and products onboard 170 cruise ships and at 69 destination resorts globally as of December 31, 2019. We entered into the business combination (the “Business Combination”) contemplated by that certain Business Combination Agreement, dated as of November 1, 2018 (as amended, supplemented or otherwise modified from time to time, the “Transaction Agreement”), by and among us, Steiner Leisure Limited, an international business company incorporated under the laws of the Commonwealth of The Bahamas (“Steiner Leisure”), Steiner U.S. Holdings, Inc., a Florida corporation, Nemo (UK) Holdco, Ltd., a limited company formed under the laws of England and Wales, Steiner UK Limited, a limited company formed under the laws of England and Wales, Steiner Management Services, LLC, a Florida limited liability company, Haymaker Acquisition Corp. a Delaware corporation (“Haymaker”), Dory US Merger Sub, LLC, a Delaware limited liability company, Dory Acquisition Sub, Limited, an international business company incorporated under the laws of the Commonwealth of The Bahamas, Dory Intermediate LLC, a Delaware limited liability company, and Dory Acquisition Sub, Inc., a Delaware corporation. The Business Combination enabled us to re-enter the public markets as a leader in global health and wellness services and enhance our ability to deliver the world class service and innovation that our cruise line and resort partners have come to expect from our organization.
General
At our core, we are a global services company. With over 90% market share in the historically highly attractive outsourced maritime health and wellness market, we are the market leader at more than 10x the size of our closest maritime competitor. Over the last 50 years, we have built our leading market position on our depth of staff expertise; broad and innovative service and product offerings; expansive global recruitment, training and logistics platform; and decades-long relationships with cruise and destination resort partners. Throughout our history, our mission has been simple: helping guests look and feel their best during and after their stay. We serve a critical role for our cruise line and destination resort partners, operating a complex and increasingly important aspect of their overall guest experience. Decades of investment and know-how have allowed us to construct an unmatched global infrastructure to manage the complexity of our operations, which in 2019 included over 8,600 annual voyages with visits to over 1,200 ports of call around the world. We have consistently expanded our onboard offerings with innovative, leading-edge service and product introductions, and developed a powerful back-end recruiting, training and logistics platform to manage our operational complexity, maintain our industry-leading quality standards and maximize revenue per center. The combination of our renowned recruiting and training platform, deep labor pool, global logistics and supply chain infrastructure and proven revenue management capabilities represents a significant competitive advantage that we believe is not economically feasible to replicate.
The majority of our revenue and profits are earned through long-term revenue sharing agreements with cruise line partners that economically align both parties and contribute to our attractive asset-light financial profile. These agreements average approximately five years in length and provide us with the exclusive right to offer health, fitness, beauty and wellness services and the ability to sell complementary products onboard the ships we serve. Under these long-term agreements, cruise line partners retain a specified percentage of revenues from all our sales onboard. This inherent alignment encourages collaboration in all aspects of our operations, including facility design, product innovation, pre- and post-cruise sales opportunities, capacity utilization initiatives and other data-driven strategies to drive increased guest traffic and revenue growth. Most of our cruise line agreements encompass 100% of a partner cruise line’s existing fleet and all new ships introduced by the cruise line during the term of the agreement. As opposed to fixed-rent landlords, cruise lines and destination resorts serve as our aligned economic partners.
We are recognized by our cruise line and destination resort partners and our guests for our comprehensive suite of services and products. We curate and deliver an exhaustive range of offerings centered on providing specific health and wellness solutions to meet our guests’ lifestyle routines or objectives. These services include: (i) traditional body, salon, and skin care services and products; (ii) specialized fitness classes and personal fitness training; (iii) innovative pain management, detoxifying programs and comprehensive body composition analyses; (iv) weight management programs and products; and (v) advanced medi-spa services. We also offer our guests access to leading beauty and wellness brands including ELEMIS ®, Kérastase ® and Dysport ®, with many brands offered exclusively by us at sea. On average, guests spend $230 per visit and our solution sales approach drives substantial retail sales, with approximately 25% of our revenues derived from the sale of retail products.
Our state-of-the-art health and wellness centers are designed and branded for each cruise line and destination resort to optimize the guest experience, align with the overall hospitality atmosphere and maximize productivity. Centers can employ up to 105 highly trained professionals and range in size from 200 to over 30,000 square feet, depending on the cruise or resort partner’s needs.
3
Our cruise line relationships average over 20 years and encompass substantially all of the major global cruise lines, including Carnival Cruise Line, Royal Caribbean, Princess Cruises, Norwegian Cruise Lines, Celebrity Cruises, Costa and Holland America, among many others. These partnerships extend across contemporary, premium, luxury and budget cruise lines that operate ships globally. We maintain an exceptional contract renewal rate with our cruise line partners, having renewed approximately 95% of our contracts based on ship count over the last 15 years, including 100% of our contracts with ships larger than 3,500 berths. We have not only maintained relationships with existing cruise line partners, but have a history of winning contracts and gaining market share. In 2019, we signed an agreement with Celebrity Cruises to become the exclusive operator of health and wellness centers on Celebrity’s entire fleet, increasing the Celebrity vessels on which we operated in 2020 by nine, extended our current agreement with Norwegian Cruise Lines through 2024, and signed an agreement with the new lifestyle brand Virgin Voyages as the exclusive operator of the spa and wellness offerings onboard the first three Virgin vessels planned to launch in 2020, 2021 and 2022. On land, we have longstanding relationships with the world’s leading destination hotel and resort operators, including Marriott, Starwood, Hilton, ClubMed, Caesars Entertainment, Lotte, Loews and Four Seasons, among others.
As a Bahamian international business company that earns a substantial portion of our revenue in low- or no-tax jurisdictions, we have benefited from a highly attractive effective cash tax rate. Additionally, we have minimal capital expenditures as third parties typically fund the build-out, maintenance, and refurbishment of our onboard health and wellness centers. The combination of our attractive tax rate and asset-light operating model leads to a financial profile that delivers exceptional Unlevered After-Tax Free Cash Flow. Annually, from 2017 through 2019, we converted approximately 90% of our Adjusted EBITDA to Unlevered After-Tax Free Cash Flow.
We have driven strong financial results and believe our leading market position in a growing industry, differentiated business model and entrenched partner relationships position our business for continued growth. For the year ended December 31, 2019, we achieved revenues of $562.2 million, Adjusted EBITDA of $58.7 million, Net Loss of $37 million and Unlevered After-Tax Free Cash Flow of $54.6 million.
On January 30, 2020, the World Health Organization declared the coronavirus outbreak (“COVID-19”) a “Public Health Emergency of International Concern,” and on March 10, 2020, declared COVID-19 a pandemic. The regional and global outbreak of COVID-19 has negatively impacted our operations. Quarantines, labor shortages and other disruptions, including the cancellation of cruise itineraries and the closure of resort properties, have adversely impacted our revenues, the ability to provide services, and our operating results, and may continue to have further or additional adverse impacts in the future. In addition, COVID-19 has resulted in a widespread health crisis that has adversely affected the economies and financial markets of many countries, causing an economic downturn that could affect demand for our products and services, as we have seen in recent weeks. As such, the full impact on our operations and financial condition is difficult to assess at this point in time. As of the date of this report, the extent to which the coronavirus will impact us will depend on future developments, which are highly uncertain and cannot be predicted, including new information which may emerge concerning the severity of the coronavirus and actions taken to contain the coronavirus or its impact, among others.
Attractive Market Opportunity
Notwithstanding the recent uncertainties and adverse conditions impacting global operations and economies resulting from the coronavirus outbreak, we operate at the intersection of the historically attractive health and wellness and travel leisure industries. Although we cannot yet predict the full impact of the coronavirus outbreak on the industry, we believe we are well-positioned to grow as a result of the cruise industry’s historical new cruise ship and passenger growth, consumers’ desire for travel and experiences and increasing focus on health and wellness in consumers’ everyday lives.
Historical Cruise Industry Growth
The cruise industry has been among the fastest-growing segments in the travel leisure industry with passenger growth for more than 20 consecutive years, including through the recessions of 2001 and 2008. We estimate, based on annual statistics published by Cruise Lines International Association (“CLIA”), that global passenger counts have grown every year from approximately 6.3 million passengers in 1995 to a projected all-time high of 30.0 million passengers in 2019, representing a compound annual growth rate of 6.7%. This passenger growth has been driven by consistent, significant investments in new cruise ship capacity, strong loyalty among experienced cruisers and the large and growing appeal of cruising to all demographics, including millennials.
Historically Large and Growing Health and Wellness Industry
Our health and wellness centers cater to guests seeking a continuation of their wellness activities while traveling and those who want to trial services while away from home. As consumers increasingly incorporate health and wellness activities into their daily lives, they are placing a higher priority on health and wellness services while traveling and vacationing. The Global Wellness Institute (“GWI”) estimates that wellness-related tourism grew at twice the rate of general tourism from 2015 to 2017.
4
Our Evolution
Our history dates back to the early 1960’s, when we opened the world’s first salons at sea onboard transatlantic cruise ships, including the Queen Mary and Queen Elizabeth II. Over more than 50 years, we have continuously defined and redefined the onboard health and wellness category by consistently expanding our onboard offerings with innovative and leading-edge service and product introductions, while developing the powerful back-end recruiting, training and logistics platforms to manage and optimize the complexity of our operations and maintain our industry-leading quality standards. We have successfully evolved the onboard health and wellness category from what was once a consumer-centric amenity for passengers to a key onboard revenue driver for cruise line partners.
In 2015, a consortium led by L Catterton acquired Steiner Leisure, the holding company of OneSpaWorld (the “2015 Transaction”). Since then, OneSpaWorld has strengthened its already proven platform by leveraging L Catterton’s expertise in multi-unit retail and customer acquisition. At sea, OneSpaWorld has enhanced collaboration with its cruise line partners to reinforce its market leading position and introduced innovative revenue initiatives to accelerate its onboard revenue growth. Key recent initiatives include:
|
|
• |
enhancing and expanding collaboration with cruise line and resort partners; |
|
|
• |
creating pre-marketing, pre-booking and pre-payment platforms with optimal positioning on cruise line websites; |
|
|
• |
employing data-driven, dynamic pricing of services to optimize facility utilization and revenue generation; |
|
|
• |
incorporating advanced direct marketing programs, including personalized communications and value promotions, to drive traffic; |
|
|
• |
shifting revenue mix towards higher value-add services through new service introductions and higher-ticket products coupled with enhanced consultative sales training techniques; |
|
|
• |
expanding medi-spa services to the majority of ships within our fleet; |
|
|
• |
collaborating with global brands to leverage our powerful retail channel and captive audience of over 20 million consumers with above average household income; |
|
|
• |
increasing frequency of budgeting and KPI reviews with cruise partners; |
|
|
• |
improving staff productivity through enhanced incentive and retention measures; and |
|
|
• |
leveraging the strength of our global marketing, recruiting, training, logistics and facility design platforms across our destination resort partnerships. |
Today, our comprehensive suite of premium health, fitness, beauty and wellness services and products reaches more consumers than ever before, with 176 centers onboard cruise ships addressing a captive audience of over 20 million passengers annually and 69 destination resort centers serving global travelers at premier destination resorts around the world.
Our Strengths
As noted above, we cannot yet fully predict the impacts of the coronavirus outbreak on the industry or on our business. Despite this uncertainty, we believe we have certain strengths that have positioned us as a leader in the hospitality-based health and wellness industry.
Global Leader in the Hospitality-Based Health and Wellness Industry
As the pre-eminent global operator of health and wellness centers onboard cruise ships and a leading operator of health and wellness centers at destination resorts worldwide, we are at the center of the intersection between the health and wellness and travel leisure industries. In 2018, the Global Wellness Institute reported that global wellness tourism was a $639 billion industry. We command over 90% market share in the highly attractive outsourced maritime health and wellness market and we are nearly 10x the size of our closest competitor. Through our market share, we have had access to a captive audience of over 20 million passengers. Cruise ship guests are an attractive demographic with average annual household incomes of over $100,000. Based on an independent study conducted by a global strategy consulting firm, approximately 45% of cruise guests are interested in or have participated in wellness activities during their cruise, while our revenues have been historically driven by approximately 10% of cruise ship passengers. As a result of our scale, our captive audience and consumers’ increasing desire for more health and wellness services, we are well-positioned in the global health and wellness industry and have a large addressable market at sea and on land.
5
Differentiated Business Model That Would Be Difficult and Non-Economical to Replicate
For more than 50 years, our business model has been built through investment in global infrastructure and training, decades-long relationships with our cruise line and destination resort partners and our reputation for offering guests a best-in-class wellness experience. The robust infrastructure and processes required to operate and maximize revenue across our network of global health and wellness centers separates us from our peers. We embarked on over 8,600 voyages that welcomed over 22 million passengers at more than 178 ports of embarkation in 2019. Our business model is centered on providing our partners with the following solutions:
|
|
• |
Supply Chain and Logistics —We manage the complex distribution of all products and supplies to our “floating centers,” leveraging proprietary data to accurately forecast and stock each center. Products can only be loaded at designated ports around the world during a limited window of time while the ship is in port, adding to the complexity of the process. |
|
|
• |
Yield and Revenue Management —We have developed proprietary technology, processes and staff training tools to consistently measure, analyze and maximize onboard revenue. |
|
|
• |
Exclusive Relationships with Global Brands —Due to our scale, superior operations, industry longevity and attractive captive audience, we currently have over 600 product SKUs offered through the OneSpaWorld platform at sea, including ELEMIS, Kérastase, Thermage ®, GoodFeet ® Arch Supports and GO SMILE ® Teeth Whitening. |
|
|
• |
Facility Design and Branding Expertise —We design our state-of-the-art health and wellness centers specifically for each cruise line and destination resort partner by creating bespoke branding and concepts to optimize guest experiences and maximize productivity. |
The above capabilities have contributed to building a differentiated and defensible strategy around our leading market position in a growing and attractive industry.
Unmatched Breadth of Service and Product Offering
We offer our guests a comprehensive suite of health and wellness services and products to meet any and all of their needs. We are continuously innovating and evolving our offerings based on the latest trends and tailor our service and product offerings to regional preferences. In addition to wellness and beauty services, we offer the latest in fitness, a full range of massage treatments, nutrition/weight management consultations, teeth whitening, acupuncture and wellness services. OneSpaWorld has also introduced innovative, higher-ticket medi-spa services, including BOTOX ® Cosmetic, Dysport, Restylane ®, CoolSculpting ®, Thermage and dermal fillers, among others. With our captive audience of over 20 million cruise guests annually, OneSpaWorld is a compelling distribution channel for leading wellness and beauty brands. Renowned brands, including ELEMIS and Kérastase, have partnered with us for exclusive distribution at sea. Cruise and resort partners depend on us to provide their guests with the best and broadest assortment of services and products to enhance their vacation experience.
Entrenched Partnerships with Economic Alignment
We have cultivated partnerships with most of the largest and most reputable cruise lines and premier resorts in the world. Our cruise line relationships average over 20 years and encompass substantially all of the major global cruise lines, including Carnival Cruise Line, Royal Caribbean, Princess Cruises, Norwegian Cruise Lines, Celebrity Cruises, Crystal Cruises, Costa, Seabourn Cruise Line, Virgin, and Holland America, among many others. The majority of our revenues and profits are earned through our long-term revenue sharing agreements with our cruise line partners that economically align both parties and create a collaborative relationship. On land, we partner with market leaders at highly-attractive destinations, including Atlantis Paradise Island Bahamas, The Ocean Club, a Four Seasons Resort, Hilton Hawaiian Village Beach Resort and Spa and the Mohegan Sun Resort. Our long-standing relationships, with economic alignment at the core, strengthens our competitive advantage.
Highly Visible and Predictable Revenue Streams
Historically, we have had access to over 20 million passengers annually with potential long-term passenger growth expected in the future as new ships are commissioned in the industry. This new ship growth is highly visible as demonstrated in a publicly available global order book outlining over five years of new ship orders. Across our contracts, OneSpaWorld typically operates on all ships in a fleet and on new ships added during the contract term, securing both existing and new ship revenue. A new ship requires approximately two to four years to be built and is rarely delayed as cruise lines typically sell out the vessel’s maiden voyage over a year in advance. New ships do not have a revenue ramp-up period given these advanced marketing efforts. Cruise line partners are experts at dependably filling their ships with passengers, as demonstrated by the industry’s historical average occupancy rate of above 100%, even through
6
recessionary periods. Due to historically consistent industry practices and decades of proprietary operating history data, OneSpaWorld has had strong visibility into our future revenue realization for the next three to five years. Despite current market conditions related to the coronavirus outbreak, we expect these revenue streams to rebound in the future to historical levels.
Asset-Light Model with After-Tax Free Cash Flow Generation
Third parties typically fund the build-out, maintenance, and refurbishment of our onboard health and wellness centers, resulting in an asset-light profile with minimal capex required. Our capital expenditures have averaged 1% of revenues over the last three years. Being a Bahamian international business company and earning a significant portion of our revenue in low-tax or no-tax jurisdictions, including international waters, our effective cash tax rate has been approximately 1% over the last three years. This combination translates to exceptional after-tax free cash flow. Annually, from 2017 through 2019, we converted approximately 90% of our Adjusted EBITDA to Unlevered After-Tax Free Cash Flow.
Seasoned and Proven Leadership Team
OneSpaWorld is led by a management team that has operated Steiner for nearly 20 years. Our Executive Chairman, Leonard Fluxman, and CFO and COO, Stephen Lazarus, together led Steiner Leisure as a public company for more than a decade. Mr. Fluxman, Mr. Lazarus and our Chief Executive Officer, Glenn Fusfield, now lead an internally developed senior management team with over 150 years of combined industry experience. We also benefit from Haymaker’s investing and operational experience at Fortune 500 companies, particularly in the consumer and hospitality sectors. The OneSpaWorld management team’s deep experience and proven track record in managing the business in both public and private markets positions OneSpaWorld as an attractive vehicle for future long-term growth within the global hospitality-based health and wellness industry.
Growth Strategies
Our management plans to continue growing the business through the following strategies:
Capture Highly Visible New Ship Growth with Current Cruise Line Partners
We expect to continue to benefit long-term from a return to the cruise industry’s capacity for growth, with a consistent and visible pipeline of new ships commissioned annually by our cruise line partners. From 2020 to 2024, our existing cruise line partners are expected to build 44 new ships, representing over 135,000 new berths, which is an approximate 33.5% increase in our estimated year-end 2019 berth count. As our existing cruise line partners expand into the Asian region over the longer-term, we will be well-positioned to grow revenue alongside our cruise line partners, as we have over 78% market share in the region today. Through established cruise line partner relationships, current contracts and an approximately 95% contract renewal rate over the last 15 years, we are well-positioned to capture new ship growth over the long term.
Expand Market Share by Adding New Potential Cruise Line Partners
Although we have over 90% market share in the outsourced maritime health and wellness market, there is an opportunity to continue to grow our market share by winning new contracts. Recently, we signed an agreement with Celebrity Cruises as the exclusive operator of health and wellness centers on Celebrity’s entire fleet, increasing the Celebrity vessels on which we operated in 2020 by nine, extended our current agreement with Norwegian Cruise Lines through 2024, and won a contract with the new lifestyle brand Virgin Voyages to operate the spa and wellness offerings onboard the first three Virgin vessels, planned to launch in 2020, 2021 and 2022. We also routinely meet with cruise lines that do not currently outsource their health and wellness centers or utilize our smaller competitors but that may have an interest in contracting with us in the future due to our strong reputation and historical results. As evidenced by our successful history of winning new contracts, we remain focused on continuing to grow our market share at sea over time.
Continue Launching More Value-Added Services and Products
We have successfully innovated services and products to meet guests’ ever-changing needs, attract more guests and generate more revenue per guest. Medi-spa has been a highly successful innovation for OneSpaWorld at sea and is now a critical component of our offerings. Performed by licensed physicians, the medi-spa offerings provide the latest cosmetic medical services to guests such as non-surgical cosmetic procedures, including BOTOX ® Cosmetic, Dysport, Restylane ®, CoolSculpting ®, Thermage, and dermal fillers. Guests purchasing medi-spa services spend on average up to 10x more than on traditional services. We continue to roll out Kérastase, a leading global professional hair care brand. In 2019, we experienced year-over-year growth of 24.1% and a 41% increase in Kérastase retail attachment. We will continue to focus on launching higher value-add products and services that meet guest demands and drive traffic through our highly productive centers.
7
Focus on Enhancing Health and Wellness Center Productivity
Cruise lines have become increasingly focused on growing onboard revenue as a way to enhance revenue beyond traditional cabin ticket sales. Between 2013 and 2018, onboard spend on the three largest cruise operators we serve increased by $2.6 billion, from $6.5 billion to $9.1 billion. We provide services to approximately 10% of cruise passengers on any one journey, while 45% of passengers say they are interested in using the centers onboard, per an independent global consulting study. We are focused on collaborating with cruise line partners to increase passenger penetration and maximize revenue yield through the following initiatives:
|
|
• |
Increase Pre-Booking and Pre-Payment Capture Rate —We are working with our cruise line partners to expand our marketing efforts to reach a guest before boarding a ship through pre-booking. Pre-booked appointments can yield approximately 30% more revenue than services booked onboard the ship. Due to our success across select cruise lines that have implemented pre-booking capabilities, we are in the process of implementing pre-booking across many of our other partner cruise lines. |
|
|
• |
Expand Targeted Marketing and Promotion Initiatives —We are now directly marketing and distributing promotions to onboard passengers as a result of enhanced collaboration with select cruise line partners. These promotions are personalized and individually tailored to guests’ profiles and have successfully driven traffic and revenue at our health and wellness centers. Examples include “happy anniversary” messages to couples, “happy birthday” notes to individual guests, and promotional retail credits offered to guests who visit our centers before the end of their cruise. On vessels implementing these initiatives, guests that received these customized promotions were responsible for over 8.9% of revenues generated during the year ended December 31, 2019. |
|
|
• |
Utilize Technology to Increase Utilization and Enhance Service Mix —We have recently begun to successfully introduce and expand technology-enabled dynamic pricing initiatives with selected cruise line partners. While dynamic pricing strategies have historically been applied manually by onboard staff, we are currently rolling out online and pre-cruise access to drive off-peak utilization rates and fill higher-demand time slots with higher-value bookings. This enhanced dynamic pricing capability is currently available with only a few cruise line partners, representing a significant opportunity for revenue growth as it is rolled out and optimized fleet-wide. |
|
|
• |
Extend Retail Beyond the Ship —Our Shop & Ship program provides guests the ability to buy retail products onboard and have products shipped directly to their home to avoid the hassle of packing products in their luggage. On average, a Shop & Ship customer spends more than 3.5x the amount of a non-Shop & Ship customer on retail products. The Shop & Ship program, combined with our e-commerce platform timetospa.com, gives us the ability to maintain a connection with each guest beyond the cruise voyage. |
Health and Wellness Services
We curate and deliver an exhaustive range of offerings for our cruise and destination resort partners centered around a holistic wellness approach which includes:
|
|
• |
Spa and Beauty. We offer massages and a broad variety of other body and beauty treatments including facials, hair cutting and styling, manicures and pedicures, and tanning. Additionally, we offer teeth whitening services in the majority of our onboard health and wellness centers. |
|
|
• |
Medi-spa. We offer medi-spa services on the majority of our ships. Our service menu consists of the leading medi-spa brands including BOTOX Cosmetic, Dysport, Restylane, CoolSculpting, Thermage, and dermal fillers, among others. Currently, medi-spa services are available on 99 ships and administered by certified medical physicians. |
|
|
• |
Fitness. We offer guests use of fitness centers as well as paid services by a fitness professional to our cruise and destination resort guests. The fitness centers are typically free and offer guests use of strength equipment, cardiovascular equipment such as treadmills, elliptical machines, exercise bicycles and rowing and stair machines. Boutique fitness classes, including yoga, Pilates, cycling, and aerobics, are also available to guests for a fee or at no charge, depending on the class. Our fitness instructors are available to provide paid services, such as body composition analysis and personal training. |
|
|
• |
Nutrition. In addition to fitness services, we offer guests paid services including personal nutritional and dietary advice, weight management, nutrition coaching and detoxification. Guests can begin a program on the cruise and remain connected to our professional coach after the cruise to ensure successful completion of the program, such as a nutrition or detoxification plan. |
|
|
• |
Health. We first introduced acupuncture in 2005 and have since rapidly expanded our health and pain management, offerings to be one of our largest categories. Today, we offer acupuncture, electro acupuncture, cupping, posture and gait analysis, GoodFeet Arch Supports, physical therapy, and NormaTec ® recovery. Our services are enhanced by our retail channel; GoodFeet, a premium arch support insert, is now a leading retail product for us. |
|
|
• |
Mind-Body and Wellness. We also offer our guests yoga, Tai Chi and sound therapy in addition to meditation and biofeedback. |
8
Products
We sell over 600 branded product SKUs due to our scale, superior operations, industry longevity and attractive captive audience at sea and on land. We sell products from leading brands including ELEMIS, Thermage, Dysport, GoodFeet Arch Supports and GO SMILE Teeth Whitening. We have an exclusive 10-year supply agreement with ELEMIS. We believe we have a leading retail attachment rate based on the number of products purchased in conjunction with a service compared to the broader retail industry. Approximately 25% of our revenues come from product sales, enabling incremental revenue even at full treatment room utilization.
We utilize three warehouses, one 35,000 square foot bonded warehouse in Miami, FL, one 10,000 square foot warehouse in Miami, FL, and one 4,000 square foot warehouse in New Jersey. The Miami warehouses provide fulfillment services for cruise inventory, and the New Jersey warehouse provides fulfillment for e-commerce and the Shop & Ship program.
Health and Wellness Centers
As of December 31, 2019, we operated state-of-the-art health and wellness centers across a total of 170 ships, including almost all of the major cruise lines globally, and 69 resorts principally in the United States, the Caribbean and Asia. Centers are designed and branded for each cruise and destination resort partner to optimize the guest experience, maximize revenues and align with our partners’ hospitality environment. Centers can range in size from approximately 200 square feet to over 30,000 square feet and generally provide fitness areas, treatment rooms and salons, as well as elaborate thermal suites and/or saunas. Cruise centers are generally located on higher ship decks, which encourages increased passenger interest and guest traffic.
Facility Design
Our partners seek differentiated health and wellness experiences for their guests. As such, we provide design capabilities for our cruise line and destination resort partners, creating bespoke branding and design consulting to optimize guest experiences and maximize revenues. We operate health and wellness centers under proprietary brands of Mandara ® and Chavana ® as well as brands curated specifically for each cruise line, complete with cruise line and/or ship-specific service menus. We have 38 health and wellness centers under the Mandara brand, 11 centers under the Chavana brand, and one center under our destination resort health and wellness brand, “Glow ®, a Mandara Spa.”
Principal Cruise Line Customers
A significant portion of our revenue is generated from each of the following cruise lines, which accounted for more than 10% of our total revenues in 2019, 2018, and 2017, respectively: Carnival (including Carnival, Carnival Australia, Costa, Holland America, P&O, Princess, and Seabourn cruise lines): 46.7%, 48.5%, and 48.6%, Royal Caribbean (including Royal Caribbean, Celebrity Cruises, Pullmantur, Azamara and Silversea cruise lines): 23.1%, 21.0%, and 20.8%, and Norwegian Cruise Line (including Norwegian Cruise Line, Oceania Cruises and Regent Seven Seas Cruises): 14.7%, 13.8%, and 13.0%. These companies, combined, accounted for 152 of the 170 ships served by OneSpaWorld as of December 31, 2019. Our contracts are signed at the cruise line-level, not with the parent operator, giving OneSpaWorld a diverse customer base despite parent-level consolidation. Our contracts average five years in duration.
9
The numbers of ships served as of December 31, 2019 under cruise line agreements with the respective cruise lines (including ships temporarily out of service for routine dry dock maintenance) are listed below:
|
Ships Served |
|
||
|
Carnival |
|
27 |
|
|
Royal Caribbean |
|
26 |
|
|
Princess |
|
18 |
|
|
Norwegian |
|
17 |
|
|
Costa |
|
15 |
|
|
Holland America |
|
14 |
|
|
Silversea |
|
7 |
|
|
P&O |
|
6 |
|
|
Windstar |
|
6 |
|
|
Seabourn |
|
5 |
|
|
Disney |
|
4 |
|
|
Oceania |
|
4 |
|
|
Pullmantur |
|
4 |
|
|
Azamara |
|
3 |
|
|
Carnival Australia |
|
3 |
|
|
Crystal |
|
3 |
|
|
Dream |
|
2 |
|
|
Marella |
|
2 |
|
|
Saga |
|
2 |
|
|
Celebrity |
|
1 |
|
|
Regent |
|
1 |
|
|
Total |
|
170 |
|
|
|
(1) |
Carnival Corporation, the parent company of Carnival Cruise Line, also owns Carnival Australia, Costa, Holland America, P&O, Princess, and Seabourn. |
|
|
(2) |
Azamara, Celebrity, Pullmantur and Silversea are owned by Royal Caribbean. |
|
|
(3) |
Oceania and Regent are owned by Norwegian Cruise Lines. |
Resort Locations and Partners
As of December 31, 2019, we provided health and wellness services at destination resorts in the following locations:
|
Country |
|
Number of Destination Resort Centers |
|
|
|
Maldives |
|
|
14 |
|
|
Vietnam |
|
|
14 |
|
|
United States (1) |
|
|
13 |
|
|
Malaysia |
|
|
11 |
|
|
Indonesia |
|
|
4 |
|
|
Bahamas |
|
|
3 |
|
|
Palau |
|
|
2 |
|
|
Russia |
|
|
2 |
|
|
United Arab Emirates |
|
|
2 |
|
|
Bahrain |
|
|
1 |
|
|
Aruba |
|
|
1 |
|
|
Egypt |
|
|
1 |
|
|
Japan |
|
|
1 |
|
|
Total |
|
|
69 |
|
|
(1) |
Includes Puerto Rico. |
10
Cruise Line and Resort Agreements
Through the cruise line and resort agreements, we have the exclusive right to offer health, fitness, beauty and wellness services and the ability to sell complementary products onboard the ships and at destination resorts we serve. Under the cruise agreements, guests pay for our services through the cruise partners who retain a specified percentage of gross receipts from such sales before remitting the remainder to us. Our revenue share agreements result in a highly variable cost model, where the primary fixed costs are the meals and accommodations for our cruise employees. Most of the cruise line agreements cover all of the then-operating ships of a cruise line and typically new ships are added to ships in service through an amendment to the agreement. The agreements have specified terms ranging from 2 to 10.7 years, with an average remaining term per ship of approximately 3.4 years as of December 31, 2019. Cruise lines can terminate the agreements with limited or no advance notice under certain circumstances, including, among other things, the withdrawal of a ship from the cruise trade, the sale or lease of a ship, or our failure to achieve specified passenger service standards. However, we have never had a contract terminated prior to our respective expiration date.
We operate our destination resort centers pursuant to agreements with the owners of the properties involved. Our destination resort centers generally are required to pay rent based on a percentage of our revenues, with others having fixed rents. Some of our destination resort center agreements also require that we make minimum rental payments irrespective of the amount of our revenues. The terms of the agreements for our destination resort centers generally range from five to 20 years (including the terms of renewals available at our option). In North America, destination resort centers generally have a higher investment cost and lower revenue share with higher staff costs and contracts lasting 10 years on average. In Asia, destination resort centers have lower investment cost, higher revenue share, lower staff costs, and contracts averaging five years.
Our continued success is dependent, in part, on our ability to attract qualified employees. Our goal in recruiting and training new employees is to have available a sufficient number of skilled personnel trained in our customer service philosophy. We recruit prospective cruise employees from geographies including the British Isles, Australia, South Africa, the Philippines, Canada, the Caribbean and continental Europe, providing an ample pipeline of talent to fulfill any demographic preferences. Recruitment professionals source potential employees using a variety of recruitment techniques including advertisements in trade and other publications, appearances at beauty, hair, and fitness trade shows, meetings with students at trade schools, and recommendations from our employees. Candidates are generally required to have received prior training and certifications in the services they will perform and are tested in their specific modalities. Prospective employees for destination resorts are also required to have received prior training but are recruited in a customary manner within the respective destination region.
Our candidates complete a rigorous training program at one of our nine global training facilities or at one of the destination resorts. We train over 3,000 employees annually and have 56 training, administrative, and recruitment staff to execute that training. Training courses are typically conducted over a period of one to six weeks, depending on the modality, and emphasize use of personalized, attentive guest care and the unique requirements of each cruise line partner. Additionally, employees are trained from day one in yield management and cross-selling products. This training covers, among other things, maximization of revenues, personnel supervision, customer service, and administrative matters, including interaction with cruise line and destination resort personnel. Given the complex human capital requirements, we consider our recruitment and training infrastructure to be a key barrier to entry.
We promote our services and products to cruise passengers and resort guests through targeted marketing, including pre-and post-cruise emails, website advertising, on-site demonstrations and seminars, video presentations shown on in-cabin/in-room television, ship newsletters, tours of our centers, and dedicated signage around the ship. We also encourage our employees to cross-sell as they believe that such cross-promotional activities frequently result in our customers purchasing services and/or products in addition to those they initially contemplated buying. For example, we cross-sell the fitness body assessment with detox programs, vitamins, and seaweed wraps. We also maintain a dedicated sales desk to facilitate pre-cruise health and wellness services booking and to disseminate health and wellness information for charters and other groups of cruise passengers.
Recent collaborative initiatives with cruise line partners have proven to enhance performance across certain key performance indicators. We have developed a fully integrated pre-booking platform which allows guests to book health and wellness treatments six to eight weeks prior to the voyage. Pre-booked and pre-paid guests on average spend approximately 30% more than guests who book services once already onboard. We recently introduced targeted marketing, including the ‘positive surprise’ direct marketing campaign where guests receive a targeted gift card to celebrate a birthday, honeymoon, anniversary, or other special occasion. Guests who received the ‘positive surprise’ campaign spent approximately 50% more in the health and wellness centers, which translated to a 6% increase in onboard spend. We have begun rolling out our dynamic pricing model to our full cruise fleet, which provides the ability to optimize demand and maximize utilization of the health and wellness center. We continually monitor the results of our marketing efforts and adjust our strategies in order to use our marketing resources in a cost-effective manner.
11
Competition
We face competition in our cruise ships and destination resorts. On cruise ships, we compete with passenger activity alternatives for onboard passenger dollars. We also compete with other maritime wellness facility providers, including cruise lines that insource the activity as well as other outsource providers. Across the resorts business, we compete with other hotel operators that outsource health and wellness services. The destination resorts business is highly fragmented, and there is no one leader within this category.
Seasonality
A significant portion of our revenues are generated onboard cruise ships. Certain cruise lines, and, as a result, we have experienced varying degrees of seasonality as the demand for cruises is stronger in the Northern Hemisphere during the summer months and during holidays. Accordingly, the third quarter and holiday periods generally result in the highest revenue yields for us. Further, cruises and destination resorts have been negatively affected by the frequency and intensity of hurricanes. The negative impact of hurricanes in the Northern Hemisphere is highest during peak hurricane season from August to October.
Trademarks
We hold or control numerous trademarks in the United States and a number of other countries. Our most recognized health and wellness products and services trademarks are for Mandara and Chavana. We believe that the use of our trademarks is important in establishing and maintaining our reputation for providing high quality health and wellness services as well as cosmetic goods, and we are committed to protecting these trademarks by all appropriate legal means.
Registrations for the OneSpaWorld, Mandara and Chavana trademarks, among others, have been obtained in a number of countries throughout the world. We continue to apply for other trademark registrations in various countries.
While a number of the trademarks we use have been registered in the United States and other countries, the registrations of other trademarks that we use are pending. Recently we have adopted the mark “OneSpaWorld” as the trade name of our maritime health and wellness business to reflect our position as a global provider of shipboard products and services.
We license “Mandara” for use by luxury destination resorts in certain Asian countries.
Employees
As of December 31, 2019, we had a total of 4,298 employees. Of that number, 3,840 worked in health and wellness operations, and 426 represented management and sales personnel and support staff, while 32 were involved in recruiting and training. We have one health and wellness center manager in each center and can have up to 105 total staff depending on the size of the center. Cruise employees typically are employed under nine month-long agreements with fixed terms. In recent years, we have improved staff retention, resulting in a more experienced staff across our fleet. Employees at our destination resorts generally are employed without contracts, on an at-will basis, although most of our employees in Asia have one- or two-year contracts.
Most cruise and destination resort employees’ compensation consists of commission based on the volume of revenues generated by the employee. Cruise managers receive incentive payments, including a commission based on the volume of revenue generated by our staff under their management. Destination resort managers receive a salary, plus bonus, if appropriate, based on various criteria. We believe that our relations with our employees are satisfactory.
Government Regulation
Our business is subject to certain international, U.S. federal, state and local laws, and regulations and policies in jurisdictions in which we operate. Such laws, regulations and policies impact areas of our business, including securities, anti-discrimination, anti-fraud, data protection and security. We are also subject to anti-corruption and bribery laws and government economic sanctions, including applicable regulations under the U.S. Treasury’s Office of Foreign Asset Control and the U.S. Foreign Corrupt Practices Act (“FCPA”). The FCPA and similar anti-corruption and bribery laws in other jurisdictions generally prohibit companies and their intermediaries from making improper payments to government officials for the purpose of obtaining or generating business.
Website Access to SEC Reports
Our website can be found at onespaworld.com. Information contained on our website is not part of this report.
We make available, free of charge through our website, our annual report on Form 10-K, quarterly reports on Form 10-Q, current reports on Form 8-K and amendments to those reports filed or furnished pursuant to Section 13(a) or 15(d) of the Exchange Act as soon as is reasonably practicable after we electronically file them with, or furnish them to, the Securities and Exchange Commission.
12
An investment in our securities involves a high degree of risk. You should carefully consider the risks described below before making an investment decision. Our business, prospects, financial condition, or operating results could be harmed, and has been harmed, by any of these risks, as well as other risks not currently known to us or that we currently consider immaterial. The trading price of our securities could decline, and has declined, due to any of these risks, and, as a result, you may lose all or part of your investment.
Risks Related to Our Business
Actual or Threatened Epidemics or Pandemics may Have an Adverse Effect on our Business, Financial Condition and Results of Operation
In December 2019, a novel strain of coronavirus (“COVID-19”) was reported in Wuhan, China. The World Health Organization has declared COVID-19 to constitute a “Public Health Emergency of International Concern.” On January 30, 2020, the U.S. Department of State issued a Level 4 “do not travel” advisory for China. The U.S. government has also implemented enhanced screenings, quarantine requirements and travel restrictions in connection with the COVID-19 outbreak. On March 8, 2020 the U.S. Department of State issued a warning for US citizens to not travel by cruise ship. COVID-19 has resulted in the temporary ceasing of our operations of health and wellness centers onboard cruise ships and at destination resorts, and cruise ship itinerary modifications in response to travel restrictions and advisories, which has significantly impacted our business and revenue. Risks related to an epidemic or pandemic, such as COVID-19, could also lead to the prolonged closure of our health and wellness centers onboard cruise ships and at destination resorts. COVID-19 is also impacting consumer sentiment regarding travel generally. The situation surrounding the COVID-19 outbreak is fluid, and the duration and magnitude of its impacts on our financial condition and results of operations are difficult to reasonably estimate at this time. COVID-19, and similar outbreaks in the future, or threats of such outbreaks, may have a material adverse effect on our business, financial condition and results of operation.
We Depend on Our Agreements with Cruise Lines and Destination Resort Health and Wellness Centers; if These Agreements Terminate, Our Business Would Be Harmed
A significant portion of our revenues are generated from our cruise ship health and wellness operations. The cruise line agreements have specific terms, ranging from 2 to 10.7 years with an average remaining term per ship of approximately 3.4 years as of December 31, 2019. As of that date, cruise line agreements that expire within one year covered 14 of the 170 ships served by us. These 14 ships accounted for approximately 8% of our 2019 revenues. These agreements, as well as our other cruise line agreements, may not be renewed after their expiration date on similar terms or at all. Any renewals may cause reductions in our margins. From time to time, the amounts we pay to cruise lines and land-based venues increase upon entering into renewals of agreements.
In addition, these agreements provide for termination by the cruise lines with limited or no advance notice under certain circumstances, including, among other things, the withdrawal of a ship from the cruise trade, the sale or lease of a ship or our failure to achieve specified passenger service standards. As of December 31, 2019, agreements for four ships provided for termination for any reason by the cruise line on 90 days’ notice, and with respect to four of our ships, we are operating without written agreements. These four ships (which are included in the 170 ships referenced above) accounted for 5.0% of our 2019 revenues. Termination of significant cruise line agreements or a series of other cruise line agreements, either upon completion of their terms or prior thereto, could have a material adverse effect on our results of operations and financial condition. Some of our land-based health and wellness center agreements also provide for termination with limited advance notice under certain circumstances.
As a result of the consolidation of the cruise industry, the number of independent cruise lines has decreased in recent years, and this trend may continue. Also, historically, some smaller cruise lines have ceased operating for economic reasons and this may happen to other cruise lines in the future. As a result of these factors, a small number of cruise companies, all of which currently are our customers, dominate the cruise industry. Revenues from passengers of each of the following cruise line companies accounted for more than 10% of our total revenues in 2019, 2018, and 2017, respectively: Carnival (including Carnival, Carnival Australia, Costa, Holland America, P&O, Princess, and Seabourn cruise lines): 46.7%, 48.5%, and 48.6%, Royal Caribbean (including Royal Caribbean, Celebrity Cruises, Pullmantur, Azamara and Silversea cruise lines): 23.1%, 21.0%, and 20.8%, and Norwegian Cruise Line (including Norwegian Cruise Line, Oceania Cruises and Regent Seven Seas Cruises): 14.7%, 13.8%, and 13.0%. These companies, combined, accounted for 152 of the 170 ships served by OneSpaWorld as of December 31, 2019. If we cease to serve one of these cruise companies, or a substantial number of ships operated by a cruise company, it could materially adversely affect our results of operations and financial condition.
13
We Depend on the Cruise Industry and Their Risks Are Risks to Us
Cruise lines compete for consumer disposable leisure time dollars with other vacation alternatives, such as hotels and sightseeing vacations. Demand for cruises is dependent on the underlying economic strength of the countries from which cruise lines source their passengers. Economic changes that reduce disposable income or consumer confidence in the countries from which our cruise line partners source their passengers may affect demand for vacations, including cruise vacations, which are discretionary purchases.
Despite the general historic trend of growth in the volume of cruise passengers, in 2020 and future years, the global economic environment, including the impacts related to the recent coronavirus outbreak, may cause the number of cruise passengers to decline or be maintained through discounting, which could result in an increased number of passengers with limited discretionary spending ability. A significant decrease in passenger volume could have a material adverse effect on our results of operations and financial condition.
A continuing industry trend reported by CLIA is the growing number of passengers sourced from outside North America. We believe that non-North American passengers spend less on our services and products than North American passengers. Other recent trends are those of certain cruise lines reducing the number of cruises to certain long-standing destinations and replacing them with alternative exotic destinations, as well as extending the length of voyages. A number of such replacements and extensions result in cruises producing lower revenues to us than cruises to the prior destinations and of certain long-standing durations. The continuation of these trends could materially adversely affect the results of our shipboard health and wellness operations.
A significant portion of the cruise industry’s growth is expected to come from expansion of markets outside of our core North American market. Our facilities on North American ships are our best performing facilities, and there is no guarantee that we will be able to generate the same revenue performance in non-North American markets. Additionally, our cruise partners dictate the itineraries and geographies where their ships sail, and they may change itineraries to be less favorable to our revenue performance.
Accidents and other incidents involving cruise ships can materially adversely affect the cruise industry, as well as our results of operations and financial condition. Among other things, accidents reduce our revenues and increase the costs of our maritime-related insurance. In addition, accidents can adversely affect consumer demand for cruise vacations.
Other unscheduled withdrawals of ships from service, delays in new ship introductions, environmental violations by cruise lines, restricted access of cruise ships to environmentally sensitive regions, hurricanes and other adverse weather conditions and increases in fuel costs could also materially adversely impact the cruise industry. For example, in the past, hurricanes have caused the withdrawal of ships that we served from service for use in hurricane relief efforts, as well as the temporary closing of cruise ports and the destruction of a cruise pier facility. A number of cruise ships have experienced outbreaks of illnesses that have affected, at times, hundreds of passengers on a ship. In addition, epidemics affecting global regions, or a pandemic such as the coronavirus, could also adversely affect cruise ship travel. Also, in recent years, plane crashes, violence and other crimes, passenger accidents, disappearances and assaults, fatalities from shore excursion activities, shipboard fires and other incidents have brought adverse publicity to the travel industry, including the cruise industry. The public concern over these incidents, especially if they are repeated, or other negative publicity about the cruise industry, could adversely affect the demand for cruises and adversely affect our results of operations and financial condition. The cruise lines’ capacity has grown in recent years and is expected to continue to grow over the next few years as new ships are introduced. In order to utilize the new capacity, it is likely that the cruise industry will need to increase its share of the overall vacation market. In order to increase that market share, cruise lines may be required to offer discounted fares to prospective passengers, which would have the potentially adverse effects on us described above.
Severe weather conditions, both at sea and at ports of embarkation, also could adversely affect the cruise industry. The cruise industry also relies to a significant extent on airlines to transport passengers to ports of embarkation. Changes in airline service to cruise embarkation and disembarkation locations could adversely affect us. In addition, any strikes or other disruptions of airline service, including those that could follow terrorist attacks or armed hostilities, could adversely affect the ability of cruise passengers or our shipboard staff to reach their ports of embarkation, or could cause cancellation of cruises.
Cruise ships have increasingly had itineraries which provide for the ships to be in port during cruises. When cruise ships are in port, our revenues are adversely affected.
Cruise ships periodically go into dry-dock for routine maintenance, repairs and refurbishment for periods ranging from one to three weeks. Cruise ships also may be taken out of service unexpectedly for non-routine maintenance and repairs as a result of damage from an accident or otherwise, such as the Carnival Triumph, Oasis of the Seas, and Costa Smerelda incidents. A ship also may go out of service with respect to us if it is transferred to a cruise line we do not serve or if it is retired from service. While we attempt to plan appropriately for the scheduled removal from service of ships we serve, unexpected removals from service of ships we serve can hamper the efficient distribution of our shipboard personnel, in addition to causing unexpected reductions in our shipboard revenues.
14
We Are Required to Make Minimum Payments under Our Agreements and May Face Increasing Payments to Cruise Lines and Owners of Our Destination Resort Health and Wellness Centers
We are obligated to make minimum annual payments to certain cruise lines and owners of our land-based venues regardless of the amount of revenues we receive from customers. We may also be required to make such minimum annual payments under any future agreements into which we enter. Accordingly, we could be obligated to pay more in minimum payments than the amount we collect from customers. As of December 31, 2019, these payments are required by cruise line agreements covering a total of 151 ships served by us and by six of the agreements for our destination resort health and wellness centers.
As of December 31, 2019, we guaranteed total minimum payments to cruise lines (excluding payments based on minimum amounts per passenger per day of a cruise applicable to certain ships served by us) and owners of our land-based venues of approximately $126 million in the aggregate in 2020, which amount does not take into account cancelled voyages. As we renew or enter into new agreements with cruise lines and land-based venues, we may experience increases in such required payments and such increases may materially adversely affect our results of operations and financial condition.
We Depend on the Continued Viability of the Ships and Destination Resort Health and Wellness Centers We Serve
Our revenues from our shipboard guests and guests at our destination resort health and wellness centers can only be generated if the ships and land-based venues we serve are open for business and continue to operate. Historically, some smaller cruise lines we served have ceased operating for economic reasons. We cannot be assured of the continued viability of any of the land-based venues (including our ability to protect our investments in build-outs of health and wellness centers) or cruise lines that we serve, particularly in the event of recurrence of the more severe aspects of the economic slowdown experienced in certain prior years, which may occur due to the recent coronavirus outbreak. To the extent that cruise lines or land-based venues we serve, or could potentially serve in the future, cease to operate, our results of operations and financial condition could be adversely affected.
Increased Costs Could Adversely Impact our Financial Results
In addition to the adverse effects on the cruise industry of high fuel costs described above, periods of higher fuel costs adversely affect us directly. We depend on commercial airlines for the transportation of our shipboard employees to and from the ships we serve and, as a result, we pay for a relatively large number of flights for these employees each year. During times of higher fuel costs, such as those experienced in certain prior years, airfares, including those applicable to the transportation of our employees, have been increased by the airlines we have utilized. Increased transportation costs associated with increased fuel costs also add to the costs of delivery of our products to the ships we serve and other destinations. Higher fuel charges also increase the cost to consumers of transportation to cruise ship destination ports and to venues where we operate our destination resort health and wellness centers and also increase the cost of utilities at our destination resort health and wellness centers. Periods of increasing fuel costs would likely cause these transportation costs to correspondingly increase. Extended periods of increased airfares could adversely impact our results of operations and financial condition.
Increases in prices of other commodities utilized by us in our business could adversely affect us. For example, in certain prior years, as a result of increases in the cost of cotton, the cost to us of linens and uniforms utilized in our operations has increased. Our land-based health and wellness operations also have experienced an increase in the cost of electrical utilities. A continuing increase in these costs or similar costs applicable to our operations could adversely impact our results of operations and financial condition.
Increases in minimum wage obligations in jurisdictions where we employ personnel have also affected us directly and could adversely impact our results of operation and financial condition.
We Depend on Our Key Officers and Qualified Employees
Our continued success will depend to a significant extent on our senior executive officers, including Leonard Fluxman, our Executive Chairman, Glenn Fusfield, our Chief Executive Officer and President, and Stephen Lazarus, our Chief Financial Officer and Chief Operating Officer. The loss of the services of any of these persons or other key management personnel could have a material adverse effect on our business. Our continued success also is dependent on our ability to recruit and retain personnel qualified to perform our services. Shipboard employees typically are employed pursuant to agreements with terms of nine months. Our land-based health and wellness employees generally are employed without contracts, on an at-will basis. Other providers of shipboard health and wellness services compete with us for shipboard personnel. We also compete with destination resort health and wellness centers and other employers for our shipboard and land-based health and wellness personnel. We may not be able to continue to attract a sufficient number of applicants possessing the requisite training and skills necessary to conduct our business. Our inability to attract a sufficient number of qualified applicants to provide our services and products could adversely impact our results of operations and financial condition. In addition, in recent years, the immigration approval process in the United States has proceeded at a slower pace than previously had been the case. Since many of our shipboard employees are not United States citizens, exacerbation of this trend could adversely affect our ability to meet our shipboard staffing needs on a timely basis.
15
Almost all of our shipboard personnel come from jurisdictions outside the United States. Our ability to obtain non-United States shipboard employees is subject to regulations in certain countries from which we source a number of our employees and, in the case of one country, control by an employment company that acts on behalf of employees and potential employees from that country. In addition, in that country, we are required to deal with local employment companies to facilitate the hiring of employees. Our ability to obtain shipboard employees from those countries on economic terms that are acceptable to us may be hampered by evolving regulatory requirements and/or our inability to enter into an acceptable agreement with the applicable local employment company.
In addition, the various jurisdictions where we operate our health and wellness centers have their own licensing or similar requirements applicable to our employees, which could affect our ability to open new health and wellness centers on a timely basis or adequately staff existing health and wellness centers. The ship we serve that is United States-based also is subject to United States labor law requirements that can result in delays in obtaining adequate staffing.
Possible Adverse Changes in United States or Foreign Tax Laws or Changes in Our Business Could Increase Our Taxes
Background
We are a Bahamas international business company (“IBC”) that owns, among other entities, OneSpaWorld (Bahamas) Limited (formerly known as Steiner Transocean Limited) (“OneSpaWorld (Bahamas)”), our principal subsidiary and a Bahamas IBC that conducts our shipboard operations, primarily outside United States waters (which constitutes most of our shipboard activities), and One Spa World LLC, a Florida limited liability company that performs administrative services in connection with our operations in exchange for fees from OneSpaWorld (Bahamas) and other subsidiaries.
We also own, directly or indirectly, the shares of additional subsidiaries organized in the United States, the United Kingdom and other taxable jurisdictions, as well as subsidiaries organized in jurisdictions that do not subject the subsidiaries to taxation.
Currently, we and our non-United States subsidiaries are not subject to Bahamas income tax or other (including United States federal) income tax, except as set forth below. Our United States subsidiaries are subject to United States federal income tax as a consolidated group at regular corporate rates up to 21%. Generally, any dividends paid by our United States holding company to its parent, are subject to a 30% United States withholding tax. Other than as described below, we believe that none of the income generated by our non-United States subsidiaries should be effectively connected with the conduct of a trade or business in the United States and, accordingly, that such income should not be subject to United States federal income tax.
A foreign corporation generally is subject to United States federal corporate income tax at a rate of up to 21% on its United States-source income that is effectively connected with its trade or business within the United States and on certain limited types of its foreign-source income that is effectively connected to a trade or business it conducts in the United States. A foreign corporation also can be subject to a branch profits tax of 30% imposed on its after-tax earnings that are so effectively connected.
OneSpaWorld (Bahamas) has three types of income: income from the provision of health and wellness services, income from the sales of health and wellness products and income from leasing (at rates determined on an arm’s length basis) our shipboard employees and space to a United States subsidiary that performs health and wellness services and sells health and wellness products while the ships are in United States waters and pays OneSpaWorld (Bahamas) the amounts referenced above (the “U.S. Waters Activities”).
We believe that most of OneSpaWorld (Bahamas)’s shipboard income should be treated as foreign-source income not effectively connected to a business it conducts in the United States. This belief is based on the following:
|
|
• |
all of the functions performed, resources employed and risks assumed in connection with the performance of the above-mentioned services and sales (other than OneSpaWorld (Bahamas)’s involvement in the U.S. Waters Activities) occur outside of the United States; and |
|
|
• |
income to OneSpaWorld (Bahamas) from the U.S. Waters Activities is income effectively connected with a United States trade or business, and thus subject to United States income taxation, but constitutes a small percentage of OneSpaWorld (Bahamas)’s total income. |
16
The Risks to OneSpaWorld
Under United States Internal Revenue Service (“IRS”) regulations, as of January 1, 2007, all or a portion of OneSpaWorld (Bahamas)’s income for periods commencing on or after that date could be subject to United States federal income tax at a rate of up to 35% with respect to income earned prior to January 1, 2018 and up to 21% with respect to income earned thereafter:
|
|
• |
to the extent the income from OneSpaWorld (Bahamas)’s shipboard operations that OneSpaWorld believes are performed outside of United States territorial waters is considered by the IRS to be attributable to functions performed, resources employed or risks assumed within the United States or its possessions or territorial waters; |
|
|
• |
to the extent the income from OneSpaWorld (Bahamas)’s sale of health and wellness products for use, consumption, or disposition in international waters is considered by the IRS to be attributable to functions performed, resources employed or risks assumed within the United States, its possessions or territorial waters; or |
|
|
• |
to the extent that passage of title or transfer of ownership of products sold by OneSpaWorld (Bahamas) for use, consumption or disposition outside international waters, takes place in the United States or a United States office materially participates in such sales. |
If OneSpaWorld (Bahamas) is considered to be a controlled foreign corporation (“CFC”), any of its shipboard income would be considered income from sources within the United States and would be subject to United States federal income tax unless such income is attributable to functions performed, resources employed or risks assumed in a foreign country or countries.
A foreign corporation is a CFC if more than 50% of (i) the total combined voting power of all classes of stock entitled to vote or (ii) the total value of the stock of such corporation is owned or considered as owned by “United States shareholders” (“U.S. shareholders”) on any day during the taxable year of such corporation. A “U.S. Shareholder,” generally, means a “United States person” (“U.S. person”) who owns directly, indirectly or constructively at least 10% of the voting power or value of the stock of a foreign corporation. A “U.S. person” is a citizen or resident of the United States, a domestic partnership, a domestic corporation, any domestic estate or a trust over which a United States court is able to exercise administrative supervision and over which one or more United States persons have authority to control all substantial decisions.
Under certain “downward attribution” rules, made applicable by a provision of the Tax Cuts and Jobs Act (“TCJA”) to determine the CFC status of a foreign corporate subsidiary of a foreign parent corporation that also has a U.S. subsidiary, the foreign subsidiary may in certain circumstances be treated as a CFC based solely on its brother-sister relationship to the U.S. subsidiary. However, in 2018 the IRS and Treasury Department announced that pending the issuance of further guidance, and solely for purposes of the income-source rules described above, taxpayers may determine whether a foreign corporation is a CFC without regard to this provision of the TCJA. In 2019, the IRS and Treasury Department issued a proposed regulation which is consistent with the 2018 announcement, and proposed that a taxpayer may apply the regulation to the last tax year of a foreign corporation beginning before January 1, 2018 and each subsequent year.
Accordingly, solely for purposes of the income-sourcing rules described above, we believe that OneSpaWorld (Bahamas) should not be characterized as a CFC. This should allow us to treat most of our shipboard income, which is earned by a foreign corporation that would not be a CFC but for the TCJA provision referred to above, to be foreign source income to the same extent as income earned by a non-CFC.
If OneSpaWorld (Bahamas) is subject to United States federal income tax (at a rate of up to 21%) on its United States-source income and on certain of its foreign-source income that is effectively connected to a business it conducts in the United States, it also would be subject to a branch profits tax of 30% imposed on its after-tax earnings withdrawn, or considered to be withdrawn, from its United States business.
Certain non-United States jurisdictions may also assert that OneSpaWorld (Bahamas)’s income is subject to their income tax.
Some of our United Kingdom, Bahamas and United States subsidiaries provide goods and/or services to us and certain of our other subsidiaries. The United Kingdom or United States tax authorities may assert that some or all of these transactions do not contain arm’s length terms. In that event, income or deductions could be reallocated among our subsidiaries in a manner that could increase the United Kingdom or United States tax on us. This reallocation also could result in the imposition of interest and penalties.
We cannot assure you that the tax laws on which we have relied to minimize our income taxes will remain unchanged in the future.
Our land-based operations, the income from which is generally taxable, have significantly increased and we intend to consider land-based opportunities in the future (though we cannot assure you that we will be successful in finding appropriate opportunities). To the extent that we are able to effectively implement this strategy, the amount of our income that is subject to tax would increase.
17
The Success of Health and Wellness Centers Depends on the Hospitality Industry
We are dependent on the hospitality industry for the success of destination resort centers. To the extent that consumers do not choose to stay at venues where we operate health and wellness centers, over which we have no control, our business, financial condition and results of operations could be materially adversely affected. The hospitality industry is subject to risks that are similar to those of the cruise industry. As discussed above, the recent coronavirus outbreak has caused government travel advisories, itinerary modifications and/or travel cancellations that are impacting demand at hotels and resorts, resulting in material adverse effects to the hospitality industry.
The considerations described above regarding the effects of adverse economic conditions on the cruise industry apply similarly to the hospitality industry, including the resorts where we have operations. Periods of economic slowdown result in reduced destination resort occupancy rates and decreased spending by destination resort guests, including at the resorts where we operate health and wellness centers. The recurrence of challenging economic conditions, as well as instances of increased fuel costs, which have occurred in certain prior years, could result in lower resort occupancy, which would have a direct, adverse effect on the number of resort guests that purchase our health and wellness services and products at the venues in question. Accordingly, such lower occupancy rates at the resorts we serve could have a material adverse effect on our results of operations and financial condition.
The following are other risks related to the hospitality industry:
|
|
• |
changes in the national, regional and local conditions (including major national or international terrorist attacks, armed hostilities or other significant adverse events, including an oversupply of hotel properties or a reduction in demand for hotel rooms); |
|
|
• |
the possible loss of funds expended for build-outs of health and wellness centers at venues that fail to open, underperform or close due to economic slowdowns or otherwise; |
|
|
• |
the attractiveness of the venues to consumers and competition from comparable venues in terms of, among other things, accessibility and cost; |
|
|
• |
the outbreaks of illnesses, such as the recent coronavirus outbreak, or the perceived risk of such outbreaks, in locations where we operate land-based health and wellness centers or locations from which guests of such wellness centers are sourced; |
|
|
• |
weather conditions, including natural disasters, such as earthquakes, hurricanes, tsunamis and floods; |
|
|
• |
possible labor unrest or changes in economics based on collective bargaining activities; |
|
|
• |
changes in ownership, maintenance or room rates of, or popular travel patterns and guest demographics at the venues we serve; |
|
|
• |
possible conversion of guest rooms at hotels to condominium units and the decrease in health and wellness center usage that often accompanies such conversions, and the related risk that condominium hotels are less likely to be suitable venues for our health and wellness centers; |
|
|
• |
reductions in resort occupancy during major renovations or as a result of damage or other causes; |
|
|
• |
acquisition by resort chains of health and wellness service providers to create captive “in-house” brands and development by resort chains of their own proprietary health and wellness service providers, reducing the opportunity for third-party health and wellness providers like us; and |
|
|
• |
the financial condition of the airline industry, as well as elimination of, or reduction in, airline service to locations where we operate resort facilities, which would result in fewer guests at those venues. |
We Compete with Passenger Activity Alternatives
We compete with passenger activity alternatives on cruise ships and with competing providers of services and products similar to our services and products seeking agreements with cruise lines. Casinos, bars and a variety of shops are found on almost all of the ships served by us. In addition, ships dock in ports which provide opportunities for additional shopping as well as other activities that compete with us for passenger attention and disposable income, and cruise ships are increasingly offering itineraries providing for greater numbers of port days. Cruise ships also typically offer swimming pools and other recreational facilities and activities, as well as musical and other entertainment, all without additional charge to the passengers. Certain cruise lines we formerly served have engaged the services of third parties or their own personnel for the operation of the health and wellness centers for all or some of their ships. Additional cruise lines could take similar actions in the future. In addition, there are certain other entities offering services in the cruise industry similar to those provided by us and we may not be able to serve new cruise ships that come into service and that are not covered by our cruise line agreements.
18
Many of the land-based venues that we serve or may serve in the future offer recreational entertainment facilities and activities similar to those offered on cruise ships, often without additional charge to guests. A number of the hotels we serve also offer casino gambling. These activities and facilities compete with us for customer time and disposable income. Our destination resort health and wellness centers also compete with other health and wellness centers in their vicinities, as well as with other beauty, relaxation or other therapeutic alternatives. These include salons that offer these services at prices significantly lower than those charged by us. We believe, however, that the prices charged by us are appropriate for the quality of the experience we provide in our respective markets. In addition, we also compete, both for customers and for contracts with hotels, with health and wellness centers and beauty salons owned or operated by companies that have offered their destination resort health and wellness services longer than we have, some of which enjoy greater name recognition with customers and prospective customers than health and wellness centers operated by us. Also, a number of these health and wellness center operators may have greater resources than we do. Further, some hotel operators provide health and wellness services themselves. If we are unable to compete effectively in one or more areas of our operations, our results of operations and financial condition could be adversely affected.
Risks Relating to Non-U.S. Operations and Hostilities
The cruise lines we serve operate in waters and call on ports throughout the world and our destination resort health and wellness centers are located in a variety of countries. Operating internationally exposes us to a number of risks, including increased exposure to a wider range of regional and local economic conditions, volatile local political conditions, potential changes in duties and taxes, including changing and/or uncertain interpretations of existing tax laws and regulations, required compliance with additional laws and policies affecting cruising, vacation or maritime businesses or governing the operations of foreign-based companies, currency fluctuations, interest rate movements, difficulties in operating under local business environments, port quality and availability in certain regions, U.S. and global anti-bribery laws or regulations, imposition of trade barriers and restrictions on repatriation of earnings.
Operating globally also exposes us to numerous and sometimes conflicting legal, regulatory and tax requirements. In many parts of the world, including countries in which we operate, practices in the local business communities might not conform to international business standards. We must adhere to policies designed to promote legal and regulatory compliance as well as applicable laws and regulations. However, we might not be successful in ensuring that our employees, agents, representatives and other third parties with whom we associate throughout the world properly adhere to them. Failure by us, our employees or any of these third parties to adhere to our policies or applicable laws or regulations could result in penalties, sanctions, damage to our reputation and related costs which in turn could negatively affect our results of operations and cash flows.
As a global operator, our business may also be impacted by changes in U.S. policy or priorities in areas such as trade, immigration and/or environmental or labor regulations, among others. Depending on the nature and scope of any such changes, they could impact our domestic and international business operations. Any such changes, and any international response to them, could potentially introduce new barriers to passenger or crew travel and/or cross border transactions, impact our guest experience and/or increase our operating costs.
The waters and countries in which we operate include geographic regions that, from time to time, experience political and civil unrest and armed hostilities. Political unrest in areas where we operate health and wellness centers also has adversely affected our operations and continued political unrest in the Middle East has adversely affected the travel industry in that region. The threat of additional attacks and of armed hostilities internationally or locally may cause prospective travelers to cancel their plans, including plans for cruise or land-based venue vacations. Weaker cruise industry and land-based venue performance could have a material adverse effect on our results of operations and financial condition.
If we are unable to address these risks adequately, our financial position and results of operations could be adversely affected, including potentially impairing the value of our shipboard spas and other assets.
Severe Weather Can Disrupt Our Operations
Our operations may be impacted by adverse weather patterns or other natural disasters, such as hurricanes, earthquakes, floods, fires, tornados, tsunamis, typhoons and volcanic eruptions. It is possible that cruises we serve could be forced to alter itineraries or cancel a cruise or a series of cruises or tours due to these or other factors, which would have an adverse effect on our net revenue yields and profitability. Extreme weather events, such as hurricanes, floods and typhoons, may not only cause disruption, alteration, or cancellation of cruises and closures of destination resort health and wellness centers but may also adversely impact commercial airline flights and other transport or prevent certain individuals from electing to utilize our offerings altogether. In addition, these extreme weather conditions could result in increased wave and wind activity, which would make it more challenging to sail and dock ships and could cause sea/motion sickness among guests and crew on the ships we serve. These events could have an adverse impact on the safety and satisfaction of cruising and could have an adverse impact on our net revenue yields and profitability. Additionally, these extreme weather conditions could impact our ability to provide our cruise products and services as well as to obtain insurance coverage for operations in such areas at reasonable rates.
19
Risk of Early Termination of Land-Based Health and Wellness Center Agreements
A number of our land-based health and wellness center agreements provide that landlords may terminate the agreement prior to its expiration date (provided, in some cases, that we receive certain compensation with respect to our build-out expenses and earnings lost as a result of such termination). While we always attempt to negotiate the best deal we can in this regard, we may not be able to successfully negotiate a termination fee in any of our future agreements or that any amounts we would receive in connection with such termination accurately reflects the economic value of the assets we would be leaving behind as a result of such termination. In addition, in the event of certain terminations of an agreement with a land-based venue, such as by the venue operator after our breach of an agreement, or as a result of the bankruptcy of a venue, even if we have a provision in our agreement providing for a termination payment, we could receive no compensation with respect to build-out expenditures we have incurred.
We also attempt to obtain terms in our land-based health and wellness center agreements that protect us in the event that the lessor’s lender forecloses and takes over the property in question. However, we cannot always obtain such protective “non-disturbance” terms. In the event that the lender to a land-based venue owner under an agreement where no such non-disturbance term is included forecloses on that property, our agreement could be terminated prior to the expiration of its term. In such case, in addition to the loss of income from that health and wellness center, we could lose the residual value of any investment we made to build out that facility.
Delays in New Ship Introductions Could Slow Our Growth
Our growth depends, in part, on our serving new cruise ships brought into service. A number of cruise lines we serve have experienced in the past and recently, and could experience in the future, delays in bringing new ships into service. In addition, there is a limited number of shipyards in the world capable of constructing large cruise ships in accordance with the standards of major cruise lines. This also may contribute to delays in new ship construction. Such delays could slow our growth and have an adverse impact on our results of operations and financial condition.
Changes in and Compliance with Laws and Regulations Relating to Environment, Health, Safety, Security, Data Privacy and Protection, Tax and Anti-Corruption under Which We Operate May Lead to Litigation, Enforcement Actions, Fines, or Penalties
We are subject to numerous international, national, state and local laws, regulations and treaties covering many areas, including social issues, health, safety, security, data privacy and protection, and tax. Failure to comply with these laws, regulations, treaties and agreements could lead and has led to enforcement actions, fines, civil or criminal penalties or the assertion of litigation claims and damages. These issues are, and we believe will continue to be, an area of focus by the relevant authorities throughout the world. Accordingly, new legislation, regulations or treaties, or changes thereto, could impact our operations and would likely subject us to increased compliance costs in the future. In addition, training of crew may become more time consuming and may increase our operating costs due to increasing regulatory and other requirements.
Environmental laws and regulations or liabilities arising from past or future releases of, or exposure to, hazardous substances or vessel discharges, including ballast water and waste disposal, could materially adversely affect our business, profitability and financial condition. Some environmental groups have lobbied for more stringent regulation of cruise ships. Various agencies and regulatory organizations have enacted or are considering new regulations or policies, such as stricter emission limits to reduce greenhouse gas effects, which could adversely impact the cruise industry.
Our guest and employee relationships provide us with access to sensitive data. We are subject to laws and requirements related to the treatment and protection of such sensitive data. We may be subject to legal liability and reputational damage if we do not comply with data privacy and protection regulations. Various governments, agencies and regulatory organizations have enacted and are considering new regulations and implementation of rules for existing regulations. Additional requirements could negatively impact our ability to market cruises to consumers and increase our costs.
We are subject to the European Union (“EU”) General Data Protection Regulation (“GDPR”), which came into effect in May 2018 and imposes significant obligations to businesses that sell products or services to EU customers or otherwise control or process personal data of EU residents. Should we violate or not comply with the GDPR, or any other applicable laws or regulations, contractual requirements relating to data security and privacy, either intentionally or unintentionally, or through the acts of intermediaries, it could have a material adverse effect on our business, financial condition and results of operations, as well as subject us to significant fines, litigation, losses, third-party damages and other liabilities.
We are subject to the examination of our income tax returns by tax authorities in the jurisdictions where we operate. There can be no assurance that the outcome from these examinations will not adversely affect our profitability.
As budgetary constraints continue to adversely impact the jurisdictions in which we operate, increases in income or other taxes affecting our operations may be imposed. Some social activist groups have lobbied for more taxation on income generated by cruise companies. Certain groups have also generated negative publicity for us. In recent years, certain members of the U.S. Congress have proposed various forms of legislation that would result in higher taxation on income generated by cruise companies.
20
Our global operations subject us to potential liability under anti-corruption, economic sanctions, and other laws and regulations. The Foreign Corrupt Practices Act, the UK Bribery Act and other anti-corruption laws and regulations (“Anti-Corruption Laws”) prohibit corrupt payments by our employees, vendors, or agents. While we devote substantial resources to our global compliance programs and have implemented policies, training, and internal controls designed to reduce the risk of corrupt payments, our employees, vendors, or agents may violate our policies. Our failure to comply with Anti-Corruption Laws could result in significant fines and penalties, criminal sanctions against us, our officers, or our employees, prohibitions or limitations on the conduct of our business, and damage to our reputation. Operations outside the U.S. may also be affected by changes in economic sanctions, trade protection laws, policies, and other regulatory requirements affecting trade and investment. We may be subject to legal liability and reputational damage if we improperly sell goods or otherwise operate improperly in areas subject to economic sanctions such as Crimea, Iran, North Korea, Cuba, Sudan, and Syria or if we improperly engage in business transactions with persons subject to economic sanctions.
These various international laws and regulations could lead and have led to enforcement actions, fines, civil or criminal penalties or the assertion of litigation claims and damages. In addition, improper conduct by our employees or agents could damage our reputation and lead to litigation or legal proceedings that could result in significant awards or settlements to plaintiffs and civil or criminal penalties, including substantial monetary fines. Such events could lead to an adverse impact on our financial condition or profitability, even if the monetary damage is mitigated by our insurance coverage.
As a result of ship or other incidents, litigation claims, enforcement actions and regulatory actions and investigations, including, but not limited to, those arising from personal injury, loss of life, loss of or damage to personal property, business interruption losses or environmental damage to any affected coastal waters and the surrounding areas, may be asserted or brought against various parties, including us. The time and attention of our management may also be diverted in defending such claims, actions and investigations. We may also incur costs both in defending against any claims, actions and investigations and for any judgments, fines, or civil or criminal penalties if such claims, actions or investigations are adversely determined and not covered by our insurance policies.
Product Liability and Other Potential Claims Could Adversely Affect Us
The nature and use of our products and services could give rise to liability if a customer were injured while receiving one of our services. Guests at our health and wellness centers could be injured, among other things, in connection with their use of our fitness equipment, sauna facilities or other facilities. If any of these events occurred, we could incur substantial litigation expense and be required to make payments in connection with settlements of claims or as a result of judgments against us.
We maintain insurance to cover a number of risks associated with our business. While we seek to obtain comprehensive insurance coverage at commercially reasonable rates, we cannot be certain that appropriate insurance will be available to us in the future on commercially reasonable terms or at all. Our insurance policies are subject to coverage limit, exclusions and deductible levels and are subject to non-renewal upon termination at the option of the applicable insurance company. Our inability to obtain insurance coverage at commercially reasonable rates for the potential liabilities that we face could have a material adverse effect on our results of operations and financial condition. In addition, in connection with insured claims, we bear the risks associated with the fact that insurers often control decisions relating to pre-trial settlement of claims and other significant aspects of claims and their decisions may prove to not be in our best interest in all cases.
We believe that our current coverage is adequate to protect us against most of the significant risks involved in the conduct of our business, but we self-insure or use higher deductibles for various risks. Accordingly, we are not protected against all risks (including failures by third-party service providers such as insurance brokers to fulfill their duties), which could result in unexpected increases in our expenses in the event of certain claims against us.
If the types of services we offer increase, the potential for claims against us also could increase. We self-insure potential claims regarding certain of our medi-spa services. High visibility claims also could cause us to receive adverse publicity and suffer a loss of sales, and, therefore, our results of operations and financial condition could be materially adversely affected in such cases. We are, and may in the future be, subject to other legal proceedings, including claims presented as class actions. Litigation is subject to many uncertainties, and we cannot predict the outcome of individual matters. It is reasonably possible that the final resolution of these matters could have a material adverse effect on our results of operations and financial condition.
Our Indebtedness Could Adversely Affect Our Financial Condition and Ability to Operate and We May Incur Additional Debt
As of March 19, 2020, we have $247.5 million of secured indebtedness under our First Lien Term Loan Facility and Second Lien Term Loan Facility, and our First Lien Revolving Facility (collectively, the “New Credit Facilities”). Our debt level and the terms of our financing arrangements could adversely affect our financial condition and limit our ability to successfully implement our growth strategies. In addition, under the New Credit Facilities, certain of our direct and indirect subsidiaries have granted the lenders a security interest in substantially all of their assets. Our ability to meet our debt service obligations will depend on our future performance, which will be affected by the other risk factors described herein. If we do not generate enough cash flow to pay our debt service obligations, we may be required to refinance all or part of our existing debt, sell our assets, borrow more money or raise equity. We may not be able to take any of these actions on a timely basis, on terms satisfactory to us, or at all.
21
The New Credit Facilities bear interest at variable rates. If market interest rates increase, variable rate debt will create higher debt service requirements, which could adversely affect our cash flow.
Our Credit Facilities Contain Financial and Other Covenants. The Failure to Comply with Such Covenants Could Have An Adverse Effect on Us
Our New Credit Facilities contain certain financial covenants and a number of traditional negative covenants, including limitations on our ability to, among other things, incur and/or undertake asset sales and other dispositions, liens, indebtedness, certain acquisitions, and investments, consolidations, mergers, reorganizations and other fundamental changes, payment of dividends and other distributions to equity and warrant holders and prepayments of material subordinated debt, in each case, subject to customary exceptions. Any failure to comply with the restrictions of the New Credit Facilities, including any failure to comply with certain financial covenants due to the negative effects of the coronavirus on our revenue and results of operations, may result in an event of default under the agreements. If an event of default occurs, the lenders under the New Credit Facilities are entitled to take various actions, including the acceleration of amounts due under the New Credit Facilities and all actions permitted to be taken by a secured creditor, subject to customary intercreditor provisions among the first and second lien secured parties.
If We Are Unable to Execute Our Growth Strategies, Including Our Ability to Offer and Integrate New Services and Products, Our Business Could Be Adversely Affected
The demands of consumers with respect to health and wellness services and products continue to evolve. Among other things, there is a continuing trend to add services at health and wellness centers similar to those traditionally provided in medical facilities, including services relating to skin care. If we are unable to identify and capture new audiences, our ability to successfully integrate additional services and products will be adversely affected. Our ability to provide certain additional services depends on our ability to find appropriate third parties with whom to work in connection with these services and, in certain cases, could be dependent on our ability to fund substantial costs. We cannot assure you that we will be able to find such appropriate third parties or be able to fund such costs. We also cannot assure you that we will be able to continue to expand our health and wellness services sufficiently to keep up with consumer demand. Accordingly, we may not be able to successfully implement our growth strategies or continue to maintain sales at our current rate, or at all. If we fail to implement our growth strategies, our sales and profitability may be negatively impacted, which would adversely affect our business, financial condition and results of operations.
Our Business Could Be Adversely Affected if We Are Unable to Successfully Protect Our Trademarks or Obtain New Trademarks
The market for our services and products depends to a significant extent upon the value associated with our brand names. Although we take appropriate steps to protect our brand names, in the future, we may not be successful in asserting trademark protection in connection with our efforts to grow our business or otherwise due to the nature of certain of our marks or for other reasons. In addition, the laws of certain foreign countries may not protect our intellectual property rights to the same extent as the laws of the United States. The costs required to protect our trademarks and trade names may be substantial. If other parties infringe on our intellectual property rights, the value of our brands in the marketplace may be diluted. In addition, any infringement of our intellectual property rights would likely result in a commitment of our time and resources to protect these rights through litigation or otherwise. One or more adverse judgments with respect to these intellectual property rights could negatively impact our ability to compete and could adversely affect our results of operations and financial condition.
We Are Subject to Currency Risk
Fluctuations in currency exchange rates compared to the U.S. dollar can impact our results of operations, most significantly because we pay for the administration of recruitment and training of our shipboard personnel in U.K. pounds sterling and Euros. Accordingly, while the relative strength of the U.S. dollar has improved recently, renewed weakness of the U.S. dollar against those currencies can adversely affect our results of operations, as has occurred in some recent years. To the extent that the U.K. pound sterling or the Euro is stronger than the U.S. dollar, our results of operations and financial condition could be adversely affected.
We May Be Exposed to the Threat of Cyber Attacks and/or Data Breaches
Cyberattacks can vary in scope and intent from economically driven attacks to malicious attacks targeting our key operating systems with the intent to disrupt, disable or otherwise cripple our maritime and/or land-based operations. This can include any combination of phishing attacks, malware and/or viruses targeted at our key systems. The breadth and scope of this threat has grown over time, and the techniques and sophistication used to conduct cyberattacks, as well as the sources and targets of the attacks, change frequently. While we invest time, effort and capital resources to secure our key systems and networks, we cannot provide assurance that we will be successful in preventing or responding to all such attacks.
22
A successful cyberattack may target us directly, or may be the result of a third-party vendor’s inadequate care. In either scenario, we may suffer damage to our key systems and/or data that could interrupt our operations, adversely impact our reputation and brand and expose us to increased risks of governmental investigation, litigation and other liability, any of which could adversely affect our business. Furthermore, responding to such an attack and mitigating the risk of future attacks could result in additional operating and capital costs in systems technology, personnel, monitoring and other investments.
In addition to malicious cyberattacks, we are also subject to various risks associated with the collection, handling, storage and transmission of sensitive information. In the course of doing business, we collect large volumes of internal, customer and other third-party data, including personally identifiable information and individual credit data, for various business purposes. We are subject to federal, state and international laws (including the GDPR), as well as industry standards, relating to the collection, use, retention, security and transfer of personally identifiable information and individual credit data. In many cases, these laws apply not only to third-party transactions, but also to transfers of information between us and our subsidiaries, and among us, our subsidiaries and other parties with which we have commercial relations. Several jurisdictions have passed laws in this area, and other jurisdictions are considering imposing additional restrictions. These laws continue to develop and may be inconsistent from jurisdiction to jurisdiction. Complying with emerging and changing international requirements has caused, and may cause, us to incur substantial costs or require us to change our business practices. If we fail to comply with the various applicable data collection and privacy laws, we could be exposed to fines, penalties, restrictions, litigation or other expenses, and our business could be adversely impacted.
Even if we are fully compliant with legal and/or industry standards and any relevant contractual requirements, we still may not be able to prevent security breaches involving sensitive data and/or critical systems. Any breach, theft, loss, or fraudulent use of guest, employee, third-party or company data, could adversely impact our reputation and brand and our ability to retain or attract new customers, and expose us to risks of data loss, business disruption, governmental investigation, litigation and other liability, any of which could adversely affect our business. Significant capital investments and other expenditures could be required to remedy the problem and prevent future breaches, including costs associated with additional security technologies, personnel, experts and credit monitoring services for those whose data has been breached. Further, if we or our vendors experience significant data security breaches or fail to detect and appropriately respond to significant data security breaches, we could be exposed to government enforcement actions and private litigation.
Changes in Privacy Law Could Adversely Affect Our Ability to Market Our Services Effectively
Our ability to market our services effectively is an important component of our business. We rely on a variety of direct marketing techniques, including telemarketing, email marketing, and direct mail. Any further restrictions under laws such as the Telemarketing Sales Rule, the CAN-SPAM Act of 2003, the GDPR, and various United States state laws or new federal laws regarding marketing and solicitation, or international data protection laws that govern these activities, could adversely affect the continuing effectiveness of telemarketing, email, and postal mailing techniques and could force further changes in our marketing strategy. If this were to occur, we may be unable to develop adequate alternative marketing strategies, which could impact our ability to effectively market and sell our services.
In addition, we collect information relating to our customers for various business purposes, including marketing and promotional purposes. The collection and use of personal data, such as, among other things, credit card information, is governed by privacy laws and regulations of the United States and other jurisdictions. Privacy regulations continue to evolve and, occasionally, may be inconsistent from one jurisdiction to another. Compliance with applicable privacy regulations may increase our operating costs and/or adversely impact our ability to market our services and products and serve our customers. In addition, non-compliance with applicable privacy regulations by us or, in some instances, non-compliance by third parties engaged by us, or a breach of security systems storing our data may result in fines, payment of damages or restrictions on our use or transfer of data.
Risks Related to Ownership of Our Securities
Steiner Leisure Owns a Significant Portion of Our Shares and Has Representation on Our Board; Steiner Leisure May Have Interests That Differ from Those of Other Shareholders
Approximately 14% of our common shares are beneficially owned by Steiner Leisure. One of our directors was nominated by Steiner Leisure, and as a result, Steiner Leisure may be able to significantly influence the outcome of matters submitted for director action, subject to our directors’ obligation to act in the interest of all of our shareholders, and for shareholder action, including the designation and appointment of the OneSpaWorld Board (and committees thereof) and approval of significant corporate transactions, including business combinations, consolidations and mergers. The influence of Steiner Leisure over our management could have the effect of delaying or preventing a change in control or otherwise discouraging a potential acquirer from attempting to obtain control of us, which could cause the market price of our common shares to decline or prevent our shareholders from realizing a premium over the market price for our common shares.
23
Under the “Business Opportunities” section of our Amended and Restated Memorandum and Articles of Association (our “Articles”), among other things, we have renounced any interest or expectancy of us or our subsidiaries being offered an opportunity to participate in any potential transaction opportunities available to Steiner Leisure and certain of its affiliates and related parties, such parties have no obligation to communicate or offer such potential transaction opportunities to us, and such parties will have no duty to refrain from engaging in the same or similar businesses as us. Prospective investors in our common shares should consider that the interests of Steiner Leisure may differ from their interests in material respects.
If We Fail to Maintain an Effective System of Internal Control over Financial Reporting, We May Not Be Able to Accurately Report Our Financial Results or Prevent Fraud; as a Result, Shareholders Could Lose Confidence in Our Financial and Other Public Reporting, Which Is Likely to Negatively Affect Our Business and the Market Price of Our Common Shares
Effective internal control over financial reporting is necessary for us to provide reliable financial reports and prevent fraud. Any failure to implement required new or improved controls, or difficulties encountered in our implementation could cause us to fail to meet our reporting obligations. In addition, any testing conducted by us, or any testing conducted by our independent registered public accounting firm, may reveal deficiencies in our internal controls over financial reporting that are deemed to be material weaknesses or that may require prospective or retroactive changes to our financial statements or identify other areas for further attention or improvement. Inferior internal controls could also cause investors to lose confidence in our reported financial information, which is likely to negatively affect our business and the market price of our shares.
We are required to disclose changes made in our internal controls and procedures on a quarterly basis and our management is required to assess the effectiveness of these controls annually.
However, for as long as we are an “emerging growth company” under the JOBS Act, our independent registered public accounting firm will not be required to attest to the effectiveness of our internal control over financial reporting pursuant to Section 404(b) of the Sarbanes-Oxley Act. We could be an “emerging growth company” for up to five years. An independent assessment of the effectiveness of our internal controls could detect problems that our management’s assessment might not. Undetected material weaknesses in our internal controls could lead to financial statement restatements and require us to incur the expense of remediation.
The Market Price and Trading Volume of Our Common Shares Has Been and May Continue to Be Volatile
The stock markets, including Nasdaq, on which we have listed our common shares, have from time to time experienced significant price and volume fluctuations. The market price of our common shares may be volatile and could decline significantly, as has recently happened as a result of the coronavirus outbreak and related economic uncertainty. In addition, the trading volume in our common shares may fluctuate and cause significant price variations to occur. We cannot assure you that the market price of our common shares will not fluctuate widely or decline significantly in the future in response to a number of factors, including, among others, the following:
|
|
• |
the realization of any of the risk factors presented in this Annual Report on Form 10-K; |
|
|
• |
actual or anticipated differences in our estimates, or in the estimates of analysts, for our revenues, results of operations, level of indebtedness, liquidity or financial condition; |
|
|
• |
additions and departures of key personnel; |
|
|
• |
failure to comply with the requirements of Nasdaq; |
|
|
• |
failure to comply with the Sarbanes-Oxley Act or other laws or regulations; |
|
|
• |
future issuances, sales or resales, or anticipated issuances, sales or resales, of our common shares; |
|
|
• |
publication of research reports about us, our wellness centers, or the lodging industry generally; |
|
|
• |
the performance and market valuations of other similar companies; |
|
|
• |
broad disruptions in the financial markets, as have occurred as a result of the recent coronavirus outbreak, including sudden disruptions in the credit markets; |
|
|
• |
speculation in the press or investment community; |
|
|
• |
actual, potential or perceived control, accounting or reporting problems; and |
|
|
• |
changes in accounting principles, policies and guidelines. |
24
In the past, securities class-action litigation has often been instituted against companies following periods of volatility in the market price of their shares. This type of litigation could result in substantial costs and divert our management’s attention and resources, which could have a material adverse effect on us.
If Securities or Industry Analysts Do Not Publish Research, Publish Inaccurate or Unfavorable Research or Cease Publishing Research About Us, Our Share Price and Trading Volume Could Decline Significantly
The market for our common shares will depend in part on the research and reports that securities or industry analysts publish about us or our business. Securities and industry analysts do not currently, and may never, publish research on us. If no securities or industry analysts commence coverage of us, the market price and liquidity for our common shares could be negatively impacted. In the event securities or industry analysts initiate coverage, if one or more of the analysts who cover us downgrade their opinions about our common shares, publish inaccurate or unfavorable research about us, or cease publishing about us regularly, demand for our common shares could decrease, which might cause our share price and trading volume to decline significantly.
Future Issuances of Debt Securities and/or Equity Securities May Adversely Affect Us, Including the Market Price of Our Common Shares, and May Be Dilutive to Our Existing Shareholders
In the future, we may incur debt and/or issue equity ranking senior to our common shares. Those securities will generally have priority upon liquidation. Such securities also may be governed by an indenture or other instrument containing covenants restricting our operating flexibility. Additionally, any convertible or exchangeable securities that we issue in the future may have rights, preferences and privileges more favorable than those of our common shares. Because our decision to issue debt and/or equity in the future will depend, in part, on market conditions and other factors beyond our control, we cannot predict or estimate the amount, timing, nature or success of our future capital raising efforts. As a result, future capital raising efforts may reduce the market price of our common shares and be dilutive to our existing shareholders.
You May Have Difficulty Enforcing Judgments Against Us
We are an international business company incorporated under the laws of the Commonwealth of The Bahamas. A substantial portion of our assets are located outside the United States. As a result, it may be difficult or impossible to:
|
|
• |
effect service of process within the United States upon us; or |
|
|
• |
enforce, against us, court judgments obtained in U.S. courts, including judgments relating to U.S. federal securities laws. |
It is unlikely that Bahamian courts would entertain original actions against Bahamian companies, their directors or officers predicated solely upon U.S. federal securities laws. The Bahamian courts may apply any rule of Bahamian law which is mandatory irrespective of the governing law and may refuse to apply a rule of such governing law of the relevant documents, if it is manifestly incompatible with the public policy of The Bahamas. Furthermore, judgments based upon any civil liability provisions of the U.S. federal securities laws are not directly enforceable in The Bahamas. Rather, a lawsuit must be brought in The Bahamas on any such judgment. The courts of The Bahamas would recognize a U.S. judgment as a valid judgment, and permit the same to provide the basis of a fresh action in The Bahamas and should give a judgment based thereon without there being a re-trial or reconsideration of the merits of the case provided that (i) the courts in the United States had proper jurisdiction under Bahamian conflict of law rules over the parties subject to such judgment, (ii) the judgment is for a debt or definite sum of money other than a sum payable in respect of taxes or charges of a like nature or in respect of a fine or penalty, (iii) the U.S. courts did not contravene the rules of natural justice of The Bahamas, (iv) the judgment was not obtained by fraud on the part of the party in whose favor the judgment was given or of the court pronouncing it, (v) the enforcement of such judgment would not be contrary to the public policy of The Bahamas, (vi) the correct procedures under the laws of The Bahamas are duly complied with, (vii) the judgment is not inconsistent with a prior Bahamian judgment in respect of the same matter and (viii) enforcement proceedings are instituted within six years after the date of such judgment.
Certain Provisions in Our Articles May Limit Shareholders’ Ability to Affect a Change in Management or Control
Our Articles include certain provisions which may have the effect of delaying or preventing a future takeover or change in control of us that shareholders may consider to be in their best interests. Among other things, our Articles provide for a classified Board serving staggered terms of three years, super majority voting requirements with respect to certain significant transactions and restrictions on the acquisition of greater than 9.99% ownership without our Board’s approval. Our equity plans and our officers’ employment agreements provide certain rights to plan participants and those officers, respectively, in the event of a change in control of us.
25
ITEM 1B. UNRESOLVED STAFF COMMENTS
None.
Our hotel spas are operated under agreements with the hotel operators or owners, as the case may be, of those venues. Our other facilities, including our warehouses, are leased from the owners of the venues where they are located. Our principal office is located in Nassau, The Bahamas, and we own an office building in Coral Gables, Florida where certain administrative functions are located.
We believe that our existing facilities are adequate for our current and planned levels of operations and that alternative sites are readily available on competitive terms in the event that any of our material leases are not renewed.
None.
ITEM 4. MINE SAFETY DISCLOSURES
Not applicable.
ITEM 5. MARKET FOR REGISTRANT’S COMMON EQUITY, RELATED SHAREHOLDER MATTERS AND ISSUER PURCHASES OF EQUITY SECURITIES
Market Information
Our common shares are traded on The Nasdaq Capital Market under the symbol “OSW.” As of March 19, 2020, there were approximately 36 holders of our common shares.
Dividends
We adopted a cash dividend program in November 2019, with an initial quarterly cash dividend payment of $0.04 per common share. However, as a result of the impact of the coronavirus outbreak on our business, our board of directors re-evaluated our current dividend program and has determined that in order to increase our financial flexibility and reallocate our capital resources, to defer the previously authorized and declared quarterly dividend to be paid on May 29, 2020 and to temporarily suspend the dividend program until further notice.
Repurchases and Sales of Unregistered Securities
We have no recent repurchases of any securities or sales of any unregistered securities.
Stock Performance Graph
The following graph compares the change in the cumulative total shareholder return on our common shares against the cumulative total return (assuming reinvestment of dividends) of the Nasdaq Composite® (United States and Foreign) Index, and the Dow Jones U.S. Travel and Leisure Index for the period beginning March 21, 2019 and ending December 31, 2019.
We did not pay dividends on our common shares during the year ended December 31, 2019. The graph assumes that $100.00 was invested on March 21, 2019 in our common shares at a per share price of $11.85, the closing price on that date, and in each of the comparative indices. The share price performance on the following graph is not necessarily indicative of future share price performance.
26
COMPARISON OF CUMULATIVE TOTAL RETURN
Among OneSpaWorld Holdings Limited, the Nasdaq Composite Index, and the Dow Jones US Travel & Leisure Index
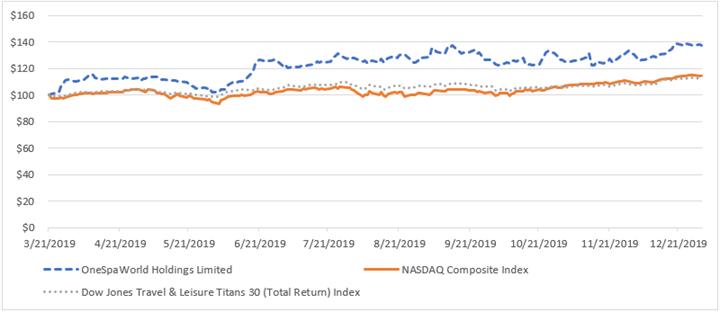
|
|
3/21 |
|
3/29 |
|
4/30 |
|
5/31 |
|
6/28 |
|
7/31 |
|
8/30 |
|
9/30 |
|
10/31 |
|
11/29 |
|
12/31 |
|
|||||||||||
|
OneSpaWorld Holdings Limited |
$ |
100.00 |
|
$ |
111.42 |
|
$ |
110.77 |
|
$ |
102.04 |
|
$ |
126.43 |
|
$ |
127.73 |
|
$ |
128.06 |
|
$ |
126.67 |
|
$ |
126.84 |
|
$ |
133.20 |
|
$ |
137.36 |
|
|
NASDAQ Composite |
$ |
100.00 |
|
$ |
98.60 |
|
$ |
103.27 |
|
$ |
95.08 |
|
$ |
102.13 |
|
$ |
104.29 |
|
$ |
101.58 |
|
$ |
102.05 |
|
$ |
105.78 |
|
$ |
110.54 |
|
$ |
114.46 |
|
|
Dow Jones US Travel & Leisure |
$ |
100.00 |
|
$ |
100.29 |
|
$ |
104.06 |
|
$ |
98.47 |
|
$ |
104.99 |
|
$ |
107.86 |
|
$ |
106.95 |
|
$ |
106.85 |
|
$ |
105.99 |
|
$ |
108.38 |
|
$ |
112.38 |
|
ITEM 6. SELECTED FINANCIAL DATA
At the closing of the Business Combination, OneSpaWorld became the ultimate parent company of Haymaker and OSW Predecessor. “OSW Predecessor” is comprised of the net assets and operations of (i) the following wholly owned subsidiaries of Steiner Leisure: OneSpaWorld LLC, Steiner Spa Asia Limited, Steiner Spa Limited, and Steiner Marks Limited, (ii) the following respective indirect subsidiaries of Steiner Leisure: Mandara PSLV, LLC, Mandara Spa (Hawaii), LLC, Florida Luxury Spa Group, LLC, Steiner Transocean U.S., Inc., Steiner Spa Resorts (Nevada), Inc., Steiner Spa Resorts (Connecticut), Inc., Steiner Resort Spas (California), Inc., OneSpaWorld Resort Spas (North Carolina), Inc. (formerly known as Steiner Resort Spas (North Carolina), Inc.), OSW SoHo LLC, OSW Distribution LLC, World of Wellness Training Limited (formerly known as Steiner Training Limited), STO Italy S.r.l., One Spa World LLC, Mandara Spa Services LLC, OneSpaWorld Limited, OneSpaWorld (Bahamas) Limited (formerly known as Steiner Transocean Limited), OneSpaWorld Medispa LLC, OneSpaWorld Medispa Limited, OneSpaWorld Medispa (Bahamas) Limited (formerly known as STO Medispa Limited), Mandara Spa (Cruise I), LLC, Mandara Spa (Cruise II), LLC, Steiner Transocean (II) Limited (subsequently dissolved), The Onboard Spa by Steiner (Shanghai) Co., Ltd., Mandara Spa LLC, Mandara Spa Puerto Rico, Inc., Mandara Spa (Guam), L.L.C. (subsequently dissolved), Mandara Spa (Bahamas) Limited, Mandara Spa Aruba N.V., Mandara Spa Polynesia Sarl, Mandara Spa (Saipan), Inc., Mandara Spa Asia Limited, PT Mandara Spa Indonesia, Spa Services Asia Limited, Mandara Spa Palau, Mandara Spa (Malaysia) Sdn. Bhd., Mandara Spa Ventures International Sdn. Bhd., Spa Partners (South Asia) Limited, Mandara Spa (Maldives) PVT LTD, and Mandara Spa (Fiji) Limited, (iii) Medispa Limited, a majority-owned subsidiary of Steiner Leisure, and (iv) the timetospa.com website, owned by Elemis USA, Inc. (formerly known as Steiner Beauty Products, Inc.) and subsequently transferred to OneSpaWorld.
The following tables contain selected historical financial data for the Company, derived from the audited consolidated and combined financial statements of OSW Predecessor included elsewhere in this report. The information below should be read in conjunction with the section entitled “Management’s Discussion and Analysis of Financial Condition and Results of Operations” and the audited consolidated and combined financial statements of the Company, and the notes related thereto, included elsewhere in this report.
27
|
|
Successor |
|
|
|
Predecessor |
|
|||||||||||||||
|
|
March 20, 2019 to December 31, 2019 |
|
|
|
January 1, 2019 to March 19, 2019 |
|
|
Year Ended December 31, 2018 |
|
|
Year Ended December 31, 2017 |
|
|||||||||
|
(In thousands) |
|
|
|
|
|
|
|
|
|
|
|
|
|
|
|
|
|||||
|
Revenues |
|
|
|
|
|
|
|
|
|
|
|
|
|
|
|
|
|||||
|
Service Revenues |
$ |
339,793 |
|
|
|
$ |
91,280 |
|
|
$ |
410,927 |
|
|
$ |
383,686 |
|
|||||
|
Product Revenues |
|
103,988 |
|
|
|
|
27,172 |
|
|
|
129,851 |
|
|
|
122,999 |
|
|||||
|
Total Revenues |
|
443,781 |
|
|
|
|
118,452 |
|
|
|
540,778 |
|
|
|
506,685 |
|
|||||
|
Cost of Revenue and Operating Expenses |
|
|
|
|
|
|
|
|
|
|
|
|
|
|
|
|
|||||
|
Cost of Services |
|
292,844 |
|
|
|
|
76,836 |
|
|
|
352,382 |
|
|
|
332,360 |
|
|||||
|
Cost of Products |
|
90,353 |
|
|
|
|
23,957 |
|
|
|
110,793 |
|
|
|
107,990 |
|
|||||
|
Administrative |
|
13,986 |
|
|
|
|
2,498 |
|
|
|
9,937 |
|
|
|
9,222 |
|
|||||
|
Salary and Payroll Taxes |
|
32,300 |
|
|
|
|
29,349 |
|
|
|
15,624 |
|
|
|
15,294 |
|
|||||
|
Amortization of Intangible Assets |
|
13,174 |
|
|
|
|
755 |
|
|
|
3,521 |
|
|
|
3,521 |
|
|||||
|
Total Cost of Revenues and Operating Expenses |
|
442,657 |
|
|
|
|
133,395 |
|
|
|
492,257 |
|
|
|
468,387 |
|
|||||
|
Income (Loss) from Operations |
|
1,124 |
|
|
|
|
(14,943 |
) |
|
|
48,521 |
|
|
|
38,298 |
|
|||||
|
Other Income (Expense), net |
|
|
|
|
|
|
|
|
|
|
|
|
|
|
|
|
|||||
|
Interest Expense |
|
(13,522 |
) |
|
|
|
(6,316 |
) |
|
|
(34,099 |
) |
|
|
— |
|
|||||
|
Loss on extinguishment of debt |
|
— |
|
|
|
|
(3,413 |
) |
|
|
— |
|
|
|
— |
|
|||||
|
Interest Income |
|
43 |
|
|
|
|
— |
|
|
|
238 |
|
|
|
408 |
|
|||||
|
Other (Expense) / Income |
|
— |
|
|
|
|
— |
|
|
|
171 |
|
|
|
(217 |
) |
|||||
|
Total Other Income (Expense), net |
|
(13,479 |
) |
|
|
|
(9,729 |
) |
|
|
(33,690 |
) |
|
|
191 |
|
|||||
|
(Loss) Income Before Provision for Income Taxes |
|
(12,355 |
) |
|
|
|
(24,672 |
) |
|
|
14,831 |
|
|
|
38,489 |
|
|||||
|
(Benefit) Provision for Income Taxes |
|
(120 |
) |
|
|
|
109 |
|
|
|
1,088 |
|
|
|
5,263 |
|
|||||
|
Net (Loss) Income |
$ |
(12,235 |
) |
|
|
$ |
(24,781 |
) |
|
$ |
13,743 |
|
|
$ |
33,226 |
|
|||||
|
Adjusted EBITDA (1) |
$ |
44,849 |
|
|
|
$ |
13,892 |
|
|
$ |
58,622 |
|
|
$ |
55,902 |
|
|||||
|
Unlevered After-Tax Free Cash Flow (1) |
$ |
41,105 |
|
|
|
$ |
13,505 |
|
|
$ |
52,913 |
|
|
$ |
52,774 |
|
|||||
|
% Conversion |
|
91.7 |
% |
|
|
|
97.2 |
% |
|
|
90.3 |
% |
|
|
94.4 |
% |
|||||
|
|
Successor |
|
|
|
Predecessor |
|
||||||
|
|
As of December 31, 2019 |
|
|
|
As of December 31, 2018 |
|
|
As of December 31, 2017 |
|
|||
|
Balance Sheet Data (At Period End): |
|
|
|
|
|
|
|
|
|
|
|
|
|
Working Capital (2) |
$ |
25,389 |
|
|
|
$ |
22,419 |
|
|
$ |
17,252 |
|
|
Total Assets |
|
923,669 |
|
|
|
|
272,659 |
|
|
|
267,072 |
|
|
Total Liabilities |
|
277,301 |
|
|
|
|
400,242 |
|
|
|
41,791 |
|
|
Total Equity (Deficit) |
|
646,368 |
|
|
|
|
(127,583 |
) |
|
|
225,281 |
|
|
|
(1) |
We define Adjusted EBITDA as Net Income plus Provision for Income Taxes, Other Income, Non-Controlling Interest, Interest Expense, and Depreciation & Amortization, with adjustments for non-recurring items, related party transactions, contribution from the historical timetospa.com channel, purchase price accounting adjustments, discrepancies between cash and booked Provision for Income Taxes and non-cash contract expenses. We define Unlevered After-Tax Free Cash Flow as Adjusted EBITDA minus capital expenditures and cash taxes paid. |
|
|
(2) |
Working capital calculated as current assets less current liabilities, less cash and cash equivalents. |
28
The following table reconciles Net Income to Adjusted EBITDA and Unlevered After-Tax Free Cash Flow for the periods March 20, 2019 to December 31, 2019 (Successor) and January 1, 2019 to March 19,2019 (Predecessor) and for the years ended December 31, 2018 and 2017 (Predecessor):
|
|
Successor |
|
|
|
Predecessor |
|
||||||||||
|
(In thousands) |
March 20, 2019 to December 31, |
|
|
|
January 1, 2019 to March 19, |
|
|
Year Ended December 31, |
|
|
Year Ended December 31, |
|
||||
|
|
2019 |
|
|
|
2019 |
|
|
2018 |
|
|
2017 |
|
||||
|
Net (Loss) Income |
$ |
(12,235 |
) |
|
|
$ |
(24,781 |
) |
|
$ |
13,743 |
|
|
$ |
33,226 |
|
|
Provision for Income Taxes |
|
(120 |
) |
|
|
|
109 |
|
|
|
1,088 |
|
|
|
5,263 |
|
|
Interest Income |
|
(43 |
) |
|
|
|
— |
|
|
|
(409 |
) |
|
|
(191 |
) |
|
Non-Controlling Interest (a) |
|
(3,334 |
) |
|
|
|
(678 |
) |
|
|
(3,857 |
) |
|
|
(2,109 |
) |
|
Interest Expense |
|
13,522 |
|
|
|
|
6,316 |
|
|
|
34,099 |
|
|
|
— |
|
|
Loss on Extinguishment of Debt |
|
— |
|
|
|
|
3,413 |
|
|
|
— |
|
|
|
— |
|
|
Non-GAAP Management Adjustments (b) |
|
— |
|
|
|
|
— |
|
|
|
— |
|
|
|
(1,208 |
) |
|
Related Party Adjustments (c) |
|
— |
|
|
|
|
538 |
|
|
|
2,860 |
|
|
|
9,925 |
|
|
timetospa.com Adjustments (d) |
|
— |
|
|
|
|
— |
|
|
|
— |
|
|
|
(805 |
) |
|
Depreciation & Amortization |
|
19,138 |
|
|
|
|
2,415 |
|
|
|
10,055 |
|
|
|
9,829 |
|
|
Change in Control Payments (e) |
|
— |
|
|
|
|
26,284 |
|
|
|
— |
|
|
|
— |
|
|
Stock-based Compensation |
|
20,761 |
|
|
|
|
— |
|
|
|
— |
|
|
|
— |
|
|
Business Combination Costs (f) |
|
7,160 |
|
|
|
|
— |
|
|
|
— |
|
|
|
— |
|
|
Addback for Non-Cash Prepaid Expenses (g) |
|
— |
|
|
|
|
276 |
|
|
|
1,043 |
|
|
|
1,972 |
|
|
Adjusted EBITDA |
$ |
44,849 |
|
|
|
$ |
13,892 |
|
|
$ |
58,622 |
|
|
$ |
55,902 |
|
|
Capital Expenditures |
|
(3,500 |
) |
|
|
|
(387 |
) |
|
|
(4,983 |
) |
|
|
(2,683 |
) |
|
Cash Taxes (h) |
|
(244 |
) |
|
|
|
— |
|
|
|
(726 |
) |
|
|
(445 |
) |
|
Unlevered After-Tax Free Cash Flow |
$ |
41,105 |
|
|
|
$ |
13,505 |
|
|
$ |
52,913 |
|
|
$ |
52,774 |
|
|
% Conversion (i) |
|
91.7 |
% |
|
|
|
97.2 |
% |
|
|
90.3 |
% |
|
|
94.4 |
% |
|
|
(a) |
Non-Controlling Interest refers to amounts paid to a joint venture partner. |
|
|
(b) |
Non-GAAP Management Adjustments refers to adjustments for certain one-time income or expenses and reflects timing discrepancies for certain cash income or expense items. |
|
|
(c) |
Related Party Adjustments refers to adjustments to reflect the impact of agreements with related parties for the full periods presented. |
|
|
(d) |
As a result of our planned separation from Steiner Leisure, OSW Predecessor no longer operates timetospa.com as a standalone e-commerce business with focused marketing efforts and paid search advertising, as it had operated the channel through December 31, 2017. timetospa.com is now a post-cruise sales tool where guests may continue their wellness journey after disembarking. This adjustment removes the impact of timetospa.com in the historical financial period due to this change in business model and to assist in comparing such periods with later periods. |
|
|
(e) |
Change in control payments relates to amounts paid to OSW Predecessor executives upon consummation of the Business Combination. |
|
|
(f) |
Business Combination costs refers primarily to legal and advisory fees incurred by OneSpaWorld in connection with the Business Combination. |
|
|
(g) |
Addback for Non-Cash Prepaid Expenses refers to non-cash expenses incurred in connection with certain contracts. |
|
|
(h) |
Cash Taxes refers to cash taxes paid or payable. |
|
|
(i) |
Unlevered After-Tax Free Cash Flow Conversion is calculated as Adjusted EBITDA less Capital Expenditures and Provision for Income Taxes, divided by Adjusted EBITDA. |
Note Regarding Non-GAAP Financial Information
We believe that these non-GAAP measures, when reviewed in conjunction with GAAP financial measures, and not in isolation or as substitutes for analysis of our results of operations under GAAP, are useful to investors as they are widely used measures of performance and the adjustments we make to these non-GAAP measures provide investors further insight into our profitability and additional perspectives in comparing our performance to other companies and in comparing our performance over time on a consistent basis. Adjusted EBITDA and Unlevered After-Tax Free Cash Flow have limitations as profitability measures in that they do not include total amounts for interest expense on our debt and provision for income taxes, and the effect of our expenditures for capital assets and certain intangible assets. In addition, all of these non-GAAP measures have limitations as profitability measures in that they do not include the impact of certain expenses related to items that are settled in cash. Because of these limitations, the Company relies primarily on its GAAP results.
In the future, we may incur expenses similar to those for which adjustments are made in calculating Adjusted EBITDA. Our presentation of Adjusted EBITDA should not be construed as a basis to infer that our future results will be unaffected by extraordinary, unusual or non-recurring items.
29
ITEM 7. MANAGEMENT’S DISCUSSION AND ANALYSIS OF FINANCIAL CONDITION AND RESULTS OF OPERATIONS
General
The following discussion and analysis of our audited financial condition and results of operations should be read in conjunction with the information presented in “Selected Historical Financial Information” and our combined financial statements and the notes thereto included elsewhere in this report. In addition to historical information, the following discussion contains forward-looking statements, such as statements regarding our expectation for future performance, liquidity and capital resources, that involve risks, uncertainties and assumptions that could cause actual results to differ materially from those contained in or implied by any forward-looking statements. Factors that could cause such differences include those identified below and those described in the sections entitled “Cautionary Statement Regarding Forward-Looking Statements” and “Risk Factors.” We assume no obligation to update any of these forward-looking statements.
The information for the periods ended March 20, 2019 to December 31, 2019 (Successor) and January 1, 2019 to March 19, 2019 (Predecessor) and for the years ended December 31, 2018 and 2017 are derived from OSW Predecessor’s audited combined financial statements and the notes thereto included elsewhere in this report.
Any reference to “OneSpaWorld” refers to OneSpaWorld Holdings Limited and our consolidated subsidiaries on a forward-looking basis or, as the context requires, to the historical results of OSW Predecessor. Any reference to “OSW Predecessor” refers to the entities comprising the “OneSpaWorld” business prior to the consummation of the Business Combination.
Overview
We are the pre-eminent global operator of health and wellness centers onboard cruise ships and a leading operator of health and wellness centers at destination resorts worldwide. Our highly-trained and experienced staff offer guests a comprehensive suite of premium health, fitness, beauty and wellness services and products onboard 170 cruise ships and at 69 destination resorts globally as of December 31, 2019. With over 90% market share in the outsourced maritime health and wellness market, we are the market leader at approximately 10x the size of our closest maritime competitor. Over the last 50 years, we have built our leading market position on our depth of staff expertise, broad and innovative service and product offerings, expansive global recruitment, training and logistics platform as well as decades-long relationships with cruise and destination resort partners. Throughout our history, our mission has been simple—helping guests look and feel their best during and after their stay.
At our core, we are a global services company. We serve a critical role for our cruise line and destination resort partners, operating a highly complex and increasingly important aspect of our cruise line and destination resort partners’ overall guest experience. Decades of investment and know-how have allowed us to construct an unmatched global infrastructure to manage the complexity of our operations, which in 2019 included nearly 8,600 annual voyages with visits to over 1,200 ports of call around the world. We have consistently expanded our onboard offerings with innovative and leading-edge service and product introductions, and developed the powerful back-end recruiting, training and logistics platforms to manage our operational complexity, maintain our industry-leading quality standards, and maximize revenue per center. The combination of our renowned recruiting and training platform, deep labor pool, global logistics and supply chain infrastructure, and proven revenue management capabilities represents a significant competitive advantage that we believe is not economically feasible to replicate.
A significant portion of our revenues are generated from our cruise ship operations. Historically, we have been able to renew almost all of our cruise line agreements that expired or were scheduled to expire. Recently, we signed an agreement with Celebrity Cruises as the exclusive operator of health and wellness centers on Celebrity’s entire fleet, increasing the Celebrity vessels on which we operated in 2020 by nine, extended our current agreement with Norwegian Cruise Lines through 2024, won a contract with the new lifestyle brand Virgin Voyages to operate the spa and wellness offerings onboard the first three Virgin vessels, planned to launch in 2020, 2021 and 2022, and entered into an amended agreement with P&O Cruises to extend our operations on P&O’s vessels for the next five years.
As discussed above, the coronavirus outbreak is currently impacting global economic conditions, the Health & Wellness industry, and other industries in which we do business. Temporary closures of businesses have been ordered and individuals’ ability to travel has been curtailed through mandated travel restrictions and may be further limited through additional voluntary or mandated closures of travel-related businesses. These actions have expanded significantly in the past few weeks and are expected to continue. The coronavirus outbreak has had a significant effect on our business and is expected to continue to have a significant effect on our results of operations and financial condition during the remainder of fiscal 2020, although the full financial impact on our business cannot be reasonably estimated at this time.
30
Matters Affecting Comparability
Supply Agreement
We purchase beauty products for resale from an entity (the “Supplier Entity”) that was, during the periods presented, a wholly-owned subsidiary of Steiner Leisure. OSW Predecessor and the Supplier Entity entered into an agreement, effective as of January 1, 2017 (subsequently amended in 2018), which established the prices at which beauty products will be purchased by us from the Supplier Entity for a term of 10 years (the “Supply Agreement”). The Supply Agreement has had a positive impact on our business as it has reduced the cost of products for retail goods and has lowered the cost of products used in services.
The Supply Agreement was effective as of January 1, 2017, however, existing inventories of products purchased prior to the effectiveness of the Supply Agreement were not fully depleted until the end of the third quarter of 2017. Beginning October 1, 2017, the cost of products used in services and cost of products reflect the actual pricing under the Supply Agreement because, at that time, all inventory on hand was purchased under the terms of the Supply Agreement.
On March 19, 2019, we consummated the previously announced Business Combination pursuant to the Transaction Agreement.
“OSW Predecessor” is comprised of the net assets and operations of (i) the following wholly-owned subsidiaries of Steiner Leisure: OneSpaWorld LLC, Steiner Spa Asia Limited, Steiner Spa Limited, and Steiner Marks Limited, (ii) the following respective indirect subsidiaries of Steiner Leisure: Mandara PSLV, LLC, Mandara Spa (Hawaii), LLC, Florida Luxury Spa Group, LLC, Steiner Transocean U.S., Inc., Steiner Spa Resorts (Nevada), Inc., Steiner Spa Resorts (Connecticut), Inc., Steiner Resort Spas (California), Inc., OneSpaWorld Resort Spas (North Carolina), Inc. (formerly known as Steiner Resort Spas (North Carolina), Inc.), OSW SoHo LLC, OSW Distribution LLC, World of Wellness Training Limited (formerly known as Steiner Training Limited), STO Italy S.r.l., One Spa World LLC, Mandara Spa Services LLC, OneSpaWorld Limited, OneSpaWorld (Bahamas) Limited (formerly known as Steiner Transocean Limited), OneSpaWorld Medispa LLC, OneSpaWorld Medispa Limited, OneSpaWorld Medispa (Bahamas) Limited (formerly known as STO Medispa Limited), Mandara Spa (Cruise I), LLC, Mandara Spa (Cruise II), LLC, Steiner Transocean (II) Limited (subsequently dissolved), The Onboard Spa by Steiner (Shanghai) Co., Ltd., Mandara Spa LLC, Mandara Spa Puerto Rico, Inc., Mandara Spa (Guam), L.L.C., Mandara Spa (Bahamas) Limited, Mandara Spa Aruba N.V., Mandara Spa Polynesia Sarl, Mandara Spa Asia Limited, PT Mandara Spa Indonesia, Spa Services Asia Limited, Mandara Spa Palau, Mandara Spa (Malaysia) Sdn. Bhd., Mandara Spa Ventures International Sdn. Bhd., Spa Partners (South Asia) Limited, Mandara Spa (Maldives) PVT LTD, and Mandara Spa (Fiji) Limited, (iii) Medispa Limited, a majority-owned subsidiary of Steiner Leisure, and (iv) the timetospa.com website owned by Elemis USA, Inc. (formerly known as Steiner Beauty Products, Inc.), subsequently transferred to OneSpaWorld.
At the closing of the Business Combination, OneSpaWorld became the ultimate parent company of Haymaker and OSW Predecessor. Unless the context otherwise requires, “we,” “us,” “our” and the “Company” refer to OneSpaWorld Holdings Limited and its subsidiaries.
timetospa.com Business Model
As a result of our separation from Steiner Leisure, we ceased operating timetospa.com as a standalone e-commerce business with focused marketing efforts and paid search advertising effective as of December 31, 2017. timetospa.com is now a post-cruise sales tool where guests may continue their wellness journey after disembarking. Revenue and net income in the year ended December 31, 2017 are not directly comparable to revenue and net income in the year ended December 31, 2018 due to this change in the timetospa.com business model.
31
Key Performance Indicators
In assessing the performance of our business, we consider several key performance indicators used by management. These key indicators include:
|
|
• |
Ship Count. The number of ships, both on average during the period and at period end, on which we operate health and wellness centers. This is a key metric that impacts revenue and profitability. |
|
|
• |
Average Weekly Revenue Per Ship. A key indicator of productivity per ship. Revenue per ship can be affected by the various sizes of health and wellness centers and categories of ships on which we serve. |
|
|
• |
Average Revenue Per Shipboard Staff Per Day. We utilize this performance metric to assist in determining the productivity of our onboard staff, which we believe is a critical element of our operations. |
|
|
• |
Destination Resort Count. The number of destination resorts, both on average during the period and at period end, on which we operate the health and wellness centers. This is a key metric that impacts revenue and profitability. |
|
|
• |
Average Weekly Revenue Per Destination Resort Health and Wellness Center. A key indicator of productivity per destination resort health and wellness center. Revenue per destination resort health and wellness center in a period can be affected by the mix of North American and Asian centers for such period because North American centers are typically larger and produce substantially more revenues per center than Asian centers. Additionally, average weekly revenue can also be negatively impacted by renovations of our destination resort health and wellness centers. |
For the year ended December 31, 2019, we have combined the results of the successor entity, OneSpaWorld Holdings Limited, for the period from March 20, 2019 to December 31, 2019 with the results of OSW Predecessor for the period from January 1, 2019 to March 19, 2019 (the “2019 Combined Period”) in the following table which sets forth the above key performance indicators for the periods presented:
|
|
As of and for the Year Ended December 31, |
|
|||||||||
|
|
2019 |
|
|
2018 |
|
|
2017 |
|
|||
|
Average Ship Count |
|
160 |
|
|
|
157 |
|
|
|
154 |
|
|
Period End Ship Count |
|
170 |
|
|
|
163 |
|
|
|
157 |
|
|
Average Weekly Revenue Per Ship |
$ |
61,561 |
|
|
|
60,421 |
|
|
|
56,999 |
|
|
Average Revenue Per Shipboard Staff Per Day |
$ |
475 |
|
|
|
474 |
|
|
|
446 |
|
|
Average Resort Count |
|
69 |
|
|
|
62 |
|
|
|
52 |
|
|
Period End Resort Count |
|
69 |
|
|
|
67 |
|
|
|
54 |
|
|
Average Weekly Revenue Per Resort |
$ |
12,128 |
|
|
|
13,927 |
|
|
|
16,400 |
|
Key Financial Definitions
Revenues. Revenues consist primarily of sales of services and sales of products to cruise ship passengers and destination resort guests. The following is a brief description of the components of our revenues:
|
|
• |
Service revenues. Service revenues consist primarily of sales of health and wellness services, including a full range of massage treatments, facial treatments, nutritional/weight management consultations, teeth whitening, mindfulness services and medi-spa services to cruise ship passengers and destination resort guests. We bill our services at rates which inherently include an immaterial charge for products used in the rendering of such services, if applicable. |
|
|
• |
Product revenues. Product revenues consist primarily of sales of health and wellness products, such as facial skincare, body care, orthotics and detox supplements to cruise ship passengers, destination resort guests and timetospa.com customers. |
Cost of services. Cost of services consists primarily of an allocable portion of payments to cruise lines (which are derived as a percentage of service revenues or a minimum annual rent or a combination of both), an allocable portion of wages paid to shipboard employees, an allocable portion of staff-related shipboard expenses, costs related to recruitment and training of shipboard employees, wages paid directly to destination resort employees, payments to destination resort venue owners, the allocable cost of products consumed in the rendering of a service and health and wellness center depreciation. Cost of services has historically been highly variable; increases and decreases in cost of services are primarily attributable to a corresponding increase or decrease in service revenues. Cost of services has tended to remain consistent as a percentage of service revenues.
Cost of products. Cost of products consists primarily of the cost of products sold through our various methods of distribution, an allocable portion of wages paid to shipboard employees and an allocable portion of payments to cruise lines and destination resort partners (which are derived as a percentage of product revenues or a minimum annual rent or a combination of both). Cost of products
32
has historically been highly variable, increases and decreases in cost of products are primarily attributable to a corresponding increase or decrease in product revenues. Cost of products has tended to remain consistent as a percentage of product revenues.
Administrative. Administrative expenses are comprised of expenses associated with corporate and administrative functions that support our business, including fees for professional services, insurance, headquarters rent and other general corporate expenses. We expect administrative expenses to increase due to additional legal, accounting, insurance and other expenses related to becoming a public company.
Salary and payroll taxes. Salary and payroll taxes are comprised of employee expenses associated with corporate and administrative functions that support our business, including fees for employee salaries, bonuses, payroll taxes, pension/401(k) and other employee costs.
Amortization of intangible assets. Amortization of intangible assets are comprised of the amortization of intangible assets with definite useful lives (e.g. retail concession agreements, destination resort agreements, licensing agreements) and amortization expenses associated with the 2015 and 2019 Transactions.
Other income (expense), net. Other income (expense) consists of royalty income, interest income, interest expense and minority interest expense.
Provision for income taxes. Provision for income taxes includes current and deferred federal income tax expenses, as well as state and local income taxes. See “—Critical Accounting Policies—Income Taxes” included elsewhere in this Annual Report on Form 10-K.
Net income. Net income consists of income from operations less other income (expense) and provision for income taxes.
Revenue Drivers and Business Trends
Our revenues and financial performance are impacted by a multitude of factors, including, but not limited to:
|
|
• |
The number of ships and destination resorts in which we operate health and wellness centers. Revenue is impacted by net new ship growth, ships out of service, unanticipated dry-docks, ships prevented from sailing due to outbreaks of illnesses, such as the recent coronavirus outbreak, and the number of destination resort health and wellness centers operating in each period. |
|
|
• |
The size and offerings of new health and wellness centers. We have focused our attention on the innovation and provision of higher value added and price point services such as medi-spa and advanced facial techniques, which require treatment rooms equipped with specific equipment and staff trained to perform these services. As our cruise line partners continue to invest in new ships with enhanced health and wellness centers that allow for more advanced treatment rooms and larger staff sizes, we are able to increase the availability of these services, driving an overall shift towards a more attractive service mix. |
|
|
• |
Expansion of value-added services and products across modalities in existing health and wellness centers. We continue to expand our higher value added and price point offerings in existing health and wellness centers, including introducing premium medi-spa services, resulting in higher guest spending. |
|
|
• |
The mix of ship count across contemporary, premium, luxury and budget categories. Revenue generated per shipboard health and wellness center differs across contemporary, premium, luxury and budget ship categories due to the size of the health and wellness centers, services offered, guest demographics and guest spending patterns. |
|
|
• |
The mix of cruise geography and itinerary. Revenue generated per shipboard health and wellness center is influenced by each cruise itinerary including the number of sea versus port days, which impacts center utilization, as well as the geographic sailing region which may impact offerings of services and products to best address guest preferences. |
|
|
• |
Collaboration with cruise line partners, including targeted marketing and promotion initiatives, as well as implementation of proprietary technologies to increase center utilization via pre-booking and pre-payment. We are now directly marketing and distributing promotions to onboard passengers as a result of enhanced collaboration with select cruise line partners. We have also begun to implement proprietary pre-booking and pre-payment technology platforms that interface with our cruise line partners’ pre-cruise planning systems. These areas of increased collaboration with cruise line partners are resulting in higher revenue generation across our health and wellness centers. |
|
|
• |
The impact of weather. Our health and wellness centers onboard cruise ships and in select destination resorts may be negatively affected by hurricanes. The negative impact of hurricanes is highest during peak hurricane season from August to October. |
The effect of each of these factors on our revenues and financial performance varies from period to period.
33
Results of Operations
The following tables present operations for two periods, Predecessor and Successor, which relate to the periods preceding and the periods succeeding the Business Combination, respectively. References to the “Successor 2019 Period” in the discussion below refer to the period from March 20, 2019 to December 31, 2019. References to the “Predecessor 2019 Period” in the discussion below refers to the period from January 1, 2019 to March 19, 2019.
|
|
Successor |
|
|
Predecessor |
|
||||||||||||||||
|
|
Consolidated |
|
|
Combined |
|
||||||||||||||||
|
($ in thousands) |
March 20, 2019 to December 31, 2019 |
|
% of Total Revenue |
|
|
January 1, 2019 to March 19, 2019 |
|
% of Total Revenue |
|
|
Year Ended December 31, 2018 |
|
|
% of Total Revenue |
|
||||||
|
REVENUES: |
|
|
|
|
|
|
|
|
|
|
|
|
|
|
|
|
|
|
|
|
|
|
Service Revenues |
$ |
339,793 |
|
|
76.6 |
% |
|
$ |
91,280 |
|
|
77.1 |
% |
|
$ |
410,927 |
|
|
|
76.0 |
% |
|
Product Revenues |
|
103,988 |
|
|
23.4 |
% |
|
|
27,172 |
|
|
22.9 |
% |
|
|
129,851 |
|
|
|
24.0 |
% |
|
Total Revenues |
|
443,781 |
|
|
100.0 |
% |
|
|
118,452 |
|
|
100.0 |
% |
|
|
540,778 |
|
|
|
100.0 |
% |
|
COST OF REVENUES AND OPERATING EXPENSES: |
|
|
|
|
|
|
|
|
|
|
|
|
|
|
|
|
|
|
|
|
|
|
Cost of Services |
|
292,844 |
|
|
66.0 |
% |
|
|
76,836 |
|
|
64.9 |
% |
|
|
352,382 |
|
|
|
65.2 |
% |
|
Cost of Products |
|
90,353 |
|
|
20.4 |
% |
|
|
23,957 |
|
|
20.2 |
% |
|
|
110,793 |
|
|
|
20.5 |
% |
|
Administrative |
|
13,986 |
|
|
3.2 |
% |
|
|
2,498 |
|
|
2.1 |
% |
|
|
9,937 |
|
|
|
1.8 |
% |
|
Salary and Payroll Taxes |
|
32,300 |
|
|
7.3 |
% |
|
|
29,349 |
|
|
24.8 |
% |
|
|
15,624 |
|
|
|
2.9 |
% |
|
Amortization of Intangible Assets |
|
13,174 |
|
|
3.0 |
% |
|
|
755 |
|
|
0.6 |
% |
|
|
3,521 |
|
|
|
0.7 |
% |
|
Total Cost of Revenues and Operating Expenses |
|
442,657 |
|
|
99.7 |
% |
|
|
133,395 |
|
|
112.6 |
% |
|
|
492,257 |
|
|
|
91.0 |
% |
|
Income from Operations |
|
1,124 |
|
|
0.3 |
% |
|
|
(14,943 |
) |
|
-12.6 |
% |
|
|
48,521 |
|
|
|
9.0 |
% |
|
OTHER INCOME (EXPENSE), NET |
|
|
|
|
|
|
|
|
|
|
|
|
|
|
|
|
|
|
|
|
|
|
Interest Expense |
|
(13,522 |
) |
|
-3.0 |
% |
|
|
(6,316 |
) |
|
-5.3 |
% |
|
|
(34,099 |
) |
|
|
-6.3 |
% |
|
Loss on extinguishment of debt |
|
— |
|
|
0.0 |
% |
|
|
(3,413 |
) |
|
-2.9 |
% |
|
|
— |
|
|
|
0.0 |
% |
|
Interest Income |
|
43 |
|
|
0.0 |
% |
|
|
— |
|
|
0.0 |
% |
|
|
238 |
|
|
|
0.0 |
% |
|
Other (Expense)/Income |
|
— |
|
|
0.0 |
% |
|
|
— |
|
|
0.0 |
% |
|
|
171 |
|
|
|
0.0 |
% |
|
Total Other Income, net |
|
(13,479 |
) |
|
-3.0 |
% |
|
|
(9,729 |
) |
|
-8.2 |
% |
|
|
(33,690 |
) |
|
|
-6.2 |
% |
|
(Loss) Income Before Provision for Income Taxes |
|
(12,355 |
) |
|
-2.8 |
% |
|
|
(24,672 |
) |
|
-20.8 |
% |
|
|
14,831 |
|
|
|
2.7 |
% |
|
(BENEFIT) PROVISION FOR INCOME TAXES |
|
(120 |
) |
|
0.0 |
% |
|
|
109 |
|
|
0.1 |
% |
|
|
1,088 |
|
|
|
0.2 |
% |
|
Net Income |
|
(12,235 |
) |
|
-2.8 |
% |
|
|
(24,781 |
) |
|
-20.9 |
% |
|
|
13,743 |
|
|
|
2.5 |
% |
|
Net Income attributable to noncontrolling interest |
|
3,334 |
|
|
0.8 |
% |
|
|
678 |
|
|
0.6 |
% |
|
|
3,857 |
|
|
|
0.7 |
% |
|
Net (loss) income attributable to common Shareholders and Parent, respectively |
$ |
(15,569 |
) |
|
-3.5 |
% |
|
$ |
(25,459 |
) |
|
-21.5 |
% |
|
$ |
9,886 |
|
|
|
1.8 |
% |
Revenues. Revenues for the Successor 2019 Period, Predecessor 2019 Period and for the year ended December 31, 2018 were $443.8 million, $118.5 million and $540.8 million, respectively. The increase was driven by seven incremental net new shipboard health and wellness centers added to the fleet, a continued trend towards larger and enhanced shipboard health and wellness centers, as well as increased guest spending on higher-priced services, product innovation and improved collaboration with partners, such as the continued rollout of new direct marketing initiatives onboard. This growth was partially offset by the negative impacts of ships temporarily taken out of service:
|
|
• |
Service revenues Service Revenues for the Successor 2019 Period, Predecessor 2019 Period and the year ended December 31, 2018 were $339.8 million, $91.3 million and $410.9 million, respectively. |
|
|
• |
Product revenues. Product revenues for the Successor 2019 Period, Predecessor 2019 Period and year ended December 31, 2018 were $104.0 million, $27.2 million and $129.9 million, respectively. |
The productivity of shipboard health and wellness centers increased slightly for the 2019 combined period compared to 2018, as evidenced by an increase in both average weekly revenues and a small increase in revenues per shipboard staff per day. Average weekly revenues increased by 1.9% to $61,561 in 2019, from $60,421 in 2018, and revenues per shipboard staff per day increased by 0.2% over the same time period. We had an average of 2,964 shipboard staff members in service in 2019 compared to an average of 2,852 shipboard staff members in service in 2018. The productivity of destination resort health and wellness centers, measured by average weekly revenues, decreased 12.9% to $12,128 in 2019, from $13,927 in 2018. The decrease in productivity was driven by the closure of two large health and wellness centers in North America.
Cost of services. Cost of services as a percentage of service revenue for the Successor 2019 Period, Predecessor 2019 Period, and for the year ended December 31, 2018 were 86.2%, 84.2% and 85.8%, respectively.
34
Cost of products. Cost of products as a percentage of product revenue for the Successor 2019 Period, Predecessor 2019 Period and for the year ended December 31, 2018 were 86.9%, 88.2% and 85.3%, respectively. Successor 2019 Period includes purchase price adjustments concerning the inventory valuations resulting in higher costs, a portion of which are non-cash.
Administrative. Administrative expenses for the Successor 2019 Period, Predecessor 2019 Period and for the year ended December 31, 2018 were $14.0 million, $2.5 million and $9.9 million, respectively. The Successor 2019 Period had expenses incurred in connection with the Business Combination and costs associated with being a public company.
Salary and payroll taxes. Salary and payroll taxes for the Successor 2019 Period, Predecessor 2019 Period and for the year ended December 31, 2018 were $32.3 million, $29.3 million and $15.6 million, respectively. The Successor 2019 Period includes stock-based compensation of $20.4 million related to stock options that fully vested upon grant to certain directors and executives. The Predecessor 2019 Period had change in control payments of $26.6 million pursuant to employment agreements entered into in 2016 that were earned upon consummation of the Business Combination for services rendered prior to the Business Combination.
Amortization of intangible assets. Amortization of intangible assets for the Successor 2019 Period, Predecessor 2019 Period and year ended December 31, 2018 were $13.5 million, $0.8 million and $3.5 million, respectively. Amortization expense in the 2019 Successor Period reflects the new basis of intangible assets identified in the Business Combination.
Other income (expense), net. Other income (expense) for the Successor 2019 Period, Predecessor 2019 Period and year ended December 31, 2018 were $(13.5) million, $(9.7) million and $(33.7) million, respectively. The Predecessor 2019 Period included a loss on extinguishment of debt of $3.4 million associated with the payoff of the pre-existing debt by the Parent of the Company’s predecessor.
Provision for income taxes. Provision for income taxes for the Successor 2019 Period, Predecessor 2019 Period, and year ended December 31, 2018 were $(0.1) million, $0.1 million and $1.0 million, respectively.
Net income. Net (loss) income for the Successor 2019 Period, Predecessor 2019 Period and year ended December 31, 2018 were $(12.2) million, $(24.8) million and $13.7 million, respectively. The Successor 2019 Period had expenses related to stock-based compensation of $20.4 million. The Predecessor 2019 Period had change in control payments of $26.6 million earned upon consummation of the Business Combination.
35
Comparison of Results for the Years Ended December 31, 2018 (audited) and December 31, 2017 (audited)
|
|
Predecessor |
|
|
|
|
|
|
|
||||||||||||||||||||||
|
|
Combined |
|
|
|
|
|
|
|
||||||||||||||||||||||
|
|
|
|
|
|
|
|
|
|
|
|
|
|
Change |
|
||||||||||||||||
|
($ in thousands) |
Year Ended December 31, 2018 |
|
% of Total Revenue |
|
Year Ended December 31, 2017 |
|
% of Total Revenue |
|
$ |
|
% |
|
||||||||||||||||||
|
Revenues |
|
|
|
|
|
|
|
|
|
|
|
|
|
|
|
|
|
|
||||||||||||
|
Service Revenues |
$ |
410,927 |
|
|
76.0 |
% |
$ |
383,686 |
|
|
75.7 |
% |
$ |
27,241 |
|
|
7.1 |
% |
||||||||||||
|
Product Revenues |
|
129,851 |
|
|
24.0 |
% |
|
122,999 |
|
|
24.3 |
% |
|
6,852 |
|
|
5.6 |
% |
||||||||||||
|
Total Revenues |
|
540,778 |
|
|
100.0 |
% |
|
506,685 |
|
|
100.0 |
% |
|
34,093 |
|
|
6.7 |
% |
||||||||||||
|
Cost of Revenues and Operating Expenses |
|
|
|
|
|
|
|
|
|
|
|
|
|
|
|
|
|
|
||||||||||||
|
Cost of Services |
|
352,382 |
|
|
65.2 |
% |
|
332,360 |
|
|
65.6 |
% |
|
20,022 |
|
|
6.0 |
% |
||||||||||||
|
Cost of Products |
|
110,793 |
|
|
20.5 |
% |
|
107,990 |
|
|
21.3 |
% |
|
2,803 |
|
|
2.6 |
% |
||||||||||||
|
Administrative |
|
9,937 |
|
|
1.8 |
% |
|
9,222 |
|
|
1.8 |
% |
|
715 |
|
|
7.8 |
% |
||||||||||||
|
Salary and Payroll Taxes |
|
15,624 |
|
|
2.9 |
% |
|
15,294 |
|
|
3.0 |
% |
|
330 |
|
|
2.2 |
% |
||||||||||||
|
Amortization of Intangible Assets |
|
3,521 |
|
|
0.7 |
% |
|
3,521 |
|
|
0.7 |
% |
|
— |
|
|
0.0 |
% |
||||||||||||
|
Total Cost of Revenues and Operating Expenses |
|
492,257 |
|
|
91.0 |
% |
|
468,387 |
|
|
92.4 |
% |
|
23,870 |
|
|
5.1 |
% |
||||||||||||
|
Income from Operations |
|
48,521 |
|
|
9.0 |
% |
|
38,298 |
|
|
7.6 |
% |
|
10,223 |
|
|
26.7 |
% |
||||||||||||
|
Other Income (Expense), net |
|
|
|
|
|
|
|
|
|
|
|
|
|
|
|
|
|
|
||||||||||||
|
Interest Expense |
|
(34,099 |
) |
|
-6.3 |
% |
|
— |
|
|
0.0 |
% |
|
(34,099 |
) |
NM |
|
|||||||||||||
|
Interest Income |
|
238 |
|
|
0.0 |
% |
|
408 |
|
|
0.1 |
% |
|
(170 |
) |
|
-41.7 |
% |
||||||||||||
|
Other (Expense)/Income |
|
171 |
|
|
0.0 |
% |
|
(217 |
) |
|
0.0 |
% |
|
388 |
|
NM |
|
|||||||||||||
|
Total Other Income, net |
|
(33,690 |
) |
|
-6.2 |
% |
|
191 |
|
|
0.0 |
% |
|
(33,881 |
) |
NM |
|
|||||||||||||
|
Income Before Provision for Income Taxes |
|
14,831 |
|
|
2.7 |
% |
|
38,489 |
|
|
7.6 |
% |
|
(23,658 |
) |
|
-61.5 |
% |
||||||||||||
|
Provision for Income Taxes |
|
1,088 |
|
|
0.2 |
% |
|
5,263 |
|
|
1.0 |
% |
|
(4,175 |
) |
|
-79.3 |
% |
||||||||||||
|
Net Income |
$ |
13,743 |
|
|
2.5 |
% |
$ |
33,226 |
|
|
6.6 |
% |
$ |
(19,483 |
) |
|
-58.6 |
% |
||||||||||||
Revenues. Revenues increased approximately 6.7%, or $34.1 million, to $540.8 million in 2018, from $506.7 million in 2017. The increase was driven by six incremental net new shipboard health and wellness centers added to the fleet, 14 incremental net new destination resort health and wellness centers opened, a continued trend towards larger and enhanced shipboard health and wellness centers as well as increased guest spending on higher-priced services, product innovation and improved collaboration with partners such as the continued rollout of new direct marketing initiatives onboard. The revenue increase was offset by one-time changes in the business model for the timetospa.com website.
For the year ended December 31, 2018, the 20 incremental net new health and wellness centers contributed $20.1 million, the increase in average price of services and products sold contributed $15.3 million and the increase in the volume of services sold at existing health and wellness centers contributed $1.0 million in increased revenue, respectively, offset by a decrease of $2.2 million due to the change in the timetospa.com website business model. The revenue growth over this time period was relatively proportional between service and product revenues:
|
|
• |
Service revenues. Service revenues increased approximately 7.1%, or $27.2 million, to $410.9 million in 2018, from $383.7 million in 2017. |
|
|
• |
Product revenues. Product revenues increased approximately 5.6%, or $6.9 million, to $129.9 million in 2018, from $123.0 million in 2017. |
The productivity of shipboard health and wellness centers increased for 2018 compared to 2017 as evidenced by an increase in both average weekly revenues and revenues per shipboard staff per day. Average weekly revenues increased by 6.0% to $60,421 in 2018, from $56,999 in 2017, and revenues per shipboard staff per day increased by 6.3% over the same time period. We had an average of 2,852 shipboard staff members in service in 2018 compared to an average of 2,809 shipboard staff members in service in 2017. The productivity of destination resort health and wellness centers, measured by average weekly revenues, decreased 12.9% to $13,927 in 2018, from $16,400 in 2017. The decrease in productivity was primarily driven by one large destination resort health and wellness center being under renovation as well as the addition of smaller health and wellness centers in Asia that generate lower revenue and the closure of a large health and wellness center in Las Vegas.
36
Cost of services. Cost of services increased $20.0 million in 2018 compared to 2017. The increase was primarily attributable to an increase in service revenues which accounted for an increase of $23.6 million, offset by the effect of reduced costs under the Supply Agreement which decreased cost of services by $4.2 million. Cost of services as a percentage of service revenues decreased to 85.8% in 2018, from 86.6% in 2017. The decrease was primarily attributable to the effect of the Supply Agreement.
Cost of products. Cost of products increased $2.8 million in 2018 compared to 2017. The increase was primarily attributable to an increase in product revenues which accounted for an increase of $6.1 million and an increase in payments to cruise and destination resort partners of $3.0 million, offset by the effect of the Supply Agreement which decreased cost of products by $5.2 million. Cost of products as a percentage of product revenues decreased to 85.3% in 2018, from 87.8% in 2017. The decrease was attributable to the effect of reduced costs under the Supply Agreement.
Administrative. Administrative expenses increased $0.7 million in 2018 compared to 2017. The increase in administrative expenses was driven primarily by expenses incurred in connection with the Business Combination.
Salary and payroll taxes. Salary and payroll taxes increased $0.3 million in 2018 compared to 2017. The increase was primarily related to additional merit-based compensation.
Amortization of intangible assets. Amortization of intangible assets remained flat at $3.5 million in 2018 and 2017.
Other income (expense), net. Other income (expense), net decreased $33.9 million in 2018 compared to 2017. This decrease was primarily attributable to an increase in interest expense related to internal restructuring, which resulted in debt previously held at the parent level being assigned to us in anticipation of the Business Combination.
Provision for income taxes. Provision for income taxes decreased $4.2 million in 2018 compared to 2017. This decrease was primarily due to a favorable impact of the Act which resulted in a lower U.S. federal tax rate effective January 1, 2018. Cash taxes as a percentage of income before provision for income taxes for the years ended December 31, 2018 and 2017 were 4.9% and 1.2%, respectively.
Net income. Net income was $13.7 million in 2018 compared to net income of $33.2 million in 2017. This decrease in net income was due to all of the factors described above.
Liquidity and Capital Resources
Overview
We have historically funded our operations with cash flow from operations, except with respect to certain expenses and operating costs that had been paid prior to the Business Combination by Steiner Leisure on our behalf, and, when needed, with borrowings under our credit facility. Steiner Leisure has paid on our behalf expenses associated with the allocation of Parent corporate overhead and costs associated with the purchase of products from related parties and forgiven by Steiner Leisure. Historical operating cash flows exclude OSW Predecessor’s expenses and operating costs paid by Steiner Leisure on our behalf. Consequently, our combined historical cash flows may not be indicative of cash flows had we been a separate stand-alone entity, or of our future cash flows.
Our principal uses for liquidity have been distributions to Steiner Leisure prior to the Business Combination, debt service and working capital, and most recently, the acquisition of the medi-spa joint venture. On December 31, 2019, the Company had a 60% controlling interest and a third party had a 40% noncontrolling interest in Medispa Limited. On February 14, 2020, the Company purchased the 40% noncontrolling interest for $12.3 million in a combination of cash and 98,753 shares of the Company’s common stock.
The regional and global outbreak of the coronavirus has negatively impacted our revenue, including our current cash flow in the first quarter of fiscal 2020. As of the date of this report, the extent to which the coronavirus will impact our liquidity and capital resources will depend on future developments, which are highly uncertain and cannot be predicted at this time.
37
Cash Flows
The following table shows summary cash flow information for the periods from March 20, 2019 to December 31, 2019 (Successor), January 1, 2019 to March 19, 2019 (Predecessor) and the years ended December 31, 2018 and 2017 (Predecessor)(audited).
|
|
Successor |
|
Predecessor |
|
|||||||||||
|
|
March 20,2019 to December 31, |
|
January 1, 2019 to March 19, |
|
|
Year Ended December 31, |
|
|
Year Ended December 31, |
|
|||||
|
(in thousands) |
2019 |
|
2019 |
|
|
2018 |
|
|
2017 |
|
|||||
|
Net Income |
$ |
(12,235 |
) |
$ |
(24,781 |
) |
|
$ |
13,743 |
|
|
$ |
33,226 |
|
|
|
Depreciation & Amortization |
|
19,606 |
|
|
1,989 |
|
|
|
10,055 |
|
|
|
9,829 |
|
|
|
Amortization of Deferred Financing Costs |
|
841 |
|
|
213 |
|
|
|
1,243 |
|
|
|
— |
|
|
|
Stock-based Compensation |
|
20,683 |
|
|
— |
|
|
|
— |
|
|
|
— |
|
|
|
Provision for Doubtful Accounts |
|
— |
|
|
8 |
|
|
|
18 |
|
|
|
18 |
|
|
|
Loss on extinguishment of debt |
|
— |
|
|
3,413 |
|
|
|
— |
|
|
|
— |
|
|
|
Allocation of Parent Corporate Overhead (1) |
|
— |
|
|
— |
|
|
|
11,731 |
|
|
|
11,666 |
|
|
|
Deferred Income Taxes |
|
(643 |
) |
|
— |
|
|
|
(1 |
) |
|
|
3,350 |
|
|
|
Change in Working Capital (1) |
|
(31,426 |
) |
|
22,891 |
|
|
|
(4,402 |
) |
|
|
12,029 |
|
|
|
Cash Flow from Operating Activities (1) |
$ |
(3,174 |
) |
$ |
3,733 |
|
|
$ |
32,387 |
|
|
$ |
70,118 |
|
|
|
Capital Expenditures |
|
(2,909 |
) |
|
(517 |
) |
|
|
(4,983 |
) |
|
|
(2,683 |
) |
|
|
Acquisition of OSW Predecessor |
|
(676,453 |
) |
|
— |
|
|
|
— |
|
|
|
— |
|
|
|
Cash Flow Used in Investing Activities |
|
(679,362 |
) |
|
(517 |
) |
|
|
(4,983 |
) |
|
|
(2,683 |
) |
|
|
Proceeds from the issuance of common shares |
|
122,510 |
|
|
— |
|
|
|
— |
|
|
|
— |
|
|
|
Net proceeds from Haymaker and private placement investors |
|
349,390 |
|
|
— |
|
|
|
— |
|
|
|
— |
|
|
|
Proceeds from the term loan and revolver facilities |
|
245,900 |
|
|
— |
|
|
|
— |
|
|
|
— |
|
|
|
Proceeds from conversion of public warrants into common shares |
|
11 |
|
|
— |
|
|
|
— |
|
|
|
— |
|
|
|
Payment of deferred financing costs |
|
(6,892 |
) |
|
— |
|
|
|
— |
|
|
|
— |
|
|
|
Repayment on term loan and revolver facilities |
|
(18,442 |
) |
|
— |
|
|
|
— |
|
|
|
— |
|
|
|
Proceeds from amounts due from related party |
|
3,187 |
|
|
— |
|
|
|
— |
|
|
|
— |
|
|
|
Net Distributions to Parent and its affiliates (1) |
|
— |
|
|
(4,262 |
) |
|
|
(15,690 |
) |
|
|
(60,893 |
) |
|
|
Distribution to Noncontrolling Interest |
|
(834 |
) |
|
(267 |
) |
|
|
(4,867 |
) |
|
|
(4,606 |
) |
|
|
Cash Flow provided by (used in) Financing Activities (1) |
|
694,830 |
|
|
(4,529 |
) |
|
|
(20,557 |
) |
|
|
(65,499 |
) |
|
|
Effect of Exchange Rates |
|
(205 |
) |
|
649 |
|
|
|
(216 |
) |
|
|
124 |
|
|
|
Net Increase (Decrease) in Cash and Cash Equivalents |
$ |
12,089 |
|
$ |
(664 |
) |
|
$ |
6,631 |
|
|
$ |
2,060 |
|
|
|
(1) |
Allocation of Parent Corporate Overhead was paid by Steiner Leisure on our behalf. The amounts related to the allocation of Parent corporate overhead and costs associated with the purchase of products from related parties and forgiven by Steiner Leisure were considered non-cash contributions and enabled us to make increased cash distributions to Steiner Leisure, which are classified in financing cash outflows. |
Comparison of Results for the Period from March 20, 2019 to December 31, 2019 (Successor), January 1, 2019 to March 19, 2019 (Predecessor) and the Year Ended December 31, 2019 (Predecessor) (audited)
Operating activities. Our net cash (used in) provided by operating activities for the Successor 2019 Period, Predecessor 2019 Period and for the year ended December 31, 2018 were $(3.2) million, $3.7 million and $32.4 million, respectively. In the Successor 2019 Period, the Company incurred stock-based compensation payments of $20.5 million related to stock options to certain directors and executives. In the Predecessor 2019 Period, the Company incurred change of control payments of $26.6 million payable upon consummation of the Business Combination.
Investing activities. Investing activities for the Successor 2019 period, Predecessor 2019 period and for the year ended December 31, 2018 were $679.4 million, $0.5 million and $5.0 million, respectively. In the Successor 2019 Period, cash payments of $676.5 million were made to consummate the Business Combination.
38
Financing activities. Financing activities for the Successor 2019 period, Predecessor 2019 period and for the year ended December 31, 2018 were $694.8 million, $(4.5) million and $(20.6) million, respectively. In the Successor 2019 Period, financing activities of $122.5 million, $349.4 million and $245.9 million, related to proceeds from the issuance of common shares, Haymaker cash contributions, and proceeds related to the term loan and revolver facilities, net of repayments, respectively, were undertaken in connection with the Business Combination.
Comparison of Results for the Years Ended December 31, 2018 (audited) and December 31, 2017 (audited)
Operating activities. Our net cash provided by operating activities decreased $37.7 million to $32.4 million in 2018, from $70.1 million in 2017. This decrease was due primarily to an unfavorable change in operating assets and liabilities, as well as a lower net income. The unfavorable change in operating assets and liabilities was largely driven by a change in the payment terms, the effect of reduced costs under the Supply Agreement and the depletion of existing inventories of products purchased prior to the effectiveness of the Supply Agreement of $9.4 million in 2017. The unfavorable change in net income was primarily due to interest expense of $34.1 million in 2018 related to an internal restructuring, which resulted in debt previously held at the parent level being assigned to us in anticipation of the Business Combination.
Investing activities. Our net cash used by investing activities increased $2.3 million to $5.0 million in 2018, from $2.7 million in 2017. This increase was largely driven by the renovation of a destination resort health and wellness center.
Financing activities. Our net cash used by financing activities decreased $44.9 million to $20.6 million in 2018, from $65.5 million in 2017. This decrease was largely due to a decrease in distributions to Steiner Leisure and its affiliates.
Seasonality
A significant portion of our revenues are generated onboard cruise ships. Certain cruise lines, and, as a result, we have experienced varying degrees of seasonality as the demand for cruises is stronger in the Northern Hemisphere during the summer months and during holidays. Accordingly, the third quarter and holiday periods generally result in the highest revenue yields for us. Further, cruises and destination resorts have been negatively affected by the frequency and intensity of hurricanes. The negative impact of hurricanes in the Northern Hemisphere is highest during peak hurricane season from August to October.
Off-Balance Sheet Arrangements
Other than the operating lease arrangements described below, we have no off-balance sheet arrangements that have or are reasonably likely to have a current or future material effect on our financial condition, changes in financial condition, income or expenses, results of operations, liquidity, capital expenditures or capital resources.
Contractual Obligations
The following table summarizes certain of our obligations as of December 31, 2019 and the estimated timing and effect that such obligations are expected to have on liquidity and cash flows in future periods (in thousands):
|
|
|
Payment due by period |
|
|||||||||||||||||
|
|
|
Total |
|
|
2020 |
|
|
2021-2022 |
|
|
2023-2024 |
|
|
Thereafter |
|
|||||
|
Cruise Line Agreements (1)(3) |
|
$ |
122,216 |
|
|
$ |
122,216 |
|
|
$ |
— |
|
|
$ |
— |
|
|
$ |
— |
|
|
Operating Leases (2)(3) |
|
|
26,518 |
|
|
|
3,581 |
|
|
|
6,041 |
|
|
|
5,046 |
|
|
|
11,850 |
|
|
Total |
|
$ |
148,734 |
|
|
$ |
125,797 |
|
|
$ |
6,041 |
|
|
$ |
5,046 |
|
|
$ |
11,850 |
|
|
(1) |
Cruise Line Agreements. A large portion of our revenues are generated on cruise ships. We have entered into agreements of varying terms with the cruise lines under which services and products are paid for by cruise passengers. These agreements provide for us to pay the cruise line commissions for use of their shipboard facilities, as well as fees for staff shipboard meals and accommodations. These commissions are based on a percentage of revenue, a minimum annual amount, or a combination of both. Some of the minimum commissions are calculated as a flat dollar amount, while others are based upon minimum passenger per diems for passengers actually embarked on each cruise of the respective vessel. Staff shipboard meals and accommodations are charged by the cruise lines on a per staff per day basis. We recognize all expenses related to cruise line commissions, minimum arrears payment, and staff shipboard meals and accommodations, generally, as they are incurred and include such expenses in cost of revenues in the accompanying combined statements of operations. For cruises in process at period end, an accrual is made to record such expenses in a manner that approximates a pro-rata basis. In addition, staff-related expenses such as shipboard employee commissions are recognized in the same manner. |
|
(2) |
Operating Leases. We lease office and warehouse space, as well as office equipment and automobiles, under operating leases. We also make certain payments to the owners of the destination resorts where destination resort health and wellness centers are located. Destination resort health and wellness centers generally require rent based on a percentage of revenues. In addition, as part of the rental arrangements for some of the destination resort health and wellness centers, we are required to pay a minimum annual rental regardless of whether such amount would be required to be paid under the percentage rent arrangement. Substantially all of these arrangements include renewal options ranging from three to five years. Rental expense incurred under operating leases for the years ended December 31, 2019, 2018 and 2017 were $9.5 million, $9.5 million and $8.8 million, respectively. |
|
(3) |
The amounts presented represent minimum annual commitments under our cruise line agreements and operating lease obligations and do not take into account cancelled voyages. Certain minimum annual commitments, if any, are not currently determinable for fiscal years other than 2020. |
39
Critical Accounting Policies
Our consolidated and combined financial statements have been prepared in accordance with accounting principles generally accepted in the United States (“GAAP”). We have identified the policies outlined below as critical to our business operations and an understanding of our results of operations and that require the most difficult, subjective and complex judgments. This discussion is not intended to be a comprehensive description of all accounting policies. In many cases, the accounting treatment of a particular transaction is specifically dictated by accounting principles generally accepted in the United States, with no need for management’s judgment in their application. The impact on our business operations and any associated risks related to these policies is discussed under results of operations, below, where such policies affect our reported and expected financial results. For a detailed discussion on the application of these and other accounting policies, please see Note 2 in the Notes to the Consolidated and Combined Financial Statements. Note that our preparation of our combined financial statements included in this Annual Report on Form 10-K requires us to make estimates and assumptions that affect the reported amount of assets and liabilities, disclosure of contingent assets and liabilities at the date of our financial statements, and the reported amounts of revenue and expenses during the reporting period. There can be no assurance that actual results will be consistent with those estimates.
General -Predecessor. Our combined financial statements include the accounts of the wholly-owned direct and indirect subsidiaries of Steiner Leisure listed in Note 1 and include the accounts of a company partially owned by OneSpaWorld Medispa (Bahamas) Limited, in which OneSpaWorld (Bahamas) Limited (100% owner of OneSpaWorld Medispa (Bahamas) Limited) has a controlling interest until February 14, 2020, at which time OneSpaWorld acquired full ownership of such company. The combined financial statements also include the accounts and results of operations associated with the timetospa.com website, owned by Elemis USA, Inc. until March 1, 2019. Our combined financial statements do not represent the financial position and results of operations of a legal entity but rather a combination of entities under our common control that have been “carved out” of Steiner Leisure’s consolidated financial statements and reflect significant assumptions and allocations. All significant intercompany transactions and balances have been eliminated in combination.
Our combined financial statements include the assets, liabilities, revenues and expenses specifically related to our operations. We receive services and support from various functions performed by Steiner Leisure and costs associated with these functions have been allocated to us. These allocations are necessary to reflect all of the costs of doing business and include costs related to certain Steiner Leisure corporate functions, including, but not limited to, senior management, legal, human resources, finance, IT and other shared services that have been allocated to us based on direct usage or benefit where identifiable, with the remainder allocated on a pro rata basis determined by an estimate of the percentage of time Steiner Leisure employees devoted to us, as compared to total time available or by the headcount of employees at Steiner Leisure’s corporate headquarters that are fully dedicated to our entities in relation to the total employee headcount. These allocated costs are reflected in salary and payroll taxes and administrative expenses in the combined statements of operations.
Management considers these allocations to be a reasonable reflection of the utilization of services by, or benefit provided to, us. However, the allocations may not be indicative of the actual expenses that would have been incurred had we operated as an independent, stand-alone entity.
We believe the assumptions and allocations underlying the accompanying consolidated and combined financial statements and notes to the combined financial statements are reasonable, appropriate and consistently applied for the periods presented. We believe the combined financial statements reflect all costs of doing business.
Cost of Revenues
Cost of revenues includes:
|
|
• |
Cost of services. Cost of services consists primarily of the cost of product consumed in the rendering of a service, an allocable portion of wages paid to shipboard employees, an allocable portion of payments to cruise lines (which are derived as a percentage of service revenues or a minimum annual rent or a combination of both), an allocable portion of staff-related shipboard expenses, costs related to recruitment and training of shipboard employees, wages paid directly to destination resort employees, payments to destination resort venue owners, and health and wellness facility depreciation. |
|
|
• |
Cost of products. Cost of products consists primarily of the cost of products sold through our various methods of distribution, an allocable portion of wages paid to shipboard employees, an allocable portion of payments to cruise lines and destination resort partners (which are derived as a percentage of product revenues or a minimum annual rent or a combination of both). |
40
Cost of revenues may be affected by, among other things, sales mix, production levels, exchange rates, changes in supplier prices and discounts, purchasing and manufacturing efficiencies, tariffs, duties, freight and inventory costs and increases in fuel costs. Certain cruise line and destination resort health and wellness center agreements provide for increases in the percentages of services and products revenues and/or, as the case may be, the amount of minimum annual payments over the terms of those agreements. These payments may also be increased under new agreements with cruise lines and destination resort health and wellness center owners that replace expiring agreements.
Cost of products includes the cost of products sold through various methods of distribution.
Operating expenses include administrative expenses, salaries, and payroll taxes. In addition, operating expenses include amortization of certain intangibles relating to acquisitions.
Revenue Recognition. We recognize revenues when customers obtain control of goods and services promised by the Company. The amount of revenue recognized is based on the amount that reflects the consideration that is expected to be received in exchange for those respective goods and services. Amounts recognized are gross of commissions to cruise line or destination resort partners, which typically withhold commissions from customer payments. We have elected to present sales taxes on a net basis and, as such, sales taxes are excluded from revenue. Revenue is reported net of discounts and net of any estimated refund liability, which is determined based on historical experience. We also issue gift cards for future goods or services; revenue is recognized when they are redeemed; we also recognize revenue for breakage based on past experience for gift card amounts we expect to go unredeemed.
Prior to adoption of ASC Topic 606, as discussed in Revenue Recognition section within Adoption of Accounting Pronouncements in Note 2. Summary of Significant accounting policies to our combined and consolidated financial statements, we recognized revenues earned as services are provided and as products are sold, following legacy accounting guidance under ASC Topic 605. Generally, this led to recognition that is consistent with our new policy. Under legacy guidance, we had also elected to recognize revenue on a net-of-tax basis, which is similar to our election under ASC Topic 606. For gift card breakage, the Company uses the redemption recognition method for recognizing breakage related to certain gift certificates for which it has sufficient historical information; this pattern is relatively consistent with our recognition pattern under ASC Topic 606.
Share-Based Compensation. We recognize expense for our share-based compensation awards using a fair-value-based method. Share-based compensation expense is recognized over the requisite service period for awards that are based on a service period and not contingent upon any future performance.
Income Taxes. Our U.S. entities, other than those that are domiciled in U.S. territories, file their U.S. tax return as part of a consolidated tax filing group, while our entities that are domiciled in U.S. territories file specific returns. In addition, our foreign entities file income tax returns in their respective countries of incorporation, where required. For the purposes of our combined financial statements included in this Annual Report on Form 10-K, we account for income taxes under the separate return method of accounting. This method requires the allocation of current and deferred taxes to us as if it were a separate taxpayer. Under this method, the resulting portion of current income taxes payable that is not actually owed to the tax authorities is written-off through equity.
Taxes payable in the consolidated and combined balance sheets, as of December 31, 2019 and 2018 reflects current income tax amounts actually owed to the tax authorities, as of those dates, as well as the accrual for uncertain tax positions. The write-off of current income taxes payable not actually owed to the tax authorities is included in net Parent investment in the accompanying combined balance sheet as of December 31, 2018. Deferred income taxes are recognized based upon the tax consequences of “temporary differences” by applying enacted statutory rates applicable to future years to differences between the financial statement carrying amounts and the tax bases of existing assets and liabilities. Deferred income tax provisions and benefits are based on the changes to the asset or liability from period to period. A valuation allowance is provided on deferred tax assets if it is determined that it is more likely than not that the deferred tax assets will not be realized. The majority of our income is generated outside of the United States.
We believe a large percentage of our shipboard service income is foreign-source income, not effectively connected to a business we conduct in the United States and, therefore, not subject to U.S. income taxation.
We recognize interest and penalties within the provision for income taxes in the combined statements of income. To the extent interest and penalties are not assessed with respect to uncertain tax positions, amounts accrued will be reduced and reflected as a reduction of the overall income tax provision.
We recognize liabilities for uncertain tax positions based on a two-step process. The first step is to evaluate the tax position for recognition by determining if the weight of available evidence indicates it is more likely than not that the position will be sustained on audit, including resolution of related appeals or litigation processes, if any. The second step is to measure the tax benefit as the largest amount of benefit, determined on a cumulative probability basis, which is more than 50% likely of being realized upon ultimate settlement.
41
Business Combination. We are required to recognize the assets acquired, liabilities assumed, contractual contingencies, noncontrolling interests and contingent consideration at their fair value as of the acquisition date. The purchase price allocation process requires management to make significant estimates and assumptions with respect to intangible assets, all of which ultimately affect the fair value of goodwill established as of the acquisition date. Goodwill acquired in business combinations is assigned to the reporting unit(s) expected to benefit from the combination as of the acquisition date and is then subsequently tested for impairment at least annually.
Goodwill and Indefinite-Lived Intangible Assets. Goodwill represents the excess of cost over the fair value of net tangible and identifiable intangible assets acquired. The Company has two operating segments: (1) Maritime and (2) Destination Resorts. The Maritime and Destination Resorts operating segments each have associated goodwill, and each has been determined to be a reporting unit.
Goodwill and other intangible assets with indefinite useful lives are not amortized, but rather, are tested for impairment at least annually. We review goodwill for impairment at the reporting unit level annually or, when events or circumstances dictate, more frequently. The impairment review for goodwill consists of a qualitative assessment of whether it is more-likely-than-not that a reporting unit’s fair value is less than its carrying amount, and if necessary, a two-step goodwill impairment test. Factors to consider when performing the qualitative assessment primarily include general economic conditions and changes in forecasted operating results. If the qualitative assessment demonstrates that it is more-likely-than-not that the estimated fair value of the reporting unit exceeds its carrying value, it is not necessary to perform the two-step goodwill impairment test. We may elect to bypass the qualitative assessment and proceed directly to step one, for any reporting unit, in any period. The Company can resume the qualitative assessment for any reporting unit in any subsequent period. When performing the two-step goodwill impairment test, the fair value of the reporting unit is determined and compared to the carrying value of the net assets allocated to the reporting unit. If the fair value of the reporting unit exceeds its carrying value, no further analysis or write-down of goodwill is required. If the fair value of the reporting unit is less than the carrying value of its net assets, the implied fair value of the reporting unit is allocated to all its underlying assets and liabilities, including both recognized and unrecognized tangible and intangible assets, based on their fair value. If necessary, goodwill is then written down to its implied fair value.
Long-Lived Assets. We review long-lived assets for impairment whenever events or changes in circumstances indicate, based on estimated future cash flows, that the carrying amount of these assets may not be fully recoverable. Recoverability of assets to be held and used is measured by a comparison of the carrying amount of an asset (asset group) to future undiscounted cash flows expected to be generated by the asset (asset group). An asset group is the lowest level of assets and liabilities for which identifiable cash flows are largely independent of the cash flows of other assets and liabilities. When estimating future cash flows, the Company considers:
|
|
• |
only the future cash flows that are directly associated with and that are expected to arise as a direct result of the use and eventual disposition of the asset group; |
|
|
• |
potential events and changes in circumstance affecting key estimates and assumptions; and |
|
|
• |
the existing service potential of the asset (asset group) at the date tested. |
If an asset (asset group) is considered to be impaired, the impairment to be recognized is measured by the amount by which the carrying amount of the asset (asset group) exceeds our fair value. When determining the fair value of the asset (asset group), we consider the highest and best use of the assets from a market-participant perspective. The fair value measurement is generally determined through the use of independent third-party appraisals or an expected present value technique, both of which may include a discounted cash flow approach, which reflects assumptions of what market participants would utilize to price the asset (asset group).
Assets to be disposed of are reported at the lower of the carrying amount or fair value less costs to sell. Assets to be abandoned, or from which no further benefit is expected, are written down to zero at the time that the determination is made and the assets are removed entirely from service.
Recently Issued Accounting Pronouncements
With the exception of those discussed below, there have been no recent accounting pronouncements or changes in accounting pronouncements during the year ended December 31, 2019 that are of significance, or potential significance, to us based on our current operations. The following summary of recent accounting pronouncements is not intended to be an exhaustive description of the respective pronouncement.
42
In February 2016, the FASB issued ASU 2016-02, “Leases (Topic 842)” (“ASU 2016-02”) to increase transparency and comparability among organizations by recognizing rights and obligations resulting from leases as lease assets and lease liabilities on the balance sheet and disclosing key information about leasing arrangements. The update requires lessees to recognize for all leases with a term of 12 months or more at the commencement date: (a) a lease liability or a lessee’s obligation to make lease payments arising from a lease, measured on a discounted basis; and (b) a right-of-use asset or a lessee’s right to use or control the use of a specified asset for the lease term. Under the update, lessor accounting remains largely unchanged. The update requires a modified retrospective transition approach for leases existing at or entered into after the beginning of the earliest comparative period presented in the financial statements and do not require any transition accounting for leases that expire before the earliest comparative period presented.
The update is effective retrospectively for annual periods beginning after December 15, 2019, and interim periods beginning after December 15, 2020, with early adoption permitted. We intend to elect the optional transition method, which allows entities to initially apply the standard at the adoption date and recognize a cumulative-effect adjustment to the opening balance of retained earnings in the period of adoption. The Company continues to evaluate the effect that the update will have on the Company’s consolidated financial statement. The Company expects the update will have a material effect on our consolidated balance sheets due to the recognition of operating lease assets and operating lease liabilities primarily related to the destination resort agreements and office space which will result in a balance sheet presentation that is not comparable to the prior period in the first year of adoption. Upon adoption, we expect that there will be no cumulative-effect adjustment of initially applying the guidance to our opening balance of retained earnings. We do not expect this guidance to have a material impact to our consolidated statements of operations, consolidated statements of cash flows and our debt-covenant compliance under our current agreements on an ongoing basis.
In August 2018, the FASB issued ASU No. 2018-15, Intangibles - Goodwill and Other - Internal Use Software (Topic 350-40): Customer’s Accounting for Implementation Costs Incurred in a Cloud Computing Arrangement That Is a Service Contract, which amends ASC 350-40 to address a customer’s accounting for implementation costs incurred in a cloud computing arrangement (CCA) that is a service contract. ASU 2018-15 aligns the accounting for costs incurred to implement a CCA that is a service arrangement with the guidance on capitalizing costs associated with developing or obtaining internal-use software. The standard is effective for fiscal years beginning after December 15, 2019, with early adoption permitted. Entities are permitted to apply either a retrospective or prospective approach to adopt the guidance. We are currently evaluating the impact of the adoption of this update on our consolidated financial position, results of operations, and cash flows.
In June 2016, the FASB issued ASU 2016-13, “Financial Instruments—Credit Losses (Topic 326).” This ASU amends the Board’s guidance on the impairment of financial instruments. The ASU adds to GAAP an impairment model (known as the current expected credit losses model) that is based on an expected losses model rather than an incurred losses model. Under the new guidance, an entity recognizes as an allowance its estimate of expected credit losses. The ASU is also intended to reduce the complexity of GAAP by decreasing the number of impairment models that entities use to account for debt instruments. The update is effective for fiscal years beginning after December 15, 2020. The Company is currently assessing the impact the adoption of this guidance will have on its consolidated financial statements.
In January 2017, the FASB issued ASU 2017-04, “Intangibles – Goodwill and Other (Topic 350): Simplifying the Test for Goodwill Impairment” (“ASU 2017-04”). This ASU simplifies the subsequent measurement of goodwill by eliminating Step 2 from the goodwill impairment test. Previously, in computing the implied fair value of goodwill under Step 2, an entity had to perform procedures to determine the fair value at the impairment testing date of its assets and liabilities following the procedure that would be required in determining the fair value of assets acquired and liabilities assumed in a business combination. Instead, under ASU 2017-04, an entity should perform its annual, or interim, goodwill impairment test by comparing the fair value of a reporting unit with its carrying amount. An entity should recognize an impairment charge for the amount by which the carrying amount exceeds the reporting unit’s fair value; however, the loss recognized should not exceed the total amount of goodwill allocated to the reporting unit. The new guidance is effective for an entity’s annual or any interim goodwill impairment tests in fiscal years beginning after December 15, 2019 and early adoption is permitted for interim or annual goodwill impairment tests performed on testing dates after January 1, 2017. The Company will evaluate, upon adoption of this guidance, the impact of this guidance on the Company’s financial statements.
Inflation and Economic Conditions
We do not believe that inflation has had a material adverse effect on our revenues or results of operations. However, public demand for activities, including cruises, is influenced by general economic conditions, including inflation, global health epidemics/pandemics and customer preferences. Periods of economic softness could have a material adverse effect on the cruise industry and hospitality industry upon which we are dependent. Such a slowdown could adversely affect our results of operations and financial condition. The recent coronavirus outbreak has negatively impacted our results of operations and financial condition during the first quarter of 2020, the full effect of which impact is currently unknown. Recurrence of the more severe aspects of the recent adverse economic conditions, including further escalation of the coronavirus outbreak, as well as periods of fuel price increases, could have a material adverse effect on our results of operations and financial condition during the period of such recurrence. Weakness in the U.S. dollar compared to the U.K. pound sterling and the Euro also could have a material adverse effect on our results of operations and financial condition.
43
U.S. Tax Reform
On December 22, 2017, the U.S. enacted significant changes to tax law following the passage and signing of TCJA. The Company completed the analysis of the tax accounting implications of the TCJA during the year ended December 31, 2018 in accordance with the terms of SEC Staff Bulletin 118. The Company did not record any adjustments in the year ended December 31, 2018 to provisional amounts that were material to our combined financial statements.
ITEM 7A. QUANTITATIVE AND QUALITATIVE DISCLOSURES ABOUT MARKET RISK
Our future income, cash flows and fair values relevant to financial instruments are dependent upon prevalent market interest rates. Market risk refers to the risk of loss from adverse changes in market prices and interest rates.
Concentration of credit risk. Financial instruments that potentially subject us to significant concentrations of credit risk consist principally of cash and cash equivalents and accounts receivable. We maintain cash and cash equivalents with high quality financial institutions. As of December 31, 2019, 2018 and 2017, we had three cruise companies that represented greater than 10% of accounts receivable. We do not normally require collateral or other security to support normal credit sales. We control credit risk through credit approvals, credit limits, and monitoring procedures.
Accounts receivable are stated at amounts due from customers, net of an allowance for doubtful accounts. We record an allowance for doubtful accounts with respect to accounts receivable using historical collection experience, and generally, an account receivable balance is written off once it is determined to be uncollectible. We review the historical collection experience and consider other facts and circumstances and adjust the calculation to record an allowance for doubtful accounts as appropriate. If our current collection trends were to differ significantly from historic collection experience, we would make a corresponding adjustment to the allowance. As of December 31, 2019 and 2018, the allowance for doubtful accounts was $0.01 million and $0.5 million, respectively. Bad debt expense is included within administrative operating expenses in the consolidated and combined statements of operations and is immaterial for the period from March 20, 2019 to December 31, 2019 (Successor), period from January 1, 2019 to March 19, 2019 (Predecessor) and years ended December 31, 2018 and 2017.
Interest rate risk. We are subject to interest rate risk in connection with borrowing based on a variable interest rate. Derivative financial instruments, such as interest rate swap agreements and interest rate cap agreements, may be used for the purpose of managing fluctuating interest rate exposures that exist from our variable rate debt obligations that are expected to remain outstanding. Interest rate changes do not affect the market value of such debt, but could impact the amount of our interest payments, and accordingly, our future earnings and cash flows, assuming other factors are held constant.
Our policy is to manage interest rate risk through the use of a combination of fixed and floating rate debt and interest rate derivatives based upon market conditions. Our objective in managing the exposure to interest rate changes is to limit the impact of interest rate changes on earnings and cash flows and to lower our overall borrowing costs. To achieve these objectives, we have used interest rate swaps to manage net exposure to interest rate changes to our borrowings. These swaps are typically entered into with a group of financial institutions with investment grade credit ratings, thereby reducing the risk of credit loss. A hypothetical 10% change in our interest rate would change our results of operations by approximately $0.8 million.
Foreign currency risk. The fluctuation in currency exchange rates is not a significant risk for us, as most of our revenues are earned and expenses are incurred in U.S. Dollars.
While our revenues and expenses are primarily represented by U.S. Dollars, they also are represented by various other currencies, primarily the U.K. Pound Sterling and the Euro. Accordingly, we face the risk of fluctuations in non-U.S. currencies compared to U.S. Dollars. We manage this currency risk by monitoring fluctuations in foreign currencies and, when exchange rates are appropriate, purchasing amounts of those foreign currencies. We have mitigated the risk relating to fluctuations in the U.K. Pound Sterling and the Euro through the structuring of intercompany debt. If such mitigation proves ineffective, a hypothetical 10% change in the aggregate exchange rate exposure of the U.K. Pound Sterling and the Euro to the U.S. Dollar as of December 31, 2018 would change our results of operations by approximately $0.5 million.
44
ITEM 8. FINANCIAL STATEMENTS AND SUPPLEMENTARY DATA
Our Consolidated and Combined Financial Statements and the Notes thereto, together with the report thereon of Ernst & Young LLP dated March 30, 2020 are filed as part of this report, beginning on page F-l.
ITEM 9. CHANGES IN AND DISAGREEMENTS WITH ACCOUNTANTS ON ACCOUNTING AND FINANCIAL DISCLOSURE
None.
ITEM 9A. CONTROLS AND PROCEDURES
Disclosure Controls and Procedures
We maintain disclosure controls and procedures designed to ensure that information required to be disclosed in reports we file with the SEC is recorded, processed, summarized and reported within applicable time periods. We carried out an evaluation, under the supervision, and with the participation, of, our management, including our chief executive officer and chief financial officer, of the effectiveness of our disclosure controls and procedures (as that term is defined in Rules 13a-15(e) and 15d-15(e) of the Exchange Act) as of the end of the period covered by this report. Based upon that evaluation, our principal executive officer and principal financial officer concluded that our disclosure controls and procedures were effective as of December 31, 2019 and provided reasonable assurance that information required to be disclosed in our periodic SEC filings is recorded, processed, summarized and reported within the time periods specified in the SEC’s rules, and that such information is accumulated and communicated to our management, including our chief executive officer and chief financial officer, as appropriate, to allow timely decisions regarding such required disclosure.
Management’s Annual Report on Internal Control Over Financial Reporting
Our management is responsible for establishing and maintaining adequate internal control over financial reporting, as such term is defined in Exchange Act Rule 13a-15(f). Management, with the participation of our chief executive officer and chief financial officer, conducted an evaluation of the effectiveness of our internal control over financial reporting based on the framework in Internal Control - Integrated Framework (2013) issued by the Committee of Sponsoring Organizations of the Treadway Commission. Based on this evaluation, our management concluded that our internal control over financial reporting was effective as of December 31, 2019. There have not been any changes in our internal control over financial reporting during our most recent fiscal quarter that have materially affected or are reasonably likely to materially affect our internal control over financial reporting. Our management’s report was not subject to attestation by the Company’s independent registered public accounting firm pursuant to rules of the SEC that permit the Company to provide only management’s report in this annual report.
None.
ITEM 10. DIRECTORS, EXECUTIVE OFFICERS AND CORPORATE GOVERNANCE
Information required by this Item 10 is contained under the caption “Corporate Governance” in our Proxy Statement for our 2020 Annual Meeting of Shareholders to be filed with the SEC within 120 days of the year ended December 31, 2019 (the 2020 Proxy Statement) and is incorporated herein by reference.
ITEM 11. EXECUTIVE COMPENSATION
Information required by this Item 11 is contained under the captions “Compensation of Directors and Executive Officers” and “Corporate Governance” in the 2020 Proxy Statement and is incorporated herein by reference.
ITEM 12. SECURITY OWNERSHIP OF CERTAIN BENEFICIAL OWNERS AND MANAGEMENT AND RELATED SHAREHOLDER MATTERS
Information required by this Item 12 is contained under the caption “Stock Ownership of Certain Beneficial Owners and Management” in the 2020 Proxy Statement and is incorporated herein by reference.
45
ITEM 13. CERTAIN RELATIONSHIPS AND RELATED TRANSACTIONS, AND DIRECTOR INDEPENDENCE
Information required by this Item 13 is contained under the caption “Corporate Governance” in the 2020 Proxy Statement and is incorporated herein by reference.
ITEM 14. PRINCIPAL ACCOUNTING FEES AND SERVICES
Information required by this Item 14 is contained under the caption “Proposals to be Voted On —Proposal 2: Ratification of Independent Registered Public Accounting Firm” in the 2020 Proxy Statement and is incorporated herein by reference.
46
ITEM 15. EXHIBITS, FINANCIAL STATEMENT SCHEDULES
(a) (1) Financial Statements
The following report and Consolidated and Combined Financial Statements are filed as part of this report beginning on page F-l, pursuant to Item 8.
Audited Consolidated and Combined Financial Statements for OneSpaWorld Limited and Subsidiaries
Report of Independent Registered Public Accounting Firm
Consolidated and Combined Balance Sheets as of December 31, 2019 and 2018
Consolidated and Combined Statements of Operations for the years ended December 31, 2019, 2018 and 2017
Consolidated and Combined Statements of Comprehensive Income (Loss) for the years ended December 31, 2019, 2018 and 2017
Consolidated and Combined Statements of Equity (Deficit) for the years ended December 31, 2019, 2018 and 2017
Consolidated and Combined Statements of Cash Flows for the years ended December 31, 2019, 2018 and 2017
Notes to Consolidated and Combined Financial Statements
(2) Financial Statement Schedules
Financial statement schedules have been omitted since they are either not required, not applicable or the information is otherwise included.
(3) Exhibit Listing
Please see list of the exhibits at 15(b), below.
(b) The following is a list of all exhibits filed as a part of this report.
47
|
Document Exhibit Number |
|
Exhibit Description |
|
|
|
|
|
2.1 |
|
|
|
|
|
|
|
3.1 |
|
|
|
4.1* |
|
|
|
|
|
|
|
10.1 |
|
|
|
|
|
|
|
10.2 |
|
|
|
|
|
|
|
10.3 |
|
|
|
|
|
|
|
10.4 |
|
|
|
|
|
|
|
10.5 |
|
|
|
|
|
|
|
10.6† |
|
|
|
|
|
|
|
10.7 |
|
|
|
|
|
|
|
10.8 |
|
|
|
|
|
|
|
10.9 |
|
|
|
|
|
|
|
10.10 |
|
|
|
|
|
|
|
10.11† |
|
|
|
|
|
|
|
10.12† |
|
|
|
|
|
|
|
10.13† |
|
|
|
|
|
|
48
|
Document Exhibit Number |
|
Exhibit Description |
|
|
|
|
|
21.1* |
|
|
|
|
|
|
|
23.1* |
|
|
|
|
|
|
|
31.1* |
|
|
|
|
|
|
|
31.2* |
|
|
|
|
|
|
|
32.1* |
|
|
|
|
|
|
|
32.2* |
|
|
* |
Filed herewith. |
|
† |
Indicates a management contract or compensatory plan. |
49
Pursuant to the requirements of Section 13 or 15(d) of the Securities Exchange Act of 1934, the registrant has duly caused this report to be signed on its behalf by the undersigned, thereunto duly authorized.
|
|
|
|
||
|
ONESPAWORLD HOLDINGS LIMITED |
||||
|
|
|
|||
|
By: |
|
/s/ Stephen B. Lazarus |
||
|
|
|
Name: Stephen B. Lazarus |
||
|
|
|
Title: Chief Operating Officer and Chief Financial Officer |
||
|
Date: |
|
March 30, 2020 |
||
Pursuant to the requirements of the Securities Exchange Act of 1934, this report has been signed below by the following persons on behalf of the registrant and in the capacities and on the dates indicated.
|
|
|
|
|
|
|
|
Name |
|
Position |
|
Date |
|
|
|
|
|
|
|
|
|
/s/ Glenn J. Fusfield Glenn J. Fusfield |
|
President, Chief Executive Officer and Director (Principal Executive Officer) |
|
March 30, 2020 |
|
|
|
|
|
|
|
|
|
/s/ Stephen B. Lazarus Stephen B. Lazarus |
|
Chief Operating Officer and Chief Financial Officer (Principal Financial and Accounting Officer) |
|
March 30, 2020 |
|
|
|
|
|
|
|
|
|
/s/ Leonard Fluxman Leonard Fluxman |
|
Executive Chairman |
|
March 30, 2020 |
|
|
|
|
|
|
|
|
|
/s/ Steven J. Heyer Steven J. Heyer |
|
Lead Director |
|
March 30, 2020 |
|
|
|
|
|
|
|
|
|
/s/ Marc Magliacano Marc Magliacano |
|
Director |
|
March 30, 2020 |
|
|
|
|
|
|
|
|
|
/s/ Andrew R. Heyer Andrew R. Heyer |
|
Director |
|
March 30, 2020 |
|
|
|
|
|
|
|
|
|
/s/ Walter F. McLallen Walter F. McLallen |
|
Director |
|
March 30, 2020 |
|
|
|
|
|
|
|
|
|
/s/ Jeffrey E. Stiefler Jeffrey E. Stiefler |
|
Director |
|
March 30, 2020 |
|
|
|
|
|
|
|
|
|
/s/ Michael J. Dolan Michael J. Dolan |
|
Director |
|
March 30, 2020 |
|
|
|
|
|
|
|
|
|
/s/ Stephen W. Powell Stephen W. Powell |
|
Director |
|
March 30, 2020 |
|
|
|
|
|
|
|
|
|
/s/ Maryam Banikarim Maryam Banikarim |
|
Director |
|
March 30, 2020 |
|
50
Index to Consolidated and Combined Financial Statements
|
|
Page Number |
|
|
|
|
Audited Consolidated and Combined Financial Statements for OneSpaWorld Holdings Limited and Subsidiaries |
|
|
F-2 |
|
|
F-3 |
|
|
F-4 |
|
|
Consolidated and Combined Statements of Comprehensive Income (Loss) |
F-5 |
|
F-6 |
|
|
F-7 |
|
|
F-9 |
Report of Independent Registered Public Accounting Firm
To the Shareholders and Board of Directors of OneSpaWorld Holdings Limited
Opinion on the Financial Statements
We have audited the accompanying consolidated and combined balance sheets of OneSpaWorld Holdings Limited and subsidiaries (the Company) as of December 31, 2019 (Successor) and 2018 (Predecessor), the related consolidated and combined statements of operations, comprehensive income (loss), equity (deficit) and cash flows for the period from March 20, 2019 through December 31, 2019 (Successor) and the period from January 1, 2019 through March 19, 2019 (Predecessor), and for each of the two years in the period ended December 31, 2018 (Predecessor), and the related notes (collectively referred to as the “consolidated and combined financial statements”). In our opinion, the consolidated and combined financial statements present fairly, in all material respects, the financial position of the Company at December 31, 2019 (Successor) and 2018 (Predecessor), and the results of its operations and its cash flows for the period from March 20, 2019 through December 31, 2019 (Successor) and the period from January 1, 2019 through March 19, 2019 (Predecessor), and for each of the two years in the period ended December 31, 2018 (Predecessor), in conformity with U.S. generally accepted accounting principles.
Basis for Opinion
These financial statements are the responsibility of the Company’s management. Our responsibility is to express an opinion on the Company’s financial statements based on our audits. We are a public accounting firm registered with the Public Company Accounting Oversight Board (United States) (PCAOB) and are required to be independent with respect to the Company in accordance with the U.S. federal securities laws and the applicable rules and regulations of the Securities and Exchange Commission and the PCAOB.
We conducted our audits in accordance with the standards of the PCAOB. Those standards require that we plan and perform the audit to obtain reasonable assurance about whether the financial statements are free of material misstatement, whether due to error or fraud. The Company is not required to have, nor were we engaged to perform, an audit of its internal control over financial reporting. As part of our audits we are required to obtain an understanding of internal control over financial reporting but not for the purpose of expressing an opinion on the effectiveness of the Company’s internal control over financial reporting. Accordingly, we express no such opinion.
Our audits included performing procedures to assess the risks of material misstatement of the financial statements, whether due to error or fraud, and performing procedures that respond to those risks. Such procedures included examining, on a test basis, evidence regarding the amounts and disclosures in the financial statements. Our audits also included evaluating the accounting principles used and significant estimates made by management, as well as evaluating the overall presentation of the financial statements. We believe that our audits provide a reasonable basis for our opinion.
|
/s/ Ernst & Young LLP |
|
|
|
We have served as the Company’s auditor since 2018. |
|
|
|
Miami, Florida |
|
March 30, 2020 |
F-2
ONESPAWORLD HOLDINGS LIMITED AND SUBSIDIARIES
CONSOLIDATED AND COMBINED BALANCE SHEETS
(in thousands, except share and per share data)
|
|
|
As of December 31, |
|
||||||
|
|
|
2019 |
|
|
|
2018 |
|
||
|
|
|
Successor |
|
|
|
Predecessor |
|
||
|
ASSETS |
|
Consolidated |
|
|
|
Combined |
|
||
|
CURRENT ASSETS: |
|
|
|
|
|
|
|
|
|
|
Cash and cash equivalents |
|
$ |
13,863 |
|
|
|
$ |
15,302 |
|
|
Accounts receivable, net |
|
|
30,513 |
|
|
|
|
25,352 |
|
|
Inventories |
|
|
36,066 |
|
|
|
|
32,265 |
|
|
Prepaid expenses |
|
|
7,655 |
|
|
|
|
6,617 |
|
|
Other current assets |
|
|
2,565 |
|
|
|
|
1,424 |
|
|
Total current assets |
|
|
90,662 |
|
|
|
|
80,960 |
|
|
Property and equipment, net |
|
|
22,741 |
|
|
|
|
16,239 |
|
|
Intangible assets, net |
|
|
616,637 |
|
|
|
|
131,517 |
|
|
Goodwill |
|
|
190,077 |
|
|
|
|
33,864 |
|
|
OTHER ASSETS: |
|
|
|
|
|
|
|
|
|
|
Deferred tax assets |
|
|
2,046 |
|
|
|
|
4,265 |
|
|
Other non-current assets |
|
|
1,506 |
|
|
|
|
5,814 |
|
|
Total other assets |
|
|
3,552 |
|
|
|
|
10,079 |
|
|
Total assets |
|
$ |
923,669 |
|
|
|
$ |
272,659 |
|
|
LIABILITIES AND EQUITY (DEFICIT) |
|
|
|
|
|
|
|
|
|
|
LIABILITIES: |
|
|
|
|
|
|
|
|
|
|
Accounts payable |
|
$ |
23,437 |
|
|
|
$ |
7,595 |
|
|
Accounts payable—related parties |
|
|
— |
|
|
|
|
6,553 |
|
|
Accrued expenses |
|
|
23,575 |
|
|
|
|
27,211 |
|
|
Income taxes payable |
|
|
897 |
|
|
|
|
670 |
|
|
Other current liabilities |
|
|
3,501 |
|
|
|
|
1,210 |
|
|
Total current liabilities |
|
|
51,410 |
|
|
|
|
43,239 |
|
|
Deferred rent |
|
|
160 |
|
|
|
|
645 |
|
|
Income tax contingency |
|
|
3,949 |
|
|
|
|
3,918 |
|
|
Deferred tax liability |
|
|
375 |
|
|
|
|
— |
|
|
Long-term debt, net |
|
|
221,407 |
|
|
|
|
352,440 |
|
|
Total liabilities |
|
|
277,301 |
|
|
|
|
400,242 |
|
|
Commitments (Note 13) |
|
|
|
|
|
|
|
|
|
|
EQUITY (DEFICIT): |
|
|
|
|
|
|
|
|
|
|
Common stock, $0.0001 par value; 250,000,000 shares authorized; 61,119,398 issued and outstanding at December 31, 2019 |
|
|
6 |
|
|
|
|
— |
|
|
Additional paid-in capital |
|
|
653,088 |
|
|
|
|
— |
|
|
Accumulated deficit |
|
|
(15,569 |
) |
|
|
|
— |
|
|
Net Parent investment |
|
|
— |
|
|
|
|
(130,520 |
) |
|
Accumulated other comprehensive income (loss) |
|
|
719 |
|
|
|
|
(649 |
) |
|
Total OneSpaWorld stockholders' equity and Parent's (deficit), respectively |
|
|
638,244 |
|
|
|
|
(131,169 |
) |
|
Noncontrolling interest |
|
|
8,124 |
|
|
|
|
3,586 |
|
|
Total (deficit) equity |
|
|
646,368 |
|
|
|
|
(127,583 |
) |
|
Total liabilities and (deficit) equity |
|
$ |
923,669 |
|
|
|
$ |
272,659 |
|
|
|
|
|
|
|
|
|
|
|
|
The accompanying notes are an integral part of the consolidated and combined financial statements.
F-3
ONESPAWORLD HOLDINGS LIMITED AND SUBSIDIARIES
CONSOLIDATED AND COMBIINED STATEMENTS OF OPERATIONS
(in thousands, except share and per share data)
|
|
Successor |
|
|
|
Predecessor |
|
||||||||
|
|
Consolidated |
|
|
|
Combined |
|
||||||||
|
|
|
|
|
|
|
|
|
|
Year Ended December 31, |
|
||||
|
|
March 20, 2019 to December 31, 2019 |
|
|
|
January 1, 2019 to March 19, 2019 |
|
2018 |
|
2017 |
|
||||
|
REVENUES |
|
|
|
|
|
|
|
|
|
|
|
|
|
|
|
Service revenues |
$ |
339,793 |
|
|
|
$ |
91,280 |
|
$ |
410,927 |
|
$ |
383,686 |
|
|
Product revenues |
|
103,988 |
|
|
|
|
27,172 |
|
|
129,851 |
|
|
122,999 |
|
|
Total revenues |
|
443,781 |
|
|
|
|
118,452 |
|
|
540,778 |
|
|
506,685 |
|
|
COST OF REVENUES AND OPERATING EXPENSES |
|
|
|
|
|
|
|
|
|
|
|
|
|
|
|
Cost of services |
|
292,844 |
|
|
|
|
76,836 |
|
|
352,382 |
|
|
332,360 |
|
|
Cost of products |
|
90,353 |
|
|
|
|
23,957 |
|
|
110,793 |
|
|
107,990 |
|
|
Administrative |
|
13,986 |
|
|
|
|
2,498 |
|
|
9,937 |
|
|
9,222 |
|
|
Salary and payroll taxes |
|
32,300 |
|
|
|
|
29,349 |
|
|
15,624 |
|
|
15,294 |
|
|
Amortization of intangible assets |
|
13,174 |
|
|
|
|
755 |
|
|
3,521 |
|
|
3,521 |
|
|
Total cost of revenues and operating expenses |
|
442,657 |
|
|
|
|
133,395 |
|
|
492,257 |
|
|
468,387 |
|
|
Income (loss) from operations |
|
1,124 |
|
|
|
|
(14,943 |
) |
|
48,521 |
|
|
38,298 |
|
|
OTHER (EXPENSE) INCOME, NET |
|
|
|
|
|
|
|
|
|
|
|
|
|
|
|
Interest expense |
|
(13,522 |
) |
|
|
|
(6,316 |
) |
|
(34,099 |
) |
|
— |
|
|
Loss on extinguishment of debt |
|
— |
|
|
|
|
(3,413 |
) |
|
— |
|
|
— |
|
|
Interest income |
|
43 |
|
|
|
|
— |
|
|
238 |
|
|
408 |
|
|
Other income (expense) |
|
— |
|
|
|
|
— |
|
|
171 |
|
|
(217 |
) |
|
Total other (expense) income, net |
|
(13,479 |
) |
|
|
|
(9,729 |
) |
|
(33,690 |
) |
|
191 |
|
|
(Loss) income before income tax (benefit) expense |
|
(12,355 |
) |
|
|
|
(24,672 |
) |
|
14,831 |
|
|
38,489 |
|
|
INCOME TAX (BENEFIT)EXPENSE |
|
(120 |
) |
|
|
|
109 |
|
|
1,088 |
|
|
5,263 |
|
|
NET (LOSS) INCOME |
|
(12,235 |
) |
|
|
|
(24,781 |
) |
|
13,743 |
|
|
33,226 |
|
|
Net income attributable to noncontrolling interest |
|
3,334 |
|
|
|
|
678 |
|
|
3,857 |
|
|
2,109 |
|
|
NET (LOSS) INCOME ATTRIBUTABLE TO COMMON SHAREHOLDERS AND PARENT, RESPECTIVELY |
$ |
(15,569 |
) |
|
|
$ |
(25,459 |
) |
$ |
9,886 |
|
$ |
31,117 |
|
|
LOSS PER SHARE |
|
|
|
|
|
|
|
|
|
|
|
|
|
|
|
Basic |
$ |
(0.25 |
) |
|
|
|
|
|
|
|
|
|
|
|
|
Diluted |
$ |
(0.25 |
) |
|
|
|
|
|
|
|
|
|
|
|
|
WEIGHTED-AVERAGE SHARES OUTSTANDING |
|
|
|
|
|
|
|
|
|
|
|
|
|
|
|
Basic |
$ |
61,118,387 |
|
|
|
|
|
|
|
|
|
|
|
|
|
Diluted |
$ |
61,118,387 |
|
|
|
|
|
|
|
|
|
|
|
|
|
|
|
|
|
|
|
|
|
|
|
|
|
|
|
|
|
|
|
|
|
|
|
|
|
|
|
|
|
|
|
|
The accompanying notes are an integral part of the consolidated and combined financial statements.
F-4
ONESPAWORLD HOLDINGS LIMITED AND SUBSIDIARIES
CONSOLIDATED AND COMBINED STATEMENTS OF COMPREHENSIVE INCOME (LOSS)
(in thousands)
|
|
Successor |
|
|
|
Predecessor |
|
|||||||||
|
|
Consolidated |
|
|
|
Combined |
|
|||||||||
|
|
|
|
|
|
|
|
|
|
|
Year Ended December 31, |
|
||||
|
|
March 20, 2019 to December 31, 2019 |
|
|
|
January 1, 2019 to March 19, 2019 |
|
|
2018 |
|
2017 |
|
||||
|
Net (loss) income |
$ |
(12,235 |
) |
|
|
$ |
(24,781 |
) |
|
$ |
13,743 |
|
$ |
33,226 |
|
|
Other comprehensive income (loss), net of tax: |
|
|
|
|
|
|
|
|
|
|
|
|
|
|
|
|
Foreign currency translation (loss) gain |
|
(183 |
) |
|
|
|
(165 |
) |
|
|
(293 |
) |
|
369 |
|
|
Cash Flows hedges: |
|
|
|
|
|
|
|
|
|
|
|
|
|
|
|
|
Net unrealized gain on derivative |
|
1,109 |
|
|
|
|
— |
|
|
|
— |
|
|
— |
|
|
Amount realized and reclassified into earnings |
|
(207 |
) |
|
|
|
— |
|
|
|
— |
|
|
— |
|
|
Total other comprehensive (loss) income, net of tax |
|
719 |
|
|
|
|
(165 |
) |
|
|
(293 |
) |
|
369 |
|
|
Comprehensive (loss) income |
|
(11,516 |
) |
|
|
|
(24,946 |
) |
|
|
13,450 |
|
|
33,595 |
|
|
Comprehensive income attributable to noncontrolling interest |
|
3,334 |
|
|
|
|
678 |
|
|
|
3,857 |
|
|
2,109 |
|
|
Comprehensive (loss) income attributable to common Shareholders and Parent, respectively |
$ |
(14,850 |
) |
|
|
$ |
(25,624 |
) |
|
$ |
9,593 |
|
$ |
31,486 |
|
The accompanying notes are an integral part of the consolidated and combined financial statements.
F-5
ONESPAWORLD HOLDINGS LIMITED AND SUBSIDIARIES
CONSOLIDATED AND COMBINED STATEMENTS OF EQUITY (DEFICIT)
(in thousands, except share data)
|
|
|
|
|
|
|
|
|
|
|
|
|
|
|
|
|
|
|
|
|
|
|
|
|
|
|
|||||||
|
|
Combined |
|
|||||||||||||
|
|
|
|
|
|
|
|
|
|
|
|
|
|
|
|
|
|
Predecessor: |
Net Parent Investment |
|
Accumulated Other Comprehensive Loss |
|
Total Parent's Equity (Deficit) |
|
Non-Controlling Interest |
|
Total |
|
|||||
|
|
|
|
|
|
|
|
|
|
|
|
|
|
|
|
|
|
BALANCE, December 31, 2016 |
$ |
238,496 |
|
$ |
(725 |
) |
$ |
237,771 |
|
$ |
7,093 |
|
$ |
244,864 |
|
|
Net income |
|
31,117 |
|
|
- |
|
|
31,117 |
|
|
2,109 |
|
|
33,226 |
|
|
Distributions to noncontrolling interest |
|
- |
|
|
- |
|
|
- |
|
|
(4,606 |
) |
|
(4,606 |
) |
|
Net distributions to Parent and its affiliates |
|
(48,572 |
) |
|
- |
|
|
(48,572 |
) |
|
- |
|
|
(48,572 |
) |
|
Foreign currency translation gain (loss) |
|
- |
|
|
369 |
|
|
369 |
|
|
- |
|
|
369 |
|
|
BALANCE, December 31, 2017 |
|
221,041 |
|
|
(356 |
) |
|
220,685 |
|
|
4,596 |
|
|
225,281 |
|
|
Net income |
|
9,886 |
|
|
- |
|
|
9,886 |
|
|
3,857 |
|
|
13,743 |
|
|
Distributions to noncontrolling interest |
|
- |
|
|
- |
|
|
- |
|
|
(4,867 |
) |
|
(4,867 |
) |
|
Net distributions to Parent and its affiliates |
|
(361,447 |
) |
|
- |
|
|
(361,447 |
) |
|
- |
|
|
(361,447 |
) |
|
Foreign currency translation gain (loss) |
|
- |
|
|
(293 |
) |
|
(293 |
) |
|
- |
|
|
(293 |
) |
|
BALANCE, December 31, 2018 |
|
(130,520 |
) |
|
(649 |
) |
|
(131,169 |
) |
|
3,586 |
|
|
(127,583 |
) |
|
Net Loss |
|
(25,459 |
) |
|
- |
|
|
(25,459 |
) |
|
678 |
|
|
(24,781 |
) |
|
Distributions to noncontrolling interest |
|
- |
|
|
- |
|
|
- |
|
|
(267 |
) |
|
(267 |
) |
|
Net contributions from Parent and its affiliates |
|
351,802 |
|
|
- |
|
|
351,802 |
|
|
- |
|
|
351,802 |
|
|
Foreign currency translation gain (loss) |
|
- |
|
|
(165 |
) |
|
(165 |
) |
|
- |
|
|
(165 |
) |
|
BALANCE, March 19, 2019 |
$ |
195,823 |
|
$ |
(814 |
) |
$ |
195,009 |
|
$ |
3,997 |
|
$ |
199,006 |
|
|
|
|
|
|
|
|
|
|
|
|
|
|
|
|
|
|
|
|
Consolidated |
|
||||||||||||||||||||||||
|
|
|
|
|
|
|
|
|
|
|
|
|
|
|
|
|
|
|
|
|
|
|
|
|
|
||
|
Successor: |
Issued Common Shares |
|
Common Stock |
|
Additional Paid-in Capital |
|
Accumulated Other Comprehensive Income (Loss) |
|
Accumulated Deficit |
|
Total Stockholders' Equity |
|
Non-Controlling Interest |
|
Total |
|
||||||||||
|
BALANCE, March 20, 2019 (1) |
|
61,118,298 |
|
$ |
6 |
|
$ |
664,160 |
|
$ |
- |
|
$ |
- |
|
$ |
664,166 |
|
$ |
5,624 |
|
$ |
669,790 |
|
||
|
Immaterial correction of an error (2) |
|
- |
|
|
- |
|
|
(29,321 |
) |
|
- |
|
|
- |
|
|
(29,321 |
) |
|
- |
|
|
(29,321 |
) |
||
|
Net loss |
|
- |
|
|
- |
|
. |
|
|
- |
|
|
(15,569 |
) |
|
(15,569 |
) |
|
3,334 |
|
|
(12,235) |
|
|||
|
Conversion of public warrants into common shares |
|
1,100 |
|
|
- |
|
|
11 |
|
|
- |
|
|
- |
|
|
11 |
|
|
- |
|
|
11 |
|
||
|
Dividends |
|
|
|
|
|
|
|
(2,445 |
) |
|
|
|
|
- |
|
|
(2,445 |
) |
|
- |
|
|
(2,445 |
) |
||
|
Distributions to noncontrolling interest |
|
- |
|
|
- |
|
|
- |
|
|
- |
|
|
- |
|
|
- |
|
|
(834 |
) |
|
(834 |
) |
||
|
Stock-based compensation |
|
- |
|
|
- |
|
|
20,683 |
|
|
- |
|
|
- |
|
|
20,683 |
|
|
- |
|
|
20,683 |
|
||
|
Foreign currency translation loss |
|
- |
|
|
- |
|
|
- |
|
|
(183 |
) |
|
- |
|
|
(183 |
) |
|
- |
|
|
(183 |
) |
||
|
Unrealized gain on derivatives |
|
- |
|
|
- |
|
|
- |
|
|
902 |
|
|
- |
|
|
902 |
|
|
- |
|
|
902 |
|
||
|
BALANCE, December 31, 2019 |
|
61,119,398 |
|
$ |
6 |
|
$ |
653,088 |
|
$ |
719 |
|
$ |
(15,569 |
) |
$ |
638,244 |
|
$ |
8,124 |
|
$ |
646,368 |
|
||
|
(1) |
Initial equity balances of the Successor reflect the equity of the accounting acquirer, Haymaker, and the issuance of common stock, warrants and cash contributed by Haymaker in connection with the acquisition of OSW Predecessor. |
|
(2) |
See Note 19. |
The accompanying notes are an integral part of the consolidated and combined financial statements.
F-6
ONESPAWORLD HOLDINGS LIMITED AND SUBSIDIARIES
CONSOLIDATED AND COMBINED STATEMENTS OF CASH FLOWS
(in thousands)
|
|
Successor |
|
|
|
Predecessor |
|
||||||||||
|
|
Consolidated |
|
|
|
Combined |
|
||||||||||
|
|
|
|
|
|
|
|
|
|
|
Year Ended December 31, |
|
|||||
|
|
March 20, 2019 to December 31, 2019 |
|
|
|
January 1, 2019 to March 19, 2019 |
|
|
2018 |
|
|
2017 |
|
||||
|
CASH FLOWS FROM OPERATING ACTIVITIES: |
|
|
|
|
|
|
|
|
|
|
|
|
|
|
|
|
|
Net (loss) income |
$ |
(12,235 |
) |
|
|
$ |
(24,781 |
) |
|
$ |
13,743 |
|
|
$ |
33,226 |
|
|
Adjustments to reconcile net (loss) income to net cash provided by operating activities: |
|
|
|
|
|
|
|
|
|
|
|
|
|
|
|
|
|
Depreciation and amortization |
|
19,606 |
|
|
|
|
1,989 |
|
|
|
10,055 |
|
|
|
9,829 |
|
|
Stock-based compensation |
|
20,683 |
|
|
|
|
— |
|
|
|
— |
|
|
|
— |
|
|
Amortization of deferred financing costs |
|
841 |
|
|
|
|
213 |
|
|
|
1,243 |
|
|
|
— |
|
|
Provision for doubtful accounts |
|
— |
|
|
|
|
8 |
|
|
|
18 |
|
|
|
18 |
|
|
Loss on extinguishment of debt |
|
— |
|
|
|
|
3,413 |
|
|
|
— |
|
|
|
— |
|
|
Allocation of Parent corporate overhead |
|
— |
|
|
|
|
— |
|
|
|
11,731 |
|
|
|
11,666 |
|
|
Deferred income taxes |
|
(643 |
) |
|
|
|
— |
|
|
|
(1 |
) |
|
|
3,350 |
|
|
Changes in: |
|
|
|
|
|
|
|
|
|
|
|
|
|
|
|
|
|
Accounts receivable |
|
(6,840 |
) |
|
|
|
1,671 |
|
|
|
(2,107 |
) |
|
|
(2,446 |
) |
|
Inventories |
|
352 |
|
|
|
|
(406 |
) |
|
|
(6,966 |
) |
|
|
8,163 |
|
|
Prepaid expenses |
|
(1,714 |
) |
|
|
|
1,073 |
|
|
|
(1,798 |
) |
|
|
(160 |
) |
|
Other current assets |
|
(776 |
) |
|
|
|
213 |
|
|
|
(340 |
) |
|
|
100 |
|
|
Note receivable due from affiliate of Parent |
|
— |
|
|
|
|
— |
|
|
|
(238 |
) |
|
|
(408 |
) |
|
Other non-current assets |
|
(854 |
) |
|
|
|
(1,003 |
) |
|
|
652 |
|
|
|
(5,354 |
) |
|
Accounts payable |
|
7,529 |
|
|
|
|
8,313 |
|
|
|
1,730 |
|
|
|
2,435 |
|
|
Accounts payable – related parties |
|
— |
|
|
|
|
(6,553 |
) |
|
|
(3,650 |
) |
|
|
9,260 |
|
|
Accrued expenses |
|
(30,078 |
) |
|
|
|
19,792 |
|
|
|
7,698 |
|
|
|
(718 |
) |
|
Other current liabilities |
|
317 |
|
|
|
|
(288 |
) |
|
|
499 |
|
|
|
(135 |
) |
|
Income taxes payable |
|
409 |
|
|
|
|
42 |
|
|
|
(84 |
) |
|
|
1,063 |
|
|
Income tax contingency |
|
69 |
|
|
|
|
— |
|
|
|
— |
|
|
|
— |
|
|
Deferred rent |
|
160 |
|
|
|
|
37 |
|
|
|
202 |
|
|
|
229 |
|
|
Net cash (used in) provided by operating activities |
|
(3,174 |
) |
|
|
|
3,733 |
|
|
|
32,387 |
|
|
|
70,118 |
|
|
CASH FLOWS FROM INVESTING ACTIVITIES: |
|
|
|
|
|
|
|
|
|
|
|
|
|
|
|
|
|
Capital expenditures |
|
(2,909 |
) |
|
|
|
(517 |
) |
|
|
(4,983 |
) |
|
|
(2,683 |
) |
|
Acquisition of OSW Predecessor, net of cash acquired |
|
(676,453 |
) |
|
|
|
— |
|
|
|
— |
|
|
|
— |
|
|
Net cash used in investing activities |
|
(679,362 |
) |
|
|
|
(517 |
) |
|
|
(4,983 |
) |
|
|
(2,683 |
) |
|
CASH FLOWS FROM FINANCING ACTIVITIES: |
|
|
|
|
|
|
|
|
|
|
|
|
|
|
|
|
|
Proceeds from the issuance of common shares |
|
122,510 |
|
|
|
|
— |
|
|
|
— |
|
|
|
— |
|
|
Net proceeds from Haymaker and private placement investors |
|
349,390 |
|
|
|
|
— |
|
|
|
— |
|
|
|
— |
|
|
Proceeds from the term loan and revolver facilities |
|
245,900 |
|
|
|
|
— |
|
|
|
— |
|
|
|
— |
|
|
Proceeds from conversion of public warrants into common shares |
|
11 |
|
|
|
|
— |
|
|
|
— |
|
|
|
— |
|
|
Payment of deferred financing costs |
|
(6,892 |
) |
|
|
|
— |
|
|
|
— |
|
|
|
— |
|
|
Repayment on term loan and revolver facilities |
|
(18,442 |
) |
|
|
|
— |
|
|
|
— |
|
|
|
— |
|
|
Proceeds from amounts due from related party |
|
3,187 |
|
|
|
|
— |
|
|
|
— |
|
|
|
— |
|
|
Net distributions to Parent and its affiliates |
|
— |
|
|
|
|
(4,262 |
) |
|
|
(15,690 |
) |
|
|
(60,893 |
) |
|
Distributions to noncontrolling interest |
|
(834 |
) |
|
|
|
(267 |
) |
|
|
(4,867 |
) |
|
|
(4,606 |
) |
|
Net cash provided by (used in) financing activities |
|
694,830 |
|
|
|
|
(4,529 |
) |
|
|
(20,557 |
) |
|
|
(65,499 |
) |
|
Effect of exchange rate changes on cash |
|
(205 |
) |
|
|
|
649 |
|
|
|
(216 |
) |
|
|
124 |
|
|
Net increase (decrease) in cash and cash equivalents |
|
12,089 |
|
|
|
|
(664 |
) |
|
|
6,631 |
|
|
|
2,060 |
|
|
Cash and cash equivalents, Beginning of period |
|
1,774 |
|
|
|
|
15,302 |
|
|
|
8,671 |
|
|
|
6,611 |
|
|
Cash and cash equivalents, End of period |
$ |
13,863 |
|
|
|
$ |
14,638 |
|
|
$ |
15,302 |
|
|
$ |
8,671 |
|
The accompanying notes are an integral part of the consolidated and combined financial statements.
F-7
ONESPAWORLD HOLDINGS LIMITED AND SUBSIDIARIES
CONSOLIDATED AND COMBINED STATEMENTS OF CASH FLOWS (CONTINUED)
(in thousands)
|
|
Successor |
|
|
|
Predecessor |
|
||||||||||
|
|
Consolidated |
|
|
|
Combined |
|
||||||||||
|
|
|
|
|
|
|
|
|
|
|
Year Ended December 31, |
|
|||||
|
SUPPLEMENTAL DISCLOSURES OF CASH FLOW INFORMATION: |
March 20, 2019 to December 31, 2019 |
|
|
|
January 1, 2019 to March 19, 2019 |
|
|
2018 |
|
|
2017 |
|
||||
|
Cash paid during the period for: |
|
|
|
|
|
|
|
|
|
|
|
|
|
|
|
|
|
Income taxes |
$ |
409 |
|
|
|
$ |
73 |
|
|
$ |
1,038 |
|
|
$ |
364 |
|
|
Interest |
$ |
12,347 |
|
|
|
$ |
— |
|
|
$ |
30,344 |
|
|
$ |
— |
|
|
Non-cash transactions: |
|
|
|
|
|
|
|
|
|
|
|
|
|
|
|
|
|
Equity consideration paid in connection with the Business Combination |
$ |
167,300 |
|
|
|
$ |
— |
|
|
$ |
— |
|
|
$ |
— |
|
|
Unpaid declared dividends |
$ |
2,445 |
|
|
|
$ |
— |
|
|
$ |
— |
|
|
$ |
— |
|
|
Vendor-financed purchase of fixed assets |
$ |
— |
|
|
|
$ |
— |
|
|
$ |
306 |
|
|
$ |
— |
|
|
Fixed assets transferred from Parent |
$ |
— |
|
|
|
$ |
— |
|
|
$ |
125 |
|
|
$ |
— |
|
|
Allocation of Parent corporate overhead |
$ |
— |
|
|
|
$ |
— |
|
|
$ |
11,731 |
|
|
$ |
11,666 |
|
|
Assignment and assumption of Parent long-term debt |
$ |
— |
|
|
|
$ |
— |
|
|
$ |
351,197 |
|
|
$ |
— |
|
|
Note receivable from affiliate of Parent forgiven by Parent |
$ |
— |
|
|
|
$ |
— |
|
|
$ |
6,841 |
|
|
$ |
— |
|
|
Repayment of long-term debt by Parent on behalf of the company |
$ |
— |
|
|
|
$ |
351,482 |
|
|
$ |
— |
|
|
$ |
— |
|
|
Write-off of income tax payable for separate return method |
$ |
— |
|
|
|
$ |
— |
|
|
$ |
1,174 |
|
|
$ |
1,033 |
|
The accompanying notes are an integral part of the consolidated and combined financial statements.
F-8
ONESPAWORLD HOLDINGS LIMITED AND SUBSIDIARIES
NOTES TO CONSOLIDATED AND COMBINED FINANCIAL STATEMENTS
DECEMBER 31, 2019
1. Organization
OneSpaWorld Holdings Limited (“OneSpaWorld” or the “Company”) is an international business company incorporated under the laws of the Commonwealth of The Bahamas. OneSpaWorld is a global provider and innovator in the fields of health and wellness, fitness and beauty. In facilities on cruise ships and in land-based resorts, the Company strives to create a relaxing and therapeutic environment where guests can receive health and wellness, fitness and beauty services and experiences of the highest quality. The Company’s services include traditional and alternative massage, body and skin treatments, fitness, acupuncture, and medispa treatments. The Company also sells premium quality health and wellness, fitness and beauty products at its facilities and through its timetospa.com website. The predominant business, based on revenues, is sales of services and products on cruise ships and in land-based resorts, followed by sales of products through the timetospa.com website.
On March 19, 2019 (the “Business Combination Date”), OneSpaWorld consummated a business combination pursuant to a Business Combination Agreement, dated as of November 1, 2018 (as amended on January 7, 2019, by Amendment No. 1 to the Business Combination Agreement), by and among Steiner Leisure Limited (“Steiner Leisure,” “Steiner,” or “Parent”), Steiner U.S. Holdings, Inc., Nemo (UK) Holdco, Ltd., Steiner UK Limited, Steiner Management Services, LLC, Haymaker Acquisition Corp. (“Haymaker”), OneSpaWorld, Dory US Merger Sub, LLC, Dory Acquisition Sub, Limited, Dory Intermediate LLC, and Dory Acquisition Sub, Inc. (the “Business Combination”), in which Haymaker acquired from Steiner the combined operating business known as OSW Predecessor (“OSW”). Prior to the consummation of the Business Combination, OneSpaWorld was a wholly-owned subsidiary of Steiner Leisure. On the Business Combination Date, OneSpaWorld became the ultimate parent company of the Haymaker and OSW combined company.
Haymaker, a special purpose acquisition company (“SPAC”), was organized as a blank check company incorporated in Delaware on April 27, 2017 and was formed for the purpose of effecting a merger, capital stock exchange, asset acquisition, stock purchase, reorganization or similar business combination with one or more businesses. On October 27, 2017, Haymaker consummated an initial public offering (“IPO”) of its Class A common shares (the “Haymaker Class A Shares”), generating gross proceeds of approximately $300,000,000. The net proceeds from the IPO were subsequently placed in a trust account for the intended purpose of being applied toward consummating a business combination.
At the closing of the Business Combination, OneSpaWorld became the ultimate parent company of Haymaker and OSW Predecessor. “OSW Predecessor” is comprised of the net assets and operations of (i) the following wholly-owned subsidiaries of Steiner Leisure: OneSpaWorld LLC, Steiner Spa Asia Limited, Steiner Spa Limited, and Steiner Marks Limited, (ii) the following respective indirect subsidiaries of Steiner Leisure: Mandara PSLV, LLC, Mandara Spa (Hawaii), LLC, Florida Luxury Spa Group, LLC, Steiner Transocean U.S., Inc., Steiner Spa Resorts (Nevada), Inc., Steiner Spa Resorts (Connecticut), Inc., Steiner Resort Spas (California), Inc., OneSpaWorld Resort Spas (North Carolina), Inc. (formerly known as Steiner Resort Spas (North Carolina), Inc.), OSW SoHo LLC, OSW Distribution LLC, World of Wellness Training Limited (formerly known as Steiner Training Limited), STO Italy S.r.l., One Spa World LLC, Mandara Spa Services LLC, OneSpaWorld Limited, OneSpaWorld (Bahamas) Limited (formerly known as Steiner Transocean Limited), OneSpaWorld Medispa LLC, OneSpaWorld Medispa Limited, OneSpaWorld Medispa (Bahamas) Limited (formerly known as STO Medispa Limited), Mandara Spa (Cruise I), LLC, Mandara Spa (Cruise II), LLC, Steiner Transocean (II) Limited (subsequently dissolved), The Onboard Spa by Steiner (Shanghai) Co., Ltd., Mandara Spa LLC, Mandara Spa Puerto Rico, Inc., Mandara Spa (Guam), L.L.C. (subsequently dissolved), Mandara Spa (Bahamas) Limited, Mandara Spa Aruba N.V., Mandara Spa Polynesia Sarl, Inc., Mandara Spa Asia Limited, PT Mandara Spa Indonesia, Spa Services Asia Limited, Mandara Spa Palau, Mandara Spa (Malaysia) Sdn. Bhd., Mandara Spa Ventures International Sdn. Bhd., Spa Partners (South Asia) Limited, Mandara Spa (Maldives) PVT LTD, and Mandara Spa (Fiji) Limited, (iii) Medispa Limited, a majority-owned subsidiary of Steiner Leisure, and (iv) the timetospa website owned by Elemis USA, Inc. (formerly known as Steiner Beauty Products, Inc.) and subsequently transferred to OneSpaWorld.
F-9
2. Summary of Significant Accounting Policies
Basis of Presentation, Principles of Consolidation and Principles of Combination
Successor:
The accompanying consolidated financial statements as of and for the period March 20, 2019 to December 31, 2019, includes the consolidated balance sheet and statements of operations, comprehensive income (loss), equity, and cash flows of OneSpaWorld. All significant intercompany items and transactions have been eliminated in consolidation. In the opinion of management, the accompanying consolidated financial statements have been prepared pursuant to the rules and regulations of the United States Securities and Exchange Commission (the “SEC”). Certain information and footnote disclosures normally included in annual financial statements prepared in accordance with U.S. generally accepted accounting principles have been omitted pursuant to the SEC’s rules and regulations. However, management believes that the disclosures contained herein are adequate to make the information presented not misleading. In the opinion of management, the consolidated financial statements reflect all adjustments (which are of a normal recurring nature) necessary to present fairly our financial position, results of operations and cash flows.
The preparation of consolidated financial statements in conformity with accounting principles generally accepted in the United States (“U.S. GAAP”) requires management to make estimates and assumptions that affect the reported amounts of assets and liabilities and disclosure of contingent assets and liabilities at the date of the financial statements and the reported amounts of revenues and expenses during the reporting period. Actual results could differ from those estimates.
Predecessor:
The combined OSW financial statements (the “OSW financial statements”) include the accounts of the wholly-owned and indirect subsidiaries of Steiner Leisure listed in Note 1 and include the accounts of a company majority-owned by OneSpaWorld Medispa (Bahamas) Limited, in which OneSpaWorld (Bahamas) Limited 100% owner of OneSpaWorld Medispa (Bahamas) Limited) had a controlling interest. The OSW condensed combined financial statements also include the accounts and results of operations associated with the timetospa.com website owned by Elemis USA, Inc. The OSW financial statements do not represent the financial position and results of operations of a legal entity but rather a combination of entities under common control of Steiner Leisure that have been “carved out” of the Steiner Leisure consolidated financial statements and reflect significant assumptions and allocations. All significant intercompany transactions and balances have been eliminated in combination. The accompanying combined OSW financial statements may not be indicative of what they would have been had OSW actually been a separate stand-alone entity.
The accompanying OSW financial statements include the assets, liabilities, revenues and expenses specifically related to OSW’s operations. OSW receives services and support from various functions performed by Steiner Leisure and costs associated with these functions have been allocated to OSW. These allocations are necessary to reflect all of the costs of doing business and include costs related to certain Steiner Leisure corporate functions, including, but not limited to, senior management, legal, human resources, finance, IT and other shared services that have been allocated to OSW based on direct usage or benefit where identifiable, with the remainder allocated on a pro rata basis determined by an estimate of the percentage of time Steiner Leisure employees devoted to OSW, as compared to total time available or by the headcount of employees at Steiner Leisure corporate headquarters that are fully dedicated to the OSW entities in relation to the total employee headcount. These allocated costs are reflected in salaries and payroll taxes and administrative expenses in the accompanying condensed combined OSW statements of operations. Management considers these allocations to be a reasonable reflection of the utilization of services by or benefit provided to OSW. However, the allocations may not be indicative of the actual expenses that would have been incurred had OSW operated as an independent, stand-alone entity.
Net Parent investment represents the Steiner Leisure controlling interest in the recorded net assets of OSW, specifically, the cumulative net investment by Steiner Leisure in OSW and cumulative operating results through the date presented. The net effect of the settlement of transactions between OSW, Steiner Leisure, and other affiliates of Steiner Leisure are reflected in the accompanying condensed combined statements of cash flows as a financing activity and in the condensed combined balance sheet as Net Parent investment.
Certain expenses and operating costs were paid by Steiner Leisure on behalf of OSW. The Parent has paid on behalf of OSW expenses associated with the allocation of Steiner Leisure corporate overhead and costs associated with the purchase of products from related parties. Operating cash flows for the predecessor periods exclude OSW expenses and operating costs paid by Steiner Leisure on behalf of OSW. Consequently, OSW’s historical cash flows may not be indicative of cash flows had OSW actually been a separate stand-alone entity or future cash flows of OSW.
F-10
As of December 31, 2018, OSW had assumed long-term debt of the Parent. Such debt was paid-off by the Parent on behalf of OSW during the Predecessor period from January 1, 2019 to March 19, 2019. Refer to Note 7 for more information on long-term debt.
Management believes the assumptions and allocations underlying the accompanying combined OSW financial statements and notes to the OSW combined financial statements are reasonable, appropriate and consistently applied for the periods presented. Management believes the accompanying combined OSW financial statements reflect all costs of doing business.
The accompanying OSW combined financial statements have been prepared in conformity with U.S. GAAP.
Emerging Growth Company
The Company is an “emerging growth company,” as defined in Section 2(a) of the Securities Act of 1933, as amended (the “Securities Act”). As modified by the Jumpstart Our Business Startups Act of 2012 (the “JOBS Act”), the Company may take advantage of certain exemptions from various reporting requirements that are applicable to other public companies that are not emerging growth companies, including, but not limited to, not being required to comply with the auditor attestation requirements of Section 404 of the Sarbanes-Oxley Act, reduced disclosure obligations regarding executive compensation in its periodic reports and proxy statements, and exemption from the requirements of holding a nonbinding advisory vote on executive compensation and stockholder approval of any golden parachute payments not previously approved.
Further, section 102(b) of the JOBS Act exempts emerging growth companies from being required to comply with new or revised financial accounting standards until private companies (that is, those that have not had a Securities Act registration statement declared effective or do not have a class of securities registered under the Securities Act) are required to comply with new or revised financial accounting standards. The JOBS Act provides that an emerging growth company can elect to opt-out of the extended transition period and comply with the requirements that apply to non-emerging growth companies, but any such election is irrevocable. The Company has elected not to opt-out of such extended transition period, which means that when a standard is issued or revised and it has different application dates for public or private companies, the Company, as an emerging growth company, can adopt the new or revised standard at the time private companies adopt the new or revised standard. This may make comparison of the Company’s financial statements with another public company, which is neither an emerging growth company nor a non-emerging growth company, which has opted-out of using the extended transition period, difficult or impossible because of the potential differences in accounting standards used.
Cash and Cash Equivalents
The Company considers all highly liquid investments purchased with an original maturity of three months or less at the date of purchase to be cash equivalents. The Company maintains its cash and cash equivalents with reputable major financial institutions. Deposits with these banks exceed the Federal Deposit Insurance Corporation insurance limits or similar limits in foreign jurisdictions. While the Company monitors daily the cash balances in its operating accounts and adjusts the balances as appropriate, these balances could be impacted if one or more of the financial institutions with which the Company deposits funds fails or is subject to other adverse conditions in the financial or credit markets. To date, the Company has experienced no loss or lack of access to invested cash or cash equivalents; however, it can provide no assurance that access to invested cash and cash equivalents will not be impacted by adverse conditions in the financial and credit markets.
Inventories
Inventories, consisting principally of beauty products, are stated at the lower of cost, as determined on a first-in, first-out basis, or market. All inventory balances are comprised of finished goods used in beauty and health and wellness services or held for resale.
Property and Equipment
Property and equipment are stated at cost, less accumulated depreciation and amortization. Expenditures for maintenance and repairs, which do not add to the value of the related assets or materially extend their original lives, are expensed as incurred. Depreciation of property and equipment is computed using the straight-line method over the estimated useful lives of the assets. Leasehold improvements are amortized in a straight-line basis over the shorter of the terms of the respective leases and the estimated useful lives of the respective assets.
F-11
Impairment of Long-Lived Assets Other than Goodwill and Indefinite-Lived Intangible Assets
The Company reviews long-lived assets including property and equipment and intangible assets with finite lives for impairment whenever events or changes in circumstances indicate, based on estimated future cash flows, that the carrying amount of these assets may not be fully recoverable. Recoverability of assets to be held and used is measured by a comparison of the carrying amount of an asset (asset group) to future undiscounted cash flows expected to be generated by the asset (asset group). An asset group is the lowest level of assets and liabilities for which identifiable cash flows are largely independent of the cash flows of other assets and liabilities. When estimating future cash flows, the Company considers:
|
|
• |
only the future cash flows that are directly associated with and that are expected to arise as a direct result of the use and eventual disposition of the asset group; |
|
|
• |
potential events and changes in circumstance affecting key estimates and assumptions; and |
|
|
• |
the existing service potential of the asset (asset group) at the date tested. |
If an asset (asset group) is considered to be impaired, the impairment to be recognized is measured by the amount by which the carrying amount of the asset (asset group) exceeds its fair value. When determining the fair value of the asset (asset group), the Company considers the highest and best use of the assets from a market-participant perspective. The fair value measurement is generally determined through the use of independent third-party appraisals or an expected present value technique, both of which may include a discounted cash flow approach, which reflects assumptions of what market participants would utilize to price the asset (asset group).
Assets to be disposed of are reported at the lower of the carrying amount or fair value less costs to sell. Assets to be abandoned, or from which no further benefit is expected, are written down to zero at the time that the determination is made, and the assets are removed entirely from service.
Goodwill and Indefinite-Lived Intangible Assets
Goodwill represents the excess of cost over the fair value of net tangible and identifiable intangible assets acquired. The Company has two operating segments: (1) Maritime and (2) Destination Resorts. The Maritime and Destination Resorts operating segments each have associated goodwill, and each has been determined to be a reporting unit.
Goodwill and other intangible assets with indefinite useful lives are not amortized, but rather, are tested for impairment at least annually. The Company reviews goodwill for impairment at the reporting unit level annually or, when events or circumstances dictate, more frequently. The impairment review for goodwill consists of a qualitative assessment of whether it is more-likely-than-not that a reporting unit’s fair value is less than its carrying amount, and if necessary, a two-step goodwill impairment test. Factors to consider when performing the qualitative assessment primarily include general economic conditions and changes in forecasted operating results. If the qualitative assessment demonstrates that it is more-likely-than-not that the estimated fair value of the reporting unit exceeds its carrying value, it is not necessary to perform the two-step goodwill impairment test. The Company may elect to bypass the qualitative assessment and proceed directly to step one, for any reporting unit, in any period. The Company can resume the qualitative assessment for any reporting unit in any subsequent period. When performing the two-step goodwill impairment test, the fair value of the reporting unit is determined and compared to the carrying value of the net assets allocated to the reporting unit. If the fair value of the reporting unit exceeds its carrying value, no further analysis or write-down of goodwill is required. If the fair value of the reporting unit is less than the carrying value of its net assets, the implied fair value of the reporting unit is allocated to all its underlying assets and liabilities, including both recognized and unrecognized tangible and intangible assets, based on their fair value. If necessary, goodwill is then written down to its implied fair value.
Identifiable intangible assets not subject to amortization are assessed for impairment using a similar process used to evaluate goodwill as described above.
There was no impairment for the for the periods from March 20, 2019 to December 31, 2019 (Successor), for the period from January 1, 2019 to March 19, 2019 (Predecessor) and for the years ended December 31, 2018 (Predecessor) and 2017 (Predecessor).
F-12
Definite-Lived Intangible Assets
The Company amortizes intangible assets with definite lives on a straight-line basis over their estimated useful lives. Definite-Lived Intangible assets include the contracts with cruise lines and leases with hotels and resorts. Contracts with cruise lines are generally renewed every five years. The Company has the intent and ability to renew such contracts over the estimated useful lives of the assets. Costs incurred to renew contracts are capitalized and amortized to cost of revenues and operating expenses over the term of the contract.
Lease agreements with hotels and resorts in which the Company operates are generally renewed every ten years. The Company had the intent and ability to renew such contracts.
Revenue Recognition
Revenue is recognized when customers obtain control of goods and services promised by the Company. The amount of revenue recognized is based on the amount that reflects the consideration that is expected to be received in exchange for those respective goods and services. Amounts recognized are gross of commissions to cruise line or destination resort partners, which typically withhold commissions from customer payments. The Company has elected to present sales taxes on a net basis and, as such, sales taxes are excluded from revenue. Revenue is reported net of discounts and net of any estimated refund liability, which is determined based on historical experience. The Company also issues gift cards for future goods or services; revenue is recognized when they are redeemed; we also recognize revenue for breakage based on past experience for gift card amounts we expect to go unredeemed.
Prior to adoption of ASC Topic 606, as discussed in Revenue Recognition section within Adoption of Accounting Pronouncements below, the Company recognized revenues earned as services are provided and as products are sold, following legacy accounting guidance under ASC Topic 605. Generally, this led to recognition that is consistent with our new policy. Under legacy guidance, we had also elected to recognize revenue on a net-of-tax basis, which is similar to our election under ASC Topic 606. For gift card breakage, the Company uses the redemption recognition method for recognizing breakage related to certain gift certificates for which it has sufficient historical information; this pattern is relatively consistent with our recognition pattern under ASC Topic 606.
Cost of Revenues
Cost of services consists primarily of the cost of product consumed in the rendering of a service, an allocable portion of wages paid to shipboard employees, an allocable portion of payments to cruise lines (which are derived as a percentage of service revenues or a minimum annual rent or a combination of both), an allocable portion of staff-related shipboard expenses, costs related to recruitment and training of shipboard employees, wages paid directly to destination resort employees, payments to destination resort venue owners, and health and wellness facility depreciation.
Cost of products consists primarily of the cost of products sold through the Company’s various methods of distribution, an allocable portion of wages paid to shipboard employees, an allocable portion of payments to cruise lines (which are derived as a percentage of product revenues or a minimum annual rent or a combination of both), and an allocable portion of staff-related shipboard expenses
Shipping and Handling
Shipping and handling costs associated with inbound freight are capitalized to inventories and relieved through cost of sales as inventories are sold. Shipping and handling costs associated with the delivery of products are included in administrative expenses. The shipping and handling costs included in administrative expenses in the accompanying combined consolidated and combined statements of operations for the period from March 20, 2019 through December 31, 2019 (Successor), for the period from January 1, 2019 through March 19, 2019 (Predecessor), for the years ended December 31, 2018 (Predecessor) and 2017 (Predecessor) were $0.04 million, $0.01 million, $0.4 million and $0.5 million, respectively.
Advertising
Substantially, all of the Company’s advertising costs are charged to expense as incurred, except costs that result in tangible assets, such as brochures, which are recorded as prepaid expenses and charged to expense as consumed. Advertising expenses included in cost of revenues and operating expenses in the accompanying consolidated and combined statements of operations for the period from March 20, 2019 through December 31, 2019 (Successor), for the period from January 1, 2019 through March 19, 2019 (Predecessor), for the years ended December 31, 2018 (Predecessor) and 2017 (Predecessor) were $2.5 million, $0.5 million, $3.7 million and $2.9 million, respectively.
F-13
Share-Based Compensation
The Company recognizes expense for our share-based compensation awards using a fair-value-based method. Share-based compensation expense is recognized over the requisite service period for awards that are based on a service period and not contingent upon any future performance.
Debt Issuance Costs
Debt issuance costs related to a recognized debt liability are presented in the consolidated and combined balance sheets as a direct deduction from the carrying amount of that debt liability, consistent with debt discounts. These deferred issuance costs are amortized over the life of the loan agreement. The amortization of deferred financing fees is included in interest expense, net in the consolidated and combined statements of operations.
Income Taxes
Successor:
As part of the process of preparing the consolidated financial statements, the Company is required to estimate its income taxes in each of the jurisdictions in which it operates. This process involves estimating the Company’s actual current income tax exposure together with an assessment of temporary differences resulting from differing treatment of items for tax purposes and accounting purposes, respectively. These differences result in deferred income tax assets and liabilities which are included in the accompanying consolidated balance sheet as of December 31, 2019. Deferred taxes are recorded using the currently enacted tax rates that applied in the periods that the differences are expected to reverse. The Company must then assess the likelihood that its deferred income tax assets will be recovered from future taxable income and, to the extent that the Company believes that recovery is not likely, the Company must establish a valuation allowance. With respect to acquired deferred tax assets, changes within the measurement period that result from new information about facts and circumstances that existed at the acquisition date shall be recognized through a corresponding adjustment to goodwill. Subsequent to the measurement period, all other changes shall be reported as a reduction or increase to income tax expense in the Company’s consolidated statement of operations for the period from March 20, 2019 to December 31, 2019 (Successor).
Predecessor:
The Company’s United States (“U.S.”) entities, other than those that are domiciled in U.S. territories, file their U.S. tax return as part of a consolidated tax filing group, while the Company’s entities that are domiciled in U.S. territories file specific returns. In addition, the Company’s foreign entities file income tax returns in their respective countries of incorporation, where required. For the purposes of these financial statements, the Company is accounting for income taxes under the separate return method of accounting. This method requires the allocation of current and deferred taxes to the Company as if it were a separate taxpayer. Under this method, the resulting portion of current income taxes payable that is not actually owed to the tax authorities is written-off through equity. Accordingly, income taxes payable in the combined balance sheet, as of December 31, 2018 reflects current income tax amounts actually owed to the tax authorities, as of those dates, as well as the accrual for uncertain tax positions. The write-off of current income taxes payable not actually owed to the tax authorities is included in net Parent investment in the accompanying combined balance sheet as of December 31, 2018. Deferred income taxes are recognized based upon the tax consequences of “temporary differences” by applying enacted statutory rates applicable to future years to differences between the financial statement carrying amounts and the tax bases of existing assets and liabilities. Deferred income tax provisions and benefits are based on the changes to the asset or liability from period to period. A valuation allowance is provided on deferred tax assets if it is determined that it is more likely than not that the deferred tax assets will not be realized. The majority of the Company’s income is generated outside of the U.S.
Successor and Predecessor:
The Company believes a large percentage of its shipboard service’s income is foreign-source income, not effectively connected to a business it conducts in the U.S. and, therefore, not subject to U.S. income taxation.
The Company recognizes interest and penalties within the provision for income taxes in the consolidated and combined statements of operations. To the extent interest and penalties are not assessed with respect to uncertain tax positions, amounts accrued, therefore, will be reduced and reflected as a reduction of the overall income tax provision.
The Company recognizes liabilities for uncertain tax positions based on a two-step process. The first step is to evaluate the tax position for recognition by determining if the weight of available evidence indicates it is more likely than not that the position will be sustained on audit, including resolution of related appeals or litigation processes, if any. The second step is to measure the tax benefit as the largest amount of benefit, determined on a cumulative probability basis, which is more than 50% likely of being realized upon ultimate settlement.
F-14
Earnings (Loss) Per Share
Basic earnings (loss) per share is computed by dividing net income (loss) by the weighted average number of common shares outstanding for the period. Diluted earnings per share is computed by dividing net income by the weighted average number of diluted shares, as calculated under the treasury stock method, which includes the potential effect of dilutive common stock equivalents, such as options and warrants to purchase common shares, and contingently issuable shares. If the entity reports a net loss, rather than net income for the period, the computation of diluted loss per share excludes the effect of dilutive common stock equivalents, as their effect would be anti-dilutive.
The following table provides details underlying OneSpaWorld’s loss per basic and diluted share calculation for the period from March 20, 2019 to December 31, 2019 (Successor) (in thousands, except per share data):
|
|
|
Successor |
|
|
|
|
|
March 20, 2019 to December 31, 2019 |
|
|
|
Numerator: |
|
|
|
|
|
Net loss attributable to OneSpaWorld (a) |
|
$ |
(15,569 |
) |
|
Denominator: |
|
|
|
|
|
Weighted average shares issued and outstanding - basic |
|
|
61,118 |
|
|
Weighted average shares issued and outstanding - diluted (b) |
|
|
61,118 |
|
|
|
|
|
|
|
|
Loss per share: |
|
|
|
|
|
Basic |
|
$ |
(0.25 |
) |
|
Diluted |
|
$ |
(0.25 |
) |
(a) Calculated as total net loss less amounts attributable to noncontrolling interest.
(b) For the period from March 20, 2019 to December 31, 2019 (Successor), potential common shares under the treasury stock method were antidilutive because the Company reported a net loss in this period. Consequently, the Company did not have any adjustments in this period between basic and diluted loss per share related to stock options, warrants, deferred shares and restricted stock.
The table below presents the weighted-average number of antidilutive potential common shares that are not considered in the calculation of diluted loss per share for the period from March 20, 2019 to December 31, 2019 (Successor) (in thousands):
|
|
|
|
|
|
|
|
|
|
|
|
|
|
|
|
|
|
|
|
|
|
|
|
|
|
|
|
|
|
|
Common share warrants (a) |
|
|
24,500 |
|
|
Deferred shares |
|
|
6,600 |
|
|
Employee stock options |
|
|
4,455 |
|
|
Board of directors RSUs |
|
|
33 |
|
|
|
|
|
35,588 |
|
|
(a) Includes all public warrants and private placement warrants |
|
|
|
|
Foreign Currency Transactions
For currency exchange rate purposes, assets and liabilities of the Company’s foreign subsidiaries are translated at the rate of exchange in effect at the balance sheet date. Equity and other items are translated at historical rates, and income and expenses are translated at the average rates of exchange prevailing during the year. The related translation adjustments are reflected in the accumulated other comprehensive loss caption of the Company’s combined balance sheets. Foreign currency gains and losses resulting from transactions, including intercompany transactions, are included in results of operations. The transaction gains (losses) included in the administrative expenses caption of the combined statements of operations for the Periods from March 20, 2019 to December 31, 2019 (Successor), January 1, 2019 to March 31, 2019 (Predecessor), for the years ended December 31, 2018 (Predecessor) and 2017 (Predecessor) were $(0.2) million, $0.5 million, $(0.4) million and $0.7 million, respectively.
F-15
Fair Value Measurements
Fair value is the exchange price that would be received for an asset or paid to transfer a liability (an exit price) in the principal or most advantageous market for the asset or liability in an orderly transaction between market participants at the measurement date. Additionally, the inputs used to measure fair value are prioritized based on a three-level hierarchy.
The three levels of inputs used to measure fair value are as follows:
|
|
• |
Level 1—Value is based on quoted prices in active markets for identical assets and liabilities. |
|
|
• |
Level 2—Value is based on observable inputs other than quoted prices included in Level 1. This includes dealer and broker quotations, bid prices, quoted prices for similar assets and liabilities in active markets, or other inputs that are observable or can be corroborated by observable market data. |
|
|
• |
Level 3—Value is based on unobservable inputs that are supported by little or no market activity and that are significant to the fair value of the assets or liabilities. This includes discounted cash flow methodologies and similar techniques that use significant unobservable inputs. |
Derivative Instruments and Hedging Activities
The Company records all derivatives on the balance sheet at fair value. The accounting for changes in the fair value of derivatives depends on the intended use of the derivative, whether the Company has elected to designate a derivative in a hedging relationship and apply hedge accounting and whether the hedging relationship has satisfied the criteria necessary to apply hedge accounting. Derivatives designated and qualifying as a hedge of the exposure to variability in expected future cash flows, or other types of forecasted transactions, are considered cash flow hedges. Hedge accounting generally provides for the matching of the timing of gain or loss recognition on the hedging instrument with the recognition of the changes in the fair value of the hedged asset or liability that are attributable to the hedged risk in a fair value hedge or the earnings effect of the hedged forecasted transactions in a cash flow hedge. Gains and losses on derivatives that are designated as cash flow hedges are recorded as a component of Accumulated other comprehensive loss until the underlying hedged transactions are recognized in earnings.
Use of Estimates
The preparation of financial statements in conformity with GAAP requires management to make estimates and assumptions that affect the reported amounts of assets and liabilities and disclosure of contingent assets and liabilities at the date of the financial statements and the reported amounts of revenues and expenses during the reporting period.
Actual results could differ from those estimates. Significant estimates include the valuation of certain assets acquired in the Business Combination, assessment of the recovery of long-lived assets, goodwill, and other intangible assets; the determination of deferred income taxes, including valuation allowances; the useful lives of definite-lived intangible assets and property and equipment; and allocations of Parent costs.
Concentrations of Credit Risk
Financial instruments that potentially subject the Company to significant concentrations of credit risk consist principally of cash and cash equivalents and accounts receivable. The Company maintains cash and cash equivalents with high quality financial institutions. As of December 31, 2019, and 2018, the Company had three cruise companies that represented greater than 10% of accounts receivable. The Company does not normally require collateral or other security to support normal credit sales. The Company controls credit risk through credit approvals, credit limits, and monitoring procedures.
Accounts receivable are stated at amounts due from customers, net of an allowance for doubtful accounts. The Company records an allowance for doubtful accounts with respect to accounts receivable using historical collection experience, and generally, an account receivable balance is written off once it is determined to be uncollectible. The Company reviews the historical collection experience and considers other facts and circumstances and adjusts the calculation to record an allowance for doubtful accounts as appropriate. If the Company’s current collection trends were to differ significantly from historic collection experience, the Company would make a corresponding adjustment to the allowance. The allowance for doubtful accounts was $0.01 million and $0.5 million as of December 31, 2019 (Successor) and 2018 (Predecessor), respectively. Bad debt expense is included within administrative operating expenses in the accompanying consolidated and combined statements of operations and is not significant for the period from March 20, 2019 to December 31, 2019 (Successor) and for the period from January 1, 2019 to March 19, 2019 (Predecessor), and for the years ended December 31, 2018 (Predecessor), and 2017 (Predecessor).
F-16
Accounting for Business Combinations
In accordance with ASC 805, when accounting for business combinations, the Company is required to recognize the assets acquired, liabilities assumed, contractual contingencies, noncontrolling interests and contingent consideration at their fair value as of the acquisition date.
The purchase price allocation process requires management to make significant estimates and assumptions with respect to intangible assets and/or pre-acquisition contingencies, all of which ultimately affect the fair value of goodwill established as of the acquisition date. Goodwill acquired in business combinations is assigned to the reporting unit(s) expected to benefit from the combination as of the acquisition date and is then subsequently tested for impairment at least annually.
As part of the Company’s accounting for business combinations, the Company is required to determine the useful lives of identifiable intangible assets recognized separately from goodwill. The useful life of an intangible asset is the period over which the asset is expected to contribute directly or indirectly to the future cash flows of the acquired business. An intangible asset with a finite useful life shall be amortized; an intangible asset with an indefinite useful life shall not be amortized. The Company bases the estimate of the useful life of an intangible asset on an analysis of all pertinent factors, including but not limited to the expected use of the asset, the expected useful life of another asset or a group of assets to which the useful life of the intangible asset may relate, any legal, regulatory, or contractual provisions that may limit the useful life, the Company’s own historical experience in renewing or extending similar arrangements, consistent with the Company’s intended use of the asset, regardless of whether those arrangements have explicit renewal or extension provisions, the effects of obsolescence, demand, competition, and other economic factors, and the level of maintenance expenditures required to obtain the expected future cash flows from the asset. If no legal, regulatory, contractual, competitive, economic, or other factors limit the useful life of an intangible asset to the reporting entity, the useful life of the asset shall be considered to be indefinite. The term indefinite does not mean the same as infinite or indeterminate. The useful life of an intangible asset is indefinite if that life extends beyond the foreseeable horizon—that is, there is no foreseeable limit on the period of time over which it is expected to contribute to the cash flows of the acquired business.
Although the Company believes the assumptions and estimates it has made have been reasonable and appropriate, such assumptions and estimates are based in part on historical experience and information obtained from the management of the acquired entity and are inherently uncertain. Examples of critical estimates in accounting for acquisitions include, but are not limited to, the future expected cash flows from sales of products and services, and related contracts and agreements, and discount and long-term growth rates. Unanticipated events and circumstances may occur which could affect the accuracy or validity of the Company’s assumptions, estimates or actual results.
Adoption of Accounting Pronouncements
Revenue Recognition
In May 2014, the FASB issued Accounting Standards Update ("ASU") No. 2014-09, Revenue from Contracts with Customers, which establishes principles to report useful information to financial statements users about the nature, timing and uncertainty of revenue from contracts with customers. ASU No. 2014-09 along with various related amendments comprise ASC Topic 606, Revenue from Contracts with Customers, and provide guidance that is applicable to all contracts with customers within its scope, and supersedes most existing revenue recognition guidance, including industry-specific guidance.
The Company adopted this standard using the modified retrospective method as of March 20, 2019. Results for the Successor period beginning after March 20, 2019 are presented under ASC Topic 606, while Predecessor period amounts are not adjusted and continue to be reported in accordance with our legacy accounting under ASC Topic 605. There was no adjustment for the cumulative effect of adoption made to the Company’s financial statements upon adoption on March 20, 2019.
Overall, the adoption of Topic 606 did not have a material effect on the timing, classification or amount of revenue recognized from contracts with customers in our consolidated and combined financial statements, and therefore, the adoption had no impact on the Company’s consolidated and combined statement of operations. Refer to Note 11 for disclosures with respect to additional revenue recognition disclosure.
Derivatives and Hedging
During the third quarter of 2019, the Company early-adopted ASU 2017-12 “Derivatives and Hedging (Topic 815)” which was issued with the objective of improving the financial reporting of hedging relationships to better portray the economic results of an entity’s risk management activities in its financial statements and to make certain targeted improvements to simplify the application of previously applicable hedge accounting guidance. Additionally, the new standard requires new disclosures requirements on a prospective basis. This adoption did not have a material effect on the Company’s condensed consolidated and combined financial statements and did not result in any cumulative adjustment to equity as of the date of adoption (See Note 15).
F-17
Business Combinations
In January 2017, the FASB issued ASU 2017-01, “Business Combinations (Topic 805): Clarifying the Definition of a Business.” This ASU assists entities with evaluating whether transactions should be accounted for as acquisitions (or disposals) of assets or businesses by clarifying the definition of a business. The definition of a business affects many areas of accounting including acquisition, disposals, goodwill and consolidation. The update is effective for annual periods beginning after December 31, 2018. The amendments in this update should be applied prospectively on or after the effective date. We prospectively adopted this standard on March 20, 2019.The new standard did not have an impact to the Company's consolidated and combined financial statements.
Statement of Cash: Restricted Cash
In November 2016, the FASB issued ASU 2016-18, “Statement of Cash Flows (Topic 230): Restricted Cash.” This ASU requires that a statement of cash flows explains the change during the period in the total of cash, cash equivalents, and amounts generally described as restricted cash or restricted cash equivalents. Therefore, amounts generally described as restricted cash and restricted cash equivalents should be included with cash and cash equivalents when reconciling the beginning-of-period and end-of-period total amounts shown on the statement of cash flows. The update is effective for annual periods beginning after December 15, 2018. We adopted the standard on March 20, 2019. The new standard did not have an impact to the Company's consolidated and combined financial statements.
Statement of Cash Flows: Classification of Certain Cash Receipts and Cash Payments
In August 2016, the FASB issued ASU 2016-15, “Statement of Cash Flows (Topic 230): Classification of Certain Cash Receipts and Cash Payments.” This ASU addresses eight specific cash flow issues with the objective of reducing the existing diversity in practice in how certain cash receipts and cash payments are presented and classified in the statement of cash flows under existing guidance. The update is effective for annual periods beginning after December 15, 2018. The amendments should be applied using a retrospective transition method to each period presented. We adopted the standard on March 20, 2019. The new standard did not have an impact to the Company's consolidated and combined financial statements.
Income Taxes: Intra-Entity Transfers of Assets Other Than Inventory
In October 2016, the FASB issued ASU 2016-16, “Income Taxes (Topic 740): Intra-Entity Transfers of Assets Other Than Inventory:” (“ASU 2016-16”) This ASU was issued as part of the Board’s initiative to reduce complexity in accounting standards. This ASU eliminates an exception in ASC 740, which prohibits the immediate recognition of income tax consequences of intra-entity asset transfers other than inventory. Under ASU 2016-16, entities will be required to recognize the immediate current and deferred income tax effects of intra-entity asset transfers, which often involve a subsidiary of a company transferring intellectual property to another subsidiary. The new guidance will be effective for annual periods beginning after December 15, 2018. This ASU’s amendments should be applied on a modified retrospective basis, recognizing the effects in retained earnings as of the beginning of the year of adoption. We adopted the standard on March 20, 2019. The new guidance did not have an impact to the Company's consolidated and combined financial statements.
Recognition of Breakage for Certain Prepaid Stored-Value Products
In March 2016, the FASB issued ASU 2016-04, “Recognition of Breakage for Certain Prepaid Stored-Value Products (a consensus of the FASB Emerging Issues Task Force).” ASU 2016-04 requires entities that sell certain prepaid stored-value products redeemable for goods, services or cash at third-party merchants to derecognize liabilities related to those products for breakage (i.e., the value that is ultimately not redeemed by the consumer). This guidance is effective for annual periods beginning after December 15, 2018. Entities can use either a full retrospective approach, meaning they would apply the guidance to all periods presented, or a modified retrospective approach, meaning they would apply it only to the most current period presented with a cumulative-effect adjustment to retained earnings as of the beginning of the period of adoption. We adopted the standard on March 20, 2019. The new standard did not have an impact to the Company's consolidated and combined financial statements.
Recent Accounting Pronouncements
With the exception of those discussed below, there have been no recent accounting pronouncements or changes in accounting pronouncements that are of significance, or potential significance, to the Company based on its current operations. The following summary of recent accounting pronouncements is not intended to be an exhaustive description of the respective pronouncement.
In February 2016, the FASB issued ASU 2016-02, “Leases (Topic 842)” (“ASU 2016-02”) to increase transparency and comparability among organizations by recognizing rights and obligations resulting from leases as lease assets and lease liabilities on the balance sheet and disclosing key information about leasing arrangements. The update requires lessees to recognize for all leases with a term of 12 months or more at the commencement date: (a) a lease liability or a lessee’s obligation to make lease payments arising from a lease, measured on a discounted basis; and (b) a right-of-use asset or a lessee’s right to use or control the use of a specified asset for the lease
F-18
term. Under the update, lessor accounting remains largely unchanged. The update requires a modified retrospective transition approach for leases existing at or entered into after the beginning of the earliest comparative period presented in the financial statements and do not require any transition accounting for leases that expire before the earliest comparative period presented.
The update is effective retrospectively for annual periods beginning after December 15, 2019, and interim periods beginning after December 15, 2020, with early adoption permitted. We intend to elect the optional transition method, which allows entities to initially apply the standard at the adoption date and recognize a cumulative-effect adjustment to the opening balance of retained earnings in the period of adoption. The Company continues to evaluate the effect that the update will have on the Company’s consolidated financial statement. The company is in the process to start its initial scoping review to identify a complete population of leases to be recorded on the consolidated Balance Sheet as a lease obligation and right of use asset. The Company expects the update will have a material effect on our consolidated balance sheets due to the recognition of operating lease assets and operating lease liabilities primarily related to the destination resort agreements and office space which will result in a balance sheet presentation that is not comparable to the prior period in the first year of adoption. Upon adoption, we expect that there will be no cumulative-effect adjustment of initially applying the guidance to our opening balance of retained earnings. We are currently evaluating the impact to our consolidated statements of operations, consolidated statements of cash flows and our debt-covenant compliance under our current agreements on an ongoing basis.
In August 2018, the FASB issued ASU No. 2018-15, Intangibles - Goodwill and Other - Internal Use Software (Topic 350-40): Customer’s Accounting for Implementation Costs Incurred in a Cloud Computing Arrangement That Is a Service Contract, which amends ASC 350-40 to address a customer’s accounting for implementation costs incurred in a cloud computing arrangement (CCA) that is a service contract. ASU 2018-15 aligns the accounting for costs incurred to implement a CCA that is a service arrangement with the guidance on capitalizing costs associated with developing or obtaining internal-use software. The standard is effective for fiscal years beginning after December 15, 2019, with early adoption permitted. Entities are permitted to apply either a retrospective or prospective approach to adopt the guidance. We are currently evaluating the impact of the adoption of this update on our consolidated financial position, results of operations, and cash flows.
In June 2016, the FASB issued ASU 2016-13, “Financial Instruments—Credit Losses (Topic 326).” This ASU amends the Board’s guidance on the impairment of financial instruments. The ASU adds to GAAP an impairment model (known as the current expected credit losses model) that is based on an expected losses model rather than an incurred losses model. Under the new guidance, an entity recognizes as an allowance its estimate of expected credit losses. The ASU is also intended to reduce the complexity of GAAP by decreasing the number of impairment models that entities use to account for debt instruments. The update is effective for fiscal years beginning after December 15, 2020. The Company is currently assessing the impact the adoption of this guidance will have on its consolidated financial statements.
In January 2017, the FASB issued ASU 2017-04, “Intangibles – Goodwill and Other (Topic 350): Simplifying the Test for Goodwill Impairment” (“ASU 2017-04”). This ASU simplifies the subsequent measurement of goodwill by eliminating Step 2 from the goodwill impairment test. Previously, in computing the implied fair value of goodwill under Step 2, an entity had to perform procedures to determine the fair value at the impairment testing date of its assets and liabilities following the procedure that would be required in determining the fair value of assets acquired and liabilities assumed in a business combination. Instead, under ASU 2017-04, an entity should perform its annual, or interim, goodwill impairment test by comparing the fair value of a reporting unit with its carrying amount. An entity should recognize an impairment charge for the amount by which the carrying amount exceeds the reporting unit’s fair value; however, the loss recognized should not exceed the total amount of goodwill allocated to the reporting unit. The new guidance is effective for an entity’s annual or any interim goodwill impairment tests in fiscal years beginning after December 15, 2019 and early adoption is permitted for interim or annual goodwill impairment tests performed on testing dates after January 1, 2017. The Company will evaluate, upon adoption of this guidance, the impact of this guidance on the Company’s financial statements.
F-19
3. Business Combination
As discussed in Note 1, Organization, on March 19, 2019, OneSpaWorld consummated a business combination. The Business Combination was accounted for using the acquisition method of accounting in accordance with Financial Accounting Standards Board (“FASB”) Accounting Standards Codification (“ASC”) Topic 805, Business Combinations (“ASC 805”). Haymaker was deemed to be the accounting acquirer and OSW the accounting acquiree. As a result of applying pushdown accounting, the post-Business Combination financial statements of OneSpaWorld reflect the new basis of accounting for OSW.
Transaction costs incurred by OneSpaWorld in the Business Combination, consisting primarily of debt issuance costs of $6,892,000 in connection with the arrangement of debt financing to consummate the Business Combination, are recorded as deferred financing costs and netted against the related long-term debt in the accompanying condensed consolidated balance sheet. Under ASC 805, transaction costs of the acquirer are not included as a component of consideration transferred but are accounted as an expense in the period in which such costs are incurred, or, if related to the issuance of debt or equity, capitalized as debt issuance costs or recorded as a reduction in equity proceeds to additional paid-in capital, respectively. Acquisition related transaction costs incurred as part of a business combination can include estimated fees related to the issuance of long-term debt, underwriting fees, as well as advisory, legal and accounting fees.
Upon completion of the Business Combination, the Haymaker selling stockholders received an aggregate 31,713,387 common shares, par value $0.0001, of OneSpaWorld (the “OneSpaWorld Shares”), with each Haymaker stockholder receiving one OneSpaWorld Share in exchange for each Haymaker Class A Common Share. In addition, each existing warrant to purchase one Haymaker Class A Common Share (the “Haymaker Warrants”) became exercisable for one OneSpaWorld Share (the “Public Warrants”), on the same terms and conditions as those applicable to the warrants to purchase the Haymaker Class A Shares (See Note 8). Also, 3,000,000 OneSpaWorld Shares, and the right to receive 1,600,000 OneSpaWorld Shares upon the occurrence of certain events (the “OneSpaWorld Deferred Shares”), were issued to Haymaker Sponsor and the other former holders of Haymaker Class B common shares (the “Founder Shares”) in exchange for such shares, and the Haymaker Warrants held by Haymaker Sponsor became exercisable for 3,408,186 OneSpaWorld Shares.
Total consideration transferred to Steiner in connection with the Business Combination was $858,386,000, consisting of the following:
|
|
(i) |
$691,086,000 in cash, including $13,900,000 in seller expenses paid by OSW and cash proceeds of $56,071,000 from the sale of 5,607,144 OneSpaWorld shares by Steiner in a private placement offering to investors. |
|
|
(ii) |
$167,300,000 in equity consideration, consisting of 14,155,274 OneSpaWorld shares, of which 5,607,144 OneSpaWorld shares were issued to Steiner in a private placement offering to investors; warrants to purchase 1,486,520 OneSpaWorld shares; and the right to receive 5,000,000 OneSpaWorld Deferred Shares (See Note 8). |
The fair value of the OneSpaWorld Shares and OneSpaWorld Deferred Shares issued as equity consideration in the Business Combination was based on the observable market price of $11.85 per share of OneSpaWorld common stock on the Business Combination Date. The fair value of the warrants to purchase OneSpaWorld shares issued as equity consideration in the Business Combination was determined using a Black-Sholes option-pricing model with inputs as of the Business Combination Date.
The acquisition of OSW is recorded on the Company’s condensed consolidated balance sheet as of March 19, 2019 based upon estimated fair values as of such date.
The valuation of the assets acquired and liabilities assumed was based on fair values at the Business Combination Date. The allocation of consideration to the net tangible and intangible assets acquired and liabilities assumed reflect various fair value estimates and analyses, including work performed by third-party valuation specialists.
F-20
The Company’s purchase price allocation was final as of December 31, 2019. Measurement period adjustments were applied retrospectively to the Business Combination Date. The computations of the allocation of the purchase price to the net tangible and intangible assets acquired and liabilities assumed, as adjusted, is presented below (in thousands):
|
|
|
Estimated Fair Value as of Acquisition Date (as Previously Reported) |
|
|
Immaterial Corrections (a) |
|
|
Measurement Period Adjustments |
|
|
Other |
|
|
Estimated Fair Value as of Acquisition Date (As Adjusted) |
|
|||||||
|
Assets |
|
|
|
|
|
|
|
|
|
|
|
|
|
|
|
|
|
|
|
|
||
|
Cash and cash equivalents |
|
$ |
14,638 |
|
|
$ |
- |
|
|
$ |
- |
|
|
$ |
- |
|
|
$ |
14,638 |
|
||
|
Accounts receivable |
|
|
23,673 |
|
|
|
- |
|
|
|
- |
|
|
|
- |
|
|
|
23,673 |
|
||
|
Inventories |
|
|
34,150 |
|
|
|
2,268 |
|
|
|
|
|
|
|
- |
|
|
|
36,418 |
|
||
|
Other current assets |
|
|
6,756 |
|
|
|
4,202 |
|
|
|
|
|
|
|
- |
|
|
|
10,958 |
|
||
|
Property and equipment |
|
|
26,253 |
|
|
|
- |
|
|
|
- |
|
|
|
- |
|
|
|
26,253 |
|
||
|
Intangible assets |
|
|
633,300 |
|
|
|
- |
|
|
|
(3,500 |
) |
(b) |
|
- |
|
|
|
629,800 |
|
||
|
Other noncurrent assets |
|
|
6,818 |
|
|
|
(6,818 |
) |
|
|
- |
|
|
|
|
|
|
|
- |
|
||
|
Goodwill |
|
|
199,379 |
|
|
|
(25,764 |
) |
|
|
10,053 |
|
|
|
6,409 |
|
(c) |
|
190,077 |
|
||
|
Deferred tax asset |
|
|
8,407 |
|
|
|
- |
|
|
|
(6,814 |
) |
(d) |
|
- |
|
|
|
1,593 |
|
||
|
Total assets acquired |
|
|
953,374 |
|
|
|
(26,112 |
) |
|
|
(261 |
) |
|
|
6,409 |
|
|
|
933,410 |
|
||
|
Liabilities |
|
|
|
|
|
|
|
|
|
|
|
|
|
|
|
|
|
|
|
|
||
|
Current liabilities |
|
|
64,518 |
|
|
|
503 |
|
|
|
499 |
|
|
|
- |
|
|
|
65,520 |
|
||
|
Deferred tax liabilities |
|
|
77 |
|
|
|
- |
|
|
|
(77 |
) |
|
|
- |
|
|
|
- |
|
||
|
Other long-term liabilities |
|
|
4,563 |
|
|
|
- |
|
|
|
(683 |
) |
|
|
- |
|
|
|
3,880 |
|
||
|
Total liabilities acquired |
|
|
69,158 |
|
|
|
503 |
|
|
|
(261 |
) |
|
|
- |
|
|
|
69,400 |
|
||
|
Non-controlling interest |
|
|
5,624 |
|
|
|
- |
|
|
|
- |
|
|
|
- |
|
|
|
5,624 |
|
||
|
Total purchase price |
|
$ |
878,592 |
|
|
$ |
(26,615 |
) |
|
$ |
- |
|
|
$ |
6,409 |
|
|
$ |
858,386 |
|
||
|
(a) |
See Note 19. |
|
(b) |
As a result of additional information obtained about certain assumptions used in the valuation of the destination resort agreements and licensing agreement, the Company recorded measurement period adjustments during the third quarter of fiscal 2019 which resulted in a net increase to Goodwill of $3.5 million. The change in this provisional amount resulted in a $0.5 million reduction to amortization of intangible assets for the period from March 20, 2019 through December 31, 2019. |
|
(c) |
Increase in cash consideration of $6.4 million due to working capital adjustments. |
|
(d) |
Approximately $3.8 million related to the forfeiture of U.S. federal operating loss carry forwards forfeited as a result of change of ownership in the Business Combination and tax effect of adjustments in acquired assets and liabilities |
The Company recorded identifiable intangible assets of $629.8 million related to retail concession agreements, destination resort agreements, a trade name and a licensing agreement. Retail concession agreements and destination resort agreements were valued through application of the multi-period excess earnings method. Under this method, revenues, operating expenses and other costs associated with these agreements were estimated in order to derive cash flows attributable to the existing agreements. The resulting cash flows were then discounted to present value at rates reflective of the risk and return expectations of the agreements to arrive at the fair value of the agreements as of the Business Combination Date. The Company has determined the estimated useful lives of the retail concession agreements and destination resort agreements based on the projected economic benefits associated with these interests. The trade name and licensing agreement were valued through application of the relief from royalty method. Under this method a royalty rate is applied to the revenues associated with the trade name to capture value associated with use of the name as if licensed. The resulting royalty savings are then discounted to present value at rates reflective of the risk and return expectations of the interests to derive their respective fair values as of the Business Combination Date. The Company has determined that the trade name is expected to have an indefinite useful life while the licensing agreement life is estimated based on the projected economic benefits associated with this interest. Identifiable intangible assets consist of the following (in thousands):
|
|
|
|
|
|
|
|
|
|
|
|
|
|
Fair Value |
|
|
|
|
Retail concession agreements |
|
|
|
$ |
604,700 |
|
|
|
Destination resort agreements |
|
|
|
|
17,900 |
|
|
|
Trade name |
|
|
|
|
6,200 |
|
|
|
Licensing agreement |
|
|
|
|
1,000 |
|
|
|
|
|
|
|
$ |
629,800 |
|
|
F-21
Property and equipment acquired was based on the fair value of such assets determined using the trending method of the cost approach. The fair value of the inventory was determined through use of the replacement cost approach.
Goodwill represents the excess of the total purchase consideration over the fair value of the underlying net assets, largely arising from the workforce and extensive distribution network that has been established by OSW Predecessor. The majority of goodwill is not deductible for income tax purposes. Goodwill of $174.2 million and $15.9 million was assigned to the Maritime and Destination Resorts reporting units, respectively, based on expected benefits from the combination as of the Business Combination Date.
Noncontrolling interest was based on the fair value using a discounted cash flow method of the income approach.
The following information represents the unaudited supplemental pro forma results of the Company’s condensed consolidated statement of operations as if the Business Combination occurred on January 1, 2018, after giving effect to certain adjustments, including depreciation and amortization of the assets acquired and liabilities assumed based on their estimated fair values and changes in interest expense resulting from changes in debt (in thousands):
|
|
|
Year Ended December 31, 2019 |
|
|
Year Ended December 31, 2018 |
|
|
||
|
Revenues |
|
$ |
562,233 |
|
|
$ |
540,778 |
|
|
|
Net income (loss) |
|
$ |
(26,289 |
) |
|
$ |
13,743 |
|
|
The pro forma information does not purport to be indicative of what the Company’s results of operations would have been if the Business Combination had in fact occurred at the beginning of the period presented and is not intended to be a projection of the Company’s future results of operations. Financial information prior to the Business Combination Date is referred to as “Predecessor” company information, which reflects the combined financial statements of OSW prepared using OSW’s previous combined basis of accounting. The financial information beginning March 20, 2019 is referred to as “Successor” company information and reflects the consolidated financial statements of OneSpaWorld, including the financial statement effects of recording fair value adjustments and the capital structure resulting from the Business Combination. Black lines have been drawn to separate the Successor’s financial information from that of the Predecessor since their financial statements are not comparable as a result of the application of acquisition accounting and the Company’s capital structure resulting from the Business Combination.
4. Property and Equipment, Net
Property and equipment, net consisted of the following (in thousands, except useful life):
|
|
|
|
As of December 31, |
|
||||||
|
|
|
|
2019 |
|
|
|
2018 |
|
||
|
|
|
|
Successor |
|
|
|
Predecessor |
|
||
|
|
Useful Life in years |
|
Consolidated |
|
|
|
Combined |
|
||
|
Furniture and fixtures |
5 – 7 |
|
$ |
2,501 |
|
|
|
$ |
4,735 |
|
|
Computers and equipment |
3 – 8 |
|
|
7,216 |
|
|
|
|
7,127 |
|
|
Leasehold improvements |
Shorter of remaining lease term or useful life |
|
|
19,467 |
|
|
|
|
24,665 |
|
|
|
|
|
|
29,184 |
|
|
|
|
36,527 |
|
|
Less: Accumulated depreciation and amortization |
|
|
|
(6,443 |
) |
|
|
|
(20,288 |
) |
|
|
|
|
$ |
22,741 |
|
|
|
$ |
16,239 |
|
Depreciation and amortization expense for the periods from March 20, 2019 to December 31, 2019 (Successor), January 1, 2019 to March 19, 2019 (Predecessor), for the years ended December 31, 2018 (Predecessor) and 2017 (Predecessor) were $6.4 million, $1.2 million, $6.5 million and $6.3 million, respectively.
5. Goodwill and Intangible Assets
As a result of the Business Combination on March 19, 2019, and the related application of acquisition accounting, the Company completed an initial preliminary valuation of goodwill as of that date of $199.4 million. As of December 31, 2019 (Successor), goodwill was adjusted to $190.1 million, a decrease of $9.3 million (see Note 3).
F-22
Intangible assets consist of finite and indefinite life assets. The following is a summary of the Company’s intangible assets as of December 31, 2019 (Successor) (in thousands, except amortization period):
|
|
|
|
|
|
|
|
|
|
|
|
|
|
|
|
|
|
|
|
|
|
|
|
|
|
|
|
|
|
|
Successor: |
Cost |
|
|
Accumulated Amortization |
|
|
Net Balance |
|
|
Amortization Period (in years) |
|||
|
Retail concession agreements |
$ |
604,700 |
|
|
$ |
(12,165 |
) |
|
$ |
592,535 |
|
|
39 |
|
Destination resort agreements |
|
17,900 |
|
|
|
(907 |
) |
|
|
16,993 |
|
|
15 |
|
Trade name |
|
6,200 |
|
|
|
- |
|
|
|
6,200 |
|
|
Indefinite-life |
|
Licensing agreement |
|
1,000 |
|
|
|
(91 |
) |
|
|
909 |
|
|
8 |
|
|
$ |
629,800 |
|
|
$ |
(13,163 |
) |
|
$ |
616,637 |
|
|
|
The following is a summary of the Company’s intangible assets as of December 31, 2018 (Predecessor) (in thousands, except amortization period):
|
|
|
|
|
|
|
|
|
|
|
|
|
|
|
|
Predecessor: |
Cost |
|
|
Accumulated Amortization |
|
|
Net Balance |
|
|
Amortization Period (in years) |
|||
|
Retail concession agreements |
$ |
130,000 |
|
|
$ |
(10,210 |
) |
|
$ |
119,790 |
|
|
36 |
|
Destination resort agreements |
|
7,300 |
|
|
|
(573 |
) |
|
|
6,727 |
|
|
36 |
|
Trade name |
|
5,000 |
|
|
|
- |
|
|
|
5,000 |
|
|
Indefinite-life |
|
|
$ |
142,300 |
|
|
$ |
(10,783 |
) |
|
$ |
131,517 |
|
|
|
|
|
|
|
|
|
|
|
|
|
|
|
|
|
|
The Company amortizes intangible assets with definite lives on a straight-line basis over their estimated useful lives. Amortization expense for the periods from March 20, 2019 to December 31, 2019 (Successor), January 1, 2019 to March 19, 2019 (Predecessor), for the years ended December 31, 2018 (Predecessor) and 2017 (Predecessor) was $13.2 million, $0.8 million, $3.5 million and $3.5 million, respectively. Amortization expense is estimated to be $16.8 million in each of the next five years beginning in 2020.
6. Accrued Expenses
Accrued expenses consisted of the following (in thousands):
|
|
|
|
|
|
|
|
|
|
|
|
|
As of December 31, |
|
|
||||||
|
|
2019 |
|
|
|
2018 |
|
|
||
|
|
Successor |
|
|
|
Predecessor |
|
|
||
|
|
Consolidated |
|
|
|
Combined |
|
|
||
|
Operative commissions |
$ |
4,194 |
|
|
|
$ |
4,663 |
|
|
|
Minimum cruise line commissions |
|
4,164 |
|
|
|
|
5,648 |
|
|
|
Payroll and bonuses |
|
2,566 |
|
|
|
|
5,037 |
|
|
|
Interest |
|
339 |
|
|
|
|
2,513 |
|
|
|
Other |
|
12,312 |
|
|
|
|
9,350 |
|
|
|
|
$ |
23,575 |
|
|
|
$ |
27,211 |
|
|
|
|
|
|
|
|
|
|
|
|
|
7. Long-term Debt
Long-term debt consisted of the following (in thousands, except interest rate):
F-23
|
|
|
|
|
|
|
|
|
|
|
|
|
As of December 31, |
|
||||||
|
|
|
|
|
|
|
|
|
|
|
|
|
2019 |
|
|
|
2018 |
|
||
|
|
|
Interest Rate December 31, |
|
|
Maturities Through |
|
Successor |
|
|
|
Predecessor |
|
|||||||
|
|
|
2019 |
|
|
2018 |
|
|
|
|
Consolidated |
|
|
|
Combined |
|
||||
|
First lien term loan facility |
|
5.5% |
|
|
|
|
|
|
2026 |
|
$ |
202,457 |
|
|
|
$ |
- |
|
|
|
Second lien term loan facility |
|
9.3% |
|
|
|
|
|
|
2027 |
|
|
25,000 |
|
|
|
|
- |
|
|
|
Term credit agreement |
|
|
|
|
|
9.6% |
|
|
|
|
|
- |
|
|
|
|
356,140 |
|
|
|
Total Debt |
|
|
|
|
|
|
|
|
|
|
|
|
227,457 |
|
|
|
|
356,140 |
|
|
Less: unamortized debt Issuance cost |
|
|
|
|
|
|
|
|
|
|
|
|
(6,050 |
) |
|
|
|
(3,700 |
) |
|
Total debt, net of unamortized debt Issuance cost |
|
|
|
|
|
|
|
|
|
|
|
$ |
221,407 |
|
|
|
$ |
352,440 |
|
Successor:
On March 19, 2019, the Company entered into (i) senior secured first lien credit facilities (the “First Lien Credit Facilities”) with Goldman Sachs Lending Partners LLC, as administrative agent, and certain lenders, consisting of (x) a term loan facility of $208.5 million (of which $20 million was borrowed by a subsidiary of the Company) (the “First Lien Term Loan Facility”), (y) a revolving loan facility of up to $20 million (the “First Lien Revolving Facility”) and (z) a delayed draw term loan facility of $5 million (the “First Lien Delayed Draw Facility”), and (ii) a senior secured second lien term loan facility of $25 million with Cortland Capital Market Services LLC, as administrative agent, and Neuberger Berman Alternative Funds, Neuberger Berman Long Short Fund, as lender. (the “Second Lien Term Loan Facility” and, together with the First Lien Term Loan Facility, the “Term Loan Facilities”; the New Term Loan Facilities, together with the First Lien Revolving Facility and the First Lien Delayed Draw Facility, are referred to as the “New Credit Facilities”). The First Lien Revolving Facility includes borrowing capacity available for letters of credit up to $5 million. Any issuance of letters of credit reduces the amount available under the New First Lien Revolving Facility. The First Lien Term Loan Facility matures seven years after March 19, 2019, the First Lien Revolving Facility matures five years after March 19, 2019 and the Second Lien Term Loan Facility matures eight years after March 19, 2019.
Loans outstanding under the First Lien Credit Facilities will accrue interest at a rate per annum equal to LIBOR plus a margin of 4.00%, with one step down to 3.75% upon achievement of a certain leverage ratio, and undrawn amounts under the First Lien Revolving Facility will accrue a commitment fee at a rate per annum of 0.50% on the average daily undrawn portion of the commitments thereunder, with one step down to 0.325% upon achievement of a certain leverage ratio. Loans outstanding under the Second Lien Term Loan Facility will accrue interest at a rate per annum equal to LIBOR plus 7.50%.
The obligations under the New Credit Facilities are guaranteed by the Company and each of its direct or indirect wholly-owned subsidiaries organized under the laws of the United States and the Commonwealth of The Bahamas, in each case, other than certain excluded subsidiaries, including, but not limited to, immaterial subsidiaries, non-profit subsidiaries, and any other subsidiary with respect to which the burden or cost of providing a guarantee is excessive in view of the benefits to be obtained by the lenders therefrom.
The Term Loan Facilities require the Company to make certain mandatory prepayments, with (i) 100% of net cash proceeds of all non-ordinary course asset sales or other dispositions of property, subject to the ability to reinvest such proceeds and certain other exceptions, and subject to step downs if certain leverage ratios are met and (ii) 100% of the net cash proceeds of any debt incurrence, other than debt permitted under the definitive agreements (but excluding debt incurred to refinance the New Credit Facilities). The Company also is required to make quarterly amortization payments equal to 0.25% of the original principal amount of the First Lien Term Loan Facility commencing after the first full fiscal quarter after the closing date of the New Credit Facilities (subject to reductions by optional and mandatory prepayments of the loans). The Company may prepay (i) the First Lien Credit Facilities at any time without premium or penalty, subject to payment of customary breakage costs and a customary “soft call,” and (ii) the Second Lien Term Loan Facility at any time without premium or penalty, subject to a customary make-whole premium for any voluntary prepayment prior to the date that is 30 months following the closing date of the New Credit Facilities (the “Callable Date”), following by a call premium of (x) 4.00% on or prior to the first anniversary of the Callable Date, (y) 2.50% after the first anniversary but on or prior to the second anniversary of the Callable Date, and (z) 1.50% after the second anniversary but on or prior to the third anniversary of the Callable Date.
The First Lien Revolving Facility contains a financial covenant and the New Credit Facilities contain a number of traditional negative covenants including negative covenants related to the following subjects: consolidations, mergers, and sales of assets; limitations on the incurrence of certain liens; limitations on certain indebtedness; limitations on the ability to pay dividends; and certain affiliate transactions.
The New Credit Facilities also contain certain customary representations and warranties, affirmative covenants and events of default. If an event of default occurs, the lenders under the New Credit Facilities are entitled to take various actions, including the acceleration of amounts due under the New Credit Facilities and all actions permitted to be taken by a secured creditor, subject to customary intercreditor provisions among the first and second lien secured parties. As of December 31, 2019, the company was in Compliance with all of the covenants contained in the New Credit Facilities.
F-24
The Following are scheduled principal repayments on long-term as of December 31, 2019 for each of the next five years (in thousands):
|
|
|
|
|
|
|
Year |
|
Amount |
|
|
|
2020 |
|
$ |
- |
|
|
2021 |
|
|
- |
|
|
2022 |
|
|
1,776 |
|
|
2023 |
|
|
2,085 |
|
|
2024 |
|
|
2,085 |
|
|
Thereafter Total |
|
|
221,511 |
|
|
|
|
$ |
227,457 |
|
|
|
|
|
|
|
Borrowing Capacity:
As of December 31, 2019, the Company had the ability to borrow under the First Lien Revolving Facility as follows (in thousands):
|
|
|
Borrowing Capacity |
|
|
Amount Borrowed |
|
||
|
First Lien Revolving Facility |
|
$ |
20,000 |
|
|
$ |
- |
|
Predecessor:
On January 11, 2018, the Company entered into an assignment and assumption of third-party debt (the “Term Credit Agreement”) of $356.2 million from the Parent with a maturity date on December 9, 2021. Long-term debt is presented net of related unamortized deferred financing costs of $3.7 million on the condensed combined balance sheet as of December 31, 2018. The interest rate on the Term Credit Agreement was based on (at the Parent’s election) either LIBOR plus a predetermined margin that ranged from 7.00% to 7.50%, or the base rate as defined in the Term Credit Agreement plus a predetermined margin that ranged from 6.00% to 6.50%, in each case based on the Parent’s consolidated total leverage ratio. At December 31, 2018, the Parent elected the LIBOR rate and the applicable margin was 7.25% per annum. In connection with the Term Credit Agreement, the Company entered into pledge and security agreements with the applicable lenders as collateral agent, pledging substantially all of its assets as collateral.
On March 1, 2019, all amounts due under the Term Credit Agreement were paid off in full by the Parent on behalf of OSW. This resulted in a loss on extinguishment of debt to OSW of $3,413,000, representing the write-off of unamortized deferred financing costs, which is recorded in other income (expense) in the accompanying condensed combined statements of operations for the period from January 1, 2019 to March 19, 2019 (Predecessor).
8. Equity
Common Shares
The Company is authorized to issue 250,000,000 common shares with a par value of $0.0001 per share. Holders of the Company’s common stock are entitled to one vote for each share. At December 31, 2019, there were 61,119,398 shares of OneSpaWorld common stock issued and outstanding.
Dividends Declared Per Common Share
In November 2019, the Company adopted an annual cash dividend program and declared an initial quarterly payment of $0.04 per common share. We adopted a cash dividend program in November 2019, with an initial quarterly cash dividend payment of $0.04 per common share. However, as a result of the impact of the coronavirus outbreak on our business, our board of directors re-evaluated our current dividend program and has determined that in order to increase our financial flexibility and reallocate our capital resources, to defer the previously authorized and declared quarterly dividend to be paid on May 29, 2020 and to temporarily suspend the dividend program until further notice.
Deferred Shares
As part of the equity consideration transferred in the Business Combination on March 19, 2019, Steiner and Haymaker Sponsor, LLC (“Haymaker Sponsor”) received deferred shares which provided the right to receive 5,000,000 and 1,600,000 OneSpaWorld common stock, respectively. The issuance of the OneSpaWorld common shares related to the Deferred Shares is contingent upon the earliest occurrence of any of the following events: (i) OneSpaWorld share price reaching $20 per share for five consecutive trading dates, as adjusted to reflect any stock split, reverse stock split, stock dividend, payment of dividends and other events as defined in the applicable
F-25
Deferred Shares agreement, (ii) in the event of a change of control, as defined, of the Company if the price per share paid in connection with such change in control is equal to or greater than $20; however, if the price per share paid in connection with such change in control is less than $20, then no OneSpaWorld common shares will be issued and all the rights to receive the shares will be forfeited for no consideration, and (iii) ten years from the date of the Business Combination agreement.
Public Warrants
Each whole Public Warrant is exercisable to purchase one share of common stock and only whole warrants are exercisable (See Note 1). The Public Warrants became exercisable 30 days after the completion of the Business Combination. Each whole Public Warrant entitles the holder to purchase one share of OneSpaWorld common stock at an exercise price of $11.50. For the period from March 20, 2019 to December 31, 2019 (Successor Period), 1,100 Public Warrants were converted into 1,100 OneSpaWorld common shares. As of December 31, 2019, 24,498,900 Public Warrants were issued and outstanding.
Pursuant to the warrant agreement, a warrant holder may exercise its warrants only for a whole number of shares of OneSpaWorld common stock. This means that only a whole warrant may be exercised at any given time by a warrant holder. No fractional warrants will be issued upon separation of the units and only whole warrants will trade. Accordingly, unless the holder purchases at least two units, the holder will not be able to receive or trade a whole warrant. The warrants will expire five years after the date of the Business Combination or earlier upon redemption or liquidation.
The Company filed with the Securities and Exchange Commission (“SEC”) a registration statement for the registration, under the Securities Act, of the shares of OneSpaWorld common stock issuable upon exercise of the warrants. This registration statement has since been declared effective by the SEC. The Company will use its reasonable efforts to maintain the effectiveness of such registration statement, and a current prospectus relating thereto, until the expiration of the warrants in accordance with the provisions of the warrant agreement. Notwithstanding the above, if the Company’s common stock is at the time of any exercise of a warrant not listed on a national securities exchange such that it satisfies the definition of a “covered security” under Section 18(b)(1) of the Securities Act, the Company may, at its option, require holders of public warrants who exercise their warrants to do so on a “cashless basis” in accordance with Section 3(a)(9) of the Securities Act and, in the event the Company so elects, the Company will not be required to file or maintain in effect a registration statement, but the Company will be required to use its best efforts to register or qualify the shares under applicable blue sky laws to the extent an exemption is not available.
Once the warrants become exercisable, the Company may call the warrants for redemption:
|
|
• |
in whole and not in part; |
|
|
• |
at a price of $0.01 per warrant; |
|
|
• |
upon not less than 30 days’ prior written notice of redemption (the “30-day redemption period”) to each warrant holder; and |
|
|
• |
if, and only if, the reported last sale price of the Class A common stock equals or exceeds $18.00 per share for any 20 trading days within a 30-trading day period ending three business days before the Company sends the notice of redemption to the warrant holders. |
Private Placement Warrants
Certain investors (the “Investors”) purchased an aggregate of 3,105,294 Private Placement Warrants at a price of $1.00 per whole warrant in a private placement that occurred simultaneously with the closing of the Business Combination. Each whole Private Placement Warrant is exercisable for one whole share of OneSpaWorld common stock at a price of $11.50 per share. The proceeds from the purchase of the Private Placement Warrants was used to fund a portion of the cash payment payable in connection with the consummation of the Business Combination. The Private Placement Warrants will be non-redeemable and exercisable on a cashless basis so long as they are held by the Investors or their permitted transferees.
The Private Placement Warrants (including the OneSpaWorld common stock issuable upon exercise of the Private Placement Warrants) will not be transferable, assignable or saleable until 30 days after the Business Combination and they will not be redeemable so long as they are held by the Investors or their permitted transferees. Otherwise, the Private Placement Warrants have terms and provisions that are identical to those of the Public Warrants, including as to exercise price, exercisability and exercise period. If the Private Placement Warrants are held by holders other than the Sponsor or its permitted transferees, the Private Placement Warrants will be redeemable by the Company and exercisable by the holders on the same basis the Public Warrants. If holders of the Private Placement Warrants elect to exercise them on a cashless basis, they would pay the exercise price by surrendering their warrants for that number of shares of OneSpaWorld common stock equal to the quotient obtained by dividing (x) the product of the number of shares of OneSpaWorld common stock underlying the warrants, multiplied by the difference between the exercise price of the warrants and the “fair market value” (defined below) by (y) the fair market value. The “fair market value” shall mean the average reported last sale price of the Class A
F-26
common stock for the 10 trading days ending on the third trading day prior to the date on which the notice of warrant exercise is sent to the warrant agent.
9. Stock-Based Employee Compensation
Successor:
2019 Equity Incentive Plan and Stock-Based Compensation
The Company’s board of directors approved the 2019 Equity Incentive Plan (the “2019 Plan”) on March 18, 2019 and the Company’s shareholders approved the 2019 Plan on March 18, 2019. The purpose of the 2019 Plan is to make available incentives that will assist the Company to attract, retain, and motivate employees, including officers, consultants and directors. The Company may provide these incentives through the grant of share options, share appreciation rights, restricted shares, restricted share units, performance shares and units and other cash-based or share-based awards. The Equity Plan provides participants an option to defer compensation on a tax-deferred basis. Awards may be granted under the 2019 Plan to OneSpaWorld employees, including officers, directors or consultants or those of any present or future parent or subsidiary corporation or other affiliated entity. A total of 7,000,000 OneSpaWorld Shares have been authorized and reserved for issuance under the 2019 Plan. Non-cash stock-based compensation expense is included within general and administrative expense in the consolidated statements of operations. Share-based payments, to the extent they are compensatory, are recognized based on their grant date fair values. Forfeitures are recorded as they occur.
On March 26, 2019 (the “Grant Date”), a total of 4,547,076 options were granted by the Company under the 2019 Plan to executive officers of the Company. The options have an exercise price of $12.99 and expire on the sixth anniversary of the Grant Date. The options were 100% vested on the Grant Date. The options become exercisable upon the five day volume weighted average price of OneSpaWorld common shares reaching $20.00 per share. The Grant Date fair value of the option was $4.48, resulting in stock-based compensation of $20,370,900 being recognized by the Company in the period from March 20, 2019 to December 31, 2019 (Successor) in accordance with ASC Topic 718, Compensation – Stock Compensation. The Grant Date fair value of the option was estimated by a third-party valuation specialist using a Monte Carlo simulation in a risk-neutral framework assuming Geometric Motion, 2,500,000 trials, and using the following assumptions:
|
|
|
|
|
|
|
Hurdle price per share |
|
$ |
20.00 |
|
|
Strike price per share |
|
$ |
12.99 |
|
|
Average period for hurdle price, in days |
|
5 |
|
|
|
End of simulation term |
|
3/26/2025 |
|
|
|
Term of simulation |
|
6.00 years |
|
|
|
Stock price as of the Measurement Date |
|
$ |
12.99 |
|
|
Volatility |
|
|
37.5 |
% |
|
Risk-free rate (continuous) |
|
|
2.2 |
% |
|
Dividend yield (quarterly after 3 years) |
|
|
3.0 |
% |
|
Suboptimal exercise multiple |
|
2.8x |
|
|
F-27
Stock Option Activity
Stock option activity and information about stock options outstanding are summarized in the following table:
|
|
|
|
|
|
|
|
|
|
|
|
|
|
|
|
|
|
|
|
|
|
|
|
|
|
|
|
|
|
|
Number of Options |
|
|
Weighted- Average Exercise Price |
|
|
Weighted-Average Grant Date Fair Value |
|
|||
|
|
|
|
|
|
|
|
|
|
|
|
|
|
|
Outstanding at March 20, 2019 |
|
|
- |
|
|
$ |
- |
|
|
$ |
- |
|
|
Granted |
|
|
4,547,076 |
|
|
|
12.99 |
|
|
|
4.48 |
|
|
Exercised |
|
|
- |
|
|
|
- |
|
|
|
- |
|
|
Canceled |
|
|
- |
|
|
|
- |
|
|
|
- |
|
|
Outstanding at December 31, 2019 |
|
|
4,547,076 |
|
|
|
12.99 |
|
|
|
4.48 |
|
|
Vested at December 31, 2019 |
|
|
4,547,076 |
|
|
$ |
12.99 |
|
|
$ |
4.48 |
|
|
|
|
|
|
|
|
|
|
|
|
|
|
|
As of December 31, 2019, there was no unrecognized compensation cost related to the share options granted under the plan. No share options were granted during the two years ended December 31, 2018 and during the period from January 1, 2019 to March 19, 2019 (Predecessor).
Restricted Share Units
Restricted share units become unrestricted common stock upon vesting on a one-for-one basis. The cost of these awards is determined using the fair value of our common stock on the date of the grant, and compensation expense is recognized over the vesting period.
On July 30, 2019, the Company granted the board of directors a total of 60,902 OneSpaWorld Restricted Stock Units (“RSU’s”) as compensation for future service. The RSU’s fully vest at the completion of the one-year period commencing from the date of grant and had an estimated grant-date fair value of $1.0 million.
Restricted stock activity is summarized in the following table:
|
|
|
|
|
|
|
|
|
|
|
|
Restricted Share Units Activity |
|
Number of Awards |
|
|
Weighted-Average Grant Date Fair Value |
|
|
||
|
|
|
|
|
|
|
|
|
|
|
|
Non-Vested share units as of March 20, 2019 |
|
|
- |
|
|
$ |
- |
|
|
|
Granted |
|
|
60,902 |
|
|
|
15.60 |
|
|
|
Vested |
|
|
- |
|
|
|
- |
|
|
|
Canceled |
|
|
- |
|
|
|
- |
|
|
|
Non-Vested share units as of December 31, 2019 |
|
|
60,902 |
|
|
$ |
15.60 |
|
|
|
|
|
|
|
|
|
|
|
|
|
The Company recognized stock-based compensation expense of $0.4 million for the Period from March 20, 2019 through December 31, 2019 (Successor) related to the RSU’s, which is included as a component of salary and payroll taxes in the accompanying consolidated statement of operations.
As of December 31, 2019, The Company had $0.6 million of total unrecognized compensation expense related to restricted stock award grants, which will be recognized over the weighted-average period of seven months.
10. Noncontrolling Interest
The Company had a 60% controlling interest and a third party has a 40% noncontrolling interest of Medispa Limited, a Bahamian entity that is a subsidiary of the Company. The operations of MediSpa Limited relate to the delivery of non-invasive aesthetic services, provision of related services, and the sale of related products onboard passenger cruise ships and at hotel and resort spas outside the tax jurisdiction of the U.S. As of December 31, 2019 (Successor) and 2018 (Predecessor), the noncontrolling interest was $8.1 million and $3.6 million, respectively. See Note 20 for details on the Company’s Subsequent purchase of the noncontrolling interest.
11. Revenue Recognition
The Company's revenue generating activities include the following:
F-28
Service Revenues
Service revenues consist primarily of sales of health, wellness and beauty services, including a full range of massage treatments, facial treatments, nutritional/weight management consultations, teeth whitening, mindfulness services and medi-spa services to cruise ship passengers and destination resort guests. Each service or consultation represents a separate performance obligation and revenues are generally recognized immediately upon the completion of our service. Given the short duration of our performance obligation, although some services are recognized over time, there is no difference in the timing of recognition.
Product Revenues
Product revenues consist primarily of sales of health and wellness products, such as facial skincare, body care, hair care, orthotics and nutritional supplements to cruise ship passengers, destination resort guests and timetospa.com customers. Our Shop & Ship program provides guests the ability to buy retail products onboard and have products shipped directly to their home. Each product unit represents a separate performance obligation. Our performance obligations are satisfied and revenue is recognized when the customer obtains control of the product, which occurs either at the point of sale for retail sales and at the time of shipping for Shop & Ship and timetospa.com product sales. The Company provides no warranty on products sold. Shipping and handling fees charged to customers are included in net sales.
Gift Cards
The Company only offers no-fee, non-expiring gift cards to its customers. At the time gift cards are sold, no revenue is recognized; rather, the Company records a contract liability to customers. The liability is relieved, and revenue is recognized equal to the amount redeemed at the time gift cards are redeemed for products or services. The Company records revenue from unredeemed gift cards (breakage) in net sales on a pro-rata basis over the time period gift cards are redeemed. At least three years of historical data, updated annually, is used to determine actual redemption patterns. The liability for unredeemed gift cards is included in “Other current liabilities” on the Company's consolidated and combined balance sheets and was $0.8 million and $0.9 million as of December 31, 2019 and 2018, respectively.
Customer Loyalty Rewards Program
The Company initiated a customer loyalty program during October 2019 in which customers earn points based on their spending on timetospa.com. The Company recognizes the estimated net amount of the rewards that will be earned and redeemed as a reduction to net sales at the time of the initial transaction and as tender when the points are subsequently redeemed by a customer. The liability for customer loyalty programs was not material as of December 31, 2019.
Contract Balances (in thousands)
Receivables from the Company’s contracts with customers are included within accounts receivables, net. Such amounts are typically remitted to us by our cruise line or destination resort partners, except for online sales, and are net of commissions they withhold. Although paid by our cruise line partners, customers are typically required to pay with major credit cards, reducing our credit risk to individual customers. Amounts are billed immediately, and our cruise line and destination resort partners typically remit payments to us within 30 days. As of December 31, 2019 and 2018, our receivables from contracts with customers were $30,513 and $25,352, respectively.
Our contract liabilities for gift cards and customer loyalty programs are described above and have increased primarily due to advance payments for gift cards and been reduced for redemptions.
Disaggregation of Revenue and Segment Reporting
The Company operates facilities on cruise ships and in destination resorts, where we provide health and wellness, fitness and beauty services and sell related products. The Company’s Maritime and Destination Resorts operating segments are aggregated into a single reportable segment based upon similar economic characteristics, products, services, customers and delivery methods. Additionally, the Company’s operating segments represent components of the Company for which separate financial information is available that is utilized on a regular basis by the chief executive officer, who is the Company’s chief operating decision maker (CODM), in determining how to allocate the Company’s resources and evaluate performance. The following table disaggregates the Company’s revenues by revenue source and operating segment (in thousands):
F-29
|
|
|
|
|
|
|
|
|
|
|
|
|
|
|
|
|
|
Successor |
|
|
|
Predecessor |
|
||||||||
|
|
Consolidated |
|
|
|
Combined |
|
||||||||
|
|
|
|
|
|
|
|
|
|
Year Ended December 31, |
|
||||
|
|
March 20, 2019 to December 31, 2019 |
|
|
|
January 1, 2019 to March 19, 2019 |
|
2018 |
|
2017 |
|
||||
|
Service Revenues: |
|
|
|
|
|
|
|
|
|
|
|
|
|
|
|
Maritime |
$ |
308,090 |
|
|
|
$ |
81,170 |
|
$ |
368,498 |
|
$ |
342,388 |
|
|
Destination resorts |
|
31,703 |
|
|
|
|
10,110 |
|
|
42,429 |
|
|
41,298 |
|
|
Total service revenues |
|
339,793 |
|
|
|
|
91,280 |
|
|
410,927 |
|
|
383,686 |
|
|
Product revenues: |
|
|
|
|
|
|
|
|
|
|
|
|
|
|
|
Maritime |
|
99,308 |
|
|
|
|
25,794 |
|
|
123,761 |
|
|
114,368 |
|
|
Destination resorts |
|
2,003 |
|
|
|
|
633 |
|
|
2,524 |
|
|
2,835 |
|
|
Timetospa.com |
|
2,677 |
|
|
|
|
745 |
|
|
3,566 |
|
|
5,796 |
|
|
Total product revenues |
|
103,988 |
|
|
|
|
27,172 |
|
|
129,851 |
|
|
122,999 |
|
|
|
|
|
|
|
|
|
|
|
|
|
|
|
|
|
|
Total revenues |
$ |
443,781 |
|
|
|
$ |
118,452 |
|
$ |
540,778 |
|
$ |
506,685 |
|
12. Income Taxes
(Loss) income before income tax (benefit) consists of (in thousands):
|
|
Successor |
|
|
|
Predecessor |
|
||||||||
|
|
Consolidated |
|
|
|
Combined |
|
||||||||
|
|
|
|
|
|
|
|
|
|
Year Ended December 31, |
|
||||
|
|
March 20, 2019 to December 31, 2019 |
|
|
|
January 1, 2019 to March 19, 2019 |
|
2018 |
|
2017 |
|
||||
|
U.S. |
$ |
(19,901 |
) |
|
|
$ |
115 |
|
$ |
2,871 |
|
$ |
3,047 |
|
|
Foreign |
|
7,546 |
|
|
|
|
(24,787 |
) |
|
11,960 |
|
|
35,442 |
|
|
|
$ |
(12,355 |
) |
|
|
$ |
(24,672 |
) |
$ |
14,831 |
|
$ |
38,489 |
|
The income tax (benefit) expense consist of the following (in thousands):
|
|
Successor |
|
|
|
Predecessor |
|
||||||||
|
|
Consolidated |
|
|
|
Combined |
|
||||||||
|
|
|
|
|
|
|
|
|
|
Year Ended December 31, |
|
||||
|
|
March 20, 2019 to December 31, 2019 |
|
|
|
January 1, 2019 to March 19, 2019 |
|
2018 |
|
2017 |
|
||||
|
U.S. Federal |
$ |
(340 |
) |
|
|
$ |
(39 |
) |
$ |
461 |
|
$ |
3,919 |
|
|
U.S. State |
|
89 |
|
|
|
|
57 |
|
|
159 |
|
|
267 |
|
|
Foreign |
|
131 |
|
|
|
|
91 |
|
|
468 |
|
|
1,077 |
|
|
|
|
(120 |
) |
|
|
|
109 |
|
|
1,088 |
|
|
5,263 |
|
|
Current |
523 |
|
|
|
|
118 |
|
|
1,089 |
|
|
1,913 |
|
|
|
Deferred |
|
(643 |
) |
|
|
|
(9 |
) |
|
(1 |
) |
|
3,350 |
|
|
|
$ |
(120 |
) |
|
|
$ |
109 |
|
$ |
1,088 |
|
$ |
5,263 |
|
F-30
A reconciliation of the difference between the expected income tax (benefit) expense using the U.S. federal tax rate and our actual provision is as follows (in thousands):
|
|
Successor |
|
|
|
Predecessor |
|
|||||||||||||
|
|
Consolidated |
|
|
|
Combined |
|
|||||||||||||
|
|
|
|
|
|
|
|
|
|
Year Ended December 31, |
|
|||||||||
|
|
March 20, 2019 to December 31, 2019 |
|
|
|
January 1, 2019 to March 19, 2019 |
|
2018 |
|
2017 |
|
|||||||||
|
Provision using statutory |
|
|
|
|
|
|
|
|
|
|
|
|
|
|
|||||
|
U.S. federal tax rate |
$ |
(2,594 |
) |
|
|
$ |
(5,162 |
) |
$ |
3,114 |
|
$ |
13,471 |
|
|||||
|
Foreign rate differential |
|
(1,759 |
) |
|
|
|
4,780 |
|
|
(1,730 |
) |
|
(11,222 |
) |
|||||
|
Rate change on deferred |
|
- |
|
|
|
|
- |
|
|
- |
|
|
2,652 |
|
|||||
|
State taxes |
|
89 |
|
|
|
|
- |
|
|
126 |
|
|
277 |
|
|||||
|
Change in valuation allowance |
|
4,093 |
|
|
|
|
- |
|
|
(439 |
) |
|
(396 |
) |
|||||
|
Permanent differences |
|
168 |
|
|
|
|
346 |
|
|
141 |
|
|
71 |
|
|||||
|
Uncertain tax position |
|
- |
|
|
|
|
- |
|
|
(68 |
) |
|
487 |
|
|||||
|
Other |
|
(117 |
) |
|
|
|
145 |
|
|
(56 |
) |
|
(77 |
) |
|||||
|
Total |
$ |
(120 |
) |
|
|
$ |
109 |
|
$ |
1,088 |
|
$ |
5,263 |
|
|||||
The difference between the expected provision for income taxes using the 21% U.S. federal income tax rate for 2019 (Successor and Predecessor) and 2018 (Predecessor) and a 35% U.S. federal income tax rate for 2017 (Predecessor), and the Company’s actual provision is primarily attributable to the change in valuation allowance, foreign rate differential including income earned in jurisdictions not subject to income taxes, and, for the year ended December 31, 2017, the effect of the change in the U.S. corporate income tax rate on the Company’s net U.S. deferred tax assets.
A reconciliation of the beginning and ending amounts of uncertain tax positions, excluding interest and penalties, is as follows (in thousands):
|
|
Successor |
|
|
|
Predecessor |
|
||||||||||||||
|
|
Consolidated |
|
|
|
Combined |
|
||||||||||||||
|
|
|
|
|
|
|
|
|
|
Year Ended December 31, |
|
||||||||||
|
|
March 20, 2019 to December 31, 2019 |
|
|
|
January 1, 2019 to March 19, 2019 |
|
2018 |
|
2017 |
|
||||||||||
|
Beginning balance |
$ |
1,663 |
|
|
|
$ |
1,697 |
|
$ |
1,781 |
|
$ |
1,559 |
|
||||||
|
Gross (decreases) increases—prior period tax position |
|
- |
|
|
|
|
(34 |
) |
|
(84 |
) |
|
222 |
|
||||||
|
Ending balance |
$ |
1,663 |
|
|
|
$ |
1,663 |
|
$ |
1,697 |
|
$ |
1,781 |
|
||||||
As of December 31, 2019 and 2018, the Company accrued $3.9 million, for uncertain tax positions, including interest and penalties that, if recognized, would affect the effective income tax rate.
F-31
The Company classifies interest and penalties on uncertain tax positions as a component of provision for income taxes in the combined statements of operations. Accrued interest and penalties related to uncertain tax positions amounted to $2.2 million as of December 31, 2019 and 2018 and are included in income tax contingency in the accompanying consolidated and combined balance sheets.
Deferred income taxes consist of the following (in thousands):
|
|
As of December 31, |
|
|
|
As of December 31, |
|
||
|
|
2019 |
|
|
|
2018 |
|
||
|
|
Successor |
|
|
|
Predecessor |
|
||
|
|
Consolidated |
|
|
|
Combined |
|
||
|
Deferred income tax assets: |
|
|
|
|
|
|
|
|
|
Stock options |
$ |
4,807 |
|
|
|
$ |
- |
|
|
Inventory reserves |
|
36 |
|
|
|
|
41 |
|
|
Allowance for doubtful accounts |
|
8 |
|
|
|
|
8 |
|
|
Depreciation and amortization |
|
1,274 |
|
|
|
|
3,731 |
|
|
Other reserves and accruals |
|
144 |
|
|
|
|
277 |
|
|
Gift certificates |
|
185 |
|
|
|
|
208 |
|
|
Net operating losses |
|
749 |
|
|
|
|
- |
|
|
Total deferred income tax assets |
|
7,203 |
|
|
|
|
4,265 |
|
|
Less valuation allowance |
|
(5,157 |
) |
|
|
|
- |
|
|
Deferred income tax asset, net |
$ |
2,046 |
|
|
|
$ |
4,265 |
|
|
Deferred income tax liability |
$ |
(375 |
) |
|
|
$ |
- |
|
|
Net deferred income tax asset |
$ |
1,671 |
|
|
|
$ |
4,265 |
|
The valuation allowance increased by $5.2 million in 2019, primarily stemming from the assessment of realizability of the deferred tax asset related to U.S. stock compensation.
As of December 31, 2019, we had approximately $3.7 million of foreign tax operating loss carryforwards expiring as follows (in millions):
|
Expires |
|
|
|
|
2020 |
$ |
0.4 |
|
|
2021 |
|
0.6 |
|
|
2022 |
|
0.3 |
|
|
2023 |
|
0.5 |
|
|
2024 |
|
0.5 |
|
|
2026 |
|
0.3 |
|
|
2027 |
|
0.2 |
|
|
2028 |
|
0.2 |
|
|
Indefinite |
|
0.7 |
|
|
Total |
$ |
3.7 |
|
As the Company accounts for income taxes under the separate return method for the predecessor period, the combined statements of equity for period from January 1, 2019 to March 19, 2019 (Predecessor) and years ended December 31, 2018 (Predecessor) and 2017 (Predecessor) include $0.03 million, $1.2 million, $1.0 million, respectively, of current income taxes payable that were included in net Parent investment, as such income taxes are not actually owed to the tax authorities. The Company is subject to routine audits by U.S. federal, state, local and foreign tax authorities. These audits include questioning the timing and the amount of deductions and the allocation of income among various tax jurisdictions. The tax years 2015-2019 remain subject to examination by taxing authorities throughout the world in major jurisdictions, such as the U.S. and Italy.
In November 2016, the Company was notified by a foreign tax authority of a disagreement over how the withholding tax exemption was applied on dividend distributions. On February 17, 2017, the Company received a formal assessment related to this matter. The Company is disputing the assessment and believes that adequate accrual has been established for this matter. The Company has included $(0.1) million and $0.5 million of unrecognized tax benefit in the provision for income taxes for the years ended December 31, 2018 (Predecessor) and 2017 (Predecessor), respectively, which comprises the impact of foreign exchange movements on the income tax contingency accrual.
F-32
U.S. Tax Reform
On December 22, 2017, the U.S. enacted significant changes to tax law following the passage and signing of The Tax Cuts and Jobs Act (“TCJA”). The Company has completed the analysis of the tax accounting implications of the TCJA during the year ended December 31, 2018 in accordance with the terms of SEC Staff Bulletin 118. The Company did not record any adjustments in the year ended December 31, 2018 to provisional amounts that were material to its combined financial statements.
13. Commitment and Contingencies
Cruise Line Agreements
A large portion of the Company’s revenues are generated on cruise ships. The Company has entered into agreements of varying terms with the cruise lines under which services and products are paid for by cruise passengers. These agreements provide for the Company to pay the cruise line commissions for use of their shipboard facilities, as well as fees for staff shipboard meals and accommodations. These commissions are based on a percentage of revenue, a minimum annual amount, or a combination of both. Some of the minimum commissions are calculated as a flat dollar amount while others are based upon minimum passenger per diems for passengers actually embarked on each cruise of the respective vessel. Staff shipboard meals and accommodations are charged by the cruise lines on a per staff per day basis. The Company recognizes all expenses related to cruise line commissions, minimum guarantees, and staff shipboard meals and accommodations, generally, as they are incurred and includes such expenses in cost of revenues and operating expenses in the accompanying consolidated and combined statements of operations. For cruises in process at period end, an accrual is made to record such expenses in a manner that approximates a pro-rata basis. In addition, staff-related expenses such as shipboard employee commissions are recognized in the same manner.
Pursuant to agreements that provide for minimum commissions, the Company guaranteed total minimum payments to cruise line (excluding payments based on minimum amounts per passenger per day of a cruise applicable to certain ships served by us) the following amounts as of December 31, 2019 (in thousands):
|
Year |
|
Amount |
|
|
|
2020 |
|
$ |
122,216 |
|
|
2021 |
|
|
— |
|
|
|
|
$ |
122,216 |
|
The total minimum payment guarantee amounts referenced in the above calculation does not take into account cancelled cruise voyages. Such cancelled voyages would not be subject to guaranteed minimum payments to the cruise line.
Revenues from passengers of each of the following cruise line companies accounted for more than ten percent of the Company’s total revenues in 2019 periods from March 20, 2019 to December 31, 2019 (Successor), January 1, 2019 to March 19, 2019 (Predecessor) and the years ended December 31, 2018 (Predecessor), and 2017 (Predecessor), respectively: Carnival (including Carnival, Carnival Australia, Costa, Cunard, Holland America, P&O, Princess and Seabourn cruise lines): 46.7%, 46.7%, 48.5%, and 48.6% ; Royal Caribbean (including Royal Caribbean, Pullmantur, Celebrity, Azamara and Silversea cruise lines): 22.7%, 24.6%, 21.0% and 20.8% ; and Norwegian Cruise Line (including Norwegian Cruise Line, Oceania Cruises and Regent Seven Seas Cruises) 15.2%, 12.9%, 13.8% and 13.0%.
Operating Leases
The Company leases office and warehouse space, as well as office equipment and automobiles, under operating leases. The Company also makes certain payments to the owners of the venues where destination resort health and wellness centers are located. Destination resort health and wellness centers generally require rent based on a percentage of revenues. In addition, as part of the rental arrangements for some of the destination resort health and wellness centers, the Company is required to pay a minimum annual rental regardless of whether such amount would be required to be paid under the percentage rent arrangement. Substantially all of these arrangements include renewal options ranging from three to five years.
Rent expense consist of (in thousands):
|
|
Successor |
|
|
|
Predecessor |
|
||||||||
|
|
Consolidated |
|
|
|
Combined |
|
||||||||
|
|
|
|
|
|
|
|
|
|
Year Ended December 31, |
|
||||
|
|
March 20, 2019 to December 31, 2019 |
|
|
|
January 1, 2019 to March 19, 2019 |
|
2018 |
|
2017 |
|
||||
|
|
|
|
|
|
|
|
|
|
|
|
|
|
|
|
|
Minimum rentals |
$ |
5,173 |
|
|
|
$ |
1,573 |
|
$ |
7,087 |
|
$ |
6,873 |
|
|
Contingent rentals |
|
2,039 |
|
|
|
|
689 |
|
|
2,450 |
|
|
1,949 |
|
|
|
$ |
7,212 |
|
|
|
$ |
2,262 |
|
$ |
9,537 |
|
$ |
8,822 |
|
F-33
Minimum annual commitments under operating leases at December 31, 2019 are as follows (in thousands):
|
Year |
|
Amount |
|
|
|
2020 |
|
$ |
3,581 |
|
|
2021 |
|
|
3,184 |
|
|
2022 |
|
|
2,857 |
|
|
2023 |
|
|
2,496 |
|
|
2024 |
|
|
2,550 |
|
|
Thereafter |
|
|
11,850 |
|
|
|
|
$ |
26,518 |
|
F-34
14. Changes in Accumulated Other Comprehensive Income (Loss) by Component
The following table presents the changes in accumulated other comprehensive income (loss) by component for the period March 20, 2019 to December 31, 2019 (Successor), January 1, 2019 to March 19, 2019 (Predecessor) and the years ended December 31, 2018 (Predecessor) and 2017 (Predecessor), respectively (in thousands):
|
|
|
|
|
|
|
|
|
|
|
|
|
|
|
|
|
|
|
|
|
|
|
||
|
|
Successor |
|
|
|
Predecessor |
|
|||||||||||||||||
|
|
Accumulated Other Comprehensive Income (Loss) for the Period March 20, 2019 to December 31, 2019 |
|
|
|
Accumulated Other Comprehensive Income (Loss) for the period from January 1, 2019 to March 19, 2019 (2) |
|
Accumulated Other Comprehensive Income (Loss) for the year ended December 31,(2) |
|
|||||||||||||||
|
|
|
|
|
|
|
|
|
|
|
|
|
|
|
|
|
|
2018 |
|
|
2017 |
|
||
|
|
Foreign Currency Translation Adjustments |
|
|
Changes Related to Cash Flow Derivative Hedge (1) |
|
|
Accumulated Other Comprehensive Loss |
|
|
|
Foreign Currency Translation Adjustments |
|
Foreign Currency Translation Adjustments |
|
|
Foreign Currency Translation Adjustments |
|
||||||
|
Accumulated other comprehensive loss, beginning of the period |
$ |
- |
|
|
$ |
- |
|
|
$ |
- |
|
|
|
$ |
(649 |
) |
$ |
(356 |
) |
|
$ |
(725 |
) |
|
Other comprehensive (loss) income before reclassifications |
|
(183 |
) |
|
|
1,109 |
|
|
|
926 |
|
|
|
|
(165 |
) |
|
(293 |
) |
|
|
369 |
|
|
Amounts reclassified from accumulated other comprehensive income (loss) |
|
- |
|
|
|
(207 |
) |
|
|
(207 |
) |
|
|
|
- |
|
|
- |
|
|
|
- |
|
|
Net current period other comprehensive (loss) income |
|
(183 |
) |
|
|
902 |
|
|
|
719 |
|
|
|
|
(165 |
) |
|
(293 |
) |
|
|
369 |
|
|
Ending balance |
$ |
(183 |
) |
|
$ |
902 |
|
|
$ |
719 |
|
|
|
$ |
(814 |
) |
$ |
(649 |
) |
|
$ |
(356 |
) |
|
(1) |
See Note 15. |
|
(2) |
For the years ended December 31, 2018 (Predecessor) and 2017 (Predecessor), the only component of other comprehensive income (loss) was foreign currency translation adjustments. |
15. Fair Value Measurements and Derivatives
Fair Value Measurements
The Company’s outstanding long-term debt as of December31, 2019 (Successor) was recently originated and bears variable interest rates. As a result, the Company believes that the fair value of long-term debt as of December 31, 2019 approximates its carrying amount. The fair value of outstanding long-term debt as of December 31, 2018 (Predecessor) is estimated at $372.2 million using a discounted cash flow analysis based on current market interest rates for debt issuances with similar remaining years-to-maturity and adjusted for credit risk, which represents a Level 3 measurement in the fair value hierarchy.
F-35
Assets and liabilities that are recorded at fair value have been categorized based upon the fair value hierarchy. The following table presents information about the Company’s financial instruments recorded at fair value on a recurring basis (in thousands):
|
|
|
|
|
Fair Value Measurements at December 31, 2019 Using |
|
|||||||||||||
|
Description |
|
Balance Sheet Location |
|
Total |
|
|
Level 1 |
|
|
Level 2 |
|
|
Level 3 |
|
||||
|
Assets: |
|
|
|
|
|
|
|
|
|
|
|
|
|
|
|
|
|
|
|
Derivative financial instruments (1) |
|
Other current assets |
|
$ |
250 |
|
|
$ |
- |
|
|
$ |
250 |
|
|
$ |
- |
|
|
Derivative financial instruments (1) |
|
Other non-current assets |
|
|
652 |
|
|
|
- |
|
|
|
652 |
|
|
|
- |
|
|
Total Assets |
|
|
|
|
902 |
|
|
|
- |
|
|
|
902 |
|
|
|
- |
|
|
|
|
|
|
|
|
|
|
|
|
|
|
|
|
|
|
|
|
|
|
Liabilities: |
|
|
|
|
|
|
|
|
|
|
|
|
|
|
|
|
|
|
|
Derivative financial instruments (1) |
|
|
|
|
- |
|
|
|
- |
|
|
|
- |
|
|
|
- |
|
|
Total Liabilities |
|
|
|
$ |
- |
|
|
$ |
- |
|
|
$ |
- |
|
|
$ |
- |
|
|
|
|
|
|
|
|
|
|
|
|
|
|
|
|
|
|
|
|
|
|
(1) |
Consists of an interest rate swap. |
Derivatives
Successor:
Market risk associated with the Company’s long-term floating rate debt is the potential increase in interest expense from an increase in interest rates. The Company’s objectives in using interest rate derivatives are to add stability to interest expense and to manage its exposure to interest rate movements.
The Company assesses whether derivatives used in hedging transactions are “highly effective” in offsetting changes in the cash flow of its hedged forecasted transactions. The Company uses regression analysis for this hedge relationship and high effectiveness is achieved when a statistically valid relationship reflects a high degree of offset and correlation between the fair values of the derivative and the hedged forecasted transaction. Cash flows from the derivatives are classified in the same category as the cash flows from the underlying hedged transaction. The Company classifies derivative instrument cash flows from hedges of benchmark interest rate as operating activities due to the nature of the hedged item. If it is determined that the hedged forecasted transaction is no longer probable of occurring, then the amount recognized in accumulated other comprehensive income (loss) is released to earnings.
The Company monitors concentrations of credit risk associated with financial and other institutions with which the Company conducts significant business. Credit risk, including but not limited to, counterparty nonperformance under derivatives, is not considered significant, as the Company primarily conducts business with large, well-established financial institutions with which the Company has established relationships, and which have credit risks acceptable to the Company. The Company does not anticipate non-performance by its counterparty. The amount of the Company’s credit risk exposure is equal to the fair value of the derivative when any of the derivatives are in a net gain position.
In September 2019, the Company entered into a floating-to-fixed interest rate swap agreement to make a series of payments based on a fixed interest rate of 1.457% and receive a series of payments based on the greater of 1 Month USD LIBOR or Strike which is used to hedge the Company’s exposure to changes in cash flows associated with its variable rate Term Loan Facilities and has designated this derivative as a cash flow hedge. Both the fixed and floating payment streams are based on a notional amount of $174.7 million at the inception of the contract.
The interest rate swap agreement has a maturity date of September 19, 2024. As of December 31, 2019, the notional amount is $173.9 million. There was no ineffectiveness related to the interest rate swaps. The gain or loss on the derivative is recorded as a component of accumulated other comprehensive income (loss) and subsequently reclassified into interest expense in the same period(s) during which the hedged transaction affects earnings. The Company expects to reclassify $0.2 million of income from accumulated other comprehensive income (loss) into interest expense within the next twelve months.
The fair value of the interest rate swap contract is measured on a recurring basis by netting the discounted future fixed cash payments and the discounted expected variable cash receipts. The variable cash receipts are based on the expectation of future interest rates (forward curves) derived from observable market interest rate curves. The interest rate swap contract was categorized as Level 2 in the fair value hierarchy. The Company is not required to post cash collateral related to this derivative instrument.
F-36
The effect of the interest rate swap contract designated as cash flows hedging instrument on the condensed consolidated financial statements was as follows (in thousands):
|
Derivative |
|
Amount of Gain Recognized in Accumulated Other Comprehensive Income (Loss) on Derivative |
|
|
Location of Gain Reclassified From Accumulated Other Comprehensive Income (Loss) into Income |
|
Amount of Gain Reclassified from Accumulated Other Comprehensive Income (Loss) into Income |
|
|
|||
|
|
|
|
|
|
|
|
|
|
|
|
|
|
|
|
|
March 20, 2019 to December 31, 2019 |
|
|
|
|
March 20, 2019 to December 31, 2019 |
|
|
|||
|
|
|
|
|
|
|
|
|
|
|
|
|
|
|
Interest rate swap |
|
$ |
1,109 |
|
|
Interest expense |
|
$ |
207 |
|
|
|
|
Total |
|
$ |
1,109 |
|
|
|
|
$ |
207 |
|
|
|
|
|
|
|
|
|
|
|
|
|
|
|
|
|
|
|
|
|
|
|
|
|
|
|
|
|
|
|
Predecessor:
During the year ended December 31, 2018 and for the period from January 1, 2019 to March 19, 2019, the Company did not enter into or transact any derivative contracts, nor did the Company have any derivative contracts outstanding as of December 31, 2018.
16. Transactions with Related Parties
Successor:
One Spa World LLC, a subsidiary of OneSpaWorld, entered into a transition services agreement, concurrent with the closing of the Business Combination, with Steiner Management Services, LLC (“SMS”), which became effective at the time of the closing. This agreement provides for the provision by SMS and its affiliates and third-party providers of certain services, including accounting, information technology and legal services, to certain subsidiaries of OneSpaWorld until December 31, 2020 in exchange for approximately $360,000.
Predecessor:
OSW Predecessor entered into an Executive Services Agreement, concurrent with the closing of the Business Combination, with Nemo Investor Aggregator, Limited, the parent company of Steiner Leisure, which became effective at the time of the closing. The agreement provides that after the closing of the Business Combination, Leonard Fluxman and Stephen Lazarus are to be made available to provide certain transition services to Nemo, until December 31, 2020 in exchange for $850,000.
The Company purchases beauty products from former wholly-owned subsidiaries of the Parent through March 1, 2019 for resale to its customers. In 2017, the Company entered into a supply agreement with a wholly-owned subsidiary of the Parent company, which established the prices at which beauty products will be purchased by the Company from the supplier for a term of ten years. This supply agreement was subsequently amended and restated in 2018.
Purchases of beauty products from related parties and cost of revenues are as follows (in thousands):
|
|
|
Predecessor |
|
||||||||||
|
|
|
January 1, 2019 to March 19, 2019 |
|
Year Ended December 31, 2018 |
|
Year Ended December 31, 2017 |
|
Year Ended December 31, 2016 |
|
||||
|
Purchases |
|
$ |
2,026 |
|
$ |
25,491 |
|
$ |
20,943 |
|
$ |
35,390 |
|
|
Cost of revenues |
|
$ |
1,828 |
|
$ |
22,995 |
|
$ |
28,903 |
|
$ |
36,114 |
|
As of December 31, 2018, inventories on hand related to these purchases and accounts payable owed to the supplier entities related to the purchases is as follows (in thousands):
|
|
|
|
|
|
|
Inventory |
|
$ |
17,268 |
|
|
Accounts payable—related parties |
|
$ |
6,553 |
|
The Company entered into a loan agreement with a wholly-owned subsidiary of the Parent, for €5.0 million on February 25, 2016. The note receivable is due in full by January 3, 2021 and bears an annual interest rate of 7.50%. The note receivable is accounted for on an amortized cost basis, and interest is recognized using the effective interest rate method. On July 27, 2018, the Parent settled the
F-37
outstanding principal amount and all accrued interest under this loan agreement. This note receivable from affiliate of Parent and related unpaid accrued interest forgiven by Parent totaling approximately $6.8 million were considered contributions of capital from the Parent in the consolidated and combined financial statements of the Company. Interest income earned on the loan was $0.2 million and $0.3 million for the years ended December 31, 2018 (Predecessor) and 2017 (Predecessor), respectively, which is included in the consolidated and combined statements of operations.
The Company receives services and support from various functions performed by the Parent. These expenses relate to allocations of Parent corporate overhead. Included in Salary and Payroll taxes in the combined statements of operations for the years ended December 31, 2018 (Predecessor) and 2017 (Predecessor) were $9.1 million and $9.2 million, respectively. Included in Administrative expenses in the combined statements of operations the years ended December 31, 2018 (Predecessor) and 2017 (Predecessor) were $2.6 million and $2.5 million, respectively.
Predecessor and Successor:
OSW entered into a Management Agreement, dated May 25, 2018 and amended and restated October 25, 2018, with Bliss World LLC, an indirect subsidiary of Steiner Leisure, which became effective at the time of the closing of the Business Combination. The agreement provides that OSW will manage the operation of nine U.S. health and wellness centers on behalf of Bliss World LLC in exchange for approximately $1.25 million in the aggregate for the year ended December 31, 2019. Subject to certain customary early termination rights, the agreement terminates, with respect to each health and wellness center, upon expiration or termination of the respective lease for each such health and wellness center.
On August 3, 2018, OSW entered into a lease of office space in Coral Gables, Florida (the “Coral Gables Lease”) with an initial lease term of twelve years and options to renew for two periods of five years each. Additionally, on August 3, 2018, OSW entered into a sublease of the Coral Gables Lease with SMS, with an initial term of five years and an annual rent amount of approximately $480,000.
17. Profit Sharing Plans
Eligible employees participate in the Company’s profit sharing retirement plan (Successor and Predecessor) and a profit sharing plan of the Parent (Predecessor), which are qualified under Section 401(k) of the Internal Revenue Code. With respect to the Parent’s profit sharing retirement plan, the Company’s Parent makes discretionary annual matching contributions in cash based on a percentage of eligible employee compensation deferrals. The contribution to the plans, included in salary and payroll taxes in the consolidated and combined statements of operations, for the periods March 20, 2019 to December 31, 2019 (Successor), January 1, 2019 to March 19, 2019 (Predecessor), and for the years ended December 31, 2018 (Predecessor) and 2017 (Predecessor) was $0.2 million, $0.01 million, $0.3 million and $0.3 million, respectively.
18. Segment and Geographic Information
The Company operates facilities on cruise ships and in destination resort health and wellness centers, which provide health and wellness services and sell beauty products onboard cruise ships and destination resort health and wellness centers. The Company’s Maritime and Destination Resorts operating segments are aggregated into a single reportable segment based upon similar economic characteristics, products, services, customers and delivery methods. Additionally, the Company’s operating segments represent components of the Company for which separate financial information is available that is utilized on a regular basis by the chief executive officer, who is the Company’s chief operating decision maker (CODM), in determining how to allocate the Company’s resources and evaluate performance.
The basis for determining the geographic information below is based on the countries in which the Company operates. The Company is not able to identify the country of origin for the customers to which revenues from cruise ship operations relate. Geographic information is as follows (in thousands):
|
|
Successor |
|
Predecessor |
|
||||||||||
|
|
Consolidated |
|
Combined |
|
||||||||||
|
|
|
|
|
|
|
|
|
Year Ended December 31, |
|
|||||
|
|
March 20,2019 to December 31, 2019 |
|
January 1, 2019 to March 19, 2019 |
|
|
2018 |
|
|
2017 |
|
||||
|
Revenues: |
|
|
|
|
|
|
|
|
|
|
|
|
|
|
|
U.S. |
$ |
25,950 |
|
$ |
6,008 |
|
|
$ |
27,166 |
|
|
$ |
30,851 |
|
|
Not connected to a country |
|
399,675 |
|
|
106,886 |
|
|
|
491,244 |
|
|
|
455,782 |
|
|
Other |
|
18,156 |
|
|
5,558 |
|
|
|
22,368 |
|
|
|
20,052 |
|
|
Total |
$ |
443,781 |
|
$ |
118,452 |
|
|
$ |
540,778 |
|
|
$ |
506,685 |
|
F-38
|
|
As of December 31, |
|
||||||
|
|
2019 |
|
|
|
2018 |
|
||
|
|
Successor |
|
|
|
Predecessor |
|
||
|
|
Consolidated |
|
|
|
Combined |
|
||
|
Property and equipment, net: |
|
|
|
|
|
|
|
|
|
U.S. |
$ |
9,965 |
|
|
|
$ |
6,838 |
|
|
Not connected to a country |
|
6,826 |
|
|
|
|
2,188 |
|
|
Other |
|
5,950 |
|
|
|
|
7,213 |
|
|
Total |
$ |
22,741 |
|
|
|
$ |
16,239 |
|
19. Quarterly Selected Financial Data (Unaudited) (in thousands, except share and per share data)
|
|
|
First Quarter |
|
|
Second Quarter |
|
|
|
Third Quarter |
|
|
|
Fourth Quarter |
|
|||||||||||||||||||||||||||
|
|
|
Successor |
|
|
|
Predecessor |
|
Predecessor |
|
|
Successor |
|
|
|
Predecessor |
|
|
|
Successor |
|
|
|
Predecessor |
|
|
|
Successor |
|
|
|
Predecessor |
|
|||||||||
|
|
|
Consolidated |
|
|
|
Combined |
|
Combined |
|
|
Consolidated |
|
|
|
Combined |
|
|
|
Consolidated |
|
|
|
Combined |
|
|
|
Consolidated |
|
|
|
Combined |
|
|||||||||
|
|
|
March 20, 2019 to March 31, 2019 |
|
|
|
January 1, 2019 to March 19, 2019 |
|
Three Months Ended March 31, 2018 |
|
|
Three Months Ended June 30, 2019 |
|
|
|
Three Months Ended June 30, 2018 |
|
|
|
Three Months Ended September 30, 2019 |
|
|
|
Three Months Ended September 30, 2018 |
|
|
|
Three Months Ended December 31, 2019 |
|
|
|
Three Months Ended December 31, 2018 |
|
|||||||||
|
Revenues |
|
$ |
19,014 |
|
|
|
$ |
118,452 |
|
$ |
128,894 |
|
|
$ |
140,430 |
|
|
|
$ |
135,395 |
|
|
|
$ |
144,901 |
|
|
|
$ |
142,620 |
|
|
|
$ |
139,436 |
|
|
|
$ |
133,869 |
|
|
Operating (loss) income |
|
$ |
(21,276 |
) |
|
|
$ |
(14,943 |
) |
$ |
11,671 |
|
|
$ |
8,098 |
|
|
|
$ |
12,399 |
|
|
|
$ |
8,338 |
|
|
|
$ |
12,733 |
|
|
|
$ |
5,964 |
|
|
|
$ |
11,718 |
|
|
Net (loss) Income |
|
$ |
(22,579 |
) |
|
|
$ |
(24,781 |
) |
$ |
3,783 |
|
|
$ |
4,559 |
|
|
|
$ |
3,697 |
|
|
|
$ |
3,670 |
|
|
|
$ |
3,588 |
|
|
|
$ |
2,115 |
|
|
|
$ |
2,675 |
|
|
Net (loss) income attributable to common shareholders and Parent, respectively |
|
$ |
(22,683 |
) |
|
|
$ |
(25,459 |
) |
|
2,883 |
|
|
$ |
3,609 |
|
|
|
$ |
2,653 |
|
|
|
$ |
2,362 |
|
|
|
$ |
2,515 |
|
|
|
$ |
1,143 |
|
|
|
$ |
1,835 |
|
|
Basic (loss) earning per share |
|
$ |
(0.37 |
) |
|
|
|
- |
|
|
- |
|
|
$ |
0.06 |
|
|
|
|
- |
|
|
|
$ |
0.04 |
|
|
|
|
- |
|
|
|
$ |
0.02 |
|
|
|
|
- |
|
|
Diluted (loss) earning per share |
|
$ |
(0.37 |
) |
|
|
|
- |
|
|
- |
|
|
$ |
0.05 |
|
|
|
|
- |
|
|
|
$ |
0.03 |
|
|
|
|
- |
|
|
|
$ |
0.01 |
|
|
|
|
- |
|
|
Basic weighted average shares outstanding |
|
|
61,118,298 |
|
|
|
|
- |
|
|
- |
|
|
|
61,118,298 |
|
|
|
|
- |
|
|
|
|
61,118,387 |
|
|
|
|
- |
|
|
|
|
61,119,387 |
|
|
|
|
- |
|
|
Diluted weighted average shares outstanding |
|
|
61,118,298 |
|
|
|
|
- |
|
|
- |
|
|
|
72,047,201 |
|
|
|
|
- |
|
|
|
|
75,011,638 |
|
|
|
|
- |
|
|
|
|
75,115,386 |
|
|
|
|
- |
|
Correction of Immaterial Errors
The Company corrected errors that were immaterial to the previously reported condensed consolidated financial statements as of March 31, 2019. These errors were identified in connection with the preparation of our condensed consolidated financial statements for the second quarter of 2019 and our annual 2019 consolidated financial statements and relate to the period from March 20, 2019 to March 31, 2019 (Successor).
As previously disclosed in the second quarter of 2019, goodwill decreased by $23.0 million due to the net effect of adjusting for (i) a decrease of $26.6 million attributable to incorrectly including as consideration transferred change in control payments pursuant to employment agreements entered into in 2016 that were earned upon consummation of the Business Combination for services rendered prior to the Business Combination for which an assumed liability had been recorded in the purchase accounting treatment of the Business Combination; (ii) a decrease of $3.2 million attributable to a receivable due from Parent for the reimbursement of cash payments made by the Company on behalf of the Parent that had not been recorded in the purchase accounting treatment of the Business Combination; and (iii) an increase of $6.8 million attributable to contract acquisition costs that had incorrectly been recorded as an intangible asset in the purchase accounting of the Business Combination. Additionally, the Company corrected for $3.7 million of accrued expenses associated with Haymaker that had not been recorded upon consummation of the Business Combination and to reclassify $0.6 million of accumulated other comprehensive loss as additional paid in capital as of March 31, 2019. The effect of correcting these errors decreased additional paid in capital and stockholders’ equity by $24.1 million and $23.5 million, respectively, as of March 31, 2019.
F-39
The consolidated statement of cash flows for the period from March 20, 2019 to December 31, 2019 (Successor) has been corrected for the effect of the above referenced balance sheet adjustments and other cash flow presentation items that were corrected in the period from March 20, 2019 to March 31, 2019 (Successor). The effect of correcting i) above resulted in a $26.6 million decrease in Cash Flow Used in Investing Activities attributable to the acquisition of OSW Predecessor, which was further reduced to reflect $14.6 million of cash acquired in the Business Combination (which was previously presented as cash and cash equivalents, beginning of period). The effect of correcting iii) above resulted in a $6.8 million increase in Cash Flow Used In by Operating Activities (specifically, to decrease the change in other noncurrent assets), which was offset partially by a correction for $3.0 million associated with payment of accrued expenses. The Company also corrected the presentation of Net Proceeds From Haymaker and Institutional Investors by reducing the amount previously presented by $25.0 million, the effect of exchange rate changes on cash by reducing it by $0.6 million, and adjusted cash and cash equivalents at beginning of period to $1.7 million, which was the cash held by Haymaker at the Business Combination Date.
Additionally, in the fourth quarter of 2019, goodwill decreased by $2.8 million due to the net effect of adjusting for (i) a decrease of $2.3 million attributable to understating inventory acquired at fair value in purchase accounting of the Business Combination; (ii) a decrease of $1.0 million attributable to understating prepaid expenses and other current assets that had not been recorded in purchase accounting of the Business Combination; and (iii) an increase of $0.5 million attributable to an understatement of current liabilities in the purchase accounting of the Business Combination. The Company also corrected for $3.9 million of additional accrued expenses associated with Haymaker that had not been recorded upon consummation of the Business Combination and $1.3 million of adjustments incorrectly recorded in additional paid-in capital in consolidation upon consummation of the Business Combination. The effect of correcting these errors decreased additional paid-in capital and stockholders’ equity by $5.2 million as of March 31, 2019.
The corrections of these errors did not have any effect on the condensed consolidated and combined statement of operations for the interim periods previously presented as of March 31, 2019. Additionally, these errors did not have any effect on cash and cash equivalents at March 31, 2019.
The corrections of these errors did not have any effect on the condensed consolidated statements of operations for any of the periods previously presented. Additionally, these errors did not have any effect on cash and cash equivalents at March 31, 2019.
20. Subsequent Events
As discussed in Note 10, the Company had a 60% controlling interest and a third party had a 40% noncontrolling interest of Medispa Limited. On February 14, 2020, the Company purchased the 40% noncontrolling interest for $12.3 million in a combination of cash and 98,753 shares of the Company’s common stock.
On January 30, 2020, the World Health Organization declared the coronavirus outbreak (“COVID-19”) a “Public Health Emergency of International Concern,” and on March 10, 2020, declared COVID-19 a pandemic. The regional and global outbreak of COVID-19 has negatively impacted our operations. Quarantines, labor shortages and other disruptions, including the cancellation of cruise itineraries and the closure of resort properties, have adversely impacted our revenues, the ability to provide services, and our operating results, and may continue to have further or additional adverse impacts in the future. In addition, COVID-19 has resulted in a widespread health crisis that has adversely affected the economies and financial markets of many countries, causing an economic downturn that could affect demand for our products and services, as we have seen in recent weeks. As such, the full impact on our operations and financial condition is difficult to assess at this point in time. As of the date of this report, the extent to which the COVID-19 will impact us will depend on future developments, which are highly uncertain and cannot be predicted, including new information which may emerge concerning the severity of the COVID-19 and actions taken to contain the COVID-19 or its impact, among others.
On March 24, 2020, the Company announced that it is deferring payment of its dividend declared on February 26, 2020, for payment on May 29, 2020 to shareholders of record on April 10, 2020, until the Board of Directors reapproves its payment; and withdrawing its dividend program until further notice.
F-40