Attached files
| file | filename |
|---|---|
| EX-99.1 - EX-99.1 - ONCOR ELECTRIC DELIVERY CO LLC | oncor-ex991_25.htm |
| EX-10.1 - EX-10.1 - ONCOR ELECTRIC DELIVERY CO LLC | oncor-ex101_7.htm |
| 8-K - 8-K - ONCOR ELECTRIC DELIVERY CO LLC | oncor-8k_20200324.htm |
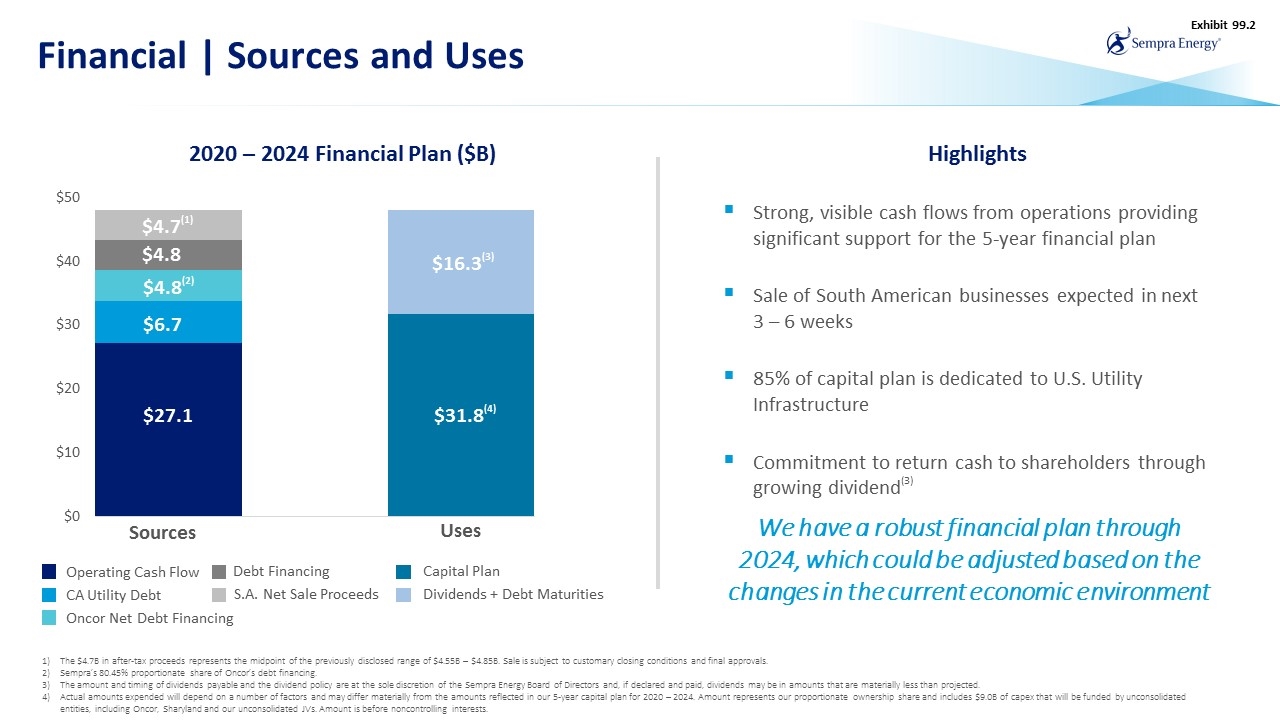
Financial | Sources and Uses ~$31.8 (2) ~$16.3 (1) $27.1 $4.7 2020 – 2024 Financial Plan ($B) $6.7 $4.8 Sources Uses The $4.7B in after-tax proceeds represents the midpoint of the previously disclosed range of $4.55B – $4.85B. Sale is subject to customary closing conditions and final approvals. Sempra’s 80.45% proportionate share of Oncor’s debt financing. The amount and timing of dividends payable and the dividend policy are at the sole discretion of the Sempra Energy Board of Directors and, if declared and paid, dividends may be in amounts that are materially less than projected. Actual amounts expended will depend on a number of factors and may differ materially from the amounts reflected in our 5-year capital plan for 2020 – 2024. Amount represents our proportionate ownership share and includes $9.0B of capex that will be funded by unconsolidated entities, including Oncor, Sharyland and our unconsolidated JVs. Amount is before noncontrolling interests. Operating Cash Flow S.A. Net Sale Proceeds Oncor Net Debt Financing $4.8 $27.1 $4.8(2) $4.7(1) CA Utility Debt $6.7 Debt Financing Capital Plan Dividends + Debt Maturities $31.8(4) $16.3(3) $4.8 Strong, visible cash flows from operations providing significant support for the 5-year financial plan Sale of South American businesses expected in next 3 – 6 weeks 85% of capital plan is dedicated to U.S. Utility Infrastructure Commitment to return cash to shareholders through growing dividend(3) Highlights We have a robust financial plan through 2024, which could be adjusted based on the changes in the current economic environment Exhibit 99.2
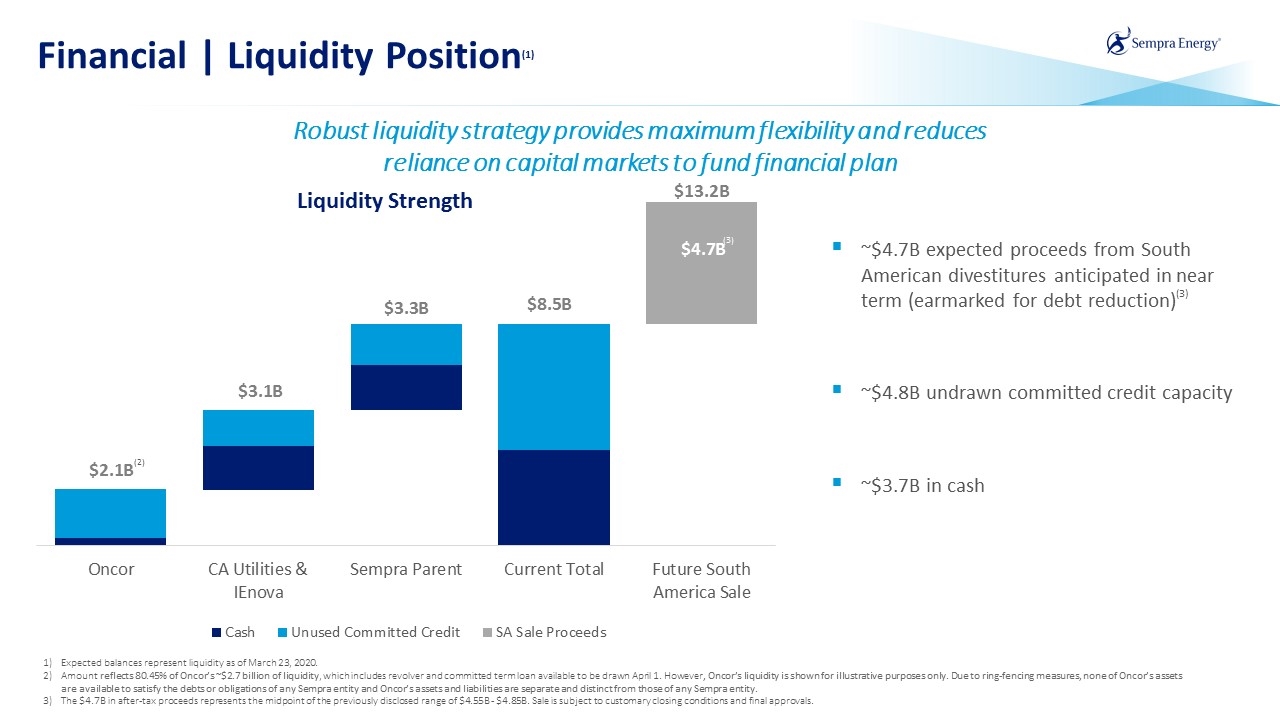
Financial | Liquidity Position(1) Robust liquidity strategy provides maximum flexibility and reduces reliance on capital markets to fund financial plan ~$4.7B expected proceeds from South American divestitures anticipated in near term (earmarked for debt reduction)(3) ~$4.8B undrawn committed credit capacity ~$3.7B in cash (2) Expected balances represent liquidity as of March 23, 2020. Amount reflects 80.45% of Oncor’s ~$2.7 billion of liquidity, which includes revolver and committed term loan available to be drawn April 1. However, Oncor’s liquidity is shown for illustrative purposes only. Due to ring-fencing measures, none of Oncor’s assets are available to satisfy the debts or obligations of any Sempra entity and Oncor’s assets and liabilities are separate and distinct from those of any Sempra entity. The $4.7B in after-tax proceeds represents the midpoint of the previously disclosed range of $4.55B - $4.85B. Sale is subject to customary closing conditions and final approvals. (3) Liquidity Strength
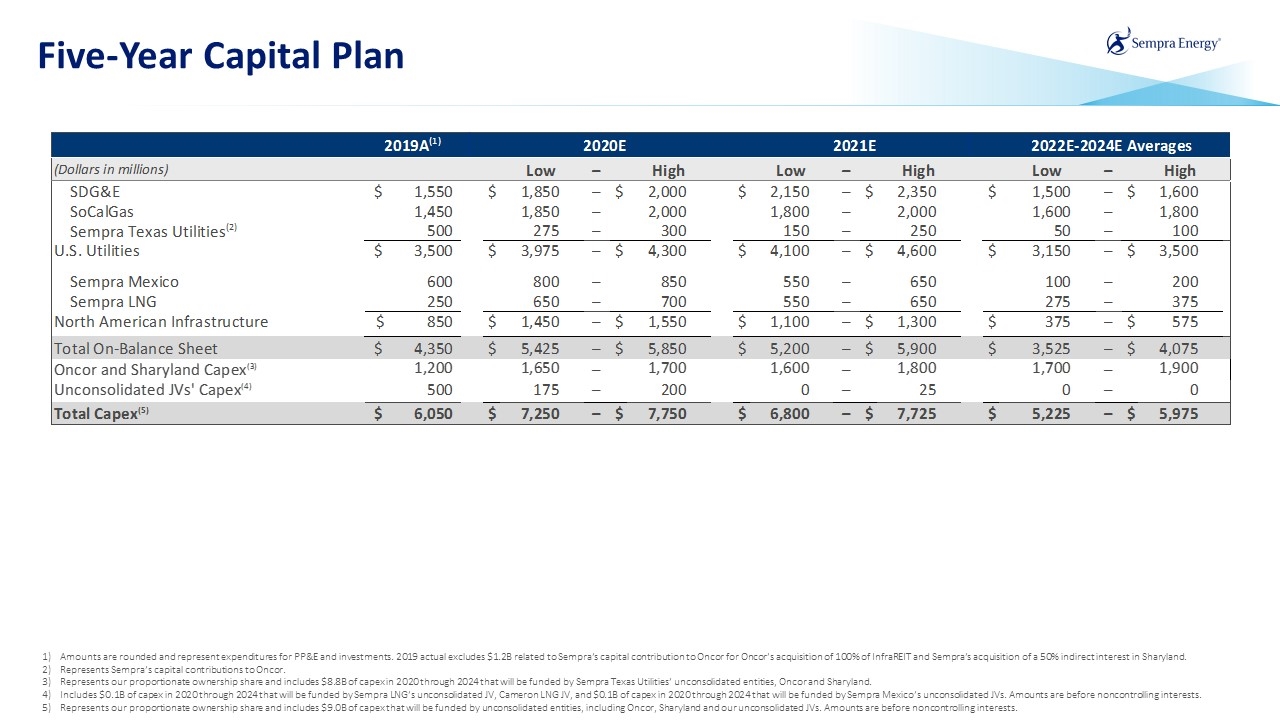
Five-Year Capital Plan Amounts are rounded and represent expenditures for PP&E and investments. 2019 actual excludes $1.2B related to Sempra’s capital contribution to Oncor for Oncor’s acquisition of 100% of InfraREIT and Sempra’s acquisition of a 50% indirect interest in Sharyland. Represents Sempra’s capital contributions to Oncor. Represents our proportionate ownership share and includes $8.8B of capex in 2020 through 2024 that will be funded by Sempra Texas Utilities’ unconsolidated entities, Oncor and Sharyland. Includes $0.1B of capex in 2020 through 2024 that will be funded by Sempra LNG’s unconsolidated JV, Cameron LNG JV, and $0.1B of capex in 2020 through 2024 that will be funded by Sempra Mexico’s unconsolidated JVs. Amounts are before noncontrolling interests. Represents our proportionate ownership share and includes $9.0B of capex that will be funded by unconsolidated entities, including Oncor, Sharyland and our unconsolidated JVs. Amounts are before noncontrolling interests. ~195% CA Utilities
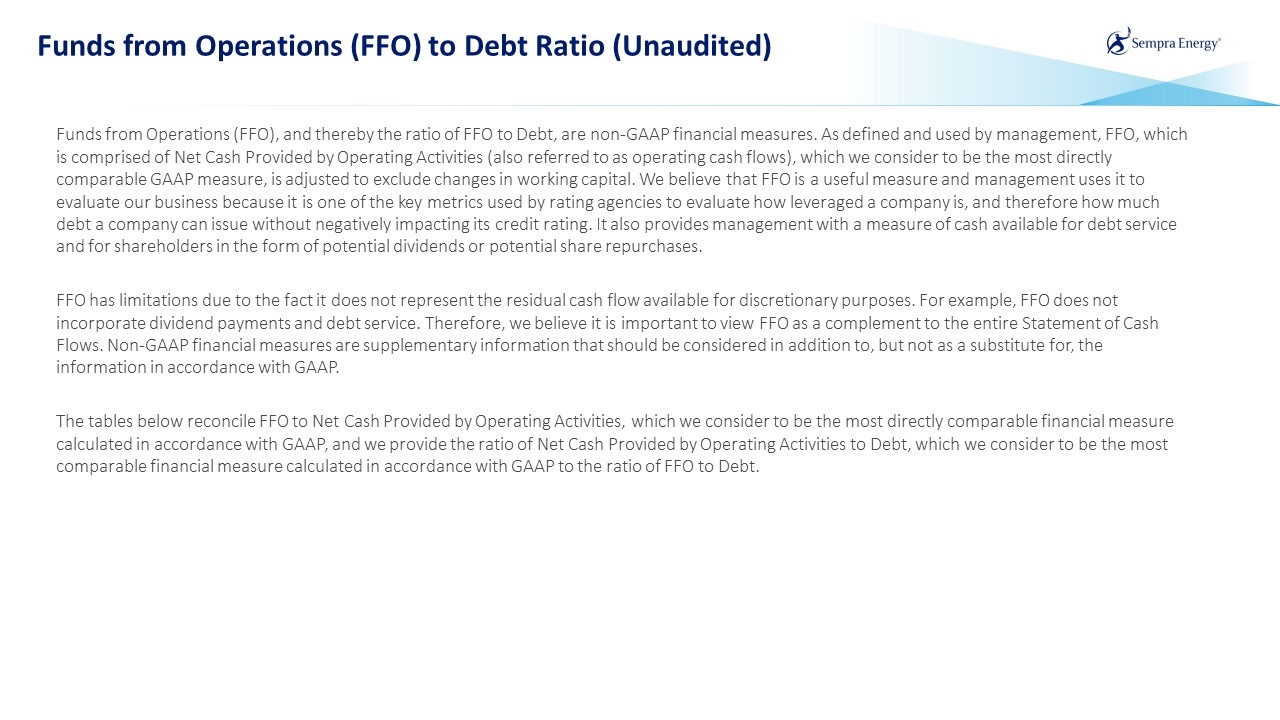
Funds from Operations (FFO) to Debt Ratio (Unaudited) Funds from Operations (FFO), and thereby the ratio of FFO to Debt, are non-GAAP financial measures. As defined and used by management, FFO, which is comprised of Net Cash Provided by Operating Activities (also referred to as operating cash flows), which we consider to be the most directly comparable GAAP measure, is adjusted to exclude changes in working capital. We believe that FFO is a useful measure and management uses it to evaluate our business because it is one of the key metrics used by rating agencies to evaluate how leveraged a company is, and therefore how much debt a company can issue without negatively impacting its credit rating. It also provides management with a measure of cash available for debt service and for shareholders in the form of potential dividends or potential share repurchases. FFO has limitations due to the fact it does not represent the residual cash flow available for discretionary purposes. For example, FFO does not incorporate dividend payments and debt service. Therefore, we believe it is important to view FFO as a complement to the entire Statement of Cash Flows. Non-GAAP financial measures are supplementary information that should be considered in addition to, but not as a substitute for, the information in accordance with GAAP. The tables below reconcile FFO to Net Cash Provided by Operating Activities, which we consider to be the most directly comparable financial measure calculated in accordance with GAAP, and we provide the ratio of Net Cash Provided by Operating Activities to Debt, which we consider to be the most comparable financial measure calculated in accordance with GAAP to the ratio of FFO to Debt.
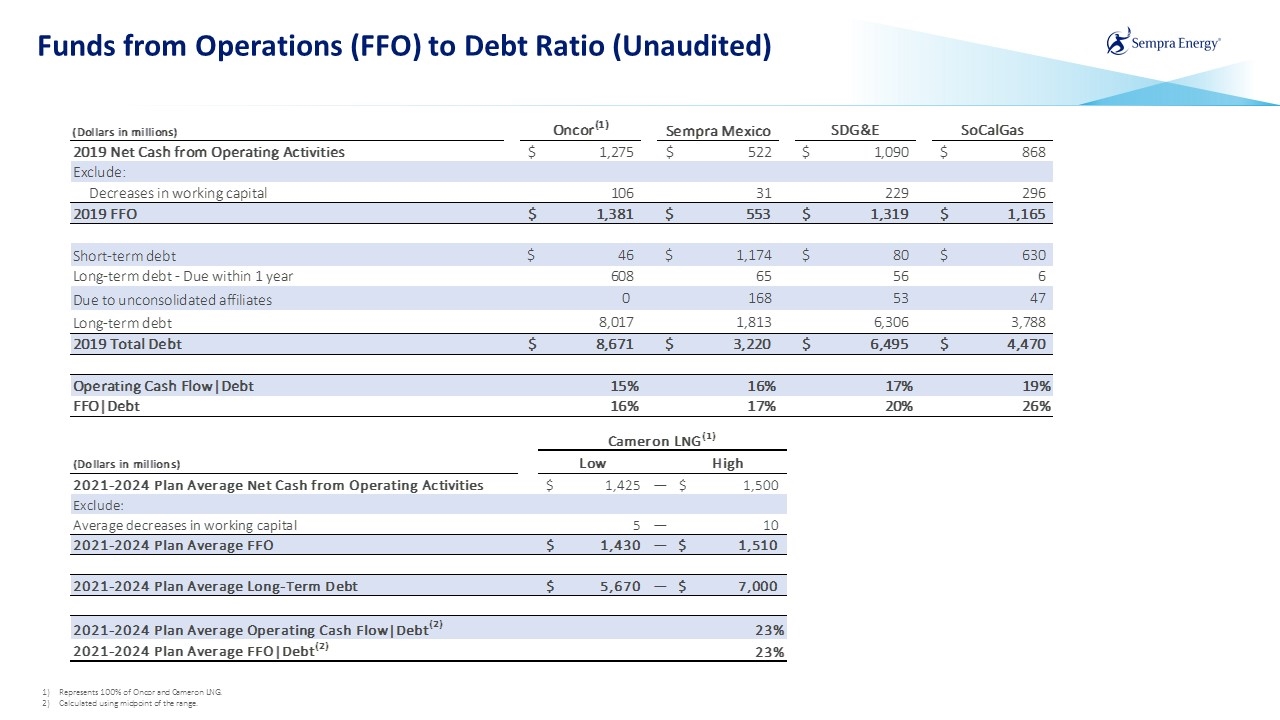
Funds from Operations (FFO) to Debt Ratio (Unaudited) Represents 100% of Oncor and Cameron LNG. Calculated using midpoint of the range.
