Attached files
| file | filename |
|---|---|
| EX-99.2 - EX-99.2 - ONCOR ELECTRIC DELIVERY CO LLC | oncor-ex992_6.htm |
| EX-10.1 - EX-10.1 - ONCOR ELECTRIC DELIVERY CO LLC | oncor-ex101_7.htm |
| 8-K - 8-K - ONCOR ELECTRIC DELIVERY CO LLC | oncor-8k_20200324.htm |
March 24, 2020 2020 Investor Day Oncor Electric Delivery Allen Nye, Chief Executive Officer Exhibit 99.1
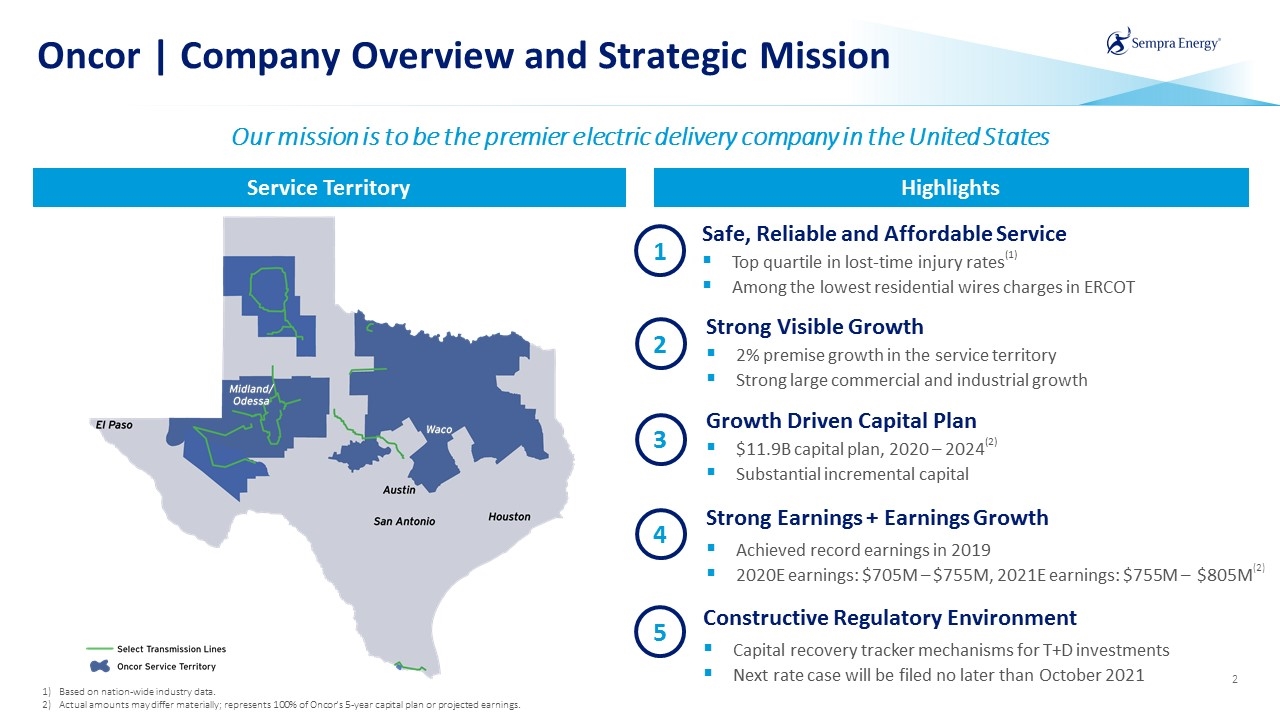
Oncor | Company Overview and Strategic Mission Based on nation-wide industry data. Actual amounts may differ materially; represents 100% of Oncor’s 5-year capital plan or projected earnings. Service Territory Highlights Our mission is to be the premier electric delivery company in the United States Safe, Reliable and Affordable Service Top quartile in lost-time injury rates(1) Among the lowest residential wires charges in ERCOT Growth Driven Capital Plan $11.9B capital plan, 2020 – 2024(2) Substantial incremental capital Strong Visible Growth 2% premise growth in the service territory Strong large commercial and industrial growth Strong Earnings + Earnings Growth Achieved record earnings in 2019 2020E earnings: $705M – $755M, 2021E earnings: $755M – $805M(2) 1 2 3 4 Constructive Regulatory Environment Capital recovery tracker mechanisms for T+D investments Next rate case will be filed no later than October 2021 5
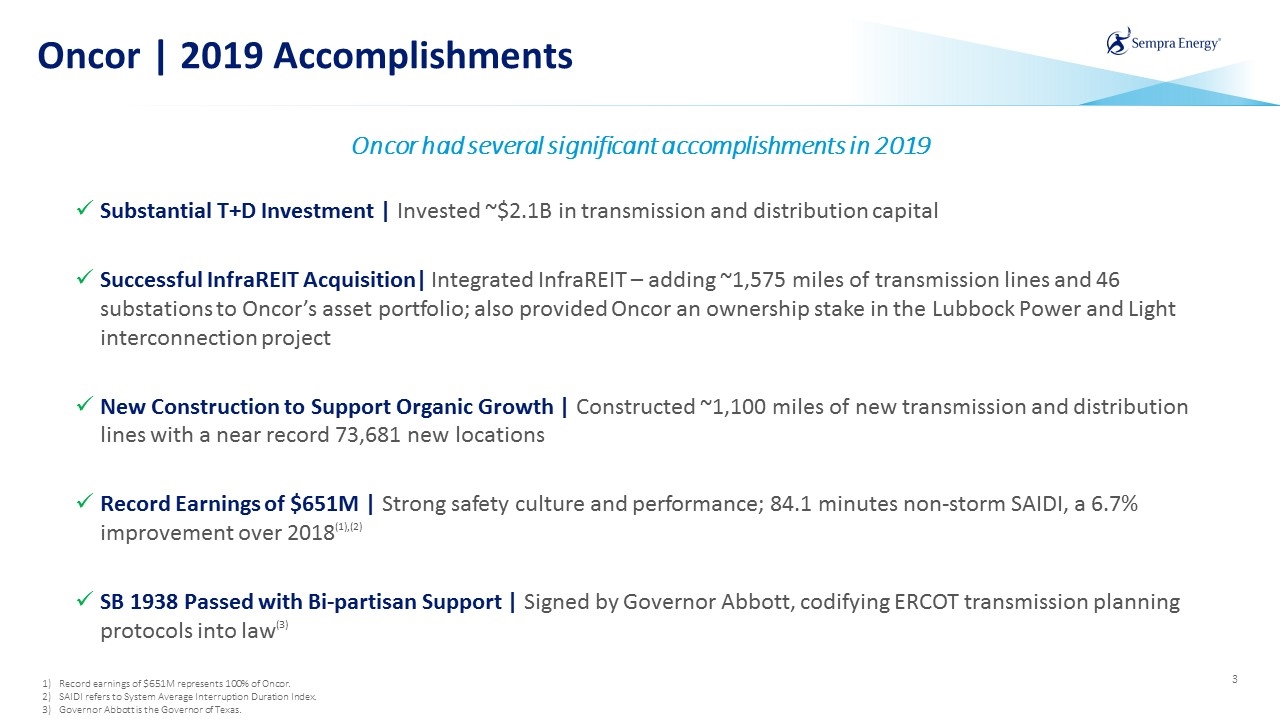
Substantial T+D Investment | Invested ~$2.1B in transmission and distribution capital Successful InfraREIT Acquisition| Integrated InfraREIT – adding ~1,575 miles of transmission lines and 46 substations to Oncor’s asset portfolio; also provided Oncor an ownership stake in the Lubbock Power and Light interconnection project New Construction to Support Organic Growth | Constructed ~1,100 miles of new transmission and distribution lines with a near record 73,681 new locations Record Earnings of $651M | Strong safety culture and performance; 84.1 minutes non-storm SAIDI, a 6.7% improvement over 2018(1),(2) SB 1938 Passed with Bi-partisan Support | Signed by Governor Abbott, codifying ERCOT transmission planning protocols into law(3) Oncor had several significant accomplishments in 2019 Record earnings of $651M represents 100% of Oncor. SAIDI refers to System Average Interruption Duration Index. Governor Abbott is the Governor of Texas. Oncor | 2019 Accomplishments
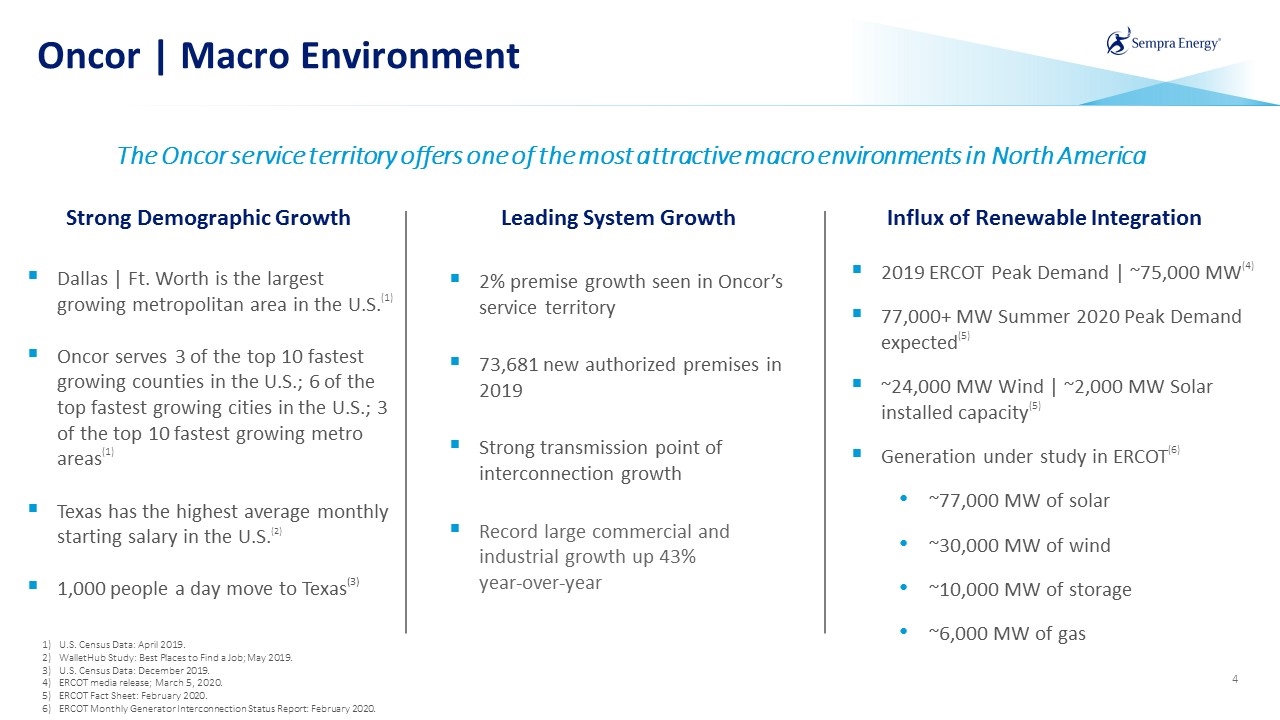
Oncor | Macro Environment U.S. Census Data: April 2019. WalletHub Study: Best Places to Find a Job; May 2019. U.S. Census Data: December 2019. ERCOT media release; March 5, 2020. ERCOT Fact Sheet: February 2020. ERCOT Monthly Generator Interconnection Status Report: February 2020. 2% premise growth seen in Oncor’s service territory 73,681 new authorized premises in 2019 Strong transmission point of interconnection growth Record large commercial and industrial growth up 43% year-over-year Dallas | Ft. Worth is the largest growing metropolitan area in the U.S.(1) Oncor serves 3 of the top 10 fastest growing counties in the U.S.; 6 of the top fastest growing cities in the U.S.; 3 of the top 10 fastest growing metro areas(1) Texas has the highest average monthly starting salary in the U.S.(2) 1,000 people a day move to Texas(3) 2019 ERCOT Peak Demand | ~75,000 MW(4) 77,000+ MW Summer 2020 Peak Demand expected(5) ~24,000 MW Wind | ~2,000 MW Solar installed capacity(5) Generation under study in ERCOT(6) ~77,000 MW of solar ~30,000 MW of wind ~10,000 MW of storage ~6,000 MW of gas Leading System Growth Strong Demographic Growth Influx of Renewable Integration The Oncor service territory offers one of the most attractive macro environments in North America
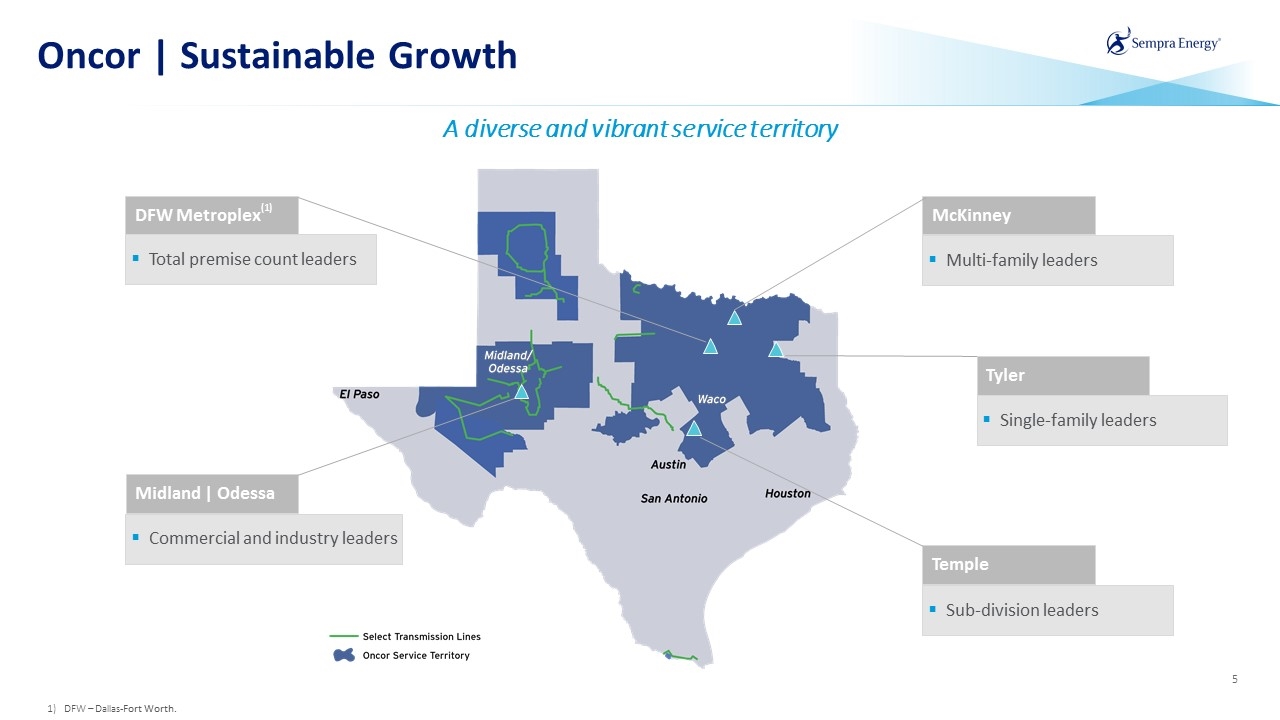
Oncor | Sustainable Growth A diverse and vibrant service territory Midland | Odessa Commercial and industry leaders DFW Metroplex(1) Total premise count leaders McKinney Multi-family leaders Tyler Single-family leaders Temple Sub-division leaders DFW – Dallas-Fort Worth.
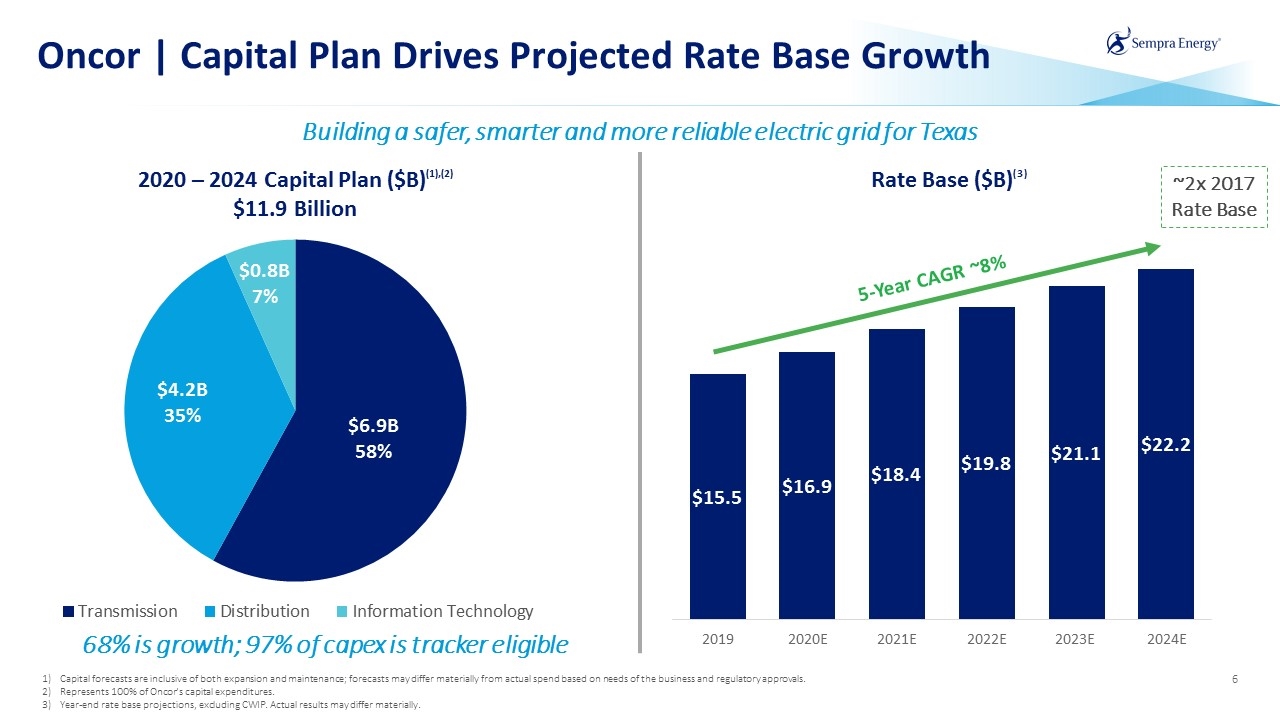
Oncor | Capital Plan Drives Projected Rate Base Growth Building a safer, smarter and more reliable electric grid for Texas Capital forecasts are inclusive of both expansion and maintenance; forecasts may differ materially from actual spend based on needs of the business and regulatory approvals. Represents 100% of Oncor’s capital expenditures. Year-end rate base projections, excluding CWIP. Actual results may differ materially. 5-Year CAGR ~8% ~2x 2017 Rate Base 68% is growth; 97% of capex is tracker eligible
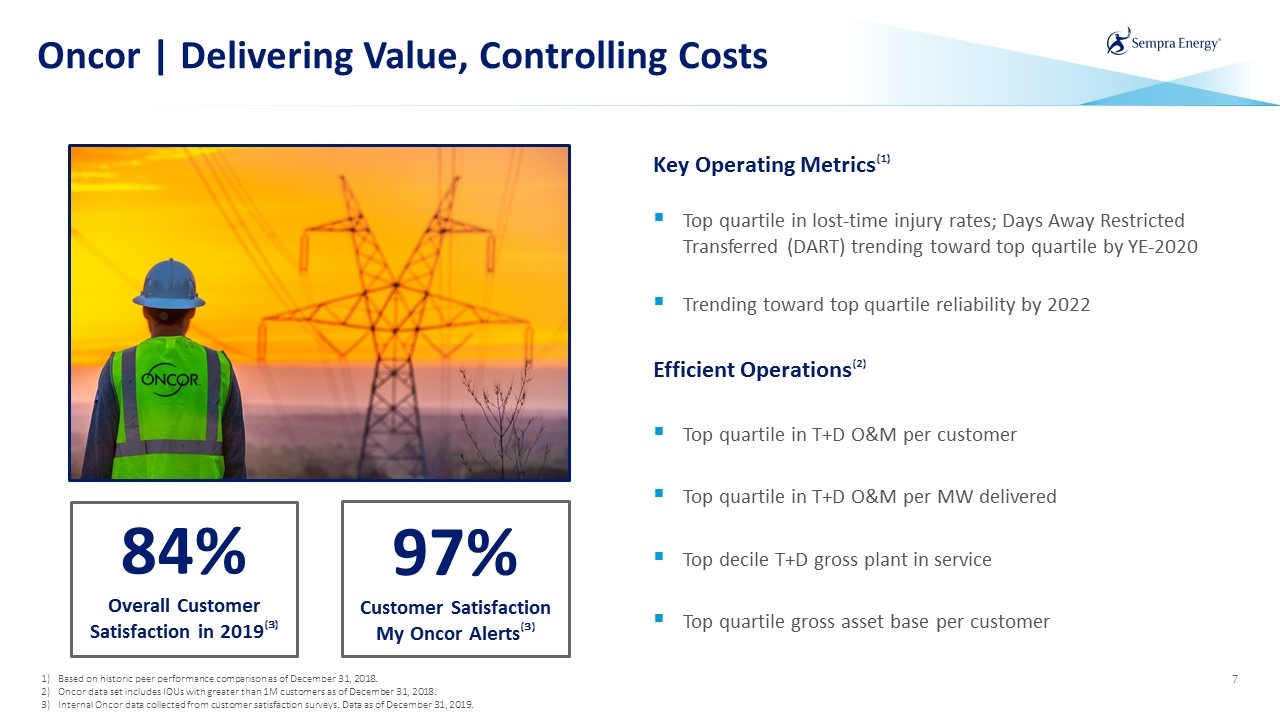
Oncor | Delivering Value, Controlling Costs Based on historic peer performance comparison as of December 31, 2018. Oncor data set includes IOUs with greater than 1M customers as of December 31, 2018. Internal Oncor data collected from customer satisfaction surveys. Data as of December 31, 2019. Key Operating Metrics(1) Top quartile in lost-time injury rates; Days Away Restricted Transferred (DART) trending toward top quartile by YE-2020 Trending toward top quartile reliability by 2022 Efficient Operations(2) Top quartile in T+D O&M per customer Top quartile in T+D O&M per MW delivered Top decile T+D gross plant in service Top quartile gross asset base per customer 84% Overall Customer Satisfaction in 2019(3) 97% Customer Satisfaction My Oncor Alerts(3)
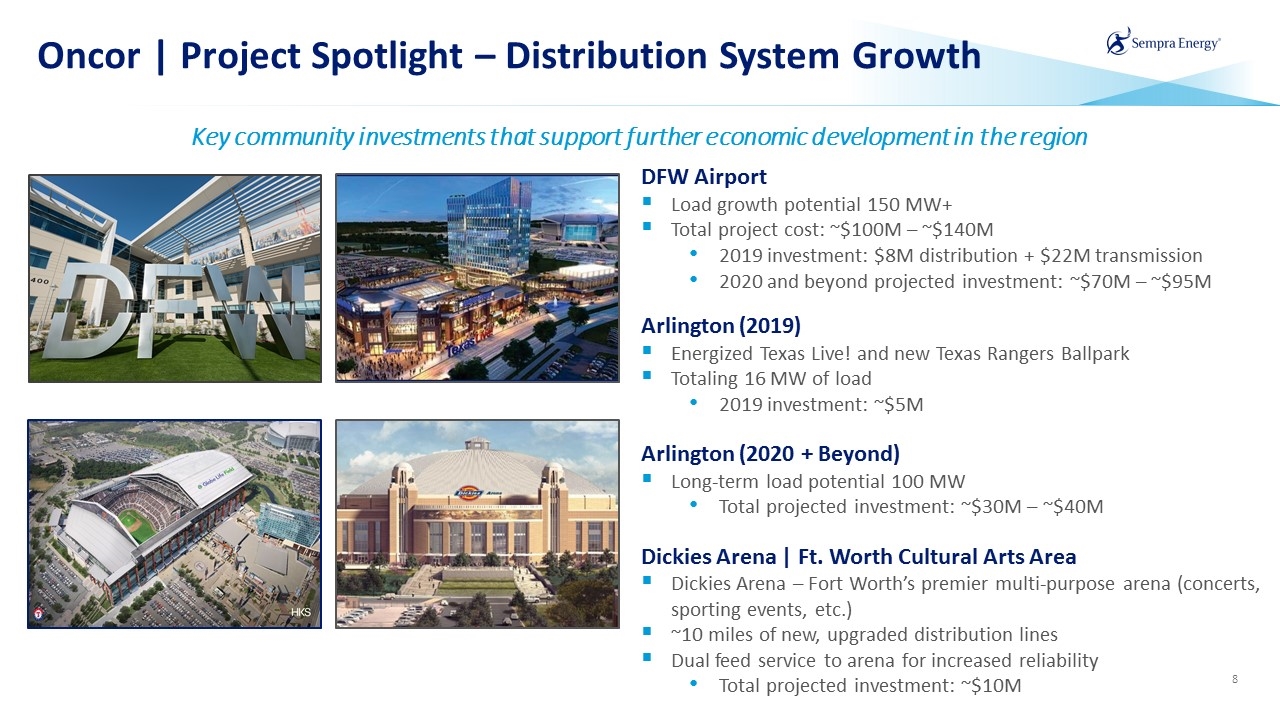
DFW Airport Load growth potential 150 MW+ Total project cost: ~$100M – ~$140M 2019 investment: $8M distribution + $22M transmission 2020 and beyond projected investment: ~$70M – ~$95M Arlington (2019) Energized Texas Live! and new Texas Rangers Ballpark Totaling 16 MW of load 2019 investment: ~$5M Arlington (2020 + Beyond) Long-term load potential 100 MW Total projected investment: ~$30M – ~$40M Dickies Arena | Ft. Worth Cultural Arts Area Dickies Arena – Fort Worth’s premier multi-purpose arena (concerts, sporting events, etc.) ~10 miles of new, upgraded distribution lines Dual feed service to arena for increased reliability Total projected investment: ~$10M Oncor | Project Spotlight – Distribution System Growth Key community investments that support further economic development in the region
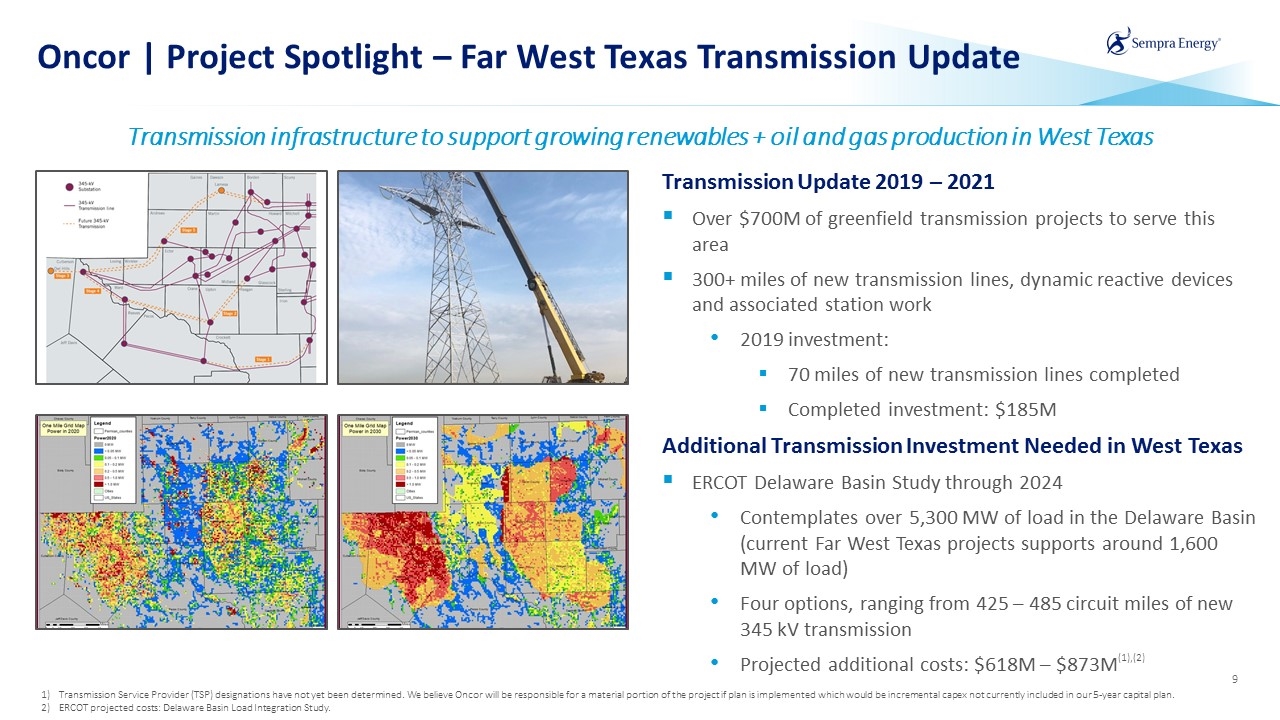
Oncor | Project Spotlight – Far West Texas Transmission Update Transmission infrastructure to support growing renewables + oil and gas production in West Texas Transmission Update 2019 – 2021 Over $700M of greenfield transmission projects to serve this area 300+ miles of new transmission lines, dynamic reactive devices and associated station work 2019 investment: 70 miles of new transmission lines completed Completed investment: $185M Additional Transmission Investment Needed in West Texas ERCOT Delaware Basin Study through 2024 Contemplates over 5,300 MW of load in the Delaware Basin (current Far West Texas projects supports around 1,600 MW of load) Four options, ranging from 425 – 485 circuit miles of new 345 kV transmission Projected additional costs: $618M – $873M(1),(2) Transmission Service Provider (TSP) designations have not yet been determined. We believe Oncor will be responsible for a material portion of the project if plan is implemented which would be incremental capex not currently included in our 5-year capital plan. ERCOT projected costs: Delaware Basin Load Integration Study.
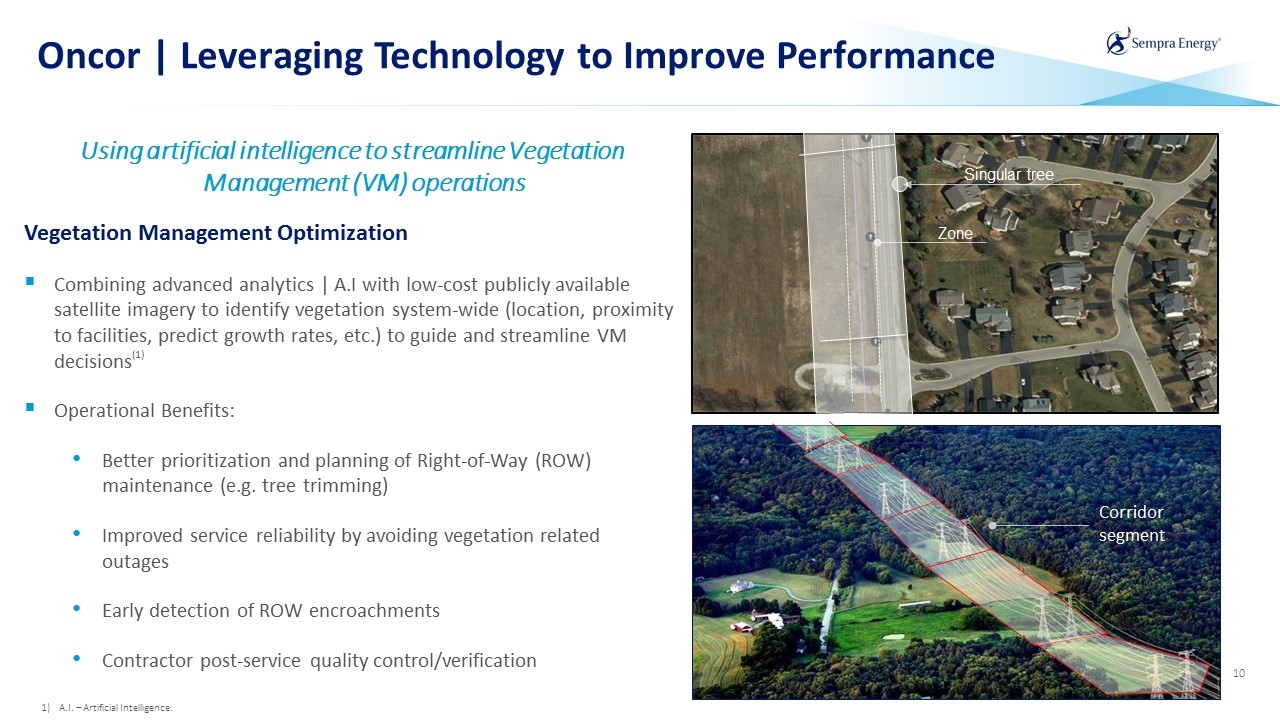
Oncor | Leveraging Technology to Improve Performance Vegetation Management Optimization Combining advanced analytics | A.I with low-cost publicly available satellite imagery to identify vegetation system-wide (location, proximity to facilities, predict growth rates, etc.) to guide and streamline VM decisions(1) Operational Benefits: Better prioritization and planning of Right-of-Way (ROW) maintenance (e.g. tree trimming) Improved service reliability by avoiding vegetation related outages Early detection of ROW encroachments Contractor post-service quality control/verification Using artificial intelligence to streamline Vegetation Management (VM) operations Zone Singular tree Corridor segment A.I. – Artificial Intelligence.
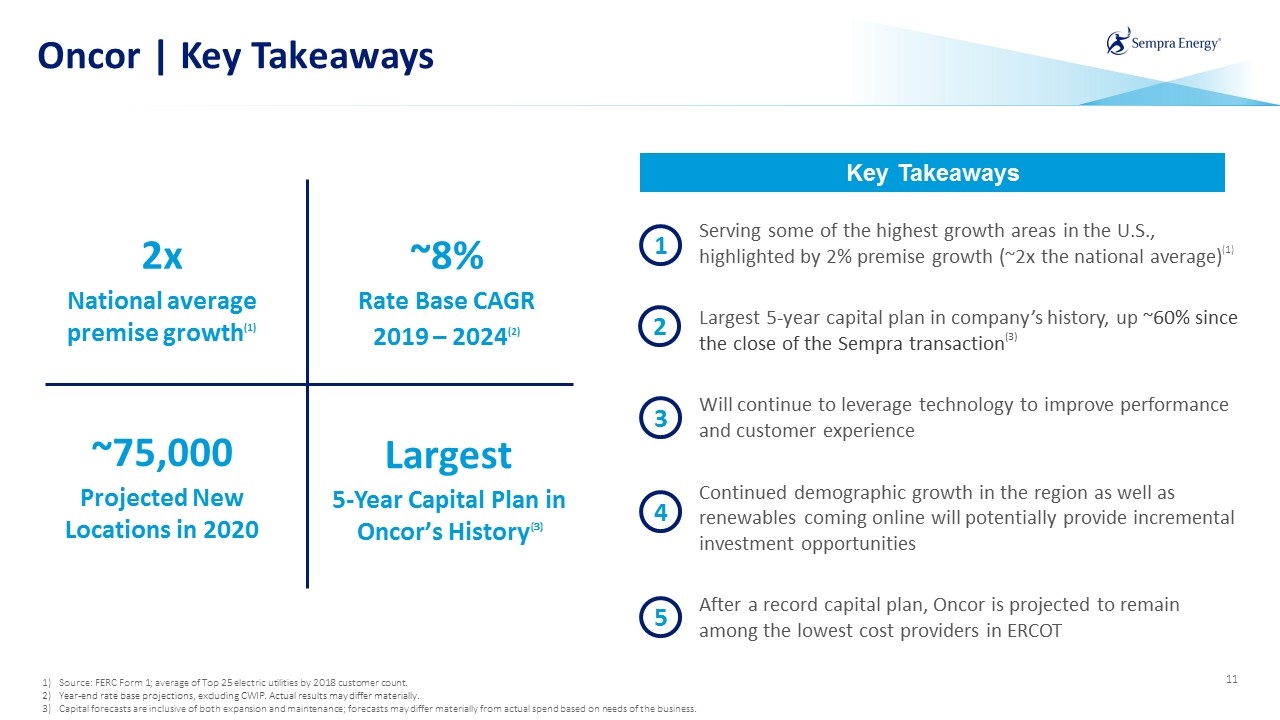
Oncor | Key Takeaways Source: FERC Form 1; average of Top 25 electric utilities by 2018 customer count. Year-end rate base projections, excluding CWIP. Actual results may differ materially. Capital forecasts are inclusive of both expansion and maintenance; forecasts may differ materially from actual spend based on needs of the business. 2x National average premise growth(1) ~75,000 Projected New Locations in 2020 Largest 5-Year Capital Plan in Oncor’s History(3) Key Takeaways Serving some of the highest growth areas in the U.S., highlighted by 2% premise growth (~2x the national average)(1) Largest 5-year capital plan in company’s history, up ~60% since the close of the Sempra transaction(3) Will continue to leverage technology to improve performance and customer experience Continued demographic growth in the region as well as renewables coming online will potentially provide incremental investment opportunities After a record capital plan, Oncor is projected to remain among the lowest cost providers in ERCOT ~8% Rate Base CAGR 2019 – 2024(2) 1 2 3 4 5
Appendix
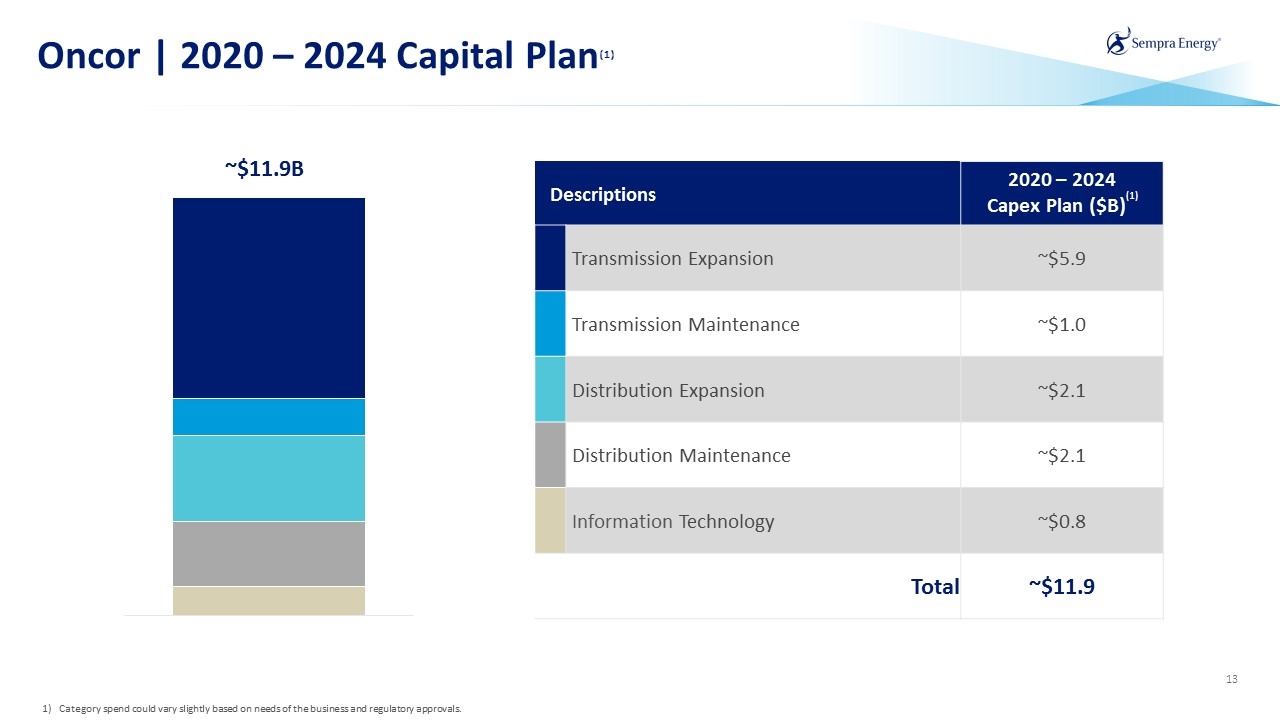
Oncor | 2020 – 2024 Capital Plan(1) Category spend could vary slightly based on needs of the business and regulatory approvals. Descriptions 2020 – 2024 Capex Plan ($B)(1) Transmission Expansion ~$5.9 Transmission Maintenance ~$1.0 Distribution Expansion ~$2.1 Distribution Maintenance ~$2.1 Information Technology ~$0.8 Total ~$11.9 ~$11.9B
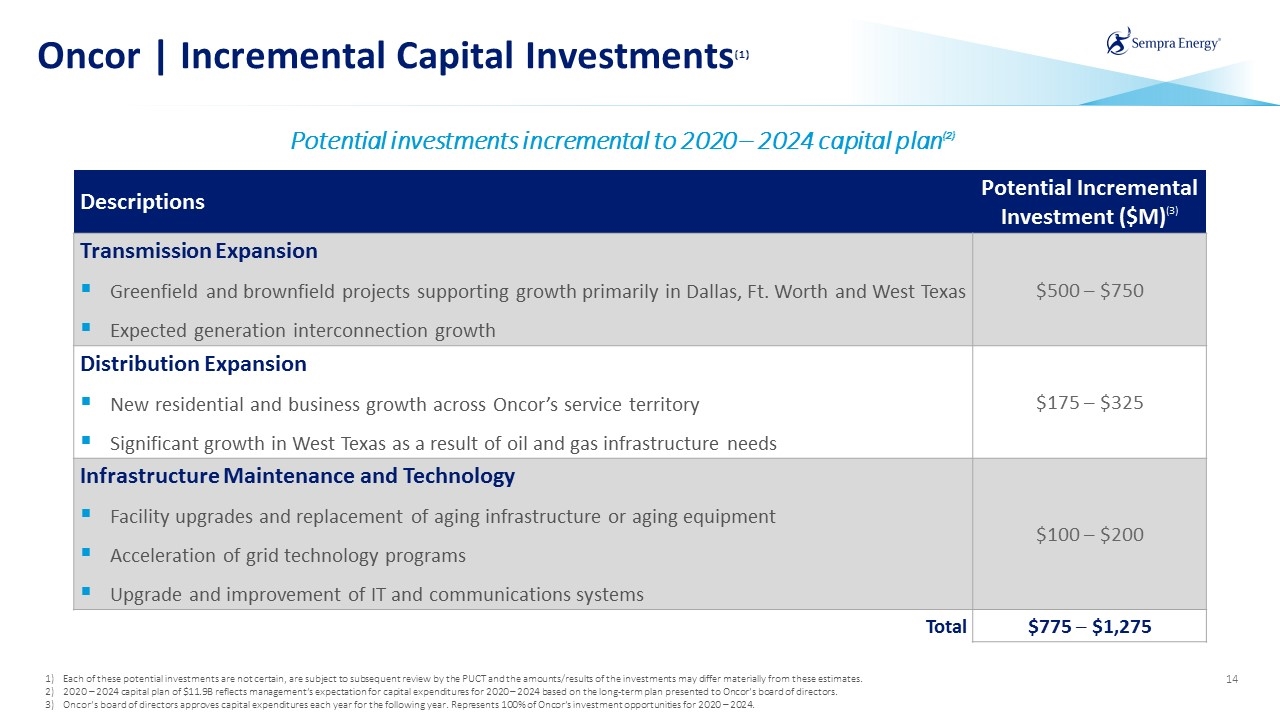
Oncor | Incremental Capital Investments(1) Potential investments incremental to 2020 – 2024 capital plan(2) Descriptions Potential Incremental Investment ($M)(3) Transmission Expansion Greenfield and brownfield projects supporting growth primarily in Dallas, Ft. Worth and West Texas Expected generation interconnection growth $500 – $750 Distribution Expansion New residential and business growth across Oncor’s service territory Significant growth in West Texas as a result of oil and gas infrastructure needs $175 – $325 Infrastructure Maintenance and Technology Facility upgrades and replacement of aging infrastructure or aging equipment Acceleration of grid technology programs Upgrade and improvement of IT and communications systems $100 – $200 Total $775 – $1,275 Each of these potential investments are not certain, are subject to subsequent review by the PUCT and the amounts/results of the investments may differ materially from these estimates. 2020 – 2024 capital plan of $11.9B reflects management’s expectation for capital expenditures for 2020 – 2024 based on the long-term plan presented to Oncor’s board of directors. Oncor’s board of directors approves capital expenditures each year for the following year. Represents 100% of Oncor’s investment opportunities for 2020 – 2024.
