Attached files
| file | filename |
|---|---|
| EX-99.1 - EXHIBIT 99.1 - IHS Markit Ltd. | ex991q120.htm |
| 8-K - 8-K - IHS Markit Ltd. | q1-20earningsrelease.htm |

Q1 2020 Earnings Supplemental Financials March 24, 2020
Forward-looking statements This presentation contains “forward-looking statements” as defined in the Private Securities Litigation Reform Act of 1995. These statements, which express management’s current views concerning future business, events, trends, contingencies, financial performance, or financial condition, appear at various places in this communication and use words like “aim,” “anticipate,” “assume,” “believe,” “continue,” “could,” “estimate,” “expect,” “forecast,” “future,” “goal,” “intend,” “likely,” “may,” “might,” “plan,” “potential,” “predict,” “project,” “see,” “seek,” “should,” “strategy,” “strive,” “target,” “will,” and “would” and similar expressions, and variations or negatives of these words. Examples of forward-looking statements include, among others, statements we make regarding: guidance and predictions relating to expected operating results, such as revenue growth and earnings; strategic actions such as acquisitions, joint ventures, and dispositions, the anticipated benefits therefrom, and our success in integrating acquired businesses; anticipated levels of capital expenditures in future periods; anticipated levels of indebtedness, capital allocation, dividends, and share repurchases in future periods; our belief that we have sufficient liquidity to fund our ongoing business operations; expectations of the effect on our financial condition of claims, litigation, environmental costs, contingent liabilities, and governmental and regulatory investigations and proceedings; and our strategy for customer retention, growth, product development, market position, financial results, and reserves. Forward-looking statements are neither historical facts nor assurances of future performance. Instead, they are based only on management’s current beliefs, expectations, and assumptions regarding the future of our business, future plans and strategies, projections, anticipated events and trends, the economy, and other future conditions. Because forward-looking statements relate to the future, they are subject to inherent uncertainties, risks, and changes in circumstances that are difficult to predict and many of which are outside of our control. Important factors that could cause our actual results and financial condition to differ materially from those indicated in the forward- looking statements are more fully discussed under the caption “Risk Factors” in our Annual Report on Form 10-K, along with our other filings with the U.S. Securities and Exchange Commission (“SEC”). However, those factors should not be considered to be a complete statement of all potential risks and uncertainties. Unlisted factors may present significant additional obstacles to the realization of forward-looking statements. Consequences of material differences in results as compared with those anticipated in the forward-looking statements could include, among other things, business disruption, operational problems, financial loss, legal liability to third parties and similar risks, any of which could have a material adverse effect on our consolidated financial condition, results of operations, credit rating, or liquidity. Therefore, you should not rely on any of these forward-looking statements. Any forward-looking statement made by us in this communication is based only on information currently available to our management and speaks only as of the date of this communication. We do not assume any obligation to publicly provide revisions or updates to any forward-looking statements, whether as a result of new information, future developments or otherwise, should circumstances change, except as otherwise required by securities and other applicable laws. Please consult our public filings with the SEC or on our website at investor.ihsmarkit.com. Non-GAAP measures Non-GAAP financial information is presented only as a supplement to IHS Markit’s financial information based on U.S. generally accepted accounting principles (“GAAP”). Non-GAAP financial information is provided to enhance the reader’s understanding of IHS Markit’s financial performance, but none of these non-GAAP financial measures are recognized terms under GAAP and should not be considered in isolation from, or as a substitute for, financial measures calculated in accordance with GAAP. Definitions of IHS Markit non-GAAP measures and reconciliations to the most directly comparable GAAP measures are provided within the schedules attached to IHS Markit’s quarterly earnings releases on the Investor Relations section of the company’s website (investor.ihsmarkit.com). This presentation also includes certain forward-looking non-GAAP financial measures. IHS Markit is unable to present a reconciliation of this forward looking non-GAAP financial information because management cannot reliably predict all of the necessary components of such measures. Accordingly, investors are cautioned not to place undue reliance on this information. IHS Markit uses non-GAAP measures in its operational and financial decision making. IHS Markit believes that such measures allow it to focus on what it deems to be more a reliable indicator of ongoing operating performance and its ability to generate cash flow from operations. IHS Markit also believes that investors may find these non-GAAP financial measures useful for the same reasons, although investors are cautioned that non-GAAP financial measures are not a substitute for GAAP financial measures or disclosures. None of these non-GAAP financial measures are recognized terms under GAAP and do not purport to be an alternative to any other GAAP measure. Non-GAAP measures are frequently used by securities analysts, investors and other interested parties in their evaluation of companies comparable to IHS Markit, many of which present non- GAAP measures when reporting their results. These measures can be useful in evaluating IHS Markit’s performance against its peer companies because IHS Markit believes the measures provide users with valuable insight into key components of GAAP financial disclosures. However, non-GAAP measures have limitations as an analytical tool. Because not all companies use identical calculations, IHS Markit’s presentation of non-GAAP financial measures may not be comparable to other similarly titled measures of other companies. They are not presentations made in accordance with GAAP, are not measures of financial condition or liquidity and should not be considered as an alternative to profit or loss for the period determined in accordance with GAAP or operating cash flows determined in accordance with GAAP. As a result, these performance measures should not be considered in isolation from, or as a substitute analysis for, results of operations as determined in accordance with GAAP.
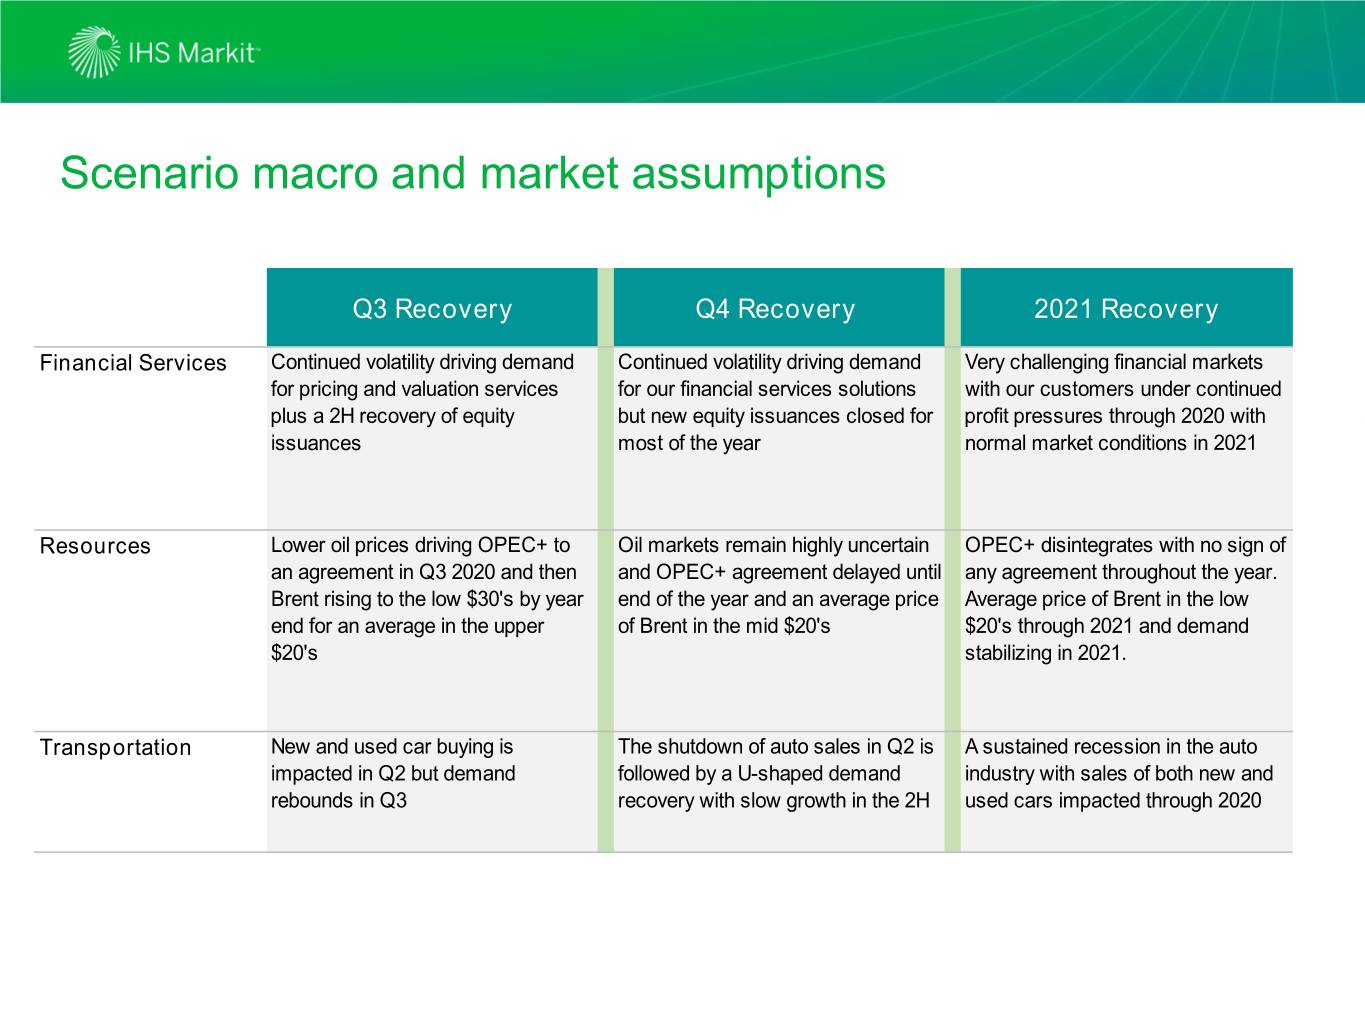
Scenario macro and market assumptions Q3 Recovery Q4 Recovery 2021 Recovery Financial Services Continued volatility driving demand Continued volatility driving demand Very challenging financial markets for pricing and valuation services for our financial services solutions with our customers under continued plus a 2H recovery of equity but new equity issuances closed for profit pressures through 2020 with issuances most of the year normal market conditions in 2021 Resources Lower oil prices driving OPEC+ to Oil markets remain highly uncertain OPEC+ disintegrates with no sign of an agreement in Q3 2020 and then and OPEC+ agreement delayed until any agreement throughout the year. Brent rising to the low $30's by year end of the year and an average price Average price of Brent in the low end for an average in the upper of Brent in the mid $20's $20's through 2021 and demand $20's stabilizing in 2021. Transportation New and used car buying is The shutdown of auto sales in Q2 is A sustained recession in the auto impacted in Q2 but demand followed by a U-shaped demand industry with sales of both new and rebounds in Q3 recovery with slow growth in the 2H used cars impacted through 2020
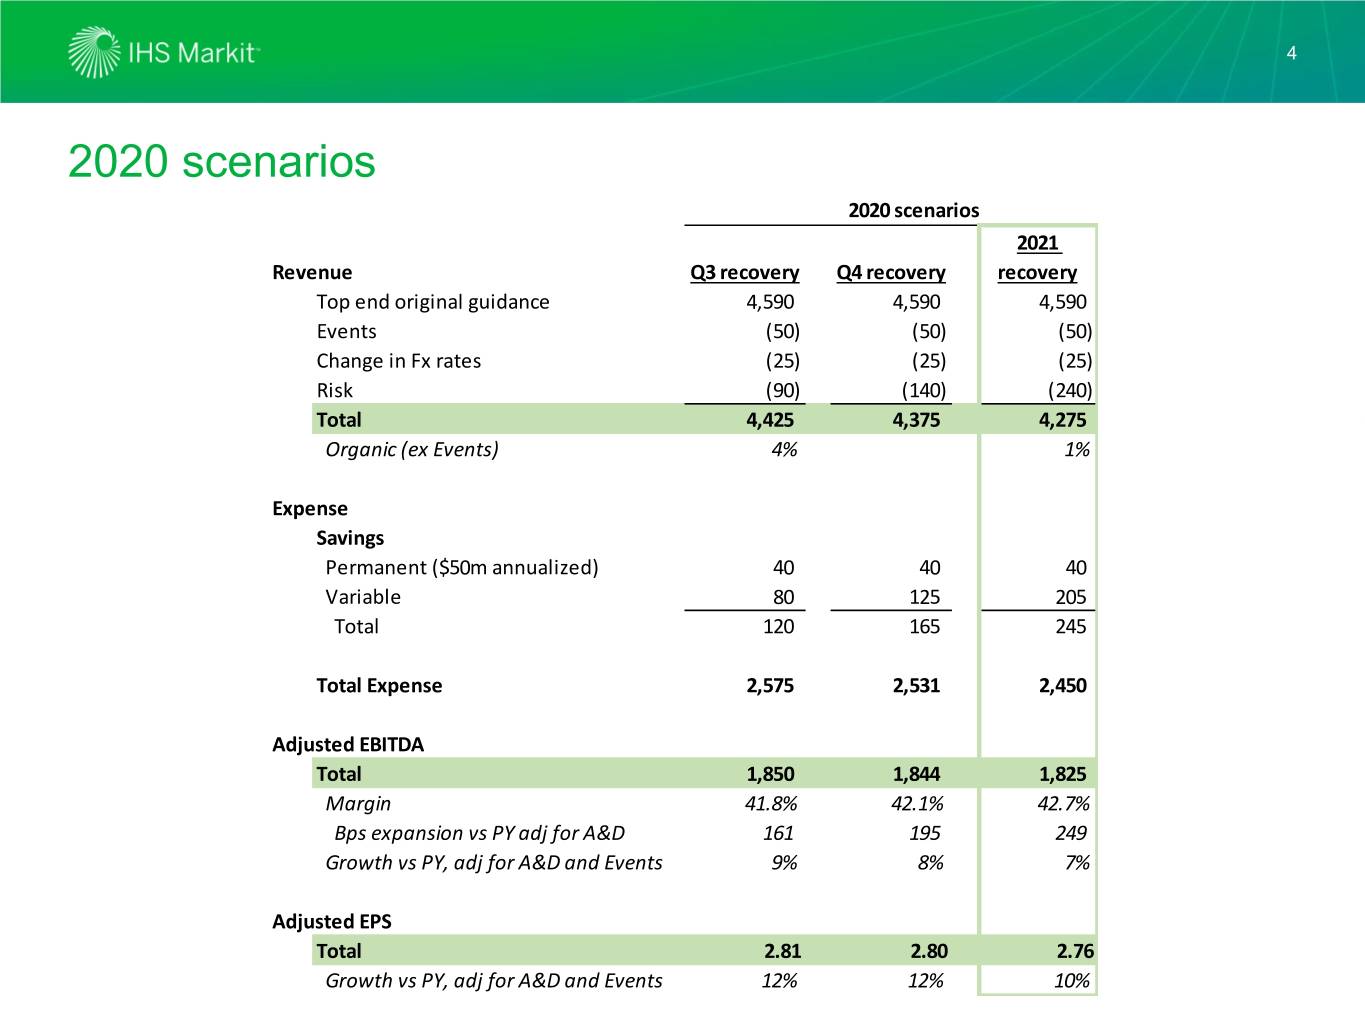
4 2020 scenarios 2020 scenarios 2021 Revenue Q3 recovery Q4 recovery recovery Top end original guidance 4,590 4,590 4,590 Events (50) (50) (50) Change in Fx rates (25) (25) (25) Risk (90) (140) (240) Total 4,425 4,375 4,275 Organic (ex Events) 4% 1% Expense Savings Permanent ($50m annualized) 40 40 40 Variable 80 125 205 Total 120 165 245 Total Expense 2,575 2,531 2,450 Adjusted EBITDA Total 1,850 1,844 1,825 Margin 41.8% 42.1% 42.7% Bps expansion vs PY adj for A&D 161 195 249 Growth vs PY, adj for A&D and Events 9% 8% 7% Adjusted EPS Total 2.81 2.80 2.76 Growth vs PY, adj for A&D and Events 12% 12% 10%
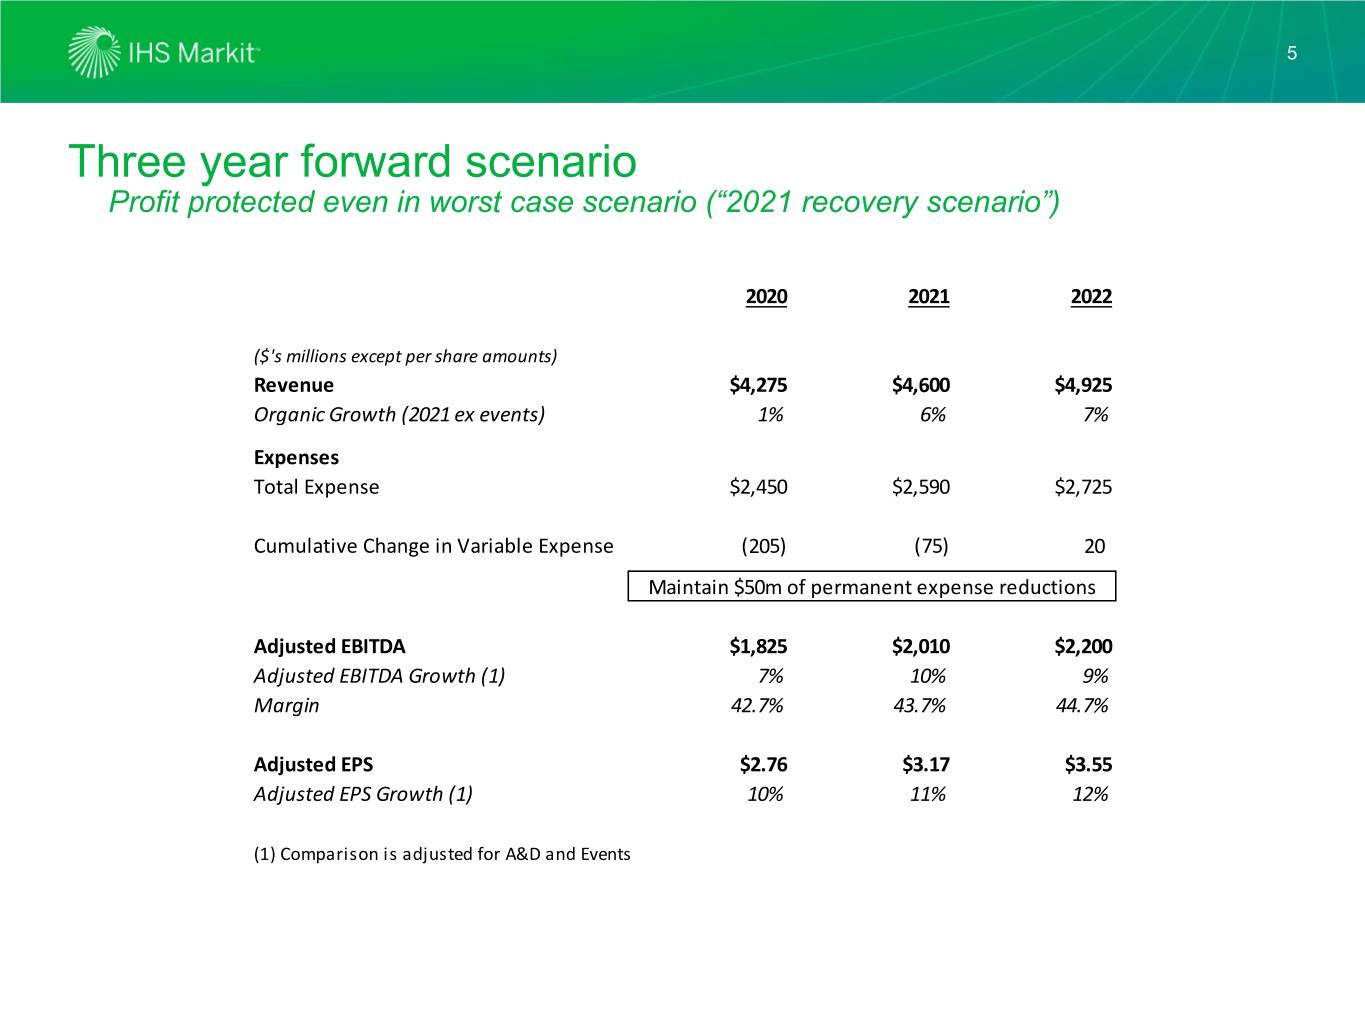
5 Three year forward scenario Profit protected even in worst case scenario (“2021 recovery scenario”) 2020 2021 2022 ($'s millions except per share amounts) Revenue $4,275 $4,600 $4,925 Organic Growth (2021 ex events) 1% 6% 7% Expenses Total Expense $2,450 $2,590 $2,725 Cumulative Change in Variable Expense (205) (75) 20 Maintain $50m of permanent expense reductions Adjusted EBITDA $1,825 $2,010 $2,200 Adjusted EBITDA Growth (1) 7% 10% 9% Margin 42.7% 43.7% 44.7% Adjusted EPS $2.76 $3.17 $3.55 Adjusted EPS Growth (1) 10% 11% 12% (1) Comparison is adjusted for A&D and Events
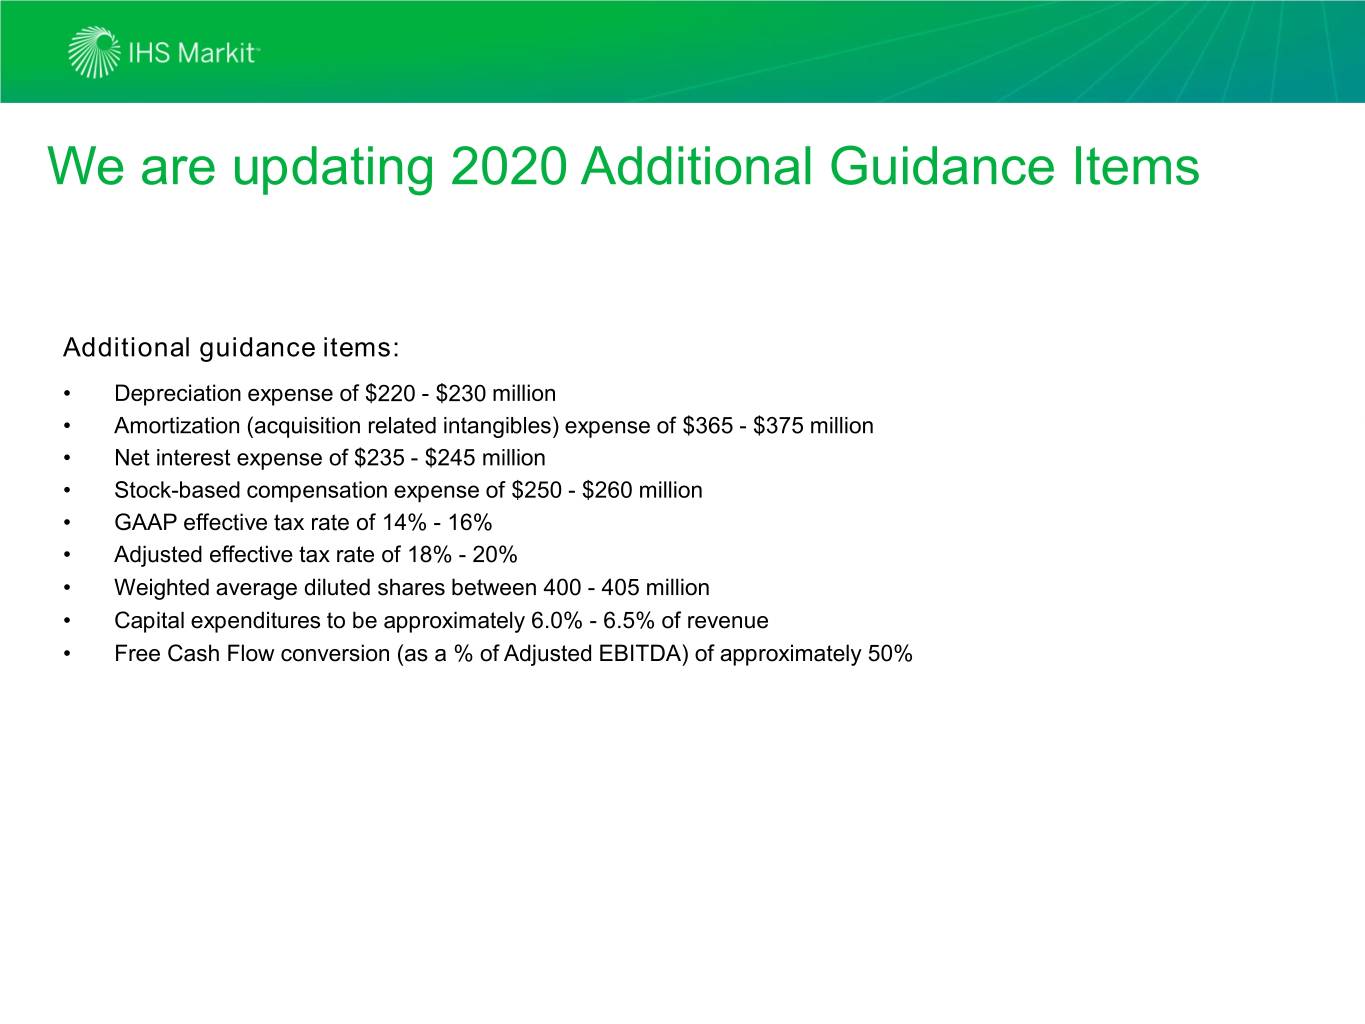
We are updating 2020 Additional Guidance Items Additional guidance items: • Depreciation expense of $220 - $230 million • Amortization (acquisition related intangibles) expense of $365 - $375 million • Net interest expense of $235 - $245 million • Stock-based compensation expense of $250 - $260 million • GAAP effective tax rate of 14% - 16% • Adjusted effective tax rate of 18% - 20% • Weighted average diluted shares between 400 - 405 million • Capital expenditures to be approximately 6.0% - 6.5% of revenue • Free Cash Flow conversion (as a % of Adjusted EBITDA) of approximately 50%
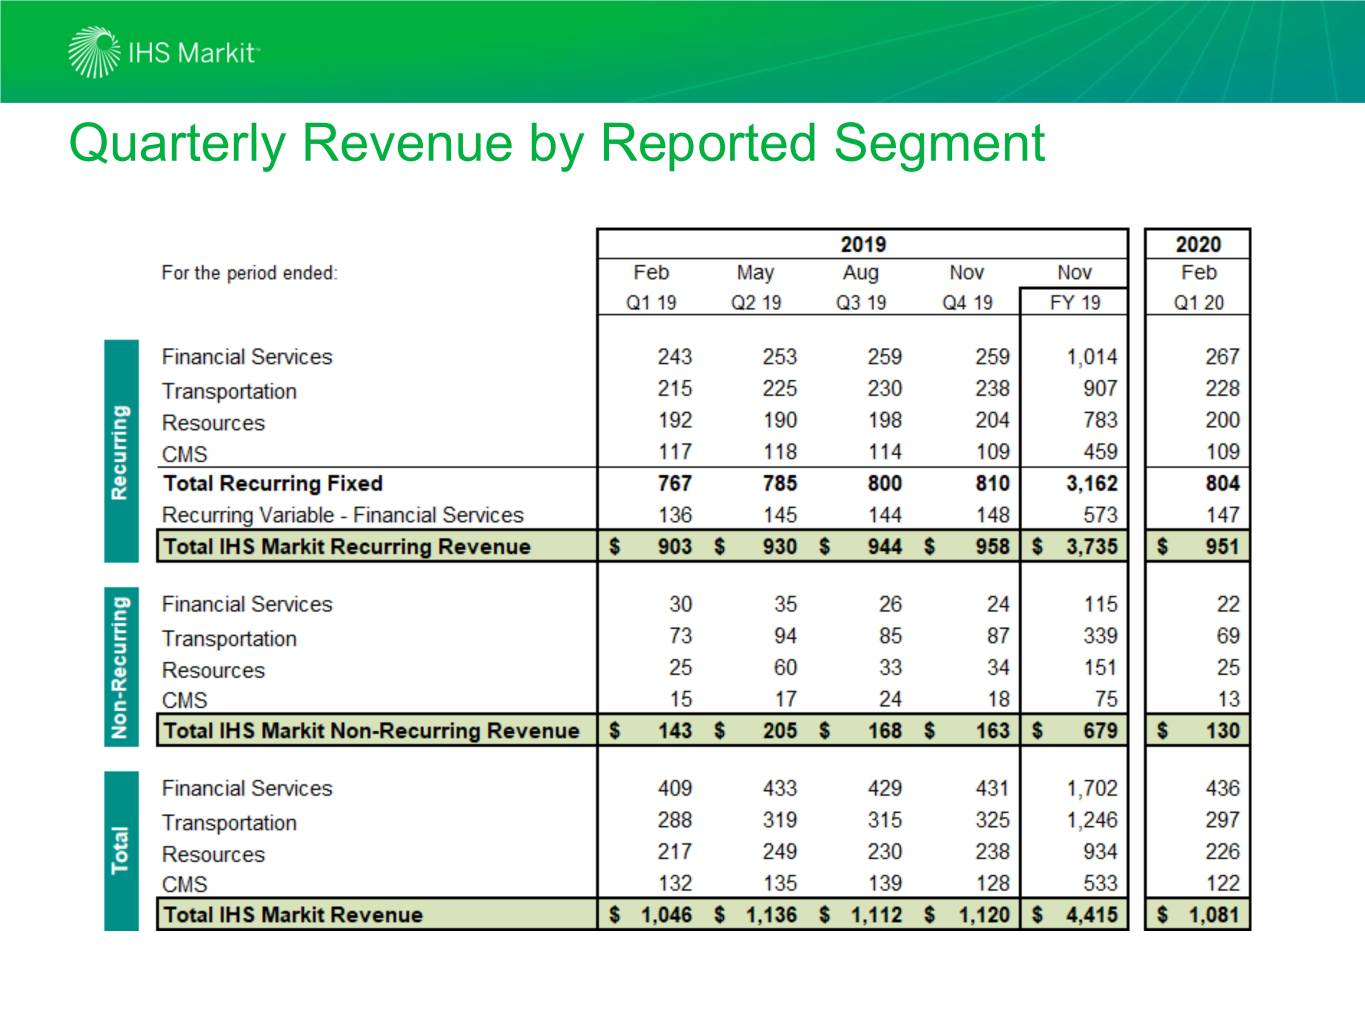
Quarterly Revenue by Reported Segment
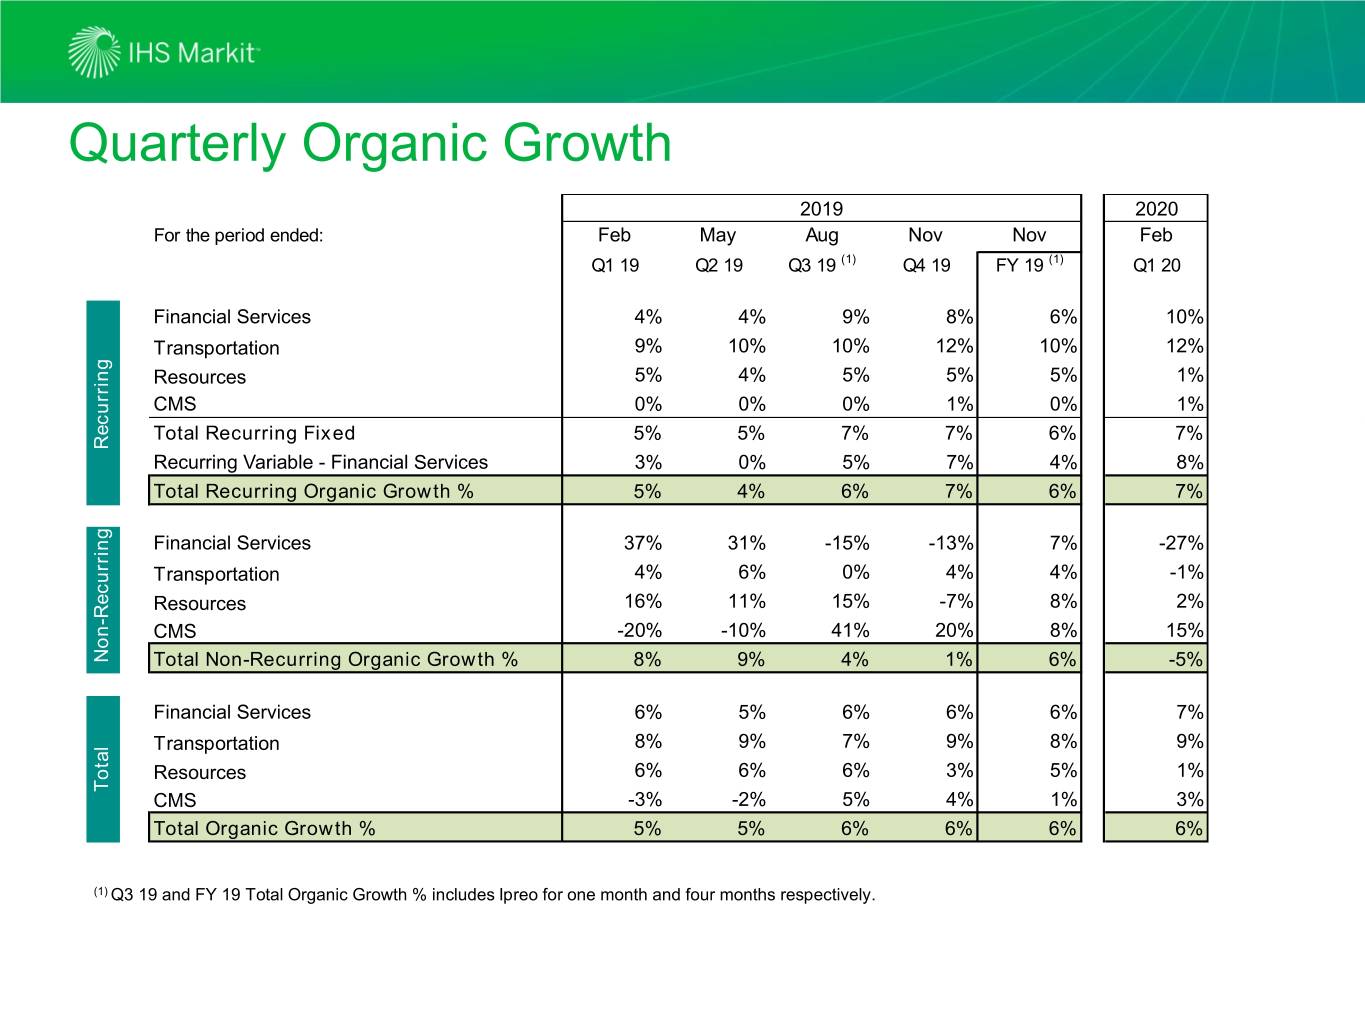
Quarterly Organic Growth 2019 2020 For the period ended: Feb May Aug Nov Nov Feb Q1 19 Q2 19 Q3 19 (1) Q4 19 FY 19 (1) Q1 20 Financial Services 4% 4% 9% 8% 6% 10% Transportation 9% 10% 10% 12% 10% 12% Resources 5% 4% 5% 5% 5% 1% CMS 0% 0% 0% 1% 0% 1% Total Recurring Fixed 5% 5% 7% 7% 6% 7% Recurring Recurring Variable - Financial Services 3% 0% 5% 7% 4% 8% Total Recurring Organic Growth % 5% 4% 6% 7% 6% 7% Financial Services 37% 31% -15% -13% 7% -27% Transportation 4% 6% 0% 4% 4% -1% Resources 16% 11% 15% -7% 8% 2% CMS -20% -10% 41% 20% 8% 15% Non-Recurring Total Non-Recurring Organic Growth % 8% 9% 4% 1% 6% -5% Financial Services 6% 5% 6% 6% 6% 7% Transportation 8% 9% 7% 9% 8% 9% Resources 6% 6% 6% 3% 5% 1% Total CMS -3% -2% 5% 4% 1% 3% Total Organic Growth % 5% 5% 6% 6% 6% 6% (1) Q3 19 and FY 19 Total Organic Growth % includes Ipreo for one month and four months respectively.
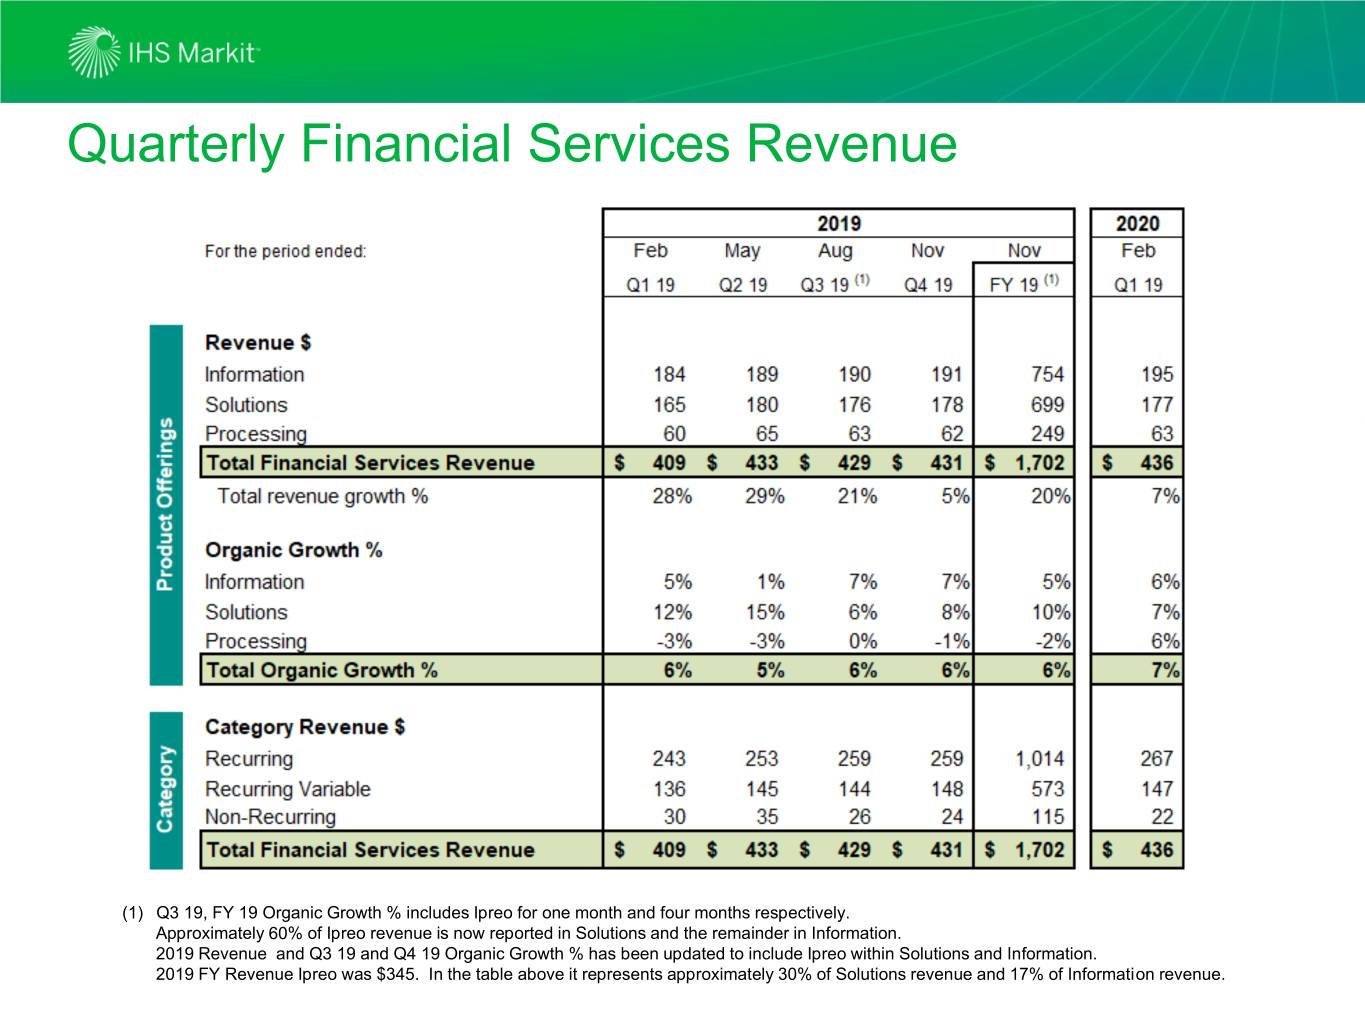
Quarterly Financial Services Revenue (1) Q3 19, FY 19 Organic Growth % includes Ipreo for one month and four months respectively. Approximately 60% of Ipreo revenue is now reported in Solutions and the remainder in Information. 2019 Revenue and Q3 19 and Q4 19 Organic Growth % has been updated to include Ipreo within Solutions and Information. 2019 FY Revenue Ipreo was $345. In the table above it represents approximately 30% of Solutions revenue and 17% of Information revenue.
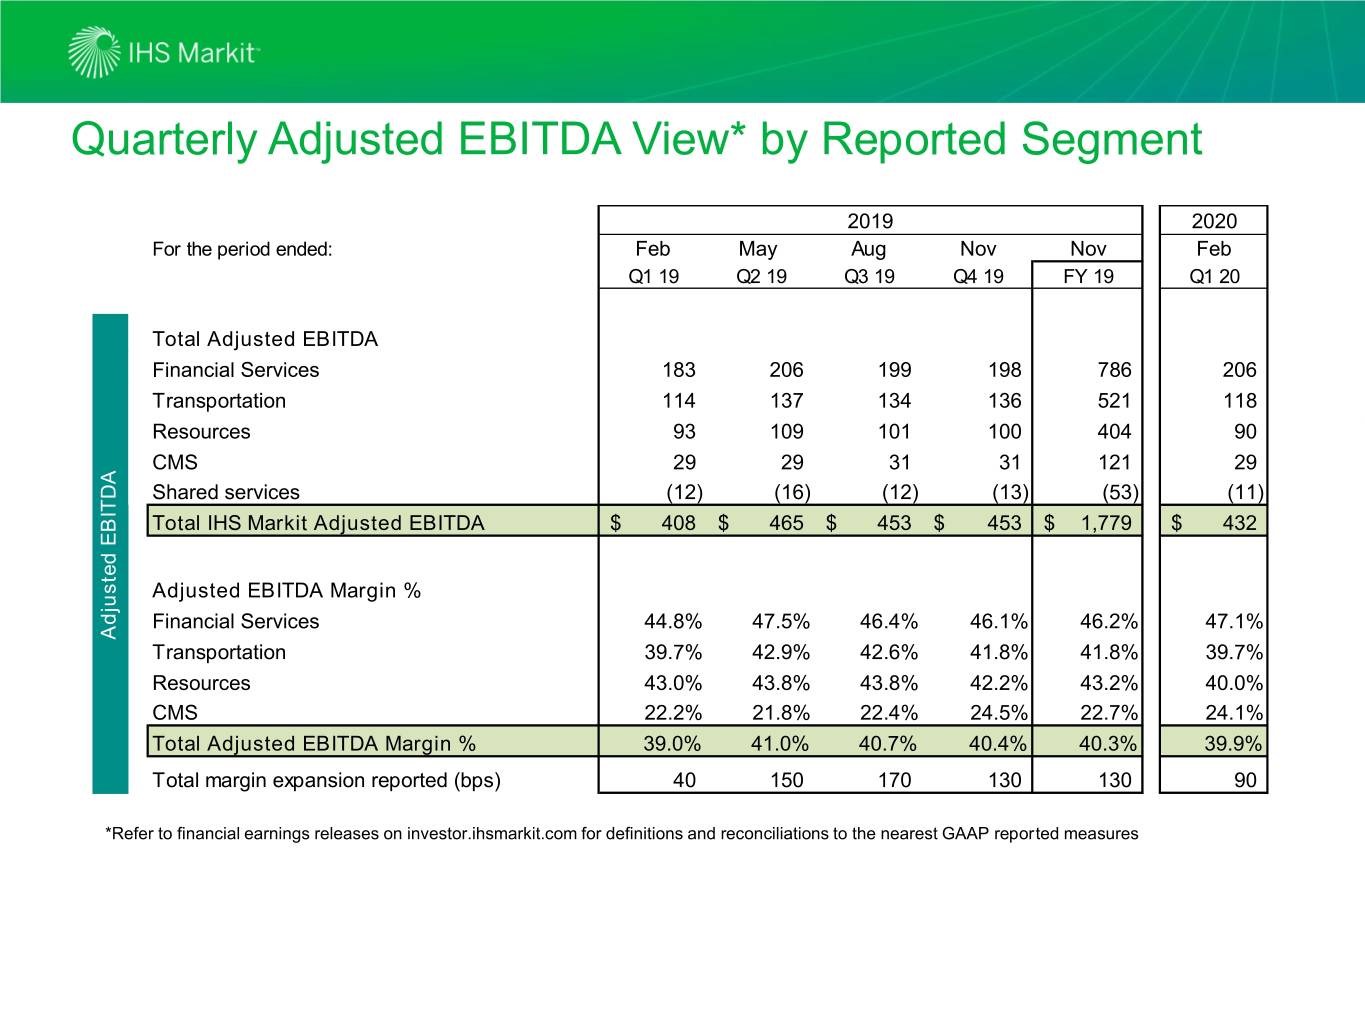
Quarterly Adjusted EBITDA View* by Reported Segment 2019 2020 For the period ended: Feb May Aug Nov Nov Feb Q1 19 Q2 19 Q3 19 Q4 19 FY 19 Q1 20 Total Adjusted EBITDA Financial Services 183 206 199 198 786 206 Transportation 114 137 134 136 521 118 Resources 93 109 101 100 404 90 CMS 29 29 31 31 121 29 Shared services (12) (16) (12) (13) (53) (11) Total IHS Markit Adjusted EBITDA $ 408 $ 465 $ 453 $ 453 $ 1,779 $ 432 Adjusted EBITDA Margin % Financial Services 44.8% 47.5% 46.4% 46.1% 46.2% 47.1% Adjusted EBITDA Adjusted Transportation 39.7% 42.9% 42.6% 41.8% 41.8% 39.7% Resources 43.0% 43.8% 43.8% 42.2% 43.2% 40.0% CMS 22.2% 21.8% 22.4% 24.5% 22.7% 24.1% Total Adjusted EBITDA Margin % 39.0% 41.0% 40.7% 40.4% 40.3% 39.9% Total margin expansion reported (bps) 40 150 170 130 130 90 *Refer to financial earnings releases on investor.ihsmarkit.com for definitions and reconciliations to the nearest GAAP reported measures
