Attached files
| file | filename |
|---|---|
| 8-K - 8-K - Great Elm Capital Corp. | gecc-8k_20200324.htm |
Great Elm Capital Corp. (NASDAQ: GECC) Investor Presentation – Quarter Ended December 31, 2019 March 24, 2020 © 2020 Great Elm Capital Corp. Exhibit 99.1
© 2020 Great Elm Capital Corp. Disclaimer Statements in this communication that are not historical facts are “forward-looking” statements within the meaning of the federal securities laws. These statements are often, but not always, made through the use of words or phrases such as “believe,” “expect,” “anticipate,” “should,” “planned,” “will,” “may,” “intend,” “estimated,” “aim,” “target,” “opportunity,” “sustained,” “positioning,” “designed,” “create,” “seek,” “would,” “could”, “continue,” “ongoing,” “upside,” “increases,” and “potential,” and similar expressions. All such forward-looking statements involve estimates and assumptions that are subject to risks, uncertainties and other factors that could cause actual results to differ materially from the results expressed in the statements. Among the key factors that could cause actual results to differ materially from those projected in the forward-looking statements are: conditions in the credit markets, the price of Great Elm Capital Corp. (“GECC”) common stock, and performance of GECC’s portfolio and investment manager. Additional information concerning these and other factors can be found in GECC’s Form 10-K and other reports filed with the Securities and Exchange Commission (the “SEC”). GECC assumes no obligation to, and expressly disclaims any duty to, update any forward-looking statements contained in this communication or to conform prior statements to actual results or revised expectations, except as required by law. Readers are cautioned not to place undue reliance on these forward-looking statements that speak only as of the date hereof. You should consider the investment objective, risks, charges and expenses of GECC carefully before investing. GECC’s filings with the SEC contain this and other information about GECC and are available by contacting GECC at the phone number and address at the end of this presentation. The SEC also maintains a website that contains the aforementioned documents. The address of the SEC’s website is http://www.sec.gov. These documents should be read and considered carefully before investing. The performance, distributions and financial data contained herein represent past performance, distributions and results and neither guarantees nor is indicative of future performance, distributions or results. Investment return and principal value of an investment will fluctuate so that an investor’s shares may be worth more or less than the original cost. GECC’s market price and net asset value will fluctuate with market conditions. Current performance may be lower or higher than the performance data quoted. All information and data, including portfolio holdings and performance characteristics, is as of December 31, 2019, unless otherwise noted, and is subject to change. This presentation does not constitute an offer of any securities for sale.
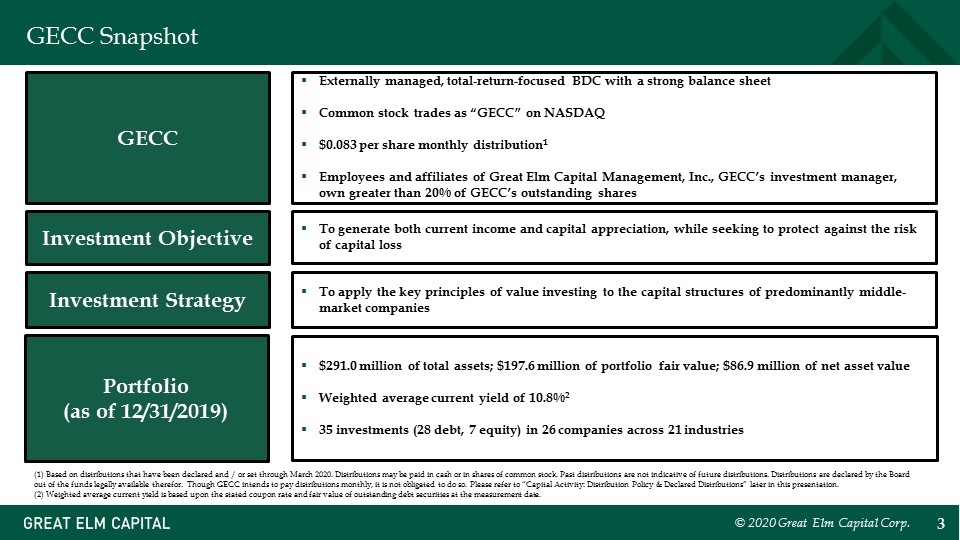
GECC Snapshot GECC Investment Objective Investment Strategy Externally managed, total-return-focused BDC with a strong balance sheet Common stock trades as “GECC” on NASDAQ $0.083 per share monthly distribution1 Employees and affiliates of Great Elm Capital Management, Inc., GECC’s investment manager, own greater than 20% of GECC’s outstanding shares To generate both current income and capital appreciation, while seeking to protect against the risk of capital loss To apply the key principles of value investing to the capital structures of predominantly middle-market companies Portfolio (as of 12/31/2019) $291.0 million of total assets; $197.6 million of portfolio fair value; $86.9 million of net asset value Weighted average current yield of 10.8%2 35 investments (28 debt, 7 equity) in 26 companies across 21 industries (1) Based on distributions that have been declared and / or set through March 2020. Distributions may be paid in cash or in shares of common stock. Past distributions are not indicative of future distributions. Distributions are declared by the Board out of the funds legally available therefor. Though GECC intends to pay distributions monthly, it is not obligated to do so. Please refer to “Capital Activity: Distribution Policy & Declared Distributions” later in this presentation. (2) Weighted average current yield is based upon the stated coupon rate and fair value of outstanding debt securities at the measurement date. © 2020 Great Elm Capital Corp.
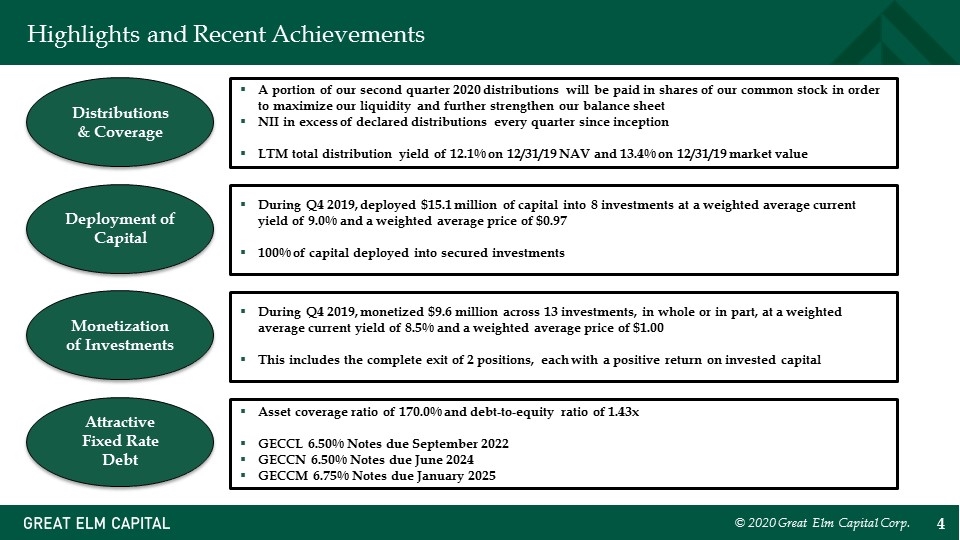
Highlights and Recent Achievements A portion of our second quarter 2020 distributions will be paid in shares of our common stock in order to maximize our liquidity and further strengthen our balance sheet NII in excess of declared distributions every quarter since inception LTM total distribution yield of 12.1% on 12/31/19 NAV and 13.4% on 12/31/19 market value During Q4 2019, monetized $9.6 million across 13 investments, in whole or in part, at a weighted average current yield of 8.5% and a weighted average price of $1.00 This includes the complete exit of 2 positions, each with a positive return on invested capital During Q4 2019, deployed $15.1 million of capital into 8 investments at a weighted average current yield of 9.0% and a weighted average price of $0.97 100% of capital deployed into secured investments Asset coverage ratio of 170.0% and debt-to-equity ratio of 1.43x GECCL 6.50% Notes due September 2022 GECCN 6.50% Notes due June 2024 GECCM 6.75% Notes due January 2025 Attractive Fixed Rate Debt Deployment of Capital Monetization of Investments Distributions & Coverage © 2020 Great Elm Capital Corp.
Portfolio Review (Quarter Ended 12/31/2019) © 2020 Great Elm Capital Corp.
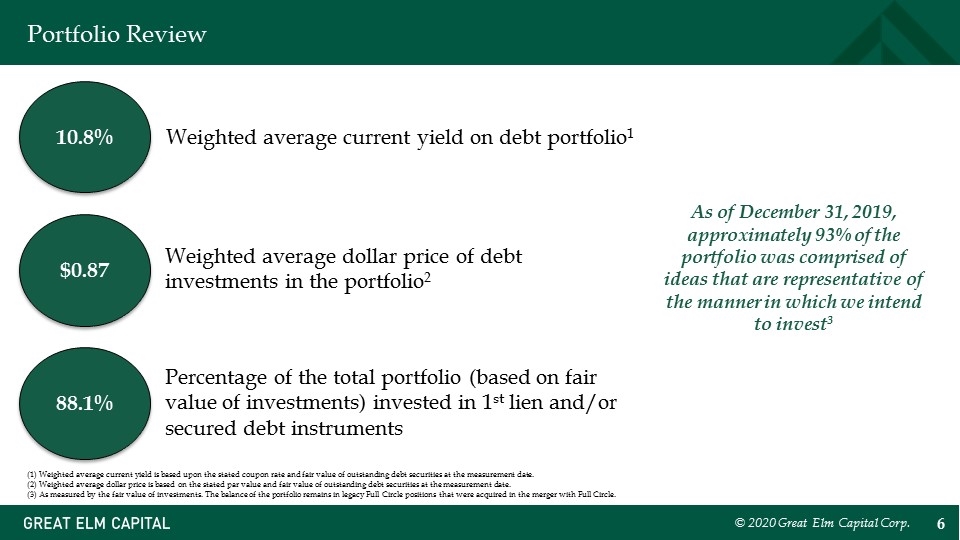
Portfolio Review 10.8% Weighted average current yield on debt portfolio1 88.1% Percentage of the total portfolio (based on fair value of investments) invested in 1st lien and/or secured debt instruments $0.87 Weighted average dollar price of debt investments in the portfolio2 As of December 31, 2019, approximately 93% of the portfolio was comprised of ideas that are representative of the manner in which we intend to invest3 (1) Weighted average current yield is based upon the stated coupon rate and fair value of outstanding debt securities at the measurement date. (2) Weighted average dollar price is based on the stated par value and fair value of outstanding debt securities at the measurement date. (3) As measured by the fair value of investments. The balance of the portfolio remains in legacy Full Circle positions that were acquired in the merger with Full Circle. © 2020 Great Elm Capital Corp.
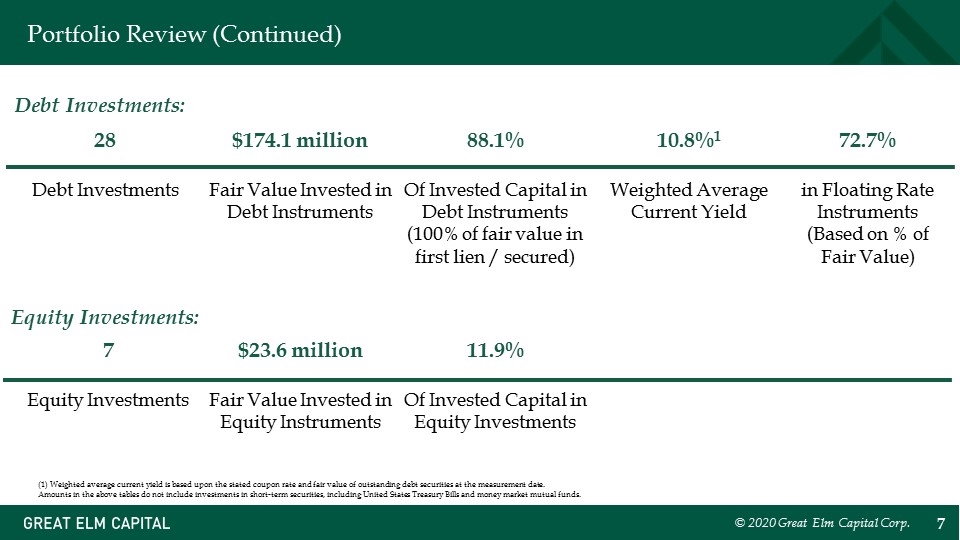
Portfolio Review (Continued) 28 Debt Investments $174.1 million Fair Value Invested in Debt Instruments 72.7% in Floating Rate Instruments (Based on % of Fair Value) 10.8%1 Weighted Average Current Yield 88.1% Of Invested Capital in Debt Instruments (100% of fair value in first lien / secured) 7 Equity Investments $23.6 million Fair Value Invested in Equity Instruments Debt Investments: Equity Investments: 11.9% Of Invested Capital in Equity Investments (1) Weighted average current yield is based upon the stated coupon rate and fair value of outstanding debt securities at the measurement date. Amounts in the above tables do not include investments in short-term securities, including United States Treasury Bills and money market mutual funds. © 2020 Great Elm Capital Corp.
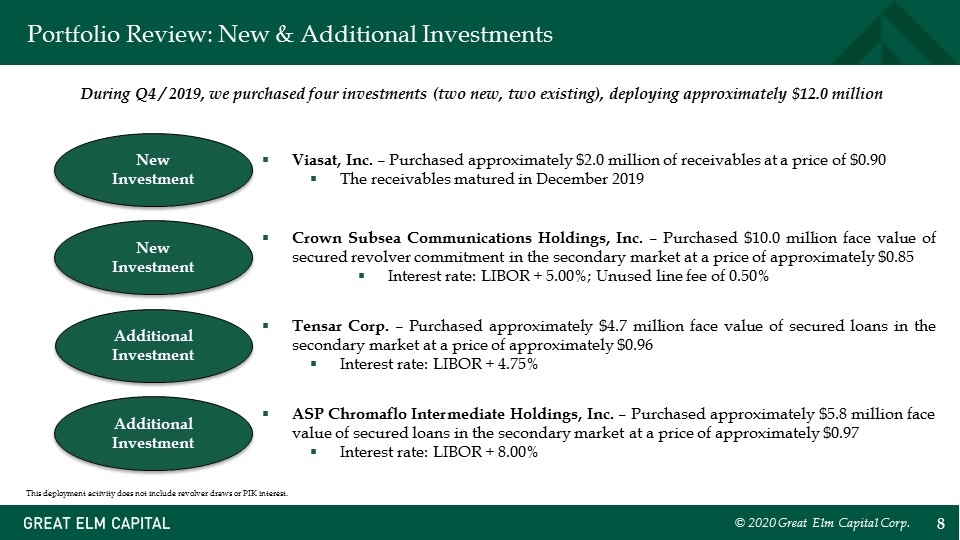
Portfolio Review: New & Additional Investments During Q4 / 2019, we purchased four investments (two new, two existing), deploying approximately $12.0 million This deployment activity does not include revolver draws or PIK interest. Viasat, Inc. – Purchased approximately $2.0 million of receivables at a price of $0.90 The receivables matured in December 2019 New Investment © 2020 Great Elm Capital Corp. New Investment Additional Investment Additional Investment Crown Subsea Communications Holdings, Inc. – Purchased $10.0 million face value of secured revolver commitment in the secondary market at a price of approximately $0.85 Interest rate: LIBOR + 5.00%; Unused line fee of 0.50% Tensar Corp. – Purchased approximately $4.7 million face value of secured loans in the secondary market at a price of approximately $0.96 Interest rate: LIBOR + 4.75% ASP Chromaflo Intermediate Holdings, Inc. – Purchased approximately $5.8 million face value of secured loans in the secondary market at a price of approximately $0.97 Interest rate: LIBOR + 8.00%
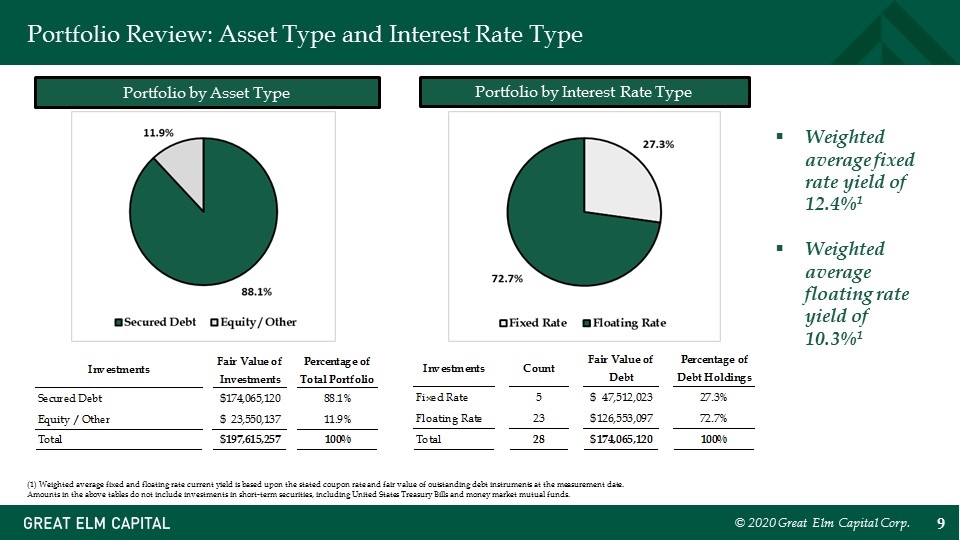
Portfolio Review: Asset Type and Interest Rate Type Portfolio by Asset Type Portfolio by Interest Rate Type Weighted average fixed rate yield of 12.4%1 Weighted average floating rate yield of 10.3%1 (1) Weighted average fixed and floating rate current yield is based upon the stated coupon rate and fair value of outstanding debt instruments at the measurement date. Amounts in the above tables do not include investments in short-term securities, including United States Treasury Bills and money market mutual funds. © 2020 Great Elm Capital Corp. Investments Fair Value of Investments Percentage of Total Portfolio Investments Count Fair Value of Debt Percentage of Debt Holdings Secured Debt $,174,065,120 0.88082834616357586 Fixed Rate 5 $47,512,023.7 0.2729554494892486 Equity / Other $23,550,137 0.11917165383642418 Floating Rate 23 $,126,553,096.93000001 0.72704455051075145 Total $,197,615,257 1 Total 28 $,174,065,120 1 Investments Fair Value of Investments Percentage of Total Portfolio Investments Count Fair Value of Debt Percentage of Debt Holdings 1st Lien / Secured Debt $,174,065,120 0.88082834616357586 Fixed Rate 5 $47,512,023.7 0.2729554494892486 Equity / Other $23,550,137 0.11917165383642418 Floating Rate 23 $,126,553,096.93000001 0.72704455051075145 Total $,197,615,257 1 Total 28 $,174,065,120 1
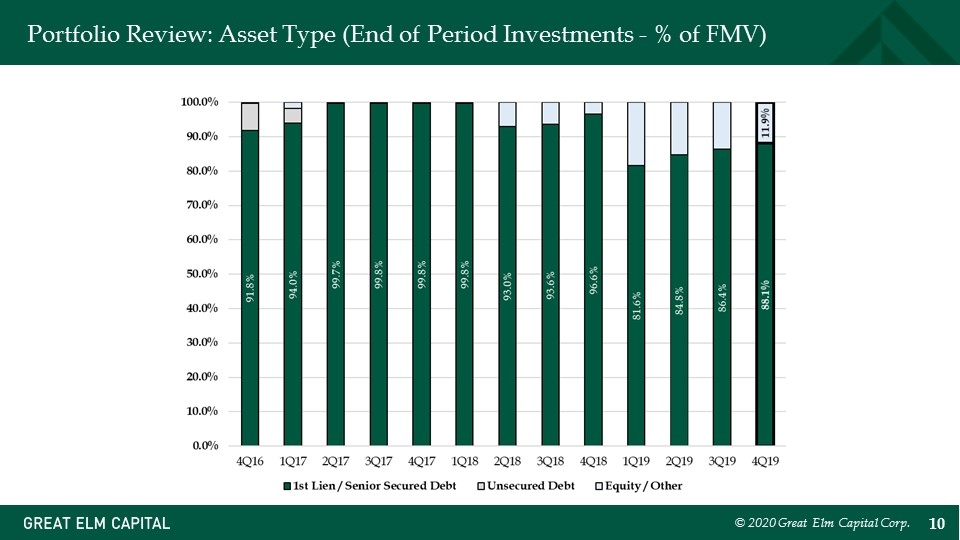
Portfolio Review: Asset Type (End of Period Investments - % of FMV) © 2020 Great Elm Capital Corp.
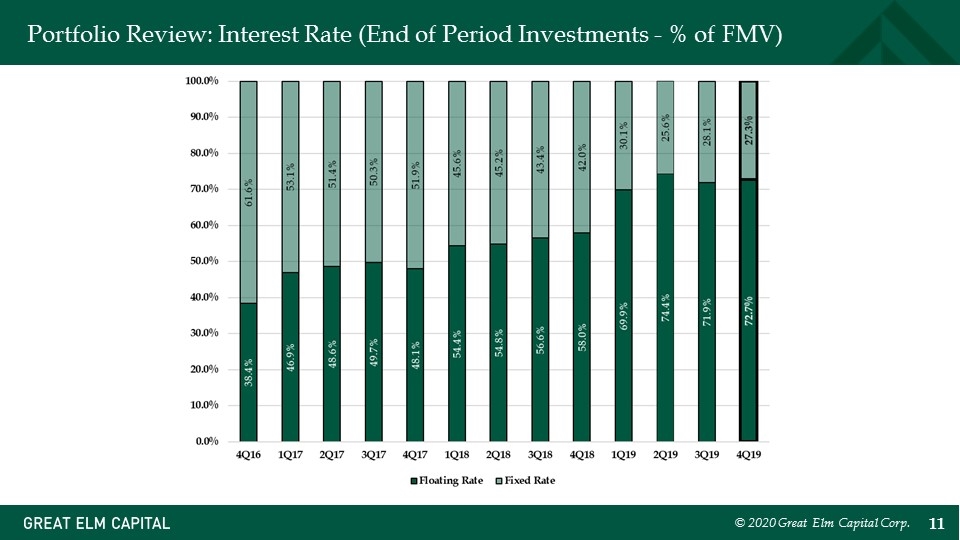
Portfolio Review: Interest Rate (End of Period Investments - % of FMV) © 2020 Great Elm Capital Corp.
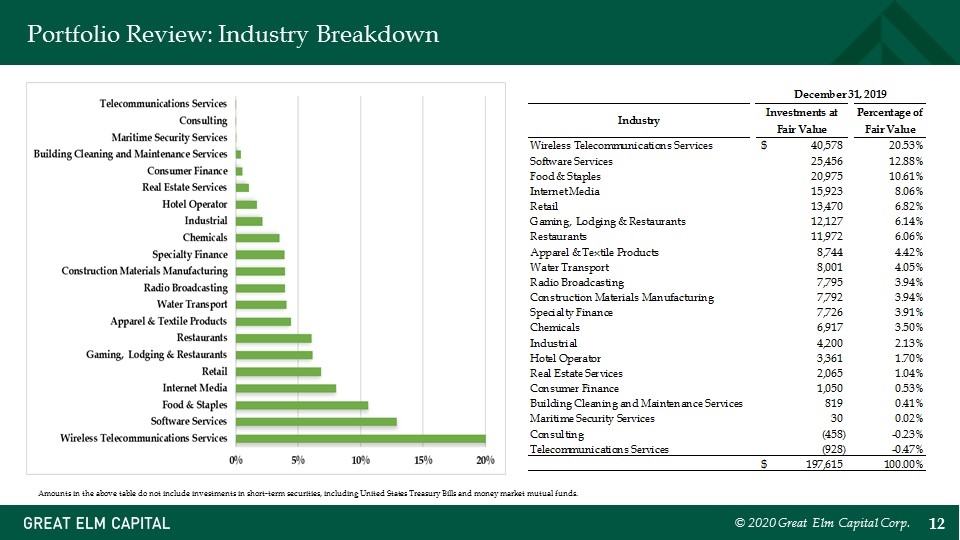
Portfolio Review: Industry Breakdown Amounts in the above table do not include investments in short-term securities, including United States Treasury Bills and money market mutual funds. © 2020 Great Elm Capital Corp. September 30, 2018 Investments at Fair Value Percentage of Fair Value Wireless Telecommunications Services $42,760 0.2103740584580113 Building Cleaning and Maintenance Services 19,934 9.8% Manufacturing 17,281 8.5% Technology Services 15,738 7.7% Retail 15,612 7.7% Industrial Conglomerates 14,536 7.2% Water Transport 10,618 5.2% Business Services 9,918 4.9% Gaming, Lodging & Restaurants 9,841 4.8% Chemicals 9,431 4.6% Software Services 8,957 4.4% Radio Broadcasting 8,847 4.4% Real Estate Services 5,583 2.7% Food & Staples Retailing 5,569 2.7% Hotel Operator 2,751 1.4% Consumer Finance 2,346 1.2% Food Products 1,979 .97364420413565099 Information and Data Services 1,250 .6% Wireless Communications 272 .1% Maritime Security Services 34 16727591177671618.2% Total $,203,257 100.0% December 31, 2018 Industry Investments at Fair Value Percentage of Fair Value Wireless Telecommunications Services $35,631 0.19345118521494575 Building Cleaning and Maintenance Services 18,443 0.10013247478092797 Software Services 15,942 8.6553809735810533E-2 Manufacturing 15,575 8.4561258727590585E-2 Retail 14,227 7.7242570010750009E-2 Industrial Conglomerates 13,365 7.2562518323868258E-2 Water Transport 11,889 6.454887993658584E-2 Gaming, Lodging & Restaurants 9,687 5.2593573887266133E-2 Business Services 9,505 5.1605442324606648E-2 Food & Staples Retailing 8,935 4.8510744573420347E-2 Radio Broadcasting 8,807 4.7815794902978513E-2 Chemicals 7,601 4.1268065976784341E-2 Real Estate Services 4,479 2.4317809171163933E-2 Technology Services 4,428 2.4040915161847264E-2 Hotel Operator 3,212 1.7438893292649821E-2 Consumer Finance 1,830 9.9356085695981242E-3 Wireless Communications 596 3.2358594029947988E-3 Maritime Security Services 34 1.8459600621111268E-4 Total $,184,186 0.99999999999999978 March 31, 2019 Industry Investments at Fair Value Percentage of Fair Value Wireless Telecommunications … $38,956 0.20977017683675447 Building Cleaning ... 20,683 0.11137376957373941 Retail 20,292 0.10926831369677127 Software Services 19,393 0.10442738061903634 Business Services 12,742 6.861309152002068E-2 Water Transport 11,389 6.1327460314041397E-2 Gaming, Lodging & Restaurants 9,766 5.2587933745449844E-2 Food & Staples Retailing 8,904 4.794623818036918E-2 Radio Broadcasting 8,536 4.5964632649105046E-2 Industrial Conglomerates 7,538 4.0590604605078941E-2 Specialty Finance 7,367 3.9669804208757833E-2 Internet Media 3,486 1.8771404570616237E-2 Real Estate Services 3,238 1.7435974756068666E-2 Hotel Operator 3,087 1.6622870312533657E-2 Restaurants 2,903 1.5632067546901586E-2 Apparel & Textile Products 1,983 1.067805371874125E-2 Communications Equipment 1,972 1.0618820944708897E-2 Industrial 1,931 1.0398044241497404E-2 Consumer Finance 1,409 7.5871798737803435E-3 Wireless Communications 103 5.5463415684838565E-4 Maritime Security Services 30 1.6154392917914145E-4 Total $,185,708 0.99999999999999967 June 30, 2019 Industry Investments at Fair Value Percentage of Fair Value Wireless Telecommunications Services $40,044 0.19608457628612561 Building Cleaning and Maintenance Services 19,798 9.6945421069641269E-2 Retail 19,027 9.3170043776748382E-2 Internet Media 16,112 7.8896081638249321E-2 Business Services 14,726 7.2109216621453545E-2 Food & Staples 13,902 6.8074312744224305E-2 Software Services 13,863 6.7883340351976809E-2 Gaming, Lodging & Restaurants 12,023 5.8873360820299876E-2 Water Transport 10,768 5.2727967172335445E-2 Radio Broadcasting 8,299 4.063794572466678E-2 Specialty Finance 7,732 3.7861500945068502E-2 Restaurants 6,809 3.3341820995210998E-2 Apparel & Textile Products 5,810 2.8449989716871186E-2 Industrial 5,355 2.6221978473983686E-2 Real Estate Services 4,663 2.2833442693592141E-2 Hotel Operator 3,177 1.5556904876161749E-2 Consumer Finance 1,392 6.8162453848338543E-3 Construction Materials Manufacturing 474 2.3210490750080796E-3 Wireless Communications 214 1.0478997933580782E-3 Maritime Security Services 30 1.4690184019038478E-4 Total $,204,218 0.99999999999999978 September 30, 2019 Industry Investments at Fair Value Percentage of Fair Value Wireless Telecommunications Services 19476 $38,524 0.19776282219107902 Software Services 14044 24,702 0.12680763248271296 Food & Staples 20,505 0.1052623473426455 Retail 83460 16,502 8.4712960538811805E-2 Internet Media 9530 15,808 8.1150313913315772E-2 Restaurants 9761 12,552 6.443564905363991E-2 Gaming, Lodging & Restaurants 13130 12,253 6.2900733576661066E-2 Water Transport 4202 8,607 4.4184005051360636E-2 Apparel & Textile Products 3284 8,573 4.4009466167690796E-2 Radio Broadcasting 7244 8,024 4.1191176546080829E-2 Specialty Finance 17049 7,671 3.9379052253861672E-2 Industrial 4594 4,970 2.5513477995266917E-2 Real Estate Services 16476 3,610 1.8531922648473555E-2 Construction Materials Manufacturing 3,344 1.7166412558586031E-2 Hotel Operator 14007 3,334 1.7115077592800784E-2 Chemicals 2,710 1.3911775727801477E-2 Building Cleaning and Maintenance Services 7399 1,761 9.0400874747816988E-3 Consumer Finance 7544 1,205 6.1858633771220591E-3 Wireless Communications 216 1.1088352609612986E-3 Maritime Security Services 30 1.540048973557359E-4 Consulting -,102 -5.2361665100950213E-4 $,194,799 1.0000000000000002 December 31, 2019 Industry Investments at Fair Value Percentage of Fair Value Wireless Telecommunications Services 19476 $40,578 0.20533866356298863 Software Services 7399 25,456 0.12881613237861497 Food & Staples 83460 20,975 0.1061407281835893 Internet Media 9530 15,923 8.0575867216557448E-2 Retail 1300 13,470 6.8162841889532672E-2 Gaming, Lodging & Restaurants 12,127 6.1366799079017278E-2 Restaurants 14044 11,972 6.0582445664549754E-2 Apparel & Textile Products 13130 8,744 4.4247653265187356E-2 Water Transport 4202 8,001 4.0487817220352704E-2 Radio Broadcasting 7244 7,795 3.9445386230802321E-2 Construction Materials Manufacturing 17049 7,792 3.9430205196973912E-2 Specialty Finance 9761 7,726 3.9096222452749033E-2 Chemicals 3284 6,917 3.5002403663689501E-2 Industrial 4594 4,200 2.1253447359765198E-2 Hotel Operator 16476 3,361 1.7007818232421628E-2 Real Estate Services 14007 2,065 1.0449611618551223E-2 Consumer Finance 7544 1,050 5.3133618399412996E-3 Building Cleaning and Maintenance Services 9047 819 4.1444222351542138E-3 Maritime Security Services 30 1.5181033828403715E-4 Consulting -,458 -2.3176378311363004E-3 Telecommunications Services -,928 -4.695999797586216E-3 $,197,615 1
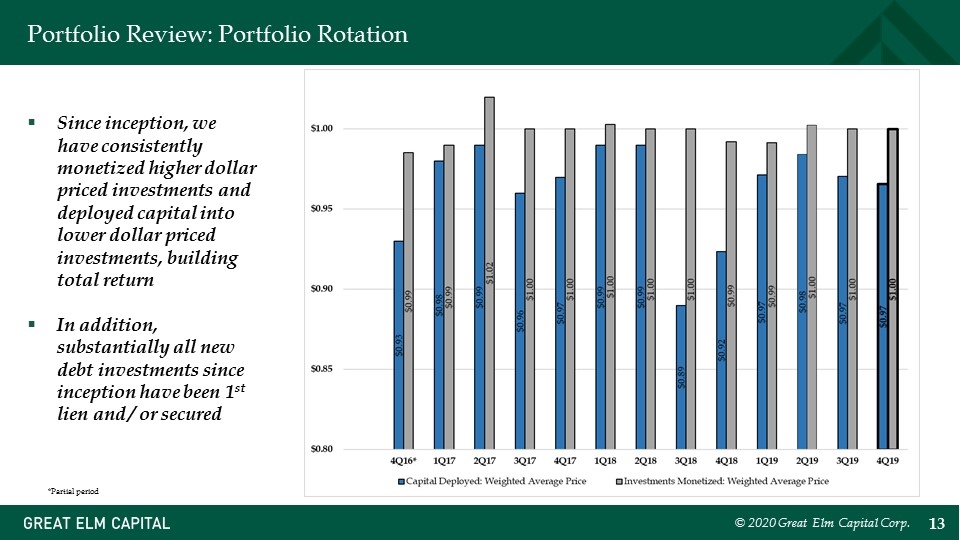
Portfolio Review: Portfolio Rotation © 2020 Great Elm Capital Corp. Since inception, we have consistently monetized higher dollar priced investments and deployed capital into lower dollar priced investments, building total return In addition, substantially all new debt investments since inception have been 1st lien and / or secured *Partial period
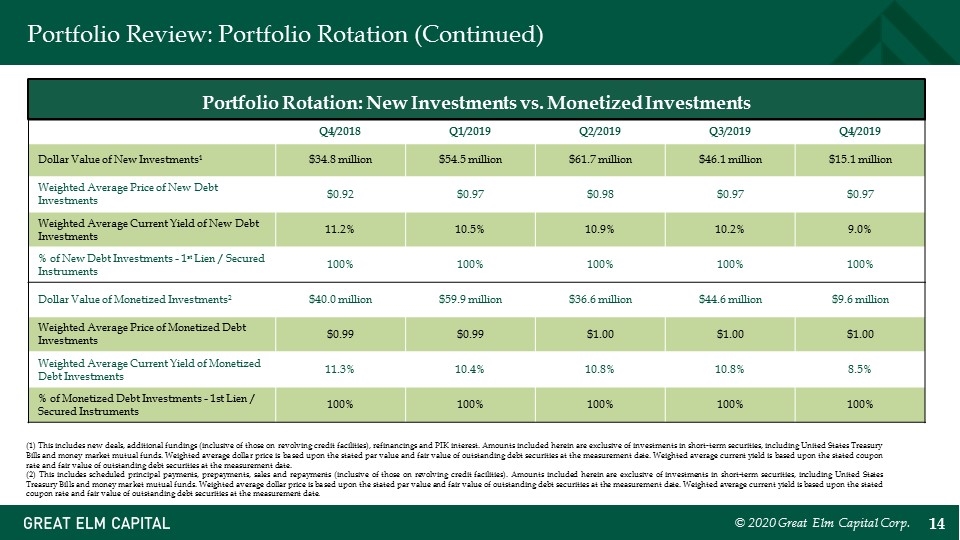
Portfolio Review: Portfolio Rotation (Continued) Q4/2018 Q1/2019 Q2/2019 Q3/2019 Q4/2019 Dollar Value of New Investments1 $34.8 million $54.5 million $61.7 million $46.1 million $15.1 million Weighted Average Price of New Debt Investments $0.92 $0.97 $0.98 $0.97 $0.97 Weighted Average Current Yield of New Debt Investments 11.2% 10.5% 10.9% 10.2% 9.0% % of New Debt Investments - 1st Lien / Secured Instruments 100% 100% 100% 100% 100% Dollar Value of Monetized Investments2 $40.0 million $59.9 million $36.6 million $44.6 million $9.6 million Weighted Average Price of Monetized Debt Investments $0.99 $0.99 $1.00 $1.00 $1.00 Weighted Average Current Yield of Monetized Debt Investments 11.3% 10.4% 10.8% 10.8% 8.5% % of Monetized Debt Investments - 1st Lien / Secured Instruments 100% 100% 100% 100% 100% (1) This includes new deals, additional fundings (inclusive of those on revolving credit facilities), refinancings and PIK interest. Amounts included herein are exclusive of investments in short-term securities, including United States Treasury Bills and money market mutual funds. Weighted average dollar price is based upon the stated par value and fair value of outstanding debt securities at the measurement date. Weighted average current yield is based upon the stated coupon rate and fair value of outstanding debt securities at the measurement date. (2) This includes scheduled principal payments, prepayments, sales and repayments (inclusive of those on revolving credit facilities). Amounts included herein are exclusive of investments in short-term securities, including United States Treasury Bills and money market mutual funds. Weighted average dollar price is based upon the stated par value and fair value of outstanding debt securities at the measurement date. Weighted average current yield is based upon the stated coupon rate and fair value of outstanding debt securities at the measurement date. Portfolio Rotation: New Investments vs. Monetized Investments © 2020 Great Elm Capital Corp.
Subsequent Events (Through March 20, 2020) © 2020 Great Elm Capital Corp.
Subsequent Events The first quarter of 2020 has been characterized by remarkable volatility in the leveraged credit markets, driven in part by the impact of the global Coronavirus outbreak and violent swings in commodity prices We believe we must take every opportunity to bolster liquidity in order to successfully navigate current market volatility and to be in a position to capitalize on what may prove to be attractive investment opportunities if and when they materialize To best position ourselves, we continue to strengthen our balance sheet by: Shoring up cash to build NAV over time Utilizing unsecured borrowings with no maintenance covenants This deployment and monetization activity does not include revolver draws, ordinary course paydowns, and investments in short-term securities, including United States Treasury Bills and money market mutual funds.. © 2020 Great Elm Capital Corp.
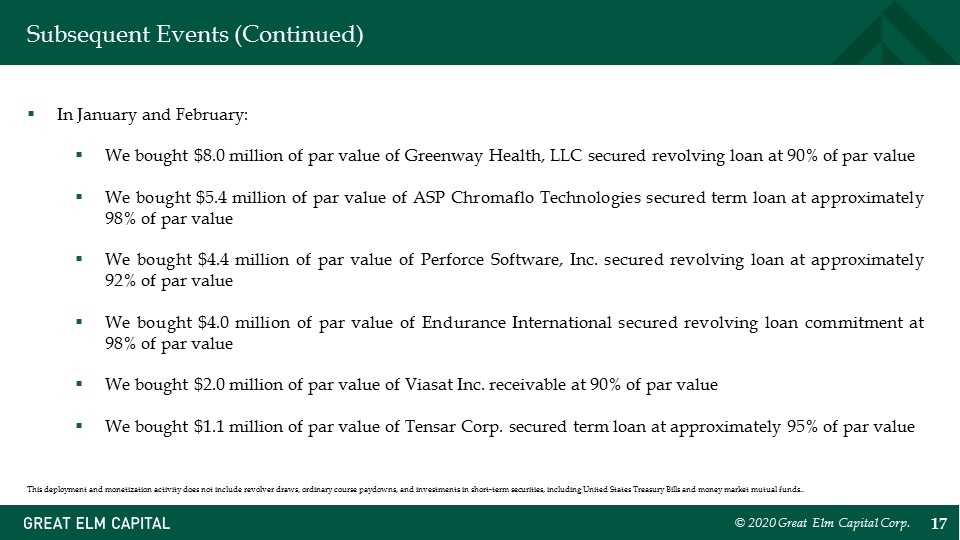
Subsequent Events (Continued) In January and February: We bought $8.0 million of par value of Greenway Health, LLC secured revolving loan at 90% of par value We bought $5.4 million of par value of ASP Chromaflo Technologies secured term loan at approximately 98% of par value We bought $4.4 million of par value of Perforce Software, Inc. secured revolving loan at approximately 92% of par value We bought $4.0 million of par value of Endurance International secured revolving loan commitment at 98% of par value We bought $2.0 million of par value of Viasat Inc. receivable at 90% of par value We bought $1.1 million of par value of Tensar Corp. secured term loan at approximately 95% of par value © 2020 Great Elm Capital Corp. This deployment and monetization activity does not include revolver draws, ordinary course paydowns, and investments in short-term securities, including United States Treasury Bills and money market mutual funds..
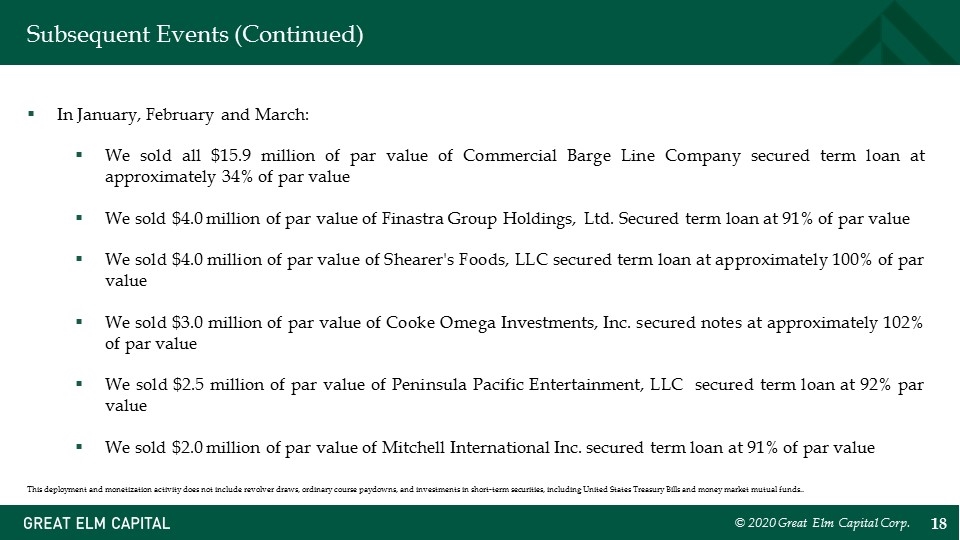
Subsequent Events (Continued) In January, February and March: We sold all $15.9 million of par value of Commercial Barge Line Company secured term loan at approximately 34% of par value We sold $4.0 million of par value of Finastra Group Holdings, Ltd. Secured term loan at 91% of par value We sold $4.0 million of par value of Shearer's Foods, LLC secured term loan at approximately 100% of par value We sold $3.0 million of par value of Cooke Omega Investments, Inc. secured notes at approximately 102% of par value We sold $2.5 million of par value of Peninsula Pacific Entertainment, LLC secured term loan at 92% par value We sold $2.0 million of par value of Mitchell International Inc. secured term loan at 91% of par value This deployment and monetization activity does not include revolver draws, ordinary course paydowns, and investments in short-term securities, including United States Treasury Bills and money market mutual funds.. © 2020 Great Elm Capital Corp.
Financial Review (Quarter Ended 12/31/2019) © 2020 Great Elm Capital Corp.
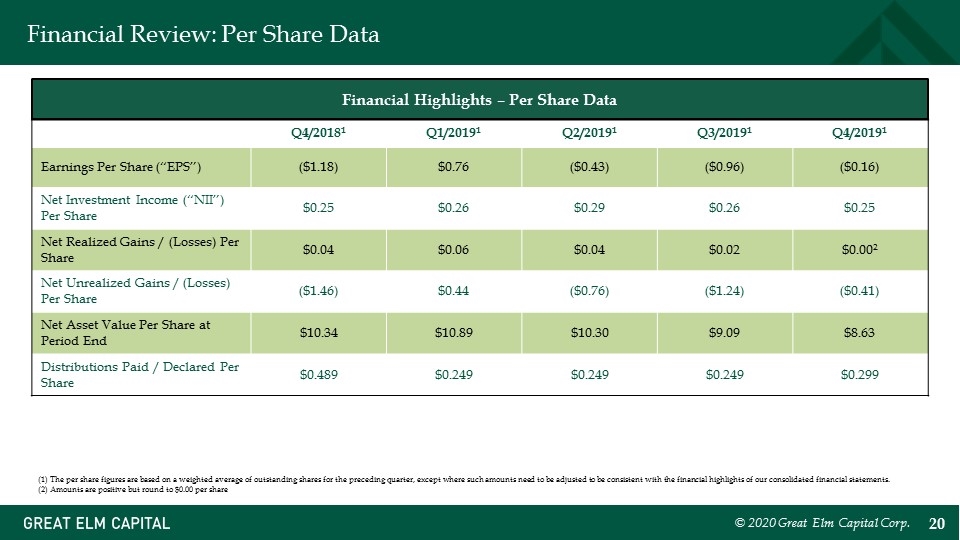
Financial Review: Per Share Data Q4/20181 Q1/20191 Q2/20191 Q3/20191 Q4/20191 Earnings Per Share (“EPS”) ($1.18) $0.76 ($0.43) ($0.96) ($0.16) Net Investment Income (“NII”) Per Share $0.25 $0.26 $0.29 $0.26 $0.25 Net Realized Gains / (Losses) Per Share $0.04 $0.06 $0.04 $0.02 $0.002 Net Unrealized Gains / (Losses) Per Share ($1.46) $0.44 ($0.76) ($1.24) ($0.41) Net Asset Value Per Share at Period End $10.34 $10.89 $10.30 $9.09 $8.63 Distributions Paid / Declared Per Share $0.489 $0.249 $0.249 $0.249 $0.299 (1) The per share figures are based on a weighted average of outstanding shares for the preceding quarter, except where such amounts need to be adjusted to be consistent with the financial highlights of our consolidated financial statements. (2) Amounts are positive but round to $0.00 per share Financial Highlights – Per Share Data © 2020 Great Elm Capital Corp.
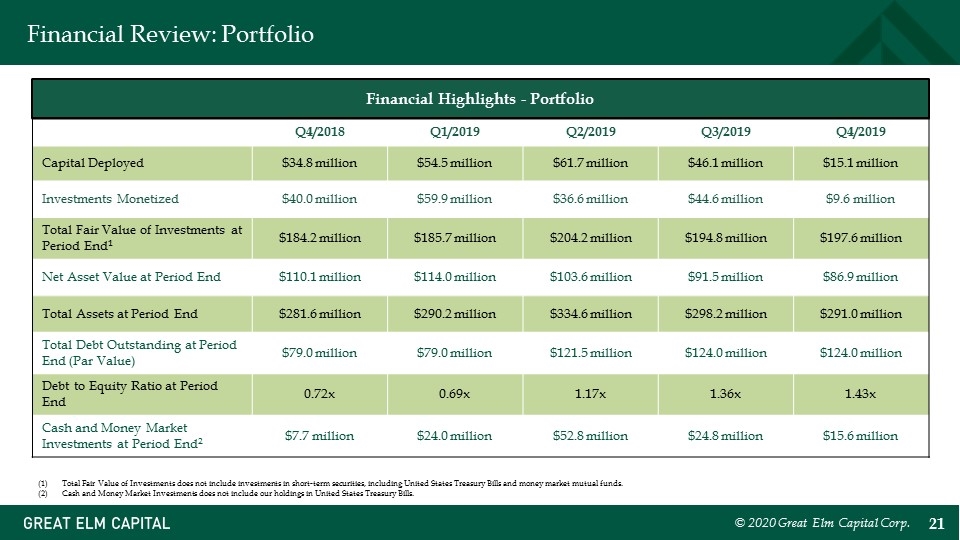
Financial Review: Portfolio Q4/2018 Q1/2019 Q2/2019 Q3/2019 Q4/2019 Capital Deployed $34.8 million $54.5 million $61.7 million $46.1 million $15.1 million Investments Monetized $40.0 million $59.9 million $36.6 million $44.6 million $9.6 million Total Fair Value of Investments at Period End1 $184.2 million $185.7 million $204.2 million $194.8 million $197.6 million Net Asset Value at Period End $110.1 million $114.0 million $103.6 million $91.5 million $86.9 million Total Assets at Period End $281.6 million $290.2 million $334.6 million $298.2 million $291.0 million Total Debt Outstanding at Period End (Par Value) $79.0 million $79.0 million $121.5 million $124.0 million $124.0 million Debt to Equity Ratio at Period End 0.72x 0.69x 1.17x 1.36x 1.43x Cash and Money Market Investments at Period End2 $7.7 million $24.0 million $52.8 million $24.8 million $15.6 million Total Fair Value of Investments does not include investments in short-term securities, including United States Treasury Bills and money market mutual funds. Cash and Money Market Investments does not include our holdings in United States Treasury Bills. Financial Highlights - Portfolio © 2020 Great Elm Capital Corp.
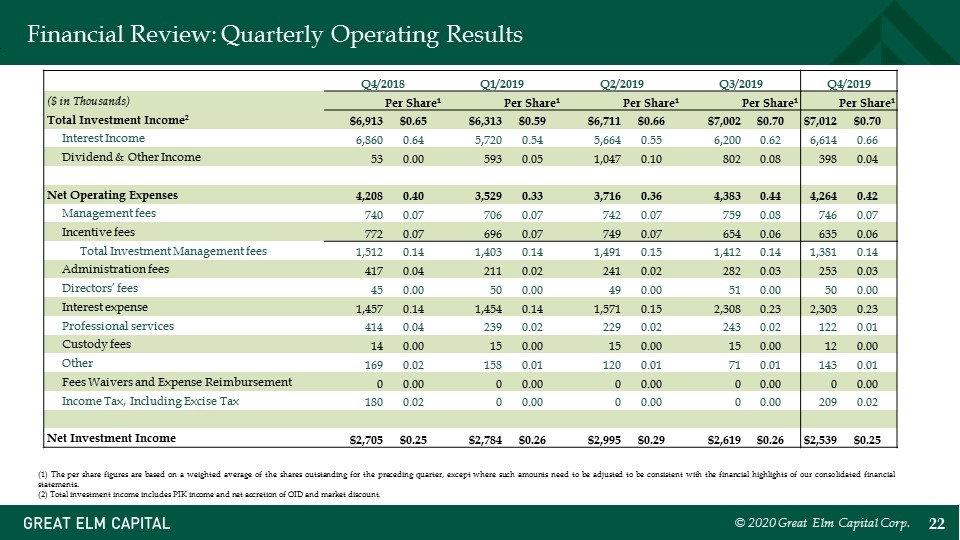
Financial Review: Quarterly Operating Results (1) The per share figures are based on a weighted average of the shares outstanding for the preceding quarter, except where such amounts need to be adjusted to be consistent with the financial highlights of our consolidated financial statements. (2) Total investment income includes PIK income and net accretion of OID and market discount. Q4/2018 Q1/2019 Q2/2019 Q3/2019 Q4/2019 ($ in Thousands) Per Share1 Per Share1 Per Share1 Per Share1 Per Share1 Total Investment Income2 $6,913 $0.65 $6,313 $0.59 $6,711 $0.66 $7,002 $0.70 $7,012 $0.70 Interest Income 6,860 0.64 5,720 0.54 5,664 0.55 6,200 0.62 6,614 0.66 Dividend & Other Income 53 0.00 593 0.05 1,047 0.10 802 0.08 398 0.04 Net Operating Expenses 4,208 0.40 3,529 0.33 3,716 0.36 4,383 0.44 4,264 0.42 Management fees 740 0.07 706 0.07 742 0.07 759 0.08 746 0.07 Incentive fees 772 0.07 696 0.07 749 0.07 654 0.06 635 0.06 Total Investment Management fees 1,512 0.14 1,403 0.14 1,491 0.15 1,412 0.14 1,381 0.14 Administration fees 417 0.04 211 0.02 241 0.02 282 0.03 253 0.03 Directors’ fees 45 0.00 50 0.00 49 0.00 51 0.00 50 0.00 Interest expense 1,457 0.14 1,454 0.14 1,571 0.15 2,308 0.23 2,303 0.23 Professional services 414 0.04 239 0.02 229 0.02 243 0.02 122 0.01 Custody fees 14 0.00 15 0.00 15 0.00 15 0.00 12 0.00 Other 169 0.02 158 0.01 120 0.01 71 0.01 143 0.01 Fees Waivers and Expense Reimbursement 0 0.00 0 0.00 0 0.00 0 0.00 0 0.00 Income Tax, Including Excise Tax 180 0.02 0 0.00 0 0.00 0 0.00 209 0.02 Net Investment Income $2,705 $0.25 $2,784 $0.26 $2,995 $0.29 $2,619 $0.26 $2,539 $0.25 © 2020 Great Elm Capital Corp.
Capital Activity © 2020 Great Elm Capital Corp.
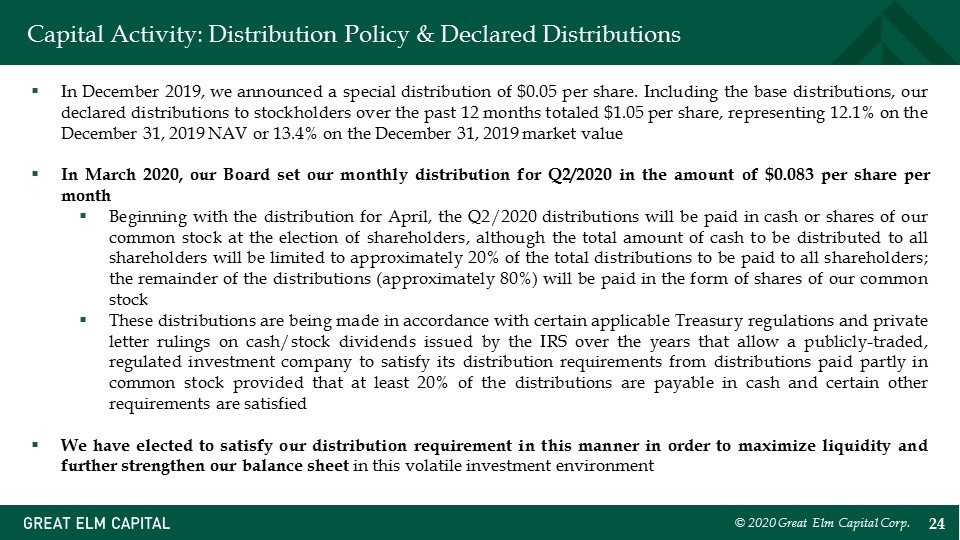
Capital Activity: Distribution Policy & Declared Distributions In December 2019, we announced a special distribution of $0.05 per share. Including the base distributions, our declared distributions to stockholders over the past 12 months totaled $1.05 per share, representing 12.1% on the December 31, 2019 NAV or 13.4% on the December 31, 2019 market value In March 2020, our Board set our monthly distribution for Q2/2020 in the amount of $0.083 per share per month Beginning with the distribution for April, the Q2/2020 distributions will be paid in cash or shares of our common stock at the election of shareholders, although the total amount of cash to be distributed to all shareholders will be limited to approximately 20% of the total distributions to be paid to all shareholders; the remainder of the distributions (approximately 80%) will be paid in the form of shares of our common stock These distributions are being made in accordance with certain applicable Treasury regulations and private letter rulings on cash/stock dividends issued by the IRS over the years that allow a publicly-traded, regulated investment company to satisfy its distribution requirements from distributions paid partly in common stock provided that at least 20% of the distributions are payable in cash and certain other requirements are satisfied We have elected to satisfy our distribution requirement in this manner in order to maximize liquidity and further strengthen our balance sheet in this volatile investment environment © 2020 Great Elm Capital Corp.
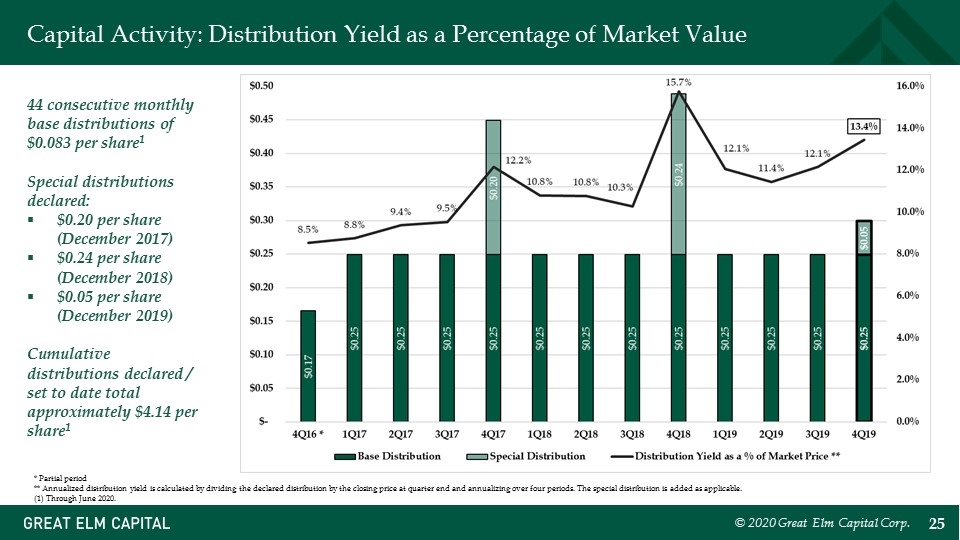
Capital Activity: Distribution Yield as a Percentage of Market Value © 2020 Great Elm Capital Corp. * Partial period ** Annualized distribution yield is calculated by dividing the declared distribution by the closing price at quarter end and annualizing over four periods. The special distribution is added as applicable. (1) Through June 2020. 44 consecutive monthly base distributions of $0.083 per share1 Special distributions declared: $0.20 per share (December 2017) $0.24 per share (December 2018) $0.05 per share (December 2019) Cumulative distributions declared / set to date total approximately $4.14 per share1
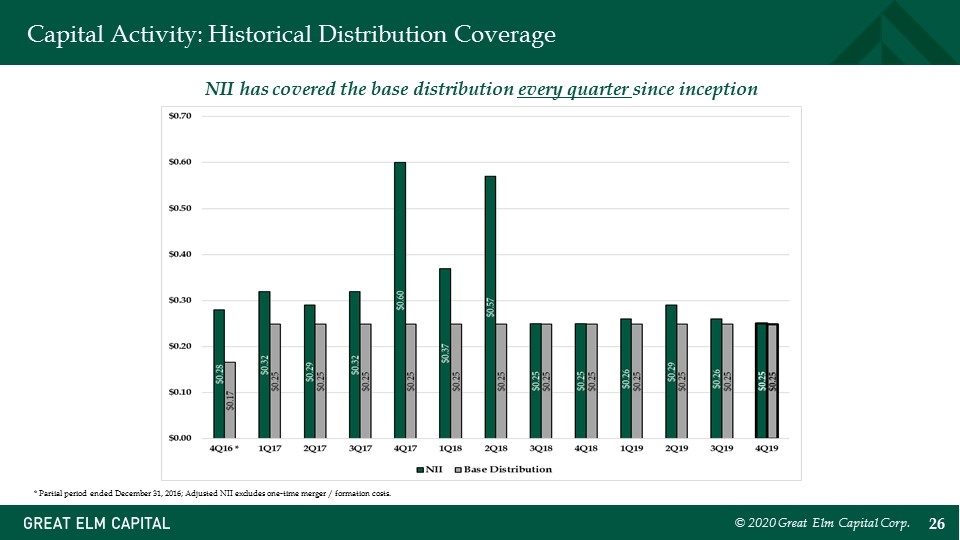
Capital Activity: Historical Distribution Coverage © 2020 Great Elm Capital Corp. * Partial period ended December 31, 2016; Adjusted NII excludes one-time merger / formation costs. NII has covered the base distribution every quarter since inception
Summary © 2020 Great Elm Capital Corp.
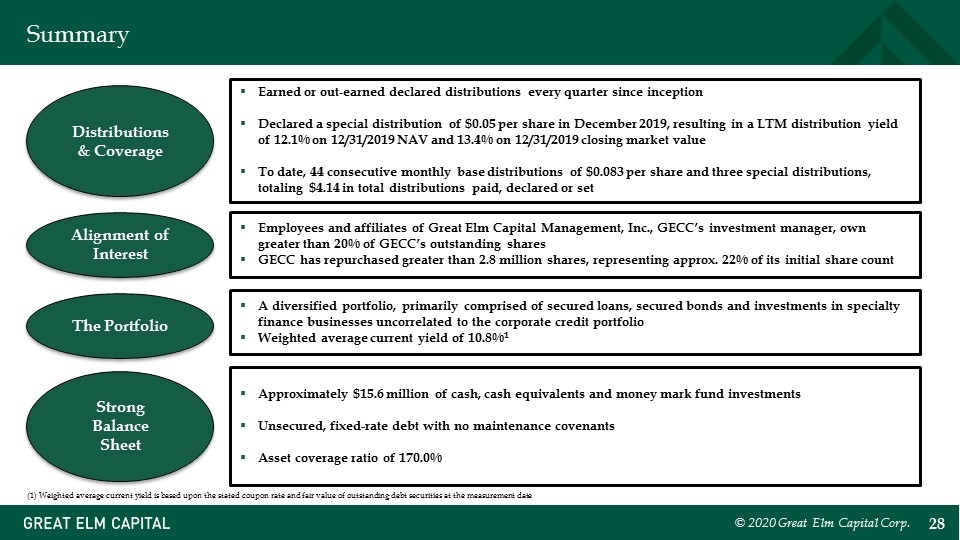
Summary Earned or out-earned declared distributions every quarter since inception Declared a special distribution of $0.05 per share in December 2019, resulting in a LTM distribution yield of 12.1% on 12/31/2019 NAV and 13.4% on 12/31/2019 closing market value To date, 44 consecutive monthly base distributions of $0.083 per share and three special distributions, totaling $4.14 in total distributions paid, declared or set Approximately $15.6 million of cash, cash equivalents and money mark fund investments Unsecured, fixed-rate debt with no maintenance covenants Asset coverage ratio of 170.0% Employees and affiliates of Great Elm Capital Management, Inc., GECC’s investment manager, own greater than 20% of GECC’s outstanding shares GECC has repurchased greater than 2.8 million shares, representing approx. 22% of its initial share count Alignment of Interest Strong Balance Sheet Distributions & Coverage © 2020 Great Elm Capital Corp. The Portfolio A diversified portfolio, primarily comprised of secured loans, secured bonds and investments in specialty finance businesses uncorrelated to the corporate credit portfolio Weighted average current yield of 10.8%1 (1) Weighted average current yield is based upon the stated coupon rate and fair value of outstanding debt securities at the measurement date
Appendix © 2020 Great Elm Capital Corp.
Appendix: General Risks Debt instruments are subject to credit and interest rate risks. Credit risk refers to the likelihood that an obligor will default in the payment of principal or interest on an instrument. Financial strength and solvency of an obligor are the primary factors influencing credit risk. In addition, lack or inadequacy of collateral or credit enhancement for a debt instrument may affect its credit risk. Credit risk may change over the life of an instrument, and debt instruments that are rated by rating agencies are often reviewed and may be subject to downgrade. Our debt investments either are, or if rated would be, rated below investment grade by independent rating agencies. These “junk bonds” and “leveraged loans” are regarded as having predominantly speculative characteristics with respect to the issuer’s capacity to pay interest and repay principal. They may be illiquid and difficult to value and typically do not require repayment of principal before maturity, which potentially heightens the risk that we may lose all or part of our investment. Interest rate risk refers to the risks associated with market changes in interest rates. Interest rate changes may affect the value of a debt instrument indirectly (especially in the case of fixed rate obligations) or directly (especially in the case of an instrument whose rates are adjustable). In general, rising interest rates will negatively impact the price of a fixed rate debt instrument and falling interest rates will have a positive effect on price. Adjustable rate instruments also react to interest rate changes in a similar manner although generally to a lesser degree (depending, however, on the characteristics of the reset terms, including the index chosen, frequency of reset and reset caps or floors, among other factors). GECC utilizes leverage to seek to enhance the yield and net asset value of its common stock. These objectives will not necessarily be achieved in all interest rate environments. The use of leverage involves risk, including the potential for higher volatility and greater declines of GECC’s net asset value, fluctuations of dividends and other distributions paid by GECC and the market price of GECC’s common stock, among others. The amount of leverage that GECC may employ at any particular time will depend on, among other things, our Board’s and our adviser’s assessment of market and other factors at the time of any proposed borrowing. As part of our lending activities, we may purchase notes or make loans to companies that are experiencing significant financial or business difficulties, including companies involved in bankruptcy or other reorganization and liquidation proceedings. Although the terms of such financings may result in significant financial returns to us, they involve a substantial degree of risk. The level of analytical sophistication, both financial and legal, necessary for successful financing to companies experiencing significant business and financial difficulties is unusually high. We cannot assure you that we will correctly evaluate the value of the assets collateralizing our investments or the prospects for a successful reorganization or similar action. In any reorganization or liquidation proceeding relating to a portfolio company, we may lose all or part of the amounts advanced to the borrower or may be required to accept collateral with a value less than the amount of the investment advanced by us to the borrower. © 2020 Great Elm Capital Corp.
Appendix: Contact Information Investor Relations 800 South Street, Suite 230 Waltham, MA 02453 Phone: +1 (617) 375-3006 investorrelations@greatelmcap.com © 2020 Great Elm Capital Corp.
