Attached files
| file | filename |
|---|---|
| EX-99.1 - EX-99.1 - Great Elm Capital Corp. | gecc-ex991_230.htm |
| EX-32.1 - EX-32.1 - Great Elm Capital Corp. | gecc-ex321_7.htm |
| EX-31.2 - EX-31.2 - Great Elm Capital Corp. | gecc-ex312_10.htm |
| EX-31.1 - EX-31.1 - Great Elm Capital Corp. | gecc-ex311_6.htm |
| EX-21.1 - EX-21.1 - Great Elm Capital Corp. | gecc-ex211_8.htm |
| EX-4.10 - EX-4.10 - Great Elm Capital Corp. | gecc-ex410_316.htm |
UNITED STATES
SECURITIES AND EXCHANGE COMMISSION
Washington, D.C. 20549
FORM 10-K
|
☒ |
ANNUAL REPORT PURSUANT TO SECTION 13 OR 15(d) OF THE SECURITIES EXCHANGE ACT OF 1934 |
For the fiscal year ended December 31, 2019
or
|
☐ |
TRANSITION REPORT PURSUANT TO SECTION 13 OR 15(d) OF THE SECURITIES EXCHANGE ACT OF 1934 |
For the transition period from _______ to _________
Commission file number: 814-01211
Great Elm Capital Corp.
(Exact name of registrant as specified in its charter)
|
Maryland |
|
81-2621577 |
|
(State or other jurisdiction of incorporation or organization) |
|
(I.R.S. Employer Identification No.) |
|
|
|
|
|
800 South Street, Suite 230, Waltham, MA |
|
02453 |
|
(Address of principal executive offices) |
|
(Zip Code) |
Registrant's telephone number, including area code: (617) 375-3006
Securities registered pursuant to Section 12(b) of the Act:
|
Title of each class |
|
Name of each exchange on which registered |
|
Common stock, par value $0.01 per share |
|
Nasdaq Global Market |
|
6.50% Notes due 2022 |
|
Nasdaq Global Market |
|
6.75% Notes due 2025 |
|
Nasdaq Global Market |
|
6.50% Notes due 2024 |
|
Nasdaq Global Market |
Securities registered pursuant to section 12(g) of the Act: None
Indicate by check mark if the registrant is a well-known seasoned issuer, as defined in Rule 405 of the Securities Act. Yes ☐ No ☒
Indicate by check mark if the registrant is not required to file reports pursuant to Section 13 or Section 15(d) of the Act. Yes ☐ No ☒
Indicate by check mark whether the registrant (1) has filed all reports required to be filed by Section 13 or 15(d) of the Securities Exchange Act of 1934 during the preceding 12 months (or for such shorter period that the registrant was required to file such reports), and (2) has been subject to such filing requirements for the past 90 days. Yes ☒ No ☐
Indicate by check mark whether the registrant has submitted electronically every Interactive Data File required to be submitted pursuant to Rule 405 of Regulation S-T (§232.405 of this chapter) during the preceding 12 months (or for such shorter period that the registrant was required to submit such files). Yes ☒ No ☐
Indicate by check mark whether the registrant is a large accelerated filer, an accelerated filer, a non-accelerated filer, a smaller reporting company, or an emerging growth company. See the definitions of “large accelerated filer,” “accelerated filer,” “smaller reporting company,” and "emerging growth company" in Rule 12b-2 of the Exchange Act.
|
Large accelerated filer |
|
☐ |
|
Accelerated filer |
|
☐ |
|
Non-accelerated filer |
|
☒ |
|
Smaller reporting company |
|
☐ |
|
|
|
|
|
Emerging growth company |
|
☒ |
If an emerging growth company, indicate by check mark if the registrant has elected not to use the extended transition period for complying with any new or revised financial accounting standards provided pursuant to Section 13(a) of the Exchange Act. ☐
Indicate by check mark whether the registrant is a shell company (as defined in Rule 12b-2 of the Act): Yes ☐ No ☒
The aggregate market value of the voting stock held by non-affiliates of the registrant was $58.9 million as of June 30, 2019.
As of March 16, 2020, there were 10,062,682 outstanding shares of the registrant’s common stock.
|
|
Page |
|
|
|
|
|
|
Item 1. |
2 |
|
|
Item 1A. |
20 |
|
|
Item 1B. |
47 |
|
|
Item 2. |
47 |
|
|
Item 3. |
47 |
|
|
Item 4. |
47 |
|
|
|
|
|
|
|
|
|
|
|
|
|
|
Item 5. |
48 |
|
|
Item 6. |
51 |
|
|
Item 7. |
Management’s Discussion and Analysis of Financial Condition and Results of Operations |
52 |
|
Item 7A. |
64 |
|
|
Item 8. |
64 |
|
|
Item 9. |
Changes in and Disagreements With Accountants on Accounting and Financial Disclosure |
64 |
|
Item 9A. |
65 |
|
|
Item 9B. |
66 |
|
|
|
|
|
|
|
|
|
|
|
|
|
|
Item 10. |
67 |
|
|
Item 11. |
67 |
|
|
Item 12. |
Security Ownership of Certain Beneficial Owners and Management and Related Stockholder Matters |
67 |
|
Item 13. |
Certain Relationships and Related Transactions, and Director Independence |
67 |
|
Item 14. |
67 |
|
|
|
|
|
|
|
|
|
|
|
|
|
|
Item 15. |
67 |
|
|
Item 16. |
67 |
|
|
|
|
|
|
|
70 |
i
Unless the context otherwise requires, all references to “GECC,” “we,” “us,” “our,” the “Company” and words of similar import are to Great Elm Capital Corp. and its subsidiaries. We reference materials on our website, www.greatelmcc.com, but nothing on our website shall be deemed incorporated by reference or otherwise contained in this report.
Cautionary Note Regarding Forward-Looking Information
Some of the statements in this report (including in the following discussion) constitute forward-looking statements, which relate to future events or our future performance or financial conditions. The forward-looking statements contained in this report involve a number of risks and uncertainties, including statements concerning:
|
|
▪ |
our, or our portfolio companies’, future business, operations, operating results or prospects; |
|
|
▪ |
the return or impact of current and future investments; |
|
|
▪ |
the impact of a protracted decline in the liquidity of credit markets on our business; |
|
|
▪ |
the impact of fluctuations in interest rates on our business; |
|
|
▪ |
the impact of changes in laws or regulations governing our operations or the operations of our portfolio companies; |
|
|
▪ |
our contractual arrangements and relationships with third parties; |
|
|
▪ |
our current and future management structure; |
|
|
▪ |
the general economy and its impact on the industries in which we invest; |
|
|
▪ |
the financial condition of and ability of our current and prospective portfolio companies to achieve their objectives; |
|
|
▪ |
our expected financings and investments; |
|
|
▪ |
the adequacy of our financing resources and working capital; |
|
|
▪ |
the ability of our investment adviser to locate suitable investments for us and to monitor and administer our investments; |
|
|
▪ |
the timing of cash flows, if any, from the operations of our portfolio companies; |
|
|
▪ |
the timing, form and amount of any dividend distributions; |
|
|
▪ |
the valuation of any investments in portfolio companies, particularly those having no liquid trading market; and |
|
|
▪ |
our ability to maintain our qualification as a regulated investment company (“RIC”) and as a business development company (“BDC”). |
We use words such as “anticipate,” “believe,” “expect,” “intend,” “will,” “should,” “could,” “may,” “plan” and similar words to identify forward-looking statements. The forward-looking statements contained in this report involve risks and uncertainties. Our actual results could differ materially from those implied or expressed in the forward-looking statements for any reason, including the factors set forth under “Item 1A. Risk Factors.”
We have based the forward-looking statements included in this report on information available to us on the date of this report, and we assume no obligation to update any such forward-looking statements. Although we undertake no obligation to revise or update any forward-looking statements, whether as a result of new information, future events or otherwise, you are advised to consult any additional disclosures that we may make directly to you or through reports that we have filed or in the future may file with the Securities and Exchange Commission (the “SEC”).
1
Overview
We are an externally managed non‑diversified closed‑end management investment company that elected to be regulated as a BDC under the Investment Company Act of 1940, as amended (the “Investment Company Act”). We are an “emerging growth company” within the meaning of the JOBS Act, and, as such, are subject to reduced public company reporting requirements. Our investment objective is to seek to generate both current income and capital appreciation, while seeking to protect against risk of capital loss, by investing predominantly in the debt instruments of middle-market companies in a range of industries, which our external investment manager, Great Elm Capital Management, Inc. (“GECM”), defines as companies with enterprise values between $100.0 million and $2.0 billion. Our investment objectives may be changed without a vote of the holders of a majority of our stock. GECM provides the administrative services necessary for us to operate.
We made, and expect to make, multi‑year investments primarily in secured and senior unsecured debt instruments that we purchase in the secondary markets. We may also originate investments directly with issuers. We invest in companies that have high leverage or operate in industries experiencing cyclical declines. Investments in these companies may trade at discounts to their original issue prices. We seek to protect against risk of loss by investing in borrowers with tangible and intangible assets, where GECM believes asset values are expected to, or do, exceed our investment and any debt that is senior to, or ranks in parity with, our investment. We seek investments whose total return potential (interest income plus capital appreciation and fees, if any) appropriately recognizes potential investment risks. GECM’s investment process includes a focus on an investment’s contractual documents, as it seeks to identify rights that enhance an investment’s risk protection and avoid contracts that compromise potential returns or recoveries. We may also invest in subordinated debt, mezzanine debt, and equity or equity‑linked financial instruments.
Our Portfolio at December 31, 2019
A list of the industries in which we have invested as of December 31, 2019 may be found in “Management’s Discussion and Analysis of Financial Condition and Results of Operations.” Set forth below is a brief description of each company representing greater than 5% of the fair market value of our portfolio at December 31, 2019.
Avanti Communications Group plc
Avanti Communications Group, plc (“Avanti”), located in London, England, is a leading provider of satellite-enabled data communications services in Europe, the Middle East and Africa. Avanti’s network consists of: three high throughput satellites, HYLAS 1, HYLAS 2 and HYLAS 4; a multiband satellite, Artemis; one satellite that is not yet launched, HYLAS 3; and an international fiber network connecting data centers in several countries. Avanti’s satellites primarily operate in the Ka band frequency range. The Ka band allows for the delivery of greater capacity at faster speeds than Ku band capacity.
California Pizza Kitchen, Inc.
Headquartered in Los Angeles, California Pizza Kitchen, Inc. (“CPK”) is a leading polished-casual restaurant chain specializing in California-style pizza. CPK currently has over 240 locations in more than 30 states and 11 countries. In addition to its restaurant operations, CPK also sells its branded products in grocery stores and is a leader in the frozen specialty pizza segment. CPK is owned by Golden Gate Capital, which acquired it in 2011.
Finastra Group Holdings, Ltd
Finastra Group Holdings, Ltd. (“Finastra”) is estimated to be the world’s third largest financial technology company. Finastra, backed by Vista Equity Partners, provides financial software solutions to over nine thousand customers in the retail and transactional banking, lending, treasury and capital markets across 130 countries.
2
Mitchell International, Inc. (“Mitchell”), based in San Diego, CA, provides solutions that simplify, accelerate and drive better outcomes in the management of claims in both the casualty and collision repair processes. Mitchell has a broad range of technology and technology enabled solution services, networks and partners to address the needs of insurance carriers, third party administrators, self-insured entities, managed care organizations, body shops and pharmacies. Mitchell’s solutions are offered through the following units: Clinical Solutions, Casualty Solutions, and Auto Physical Damage Solutions (APD). Clinical Solutions assist in providing better clinical outcomes for individuals that have suffered an injury, primarily as a result of workplace occupational accidents. Casualty Solutions provide integrated cost containment services that assist insurance carriers and other claims payers in accelerating and optimizing claims associated with workplace and automotive bodily accidents. APD solutions help improve the efficiency of the claims and vehicle repair process while accelerating the settlement of claims in the most effective, fair, and accurate manner for the claimant, the autobody shop, and the insurance carrier.
Research Now Group, Inc.
Research Now Group, Inc. (“Research Now”) is the largest first-party data and insight platform, serving nearly 6,000 market research, media and advertising agencies, publishers, consulting and investment firms and corporate customers. Research Now offers end-to-end solutions for research from survey preparation and delivery to data processing and analytics. Research Now conducts over 90 million surveys annually with from its 29 million active panelists.
TRU (UK) Asia Limited
TRU (UK) Asia Limited (“TRU Taj”) is a leading global retailer of toys and juvenile products. As of August 2018, the company operated approximately 441 stores in 9 countries under the “Toys R Us” and “Babies R Us” banners. TRU Taj is a subsidiary of Toys “R” Us, Inc. (“Toys”) and operates substantially all of the company’s international operations (excluding Canada). In August 2018, both Toys and TRU Taj commenced a Chapter 11 plan (the “Plan”) of restructuring in 2017 under the U.S. Bankruptcy Code (the “Bankruptcy Code”). The Plan became effective in January 2019. See “Risk Factors—Risks Relating to Our Investments—By investing in companies that are experiencing significant financial or business difficulties, we will be exposed to distressed lending risks.”
Investment Manager and Administrator
GECM's investment team has more than 100 years of experience in the aggregate financing and investing in leveraged middle-market companies. GECM's team is led by Peter A. Reed, GECM’s Chief Investment Officer. Senior members of the GECM team include Adam M. Kleinman, John S. Ehlinger and Adam W. Yates. The GECM investment team has deployed more than $17.0 billion into more than 550 issuers across 20+ jurisdictions during its members prior and current experiences together.
Investment Selection
GECM employs a team of investment professionals with experience in leveraged finance. The sector-focused research team performs fundamental research at both the industry and company level. Through in-depth industry coverage, GECM's investment team seeks to develop a thorough understanding of the fundamental market, sector drivers, mergers and acquisition activity, security pricing and trading and new issue trends. GECM's investment team believes that understanding industry trends is an important element of investment success.
3
Idea Generation, Origination and Refinement
Idea generation and origination is maximized through long‑standing and extensive relationships with industry contacts, brokers, commercial and investment bankers, as well as current and former clients, portfolio companies and investors. GECM’s investment team is expected to supplement these lead sources by also utilizing broader research efforts, such as attendance at prospective borrower industry conferences and an active calling effort to brokers and investment bankers. GECM’s investment team focuses their idea generation and origination efforts on middle‑market companies. In screening potential investments, GECM’s investment team utilizes a value‑oriented investment philosophy with analysis and research focused on the preservation of capital. GECM has identified several criteria that it believes are important in identifying and investing in prospective portfolio companies. GECM’s process requires focus on the terms of the applicable contracts and instruments perfecting security interests. GECM’s criteria provide general guidelines for GECM’s investment committee’s decisions; however, not all of these criteria will be met by each prospective portfolio company in which they choose to invest.
Asset Based Investments. Debt issued by firms with negative free cash flow but where GECM’s investment thesis is based on the value of the collateral or the issuer’s assets. This type of investment focuses on expected realizable value of the issuer’s assets.
Enterprise Value Investments. Debt issued by firms whose business generates free cash flow to service the debt with a margin of safety and the enterprise value of the firm represents the opportunity for principal to be repaid by refinancing or in connection with a merger or acquisition transaction. These investments focus on the going concern value of the enterprise.
Other Debt Investments. Debt issued by firms which have the ability to pay interest and principal out of expected free cash flow from their business. These investments focus on the sustainability and defensibility of cash flows from the business.
Due Diligence
GECM’s due diligence typically includes:
|
|
▪ |
analysis of the credit documents by GECM’s investment team (including the members of the team with legal training and years of professional experience). GECM will engage outside counsel when necessary as well; |
|
|
▪ |
review of historical and prospective financial information; |
|
|
▪ |
research relating to the prospective portfolio company’s management, industry, markets, customers, products and services and competitors and customers; |
|
|
▪ |
verification of collateral; |
|
|
▪ |
interviews with management, employees, customers and vendors of the prospective portfolio company; and |
|
|
▪ |
informal or formal background and reference checks. |
Upon the completion of due diligence and a decision to proceed with an investment in a company, the investment professionals leading the diligence process present the opportunity to GECM’s investment committee, which then determines whether to pursue the potential investment.
Approval of Investment Transactions
GECM’s procedures call for each new investment under consideration by the GECM analysts to be preliminarily reviewed at periodic meetings of GECM’s investment team. GECM’s investment team then prepares a summary of the investment, including a financial model and risk cases and a legal review checklist. GECM’s investment committee then will hold a formal review meeting, and following approval of a specific investment, authorization is given to GECM’s trader, including execution guidelines.
4
GECM’s investment analysts provide regular updates of the positions for which they are responsible to members of GECM’s investment committee.
GECM’s investment analysts and members of the GECM investment committee will jointly decide when to sell a position. The sale decision will then be given to GECM’s trader, who will execute the trade in consultation with the analyst and the applicable member of GECM’s investment committee.
Ongoing Relationship with Portfolio Companies
As a BDC, we offer, and sometimes provide upon request, significant managerial assistance to certain of our portfolio companies. This assistance could involve, among other things, monitoring the operations of our portfolio companies, participating in board and management meetings, consulting with and advising officers of our portfolio companies and providing other organizational and financial guidance.
GECM’s investment team monitors our portfolio companies on an ongoing basis. They monitor the financial trends of each portfolio company and its respective industry to assess the appropriate course of action for each investment. GECM’s ongoing monitoring of a portfolio company will include both a qualitative and quantitative analysis of the company and its industry.
Valuation Procedures
We value our assets, an essential input in the determination of our net asset value consistent with generally accepted accounting principles in the United States (“GAAP”) and as required by the Investment Company Act. See “Management’s Discussion and Analysis of Financial Condition and Results of Operations–Critical Accounting Policies” for an extended discussion of our methodology.
Staffing
We do not currently have any employees. Mr. Reed is our Chief Executive Officer and President and GECM’s Chief Investment Officer. Under an Administration Agreement, dated as of September 27, 2016 (the “Administration Agreement”), by and between us and GECM, GECM provides the services of our Chief Financial Officer and Chief Compliance Officer.
Competition
We compete for investments with other BDCs and investment funds (including private equity funds, hedge funds, mutual funds, mezzanine funds and small business investment companies), as well as traditional financial services companies such as commercial banks, direct lending funds and other sources of funding. Additionally, because competition for investment opportunities generally has increased among alternative investment vehicles, those entities have begun to invest in areas they have not traditionally invested in, including making investments in the types of portfolio companies we target. Many of these entities have greater financial and managerial resources than we do.
Formation Transactions
On June 23, 2016, we entered into an Agreement and Plan of Merger (the “Merger Agreement”), with Full Circle Capital Corporation, a Maryland corporation (“Full Circle”), that provided for a stock-for-stock merger (the “Merger”) of Full Circle with and into GECC. Concurrent with delivery of the Merger Agreement, we entered into a Subscription Agreement (the “Subscription Agreement”) with Great Elm Capital Group, Inc., a Delaware corporation (“GEC”), and private investment funds (the “MAST Funds”) managed by MAST Capital Management, LLC, a Delaware limited liability company (“MAST Capital”). Per the Subscription Agreement, GEC contributed $30.0 million to us. Prior to the Merger and our election to be regulated as a BDC under the Investment Company Act, per the Subscription Agreement, we acquired a portfolio of debt instruments (the “Initial GECC Portfolio”) from the MAST Funds. As a result of the transactions contemplated by the Subscription Agreement, the MAST Funds owned approximately 75% of the pre‑Merger outstanding shares of our common stock and GEC owned 25% of the pre‑Merger outstanding shares of our common stock. The Merger was completed on November 3, 2016.
5
We applied to the SEC for exemptive relief that will allow us to co‑invest, together with other investment vehicles managed by GECM, in specific investment opportunities. We are unable to predict whether or not the SEC will grant the requested exemption. If the SEC does not provide the requested exemption, GECM will allocate investment opportunities to different investment vehicles in accordance with its allocation policies.
Investment Management Agreement
Management Services
GECM serves as our investment adviser and is registered as an investment adviser under the Investment Advisers Act of 1940, as amended (the “Advisers Act”). Subject to the overall supervision of our board of directors (our “Board”), GECM manages our day‑to‑day operations and provides investment advisory and management services to us. Under the terms of the Investment Management Agreement, dated as of September 27, 2016 (the “Investment Management Agreement”), by and between us and GECM, GECM:
|
|
▪ |
determines the composition of our portfolio, the nature and timing of the changes to our portfolio and the manner of implementing such changes; |
|
|
▪ |
identifies, evaluates and negotiates the structure of our investments (including performing due diligence on our prospective portfolio companies); |
|
|
▪ |
closes and monitors our investments; and |
|
|
▪ |
determines the securities and other assets that we purchase, retain or sell. |
GECM’s services to us under the Investment Management Agreement are not exclusive, and GECM is free to furnish similar services to other entities.
Management and Incentive Fees
Under the Investment Management Agreement, GECM receives a fee from us, consisting of two components: (1) a base management fee and (2) an incentive fee.
The base management fee is calculated at an annual rate of 1.50% based on the average value of our total assets (determined under GAAP) (other than cash or cash equivalents, but including assets purchased with borrowed funds or other forms of leverage) at the end of the two most recently completed calendar quarters. The base management fee is payable quarterly in arrears.
The incentive fee consists of two components that are independent of each other, with the result that one component may be payable even if the other is not. One component of the inventive fee is based on income (the “Income Incentive Fee”) and the other component is based on capital gains (the “Capital Gains Incentive Fee”).
Income Incentive Fee
The Income Incentive Fee is calculated and payable quarterly in arrears based on our pre‑incentive fee net investment income for the quarter. Pre‑incentive fee net investment income means interest income, dividend income and any other income (including any other fees such as commitment, origination, diligence and consulting fees or other fees that we receive from portfolio companies, but excluding fees for providing managerial assistance) accrued during the calendar quarter, minus operating expenses for the quarter (including the base management fee, any expenses payable under the Administration Agreement, and any interest expense and dividends paid on any outstanding preferred stock, but excluding the incentive fee). Pre‑incentive fee net investment income includes any accretion of original issue discount, market discount, payment‑in‑kind (“PIK”) interest, PIK dividends or other types of deferred or accrued income, including in connection with zero coupon securities, that we and our consolidated subsidiaries have recognized in accordance with GAAP, but have not yet received in cash (collectively, “Accrued Unpaid Income”).
6
Pre‑incentive fee net investment income does not include any realized capital gains or unrealized capital appreciation or depreciation. Because of the structure of the incentive fee, it is possible that we may pay an incentive fee in a quarter where we incur a loss. For example, if we receive pre‑incentive fee net investment income in excess of the hurdle rate (as defined below) for a quarter, we will pay the applicable incentive fee even if we have incurred a loss in that quarter due to realized and unrealized capital losses.
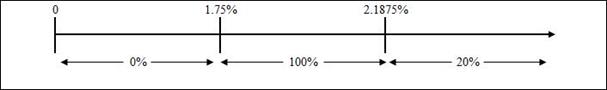
Pre‑incentive fee net investment income, expressed as a rate of return on the value of our net assets (defined in accordance with GAAP) at the end of the immediately preceding calendar quarter, is compared to a fixed “hurdle rate” of 1.75% per quarter (7.00% annualized). If market interest rates rise, we may be able to invest in debt instruments that provide for a higher return, which would increase our pre‑incentive fee net investment income and make it easier for GECM to surpass the fixed hurdle rate and receive an incentive fee based on such net investment income.
We pay the incentive fee with respect to our pre‑incentive fee net investment income in each calendar quarter as follows:
|
|
▪ |
no incentive fee in any calendar quarter in which the pre‑incentive fee net investment income does not exceed the hurdle rate; |
|
|
▪ |
100% of our pre‑incentive fee net investment income with respect to that portion of such pre‑incentive fee net investment income, if any, that exceeds the hurdle rate, but is less than 2.1875% in any calendar quarter (8.75% annualized). We refer to this portion of our pre‑incentive fee net investment income as the “catch up” provision. The “catch up” is meant to provide GECM with 20% of the pre‑incentive fee net investment income as if a hurdle rate did not apply if our net investment income exceeds 2.1875% in any calendar quarter; and |
|
|
▪ |
20% of the amount of our pre‑incentive fee net investment income, if any, that exceeds 2.1875% in any calendar quarter (8.75% annualized). |
The following is a graphical representation of the calculation of the income related portion of the incentive fee:
These calculations are adjusted for any share issuances or repurchases during the quarter and will be appropriately prorated for any period of less than three months. Any Income Incentive Fee otherwise payable with respect to Accrued Unpaid Income (collectively, the “Accrued Unpaid Income Incentive Fees”) will be deferred, on a security by security basis, and will become payable only if, as, when and to the extent cash is received by us or our consolidated subsidiaries in respect thereof. Any Accrued Unpaid Income that is subsequently reversed in connection with a write‑down, write‑off, impairment or similar treatment of the investment giving rise to such Accrued Unpaid Income will, in the applicable period of reversal, (1) reduce pre‑incentive fee net investment income and (2) reduce the amount of Accrued Unpaid Income deferred pursuant to the terms of the Investment Management Agreement. Subsequent payments of Income Incentive Fees deferred pursuant to this paragraph do not reduce the amounts payable for any quarter pursuant to the other terms of the Investment Management Agreement.
7
We will defer cash payment of any Income Incentive Fee otherwise payable to the investment adviser in any quarter (excluding Accrued Unpaid Income Incentive Fees with respect to such quarter) that exceeds (1) 20% of the Cumulative Pre‑Incentive Fee Net Return (as defined below) during the most recent twelve full calendar quarter period ending on or prior to the date such payment is to be made (the “Trailing Twelve Quarters”) less (2) the aggregate incentive fees that were previously paid to the investment adviser during such Trailing Twelve Quarters (excluding Accrued Unpaid Income Incentive Fees during such Trailing Twelve Quarters and not subsequently paid). “Cumulative Pre‑Incentive Fee Net Return” during the relevant Trailing Twelve Quarters means the sum of (a) pre‑incentive fee net investment income in respect of such Trailing Twelve Quarters less (b) net realized capital losses and net unrealized capital depreciation, if any, in each case calculated in accordance with GAAP, in respect of such Trailing Twelve Quarters.
Capital Gains Incentive Fee
The Capital Gains Incentive Fee is determined and payable in arrears as of the end of each calendar year (or upon termination of the Investment Management Agreement, as of the termination date), commencing with the partial calendar year ended December 31, 2016, and is calculated at the end of each applicable year by subtracting (a) the sum of our and our consolidated subsidiaries’ cumulative aggregate realized capital losses and aggregate unrealized capital depreciation from (b) our and our consolidated subsidiaries’ cumulative aggregate realized capital gains, in each case calculated from November 4, 2016. If such amount is positive at the end of such year, then the Capital Gains Incentive Fee for such year is equal to 20% of such amount, less the aggregate amount of Capital Gains Incentive Fees paid in all prior years. If such amount is negative, then there is no Capital Gains Incentive Fee for such year.
The cumulative aggregate realized capital gains are calculated as the sum of the differences, if positive, between (a) the net sales price of each investment in our portfolio when sold and (b) the accreted or amortized cost basis of such investment. The cumulative aggregate realized capital losses are calculated as the sum of the amounts by which (a) the net sales price of each investment in our portfolio when sold is less than (b) the accreted or amortized cost basis of such investment. The aggregate unrealized capital depreciation is calculated as the sum of the differences, if negative, between (a) the fair value of each investment in our portfolio as of the applicable Capital Gains Incentive Fee calculation date and (b) the accreted or amortized cost basis of such investment.
8
Examples of Quarterly Incentive Fee Calculations
The following hypothetical calculations illustrate the calculation of net investment income based incentive fees under the Investment Management Agreement. Amounts shown are a percentage of total net assets.
|
|
|
Assumption 1 |
|
Assumption 2 |
|
Assumption 3 |
|||||||||
|
Investment income(1) |
|
|
4.42 |
% |
|
|
|
5.57 |
% |
|
|
|
6.42 |
% |
|
|
Hurdle rate (7% annualized) |
|
|
1.75 |
% |
|
|
|
1.75 |
% |
|
|
|
1.75 |
% |
|
|
"Catch up" provision (8.75% annualized) |
|
|
2.19 |
% |
|
|
|
2.19 |
% |
|
|
|
2.19 |
% |
|
|
Pre-incentive fee net investment income(2) |
|
|
1.00 |
% |
|
|
|
2.15 |
% |
|
|
|
3.00 |
% |
|
|
Incentive fee |
|
|
- |
% |
(3) |
|
|
0.40 |
% |
(4) |
|
|
0.60 |
% |
(5) |
|
(1) |
Investment income includes interest income, dividends and other fee income. |
|
(2) |
Pre-incentive fee net investment income is net of management fees and other expenses and excludes organizational and offering expenses. In these examples, management fees are 0.38% (1.50% annualized) of net assets and other expenses are assumed to be 3.04% of net assets. |
|
(3) |
The pre-incentive fee net investment income is below the hurdle rate and thus no incentive fee is earned. |
|
(4) |
The pre-incentive fee net investment income ratio of 2.15% is between the hurdle rate and the top of the “catch up” provision thus the corresponding incentive fee is calculated as 100% × (2.15% - 1.75%). |
|
(5) |
The pre-incentive fee net investment income ratio of 3.00% is greater than both the hurdle rate and the “catch up” provision thus the corresponding incentive fee is calculated as (i) 100% × (2.1875% – 1.75%) or 0.4375% (the “catch up”); plus (ii) 20% × (3.00% - 2.1875%). |
9
The following hypothetical calculations illustrate the calculation of the capital gains based incentive fee under the Investment Management Agreement.
|
|
|
In millions |
||||||||
|
|
|
Assumption 1 |
|
Assumption 2 |
||||||
|
Year 1 |
|
|
|
|
|
|
|
|
|
|
|
Investment in Company A |
|
$ |
20.0 |
|
|
|
$ |
20.0 |
|
|
|
Investment in Company B |
|
|
30.0 |
|
|
|
|
30.0 |
|
|
|
Investment in Company C |
|
|
- |
|
|
|
|
25.0 |
|
|
|
Year 2 |
|
|
|
|
|
|
|
|
|
|
|
Proceeds from sale of investment in Company A |
|
|
50.0 |
|
|
|
|
50.0 |
|
|
|
Fair market value (FMV) of investment in Company B |
|
|
32.0 |
|
|
|
|
25.0 |
|
|
|
FMV of investment in Company C |
|
|
- |
|
|
|
|
25.0 |
|
|
|
Year 3 |
|
|
|
|
|
|
|
|
|
|
|
Proceeds from sale of investment in Company C |
|
|
- |
|
|
|
|
30.0 |
|
|
|
FMV of investment in Company B |
|
|
25.0 |
|
|
|
|
24.0 |
|
|
|
Year 4 |
|
|
|
|
|
|
|
|
|
|
|
Proceeds from sale of investment in Company B |
|
|
31.0 |
|
|
|
|
- |
|
|
|
FMV of investment in Company B |
|
|
- |
|
|
|
|
35.0 |
|
|
|
Year 5 |
|
|
|
|
|
|
|
|
|
|
|
Proceeds from sale of investment in Company B |
|
|
- |
|
|
|
|
20.0 |
|
|
|
|
|
|
|
|
|
|
|
|
|
|
|
Capital Gains Incentive Fee: |
|
|
|
|
|
|
|
|
|
|
|
Year 1 |
|
$ |
- |
|
(1) |
|
$ |
- |
|
(1) |
|
Year 2 |
|
|
6.0 |
|
(2) |
|
|
5.0 |
|
(6) |
|
Year 3 |
|
|
- |
|
(3) |
|
|
0.8 |
|
(7) |
|
Year 4 |
|
|
0.2 |
|
(4) |
|
|
1.2 |
|
(8) |
|
Year 5 |
|
|
- |
|
(5) |
|
|
- |
|
(9) |
|
(1) |
There is no Capital Gains Incentive Fee in Year 1 as there have been no realized capital gains. |
|
(2) |
Aggregate realized capital gains are $30.0 million. There are no aggregate realized capital losses or aggregate unrealized capital depreciation. Capital Gains Incentive Fee is calculated as $30.0 million × 20%. |
|
(3) |
Aggregate realized capital gains are $30.0 million. There are no aggregate realized capital losses and there is $5.0 million in aggregate unrealized capital depreciation. Capital Gains Incentive Fee is calculated as the greater of (i) zero and (ii) ($30.0 million - $5.0 million) × 20% less $6.0 million (aggregate Capital Gains Incentive Fee paid in prior years). |
|
(4) |
Aggregate realized capital gains are $31.0 million. There are no aggregate realized capital losses or aggregate unrealized capital depreciation. Capital Gains Incentive Fee is calculated as the greater of (i) zero and (ii) $31.0 million × 20% less $6.0 million (aggregate Capital Gains Incentive Fee paid in prior years). |
|
(5) |
There is no Capital Gains Incentive Fee in Year 5 as there are no aggregate realized capital gains for which Capital Gains Incentive Fee has not already been paid in prior years. |
|
(6) |
Aggregate realized capital gains are $30.0 million. There are no aggregate realized capital losses and there is $5.0 million in aggregate unrealized capital depreciation. Capital Gains Incentive Fee is calculated as the greater of (i) zero and (ii) ($30.0 million - $5.0 million) × 20%. There have been no Capital Gains Incentive Fees paid in prior years. |
|
(7) |
Aggregate realized capital gains are $35.0 million. There are no aggregate realized capital losses and there is $6.0 million in aggregate unrealized capital depreciation. Capital Gains Incentive Fee is calculated as the greater of (i) zero and (ii) ($35.0 million - $6.0 million) × 20% less $5.0 million (aggregate Capital Gains Incentive Fee paid in prior years). |
10
|
(9) |
Aggregate realized capital gains are $35.0 million. Aggregate realized capital losses are $10.0 million. There is no aggregate unrealized capital depreciation. Capital Gains Incentive Fee is calculated as the greater of (i) zero and (ii) ($35.0 million - $10.0 million) × 20% less $7.0 million (aggregate Capital Gains Incentive Fee paid in prior years). |
As illustrated in Year 3 of Assumption 1 above, if GECC were to be wound up on a date other than December 31 of any year, we may have paid aggregate capital gain incentive fees that are more than the amount of such fees that would be payable if GECC had been wound up on December 31 of such year.
For the year ended December 31, 2019, we incurred $3.0 million in base management fees and $2.7 million in income based fees accrued during the period. The incentive fees are currently expected to be deferred in accordance with the Investment Management Agreement. There were no capital gains incentive fees earned by GECM as calculated under the Investment Management Agreement for the year ended December 31, 2019.
For the year ended December 31, 2018, we incurred $3.0 million in base management fees and $0.2 million in income-based fees accrued during the period. The incentive fees were deferred in accordance with the Investment Management Agreement. There were no capital gains incentive fees earned by GECM as calculated under the Investment Management Agreement for the year ended December 31, 2018.
For the period from our inception through December 31, 2016, we incurred $0.4 million in base management fees and $0.9 million in income based fees accrued during the period. The incentive fees were deferred in accordance with the Investment Management Agreement. There was no capital gains incentive fee earned by our investment adviser as calculated under the Investment Management Agreement for the period ended December 31, 2016.
Payment of Expenses
The services of all investment professionals and staff of GECM, when and to the extent engaged in providing investment advisory and management services, and the compensation and routine overhead expenses of such personnel allocable to such services, are provided and paid for by GECM. We bear all other costs and expenses of our operations and transactions, including (without limitation):
|
|
▪ |
our organizational expenses; |
|
|
▪ |
fees and expenses, including reasonable travel expenses, actually incurred by GECM or payable to third parties related to our investments, including, among others, professional fees (including the fees and expenses of counsel, consultants and experts) and fees and expenses relating to, or associated with, evaluating, monitoring, researching and performing due diligence on investments and prospective investments (including payments to third party vendors for financial information services); |
|
|
▪ |
out‑of‑pocket fees and expenses, including reasonable travel expenses, actually incurred by GECM or payable to third parties related to the provision of managerial assistance to our portfolio companies that we agree to provide such services to under the Investment Company Act (exclusive of the compensation of any investment professionals of GECM); |
|
|
▪ |
interest or other costs associated with debt, if any, incurred to finance our business; |
|
|
▪ |
fees and expenses incurred in connection with our membership in investment company organizations; |
|
|
▪ |
brokers’ commissions; |
|
|
▪ |
investment advisory and management fees; |
|
|
▪ |
fees and expenses associated with calculating our net asset value (including the costs and expenses of any independent valuation firm); |
|
|
▪ |
fees and expenses relating to offerings of our common stock and other securities; |
11
|
|
▪ |
federal, state and local taxes and other governmental fees; |
|
|
▪ |
the fees and expenses of GECM, in its role as the administrator, and any sub‑administrator, our transfer agent or sub‑transfer agent, and any other amounts payable under the Administration Agreement, or any similar administration agreement or sub‑administration agreement to which we may become a party; |
|
|
▪ |
the cost of preparing stock certificates or any other expenses, including clerical expenses of issue, redemption or repurchase of our securities; |
|
|
▪ |
the expenses of and fees for registering or qualifying our shares for sale and of maintaining our registration and registering us as a broker or a dealer; |
|
|
▪ |
the fees and expenses of our directors who are not interested persons (as defined in the Investment Company Act); |
|
|
▪ |
the cost of preparing and distributing reports, proxy statements and notices to stockholders, the SEC and other governmental or regulatory authorities; |
|
|
▪ |
costs of holding stockholders’ meetings; |
|
|
▪ |
listing fees; |
|
|
▪ |
the fees or disbursements of custodians of our assets, including expenses incurred in the performance of any obligations enumerated by our amended and restated articles of incorporation or bylaws insofar as they govern agreements with any such custodian; |
|
|
▪ |
our allocable portion of the fidelity bond, directors and officers/errors and omissions liability insurance, and any other insurance premiums; |
|
|
▪ |
our allocable portion of the costs associated with maintaining any computer software, hardware or information technology services (including information systems, Bloomberg or similar terminals, cyber security and related consultants and email retention) that are used by us or by GECM or its respective affiliates on our behalf (which allocable portion shall exclude any such costs related to investment professionals of GECM providing services to us); |
|
|
▪ |
direct costs and expenses incurred by us or GECM in connection with the performance of administrative services on our behalf, including printing, mailing, long distance telephone, cellular phone and data service, copying, secretarial and other staff, independent auditors and outside legal costs; |
|
|
▪ |
all other expenses incurred by us or GECM in connection with administering our business (including payments under the Administration Agreement based upon our allocable portion of GECM’s overhead in performing its obligations under the Administration Agreement, including rent and the allocable portion of the cost of our Chief Financial Officer and Chief Compliance Officer and their respective staffs (including reasonable travel expenses); and |
|
|
▪ |
costs incurred by us in connection with any claim, litigation, arbitration, mediation, government investigation or dispute in connection with our business and the amount of any judgment or settlement paid in connection therewith, or the enforcement of our rights against any person and indemnification or contribution expenses payable by us to any person and other extraordinary expenses not incurred in the ordinary course of our business. |
Duration and Termination
Our Board approved the Investment Management Agreement on August 8, 2016. The Investment Management Agreement renews for successive annual periods subject to annual approval by our Board or by the affirmative vote of the holders of a majority of our outstanding voting securities, including, in either case, approval by a majority of our directors who are not “interested persons.” The Investment Management Agreement will automatically terminate if it is assigned. The Investment Management Agreement may be terminated by either party without penalty upon 60 days’ written notice to the other. The Investment Management Agreement is currently in effect.
12
Conflicts of interest may arise if GECM seeks to change the terms of the Investment Management Agreement, including, for example, the terms for compensation. Any material change to the Investment Management Agreement must be submitted to stockholders for approval under the Investment Company Act and we may from time to time decide it is appropriate to seek stockholder approval to change the terms of the Investment Management Agreement.
Indemnification
We agreed to indemnify GECM, its stockholders and their respective officers, managers, partners, agents, employees, controlling persons, members and any other person affiliated with it, to the fullest extent permitted by law, absent willful misfeasance, bad faith or gross negligence in the performance of its duties or by reason of the reckless disregard of its duties and obligations, for any damages, liabilities, costs and expenses (including reasonable attorneys’ fees and amounts reasonably paid in settlement) arising from the rendering of GECM’s services under the Investment Management Agreement or otherwise as our investment adviser.
Organization of the Investment Adviser
GECM is a Delaware corporation and is registered as an investment adviser under the Advisers Act. GECM’s principal executive offices are located at 800 South Street, Suite 230, Waltham, MA 02453.
Regulation as a Business Development Company
We may not change the nature of our business so as to cease to be, or withdraw our election as, a BDC unless authorized by vote of a majority of the outstanding voting securities, as required by the Investment Company Act. A majority of the outstanding voting securities of a company is defined under the Investment Company Act as the lesser of:
|
|
▪ |
67% or more of the voting securities present at a meeting if more than 50% of the outstanding voting securities are present or represented by proxy, or |
|
|
▪ |
more than 50% of the outstanding voting securities. |
A majority of our directors must be persons who are not interested persons, as that term is defined in the Investment Company Act. Additionally, we are required to provide and maintain a bond issued by a reputable fidelity insurance company to protect the BDC. Furthermore, as a BDC, we are prohibited from protecting any director or officer against any liability to us or our stockholders arising from willful misfeasance, bad faith, gross negligence or reckless disregard of the duties involved in the conduct of such person's office.
We are required to meet a coverage ratio of the value of total assets to total senior securities, which include all of our borrowings and any preferred stock we may issue in the future, of at least 150%. We may also be prohibited under the Investment Company Act from knowingly participating in certain transactions with our affiliates without the prior approval of our directors who are not interested persons and, in some cases, prior approval by the SEC.
We are generally unable to sell shares of our common stock at a price below net asset value per share. As a BDC, the necessity of raising additional capital may expose us to risks, including the typical risks associated with leverage. We may, however, sell shares of our common stock at a price below net asset value per share:
|
|
▪ |
in connection with a rights offering to our existing stockholders, |
|
|
▪ |
with the consent of the majority of our common stockholders, or |
|
|
▪ |
under such other circumstances as the SEC may permit. |
For example, we may sell shares of our common stock at a price below the then current net asset value of our common stock if our Board determines that such sale is in our and our stockholders’ best interests, and our stockholders approve our policy and practice of making such sales. In any such case, under such circumstances, the price at which shares of our common stock are sold may be the fair value of such shares of common stock. We may be examined by the SEC for compliance with the Investment Company Act.
13
We may not acquire any asset other than "qualifying assets" unless, at the time we make such acquisition, the value of our qualifying assets represents at least 70% of the value of our total assets. The principal categories of qualifying assets relevant to our business are:
|
|
▪ |
securities purchased in transactions not involving any public offering, the issuer of which is an eligible portfolio company; |
|
|
▪ |
securities received in exchange for or distributed with respect to securities described in the bullet above or pursuant to the exercise of options, warrants or rights relating to such securities; and |
|
|
▪ |
cash, cash items, government securities or high quality debt securities (within the meaning of the Investment Company Act), maturing in one year or less from the time of investment. |
An eligible portfolio company is generally a domestic company that is not an investment company (other than a small business investment company wholly owned by a BDC) and that:
|
|
▪ |
does not have a class of securities with respect to which a broker may extend margin credit at the time the acquisition is made; |
|
|
▪ |
is controlled by the BDC and has an affiliate of the BDC on its board of directors; |
|
|
▪ |
does not have any class of securities listed on a national securities exchange; |
|
|
▪ |
is a public company that lists its securities on a national securities exchange with a market capitalization of less than $250.0 million; or |
|
|
▪ |
meets such other criteria as may be established by the SEC. |
Control, as defined by the Investment Company Act, is presumed to exist where a BDC beneficially owns more than 25% of the outstanding voting securities of the portfolio company.
In addition, a BDC must have been organized and have its principal place of business in the United States and must be operated for the purpose of making investments in eligible portfolio companies, or in other securities that are consistent with its purpose as a BDC.
To include certain securities described above as qualifying assets for the purpose of the 70% test, a BDC must offer to the issuer of those securities managerial assistance such as providing guidance and counsel concerning the management, operations, or business objectives and policies of a portfolio company. We offer to provide managerial assistance to our portfolio companies.
Pending investment in other types of "qualifying assets," as described above, our investments may consist of cash, cash equivalents, U.S. government securities or high-quality debt securities maturing in one year or less from the time of investment, which are referred to, collectively, as temporary investments, so that 70% of our assets, as applicable, are qualifying assets. We will invest in U.S. Treasury bills or in repurchase agreements that are fully collateralized by cash or securities issued by the U.S. government or its agencies. A repurchase agreement involves the purchase by an investor of a specified security and the simultaneous agreement by the seller to repurchase it at an agreed-upon future date and at a price which is greater than the purchase price by an amount that reflects an agreed-upon interest rate. There is no percentage restriction on the proportion of our assets that may be invested in such repurchase agreements. However, if more than 25% of our gross assets constitute repurchase agreements from a single counterparty, we would not meet the diversification tests in order to qualify as a RIC for federal income tax purposes. Thus, we do not intend to enter into repurchase agreements with a single counterparty in excess of this limit.
We are permitted, under specified conditions, to issue multiple classes of indebtedness and one class of stock senior to our common stock, if our asset coverage, as defined in the Investment Company Act, is at least equal to 150% immediately after each such issuance. In addition, while any senior securities remain outstanding, we must make provisions to prohibit any distribution to our stockholders or the repurchase of our common stock unless we meet the applicable asset coverage ratios at the time of the distribution or repurchase. We may also borrow amounts up to 5% of the value of our gross assets for temporary or emergency purposes without regard to asset coverage.
14
We and GECM have each adopted a code of ethics, which applies to the management at each company, respectively, pursuant to Rule 17j-1 under the Investment Company Act and Rule 204A-1 under the Advisers Act, respectively, that establishes procedures for personal investments and restricts certain transactions by our or GECM's personnel, respectively. Each code of ethics is available on the EDGAR Database on the SEC's Internet site at http://www.sec.gov. You may also obtain copies of the respective codes of ethics, after paying a duplicating fee, by electronic request at the following email address: publicinfo@sec.gov.
Material Federal Income Tax Matters
We currently qualify as a RIC under the Internal Revenue Code of 1986, as amended (the “Code”). To continue to qualify as a RIC, we must, among other things, (a) derive in each taxable year at least 90% of our gross income from dividends, interest (including tax‑exempt interest), payments with respect to certain securities loans, gains from the sale or other disposition of stock, securities or foreign currencies, other income (including but not limited to gain from options, futures and forward contracts) derived with respect to our business of investing in stock, securities or currencies, or net income derived from an interest in a “qualified publicly traded partnership” (a “QPTP”); and (b) diversify our holdings so that, at the end of each quarter of each taxable year (i) at least 50% of the market value of our total assets is represented by cash and cash items, U.S. Government securities, the securities of other regulated investment companies and other securities, with other securities limited, in respect of any one issuer, to an amount not greater than 5% of the value of our total assets and not more than 10% of the outstanding voting securities of such issuer (subject to the exception described below), and (ii) not more than 25% of the market value of our total assets is invested in the securities (other than U.S. Government securities and the securities of other regulated investment companies) (A) of any issuer, (B) of any two or more issuers that we control and that are determined to be engaged in the same business or similar or related trades or businesses, or (C) of one or more QPTPs. We may generate certain income that might not qualify as good income for purposes of the 90% annual gross income requirement described above. We will monitor our transactions to endeavor to prevent our disqualification as a RIC.
If we fail to satisfy the 90% annual gross income requirement or the asset diversification requirements discussed above in any taxable year, we may be eligible for relief provisions if the failures are due to reasonable cause and not willful neglect and if a penalty tax is paid with respect to each failure to satisfy the applicable requirements. Additionally, relief is provided for certain de minimis failures of the asset diversification requirements where we correct the failure within a specified period. If the applicable relief provisions are not available or cannot be met, all of our income would be subject to corporate‑level U.S. federal income tax as described below. We cannot provide assurance that we would qualify for any such relief should we fail the 90% annual gross income requirement or the asset diversification requirements discussed above.
As a RIC, in any taxable year with respect to which we timely distribute at least 90% of the sum of:
|
|
▪ |
our investment company taxable income (which includes, among other items, dividends, interest and the excess of any net short‑term capital gain over net long‑term capital loss and other taxable income (other than any net capital gain), reduced by deductible expenses) determined without regard to the deduction for dividends and distributions paid; and |
|
|
▪ |
net tax exempt interest income (which is the excess of our gross tax exempt interest income over certain disallowed deductions) (the “Annual Distribution Requirement”). |
We (but not our stockholders) generally will not be subject to U.S. federal income tax on investment company taxable income and net capital gain (generally, net long‑term capital gain in excess of short‑term capital loss) that we distribute to our stockholders. We intend to distribute annually all or substantially all of such income on a timely basis.
To the extent that we retain our net capital gains for investment or any investment company taxable income, we will be subject to U.S. federal income tax at the regular corporate income tax rates. We may choose to retain our net capital gains for investment or any investment company taxable income, and pay the associated federal corporate income tax, including the federal excise tax described below.
15
Amounts not distributed on a timely basis in accordance with a calendar year distribution requirement are subject to a nondeductible 4% U.S. federal excise tax payable by us. To avoid this tax, we must distribute (or be deemed to have distributed) during each calendar year an amount equal to the sum of:
|
|
▪ |
at least 98% of our ordinary income (not taking into account any capital gains or losses) for the calendar year; |
|
|
▪ |
at least 98.2% of the amount by which our capital gains exceed our capital losses (adjusted for certain ordinary losses) for a one‑year period generally ending on October 31 of the calendar year (unless an election is made by us to use our taxable year); and |
|
|
▪ |
certain undistributed amounts from previous years on which we paid no U.S. federal income tax. |
While we intend to distribute any income and capital gains in the manner necessary to minimize imposition of the 4% federal excise tax, sufficient amounts of our taxable income and capital gains may not be distributed to avoid entirely the imposition of the tax. In that event, we will be liable for the tax only on the amount by which we do not meet the foregoing distribution requirement.
If, in any particular taxable year, we do not satisfy the Annual Distribution Requirement or otherwise were to fail to qualify as a RIC (for example, because we fail the 90% annual gross income requirement described above), and relief is not available as discussed above, all of our taxable income (including our net capital gains) will be subject to tax at regular corporate rates without any deduction for distributions to stockholders, and distributions generally will be taxable to the stockholders as ordinary dividends to the extent of our current and accumulated earnings and profits.
We may decide to be taxed as a regular corporation even if we would otherwise qualify as a RIC if we determine that treatment as a corporation for a particular year would be in our best interests.
If we realize a net capital loss, the excess of our net short‑term capital loss over our net long‑term capital gain is treated as a short‑term capital loss arising on the first day of our next taxable year and the excess of our net long‑term capital loss over our net short‑term capital gain is treated as a long‑term capital loss arising on the first day of our next taxable year. If future capital gain is offset by carried forward capital losses, such future capital gain is not subject to fund‑level U.S. federal income tax, regardless of whether they are distributed to stockholders. Accordingly, we do not expect to distribute any such offsetting capital gain. A RIC cannot carry back or carry forward any net operating losses.
Our Investments
Certain of our investment practices are subject to special and complex U.S. federal income tax provisions that may, among other things:
|
|
▪ |
disallow, suspend or otherwise limit the allowance of certain losses or deductions, including the dividends received deduction; |
|
|
▪ |
convert lower taxed long‑term capital gain and qualified dividend income into higher taxed, short‑term capital gain or ordinary income; |
|
|
▪ |
convert ordinary loss or a deduction into capital loss (the deductibility of which is more limited); |
|
|
▪ |
cause us to recognize income or gain without a corresponding receipt of cash; |
|
|
▪ |
adversely affect the time as to when a purchase or sale of stock or securities is deemed to occur; |
|
|
▪ |
adversely alter the characterization of certain complex financial transactions; and |
|
|
▪ |
produce income that will not qualify as “good income” for purposes of the 90% annual gross income requirement described above. |
We will monitor our transactions and may make certain tax elections and may be required to borrow money or dispose of securities (even if it is not advantageous to dispose of such securities) to mitigate the effect of these rules and prevent disqualification of us as a RIC.
16
Investments we make in securities issued at a discount or providing for deferred interest or PIK interest are subject to special tax rules that will affect the amount, timing and character of distributions to stockholders. For example, with respect to securities issued at a discount, we will generally be required to accrue daily as income a portion of the discount and to distribute such income on a timely basis each year to maintain our qualification as a RIC and to avoid U.S. federal income and excise taxes. Since in certain circumstances we may recognize income before or without receiving cash representing such income, we may have difficulty making distributions in the amounts necessary to satisfy the requirements for maintaining RIC status and for avoiding U.S. federal income and excise taxes. Accordingly, we may have to sell some of our investments at times we would not consider advantageous, raise additional debt or equity capital or reduce new investment originations to meet these distribution requirements. If we are not able to obtain cash from other sources, we may fail to qualify as a RIC and thereby be subject to corporate‑level income tax.
Furthermore, a portfolio company in which we invest may face financial difficulty that requires us to work‑out, modify or otherwise restructure our investment in the portfolio company. Any such restructuring may result in unusable capital losses and future non‑cash income. Any such restructuring may also result in our recognition of a substantial amount of non‑qualifying income for purposes of the 90% gross income requirement or our receiving assets that would not count toward the asset diversification requirements.
Gain or loss recognized by us from warrants acquired by us as well as any loss attributable to the lapse of such warrants generally will be treated as capital gain or loss. Such gain or loss generally will be long‑term or short‑term, depending on how long we held a particular warrant.
If we invest in foreign securities, we may be subject to withholding and other foreign taxes with respect to those securities. Stockholders will generally not be entitled to claim a U.S. foreign tax credit or deduction with respect to foreign taxes paid by us.
If we acquire shares in a “passive foreign investment company” (a “PFIC”), we may be subject to U.S. federal income tax on a portion of any “excess distribution” or gain from the disposition of such shares even if such income is distributed as a taxable dividend by us to our stockholders. Additional charges in the nature of interest may be imposed on us in respect of deferred taxes arising from such distributions or gains. If we invest in a PFIC and elect to treat the PFIC as a “qualified electing fund” under the Code (a “QEF”), in lieu of the foregoing requirements, we will be required to include in income each year a portion of the ordinary earnings and net capital gain of the QEF, even if such income is not distributed to us. Alternatively, we can elect to mark‑to‑market at the end of each taxable year our shares in a PFIC; in this case, we will recognize as ordinary income any increase in the value of such shares, and as ordinary loss any decrease in such value to the extent it does not exceed prior increases included in income. Our ability to make either election will depend on factors beyond our control. Under either election, we may be required to recognize in a year income in excess of our distributions from PFICs and our proceeds from dispositions of PFIC stock during that year, and such income will nevertheless be subject to the Annual Distribution Requirement and will be taken into account for purposes of the 4% excise tax.
If we hold more than 10% of the shares in, or the value of, a foreign corporation that is treated as a controlled foreign corporation (“CFC”), we may be required to include in our gross income our pro rata share of such CFC’s “subpart F income” and “global intangible low-taxed income,” whether or not the corporation makes an actual distribution during such year. In general, a foreign corporation will be classified as a CFC if more than 50% of the shares of the corporation, measured by reference to combined voting power or value, is owned (directly, indirectly or by attribution) by U.S. Stockholders. A U.S. Stockholder, for this purpose, is any U.S. person that possesses (actually or constructively) 10% or more of the combined voting power of all classes of shares or 10% or more of the value of a corporation. If we are treated as receiving a deemed distribution from a CFC, we will be required to include such distribution in our investment company taxable income regardless of whether we receive any actual distributions from such CFC, and we must distribute such income to satisfy the Annual Distribution Requirement and the Excise Tax Avoidance Requirement.
17
Our functional currency is the U.S. dollar for U.S. federal income tax purposes. Under Section 988 of the Code, gains or losses attributable to fluctuations in exchange rates between the time we accrue income, expenses or other liabilities denominated in a foreign currency and the time we actually collect such income or pay such expenses or liabilities are generally treated as ordinary income or loss. Similarly, gains or losses on foreign currency forward contracts and the disposition of debt denominated in a foreign currency, to the extent attributable to fluctuations in exchange rates between the acquisition and disposition dates, are also treated as ordinary income or loss.
If we borrow money, we may be prevented by loan covenants from declaring and paying dividends in certain circumstances. Limits on our payment of dividends may prevent us from meeting the Annual Distribution Requirement, and may, therefore, jeopardize our qualification for taxation as a RIC, or subject us to the 4% excise tax.
Even if we are authorized to borrow funds and to sell assets in order to satisfy distribution requirements, under the Investment Company Act, we are not permitted to make distributions to our stockholders while our debt obligations and senior securities are outstanding unless certain “asset coverage” tests are met. This may also jeopardize our qualification for taxation as a RIC or subject us to the 4% excise tax.
Moreover, our ability to dispose of assets to meet our distribution requirements may be limited by (1) the illiquid nature of our portfolio and (2) other requirements relating to our status as a RIC, including the asset diversification requirements. If we dispose of assets to meet the Annual Distribution Requirement, the asset diversification requirements, or the 4% excise tax, we may make such dispositions at times that, from an investment standpoint, are not advantageous.
Some of the income that we might otherwise earn, such as lease income, management fees, or income recognized in a work‑out or restructuring of a portfolio investment, may not satisfy the 90% gross income requirement. To manage the risk that such income might disqualify us as a RIC for a failure to satisfy the 90% gross income requirement, one or more of our subsidiaries treated as U.S. corporations for U.S. federal income tax purposes may be employed to earn such income. Such corporations will be required to pay U.S. corporate income tax on their earnings, which ultimately will reduce the yield to our stockholders on such income and fees.
Failure to Qualify as a RIC
If we were unable to qualify for treatment as a RIC, and relief is not available as discussed above, we would be subject to tax on all of our taxable income at regular corporate rates. We would not be able to deduct distributions to stockholders nor would we be required to make distributions for tax purposes. Distributions would generally be taxable to our stockholders as ordinary dividend income eligible for reduced maximum rates for non-corporate stockholders to the extent of our current and accumulated earnings and profits. Subject to certain limitations under the Code, corporate U.S. stockholders would be eligible for the dividends received deduction. Distributions in excess of our current and accumulated earnings and profits would be treated first as a return of capital to the extent of the stockholder’s tax basis, and any remaining distributions would be treated as a capital gain. If we were to fail to meet the RIC requirements for more than two consecutive years and then to seek to requalify as a RIC, we would be required to recognize gain to the extent of any unrealized appreciation in our assets unless we made a special election to pay corporate level tax on any such unrealized appreciation recognized during the succeeding five‑year period.
18
Our Board approved the Administration Agreement on August 8, 2016. Pursuant to the Administration Agreement, GECM furnishes us with, or otherwise arranges for the provision of, office facilities, equipment, clerical, bookkeeping, finance, accounting, compliance and record keeping services at such office facilities and other such services as the administrator. Under the Administration Agreement, GECM will, from time to time, provide, or otherwise arrange for the provision of, other services GECM determines to be necessary or useful to perform its obligations under the Administration Agreement, including retaining the services of financial, compliance, accounting and administrative personnel that perform services on our behalf, including personnel to serve as our Chief Financial Officer and Chief Compliance Officer. Under the Administration Agreement, GECM also performs, or oversees the performance of, our required administrative services, which include, among other things, being responsible for the financial records that we are required to maintain and preparing reports to our stockholders and reports filed with the SEC. In addition, GECM assists us in determining and publishing our net asset value, oversees the preparation and filing of our tax returns and the printing and dissemination of reports to our stockholders, and generally oversees the payment of our expenses and the performance of administrative and professional services rendered to us by others. Payments made by us to GECM under the Administration Agreement are equal to an amount based upon our allocable portion of GECM’s overhead in performing its obligations under the Administration Agreement, including our allocable portion of the cost of our officers (including our Chief Compliance Officer, Chief Financial Officer and their respective staffs). The Administration Agreement may be terminated by either party without penalty upon 60 days’ written notice to the other party.
We bear all costs and expenses that are incurred in our operation and transactions and not specifically assumed by GECM pursuant to the Investment Management Agreement.
The Administration Agreement provides that, to the fullest extent permitted by law, absent willful misfeasance, bad faith or gross negligence in the performance of its duties or by reason of the reckless disregard of its duties and obligations, GECM, its stockholders and their respective officers, managers, partners, agents, employees, controlling persons, members and any other person or entity affiliated with it are entitled to indemnification from us for any damages, liabilities, costs and expenses (including reasonable attorneys’ fees and amounts reasonably paid in settlement) arising from or otherwise based upon the rendering of GECM’s services under the Administration Agreement or otherwise as our administrator.
Great Elm License Agreement
We entered into a license agreement with GEC pursuant to which GEC granted us a non‑exclusive, royalty‑free license to use the name “Great Elm Capital Corp.” Under the license agreement, we have a right to use the Great Elm Capital Corp. name and the logo for so long as GECM, or an affiliate thereof, remains our investment adviser. Other than with respect to this limited license, we have no legal right to the “Great Elm Capital Corp.” name. The license agreement may be terminated by either party without penalty upon 60 days’ written notice to the other.
Brokerage Allocation and Other Practices
GECM does not expect to execute our transactions through any particular broker or dealer, but it plans to seek to obtain the best net results for us, taking into account such factors as price (including the applicable brokerage commission or dealer spread), size of order, difficulty of execution and operational facilities of the firm and the firm’s risk and skill in positioning blocks of securities. While GECM will generally seek reasonably competitive trade execution costs, we will not necessarily pay the lowest spread or commission available. Subject to applicable legal requirements, GECM may select a broker based partly upon brokerage or research services provided to GECM, us or GECM’s other clients. In return for such services, we may pay a higher commission than other brokers would charge if we or GECM determines in good faith that such commission is reasonable in relation to the services provided.
19
Risks Relating to Our Investments
We may lose all of our investment in Avanti.
We may lose all of our investment in Avanti. As of December 31, 2019, Avanti is our largest investment, representing approximately 21% of our investment portfolio (excluding cash and short-term investments). As of December 31, 2019, we owned approximately 11% of Avanti's outstanding debt and approximately 9% of Avanti's outstanding common stock. We acquired our original position in Avanti as part of the Initial GECC Portfolio, which we purchased from the MAST Funds prior to the Merger.
In December 2017, following a series of liability management transactions, including a refinancing that resulted in us adding a representative to Avanti’s board of directors (currently filled by our Chief Compliance Officer), we and other holders of Avanti’s second lien senior secured notes (the “PIK Toggle Notes”) and 10% senior secured bonds due 2019 (the “2019 Notes”) entered into a restructuring agreement with Avanti. The restructuring closed on April 26, 2018 and resulted in:
|
|
▪ |
all 2019 Notes converting into common stock of Avanti, representing approximately 92% of the pro forma common shares of Avanti, with our position representing approximately 9.1% of the pro forma common shares of Avanti; and |
|
|
▪ |
the cash interest rate on the PIK Toggle Notes being reduced from 10% to 9% and the PIK interest rate being reduced from 15% to 9% on the PIK Toggle Notes, the extension of the maturity date by one year to October 1, 2022 and Avanti being permitted to issue up to $30.0 million of indebtedness that ranks equal with or junior to the PIK Toggle Notes and receiving relaxed financial covenants, including the elimination of certain financial maintenance covenants. |
Avanti is highly leveraged. In addition, following the restructuring, Avanti may seek to raise up to an additional $30.0 million of indebtedness that ranks equal with or junior to the PIK Toggle Notes.
If there is an event of default under the indenture governing the PIK Toggle Notes or any other indebtedness and the obligations under the PIK Toggle Notes are accelerated, Avanti likely will not have sufficient liquidity to pay the obligations under the PIK Toggle Notes. Under such circumstances, Avanti may consider other restructuring options, such as entering into an insolvency procedure under English law or by filing for Chapter 11 protection under the U.S. Bankruptcy Code, the consequences of which could include a reduction in the value of the assets available to satisfy the PIK Toggle Notes and the imposition of costs and other additional risks on holders of the PIK Toggle Notes, including a material reduction in the value of the PIK Toggle Notes. In such an event, we may lose all or part of our investment in Avanti.
In addition, as noted above, we now own approximately 9% of Avanti’s common stock. Equity securities expose us to additional risks should Avanti default on its debt or need additional financing. Equity securities rank lower in the capital structure and would likely not pay current income or PIK income, which we had been receiving on our investment in Avanti. Please see, “—We are not in a position to exercise control over our portfolio companies or to prevent decisions by management of our portfolio companies that could decrease the value of our investments” and “—Our investments are very risky and highly speculative, and the lower middle-market companies we target may have difficulty accessing the capital markets to meet their future capital needs, which may limit their ability to grow or to repay their outstanding indebtedness upon maturity.”
The long-term impact of this refinancing transaction on Avanti's financial condition is uncertain and cannot be predicted. The refinancing transaction did not materially change Avanti's long term capital structure and it is unclear whether the refinancing transaction addresses the longer term sustainability of Avanti's business model. We may sell at a loss all or a portion of our investment in Avanti from time to time in order to meet diversification requirements under the Code or as part of our portfolio management strategy.
20
We are currently receiving PIK interest on our Avanti investment under the PIK Toggle Notes. As part of the restructuring, the PIK Toggle Notes became pay-if-you-can (PIYC) notes whereby Avanti is required to make interest payments in cash, subject to satisfying certain minimum cash thresholds. Otherwise, the interest will be paid as PIK interest. Such PIK interest exposes us to significant risks. Please see “—Risks Relating to Our Business and Structure—We may expose ourselves to risks associated with the inclusion of non-cash income prior to receipt of cash,” and “—Risks Relating to Our Business and Structure—We may have difficulty paying our required distributions under applicable tax rules if we recognize income before or without receiving cash representing such income.” Additionally, all accrued interest (through March 31, 2018) on the 2019 Notes has been converted into additional shares of Avanti common equity. The December 2017 restructuring could result in a significant decrease in our net asset value if the market value of the Avanti common stock that we received in the restructuring significantly and a significant decrease in our total investment income. These factors could also result in lower trading prices for our common stock and/or debt securities. Notwithstanding the risks associated with the December 2017 restructuring, we believe the value of the Avanti common stock we received in exchange for the 2019 Notes was substantially equal to the value of the 2019 Notes (including accrued PIK interest) converted in the restructuring at the time of the exchange. There can be no certainty in this respect and a significant decrease in the market value of the Avanti common stock following the restructuring could ultimately have a material adverse effect on our net asset value and the trading prices of our securities. The Avanti common stock was delisted from their primary exchange in September 2019 and no longer trades on an exchange.
We face increasing competition for investment opportunities. Limited availability of attractive investment opportunities in the market could cause us to hold a larger percentage of our assets in liquid securities until market conditions improve. We compete for investments with other BDCs and investment funds (including private equity funds, mezzanine funds and small business investment companies), as well as traditional financial services companies such as commercial banks and other sources of funding. Many of our competitors are substantially larger and have considerably greater financial, technical and marketing resources than we do. For example, some competitors have a lower cost of capital and access to funding sources that are not available to us, including from the Small Business Administration. In addition, increased competition for attractive investment opportunities allows debtors to demand more favorable terms and offer fewer contractual protections to creditors. Some of our competitors have higher risk tolerances or different risk assessments than we do. These characteristics could allow our competitors to consider a wider variety of investments, establish more relationships and offer better pricing and more flexible structuring than we are able to offer. We may lose investment opportunities if we do not match our competitors’ pricing, terms and structure. If we are forced to match our competitors’ pricing, terms and structure, we may not be able to achieve acceptable returns on our investments or may bear substantial risk of capital loss. A significant part of our competitive advantage stems from the fact that the market for investments in lower middle‑market companies is underserved by traditional commercial banks and other financing sources. A significant increase in the number and/or the size of our competitors in this target market would force us to accept less attractive investment terms. GECM may, at its discretion, decide to pursue such opportunities if it believes that they are in our best interest; however, GECM may decline to pursue available investment opportunities that, although otherwise consistent with our investment policies and objectives, in GECM’s view present unacceptable risk/return profiles. Under such circumstances, we may hold a larger percentage of our assets in liquid securities until market conditions improve in order to avoid having assets remain uninvested. Furthermore, many of our competitors have greater experience operating under, or are not subject to, the regulatory restrictions that the Investment Company Act imposes on us as a BDC. We believe that competitors will make first and second lien loans with interest rates and returns that are lower than the rates and returns that we target. Therefore, we do not seek to compete solely on the interest rates and returns offered to prospective portfolio companies.
21
Changes in the regulatory framework under which the wireless telecommunications industry operates and significant competition in the wireless telecommunications industry could adversely affect our business prospects or results of operations. We hold a large position in Avanti. As a result of our stake in Avanti, we are exposed to risks associated with the wireless telecommunications sector.
For example, Avanti’s operations are regulated by various foreign governments and international bodies. These regulatory regimes restrict or impose conditions on Avanti’s ability to operate in designated areas and to provide specified products or services. In addition, new laws or regulations or changes to the existing regulatory framework could impose additional costs, impair revenue opportunities and potentially impede Avanti’s ability to provide services. The further regulation of Avanti’s activities could impact Avanti’s ability to compete in the marketplace and limit the return Avanti, and, as a result, we, can expect to achieve.
In addition, Avanti’s business may also be affected by the significant competition in the wireless telecommunications industry. There is rapid development of new technologies, services and products, which brings new competitors to the market. While these changes have enabled companies like Avanti to offer new types of products and services, they have also allowed other providers to broaden the scope of their own competitive offerings. Avanti’s ability to compete effectively will depend on, among other things, how successfully Avanti anticipates and responds to various factors affecting its industry, including new technologies and business models, changes in consumer preferences and demand for existing services, demographic trends and economic conditions. If Avanti is not able to respond successfully to these competitive challenges, Avanti may face challenges in meeting its required payments under its debt securities held by us, which could result in a material decrease in the fair value of such debt securities, and a corresponding material adverse change in our financial position and results of operations.
Our portfolio will be limited in diversification among portfolio companies which may subject us to a risk of significant loss if one or more of these companies defaults on its obligations under any of its debt instruments. Our portfolio is likely to hold a limited number of portfolio companies. Beyond the asset diversification requirements associated with qualification as a RIC, we do not have fixed guidelines for diversification, and our investments are likely to be concentrated in relatively few companies. As our portfolio is less diversified than the portfolios of some funds, we are more susceptible to failure if a single investment fails. Similarly, the aggregate returns we realize may be significantly adversely affected if a small number of investments perform poorly or if we need to write down the value of any one investment.
Our portfolio will be concentrated in a limited number of industries, which subjects us to a risk of significant loss if there is a downturn in a particular industry in which a number of our investments are concentrated. Our portfolio is likely to be concentrated in a limited number of industries. A downturn in any particular industry in which we are invested could significantly impact our aggregate realized returns.
In addition, we may from time to time invest a relatively significant percentage of our portfolio in industries in which GECM does not necessarily have extensive historical research coverage. If an industry in which we have significant investments suffers from adverse business or economic conditions, as these industries have to varying degrees, a material portion of our investment portfolio could be affected adversely, which, in turn, could adversely affect our financial position and results of operations.
Any unrealized losses we experience in our portfolio may be an indication of future realized losses, which could reduce our income available for distribution. As a BDC, we are required to carry our investments at fair value as determined in good faith by our Board. Decreases in the fair values of our investments are recorded as unrealized depreciation. Any unrealized losses in our portfolio could be an indication of a portfolio company’s inability to meet its repayment obligations to us with respect to the affected investments. This could result in realized losses in the future and ultimately in reductions of our income available for distribution in future periods.
22
Prepayments of our debt investments by our portfolio companies could adversely impact our results of operations and reduce our returns on equity. We are subject to the risk that investments intended to be held over long periods are, instead, repaid prior to maturity. When this occurs, we will generally reinvest these proceeds in temporary investments, repay debt or repurchase our common stock, depending on expected future investment opportunities. These temporary investments will typically have substantially lower yields than the debt being prepaid and we could experience significant delays in reinvesting these amounts. Any future investment may also be at lower yields than the debt that was repaid. As a result, our results of operations could be materially adversely affected if one or more of our portfolio companies elects to prepay amounts owed by them. Additionally, prepayments could negatively impact our return on equity, which could result in a decline in the market price of our common stock.
We are not in a position to exercise control over our portfolio companies or to prevent decisions by management of our portfolio companies that could decrease the value of our investments. We generally do not hold controlling equity positions in our portfolio companies. As a result, we are subject to the risk that a portfolio company may make business decisions with which we disagree, and that the management and/or stockholders of a portfolio company may take risks or otherwise act in ways that are adverse to our interests. Due to the lack of liquidity of the debt and equity investments that we typically hold in our portfolio companies, we may not be able to dispose of our investments if we disagree with the actions of a portfolio company and may therefore suffer a decrease in the value of our investments.
Defaults by our portfolio companies may harm our operating results. A portfolio company’s failure to satisfy financial or operating covenants imposed by us or other lenders could lead to defaults and, potentially, termination of our investments and foreclosure on our secured assets, which could trigger cross‑defaults under other agreements and jeopardize a portfolio company’s ability to meet its obligations under the debt or equity securities that we hold. We may incur expenses to the extent necessary to seek recovery upon default or to negotiate new terms, which may include the waiver of financial covenants, with a defaulting portfolio company. If any of these occur, it could materially and adversely affect our operating results and cash flows.
By investing in companies that are experiencing significant financial or business difficulties, we will be exposed to distressed lending risks. As part of our lending activities, we may purchase notes or loans to companies that are experiencing significant financial or business difficulties, including companies involved in bankruptcy or other reorganization and liquidation proceedings. Although the terms of such financing may result in significant financial returns to us, they involve a substantial degree of risk. The level of analytical sophistication, both financial and legal, necessary for successful financing to companies experiencing significant business and financial difficulties is unusually high. We cannot assure you that we will correctly evaluate the value of the assets collateralizing our investments or the prospects for a successful reorganization or similar action. In any reorganization or liquidation proceeding relating to a portfolio company, we may lose all or part of the amounts advanced to the borrower (as in the TRU Taj example discussed below) or may be required to accept collateral with a value less than the amount of the investment advanced by us to the borrower.
As of December 31, 2018, we held approximately $16.0 million at par value of TRU Taj senior secured notes due 2021 (the “TRU Taj 2021 notes”) and $5.0 million at par value of TRU Taj debtor in possession notes. On August 4, 2018, TRU Taj and Toys filed the Plan, which included a sale of substantially all of their assets, including the company’s 85% equity interest in an Asia joint venture (“Asia JV”). A credit bid submitted by an ad hoc group of noteholders in an amount of up to $760.0 million (net of any cash, debt and working capital adjustments) was the winning bid. The Plan also included a $365.0 million rights offering for noteholders which we participated in. The Plan was confirmed on December 13, 2018 and became effective on January 23, 2019. As a result, the debtor in possession notes were repaid at maturity and we received 776,954 shares of common stock in the reorganized Asia JV business and 16,000 shares in a liquidating trust that contains all other international assets currently being wound down, partially in exchange for the TRU Taj 2021 notes. As of December 31, 2019, we still hold these equity securities. Investments in equity securities involve a number of significant risks, including the risk of further dilution as a result of additional issuances, inability to access additional capital and failure to pay current distributions. See “—We may not realize gains from our equity investments.”
23
Our investments are very risky and highly speculative, and the lower middle‑market companies we target may have difficulty accessing the capital markets to meet their future capital needs, which may limit their ability to grow or to repay their outstanding indebtedness upon maturity.
Senior Secured Loans and Notes. There is a risk that the collateral securing our loans and notes may decrease in value over time, may be difficult to sell in a timely manner, may be difficult to appraise and may fluctuate in value based upon the success of the business and market conditions, including as a result of the inability of the portfolio company to raise additional capital, and, in some circumstances, our lien could be subordinated to claims of other creditors. In addition, deterioration in a portfolio company’s financial condition and prospects, including its inability to raise additional capital, may be accompanied by deterioration in the value of the collateral for the loan or note. Consequently, the fact that a loan or note is secured does not guarantee that we will receive principal and interest payments according to the loan’s or note’s terms, or at all, or that we will be able to collect on the loan or note should we be forced to enforce our remedies.
Mezzanine Loans. Our mezzanine debt investments will be generally subordinated to senior loans and will be generally unsecured. As such, other creditors may rank senior to us in the event of an insolvency, which could likely result in a substantial or complete loss on such investment in the case of such insolvency. This may result in an above average amount of risk and loss of principal.
Unsecured Loans and Notes. We may invest in unsecured loans and notes. If the issuer defaults or has an event of insolvency, other creditors may rank senior, be structurally senior or have lien protection that effectively renders their claim superior to our rights under our unsecured notes or loans, which could likely result in a substantial or complete loss on such investment in the case of such insolvency. This may result in an above average amount of risk and loss of principal.
Unfunded Commitments. The company from time to time purchases revolving credit loans with unfunded commitments in the ordinary course of business. In the event multiple borrowers of such revolving credit loans were to draw these commitments at the same time, including during a market downturn, it could have an adverse impact on the Company’s liquidity at a time when it may be more difficult for the Company to sell other assets.
Equity Investments. When we invest in senior secured loans or mezzanine loans, we may acquire equity securities, including warrants, as well. In addition, we may invest directly in the equity securities of portfolio companies. The equity interests we receive may not appreciate in value and, in fact, may decline in value. Accordingly, we may not be able to realize gains from our equity interests, and any gains that we realize on the disposition of any equity interests may not be sufficient to offset any other losses we experience.
In addition, investing in middle‑market companies involves a number of significant risks, including:
|
|
▪ |
these companies may have limited financial resources and may be unable to meet their obligations under their debt securities that we hold, which may be accompanied by a deterioration in the value of any collateral and a reduction in the likelihood of us realizing any guarantees we may have obtained in connection with our investment; |
|
|
▪ |
they typically have shorter operating histories, narrower product lines and smaller market shares than larger businesses, which tend to render them more vulnerable to competitors’ actions and market conditions, as well as general economic downturns; |
|
|
▪ |
they are more likely to depend on the management talents and efforts of a small group of persons; therefore, the death, disability, resignation or termination of one or more of these persons could have a material adverse impact on our portfolio company and, in turn, on our shareholders; |
|
|
▪ |
they generally have less predictable operating results, may from time to time be parties to litigation, may be engaged in rapidly changing businesses with products subject to a substantial risk of obsolescence, and may require substantial additional capital to support their operations, finance expansion or maintain their competitive position. In addition, our executive officers, directors and GECM may be named as defendants in litigation arising from our investments in the portfolio companies; |
24
|
|
▪ |
they may have difficulty accessing the capital markets to meet future capital needs, which may limit their ability to grow or to repay their outstanding indebtedness upon maturity; and |
|
|
▪ |
a portion of our income may be non‑cash income, such as contractual PIK interest, which represents interest added to the debt balance and due at the end of the instrument’s term, in the case of loans, or issued as additional notes in the case of bonds. Instruments bearing PIK interest typically carry higher interest rates as a result of their payment deferral and increased credit risk. When we recognize income in connection with PIK interest, there is a risk that such income may become uncollectable if the borrower defaults. |
Investing in middle‑market companies involves a high degree of risk and our financial results may be affected adversely if one or more of our portfolio investments defaults on its loans or notes or fails to perform as we expect. Our portfolio consists primarily of debt and equity investments in privately owned lower middle‑market companies. Investing in lower middle‑market companies involves a number of significant risks. Typically, the debt instruments in which we invest are not initially rated by any rating agency; however, we believe that if such investments were rated, they would be below investment grade, which are referred to as “junk bonds.” Compared to larger publicly owned companies, these middle‑market companies may be in a weaker financial position and experience wider variations in their operating results, which may make them more vulnerable to economic downturns and other business disruptions. Typically, these companies need more capital to compete; however, their access to capital is limited and their cost of capital is often higher than that of their competitors. Our portfolio companies face intense competition from larger companies with greater financial, technical and marketing resources and their success typically depends on the managerial talents and efforts of an individual or a small group of persons. Therefore, the loss of any of their key employees could affect a portfolio company’s ability to compete effectively and harm its financial condition. Further, some of these companies conduct business in regulated industries that are susceptible to regulatory changes. These factors could impair the cash flow of our portfolio companies and result in other events, such as bankruptcy. These events could limit a portfolio company’s ability to repay its obligations to us. Deterioration in a borrower’s financial condition and prospects may be accompanied by deterioration in the value of the loan’s collateral and the fair market value of the loan.
Most of the loans in which we invest are not structured to fully amortize during their lifetime. In order to create liquidity to pay the final principal payment, borrowers typically must raise additional capital or sell their assets, which could potentially result in the collateral being sold for less than its fair market value. If they are unable to raise sufficient funds to repay us, the loan will go into default, which will require us to foreclose on the borrower’s assets, even if the loan was otherwise performing prior to maturity. This will deprive us from immediately obtaining full recovery on the loan and prevent or delay the reinvestment of the loan proceeds in other, more profitable investments. Moreover, there are no assurances that any recovery on such loan will be obtained. Most of these companies cannot obtain financing from public capital markets or from traditional credit sources, such as commercial banks. Accordingly, loans made to these types of companies pose a higher default risk than loans made to companies that have access to traditional credit sources.
An investment strategy that includes privately held companies presents challenges, including the lack of available information about these companies, a dependence on the talents and efforts of only a few key portfolio company personnel and a greater vulnerability to economic downturns. We will invest in privately held companies. Generally, little public information exists about these companies, and we are required to rely on GECM’s ability to obtain adequate information to evaluate the potential returns from investing in these companies. If we are unable to uncover all material information about these companies, we may not make a fully informed investment decision, and may lose money on our investments. Also, privately held companies frequently have less diverse product lines and smaller market presence than larger competitors. These factors could adversely affect our investment returns as compared to companies investing primarily in the securities of public companies.
25
Our portfolio companies may incur debt that ranks equally with, or senior to, our investments in such companies. Our portfolio companies may have, or may be permitted to incur, other debt that ranks equally with, or in some cases senior to, the debt in which we invest. By their terms, such debt instruments may entitle the holders to receive payment of interest or principal on or before the dates on which we are entitled to receive payments with respect to the debt instruments in which we invested. Also, in insolvency, liquidation, dissolution, reorganization or bankruptcy of a portfolio company, holders of debt instruments ranking senior to our investment in that portfolio company would typically be entitled to receive payment in full before we receive any distribution. After repaying such senior creditors, such portfolio company may not have any remaining assets to use for repaying its obligation to us. In the case of debt ranking equally with debt instruments in which we invest, we would have to share on an equal basis any distributions with other creditors holding such debt in the event of an insolvency, liquidation, dissolution, reorganization or bankruptcy of the relevant portfolio company.
There may be circumstances where our debt investments could be subordinated to claims of other creditors or we could be subject to lender liability claims. Even though we may have structured investments as secured investments, if one of our portfolio companies were to go bankrupt, depending on the facts and circumstances, and based upon principles of equitable subordination as defined by existing case law, a bankruptcy court could subordinate all or a portion of our claim to that of other creditors and transfer any lien securing such subordinated claim to the bankruptcy estate. The principles of equitable subordination defined by case law have generally indicated that a claim may be subordinated only if its holder is guilty of misconduct or where the senior investment is re‑characterized as an equity investment and the senior lender has actually provided significant managerial assistance to the bankrupt debtor. We may also be subject to lender liability claims for actions taken by us with respect to a borrower’s business or instances where we exercise control over the borrower. It is possible that we could become subject to a lender’s liability claim, including as a result of actions taken in rendering managerial assistance or actions to compel and collect payments from the borrower outside the ordinary course of business.
Second priority liens on collateral securing loans and notes that we invest in may be subject to control by senior creditors with first priority liens. If there is a default, the value of the collateral may not be sufficient to repay in full both the first priority creditors and us. We may purchase loans or notes that are secured by a second priority security interest in the same collateral pledged by a portfolio company to secure senior debt owed by the portfolio company to commercial banks or other traditional lenders. Often the senior lender has procured covenants from the portfolio company prohibiting the incurrence of additional secured debt without the senior lender’s consent. Prior to and as a condition of permitting the portfolio company to borrow money from us secured by the same collateral pledged to the senior lender, the senior lender will require assurances that it will control the disposition of any collateral in the event of bankruptcy or other default. In many such cases, the senior lender will require us or the indenture trustee to enter into an “intercreditor agreement” prior to permitting the portfolio company to borrow. Typically the intercreditor agreements expressly subordinate our debt instruments to those held by the senior lender and further provide that the senior lender shall control: (1) the commencement of foreclosure or other proceedings to liquidate and collect on the collateral; (2) the nature, timing and conduct of foreclosure or other collection proceedings; (3) the amendment of any collateral document; (4) the release of the security interests in respect of any collateral; and (5) the waiver of defaults under any security agreement. Because of the control we may cede to senior lenders under intercreditor agreements we may enter, we may be unable to realize the proceeds of any collateral securing some of our loans and notes.
The reference rates for our loans may be manipulated or changed. Concerns have been publicized that some of the member banks surveyed by the British Bankers’ Association (the “BBA”) in connection with the calculation of the London Interbank Borrowing Rate (“LIBOR”) across a range of maturities and currencies may have been underreporting or otherwise manipulating the inter‑bank lending rate applicable to them in order to profit on their derivatives positions or to avoid an appearance of capital insufficiency or adverse reputational or other consequences that may have resulted from reporting inter‑bank lending rates higher than those they actually submitted. A number of BBA member banks have entered into settlements with their regulators and law enforcement agencies with respect to alleged manipulation of LIBOR, and investigations by regulators and governmental authorities in various jurisdictions are ongoing.
26
Central banks have engaged in quantitative easing, currency purchase programs and other activities that caused government borrowing rates and currencies to trade at prices different than those that would prevail in an unaffected market.
Actions by market participants, like the BBA, or by government agencies, like the Federal Reserve Board, may affect prevailing interest rates and the reference rates for loans to our portfolio companies. Actions by governments may create inflation in asset prices that over-state the value of our portfolio companies and their assets and drive cycles of capital market activities (like mergers and acquisitions) at a rate and at prices in excess of those that would prevail in an unaffected market.
We cannot assure you that actions by market participants, like the BBA, or by government agencies, like the Federal Reserve Board, will not materially adversely affect trading markets or our portfolio companies or us or our and our portfolio companies’ respective business, prospects, financial condition or results of operations.
In July 2017, the head of the United Kingdom Financial Conduct Authority announced the desire to phase out the use of LIBOR by the end of 2021. The U.S. Federal Reserve, in conjunction with the Alternative Reference Rates Committee, a steering committee comprised of large U.S. financial institutions, was considering replacing U.S. dollar LIBOR with a new index calculated by short-term repurchase agreements, backed by Treasury securities. If LIBOR ceases to exist, we may need to renegotiate outstanding loans to our portfolio companies which extend beyond 2021, and that utilize LIBOR as a factor in determining the interest rate, to replace LIBOR with the new standard that is established. There is currently no definitive information regarding the future utilization of LIBOR or of any particular replacement rate. As such, the potential effect of any such event on our cost of capital and net investment income cannot yet be determined.
We may mismatch the interest rate and maturity exposure of our assets and liabilities. Our net investment income depends, in part, upon the difference between the rate at which we borrow funds and the rate at which we invest those funds. We cannot assure you that a significant change in market interest rates will not have a material adverse effect on our net investment income. In periods of rising interest rates, our cost of funds could increase, which could reduce our net investment income. We expect that our fixed‑rate investments will be financed primarily with equity and/or long‑term debt. We may use interest rate risk management techniques in an effort to limit our exposure to interest rate fluctuations. Such techniques may include various interest rate hedging activities to the extent permitted by the Investment Company Act. If we do not implement these techniques properly, we could experience losses on our hedging positions, which could be material.
If interest rates fall, our portfolio companies are likely to refinance their obligations to us at lower interest rates. Our proceeds from these refinancings are likely to be reinvested at lower interest rates than our refinanced loans resulting in a material decrease in our net investment income.
We may not realize gains from our equity investments. Our portfolio may include warrants or other equity securities. We may take back equity securities in exchange for our debt investments in workouts of troubled investments. Investments in equity securities involve a number of significant risks, including the risk of further dilution as a result of additional issuances, inability to access additional capital and failure to pay current distributions. Investments in preferred securities involve special risks, such as the risk of deferred distributions, credit risk, illiquidity and limited voting rights. In addition, we may from time to time make non‑control, equity investments in portfolio companies. The equity interests we invest in may not appreciate in value and, in fact, may decline in value. Accordingly, we may not be able to realize gains from our equity interests, and any gains that we do realize on the disposition of any equity interests may not be sufficient to offset any other losses we experience. We also may be unable to realize any value if a portfolio company does not have a liquidity event, such as a sale of the business, recapitalization or public offering, which would allow us to sell the underlying equity interests. We may seek puts or similar rights to give it the right to sell our equity securities back to the portfolio company. We may be unable to exercise these put rights if the issuer is in financial distress or otherwise lacks sufficient liquidity to purchase the underlying equity investment.
27
Investments in foreign securities may involve significant risks in addition to the risks inherent in U.S. investments. Our investment strategy contemplates investments in debt securities of foreign companies. Investing in foreign companies may expose us to additional risks not typically associated with investing in U.S. companies. These risks include changes in exchange control regulations, political and social instability, expropriation, imposition of foreign taxes, less liquid markets and less available information than is generally the case in the United States, higher transaction costs, less government supervision of exchanges, brokers and issuers, less developed bankruptcy laws, difficulty in enforcing contractual obligations, lack of uniform accounting and auditing standards and greater price volatility. Such investments will generally not represent “qualifying assets” under Section 55(a) of the Investment Company Act. Pursuant to the Investment Company Act, qualifying assets must represent at least 70% of our total assets at the time of acquisition of any additional non-qualifying assets. If we do not meet the 70% threshold, we will be limited to purchasing qualifying assets until such threshold is met. See "Regulation as a Business Development Company."
Any investments denominated in a foreign currency will be subject to the risk that the value of a particular currency will change in relation to one or more other currencies. Among the factors that may affect currency values are trade balances, the level of short‑term interest rates, differences in relative values of similar assets in different currencies, long‑term opportunities for investment and capital appreciation, and political developments. We may employ hedging techniques to minimize these risks, but we offer no assurance that we will, in fact, hedge currency risk, or that if it does, such strategies will be effective.
We may hold a significant portion of our portfolio assets in cash, cash equivalents, money market mutual funds, U.S. government securities, repurchase agreements and high-quality debt instruments maturing in one year or less, which may have a negative impact on our business and operations. We may hold a significant portion of our portfolio assets in cash, cash equivalents, money market mutual funds, U.S. government securities, repurchase agreements and high-quality debt instruments maturing in one year or less for many reasons, including, among others:
|
|
• |
as part of GECM’s strategy in order to take advantage of investment opportunities as they arise, |
|
|
• |
when GECM believes that market conditions are unfavorable for profitable investing, |
|
|
• |
when GECM is otherwise unable to locate attractive investment opportunities, |
|
|
• |
as a defensive measure in response to adverse market or economic conditions, or |
|
|
• |
to meet RIC qualification requirements. |
We may also be required to hold higher levels of cash, money market mutual funds or other short-term securities in order to pay our expenses or make distributions to stockholders in the ordinary course of business given the relatively high percentage of our total investment income represented by non-cash income, including PIK income and accretion of OID. During periods when we maintain exposure to cash, money market mutual funds, or other short-term securities, we may not participate in market movements to the same extent that it would if we were fully invested, which may have a negative impact on our business and operations and, accordingly, our returns may be reduced.
28
Risks Relating to Our Business and Structure
Capital markets experience periods of disruption and instability. These market conditions have historically materially and adversely affected debt and equity capital markets in the United States and abroad, which had, and may in the future have, a negative impact on our business and operations. The global capital markets are subject to disruption as evidenced by, among other things, a lack of liquidity in the debt capital markets, significant write‑offs in the financial services sector, the re‑pricing of credit risk in the broadly syndicated credit market and the failure of major financial institutions. Despite actions of the U.S. federal government and foreign governments, these events have contributed to worsening general economic conditions that have historically materially and adversely impacted the broader financial and credit markets and reduced the availability of debt and equity capital for the market as a whole and financial services firms in particular. We cannot provide any assurance that these conditions will not significantly worsen. Equity capital may be difficult to raise because, as a BDC, we are generally not able to issue additional shares of our common stock at a price less than net asset value. In addition, our ability to incur indebtedness or issue preferred stock is limited by applicable regulations such that our asset coverage, as defined in the Investment Company Act, must equal at least 150% immediately after each time we incur indebtedness or issue preferred stock. The debt capital that may be available, if at all, may be at a higher cost and on less favorable terms and conditions in the future. Any inability to raise capital could have a negative effect on our business, financial condition and results of operations.
Market conditions may in the future make it difficult to extend the maturity of or refinance our existing indebtedness, and any failure to do so could have a material adverse effect on our business. The expected illiquidity of our investments may make it difficult for us to sell such investments if required. As a result, we may realize significantly less than the value at which we have recorded our investments.
In addition, significant changes in the capital markets, including recent volatility and disruption, have had, and may in the future have, a negative effect on the valuations of our investments and on the potential for liquidity events involving our investments. An inability to raise capital, and any required sale of our investments for liquidity purposes, could have a material adverse impact on our business, financial condition and results of operations.
A significant portion of our total outstanding shares may be sold into the public market in the near future, which could cause the market price of our common stock to drop significantly, even if our business is doing well. Sales of a substantial number of shares of our common stock in the public market could occur at any time. These sales, or the market perception that the holders of a large number of shares intend to sell shares, could reduce the market price of our common stock. We have registered all of the shares of our common stock issued to the MAST Funds and GEC in the Formation Transactions for resale. The shares issued in the Formation Transactions represent approximately 24% percent of our outstanding shares of common stock at December 31, 2019.
The MAST Funds are not prohibited from transferring their shares of our common stock. Any sale by the MAST Funds of all or a portion of their shares could cause the market price of shares of our common stock to drop significantly, even if our business is doing well.
We may borrow money, which would magnify the potential for loss on amounts invested and may increase the risk of investing with us. We have existing indebtedness and may in the future borrow additional money, each of which magnifies the potential for loss on amounts invested and may increase the risk of investing with us. Our ability to service our existing and potential future debt depends largely on our financial performance and is subject to prevailing economic conditions and competitive pressures. The amount of leverage that we could employ at any particular time will depend on GECM’s and our Board’s assessment of market and other factors at the time of any proposed borrowing.
Any GECC credit facility would impose financial and operating covenants that would restrict our business activities, including limitations that could hinder our ability to finance additional loans and investments or to make the distributions required to maintain our status as a RIC under the Code. A failure to renew our credit facilities or to add new or replacement debt facilities could have a material adverse effect on our business, financial condition and results of operations.
29
Borrowings, also known as leverage, magnify the potential for gain or loss on amounts invested and, therefore, increase the risks associated with investing in our securities. When a company issues debt, the issuer gives the debt holders a call right on the issuer’s business and assets. Holders of such debt securities would have fixed dollar claims on our consolidated assets that would be superior to the claims of our common stockholders or any preferred stockholders.
If the value of our consolidated assets decreases while we have debt outstanding, leveraging would cause our net asset value to decline more sharply than it otherwise would have had we not leveraged. Similarly, any decrease in our consolidated income while we have debt outstanding would cause net income to decline more sharply than it would have had we not borrowed. Such a decline could negatively affect our ability to make common stock distributions. We cannot assure you that our leveraging strategy will be successful.
Illustration. The following tables illustrate the effect of leverage on returns from an investment in our common stock assuming various annual returns, net of expenses. The first table assumes the amount of senior securities outstanding as of December 31, 2108. The second table assumes the amount of senior securities outstanding as permitted under our asset coverage ratio of 150%. See “—We may incur additional debt.” The calculations in the tables below are hypothetical and actual returns may be higher or lower than those appearing below.
Table 1
|
Assumed Return on Our Portfolio(1) (2) (net of expenses) |
|
(10.0)% |
|
|
(5.0)% |
|
|
0.0% |
|
|
5.0% |
|
|
10.0% |
|
|
Corresponding net return to common stockholder |
|
(14.14)% |
|
|
(9.14)% |
|
|
(4.14)% |
|
|
0.86% |
|
|
5.86% |
|
|
(1) |
Assumes $197.6 million in total portfolio assets, $124.0 million in senior securities outstanding, $86.9 million in net assets, and an average cost of funds of 6.59%. Actual interest payments may be different. |
|
(2) |
In order for us to cover our annual interest payments on indebtedness, we must achieve annual returns on our December 31, 2019 total portfolio assets of at least 4.14%. |
Table 2
|
Assumed Return on Our Portfolio(1) (2) (net of expenses) |
|
(10.0)% |
|
|
(5.0)% |
|
|
0.0% |
|
|
5.0% |
|
|
10.0% |
|
|
Corresponding net return to common stockholder |
|
(14.63)% |
|
|
(9.63)% |
|
|
(4.63)% |
|
|
0.37% |
|
|
5.37% |
|
|
(1) |
Assumes $247.4 million in total portfolio assets, $173.8 million in senior securities outstanding, $86.9 million in net assets, and an average cost of funds of 6.59%. Actual interest payments may be different. |
|
(2) |
In order for us to cover our annual interest payments on indebtedness, we must achieve annual returns on our December 31, 2019 total portfolio assets of at least 4.63%. |
We may experience fluctuations in our quarterly results. Our quarterly operating results will fluctuate due to a number of factors, including the level of expenses, variations in and the timing of the recognition of realized and unrealized gains or losses, the degree to which we encounter competition in our markets and general economic conditions. Our quarterly operating results will also fluctuate due to a number of other factors, including the interest rates payable on the debt investments we make and the default rates on such investments. As a result of these factors, results for any period should not be relied upon as being indicative of performance in future periods.
Our success depends on the ability of our investment adviser to attract and retain qualified personnel in a competitive environment. Our growth requires that GECM retain and attract new investment and administrative personnel in a competitive market. GECM’s ability to attract and retain personnel with the requisite credentials, experience and skills depends on several factors, including, but not limited to, its ability to offer competitive wages, benefits and professional growth opportunities. Many of the entities, including investment funds (such as private equity funds and mezzanine funds) and traditional financial services companies, which compete for experienced personnel with GECM, have greater resources than GECM.
30
Our ability to grow depends on our ability to raise capital and/or access debt financing. We intend to periodically access the capital markets to raise cash to fund new investments. We expect to continue to elect to be treated as a RIC and operate in a manner so as to qualify for the U.S. federal income tax treatment applicable to RICs. Among other things, in order to maintain our RIC status, we must distribute to our stockholders on a timely basis generally an amount equal to at least 90% of our investment company taxable income (as defined by the Code), and, as a result, such distributions will not be available to fund new investments. As a result, we must borrow from financial institutions or issue additional securities to fund our growth. Unfavorable economic or capital market conditions may increase our funding costs, limit our access to the capital markets or could result in a decision by lenders not to extend credit to us. There has been and will continue to be uncertainty in the financial markets in general. An inability to successfully access the capital or credit markets for either equity or debt could limit our ability to grow our business and fully execute our business strategy and could decrease our earnings, if any.
If the fair value of our assets declines substantially, we may fail to maintain the asset coverage ratios imposed upon us by the Investment Company Act or our lenders. Any such failure, or a tightening or general disruption of the credit markets, would affect our ability to issue senior securities, including borrowings, and pay dividends or other distributions, which could materially impair our business.
In addition, with certain limited exceptions we are only allowed to borrow or issue debt securities or preferred stock such that our asset coverage, as defined in the Investment Company Act, equals at least 150% immediately after such borrowing, which, in certain circumstances, may restrict our ability to borrow or issue debt securities or preferred stock. The amount of leverage that we may employ will depend on GECM’s and our Board’s assessments of market and other factors at the time of any proposed borrowing or issuance of debt securities or preferred stock. We cannot assure you that we will be able to obtain lines of credit at all or on terms acceptable to us.
Economic recessions or downturns could impair our portfolio companies and harm our operating results. The economy is subject to periodic downturns that, from time to time, result in recessions or more serious adverse macroeconomic events. Our portfolio companies are susceptible to economic slowdowns or recessions and may be unable to repay loans or notes during these periods. Therefore, our non‑performing assets may increase and the value of our portfolio may decrease during these periods as we are required to record the market value of our investments. Adverse economic conditions may also decrease the value of collateral securing some of our investments and the value of our equity investments. Economic slowdowns or recessions could lead to financial losses in our portfolio and a decrease in revenues, net income and assets. Unfavorable economic conditions also could increase our funding costs, limit our access to the capital markets or result in a decision by lenders not to extend credit to us. These events could prevent us from increasing investments and harm our operating results.
A portfolio company’s failure to satisfy financial or operating covenants in its agreements with us or other lenders could lead to defaults and, potentially, acceleration of the time when the debt obligations are due and foreclosure on its secured assets, which could trigger cross‑defaults under other agreements and jeopardize the portfolio company’s ability to meet its obligations under the debt that we hold. We may incur additional expenses to the extent necessary to seek recovery upon default or to negotiate new terms with a defaulting portfolio company. In addition, if one of our portfolio companies were to go bankrupt, depending on the facts and circumstances, including the extent to which we actually provided significant managerial assistance to that portfolio company, a bankruptcy court might re-characterize our debt holding and subordinate all or a portion of our claim to that of other creditors.
Uncertainty about the financial stability of the United States and of several countries in the European Union (“EU”) could have a significant adverse effect on our business, financial condition and results of operations. Downgrades of the U.S. government’s credit rating, or warnings regarding downgrades, by S&P Global Ratings or other rating agencies, and the government’s credit and deficit concerns in general, could cause interest rates and borrowing costs to rise, which may negatively impact both the perception of credit risk associated with our debt portfolio and our ability to access the debt markets on favorable terms. In addition, a decreased U.S. government credit rating could create broader financial turmoil and uncertainty, which may weigh heavily on our financial performance and the value of our common stock.
31
Protectionism and other governmental causes of recessions and other negative economic factors may increase. Risks resulting from any future debt crisis in Europe or any similar crisis could have a detrimental impact on the global economic recovery, sovereign and non‑sovereign debt in these countries and the financial condition of European financial institutions. Market and economic disruptions have affected, and may in the future affect, consumer confidence levels and spending, personal bankruptcy rates, levels of incurrence and defaults on consumer debt and home prices, among other factors. We cannot assure you that market disruptions in Europe, including the increased cost of funding for certain governments and financial institutions, will not impact the global economy. To the extent uncertainty regarding the United Kingdom or the EU negatively impacts consumer confidence, market conditions and credit factors, our business, financial condition and results of operations could be materially adversely affected.
In October 2014, the Federal Reserve announced that it was concluding its bond‑buying program, or quantitative easing, which was designed to stimulate the economy and expand the Federal Reserve’s holdings of long‑term securities. It is unclear what effect, if any, the conclusion of the Federal Reserve’s bond‑buying program has had or will have on the value of our investments. However, it is possible that, without quantitative easing by the Federal Reserve, these developments, along with the U.S. government’s credit and deficit concerns and the European sovereign debt crisis, could cause interest rates and borrowing costs to rise, which may negatively impact our ability to access the debt markets on favorable terms. In October 2019, the Federal Reserve decreased the federal funds rate to 1.75% followed by another decrease in March 2020 to 0.25%.
The U.S. Congress has passed, and the President signed into law on December 22, 2017, a tax reform bill that, among other things, significantly changed the taxation of business entities (including by significantly lowering corporate tax rates), the deductibility of interest expense, and the timing in which certain income items are recognized. Additionally, the Trump administration has called for significant change to U.S. trade, healthcare, immigration, foreign, and government regulatory policy. In this regard, there is significant uncertainty with respect to legislation, regulation and government policy at the federal level, as well as the state and local levels. Recent events have created a climate of heightened uncertainty and introduced new and difficult-to-quantify macroeconomic and political risks with potentially far-reaching implications. There has been a corresponding meaningful increase in the uncertainty surrounding interest rates, inflation, foreign exchange rates, trade volumes and fiscal and monetary policy. To the extent the U.S. Congress or Trump administration implements changes to U.S. policy, those changes may impact, among other things, the U.S. and global economy, international trade and relations, unemployment, immigration, corporate taxes, healthcare, the U.S. regulatory environment, inflation and other areas. Some particular areas identified as subject to potential change, amendment or repeal include the Dodd-Frank Wall Street Reform and Consumer Protection Act (the “Dodd-Frank Act”), including the Volcker Rule and various swaps and derivatives regulations, credit risk retention requirements and the authorities of the Federal Reserve, the Financial Stability Oversight Council and the SEC. Although we cannot predict the impact, if any, of these changes to our business, they could adversely affect our business, financial condition, operating results and cash flows. Until we know what policy changes are made and how those changes impact our business and the business of our competitors over the long term, we will not know if, overall, we will benefit from them or be negatively affected by them.
Uncertainty regarding the impact of the United Kingdom’s departure from the European Union could negatively impact our business, financial condition and earnings. On January 31, 2020, the United Kingdom withdrew from the European Union (“Brexit”), with a transition period lasting until December 31, 2020. During the transition period, existing arrangements between the United Kingdom and the European Union will remain in place while the United Kingdom and the European Union seek to negotiate a free trade agreement that will govern the trading relationship between the United Kingdom and the European Union following the transition period. The longer term economic, legal, political and social framework to be put in place between the United Kingdom and the European Union remains unclear and may to lead to ongoing political and economic uncertainty and periods of exacerbated volatility in both the United Kingdom and in wider European markets for some time. The United Kingdom and Europe may also experience weakening in consumer, corporate and financial confidence. In particular, the decision made in the United Kingdom referendum may lead to a call for similar referenda in other European jurisdictions which may cause increased economic volatility and uncertainty in the European and global markets. This volatility and uncertainty may have an adverse effect on the economy generally and on the ability of us and our portfolio companies to execute our respective strategies and to receive attractive returns. Our largest investment, Avanti, is headquartered in London, United Kingdom.
32
We may acquire other funds, portfolios of assets or pools of debt and those acquisitions may not be successful. We may acquire other funds, portfolios of assets or pools of debt investments. Any such acquisition program has a number of risks, including among others:
|
|
▪ |
management’s attention will be diverted from running our existing business by efforts to source, negotiate, close and integrate acquisitions; |
|
|
▪ |
our due diligence investigation of potential acquisitions may not reveal risks inherent in the acquired business or assets; |
|
|
▪ |
we may over‑value potential acquisitions resulting in dilution to you, incurrence of excessive indebtedness, asset write downs and negative perception of our common stock; |
|
|
▪ |
the interests of our existing stockholders may be diluted by the issuance of additional shares of our common stock or preferred stock; |
|
|
▪ |
we may borrow to finance acquisitions and there are risks associated with borrowing as described in this document; |
|
|
▪ |
GECM has an incentive to increase our assets under management in order to increase its fee stream, which may not be aligned with the interests of our stockholders; |
|
|
▪ |
we and GECM may not successfully integrate any acquired business or assets; and |
|
|
▪ |
GECM may compensate the existing managers of any acquired business or assets in a manner that results in the combined company taking on excessive risk. |
Our failure to maintain our status as a BDC would reduce our operating flexibility. We elected to be regulated as a BDC under the Investment Company Act. The Investment Company Act imposes numerous constraints on the operations of BDCs and their external advisers. For example, BDCs are required to invest at least 70% of their gross assets in specified types of securities, primarily in private companies or illiquid U.S. public companies below a certain market capitalization, cash, cash equivalents, U.S. government securities and other high quality debt investments that mature in one year or less. Furthermore, any failure to comply with the requirements imposed on BDCs by the Investment Company Act could cause the SEC to bring an enforcement action against us and/or expose us to claims of private litigants. In addition, upon approval of a majority of our voting securities (as defined under the Investment Company Act), we may elect to withdraw our status as a BDC. If we decide to withdraw our BDC election, or if we otherwise fail to qualify, or to maintain our qualification, as a BDC, we may be subject to substantially greater regulation under the Investment Company Act as a closed‑end management investment company. Compliance with such regulations would significantly decrease our operating flexibility and would significantly increase our costs of doing business.
Regulations governing our operations as a BDC affect our ability to raise additional capital and the way in which we do so. As a BDC, the necessity of raising additional capital may expose us to risks, including the typical risks associated with leverage. We may issue debt securities or preferred stock and/or borrow money from banks or other financial institutions, referred to collectively as “senior securities,” up to the maximum amount permitted under the Investment Company Act. Under the provisions of the Investment Company Act applicable to BDCs, we are permitted to issue senior securities (e.g., notes and preferred stock) in amounts such that our asset coverage ratio, as defined in the Investment Company Act, equals at least 150% of gross assets less all liabilities and indebtedness not represented by senior securities, after each issuance of senior securities. If the value of our assets declines, we may be unable to satisfy this test. If that happens, we may be required to sell a portion of our investments and, depending on the nature of our leverage, repay a portion of our indebtedness at a time when such sales may be disadvantageous. Also, any amounts that we use to service our indebtedness would not be available for distributions to our stockholders. Furthermore, as a result of issuing senior securities, we would also be exposed to typical risks associated with leverage, including an increased risk of loss.
33
If we issued preferred stock, the preferred stock would rank “senior” to common stock in our capital structure, preferred stockholders would have separate voting rights on certain matters and might have other rights including, for example, the right to elect one or more of our directors, preferences, or privileges more favorable than those of our common stockholders, and the issuance of preferred stock could have the effect of delaying, deferring or preventing a transaction or a change of control that might involve a premium price for holders of our common stock.
We are not generally able to issue and sell shares of our common stock at a price below net asset value per share. We may, however, sell shares of our common stock, or warrants, options or rights to acquire our common stock, at a price below the then current net asset value per share of our common stock if our Board determines that such sale is in our and our stockholders’ best interests. In any such case, the price at which our securities are to be issued and sold may not be less than a price that, in the determination of our Board, equals or closely approximates the market value of such securities (less any distributing commission or discount calculated). Certain sales of our common stock below net asset value per share also require approval by our stockholders in accordance with the Investment Company Act. If we raise additional funds by issuing more common stock or senior securities convertible into, or exchangeable for, our common stock, then our existing common stockholders’ percentage ownership at that time will decrease, and they will experience dilution.
Our common stock price may be volatile and may decrease substantially, and an investor may lose money in connection with an investment in our shares. The trading price of our common stock will likely fluctuate substantially. The price of our common stock may increase or decrease, depending on many factors, some of which are beyond our control and may not be directly related to our operating performance. These factors include, but are not limited to, the following:
|
|
▪ |
price and volume fluctuations in the overall stock market from time to time; |
|
|
▪ |
investor demand for our shares; |
|
|
▪ |
significant volatility in the market price and trading volume of securities of BDCs or other companies in our sector, which are not necessarily related to the operating performance of these companies; |
|
|
▪ |
exclusion of our common stock from certain indices, such as the Russell 2000 Financial Services Index, which could reduce the ability of certain investment funds to own our common stock and put short‑term selling pressure on our common stock; |
|
|
▪ |
changes in regulatory policies or tax guidelines with respect to RICs or BDCs; |
|
|
▪ |
failure to qualify as a RIC, or the loss of RIC status; |
|
|
▪ |
any shortfall in revenue or net income or any increase in losses from levels expected by investors or securities analysts; |
|
|
▪ |
changes, or perceived changes, in the value of our portfolio investments; |
|
|
▪ |
departures of GECM’s key personnel; |
|
|
▪ |
operating performance of companies comparable to GECC; or |
|
|
▪ |
general economic conditions and trends and other external factors. |
If the price of shares of our common stock decreases, an investor may lose money if he were to sell his shares of our common stock.
In addition, following periods of volatility in the market price of a company’s securities, securities class action litigation has often been brought against that company. Due to the potential volatility of the price of our securities, we may become the target of securities litigation in the future. Securities litigation could result in substantial costs and divert management’s attention and resources from our business.
34
Our Board may change our investment objectives, operating policies and strategies without prior notice or stockholder approval, the effects of which may be adverse. Our Board has the authority to modify or waive our investment objectives, current operating policies, investment criteria and strategies without prior notice and without stockholder approval. We cannot predict the effect any changes to our current operating policies, investment criteria and strategies would have on our business, net asset value, operating results and value of our common stock. However, the effects might be adverse, which could negatively impact our ability to pay our stockholders dividends or other distributions.
We may have difficulty paying our required distributions under applicable tax rules if we recognize income before or without receiving cash representing such income. For U.S. federal income tax purposes, we may be required to include in income certain amounts before our receipt of the cash attributable to such amounts, such as original issue discount (“OID”), which may arise if we receive warrants in connection with the making of a loan or possibly in other circumstances, or PIK interest, which represents contractual interest added to the loan balance and due at the end of the loan term. For example, such OID or increases in loan balances as a result of PIK interest will be included in income before we receive any corresponding cash payments. Also, we may be required to include in income other amounts that we will not receive in cash, including, for example, non‑cash income from PIK securities, deferred payment securities and hedging and foreign currency transactions. In addition, we intend to seek debt investments in the secondary market that represent attractive risk-adjusted returns, taking into account both stated interest rates and current market discounts to par value. Such market discount may be included in income before we receive any corresponding cash payments. Our debt investments in Avanti currently only earn PIK interest and, if converted to common stock, our investment in Avanti equity is not expected to earn cash dividends.
Since we may recognize income before or without receiving cash representing such income, we may have difficulty meeting the U.S. federal income tax requirement to distribute generally an amount equal to at least 90% of our investment company taxable income to maintain our status as a RIC. Accordingly, we may have to sell some of our investments at times we would not consider advantageous, raise additional debt or equity capital or reduce new investment originations to meet these distribution requirements. If we are not able to obtain cash from other sources, we may fail to qualify as a RIC and thus be subject to additional corporate‑level taxes.
However, in order to satisfy the Annual Distribution Requirement for a RIC, we may, but have no current intention to, declare a large portion of a dividend in shares of our common stock instead of in cash. As long as a portion of such dividend is paid in cash (which portion may be as low as 20% of such dividend) and certain requirements are met, the entire distribution will be treated as a dividend for U.S. federal income tax purposes.
We may expose ourselves to risks associated with the inclusion of non-cash income prior to receipt of cash. To the extent we invest in OID instruments, including PIK loans, zero coupon bonds, and debt securities with attached warrants, investors will be exposed to the risks associated with the inclusion of such non-cash income in taxable and accounting income prior to receipt of cash.
The deferred nature of payments on PIK loans creates specific risks. Interest payments deferred on a PIK loan are subject to the risk that the borrower may default when the deferred payments are due in cash at the maturity of the loan. Since the payment of PIK income does not result in cash payments to us, we may also have to sell some of our investments at times we would not consider advantageous, raise additional debt or equity capital or reduce new investment originations (and thus hold higher cash or cash equivalent balances, which could reduce returns) to pay our expenses or make distributions to stockholders in the ordinary course of business, even if such loans do not default. An election to defer PIK interest payments by adding them to principal increases our gross assets and, thus, increases future base management fees to GECM and, because interest payments will then be payable on a larger principal amount, the PIK election also increases GECM’s future income incentive fees at a compounding rate. The deferral of interest on a PIK loan increases its loan-to-value ratio, which is a measure of the riskiness of a loan.
35
More generally, market prices of OID instruments are more volatile because they are impacted to a greater extent by interest rate changes than instruments that pay interest periodically in cash. Ordinarily, OID would also create the risk of non-refundable cash payments to GECM based on non-cash accruals that may never be realized; however, this risk is mitigated since the Investment Management Agreement requires GECM to defer any incentive fees on accrued but unpaid income, the effect of which is that income incentive fees otherwise payable with respect to accrued unpaid income become payable only if, as, when and to the extent cash is received by us or our consolidated subsidiaries in respect thereof.
Additionally, we will be required under the tax laws to make distributions of non-cash income to stockholders without receiving any cash. Such required cash distributions may have to be paid from the sale of our assets without investors being given any notice of this fact. The required recognition of non-cash income, including PIK and OID interest, for U.S. federal income tax purposes may have a negative impact on liquidity because it represents a non-cash component of our taxable income that must, nevertheless, be distributed to investors to avoid us being subject to corporate level taxation.
Further, our investment in Avanti, which represented approximately 20.6% of our investment portfolio (excluding cash and short-term investments) as of December 31, 2019 and 20.6% of our total investment income for the year ended December 31, 2019, has resulted in significant PIK interest, which significantly increases our exposure to the aforementioned risks. Conversion of Avanti’s 2019 Notes to equity has resulted in us owning more Avanti common shares, which are not expected to generate cash dividends. Please see “—Risks Relating to Our Investments—We may lose all of our investment in Avanti.”
We may choose to pay distributions in our own stock, in which case stockholders may be required to pay tax in excess of the cash they receive. We may distribute a portion of our taxable distributions in the form of shares of our stock. Under applicable provisions of the Code, distributions payable in cash or in shares of stock at the election of stockholders may be treated as a taxable distribution. The IRS has issued private rulings indicating that this rule will apply even if the total amount of cash that may be distributed is limited to no more than 20% of the total distribution. Under these rulings, if too many stockholders elect to receive their distributions in cash, each such stockholder would receive a pro rata share of the total cash to be distributed and would receive the remainder of their distribution in shares of stock. If we decide to make any distributions consistent with these rulings that are payable in part in our stock, taxable stockholders receiving such distributions will be required to include the full amount of the distribution (whether received in cash, stock or a combination thereof) as ordinary income (or as a long‑term capital gain to the extent such distribution is properly designated as a capital gain dividend) to the extent of our current and accumulated earnings and profits for U.S. federal income tax purposes. As a result, a U.S. stockholder may be required to pay tax with respect to such distribution in excess of any cash received. If a U.S. stockholder sells the stock it receives as a distribution in order to pay this tax, the sales proceeds may be less than the amount included in income with respect to the distribution, depending on the market price of our common stock at the time of the sale. Furthermore, with respect to non‑U.S. stockholders, we may be required to withhold U.S. tax with respect to such distribution, including in respect to all or a portion of such distribution that is payable in stock. In addition, if a significant number of our stockholders determine to sell shares of our common stock, in order to pay taxes owed on distribution, such sales may put downward pressure on the trading price of our common stock.
We may expose ourself to risks if we engage in hedging transactions. If we engage in hedging transactions, we may expose our self to risks associated with such transactions. We may utilize instruments such as forward contracts, currency options and interest rate swaps, caps, collars and floors to seek to hedge against fluctuations in the relative values of our portfolio positions from changes in currency exchange rates and market interest rates. Hedging against a decline in the values of our portfolio positions does not eliminate the possibility of fluctuations in the values of such positions or prevent losses if the values of such positions decline. Such hedging transactions may also limit the opportunity for gain if the values of the underlying portfolio positions increase. It may not be possible to hedge against an exchange rate or interest rate fluctuation that is generally anticipated because we may not be able to enter into a hedging transaction at an acceptable price. Moreover, for a variety of reasons, we may not seek to establish a perfect correlation between such hedging instruments and the portfolio holdings being hedged.
36
Any such imperfect correlation may prevent us from achieving the intended hedge and expose us to risk of loss. In addition, it may not be possible to hedge fully or perfectly against currency fluctuations affecting the value of securities denominated in non‑U.S. currencies because the value of those securities is likely to fluctuate as a result of factors not related to currency fluctuations.
We will be subject to corporate‑level U.S. federal income tax if we are unable to qualify as a RIC under the Code. No assurance can be given that we will be able to qualify for and maintain RIC status. To maintain RIC tax treatment under the Code, we must meet certain annual distribution, source of income and asset diversification requirements.
The Annual Distribution Requirement for a RIC will be satisfied if we distribute to our stockholders on an annual basis at least 90% of our net ordinary income and realized net short‑term capital gains in excess of realized net long‑term capital losses, if any. Because we may use debt financing, we may be subject to asset coverage ratio requirements under the Investment Company Act and financial covenants under loan and credit agreements that could, under certain circumstances, restrict us from making distributions necessary to satisfy the distribution requirement. If we are unable to make the required distributions, we could fail to qualify for RIC tax treatment and thus become subject to corporate‑level U.S. federal income tax.
The source of income requirement will be satisfied if we obtain at least 90% of our income for each year from dividends, interest, gains from the sale of stock or securities or similar sources.
The asset diversification requirement will be satisfied if we meet asset diversification requirements at the end of each quarter of our taxable year. We expect to satisfy the asset diversification requirements, but our business model calls for concentration in a relatively small number of portfolio companies. Failure to meet the asset diversification requirements could result in us having to dispose of investments quickly in order to prevent the loss of RIC status. Because most of our investments will be relatively illiquid, any such dispositions could be made at disadvantageous prices and could result in substantial losses. Further, the illiquidity of our investments may make them difficult or impossible to dispose of in a timely manner.
If we fail to qualify for RIC tax treatment for any reason and become subject to corporate U.S. federal income tax, the resulting corporate taxes could substantially reduce our net assets, the amount of income available for distribution and the amount of our distributions and the value of our shares of common stock.
The incentive fee structure and the formula for calculating the management fee may incentivize GECM to pursue speculative investments, advise us to use leverage when it may be unwise to do so, or advise us to refrain from reducing debt levels when it would otherwise be appropriate to do so. The incentive fee payable by us to GECM creates an incentive for GECM to pursue investments on our behalf that are riskier or more speculative than would be the case in the absence of such a compensation arrangement. The incentive fee payable to GECM is calculated based on a percentage of our return on invested capital. In addition, GECM’s base management fee is calculated on the basis of our gross assets, including assets acquired through the use of leverage. This may encourage GECM to use leverage to increase the aggregate amount of and the return on our investments, even when it may not be appropriate to do so, and to refrain from reducing debt levels when it would otherwise be appropriate to do so. The use of leverage increases our likelihood of default, which would impair the value of our securities. In addition, GECM will receive the incentive fee based, in part, upon net capital gains realized on our investments. Unlike that portion of the incentive fee based on income, there will be no hurdle rate applicable to the portion of the incentive fee based on net capital gains. As a result, GECM may have a tendency to invest more capital in investments that are likely to result in capital gains as compared to income producing securities. Such a practice could result in us investing in more speculative securities than would otherwise be the case, which could result in higher investment losses, particularly during economic downturns.
37
We may invest in the securities and instruments of other investment companies, including private funds, and we will bear our ratable share of any such investment company’s expenses, including management and performance fees. We will also remain obligated to pay management and incentive fees to GECM with respect to the assets invested in the securities and instruments of other investment companies. With respect to each of these investments, each of our stockholders will bear its share of the management and incentive fee payable to GECM as well as indirectly bearing the management and performance fees and other expenses of any investment companies in which we invest.
In addition, if we purchase our debt instruments and such purchase results in our recording a net gain on the extinguishment of debt for financial reporting and tax purposes, such net gain will be included in our pre‑incentive fee net investment income for purposes of determining the income incentive fee payable to GECM under the Investment Management Agreement.
Finally, the incentive fee payable by us to GECM also may create an incentive for GECM to invest on our behalf in instruments that have a deferred interest feature such as investments with PIK provisions. Under these investments, we would accrue the interest over the life of the investment but would typically not receive the cash income from the investment until the end of the term or upon the investment being called by the issuer. Our net investment income used to calculate the income portion of our incentive fee, however, includes accrued interest. The portion of the incentive fee that is attributable to deferred interest, such as PIK, will not be paid to GECM until we receive such interest in cash. Even though such portion of the incentive fee will be paid only when the accrued income is collected, the accrued income is capitalized and included in the calculation of the base management fee. In other words, when deferred interest income (such as PIK) is accrued, a corresponding income incentive fee (if any) is also accrued (but not paid) based on that income. After the accrual of such income, it is capitalized and added to the debt balance, which increases our total assets and thus the base management fee paid following such capitalization. If any such interest is reversed in connection with any write-off or similar treatment of the investment, we will reverse the income incentive fee accrual and an income incentive fee will not be payable with respect to such uncollected interest. If a portfolio company defaults on a loan, it is possible that accrued interest previously used in the calculation of whether GECM met the hurdle rate to earn the incentive fee will become uncollectible.
A general increase in interest rates will likely have the effect of making it easier for GECM to receive incentive fees, without necessarily resulting in an increase in our net earnings. Given the structure of the Investment Management Agreement, any general increase in interest rates will likely have the effect of making it easier for GECM to meet the quarterly hurdle rate for payment of income incentive fees under the Investment Management Agreement without any additional increase in relative performance on the part of GECM. In addition, in view of the catch‑up provision applicable to income incentive fees under the Investment Management Agreement, GECM could potentially receive a significant portion of the increase in our investment income attributable to such a general increase in interest rates. If that were to occur, our increase in net earnings, if any, would likely be significantly smaller than the relative increase in GECM’s income incentive fee resulting from such a general increase in interest rates.
GECM has the right to resign on 60 days’ notice, and we may not be able to find a suitable replacement within that time, resulting in a disruption in our operations that could adversely affect our financial condition, business and results of operations. GECM has the right, under the Investment Management Agreement, to resign at any time upon not more than 60 days’ written notice, whether we have found a replacement or not. If GECM resigns, we may not be able to find a new investment adviser or hire internal management with similar expertise and ability to provide the same or equivalent services on acceptable terms within 60 days, or at all. If we are unable to do so quickly, our operations are likely to experience a disruption; our financial condition, business and results of operations, as well as our ability to pay distributions are likely to be adversely affected; and the market price of our common stock may decline. In addition, the coordination of our internal management and investment activities is likely to suffer if we are unable to identify and reach an agreement with a single institution or group of executives having the expertise possessed by our investment adviser and its affiliates. Even if we are able to retain comparable management, whether internal or external, the integration of such management and their lack of familiarity with our investment objective and current investment portfolio may result in additional costs and time delays that may adversely affect our financial condition, business and results of operations.
38
We incur significant costs as a result of being a publicly traded company. As a publicly traded company, we incur legal, accounting and other expenses, including costs associated with the periodic reporting requirements applicable to a company whose securities are registered under the Securities and Exchange Act of 1934, as amended (the “Exchange Act”), as well as additional corporate governance requirements, including requirements under the Sarbanes-Oxley Act of 2002 (the “Sarbanes‑Oxley Act”), the Dodd‑Frank Act and other rules implemented by our government.
Changes in laws or regulations governing our operations may adversely affect our business or cause us to alter our business strategy. We and our portfolio companies are subject to applicable local, state and federal laws and regulations. New legislation may be enacted or new interpretations, rulings or regulations could be adopted, including those governing the types of investments we are permitted to make, any of which could harm us and you, potentially with retroactive effect. Additionally, any changes to the laws and regulations governing our operations relating to permitted investments may cause us to alter our investment strategy in order to avail our self of new or different opportunities. Such changes could result in material differences to the strategies and plans and may result in our investment focus shifting from the areas of expertise of GECM to other types of investments in which the investment committee may have less expertise or little or no experience. Specifically, tax reform legislation could have an adverse impact on us, the credit markets and our portfolio companies, notwithstanding the reduction in corporate tax rates. Thus, any such changes, if they occur, could have a material adverse effect on our results of operations.
In December 2015, the SEC proposed Rule 18f-4 under the Investment Company Act to regulate the use of derivatives by registered investment companies that applies to BDCs, including us. Although Rule 18f-4 was ultimately not adopted, the SEC’s Regulatory Flexibility Agenda for Spring 2018 included a prospective rule titled “Use of Derivatives by Registered Investment Companies and Business Development Companies.” The prospective rule stated that the Division of Investment Management is “considering recommending that the SEC re-propose a new rule designed to enhance the regulation of the use of derivatives by registered investment companies, including mutual funds, exchange-traded funds, closed-end funds and business development companies.” If such a rule goes into effect, it could limit our ability to invest or remain invested in derivatives. In addition, other future regulatory developments may impact our ability to invest or remain invested in derivatives. Legislation or regulation may also change the way in which we are regulated. We cannot predict the effects of any new governmental regulation that may be implemented on our ability to use swaps or any other financial derivative product, and there can be no assurance that any new governmental regulation will not adversely affect our ability to achieve our investment objective.
We may incur additional debt. On March 23, 2018, the Consolidated Appropriations Act of 2018, which includes the Small Business Credit Availability Act (the “Act”), was signed into law. The Act amends the Investment Company Act to permit a BDC to reduce the required minimum asset coverage ratio applicable to it from 200% to 150%, subject to certain requirements described therein. This reduction significantly increases the amount of debt that BDCs may incur.
Prior to the enactment of the Act, BDCs were required to maintain an asset coverage ratio of at least 200% in order to incur debt or to issue other senior securities. Generally, for every $1.00 of debt incurred or in senior securities issued, a BDC was required to have at least $2.00 of assets immediately following such incurrence or issuance. For those BDCs that satisfy the Act’s disclosure and approval requirements, the minimum asset coverage ratio is reduced such that for every $1.00 of debt incurred or in senior securities issued, a BDC must now have at least $1.50 of assets.
At our 2018 annual meeting of stockholders (the “Annual Meeting”), a majority of our stockholders approved the application of the modified minimum asset coverage requirements set forth in Section 61(a)(2) of the Investment Company Act, to the Company. As a result of such approval, and subject to satisfying certain ongoing disclosure requirements, effective May 4, 2018 the asset coverage ratio test applicable to the Company was decreased from 200% to 150%, permitting us to incur additional leverage and thereby potentially increasing the risk of an investment in us.
Incurring additional indebtedness could increase the risk in investing in our Company. In 2018, our stockholders approved of the reduction of our required minimum asset coverage ratio from 200% to 150%, permitting us to incur additional leverage. The use of leverage magnifies the potential for gain or loss on amounts invested. The use of leverage is generally considered a speculative investment technique and increases the risks associated with investing in our securities.
39
As of December 31, 2019, we had approximately $124.0 million of total outstanding indebtedness under three series of senior securities (unsecured notes)—the GECCL Notes, the GECCM Notes and the GECCN Notes (each as defined herein)—and our asset coverage ratio was 170%. Holders of our GECCL Notes, GECCM Notes and GECCN Notes have fixed dollar claims on our assets that are superior to the claims of our common stockholders, and such holders may seek to recover against our assets in the event of a default.
If we are unable to meet the financial obligations under any of the GECCL Notes, the GECCM Notes or the GECCN Notes, the holders of such indebtedness would have a superior claim to our assets over our common stockholders in the event of a default by us. If the value of our assets decreases, leveraging would cause net asset value to decline more sharply than it otherwise would have had we not leveraged, thereby magnifying losses. Similarly, any decrease in our revenue or income will cause our net income to decline more sharply than it would have had we not borrowed. Such a decline would also negatively affect our ability to make distributions with respect to our common stock. Our ability to service any debt depends largely on our financial performance and is subject to prevailing economic conditions and competitive pressures. Moreover, as the base management fee payable to GECM is payable based on the average value of our total assets, including those assets acquired through the use of leverage, GECM will have a financial incentive to incur leverage, which may not be consistent with our stockholders’ interests. In addition, our common stockholders bear the burden of any increase in our fees or expenses as a result of our use of leverage, including interest expenses and any increase in the base management fee payable to GECM.
If our asset coverage ratio falls below the required limit, we will not be able to incur additional debt until we are able to comply with the asset coverage ratio applicable to us. This could have a material adverse effect on our operations, and we may not be able to make distributions to stockholders. The actual amount of leverage that we employ will depend on GECM’s and our Board’s assessment of market and other factors at the time of any proposed borrowing. We cannot assure you that we will be able to obtain credit at all or on terms acceptable to us.
Incurring additional leverage may magnify our exposure to risks associated with changes in interest rates, including fluctuations in interest rates which could adversely affect our profitability. If we incur additional leverage, general interest rate fluctuations may have a more significant negative impact on our financial condition and results of operations than they would have absent such additional incurrence, and, accordingly, may have a material adverse effect on our investment objectives and rate of return on investment capital. A portion of our income will depend upon the difference between the rate at which we borrow funds and the interest rate on the debt securities in which we invest. Because we may borrow money to make investments and may issue debt securities, preferred stock or other securities, our net investment income is dependent upon the difference between the rate at which we borrow funds or pay interest or dividends on such debt securities, preferred stock or other securities and the rate at which we invest these borrowed funds.
We expect that a majority of our investments in debt will continue to be at floating rates with a floor. As a result, significant increase in market interest rates could result in an increase in our non-performing assets and a decrease in the value of our portfolio because our floating-rate loan portfolio companies may be unable to meet higher payment obligations. In periods of rising interest rates, our cost of funds would increase, resulting in a decrease in our net investment income. Incurring additional leverage will magnify the impact of an increase to our cost of funds. In addition, a decrease in interest rates may reduce net income, because new investments may be made at lower rates despite the increased demand for our capital that the decrease in interest rates may produce. To the extent our additional borrowings are in fixed-rate instruments, we may be required to invest in higher-yield securities in order to cover our interest expense and maintain our current level of return to stockholders, which may increase the risk of an investment in our securities.
40
There is, and will be, uncertainty as to the value of our portfolio investments. Under the Investment Company Act, we are required to carry our portfolio investments at market value or, if there is no readily available market value, at fair value as determined by us in accordance with our written valuation policy, with our Board having final responsibility for overseeing, reviewing and approving, in good faith, our estimate of fair value. Often, there will not be a public market for the securities of the privately held companies in which we invest. As a result, we will value these securities on a quarterly basis at fair value based on input from management, third party independent valuation firms and our audit committee, with the oversight, review and approval of our Board. We consult with an independent valuation firm in valuing all securities in which we invest classified as “Level 3,” other than investments which are less than 1% of net asset value as of the applicable quarter end. See “Management’s Discussion and Analysis of Financial Condition and Results of Operations—Critical Accounting Policies—Valuation of Portfolio Investments.”
The determination of fair value and consequently, the amount of unrealized gains and losses in our portfolio, are subjective and dependent on a valuation process approved and overseen by our Board. Factors that may be considered in determining the fair value of our investments include, among others, estimates of the collectability of the principal and interest on our debt investments and expected realization on our equity investments, as well as external events, such as private mergers, sales and acquisitions involving comparable companies. Because such valuations, and particularly valuations of private securities and private companies and small cap public companies, are inherently uncertain, they may fluctuate over short periods of time and may be based on estimates. Our determinations of fair value may differ materially from the values that would have been used if a ready market for these securities existed. Due to this uncertainty, our fair value determinations may cause our net asset value on a given date to materially misstate the value that we may ultimately realize on one or more of our investments. As a result, investors purchasing our securities based on an overstated net asset value would pay a higher price than the value of our investments might warrant. Conversely, investors selling securities during a period in which the net asset value understates the value of our investments will receive a lower price for their securities than the value of our investments might otherwise warrant.
Our financial condition and results of operations depend on our ability to effectively manage and deploy capital. Our ability to achieve our investment objective depends on our ability to effectively manage and deploy capital, which depends, in turn, on GECM’s ability to identify, evaluate and monitor, and our ability to finance and invest in, companies that meet our investment criteria.
Accomplishing our investment objective on a cost‑effective basis is largely a function of GECM’s handling of the investment process, its ability to provide competent, attentive and efficient services and its access to investments offering acceptable terms. In addition to monitoring the performance of our existing investments, GECM may also be called upon, from time to time, to provide managerial assistance to some of our portfolio companies. These demands on their time may distract them or slow the rate of investment.
Even if we are able to grow and build out our investment operations, any failure to manage our growth effectively could have a material adverse effect on our business, financial condition, results of operations and prospects. Our results of operations will depend on many factors, including the availability of opportunities for investment, readily accessible short and long‑term funding alternatives in the financial markets and economic conditions.
We may hold assets in cash or short-term treasury securities in situations where we or GECM expects downward pricing in the high yield market. Our strategic decision not to be fully invested may, from time to time, reduce funds available for distribution and cause downward pressure on the price of our common stock.
The failure in cyber security systems, as well as the occurrence of events unanticipated in our disaster recovery systems and management continuity planning, could impair our ability to conduct business effectively. The occurrence of a disaster such as a cyber‑attack, a natural catastrophe, an epidemic or pandemic, an industrial accident, a terrorist attack or war, events anticipated or unanticipated in our disaster recovery systems, or a failure in externally provided data systems, could have an adverse effect on our ability to conduct business and on our results of operations and financial condition, particularly if those events affect our computer‑based data processing, transmission, storage, and retrieval systems or destroy data. Our ability to effectively conduct our business could be severely compromised. The financial markets we operate in are dependent upon third party data systems to link buyers and sellers and provide pricing information.
41
We depend heavily upon computer systems to perform necessary business functions. Our computer systems could be subject to cyber‑attacks and unauthorized access, such as physical and electronic break‑ins or unauthorized tampering. Like other companies, we expect to experience threats to our data and systems, including malware and computer virus attacks, unauthorized access, system failures and disruptions. If one or more of these events occurs, it could potentially jeopardize the confidential, proprietary and other information processed and stored in, and transmitted through, our computer systems and networks, or otherwise cause interruptions or malfunctions in our operations, which could result in damage to our reputation, financial losses, litigation, increased costs, regulatory penalties and/or customer dissatisfaction or loss, respectively.
Terrorist attacks, acts of war, natural disasters or an epidemic or pandemic may affect the market for our securities, impact the businesses in which we invest and harm our business, operating results and financial condition. Terrorist acts, acts of war, natural disasters or an epidemic or pandemic may disrupt our operations, as well as the operations of the businesses in which we invest. Such acts have created, and continue to create, economic and political uncertainties and have contributed to global economic instability. For example, the recent outbreak of the Coronavirus Disease 2019 (COVID-19) which has been declared by the World Health Organization to be a “public health emergency of international concern,” has spread across the globe and is impacting worldwide economic activity. A public health epidemic or pandemic, including COVID-19, poses the risk that we, GECM, our portfolio companies or other business partners may be prevented from conducting business activities for an indefinite period of time, including due to shutdowns that may be requested or mandated by governmental authorities. While it is not possible at this time to estimate the impact that COVID-19 could have on our business, the continued spread of COVID-19 and the measures taken by the governments of countries affected could disrupt the supply chain and the manufacture or shipment of products and adversely impact our business, financial condition or results of operations.
Future terrorist activities, military or security operations, or natural disasters could further weaken the domestic/global economies and create additional uncertainties, which may negatively impact the businesses in which we invest directly or indirectly and, in turn, could have a material adverse impact on our business, operating results and financial condition. Losses from terrorist attacks and natural disasters are generally uninsurable.
Provisions of the Maryland General Corporation Law and our organizational documents could deter takeover attempts and have an adverse impact on the prices of our common stock. The Maryland General Corporation Law and our organizational documents contain provisions that may discourage, delay or make more difficult a change in control of GECC or the removal of our directors. We are subject to the Maryland Business Combination Act and the Investment Company Act. If our Board does not approve a business combination, the Maryland Business Combination Act may discourage third parties from trying to acquire control of us and increase the difficulty of consummating such an offer. Our Board could amend our bylaws to repeal our current exemption from the Control Share Acquisition Act; however, our Board will not amend our bylaws to repeal the current exemption from the Control Share Acquisition Act without a formal determination by the Board that doing so would be in the best interests of our stockholders and without first notifying the SEC staff. The Control Share Acquisition Act also may make it more difficult for a third party to obtain control of GECC and increase the difficulty of consummating such a transaction.
42
Our Board is authorized to reclassify any unissued shares of common stock into one or more classes of preferred stock, which could convey special rights and privileges to its owners. Under Maryland General Corporation Law and our organizational documents, our Board is authorized to classify and reclassify any authorized but unissued shares of stock into one or more classes of stock, including preferred stock. Prior to issuance of shares of each class or series, our Board will be required by Maryland law and our charter to set the terms, preferences, conversion or other rights, voting powers, restrictions, limitations as to dividends or other distributions, qualifications and terms or conditions of redemption for each class or series. Thus, our Board could authorize the issuance of shares of preferred stock with terms and conditions which could have the effect of delaying, deferring or preventing a transaction or a change in control that might involve premium prices for holders of our common stock or otherwise be in their best interest. The cost of any such reclassification would be borne by our common stockholders. Certain matters under the Investment Company Act require the separate vote of the holders of any issued and outstanding preferred stock. For example, holders of preferred stock would vote as a separate class from the holders of common stock on a proposal to cease operations as a BDC. In addition, the Investment Company Act provides that holders of preferred stock are entitled to vote separately from holders of common stock to elect two preferred stock directors. The issuance of preferred shares convertible into shares of common stock may also reduce the net income and net asset value per share of our common stock upon conversion. These effects, among others, could have an adverse effect on an investment in our common stock.
We cannot be certain if the reduced disclosure requirements applicable to emerging growth companies will make our securities less attractive to investors. We are and will remain an “emerging growth company” as defined in the JOBS Act until the earliest of (a) December 31, 2021, (b) the last day of the fiscal year (i) in which we have total annual gross revenue of at least $1.0 billion, or (ii) in which we are deemed to be a large accelerated filer, which means the market value of its common stock that is held by non‑affiliates exceeds $700.0 million as of the end of the previous second fiscal quarter, and (c) the date on which we have issued more than $1.0 billion in non‑convertible debt during the prior three‑year period. For so long as we remain an “emerging growth company” we may take advantage of exemptions from various reporting requirements that are applicable to other public companies that are not “emerging growth companies” including, but not limited to, not being required to comply with the auditor attestation requirements of Section 404 of the Sarbanes‑Oxley Act. We cannot predict if investors will find our securities less attractive because we will rely on some or all of these exemptions. If some investors find our securities less attractive as a result, there may be a less active and more volatile trading market for our securities.
In addition, Section 107 of the JOBS Act also provides that an “emerging growth company” may take advantage of the extended transition period provided in Section 7(a)(2)(B) of the Securities Act of 1933, as amended, for complying with new or revised accounting standards. In other words, an “emerging growth company” can delay the adoption of certain accounting standards until those standards would otherwise apply to private companies. To the extent we take advantage of the extended transition period for complying with new or revised accounting standards, it will be more difficult for investors and securities analysts to evaluate us since our financial statements may not be comparable to companies that comply with public company effective dates and may result in less investor confidence.
There are significant potential conflicts of interest that could impact our investment returns. Certain of our executive officers and directors, and members of the investment committee of GECM, serve or may serve as officers, directors or principals of other entities and affiliates of GECM and investment funds managed by our affiliates. Accordingly, they may have obligations to investors in those entities, the fulfillment of which might not be in our or our stockholders' best interests or that may require them to devote time to services for other entities, which could interfere with the time available to provide services to us. For example, Peter A. Reed, our President, Chief Executive Officer and Chairman of our Board, is GECM's Chief Investment Officer and chief executive officer of the second largest beneficial owner of our stock, GEC.
Although funds managed by GECM may have different primary investment objectives than we do, they may from time to time invest in asset classes similar to those targeted by us. GECM is not restricted from raising an investment fund with investment objectives similar to ours. Any such funds may also, from time to time, invest in asset classes similar to those targeted by us. It is possible that we may not be given the opportunity to participate in certain investments made by investment funds managed by investment managers affiliated with GECM.
43
We will pay management and incentive fees to GECM, and will reimburse GECM for certain expenses it incurs. In addition, investors in our common stock will invest on a gross basis and receive distributions on a net basis after expenses, resulting in, among other things, a lower rate of return than one might achieve through direct investments.
GECM's management fee is based on a percentage of our total assets (other than cash or cash equivalents but including assets purchased with borrowed funds) and GECM may have conflicts of interest in connection with decisions that could affect our total assets, such as decisions as to whether to incur indebtedness.
The part of the incentive fee payable by us that relates to our pre-incentive fee net investment income is computed and paid on income that may include interest that is accrued but not yet received in cash. If a portfolio company defaults on a loan or note that is structured to provide accrued interest, it is possible that accrued interest previously used in the calculation of the incentive fee will become uncollectible.
The Investment Management Agreement renews for successive annual periods if approved by our Board or by the affirmative vote of the holders of a majority of our outstanding voting securities, including, in either case, approval by a majority of our directors who are not interested persons. However, both we and GECM have the right to terminate the agreement without penalty upon 60 days' written notice to the other party. Moreover, conflicts of interest may arise if GECM seeks to change the terms of the Investment Management Agreement, including, for example, the terms for compensation.
Pursuant to the Administration Agreement, we pay GECM our allocable portion of overhead and other expenses incurred by GECM in performing its obligations under the Administration Agreement, including our allocable portion of the cost of our Chief Financial Officer and Chief Compliance Officer and their respective staffs.
As a result of the arrangements described above, there may be times when our management team has interests that differ from those of our stockholders, giving rise to a conflict.
Our stockholders may have conflicting investment, tax and other objectives with respect to their investments in us. The conflicting interests of individual stockholders may relate to or arise from, among other things, the nature of our investments, the structure or the acquisition of our investments, and the timing of disposition of our investments. As a consequence, conflicts of interest may arise in connection with decisions made by GECM, including with respect to the nature or structuring of our investments, that may be more beneficial for one stockholder than for another stockholder, especially with respect to stockholders' individual tax situations. In selecting and structuring investments appropriate for us, GECM will consider the investment and tax objectives of us and our stockholders, as a whole, not the investment, tax or other objectives of any stockholder individually.
Shares of closed-end investment companies, including BDCs, frequently trade at a discount from their net asset value. Shares of closed-end investment companies, including BDCs, frequently trade at a discount from their net asset value. This characteristic of closed-end investment companies is separate and distinct from the risk that our net asset value per share of common stock may decline.
We may, however, sell our common stock, or warrants, options or rights to acquire our common stock, at a price below the then-current net asset value per share of our common stock if our Board determines that such sale is in the best interests of GECC and our stockholders approve such sale. In any such case, the price at which our securities are to be issued and sold may not be less than a price that, in the determination of our Board, equals the fair value of such securities (less any distributing commission or discount calculated). If we raise additional funds by issuing more common stock or senior securities convertible into, or exchangeable for, our common stock, then the percentage of our existing stockholders’ ownership at that time will decrease, and they may experience dilution.
44
Our stockholders may not receive distributions or our distributions may not grow over time and a portion of our distributions may be a return of capital. We intend to make distributions on a monthly basis to our stockholders out of assets legally available for distribution (i.e., not subject to any legal restrictions under Maryland law on the distribution thereof). We cannot assure you that we will achieve investment results that will allow us to make a specified level of cash distributions or year-to-year increases in cash distributions. Our ability to pay distributions might be adversely affected by the impact of one or more of the risk factors described in this document. Due to the asset coverage test applicable to us under the Investment Company Act as a BDC, we may be limited in our ability to make distributions.
When we make distributions, we will be required to determine the extent to which such distributions are paid out of current or accumulated earnings and profits. Distributions in excess of current and accumulated earnings and profits will be treated as a non-taxable return of capital to the extent of an investor’s basis in our stock and, assuming that an investor holds our stock as a capital asset, thereafter as a capital gain. Stockholders who periodically receive the payment of a distribution consisting of a return of capital may be under the impression that they are receiving net profits when they are not. Stockholders should not assume that the source of a distribution from us is net profit.
We currently intend to distribute realized net capital gains (i.e., net long term capital gains in excess of short term capital losses), if any, at least annually, we may in the future decide to retain such capital gains for investment and elect to treat such gains as deemed distributions to our stockholders. If this happens, you will be treated as if you had received an actual distribution of the capital gains we retain and reinvested the net after tax proceeds in GECC. In this situation, you would be eligible to claim a tax credit (or, in certain circumstances, a tax refund) equal to your allocable share of the tax we paid on the capital gains deemed distributed to you.
Our current intention is to make any distributions in additional shares of our common stock under our dividend reinvestment plan out of assets legally available therefor, unless you elect to receive your distributions and/or long-term capital gains distributions in cash. If you hold shares in the name of a broker or financial intermediary, you should contact the broker or financial intermediary regarding your election to receive distributions in cash.
We can offer no assurance that we will achieve results that will permit the payment of any cash distributions and, if we issue senior securities, we will be prohibited from making distributions if doing so causes us to fail to maintain the asset coverage ratios stipulated by the Investment Company Act or if distributions are limited by the terms of any of our borrowings.
Stockholders may experience dilution in their ownership percentage if they do not participate in our dividend reinvestment plan. All distributions declared in cash payable to stockholders that are participants in our dividend reinvestment plan are generally automatically reinvested in shares of our common stock. As a result, stockholders that do not participate in the dividend reinvestment plan may experience dilution over time. Stockholders who receive distributions in shares of common stock may experience accretion to the net asset value of their shares if our shares are trading at a premium and dilution if our shares are trading at a discount. The level of accretion or discount would depend on various factors, including the proportion of our stockholders who participate in the plan, the level of premium or discount at which our shares are trading and the amount of the distribution payable to a stockholder.
Existing stockholders may incur dilution if, in the future, we sell shares of our common stock in one or more offerings at prices below the then current net asset value per share of our common stock. The Investment Company Act prohibits us from selling shares of our common stock at a price below the current net asset value per share of such stock, with certain exceptions. Our shares might trade at premiums that are unsustainable or at discounts from net asset value.
45
Shares of BDCs like us may, during some periods, trade at prices higher than their net asset value per share and, during other periods, as frequently occurs with closed-end investment companies, trade at prices lower than their net asset value per share. The perceived value of our investment portfolio may be affected by a number of factors including perceived prospects for individual companies we invest in, market conditions for common stock generally, for initial public offerings and other exit events for venture capital backed companies, and the mix of companies in our investment portfolio over time. Negative or unforeseen developments affecting the perceived value of companies in our investment portfolio could result in a decline in the trading price of our common stock relative to our net asset value per share.
The possibility that our shares will trade at a discount from net asset value or at premiums that are unsustainable are risks separate and distinct from the risk that our net asset value per share will decrease. The risk of purchasing shares of a BDC that might trade at a discount or unsustainable premium is more pronounced for investors who wish to sell their shares in a relatively short period of time because, for those investors, realization of a gain or loss on their investments is likely to be more dependent upon changes in premium or discount levels than upon increases or decreases in net asset value per share.
Future offerings of debt securities, which would be senior to our common stock upon liquidation, or equity securities, which could dilute our existing stockholders and may be senior to our common stock for the purposes of distributions, may harm the value of our common stock. In the future, we may attempt to increase our capital resources by making offerings of debt or equity securities, including commercial paper, medium-term notes, senior or subordinated notes and classes of preferred stock or common stock, subject to the restrictions of the Investment Company Act. Upon a liquidation of our company, holders of our debt securities and shares of preferred stock and lenders with respect to other borrowings would receive a distribution of our available assets prior to the holders of our common stock. Additional equity offerings by us may dilute the holdings of our existing stockholders or reduce the value of our common stock, or both. Any preferred stock we may issue would have a preference on distributions that could limit our ability to make distributions to the holders of our common stock. Because our decision to issue securities in any future offering will depend on market conditions and other factors beyond our control, we cannot predict or estimate the amount, timing or nature of our future offerings. Thus, our stockholders bear the risk of our future offerings reducing the market price of our common stock and diluting their stock holdings in us. In addition, proceeds from a sale of common stock will likely be used to increase our total assets or to pay down our borrowings, among other uses. This would increase our asset coverage ratio and permit us to incur additional leverage under rules pertaining to BDCs by increasing our borrowings or issuing senior securities such as preferred stock or additional debt securities.
46
Item 1B. Unresolved Staff Comments.
None.
Our executive offices are located at 800 South Street, Suite 230, Waltham, MA 02453, and are provided by GECM in accordance with the terms of the Administration Agreement.
From time to time, we, our investment adviser or administrator may be a party to certain legal proceedings in the ordinary course of business, including proceedings relating to the enforcement of our rights under contracts with our portfolio companies.
We are named as a defendant in a lawsuit filed on March 5, 2016, and captioned Intrepid Investments, LLC v. London Bay Capital, which is pending in the Delaware Court of Chancery. The plaintiff immediately agreed to stay the action in light of an ongoing mediation among parties other than us. This lawsuit was brought by a member of Speedwell Holdings (formerly known as The Selling Source, LLC), one of our portfolio investments, against various members of and lenders to Speedwell Holdings. The plaintiff asserts claims of aiding and abetting, breaches of fiduciary duty, and tortious interference against us. In June 2018, Intrepid Investments, LLC (“Intrepid”) sent notice to the court and defendants effectively lifting the stay and triggering defendants’ obligation to respond to the Intrepid complaint. In September 2018, we joined the other defendants in a motion to dismiss on various grounds. In February 2019, Intrepid filed a second amended complaint to which defendants filed a renewed motion to dismiss in March 2019. We intend to continue to monitor the matter and will assess the need to defend the matter further as necessary.
In July 2016, Full Circle filed suit in the District Court of Caldwell County, Texas against, among others, Willis Pumphrey for breach of a guaranty agreement arising from a loan transaction with Full Circle. Dr. Pumphrey, a personal guarantor of the loan made by Full Circle, our predecessor in interest, brought counterclaims in (i) the District Court of Caldwell County, Texas and (ii) the District Court of Harris County, Texas (the “District Court”) against, among others, Justin Bonner, an employee of GECM, in each case, alleging breach of a confidentiality agreement and tortious interference with Dr. Pumphrey’s attempted sale of a business in which he owned an interest. In August 2017, Dr. Pumphrey voluntarily withdrew his complaint against Mr. Bonner and Full Circle in the District Court of Harris County, Texas. In November 2017, Dr. Pumphrey voluntarily withdrew his complaint without prejudice against Full Circle in the District Court of Caldwell County, Texas. On November 29, 2017, Dr. Pumphrey refiled his claims in the District Court of Harris County, Texas naming Full Circle, MAST Capital, GECC and GECM as defendants. Dr. Pumphrey is seeking between $2 million and $6 million in damages. GECC believes Dr. Pumphrey’s claims to be frivolous and intends to vigorously defend them. Furthermore, we continue to pursue our initial claims against Dr. Pumphrey in the District Court of Caldwell County, Texas. In September 2019, we received a judgment in our favor from the District Court of Caldwell County, Texas.
In September 2018, we (as successor by merger to Full Circle), the other lenders, and the lender trustee under PEAKS Trust 2009-11 (“PEAKS Trust”), were named as defendants in a claim brought by the Chapter 7 trustee in the ITT Educational Services bankruptcy. Full Circle purchased via assignment a portion of the PEAKS Trust senior secured facility from Deutsche Bank Trust Company Americas in December 2016. The PEAKS Trust senior secured facility was supported by an underlying portfolio of student loans and guaranteed by ITT Educational Services, Inc. (“ITT”). In September 2016, ITT and its affiliates filed for relief under Chapter 7 of the Bankruptcy Code. Following the Chapter 7 filing, a trustee was appointed who initiated a proceeding against certain Deutsche Bank entities and the investors in the PEAKS Trust, including GECC. On November 2, 2018, the trustee filed a motion seeking to stay the litigation in order to facilitate settlement. We are continuing to monitor these proceedings.
Item 4. Mine Safety Disclosures.
Not applicable.
47
Item 5. Market for Registrant’s Common Equity, Related Stockholder Matters and Issuer Purchases of Equity Securities.
Market Information
Our common stock is traded on the NASDAQ Global Market (“Nasdaq”) under the symbol “GECC.”
As of March 16, 2020, there were approximately 7 holders of record of the common stock, one of which represents all of our stockholders for whom shares are held in “nominee” or “street name.”
Distributions
We offer no assurance that we will achieve results that will permit the payment of any cash distributions and, if we issue senior securities, we will be prohibited from making distributions if doing so causes us to fail to maintain the asset coverage ratios stipulated by the Investment Company Act or if distributions are limited by the terms of any of our borrowings.
To the extent our taxable earnings fall below the total amount of our distributions for that fiscal year, a portion of those distributions may be deemed a tax-free return of capital to our stockholders. Thus, the source of a distribution to our stockholders may be the original capital invested by the stockholder rather than our taxable ordinary income or capital gains. Stockholders should read any written disclosure accompanying a distribution payment carefully and should not assume that the source of any distribution is our taxable ordinary income or capital gains.
During the year ended December 31, 2019, our distributions were made from undistributed net investment income. We may not be able to achieve operating results that will allow us to make distributions at a specific level or to increase the amount of these distributions in the future. In addition, we may be limited in our ability to make distributions due to the asset coverage requirements applicable to us as a BDC under the Investment Company Act. If we do not distribute a certain percentage of our income annually, we will suffer adverse tax consequences, including possible loss of favorable regulated investment company tax treatment.
48
Issuer Purchases of Equity Securities
In March 2019, the Company implemented a stock buyback program pursuant to Rule 10b5-1 and Rule 10b-18 under the Exchange Act (the “buyback program”) authorizing us to repurchase our common stock in open market transactions in an aggregate amount of up to $5 million through December 31, 2019, unless extended or terminated by our Board. During the year ended December 31, 2019, the Company purchased 589,719 shares under the buyback program at a weighted average price of $8.54 per share.
Common stock repurchases during the year ended December 31, 2019 were:
|
Month |
|
Total Number of Shares Purchased |
|
|
Average Price Per Share |
|
|
Total Number of Shares Purchased as Part of Publicly Announced Program |
|
|
Approximate Dollar Value of Shares that May Yet Be Purchased Under the Program (in thousands) |
|
||||
|
March 1-31, 2019 |
|
|
192,000 |
|
|
$ |
8.27 |
|
|
|
192,000 |
|
|
$ |
3,406 |
|
|
April 1-30, 2019 |
|
|
116,883 |
|
|
|
8.26 |
|
|
|
308,883 |
|
|
|
2,437 |
|
|
May 1-31, 2019 |
|
|
277,044 |
|
|
|
8.65 |
|
|
|
585,927 |
|
|
|
33 |
|
|
June 1-30, 2019 |
|
|
3,792 |
|
|
|
8.71 |
|
|
|
589,719 |
|
|
|
- |
|
|
July 1-31, 2019 |
|
|
- |
|
|
|
- |
|
|
|
- |
|
|
|
- |
|
|
August 1-31, 2019 |
|
|
- |
|
|
|
- |
|
|
|
- |
|
|
|
- |
|
|
September 1-30, 2019 |
|
|
- |
|
|
|
- |
|
|
|
- |
|
|
|
- |
|
|
October 1-31, 2019 |
|
|
- |
|
|
|
- |
|
|
|
- |
|
|
|
- |
|
|
November 1-30, 2019 |
|
|
- |
|
|
|
- |
|
|
|
- |
|
|
|
- |
|
|
December 1-31, 2019 |
|
|
- |
|
|
|
- |
|
|
|
- |
|
|
|
- |
|
|
|
|
|
|
|
|
|
|
|
|
|
|
|
|
|
|
|
|
Total |
|
|
397,719 |
|
|
$ |
8.54 |
|
|
|
589,719 |
|
|
$ |
- |
|
49
This graph compares the return on our common stock with that of the Standard & Poor’s 500 Index (the “S&P 500 Index”) and the Nasdaq Financial 100 Index, for the period from November 3, 2016, the date of our Merger, after which our common stock began trading on Nasdaq, through December 31, 2019. The graph assumes that, on November 3, 2016, a person invested $10,000 in each of the S&P 500 Index and the Nasdaq Financial 100 Index, and our common stock at the equivalent closing price of Full Circle’s last day of trading. The graph measures total stockholder return, which takes into account both changes in stock price and dividends. It assumes that dividends paid are reinvested in like securities.
The graph and other information furnished under this Item 5 shall not be deemed to be “soliciting material” or to be “filed” with the SEC or subject to Regulation 14A or 14C, or to the liabilities of Section 18 of the Exchange Act. The stock price performance included in the above graph is not necessarily indicative of future stock price performance.
50
Item 6. Selected Financial Data.
The following selected financial data is derived from our consolidated financial statements which have been audited by Deloitte & Touche LLP, our independent registered public accounting firm. The data should be read in conjunction with our consolidated financial statements and related notes thereto and “Management’s Discussion and Analysis of Financial Condition and Results of Operations” as well as other disclosures included elsewhere in this report.
|
|
|
For the year ended December 31, |
|
|
For the period from inception through December 31, |
|
||||||||||
|
(in thousands, except per share amounts) |
|
2019 |
|
|
2018 |
|
|
2017 |
|
|
2016(1) |
|
||||
|
Statement of Operations Data: |
|
|
|
|
|
|
|
|
|
|
|
|
|
|
|
|
|
Total Investment Income |
|
$ |
27,038 |
|
|
$ |
27,754 |
|
|
$ |
29,728 |
|
|
$ |
5,831 |
|
|
Total Gross Expenses(2) |
|
|
15,892 |
|
|
|
12,240 |
|
|
|
11,959 |
|
|
|
5,818 |
|
|
Total Net Expenses |
|
|
15,892 |
|
|
|
12,240 |
|
|
|
12,029 |
|
|
|
5,738 |
|
|
Net Investment Income |
|
|
10,937 |
|
|
|
15,334 |
|
|
|
17,575 |
|
|
|
5 |
|
|
Net Decrease in Net Assets Resulting from Operations |
|
|
(7,547 |
) |
|
|
(9,005 |
) |
|
|
(2,754 |
) |
|
|
(17,874 |
) |
|
|
|
|
|
|
|
|
|
|
|
|
|
|
|
|
|
|
|
Per Share Data:(3) |
|
|
|
|
|
|
|
|
|
|
|
|
|
|
|
|
|
Net Investment Income |
|
|
1.07 |
|
|
|
1.44 |
|
|
|
1.52 |
|
|
|
0.28 |
|
|
Net Decrease in Net Assets Resulting from Operations |
|
|
(0.74 |
) |
|
|
(0.85 |
) |
|
|
(0.24 |
) |
|
|
(0.75 |
) |
|
Dividends Declared |
|
|
1.05 |
|
|
|
1.24 |
|
|
|
1.20 |
|
|
|
0.17 |
|
|
|
|
|
|
|
|
|
|
|
|
|
|
|
|
|
|
|
|
Statement of Assets and Liabilities Data: |
|
|
|
|
|
|
|
|
|
|
|
|
|
|
|
|
|
Total Assets |
|
$ |
291,039 |
|
|
$ |
281,563 |
|
|
$ |
239,913 |
|
|
$ |
236,544 |
|
|
Total Net Assets |
|
$ |
86,889 |
|
|
$ |
110,116 |
|
|
$ |
132,287 |
|
|
$ |
172,984 |
|
|
Other Data: |
|
|
|
|
|
|
|
|
|
|
|
|
|
|
|
|
|
Total Return based on Market Value(4) |
|
|
15.17 |
% |
|
|
(8.35 |
)% |
|
|
(5.56 |
)% |
|
|
(2.03 |
)% |
|
Total Return based on Net Asset Value(5) |
|
|
(4.64 |
)% |
|
|
(7.31 |
)% |
|
|
0.69 |
% |
|
|
(5.30 |
)% |
|
(1) |
For the period from November 3, 2016 to December 31, 2016. November 3, 2016 is the date on which the Merger closed; November 4, 2016 is the date on which we began operating as the combined entity resulting from the Merger. |
|
(2) |
For the year ended December 31, 2017, this number includes the reversal of a previously accrued estimate of the waiver in the Administration Agreement of approximately $0.07 million. Without such inclusion, total gross expenses would have been approximately $12.0 million. |
|
(3) |
The per share data was derived by using the weighted average shares outstanding during the period. |
|
(4) |
Total return based on market value does not consider the effect of any sales commissions or charges that may be incurred in connection with the sale of shares of our common stock. Total return based on market value is calculated as the change in market value per share, assuming our distributions were reinvested through our dividend reinvestment plan. For the period ended December 31, 2016, total return based on market value is calculated assuming an opening market value of $12.03 per share, which represents the closing price of Full Circle’s common stock on its last day of trading prior to the Merger, as adjusted by the exchange ratio in the Merger Agreement. |
|
(5) |
Total return based on net asset value is calculated as the change in net asset value per share, assuming our distributions were reinvested through our dividend reinvestment plan. |
51
Item 7. Management’s Discussion and Analysis of Financial Condition and Results of Operations.
Overview
We are a BDC that seeks to generate both current income and capital appreciation through debt and equity investments. Our investment focus is on debt obligations of middle-market companies for which quotations are typically available in the credit markets. We invest primarily in the debt of middle-market companies as well as small businesses, generally in the form of senior secured and unsecured notes, as well as in senior secured loans, junior loans and mezzanine debt. We will from time to time make equity investments as part of restructuring credits and in rare instances reserve the right to make equity investments directly.
On September 27, 2016, we and GECM entered into the Investment Management Agreement and the Administration Agreement, and, upon closing the Merger, we began to accrue obligations to our external investment manager under those agreements.
Beginning with our tax year starting October 1, 2016, we elected to be treated as a RIC for U.S. federal income tax purposes. As a RIC, we will not be taxed on our income to the extent that we distribute such income each year and satisfy other applicable income tax requirements. To qualify as a RIC, we must, among other things, meet source-of-income and asset diversification requirements and annually distribute to our stockholders generally at least 90% of our investment company taxable income on a timely basis. If we qualify as a RIC, we generally will not have to pay corporate level taxes on any income that we distribute to our stockholders.
Formation Transactions
On June 23, 2016, we entered into the Subscription Agreement, under which:
|
|
▪ |
On June 23, 2016, GEC contributed $30.0 million in exchange for 1,966,667 shares of our common stock. |
|
|
▪ |
On September 27, 2016, before we elected to become a BDC, the MAST Funds contributed to us the Initial GECC Portfolio that we valued at $90.0 million in exchange for 5,935,800 shares of our common stock. |
For financial reporting purposes, we have accounted for the contribution of the Initial GECC Portfolio as an asset acquisition per the Financial Accounting Standards Board Accounting Standards Codification Topic 805, Business Combinations (“Topic 805”). For tax purposes, we recorded our basis in the Initial GECC Portfolio at the fair market value of the Initial GECC Portfolio as of the date of contribution.
Under the Subscription Agreement, upon consummation of the Merger, we became obligated to reimburse the costs incurred by GEC and the MAST Funds in connection with the Merger and the transactions contemplated by the Subscription Agreement.
Following the closing of the Merger, we entered into a registration rights agreement with GEC and the MAST Funds.
Full Circle Merger
On June 23, 2016, we entered into the Merger Agreement with Full Circle. Following approval on October 31, 2016 of the Merger by Full Circle’s stockholders, on November 3, 2016:
|
|
▪ |
Full Circle merged into us resulting in our acquisition by operation of the Merger of Full Circle’s portfolio that we valued at $74.7 million at November 3, 2016; |
|
|
▪ |
We became obligated to issue an aggregate of 4,986,585 shares of our common stock to former Full Circle stockholders; and |
|
|
▪ |
Our exchange agent paid a $5.4 million special cash dividend to former Full Circle stockholders. |
52
We accounted for the Merger as a business combination under Topic 805 and Regulation S-X’s purchase accounting guidance. GECC was designated as the acquirer for accounting purposes. The difference between the fair value of Full Circle’s net assets and the consideration was recorded as a purchase accounting loss because the fair value of the assets acquired and liabilities assumed, as of the date of the Merger, was less than that of the merger consideration paid.
Investments
Our level of investment activity can and does vary substantially from period to period depending on many factors, including, among others, the amount of debt and equity capital available from other sources to middle-market companies, the level of merger and acquisition activity, pricing in the high yield credit markets, our expectations of future investment opportunities, the general economic environment as well as the competitive environment for the types of investments we make.
As a BDC, our investments and the composition of our portfolio are required to comply with regulatory requirements. See “Regulation as a Business Development Company” and “Material Federal Income Tax Matters.”
Revenues
We generate revenue primarily from interest on the debt investments that we hold. We also may generate revenue from dividends on the equity investments that we hold, capital gains on the disposition of investments, and lease, fee, and other income. Our investments in fixed income instruments generally have an expected maturity of three to five years, although we have no lower or upper constraint on maturity. Our debt investments generally pay interest quarterly or semi-annually. Payments of principal of our debt investments may be amortized over the stated term of the investment, deferred for several years or due entirely at maturity. In some cases, our debt investments and preferred stock investments may defer payments of cash interest or dividends or PIK. In addition, we may generate revenue in the form of prepayment fees, commitment, origination, due diligence fees, end-of-term or exit fees, fees for providing significant managerial assistance, consulting fees and other investment-related income.
Expenses
Our primary operating expenses include the payment of a base management fee, administration fees (including the allocable portion of overhead under the Administration Agreement), and, depending on our operating results, an incentive fee. The base management fee and incentive fee remunerates GECM for work in identifying, evaluating, negotiating, closing and monitoring our investments. The Administration Agreement provides for reimbursement of costs and expenses incurred for office space rental, office equipment and utilities allocable to us under the Administration Agreement, as well as certain costs and expenses incurred relating to non-investment advisory, administrative or operating services provided by GECM or its affiliates to us. We also bear all other costs and expenses of our operations and transactions. Our expenses include interest on our outstanding indebtedness.
Critical Accounting Policies
Valuation of Portfolio Investments
We value our portfolio investments at fair value based upon the principles and methods of valuation set forth in policies adopted by our Board. Fair value is defined as the price that would be received to sell an asset in an orderly transaction between market participants at the measurement date. Market participants are buyers and sellers in the principal (or most advantageous) market for the asset that (1) are independent of us; (2) are knowledgeable, having a reasonable understanding about the asset based on all available information (including information that might be obtained through due diligence efforts that are usual and customary); (3) are able to transact for the asset; and (4) are willing to transact for the asset (that is, they are motivated but not forced or otherwise compelled to do so).
Investments for which market quotations are readily available are valued at such market quotations unless the quotations are deemed not to represent fair value. We generally obtain market quotations from recognized exchanges, market quotation systems, independent pricing services or one or more broker-dealers or market makers. However, short term debt investments with remaining maturities within ninety days are generally valued at amortized cost, which approximates fair value.
53
Debt and equity securities for which market quotations are not readily available or for which market quotations are deemed not to represent fair value, are valued at fair value using a valuation process consistent with our Board-approved policy. Our Board approves in good faith the valuation of our portfolio as of the end of each quarter. Due to the inherent uncertainty and subjectivity of determining the fair value of investments that do not have a readily available market value, the fair value of our investments may differ significantly from the values that would have been used had a readily available market value existed for such investments and may differ materially from the values that we may ultimately realize. In addition, changes in the market environment and other events may impact the market quotations used to value some of our investments.
The valuation process approved by our Board with respect to investments for which market quotations are not readily available or for which market quotations are deemed not to represent fair value is as follows:
|
|
▪ |
The investment professionals of GECM provide recent portfolio company financial statements and other reporting materials to independent valuation firms approved by our Board; |
|
|
▪ |
Such firms evaluate this information along with relevant observable market data to conduct independent appraisals each quarter, and their preliminary valuation conclusions are documented and discussed with senior management of GECM; |
|
|
▪ |
The fair value of smaller investments comprising in the aggregate less than 5% of our total capitalization may be determined by GECM in good faith in accordance with our valuation policy without the employment of an independent valuation firm; and |
|
|
▪ |
Our audit committee recommends, and our Board determines, the fair value of the investments in our portfolio in good faith based on the input of GECM, our independent valuation firms (to the extent applicable) and the business judgment of our audit committee and our Board, respectively. |
Those investments for which market quotations are not readily available or for which market quotations are deemed not to represent fair value are valued utilizing a market approach, an income approach, or both approaches, as appropriate. The market approach uses prices and other relevant information generated by market transactions involving identical or comparable assets or liabilities (including a business). The income approach uses valuation techniques to convert future amounts (for example, cash flows or earnings) to a single present amount (discounted). The measurement is based on the value indicated by current market expectations about those future amounts. In following these approaches, the types of factors that we may take into account in determining the fair value of our investments include, as relevant and among other factors: available current market data, including relevant and applicable market trading and transaction comparables; applicable market yields and multiples, security covenants, call protection provisions, information rights, the nature and realizable value of any collateral; the portfolio company’s ability to make payments, its earnings and discounted cash flows, the markets in which the portfolio company does business, comparisons of financial ratios of peer companies that are public, merger and acquisition comparables; and enterprise values.
We prefer the use of observable inputs and minimize the use of unobservable inputs in our valuation process. Inputs refer broadly to the assumptions that market participants would use in pricing an asset. Observable inputs are inputs that reflect the assumptions market participants would use in pricing an asset developed based on market data obtained from sources independent of us. Unobservable inputs are inputs that reflect our assumptions about the assumptions market participants would use in pricing an asset developed based on the best information available in the circumstances.
Investments are classified by GAAP into the three broad levels as follows:
|
Level 1 |
Investments valued using unadjusted quoted prices in active markets for identical assets. |
|
Level 2 |
Investments valued using other unadjusted observable market inputs, e.g. quoted prices in markets that are not active or quotes for comparable instruments. |
|
Level 3 |
Investments that are valued using quotes and other observable market data to the extent available, but which also take into consideration one or more unobservable inputs that are significant to the valuation taken as a whole. |
54
All Level 3 investments that comprise more than 5% of the investments of the fund are valued by independent third parties.
Revenue Recognition
Interest and dividend income, including PIK income, is recorded on an accrual basis. Origination, structuring, closing, commitment and other upfront fees, including OID, earned with respect to capital commitments are generally amortized or accreted into interest income over the life of the respective debt investment, as are end-of-term or exit fees receivable upon repayment of a debt investment if such fees are fixed in nature. Other fees, including certain amendment fees, prepayment fees and commitment fees on broken deals, and end-of-term or exit fees that have a contingency feature or are variable in nature are recognized as earned. Prepayment fees and similar income due upon the early repayment of a loan or debt security are recognized when earned and are included in interest income.
We may purchase debt investments at a discount to their face value. Discounts on the acquisition of corporate debt instruments are generally amortized using the effective-interest or constant-yield method, unless there are material questions as to collectability.
Net Realized Gains (Losses) and Net Change in Unrealized Appreciation (Depreciation)
We measure realized gains or losses by the difference between the net proceeds from the repayment or sale of an investment and the amortized cost basis of the investment, without regard to unrealized appreciation or depreciation previously recognized. Realized gains and losses are computed using the first in first out method.
Net change in unrealized appreciation or depreciation reflects the net change in portfolio investment values and portfolio investment cost bases during the reporting period, including the reversal of previously recorded unrealized appreciation or depreciation when gains or losses are realized.
55
Portfolio and Investment Activity
The following is a summary of our investment activity for the years ended December 31, 2019 and 2018 (in thousands):
|
Time Period |
|
Acquisitions(1) |
|
|
Dispositions(2) |
|
|
Weighted Average Yield End of Period(3) |
|
|||
|
Quarter ended March 31, 2018 |
|
|
63,220 |
|
|
|
(29,069 |
) |
|
|
14.8 |
% |
|
Quarter ended June 30, 2018 |
|
|
37,927 |
|
|
|
(27,729 |
) |
|
|
11.1 |
% |
|
Quarter ended September 30, 2018 |
|
|
38,969 |
|
|
|
(37,991 |
) |
|
|
11.6 |
% |
|
Quarter ended December 31, 2018 |
|
|
34,849 |
|
|
|
(40,028 |
) |
|
|
12.0 |
% |
|
For the year ended December 31, 2018 |
|
|
174,965 |
|
|
|
(134,817 |
) |
|
|
|
|
|
|
|
|
|
|
|
|
|
|
|
|
|
|
|
Quarter ended March 31, 2019 |
|
|
54,846 |
|
|
|
(59,869 |
) |
|
|
11.3 |
% |
|
Quarter ended June 30, 2019 |
|
|
62,238 |
|
|
|
(37,802 |
) |
|
|
11.4 |
% |
|
Quarter ended September 30, 2019 |
|
|
45,873 |
|
|
|
(44,531 |
) |
|
|
11.0 |
% |
|
Quarter ended December 31, 2019 |
|
|
14,800 |
|
|
|
(9,616 |
) |
|
|
10.8 |
% |
|
For the Year Ended December 31, 2019 |
|
|
177,757 |
|
|
|
(151,818 |
) |
|
|
|
|
|
(1) |
Includes new deals, additional fundings (inclusive of those on revolving credit facilities), refinancings and capitalized PIK income. Investments in short-term securities, including U.S. Treasury Bills and money market mutual funds, were excluded. |
|
(2) |
Includes scheduled principal payments, prepayments, sales and repayments (inclusive of those on revolving credit facilities). Investments in short-term securities, including U.S. Treasury Bills and money market mutual funds, were excluded. |
|
(3) |
Weighted average yield is based upon the stated coupon rate and fair value of outstanding debt securities at the measurement date. Debt securities on non-accrual status are included in the calculation and are treated as having 0.00% as their applicable interest rate for purposes of this calculation, unless such debt securities are valued at zero. |
Portfolio Reconciliation
The following is a reconciliation of the investment portfolio for the years ended December 31, 2019, 2018 and 2017. Investments in short-term securities, including U.S. Treasury Bills and money market mutual funds, are excluded.
|
|
|
For the Year Ended December 31, |
|
|||||||||
|
(in thousands) |
|
2019 |
|
|
2018 |
|
|
2017 |
|
|||
|
Beginning Investment Portfolio |
|
$ |
184,186 |
|
|
$ |
164,870 |
|
|
$ |
154,677 |
|
|
Portfolio Investments acquired(1) |
|
|
177,757 |
|
|
|
174,965 |
|
|
|
199,878 |
|
|
Amortization of premium and accretion of discount, net |
|
|
5,982 |
|
|
|
3,485 |
|
|
|
5,627 |
|
|
Portfolio Investments repaid or sold(2) |
|
|
(151,818 |
) |
|
|
(134,817 |
) |
|
|
(174,983 |
) |
|
Net change in unrealized appreciation (depreciation) on investments |
|
|
(19,792 |
) |
|
|
(26,752 |
) |
|
|
(23,962 |
) |
|
Net realized gain (loss) on investments |
|
|
1,300 |
|
|
|
2,435 |
|
|
|
3,633 |
|
|
Ending Investment Portfolio |
|
$ |
197,615 |
|
|
$ |
184,186 |
|
|
$ |
164,870 |
|
|
(1) |
Includes new investments, additional fundings (inclusive of those on revolving credit facilities), refinancings, and capitalized PIK income. |
|
(2) |
Includes scheduled principal payments, prepayments, sales, and repayments (inclusive of those on revolving credit facilities). |
56
The following table shows the fair value of our portfolio of investments by industry, as of December 31, 2019 and 2018 (in thousands):
|
|
|
As of December 31, |
|
|||||||||||||
|
|
|
2019 |
|
|
2018 |
|
||||||||||
|
Industry |
|
Investments at Fair Value |
|
|
Percentage of Fair Value |
|
|
Investments at Fair Value |
|
|
Percentage of Fair Value |
|
||||
|
Wireless Telecommunications Services |
|
$ |
40,578 |
|
|
|
20.53 |
% |
|
$ |
35,631 |
|
|
|
19.35 |
% |
|
Software Services |
|
|
25,456 |
|
|
|
12.88 |
% |
|
|
15,942 |
|
|
|
8.66 |
% |
|
Food & Staples |
|
|
20,975 |
|
|
|
10.61 |
% |
|
|
8,935 |
|
|
|
4.85 |
% |
|
Internet Media |
|
|
15,923 |
|
|
|
8.06 |
% |
|
|
- |
|
|
|
0.00 |
% |
|
Retail |
|
|
13,470 |
|
|
|
6.82 |
% |
|
|
14,227 |
|
|
|
7.72 |
% |
|
Gaming, Lodging & Restaurants |
|
|
12,127 |
|
|
|
6.14 |
% |
|
|
9,687 |
|
|
|
5.27 |
% |
|
Restaurants |
|
|
11,972 |
|
|
|
6.06 |
% |
|
|
- |
|
|
|
0.00 |
% |
|
Apparel & Textile Products |
|
|
8,744 |
|
|
|
4.42 |
% |
|
|
- |
|
|
|
0.00 |
% |
|
Water Transport |
|
|
8,001 |
|
|
|
4.05 |
% |
|
|
11,889 |
|
|
|
6.45 |
% |
|
Radio Broadcasting |
|
|
7,795 |
|
|
|
3.94 |
% |
|
|
8,807 |
|
|
|
4.78 |
% |
|
Construction Materials Manufacturing |
|
|
7,792 |
|
|
|
3.94 |
% |
|
|
- |
|
|
|
0.00 |
% |
|
Specialty Finance |
|
|
7,726 |
|
|
|
3.91 |
% |
|
|
- |
|
|
|
0.00 |
% |
|
Chemicals |
|
|
6,917 |
|
|
|
3.50 |
% |
|
|
7,601 |
|
|
|
4.13 |
% |
|
Industrial |
|
|
4,200 |
|
|
|
2.13 |
% |
|
|
- |
|
|
|
0.00 |
% |
|
Hotel Operator |
|
|
3,361 |
|
|
|
1.70 |
% |
|
|
3,212 |
|
|
|
1.74 |
% |
|
Real Estate Services |
|
|
2,065 |
|
|
|
1.04 |
% |
|
|
4,479 |
|
|
|
2.43 |
% |
|
Consumer Finance |
|
|
1,050 |
|
|
|
0.53 |
% |
|
|
1,830 |
|
|
|
0.99 |
% |
|
Building Cleaning and Maintenance Services |
|
|
819 |
|
|
|
0.41 |
% |
|
|
18,443 |
|
|
|
10.01 |
% |
|
Maritime Security Services |
|
|
30 |
|
|
|
0.02 |
% |
|
|
34 |
|
|
|
0.02 |
% |
|
Manufacturing |
|
|
- |
|
|
|
0.00 |
% |
|
|
15,575 |
|
|
|
8.46 |
% |
|
Industrial Conglomerates |
|
|
- |
|
|
|
0.00 |
% |
|
|
13,365 |
|
|
|
7.26 |
% |
|
Business Services |
|
|
- |
|
|
|
0.00 |
% |
|
|
9,505 |
|
|
|
5.16 |
% |
|
Technology Services |
|
|
- |
|
|
|
0.00 |
% |
|
|
4,428 |
|
|
|
2.40 |
% |
|
Wireless Communications |
|
|
- |
|
|
|
0.00 |
% |
|
|
596 |
|
|
|
0.32 |
% |
|
Consulting |
|
|
(458 |
) |
|
|
-0.23 |
% |
|
|
- |
|
|
|
0.00 |
% |
|
Telecommunications Services |
|
|
(928 |
) |
|
|
-0.47 |
% |
|
|
- |
|
|
|
0.00 |
% |
|
Total |
|
$ |
197,615 |
|
|
|
99.99 |
% |
|
$ |
184,186 |
|
|
|
100.00 |
% |
Results of Operations
Total Investment Income
|
|
|
For the Year Ended December 31, |
|
|||||||||||||
|
|
|
2019 |
|
|
2018 |
|
||||||||||
|
|
|
In Thousands |
|
|
Per Share(1) |
|
|
In Thousands |
|
|
Per Share(1) |
|
||||
|
Total Investment Income |
|
$ |
27,038 |
|
|
$ |
2.64 |
|
|
$ |
27,754 |
|
|
$ |
2.61 |
|
|
Interest income |
|
|
24,198 |
|
|
|
2.36 |
|
|
|
27,334 |
|
|
|
2.57 |
|
|
Dividend income |
|
|
2,070 |
|
|
|
0.20 |
|
|
|
197 |
|
|
|
0.02 |
|
|
Other income |
|
|
770 |
|
|
|
0.08 |
|
|
|
223 |
|
|
|
0.02 |
|
|
(1) |
The per share amounts are based on a weighted average of 10,249,578 shares for the year ended December 31, 2019 and a weighted average of 10,652,401 shares for the year ended December 31, 2018. |
Investment income consists of interest income, including net amortization of premium and accretion of discount on debt securities, dividend income and other income, which primarily consists of amendment fees on loans. For the years ended years ended December 31, 2019, 2018 and 2017, interest income includes non-cash PIK income of $5.4 million, $8.2 million and $11.7 million, respectively.
57
The decrease in interest income for the year ended December 31, 2019 as compared to the year ended December 31, 2018 is primarily due to the April 2018 restructuring of our investment in Avanti Communications Group plc’s (“Avanti”) third lien senior secured notes (the “Avanti third lien notes”), in which the Avanti third lien notes were converted into Avanti common equity which is currently non-income producing. Additionally, in January 2019 the Tru Taj, LLC (“Tru Taj”) notes were converted to common equity which is currently non-income producing. The Avanti third lien notes and Tru Taj notes accrued approximately $3.7 million and $2.2 million, respectively, of interest income during the year ended December 31, 2018. These decreases were partially offset by increases in interest income related to our investments in Commercial Barge Line Company (“Commercial Barge”) and PFS Holdings Corp. (“PFS”) which earned $3.3 million and $3.2 million, respectively, in interest income for the year ended December 31, 2019 as compared to $1.7 million and $0.8 million, respectively, in interest income for the year ended December 31, 2018.
Dividend income for the year ended December 31, 2019 includes $1.6 million earned from our investment in Prestige Capital Finance, LLC and $0.5 million earned from cash balances invested in short-term investments as compared to $0.2 million in dividend income earned from cash balances invested in short-term investments for the year ended December 31, 2018. The increase in other income for the year ended December 31, 2019 as compared to the year ended December 31, 2018 is primarily attributable to commitment and funding fees received on our investment in Avanti 1.5 lien notes which totaled $0.6 million for the year ended December 31, 2019.
Expenses
|
|
|
For the Year Ended December 31, |
|
|||||||||||||
|
|
|
2019 |
|
|
2018 |
|
||||||||||
|
|
|
In Thousands |
|
|
Per Share(1) |
|
|
In Thousands |
|
|
Per Share(1) |
|
||||
|
Net Operating Expenses |
|
$ |
15,892 |
|
|
$ |
1.55 |
|
|
$ |
12,240 |
|
|
$ |
1.15 |
|
|
Management fees |
|
|
2,953 |
|
|
$ |
0.29 |
|
|
|
2,955 |
|
|
|
0.28 |
|
|
Incentive fees |
|
|
2,735 |
|
|
$ |
0.26 |
|
|
|
165 |
|
|
|
0.02 |
|
|
Total advisory and management fees |
|
$ |
5,688 |
|
|
$ |
0.55 |
|
|
$ |
3,120 |
|
|
$ |
0.29 |
|
|
Administration fees |
|
|
987 |
|
|
|
0.10 |
|
|
|
1,416 |
|
|
|
0.13 |
|
|
Directors’ fees |
|
|
200 |
|
|
|
0.02 |
|
|
|
195 |
|
|
|
0.02 |
|
|
Interest expense |
|
|
7,636 |
|
|
|
0.75 |
|
|
|
5,645 |
|
|
|
0.53 |
|
|
Professional services |
|
|
833 |
|
|
|
0.08 |
|
|
|
1,205 |
|
|
|
0.11 |
|
|
Custody fees |
|
|
57 |
|
|
|
0.01 |
|
|
|
58 |
|
|
|
0.01 |
|
|
Other |
|
|
491 |
|
|
|
0.05 |
|
|
|
601 |
|
|
|
0.06 |
|
|
Income Tax Expense |
|
|
|
|
|
|
|
|
|
|
|
|
|
|
|
|
|
Excise Tax Expense |
|
|
209 |
|
|
|
0.02 |
|
|
|
180 |
|
|
|
0.02 |
|
|
(1) |
The per share amounts are based on a weighted average of 10,249,578 shares for the year ended December 31, 2019 and a weighted average of 10,652,401 shares for the year ended December 31, 2018. |
Operating expenses are largely comprised of advisory fees and administration fees paid to GECM and interest expense on our outstanding notes payable. Advisory fees include management fees and incentive fees calculated in accordance with the Investment Management Agreement, and administration fees, which include direct costs reimbursable to GECM under the Administration Agreement and fees paid for sub-administration services.
Incentive fees for the year ended December 31, 2019 increased as compared to the year ended December 31, 2018 primarily due to the reversal of $2.6 million of incentive fees recorded in prior periods in the year ended December 31, 2018. Our largest investment, Avanti, has generated significant non-cash income in the form of PIK interest. As a result of the debt-for-equity conversion, we have determined that the accrued incentive fees payable associated with the portion of such PIK interest generated by the third lien notes should not at this time be recognized as a liability and as such we have reversed for prior periods. Notwithstanding this reversal, such incentive fees remain payable under the Investment Management Agreement (subject to achievement of return hurdles) and will be recognized as an expense to the extent that an exit or recovery results in gross proceeds to us in excess of our initial cost basis in the third lien notes.
58
The decrease in administration fees for the year ended December 31, 2019 as compared to the year ended December 31, 2018 is primarily attributable to one-time costs associated with staff restructuring at GECM during the year ended December 31, 2018.
Interest expense increased for the year ended December 31, 2019 as compared to the year ended December 31, 2018 primarily due to the issuance of $45.0 million in aggregate principal amount of 6.50% notes due 2024 (the “GECCN Notes”) in June and July 2019, which resulted in a weighted average outstanding debt balance of $103.2 million for the year ended December 31, 2019 as compared to $77.6 million for the year ended December 31, 2018.
Professional services include fees associated with legal, audit and tax services and third-party valuation specialists. The decrease in professional services for the year ended December 31, 2019 as compared to the year ended December 31, 2018 was due to certain one-time costs incurred during the year ended December 31, 2018 including legal fees associated with the sale of investments and professional fees associated with the acquisition of investments, a portion of which was subsequently reversed and capitalized in the current year. Other expenses include various administrative expenses such as shareholder services, filing, transfer agency, printing and insurance costs.
Realized Gain (Loss) on Investments
The following table summarizes our realized gains (losses) resulting from investment activity and purchase accounting.
|
|
|
For the Year Ended December 31, |
|
|||||||||||||
|
|
|
2019 |
|
|
2018 |
|
||||||||||
|
|
|
In Thousands |
|
|
Per Share(1) |
|
|
In Thousands |
|
|
Per Share(1) |
|
||||
|
Net Realized Gain (Loss) |
|
$ |
1,300 |
|
|
$ |
0.13 |
|
|
$ |
2,419 |
|
|
$ |
0.23 |
|
|
Gross realized gain |
|
|
2,130 |
|
|
|
0.21 |
|
|
|
2,685 |
|
|
|
0.25 |
|
|
Gross realized loss |
|
|
(830 |
) |
|
|
(0.08 |
) |
|
|
(266 |
) |
|
|
(0.02 |
) |
|
(1) |
The per share amounts are based on a weighted average of 10,249,578 shares for the year ended December 31, 2019 and a weighted average of 10,652,401 shares for the year ended December 31, 2018. |
During the year ended December 31, 2019, we recognized gross realized gains on the sale of our investments in International Wire Group, Inc. (“International Wire”) and Michael Baker International, LLC secured bonds of $1.1 million and $0.4 million, respectively. In addition, we recognized approximately $0.4 million in realized gain due to the acceleration of discount in connection with paydowns. During the year ended December 31, 2019, gross realized losses were primarily related to the realized loss of $0.8 million on the sale of our investment in Sungard Availability Services Capital, Inc. secured loan.
During the year ended December 31, 2018, we recorded net realized gains of $2.4 million which includes realized gain of approximately $0.7 million on the sale of our first lien senior secured loan to PR Wireless, Inc., net realized gain of approximately $0.6 million on the restructuring and subsequent sale of our investment in Speedwell Holdings and net realized gain of approximately $0.2 million on the exercise of RiceBran Technologies Corporation warrants and the subsequent sale of the common equity received in such exercise.
59
Unrealized Appreciation (Depreciation) on Investments
The following table summarizes the significant unrealized appreciation (depreciation) of our investment portfolio.
|
|
|
For the Year Ended December 31, |
|
|||||||||||||
|
|
|
2019 |
|
|
2018 |
|
||||||||||
|
|
|
In Thousands |
|
|
Per Share(1) |
|
|
In Thousands |
|
|
Per Share(1) |
|
||||
|
Net unrealized appreciation/ (depreciation) |
|
$ |
(19,784 |
) |
|
$ |
(1.93 |
) |
|
$ |
(26,758 |
) |
|
$ |
(2.51 |
) |
|
Unrealized appreciation |
|
|
6,333 |
|
|
|
0.62 |
|
|
|
3,560 |
|
|
|
0.33 |
|
|
Unrealized depreciation |
|
|
(26,117 |
) |
|
|
(2.55 |
) |
|
|
(30,318 |
) |
|
|
(2.85 |
) |
|
(1) |
The per share amounts are based on a weighted average of 10,249,578 shares for the year ended December 31, 2019 and a weighted average of 10,652,401 shares for the year ended December 31, 2018. |
For the year ended December 31, 2019, net unrealized depreciation was primarily driven by our investments in Avanti, Commercial Barge, Tru Taj and PFS, for which we recognized unrealized depreciation of $7.9 million, $4.7 million, $4.2 million and $2.1 million, respectively. The net unrealized depreciation for Avanti and Tru Taj are primarily driven by decreases in the fair value of the investment while net unrealized depreciation for Commercial Barge reflects both a decrease in the fair value of the investment and increase in the cost basis of the investment as a result of the accretion of discount. The fair value of PFS increased as of December 31, 2019 as compared to December 31, 2018, however, the increase in fair value was offset by the increase in cost basis as a result of the accretion of discount. Accretion of discount is reported in interest income.
During the year ended December 31, 2019, we recognized unrealized appreciation of $1.0 million and $0.4 million as result of the sale of our investments in International Wire Group and SESAC Holdco II LLC, respectively. In addition, we recognized unrealized appreciation of $0.7 million, $0.6 million and $0.5 million as a result of increased fair value of our investments in Finastra Holdings Group, Ltd. (“Finastra”), Subcom, LLC, and Mitchel International, Inc., respectively.
For the year ended December 31, 2018, the net unrealized depreciation was primarily the result of a net decrease of $16.8 million related to our investment in Avanti as a result of Avanti’s restructuring, which impacted our costs basis and caused further decreases in fair value through the end of the year. In addition, we had net unrealized depreciation of $5.8 million on our investment in TRU Taj and $1.7 million on our investment in OPS Acquisitions Limited and Ocean Protection Services Limited primarily resulting from decreases in fair value. Further, approximately $0.9 million of the decreases in unrealized depreciation was related to securities which were realized during the year and thus are no longer held in the portfolio.
Please see “Item 7. Management’s Discussion and Analysis of Financial Condition and Results of Operations” in the Company’s Annual Report on Form 10-K for the fiscal year ended December 31, 2018 for a discussion of fiscal year 2017.
Significant Subsidiaries
In accordance with Rules 3-09 and 4-08(g) of Regulation S-X (“S-X”), the Company must determine which of its unconsolidated controlled portfolio companies, if any, are considered to be “significant subsidiaries” under the conditions specified in S-X Rule 1-02(w). The Company determined that PE Facility Solutions, LLC (“PEFS”) and Prestige Capital Finance, LLC (“Prestige”) were significant subsidiaries under at least one of the conditions for the year ended December 31, 2019.
60
On July 31, 2019, we completed the sale of PEFS to Kellermeyer Bergensons Services for $23,750. Unaudited financial information of PEFS as of and for the years ended December 31, 2019 and 2018 and for the period from February 3, 2017 (inception) through December 31, 2017 has been included below (in thousands):
|
|
|
As of December 31, |
|
|||||||||
|
Balance Sheet |
|
2019 |
|
|
2018 |
|
|
2017 |
|
|||
|
Current assets |
|
$ |
1,701 |
|
|
$ |
8,519 |
|
|
$ |
9,986 |
|
|
Noncurrent assets |
|
|
- |
|
|
|
10,938 |
|
|
|
12,209 |
|
|
Total Assets |
|
|
1,701 |
|
|
|
19,457 |
|
|
|
22,195 |
|
|
|
|
|
|
|
|
|
|
|
|
|
|
|
|
Current liabilities |
|
|
1,171 |
|
|
|
7,925 |
|
|
|
8,048 |
|
|
Noncurrent liabilities |
|
|
- |
|
|
|
18,932 |
|
|
|
19,839 |
|
|
Total Liabilities |
|
|
1,171 |
|
|
|
26,857 |
|
|
|
27,887 |
|
|
|
|
|
|
|
|
|
|
|
|
|
|
|
|
Net Equity |
|
$ |
530 |
|
|
$ |
(7,400 |
) |
|
$ |
(5,692 |
) |
|
|
|
For the year ended December 31, |
|
|
For the period February 3, 2017 (inception) through |
|
||||||
|
Statement of Operations |
|
2019 |
|
|
2018 |
|
|
December 31, 2017 |
|
|||
|
Gross Revenues |
|
$ |
34,951 |
|
|
$ |
60,804 |
|
|
$ |
49,888 |
|
|
Cost of Sales |
|
|
(28,306 |
) |
|
|
(49,173 |
) |
|
|
(41,512 |
) |
|
Other income (expense) |
|
|
(9,418 |
) |
|
|
(13,338 |
) |
|
|
(14,068 |
) |
|
Gain on sale of assets |
|
|
10,704 |
|
|
|
- |
|
|
|
- |
|
|
Net Gain from Continuing Operations |
|
$ |
7,931 |
|
|
$ |
(1,707 |
) |
|
$ |
(5,692 |
) |
Audited financial statements for Prestige have been included as an exhibit to this Form 10-K.
Liquidity and Capital Resources
At December 31, 2019, we had approximately $4.6 million of cash and cash equivalents, none of which was restricted in nature. In addition, at December 31, 2019, we had $85.7 million in short term investments such as U.S. Treasury Bills and a money market mutual fund.
At December 31, 2019, we had investments in debt securities of 24 companies, totaling approximately $174.1 million at fair value and equity investments in six companies, totaling approximately $23.5 million at fair value.
In the normal course of business, we may enter into investment agreements under which we commit to make an investment in a portfolio company at some future date or over a specified period of time. As of December 31, 2019, we had approximately $29.8 million in unfunded loan commitments, subject to our approval in certain instances, to provide debt financing to certain of our portfolio companies. We had sufficient cash and other liquid assets on our December 31, 2019 balance sheet to satisfy the unfunded commitments.
From time to time, the Company may seek to repurchase its securities in the open market at prices it deems attractive.
For the year ended December 31, 2019, cash used in operating activities was $24.5 million and consisted primarily of investment purchases of $184.0 million, partially offset by proceeds from sales and principal payments of $162.7 million. Other non-cash activity includes $19.8 million of net unrealized depreciation on investments.
For the year ended December 31, 2018, cash used in operating activities was $30.5 million and consisted primarily of investment purchases of $146.7 million, partially offset by proceeds from sales and principal payments of $123.9 million. Other non-cash activity includes $26.8 million of net unrealized depreciation on investments, which was partially offset by an increase in short term investments of $12.2 million.
61
For the year ended December 31, 2019, cash provided by financing activities was $24.9 million, consisting of $42.7 million in proceeds from the issuance of the GECCN Notes offering (discussed under “—Notes Payable” below), partially offset by $12.8 million in distributions to investors and $5.0 million in repurchases of the Company’s common stock through our stock buyback program.
For the year ended December 31, 2018, cash provided by financing activities was $31.7 million, consisting of $44.4 million in proceeds from the issuance of the GECCM Notes offering (discussed under “—Notes Payable” below), partially offset by $12.7 million in distributions to investors.
Contractual Obligations
|
(in thousands) |
|
Total |
|
|
Less than 1 year |
|
|
1-3 years |
|
|
3-5 years |
|
|
More than 5 years |
|
|||||
|
Contractual Obligations |
|
|
|
|
|
|
|
|
|
|
|
|
|
|
|
|
|
|
|
|
|
GECCL Notes |
|
$ |
32,631 |
|
|
$ |
- |
|
|
$ |
32,631 |
|
|
$ |
- |
|
|
$ |
- |
|
|
GECCM Notes |
|
|
46,398 |
|
|
|
- |
|
|
|
- |
|
|
|
- |
|
|
|
46,398 |
|
|
GECCN Notes |
|
|
45,000 |
|
|
|
- |
|
|
|
- |
|
|
|
45,000 |
|
|
|
- |
|
|
Total |
|
$ |
124,029 |
|
|
$ |
- |
|
|
$ |
32,631 |
|
|
$ |
45,000 |
|
|
$ |
46,398 |
|
Off-Balance Sheet Arrangements
We currently have no off-balance sheet arrangements, including any risk management of commodity pricing or other hedging practices.
Notes Payable
On September 18, 2017, we sold $28.4 million in aggregate principal amount of 6.50% notes due 2022 (the "GECCL Notes"). On September 29, 2017, we sold an additional $4.3 million of the GECCL Notes upon full exercise of the underwriters’ over-allotment option. As a result of the issuance of the GECCL Notes, the aggregate principal balance of the GECCL Notes outstanding is $32.6 million.
The GECCL Notes are our unsecured obligations and rank equal with all of our outstanding and future unsecured unsubordinated indebtedness. The GECCL Notes are effectively subordinated, or junior in right of payment, to any future secured indebtedness that we may incur and structurally subordinated to all future indebtedness and other obligations of our subsidiaries. We pay interest on the GECCL Notes on January 31, April 30, July 31 and October 31 of each year. The GECCL Notes will mature on September 18, 2022 and can be called on, or after, September 18, 2019. Holders of the GECCL Notes do not have the option to have the GECCL Notes repaid prior to the stated maturity date. The GECCL Notes were issued in minimum denominations of $25 and integral multiples of $25 in excess thereof.
On January 11, 2018, we sold $43.0 million in aggregate principal amount of 6.75% notes due 2025 (the "GECCM Notes"). On January 19, 2018 and February 9, 2018, we sold an additional $1.9 million and $1.5 million, respectively, of the GECCM Notes upon partial exercise of the underwriters’ over-allotment option. As a result of the issuance of these additional GECCM Notes, the aggregate principal balance of the GECCM Notes outstanding is $46.4 million.
The GECCM Notes are our unsecured obligations and rank equal with all of our outstanding and future unsecured unsubordinated indebtedness. The GECCM Notes are effectively subordinated, or junior in right of payment, to any future secured indebtedness that we may incur and structurally subordinated to all future indebtedness and other obligations of our subsidiaries. We pay interest on the GECCM Notes on March 31, June 30, September 30 and December 31 of each year. The GECCM Notes will mature on January 31, 2025 and can be called on, or after, January 31, 2021. Holders of the GECCM Notes do not have the option to have the GECCM Notes repaid prior to the stated maturity date. The GECCM Notes were issued in minimum denominations of $25 and integral multiples of $25 in excess thereof.
62
On June 18, 2019, we sold $42.5 million in aggregate principal amount of the GECCN Notes, which included $2.5 million of GECCN Notes sold in connection with the partial exercise of the underwriters’ over-allotment option. On July 5, 2019, we sold an additional $2.5 million of the GECCN Notes upon another partial exercise of the underwriters’ over-allotment option. As a result of the issuance of these additional GECCN Notes, the aggregate principal balance of the GECCN Notes outstanding is $45.0 million.
The GECCN Notes are our unsecured obligations and rank equal with all of our outstanding and future unsecured unsubordinated indebtedness. The GECCN Notes are effectively subordinated, or junior in right of payment, to any future secured indebtedness that we may incur and structurally subordinated to all future indebtedness and other obligations of our subsidiaries. We pay interest on the GECCN Notes on March 31, June 30, September 30 and December 31 of each year beginning September 30, 2019. The GECCN Notes will mature on June 30, 2024 and can be called on, or after, June 30, 2021. Holders of the GECCN Notes do not have the option to have the GECCN Notes repaid prior to the stated maturity date. The GECCN Notes were issued in minimum denominations of $25 and integral multiples of $25 in excess thereof.
Recent Developments
In January 2020:
|
|
• |
we bought $1.1 million of par value of Tensar Corp. first lien term loan at approximately 95% of par value. |
|
|
• |
we bought $2.4 million of par value of Chromaflo second lien term loan at approximately 97% of par value. |
|
|
• |
we sold $3.0 million of par value of Cooke Omega Investments, Inc. first lien notes at approximately 102% of par value. |
|
|
• |
we bought $2.0 million of par value of Viasat Inc. receivable at 90% of par value. |
|
|
• |
we sold $4.0 million of par value of Shearer's Foods, LLC second lien term loan at approximately 100% of par value. |
|
|
• |
we bought $4.4 million of par value of Perforce Software, Inc. first lien revolving loan at approximately 92% of par value. |
|
|
• |
we bought $8.0 million of par value of Greenway Health, LLC first lien revolving loan at 90% of par value. |
In February 2020:
|
|
• |
we sold $15.9 million of par value of Commercial Barge first lien term loan at approximately 34% of par value. |
|
|
• |
we bought $4.0 million of par value of Endurance International first lien revolving loan at 98% of par value. |
|
|
• |
we bought $3.0 million of par value of Chromaflo second lien term loan at approximately 99% of par value. |
In March 2020:
|
|
• |
we sold $2.0 million of par value of Mitchell International, Inc. second lien secured loan at 91% of par value. |
|
|
• |
we sold $4.0 million of par value of Finastra second lien secured loan at 91% of par value. |
|
|
• |
we sold $2.5 million of par value of Peninsula Pacific Entertainment, LLC first lien secured loan at 92% of par value. |
The recent global outbreak of COVID-19 has disrupted economic markets and the economic impact, duration and spread of the COVID-19 virus is uncertain at this time. The operational and financial performance of the portfolio companies in which we make investments may be significantly impacted by COVID-19, which may in turn impact the valuation of our investments.
63
Item 7A. Quantitative and Qualitative Disclosures About Market Risk.
We are subject to financial market risks, including changes in interest rates. As of December 31, 2019, five debt investments in our portfolio bore interest at a fixed rate, and the remaining 23 debt investments were at variable rates, representing approximately $71.9 million and $174.3 million in principal debt, respectively. As of December 31, 2018, six debt investments in our portfolio bore interest at a fixed rate, and the remaining 20 debt investments were at variable rates, representing approximately $74.8 million and $103.2 million in principal debt, respectively. The variable rates are based upon LIBOR.
To illustrate the potential impact of a change in the underlying interest rate on our net investment income, we have assumed a 1%, 2%, and 3% increase and 1%, 2%, and 3% decrease in the underlying LIBOR, and no other change in our portfolio as of December 31, 2019. We have also assumed there are no outstanding floating rate borrowings by the Company. Certain of our investments have an interest rate floor and thus decreases in LIBOR would not always result in a corresponding decrease to our investment income. See the below table for the effect the rate changes would have on net investment income.
|
LIBOR Increase (Decrease) |
|
Increase (decrease) of Net Investment Income |
|
3.00% |
|
$4,319 |
|
2.00% |
|
2,880 |
|
1.00% |
|
1,440 |
|
(1.00)% |
|
(1,304) |
|
(2.00)% |
|
(1,495) |
|
(3.00)% |
|
(1,495) |
Although we believe that this analysis is indicative of our existing interest rate sensitivity at December 31, 2019, it does not adjust for changes in the credit quality, size and composition of our portfolio, and other business developments, including borrowing under a credit facility, that could affect the net increase in net assets resulting from operations. Accordingly, no assurances can be given that actual results would not differ materially from the results under this hypothetical analysis.
We may in the future hedge against interest rate fluctuations by using standard hedging instruments such as futures, options and forward contracts. While hedging activities may insulate us against adverse changes in interest rates, they may also limit our ability to participate in the benefits of lower interest rates with respect to the investments in our portfolio with fixed interest rates.
Item 8. Financial Statements and Supplementary Data.
The financial statements listed in the index to financial statements immediately following the signature page to this report are incorporated herein by reference.
Item 9. Changes in and Disagreements With Accountants on Accounting and Financial Disclosure.
Not applicable.
64
Item 9A. Controls and Procedures.
Evaluation of Disclosure Controls and Procedures
As of December 31, 2019, we, including our Chief Executive Officer and Chief Financial Officer, evaluated the effectiveness of the design and operation of our disclosure controls and procedures (as defined in Rule 13a-15(e) of the Exchange Act). Based on that evaluation, our management, including our Chief Executive Officer and Chief Financial Officer, concluded that our disclosure controls and procedures were effective and provided reasonable assurance that information required to be disclosed in our periodic SEC filings is recorded, processed, summarized and reported within the time periods specified in the SEC’s rules and forms, and that such information is accumulated and communicated to our management, including our Chief Executive Officer and Chief Financial Officer, as appropriate, to allow timely decisions regarding required disclosure. However, in evaluating the disclosure controls and procedures, management recognized that any controls and procedures, no matter how well designed and operated, can provide only reasonable assurance of achieving the desired control objectives, and management necessarily was required to apply its judgment in evaluating the cost-benefit relationship of possible controls and procedures.
Management’s Report on Internal Control Over Financial Reporting
Our Chief Executive Officer and Chief Financial Officer have evaluated the effectiveness of the design and operation of our disclosure controls and procedures (as defined in the Securities Exchange Act of 1934 Rules 13a-15(e) or 15d-15(e)) as of the end of the year covered by this annual report. Based on their evaluation, our Chief Executive Officer and Chief Financial Officer have concluded that these disclosure controls and procedures are effective.
Our management is responsible for establishing and maintaining adequate internal control over financial reporting. The internal control over financial reporting is designed to provide reasonable assurance regarding the reliability of financial reporting and the preparation of financial statements for external purposes in accordance with generally accepted accounting principles. Our internal control over financial reporting includes those policies and procedures that:
|
|
▪ |
Pertain to the maintenance of records that, in reasonable detail, accurately and fairly reflect the transactions and dispositions of the assets of the Company; |
|
|
▪ |
Provide reasonable assurance that transactions are recorded as necessary to permit preparation of financial statements in accordance with generally accepted accounting principles, and that the Company's transactions are being made only in accordance with authorizations of management and; |
|
|
▪ |
Provide reasonable assurance regarding prevention or timely detection of unauthorized acquisition, use or disposition of the Company's assets that could have a material effect on the financial statements. |
Because of its inherent limitations, internal control over financial reporting may not prevent or detect misstatements. Also, projections of any evaluation of effectiveness to future periods are subject to the risk that controls may become inadequate because of changes in conditions, or that the degree of compliance with the policies or procedures may deteriorate.
Our management assessed the effectiveness of our internal control over financial reporting as of December 31, 2019. In making this assessment, management used the framework established in Internal Control — Integrated Framework (2013) issued by the Committee of Sponsoring Organizations of the Treadway Commission ("COSO"). As a result of this assessment and based on the criteria in the COSO framework, management has concluded that, as of December 31, 2019, our internal control over financial reporting was effective.
Management's report was not subject to attestation by the Company's independent registered public accounting firm pursuant to rules of the SEC that permit the Company to provide only management's report in this annual report.
Attestation Report of the Independent Registered Public Accounting Firm
Not applicable.
65
Changes in Internal Controls Over Financial Reporting
Management did not identify any change in the Company’s internal control over financial reporting that occurred during the fourth fiscal quarter of the year ending December 31, 2019 that has materially affected, or is reasonably likely to materially affect, the Company’s internal control over financial reporting.
Not applicable.
66
Item 10. Directors, Executive Officers and Corporate Governance.
The information required by Item 10 will be contained in our 2019 Proxy Statement and is hereby incorporated by reference thereto.
Item 11. Executive Compensation.
The information required by Item 11 will be contained in our 2019 Proxy Statement and is hereby incorporated by reference thereto.
Item 12. Security Ownership of Certain Beneficial Owners and Management and Related Stockholder Matters.
The information required by Item 12 will be contained in our 2019 Proxy Statement and is hereby incorporated by reference thereto.
Item 13. Certain Relationships and Related Transactions, and Director Independence
The information required by Item 13 will be contained in our 2019 Proxy Statement and is hereby incorporated by reference thereto.
Item 14. Principal Accounting Fees and Services.
The information required by Item 14 will be contained in our 2019 Proxy Statement is hereby incorporated by reference thereto.
Item 15. Exhibits, Financial Statement Schedules.
Financial Statements
The financial statements set forth on the index to financial statements immediately following the signature page to this report are incorporated by reference as if set forth herein.
Exhibits
The exhibit index immediately preceding the signature page is incorporated herein by reference.
Financial Statement Schedules
No financial statement schedules are filed herewith because (1) such schedules are not required or (2) the information has been presented in the aforementioned financial statements.
Not applicable.
67
Unless otherwise indicated, all references are to exhibits to the applicable filing by Great Elm Capital Corp. (the “Registrant”) under File No. 814-01211 with the SEC.
|
Exhibit Number |
|
Description |
|
|
|
|
|
2.1 |
|
|
|
|
|
|
|
2.2 |
|
|
|
|
|
|
|
3.1 |
|
|
|
|
|
|
|
3.2 |
|
|
|
|
|
|
|
4.1 |
|
|
|
|
|
|
|
4.2 |
|
|
|
|
|
|
|
4.3 |
|
|
|
|
|
|
|
4.4 |
|
|
|
|
|
|
|
4.5 |
|
|
|
|
|
|
|
4.6 |
|
|
|
|
|
|
|
4.7 |
|
|
|
|
|
|
|
4.8 |
|
|
|
|
|
|
|
4.9 |
|
|
|
|
|
|
|
4.10* |
|
|
|
|
|
|
|
10.1 |
|
|
|
|
|
|
|
10.2 |
|
|
|
|
|
|
|
10.3 |
|
|
|
|
|
|
|
10.4 |
|
|
|
|
|
|
|
10.5 |
|
|
|
|
|
|
|
14.1 |
|
Code of Ethics (incorporated by reference to Exhibit 14.1 to the Form 10-K filed on March 30, 2017) |
|
|
|
|
|
14.2 |
|
68
|
|
|
|
|
21.1* |
|
|
|
|
|
|
|
31.1* |
|
Certification of the Registrant’s Chief Executive Officer (“CEO”) |
|
|
|
|
|
31.2* |
|
Certification of the Registrant’s Chief Financial Officer (“CFO”) |
|
|
|
|
|
32.1* |
|
|
|
|
|
|
|
99.1* |
|
|
|
|
|
|
*Filed herewith
69
Pursuant to the requirements of Section 13 or 15(d) of the Securities Exchange Act of 1934, the registrant has duly caused this report to be signed on its behalf by the undersigned, thereunto duly authorized as of March 19, 2020.
|
|
GREAT ELM CAPITAL CORP. |
|
|
|
|
|
|
|
By: |
/s/ Peter A. Reed |
|
|
Name: |
Peter A. Reed |
|
|
Title: |
Chief Executive Officer |
Pursuant to the requirements of the Securities Exchange Act of 1934, this report has been signed below by the following persons on behalf of the registrant and in the capacities indicated as of March 19, 2020.
|
Name |
|
Capacity |
|
|
|
|
|
/s/ Peter A. Reed |
|
Chief Executive Officer and Director (Principal Executive Officer) |
|
Peter A. Reed |
|
|
|
|
|
|
|
/s/ Keri A. Davis |
|
Chief Financial Officer (Principal Financial Officer and Principal Accounting Officer) |
|
Keri A. Davis |
|
|
|
|
|
|
|
/s/ Randall Revell Horsey |
|
Director |
|
Randall Revell Horsey |
|
|
|
|
|
|
|
/s/ Mark Kuperschmid |
|
Director |
|
Mark Kuperschmid |
|
|
|
|
|
|
|
/s/ Michael C. Speller |
|
Director |
|
Michael C. Speller |
|
|
|
|
|
|
|
/s/ John E. Stuart |
|
Director |
|
John E. Stuart |
|
|
70
INDEX TO CONSOLIDATED FINANCIAL STATEMENTS
F-1
REPORT OF INDEPENDENT REGISTERED PUBLIC ACCOUNTING FIRM
To the Shareholders and Board of Directors of
Great Elm Capital Corp.
Boston, Massachusetts
Opinion on the Financial Statements and Financial Highlights
We have audited the accompanying consolidated statements of assets and liabilities of Great Elm Capital Corp. (the “Company”), including the consolidated schedules of investments, as of December 31, 2019 and 2018, and the related consolidated statements of operations, changes in net assets, and cash flows for each of the three years in the period then ended, and financial highlights (presented in Note 10) for each of the three years in the period ended and the period ended December 31, 2016. and the related notes. In our opinion, the financial statements present fairly, in all material respects, the financial position of the Company as of December 31, 2019 and 2018, and the results of its operations, changes in nets assets, and cash flows, for each of the three years then ended , and financial highlights for each of the three years then ended and the period ended December 31, 2016, in conformity with principles generally accepted in the United States of America.
Basis for Opinion
These financial statements and financial highlights are the responsibility of the Company’s management. Our responsibility is to express an opinion on the Company’s financial statements and financial highlights based on our audits. We are a public accounting firm registered with the Public Company Accounting Oversight Board (United States) (“PCAOB”) and are required to be independent with respect to the Company in accordance with the U.S. federal securities laws and the applicable rules and regulations of the Securities and Exchange Commission and the PCAOB.
We conducted our audits in accordance with the standards of the PCAOB. Those standards require that we plan and perform the audit to obtain reasonable assurance about whether the financial statements and financial highlights are free of material misstatement, whether due to error or fraud. The Company is not required to have, nor were we engaged to perform, an audit of its internal control over financial reporting. As part of our audits we are required to obtain an understanding of internal control over financial reporting but not for the purpose of expressing an opinion on the effectiveness of the Company’s internal control over financial reporting. Accordingly, we express no such opinion.
Our audits included performing procedures to assess the risks of material misstatement of the financial statements and financial highlights, whether due to error or fraud, and performing procedures that respond to those risks. Such procedures included examining, on a test basis, evidence regarding the amounts and disclosures in the financial statements and financial highlights. Our audits also included evaluating the accounting principles used and significant estimates made by management, as well as evaluating the overall presentation of the financial statements and financial highlights. Our procedures included confirmation of investments owned as of December 31, 2019 and 2018, by correspondence with the custodian, loan agents, and borrowers; when replies were not received, we performed other auditing procedures. We believe that our audits provide a reasonable basis for our opinion.
/s/ Deloitte & Touche LLP
McLean, Virginia
March 19, 2020
We have served as the Company’s auditor since 2016.
F-2
CONSOLIDATED STATEMENTS OF ASSETS AND LIABILITIES
Dollar amounts in thousands (except per share amounts)
|
|
|
December 31, 2019 |
|
|
December 31, 2018 |
|
||
|
Assets |
|
|
|
|
|
|
|
|
|
Investments |
|
|
|
|
|
|
|
|
|
Non-affiliated, non-controlled investments, at fair value (amortized cost of $168,269 and $137,852, respectively) |
|
$ |
147,412 |
|
|
$ |
128,318 |
|
|
Non-affiliated, non-controlled short-term investments, at fair value (amortized cost of $85,733 and $78,093, respectively) |
|
|
85,733 |
|
|
|
78,085 |
|
|
Affiliated investments, at fair value (amortized cost of $102,704 and $89,854, respectively) |
|
|
40,608 |
|
|
|
35,665 |
|
|
Controlled investments, at fair value (amortized cost of $10,601 and $20,648, respectively) |
|
|
9,595 |
|
|
|
20,203 |
|
|
Total investments |
|
|
283,348 |
|
|
|
262,271 |
|
|
|
|
|
|
|
|
|
|
|
|
Cash and cash equivalents |
|
|
4,606 |
|
|
|
4,167 |
|
|
Receivable for investments sold |
|
|
- |
|
|
|
10,887 |
|
|
Interest receivable |
|
|
2,350 |
|
|
|
3,255 |
|
|
Dividend receivable |
|
|
14 |
|
|
|
9 |
|
|
Due from portfolio company |
|
|
617 |
|
|
|
555 |
|
|
Due from affiliates |
|
|
15 |
|
|
|
5 |
|
|
Prepaid expenses and other assets |
|
|
89 |
|
|
|
414 |
|
|
Total assets |
|
$ |
291,039 |
|
|
$ |
281,563 |
|
|
|
|
|
|
|
|
|
|
|
|
Liabilities |
|
|
|
|
|
|
|
|
|
Notes payable 6.50% due September 18, 2022 (including unamortized discount of $839 and $1,141, respectively) |
|
$ |
31,792 |
|
|
$ |
31,490 |
|
|
Notes payable 6.75% due January 31, 2025 (including unamortized discount of $1,321 and $1,588, respectively) |
|
|
45,078 |
|
|
|
44,811 |
|
|
Notes payable 6.50% due June 30, 2024 (including unamortized discount of $2,058 and $0, respectively) |
|
|
42,942 |
|
|
|
- |
|
|
Payable for investments purchased |
|
|
72,749 |
|
|
|
84,102 |
|
|
Interest payable |
|
|
354 |
|
|
|
354 |
|
|
Distributions payable |
|
|
1,338 |
|
|
|
3,441 |
|
|
Accrued incentive fees payable |
|
|
8,157 |
|
|
|
5,422 |
|
|
Due to affiliates |
|
|
997 |
|
|
|
1,069 |
|
|
Accrued expenses and other liabilities |
|
|
743 |
|
|
|
758 |
|
|
Total liabilities |
|
$ |
204,150 |
|
|
$ |
171,447 |
|
|
|
|
|
|
|
|
|
|
|
|
Commitments and contingencies (Note 6) |
|
$ |
- |
|
|
$ |
- |
|
|
|
|
|
|
|
|
|
|
|
|
Net Assets |
|
|
|
|
|
|
|
|
|
Common stock, par value $0.01 per share (100,000,000 shares authorized, 10,062,682 shares issued and outstanding and 10,652,401 shares issued and outstanding, respectively) |
|
$ |
101 |
|
|
$ |
107 |
|
|
Additional paid-in capital |
|
|
193,114 |
|
|
|
198,247 |
|
|
Accumulated losses |
|
|
(106,326 |
) |
|
|
(88,238 |
) |
|
Total net assets |
|
$ |
86,889 |
|
|
$ |
110,116 |
|
|
Total liabilities and net assets |
|
$ |
291,039 |
|
|
$ |
281,563 |
|
|
Net asset value per share |
|
$ |
8.63 |
|
|
$ |
10.34 |
|
The accompanying notes are an integral part of these financial statements.
F-3
CONSOLIDATED STATEMENTS OF OPERATIONS
Dollar amounts in thousands (except per share amounts)
|
|
|
For the Year Ended December 31, |
|
|||||||||
|
|
|
2019 |
|
|
2018 |
|
|
2017 |
|
|||
|
Investment Income: |
|
|
|
|
|
|
|
|
|
|
|
|
|
Interest income from: |
|
|
|
|
|
|
|
|
|
|
|
|
|
Non-affiliated, non-controlled investments |
|
$ |
17,087 |
|
|
$ |
16,259 |
|
|
$ |
15,830 |
|
|
Non-affiliated, non-controlled investments (PIK) |
|
|
- |
|
|
|
- |
|
|
|
10,719 |
|
|
Affiliated investments |
|
|
858 |
|
|
|
772 |
|
|
|
73 |
|
|
Affiliated investments (PIK) |
|
|
4,158 |
|
|
|
7,204 |
|
|
|
- |
|
|
Controlled investments |
|
|
1,411 |
|
|
|
2,128 |
|
|
|
1,312 |
|
|
Controlled investments (PIK) |
|
|
684 |
|
|
|
971 |
|
|
|
990 |
|
|
Total interest income |
|
|
24,198 |
|
|
|
27,334 |
|
|
|
28,924 |
|
|
Dividend income from non-affiliated, non-controlled investments |
|
|
|
|
|
|
|
|
|
|
|
|
|
Non-affiliated, non-controlled investments |
|
|
470 |
|
|
|
197 |
|
|
|
298 |
|
|
Controlled investments |
|
|
1,600 |
|
|
|
- |
|
|
|
- |
|
|
Total dividend income |
|
|
2,070 |
|
|
|
197 |
|
|
|
298 |
|
|
Other income from: |
|
|
|
|
|
|
|
|
|
|
|
|
|
Non-affiliated, non-controlled investments |
|
|
142 |
|
|
|
70 |
|
|
|
470 |
|
|
Affiliated investments |
|
|
2 |
|
|
|
92 |
|
|
|
- |
|
|
Affiliated investments (PIK) |
|
|
565 |
|
|
|
- |
|
|
|
- |
|
|
Controlled investments |
|
|
61 |
|
|
|
61 |
|
|
|
36 |
|
|
Total other income |
|
|
770 |
|
|
|
223 |
|
|
|
506 |
|
|
Total investment income |
|
$ |
27,038 |
|
|
$ |
27,754 |
|
|
$ |
29,728 |
|
|
|
|
|
|
|
|
|
|
|
|
|
|
|
|
Expenses: |
|
|
|
|
|
|
|
|
|
|
|
|
|
Management fees |
|
$ |
2,953 |
|
|
$ |
2,955 |
|
|
$ |
2,298 |
|
|
Incentive fees |
|
|
2,735 |
|
|
|
165 |
|
|
|
4,394 |
|
|
Administration fees |
|
|
987 |
|
|
|
1,416 |
|
|
|
1,362 |
|
|
Custody fees |
|
|
57 |
|
|
|
58 |
|
|
|
62 |
|
|
Directors’ fees |
|
|
200 |
|
|
|
195 |
|
|
|
136 |
|
|
Professional services |
|
|
833 |
|
|
|
1,205 |
|
|
|
1,013 |
|
|
Interest expense |
|
|
7,636 |
|
|
|
5,645 |
|
|
|
2,039 |
|
|
Other expenses |
|
|
491 |
|
|
|
601 |
|
|
|
655 |
|
|
Total expenses |
|
|
15,892 |
|
|
|
12,240 |
|
|
|
11,959 |
|
|
Accrued administration fee waiver |
|
|
- |
|
|
|
- |
|
|
|
(70 |
) |
|
Net expenses |
|
$ |
15,892 |
|
|
$ |
12,240 |
|
|
$ |
12,029 |
|
|
Net investment income before taxes |
|
$ |
11,146 |
|
|
$ |
15,514 |
|
|
$ |
17,699 |
|
|
Excise tax |
|
$ |
209 |
|
|
$ |
180 |
|
|
$ |
124 |
|
|
Net investment income |
|
$ |
10,937 |
|
|
$ |
15,334 |
|
|
$ |
17,575 |
|
|
|
|
|
|
|
|
|
|
|
|
|
|
|
|
Net realized and unrealized gains (losses) on investment transactions: |
|
|
|
|
|
|
|
|
|
|||
|
Net realized gain (loss) from: |
|
|
|
|
|
|
|
|
|
|
|
|
|
Non-affiliated, non-controlled investments |
|
$ |
1,146 |
|
|
$ |
2,209 |
|
|
$ |
3,641 |
|
|
Affiliated investments |
|
|
- |
|
|
|
- |
|
|
|
- |
|
|
Controlled investments |
|
|
154 |
|
|
|
210 |
|
|
|
(8 |
) |
|
Total net realized gain (loss) |
|
|
1,300 |
|
|
|
2,419 |
|
|
|
3,633 |
|
|
Net change in unrealized appreciation (depreciation) from: |
|
|
|
|
|
|
|
|
|
|
|
|
|
Non-affiliated, non-controlled investments |
|
|
(11,316 |
) |
|
|
(8,359 |
) |
|
|
(21,078 |
) |
|
Affiliated investments |
|
|
(7,907 |
) |
|
|
(18,535 |
) |
|
|
(2,501 |
) |
|
Controlled investments |
|
|
(561 |
) |
|
|
136 |
|
|
|
(383 |
) |
|
Total net change in unrealized appreciation (depreciation) |
|
|
(19,784 |
) |
|
|
(26,758 |
) |
|
|
(23,962 |
) |
|
Net realized and unrealized gains (losses) |
|
$ |
(18,484 |
) |
|
$ |
(24,339 |
) |
|
$ |
(20,329 |
) |
|
Net increase (decrease) in net assets resulting from operations |
|
$ |
(7,547 |
) |
|
$ |
(9,005 |
) |
|
$ |
(2,754 |
) |
|
|
|
|
|
|
|
|
|
|
|
|
|
|
|
Net investment income per share (basic and diluted): |
|
$ |
1.07 |
|
|
$ |
1.44 |
|
|
$ |
1.52 |
|
|
Earnings per share (basic and diluted): |
|
$ |
(0.74 |
) |
|
$ |
(0.85 |
) |
|
$ |
(0.24 |
) |
|
Weighted average shares outstanding (basic and diluted): |
|
|
10,249,578 |
|
|
|
10,652,401 |
|
|
|
11,655,370 |
|
The accompanying notes are an integral part of these financial statements.
F-4
CONSOLIDATED STATEMENTS OF CHANGES IN NET ASSETS
Dollar amounts in thousands
|
|
|
For the Year Ended December 31, |
|
|||||||||
|
|
|
2019 |
|
|
2018 |
|
|
2017 |
|
|||
|
Increase (decrease) in net assets resulting from operations: |
|
|
|
|
|
|
|
|
|
|
|
|
|
Net investment income |
|
$ |
10,937 |
|
|
$ |
15,334 |
|
|
$ |
17,575 |
|
|
Net realized gain (loss) on investments |
|
|
1,300 |
|
|
|
2,419 |
|
|
|
3,633 |
|
|
Net change in unrealized appreciation (depreciation) on investments |
|
|
(19,784 |
) |
|
|
(26,758 |
) |
|
|
(23,962 |
) |
|
Net increase (decrease) in net assets resulting from operations |
|
|
(7,547 |
) |
|
|
(9,005 |
) |
|
|
(2,754 |
) |
|
|
|
|
|
|
|
|
|
|
|
|
|
|
|
Distributions to stockholders: |
|
|
|
|
|
|
|
|
|
|
|
|
|
Distributions(1) |
|
|
(10,680 |
) |
|
|
(13,166 |
) |
|
|
(13,682 |
) |
|
Total distributions to stockholders |
|
|
(10,680 |
) |
|
|
(13,166 |
) |
|
|
(13,682 |
) |
|
|
|
|
|
|
|
|
|
|
|
|
|
|
|
Capital transactions: |
|
|
|
|
|
|
|
|
|
|
|
|
|
Purchases of common stock |
|
|
(5,000 |
) |
|
|
- |
|
|
|
(24,261 |
) |
|
Net increase (decrease) in net assets resulting from capital transactions |
|
|
(5,000 |
) |
|
|
- |
|
|
|
(24,261 |
) |
|
Total increase (decrease) in net assets |
|
|
(23,227 |
) |
|
|
(22,171 |
) |
|
|
(40,697 |
) |
|
Net assets at beginning of period |
|
$ |
110,116 |
|
|
$ |
132,287 |
|
|
$ |
172,984 |
|
|
Net assets at end of period |
|
$ |
86,889 |
|
|
$ |
110,116 |
|
|
$ |
132,287 |
|
|
|
|
|
|
|
|
|
|
|
|
|
|
|
|
Capital share activity |
|
|
|
|
|
|
|
|
|
|
|
|
|
Shares outstanding at the beginning of the period |
|
|
10,652,401 |
|
|
|
10,652,401 |
|
|
|
12,790,880 |
|
|
Shares purchased |
|
|
(589,719 |
) |
|
|
- |
|
|
|
(2,138,479 |
) |
|
Shares outstanding at the end of the period |
|
|
10,062,682 |
|
|
|
10,652,401 |
|
|
|
10,652,401 |
|
|
(1) |
Distributions were from net investment income for each of the periods presented. |
The accompanying notes are an integral part of these financial statements.
F-5
CONSOLIDATED STATEMENTS OF CASH FLOWS
Dollar amounts in thousands
|
|
|
For the Year Ended December 31, |
|
|||||||||
|
|
|
2019 |
|
|
2018 |
|
|
2017 |
|
|||
|
Cash flows from operating activities |
|
|
|
|
|
|
|
|
|
|
|
|
|
Net increase (decrease) in net assets resulting from operations |
|
$ |
(7,547 |
) |
|
$ |
(9,005 |
) |
|
$ |
(2,754 |
) |
|
Adjustments to reconcile net increase (decrease) in net assets resulting from operations to net cash provided by (used for) operating activities: |
|
|
|
|
|
|
|
|
|
|
|
|
|
Purchases of investments |
|
|
(183,969 |
) |
|
|
(146,707 |
) |
|
|
(143,820 |
) |
|
Net change in short-term investments |
|
|
(7,640 |
) |
|
|
(12,217 |
) |
|
|
(65,892 |
) |
|
Capitalized payment-in-kind interest |
|
|
(5,141 |
) |
|
|
(10,321 |
) |
|
|
(11,709 |
) |
|
Proceeds from sales of investments |
|
|
105,355 |
|
|
|
103,264 |
|
|
|
63,726 |
|
|
Proceeds from principal payments |
|
|
57,350 |
|
|
|
20,678 |
|
|
|
120,652 |
|
|
Net realized (gain) loss on investments |
|
|
(1,300 |
) |
|
|
(2,419 |
) |
|
|
(3,633 |
) |
|
Net change in unrealized (appreciation) depreciation on investments |
|
|
19,784 |
|
|
|
26,758 |
|
|
|
23,962 |
|
|
Amortization of premium and accretion of discount, net |
|
|
(5,982 |
) |
|
|
(3,485 |
) |
|
|
(5,627 |
) |
|
Amortization of discount (premium) on long term debt |
|
|
815 |
|
|
|
657 |
|
|
|
(804 |
) |
|
Increase (decrease) in operating assets and liabilities: |
|
|
|
|
|
|
|
|
|
|
|
|
|
(Increase) decrease in principal receivable |
|
|
- |
|
|
|
- |
|
|
|
786 |
|
|
(Increase) decrease in interest receivable |
|
|
905 |
|
|
|
1,772 |
|
|
|
(689 |
) |
|
(Increase) decrease in dividends receivable |
|
|
(5 |
) |
|
|
- |
|
|
|
- |
|
|
(Increase) decrease in deposit at broker |
|
|
- |
|
|
|
- |
|
|
|
56 |
|
|
(Increase) decrease in due from portfolio company |
|
|
(62 |
) |
|
|
(351 |
) |
|
|
108 |
|
|
(Increase) decrease in due from affiliates |
|
|
(10 |
) |
|
|
687 |
|
|
|
(612 |
) |
|
(Increase) decrease in prepaid expenses and other assets |
|
|
325 |
|
|
|
(121 |
) |
|
|
(195 |
) |
|
Increase (decrease) in interest payable |
|
|
- |
|
|
|
- |
|
|
|
354 |
|
|
Increase (decrease) in due to affiliates |
|
|
2,663 |
|
|
|
298 |
|
|
|
2,770 |
|
|
Increase (decrease) in accrued expenses and other liabilities |
|
|
(15 |
) |
|
|
55 |
|
|
|
(960 |
) |
|
Net cash provided by (used for) operating activities |
|
|
(24,474 |
) |
|
|
(30,457 |
) |
|
|
(24,281 |
) |
|
Cash flows from financing activities |
|
|
|
|
|
|
|
|
|
|
|
|
|
Purchases of common stock |
|
|
(5,000 |
) |
|
|
- |
|
|
|
(24,261 |
) |
|
Repayment of 2020 Notes payable |
|
|
- |
|
|
|
- |
|
|
|
(33,645 |
) |
|
Issuance of Notes payable |
|
|
42,696 |
|
|
|
44,448 |
|
|
|
31,111 |
|
|
Distributions paid |
|
|
(12,783 |
) |
|
|
(12,740 |
) |
|
|
(12,790 |
) |
|
Net cash provided by (used for) financing activities |
|
|
24,913 |
|
|
|
31,708 |
|
|
|
(39,585 |
) |
|
Net increase (decrease) in cash |
|
|
439 |
|
|
|
1,251 |
|
|
|
(63,866 |
) |
|
Cash and cash equivalents, beginning of period |
|
|
4,167 |
|
|
|
2,916 |
|
|
|
66,782 |
|
|
Cash and cash equivalents, end of period |
|
$ |
4,606 |
|
|
$ |
4,167 |
|
|
$ |
2,916 |
|
|
|
|
For the Year Ended December 31, |
|
|||||||||
|
|
|
2019 |
|
|
2018 |
|
|
2017 |
|
|||
|
Supplemental disclosure of non-cash financing activities : |
|
|
|
|
|
|
|
|
|
|
|
|
|
Distributions declared, not yet paid |
|
$ |
1,338 |
|
|
$ |
3,441 |
|
|
$ |
3,015 |
|
|
Supplemental disclosure of cash flow information: |
|
|
|
|
|
|
|
|
|
|
|
|
|
Cash paid for excise tax |
|
$ |
171 |
|
|
$ |
120 |
|
|
$ |
88 |
|
|
Cash paid for interest |
|
|
6,821 |
|
|
|
5,088 |
|
|
|
2,489 |
|
The accompanying notes are an integral part of these financial statements.
F-6
CONSOLIDATED SCHEDULE OF INVESTMENTS
December 31, 2019
Dollar amounts in thousands
|
Portfolio Company |
Industry |
|
Security(1) |
|
Notes |
|
Interest Rate(2) |
|
Initial Acquisition Date |
|
Maturity |
|
Par Amount / Quantity |
|
|
Cost |
|
|
Fair Value |
|
|||
|
Investments at Fair Value |
|
|
|
|
|
|
|
|
|
|
|
|
|
|
|
|
|
|
|
|
|
|
|
|
APTIM Corp. |
Industrial |
|
1st Lien, Secured Bond |
|
11 |
|
7.75% |
|
03/28/2019 |
|
06/15/2025 |
|
|
7,000 |
|
|
|
5,629 |
|
|
|
4,200 |
|
|
ASP Chromaflo Technologies Corp. |
Chemicals |
|
2nd Lien Secured Loan |
|
5 |
|
1M L + 8.00%, 9.00% Floor (9.80%) |
|
08/12/2019 |
|
11/18/2024 |
|
|
6,992 |
|
|
|
6,763 |
|
|
|
6,917 |
|
|
Avanti Communications Group PLC |
Wireless Telecommunications Services |
|
1.5 Lien, Secured Bond |
|
4, 5, 6, 10, 11, 12 |
|
12.50% |
|
05/24/2019 |
|
05/24/2021 |
|
|
8,413 |
|
|
|
8,413 |
|
|
|
8,413 |
|
|
Avanti Communications Group PLC |
Wireless Telecommunications Services |
|
1.5 Lien, Secured Bond - Unfunded |
|
4, 5, 6, 10, 11, 12 |
|
12.50% |
|
05/24/2019 |
|
05/24/2021 |
|
|
- |
|
|
|
- |
|
|
|
- |
|
|
Avanti Communications Group PLC |
Wireless Telecommunications Services |
|
2nd Lien, Secured Bond |
|
4, 5, 6, 10, 11 |
|
9.00% |
|
11/03/2016 |
|
10/01/2022 |
|
|
42,467 |
|
|
|
39,391 |
|
|
|
29,812 |
|
|
Avanti Communications Group PLC |
Wireless Telecommunications Services |
|
Common Equity |
|
4, 5, 7, 10 |
|
n/a |
|
11/03/2016 |
|
n/a |
|
|
196,086,410 |
|
|
|
50,660 |
|
|
|
2,353 |
|
|
Best Western Luling |
Hotel Operator |
|
1st Lien, Secured Loan |
|
5, 8, 9 |
|
1ML + 12.00%, 12.25% Floor (0.00%) |
|
11/03/2016 |
|
12/18/2017 |
|
|
2,715 |
|
|
|
1,300 |
|
|
|
3,361 |
|
|
Boardriders, Inc. |
Apparel & Textile Products |
|
1st Lien, Secured Loan |
|
5 |
|
3M L + 6.50%, 7.50% Floor (8.30%) |
|
03/28/2019 |
|
04/06/2024 |
|
|
8,962 |
|
|
|
8,819 |
|
|
|
8,744 |
|
|
California Pizza Kitchen, Inc. |
Restaurants |
|
1st Lien, Secured Loan |
|
|
|
3M L + 6.00%, 7.00% Floor (7.91%) |
|
03/26/2019 |
|
08/23/2022 |
|
|
9,923 |
|
|
|
9,671 |
|
|
|
8,524 |
|
|
California Pizza Kitchen, Inc. |
Restaurants |
|
2nd Lien Secured Loan |
|
5 |
|
3M L + 10.00%, 11.00% Floor (11.91%) |
|
07/17/2019 |
|
08/23/2023 |
|
|
4,300 |
|
|
|
4,080 |
|
|
|
3,448 |
|
|
Commercial Barge Line Company |
Water Transport |
|
1st Lien, Secured Loan |
|
|
|
3M L + 8.75%, 9.75% Floor (10.68%) |
|
05/17/2017 |
|
11/12/2020 |
|
|
15,883 |
|
|
|
14,315 |
|
|
|
8,001 |
|
|
Cooke Omega Investments, Inc. |
Food & Staples |
|
Bond |
|
|
|
8.50% |
|
09/19/2019 |
|
12/15/2022 |
|
|
3,000 |
|
|
|
2,927 |
|
|
|
3,022 |
|
|
Davidzon Radio, Inc. |
Radio Broadcasting |
|
1st Lien, Secured Loan |
|
5, 9 |
|
1ML + 10.00%, 11.00% Floor (14.70%) |
|
11/03/2016 |
|
03/31/2020 |
|
|
8,962 |
|
|
|
8,903 |
|
|
|
7,795 |
|
|
Duff & Phelps |
Consulting |
|
1st Lien Revolver |
|
|
|
3M L + 3.25%, 3.25% Floor (5.16%) |
|
09/09/2019 |
|
02/13/2022 |
|
|
- |
|
|
|
(438 |
) |
|
|
- |
|
|
Duff & Phelps |
Consulting |
|
1st Lien Revolver - Unfunded |
|
|
|
1M L + 3.25%, 3.25% Floor (5.29%) |
|
09/09/2019 |
|
02/13/2022 |
|
|
5,000 |
|
|
|
- |
|
|
|
(458 |
) |
|
The Finance Company |
Consumer Finance |
|
1st Lien, Secured Revolver |
|
3, 5 |
|
1M L + 11.00%, 11.50% Floor (12.70%) |
|
11/03/2016 |
|
07/02/2020 |
|
|
806 |
|
|
|
806 |
|
|
|
806 |
|
|
The Finance Company |
Consumer Finance |
|
1st Lien, Secured Revolver - Unfunded |
|
3, 5 |
|
1M L + 11.00%, 11.50% Floor (13.09%) |
|
11/03/2016 |
|
07/02/2020 |
|
|
194 |
|
|
|
- |
|
|
|
- |
|
|
The Finance Company |
Consumer Finance |
|
1st Lien Secured Loan B |
|
3, 5 |
|
Consumer Finance + 0.00%, 3, 5 (0.00%) |
|
06/08/2018 |
|
07/02/2020 |
|
|
1,491 |
|
|
|
1,491 |
|
|
|
244 |
|
|
The Finance Company |
Consumer Finance |
|
Common Equity |
|
3, 5, 7 |
|
n/a |
|
06/08/2018 |
|
n/a |
|
|
288 |
|
|
|
- |
|
|
|
- |
|
F-7
|
Software Services |
|
2nd Lien, Secured Loan |
|
10 |
|
3M L + 7.25%, 8.25% Floor (9.45%) |
|
12/14/2017 |
|
06/13/2025 |
|
|
14,000 |
|
|
|
13,353 |
|
|
|
13,655 |
|
|
|
Full House Resorts, Inc. |
Gaming, Lodging & Restaurants |
|
1st Lien, Secured Note |
|
5, 11 |
|
3M L + 7.00%, 8.00% Floor (8.94%) |
|
02/02/2018 |
|
02/02/2024 |
|
|
9,800 |
|
|
|
9,656 |
|
|
|
9,657 |
|
|
Mitchell International, Inc. |
Software Services |
|
2nd Lien Secured Loan |
|
5 |
|
1M L + 7.25%, 8.00% Floor (9.05%) |
|
08/02/2019 |
|
11/30/2025 |
|
|
12,000 |
|
|
|
11,302 |
|
|
|
11,801 |
|
|
OPS Acquisitions Limited and Ocean Protection Services Limited |
Maritime Security Services |
|
1st Lien, Secured Loan |
|
4, 5, 8, 10 |
|
1M L + 12.00%, 12.50% Floor (0.00%) |
|
11/03/2016 |
|
06/01/2018 |
|
|
4,903 |
|
|
|
4,240 |
|
|
|
30 |
|
|
OPS Acquisitions Limited and Ocean Protection Services Limited |
Maritime Security Services |
|
Common Equity |
|
4, 5, 7, 10 |
|
n/a |
|
11/03/2016 |
|
n/a |
|
|
- |
|
|
|
- |
|
|
|
- |
|
|
PE Facility Solutions, LLC |
Building Cleaning and Maintenance Services |
|
1st Lien, Secured Loan B |
|
3, 5, 6, 8 |
|
1M L + 14.00%, (0.00%) |
|
02/28/2017 |
|
02/27/2022 |
|
|
838 |
|
|
|
838 |
|
|
|
819 |
|
|
PE Facility Solutions, LLC |
Building Cleaning and Maintenance Services |
|
Common Equity |
|
3, 5, 7 |
|
n/a |
|
02/28/2017 |
|
n/a |
|
|
- |
|
|
|
- |
|
|
|
- |
|
|
PEAKS Trust 2009-1 |
Consumer Finance |
|
1st Lien, Secured Note |
|
5, 8, 10 |
|
1M L + 5.50%, 7.50% Floor (0.00%) |
|
11/03/2016 |
|
01/27/2020 |
|
|
940 |
|
|
|
849 |
|
|
|
- |
|
|
Peninsula Pacific Entertainment, LLC |
Gaming, Lodging & Restaurants |
|
1st Lien, Secured Loan |
|
5 |
|
3M L + 7.25%, 7.25% Floor (9.19%) |
|
06/27/2019 |
|
11/13/2024 |
|
|
2,500 |
|
|
|
2,505 |
|
|
|
2,470 |
|
|
PFS Holdings Corp. |
Food & Staples |
|
1st Lien, Secured Loan |
|
5 |
|
3M L + 3.50%, 4.50% Floor (5.41%) |
|
07/09/2018 |
|
01/31/2021 |
|
|
14,821 |
|
|
|
11,735 |
|
|
|
9,054 |
|
|
Prestige Capital Finance, LLC (fka Prestige Capital Corporation) |
Specialty Finance |
|
Common Equity |
|
3, 5, 10 |
|
n/a |
|
02/08/2019 |
|
n/a |
|
|
- |
|
|
|
7,466 |
|
|
|
7,726 |
|
|
Research Now Group, Inc. |
Internet Media |
|
1st Lien, Secured Revolver |
|
5 |
|
3M L + 4.50%, 4.50% Floor (6.41%) |
|
01/29/2019 |
|
12/20/2022 |
|
|
4,316 |
|
|
|
3,696 |
|
|
|
4,316 |
|
|
Research Now Group, Inc. |
Internet Media |
|
1st Lien, Secured Revolver - Unfunded |
|
5 |
|
3M L + 4.50%, 4.50% Floor (6.75%) |
|
01/29/2019 |
|
12/20/2022 |
|
|
5,684 |
|
|
|
- |
|
|
|
(334 |
) |
|
Research Now Group, Inc. |
Internet Media |
|
2nd Lien, Secured Loan |
|
5 |
|
3M L + 9.50%, 10.50% Floor (11.41%) |
|
05/20/2019 |
|
12/20/2025 |
|
|
12,000 |
|
|
|
11,951 |
|
|
|
11,941 |
|
|
Shearer's Foods, LLC |
Food & Staples |
|
2nd Lien, Secured Loan |
|
|
|
1M L + 6.75%, 7.75% Floor (8.55%) |
|
06/17/2019 |
|
06/30/2022 |
|
|
9,000 |
|
|
|
8,955 |
|
|
|
8,899 |
|
|
Subcom, LLC |
Telecommunications Services |
|
1st Lien, Secured Revolver |
|
5 |
|
3M L + 5.00%, 5.00% Floor (6.91%) |
|
11/21/2019 |
|
11/02/2023 |
|
|
- |
|
|
|
(1,525 |
) |
|
|
- |
|
|
Subcom, LLC |
Telecommunications Services |
|
1st Lien, Secured Revolver - Unfunded |
|
5 |
|
3M L + 5.00%, 5.00% Floor (6.91%) |
|
11/21/2019 |
|
11/02/2023 |
|
|
10,000 |
|
|
|
- |
|
|
|
(928 |
) |
|
Tallage Davis, LLC |
Real Estate Services |
|
1st Lien, Secured Loan |
|
5 |
|
11.00% |
|
03/20/2018 |
|
01/26/2023 |
|
|
2,065 |
|
|
|
2,065 |
|
|
|
2,065 |
|
|
Tallage Davis, LLC |
Real Estate Services |
|
1st Lien, Secured Loan - Unfunded |
|
5 |
|
11.00% |
|
03/20/2018 |
|
01/26/2023 |
|
|
8,910 |
|
|
|
- |
|
|
|
- |
|
|
Tensar Corp. |
Construction Materials Manufacturing |
|
1st Lien, Secured Loan |
|
|
|
3M L + 4.75%, 5.75% Floor (6.69%) |
|
06/27/2019 |
|
07/10/2021 |
|
|
8,223 |
|
|
|
7,903 |
|
|
|
7,792 |
|
|
TRU (UK) Asia Limited |
Retail |
|
Common Equity |
|
5, 7, 10 |
|
n/a |
|
07/21/2017 |
|
n/a |
|
|
776,954 |
|
|
|
22,132 |
|
|
|
11,996 |
|
|
TRU (UK) Asia Limited Liquidating Trust |
Retail |
|
Common Equity |
|
5, 7 |
|
n/a |
|
07/21/2017 |
|
n/a |
|
|
16,000 |
|
|
|
1,723 |
|
|
|
1,474 |
|
|
Total Investments excluding Short-Term Investments (227.43% of Net Assets) |
|
|
|
|
|
|
|
|
|
|
281,574 |
|
|
|
197,615 |
|
|||||||
|
Short-Term Investments |
|
|
|
|
|
|
|
|
|
|
|
|
|
|
|
|
|
|
|
|
|
|
|
|
State Street Institutional Treasury Money Market Fund |
|
|
Premier Class |
|
|
|
n/a |
|
|
|
n/a |
|
|
11,022,134 |
|
|
|
11,022 |
|
|
|
11,022 |
|
F-8
|
|
|
Treasury Bill |
|
|
|
0% |
|
|
|
04/02/2020 |
|
|
75,000 |
|
|
|
74,711 |
|
|
|
74,711 |
|
|
|
Total Short-Term Investments (98.67% of Net Assets) |
|
|
|
|
|
|
|
|
|
|
|
|
|
|
85,733 |
|
|
|
85,733 |
|
|||
|
TOTAL INVESTMENTS(13) (326.1% of Net Assets) |
|
|
|
|
|
|
|
|
|
|
|
|
|
$ |
367,307 |
|
|
$ |
283,348 |
|
|||
|
Other Liabilities in Excess of Assets (226.1% of Net Assets) |
|
|
|
|
|
|
|
|
|
|
|
|
|
|
|
|
|
$ |
(196,459 |
) |
|||
|
NET ASSETS |
|
|
|
|
|
|
|
|
|
|
|
|
|
|
|
|
|
$ |
86,889 |
|
|||
|
|
(1) |
The Company’s investments are generally acquired in private transactions exempt from registration under the Securities Act of 1933 and, therefore, are generally subject to limitations on resale, and may be deemed to be “restricted securities’’ under the Securities Act of 1933. |
|
|
(2) |
A majority of the Company’s variable rate debt investments bear interest at a rate that is determined by reference to London Interbank Offered Rate (‘‘LIBOR” or “L”) and which is reset daily, monthly, quarterly or semiannually. For each debt investment, the Company has provided the interest rate in effect as of period end. If no reference to LIBOR is made, the rate is fixed. A floor is the minimum rate that will be applied in calculating an interest rate. A cap is the maximum rate that will be applied in calculating an interest rate. The one month (“1M”) LIBOR as of period end was 1.76%. The three month (“3M”) LIBOR as of period end was 1.91%. |
|
|
(3) |
‘‘Controlled Investments’’ are investments in those companies that are ‘‘Controlled Investments’’ of the Company, as defined in the Investment Company Act. A company is deemed to be a ‘‘Controlled Investment’’ of the Company if the Company owns more than 25% of the voting securities of such company. |
|
|
(4) |
‘‘Affiliate Investments’’ are investments in those companies that are ‘‘Affiliated Companies’’ of the Company, a defined in the Investment Company Act, which are not ‘‘Controlled Investments.’’ A company is deemed to be an ‘‘Affiliate’’ of the Company if the Company owns 5% or more, but less than 25%, of the voting securities of such company. |
|
|
(5) |
Investments classified as Level 3 whereby fair value was determined by the Company's board of directors. |
|
|
(6) |
Security pays, or has the option to pay, all of its interest in kind. |
|
|
(7) |
Non-income producing security. |
|
|
(8) |
Investment was on non-accrual status as of period end. |
|
|
(9) |
The interest rate on these loans includes a default interest rate. |
|
|
(10) |
Indicates assets that the Company believes do not represent ‘‘qualifying assets’’ under Section 55(a) of the Investment Company Act. Qualifying assets must represent at least 70% of the Company’s total assets at the time of acquisition of any additional non-qualifying assets. Of the Company’s total assets, 25.4% were non-qualifying assets as of period end. |
|
|
(11) |
Security exempt from registration pursuant to Rule 144A under the Securities Act of 1933. Such security may be sold in certain transactions (normally to qualified institutional buyers) and remain exempt from registration. |
|
|
(12) |
As of period end, the aggregate gross unrealized appreciation for all securities in which there was an excess of value over tax cost was $3,357; the aggregate gross unrealized depreciation for all securities in which there was an excess of tax cost over value was $70,638; the net unrealized depreciation was $(67,281); the aggregate cost of securities for Federal income tax purposes was $350,629. |
F-9
As of December 31, 2019, the Company’s investments consisted of the following investment types:
|
Investment Type |
|
Investments at Fair Value |
|
|
Percentage of Net Assets |
|
||
|
Debt |
|
$ |
174,066 |
|
|
|
200.33 |
% |
|
Equity/Other |
|
|
23,549 |
|
|
|
27.10 |
% |
|
Short-Term Investments |
|
|
85,733 |
|
|
|
98.67 |
% |
|
Total |
|
$ |
283,348 |
|
|
|
326.10 |
% |
As of December 31, 2019, the industry composition of the Company’s portfolio at fair value was as follows:
|
Industry |
|
|
|
Investments at Fair Value |
|
|
Percentage of Net Assets |
|
||
|
Wireless Telecommunications Services |
|
|
|
$ |
40,578 |
|
|
|
46.70 |
% |
|
Software Services |
|
|
|
|
25,456 |
|
|
|
29.30 |
% |
|
Food & Staples |
|
|
|
|
20,975 |
|
|
|
24.14 |
% |
|
Internet Media |
|
|
|
|
15,923 |
|
|
|
18.33 |
% |
|
Retail |
|
|
|
|
13,470 |
|
|
|
15.50 |
% |
|
Gaming, Lodging & Restaurants |
|
|
|
|
12,127 |
|
|
|
13.96 |
% |
|
Restaurants |
|
|
|
|
11,972 |
|
|
|
13.78 |
% |
|
Apparel & Textile Products |
|
|
|
|
8,744 |
|
|
|
10.06 |
% |
|
Water Transport |
|
|
|
|
8,001 |
|
|
|
9.21 |
% |
|
Radio Broadcasting |
|
|
|
|
7,795 |
|
|
|
8.97 |
% |
|
Construction Materials Manufacturing |
|
|
|
|
7,792 |
|
|
|
8.97 |
% |
|
Specialty Finance |
|
|
|
|
7,726 |
|
|
|
8.89 |
% |
|
Chemicals |
|
|
|
|
6,917 |
|
|
|
7.96 |
% |
|
Industrial |
|
|
|
|
4,200 |
|
|
|
4.83 |
% |
|
Hotel Operator |
|
|
|
|
3,361 |
|
|
|
3.87 |
% |
|
Real Estate Services |
|
|
|
|
2,065 |
|
|
|
2.38 |
% |
|
Consumer Finance |
|
|
|
|
1,050 |
|
|
|
1.21 |
% |
|
Building Cleaning and Maintenance Services |
|
|
|
|
819 |
|
|
|
0.94 |
% |
|
Maritime Security Services |
|
|
|
|
30 |
|
|
|
0.03 |
% |
|
Consulting |
|
|
|
|
(458 |
) |
|
|
(0.53 |
)% |
|
Telecommunications Services |
|
|
|
|
(928 |
) |
|
|
(1.07 |
)% |
|
Short-Term Investments |
|
|
|
|
85,733 |
|
|
|
98.67 |
% |
|
Total |
|
|
|
$ |
283,348 |
|
|
|
326.10 |
% |
F-10
As of December 31, 2019, the geographic composition of the Company’s portfolio at fair value was as follows:
|
Geography |
|
Investments at Fair Value |
|
|
Percentage of Net Assets |
|
||
|
United States |
|
$ |
251,153 |
|
|
|
289.05 |
% |
|
United Kingdom |
|
|
32,195 |
|
|
|
37.05 |
% |
|
Total |
|
$ |
283,348 |
|
|
|
326.10 |
% |
The accompanying notes are an integral part of these financial statements.
F-11
CONSOLIDATED SCHEDULE OF INVESTMENTS
December 31, 2018
Dollar amounts in thousands
|
Portfolio Company |
|
Industry |
|
Security(1) |
|
Notes |
|
Interest Rate(2) |
|
Initial Acquisition Date |
|
Maturity |
|
Par Amount / Quantity |
|
|
Cost |
|
|
Fair Value |
|
|||
|
Investments at Fair Value |
|
|
|
|
|
|
|
|
|
|
|
|
|
|
|
|
|
|
|
|
|
|
|
|
|
Aptean Holdings, Inc. |
|
Software Services |
|
2nd Lien, Secured Loan |
|
5 |
|
3M L + 9.50%, 10.50% Floor (12.31%) |
|
03/27/2018 |
|
12/20/2023 |
|
|
4,010 |
|
|
|
4,052 |
|
|
|
4,010 |
|
|
Avanti Communications Group PLC |
|
Wireless Telecommunications Services |
|
2nd Lien, Secured Bond |
|
4, 5, 10, 11 |
|
9.00% |
|
11/03/2016 |
|
10/01/2022 |
|
|
38,888 |
|
|
|
34,954 |
|
|
|
29,400 |
|
|
Avanti Communications Group PLC |
|
Wireless Telecommunications Services |
|
Common Equity |
|
4, 7, 10 |
|
n/a |
|
11/03/2016 |
|
n/a |
|
|
196,086,410 |
|
|
|
50,660 |
|
|
|
6,231 |
|
|
Best Western Luling (fka Luling Lodging, LLC) |
|
Hotel Operator |
|
1st Lien, Secured Loan |
|
5, 8, 9 |
|
1M L + 12.00%, 12.25% Floor (0.00%) |
|
11/03/2016 |
|
12/18/2017 |
|
|
2,715 |
|
|
|
1,300 |
|
|
|
3,212 |
|
|
Commercial Barge Line Company |
|
Water Transport |
|
1st Lien, Secured Loan |
|
|
|
1M L + 8.75%, 9.75% Floor (11.27%) |
|
05/17/2017 |
|
11/12/2020 |
|
|
16,605 |
|
|
|
13,496 |
|
|
|
11,889 |
|
|
Davidzon Radio, Inc. |
|
Radio Broadcasting |
|
1st Lien, Secured Loan |
|
5, 9 |
|
1M L + 10.00%, 11.00% Floor (15.35%) |
|
11/03/2016 |
|
03/31/2020 |
|
|
9,270 |
|
|
|
8,967 |
|
|
|
8,807 |
|
|
The Finance Company |
|
Consumer Finance |
|
1st Lien, Secured Revolver |
|
3, 5 |
|
1M L + 11.00%, 11.50% Floor (13.35%) |
|
11/03/2016 |
|
07/02/2020 |
|
|
959 |
|
|
|
959 |
|
|
|
959 |
|
|
The Finance Company |
|
Consumer Finance |
|
1st Lien, Secured Revolver - Unfunded |
|
3, 5 |
|
1M L + 11.00%, 11.50% Floor (13.35%) |
|
11/03/2016 |
|
07/02/2020 |
|
|
41 |
|
|
|
- |
|
|
|
- |
|
|
The Finance Company |
|
Consumer Finance |
|
1st Lien Secured Term Loan B |
|
3, 5 |
|
1M L + 11.00%, 11.50% Floor (13.35%) |
|
06/08/2018 |
|
07/02/2020 |
|
|
1,491 |
|
|
|
1,491 |
|
|
|
801 |
|
|
The Finance Company |
|
Consumer Finance |
|
Equity |
|
3, 5, 7 |
|
n/a |
|
06/08/2018 |
|
n/a |
|
|
288,000 |
|
|
|
- |
|
|
|
- |
|
|
Finastra Group Holdings, Ltd. (fka Almonde, Inc.) |
|
Software Services |
|
2nd Lien, Secured Loan |
|
10 |
|
3M L + 7.25%, 8.25% floor (10.05%) |
|
12/14/2017 |
|
06/13/2025 |
|
|
13,000 |
|
|
|
12,373 |
|
|
|
11,932 |
|
|
Full House Resorts, Inc. |
|
Gaming, Lodging & Restaurants |
|
1st Lien Secured Note |
|
5 |
|
3M L + 7.00%, 8.00% Floor (9.80%) |
|
02/02/2018 |
|
02/02/2024 |
|
|
9,900 |
|
|
|
9,726 |
|
|
|
9,687 |
|
|
Geo Specialty Chemicals, Inc. |
|
Chemicals |
|
1st Lien, Secured Revolver |
|
5 |
|
3M L + 4.75%, 5.75% Floor (7.13%) |
|
09/28/2017 |
|
04/30/2019 |
|
|
3,792 |
|
|
|
3,739 |
|
|
|
3,761 |
|
|
Geo Specialty Chemicals, Inc. |
|
Chemicals |
|
1st Lien, Secured Revolver - Unfunded |
|
5 |
|
3M L + 4.75%, 5.75% Floor (7.13%) |
|
09/28/2017 |
|
04/30/2019 |
|
|
583 |
|
|
|
- |
|
|
|
(5 |
) |
|
Geo Specialty Chemicals, Inc. |
|
Chemicals |
|
1st Lien, Secured Loan |
|
5 |
|
3M L + 4.75%, 5.75% Floor (7.46%) |
|
09/28/2017 |
|
04/30/2019 |
|
|
3,875 |
|
|
|
3,828 |
|
|
|
3,845 |
|
|
International Wire Group, Inc. |
|
Manufacturing |
|
2nd Lien, Secured Bond |
|
11 |
|
10.75% |
|
09/19/2017 |
|
08/01/2021 |
|
|
17,500 |
|
|
|
16,616 |
|
|
|
15,575 |
|
|
Michael Baker International, LLC |
|
Industrial Conglomerates |
|
2nd Lien, Secured Bond |
|
11 |
|
8.75% |
|
12/31/2017 |
|
03/01/2023 |
|
|
13,500 |
|
|
|
13,105 |
|
|
|
13,365 |
|
|
OPS Acquisitions Limited and Ocean Protection Services Limited |
|
Maritime Security Services |
|
1st Lien, Secured Loan |
|
4, 5, 8, 10 |
|
1M L + 12.00%, 12.50% Floor (0.00%) |
|
11/03/2016 |
|
06/01/2018 |
|
|
4,903 |
|
|
|
4,240 |
|
|
|
34 |
|
|
OPS Acquisitions Limited and Ocean Protection Services Limited |
|
Maritime Security Services |
|
Common Equity |
|
4, 5, 7, 10 |
|
n/a |
|
11/03/2016 |
|
n/a |
|
|
19 |
|
|
|
- |
|
|
|
- |
|
F-12
|
|
Building Cleaning and Maintenance Services |
|
1st Lien, Secured Revolver |
|
3, 5 |
|
1M L + 9.00% (11.35%) |
|
02/28/2017 |
|
02/27/2022 |
|
|
1,948 |
|
|
$ |
1,948 |
|
|
$ |
1,948 |
|
|
|
PE Facility Solutions, LLC |
|
Building Cleaning and Maintenance Services |
|
1st Lien, Secured Revolver - Unfunded |
|
3, 5 |
|
1M L + 9.00% (11.35%) |
|
02/28/2017 |
|
02/27/2022 |
|
|
4,052 |
|
|
|
- |
|
|
|
- |
|
|
PE Facility Solutions, LLC |
|
Building Cleaning and Maintenance Services |
|
1st Lien, Secured Loan A |
|
3, 5 |
|
1M L + 11.00% (13.35%) |
|
02/28/2017 |
|
02/27/2022 |
|
|
9,800 |
|
|
|
9,800 |
|
|
|
9,800 |
|
|
PE Facility Solutions, LLC |
|
Building Cleaning and Maintenance Services |
|
1st Lien, Secured Loan B |
|
3, 5, 6 |
|
1M L + 14.00% (16.35%) |
|
02/28/2017 |
|
02/27/2022 |
|
|
6,695 |
|
|
|
6,450 |
|
|
|
6,695 |
|
|
PE Facility Solutions, LLC |
|
Building Cleaning and Maintenance Services |
|
Common Equity |
|
3, 5, 7 |
|
n/a |
|
02/28/2017 |
|
n/a |
|
|
1 |
|
|
|
- |
|
|
|
- |
|
|
PEAKS Trust 2009-1 |
|
Consumer Finance |
|
1st Lien, Secured Note |
|
5, 10 |
|
1M L + 5.50%, 7.50% Floor (8.01%) |
|
11/03/2016 |
|
01/27/2020 |
|
|
1,122 |
|
|
|
929 |
|
|
|
70 |
|
|
PFS Holdings Corp. |
|
Food & Staples |
|
1st Lien, Secured Loan |
|
5 |
|
1M L + 3.50%, 4.50% Floor (5.88%) |
|
07/09/2018 |
|
01/31/2021 |
|
|
14,979 |
|
|
|
9,554 |
|
|
|
8,935 |
|
|
PR Wireless, Inc. |
|
Wireless Communications |
|
1st Lien, Secured Loan |
|
5 |
|
3M L + 5.25% (8.05%) |
|
11/15/2017 |
|
06/29/2020 |
|
|
602 |
|
|
|
602 |
|
|
|
600 |
|
|
PR Wireless, Inc. |
|
Wireless Communications |
|
1st Lien, Secured Delayed Draw Loan - Unfunded |
|
5 |
|
3M L + 5.25% (8.05%) |
|
11/15/2017 |
|
06/29/2020 |
|
|
768 |
|
|
|
- |
|
|
|
(4 |
) |
|
SESAC Holdco II LLC |
|
Business Services |
|
2nd Lien, Secured Loan |
|
5 |
|
1M L + 7.25%, 8.25% Floor (9.76%) |
|
12/13/2017 |
|
02/24/2025 |
|
|
9,942 |
|
|
|
9,875 |
|
|
|
9,505 |
|
|
Sungard Availability Services Capital, Inc. |
|
Technology Services |
|
1st Lien, Secured Loan |
|
5 |
|
1M L + 7.00%, 8.00% Floor (9.57%) |
|
01/24/2018 |
|
9/30/2021 |
|
|
4,808 |
|
|
|
4,524 |
|
|
|
4,428 |
|
|
Tallage Davis, LLC |
|
Real Estate Services |
|
1st Lien, Secured Loan |
|
5 |
|
11.00% |
|
03/20/2018 |
|
01/26/2023 |
|
|
2,415 |
|
|
|
2,415 |
|
|
|
2,375 |
|
|
Tallage Davis, LLC |
|
Real Estate Services |
|
1st Lien, Secured Loan - Unfunded |
|
5 |
|
11.00% |
|
03/20/2018 |
|
01/26/2023 |
|
|
10,660 |
|
|
|
- |
|
|
|
(176 |
) |
|
Tallage Lincoln, LLC |
|
Real Estate Services |
|
1st Lien, Secured Loan |
|
5 |
|
3M L + 10.00%, 11.00% Floor (12.81%) |
|
11/03/2016 |
|
12/31/2019 |
|
|
2,298 |
|
|
|
2,298 |
|
|
|
2,280 |
|
|
Tru Taj, LLC |
|
Retail |
|
1st Lien, Secured Bond |
|
11 |
|
12.00% |
|
07/21/2017 |
|
08/15/2021 |
|
|
16,000 |
|
|
|
15,433 |
|
|
|
9,160 |
|
|
Tru Taj, LLC |
|
Retail |
|
1st Lien, Debtor in Possession Note |
|
5 |
|
11.00% |
|
03/26/2018 |
|
01/22/2019 |
|
|
4,992 |
|
|
|
5,020 |
|
|
|
5,067 |
|
|
Total Investments excluding Short-Term Investments (167.27% of Net Assets) |
|
|
|
|
|
|
|
|
|
|
248,354 |
|
|
|
184,186 |
|
||||||||
|
Short-Term Investments |
|
|
|
|
|
|
|
|
|
|
|
|
|
|
|
|
|
|
|
|
|
|
|
|
|
State Street Institutional Treasury Money Market Fund |
|
|
|
Premier Class |
|
|
|
n/a |
|
|
|
n/a |
|
|
3,550,161 |
|
|
|
3,550 |
|
|
|
3,550 |
|
|
United States Treasury |
|
|
|
Treasury Bill |
|
|
|
0% |
|
|
|
04/04/2019 |
|
|
75,000 |
|
|
|
74,543 |
|
|
|
74,535 |
|
|
Total Short-Term Investments (70.91% of Net Assets) |
|
|
|
|
|
|
|
|
|
|
|
|
|
|
78,093 |
|
|
|
78,085 |
|
||||
|
TOTAL INVESTMENTS(12) (238.18% of Net Assets) |
|
|
|
|
|
|
|
|
|
|
|
|
|
$ |
326,447 |
|
|
$ |
262,271 |
|
||||
|
Other Liabilities in Excess of Assets (138.17% of Net Assets) |
|
|
|
|
|
|
|
|
|
|
|
|
|
|
|
|
|
$ |
(152,155 |
) |
||||
|
NET ASSETS |
|
|
|
|
|
|
|
|
|
|
|
|
|
|
|
|
|
$ |
110,116 |
|
||||
|
|
(1) |
The Company’s investments are generally acquired in private transactions exempt from registration under the Securities Act of 1933 and, therefore, are generally subject to limitations on resale, and may be deemed to be “restricted securities’’ under the Securities Act of 1933. |
|
|
(2) |
A majority of the Company’s variable rate debt investments bear interest at a rate that is determined by reference to London Interbank Offered Rate (‘‘LIBOR” or “L”) and which is reset daily, monthly, quarterly or semiannually. For each debt investment, the Company has provided the interest rate in effect as of period end. If no reference to LIBOR is made, the rate is fixed. A floor is the minimum rate that will be applied in calculating an interest rate. A cap is the maximum rate that will be applied in calculating an interest rate. The one month (“1M”) LIBOR as of period end was 2.50%. The three month (“3M”) LIBOR as of period end was 2.81%. |
F-13
|
|
(4) |
‘‘Affiliate Investments’’ are investments in those companies that are ‘‘Affiliated Companies’’ of the Company, a defined in the Investment Company Act, which are not ‘‘Controlled Investments.’’ A company is deemed to be an ‘‘Affiliate’’ of the Company if the Company owns 5% or more, but less than 25%, of the voting securities of such company. |
|
|
(5) |
Investments classified as Level 3 whereby fair value was determined by the Company's board of directors. |
|
|
(6) |
Security pays, or has the option to pay, all of its interest in kind. |
|
|
(7) |
Non-income producing security. |
|
|
(8) |
Investment was on non-accrual status as of period end. |
|
|
(9) |
The interest rate on these loans includes a default interest rate. |
|
|
(10) |
Indicates assets that the Company believes do not represent ‘‘qualifying assets’’ under Section 55(a) of the Investment Company Act. Qualifying assets must represent at least 70% of the Company’s total assets at the time of acquisition of any additional non-qualifying assets. Of the Company’s total assets, 25.9% were non-qualifying assets as of period end. |
|
|
(11) |
Security exempt from registration pursuant to Rule 144A under the Securities Act of 1933. Such security may be sold in certain transactions (normally to qualified institutional buyers) and remain exempt from registration. |
|
|
(12) |
As of period end, the aggregate gross unrealized appreciation for all securities in which there was an excess of value over tax cost was $1,694; the aggregate gross unrealized depreciation for all securities in which there was an excess of tax cost over value was $49,881; the net unrealized depreciation was $(48,187); the aggregate cost of securities for Federal income tax purposes was $310,459. |
As of December 31, 2018, the Company’s investments consisted of the following:
|
Investment Type |
|
Investments at Fair Value |
|
|
Percentage of Net Assets |
|
||
|
Debt |
|
$ |
177,955 |
|
|
|
161.61 |
% |
|
Equity/Other |
|
|
6,231 |
|
|
|
5.66 |
% |
|
Short-Term Investments |
|
|
78,085 |
|
|
|
70.91 |
% |
|
Total |
|
$ |
262,271 |
|
|
|
238.18 |
% |
F-14
As of December 31, 2018, the industry composition of the Company’s portfolio at fair value was as follows:
|
Industry |
|
|
|
Investments at Fair Value |
|
|
Percentage of Net Assets |
|
||
|
Wireless Telecommunications Services |
|
|
|
$ |
35,631 |
|
|
|
32.36 |
% |
|
Building Cleaning and Maintenance Services |
|
|
|
|
18,443 |
|
|
|
16.75 |
% |
|
Software Services |
|
|
|
|
15,942 |
|
|
|
14.48 |
% |
|
Manufacturing |
|
|
|
|
15,575 |
|
|
|
14.14 |
% |
|
Retail |
|
|
|
|
14,227 |
|
|
|
12.92 |
% |
|
Industrial Conglomerates |
|
|
|
|
13,365 |
|
|
|
12.14 |
% |
|
Water Transport |
|
|
|
|
11,889 |
|
|
|
10.80 |
% |
|
Gaming, Lodging & Restaurants |
|
|
|
|
9,687 |
|
|
|
8.80 |
% |
|
Business Services |
|
|
|
|
9,505 |
|
|
|
8.63 |
% |
|
Food & Staples |
|
|
|
|
8,935 |
|
|
|
8.11 |
% |
|
Radio Broadcasting |
|
|
|
|
8,807 |
|
|
|
8.00 |
% |
|
Chemicals |
|
|
|
|
7,601 |
|
|
|
6.90 |
% |
|
Real Estate Services |
|
|
|
|
4,479 |
|
|
|
4.07 |
% |
|
Technology Services |
|
|
|
|
4,428 |
|
|
|
4.02 |
% |
|
Hotel Operator |
|
|
|
|
3,212 |
|
|
|
2.92 |
% |
|
Consumer Finance |
|
|
|
|
1,830 |
|
|
|
1.66 |
% |
|
Wireless Communications |
|
|
|
|
596 |
|
|
|
0.54 |
% |
|
Maritime Security Services |
|
|
|
|
34 |
|
|
|
0.03 |
% |
|
Short-Term Investments |
|
|
|
|
78,085 |
|
|
|
70.91 |
% |
|
Total |
|
|
|
$ |
262,271 |
|
|
|
238.18 |
% |
As of December 31, 2018, the geographic composition of the Company’s portfolio at fair value was as follows:
|
Geography |
|
Investments at Fair Value |
|
|
Percentage of Net Assets |
|
||
|
United States |
|
$ |
226,606 |
|
|
|
205.79 |
% |
|
United Kingdom |
|
|
35,665 |
|
|
|
32.39 |
% |
|
Total |
|
$ |
262,271 |
|
|
|
238.18 |
% |
The accompanying notes are an integral part of these financial statements.
F-15
NOTES TO THE CONSOLIDATED FINANCIAL STATEMENTS
Dollar amounts in thousands, except share and per share amounts
1. ORGANIZATION
Great Elm Capital Corp. (the “Company”) was formed on April 22, 2016 as a Maryland corporation. The Company is structured as an externally managed, non-diversified closed-end management investment company. The Company elected to be regulated as a business development company (a “BDC”) under the Investment Company Act of 1940, as amended (the “Investment Company Act”). The Company is managed by Great Elm Capital Management, Inc., a Delaware corporation (“GECM”), a subsidiary of Great Elm Capital Group, Inc., a Delaware corporation (“Great Elm Capital Group”).
The Company seeks to generate current income and capital appreciation through debt and equity investments. The Company invests primarily in secured and senior unsecured debt instruments that it purchases in the secondary markets.
The Company and Full Circle Capital Corporation, a Maryland corporation (“Full Circle”), entered into an Agreement and Plan of Merger, dated as of June 23, 2016 (the “Merger Agreement”). The Merger Agreement provided for the merger of Full Circle with and into the Company (the “Merger”). The Company agreed to provide indemnity to Full Circle’s directors and officers under certain circumstances. The Company has concluded that its indemnification obligation is remote as of the date of the accompanying financial statements. The Merger was completed on November 3, 2016 and the Company began operations on November 4, 2016. The Company accounted for the Merger as a business combination under Accounting Standards Codification (“ASC”) Topic 805, Business Combinations (“Topic 805”). The consideration for the Merger consisted of 4,986,585 shares of common stock, par value $0.01 per share, of the Company (the “Common Stock”).
2. SIGNIFICANT ACCOUNTING POLICIES
Basis of Presentation. The Company’s functional currency is U.S. dollars and these consolidated financial statements have been prepared in that currency. The accompanying consolidated financial statements have been prepared in accordance with accounting principles generally accepted in the United States of America (“GAAP”) and pursuant to Regulation S-X and Regulation S-K. The Company is an investment company following accounting and reporting guidance in Financial Accounting Standards Board (“FASB”) Accounting Standards Codification Topic 946, Financial Services – Investment Companies (“ASC 946”).
Amounts related to dividends receivable were previously reported within prepaid expenses and other assets on the consolidated statements of assets and liabilities on the Form 10-K for the year ended December 31, 2018. These have been reclassed to dividends receivable in the consolidated statements of assets and liabilities to conform to current period presentation.
Prior to the Merger, the Company applied ASC Topic 915, Development Stage Entities (“ASC 915”) and accordingly had determined whether costs incurred were to be charged to expense when incurred or were to be capitalized or deferred. The Company concluded that costs incurred before the date of the Merger were contingent and these costs were charged to expense as permitted under ASC 915.
Basis of Consolidation. Under the Investment Company Act, Article 6 of Regulation S-X and GAAP, the Company is generally precluded from consolidating any entity other than another investment company or an operating company which provides substantially all of its services and benefits to the Company. The accompanying consolidated financial statements include the Company’s accounts and the accounts of the Company’s wholly-owned, or previously wholly-owned, subsidiaries TFC-SC Holdings, LLC, TransAmerican Asset Servicing Group, Inc. and Double Deuce Lodging, LLC. All intercompany balances and transactions have been eliminated in consolidation.
F-16
Use of Estimates. The preparation of the consolidated financial statements in conformity with GAAP requires management to make estimates and assumptions that affect the reported amount of assets and liabilities and disclosure of contingent assets and liabilities at the date of the consolidated financial statements. Changes in the economic environment, financial markets and any other parameters used in determining these estimates could cause actual results to differ materially.
Revenue Recognition. Interest and dividend income, including income paid in kind, is recorded on an accrual basis. Origination, structuring, closing, commitment and other upfront fees, including original issue discounts, earned with respect to capital commitments, are generally amortized or accreted into interest income over the life of the respective debt investment, as are end-of-term or exit fees receivable upon repayment of a debt investment if such fees are fixed in nature. The Company currently has no investments with fixed exit fees. Other fees, including certain amendment fees, prepayment fees and commitment fees on broken deals, and end-of-term or exit fees that have a contingency feature or are variable in nature are recognized as earned. Prepayment fees and similar income due upon the early repayment of a loan or debt security are generally included in interest income.
Interest Income received as paid-in-kind (“PIK”) is reported separately in the Statements of Operations. Income is included as PIK if the instrument solely provides for settlement in kind. In the event that the borrower can settle in kind or via cash payment, the income is not included as PIK until the borrower elects to pay in kind and the payment is received by the Company. In the event there is a lesser cash rate in a PIK toggle instrument, income is accrued at the lesser cash rate until the coupon is paid in kind and such larger payment is received by the Company.
Certain of the Company’s debt investments were purchased at a discount to par as a result of the underlying credit risks and financial results of the issuer, as well as general market factors that influence the financial markets as a whole. Discounts on the acquisition of corporate debt instruments are generally amortized using the effective-interest or constant-yield method assuming there are no material questions as to collectability.
Net Realized Gains (Losses) and Net Change in Unrealized Appreciation (Depreciation). The Company measures realized gains or losses by the difference between the net proceeds from the repayment or sale of an investment and the amortized cost basis of the investment, without regard to unrealized appreciation or depreciation previously recognized. Realized gains and losses are computed using the first-in first-out method. Net change in unrealized appreciation or depreciation reflects the net change in portfolio investment values and portfolio investment cost bases during the reporting period, including the reversal of previously recorded unrealized appreciation or depreciation when gains or losses are realized.
Organization and Merger Related Costs. Organization and Merger-related costs, including costs relating to the formation and incorporation of the business were deemed to be incurred by the Company only subsequent to the Merger being completed.
Cash and Cash Equivalents. Cash and cash equivalents typically consist of bank demand deposits.
Valuation of Portfolio Investments. The Company carries its investments in accordance with ASC Topic 820, Fair Value Measurements and Disclosures (“ASC 820”), which defines fair value, establishes a framework for measuring fair value and requires disclosures about fair value measurements. Fair value is generally based on quoted market prices provided by independent pricing services, broker or dealer quotations or alternative price sources. In the absence of quoted market prices, broker or dealer quotations or alternative price sources, investments are measured at fair value as determined by the Company’s board of directors (the “Board of Directors”).
Due to the inherent uncertainties of valuation, certain estimated fair values may differ significantly from the values that would have been realized had a ready market for these investments existed, and these differences could be material. See Note 4.
F-17
The Company values its portfolio investments at fair value based upon the principles and methods of valuation set forth in policies adopted by our Board. Fair value is defined as the price that would be received to sell an asset in an orderly transaction between market participants at the measurement date. Market participants are buyers and sellers in the principal (or most advantageous) market for the asset that (1) are independent of the Company, (2) are knowledgeable, having a reasonable understanding about the asset based on all available information (including information that might be obtained through due diligence efforts that are usual and customary), (3) are able to transact for the asset, and (4) are willing to transact for the asset (that is, they are motivated but not forced or otherwise compelled to do so).
Investments for which market quotations are readily available are valued at such market quotations unless the quotations are deemed not to represent fair value. The Company generally obtains market quotations from recognized exchanges, market quotation systems, independent pricing services or one or more broker-dealers or market makers. Short term debt investments with remaining maturities within ninety days are generally valued at amortized cost, which approximates fair value. Debt and equity securities for which market quotations are not readily available, which is the case for many of the Company’s investments, or for which market quotations are deemed not to represent fair value, are valued at fair value using a consistently applied valuation process in accordance with the Company’s documented valuation policy that has been reviewed and approved by our Board, who also approve in good faith the valuation of such securities as of the end of each quarter. Due to the inherent uncertainty and subjectivity of determining the fair value of investments that do not have a readily available market value, the fair value of the Company’s investments may differ significantly from the values that would have been used had a readily available market value existed for such investments and may differ materially from the values that the Company may ultimately realize. In addition, changes in the market environment and other events may have differing impacts on the market quotations used to value some of the Company’s investments than on the fair values of our investments for which market quotations are not readily available. Market quotations may be deemed not to represent fair value in certain circumstances where the Company believes that facts and circumstances applicable to an issuer, a seller or purchaser, or the market for a particular security cause current market quotations to not reflect the fair value of the security.
The valuation process approved by our Board with respect to investments for which market quotations are not readily available or for which market quotations are deemed not to represent fair value is as follows:
|
|
▪ |
The investment professionals of GECM provide recent portfolio company financial statements and other reporting materials to an independent valuation firm (or firms) approved by our Board; |
|
|
▪ |
Such firms evaluate this information along with relevant observable market data to conduct independent appraisals each quarter, and their preliminary valuation conclusions are documented, discussed, and iterated with senior management of GECM; |
|
|
▪ |
The fair value of investments comprising in the aggregate less than 5% of the Company’s total capitalization may be determined by GECM in good faith in accordance with the Company’s valuation policy without the employment of an independent valuation firm. |
The Company’s audit committee recommends, and our Board approves, the fair value of the investments in the Company’s portfolio in good faith based on the input of GECM, the respective independent valuation firms (to the extent applicable) and the inputs of each of our Board and the audit committee of our Board.
F-18
Those investments for which market quotations are not readily available or for which market quotations are deemed not to represent fair value are valued utilizing a market approach, an income approach, or both approaches, as appropriate. The market approach uses prices and other relevant information generated by market transactions involving identical or comparable assets or liabilities (including a business). The income approach uses valuation techniques to convert future amounts (for example, cash flows or earnings) to a single present amount (discounted). The measurement is based on the value indicated by current market expectations about those future amounts. In following these approaches, the types of factors that the Company may take into account in determining the fair value of its investments include, as relevant and among other factors: available current market data, including relevant and applicable market trading and transaction comparables, applicable market yields and multiples, security covenants, call protection provisions, information rights, the nature and realizable value of any collateral, the portfolio company’s ability to make payments, its earnings and discounted cash flows, the markets in which the portfolio company does business, comparisons of financial ratios of peer companies that are public, merger and acquisition comparables, and enterprise values.
Investments in revolvers or delayed draw loans may include unfunded commitments for which our acquisition cost will be offset by netbacks received on the unfunded commitment. As a result, the purchases of a commitment that is not fully funded may result in a negative cost basis for the funded commitment. The fair value of the unfunded commitment is adjusted for price appreciation or depreciation and may result in a negative fair value for the unfunded commitment.
Foreign Currency Translation. Amounts denominated in foreign currencies are translated into U.S. dollars on the following basis: (1) investments and other assets and liabilities denominated in foreign currencies are translated into U.S. dollars based upon currency exchange rates effective on the date of valuation; and (2) purchases and sales of investments and income and expense items denominated in foreign currencies are translated into U.S. dollars based upon currency exchange rates prevailing on the transaction dates. The portion of gains and losses on foreign investments resulting from fluctuations in foreign currencies is included in net realized and unrealized gain or loss from investments.
U.S. Federal Income Taxes. From inception to September 30, 2016, the Company was a taxable association under Internal Revenue Code of 1986, as amended (the “Code”). The Company has elected to be taxed as a regulated investment company (“RIC”) under subchapter M of the Code for the partial taxable period beginning on October 1, 2016 and ending December 31, 2016. The Company intends to operate in a manner so as to qualify for the tax treatment applicable to RICs in that taxable year and all future taxable years. In order to qualify as a RIC, among other things, the Company will be required to timely distribute to its stockholders at least 90% of investment company taxable income (“ICTI”) including payment-in-kind (“PIK”) interest, as defined by the Code, for each taxable year in order to be eligible for tax treatment under subchapter M of the Code. Depending on the level of ICTI earned in a tax year, the Company may choose to carry forward ICTI in excess of current year dividend distributions into the next tax year. Any such carryover ICTI must be distributed prior to the 15th day of the ninth month after the tax year-end. So long as the Company maintains its status as a RIC, the Company generally will not be subject to corporate-level U.S. federal income taxes on any ordinary income or capital gains that it distributes at least annually to its stockholders as distributions. Rather, any tax liability related to income earned by the Company represents obligations of the Company’s stockholders and will not be reflected in the consolidated financial statements of the Company.
If the Company does not distribute (or is not deemed to have distributed) each calendar year the sum of (1) 98% of its net ordinary income for each calendar year, (2) 98.2% of its capital gain net income for the one-year period ending October 31 in that calendar year and (3) any income recognized, but not distributed, in preceding years (the “Minimum Distribution Amount”), the Company will generally be required to pay an excise tax equal to 4% of the amount by the which Minimum Distribution Amount exceeds the distributions for the year. To the extent that the Company determines that its estimated current year annual taxable income will be in excess of estimated current year dividend distributions from such taxable income, the Company accrues excise taxes, if any, on estimated excess taxable income as taxable income is earned using an annual effective excise tax rate. The annual effective excise tax rate is determined by dividing the estimated annual excise tax by the estimated annual taxable income.
The Company has accrued $209, $180 and $124 of excise tax expense for the years ended December 31, 2019, 2018 and 2017, respectively.
F-19
At December 31, 2019, the Company, for federal income tax purposes, had capital loss carryforwards of $45,137 which will reduce its taxable income arising from future net realized gains on investment transactions, if any, to the extent permitted by the Internal Revenue Code, and thus will reduce the amount of distributions to shareholders, which would otherwise be necessary to relieve the Company of any liability for federal income tax. On December 22, 2010, the Regulated Investment Company Modernization Act of 2010 (the “Modernization Act”) was signed by the President. The Modernization Act changed the capital loss carryforward rules as they relate to regulated investment companies. Capital losses generated in tax years beginning after the date of enactment may now be carried forward indefinitely, and retain the character of the original loss. Of the capital loss carryforwards at December 31, 2019, $45,137 are limited losses and available for use subject to annual limitation under Section 382. Of the capital losses at December 31, 2019, $16,815 are short-term and $28,322 are long term.
ASC 740 Accounting for Uncertainty in Income Taxes (ASC 740) provides guidance on the accounting for and disclosure of uncertainty in tax position. ASC 740 requires the evaluation of tax positions taken or expected to be taken in the course of preparing the Company's tax returns to determine whether the tax positions are “more-likely-than-not” of being sustained by the applicable tax authority. Tax positions deemed to meet the more-likely-than-not threshold are recorded as a tax benefit or expense in the current year. Based on its analysis of its tax position for all open tax years (the current and prior years, as applicable), the Company has concluded that it does not have any uncertain tax positions that met the recognition or measurement criteria of ASC 740. Such open tax years remain subject to examination and adjustment by tax authorities.
Recent Accounting Developments.
Premium Amortization on Purchased Callable Debt Securities In March 2017, FASB issued ASU 2017-08; Receivables – Nonrefundable Fees and Other Costs (Subtopic 310-20) Premium Amortization on Purchased Callable Debt Securities (“ASU 2017-08”). The amendments in this update shorten the amortization period for certain callable debt securities held at a premium. Specifically, the amendments require the premium to be amortized to the earliest call date. The amendments do not require an accounting change for securities held at a discount; the discount continues to be amortized to maturity. On January 1, 2019, the Company adopted ASU 2017-08 on a modified retrospective basis, however, there was no material impact on the accompanying consolidated financial statements and related disclosures.
Fair Value Measurements In August 2018, the FASB issued ASU 2018-13, Fair Value Measurement (Topic 820): Disclosure Framework – Changes to the Disclosure Requirements for Fair Value Measurement (“ASU 2018-13”), resulting in various disclosures related to fair value measurements being eliminated, modified or supplemented. ASU 2018-13 is effective for interim and annual periods beginning after December 15, 2019, with an option to early adopt any eliminated or modified disclosures, and to delay adoption of the additional disclosures, until the effective date. On September 1, 2018, the Company early adopted the eliminated and modified disclosures of ASU 2018-13 and, as a result, updated its financial statement disclosures accordingly. A modified narrative description of measurement uncertainty for level 3 fair value measurements was applied prospectively, with all other amendments applied retrospectively.
3. SIGNIFICANT AGREEMENTS AND RELATED PARTIES
Investment Management Agreement. On September 27, 2016, the Company entered into an investment management agreement (the “Investment Management Agreement”) with GECM. Beginning on November 4, 2016, the Company began accruing for GECM’s fees for its services under the Investment Management Agreement. This fee consists of two components: a base management fee and an incentive fee.
Management Fee The base management fee is calculated at an annual rate of 1.50% of the Company’s average adjusted gross assets, including assets purchased with borrowed funds. The base management fee is payable quarterly in arrears. The base management fee is calculated based on the average value of the Company’s gross assets, excluding cash and cash equivalents, at the end of the two most recently completed calendar quarters, and appropriately adjusted for any share issuances or repurchases during the then current calendar quarter. Base management fees for any partial quarter are prorated.
F-20
For the years ended December 31, 2019, 2018 and 2017, management fees amounted to $2,953, $2,955 and $2,298, respectively. As of December 31, 2019 and 2018, $746 and $740 remained payable, respectively.
Incentive Fee The incentive fee consists of two components that are independent of each other, with the result that one component may be payable even if the other is not. One component of the incentive fee is based on income (the “Income Incentive Fee”) and the other component is based on capital gains (the “Capital Gains Incentive Fee”).
The Income Incentive Fee is calculated on a quarterly basis as 20% of the amount by which the Company’s pre-incentive fee net investment income (the “Pre-Incentive Fee Net Investment Income”) for the quarter exceeds a hurdle rate of 1.75% (7.0% annualized) of the Company’s net assets at the end of the immediately preceding calendar quarter, subject to a “catch-up” provision pursuant to which GECM receives all of such income in excess of the 1.75% level but less than 2.1875% (8.75% annualized) and subject to a total return requirement (described below). The effect of the “catch-up” provision is that, subject to the total return provision, if pre-incentive fee net investment income exceeds 2.1875% of the Company’s net assets at the end of the immediately preceding calendar quarter, in any calendar quarter, GECM will receive 20.0% of the Company’s pre-incentive fee net investment income as if the 1.75% hurdle rate did not apply. These calculations will be appropriately prorated for any period of less than three months and adjusted for any share issuances or repurchases during the then current quarter.
Pre-Incentive Fee Net Investment Income includes any accretion of original issue discount, market discount, payment-in-kind interest, payment-in-kind dividends or other types of deferred or accrued income, including in connection with zero coupon securities, that the Company and its consolidated subsidiaries have recognized in accordance with GAAP, but have not yet received in cash (collectively, “Accrued Unpaid Income”). Pre-Incentive Fee Net Investment Income does not include any realized capital gains or losses or unrealized capital appreciation or depreciation. Accrued Unpaid Income as of December 31, 2019 was $23,495. Accrued Unpaid Income includes capitalized PIK income of $12,279 on investments still held at December 31, 2019. Accrued Unpaid Income as of December 31, 2018 was $14,571, which included capitalized PIK income of $8,907 on investments still held at December 31, 2018.
Any Income Incentive Fee otherwise payable with respect to Accrued Unpaid Income (collectively, the “Accrued Unpaid Income Incentive Fees”) is deferred, on a security by security basis, and becomes payable only if, as, when and to the extent cash is received by the Company or its consolidated subsidiaries in respect thereof. Any Accrued Unpaid Income that is subsequently reversed in connection with a write-down, write-off, impairment or similar treatment of the investment giving rise to such Accrued Unpaid Income will, in the applicable period of reversal, (1) reduce Pre-Incentive Fee Net Investment Income and (2) reduce the amount of Accrued Unpaid Income Incentive Fees previously deferred.
We will defer cash payment of any Income Incentive Fee otherwise payable to the investment adviser in any quarter (excluding Accrued Unpaid Income Incentive Fees with respect to such quarter) that exceeds (1) 20% of the Cumulative Pre‑Incentive Fee Net Return (as defined below) during the most recent twelve full calendar quarter period ending on or prior to the date such payment is to be made (the “Trailing Twelve Quarters”) less (2) the aggregate incentive fees that were previously paid to the investment adviser during such Trailing Twelve Quarters (excluding Accrued Unpaid Income Incentive Fees during such Trailing Twelve Quarters and not subsequently paid). “Cumulative Pre‑Incentive Fee Net Return” during the relevant Trailing Twelve Quarters means the sum of (a) pre‑incentive fee net investment income in respect of such Trailing Twelve Quarters less (b) net realized capital losses and net unrealized capital depreciation, if any, in each case calculated in accordance with GAAP, in respect of such Trailing Twelve Quarters.
Under the Capital Gains Incentive Fee, the Company is obligated to pay GECM at the end of each calendar year 20% of the aggregate cumulative realized capital gains from November 4, 2016 through the end of that year, computed net of aggregate cumulative realized capital losses and aggregate cumulative unrealized depreciation through the end of such year, less the aggregate amount of any previously paid capital gains incentive fees.
F-21
For the years ended December 31, 2019, 2018 and 2017, the Company incurred Income Incentive Fees of $2,735, $165 and $4,394, respectively. For the year ended December 31, 2018, the Income Incentive Fees incurred include an accrual of $3,100 offset by a reversal of $2,935 of Income Incentive Fees previously accrued (discussed further below). As of December 31, 2019 and 2018, $8,157 and $5,422 of Income Incentive Fees, respectively, remained payable of which none was immediately payable after calculating the total return requirement. For the years ended December 31, 2019, 2018 and 2017, the Company did not accrue any Incentive Fees based on capital gains.
GECC’s largest investment, Avanti Communications Group plc (Avanti), has generated significant non-cash income in the form of PIK interest. In connection with the recent restructuring of Avanti completed on April 26, 2018, GECC’s investment in Avanti’s third lien notes was converted into Avanti common equity. As a result of this debt-for-equity conversion, we have determined that the accrued incentives fees payable associated with the portion of such PIK interest generated by the third lien notes should not at this time be recognized as a liability and as such we have reversed for prior periods.
The Investment Management Agreement provides that, absent willful misfeasance, bad faith or gross negligence in the performance of its duties or by reason of the reckless disregard of its duties and obligations, GECM and its officers, managers, agents, employees, controlling persons, members and any other person or entity affiliated with it are entitled to indemnification from the Company for any damages, liabilities, costs and expenses (including reasonable attorneys’ fees and amounts reasonably paid in settlement) arising from the rendering of GECM’s services under the Investment Management Agreement or otherwise as an investment adviser of the Company.
The Company’s chief executive officer is also the chief investment officer of GECM, and the chief executive officer and a member of the board of directors of GEC. The Company’s Chief Compliance Officer is also an executive officer of GECM, and serves as GECM’s Chief Compliance Officer.
Administration Fees. Pursuant to the Administration Agreement, with GECM provides us with administrative services, including, among other things, furnishing the Company with office facilities, equipment, clerical, bookkeeping record keeping services. The Company will reimburse GECM for its allocable portion of overhead and other expenses of GECM in performing its obligations under the Administration Agreement.
GECM agreed that the aggregate amount of expenses accrued for reimbursement pursuant to the Administration Agreement that pertain to direct compensation costs of financial, compliance and accounting personnel that perform services for the Company, inclusive of the fees charged by any sub-administrator to provide such financial, compliance and/or accounting personnel to the Company (the “Compensation Expenses”), during the year ending November 4, 2017, when taken together with Compensation Expenses reimbursed or accrued for reimbursement by the Company pursuant to the Investment Management Agreement during such period, shall not exceed 0.50% of the Company’s average net asset value during such period. GECM’s expense cap was calculated retrospectively for the year ending November 4, 2017 and the cap on costs was determined to be $0 and $70 of the $80 accrued at December 31, 2016 was reversed for the year ended December 31, 2017 with $10 due from our sub-administrator remaining waived.
The Administration Agreement provides that, absent willful misfeasance, bad faith or negligence in the performance of its duties or by reason of the reckless disregard of its duties and obligations, GECM and its officers, managers, partners, agents, employees, controlling persons, members and any other person or entity affiliated with it are entitled to indemnification from the Company for any damages, liabilities, costs and expenses (including reasonable attorneys’ fees and amounts reasonably paid in settlement) arising from the rendering of GECM’s services under the Administration Agreement or otherwise as administrator for the Company.
For the years ended December 31, 2019, 2018 and 2017, the Company incurred expenses under the Administration Agreement of $987, $1,416 and $1,362, respectively. As of December 31, 2019 and 2018, $176 and $329, respectively, remained payable.
F-22
The fair value of a financial instrument is the amount that would be received to sell an asset or would be paid to transfer a liability in an orderly transaction between market participants at the measurement date (i.e., the exit price).
The fair value hierarchy under ASC 820 prioritizes the inputs to valuation techniques used to measure fair value. The hierarchy gives the highest priority to unadjusted quoted prices in active markets for identical assets or liabilities (Level 1 measurements) and the lowest priority to unobservable inputs (Level 3 measurements). The levels used for classifying investments are not necessarily an indication of the risk associated with investing in these securities. The three levels of the fair value hierarchy are as follows:
Basis of Fair Value Measurement
Level 1 - Investments valued using unadjusted quoted prices in active markets for identical assets.
Level 2 - Investments valued using other unadjusted observable market inputs, e.g. quoted prices in markets that are not active or quotes for comparable instruments.
Level 3 - Investments that are valued using quotes and other observable market data to the extent available, but which also take into consideration one or more unobservable inputs that are significant to the valuation taken as a whole.
A financial instrument’s level within the fair value hierarchy is based on the lowest level of any input that is significant to the fair value measurement. Note 2 should be read in conjunction with the information outlined below.
The table below presents the valuation techniques and the nature of significant inputs generally used in determining the fair value of Level 2 Instruments.
Level 2 Instruments Valuation Techniques and Significant Inputs
|
Equity and Fixed Income |
|
The types of instruments that trade in markets that are not considered to be active but are valued based on quoted market prices, broker or dealer quotations or alternative pricing sources with reasonable levels of price transparency may include commercial paper, most government agency obligations, certain corporate debt securities, certain mortgage-backed securities, certain bank loans, less liquid publicly listed equities, certain state and municipal obligations, certain money market instruments and certain loan commitments. |
|
|
|
Valuations of Level 2 Equity and Fixed Income instruments can be verified to quoted prices, broker or dealer quotations or alternative pricing sources with reasonable levels of price transparency. Consideration is given to the nature of the quotations (e.g. indicative or firm) and the relationship of recent market activity to the prices provided from alternative pricing sources. |
F-23
Level 3 Instruments Valuation Techniques and Significant Inputs
|
Bank Loans, Corporate Debt, and Other Debt Obligations |
|
Valuations are generally based on discounted cash flow techniques, for which the significant inputs are the amount and timing of expected future cash flows, market yields and recovery assumptions. The significant inputs are generally determined based on an analysis of market comparables, transactions in similar instruments and/or recovery and liquidation analyses. |
|
Equity |
|
Recent third-party investments or pending transactions are considered to be the best evidence for any change in fair value. When these are not available, the following valuation methodologies are used, as appropriate and available: ▪ Transactions in similar instruments; ▪ Discounted cash flow techniques; ▪ Third party appraisals; and ▪ Industry multiples and public comparables. Evidence includes recent or pending reorganizations (for example, merger proposals, tender offers and debt restructurings) and significant changes in financial metrics, including: ▪ Current financial performance as compared to projected performance; ▪ Capitalization rates and multiples; and ▪ Market yields implied by transactions of similar or related assets. |
As noted above, the income and market approaches were used in the determination of fair value of certain Level 3 assets as of December 31, 2019 and 2018. The significant unobservable inputs used in the income approach are the discount rate or market yield used to discount the estimated future cash flows expected to be received from the underlying investment, which include both future principal and interest payments. An increase in the discount rate or market yield would result in a decrease in the fair value. Included in the consideration and selection of discount rates is risk of default, rating of the investment (if any), call provisions and comparable company valuations. The significant unobservable inputs used in the market approach are based on market comparable transactions and market multiples of publicly traded comparable companies. Increases or decreases in market multiples would result in an increase or decrease, respectively, in the fair value.
The following is a summary of the Company’s investment assets categorized within the fair value hierarchy as of December 31, 2019:
|
Assets |
|
Level 1 |
|
|
Level 2 |
|
|
Level 3 |
|
|
Total |
|
||||
|
Debt |
|
$ |
- |
|
|
$ |
53,635 |
|
|
$ |
120,431 |
|
|
$ |
174,066 |
|
|
Equity/Other |
|
|
- |
|
|
|
- |
|
|
|
23,549 |
|
|
|
23,549 |
|
|
Short Term Investments |
|
|
85,733 |
|
|
|
- |
|
|
|
- |
|
|
|
85,733 |
|
|
Total investment assets |
|
$ |
85,733 |
|
|
$ |
53,635 |
|
|
$ |
143,980 |
|
|
$ |
283,348 |
|
The following is a summary of the Company’s investment assets categorized within the fair value hierarchy as of December 31, 2018:
|
Assets |
|
Level 1 |
|
|
Level 2 |
|
|
Level 3 |
|
|
Total |
|
||||
|
Fixed Income |
|
$ |
- |
|
|
$ |
61,921 |
|
|
$ |
116,034 |
|
|
$ |
177,955 |
|
|
Equity/Other |
|
|
6,231 |
|
|
|
- |
|
|
|
- |
|
|
|
6,231 |
|
|
Short Term Investments |
|
|
78,085 |
|
|
|
- |
|
|
|
- |
|
|
|
78,085 |
|
|
Total investment assets |
|
$ |
84,316 |
|
|
$ |
61,921 |
|
|
$ |
116,034 |
|
|
$ |
262,271 |
|
F-24
The following is a reconciliation of Level 3 assets for the year ended December 31, 2019:
|
Level 3 |
|
Beginning Balance as of January 1, 2019 |
|
|
Net Transfers In/Out |
|
|
Purchases(1) |
|
|
Net Realized Gain (Loss) |
|
|
Net Change in Unrealized Appreciation (Depreciation)(2) |
|
|
Sales and Settlements(1) |
|
|
Net Amortization of Premium/ Discount |
|
|
Ending Balance as of December 31, 2019 |
|
||||||||
|
Debt |
|
$ |
116,034 |
|
|
$ |
- |
|
|
$ |
120,050 |
|
|
$ |
(313 |
) |
|
$ |
(6,210 |
) |
|
$ |
(112,879 |
) |
|
$ |
3,749 |
|
|
$ |
120,431 |
|
|
Equity/Other |
|
|
- |
|
|
|
6,231 |
|
|
|
32,935 |
|
|
|
- |
|
|
|
(14,003 |
) |
|
|
(1,614 |
) |
|
|
- |
|
|
|
23,549 |
|
|
Total investment assets |
|
$ |
116,034 |
|
|
$ |
6,231 |
|
|
$ |
152,985 |
|
|
$ |
(313 |
) |
|
$ |
(20,213 |
) |
|
$ |
(114,493 |
) |
|
$ |
3,749 |
|
|
$ |
143,980 |
|
The following is a reconciliation of Level 3 assets for the year ended December 31, 2018:
|
Level 3 |
|
Beginning Balance as of January 1, 2018 |
|
|
Transfers Out |
|
|
Purchases(1) |
|
|
Net Realized Gain (Loss) |
|
|
Net Change in Unrealized Appreciation (Depreciation)(2) |
|
|
Sales and Settlements(1) |
|
|
Net Amortization of Premium/ Discount |
|
|
Ending Balance as of December 31, 2018 |
|
||||||||
|
Debt |
|
$ |
83,789 |
|
|
$ |
12,570 |
|
|
$ |
126,639 |
|
|
$ |
2,081 |
|
|
$ |
(7,290 |
) |
|
$ |
(103,890 |
) |
|
$ |
2,135 |
|
|
$ |
116,034 |
|
|
Equity/Other |
|
|
136 |
|
|
|
- |
|
|
|
- |
|
|
|
335 |
|
|
|
9 |
|
|
|
(480 |
) |
|
|
- |
|
|
|
- |
|
|
Total investment assets |
|
$ |
83,925 |
|
|
$ |
12,570 |
|
|
$ |
126,639 |
|
|
$ |
2,416 |
|
|
$ |
(7,281 |
) |
|
$ |
(104,370 |
) |
|
$ |
2,135 |
|
|
$ |
116,034 |
|
|
(1) |
Purchases may include new deals, additional fundings (inclusive of those on revolving credit facilities), refinancings and capitalized PIK income, securities received in corporate actions and restructurings. Sales and Settlements may include scheduled principal payments, prepayments, sales and repayments (inclusive of those on revolving credit facilities), securities delivered in corporate actions and restructuring of investments. |
|
(2) |
The net change in unrealized appreciation (depreciation) relating to Level 3 assets still held at December 31, 2019 totaled $(20,664) consisting of the following: $(6,661) related to debt securities and $(14,003) related to equity/other. The net change in unrealized appreciation (depreciation) relating to Level 3 assets still held at December 31, 2018 totaled $(6,833) consisting of the following: $(6,833) related to debt securities and $0 related to equity/other. |
One security with a fair value of $2,353 was transferred from Level 1 into Level 3 of the fair value hierarchy during the year ended December 31, 2019 as a result of the shares being delisted from their primary exchange.
One security with a fair value of $28,807 was transferred into the Level 3 hierarchy and three securities with a fair value of $16,237 were transferred from Level 3 to Level 2 during the year ended December 31, 2018. All transfers during the year ended December 31, 2018 were the result of changes in pricing transparency.
The tables below present the ranges of significant unobservable inputs used to value the Company’s Level 3 assets and liabilities as of December 31, 2019 and 2018, respectively. These ranges represent the significant unobservable inputs that were used in the valuation of each type of instrument, but they do not represent a range of values for any one instrument. For example, the lowest yield in 1st Lien/Senior Secured is appropriate for valuing that specific debt investment, but may not be appropriate for valuing any other debt investments in this asset class. Accordingly, the ranges of inputs presented below do not represent uncertainty in, or possible ranges of, fair value measurements of the Company’s Level 3 assets.
F-25
|
As of December 31, 2019 |
|
|||||||||||
|
Investment Type |
|
Fair value |
|
|
Valuation Technique(1) |
|
Unobservable Input(1) |
|
Range (Weighted Average)(2) |
|
||
|
Debt |
|
$ |
9,054 |
|
|
Market Approach |
|
EBITDA Multiple |
|
5.50 |
|
|
|
|
|
|
(1,262 |
) |
|
|
|
Implied Yield |
|
4.09% - 8.09% (7.03%) |
|
|
|
|
|
|
38,225 |
|
|
Market Approach |
|
Earnings Multiple |
|
4.25 |
|
|
|
|
|
|
|
|
|
Income Approach |
|
Discount Rate |
|
12.75% |
|
|
|
|
|
|
73,334 |
|
|
Income Approach |
|
Discount Rate |
|
3.45% - 32.50% (12.70%) |
|
|
|
|
|
|
1,080 |
|
|
Asset Recovery / Liquidation(4) |
|
|
|
|
|
|
|
Total Debt |
|
$ |
120,431 |
|
|
|
|
|
|
|
|
|
|
|
|
|
|
|
|
|
|
|
|
|
|
|
|
Equity/Other |
|
$ |
10,079 |
|
|
Market Approach |
|
Earnings Multiple |
|
2.80 - 4.25 (3.41) |
|
|
|
|
|
|
|
|
|
Income Approach |
|
Discount Rate |
|
12.75% - 39.00% (32.87%) |
|
|
|
|
|
|
11,996 |
|
|
Market Approach |
|
Comparable Price(3) |
|
6.00 - 11.00 (8.75) |
|
|
|
|
|
|
1,474 |
|
|
Asset Recovery / Liquidation(4) |
|
|
|
|
|
|
|
Total Equity/Other |
|
$ |
23,549 |
|
|
|
|
|
|
|
|
|
December 31, 2018
|
As of December 31, 2018 |
||||||||||
|
Investment Type |
|
Fair value |
|
|
Valuation Technique(1) |
|
Unobservable Input(1) |
|
Range (Weighted Average)(2) |
|
|
Debt |
|
$ |
27,378 |
|
|
Market Approach |
|
Gross Profit Multiple |
|
2.08 |
|
|
|
|
|
|
|
|
|
EBITDA Multiple |
|
5.05 |
|
|
|
|
86,792 |
|
|
Income Approach |
|
Discount Rate |
|
8.10% - 40.00% (15.38%) |
|
|
|
|
1,864 |
|
|
Asset Recovery / Liquidation(4) |
|
Discount Rate |
|
15.00% |
|
Total Debt |
|
$ |
116,034 |
|
|
|
|
|
|
|
|
|
|
|
|
|
|
|
|
|
|
|
|
|
|
|
|
|
|
|
|
|
|
|
|
Equity/Other |
|
$ |
- |
|
|
Asset Recovery / Liquidation(4) |
|
Multiple |
|
2.08 |
|
|
|
|
|
|
|
|
|
Discount Rate |
|
15.00% |
|
(1) |
The fair value of any one instrument may be determined using multiple valuation techniques or unobservable inputs. |
|
(2) |
Weighted average for an asset category consisting of multiple investments is calculated by weighting the significant unobservable input by the relative fair value of the investment. The range and weighted average for an asset category consisting of a single investment represents the significant unobservable input used in the fair value of the investment. |
|
(3) |
Comparable Price may include broker quotes for the exact security or similar securities. |
|
(4) |
Investments valued using the asset recovery or liquidation technique may include investments for which valuation is based on current financial data without a discount rate applied. |
F-26
On November 3, 2016, the Company assumed $33,646 of Full Circle 8.25% Senior Notes due 2020 (the “2020 Notes”) in connection with the Merger by executing the second supplemental indenture dated November 3, 2016. The 2020 Notes had a maturity date of June 30, 2020 and on October 20, 2017 we redeemed them completely at their par value plus accrued and unpaid interest.
On September 13, 2017, we offered $28,375 in aggregate principal amount of 6.50% notes due 2022 (the "GECCL Notes"). On September 29, 2017, we sold to several underwriters an additional $4,256 of the GECCL Notes upon full exercise of the underwriters’ over-allotment option.
The GECCL Notes are our unsecured obligations and rank equal with all of our outstanding and future unsecured unsubordinated indebtedness. The GECCL Notes are effectively subordinated, or junior in right of payment, to any future secured indebtedness that we may incur and structurally subordinated to all future indebtedness and other obligations of our subsidiaries. We pay interest on the GECCL Notes on January 31, April 30, July 31 and October 31 of each year. The GECCL Notes will mature on September 18, 2022 and can be called on, or after, September 18, 2019. Holders of the GECCL Notes do not have the option to have the GECCL Notes repaid prior to the stated maturity date. The GECCL Notes were issued in minimum denominations of $25 and integral multiples of $25 in excess thereof.
On January 11, 2018, we offered $43,000 in aggregate principal amount of 6.75% notes due 2025 (the "GECCM Notes"). On January 19, 2018 and February 9, 2018, we sold an additional $1,898 and $1,500 of the GECCM Notes upon partial exercise of the underwriters’ over-allotment option.
The GECCM Notes are our unsecured obligations and rank equal with all of our outstanding and future unsecured unsubordinated indebtedness. The GECCM Notes are effectively subordinated, or junior in right of payment, to any future secured indebtedness that we may incur and structurally subordinated to all future indebtedness and other obligations of our subsidiaries. We pay interest on the GECCM Notes on March 31, June 30, September 30 and December 31 of each year. The GECCM Notes will mature on January 31, 2025 and can be called on, or after, January 31, 2021. Holders of the GECCM Notes do not have the option to have the GECCM Notes repaid prior to the stated maturity date. The GECCM Notes were issued in minimum denominations of $25 and integral multiples of $25 in excess thereof.
On June 18, 2019, we offered $42,500 in aggregate principal amount of 6.50% notes due 2024 (the "GECCN Notes"), which included $2,500 of the GECCN Notes sold in connection with the partial exercise of the underwriters’ over-allotment option. On July 5, 2019, we sold an additional $2.5 million of the GECCN Notes upon another partial exercise of the underwriters’ over-allotment option. As a result of the issuance of these additional GECCN Notes, the aggregate principal balance of the GECCN Notes outstanding is $45.0 million.
The GECCN Notes are our unsecured obligations and rank equal with all of our outstanding and future unsecured unsubordinated indebtedness. The GECCN Notes are effectively subordinated, or junior in right of payment, to any future secured indebtedness that we may incur and structurally subordinated to all future indebtedness and other obligations of our subsidiaries. We pay interest on the GECCN Notes on March 31, June 30, September 30 and December 31 of each year beginning September 30, 2019. The GECCN Notes will mature on June 30, 2024 and can be called on, or after, June 30, 2021. Holders of the GECCN Notes do not have the option to have the GECCN Notes repaid prior to the stated maturity date. The GECCN Notes were issued in minimum denominations of $25 and integral multiples of $25 in excess thereof.
As part of the offering, the Company incurred fees and costs, which are treated as a reduction of the carrying amount of the debt on our Statements of Assets and Liabilities. These deferred financing costs presented as a reduction to the Notes payable balance are being amortized into interest expense over the term of the Notes.
The Investment Company Act limits, with certain exceptions, the Company’s borrowing such that its asset coverage ratio, as defined in the Investment Company Act, is at least 1.5 to 1 after such borrowing.
F-27
Information about the Company’s senior securities (including debt securities and other indebtedness) is shown in the following table:
|
Year |
|
Total Amount Outstanding(1) |
|
|
Asset Coverage Ratio Per Unit(2) |
|
|
Involuntary Liquidation Preference Per Unit(3) |
|
Average Market Value Per Unit(4) |
|
|||
|
December 31, 2016 |
|
|
|
|
|
|
|
|
|
|
|
|
|
|
|
2020 Notes |
|
$ |
33,646 |
|
|
$ |
6,168 |
|
|
N/A |
|
$ |
1.02 |
|
|
|
|
|
|
|
|
|
|
|
|
|
|
|
|
|
|
December 31, 2017 |
|
|
|
|
|
|
|
|
|
|
|
|
|
|
|
GECCL Notes |
|
$ |
32,631 |
|
|
$ |
5,010 |
|
|
N/A |
|
$ |
1.02 |
|
|
|
|
|
|
|
|
|
|
|
|
|
|
|
|
|
|
December 31, 2018 |
|
|
|
|
|
|
|
|
|
|
|
|
|
|
|
GECCL Notes |
|
$ |
32,631 |
|
|
$ |
2,393 |
|
|
N/A |
|
$ |
1.01 |
|
|
GECCM Notes |
|
|
46,398 |
|
|
|
2,393 |
|
|
N/A |
|
|
0.98 |
|
|
|
|
|
|
|
|
|
|
|
|
|
|
|
|
|
|
December 31, 2019 |
|
|
|
|
|
|
|
|
|
|
|
|
|
|
|
GECCL Notes |
|
$ |
32,631 |
|
|
$ |
1,701 |
|
|
N/A |
|
$ |
1.01 |
|
|
GECCM Notes |
|
|
46,398 |
|
|
|
1,701 |
|
|
N/A |
|
|
1.01 |
|
|
GECCN Notes |
|
|
45,000 |
|
|
|
1,701 |
|
|
N/A |
|
|
1.00 |
|
|
(1) |
Total amount of each class of senior securities outstanding at the end of the period presented. |
|
(2) |
Asset coverage per unit is the ratio of the carrying value of Great Elm’s total consolidated assets, less all liabilities and indebtedness not represented by senior securities, to the aggregate amount of senior securities representing indebtedness. Asset coverage per unit is expressed in terms of dollar amounts per $1,000 of indebtedness. |
|
(3) |
The amount to which such class of senior security would be entitled upon the voluntary liquidation of the issuer in preference to any security junior to it. |
|
(4) |
The average market value per unit for the Notes, as applicable, is based on the average daily prices of such Notes and is expressed per $1 of indebtedness. |
The indenture’s covenants include compliance with (regardless of whether the Company is subject to) the asset coverage requirements set forth in Section 18(a)(1)(A) as modified by Section 61(a)(1) of the Investment Company Act, as well as covenants requiring the Company to provide financial information to the holders of the Notes and the Trustee if the Company ceases to be subject to the reporting requirements of the Securities Exchange Act of 1934. These covenants are subject to limitations and exceptions that are described in the Indenture. The Company may repurchase the Notes in accordance with the Investment Company Act and the rules promulgated thereunder. As of December 31, 2019, the Company had not repurchased any of the Notes. As of December 31, 2019 and 2018, the Company was in compliance with all covenants under the indentures.
For the years ended December 31, 2019, 2018 and 2017, the components of interest expense were as follows:
|
|
|
For the years ended December 31, |
|
|||||||||
|
|
|
2019 |
|
|
2018 |
|
|
2017 |
|
|||
|
Borrowing interest expense |
|
$ |
6,821 |
|
|
$ |
5,088 |
|
|
$ |
2,843 |
|
|
Amortization of acquisition premium |
|
|
815 |
|
|
|
557 |
|
|
|
(804 |
) |
|
Total |
|
$ |
7,636 |
|
|
$ |
5,645 |
|
|
$ |
2,039 |
|
|
Weighted average interest rate(1) |
|
|
7.40 |
% |
|
|
7.27 |
% |
|
|
4.76 |
% |
|
Average outstanding balance |
|
$ |
103,200 |
|
|
$ |
77,631 |
|
|
$ |
42,854 |
|
|
(1) |
Annualized. |
F-28
The fair value of the Company’s Notes are determined in accordance with ASC 820, which defines fair value in terms of the price that would be paid to transfer a liability in an orderly transaction between market participants at the measurement date under current market conditions. The fair value of the Company’s Notes is determined by utilizing market quotations at the measurement date as they are Level 1 securities.
|
|
|
December 31, 2019 |
|
|||||||||
|
Facility |
|
Commitments |
|
|
Borrowings Outstanding |
|
|
Fair Value |
|
|||
|
Unsecured Debt - GECCL Notes |
|
$ |
32,631 |
|
|
$ |
32,631 |
|
|
$ |
32,918 |
|
|
Unsecured Debt - GECCM Notes |
|
|
46,398 |
|
|
|
46,398 |
|
|
|
46,888 |
|
|
Unsecured Debt - GECCN Notes |
|
|
45,000 |
|
|
|
45,000 |
|
|
|
45,180 |
|
|
Total |
|
$ |
124,029 |
|
|
$ |
124,029 |
|
|
$ |
124,986 |
|
|
|
|
December 31, 2018 |
|
|||||||||
|
Facility |
|
Commitments |
|
|
Borrowings Outstanding |
|
|
Fair Value |
|
|||
|
Unsecured Debt - GECCL Notes |
|
$ |
32,631 |
|
|
$ |
32,631 |
|
|
$ |
32,174 |
|
|
Unsecured Debt - GECCM Notes |
|
|
46,398 |
|
|
|
46,398 |
|
|
|
45,044 |
|
|
Total |
|
$ |
79,029 |
|
|
$ |
79,029 |
|
|
$ |
77,218 |
|
6. COMMITMENTS AND CONTINGENCIES
In the normal course of business, the Company may enter into investment agreements under which it commits to make an investment in a portfolio company at some future date or over a specified period of time. As of December 31, 2019, the Company had approximately $29,788 in unfunded loan commitments, subject to the Company’s approval in certain instances, to provide debt financing to certain of its portfolio companies. To the degree applicable, unrealized gains or losses on these commitments as of December 31, 2019 are included in the Company’s Statement of Assets and Liabilities and the corresponding Schedule of Investments. The Company believes that it had sufficient cash and other liquid assets on its balance sheet to satisfy the unfunded commitments. The Company has considered the net decreases in net assets and negative cash flows from operations and has concluded that it has the ability to meet its obligations in the ordinary course of business based upon an evaluation of its cash position and sources of liquidity.
We are named as a defendant in a lawsuit filed on March 5, 2016, and captioned Intrepid Investments, LLC v. London Bay Capital, which is pending in the Delaware Court of Chancery. The plaintiff immediately agreed to stay the action in light of an ongoing mediation among parties other than us. This lawsuit was brought by a member of Speedwell Holdings (formerly known as The Selling Source, LLC), one of our portfolio investments, against various members of and lenders to Speedwell Holdings. The plaintiff asserts claims of aiding and abetting, breaches of fiduciary duty, and tortious interference against us. In June 2018, Intrepid Investments, LLC (“Intrepid”) sent notice to the court and defendants effectively lifting the stay and triggering defendants’ obligation to respond to the Intrepid complaint. In September 2018, we joined the other defendants in a motion to dismiss on various grounds. In February 2019, Intrepid filed a second amended complaint to which defendants filed a renewed motion to dismiss in March 2019. We intend to continue to monitor the matter and will assess the need to defend the matter further as necessary.
F-29
In July 2016, Full Circle filed suit in the District Court of Caldwell County, Texas against, among others, Willis Pumphrey for breach of a guaranty agreement arising from a loan transaction with Full Circle. Dr. Pumphrey, a personal guarantor of the loan made by Full Circle, our predecessor in interest, brought counterclaims in (i) the District Court of Caldwell County, Texas and (ii) the District Court of Harris County, Texas (the “District Court”) against, among others, Justin Bonner, an employee of GECM, in each case, alleging breach of a confidentiality agreement and tortious interference with Dr. Pumphrey’s attempted sale of a business in which he owned an interest. In August 2017, Dr. Pumphrey voluntarily withdrew his complaint against Mr. Bonner and Full Circle in the District Court of Harris County, Texas. In November 2017, Dr. Pumphrey voluntarily withdrew his complaint without prejudice against Full Circle in the District Court of Caldwell County, Texas. On November 29, 2017, Dr. Pumphrey refiled his claims in the District Court of Harris County, Texas naming Full Circle, MAST Capital, GECC and GECM as defendants. Dr. Pumphrey is seeking between $2 million and $6 million in damages. GECC believes Dr. Pumphrey’s claims to be frivolous and intends to vigorously defend them. Furthermore, we continue to pursue our initial claims against Dr. Pumphrey in the District Court of Caldwell County, Texas. In September 2019, we received a judgment in our favor from the District Court of Caldwell County, Texas.
In September 2018, we (as successor by merger to Full Circle), the other lenders, and the lender trustee under PEAKS Trust 2009-11 (“PEAKS Trust”), were named as defendants in a claim brought by the Chapter 7 trustee in the ITT Educational Services bankruptcy. Full Circle purchased via assignment a portion of the PEAKS Trust senior secured facility from Deutsche Bank Trust Company Americas in December 2016. The PEAKS Trust senior secured facility was supported by an underlying portfolio of student loans and guaranteed by ITT Educational Services, Inc. (“ITT”). In September 2016, ITT and its affiliates filed for relief under Chapter 7 of the Bankruptcy Code. Following the Chapter 7 filing, a trustee was appointed who initiated a proceeding against certain Deutsche Bank entities and the investors in the PEAKS Trust, including GECC. On November 2, 2018, the trustee filed a motion seeking to stay the litigation in order to facilitate settlement. We are continuing to monitor these proceedings.
7. INDEMNIFICATION
Under the Company’s organizational documents, its officers and directors are indemnified against certain liabilities arising out of the performance of their duties to the Company. In addition, in the normal course of business the Company expects to enter into contracts that contain a variety of representations which provide general indemnifications. The Company’s maximum exposure under these agreements cannot be known; however, the Company expects any risk of loss to be remote.
8. TAX INFORMATION
The tax character of distributions were as follows:
|
|
|
For the year ended December 31, |
|
|||||||||
|
(in thousands) |
|
2019 |
|
|
2018 |
|
|
2017 |
|
|||
|
Distributions paid from: |
|
|
|
|
|
|
|
|
|
|
|
|
|
Ordinary income |
|
$ |
10,680 |
|
|
$ |
13,116 |
|
|
$ |
13,682 |
|
|
Net long term capital gains |
|
|
- |
|
|
|
- |
|
|
|
- |
|
|
Total taxable distributions |
|
$ |
10,680 |
|
|
$ |
13,116 |
|
|
$ |
13,682 |
|
F-30
The components of distributable earnings (losses) on a tax basis were as follows:
|
|
|
As of December 31, |
|
|||||||||
|
(in thousands) |
|
2019 |
|
|
2018 |
|
|
2017 |
|
|||
|
Undistributed ordinary income, net |
|
$ |
5,828 |
|
|
$ |
6,111 |
|
|
$ |
3,488 |
|
|
Undistributed capital gains |
|
|
265 |
|
|
|
- |
|
|
|
- |
|
|
Capital loss carryforwards |
|
|
(45,137 |
) |
|
|
(46,161 |
) |
|
|
(46,984 |
) |
|
Total undistributed earnings |
|
|
(39,044 |
) |
|
|
(40,050 |
) |
|
|
(43,496 |
) |
|
Unrealized earnings (losses), net |
|
|
(67,281 |
) |
|
|
(48,187 |
) |
|
|
(22,750 |
) |
|
Total accumulated earnings (losses), net(1) |
|
$ |
(106,325 |
) |
|
$ |
(88,237 |
) |
|
$ |
(66,246 |
) |
|
(1) |
Taxable income is estimated and is not considered final until the Company files its tax return. |
The Company’s aggregate unrealized appreciation and depreciation on investments based on cost for U.S. federal income tax purposes were as follows:
|
|
|
As of December 31, |
|
|||||
|
(in thousands) |
|
2019 |
|
|
2018 |
|
||
|
Tax cost |
|
$ |
350,629 |
|
|
$ |
310,459 |
|
|
|
|
|
|
|
|
|
|
|
|
Gross unrealized appreciation |
|
|
3,357 |
|
|
|
1,694 |
|
|
Gross unrealized depreciation |
|
|
(70,638 |
) |
|
|
(49,881 |
) |
|
Net unrealized appreciation (depreciation) on investments |
|
$ |
(67,281 |
) |
|
$ |
(48,187 |
) |
The difference between GAAP-basis and tax basis unrealized gains (losses) is attributable primarily to differences in the tax treatment of underlying fund investments.
In order to present certain components of the Company's capital accounts on a tax-basis, certain reclassifications have been recorded to the Company's accounts. These reclassifications have no impact on the net asset value of the Company's and result primarily from dividend redesignations, certain non-deductible expenses, and differences in the tax treatment of paydown gains and losses.
|
|
|
As of December 31, |
|
|||||
|
(in thousands) |
|
2019 |
|
|
2018 |
|
||
|
Paid-in capital in excess of par |
|
$ |
(139 |
) |
|
$ |
(180 |
) |
|
Accumulated undistributed net investment income |
|
|
639 |
|
|
|
3,353 |
|
|
Accumulated net realized gain (loss) |
|
|
(500 |
) |
|
|
(3,173 |
) |
At December 31, 2019, the Company, for federal income tax purposes, had capital loss carryforwards of $45,137 which will reduce its taxable income arising from future net realized gains on investment transactions, if any, to the extent permitted by the Internal Revenue Code, and thus will reduce the amount of distributions to shareholders, which would otherwise be necessary to relieve the Company of any liability for federal income tax. On December 22, 2010, the Regulated Investment Company Modernization Act of 2010 (the “Modernization Act”) was signed by the President. The Modernization Act changed the capital loss carryforward rules as they relate to regulated investment companies. Capital losses generated in tax years beginning after the date of enactment may now be carried forward indefinitely and retain the character of the original loss. Of the capital loss carryforwards at December 31, 2019, $45,137 are limited losses and available for use subject to annual limitation under Section 382. Of the capital losses at December 31, 2019, $16,815 are short-term and $28,322 are long term.
F-31
ASC 740 Accounting for Uncertainty in Income Taxes (ASC 740) provides guidance on the accounting for and disclosure of uncertainty in tax position. ASC 740 requires the evaluation of tax positions taken or expected to be taken in the course of preparing the Company's tax returns to determine whether the tax positions are “more-likely-than-not” of being sustained by the applicable tax authority. Tax positions deemed to meet the more-likely-than-not threshold are recorded as a tax benefit or expense in the current year. Based on its analysis of its tax position for all open tax years (the current and prior years, as applicable), the Company has concluded that it does not have any uncertain tax positions that met the recognition or measurement criteria of ASC 740. Such open tax years remain subject to examination and adjustment by tax authorities.
9. CAPITAL TRANSACTIONS
In March 2019, the Company implemented a stock buyback program pursuant to Rule 10b5-1 and Rule 10b-18 under the Exchange Act (the “buyback program”) authorizing us to repurchase our common stock in open market transactions in an aggregate amount of up to $5,000 through December 31, 2019, unless extended or terminated by our Board. During the year ended December 31, 2019, the Company purchased 589,719 shares under the buyback program at a weighted average price of $8.45 per share.
|
Month |
|
Total Number of Shares Purchased |
|
|
Average Price Per Share |
|
|
Total Number of Shares Purchased as Part of Publicly Announced Program |
|
|
Approximate Dollar Value of Shares that May Yet Be Purchased Under the Program (in thousands) |
|
||||
|
January 2019 |
|
|
- |
|
|
$ |
- |
|
|
|
- |
|
|
$ |
- |
|
|
February 2019 |
|
|
- |
|
|
|
- |
|
|
|
- |
|
|
|
- |
|
|
March 2019 |
|
|
192,000 |
|
|
|
8.27 |
|
|
|
192,000 |
|
|
|
3,406 |
|
|
April 2019 |
|
|
116,883 |
|
|
|
8.26 |
|
|
|
308,883 |
|
|
|
2,437 |
|
|
May 2019 |
|
|
277,044 |
|
|
|
8.65 |
|
|
|
585,927 |
|
|
|
33 |
|
|
June 2019 |
|
|
3,792 |
|
|
|
8.71 |
|
|
|
589,719 |
|
|
|
- |
|
|
July 2019 |
|
|
- |
|
|
|
- |
|
|
|
- |
|
|
|
- |
|
|
August 2019 |
|
|
- |
|
|
|
- |
|
|
|
- |
|
|
|
- |
|
|
September 2019 |
|
|
- |
|
|
|
- |
|
|
|
- |
|
|
|
- |
|
|
October 2019 |
|
|
- |
|
|
|
- |
|
|
|
- |
|
|
|
- |
|
|
November 2019 |
|
|
- |
|
|
|
- |
|
|
|
- |
|
|
|
- |
|
|
December 2019 |
|
|
- |
|
|
|
- |
|
|
|
- |
|
|
|
- |
|
|
|
|
|
|
|
|
|
|
|
|
|
|
|
|
|
|
|
|
Total |
|
|
589,719 |
|
|
$ |
8.45 |
|
|
|
589,719 |
|
|
$ |
- |
|
F-32
Below is the schedule of financial highlights of the Company:
|
|
|
For the Year Ended December 31, |
|
|
November 3, 2016 (Commencement of Operations) to December 31, |
|
||||||||||
|
|
|
2019 |
|
|
2018 |
|
|
2017 |
|
|
2016(6) |
|
||||
|
Per Share Data:(1) |
|
|
|
|
|
|
|
|
|
|
|
|
|
|
|
|
|
Net asset value, beginning of period |
|
$ |
10.34 |
|
|
$ |
12.42 |
|
|
$ |
13.52 |
|
|
$ |
14.41 |
|
|
Net investment income |
|
|
1.07 |
|
|
|
1.44 |
|
|
|
1.52 |
|
|
|
0.28 |
|
|
Net realized gains |
|
|
0.13 |
|
|
|
0.23 |
|
|
|
0.31 |
|
|
|
0.02 |
|
|
Net change in unrealized appreciation (depreciation) |
|
|
(1.96 |
) |
|
|
(2.51 |
) |
|
|
(2.13 |
) |
|
|
(1.05 |
) |
|
Net increase (decrease) in net assets resulting from operations |
|
|
(0.76 |
) |
|
|
(0.84 |
) |
|
|
(0.30 |
) |
|
|
(0.75 |
) |
|
Accretion from share buybacks |
|
|
0.10 |
|
|
|
- |
|
|
|
0.40 |
|
|
|
0.03 |
|
|
Distributions declared from net investment income(2) |
|
|
(1.05 |
) |
|
|
(1.24 |
) |
|
|
(1.20 |
) |
|
|
(0.17 |
) |
|
Net decrease resulting from distributions to common stockholders |
|
|
(1.05 |
) |
|
|
(1.24 |
) |
|
|
(1.20 |
) |
|
|
(0.17 |
) |
|
Net asset value, end of period |
|
$ |
8.63 |
|
|
$ |
10.34 |
|
|
$ |
12.42 |
|
|
$ |
13.52 |
|
|
Per share market value, end of period |
|
$ |
7.78 |
|
|
$ |
7.85 |
|
|
$ |
9.84 |
|
|
$ |
11.67 |
|
|
|
|
|
|
|
|
|
|
|
|
|
|
|
|
|
|
|
|
Shares outstanding, end of period |
|
|
10,062,682 |
|
|
|
10,652,401 |
|
|
|
10,652,401 |
|
|
|
12,790,880 |
|
|
Total return based on net asset value(3) |
|
|
(4.64 |
)% |
|
|
(7.31 |
)% |
|
|
0.69 |
% |
|
|
(5.30 |
)% |
|
Total return based on market value(3) |
|
|
15.17 |
% |
|
|
(8.35 |
)% |
|
|
(5.56 |
)% |
|
|
(2.03 |
)% |
|
|
|
|
|
|
|
|
|
|
|
|
|
|
|
|
|
|
|
Ratio/Supplemental Data: |
|
|
|
|
|
|
|
|
|
|
|
|
|
|
|
|
|
Net assets, end of period |
|
$ |
86,889 |
|
|
$ |
110,116 |
|
|
$ |
132,287 |
|
|
$ |
172,984 |
|
|
Ratio of total expenses to average net assets before waiver(4),(5),(7) |
|
|
16.46 |
% |
|
|
9.96 |
% |
|
|
7.87 |
% |
|
|
10.27 |
% |
|
Ratio of total expenses to average net assets after waiver(4),(5),(7) |
|
|
16.46 |
% |
|
|
9.96 |
% |
|
|
8.00 |
% |
|
|
9.99 |
% |
|
Ratio of incentive fees to average net assets(4),(7) |
|
|
2.80 |
% |
|
|
0.13 |
% |
|
|
2.89 |
% |
|
|
3.04 |
% |
|
Ratio of net investment income to average net assets(4),(5),(7) |
|
|
11.18 |
% |
|
|
12.30 |
% |
|
|
11.56 |
% |
|
|
10.52 |
% |
|
Portfolio turnover |
|
|
81 |
% |
|
|
67 |
% |
|
|
116 |
% |
|
|
27 |
% |
|
(1) |
The per share data was derived by using the weighted average shares outstanding during the period, except where such calculations deviate from those specified under the instructions to Form N-2. |
|
(2) |
The per share data for distributions declared reflects the actual amount of distributions of record per share for the period. |
F-33
|
(4) |
Average net assets used in ratio calculations is calculated using monthly ending net assets for the period presented. For the years ended December 31, 2019, 2018 and 2017 and the period ended December 31, 2016, average net assets were $97,791, $124,668, $151,986 and $179,366, respectively. |
|
(5) |
Annualized for periods less than one year. |
|
(6) |
Net asset value at the beginning of the period is the net asset value per share as of the consummation of the Merger. Management corrected this heading to correspond to the timing of the Merger. The heading was corrected to read “November 3, 2016 to December 31, 2016,” whereas it had previously been presented as “November 4, 2016 (commencement of operations) to December 31, 2016.” November 3, 2016 is the date on which the Merger closed; November 4, 2016 is the date on which the Company began operating as the combined entity resulting from the Merger. On November 3, 2016, the Company recognized approximately $3,444 of organization costs in connection with the Merger, which were included in calculating the beginning of the period net asset value, and amounted to ($0.27) per share, based on 12,889,104 shares issued and outstanding on November 3, 2016. |
|
(7) |
Management corrected the expense ratios to reflect $3,444 of one-time non-recurring organization costs incurred in connection with the merger/formation transaction in the applicable ratio. The ratio of expenses (without management fees, incentive fees and interest and credit facility expenses) to average net assets was corrected to 4.37% (an increase of 1.92 percentage points); the ratio of total expenses to average net assets before waiver was corrected to 10.27% (an increase of 1.92 percentage points), the ratio of total expenses to average net assets after waiver was corrected to 9.99% (an increase of 1.92 percentage points); and the ratio of net investment income to average net assets was corrected to 10.52% (a reduction of 1.92 percentage points). |
11. AFFILIATED AND CONTROLLED INVESTMENTS
Affiliated investment as defined by the Investment Company Act, whereby the Company owns between 5% and 25% of the portfolio company's outstanding voting securities and the investments are not classified as controlled investments. The aggregate fair value of non-controlled, affiliated investments at December 31, 2019 represented 47% of the Company's net assets.
Controlled investment as defined by the Investment Company Act, whereby the Company owns more than 25% of the portfolio company's outstanding voting securities or maintains the ability to nominate greater than 50% of the board representation. The aggregate fair value of controlled investments at December 31, 2019 represented 11% of the Company's net assets.
As a result of restructurings during the second quarter of 2018, Avanti Communications Group PLC became an affiliated investment and The Finance Company became a controlled investment. Both investments were previously considered to be non-affiliated, non-controlled investments.
F-34
Fair value as of December 31, 2019 along with transactions during the year then ended in these affiliated and controlled investments was as follows:
|
|
|
For the Year Ended December 31, 2019 |
|
|||||||||||||||||||||||||||||||||
|
Issue(1) |
|
Fair value at December 31, 2018 |
|
|
Gross Additions(2) |
|
|
Gross Reductions(3) |
|
|
Net Realized Gain (Loss) |
|
|
Change in Unrealized Appreciation (Depreciation) |
|
|
Fair value at December 31, 2019 |
|
|
Interest Income(4) |
|
|
Fee Income(4) |
|
|
Dividend Income |
|
|||||||||
|
Non-Controlled, Affiliated Investments |
|
|
|
|
|
|
|
|
|
|
|
|
|
|
|
|
|
|
|
|
|
|
|
|||||||||||||
|
Avanti Communications Group PLC |
|
|
|
|
|
|
|
|
|
|
|
|
|
|
|
|
|
|
|
|
|
|
|
|
|
|||||||||||
|
1.5 Lien, Secured Bond |
|
$ |
- |
|
|
$ |
8,413 |
|
|
$ |
- |
|
|
$ |
- |
|
|
$ |
- |
|
|
$ |
8,413 |
|
|
$ |
499 |
|
|
$ |
565 |
|
|
$ |
- |
|
|
1.5 Lien, Secured Bond - Unfunded |
|
|
- |
|
|
|
- |
|
|
|
- |
|
|
|
- |
|
|
|
- |
|
|
|
- |
|
|
|
- |
|
|
|
- |
|
|
|
- |
|
|
2nd Lien, Secured Bond |
|
|
29,400 |
|
|
|
4,437 |
|
|
|
- |
|
|
|
- |
|
|
|
(4,025 |
) |
|
|
29,812 |
|
|
|
4,517 |
|
|
|
2 |
|
|
|
- |
|
|
Equity (9% of class) |
|
|
6,231 |
|
|
|
- |
|
|
|
- |
|
|
|
- |
|
|
|
(3,878 |
) |
|
|
2,353 |
|
|
|
- |
|
|
|
- |
|
|
|
- |
|
|
|
|
|
35,631 |
|
|
|
12,850 |
|
|
|
- |
|
|
|
- |
|
|
|
(7,903 |
) |
|
|
40,578 |
|
|
|
5,016 |
|
|
|
567 |
|
|
|
- |
|
|
|
|
|
|
|
|
|
|
|
|
|
|
|
|
|
|
|
|
|
|
|
|
|
|
|
|
|
|
|
|
|
|
|
|
|
|
|
|
OPS Acquisitions Limited and Ocean Protection Services Limited |
|
|
|
|
|
|
|
|
|
|
|
|
|
|
|
|
|
|
|
|
|
|
|
|
|
|||||||||||
|
1st Lien, Secured Loan |
|
|
34 |
|
|
|
- |
|
|
|
- |
|
|
|
- |
|
|
|
(4 |
) |
|
|
30 |
|
|
|
- |
|
|
|
- |
|
|
|
- |
|
|
Equity (19% of class) |
|
|
- |
|
|
|
- |
|
|
|
- |
|
|
|
- |
|
|
|
- |
|
|
|
- |
|
|
|
- |
|
|
|
- |
|
|
|
- |
|
|
|
|
|
34 |
|
|
|
- |
|
|
|
- |
|
|
|
- |
|
|
|
(4 |
) |
|
|
30 |
|
|
|
- |
|
|
|
- |
|
|
|
- |
|
|
|
|
|
|
|
|
|
|
|
|
|
|
|
|
|
|
|
|
|
|
|
|
|
|
|
|
|
|
|
|
|
|
|
|
|
|
|
|
Totals |
|
$ |
35,665 |
|
|
$ |
12,850 |
|
|
$ |
- |
|
|
$ |
- |
|
|
$ |
(7,907 |
) |
|
$ |
40,608 |
|
|
$ |
5,016 |
|
|
$ |
567 |
|
|
$ |
- |
|
|
|
|
|
|
|
|
|
|
|
|
|
|
|
|
|
|
|
|
|
|
|
|
|
|
|
|
|
|
|
|
|
|
|
|
|
|
|
|
Controlled Investments |
|
|
|
|
|
|
|
|
|
|
|
|
|
|
|
|
|
|
|
|
|
|
|
|||||||||||||
|
The Finance Company |
|
|
|
|
|
|
|
|
|
|
|
|
|
|
|
|
|
|
|
|
|
|
|
|
|
|||||||||||
|
1st Lien, Secured Revolver |
|
$ |
959 |
|
|
$ |
6,014 |
|
|
$ |
6,167 |
|
|
$ |
- |
|
|
$ |
- |
|
|
$ |
806 |
|
|
$ |
118 |
|
|
$ |
36 |
|
|
$ |
- |
|
|
1st Lien, Secured Revolver - Unfunded |
|
|
- |
|
|
|
- |
|
|
|
- |
|
|
|
- |
|
|
|
- |
|
|
|
- |
|
|
|
- |
|
|
|
- |
|
|
|
- |
|
|
1st Lien, Secured Term Loan B |
|
|
801 |
|
|
|
- |
|
|
|
- |
|
|
|
- |
|
|
|
(557 |
) |
|
|
244 |
|
|
|
200 |
|
|
|
- |
|
|
|
- |
|
|
Equity (72% of class) |
|
|
- |
|
|
|
- |
|
|
|
- |
|
|
|
- |
|
|
|
- |
|
|
|
- |
|
|
|
- |
|
|
|
- |
|
|
|
- |
|
|
|
|
|
1,760 |
|
|
|
6,014 |
|
|
|
6,167 |
|
|
|
- |
|
|
|
(557 |
) |
|
|
1,050 |
|
|
|
318 |
|
|
|
36 |
|
|
|
- |
|
|
|
|
|
|
|
|
|
|
|
|
|
|
|
|
|
|
|
|
|
|
|
|
|
|
|
|
|
|
|
|
|
|
|
|
|
|
|
|
PE Facility Solutions, LLC |
|
|
|
|
|
|
|
|
|
|
|
|
|
|
|
|
|
|
|
|
|
|
|
|
|
|||||||||||
|
1st Lien, Secured Revolver |
|
|
1,948 |
|
|
|
38,676 |
|
|
|
40,624 |
|
|
|
- |
|
|
|
- |
|
|
|
- |
|
|
|
228 |
|
|
|
25 |
|
|
|
- |
|
|
1st Lien, Secured Revolver - Unfunded |
|
|
- |
|
|
|
- |
|
|
|
- |
|
|
|
- |
|
|
|
- |
|
|
|
- |
|
|
|
- |
|
|
|
- |
|
|
|
- |
|
|
1st Lien, Secured Term Loan A |
|
|
9,800 |
|
|
|
- |
|
|
|
9,800 |
|
|
|
- |
|
|
|
- |
|
|
|
- |
|
|
|
774 |
|
|
|
- |
|
|
|
- |
|
|
1st Lien, Secured Term Loan B |
|
|
6,695 |
|
|
|
768 |
|
|
|
6,534 |
|
|
|
154 |
|
|
|
(264 |
) |
|
|
819 |
|
|
|
775 |
|
|
|
- |
|
|
|
- |
|
|
Equity (87% of class) |
|
|
- |
|
|
|
- |
|
|
|
- |
|
|
|
- |
|
|
|
- |
|
|
|
- |
|
|
|
- |
|
|
|
- |
|
|
|
- |
|
|
|
|
|
18,443 |
|
|
|
39,444 |
|
|
|
56,958 |
|
|
|
154 |
|
|
|
(264 |
) |
|
|
819 |
|
|
|
1,777 |
|
|
|
25 |
|
|
|
- |
|
|
|
|
|
|
|
|
|
|
|
|
|
|
|
|
|
|
|
|
|
|
|
|
|
|
|
|
|
|
|
|
|
|
|
|
|
|
|
|
Prestige Capital Finance, LLC |
|
|
|
|
|
|
|
|
|
|
|
|
|
|
|
|
|
|
|
|
|
|
|
|
|
|||||||||||
|
Equity (80% of class) |
|
|
- |
|
|
|
7,466 |
|
|
|
- |
|
|
|
- |
|
|
|
260 |
|
|
|
7,726 |
|
|
|
- |
|
|
|
- |
|
|
|
1,600 |
|
|
|
|
|
|
|
|
|
|
|
|
|
|
|
|
|
|
|
|
|
|
|
|
|
|
|
|
|
|
|
|
|
|
|
|
|
|
|
|
Totals |
|
$ |
20,203 |
|
|
$ |
52,924 |
|
|
$ |
63,125 |
|
|
$ |
154 |
|
|
$ |
(561 |
) |
|
$ |
9,595 |
|
|
$ |
2,095 |
|
|
$ |
61 |
|
|
$ |
1,600 |
|
F-35
|
(2) |
Gross additions include increases resulting from new or additional portfolio investments, capitalized PIK interest, accretion of discounts and the exchange of one or more existing securities for one or more new securities. |
|
(3) |
Gross reductions include decreases resulting from principal collections related to investment repayments or sales and the exchange of one or more existing securities for one or more new securities. |
|
(4) |
Interest income includes accrued PIK interest. |
Fair value as of December 31, 2018 along with transactions during the year then ended in these affiliated and controlled investments was as follows:
|
|
|
For the Year Ended December 31, 2018 |
|
|||||||||||||||||||||||||||||||||
|
Issue(1) |
|
Fair value at December 31, 2017 |
|
|
Gross Additions(2) |
|
|
Gross Reductions(3) |
|
|
Net Realized Gain (Loss) |
|
|
Change in Unrealized Appreciation (Depreciation) |
|
|
Fair value at December 31, 2018 |
|
|
Interest Income(4) |
|
|
Fee Income |
|
|
Dividend Income |
|
|||||||||
|
Non-Controlled, Affiliated Investments |
|
|
|
|
|
|
|
|
|
|
|
|
|
|
|
|
|
|
|
|
|
|
|
|||||||||||||
|
OPS Acquisitions Limited and Ocean Protection Services Limited |
|
|
|
|
|
|
|
|
|
|
|
|
|
|
|
|
|
|
|
|
|
|
|
|
|
|||||||||||
|
Term Loan |
|
$ |
1,770 |
|
|
$ |
- |
|
|
$ |
- |
|
|
$ |
- |
|
|
$ |
(1,736 |
) |
|
$ |
34 |
|
|
$ |
- |
|
|
$ |
- |
|
|
$ |
- |
|
|
Equity (19% of class) |
|
|
- |
|
|
|
- |
|
|
|
- |
|
|
|
- |
|
|
|
- |
|
|
|
- |
|
|
|
- |
|
|
|
- |
|
|
|
- |
|
|
|
|
|
1,770 |
|
|
|
- |
|
|
|
- |
|
|
|
- |
|
|
|
(1,736 |
) |
|
|
34 |
|
|
|
- |
|
|
|
- |
|
|
|
- |
|
|
|
|
|
|
|
|
|
|
|
|
|
|
|
|
|
|
|
|
|
|
|
|
|
|
|
|
|
|
|
|
|
|
|
|
|
|
|
|
Avanti Communications Group PLC |
|
|
|
|
|
|
|
|
|
|
|
|
|
|
|
|
|
|
|
|
|
|
|
|
|
|||||||||||
|
Senior Secured Bond, 2nd Lien |
|
|
28,807 |
|
|
|
4,527 |
|
|
|
- |
|
|
|
- |
|
|
|
(3,934 |
) |
|
|
29,400 |
|
|
|
4,311 |
|
|
|
89 |
|
|
|
- |
|
|
Senior Secured Bond, 3rd Lien |
|
|
13,257 |
|
|
|
5,626 |
|
|
|
50,637 |
|
|
|
- |
|
|
|
31,754 |
|
|
|
- |
|
|
|
3,665 |
|
|
|
3 |
|
|
|
- |
|
|
Equity (9% of class) |
|
|
213 |
|
|
|
50,637 |
|
|
|
- |
|
|
|
- |
|
|
|
(44,619 |
) |
|
|
6,231 |
|
|
|
- |
|
|
|
- |
|
|
|
- |
|
|
|
|
|
42,277 |
|
|
|
60,790 |
|
|
|
50,637 |
|
|
|
- |
|
|
|
(16,799 |
) |
|
|
35,631 |
|
|
|
7,976 |
|
|
|
92 |
|
|
|
- |
|
|
|
|
|
|
|
|
|
|
|
|
|
|
|
|
|
|
|
|
|
|
|
|
|
|
|
|
|
|
|
|
|
|
|
|
|
|
|
|
Totals |
|
$ |
44,047 |
|
|
$ |
60,790 |
|
|
$ |
50,637 |
|
|
$ |
- |
|
|
$ |
(18,535 |
) |
|
$ |
35,665 |
|
|
$ |
7,976 |
|
|
$ |
92 |
|
|
$ |
- |
|
|
|
|
|
|
|
|
|
|
|
|
|
|
|
|
|
|
|
|
|
|
|
|
|
|
|
|
|
|
|
|
|
|
|
|
|
|
|
|
Controlled Investments |
|
|
|
|
|
|
|
|
|
|
|
|
|
|
|
|
|
|
|
|
|
|
|
|||||||||||||
|
PE Facility Solutions, LLC |
|
|
|
|
|
|
|
|
|
|
|
|
|
|
|
|
|
|
|
|
|
|
|
|
|
|||||||||||
|
Revolver |
|
$ |
- |
|
|
$ |
64,942 |
|
|
$ |
62,994 |
|
|
$ |
- |
|
|
$ |
- |
|
|
$ |
1,948 |
|
|
$ |
254 |
|
|
$ |
42 |
|
|
$ |
- |
|
|
Term Loan A |
|
|
9,900 |
|
|
|
- |
|
|
|
100 |
|
|
|
- |
|
|
|
- |
|
|
|
9,800 |
|
|
|
1,304 |
|
|
|
- |
|
|
|
- |
|
|
Term Loan B |
|
|
8,204 |
|
|
|
1,061 |
|
|
|
3,408 |
|
|
|
210 |
|
|
|
628 |
|
|
|
6,695 |
|
|
|
1,186 |
|
|
|
- |
|
|
|
- |
|
|
Equity (88% of class) |
|
|
- |
|
|
|
- |
|
|
|
- |
|
|
|
- |
|
|
|
- |
|
|
|
- |
|
|
|
- |
|
|
|
- |
|
|
|
- |
|
|
|
|
|
18,104 |
|
|
|
66,003 |
|
|
|
66,502 |
|
|
|
210 |
|
|
|
628 |
|
|
|
18,443 |
|
|
|
2,744 |
|
|
|
42 |
|
|
|
- |
|
|
|
|
|
|
|
|
|
|
|
|
|
|
|
|
|
|
|
|
|
|
|
|
|
|
|
|
|
|
|
|
|
|
|
|
|
|
|
|
The Finance Company |
|
|
|
|
|
|
|
|
|
|
|
|
|
|
|
|
|
|
|
|
|
|
|
|
|
|||||||||||
|
Senior Secured Bond |
|
|
1,993 |
|
|
|
- |
|
|
|
2,191 |
|
|
|
- |
|
|
|
198 |
|
|
|
- |
|
|
|
181 |
|
|
|
1 |
|
|
|
- |
|
|
Revolver |
|
|
- |
|
|
|
4,812 |
|
|
|
3,853 |
|
|
|
- |
|
|
|
- |
|
|
|
959 |
|
|
|
62 |
|
|
|
18 |
|
|
|
- |
|
|
Term Loan B |
|
|
- |
|
|
|
1,491 |
|
|
|
- |
|
|
|
- |
|
|
|
(690 |
) |
|
|
801 |
|
|
|
112 |
|
|
|
- |
|
|
|
- |
|
|
Equity (72% of class) |
|
|
- |
|
|
|
- |
|
|
|
- |
|
|
|
- |
|
|
|
- |
|
|
|
- |
|
|
|
- |
|
|
|
- |
|
|
|
- |
|
|
|
|
|
1,993 |
|
|
|
6,303 |
|
|
|
6,044 |
|
|
|
- |
|
|
|
(492 |
) |
|
|
1,760 |
|
|
|
355 |
|
|
|
19 |
|
|
|
- |
|
|
|
|
|
|
|
|
|
|
|
|
|
|
|
|
|
|
|
|
|
|
|
|
|
|
|
|
|
|
|
|
|
|
|
|
|
|
|
|
Totals |
|
$ |
20,097 |
|
|
$ |
72,306 |
|
|
$ |
72,546 |
|
|
$ |
210 |
|
|
$ |
136 |
|
|
$ |
20,203 |
|
|
$ |
3,099 |
|
|
$ |
61 |
|
|
$ |
- |
|
|
(1) |
Non-unitized equity investments are disclosed with percentage ownership in lieu of quantity. |
|
(2) |
Gross additions include increases resulting from new or additional portfolio investments, capitalized PIK interest, accretion of discounts and the exchange of one or more existing securities for one or more new securities. |
|
(3) |
Gross reductions include decreases resulting from principal collections related to investment repayments or sales and the exchange of one or more existing securities for one or more new securities. |
|
(4) |
Interest income includes accrued PIK interest. |
F-36
In accordance with Rules 3-09 and 4-08(g) of Regulation S-X (“S-X”), the Company must determine which of its unconsolidated controlled portfolio companies, if any, are considered to be “significant subsidiaries” under the conditions specified in S-X Rule 1-02(w). The Company determined that PE Facility Solutions, LLC (“PEFS”) and Prestige Capital Finance, LLC (“Prestige”) were significant subsidiaries under at least one of the conditions for the year ended December 31, 2019.
On July 31, 2019, we completed the sale of PEFS to Kellermeyer Bergensons Services for $23,750. Unaudited financial information of PEFS as of and for the years ended December 31, 2019 and 2018 and for the period from February 3, 2017 (inception) through December 31, 2017 has been included below (in thousands):
|
|
|
As of December 31, |
|
|||||||||
|
Balance Sheet |
|
2019 |
|
|
2018 |
|
|
2017 |
|
|||
|
Current assets |
|
$ |
1,701 |
|
|
$ |
8,519 |
|
|
$ |
9,986 |
|
|
Noncurrent assets |
|
|
- |
|
|
|
10,938 |
|
|
|
12,209 |
|
|
Total Assets |
|
|
1,701 |
|
|
|
19,457 |
|
|
|
22,195 |
|
|
|
|
|
|
|
|
|
|
|
|
|
|
|
|
Current liabilities |
|
|
1,171 |
|
|
|
7,925 |
|
|
|
8,048 |
|
|
Noncurrent liabilities |
|
|
- |
|
|
|
18,932 |
|
|
|
19,839 |
|
|
Total Liabilities |
|
|
1,171 |
|
|
|
26,857 |
|
|
|
27,887 |
|
|
|
|
|
|
|
|
|
|
|
|
|
|
|
|
Net Equity |
|
$ |
530 |
|
|
$ |
(7,400 |
) |
|
$ |
(5,692 |
) |
|
|
|
For the year ended December 31, |
|
|
For the period February 3, 2017 (inception) through |
|
||||||
|
Statement of Operations |
|
2019 |
|
|
2018 |
|
|
December 31, 2017 |
|
|||
|
Gross Revenues |
|
$ |
34,951 |
|
|
$ |
60,804 |
|
|
$ |
49,888 |
|
|
Cost of Sales |
|
|
(28,306 |
) |
|
|
(49,173 |
) |
|
|
(41,512 |
) |
|
Other income (expense) |
|
|
(9,418 |
) |
|
|
(13,338 |
) |
|
|
(14,068 |
) |
|
Gain on sale of assets |
|
|
10,704 |
|
|
|
- |
|
|
|
- |
|
|
Net Gain from Continuing Operations |
|
$ |
7,931 |
|
|
$ |
(1,707 |
) |
|
$ |
(5,692 |
) |
Audited financial statements for Prestige have been included as an exhibit to this Form 10-K.
12. SELECTED QUARTERLY FINANCIAL DATA (Unaudited)
The following are the quarterly results of operations for the years ended December 31, 2019 and 2018. The following information reflects all normal recurring adjustments necessary for a fair presentation of the information for the periods presented. The operating results for any quarter are not necessarily indicative of results for any future period.
|
|
|
Quarter Ended |
|
|||||||||||||||||||||||||||||
|
(in thousands) |
|
December 31, 2019 |
|
|
September 30, 2019 |
|
|
June 30, 2019 |
|
|
March 31, 2019 |
|
|
December 31, 2018 |
|
|
September 30, 2018 |
|
|
June 30, 2018 |
|
|
March 31, 2018 |
|
||||||||
|
Investment income |
|
$ |
7,012 |
|
|
$ |
7,002 |
|
|
$ |
6,711 |
|
|
$ |
6,313 |
|
|
$ |
6,913 |
|
|
$ |
6,181 |
|
|
$ |
7,162 |
|
|
$ |
7,498 |
|
|
Net investment income |
|
|
2,539 |
|
|
|
2,619 |
|
|
|
2,995 |
|
|
|
2,784 |
|
|
|
2,704 |
|
|
|
2,686 |
|
|
|
6,078 |
|
|
|
3,866 |
|
|
Net realized and unrealized gains (losses) |
|
|
(4,130 |
) |
|
|
(12,265 |
) |
|
|
(7,373 |
) |
|
|
5,284 |
|
|
|
(15,177 |
) |
|
|
2,173 |
|
|
|
(3,430 |
) |
|
|
(7,905 |
) |
|
Net decrease in net assets resulting from operations |
|
$ |
(1,591 |
) |
|
$ |
(9,646 |
) |
|
$ |
(4,378 |
) |
|
$ |
8,068 |
|
|
$ |
(12,473 |
) |
|
$ |
4,859 |
|
|
$ |
2,648 |
|
|
$ |
(4,039 |
) |
|
Basic and diluted earnings (losses) per common share |
|
$ |
(0.11 |
) |
|
$ |
(0.96 |
) |
|
$ |
(0.43 |
) |
|
$ |
0.76 |
|
|
$ |
(1.18 |
) |
|
$ |
0.46 |
|
|
$ |
0.25 |
|
|
$ |
(0.38 |
) |
|
Net asset value per common share at end of quarter |
|
$ |
8.63 |
|
|
$ |
9.09 |
|
|
$ |
10.30 |
|
|
$ |
10.89 |
|
|
$ |
10.34 |
|
|
$ |
12.00 |
|
|
$ |
11.79 |
|
|
$ |
11.79 |
|
F-37
|
13. |
SUBSEQUENT EVENTS |
Subsequent events after the have been evaluated through the date the financial statements were available to be issued. Other than the items discussed below, the Company has concluded that there is no impact requiring adjustment or disclosure in the consolidated financial statements.
In January 2020:
|
|
• |
we bought $1,148 of par value of Tensar Corp. first lien secured loan at approximately 95% of par value. |
|
|
• |
we bought $2,424 of par value of ASP Chromaflo Technologies Corp. (“Chromaflo”) second lien secured loan at approximately 97% of par value. |
|
|
• |
we sold $3,000 of par value of Cooke Omega Investments, Inc. first lien notes at approximately 102% of par value. |
|
|
• |
we bought $2,000 of par value of Viasat Inc. receivable at 90% of par value. |
|
|
• |
we sold $4,000 of par value of Shearer's Foods, LLC second lien secured loan at approximately 100% of par value. |
|
|
• |
we bought $4,375 of par value of Perforce Software, Inc. first lien revolving loan at approximately 92% of par value. |
|
|
• |
we bought $8,026 of par value of Greenway Health, LLC first lien revolving loan at 90% of par value. |
In February 2020:
|
|
• |
we sold $15,883 of par value of Commercial Barge Line Company first lien secured loan at approximately 34% of par value. |
|
|
• |
we bought $4,000 of par value of Endurance International first lien revolving loan at 98% of par value. |
|
|
• |
we bought $3,000 of par value of Chromaflo second lien secured loan at approximately 99% of par value. |
In March 2020:
|
|
• |
we sold $2,000 of par value of Mitchell International, Inc. second lien secured loan at 91% of par value. |
|
|
• |
we sold $4,000 of par value of Finastra Group Holdings, Ltd. second lien secured loan at 91% of par value. |
|
|
• |
we sold $2,500 of par value of Peninsula Pacific Entertainment, LLC first lien secured loan at 92% of par value. |
The recent global outbreak of COVID-19 has disrupted economic markets and the economic impact, duration and spread of the COVID-19 virus is uncertain at this time. The operational and financial performance of the portfolio companies in which we make investments may be significantly impacted by COVID-19, which may in turn impact the valuation of our investments.
F-38