Attached files
| file | filename |
|---|---|
| EX-32.1 - EX-32.1 - TechTarget Inc | ttgt-ex321_9.htm |
| EX-31.2 - EX-31.2 - TechTarget Inc | ttgt-ex312_6.htm |
| EX-31.1 - EX-31.1 - TechTarget Inc | ttgt-ex311_8.htm |
| EX-23.2 - EX-23.2 - TechTarget Inc | ttgt-ex232_10.htm |
| EX-23.1 - EX-23.1 - TechTarget Inc | ttgt-ex231_1187.htm |
| EX-21.1 - EX-21.1 - TechTarget Inc | ttgt-ex211_11.htm |
| EX-10.33 - EX-10.33 - TechTarget Inc | ttgt-ex1033_770.htm |
| EX-4.2 - EX-4.2 - TechTarget Inc | ttgt-ex42_768.htm |
UNITED STATES
SECURITIES AND EXCHANGE COMMISSION
Washington, D.C. 20549
Form 10-K
|
☑ |
ANNUAL REPORT PURSUANT TO SECTION 13 OR 15(d) OF THE SECURITIES EXCHANGE ACT OF 1934 |
For the fiscal year ended December 31, 2019
|
☐ |
TRANSITION REPORT PURSUANT TO SECTION 13 OR 15(d) OF THE SECURITIES EXCHANGE ACT OF 1934 |
For the transition period from to
Commission file number: 1-33472

TECHTARGET, INC.
(Exact name of registrant as specified in its charter)
|
Delaware |
04-3483216 |
|
(State or other jurisdiction of incorporation or organization) |
(I.R.S. Employer Identification No.) |
275 Grove Street
Newton, Massachusetts 02466
(Address of principal executive offices) (zip code)
(617) 431-9200
(Registrant’s telephone number, including area code)
Securities registered pursuant to Section 12(b) of the Exchange Act:
|
Title of each class |
|
Trading Symbol(s) |
|
Name of each exchange on which registered |
|
Common Stock, $0.001 Par Value |
|
TTGT |
|
Nasdaq Global Market |
Securities registered pursuant to Section 12(g) of the Exchange Act:
None.
Indicate by check mark if the registrant is a well-known seasoned issuer, as defined in Rule 405 of the Securities Act. Yes ☐ No ☑
Indicate by check mark if the registrant is not required to file reports pursuant to Section 13 or Section 15(d) of the Exchange Act. Yes ☐ No ☑
Indicate by check mark whether the registrant (1) has filed all reports required to be filed by Section 13 or 15(d) of the Securities Exchange Act of 1934 during the preceding 12 months (or for such shorter period that the registrant was required to file such reports), and (2) has been subject to such filing requirements for the past 90 days. Yes ☑ No ☐
Indicate by check mark whether the registrant has submitted electronically every Interactive Data File required to be submitted pursuant to Rule 405 of Regulation S-T (§ 232.405 of this chapter) during the preceding 12 months (or for such shorter period that the registrant was required to submit such files). Yes ☑ No ☐
Indicate by check mark whether the registrant is a large accelerated filer, an accelerated filer, a non-accelerated filer a smaller reporting company or an emerging growth company. See the definitions of the "large accelerated filer," "accelerated filer," "non-accelerated filer," "smaller reporting company" and “emerging growth company” in Rule 12b-2 of the Exchange Act.
|
Large Accelerated Filer |
☐ |
Accelerated Filer |
☑ |
|
Non-Accelerated Filer |
☐ |
Smaller reporting company |
☐ |
|
|
Emerging Growth Company |
☐ |
|
If an emerging growth company, indicate by check mark if the registrant has elected not to use the extended transition period for complying with any new or revised financial accounting standards provided pursuant to section 13(a) of the Exchange Act. ☐
Indicate by check mark whether the registrant is a shell company (as defined in Rule 12b-2 of the Exchange Act). Yes ☐ No ☑
The aggregate market value of the registrant’s common stock held by non-affiliates of the registrant was approximately $384.1 million as of June 30, 2019 (based on a closing price of $21.25 per share as quoted by the Nasdaq Global Market as of such date). In determining the market value of non-affiliate common stock, shares of the registrant’s common stock beneficially owned by officers, directors and affiliates have been excluded. This determination of affiliate status is not necessarily a conclusive determination for other purposes.
The registrant had 28,028,446 shares of Common Stock, $0.001 par value per share, outstanding as of February 29, 2020.
DOCUMENTS INCORPORATED BY REFERENCE
Part III of this Annual Report on Form 10-K incorporates by reference certain information from the registrant’s definitive proxy statement for the 2020 annual meeting of stockholders, which the registrant intends to file pursuant to Regulation 14A with the Securities and Exchange Commission not later than 120 days after the registrant’s fiscal year end of December 31, 2019.
|
PART I |
|
|
|
|
|
|
|
|
|
|
|
Item 1. |
|
|
3 |
|
|
|
|
|
|
|
|
Item 1A. |
|
|
16 |
|
|
|
|
|
|
|
|
Item 1B. |
|
|
29 |
|
|
|
|
|
|
|
|
Item 2. |
|
|
29 |
|
|
|
|
|
|
|
|
Item 3. |
|
|
29 |
|
|
|
|
|
|
|
|
PART II |
|
|
|
|
|
|
|
|
|
|
|
Item 5. |
|
|
30 |
|
|
|
|
|
|
|
|
Item 6. |
|
|
33 |
|
|
|
|
|
|
|
|
Item 7. |
|
Management’s Discussion and Analysis of Financial Condition and Results of Operations |
|
35 |
|
|
|
|
|
|
|
Item 7A. |
|
|
50 |
|
|
|
|
|
|
|
|
Item 8. |
|
|
51 |
|
|
|
|
|
|
|
|
Item 9. |
|
Changes in and Disagreements with Accountants on Accounting and Financial Disclosure |
|
79 |
|
|
|
|
|
|
|
Item 9A. |
|
|
79 |
|
|
|
|
|
|
|
|
Item 9B. |
|
|
81 |
|
|
|
|
|
|
|
|
PART III |
|
|
|
|
|
|
|
|
|
|
|
Item 10. |
|
|
81 |
|
|
|
|
|
|
|
|
Item 11. |
|
|
81 |
|
|
|
|
|
|
|
|
Item 12. |
|
Security Ownership of Certain Beneficial Owners and Management and Related Stockholder Matters |
|
81 |
|
|
|
|
|
|
|
Item 13. |
|
Certain Relationships and Related Transactions, and Director Independence |
|
81 |
|
|
|
|
|
|
|
Item 14. |
|
|
81 |
|
|
|
|
|
|
|
|
PART IV |
|
|
|
|
|
|
|
|
|
|
|
Item 15. |
|
|
82 |
|
|
|
|
|
|
|
|
|
|
|
83 |
|
|
|
|
|
|
|
|
Item 16. |
|
|
85 |
|
|
|
|
|
|
|
|
|
|
|
86 |
2
The following discussion and analysis of our financial condition and results of operations should be read in conjunction with the consolidated financial statements and accompanying notes included elsewhere in this Annual Report on Form 10-K. This discussion and analysis contains forward-looking statements that involve risks, uncertainties and assumptions. Our actual results could differ materially from those anticipated in these forward-looking statements as a result of various factors. Please refer to our “Forward-Looking Statements” section on page 49.
Overview
TechTarget, Inc. (“we” or “the Company”) is a Delaware corporation incorporated on September 14, 1999. Through continued innovation around our specialized online content for buyers of enterprise technology solutions we have become a global leader in purchase intent-driven marketing and sales services that deliver business impact for enterprise business-to-business “B2B” technology companies. Our offerings enable B2B technology companies to better identify, reach and influence corporate enterprise technology decision makers actively researching specific enterprise technology purchases. We improve a vendors’ ability to impact these audiences for business growth using advanced targeting, analytics and data services complemented with customized marketing programs that integrate demand generation, brand marketing and advertising techniques.
Enterprise technology has become increasingly specialized, and the websites within our network of over 140 websites address every major enterprise technology segment such as storage, security, networking, and business applications. Enterprise technology and business professionals rely on us for key decision support information tailored to their specific areas of responsibility.
We enable enterprise technology and business professionals to navigate the complex and rapidly-changing enterprise technology landscape where purchasing decisions can have significant financial and operational consequences. Our content strategy includes three primary sources which enterprise technology and business professionals use to assist them in their pre-purchase research: independent content provided by our professionals, vendor-generated content provided by our customers and member-generated, or peer-to-peer, content. In addition to utilizing our independent editorial content, registered members appreciate the ability to deepen their pre-purchase research by accessing the extensive vendor supplied content available across our website network. Likewise, these members derive significant additional value from the ability our network provides to seamlessly interact with and contribute to information exchanges in a given field.
We had approximately 20.5 million and 20.0 million registered members – our “audiences” – as of December 31, 2019 and 2018, respectively. While the size of our registered member base does not provide direct insight into our customer numbers or our revenues, the value of our services sold to our customers is a direct result of the breadth and reach of this content footprint. This footprint creates the opportunity for our clients to gain business leverage by targeting our audiences through customized marketing programs. Likewise, the behavior exhibited by these audiences enables us to provide our customers with data products to improve their marketing and sales efforts. The targeted nature of our member base enables B2B technology companies to reach a specialized audience efficiently because our content is highly segmented and aligned with the B2B technology companies’ specific products. With it, we have developed a broad customer base and, in 2019, delivered marketing and sales services programs to approximately 1,400 customers.
Please refer to the section below titled “Our Strategy” regarding our longer-term expansion plans and to Item 6, Selected Financial Data, for detailed information about our revenues, net income, total assets and other financial results.
Business Trends
Our business is impacted by macro-economic conditions, including enterprise technology industry trends and foreign currency markets. Because our customers are B2B technology companies, the success of our business is intrinsically linked to the health, and subject to the market conditions, of the enterprise technology industry. The performance of the United States (“U.S.”) dollar against foreign currencies impacts our results because our largest customers derive a significant amount of revenue from outside the U.S. In years when the U.S. dollar is strong and foreign currencies are relatively weak, our legacy global customers’ revenues and marketing budgets are adversely impacted, which impacts our revenues. Conversely, when the U.S. dollar is weak against foreign currencies, revenues attributable to our largest customers can be positively impacted. Our largest 100 customers, excluding those companies we consider our legacy global customers and our remaining customers, which includes venture-backed start-ups, customers generally have less exposure to non-U.S. business. Thus, these customers, while still impacted by general technology industry trends, tend to be less impacted by foreign currency market trends, which generally results in less of an impact on their marketing budgets and, in turn, our revenues.
3
Available Information
Our website address is www.techtarget.com. We make our Annual Reports on Form 10-K, Quarterly Reports on Form 10-Q and Current Reports on Form 8-K, and amendments to these reports, available free of charge through our website as soon as reasonably practicable after we electronically file such material with, or furnish such material to, the Securities and Exchange Commission (“SEC”). The SEC maintains a website, at www.sec.gov, that contains reports, proxy and information statements and other information regarding issuers that are filed electronically. Our Code of Business Conduct and Ethics, and any amendments to our Code of Business Conduct and Ethics, Corporate Governance Guidelines and Board Committee Charters, are also available on our website. The information contained on our website is not a part of, or incorporated by reference into, this Annual Report on Form 10-K.
Industry Background
Enterprise technology and business professionals’ reliance on online content to research major purchase decisions, and the transition by B2B technology companies of marketing expenditures from offline to online channels, have been consistent trends that have benefitted us. Going forward, there are some important related trends that we believe our business strategy is well positioned to benefit from:
|
|
• |
Technology Marketers and Sales Organizations are Increasingly Using Audience Data to Drive Decisions. In the enterprise technology market in particular, companies are increasingly using data to help them determine which prospective accounts should be prioritized for marketing or sales follow-up. We believe we are uniquely positioned to provide data around the purchase intent of specific prospective accounts and potential buyers because of the nature of content we create and our product focus in these data-driven areas. |
|
|
• |
There is a Continued Focus on the Ability to Measure and Improve Return on Investment (“ROI”). Our customers are increasingly focused on measuring and improving their ROI in marketing and sales. Before the advent of internet-based marketing, there were limited tools for accurately measuring the results of such activities in a timely fashion. The internet has enabled B2B technology companies to track individual members and their responses to marketing. With the appropriate technology, vendors now have the ability to assess and benchmark the efficacy of their online programs cost-effectively and in real-time. We believe our offerings benefit as our customers continue to leverage insights gained from this measurement, and that the data and related services we are providing will assist them to optimize their marketing programs going forward. |
Enterprise Technology Purchasing
Over the past two decades, enterprise technology purchases have grown in size and complexity. The enterprise technology market comprises multiple large sectors such as storage, security and networking. Each of these sectors can be further divided into sub-sectors addressing more granular areas of specialization within an enterprise’s technology environment. For example, within the multi-billion-dollar storage sector, there are numerous sub-sectors such as storage area networks, storage management software and backup software. Furthermore, the products – and therefore the enterprise technology – in each sub-sector may represent entirely independent markets. For example, the market around backup software for use in Windows® environments can be completely distinct from that addressing Linux® environments.
In view of the complexities, high cost and importance of enterprise technology decision-making, enterprise technology purchasing decisions are increasingly being researched by teams of functional experts with specialized knowledge in their particular areas, rather than by one central enterprise technology professional, such as a Chief Information Officer (“CIO”). For these reasons and more, the enterprise technology purchasing process typically requires a lengthy sales cycle. The “sales cycle” is the sequence of stages that a typical customer goes through when deciding to purchase a product or service from a particular vendor. Key stages of a sales cycle typically consist of a customer recognizing or identifying a need; identifying possible solutions and vendors through research and evaluation; and finally, making a decision to purchase the product or service. Through various stages of this sales cycle, enterprise technology and business professionals rely upon multiple inputs from independent experts, and peers. Although there is a vast amount of information available, the aggregation and validation of these inputs from various sources can be difficult and time-consuming.
The long sales cycle for enterprise technology purchases, as well as customers’ need for significant information support, requires substantial investment on the part of B2B technology companies. These realities drive the significant marketing expenditures observable in the enterprise technology market. In addition, given the continued acceleration of technological change, at any given time, there are often multiple solution possibilities to any enterprise technology or business need. With each new product or product enhancement, B2B technology companies implement new marketing outreach, and as a result enterprise technology and business professionals are required to continuously engage in research to stay abreast of the latest developments that could benefit their companies.
4
The Opportunity
Prior to widespread internet adoption, enterprise technology buyers researching purchases relied largely on traditional enterprise technology media, consisting of broad print publications and large industry trade shows. Today, enterprise technology and business professionals are demanding specialized online content tailored to the specialized sub-sectors of enterprise technology solutions that they must understand. As enterprise technology, vendors and business professionals have all become much more specialized, the internet has become a preferred purchase research medium, which has dramatically increased research activity, accelerated information consumption and improved professional decision-making.
B2B technology companies seek high-ROI marketing opportunities that can provide them access to the specific sectors of enterprise technology buyers aligned with the solutions they sell. To be more efficient and effective, they need to distinguish these prospective buyers from accounts or individuals who are not yet ready to engage in the buying process. Thus, they look for assistance in identifying the specific accounts and individuals who are actively researching upcoming purchases. To more quickly and successfully position their respective solutions against alternatives being considered, they also seek assistance from marketing service providers to help influence these audiences by utilizing data driven insights to enable advanced demand-generating content marketing and targeted branding.
Our Solutions
Enterprise technology and business professionals rely on our content platform for decision support information tailored to their specific purchasing needs. Our specialized content strategy and comprehensive services enable B2B technology companies to better identify, understand, reach and influence enterprise technology and business professionals who are actively researching purchases in specific enterprise technology sectors. Our solution benefits from the following competitive advantages:
|
|
• |
Large and Growing Community of Registered Members. We had approximately 20.5 million registered members as of December 31, 2019. The targeted nature of our member base enables B2B technology companies to reach a specialized audience efficiently because our content is highly segmented and aligned with the B2B technology companies' specific products and services. |
|
|
• |
Strong Customer Relationships. We have developed a broad customer base. During 2019, we delivered marketing services programs for approximately 1,400 B2B technology companies, who are our customers. |
|
|
• |
Substantial Experience in Online Content and Purchase Intent Data. We have over 20 years of experience in developing our online information content, with a focus on providing targeted information to enterprise technology and business professionals and a highly refined audience to technology vendors. Our experience enables us to develop relevant new online properties rapidly and to acquire and efficiently integrate select properties to further serve enterprise technology and business professionals. We have also developed an expertise in implementing integrated, targeted marketing campaigns designed to maximize the measurability of, and improvement in, ROI. |
|
|
• |
Proprietary Data on the Research Behavior of our Registered Members and Site Visitors. Through our analytical platform, we collect information on millions of interactions that our members and visitors (and the companies, or accounts, that they are associated with) have with the content on our websites and that we send to them via email. Collection and analysis of this information allows us to increase the relevance of our informational offerings to our members and improves our customers’ ROI by allowing us to deliver better prospects to them more efficiently. This analytics platform not only guides everything we do on our own properties; it is also available to our customers in a variety of forms to aid them in directly optimizing their efforts. |
|
|
• |
Significant Brand Recognition among B2B technology companies and Enterprise Technology and Business Professionals. Our brand is well-recognized by B2B technology companies who value our integrated marketing capabilities and comprehensive high-ROI services. At the same time, our sector-specific websites command brand recognition among enterprise technology and business professionals, who rely on these websites because of their specificity and depth of content. |
5
Our solutions benefit enterprise technology, business professionals and B2B technology companies in the following ways:
Benefits to Enterprise Technology and Business Professionals
|
|
• |
Provide Access to Integrated, Sector-Specific Content. Our websites provide enterprise technology and business professionals with sector-specific content from the three fundamental sources they value when researching enterprise technology purchasing decisions: industry experts, peers and vendors. Our independent staff creates content specific to the sectors we serve and the key sub-sectors within them. This content is integrated with other content generated by our network of third-party industry experts, member-generated content and content from B2B technology companies. The reliability, breadth, depth, and accessibility of our content offerings enable enterprise technology and business professionals to make more informed purchases. |
|
|
• |
Increase Efficiency of Purchasing Decisions. By accessing targeted and specialized information, enterprise technology and business professionals are able to research important purchasing decisions more effectively. Our integrated content offering minimizes the time spent searching for and evaluating content and maximizes the time available for assimilating quality information. To support enterprise technology and business professionals’ information consumption preferences, we provide this specialized, targeted content through a variety of media types matching the critical stages within the purchase decision process. |
Benefits to B2B technology companies
|
|
• |
Provide Unique Data About In-Market Prospects. Our Activity IntelligenceTM analytical product platform captures and interprets the content consumption behaviors of our large base of targeted enterprise technology and business professional members as they research technology needs. This allows us to provide B2B technology companies with powerful behavioral insight to help them more effectively identify and pursue prospective buyers. Vendors who are increasingly making use of data to drive their marketing and sales strategies make use of our offerings as a key input to driving their progress against this objective. |
|
|
• |
Target Active Buyers Efficiently. Our highly targeted content attracts specific, targeted audiences who are actively researching purchasing decisions. Using our database of registered members and information we collect about their product interests, we are able to accurately target those registered members most likely to be of value to B2B technology companies, and support vendor-customer’s execution with scalable marketing services programs that help influence these prospective buyers. |
|
|
• |
Generate Measurable Results. Our targeted online content offerings enable us to generate and collect valuable business information about each member and his or her technology preferences. As registered members access content, we are able to build a profile of their technology interests, and their companies’ interests, as they evolve over time. Through experience, we have identified patterns that are indicative of purchase intent. We leverage this insight to improve ROI on the programs we execute for our clients by focusing specifically where active demand exists. We provide this intelligence directly to B2B technology companies for their own use. This helps them drive continuous improvement in their own marketing and sales workflows and outcomes, whether focused specifically on prospects we provide them or on those they have otherwise obtained, which our information enriches and makes more actionable. |
|
|
• |
Maximize Awareness. As a leading distributor of B2B technology company-provided enterprises technology white papers, webcasts, videocasts, virtual events and podcasts, we offer B2B technology companies the opportunity to educate enterprise technology and business professionals during the research process, prior to any direct interaction with vendor salespeople. By distributing proprietary content and reaching their target audiences via our platform, B2B technology companies can educate audiences, demonstrate much of their product capabilities and proactively brand themselves as specific product leaders. As a result, enterprise technology and business professionals are more aware of and more knowledgeable about the vendor’s specifications and product and therefore more likely to consider the vendor. Increased consideration of our B2B technology customers’ offerings combined with accurate purchase intent insight around those prospects who are actively researching a purchase significantly reduces vendor prospecting costs and time expended on inactive accounts. |
6
Our Strategy
Our goal is to deliver superior performance by continuously enhancing our position as a global leader in purchase intent-driven marketing and sales services that deliver business impact for B2B technology companies by strengthening our offerings in our three core capability areas – our specialized content that connects enterprise technology and business professionals with B2B technology companies in the sectors and sub-sectors that we serve, the purchasing intent insight analytics and data services our content and member traffic enables, and the marketing services we provide to clients to help meet their business growth objectives.
In order to achieve this goal, we intend to:
|
|
• |
Expand Long-term Contractual Relationships with Customers. Several of our newly introduced data-enabled marketing products are being offered to our customers on a subscription basis, on multiple quarter, annual or longer agreements. We intend to expand the number of subscription contracts with our customers, which allows us to work more closely with them in achieving their marketing objectives over an extended period and provide us with stable revenue streams from the continued growth of these products and our successful renewal efforts. |
|
|
• |
Expand into Complementary Sectors. We intend to complement our current offerings and content by continuing to expand our business in order to capitalize on strategic opportunities in existing, adjacent, or new sectors that we believe to be well-suited to our business model and core competencies. Based on our experience, we believe we are able to capitalize rapidly and cost-effectively on new market opportunities. |
|
|
• |
Continue to Expand Our International Presence. We intend to continue to expand our reach into our addressable market by increasing our presence in countries outside the U.S. We have pursued this strategy by launching our own websites directed at members in the United Kingdom, India, Spain, France, China, Australia, and Singapore, or by acquiring specific properties or companies with attractive properties. We previously expanded by acquiring the Computer Weekly and MicroScope online properties in the United Kingdom and E-Magine Médias SAS, which we call LeMagIT, in France. More recently, we launched German and Portuguese language websites as well as websites directed towards members in Latin America. We expect to further penetrate foreign markets by directly launching additional sector-specific websites directed at these foreign locales and at additional international markets and, if deemed appropriate, by making strategic acquisitions and investments in overseas entities. During 2019, approximately 33% of our revenues were derived from international geo-targeted programs, where our target audience is outside North America. We believe that our integrated product offering across regions continues to resonate with international marketers and is contributing to our successful results. We plan on continuing to invest in these capabilities as we seek opportunities to increase our global reach. |
|
|
• |
Selectively Acquire or Partner with Complementary Businesses. We have used acquisitions in the past as a means of expanding our content and product and service offerings, web traffic and registered members. Our acquisitions to date can be classified into three categories: content-rich blogs or other individually published sites, typically generating less than $1 million in annual revenues; early stage revenue sites, typically generating between $1 million and $5 million in annual revenues; and later stage revenue sites, typically generating greater than $5 million in annual revenues. We intend to continue to pursue selected acquisition or partnership opportunities in our core markets and in adjacent markets for products with similar characteristics. |
Platform and Content
Our integrated content platform consists of a network of specialized websites that serve the needs of enterprise technology and business professionals who are making corporate purchase decisions. At critical stages of the purchase decision process, these content offerings through different channels meet enterprise technology and business professionals’ needs for expert, peer and B2B technology company information and provide a platform on which B2B technology companies can launch targeted marketing campaigns that generate measurable, high ROI.
7
The table below provides a representation of the key market opportunities we address for the B2B technology companies who are our customers
Audience: Market Categories Sites
8
Audience: Market Categories Sites (cont.)
Market Categories
Based upon the logical clustering of our members’ respective job responsibilities and the marketing focus of the products being promoted by our customers, we currently categorize our content offerings to address the key market opportunities and audience extensions across a portfolio of distinct market categories. Each of these marketing categories services a wide range of enterprise technology sectors and sub-sectors and is driven by the key areas of enterprise technology and business professionals’ interests described below:
|
|
• |
Security. Every aspect of enterprise computing now depends on secure connectivity, data and applications. The security sector is constantly growing to adapt to new forms of threats and to secure new technologies such as mobile devices, wireless networks, virtualized systems and cloud computing solutions. Compliance regulations, cloud computing adoption, and highly publicized identity and intellectual property thefts are driving interest and investment in increasingly sophisticated security solutions that supplement common “perimeter” security solutions such as firewalls and antivirus software. Our online properties in this sector, which include SearchSecurity.com, SearchCloudSecurity.com, SearchFinancialSecurity.com, and SearchMidMarketSecurity.com, offer navigable and structured guides on B2B technology companies and enterprise technology solutions in key sub-sectors such as network security, intrusion defense, identity management and authentication, data and application security, security-as-a-service, cloud security and security information management software. |
|
|
• |
Networking. Broadly defined, the networking market includes the hardware, software and services involved in the infrastructure and management of both enterprise and carrier voice and data networks. As new sub-sectors of networking have emerged and grown in importance, technology networking professionals have increasingly focused their investments in such technologies as VoIP, wireless and mobile computing, social networking and collaboration, application performance, data center fabrics, convergence, software-defined networking (“SDN”) and providing cloud services. Our online properties in this sector, which include SearchNetworking.com, and SearchUnifiedCommunications.com aim to address the specialized needs of these technology networking professionals by offering content targeted specifically to these emerging growth areas. |
|
|
• |
Storage. The storage sector consists of the market for disk storage systems and tape hardware and software that store and manage data. Growth is fueled by trends inherent in the industry, such as the ongoing need to maintain and supplement data stores, and by external factors, such as expanded compliance regulations and increased focus on disaster recovery solutions. Recent trends reflect an increased emphasis on solid state storage and cloud storage. At the same time, |
9
|
|
established storage sub-sectors, such as backup and Storage Area Networks (“SANs”) have been invigorated by new technologies such as disk-based backup, continuous data protection, data deduplication and storage virtualization. Our online properties in this sector, which include SearchStorage.com, SearchDataBackup.com, and SearchDisasterRecovery.com, address enterprise technology and business professionals seeking solutions in key sub-sectors such as fibre channel SANs, solid state storage, virtualization IP & iSCSI SANs, Network Attached Storage (“NAS”), backup hardware and software, and storage management software. |
|
|
• |
Data Center and Virtualization Technologies. Data centers house the systems and components, such as servers, storage devices, routers and switches, utilized in large-scale, mission-critical computing environments. A variety of trends and new technologies have reinvigorated the data center as a priority among IT and business professionals. Technologies, such as blade servers, server virtualization, converged infrastructure and cloud computing, have driven renewed investment in data center-class computing solutions. Server consolidation is a focus, driven by the decline in large-scale computing prices relative to distributed computing models. These trends have put pressure on existing data center infrastructure and are driving demand for solutions that address this. For example, the deployment of high-density servers has led to increased heat output and energy consumption in data centers. Power and cooling have thus become a significant cost in enterprise technology budgets, making data center energy efficiency a priority. Our key online properties in this sector provide targeted information on the B2B technology companies technologies and solutions that serve these sub-sectors. Our properties in this sector include sites such as SearchDataCenter.com, covering disaster recovery, power and cooling, mainframe and UNIX® servers, systems management, and server consolidation, and SearchCloudComputing.com and SearchAWS.com, which cover private, public and hybrid cloud infrastructure. SearchServerVirtualization.com covers the decision points and alternatives for implementing server virtualization, while SearchVMware.com focuses on managing and building out virtual environments on the most widely installed server virtualization platform. SearchConvergedInfrastructure.com covers converged and hyper-converged infrastructure solutions. SearchITOperations.com covers DevOps, the impact of Agile Development, containers, microservices and event-driven computing upon enterprise technology operations, as well as the deployment of hybrid cloud architectures and multi-cloud management. |
We also cover servers, application and desktop solutions deployed in distributed computing environments. The dominant platform, Windows, no longer represents an offering of discrete operating systems but rather a diverse computing environment with its own areas of specialization around enterprise technology. As Windows servers have become more stable and scalable, they have taken share in data centers and currently represent one of the largest server sub-sectors. Given the breadth of the Windows market, we have segmented our Windows-focused media based on enterprise technology and business professionals’ infrastructure responsibilities and purchasing focus. Our online properties in this sector include SearchWindowsServer.com, covering servers, storage, and systems management; and SearchDomino.com, targeted toward senior management for distributed computing environments. This network of sites provides resources and advice to enterprise technology and business professionals pursuing solutions related to such topics as Windows backup and storage, server consolidation, and upgrade planning. SearchEnterpriseDesktop.com focuses on the deployment and management of end-user computing environments. SearchMobileComputing.com covers the enterprise technology management issues surrounding the increasing deployment of personal technologies such as tablets and smartphones in the workplace. Combined with our two properties that focus on server virtualization, SearchVirtualDesktop.com and BrianMadden.com, each focusing on desktop virtualization, this gives us a comprehensive offering addressing the fast-growing area of virtualization technologies.
|
|
• |
CIO/IT Strategy. Our CIO/IT Strategy sites provide content targeted at CIOs, and senior enterprise technology executives, enabling them to make informed enterprise technology purchases throughout the critical stages of the purchase decision process. CIOs’ areas of interest generally align with the major sectors of the IT market; however, CIOs increasingly are focused on the alignment between enterprise technology and their businesses’ operations. Data center consolidation, compliance, ITIL/IT service management, disaster recovery/business continuity, risk management and outsourcing as well as including Software as a Service (“SaaS”) and cloud computing have all drawn the attention of IT executives who need to understand the operational and strategic implications of these issues and technologies on their businesses. Accordingly, our targeted information resources for senior IT executives focus on ROI, implementation strategies, best practices and comparative assessment of vendor solutions related to these initiatives. Our online properties in this sector include SearchCIO.com, which provides CIOs in large enterprises with strategic information focused on critical purchasing decisions; and SearchCompliance.com, which provides advice on enterprise technology-focused regulations and standards to enterprise technology and business executives and other senior enterprise technology managers. The CIO/IT Strategy category also includes online resources and events targeted to IT decision makers in prominent vertical industries. SearchHealthIT.com provides strategic IT purchasing information and advice to senior IT and clinical professionals in hospitals, medical centers, university health centers and other care delivery organizations, as well as organizations in the life sciences sector. InternetofThingsAgenda.com covers the implications of the emergence of the Internet of Things upon IT infrastructure and strategy. |
10
|
|
• |
Business Applications and Analytics. Our Business Applications and Analytics market category focuses on mission critical software such as enterprise resource planning (“ERP”), databases and business intelligence, content management enterprise resource planning, and customer facing applications such as customer relationship management (“CRM”) software for mid-sized and large companies. Because these applications are critical to the overall success of the businesses that use them, there is a high demand for specialized information by IT and business professionals involved in their purchase, implementation, and ongoing support. Our applications-focused properties in this sector include sites such as SearchCustomerExperience.com, SearchOracle.com, SearchSAP.com, SearchHRSoftware.com, SearchSQLServer.com and SearchERP.com. These sites are leading online resources that provide this specialized information to support mission critical business applications such as CRM, sales force automation, databases and ERP software. The information produced by these applications is seen as a corporate asset that is essential for gaining competitive advantage through informed, data-driven decisions that can help improve operational efficiency, enable business agility, and improve sales effectiveness and customer service. As a result, business intelligence and analytics have become pervasive as various organizations increasingly rely on mission critical information to optimize their businesses. SearchBusinessAnalytics.com, SearchDataManagement.com and SearchContentManagement.com, cover the business intelligence, data management, content management and collaboration disciplines associated with such initiatives. SearchCloudComputing.com focuses on cloud-based or SaaS deployments of key business applications. |
|
|
• |
Application Architecture and Development. The application architecture and development sector is comprised of a broad landscape of tools and languages that enable developers, architects and project managers to build, customize and integrate software for their businesses. Our application architecture and development online properties focus on development in enterprise environments, the underlying languages such as .NET, Java and XML as well as related application development tools and integrated development environments (“IDEs”). Several trends have had a profound impact on this sector and are driving growth. The desire for business agility with more flexible and interoperable applications architecture continues to propel interest in microservices. Application integration, application testing and security, as well as internet and mobile applications are also key areas of continuing focus for vendors and developers Our online properties in this sector include sites such as TheServerSide.com, which hosts independent communities of developers and architects, SearchSoftwareQuality.com, which offers content focused on application testing and quality assurance, and SearchAppAchitechture.com, which serves Architects, IT Managers and Line of Business Executives who are interested in adapting existing architectures to meet the speed, scale and agility needs of today’s modern applications. |
|
|
• |
Channel. Our Channel sites address the information needs of channel professionals—which we have classified as resellers, value added resellers, solution providers, systems integrators, service providers, managed service providers, and consultants—in the enterprise technology market. As enterprise technology and business professionals have become more specialized, B2B technology companies have actively sought resellers with specific expertise in the vendors’ sub-sectors. Like enterprise technology and business professionals, channel professionals require more focused technical content in order to operate successful businesses in the markets in which they compete. The resulting dynamics in the B2B technology channel are well-suited to our integrated, targeted content strategy. Our online properties in this sector include SearchITChannel.com. In addition to these websites, TechTarget channel media is able to profile channel professionals accessing information on any website within the TechTarget Network. As channel professionals resell, service and support hardware, software and services from vendors in a particular enterprise technology sector, the key areas of focus tend to parallel those for the sub-sectors addressed by our IT-focused properties: for storage, backup, storage virtualization and network storage solutions such as fibre channel SANs, NAS and IP SANs; for security, intrusion defense, compliance and identity management; for networking, wireless, network security and VoIP; for systems, consolidation, cloud, converged infrastructure and server virtualization. |
Product and Service Offerings
We use our offerings to provide B2B technology companies with numerous touch points to identify, reach and influence key enterprise technology decision makers. The following is a description of the products and services we offer:
IT Deal Alert. IT Deal Alert is a suite of products and services for B2B technology companies that leverages the detailed purchase intent data that we collect about end-user enterprise technology organizations. Through proprietary scoring methodologies, we use this insight to help our customers identify and prioritize accounts whose content consumption around specific enterprise technology topics indicates that they are “in-market” for a particular product or service. We also use the data directly to identify and further profile accounts’ upcoming purchase plans.
|
|
• |
Priority Engine™. Priority Engine is a subscription service powered by our Activity Intelligence platform, which integrates with customer relationship management and marketing automation platforms from salesforce.com, Marketo, Eloqua, Pardot, and Integrate. The service delivers information that enables marketers and sales personnel to identify and understand accounts and individuals actively researching new technology purchases and then to engage those active prospects within the organizations that are relevant to the purchase. We sell this service in approximately 200 technology-specific segments which our customers use for demand generation, account-based marketing and other marketing and sales activities. Priority Engine is also available with specific geographic focus, bringing the total available segments to over 300. |
11
|
|
• |
Qualified Sales Opportunities™. Qualified Sales Opportunities is a product that profiles specific in-progress purchase projects, including information on scope and purchase considerations, in approximately 80 technology-specific segments. |
|
|
• |
Deal Data™. Deal Data is a customized solution aimed at sales intelligence and data scientist functions within our customer organizations. It renders our Activity Intelligence data into one-time offerings directly consumable by the customer's internal applications. |
Demand Solutions. Our offerings enable our customers to reach and influence prospective buyers through content marketing programs designed to generate demand for their solutions, and through display advertising and other brand programs that influence consideration by prospective buyers. This allows B2B technology companies to maximize ROI by capturing sales leads from the distribution and promotion of content to our audience of enterprise technology and business professionals.
|
|
• |
White Papers. White papers are technical documents created by B2B technology companies to describe business or technical problems which are addressed by the vendors’ products or services. In a program that includes demand solutions, we post white papers on our relevant websites and our members receive targeted promotions about these content assets. Prior to viewing white papers, our registered members and visitors supply their corporate contact information and agree to receive further information from the vendor. The corporate contact and other qualification information for these leads are supplied to the vendor in near real time through our proprietary lead management software. |
|
|
• |
Webcasts, Podcasts, Videocasts and Virtual Trade Shows. Webcasts, podcasts, videocasts, virtual trade shows and similar content bring informational sessions directly to attendees’ desktops and mobile devices. As is the case with white papers, our members supply their corporate contact and qualification information to the webcast, podcast, videocast or virtual trade show sponsor when they view or download the content. Sponsorship includes access to the registrant information and visibility before, during and after the event. |
|
|
• |
Content Sponsorships. B2B technology companies, or groups of vendors, pay us to sponsor independent editorially created content vehicles on specific technology topics where the registrant information is then provided to all participating sponsors. In some cases, these vehicles are supported by multiple sponsors in a single segment, with the registrant information provided to all participating sponsors. Because these offerings are editorially driven, our customers get the benefit of association with independently created content as well as access to prospective buyers that are researching the topic. |
Brand Solutions. Our suite of brand solutions offerings provides B2B technology companies exposure to targeted audiences of enterprise technology and business professionals actively researching information related to their products and services. We leverage our Activity Intelligence to enable significant segmentation and targeting of specific audiences that can be accessed through these programs. Components of brand programs may include:
|
|
• |
On-Network Branding. These offerings enable our customers to influence prospective buyers through display advertising purchased on the websites we operate. Programs may include specific sites or audience segments across our sites. |
|
|
• |
Off-Network Branding. Our Off-Network offerings allow our customers to influence prospective buyers through display advertising when they are visiting other websites on the internet. We identify audience segments that can be targeted based on their activity and demonstrated interests against our content and websites and offer an array of audience extension and retargeting solutions that leverage Activity Intelligence. |
|
|
• |
Microsites and Related Formats. We have a range of solutions that create stand-alone websites for B2B technology companies, or “embedded” websites, that exist within the context of our existing websites, to enable a more immersive experience for enterprise technology and business professionals with the content and brand messaging of the vendor. |
Custom Content Creation. We will at times create white papers, case studies, webcasts or videos to our customers’ specifications through our Custom Content team. These customized content assets are then promoted to our audience within both demand solutions and brand solutions programs.
Customers
We market to B2B technology companies targeting specific audiences who are actively researching purchasing decisions. We maintain multiple points of contact with our customers in order to provide support throughout their organization and during critical stages of the sales cycle. As a result, individual customers often run multiple marketing programs with us in order to reach discrete portions of our targeted audience. Our products and services are delivered under both short-term contracts that run for the length of a given marketing program, typically less than six months, and via integrated, longer-term contracts covering various client needs across approximately a year or longer. We have developed a broad customer base and delivered campaigns to approximately 1,400 customers in 2019. During 2019, 2018, and 2017, no single customer represented 10% or more of total revenues.
12
Sales and Marketing
We have an internal direct sales department that works closely with existing and potential customers to develop customized marketing programs that provide highly targeted access to enterprise technology and business professionals. We organize the sales force by the sector-specific market categories that we operate and have a global accounts team that works with our largest customers. Additionally, we organize certain individuals into Customer Success Teams. Those teams facilitate the usage and renewal of certain of the Company’s products. We believe that our sector-specific sales organization and integrated approach to our product and service offerings allows our sales personnel to develop a high level of expertise in the specific sectors they cover and to create effective marketing programs tailored to the customer’s specific objectives. As of December 31, 2019, our sales and marketing staff consisted of approximately 330 people. The majority of our sales staff and marketing staff is located in our Newton, Massachusetts headquarters and our offices in San Francisco, California, London, England and Sydney, Australia.
We pursue a variety of marketing initiatives designed to support our sales activities by building awareness of our brand with B2B technology companies and positioning ourselves as a “thought leader” in ROI-based marketing. These initiatives include purchasing online sponsorships in media vehicles that reach technology marketers, as well as engaging in direct communications with the database of relevant contacts we have built since inception. Examples of our direct communications include selected e-mail updates on new product launches and initiatives. We also produce videocasts, blogs and white papers for technology marketers where we provide information on the latest best practices in the field of online B2B technology marketing.
Through our, Press and Public Relations activities, we develop and maintain relationships with key analysts, publications and influencers covering B2B marketing and sales topics.
Online Member Acquisition
Our primary source of traffic to our websites is through non-paid traffic sources, such as our existing registered member base and organic search engine traffic. Organic search engine traffic is also the primary source of new registered members for our sites. Because our sites focus on specific sectors of the enterprise technology market, our content is highly targeted and is an effective means for attracting search engine traffic and from this, growing our membership. We also make marketing expenditures designed to supplement our non-paid traffic and registered members. We employ a variety of online marketing vehicles such as keyword advertising on the major search engines and targeted list rentals of opt-in e-mail subscribers from a variety of targeted media sources.
Technological Infrastructure
We have developed an expandable operations infrastructure using hardware and software systems from established B2B technology companies to maintain our websites and online offerings. Our system hardware is co-located at an offsite data center. All of the critical components of the system are redundant, allowing us to withstand unexpected component failure and to undergo maintenance and upgrades. Our infrastructure is scalable, enabling us to make additions that fit into the existing environment as our system requirements grow based on traffic and member growth. Our critical data is copied daily to an online backup storage solution. The data is also copied to an off-site online storage facility. We maintain a quality assurance process to constantly monitor our servers, processes and network connectivity. We have implemented these various redundancies and backup systems in order to minimize the risk associated with damage from fire, power loss, telecommunications failure, break-ins, computer viruses and other events beyond our control. We believe that continued development of our technological infrastructure is critical to our success. We have made, and expect to continue to make, technological improvements in this infrastructure to improve our ability to service our members and customers.
Competition
The market for B2B technology companies marketing spend is highly competitive, and in each of the sectors we serve, as well as across the products and services we offer, our primary competitors include media companies that produce content specifically for enterprise technology and business professionals, providers of technology-based point solutions for data analysis and other service providers. Our primary media competitors, each of which possesses substantial resources to compete, are J2 Global, Madison Logic, QuinStreet, International Data Group, and CBS Interactive/CNET. In the online market we generally compete on the basis of target audience, quality and uniqueness of information content, ease of use of our websites for IT and business professionals, and the quality and quantity of sales leads generated for B2B technology companies. We also compete for the members who comprise our target audiences primarily with the media companies that produce content specifically for enterprise technology and business professionals such as J2 Global, QuinStreet, International Data Group, and CBS Interactive/CNET. In the data-oriented businesses, we compete with providers of predictive analytics and internet-based analysis including companies like 6sense, Infer, Bombora and Aberdeen. In general marketing services, we compete with list and lead providers of various types such as ZoomInfoTechnolgies Inc. As we continue to expand internationally, we expect to compete with many of the competitors mentioned above, as well as with established media companies based in particular countries or geographical regions.
13
Member Privacy
We gather in-depth business information about our registered members who consent to provide us such information through e-mail, telephone, or other means, including through the submission of webforms displayed on our websites. We also gather information about users of certain content on our websites by tracking their content consumption or the content consumption of the companies they work for. We post our privacy policy on our websites so that our members and others who visit our websites can access and understand the terms and conditions applicable to the collection and use of their information. Our privacy policy discloses the types of information we gather, how we use it, and how a member can correct or change this information, including how a member can unsubscribe to our communications and those of our partners. Our privacy policy also explains the circumstances under which we share a member's information and with whom. Members who register receive offers via e-mail, telephone, and other means, such as targeted advertising online or on mobile devices regarding areas of specific interest to them and that are relevant to their professional interests; these offers contain content created either by us or our third-party B2B technology customers. To protect our obligations to our members, we impose constraints that are consistent with our privacy policy on the customers to whom we provide member and website visitor data. Additionally, when we provide lists to third parties, including to our customers, it is under contractual terms that are generally consistent with our obligations to members and website visitors set forth in our privacy policy, as well as in compliance with applicable laws and regulations.
Consumer Protection and Privacy Regulation
General. Advertising and promotional activities presented to members and visitors to our websites are subject to federal and state consumer protection laws that regulate unfair and deceptive practices. We are also subject to various other federal and state consumer protection laws, including the ones described below. We are also subject to the laws and regulations of various other jurisdictions in which we target members and website visitors.
CAN-SPAM Act. The Controlling the Assault of Non-Solicited Pornography and Marketing Act of 2003 (the “CAN-SPAM Act”) regulates commercial e-mails and provides a right on the part of the recipient to request the sender to stop sending commercial electronic marketing messages “commercial e-mails”, and establishes penalties for the sending of e-mail messages that are intended to deceive the recipient as to source or content. Under the CAN-SPAM Act, senders of commercial e-mails (and other persons who initiate those e-mails) are required to make sure that those e-mails do not contain false or misleading transmission information. Commercial e-mails are required to include a valid return e-mail address and other subject heading information so that the sender and the internet location from which the message has been sent are accurately identified. Recipients must be furnished with an electronic method of informing the sender of the recipient’s decision not to receive further commercial e-mails. In addition, the e-mail must include a postal address of the sender and notice that the e-mail is an advertisement. The CAN-SPAM Act may apply to the e-newsletters that our websites distribute to registered members and to some of our other commercial e-mail communications. The U.S. Federal Trade Commission (the “FTC”) has issued regulations related to the CAN-SPAM Act, including interpretations of such act that indicate that e-newsletters, such as those we distribute to our registered members, will be exempt from most of the provisions of the CAN-SPAM Act, provided that they do not contain predominantly marketing content. The CAN-SPAM Act and the FTC’s CAN-SPAM trade regulation rule allow for civil penalties that run into the millions of dollars. Several states have enacted additional, more restrictive and punitive laws regulating commercial email. Foreign legislation exists as well, including Canada’s Anti-Spam Legislation and the European laws that have been enacted pursuant to the General Data Protection Regulation “(GDPR)” and European Union Directive 2002/58/EC and its amendments. We use email as a significant means of communicating with our existing members as well as potential website visitors and members. At this time, we are applying the applicable legal requirements to e-newsletters and all other e-mail communications and believe that our e-mail practices comply with the requirements of the CAN-SPAM Act, state laws and applicable foreign legislation.
Telemarketing Rules. Laws regulating telemarketing in the U.S., including the Telephone Consumer Protection Act (the “TCPA”), the Federal Communications Commission (“FCC”) rules thereunder, the Telemarketing and Consumer Fraud and Abuse Prevention Act and the FTC’s Telemarketing Sales Rule, including their do-not call provisions, and in the other jurisdictions where we do business, could apply to our calls to members and individuals who visit our websites. If any of these laws apply to our telemarketing, and we are found liable for violating them, we could be subject to financial penalties.
Other Consumer Protection Regulation. The FTC and many state attorneys general are applying federal and state consumer protection laws to require that the online collection, use and dissemination of data, and the presentation of web site content, comply with certain standards for notice, choice, security and access. In many cases, the specific limitations imposed by these standards are subject to interpretation by courts and other governmental authorities, and courts may adopt these developments as law. In addition, the FTC has published self-regulatory principles to address consumer privacy issues that may arise from so-called “behavioral targeting” (i.e. the tracking of a member’s online activities in order to deliver advertising tailored to his or her interests) and to encourage industry self-regulation for public content. Although the FTC excluded from the principles contextual advertising, with respect to other types of behavioral targeting that include the storage of more, and potentially sensitive, data or that collects
14
information outside of the “traditional Web site context” (such as through a mobile device or by an ISP), the FTC has stated that it will continue to evaluate self-regulatory programs and bring law enforcement actions where appropriate. Further, the FTC has indicated that it is considering regulations regarding behavioral advertising, which may include implementation of a more rigorous opt-in regime. An opt-in policy would prohibit businesses from collecting and using information obtained through behavioral targeting activities from individuals who have not voluntarily consented. The FTC has also issued further clarifying guidance regarding consumer privacy and data collection with a particular focus on the mobile environment. A few states have also introduced legislation that, if enacted, would restrict or prohibit behavioral advertising within the state. In the absence of a federal law pre-empting their enforcement, such state legislation would likely have the practical effect of regulating behavioral advertising nationwide because of the difficulties behind implementing state-specific policies.
Privacy. In addition, the European Union (“EU”) and its member states, Canada and California and several other states have laws, rules and/or regulations dealing with the collection and use of personal information obtained from their citizens. Regulations have focused on, among other things, the collection, use, disclosure and security of information that may be used to identify or that actually identifies an individual, such as an e-mail address, a name, or in some cases, an IP address. These laws also provide consumers the right to access the information a company has collected on them, correct it, request that it be deleted, or to stop the sale of such information to third parties. Additionally, the EU requires informed consent for the placement of a cookie on a user device.
We believe that we are operating our business in compliance with the regulations that apply to us. However, such laws may be modified or subject to interpretation by governmental agencies or the courts, or new laws may be enacted in the future, all of which could impact our business and results of operations.
Intellectual Property
We regard our copyrights, domain names, trademarks, trade secrets and similar intellectual property as important to our success, and we rely upon copyright, trademark and trade secrets laws, as well as confidentiality agreements with our employees and others, and protective contractual provisions, to protect the proprietary technologies and content that we have developed. We pursue the registration of our material trademarks in the U.S. and elsewhere. Currently, our TechTarget trademark and logo, as well as certain other marks and logos, are registered in the U.S. with the U.S. Patent and Trademark Office and in select foreign jurisdictions and we have applied for U.S. and foreign registrations for various other marks. In addition, we have registered over 1,600 domain names that are, or may be, relevant to our business, including “www.techtarget.com,” “www.knowledgestorm.com,” “www.bitpipe.com,” and those leveraging the “search” prefix used in the branding of many of our websites. We also incorporate a number of third-party software products into our technology platform pursuant to relevant licenses. We use third-party software to maintain and enhance, among other things, the content generation and delivery, and support our technology infrastructure. We are not substantially dependent upon these third-party software licenses, and we believe the licensed software is generally replaceable, by either licensing or purchasing similar software from another vendor or building the software functions ourselves.
Employees
As of December 31, 2019, we had 649 employees. Other than a small number of employees in the United Kingdom and France, none of our current employees are represented by a labor union or are the subject of a collective bargaining agreement.
Seasonality
The timing of our revenues is affected by seasonal factors. Our revenues are seasonal primarily as a result of the annual budget approval process of many of our customers, the normal timing at which our customers introduce new products, and the historical decrease in marketing activity in summer months. The timing of revenues in relation to our expenses, much of which do not vary directly with revenues, has an impact on the cost of revenues, selling and marketing, product development and general and administrative expenses as a percentage of revenues in each calendar quarter during the year.
The majority of our expenses are personnel-related and include salaries, stock-based compensation, benefits and incentive-based compensation plan expenses. As a result, we have not experienced significant seasonal fluctuations in the timing of our expenses period to period.
15
Risks Relating to Our Business and Operations
The risks and uncertainties set forth below, as well as other risks and uncertainties described elsewhere in this Annual Report on Form 10-K including in our consolidated financial statements and accompanying notes and “Management’s Discussion and Analysis of Financial Condition and Results of Operations” or in other filings with the SEC, could materially and adversely affect our business, financial condition, operating results and the trading price of our common stock. Additional risks and uncertainties that are not currently known to us or that are not currently believed by us to be material may also harm our business operations and financial results. Because of the following risks and uncertainties, as well as other factors affecting our financial condition and operating results, past financial performance should not be considered to be a reliable indicator of future performance, and investors should not use historical trends to anticipate results or trends in future periods.
Because we depend on our ability to generate revenues from the sale and support of purchase intent driven advertising campaigns, fluctuations in advertising spending could have an adverse effect on our revenues and operating results.
The primary source of our revenues is the sale and support of purchase intent driven advertising campaigns to our customers. Any reduction in advertising expenditures could have an adverse effect on the Company’s revenues and operating results. We believe that advertising spending on the internet, as in traditional media, fluctuates significantly as a result of a variety of factors, many of which are outside of our control. Some of these factors include:
|
|
• |
variations in expenditures by advertisers due to budgetary constraints; |
|
|
• |
the cancellation or delay of projects by advertisers or by one or more significant customers; |
|
|
• |
the cyclical and discretionary nature of advertising spending; |
|
|
• |
the relocation of advertising expenditures to competitors or other media; |
|
|
• |
general global economic conditions and the availability of capital, as well as economic conditions specific to the internet and online and offline media industry; and |
|
|
• |
the occurrence of extraordinary events, such as natural disasters, disease outbreaks (such as the novel coronavirus), acts of terrorism and international or domestic political and economic unrest. |
We could be negatively impacted by the recent outbreak of the new coronavirus disease (COVID-19).
Our business could be adversely impacted by the effects of the spread of coronavirus disease (COVID-19). The extent to which the coronavirus impacts our operations will depend on future developments, which are highly uncertain and cannot be predicted at this time, and include the duration, severity and scope of the outbreak and the actions taken to contain or treat the outbreak. The continued global spread of the coronavirus could materially and adversely impact our operations including, without limitation, our clients implementing policies or procedures to prevent the spread of the virus or otherwise reduce their spending activity as a result of the virus, our employee’s may experience impacts from illness, travel restrictions, quarantines, school closures, and other community response measures and our vendors, partners and other suppliers may experience disruptions that could impact us. We continue to monitor the situation and may adjust our current policies and practices as more information and guidance become available.
Because most of our customers are in the enterprise technology industry, our revenues are subject to characteristics of the enterprise technology industry that can affect advertising spending by B2B technology companies.
Because most of our customers are in the enterprise technology industry, the success of our business is closely linked to the health, and subject to market conditions, of the enterprise technology industry. The enterprise technology industry is characterized by, among other things, volatile quarterly results, uneven sales patterns, short product life cycles, rapid technological developments, frequent new product introductions and enhancements and evolving domestic and international laws and regulations, particularly with respect to data privacy and data protection. As a result, our customers’ advertising budgets, which are often viewed as discretionary expenditures, may increase or decrease significantly over a short period of time. Many of our customers continue to scrutinize their spending on advertising campaigns. Prior market downturns in the enterprise technology industry have resulted in declines in advertising spending, which can cause longer sales cycles, deferral or delay of purchases by B2B technology companies and generally reduced expenditures for advertising and related services. Our revenues and profitability depend on the overall demand for advertising services from our customers. We believe that demand for our offerings has been in the past, and could be in the future, disproportionately affected by fluctuations, disruptions, instability or downturns in the enterprise technology industry, which may cause customers and potential customers to exit the industry or delay, cancel, reduce or reallocate any planned expenditures for our purchase intent data offerings. Any slowdown in the formation of new B2B technology companies or decline in the growth of existing B2B technology companies, may cause a decline in demand for our offerings.
16
In addition, the marketing and advertising budgets of our customers may fluctuate as a result of:
|
|
• |
weakness in corporate enterprise technology spending, resulting in a decline in enterprise technology marketing and advertising spending, a trend that we have seen in the past and that may continue in the future; |
|
|
• |
increased concentration in the enterprise technology industry as a result of consolidations, leading to a decrease in the number of current and prospective customers, as well as an overall reduction in marketing and advertising spend; |
|
|
• |
reduced spending by combined entities following such consolidations, leading to volume and price compression and loss of revenue: and |
|
|
• |
the timing of marketing and advertising campaigns around new product introductions and initiatives. |
Our future growth will depend in large part on continued increased sales of our data driven product and services.
We sell a suite of data driven products and services, which is based on our Activity Intelligence analytics. Our increase in revenues in the year ended December 31, 2019, compared to the year ended December 31, 2018, was driven in part by an increase in sales of data driven products. We expect that data driven products, as well as the expansion of the features in our current product offerings, will be major components of our future growth. The failure of our data driven products to meet anticipated sales levels, our inability to continue to expand our data driven products successfully, or the failure of our current or new products and services to achieve and then maintain widespread customer acceptance could have a material adverse effect on our business and financial results. In addition, competitors may develop a service or application that is similar to our data driven product suite, which could also result in reduced sales for those product offerings.
Our revenues are primarily derived from short-term contracts that may not be renewed.
Our customer contracts are primarily short-term, typically six months or less, and are generally subject to termination without substantial penalty by the customer at any time, generally with minimal notice requirements. We cannot assure you that our current customers will fulfill their obligations under their existing contracts, continue to participate in our existing programs beyond the terms of their existing contracts or enter into any additional contracts for new programs that we offer. In addition, our efforts to enter into longer-term arrangements with customers for our IT Deal Alert products and services may not be successful. If a significant number of customers or a few large customers decided not to continue purchasing marketing and advertising services from us, then we could experience a rapid decline in our revenues over a relatively short period of time. Any factors that limit the amount our customers are willing to and do spend on marketing or advertising with us could have a material adverse effect on our business.
If we are unable to deliver content and services that attract and retain a critical mass of members, our ability to attract customers may be affected, which could in turn have an adverse effect on our revenues.
Our success depends on our continued ability to deliver original and compelling content and services to attract and retain members, as well as our ability to garner a critical mass of members of our websites. Our member base is primarily comprised of corporate enterprise technology and business professionals who demand specialized websites tailored to the sectors of the enterprise technology products for which they are responsible and that they purchase. Our content and services may not generate engagement with our websites or continue to attract and retain a critical mass of members necessary to attract customers and generate revenues consistent with our historical results and expectations of future results. We also may not develop new content or services in a timely or cost-effective manner. Our ability to develop and produce this specialized content successfully is subject to numerous uncertainties, including our ability to:
|
|
• |
anticipate and respond successfully to rapidly changing enterprise technology developments and preferences to ensure that our content remains timely and interesting to our members; |
|
|
• |
attract and retain qualified editors, writers, freelancers and technical personnel; |
|
|
• |
fund new development for our programs and other offerings; |
|
|
• |
successfully expand our content offerings into new platform and delivery mechanisms; and |
|
|
• |
promote and strengthen the brands of our websites and our name. |
If we are not successful in maintaining and growing our member base through the deployment of targeted and compelling content, our ability to retain and attract customers may be affected or we may be required to obtain licensed content which may not be at reasonable prices, which could in turn have an adverse effect on our revenues, and operating results.
17
We depend upon internet search engines to attract a significant portion of the visitors to our websites. These visitors can become members, and if we were listed less prominently in search result listings as a result of changes in the search engines’ algorithms or otherwise, our business and operating results could be harmed.
We derive a significant portion of our website traffic from users who search for enterprise technology research and editorial content through internet search engines. A critical factor in attracting members to our websites is whether we are prominently displayed in response to an internet search relating to enterprise technology content. Search result listings are determined and displayed in accordance with a set of formulas or algorithms developed by the particular internet search engine. The algorithms determine the order of the listing of results in response to the user’s internet search. From time to time, search engines revise their algorithms. In some instances, these modifications may be detrimental and cause our websites to be listed less prominently in unpaid search results or not at all, which will result in decreased traffic from search engine users to our websites. Our websites may also become listed less prominently in unpaid search results, for other reasons, such as search engine technical difficulties, search engine technical changes and changes we make to our websites. In addition, search engines have deemed the practices of some companies to be inconsistent with search engine guidelines and have decided not to list their websites in search result listings at all. Although we could mitigate certain algorithm changes affecting our traffic with increased marketing expenditures, if we are listed less prominently or not at all, in search result listings, traffic to our websites could decline, which could impact our operating results. Increased marketing spend to increase site traffic could also impact our operating results.
Further, we use search engine optimization, or SEO, to enhance the visibility of our websites and optimize ranking in search engine results. Our ability to successfully manage our SEO efforts across our owned and operated websites depends on our ability to adapt and respond to changes in search engine algorithms and methodologies and changes in search query trends. If we fail to successfully manage our SEO strategy, our owned and operated websites may receive less favorable placement in organic or paid listings, which would reduce the number of visitors to our sites, decrease conversion rates and repeat business and have a detrimental effect our ability to generate revenue.
There are a number of risks associated with our international operations, as well as the expansion of those operations, that could adversely affect our business.
The Company derives a significant portion of its revenues from customers with billing addresses outside of the U.S. For the year ended December 31, 2019 approximately 33% of our revenues were derived from international geo-targeted campaigns, which are campaigns that are targeted at members who reside outside of North America. We have offices in the United Kingdom, France, Germany, Singapore and Australia. We also publish websites in Spanish, French, German, Portuguese and Chinese, targeting members worldwide who speak those languages.
In addition to many of the same challenges we face domestically, there are additional risks and costs to doing business in international markets, including:
|
|
• |
limitations on our activities in foreign countries where we have granted rights to existing business partners; |
|
|
• |
the degree to which our foreign-based customers transition from print to online purchase intent data; |
|
|
• |
the adaptation of our websites and purchase intent data programs to meet local needs; |
|
|
• |
our foreign-based competitors having greater resources and more established relationships with local advertisers; |
|
|
• |
more restrictive data privacy and data protection regulation, which may vary by country and for which there may be little, conflicting or no guidance; |
|
|
• |
more restrictive website licensing and hosting requirements, which may result in our websites being blocked, may require changes to how we operate our websites, or may involve regulatory or enforcement actions against us that could be harmful to our business; |
|
|
• |
more extensive labor regulation, which may vary by country; |
|
|
• |
difficulties in staffing and managing multinational operations; |
|
|
• |
difficulties in finding appropriate foreign licensees or joint venture partners; |
|
|
• |
difficulties following changes in local business operations or structure; |
|
|
• |
distance, language and cultural differences in doing business with foreign entities; |
|
|
• |
foreign (and domestic) political and economic uncertainty; |
|
|
• |
less extensive adoption of the internet as an information source and increased restriction on the content of websites; |
18
|
|
• |
currency exchange-rate fluctuations; and |
|
|
• |
potential adverse tax requirements. |
Brexit. The United Kingdom’s June 2016 referendum, in which voters approved an exit of the United Kingdom from the European Union, commonly referred to as “Brexit,” resulted in significant general economic uncertainty as well as volatility in global stock markets and currency exchange rate fluctuations. In March 2017, the United Kingdom served notice to the European Council under Article 50 of the Lisbon Treaty of its intention to withdraw from the European Union. As of January 30, 2020, the United Kingdom’s membership in the European Union was terminated and an eleven month transition period began which will allow time for a free trade agreement to be negotiated. If no agreement can be reached at the end of this transition period, it could mean that the United Kingdom will face tariffs on goods traveling to the EU. Brexit could subject us to new regulatory costs and compliance obligations (including regarding the treatment and transfer of personal data). The full effect of Brexit remains uncertain and depends on any agreements the United Kingdom may make to retain access to the EU market. Moreover, the overall impact of Brexit may create further global economic uncertainty, which may cause a subset of our customers to more closely monitor their costs in the affected region. Our revenue generated from customers who have billing addresses within the United Kingdom was approximately 10% and 12% of our total revenues for the years ended December 31, 2019 and 2018, respectively.
As a result, we may face difficulties and unforeseen expenses in expanding our business internationally and, if we attempt to do so, we may be unsuccessful, which could harm our business, operating results and financial condition.
Competition for customers’ marketing and advertising spending is intense, and we may not compete successfully, which could result in a material reduction in our market share, the number of our customers and our revenues.
We compete for potential customers with a number of different types of offerings and companies, including: broad‑based media outlets such as television, newspapers and business periodicals that are designed to reach a wide audience; general purpose portals and search engines; and offline and online offerings of media companies that produce content specifically for IT and business professionals, including International Data Group, J2 Global, QuinStreet, Madison Logic, CBS Interactive/CNet and contact providers such as ZoomInfoTechnolgies Inc. Customers may choose our competitors over us not only because they prefer our competitors’ online offerings to ours but also because customers prefer to utilize other forms of marketing and advertising services offered by our competitors that are not offered by us and/or to diversify their marketing and advertising expenditures. Many of our current and potential competitors have longer operating histories, larger customer bases, greater brand recognition and significantly greater financial, marketing and other resources than we have. They may also offer different pricing than we do, which could be more attractive to customers. Competitors have historically responded, and may continue to respond, to market conditions by lowering prices to try to attract our customers. As a result, we could lose market share to our competitors in one or more of our businesses and our revenues could decline.
We may not innovate at a successful pace, which could harm our operating results.
Our industry is rapidly adopting new technologies and standards to create and satisfy the demands of users and advertisers. It is critical that we continue to innovate by anticipating and adapting to these changes to ensure that our content‑delivery, demand generation and data driven products and services remain effective and interesting to our members, customers and partners. In addition, we may need to make significant expenditures to achieve these goals. If we fail to accomplish these goals, we may lose members and the customers that seek to reach those members, which could harm our operating results. Existing and planned efforts to develop new products, including any subscription-based offerings, may be costly and ultimately not successful.
We may be unable to continue to build awareness of our brands, which could negatively impact our business and cause our revenues to decline.
Building and maintaining recognition of our brands is critical to attracting and retaining our member base. We intend to continue to build existing brands and introduce new brands that will resonate with our targeted audiences. In order to promote our brands, we may find it necessary to increase our marketing budget, hire additional marketing and public relations personnel or otherwise increase our financial commitment to creating and maintaining brand loyalty among our customers. If we fail to promote and maintain our brands effectively, or incur excessive expenses attempting to promote and maintain our brands, our business and financial results may suffer.
If we do not retain our key personnel, our ability to execute our business strategy will be adversely affected.
Our continued success depends to a significant extent upon the recruitment, retention and effective succession of our executive officers and key management. Our management team has significant industry experience and would be difficult to replace. These individuals possess sales, marketing, financial and administrative skills that are critical to the operation of our business. The competition for these employees is intense. The loss of the services of one or more of our key personnel could have a material adverse effect on our business and operating results.
19
We may not be able to attract, hire and retain qualified personnel cost-effectively, which could impact the quality of our content and services and the effectiveness and efficiency of our management, resulting in increased costs and losses in revenues.
Our success depends on our ability to attract, hire and retain qualified technical, editorial, sales and marketing, customer support, financial and accounting and other managerial personnel at commercially reasonable rates. The competition for personnel in the industries in which we operate is intense. Our personnel may terminate their employment at any time for any reason. Loss of personnel may also result in increased costs for replacement hiring and training. If we fail to attract and hire new personnel or retain and motivate our current personnel, we may not be able to operate our businesses effectively or efficiently, serve our customers properly or maintain the quality of our content and services. In particular, our success depends in significant part on maintaining and growing an effective sales and customer retentions force. This dependence involves a number of challenges, including the need to hire, integrate, motivate and retain additional sales and sales support personnel and train new sales personnel, many of whom lack sales experience when they are hired, as well as increased competition from other companies in hiring and retaining sales personnel.
We may fail to identify or successfully acquire and integrate businesses, products and technologies that would otherwise enhance our product and service offerings to our customers and members, and as a result our revenues may decline or fail to grow.
We have acquired, and in the future may acquire or invest in, complementary businesses, products or technologies. Acquisitions and investments involve numerous risks including:
|
|
• |
difficulty in assimilating the operations and personnel of acquired businesses; |
|
|
• |
potential disruption of our ongoing businesses and distraction of our management and the management of acquired companies; |
|
|
• |
difficulty in incorporating acquired technology and rights into our offerings and services, which could result in additional expenses and/or technical difficulties in delivering our product offerings; |
|
|
• |
potential failure to achieve additional sales and enhance our customer base through cross-marketing of the combined company’s products and services to new and existing customers; |
|
|
• |
potential detrimental impact to our pricing based on the historical pricing of any acquired business with common customers and the market generally; |
|
|
• |
potential litigation resulting from our business combinations or acquisition activities; and |
|
|
• |
potential unknown liabilities associated with the acquired businesses. |
Our inability to integrate any acquired business successfully, or the failure to achieve any expected synergies, could result in increased expenses and a reduction in expected revenues or revenue growth. As a result, our revenues, results of operations or stock price could fluctuate or decline. In addition, we may not be able to identify or successfully complete acquisitions, which could impact our ability to expand into complementary sectors in the future.
General domestic and global economic, business or industry conditions and financial market instability may adversely affect our business, as well as our ability to forecast financial results.
The U.S. and international economies have experienced inconsistent, unpredictable growth and a certain degree of instability, magnified at times by factors including changes in the availability of credit, volatile business and consumer confidence and unemployment. These and other macro‑economic conditions have contributed to unpredictable changes in the global economy and expectations of future global economic growth. If the economic climate in the U.S. and abroad deteriorates, our customers or potential customers could reduce or delay their purchases of our offerings, which would adversely impact our revenues and our ability to sell our offerings, collect customer receivables and, ultimately, our profitability.
Because all components of our budgeting and forecasting are dependent upon estimates of growth or contraction in the economy generally, and in the IT market specifically, it can be difficult for us to accurately estimate future income and expenditures. We cannot predict the duration of current economic conditions or the duration or strength of an economic recovery in the U.S. or worldwide generally or in the IT industry or in any of its segments. Further adverse changes may occur as a result of global, domestic or regional economic conditions, changing consumer confidence, unemployment, tariffs, declines in stock markets, or other factors affecting economic conditions generally. These changes may negatively affect the sales of our offerings, increase exposure to losses from bad debts, increase the cost and decrease the availability of financing, or increase the risk of loss on investments. Any recent growth we have experienced internationally would be negatively affected by any future global downturn.
20
Risks Related to Data Privacy, Security and Intellectual Property Rights
We may have limited protection of our intellectual property rights; which others could infringe.
Our success and ability to compete are dependent in part on the strength of our proprietary rights, on the goodwill associated with our trademarks, trade names and service marks, and on our ability to use U.S. and foreign laws to protect them. Our intellectual property includes, among other things, our original content, our editorial features, logos, brands, domain names, the technology that we use to deliver our services, the various databases of information that we maintain and make available by license, and the appearances of our websites. We claim common law protection on certain names and marks that we have used in connection with our business activities. Although we have applied for and obtained registration of some of our marks in the U.S. and other countries where we do business, we have not been able to obtain registration of all of our key marks in certain non-U.S. jurisdictions due to prior registration or use by third parties employing similar marks. In addition to U.S. and foreign laws and registration processes, we rely on confidentiality agreements with our employees and third parties and other protective contractual provisions to safeguard our intellectual property.
Policing our intellectual property rights and identifying infringers worldwide is a difficult task, and even if we are able to identify infringers, we may not be able to stop them from infringing our intellectual property. We cannot be certain that third-party licensees of our content will adequately protect our proprietary rights. Intellectual property laws and our agreements may not be sufficient to prevent others from copying or otherwise obtaining and using our content or technologies. In addition, others may develop non-infringing technologies that are similar or superior to ours. In seeking to protect our marks, copyrights, domain names and other proprietary rights, we could face costly litigation and the diversion of our management’s attention and resources.
Furthermore, the relationship between regulations governing domain names and laws protecting trademarks and similar proprietary rights is still evolving. Therefore, we might be unable to prevent third parties from acquiring domain names that infringe or otherwise decrease the value of our trademarks and other proprietary rights. Any impairment in the value of these important assets could cause our stock price to decline.
21
We could be subject to claims from third parties based on the content on our websites created by us and third parties. These claims could result in costly litigation, payment of damages or the need to revise the way we conduct our business.
We could be subject to infringement claims from third parties, which may or may not have merit. Due to the nature of content published on our online network, including content placed on our online network by third parties, and as a creator and distributor of original content and research, we face potential liability based on a variety of theories, including defamation, libel, negligence, copyright or trademark infringement, or other legal theories based on the nature, creation or distribution of this information. Such claims may also include, among others, claims that by providing hypertext links to websites operated by third parties, we are liable for wrongful actions by those third parties through these websites. Similar claims have been brought, and sometimes successfully asserted, against online services. It is also possible that our members could make claims against us for losses incurred in reliance on information provided on our networks. In addition, we could be exposed to liability in connection with material posted to our internet sites by third parties. For example, many of our sites offer members an opportunity to post comments and opinions that are not moderated. Some of this member-generated content may infringe on third-party intellectual property rights or privacy rights or may otherwise be subject to challenge under copyright laws. Such claims, whether brought in the U.S. or abroad, could divert management time and attention away from our business and result in significant cost to investigate and defend, regardless of the merit of these claims. In addition, if we become subject to these types of claims and are not successful in our defense, we may be forced to pay substantial damages. These claims could also result in the need to develop alternative trademarks, content or technology or to enter into costly royalty or licensing agreements. Our insurance may not adequately protect us against these claims. The filing of these claims may also damage our reputation as a high-quality provider of unbiased, timely analysis and result in customer cancellations or overall decreased demand for our services. We may not have, in all cases, conducted formal evaluations of our content, technology and services to determine whether they expose us to any liability of the sort described above. As a result, we cannot be certain that our technology, offerings, services or online content do not or will not infringe upon the intellectual property or other rights of third parties. If we were found to have infringed on a third party’s intellectual property rights or otherwise found liable for damages as a result of such claims, the value of our brands and our business reputation could be impaired, and our business could suffer.
Changes in laws and standards relating to marketing, data collection and use, and the privacy of internet users could impact our ability to conduct our business and thereby decrease our marketing and advertising service revenues while imposing significant compliance costs on the Company.
We use e-mail as a significant means of communicating with our members. The laws and regulations governing the use of e-mail for marketing purposes continues to evolve, and the growth and development of the market for commerce over the internet may lead to the adoption of additional legislation and/or changes to existing laws. If new laws or regulations are adopted, or existing laws and regulations are interpreted and/or amended or modified to impose additional restrictions on our ability to send e-mail to our members or potential members, we may not be able to communicate with them in a cost-effective manner. In addition to legal restrictions on the use of e-mail, internet service providers and others typically attempt to block the transmission of unsolicited e-mail, commonly known as “spam.” If an internet service provider or software program identifies e-mail from us as “spam,” we could be placed on a restricted list that would block our e-mail to members or potential members who maintain e-mail accounts with these internet service providers or who use these software programs. If we are unable to communicate by e-mail with our members and potential members as a result of legislation, blockage or otherwise, our business, operating results and financial condition could be harmed.
We collect information from those who visit or register as members on our websites, co-branded sites, or for services, respond to surveys or, in some cases, view our content. Subject to each member’s permission (or right to decline, which we refer to as an “opt-out”, a practice that may differ across our various websites, depending on the applicable needs and requirements of different countries’ laws), we may use this information to inform our members of services that they have indicated may be of interest to them. We may also share this information with our customers for members who have elected to receive additional promotional materials and have expressly or implicitly granted us permission to share their information with third parties. We also collect information on our members based on their activity on our sites. The U.S. federal government and certain states have adopted or proposed limitations on the collection, distribution and use of personal information of internet users.
Although, to date, our efforts to comply with applicable federal and state laws and regulations have not hurt our business, additional, more burdensome laws or regulations, including more restrictive consumer privacy and data security laws, could be enacted or applied to us or our customers. Such laws or regulations could impair our ability to collect member information that helps us to provide more targeted content to our website visitors and members and detailed lead data to our customers, thereby impairing our ability to maintain and grow our audience and maximize revenue from our customers. Additionally, the FTC and many state attorneys general are applying federal and state consumer protection laws to require that the online collection, use and dissemination of data, and the presentation of website content, comply with certain standards for notice, choice, security and access. Courts may also adopt these developing standards. In many cases, the specific limitations imposed by these standards are subject to interpretation by courts and other governmental authorities. A few states have also introduced legislation that, if enacted, would restrict or prohibit behavioral
22
marketing and advertising within the state. In the absence of a federal law pre-empting their enforcement, such state legislation would likely have the practical effect of regulating behavioral marketing and advertising nationwide because of the difficulties behind implementing state-specific policies or sending targeted advertising to individuals based on their perceived commercial interests. In the event of additional legislation in this area, our ability to effectively target our website visitors and members may be limited. We believe that we are in compliance with applicable consumer protection laws, but a determination by a state or federal agency or court that any of our practices do not meet these laws and regulations could create liability to us, result in adverse publicity and affect negatively our businesses. New interpretations of these standards could also require us to incur additional costs and restrict our business operations.
The EU and its member states, California and Canada have regulations dealing with the collection and use of personal information obtained from their citizens. Regulations in these jurisdictions have focused on the collection, processing, transfer, use, disclosure and security of information that may be used to identify or that actually identifies an individual, such as a name, e-mail address or online identifier (such as an IP address in certain cases). These laws also provide consumers the right to access the information a company has collected on them, correct it, request that it be deleted, or to stop the sale of such information to third parties.
The General Data Protection Regulation (“GDPR”) became effective in May 2018 and was designed to, among other things, harmonize disparate data privacy laws found across Europe. GDPR implemented more rigorous principles relating to the data privacy and data protection, including, among other things, enhanced disclosure requirements regarding how personal information is obtained, used, and shared, limitations on the purpose and storage of personal information, mandatory data breach notification requirements and enhanced standards for data controllers to demonstrate that they have obtained valid consent for certain data processing activities. Its application and scope are extensive and penalties for non-compliance are significant, including fines of up to 20 million Euros or 4% of total worldwide revenue. In the event the Company is deemed not in compliance with GDPR, or fails to maintain compliance, then the Company would be exposed to material damages, costs and/or fines if an EU regulator or EU resident commenced an action. Failure to comply or maintain compliance could cause considerable harm to us and our reputation (including requiring notification to customers, regulators, and/or members), cause a loss of confidence in our services, and deter current and potential customers from using our services.
Further, the presidency of the council of the EU released a revised draft of the pending Proposal for Regulation on Privacy and Electronic Communications (“ePrivacy Regulation”) which will replace the ePrivacy Directive and is intended to align with the overall EU data privacy and protection framework, including GDPR. The ePrivacy Regulation was defeated by the council of the EU, but it is expected to be proposed again. The ePrivacy Regulation could disrupt the Company’s ability to use or transfer data or to market and sell its products and services, which could have a material adverse effect on our business, financial condition, and operating results.
Our customers may implement compliance measures that do not align with our services, which could limit the scope and delivery of services we are able to provide. Our customers may also require us to take on additional privacy and security obligations, causing us to incur potential disruption and expense related to our business processes. If our policies and practices, or those of our customers, are, or are perceived to be, insufficient or if our members, website visitors or customers have concerns regarding our data privacy and data protection practices, particularly with respect to GDPR or the pending ePrivacy Regulation, then we could be subject to enforcement actions or investigations by regulators or lawsuits by private parties, member engagement could decline and our business could be negatively impacted.
For certain data transfers and processing activities between the EU and the U.S., many companies previously relied on the Department of Commerce Safe Harbor Principles (“Safe Harbor”) and self-certification process in order to lawfully transfer and process the personal data of people in the EU to the U.S. in a manner that the EU deemed adequate to protect the security of such information. On October 6, 2015, the European Court of Justice declared that Safe Harbor was no longer valid. U.S. and EU lawmakers in February 2016 announced a replacement for Safe Harbor, called the EU-U.S. Privacy Shield Framework Principles (“the EU Privacy Shield”). On July 12, 2016, the European Commission deemed the EU-US Privacy Shield adequate to enable data transfers of personal data from the EU to the U.S. Similarly, a new Swiss-U.S. Privacy Shield (the “Swiss Privacy Shield”) was announced in January 2017, replacing the former Swiss-U.S. Safe Harbor, enabling data transfers of personal data from Switzerland to the U.S. The Company self-certified to the EU Privacy Shield and Swiss Privacy Shield on February 10, 2017 and April 2, 2018, respectively. Such regulatory frameworks are currently in litigation before the European Court of Justice, and any changes in the frameworks may impact our business. Failure to comply with these privacy shield principles by companies who self-certify compliance to the U.S. Department of Commerce is enforceable by the FTC. If we are found to be out of compliance, we could be subject to enforcement actions or investigations by regulators, member engagement could decline and our business could be negatively impacted.
In order to continue receiving personal data from the United Kingdom in reliance on the EU Privacy Shield following Brexit, the Company may be required to meet standards for cross-border transfer imposed by the UK itself.
23
Our digital properties collect and use data about our website visitors’ and members’ online behavior, and the revenue associated with this activity could be impacted by government regulation and enforcement, industry trends, self-regulation, technology changes, consumer behavior and attitude, and private action. We also use such information to call website visitors and members who have provided their telephone numbers to be enrolled as a member (for free). Our partners may then follow-up to try to sell products or services to such individuals.
We also work with our partners to deliver targeted advertisements based on members and website visitors’ perceived commercial interests. Many of our users voluntarily provide us with contact and other information when they visit our websites. We may utlize data from third-party sources to augment our user profiles and marketing databases so we are better able to personalize content, enhance our analytical capabilities, better target our marketing programs, and better qualify leads for our partners. If changes in user sentiment regarding the sharing of information results in a significant number of visitors to our websites refusing to provide us with contact and other information, our ability to personalize content for our users and provide targeted marketing solutions for our partners would be impaired. If our users choose to opt-out of having their data used for behavioral targeting, it would be more difficult for us to offer targeted marketing programs for our partners. If we are unable to acquire data from third-party sources for whatever reason, or if there is a marked increase in the cost of obtaining such data, our ability to personalize content and provide marketing solutions could be negatively impacted.
The use of such consumer data by online service providers and advertising networks is a topic of active interest among federal, state, and international regulatory bodies, as well as self-regulatory organizations, and the regulatory environment is unsettled. Federal, state, and international laws and regulations govern the collection, use, retention, disclosure, sharing and security of data that we receive from and about our website visitors and members through cookies and other similar technologies. Our privacy policies and practices concerning the collection, use, and disclosure of user data are posted on our websites.
There are new and expanding proposals for laws and regulations regarding “Do Not Track” requirements that protect users’ right to choose whether or not to be tracked online. These proposals seek, among other things, to allow consumers to have greater control over the use of private information collected online, to forbid the collection or use of online information, to demand a business to comply with their choice to opt out of such collection or use, and to place limits upon the disclosure of information to third party websites. Any such laws and regulations could have a significant impact on the operation of our advertising and data businesses. U.S. regulatory agencies have also placed an increased focus on online privacy matters and, in particular, on online advertising activities that utilize cookies or other tracking tools. Consumer and industry groups have expressed concerns about online data collection and use by companies, which has resulted in the release of various industry self-regulatory codes of conduct and best practice guidelines that are binding for member companies engaged in online behavioral advertising (“OBA”) and similar activities. These codes of conduct and best practice guidelines govern, among other things, the ways in which companies can collect, use and disclose user information for OBA purposes, how companies must give notice of these practices, and what choices companies must provide to consumers regarding these practices.
We may be required or otherwise choose to adopt Do Not Track mechanisms, and we may be required to abide by certain self-regulatory principles promulgated by the Digital Advertising Alliance and others for OBA and similar activities, in which case our ability to use our existing tracking technologies, to collect and sell user behavioral data, and permit their use by other third parties could be impaired. This could cause our net revenues to decline and adversely affect our operating results.
We believe that we are in material compliance with all laws, regulations and self-regulatory regimes that are applicable to us. However, as referenced above, these laws, regulations, and self-regulatory regimes may be modified, and new laws may be enacted in the future that may apply to us and affect our business. Further, data protection authorities may interpret existing laws in new ways. We may deploy new products and services from time to time, which may also require us to change our compliance practices. Any such developments (or developments stemming from enactment or modification of other laws) or the failure to anticipate accurately the application or interpretation of these laws could create liability for us, result in adverse publicity, increase our future compliance costs, make our products and services less attractive to our members and customers, or cause us to change or limit our business practices, and materially affect our business and operating results. Further, any failure on our part to comply with any relevant laws or regulations may subject us to significant civil, criminal or contractual liabilities.
Increased exposure from loss of personal, confidential, and/or proprietary information due to our cybersecurity systems or the systems of our customers, vendors, or partners being breached could cause us to incur significant legal and financial exposure and liability, and materially adversely affect our business, operating results and reputation.
We currently retain personal, confidential, and/or proprietary information relating to our members, employees, and customers in secure database servers. Our industry is prone to cyber-attacks by third parties seeking access to our data or data we have collected from website visitors and members, or to disrupt our ability to provide service. We have experienced and will continue to experience cyber-attacks targeting our database servers and information systems. Cyber-attacks may involve viruses, malware, ransomware, distributed denial-of-service attacks, phishing or other forms of social engineering (predominantly spear phishing attacks), and other methods seeking to gain unlawful access. We may not be able to prevent unauthorized access to these secure database servers and
24
information systems as a result of these third-party actions, including intentional misconduct by criminal organizations and hackers or as a result of employee error, malfeasance or otherwise. A security breach could result in intentional malfunctions or loss or corruption of data, software, hardware or other computer equipment, the misappropriation of personal, confidential and/or proprietary information, disruptions in our service, and in the unauthorized access to our customers’ data or our data, including intellectual property, business opportunity, and other confidential business information. Additionally, third parties may attempt to fraudulently induce our employees, vendors, or customers into disclosing access credentials such as usernames, passwords or keys in order to gain access to our database servers and information systems.
Our online networks could also be affected by cyber-attacks, and we could inadvertently transmit viruses across our networks to our members or other third parties. Cyber-attacks continue to evolve in sophistication and volume, and inherently may be difficult to detect for long periods of time. Although we have developed systems and processes that are designed to protect our data and user data, to prevent data loss, to disable undesirable accounts and activities on our platform, and to prevent or detect security breaches, we cannot assure that such measures will provide absolute security, and we may incur significant costs in protecting against or remediating cyber-attacks.
Providing unimpeded access to our online networks is critical to engaging with our website visitors and members and providing superior service to our customers. Our inability to provide continuous access to our online networks could cause some of our customers to discontinue purchasing marketing and advertising programs and services and/or prevent or deter our members from accessing our networks. We may be required to expend significant capital and other resources to protect against cyber-attacks. We cannot assure that any contractual provisions attempting to limit our liability in these areas will be successful or enforceable, or that our customers or other parties will accept such contractual provisions as part of our agreements.
Many states and foreign jurisdictions in which we operate have enacted laws and regulations that require us to notify members, website visitors, customers and, in some cases, governmental authorities and credit bureaus, in the event that certain personal information is accessed, or believed to have been accessed, without authorization. Certain regulations also require proscriptive policies to protect against such unauthorized access. Additionally, increasing regulatory demands are requiring us to provide heightened protection of personal information to prevent identity theft and the disclosure of sensitive information. Should we experience a loss of personal, confidential, and/or proprietary information, then efforts to regain compliance and address penalties imposed by contractual provisions or governmental authorities could increase our costs significantly.
Our business, which is dependent on centrally located communications and computer hardware systems, is vulnerable to natural disasters, telecommunication and systems failures, terrorism and other problems, as well as disruption due to maintenance or high volume, all of which could reduce traffic on our networks or websites and result in decreased capacity for marketing and advertising space.
Our operations are dependent on our communications systems and computer hardware, all of which are located in data centers operated by third parties. These systems could be damaged by natural disasters, power loss, telecommunication failures, viruses, hacking and similar events outside of our control. Our insurance policies have limited coverage levels for loss or damages in these events and may not adequately compensate us for any losses that may occur. In addition, terrorist acts or acts of war may cause harm to our employees or damage our facilities, our customers, our customers’ customers and vendors which could adversely impact our revenues, costs and expenses and financial position. We are predominantly uninsured for losses and interruptions to our systems or cancellations of events caused by terrorist acts and acts of war.
Our ability to attract and maintain relationships with our members, customers and strategic partners depends on the satisfactory performance, reliability and availability of our internet infrastructure. Our internet marketing and advertising revenues relate directly to the number of advertisements and other marketing opportunities delivered to our members. System interruptions or delays that result in the unavailability of internet sites or slower response times for members would reduce the number of advertising impressions and leads delivered. This could reduce our revenues as the attractiveness of our sites to members and advertisers decreases. Our insurance policies provide only limited coverage for service interruptions and may not adequately compensate us for any losses that may occur due to any failures or interruptions in our systems. Further, we do not have multiple site capacity for all of our services in the event of any such occurrence.
25
In addition, our networks and websites must accommodate a high volume of traffic and deliver frequently updated information. They have experienced, and may experience in the future, slower response times due to higher than expected traffic, or decreased traffic, for a variety of reasons. There have been instances where our online networks as a whole, or our websites individually, have been inaccessible. Also, slower response times, which have occurred more frequently, can result from general internet problems, routing and equipment problems involving third-party internet access providers, problems with third-party advertising servers, increased traffic to our servers, viruses and other security breaches that are out of our control. In addition, our members depend on internet service providers and online service providers for access to our online networks or websites. Those providers have experienced outages and delays in the past and may experience outages or delays in the future. Moreover, our internet infrastructure might not be able to support continued growth of our online networks or websites. Any of these problems could result in less traffic to our networks or websites or harm the perception of our networks or websites as reliable sources of information. Less traffic on our networks and websites or periodic interruptions in service could have the effect of reducing demand for marketing and advertising on our networks or websites, thereby reducing our revenues.
Our business depends on continued and unimpeded access to the internet by us and our members. If government regulations relating to the internet change, internet access providers may be able to block, degrade, or charge for access to certain of our products and services, which could lead to additional expenses and the loss of customers.
Our products and services depend on the ability of our members to access the internet. Currently, this access is provided by companies that have significant market power in the broadband and internet access marketplace, including incumbent telephone companies, cable companies, mobile communications companies, and government-owned service providers. Some of these providers have taken, or have stated that they may take measures, including legal actions, that could degrade, disrupt, or increase the cost of member access to our advertisements or our third-party publishers’ advertisements by restricting or prohibiting the use of infrastructure to support or facilitate our offerings, or by charging increased fees to us or our members to provide our offerings. On December 14, 2017, the Federal Communications Commission voted to repeal the net neutrality rules which were intended, in part, to prevent network operators from discriminating against legal traffic that traverses their networks. It is unclear whether or if such a repeal will be subject to challenge or preemption if the U.S. Congress passes new laws regarding net neutrality. In addition, as we expand internationally, government regulations concerning the internet, in particular net neutrality, may be nascent or non-existent. This regulatory environment, coupled with the potentially significant political and economic power of local network operators, could cause us to experience discriminatory or anti-competitive practices that could impede our growth, cause us to incur additional expense, or otherwise negatively affect our business. Such interference could result in a loss of existing customers, and increased costs, and could impair our ability to attract new customers, thereby harming our revenues and growth.
Risks Related to Our Financial Statements and General Corporate Matters
If we do not maintain proper and effective disclosure controls and procedures and internal control over financial reporting, our ability to produce accurate financial statements could be impaired, which could adversely affect our operating results, our ability to operate our business and investors’ views of us.
Ensuring that we have adequate disclosure controls and procedures, including internal financial and accounting controls and procedures, in place to help ensure that we can produce accurate financial statements on a timely basis is a costly and time-consuming effort that needs to be re-evaluated frequently. On an ongoing basis, both we and our independent auditors document and test our internal controls and procedures in connection with the requirements of Section 404 of the Sarbanes-Oxley Act and, as part of that documentation and testing, identify areas for further attention and improvement. Implementing any appropriate changes to our internal controls may entail substantial costs in order to modify our existing accounting systems, take a significant period of time to complete; and distract our officers, directors and employees from the operation of our business. These changes may not, however, be effective in maintaining the adequacy of our internal controls, and any failure to maintain that adequacy, or consequent inability to produce accurate financial statements on a timely basis, could increase our operating costs and could materially impair our ability to operate our business. In addition, investors’ perceptions that our internal controls are inadequate or that we are unable to produce accurate financial statements may seriously affect our stock price.
26
Our ability to raise capital in the future may be limited.
Our business and operations may consume resources faster than we anticipate. In the future, we may need to raise additional funds to expand our sales and marketing and service development efforts or to make acquisitions. Additional financing may not be available on favorable terms, if at all. If adequate funds are not available on acceptable terms, we may be unable to fund the expansion of our sales and marketing and research and development efforts or take advantage of acquisition or other opportunities, which could seriously harm our business and operating results. If we incur debt, the debt holders would have rights senior to common stockholders to make claims on our assets and the terms of any debt could restrict our operations, including our ability to pay dividends on our common stock. Furthermore, if we issue additional equity securities, stockholders will experience dilution, and the new equity securities could have rights senior to those of our common stock. Any debt financing is likely to have financial and other covenants that could have an adverse impact on our business if we do not achieve our projected results. Because our decision to issue securities in any future offering will depend on market conditions and other factors beyond our control, we cannot predict or estimate the amount, timing or nature of our future offerings. Thus, our stockholders bear the risk of our future securities offerings reducing the market price of our common stock and diluting their interest.
Restrictive covenants in certain of the agreements and instruments governing our indebtedness, including our term loan, may adversely affect our financial and operational flexibility.
In addition to financial covenants, other covenants in our loan and credit agreement and the other agreements governing our term loan facility impose significant operating and financial restrictions on us and certain of our subsidiaries. Such covenants include, among other things, limitations on: (i) dispositions; (ii) mergers, consolidations and acquisitions; (iii) indebtedness; (iv) encumbrances; (v) dividends and other distributions, and stock repurchases; (vi) loans and other investments; (vii) transactions with affiliates; (viii) subordinated debt; and (ix) capital expenditures. Future debt agreements we enter into may include similar provisions.
These covenants may also make it more difficult or discourage a takeover of us, whether favored or opposed by our management and/or our Board of Directors.
Our ability to comply with these covenants may be affected by events beyond our control, and any material deviations from our forecasts could require us to seek waivers or amendments of covenants or alternative sources of financing, or to reduce expenditures. We cannot guarantee that such waivers, amendments or alternative financing could be obtained or, if obtained, would be on terms acceptable to us.
A breach of any of the covenants or restrictions contained in these agreements could result in an event of default. Such a default could allow our debt holder to accelerate repayment of the related debt, and/or to declare all borrowings outstanding under these agreements to be due and payable. If our debt is accelerated, our assets may not be sufficient to repay such debt.
The impairment of a significant amount of goodwill and intangible assets on our balance sheet could result in a decrease in earnings and, as a result, our stock price could decline.
We have acquired assets and businesses over time, some of which have resulted in the recording of a significant amount of goodwill and/or intangible assets on our consolidated financial statements. We had $93.6 million of goodwill and $0.7 million of net intangible assets as of December 31, 2019. The goodwill was recorded because the fair value of the net tangible assets and/or intangible assets acquired was less than the purchase price. We may not realize the full value of the goodwill and/or intangible assets. We evaluate goodwill and other intangible assets with indefinite useful lives for impairment on an annual basis or more frequently if events or circumstances suggest that the asset may be impaired. We did not have any intangible assets with indefinite lives as of December 31, 2019. We evaluate other intangible assets subject to amortization whenever events or changes in circumstances indicate that the carrying amount of those assets may not be recoverable. If goodwill or other intangible assets are determined to be impaired, we will write off the unrecoverable portion as a charge to our earnings. If we acquire new assets and businesses in the future, as we intend to do, we may record additional goodwill and/or intangible assets. The possible write-off of the goodwill and/or intangible assets could negatively impact our future earnings and, as a result, the market price of our common stock could decline.
27
The trading price of our common stock may be volatile and decline substantially.
The trading price of our common stock may be volatile and could be subject to wide fluctuations in response to various factors, some of which are beyond our control. In addition to the factors discussed in this “Risk Factors” section and elsewhere in this Annual Report on Form 10-K, these factors include:
|
|
• |
our operating performance and the operating performance of similar companies; |
|
|
• |
the overall performance of the equity markets; |
|
|
• |
announcements by us or our competitors of acquisitions, business plans, commercial relationships or new product or service offerings; |
|
|
• |
threatened or actual litigation; |
|
|
• |
changes in laws or regulations relating to the provision of internet content; |
|
|
• |
any change in our Board of Directors or management; |
|
|
• |
publication of research reports about us, our competitors or our industry, or positive or negative recommendations or withdrawal of research coverage by securities analysts; |
|
|
• |
our sale of common stock or other securities in the future; |
|
|
• |
large volumes of sales of our shares of common stock by existing stockholders; and |
|
|
• |
general political and economic conditions. |
In addition, the stock market in general, and historically the market for internet-related companies in particular, have experienced price and volume fluctuations that have often been unrelated or disproportionate to the operating performance of those companies. Securities class action litigation has often been instituted against companies following periods of volatility in the overall market and in the market price of a company’s securities. Such litigation, if instituted against us, could result in substantial costs, divert our management’s attention and resources and harm our business, operating results and financial condition.
Our full year and quarterly operating results are subject to fluctuations, and these fluctuations may adversely affect the trading price of our common stock.
We have experienced fluctuations in our full year and quarterly revenues and operating results. Our revenues and operating results may fluctuate from quarter to quarter due to a number of factors described in this Risk Factors section, many of which are outside of our control. Specifically, our results could be impacted quarter by quarter by changes in the spending priorities and marketing budget cycles of customers; the addition or loss of customers; the addition of new sites and services by us or our competitors; and seasonal fluctuations in marketing spending, based on product launch schedules, annual budget approval processes for our customers and the historical decrease in marketing spending in the summer months. Due to the foregoing as well as other risks described in this Risk Factors section, our results of operations in one or more quarters may fall below the expectations of investors and/or securities analysts. In such an event, the trading price of our common stock is likely to decline.
Provisions of our certificate of incorporation, bylaws and Delaware law could deter takeover attempts.
Various provisions in our certificate of incorporation and bylaws could delay, prevent or make more difficult a merger, tender offer, proxy contest or change of control. Our stockholders might view any transaction of this type as being in their best interest since the transaction could result in a higher stock price than the then-current market price for our common stock. Among other things, our certificate of incorporation and bylaws:
|
|
• |
authorize our Board of Directors to issue preferred stock with the terms of each series to be fixed by our Board of Directors, which could be used to institute a “poison pill” that would work to dilute the share ownership of a potential hostile acquirer, effectively preventing acquisitions that have not been approved by our Board; |
|
|
• |
divide our Board of Directors into three classes so that only approximately one-third of the total number of directors is elected each year; |
|
|
• |
permit directors to be removed only for cause; |
|
|
• |
prohibit action by written consent of our stockholders; and |
|
|
• |
specify advance notice requirements for stockholder proposals and director nominations. In addition, with some exceptions, the Delaware General Corporation Law restricts or delays mergers and other business combinations between us and any stockholder that acquires 15% or more of our voting stock. |
28
Future sales of our common stock by existing stockholders could depress the market price of our common stock.
If our existing stockholders sell, or indicate an intent to sell, substantial amounts of our common stock in the public market, the trading price of our common stock could decline significantly. A large portion of our outstanding shares of common stock is held by our officers, directors and significant stockholders. Our directors, executive officers and significant stockholders beneficially own approximately 9.9 million shares of our common stock, which represents 35% of our outstanding shares as of December 31, 2019. If these additional shares are sold, or if it is perceived that they will be sold in the public market, the trading price of our common stock could decline substantially.
A limited number of stockholders have the ability to influence the outcome of director elections and other matters requiring stockholder approval.
Our directors, executive officers and significant stockholders beneficially own approximately 35% of our outstanding common stock as of December 31, 2019. These stockholders, if they act together, could exert substantial influence over matters requiring approval by our stockholders, including the election of directors, the amendment of our certificate of incorporation and bylaws and the approval of mergers or other business combination transactions. This concentration of ownership may discourage, delay or prevent a change in control of our company, which could deprive our stockholders of an opportunity to receive a premium for their stock as part of a sale of our company and might reduce our stock price. These actions may be taken even if they are opposed by other stockholders.
None.
As of December 31, 2019, we are leasing approximately 74,000 square feet of office space for our global headquarters in Newton, Massachusetts, through December 31, 2029. The Company has an option to extend the term for an additional five-year period subject to certain terms and conditions. Additionally, we have smaller leased offices throughout Europe, North America, Asia and Australia.
We are not currently a party to any material legal proceedings, and we are not aware of any pending or threatened litigation against us that could have a material adverse effect on our business, operating results or financial condition.
29
|
Item 5. |
Market for Registrant’s Common Equity, Related Stockholder Matters and Issuer Purchases of Equity Securities |
Our common stock is listed on the Nasdaq Global Market under the trading symbol “TTGT”.
Holders
As of February 29, 2020, according to our transfer agent’s records there were 78 common stockholders of record.
Dividends
We did not declare or pay any cash dividends on our common stock during the three most recent fiscal years. We currently intend to retain earnings, if any, to fund the development and growth of our business and do not anticipate paying cash dividends on our common stock in the foreseeable future. Our payment of future dividends, if any, will be at the sole discretion of our Board of Directors after considering various factors, including our financial condition, operating results, cash needs and growth plans, as well as restrictive covenants in our debt agreements.
Equity Compensation Plan Information
Information relating to compensation plans under which our equity securities are authorized for issuance is set forth under “Security Ownership of Certain Beneficial Owners and Management and Related Stockholder Matters” in Item 12 below.
30
Stock Performance Graph
The following graph compares the cumulative total return to stockholders of our common stock for the period from December 31, 2014 to December 31, 2019, to the cumulative total return of the Russell 2000 Index and the S&P 500 Media Industry Index for the same period. This graph assumes investment of $100 on December 31, 2014 in our common stock, the Russell 2000 Index and the S&P 500 Media Industry Index and assumes any dividends are reinvested.
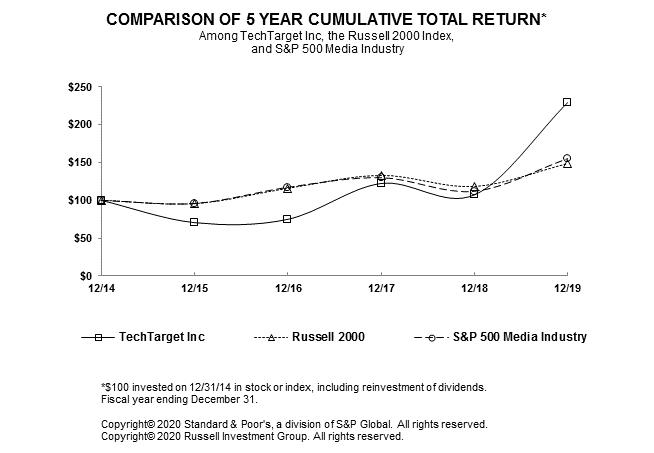
COMPARATIVE STOCK PERFORMANCE
Among TechTarget, Inc.,
the Russell 2000 Index and
the S&P 500 Media Industry Index
|
|
|
12/14 |
|
|
12/15 |
|
|
12/16 |
|
|
12/17 |
|
|
12/18 |
|
|
12/19 |
|
||||||
|
TechTarget Inc. |
|
$ |
100.00 |
|
|
$ |
70.62 |
|
|
$ |
75.02 |
|
|
$ |
122.43 |
|
|
$ |
107.39 |
|
|
$ |
229.55 |
|
|
Russell 2000 |
|
$ |
100.00 |
|
|
$ |
95.59 |
|
|
$ |
115.95 |
|
|
$ |
132.94 |
|
|
$ |
118.30 |
|
|
$ |
148.49 |
|
|
S&P 500 Media Industry |
|
$ |
100.00 |
|
|
$ |
95.79 |
|
|
$ |
117.25 |
|
|
$ |
130.06 |
|
|
$ |
111.97 |
|
|
$ |
155.29 |
|
The information included under the heading “Stock Performance Graph” in Item 5 of this Annual Report on Form 10-K is “furnished” and not “filed” and shall not be deemed to be “soliciting material” or subject to Regulation 14A, shall not be deemed “filed” for purposes of Section 18 of the Securities Exchange Act of 1934, as amended (the “Exchange Act”), or otherwise subject to the liabilities of that section, nor shall it be deemed incorporated by reference in any filing under the Securities Act of 1933, as amended, or the Exchange Act.
31
Purchases of Equity Securities by the Issuer
The following table provides information about purchases by us during the three months ended December 31, 2019 of equity securities that are registered pursuant to Section 12 of the Exchange Act.
|
Period |
|
Total Number of Shares Purchased(1) |
|
|
Average Price Paid Per Share |
|
|
Total Number of Shares Purchased as Part of Publicly Announced Plans or Programs(1) |
|
|
Approximate Dollar Value of Shares that May Yet Be Purchased Under the Plans or Programs |
|
||||
|
October 1, 2019 – October 31, 2019 |
|
|
— |
|
|
$ |
— |
|
|
|
— |
|
|
$ |
17,161,720 |
|
|
November 1, 2019 – November 30, 2019 |
|
|
— |
|
|
$ |
— |
|
|
|
— |
|
|
$ |
17,161,720 |
|
|
December 1, 2019 – December 31, 2019 |
|
|
94,125 |
|
|
$ |
24.86 |
|
|
|
94,125 |
|
|
$ |
14,821,414 |
|
|
Total |
|
|
94,125 |
|
|
$ |
24.86 |
|
|
|
94,125 |
|
|
$ |
14,821,414 |
|
|
(1) |
In November 2018, we announced that the Board of Directors had approved a stock repurchase program, which authorized management to purchase up to $25.0 million shares of our common stock from time to time on the open market or in privately negotiated transactions. The stock repurchase program expires in December 2020. |
32
The information set forth below is not necessarily indicative of results of future operations, and should be read in conjunction with Item 7, “Management’s Discussion and Analysis of Financial Condition and Results of Operations” and the consolidated financial statements and related notes thereto included in Item 8 of this Annual Report on Form 10-K to fully understand factors that may affect the comparability of the information presented below, (in thousands except per share data).
|
|
|
Years Ended December 31, |
|
|||||||||||||||||
|
|
|
2019 |
|
|
2018 |
|
|
2017 |
|
|
2016 |
|
|
2015 |
|
|||||
|
Consolidated Results of Operations Data: |
|
|
|
|
|
|
|
|
|
|
|
|
|
|
|
|
|
|
|
|
|
Revenues: |
|
$ |
133,957 |
|
|
$ |
121,333 |
|
|
$ |
108,556 |
|
|
$ |
106,625 |
|
|
$ |
111,826 |
|
|
Cost of revenues: |
|
|
31,858 |
|
|
|
28,959 |
|
|
|
28,336 |
|
|
|
30,217 |
|
|
|
29,903 |
|
|
Gross profit |
|
|
102,099 |
|
|
|
92,374 |
|
|
|
80,220 |
|
|
|
76,408 |
|
|
|
81,923 |
|
|
Operating expenses: |
|
|
|
|
|
|
|
|
|
|
|
|
|
|
|
|
|
|
|
|
|
Selling and marketing(1) |
|
|
52,462 |
|
|
|
47,779 |
|
|
|
44,747 |
|
|
|
44,316 |
|
|
|
43,722 |
|
|
Product development(1) |
|
|
8,107 |
|
|
|
8,869 |
|
|
|
8,215 |
|
|
|
8,038 |
|
|
|
7,680 |
|
|
General and administrative(1) |
|
|
14,088 |
|
|
|
14,557 |
|
|
|
12,212 |
|
|
|
12,370 |
|
|
|
12,987 |
|
|
Depreciation and amortization |
|
|
4,703 |
|
|
|
4,548 |
|
|
|
4,636 |
|
|
|
4,893 |
|
|
|
5,364 |
|
|
Total operating expenses |
|
|
79,360 |
|
|
|
75,753 |
|
|
|
69,810 |
|
|
|
69,617 |
|
|
|
69,753 |
|
|
Operating income |
|
|
22,739 |
|
|
|
16,621 |
|
|
|
10,410 |
|
|
|
6,791 |
|
|
|
12,170 |
|
|
Interest and other expense, net |
|
|
(691 |
) |
|
|
(1,778 |
) |
|
|
(693 |
) |
|
|
(1,774 |
) |
|
|
(249 |
) |
|
Income before provision for income taxes |
|
|
22,048 |
|
|
|
14,843 |
|
|
|
9,717 |
|
|
|
5,017 |
|
|
|
11,921 |
|
|
Provision for income taxes |
|
|
5,173 |
|
|
|
1,888 |
|
|
|
2,914 |
|
|
|
2,598 |
|
|
|
4,735 |
|
|
Net income |
|
$ |
16,875 |
|
|
$ |
12,955 |
|
|
$ |
6,803 |
|
|
$ |
2,419 |
|
|
$ |
7,186 |
|
|
Net income per common share(2): |
|
|
|
|
|
|
|
|
|
|
|
|
|
|
|
|
|
|
|
|
|
Basic |
|
$ |
0.61 |
|
|
$ |
0.47 |
|
|
$ |
0.25 |
|
|
$ |
0.08 |
|
|
$ |
0.22 |
|
|
Diluted |
|
$ |
0.60 |
|
|
$ |
0.45 |
|
|
$ |
0.24 |
|
|
$ |
0.08 |
|
|
$ |
0.21 |
|
|
Weighted average common shares outstanding: |
|
|
|
|
|
|
|
|
|
|
|
|
|
|
|
|
|
|
|
|
|
Basic |
|
|
27,874 |
|
|
|
27,738 |
|
|
|
27,550 |
|
|
|
29,954 |
|
|
|
32,963 |
|
|
Diluted |
|
|
28,312 |
|
|
|
28,653 |
|
|
|
28,271 |
|
|
|
30,774 |
|
|
|
34,476 |
|
|
Other Data: |
|
|
|
|
|
|
|
|
|
|
|
|
|
|
|
|
|
|
|
|
|
Adjusted EBITDA (unaudited)(3) |
|
$ |
41,955 |
|
|
$ |
30,282 |
|
|
$ |
21,958 |
|
|
$ |
18,536 |
|
|
$ |
24,499 |
|
|
|
|
|
|
|
|
|
|
|
|
|
|
|
|
|
|
|
|
|
|
|
|
|
|
As of December 31, |
|
|||||||||||||||||
|
|
|
2019 |
|
|
2018 |
|
|
2017 |
|
|
2016 |
|
|
2015 |
|
|||||
|
|
|
(in thousands) |
|
|||||||||||||||||
|
Consolidated Balance Sheet Data: |
|
|
|
|
|
|
|
|
|
|
|
|
|
|
|
|
|
|
|
|
|
Cash, cash equivalents and investments |
|
$ |
57,499 |
|
|
$ |
35,173 |
|
|
$ |
34,112 |
|
|
$ |
37,274 |
|
|
$ |
34,691 |
|
|
Total assets |
|
$ |
221,608 |
|
|
$ |
176,463 |
|
|
$ |
173,169 |
|
|
$ |
170,077 |
|
|
$ |
177,859 |
|
|
Long-term liabilities |
|
$ |
52,254 |
|
|
$ |
29,325 |
|
|
$ |
28,436 |
|
|
$ |
34,566 |
|
|
$ |
2,827 |
|
|
Total liabilities |
|
$ |
68,657 |
|
|
$ |
43,878 |
|
|
$ |
52,422 |
|
|
$ |
52,514 |
|
|
$ |
17,858 |
|
|
Treasury stock |
|
$ |
(184,972 |
) |
|
$ |
(177,905 |
) |
|
$ |
(170,816 |
) |
|
$ |
(162,731 |
) |
|
$ |
(113,949 |
) |
|
Total stockholders' equity |
|
$ |
152,951 |
|
|
$ |
132,585 |
|
|
$ |
120,747 |
|
|
$ |
117,563 |
|
|
$ |
160,001 |
|
|
(1) |
Amounts include stock-based compensation expense as follows: |
33
|
|
|
Years Ended December 31, |
|
|||||||||||||||||
|
|
|
2019 |
|
|
2018 |
|
|
2017 |
|
|
2016 |
|
|
2015 |
|
|||||
|
|
|
(in thousands) |
|
|||||||||||||||||
|
Cost of revenues |
|
$ |
210 |
|
|
$ |
159 |
|
|
$ |
43 |
|
|
$ |
112 |
|
|
$ |
84 |
|
|
Selling and marketing |
|
|
8,936 |
|
|
|
4,899 |
|
|
|
4,120 |
|
|
|
4,119 |
|
|
|
3,530 |
|
|
Product development |
|
|
408 |
|
|
|
200 |
|
|
|
112 |
|
|
|
159 |
|
|
|
111 |
|
|
General and administrative |
|
|
4,663 |
|
|
|
3,855 |
|
|
|
2,637 |
|
|
|
2,462 |
|
|
|
2,899 |
|
|
Total |
|
$ |
14,217 |
|
|
$ |
9,113 |
|
|
$ |
6,912 |
|
|
$ |
6,852 |
|
|
$ |
6,624 |
|
|
(2) |
Basic and diluted net income per common share is computed by dividing the net income applicable to common stockholders by the basic and diluted weighted-average number of common shares outstanding for the fiscal period. See Note 2 to our Consolidated Financial Statements. |
|
(3) |
The following table reconciles net income to Adjusted EBITDA for the periods presented and is unaudited: |
|
|
|
Years Ended December 31, |
|
|||||||||||||||||
|
|
|
2019 |
|
|
2018 |
|
|
2017 |
|
|
2016 |
|
|
2015 |
|
|||||
|
|
|
(in thousands) |
|
|||||||||||||||||
|
Net income |
|
$ |
16,875 |
|
|
$ |
12,955 |
|
|
$ |
6,803 |
|
|
$ |
2,419 |
|
|
$ |
7,186 |
|
|
Interest expense (income), net |
|
|
742 |
|
|
|
1,300 |
|
|
|
1,272 |
|
|
|
918 |
|
|
|
(53 |
) |
|
Provision for income taxes |
|
|
5,173 |
|
|
|
1,888 |
|
|
|
2,914 |
|
|
|
2,598 |
|
|
|
4,735 |
|
|
Depreciation and amortization |
|
|
4,999 |
|
|
|
4,548 |
|
|
|
4,636 |
|
|
|
4,893 |
|
|
|
5,364 |
|
|
Amortization of purchase price adjustment for earnouts |
|
|
— |
|
|
|
— |
|
|
|
— |
|
|
|
— |
|
|
|
341 |
|
|
EBITDA |
|
|
27,789 |
|
|
|
20,691 |
|
|
|
15,625 |
|
|
|
10,828 |
|
|
|
17,573 |
|
|
Stock-based compensation |
|
|
14,217 |
|
|
|
9,113 |
|
|
|
6,912 |
|
|
|
6,852 |
|
|
|
6,624 |
|
|
Other (income) expense, net |
|
|
(51 |
) |
|
|
478 |
|
|
|
(579 |
) |
|
|
856 |
|
|
|
302 |
|
|
Adjusted EBITDA |
|
$ |
41,955 |
|
|
$ |
30,282 |
|
|
$ |
21,958 |
|
|
$ |
18,536 |
|
|
$ |
24,499 |
|
Earnings before interest, tax, depreciation, and amortization (“EBITDA”) is a non-GAAP financial measure used by management when reviewing our performance. EBITDA represents earnings before interest expense (income) net, provision for income taxes, and depreciation and amortization. Adjusted EBITDA represents EBITDA as further adjusted to exclude stock-based compensation, other (income) expense net, secondary offering costs and other one-time charges, if any. We present Adjusted EBITDA as a supplemental performance measure because we believe it facilitates operating performance comparisons from period to period by backing out potential differences caused by variations in capital structures (affecting interest expense), tax positions (such as the impact on periods or companies of changes in effective tax rates or net operating losses), the age and book depreciation of fixed assets (affecting relative depreciation expense), acquisition-related charges (such as amortization of intangible assets and earnouts) and the impact of non-cash stock-based compensation expense. Because Adjusted EBITDA facilitates internal comparisons of operating performance on a more consistent basis, we also use Adjusted EBITDA in connection with our compensation of our executive officers and senior management. Adjusted EBITDA is not a measurement of our financial performance under Generally Accepted Accounting Principles (“GAAP”) and should not be considered as an alternative to net income (loss), operating income (loss) or any other performance measures derived in accordance with GAAP or as an alternative to cash flow from operating activities as a measure of our profitability or liquidity. We understand that although Adjusted EBITDA is frequently used by securities analysts, lenders and others in their evaluation of companies, Adjusted EBITDA has limitations as an analytical tool, and you should not consider it in isolation, or as a substitute for analysis of our results as reported under GAAP. Some of these limitations are:
|
|
• |
Adjusted EBITDA does not reflect our cash expenditures, or future requirements for capital expenditures or contractual commitments; |
|
|
• |
Adjusted EBITDA does not reflect changes in, or cash requirements for, our working capital needs; |
|
|
• |
Adjusted EBITDA does not reflect the interest expense, or the cash requirements necessary to service interest or principal payments, on our debts; |
|
|
• |
Although depreciation and amortization are non-cash charges, the assets being depreciated and amortized will often have to be replaced in the future, and Adjusted EBITDA does not reflect any cash requirements for such replacements; and |
|
|
• |
Other companies in our industry may calculate Adjusted EBITDA differently than we do, limiting its usefulness as a comparative measure. |
34
The following discussion and analysis of our financial condition and results of operations should be read in conjunction with the consolidated financial statements and accompanying notes included elsewhere in this Annual Report on Form 10-K. This discussion and analysis contain forward-looking statements that involve risks, uncertainties and assumptions. Our actual results could differ materially from those anticipated in these forward-looking statements as a result of various factors, including those discussed below and elsewhere in this Annual Report on Form 10-K, particularly under the heading “Risk Factors.” Please refer to our “Forward-Looking Statements” section on page 49.
Overview
Background
We are a Delaware corporation incorporated on September 14, 1999. Through continued innovation around our specialized online content for buyers of enterprise technology solutions, we have become a global leader in purchase intent-driven marketing and sales services that deliver business impact for enterprise technology vendors. Our offerings enable B2B technology companies to better identify, reach and influence enterprise technology decision makers actively researching specific enterprise technology purchases. We improve B2B technology companies’ ability to impact these audiences for business growth using advanced targeting, analytics and data services complemented with customized marketing programs that integrate demand generation and brand marketing and advertising techniques.
Enterprise technology and business professionals have become increasingly specialized, and because each of the websites within our network of over 140 websites focuses on a specific IT sector such as storage, security, networking, or business applications, IT and business professionals rely on us for key decision support information tailored to their specific areas of responsibility.
We enable enterprise technology and business professionals to navigate the complex and rapidly changing enterprise technology landscape where purchasing decisions can have significant financial and operational consequences. Our content strategy includes three primary sources which enterprise technology and business professionals use to assist them in their pre-purchase research: independent content provided by our professionals, vendor-generated content provided by our customers and member-generated, or peer-to-peer, content. In addition to utilizing our independent editorial content, registered members appreciate the ability to deepen their pre-purchase research by accessing the extensive vendor supplied content available across our website network. Likewise, these members derive significant additional value from the ability our network provides to seamlessly interact with and contribute to information exchanges in a given field.
We had approximately 20.5 million and 20.0 million registered members – our “audiences” – as of December 31, 2019 and 2018, respectively. While the size of our registered member base does not provide direct insight into our customer numbers or our revenues, the value of our services sold to our customers is a direct result of the breadth and reach of this content footprint. This footprint creates the opportunity for our clients to gain business leverage by targeting our audiences through customized marketing programs. Likewise, the behavior exhibited by these audiences enables us to provide our customers with data products to improve their marketing and sales efforts. The targeted nature of our member base enables B2B technology companies to reach a specialized audience efficiently because our content is highly segmented and aligned with the B2B technology companies ’ specific products. With it, we have developed a broad customer base and, in 2019 delivered, purchase intent data programs to approximately 1,400 customers.
Executive Summary
Historically, in our Annual Reports on Form 10-K we disaggregated the revenues from our IT Deal Alert and Core Online product lines. However, because all of our products leverage purchase intent data in their delivery, we believe there is no longer a meaningful distinction between the two product lines. As a result, beginning with the first quarter of 2019 we began reporting revenue as a single number.
Our total revenues for the year ended December 31, 2019 increased approximately $12.6 million, to $134.0 million, or 10% compared with 2018, driven primarily by higher Priority EngineTM revenues. Revenues from our Priority EngineTM product increased 34% in 2019 compared to 2018.
We continue to have success selling longer-term deals and, in the fourth quarter of 2019, 35% of our revenues were derived from longer-term contracts, compared to 33% in the fourth quarter of 2018. The amount of revenue that we derived from longer-term contracts in the fourth quarter of 2019 increased by approximately $2.0 million, an increase of 19% compared to the amount that we recognized in the fourth quarter of 2018.
35
Gross profit percentage remained consistent at 76% for 2019.
Business Trends
The following discussion highlights key trends affecting our business.
|
|
• |
Macro-economic Conditions and Industry Trends. Because most of our customers are B2B technology companies , the success of our business is intrinsically linked to the health, and subject to the market conditions, of the IT industry. Despite the current uncertainty in the economy, there are several factors indicating positive IT spending over the next few years is likely. There are several IT catalysts such as AI, security, data analytics, and cloud migrations, to name a few. This is coupled with the financial catalyst of the ability to expense 100% of capital improvements in the first year that was included in the 2017 tax reform bill. Importantly, the accelerated depreciation expires after 2022, giving companies a short window to invest in technology with favorable tax treatment. Our growth continues to be driven in large part by the return on the investments we made in our data analytics suite of products, IT Deal Alert, which continues to drive market share gains for us. While we will continue to invest in this growth area, management will also continue to carefully control discretionary spending such as travel and entertainment, and the filling of new and replacement positions, in an effort to maintain profit margins and cash flows. |
|
|
• |
Brexit. The United Kingdom’s June 2016 referendum, in which voters approved an exit of the United Kingdom from the European Union, commonly referred to as “Brexit,” resulted in significant general economic uncertainty as well as volatility in global stock markets and currency exchange rate fluctuations. In March 2017, the United Kingdom served notice to the European Council under Article 50 of the Lisbon Treaty of its intention to withdraw from the European Union. As of January 30, 2020, the United Kingdom’s membership in the European Union was terminated and an eleven-month transition period began which will allow time for a free trade agreement to be negotiated. If no agreement can be reached by the end of this transition period, it could mean that the United Kingdom will face tariffs on goods traveling to the EU. Brexit could subject us to new regulatory costs and compliance obligations (including regarding the treatment and transfer of personal data). The full effect of Brexit remains uncertain and depends on any agreements the United Kingdom may make to retain access to the EU market. Moreover, the overall impact of Brexit may create further global economic uncertainty, which may cause a subset of our customers to more closely monitor their costs in the affected region. Our revenue generated from customers who have billing addresses within the United Kingdom was approximately 10% of our total revenues for the years ended December 31, 2019 and 2018. |
|
|
• |
Customer Demographics. In the year ended December 31, 2019, revenues from our legacy global customers, decreased by approximately 10% compared to the prior year. Revenues from our largest 100 customers, excluding the legacy global customers described above, increased by approximately 1% compared to the prior year. Revenues attributable to our remaining customers, which includes venture capital-backed start-ups that primarily operate in North America, increased by approximately 66% over the prior year. |
Our key strategic initiatives include:
|
|
• |
Geographic – During 2019, approximately 33% of our revenues were derived from International campaigns. |
|
|
• |
Product –Purchase intent data continues to drive our product road strategy. During 2020, we intend to make our purchase intent data more readily available for salespersons at our customers, focusing on connectivity, ROI metrics and attribution. Additionally, we will be focusing on extending the market reach of our purchase intent data, with a Priority Engine offering (Priority Engine Express) tailored for the SMB market. We anticipate Priority Engine Express will ramp in the back half of 2020. |
|
|
• |
Our revenues were up 10% in 2019 compared to 2018, which was primarily driven by the increases noted above. We have looked extensively at the dynamics between our IT Deal Alert and other offerings and have evaluated whether our growth in IT Deal Alert customers is taking away from other products for those same accounts. The data, however indicates that this is not the case, and while our sales team is leading with IT Deal Alert, our sales team continues to emphasize the benefits of integration across our product offerings. |
36
Sources of Revenues
Revenue for the twelve-month periods ended December 31, 2019, 2018 and 2017 by geo-target were as follows (in thousands):
|
|
|
Twelve Months Ended December 31, |
|
|||||||||||||||||
|
|
|
|
|
|
|
|
|
|
|
2019 vs. |
|
|
|
|
|
|
2018 vs. |
|
||
|
|
|
|
|
|
|
|
|
|
|
2018 |
|
|
|
|
|
|
2017 |
|
||
|
|
|
2019 |
|
|
2018 |
|
|
% change |
|
|
2017 |
|
|
% change |
|
|||||
|
Revenue |
|
|
|
|
|
|
|
|
|
|
|
|
|
|
|
|
|
|
|
|
|
North America |
|
$ |
89,582 |
|
|
$ |
82,660 |
|
|
|
8 |
% |
|
$ |
73,349 |
|
|
|
13 |
% |
|
International |
|
|
44,375 |
|
|
|
38,673 |
|
|
|
15 |
% |
|
|
35,207 |
|
|
|
10 |
% |
|
Total Revenues |
|
$ |
133,957 |
|
|
$ |
121,333 |
|
|
|
10 |
% |
|
$ |
108,556 |
|
|
|
12 |
% |
We sell customized marketing programs to B2B technology companies targeting a specific audience within a particular enterprise technology or business sector or sub-sector. We maintain multiple points of contact with our customers to provide support throughout their organizations and their customers’ IT sales cycles. As a result, our customers often run multiple advertising programs with us in order to target their desired audience of enterprise technology and business professionals more effectively. There are multiple factors that can impact our customers’ marketing and advertising objectives and spending with us, including but not limited to, IT product launches, increases or decreases to their advertising budgets, the timing of key industry marketing events, responses to competitor activities and efforts to address specific marketing objectives such as creating brand awareness or generating sales leads. Our products and services are generally delivered under short-term contracts that run for the length of a given program, typically less than nine months. In 2016, we began to enter into longer-term contracts with certain customers, and in the year ended December 31, 2019 approximately 35% of our revenues were from longer-term contracts of approximately twelve months.
We reclassified $0.2 million in events revenue for 2017 into our consolidated revenue for presentation purposes. The events service line was discontinued in 2017 therefore there are no revenues related to events for 2018 and 2019.
Product and Service Offerings
We use our offerings to provide B2B technology companies with numerous touch points to identify, reach and influence key enterprise technology decision makers. The following is a description of the products and services we offer:
IT Deal Alert. IT Deal Alert is a suite of products and services for B2B technology companies that leverages the detailed purchase intent data that we collect about end-user enterprise technology organizations. Through proprietary scoring methodologies, we use this insight to help our customers identify and prioritize accounts whose content consumption around specific enterprise technology topics indicates that they are “in-market” for a particular product or service. We also use the data directly to identify and further profile accounts’ upcoming purchase plans.
|
|
• |
Priority Engine™. Priority Engine is a subscription service powered by our Activity Intelligence platform, which integrates with customer relationship management and marketing automation platforms from salesforce.com, Marketo, Eloqua, Pardot, and Integrate. The service delivers information that enables marketers and sales personnel to identify and understand accounts and individuals actively researching new technology purchases and then to engage those active prospects within the organizations that are relevant to the purchase. We sell this service in approximately 200 technology-specific segments which our customers use for demand generation, account-based marketing and other marketing and sales activities. Priority Engine is also available with specific geographic focus, bringing the total available segments to over 300. |
|
|
• |
Qualified Sales Opportunities™. Qualified Sales Opportunities is a product that profiles specific in-progress purchase projects, including information on scope and purchase considerations, in approximately 80 technology-specific segments. |
|
|
• |
Deal Data™. Deal Data is a customized solution aimed at sales intelligence and data scientist functions within our customer organizations. It renders our Activity Intelligence data into one-time offerings directly consumable by the customer's internal applications. |
Demand Solutions. Our offerings enable our customers to reach and influence prospective buyers through content marketing programs designed to generate demand for their solutions, and through display advertising and other brand programs that influence consideration by prospective buyers. This allows B2B Technology Companies to maximize return on investment by capturing sales leads from the distribution and promotion of content to our audience of enterprise technology and business professionals.
|
|
• |
White Papers. White papers are technical documents created by B2B Technology Companies to describe business or technical problems which are addressed by the vendors’ products or services. In a program that includes demand solutions, we post white papers on our relevant websites and our members receive targeted promotions about these content assets. Prior to viewing white papers, our registered members and visitors supply their corporate contact information and |
37
|
|
agree to receive further information from the vendor. The corporate contact and other qualification information for these leads are supplied to the vendor in near real time through our proprietary lead management software. |
|
|
• |
Webcasts, Podcasts, Videocasts and Virtual Trade Shows. Webcasts, podcasts, videocasts, virtual trade shows and similar content bring informational sessions directly to attendees’ desktops and mobile devices. As is the case with white papers, our members supply their corporate contact and qualification information to the webcast, podcast, videocast or virtual trade show sponsor when they view or download the content. Sponsorship includes access to the registrant information and visibility before, during and after the event. |
|
|
• |
Content Sponsorships. B2B Technology Companies, or groups of vendors, pay us to sponsor independent editorially created content vehicles on specific technology topics where the registrant information is then provided to all participating sponsors. In some cases, these vehicles are supported by multiple sponsors in a single segment, with the registrant information provided to all participating sponsors. Because these offerings are editorially driven, our customers get the benefit of association with independently created content as well as access to sales leads that are researching the topic. |
Brand Solutions. Our suite of brand solutions offerings provides B2B Technology Companies exposure to targeted audiences of enterprise technology and business professionals actively researching information related to their products and services. We leverage our Activity Intelligence to enable significant segmentation and targeting of specific audiences that can be accessed through these programs. Components of brand programs may include:
|
|
• |
On-Network Branding. These offerings enable our customers to influence prospective buyers through display advertising purchased on the websites we operate. Programs may include specific sites or audience segments across our sites. |
|
|
• |
Off-Network Branding. Our Off-Network offerings allow our customers to influence prospective buyers through display advertising when they are visiting other websites on the internet. We identify audience segments that can be targeted based on their activity and demonstrated interests against our content and websites, and offer an array of audience extension and retargeting solutions that leverage Activity Intelligence. |
|
|
• |
Microsites and Related Formats. We have a range of solutions that create stand-alone websites for B2B Technology Companies, or “embedded” websites that exist within the context of our existing websites, to enable a more immersive experience for enterprise technology and business professionals with the content and brand messaging of the vendor. |
Custom Content Creation. We will at times create white papers, case studies, webcasts or videos to our customers’ specifications through our Custom Content team. These customized content assets are then promoted to our audience within both demand solutions and brand solutions programs.
Cost of Revenues, Operating Expenses and Other
Expenses consist of cost of revenues, selling and marketing, product development, general and administrative, depreciation, amortization, and interest and other expense, net. Personnel-related costs are a significant component of each of these expense categories except for depreciation, amortization and interest and other expense, net.
Cost of Revenues. Cost of revenues consists primarily of: salaries and related personnel costs, member acquisition expenses (primarily keyword purchases from leading internet search sites), lead generation expenses, freelance writer expenses, website hosting costs; vendor expenses associated with the delivery of webcast, podcast, videocast and similar content; and other offerings; stock-based compensation expenses; facility expenses and other related overhead.
Selling and Marketing. Selling and marketing expenses consist primarily of salaries and related personnel costs; sales commissions; travel-related expenses; stock-based compensation expenses; facility expenses and other related overhead. Sales commissions are recorded as expense when earned by the employee, based on recorded revenue.
Product Development. Product development includes the creation and maintenance of our network of websites, advertiser offerings and technical infrastructure. Product development expense consists primarily of salaries and related personnel costs; stock-based compensation expenses; facility expenses and other related overhead.
General and Administrative. General and administrative expenses consist primarily of salaries and related personnel costs; facility expenses and related overhead; accounting, legal and other professional fees; and stock-based compensation expenses.
38
Depreciation. Depreciation expense consists of the depreciation of our property and equipment and other capitalized assets. Depreciation is calculated using the straight-line method over their estimated useful lives, ranging from three to eleven years.
Amortization of Intangible Assets. Amortization of intangible assets expense consists of the amortization of intangible assets recorded in connection with our acquisitions. Separable intangible assets that are not deemed to have an indefinite life are amortized over their estimated useful lives, which range from eighteen months to seventeen years, using methods that are expected to reflect the estimated pattern of economic use.
Interest and Other Expense, Net. Interest expense, net consists primarily of interest costs and the related amortization of deferred issuance costs on amounts borrowed under our current and prior loan agreement and amortization of premiums on our investments, less any interest income earned on cash, cash equivalents and short-term and long-term investments. We historically have invested our cash in money market accounts, municipal bonds, government agency bonds, U.S. Treasury securities, and corporate bonds. Other expense consists primarily of non-operating gains or losses, primarily related to realized and unrealized foreign currency gains and losses on trade assets and liabilities.
Application of Critical Accounting Policies and Use of Estimates
The discussion of our financial condition and results of operations is based upon our consolidated financial statements, which have been prepared in accordance with accounting principles generally accepted in the U.S. The preparation of these consolidated financial statements requires us to make estimates, judgments and assumptions that affect the reported amount of assets, liabilities, revenues and expenses and related disclosure of contingent assets and liabilities. On an ongoing basis, we evaluate our estimates, including those related to revenue, long-lived assets, goodwill, allowance for doubtful accounts, stock-based compensation, contingent liabilities, self-insurance accruals and income taxes. We based our estimates of the carrying value of certain assets and liabilities on historical experience and on various other assumptions that we believe to be reasonable. In some cases, changes in the accounting estimates are reasonably likely to occur from period to period. Our actual results may differ from these estimates under different assumptions or conditions.
We believe the following critical accounting policies affect our more significant judgments used in the preparation of our consolidated financial statements. See the notes to our consolidated financial statements for information about these critical accounting policies as well as a description of our other accounting policies.
Revenue Recognition
We generate substantially all of our revenues from the sale of targeted marketing and advertising campaigns, which we deliver via our network of websites and data analytics solutions. We recognize revenue when performance obligations are satisfied by transferring promised goods and services to customers in an amount the company expects to receive in exchange for those goods or services. The Company enters into contracts that can include various combinations of its offerings which are generally capable of being distinct and accounted for as a separate performance obligation.
The Company’s offerings consist of:
IT Deal Alert provides a suite of products that leverages detailed purchase intent data that we collect about end-user IT organizations. Through proprietary scoring methodologies, we use this insight to help our customers identify and prioritize accounts. We provide this insight primarily through Priority EngineTM, Qualified Sales OpportunitesTM and Deal DataTM. Revenue from Priority Engine which allows customers access to purchase intent data through the life of the contract is recognized ratably over the contract period. Priority EngineTM is often bundled with other duration-based solutions, which are discussed below, to maximize the data’s impact in that case revenue is recognized ratably over the contract period using the same time-based measure of progress for each of the distinct performance obligations. Determining whether products and services are considered distinct performance that should be accounted for separately versus together requires significant judgment. Revenue from Qualified Sales Opportunities and Deal Data is recognized at the point in time when control is transferred to the customer, which occurs when the related reports are provided to the customer.
Demand solutions, Brand solutions, and custom content. Demand solutions offerings provide the Company’s customers the opportunity to maximize return on investment by capturing sales leads from the distribution and promotion of content to its audience. Demand solutions may contain the following components: White Papers, Webcasts, Podcasts, Videocasts and Virtual Trade Shows, and Content Sponsorship, which the Company may utilize at its discretion. Brand Solutions provide the Company’s customers to target audiences of technology and business professionals actively researching information related to their products and services. This can be accomplished through on-network or off-network branding as well as through the hosting of Microsites. The Company will at times create white papers, case studies, webcasts, or videos to our customers’ specifications through its Custom Content team (“custom content”).
39
Revenue from brand and demand solutions is primarily recognized when the transfer of control occurs. Certain of the contracts within brand and demand solutions are duration-based campaigns which, in the event of customer cancellation, provide the Company with an enforceable right to a proportional payment for the portion of the campaign based on services provided. Accordingly, revenue from duration-based campaigns is recognized using a time-based measure of progress, which the Company believes best depicts how it satisfies its performance obligations in these arrangements as control is continuously transferred throughout the contract period. Revenue from Microsites is recognized ratably over the life of the contract. Revenue from custom content creation is recognized over the expected period of performance using a single measure of progress, typically based on hours incurred.
We recognized revenue from events in the period in which the event occurs. The majority of our events were free to qualified attendees; however, certain events were based on a paid attendee model. We recognized revenue for paid attendee events upon completion of the event. As previously disclosed, we phased out our events product line in 2017.
Long-Lived Assets
Our long-lived assets consist primarily of property and equipment, capitalized software, goodwill, and other intangible assets. Goodwill and other intangible assets have arisen principally from our acquisitions. The amount assigned to intangible assets is subjective and based on our estimates of the future benefit of the intangible assets using accepted valuation techniques, such as discounted cash flow and replacement cost models. Our long-lived assets, other than goodwill, are amortized over their estimated useful lives, which we determine based on the consideration of several factors including the period of time the asset is expected to remain in service. Intangible assets are amortized over their estimated useful lives, which range from eighteen months to seventeen years, using methods of amortization that are expected to reflect the estimated pattern of economic use. Consistent with our determination that we have only one reporting segment, we have determined that there is only one reporting unit and test goodwill for impairment at the entity level. We evaluate the carrying value and remaining useful lives of long-lived assets, other than goodwill, whenever indicators of impairment are present. We evaluate the carrying value of goodwill annually using the two-step process required by Accounting Standards Codification (“ASC”) 350, Intangibles – Goodwill and Other (“ASC 350”). The first step of the impairment test is to identify potential impairment by comparing the reporting unit’s fair value with its net book value (or carrying amount), including goodwill. The fair value is estimated based on a market value approach. If the fair value of the reporting unit exceeds it carrying amount, the reporting unit’s goodwill is not considered to be impaired and the second step of the impairment test is not performed. Whenever indicators of impairment are present, we would perform the second step and compare the implied fair value of the reporting unit’s goodwill, as defined by ASC 350, to it carrying value to determine the amount of the impairment loss, if any. As of December 31, 2019, there were no indications of impairment based on our analysis, and our estimated fair value exceeded our carrying value by a significant margin.
Fair Value of Financial Instruments
Financial instruments consist of cash and cash equivalents, short-term and long-term investments, accounts receivable, accounts payable, contingent consideration and long-term debt. Due to their short-term nature and liquidity, the carrying value of these instruments with the exception of contingent consideration and long-term debt approximates their estimated fair values. The fair value of contingent consideration was estimated using a discounted cash flow method. Amounts outstanding under our long-term debt are subject to variable rates of interest based on current market rates, and as such, we believe the carrying amount of these obligations approximates fair value.
Allowance for Doubtful Accounts
We offset gross trade accounts receivable with an allowance for doubtful accounts. The allowance for doubtful accounts is our best estimate of the amount of probable credit losses in our existing accounts receivable. We review our allowance for doubtful accounts on a regular basis, and all past due balances are reviewed individually for collectability. Account balances are charged against the allowance after all means of collection have been exhausted and the potential for recovery is considered remote. Provisions for doubtful accounts are recorded in general and administrative expense. If our historical collection experience does not reflect our future ability to collect outstanding accounts receivable, our future provision for doubtful accounts could be materially affected. To date, we have not incurred any write-offs of accounts receivable significantly different than the amounts reserved.
The allowance for doubtful accounts was $1.9 million and $2.1 million at December 31, 2019 and 2018, respectively.
40
Stock-Based Compensation
We measure stock-based compensation at the grant date based on the fair value of the award and recognize stock-based compensation in our results of operations using the straight-line method over the vesting period of the award. We use the Black-Scholes option pricing model to determine the fair value of stock option awards. We calculated the fair values of the options granted using the following estimated weighted average assumptions:
|
|
|
Years Ended December 31, |
|
|||||||||
|
|
|
2019 |
|
|
2018 |
|
|
2017 |
|
|||
|
Expected volatility |
|
|
39 |
% |
|
|
39 |
% |
|
|
43 |
% |
|
Expected term |
|
6 years |
|
|
6 years |
|
|
6 years |
|
|||
|
Risk-free interest rate |
|
|
2.15 |
% |
|
|
2.82 |
% |
|
|
1.87 |
% |
|
Expected dividend yield |
|
|
— |
% |
|
|
— |
% |
|
|
— |
% |
|
Weighted-average grant date fair value per share |
|
$ |
8.08 |
|
|
$ |
11.94 |
|
|
$ |
4.61 |
|
The expected volatility of options granted in 2019, 2018, and 2017 was determined using a weighted average of the historical volatility of our stock for a period equal to the expected life of the option. The risk-free interest rate is based on a zero-coupon U.S. treasury instrument whose term is consistent with the expected life of the stock options. We have not paid and do not anticipate paying cash dividends on our shares of common stock; therefore, the expected dividend yield is assumed to be zero. We applied an estimated annual forfeiture rate based on historical averages in determining the expense recorded in each period.
Internal-Use Software and Website Development Costs
We capitalize costs of materials, consultants and compensation and related expenses of employees who devote time to the development of internal-use software and website applications. We begin to capitalize our costs to develop software and website applications when planning stage efforts are successfully completed, management has authorized and committed project funding, and it is probable that the project will be completed, and the software will be used as intended. Our judgment is required in determining the point at which various projects enter the state at which costs may be capitalized, in assessing the ongoing value of the capitalized costs and in determining the estimated useful lives over which the costs are amortized, which is generally three years. To the extent that we change the manner in which we develop and test new features and functionalities related to our internal use software and websites, assess the ongoing value of capitalized assets or determine the estimated useful lives over which the costs are amortized, the amount of internal use software and website development costs we capitalize and amortize in future periods would be impacted. We review capitalized internal-use software and website development costs for recoverability whenever events or changes in circumstances indicate that the carrying amount of the asset may not be recoverable. We would recognize an impairment loss only if the carrying amount of the asset is not recoverable and exceeds its fair value. We capitalized internal-use software and website development costs of $5.1 million, $3.0 million, and $2.9 million for the years ended December 31, 2019, 2018, and 2017, respectively.
Income Taxes
We are subject to income taxes in both U.S. and foreign jurisdictions, and we use estimates in determining our provision for income taxes. We recognize deferred tax assets and liabilities based on temporary differences between the financial reporting and income tax bases of assets and liabilities using statutory rates expected to be in effect when such differences are settled.
Our net deferred tax liabilities are comprised primarily of book to tax differences on stock-based compensation and timing of deductions for right-of-use assets and lease liabilities, accrued expenses, depreciation, and amortization. As of December 31, 2019, we had foreign net operating loss (“NOL”) carryforwards of $0.6 million, which may be used to offset future taxable income in foreign jurisdictions and may be carried forward indefinitely. The deferred tax assets related to the foreign NOL carryforwards have been partially offset by a valuation allowance related to Hong Kong.
On December 22, 2017, the legislation commonly referred to as the Tax Cuts and Jobs Act of 2017 (“the Act”) was signed into law making significant changes to the Internal Revenue Code of 1986, as amended. Changes include, but are not limited to, a corporate tax rate decrease from 35% to 21% effective for tax years beginning after December 31, 2017. The Act also introduced a tax on global intangible low-taxed income (“GILTI”) which we have elected to account for as a period cost.
41
Net Income Per Share
We calculate basic earnings per share (“EPS”) by dividing earnings available to common stockholders for the period by the weighted average number of common shares and vested, undelivered restricted stock unit awards outstanding during the period. Because the holders of unvested restricted stock unit awards do not have non-forfeitable rights to dividends or dividend equivalents, we do not consider these awards to be participating securities that should be included in our computation of earnings per share under the two-class method. Diluted EPS is computed using the weighted average number of common shares and vested, undelivered restricted stock unit awards outstanding during the period, plus the dilutive effect of potential future issuances of common stock relating to stock option and restricted stock unit award programs using the treasury stock method. In calculating diluted EPS, the dilutive effect of stock options and restricted stock unit awards is computed using the average market price for the respective period. In addition, the assumed proceeds under the treasury stock method include the average unrecognized compensation expense of stock options and restricted stock unit awards that are in-the-money. This results in the “assumed” buyback of additional shares, thereby reducing the dilutive impact of stock options and restricted stock unit awards.
Results of Operations
The following table sets forth our results of operations for the periods indicated:
|
|
|
Years Ended December 31, |
|
|||||||||||||||||||||
|
|
|
2019 |
|
|
2018 |
|
|
2017 |
|
|||||||||||||||
|
|
|
($ in thousands) |
|
|||||||||||||||||||||
|
Revenues: |
|
$ |
133,957 |
|
|
|
100 |
% |
|
$ |
121,333 |
|
|
|
100 |
% |
|
$ |
108,556 |
|
|
|
100 |
% |
|
Total cost of revenues |
|
|
31,858 |
|
|
|
24 |
|
|
|
28,959 |
|
|
|
24 |
|
|
|
28,336 |
|
|
|
26 |
|
|
Gross profit |
|
|
102,099 |
|
|
|
76 |
|
|
|
92,374 |
|
|
|
76 |
|
|
|
80,220 |
|
|
|
74 |
|
|
Operating expenses: |
|
|
|
|
|
|
|
|
|
|
|
|
|
|
|
|
|
|
|
|
|
|
|
|
|
Selling and marketing |
|
|
52,462 |
|
|
|
39 |
|
|
|
47,779 |
|
|
|
39 |
|
|
|
44,747 |
|
|
|
41 |
|
|
Product development |
|
|
8,107 |
|
|
|
6 |
|
|
|
8,869 |
|
|
|
7 |
|
|
|
8,215 |
|
|
|
8 |
|
|
General and administrative |
|
|
14,088 |
|
|
|
11 |
|
|
|
14,557 |
|
|
|
12 |
|
|
|
12,212 |
|
|
|
11 |
|
|
Depreciation and amortization |
|
|
4,703 |
|
|
|
4 |
|
|
|
4,548 |
|
|
|
4 |
|
|
|
4,636 |
|
|
|
4 |
|
|
Total operating expenses |
|
|
79,360 |
|
|
|
59 |
|
|
|
75,753 |
|
|
|
62 |
|
|
|
69,810 |
|
|
|
64 |
|
|
Operating income |
|
|
22,739 |
|
|
|
17 |
|
|
|
16,621 |
|
|
|
14 |
|
|
|
10,410 |
|
|
|
10 |
|
|
Interest and other expense, net |
|
|
(691 |
) |
|
|
(1 |
) |
|
|
(1,778 |
) |
|
|
(2 |
) |
|
|
(693 |
) |
|
|
(1 |
) |
|
Income before provision for income taxes |
|
|
22,048 |
|
|
|
16 |
|
|
|
14,843 |
|
|
|
12 |
|
|
|
9,717 |
|
|
|
9 |
|
|
Provision for income taxes |
|
|
5,173 |
|
|
|
4 |
|
|
|
1,888 |
|
|
|
1 |
|
|
|
2,914 |
|
|
|
3 |
|
|
Net income |
|
$ |
16,875 |
|
|
|
12 |
% |
|
$ |
12,955 |
|
|
|
11 |
% |
|
$ |
6,803 |
|
|
|
6 |
% |
Comparison of Fiscal Years Ended December 31, 2019 and 2018
Revenues
|
|
|
Years Ended December 31, |
|
|||||||||||||
|
|
|
2019 |
|
|
2018 |
|
|
Increase (Decrease) |
|
|
Percent Change |
|
||||
|
|
|
($ in thousands) |
|
|||||||||||||
|
Total revenues |
|
$ |
133,957 |
|
|
$ |
121,333 |
|
|
$ |
12,624 |
|
|
|
10 |
% |
Revenues for the year ended December 31, 2019 (“fiscal 2019”) increased 10% over the year ended December 31, 2018 (“fiscal 2018”). The increase in revenues was due to our successful efforts in obtaining new Priority Engine™ customers and existing customers increasing their spend for data driven marketing products. Priority Engine™ revenues were up 34% in fiscal 2019 compared to fiscal 2018 which was driven by the addition of approximately 210 new Priority Engine™ customers.
42
Cost of Revenues and Gross Profit
|
|
|
Years Ended December 31, |
|
|||||||||||||
|
|
|
2019 |
|
|
2018 |
|
|
Increase (Decrease) |
|
|
Percent Change |
|
||||
|
|
|
($ in thousands) |
|
|||||||||||||
|
Total cost of revenues |
|
$ |
31,858 |
|
|
$ |
28,959 |
|
|
$ |
2,899 |
|
|
|
10 |
% |
|
Gross profit |
|
$ |
102,099 |
|
|
$ |
92,374 |
|
|
$ |
9,725 |
|
|
|
11 |
% |
|
Gross profit percentage |
|
|
76 |
% |
|
|
76 |
% |
|
|
|
|
|
|
|
|
Cost of Revenues. The increase in cost of revenues in fiscal 2019 was primarily driven by the increase in variable costs attributable to contracted services costs related to fulfilling campaigns attributable to the increase of $12.6 million in revenues.
Gross Profit. Our gross profit is equal to the difference between our revenues and our cost of revenues for the period. Gross profit percentage was 76% for both fiscal 2019 and fiscal 2018.
Operating Expenses and Other
|
|
|
Years Ended December 31, |
|
|||||||||||||
|
|
|
2019 |
|
|
2018 |
|
|
Increase (Decrease) |
|
|
Percent Change |
|
||||
|
|
|
($ in thousands) |
|
|||||||||||||
|
Operating expenses: |
|
|
|
|
|
|
|
|
|
|
|
|
|
|
|
|
|
Selling and marketing |
|
$ |
52,462 |
|
|
$ |
47,779 |
|
|
$ |
4,683 |
|
|
|
10 |
% |
|
Product development |
|
|
8,107 |
|
|
|
8,869 |
|
|
|
(762 |
) |
|
|
(9 |
) |
|
General and administrative |
|
|
14,088 |
|
|
|
14,557 |
|
|
|
(469 |
) |
|
|
(3 |
) |
|
Depreciation and amortization |
|
|
4,703 |
|
|
|
4,548 |
|
|
|
155 |
|
|
|
3 |
|
|
Total operating expenses |
|
$ |
79,360 |
|
|
$ |
75,753 |
|
|
$ |
3,607 |
|
|
|
5 |
% |
|
Interest and other expense, net |
|
$ |
(691 |
) |
|
$ |
(1,778 |
) |
|
$ |
1,087 |
|
|
|
(61 |
)% |
|
Provision for income taxes |
|
$ |
5,173 |
|
|
$ |
1,888 |
|
|
$ |
3,285 |
|
|
|
174 |
% |
Selling and Marketing. Sales and marketing costs increased by $4.7 million for fiscal 2019 as compared to the fiscal 2018 primarily as a result of an increase in salaries and related costs (including an increase in stock compensation of $4.0 million).
Product Development. Product development costs decreased by $0.8 million in fiscal 2019 as compared to fiscal 2018. Primarily due to an increase in capitalized software costs of $2.2 million offset partly by higher compensation costs of $1.2 million.
General and Administrative. General and administrative costs decreased by $0.5 million in fiscal 2019 as compared to fiscal 2018 primarily due to lower professional fees of $0.6 million and bad debt expense $0.7 offset by an increase in stock-based compensation costs of $0.8 million.
Depreciation and Amortization. Depreciation expense in fiscal 2019 increased slightly when compared to fiscal 2018 primarily due to the mix of new additions and their depreciable lives.
Interest and Other Expense, Net. Interest and other expense, net in fiscal 2019 decreased by $1.1 million compared to fiscal 2018. The $1.1 million change was primarily due to decrease in interest expense of $0.6 million due to a lower interest rate on the new loan and foreign currency-related gains of $52 thousand in fiscal 2019 compared to foreign currency-related losses of $0.5 million in fiscal 2018. The foreign currency-related gains and losses were due to changes in exchange rates in currencies where we record accounts receivable and accounts payable in the normal course of business, largely the United Kingdom and Australia.
Provision for Income Taxes. Our effective tax rate was 23.5% and 12.7% for the years ended December 31, 2019 and 2018, respectively. The higher rate in 2019 as compared to 2018 was primarily due to higher income and a lower tax benefit related to excess tax deductions from stock-based compensation. The effective tax rate differs from the statutory rate primarily due to these permanent differences of non-deductible expenses, excess tax deductions from stock-based compensation, state income taxes, and foreign income taxes.
43
Comparison of Fiscal Years Ended December 31, 2018 and 2017
Revenues
|
|
|
Years Ended December 31, |
|
|||||||||||||
|
|
|
2018 |
|
|
2017 |
|
|
Increase (Decrease) |
|
|
Percent Change |
|
||||
|
|
|
($ in thousands) |
|
|||||||||||||
|
Total revenues |
|
$ |
121,333 |
|
|
$ |
108,556 |
|
|
$ |
12,777 |
|
|
|
12 |
% |
Revenues for the year ended fiscal 2018 increased 12% over fiscal 2017. This increase was driven by an increase of $9.5 million in revenues from our IT Deal Alert product offerings as well as a $3.4 million increase in our revenue from other product offerings.
Cost of Revenues and Gross Profit
|
|
|
Years Ended December 31, |
|
|||||||||||||
|
|
|
2018 |
|
|
2017 |
|
|
Increase (Decrease) |
|
|
Percent Change |
|
||||
|
|
|
($ in thousands) |
|
|||||||||||||
|
Cost of revenues: |
|
|
|
|
|
|
|
|
|
|
|
|
|
|
|
|
|
Total cost of revenues |
|
$ |
28,959 |
|
|
$ |
28,336 |
|
|
$ |
623 |
|
|
|
2 |
% |
|
Gross profit |
|
$ |
92,374 |
|
|
$ |
80,220 |
|
|
$ |
12,154 |
|
|
|
15 |
% |
|
Gross profit percentage |
|
|
76 |
% |
|
|
74 |
% |
|
|
|
|
|
|
|
|
Cost of Revenues. The increase in cost of revenues was primarily driven by the increase in variable costs attributable to contracted services costs related to fulfilling campaigns attributable to an increase of $12.8 million in revenues.
Gross Profit. Our gross profit is equal to the difference between our revenues and our cost of revenues for the period. Gross profit percentage for fiscal 2018 was 76% as compared to 74% for fiscal 2017. Gross profit increased in fiscal 2018 as compared to the same period in 2017, primarily attributable to the increase in revenues as compared to the same period a year ago. Because the majority of our costs are labor-related, we expect our gross profit to fluctuate from period to period depending on the total revenues for the period.
Operating Expenses and Other
|
|
|
Years Ended December 31, |
|
|||||||||||||
|
|
|
2018 |
|
|
2017 |
|
|
Increase (Decrease) |
|
|
Percent Change |
|
||||
|
|
|
($ in thousands) |
|
|||||||||||||
|
Operating expenses: |
|
|
|
|
|
|
|
|
|
|
|
|
|
|
|
|
|
Selling and marketing |
|
$ |
47,779 |
|
|
$ |
44,747 |
|
|
$ |
3,032 |
|
|
|
7 |
% |
|
Product development |
|
|
8,869 |
|
|
|
8,215 |
|
|
|
654 |
|
|
|
8 |
|
|
General and administrative |
|
|
14,557 |
|
|
|
12,212 |
|
|
|
2,345 |
|
|
|
19 |
|
|
Depreciation and amortization |
|
|
4,548 |
|
|
|
4,636 |
|
|
|
(88 |
) |
|
|
(2 |
) |
|
Total operating expenses |
|
$ |
75,753 |
|
|
$ |
69,810 |
|
|
$ |
5,943 |
|
|
|
9 |
% |
|
Interest and other expense, net |
|
$ |
(1,778 |
) |
|
$ |
(693 |
) |
|
$ |
1,085 |
|
|
|
157 |
% |
|
Provision for income taxes |
|
$ |
1,888 |
|
|
$ |
2,914 |
|
|
$ |
(1,026 |
) |
|
|
(35 |
)% |
Selling and Marketing. Sales and marketing costs increased by $3.0 million for the fiscal year ended December 31, 2018 as compared to the fiscal year ended December 31, 2017 primarily as a result of an increase in salaries and related costs (including an increase in stock compensation of $0.8 million).
44
Product Development. Product development costs increased by $0.7 million in fiscal year ended December 31, 2018 as compared to fiscal year ended December 31, 2017. Salaries and related costs (including an increase of stock compensation of $0.1 million) increased by $0.4 million. Contracted services, hosting expenses and hardware and software related cost increased by $0.4 million which was partially offset by a $0.1 million decrease in operating supplies.
General and Administrative. General and administrative costs increased by $2.3 million in fiscal year ended December 31, 2018 as compared to fiscal year ended December 31, 2017 primarily as a result of an increase in salaries and related costs (including an increase in stock compensation of $1.2 million) of $1.5million. Additionally, non-income based taxes increased by $0.4 million
Depreciation and Amortization. Depreciation expense in fiscal 2018 decreased slightly when compared to fiscal 2017 primarily due to prior year assets ending their depreciable lives and the mix of new additions and their depreciable lives.
Interest and Other Expense, Net. Interest expense, net in 2018 was flat compared to 2017. The $1.1 million change was primarily due to foreign currency-related losses of $0.5 million in 2018 compared to foreign currency-related gains of $0.6 million in 2017. The foreign currency-related gains and losses were due to changes in exchange rates in countries where we record accounts receivable and accounts payable in the normal course of business, largely the United Kingdom and Australia.
Provision for Income Taxes. Our effective tax rate was 12.7% and 30% for the years ended December 31, 2018 and 2017, respectively. The lower rate in 2018 as compared to 2017 was primarily due to the reduction in the Federal Income Tax rate due to the Tax Cuts and Jobs Act of 2017 and excess deductions related to stock-based compensation. The effective tax rate differs from the statutory rate primarily due to these permanent differences of non-deductible expenses, excess tax deductions from stock-based compensation, state income taxes, and foreign income taxes.
Selected Quarterly Results of Operations
The following table presents our unaudited quarterly consolidated results of operations for the eight quarters ended December 31, 2019. The unaudited quarterly consolidated information has been prepared on the same basis as our audited consolidated financial statements. You should read the following table presenting our quarterly consolidated results of operations in conjunction with our audited consolidated financial statements and the related notes included elsewhere in this Annual Report on Form 10-K. The operating results for any quarter are not necessarily indicative of the operating results for any future period.
|
|
|
For the Three Months Ended |
|
|||||||||||||||||||||||||||||
|
|
|
2019 |
|
|
2018 |
|
||||||||||||||||||||||||||
|
|
|
Mar. 31 |
|
|
Jun. 30 |
|
|
Sep. 30 |
|
|
Dec. 31 |
|
|
Mar. 31 |
|
|
Jun. 30 |
|
|
Sep. 30 |
|
|
Dec. 31 |
|
||||||||
|
Total revenues |
|
$ |
29,972 |
|
|
$ |
34,286 |
|
|
$ |
33,809 |
|
|
$ |
35,890 |
|
|
$ |
27,299 |
|
|
$ |
31,472 |
|
|
$ |
30,742 |
|
|
$ |
31,820 |
|
|
Total cost of revenues |
|
|
7,012 |
|
|
|
7,952 |
|
|
|
8,047 |
|
|
|
8,847 |
|
|
|
6,725 |
|
|
|
7,124 |
|
|
|
7,445 |
|
|
|
7,665 |
|
|
Total gross profit |
|
|
22,960 |
|
|
|
26,334 |
|
|
|
25,762 |
|
|
|
27,043 |
|
|
|
20,574 |
|
|
|
24,348 |
|
|
|
23,297 |
|
|
|
24,155 |
|
|
Total operating expenses |
|
|
18,585 |
|
|
|
20,246 |
|
|
|
18,851 |
|
|
|
21,678 |
|
|
|
17,980 |
|
|
|
17,955 |
|
|
|
19,913 |
|
|
|
19,905 |
|
|
Operating income |
|
$ |
4,375 |
|
|
$ |
6,088 |
|
|
$ |
6,911 |
|
|
$ |
5,365 |
|
|
$ |
2,594 |
|
|
$ |
6,393 |
|
|
$ |
3,384 |
|
|
$ |
4,250 |
|
|
Net income |
|
$ |
3,290 |
|
|
$ |
4,151 |
|
|
$ |
5,351 |
|
|
$ |
4,083 |
|
|
$ |
2,094 |
|
|
$ |
4,420 |
|
|
$ |
3,769 |
|
|
$ |
2,672 |
|
|
Net income per common share: |
|
|
|
|
|
|
|
|
|
|
|
|
|
|
|
|
|
|
|
|
|
|
|
|
|
|
|
|
|
|
|
|
|
Basic |
|
$ |
0.12 |
|
|
$ |
0.15 |
|
|
$ |
0.19 |
|
|
$ |
0.15 |
|
|
$ |
0.08 |
|
|
$ |
0.16 |
|
|
$ |
0.14 |
|
|
$ |
0.10 |
|
|
Diluted |
|
$ |
0.12 |
|
|
$ |
0.15 |
|
|
$ |
0.19 |
|
|
$ |
0.14 |
|
|
$ |
0.07 |
|
|
$ |
0.15 |
|
|
$ |
0.13 |
|
|
$ |
0.09 |
|
Seasonality
The timing of our revenues is affected by seasonal factors. Our revenues are seasonal primarily as a result of the annual budget approval process of many of our customers, the normal timing at which our customers introduce new products, and the historical decrease in advertising in summer months. The timing of revenues in relation to our expenses, much of which do not vary directly with revenues, has an impact on the cost of revenues, selling and marketing, product development, and general and administrative expenses as a percentage of revenues in each calendar quarter during the year.
The majority of our expenses are personnel-related and include salaries, stock-based compensation, benefits and incentive-based compensation plan expenses. As a result, we have not experienced significant seasonal fluctuations in the timing of our expenses period to period.
45
Liquidity and Capital Resources
Resources
At December 31, 2019, our cash, cash equivalents and investments totaled $57.5 million. Our cash, cash equivalents and investments increased by $22.3 million during fiscal 2019, primarily due to the cash generated from operations partially offset by the repurchase of shares under our stock repurchase plan and principal payments on our term loan. Additionally, we utilized cash for purchases of property and equipment and other capitalized assets. We believe that our existing cash, cash equivalents, and investments, and our cash flow from operating activities will be sufficient to meet our anticipated cash needs for at least the next 12 months. Our future working capital requirements will depend on many factors, including the operations of our existing business, our potential strategic expansion internationally, future acquisitions we might undertake, and the expansion into complementary businesses. To the extent that our cash and cash equivalents, investments and cash flow from operating activities are insufficient to fund our future activities, we may need to raise additional funds through bank credit arrangements or public or private equity or debt financings. We also may need to raise additional funds in the event we determine in the future to effect one or more additional acquisitions of businesses.
|
|
|
As of December 31, |
|
|||||||||
|
|
|
2019 |
|
|
2018 |
|
|
2017 |
|
|||
|
|
|
(in thousands) |
|
|||||||||
|
Cash, cash equivalents and investments |
|
$ |
57,499 |
|
|
$ |
35,173 |
|
|
$ |
34,112 |
|
|
Accounts receivable, net |
|
$ |
27,102 |
|
|
$ |
30,042 |
|
|
$ |
29,601 |
|
Cash, Cash Equivalents and Investments
Our cash, cash equivalents and investments at December 31, 2019 were held for working capital purposes and were invested primarily in bonds. We do not enter into investments for trading or speculative purposes.
Accounts Receivable, Net
Our accounts receivable balance fluctuates from period to period, which affects our cash flows from operating activities. The fluctuations vary depending on the timing of our service delivery and billing activity, cash collections, and changes to our allowance for doubtful accounts. We use days sales outstanding (“DSO”) as a measurement of the quality and status of our receivables. We define DSO as net accounts receivable at quarter end divided by total revenues for the applicable period, multiplied by the number of days in the applicable period. DSO was 69 days at December 31, 2019, 87 days at December 31, 2018 and 90 days at December 31, 2017. The change in DSO year over year is primarily due to the timing of payments from all classes of customers.
Cash Flows
|
|
|
Years Ended December 31, |
|
|||||||||
|
|
|
2019 |
|
|
2018 |
|
|
2017 |
|
|||
|
|
|
(in thousands) |
|
|||||||||
|
Net cash provided by operating activities |
|
$ |
39,449 |
|
|
$ |
23,877 |
|
|
$ |
18,649 |
|
|
Net cash (used in) provided by investing activities |
|
$ |
(10,847 |
) |
|
$ |
1,692 |
|
|
$ |
6,263 |
|
|
Net cash used in financing activities |
|
$ |
(10,721 |
) |
|
$ |
(16,778 |
) |
|
$ |
(17,386 |
) |
Operating Activities
Cash provided by operating activities primarily consists of net income adjusted for certain non-cash items including depreciation and amortization, the provision for bad debt, stock-based compensation, deferred income taxes, and the effect of changes in working capital and other activities.
The increase in cash provided by operating activities in fiscal 2019 compared to fiscal 2018 was primarily the result of increases in non-cash stock compensation of $5.1 million, a $3.9 million increase in net income as well as changes in operating assets and liabilities, primarily driven by a $2.5 million increase in income taxes payable and a $2.6 million decrease in accounts receivable.
46
The increase in cash provided by operating activities in fiscal 2018 compared to fiscal 2017 was primarily the result of a $6.2 million increase in net income offset in part by changes in operating assets and liabilities, primarily driven by increases in accounts receivable and contract liabilities of $1.5 million and $2.0 million, respectively, in 2018.
Investing Activities
Cash used in investing activities in the year ended December 31, 2019 was $10.8 million; which consisted of $6.3 million for the purchase of property and equipment and other capitalized assets, made up primarily of computer equipment and related software and internal-use development costs, and $5.0 million for the purchase of investments, offset in part by $0.5 million from the maturity of short-term investments.
Cash provided by investing activities in the year ended December 31, 2018 was $1.7 million; $7.6 million from the net sales and maturities of short-term and long-term investments, partially offset by $5.5 million for the purchase of other capitalized assets, made up primarily of website development costs, computer equipment and related software and internal-use development costs and $0.4 million for cash used to acquire the operating assets of a business.
Cash provided by investing activities in the year ended December 31, 2017 was $6.3 million; which consisted of $10.4 million from the net sales and maturities of short-term and long-term investments, partially offset by $4.1 million for the purchase of property and equipment and other capitalized assets, made up primarily of website development costs, computer equipment and related software and internal-use development costs.
Capital Expenditures. We have made capital expenditures primarily for computer equipment and related software needed to host our websites, internal-use software development costs, as well as for leasehold improvements and other general purposes to support our growth. Our capital expenditures totaled $6.3 million, $5.5 million, and $4.1 million for the years ended December 31, 2019, 2018, and 2017, respectively. A majority of our capital expenditures in 2019, 2018, and 2017 were internal-use software and website development costs and, to a lesser extent, computer equipment and related software. Additionally, during 2018, the Company expended funds relating to leasehold improvements at its corporate offices.
We expect to spend approximately $6.5 million in capital expenditures in 2020, primarily for internal-use software and website development costs and computer equipment and related software. We are not currently party to any purchase contracts related to future capital expenditures. We believe we can fund these future additions through cash generated from operations.
Financing Activities
We received proceeds from the exercise of stock options in the amounts of $0.4 million, $1.0 million and $0.9 million in the years ended December 31, 2019, 2018, and 2017, respectively. These inflows were offset by $7.1 million, $7.1 million, and $8.1 million used for the repurchase of shares under our stock repurchase programs in 2019, 2018, and 2017, respectively, as well as $2.8 million, $3.2 million, and $3.9 million related to tax withholdings on net share settlements in 2019, 2018, and 2017, respectively.
Common Stock Repurchase Programs
In November 2018, we announced that our Board had authorized a $25.0 million stock repurchase program (the “November 2018 Repurchase Program”) whereby we are authorized to repurchase our common stock from time to time on the open market or in privately negotiated transactions at prices and in the manner that may be determine by management. During the last quarter of 2019 we repurchased 94,125 shares of common stock for an aggregate purchase price of approximately $2.3 million pursuant to the November 2018 Repurchase Program. As of December 31, 2019, approximately $14.8 million remained authorized.
In June 2016, we announced that our Board had authorized a $20.0 million stock repurchase program (the “June 2016 Repurchase Program”). During 2018 and 2017 we repurchased 211,729 and 749,437 shares of common stock, respectively, for an aggregate purchase price of $3.9 million and $8.1 million respectively, pursuant to the June 2016 Repurchase Program. The June 2016 Repurchase program expired in August 2018.
In the twelve months ended December 31, 2019 we repurchased a total of 411,849 shares for an aggregate purchase price of approximately $7.1 million under the “November 2018 Repurchase Program.”
Repurchased shares were recorded under the cost method and are reflected as treasury stock in the accompanying Consolidated Balance Sheets. All repurchased shares were funded with cash on hand. (see Note 9 to our Consolidated Financial Statements).
47
Term Loans
On May 9, 2016, we entered into a Senior Secured Credit Facilities Credit Agreement (the “Term Loan Agreement”), under which, we borrowed $50.0 million in aggregate principal amount pursuant to a five-year term loan. We repaid $32.5 million and $6.3 million of the outstanding principal balance during 2018 and 2017, respectively. The Term Loan Agreement was replaced by the loan agreement entered into with Western Alliance Bank in December 2018, as more fully described below.
On December 24, 2018, we entered a Loan and Security Agreement (the “Loan Agreement”) with Western Alliance Bank as the lender. The Loan Agreement provides for a $25 million term loan facility with a maturity date of December 10, 2023 and replaced the Term Loan.
The borrowings under the Loan Agreement are secured by a lien on substantially all of the assets of the Company, including a pledge of the stock of certain of its wholly-owned subsidiaries (limited, in the case of the stock of certain foreign subsidiaries of the Company, to no more than 65% of the capital stock of such subsidiaries). Borrowings under the Loan Agreement must be repaid quarterly, with applicable interest paid monthly, in the following manner: 1.25% of the initial aggregate borrowings are due and payable each quarter for the first two loan years, 1.88% of the initial aggregate borrowings are due and payable each quarter for the third loan year, and 2.50% of the initial aggregate borrowings are due and payable each quarter for the fourth and fifth loan years. At maturity, all outstanding amounts, including unpaid principal and accrued and unpaid interest, under the Loan Agreement will be due and payable. We repaid $1.3 million of the outstanding principal balance in 2019.
The borrowings are subject to a leverage ratio, measured quarterly. The Loan Agreement also requires the Company to make representations and warranties and to comply with certain other covenants and agreements that are customary in loan agreements of this type. At December 31, 2019, we were in compliance with all covenants under the Loan Agreement.
Borrowings under the Loan Agreement bear interest, on the outstanding daily balance thereof, at a floating per annum rate equal to one and three-eighths percent (1.375%) above the greater of (a) the one (1) month U.S. LIBOR rate reported in The Wall Street Journal as of such date or (b) two percent (2.00%).
The Loan Agreement required the Company to pay a one-time non-refundable facility fee of approximately $25,000 on the closing date.
Borrowings under the Loan Agreement may be prepaid by the Company at its option without penalty, provided the Company complies with the notice provision of the document. The Loan Agreement also contains customary events of default, subject to grace periods in certain cases, which may cause repayment of the Loan Agreement to be accelerated.
Contractual Obligations and Commitments
As of December 31, 2019, our principal contractual commitments consist of obligations under leases for office space and borrowings under our Loan Agreement. The offices are leased under non-cancelable operating lease agreements that expire through 2029.
The following table sets forth our commitments to settle contractual obligations in cash as of December 31, 2019:
|
|
|
Payments Due By Period (in thousands) |
|
|||||||||||||||||
|
Contractual Obligations |
|
Total |
|
|
Less than 1 Year |
|
|
1–3 Years |
|
|
3–5 Years |
|
|
More than 5 Years |
|
|||||
|
Loan Agreement |
|
$ |
23,750 |
|
|
$ |
1,250 |
|
|
$ |
4,375 |
|
|
$ |
18,125 |
|
|
$ |
— |
|
|
Operating leases |
|
|
36,888 |
|
|
|
3,746 |
|
|
|
7,961 |
|
|
|
7,421 |
|
|
|
17,760 |
|
|
Total |
|
$ |
60,638 |
|
|
$ |
4,996 |
|
|
$ |
12,336 |
|
|
$ |
25,546 |
|
|
$ |
17,760 |
|
See Note 9 to our Consolidated Financial Statements for further information on our Loan Agreement and Note 10 to our Consolidated Financial Statements for further information with respect to our operating leases.
Off-Balance Sheet Arrangements
We do not have any off-balance sheet arrangements.
48
Recent Accounting Pronouncements
See Note 2 to our Consolidated Financial Statements for recent accounting pronouncements that could have an effect on us.
Forward Looking Statements
Certain information included in this Annual Report on Form 10-K may contain “forward-looking statements” within the meaning of Section 27A of the Securities Act of 1933 and Section 21E of the Exchange Act. All statements, other than statements of historical facts, included or referenced in this Annual Report on Form 10-K that address activities, events or developments which we expect will or may occur in the future are forward-looking statements, including statements regarding the intent, belief or current expectations of the Company and members of our management team. The words “will,” “believe,” “intend,” “expect,” “anticipate,” “project,” “estimate,” “predict” and similar expressions are also intended to identify forward-looking statements. Such statements may include those regarding guidance on our future financial results and other projections or measures of our future performance; our expectations concerning market opportunities and our ability to capitalize on them; and the amount and timing of the benefits expected from acquisitions, new products or services and other potential sources of additional revenues. Such forward-looking statements are not guarantees of future performance and involve risks and uncertainties. These statements speak only as of the date of this Annual Report on Form 10-K and are based on our current plans and expectations, and they involve risks and uncertainties that could cause actual future events or results to be different than those described in or implied by such forward-looking statements. These risks and uncertainties include, but are not limited to, those relating to: market acceptance of our products and services, including continued increased sales of our IT Deal Alert offerings and continued increased international growth; relationships with customers, strategic partners and employees; difficulties in integrating acquired businesses; changes in economic or regulatory conditions or other trends affecting the internet, internet marketing and advertising and IT industries; and other matters included in our filings with the Securities and Exchange Commission, including those detailed under Part I, Item 1A, “Risk Factors” of this Annual Report on Form 10-K for the year ended December 31, 2019. Actual results may differ materially from those contemplated by the forward-looking statements. We undertake no obligation to update our forward-looking statements to reflect future events or circumstances.
49
Market risk represents the risk of loss that may impact our financial position due to adverse changes in financial market prices and rates. Our market risk exposure is primarily a result of fluctuations in foreign exchange rates and interest rates. We do not hold or issue financial instruments for trading purposes.
Foreign Currency Exchange Risk
We currently have subsidiaries in the United Kingdom, Hong Kong, Australia, Singapore, Germany and France. Approximately 26% of our revenues for the year ended December 31, 2019 were derived from customers with billing addresses outside of the United States and our foreign exchange gains/losses were not significant. Currently, our largest foreign currency exposures are the euro and British pound. We performed a sensitivity analysis on the impact of foreign exchange fluctuations on our operating income, based on our financial results for the year ended December 31, 2019. For the year ended December 31, 2019, we estimate that a 10% unfavorable movement in foreign currency exchange rates would have decreased operating income by less than $100 thousand assuming that all currencies moved in the same direction at the same time and a constant ratio of non-U.S. dollar denominated revenue and expenses to U.S. dollar denominated revenue and expenses. Since a portion of our revenue is deferred revenue that is recorded at different foreign currency exchange rates, the impact to revenue of a change in foreign currency exchange rates is recognized over time, and the impact to expenses is more immediate, as expenses are recognized at the current foreign currency exchange rate in effect at the time the expense is incurred. We currently believe our exposure to foreign currency exchange rate fluctuations is financially immaterial and therefore have not entered into foreign currency hedging transactions.
We continue to review this issue and may consider hedging certain foreign exchange risks through the use of currency futures or options in the future. The volatility of exchange rates depends on many factors that we cannot forecast with reliable accuracy. Our continued international expansion increases our exposure to exchange rate fluctuations and as a result such fluctuations could have a significant impact on our future results of operations.
Interest Rate Risk
At December 31, 2019, we had cash, cash equivalents and investments totaling $57.5 million. The cash, cash equivalents and investments were held for working capital purposes. Approximately 10% of fund were invested in a short-term bond fund. We do not enter into investments for trading or speculative purposes. Due to the short-term nature of these investments, we believe that we do not have any material exposure to changes in the fair value of our investment portfolio as a result of changes in interest rates. Declines in interest rates, however, would reduce future investment income.
Our exposure to market risk also relates to interest expense on borrowings under the Loan Agreement. The borrowings under the Loan Agreement bear interest at an annual rate of 1.375% plus the higher of the one (1) month U.S. LIBOR rate reported in the Wall Street Journal or two percent (2.00%) (see Note 9 to our Consolidated Financial Statements). Based on the $23.8 million of aggregate principal outstanding under the Loan Agreement as of December 31, 2019, a 200 basis point increase in interest rates would increase our annual interest expense under the Loan Agreement by approximately $0.5 million.
50
Index to Consolidated Financial Statements
|
|
Page |
|
|
|
|
52-54 |
|
|
|
|
|
Consolidated Balance Sheets as of December 31, 2019 and 2018 |
55 |
|
|
|
|
56 |
|
|
|
|
|
57 |
|
|
|
|
|
Consolidated Statements of Cash Flows for the Years Ended December 31, 2019, 2018, and 2017 |
58 |
|
|
|
|
59 |
51
Report of Independent Registered Public Accounting Firm
To the Board of Directors and Shareholders of
TechTarget, Inc.
Newton, Massachusetts
Opinion on the Financial Statements and Internal Control over Financial Reporting
We have audited the accompanying consolidated balance sheet of TechTarget, Inc. and subsidiaries (the “Company”) as of December 31, 2019, and the related consolidated statements of income and comprehensive income, stockholders’ equity, and cash flows for the year then ended, and the related notes to the consolidated financial statements (collectively referred to as the consolidated financial statements). We also have audited the Company’s internal control over financial reporting as of December 31, 2019 based on criteria established in Internal Control —Integrated Framework (2013) issued by the Committee of Sponsoring Organizations of the Treadway Commission (“COSO”).
In our opinion, the consolidated financial statements referred to above present fairly, in all material respects, the financial position of the Company as of December 31, 2019, and the results of its operations and its cash flows for the year then ended, in conformity with accounting principles generally accepted in the United States of America. Also, in our opinion, the Company maintained, in all material respects, effective internal control over financial reporting as of December 31, 2019, based on criteria established in Internal Control — Integrated Framework (2013) issued by COSO.
Change in Accounting Principle
As discussed in Note 10 to the consolidated financial statements, the Company has changed its method of accounting for leases as of January 1, 2019 due to the adoption of Accounting Standards Codification Topic 842, Leases.
Basis for Opinion
The Company’s management is responsible for the consolidated financial statements, for maintaining effective internal control over financial reporting, and for its assessment of the effectiveness of internal control over financial reporting. Our responsibility is to express an opinion on the Company’s consolidated financial statements and an opinion on the Company’s internal control over financial reporting based on our audits. We are a public accounting firm registered with the Public Company Accounting Oversight Board (PCAOB) and are required to be independent with respect to the Company in accordance with the U.S. federal securities laws and the applicable rules and regulations of the Securities and Exchange Commission and the PCAOB.
We conducted our audits in accordance with the standards of the PCAOB. Those standards require that we plan and perform the audits to obtain reasonable assurance about whether the consolidated financial statements are free from material misstatement, whether due to error or fraud, and whether effective internal control over financial reporting was maintained in all material respects.
Our audit of the consolidated financial statements included performing procedures to assess the risks of material misstatement of the consolidated financial statements, whether due to error or fraud, and performing procedures that respond to those risks. Such procedures included examining, on a test basis, evidence regarding the amounts and disclosures in the financial statements. Our audit also included evaluating the accounting principles used and significant estimates made by management, as well as evaluating the overall presentation of the consolidated financial statements. Our audit of internal control over financial reporting included obtaining an understanding of internal control over financial reporting, assessing the risk that a material weakness exists, and testing and evaluating the design and operating effectiveness of internal control based on the assessed risk. Our audits also included performing such other procedures as we considered necessary in the circumstances. We believe that our audits provide a reasonable basis for our opinions.
52
Definition and Limitations of Internal Control over Financial Reporting
A company’s internal control over financial reporting is a process designed to provide reasonable assurance regarding the reliability of financial reporting and the preparation of consolidated financial statements for external purposes in accordance with generally accepted accounting principles. A company’s internal control over financial reporting includes those policies and procedures that (1) pertain to the maintenance of records that, in reasonable detail, accurately and fairly reflect the transactions and dispositions of the assets of the company; (2) provide reasonable assurance that transactions are recorded as necessary to permit preparation of consolidated financial statements in accordance with generally accepted accounting principles, and that receipts and expenditures of the company are being made only in accordance with authorizations of management and directors of the company; and (3) provide reasonable assurance regarding prevention or timely detection of unauthorized acquisition, use, or disposition of the company’s assets that could have a material effect on the consolidated financial statements.
Because of its inherent limitations, internal control over financial reporting may not prevent or detect misstatements. Also, projections of any evaluation of effectiveness to future periods are subject to the risk that the controls may become inadequate because of changes in conditions, or that the degree of compliance with the policies or procedures may deteriorate.
/s/ Stowe & Degon, LLC
Westborough, Massachusetts
March 16, 2020
We have served as the Company’s auditor since 2019.
53
Report of Independent Registered Public Accounting Firm
Shareholders and Board of Directors
TechTarget, Inc.
Newton, Massachusetts
Opinion on the Consolidated Financial Statements
We have audited the accompanying consolidated balance sheets of TechTarget, Inc. (the “Company”) and subsidiaries as of December 31, 2018 and 2017, the related consolidated statements of income and comprehensive income, stockholders’ equity, and cash flows for each of the three years in the period ended December 31, 2018, and the related notes (collectively referred to as the “consolidated financial statements”). In our opinion, the consolidated financial statements present fairly, in all material respects, the financial position of the Company and subsidiaries at December 31, 2018 and 2017, and the results of their operations and their cash flows for each of the three years in the period ended December 31, 2018, in conformity with accounting principles generally accepted in the United States of America.
We also have audited, in accordance with the standards of the Public Company Accounting Oversight Board (United States) (“PCAOB”), the Company's internal control over financial reporting as of December 31, 2018, based on criteria established in Internal Control – Integrated Framework (2013) issued by the Committee of Sponsoring Organizations of the Treadway Commission (“COSO”) and our report dated March 12, 2019 expressed an unqualified opinion thereon.
Basis for Opinion
These consolidated financial statements are the responsibility of the Company’s management. Our responsibility is to express an opinion on the Company’s consolidated financial statements based on our audits. We are a public accounting firm registered with the Public Company Accounting Oversight Board (United States) (“PCAOB”) and are required to be independent with respect to the Company in accordance with the U.S. federal securities laws and the applicable rules and regulations of the Securities and Exchange Commission and the PCAOB.
We conducted our audits in accordance with the standards of the PCAOB. Those standards require that we plan and perform the audit to obtain reasonable assurance about whether the consolidated financial statements are free of material misstatement, whether due to error or fraud.
Our audits included performing procedures to assess the risks of material misstatement of the consolidated financial statements, whether due to error or fraud, and performing procedures that respond to those risks. Such procedures included examining, on a test basis, evidence regarding the amounts and disclosures in the consolidated financial statements. Our audits also included evaluating the accounting principles used and significant estimates made by management, as well as evaluating the overall presentation of the consolidated financial statements. We believe that our audits provide a reasonable basis for our opinion.
/s/ BDO USA, LLP
We have served as the Company's auditor from 2011 to 2019.
Boston, Massachusetts
March 12, 2019
54
TechTarget, Inc.
(in thousands, except share and per share data)
|
|
|
December 31, |
|
|||||
|
|
|
2019 |
|
|
2018 |
|
||
|
Assets |
|
|
|
|
|
|
|
|
|
Current assets: |
|
|
|
|
|
|
|
|
|
Cash and cash equivalents |
|
$ |
52,487 |
|
|
$ |
34,673 |
|
|
Short-term investments |
|
|
5,012 |
|
|
|
500 |
|
|
Accounts receivable, net of allowance for doubtful accounts of $1,899 and $2,099, respectively |
|
|
27,102 |
|
|
|
30,042 |
|
|
Prepaid taxes |
|
|
1,017 |
|
|
|
1,834 |
|
|
Prepaid expenses and other current assets |
|
|
1,813 |
|
|
|
3,069 |
|
|
Total current assets |
|
|
87,431 |
|
|
|
70,118 |
|
|
Property and equipment, net |
|
|
12,371 |
|
|
|
10,901 |
|
|
Goodwill |
|
|
93,639 |
|
|
|
93,687 |
|
|
Intangible assets, net |
|
|
710 |
|
|
|
849 |
|
|
Operating lease assets with right-of-use |
|
|
26,385 |
|
|
|
— |
|
|
Deferred tax assets |
|
|
136 |
|
|
|
55 |
|
|
Other assets |
|
|
936 |
|
|
|
853 |
|
|
Total assets |
|
$ |
221,608 |
|
|
$ |
176,463 |
|
|
Liabilities and Stockholders’ Equity |
|
|
|
|
|
|
|
|
|
Current liabilities: |
|
|
|
|
|
|
|
|
|
Accounts payable |
|
$ |
2,036 |
|
|
$ |
1,871 |
|
|
Current operating lease liability |
|
|
2,571 |
|
|
|
— |
|
|
Current portion of term loan |
|
|
1,241 |
|
|
|
1,241 |
|
|
Accrued expenses and other current liabilities |
|
|
2,476 |
|
|
|
3,260 |
|
|
Accrued compensation expenses |
|
|
3,679 |
|
|
|
2,432 |
|
|
Income taxes payable |
|
|
65 |
|
|
|
176 |
|
|
Contract liabilities |
|
|
4,335 |
|
|
|
5,573 |
|
|
Total current liabilities |
|
|
16,403 |
|
|
|
14,553 |
|
|
Non-current operating lease liability |
|
|
28,170 |
|
|
|
— |
|
|
Long-term portion of term loan |
|
|
22,473 |
|
|
|
23,714 |
|
|
Deferred rent |
|
|
— |
|
|
|
4,949 |
|
|
Deferred tax liabilities |
|
|
1,611 |
|
|
|
662 |
|
|
Total liabilities |
|
|
68,657 |
|
|
|
43,878 |
|
|
Commitments and contingencies (See Note 10) |
|
|
|
|
|
|
|
|
|
Stockholders’ equity: |
|
|
|
|
|
|
|
|
|
Preferred stock, $0.001 par value; 5,000,000 shares authorized; no shares issued or outstanding |
|
|
— |
|
|
|
— |
|
|
Common stock, $0.001 par value; 100,000,000 shares authorized; 54,903,824 and 54,117,325 shares issued, respectively; 28,142,519 and 27,791,045 shares outstanding, respectively |
|
|
55 |
|
|
|
54 |
|
|
Treasury stock, at cost; 26,761,305 and 26,326,280 shares, respectively |
|
|
(184,972 |
) |
|
|
(177,905 |
) |
|
Additional paid-in capital |
|
|
317,675 |
|
|
|
307,014 |
|
|
Accumulated other comprehensive (loss) |
|
|
(319 |
) |
|
|
(215 |
) |
|
Retained earnings |
|
|
20,512 |
|
|
|
3,637 |
|
|
Total stockholders’ equity |
|
|
152,951 |
|
|
|
132,585 |
|
|
Total liabilities and stockholders’ equity |
|
$ |
221,608 |
|
|
$ |
176,463 |
|
See accompanying Notes to Consolidated Financial Statements.
55
TechTarget, Inc.
Consolidated Statements of Income and Comprehensive Income
(in thousands, except per share data)
|
|
|
For the Years Ended December 31, |
|
|||||||||
|
|
|
2019 |
|
|
2018 |
|
|
2017 |
|
|||
|
Revenues |
|
$ |
133,957 |
|
|
$ |
121,333 |
|
|
$ |
108,556 |
|
|
Cost of revenues(1) |
|
|
31,858 |
|
|
|
28,959 |
|
|
|
28,336 |
|
|
Gross profit |
|
|
102,099 |
|
|
|
92,374 |
|
|
|
80,220 |
|
|
Operating expenses: |
|
|
|
|
|
|
|
|
|
|
|
|
|
Selling and marketing(1) |
|
|
52,462 |
|
|
|
47,779 |
|
|
|
44,747 |
|
|
Product development(1) |
|
|
8,107 |
|
|
|
8,869 |
|
|
|
8,215 |
|
|
General and administrative(1) |
|
|
14,088 |
|
|
|
14,557 |
|
|
|
12,212 |
|
|
Depreciation and amortization, excluding depreciation of $296, $0, and $0 included in cost of revenues |
|
|
4,703 |
|
|
|
4,548 |
|
|
|
4,636 |
|
|
Total operating expenses |
|
|
79,360 |
|
|
|
75,753 |
|
|
|
69,810 |
|
|
Operating income |
|
|
22,739 |
|
|
|
16,621 |
|
|
|
10,410 |
|
|
Interest (expense) income and other (expense) income, net |
|
|
(691 |
) |
|
|
(1,778 |
) |
|
|
(693 |
) |
|
Income before provision for income taxes |
|
|
22,048 |
|
|
|
14,843 |
|
|
|
9,717 |
|
|
Provision for income taxes |
|
|
5,173 |
|
|
|
1,888 |
|
|
|
2,914 |
|
|
Net income |
|
$ |
16,875 |
|
|
$ |
12,955 |
|
|
$ |
6,803 |
|
|
Other comprehensive (loss) income, net of tax: |
|
|
|
|
|
|
|
|
|
|
|
|
|
Unrealized gain on investments (net of tax provision of $0,$(11) and $(7) |
|
$ |
— |
|
|
$ |
15 |
|
|
$ |
13 |
|
|
Foreign currency translation adjustments |
|
|
(104 |
) |
|
|
(295 |
) |
|
|
300 |
|
|
Other comprehensive (loss) income |
|
|
(104 |
) |
|
|
(280 |
) |
|
|
313 |
|
|
Comprehensive income |
|
$ |
16,771 |
|
|
$ |
12,675 |
|
|
$ |
7,116 |
|
|
Net income per common share: |
|
|
|
|
|
|
|
|
|
|
|
|
|
Basic |
|
$ |
0.61 |
|
|
$ |
0.47 |
|
|
$ |
0.25 |
|
|
Diluted |
|
$ |
0.60 |
|
|
$ |
0.45 |
|
|
$ |
0.24 |
|
|
Weighted average common shares outstanding: |
|
|
|
|
|
|
|
|
|
|
|
|
|
Basic |
|
|
27,874 |
|
|
|
27,738 |
|
|
|
27,550 |
|
|
Diluted |
|
|
28,312 |
|
|
|
28,653 |
|
|
|
28,271 |
|
|
(1) |
Amounts include stock-based compensation expense as follows: |
|
Cost of revenues |
|
$ |
210 |
|
|
$ |
159 |
|
|
$ |
43 |
|
|
Selling and marketing |
|
$ |
8,936 |
|
|
$ |
4,899 |
|
|
$ |
4,120 |
|
|
Product development |
|
$ |
408 |
|
|
$ |
200 |
|
|
$ |
112 |
|
|
General and administrative |
|
$ |
4,663 |
|
|
$ |
3,855 |
|
|
$ |
2,637 |
|
See accompanying Notes to Consolidated Financial Statements.
56
TechTarget, Inc.
Consolidated Statements of Stockholders’ Equity
(in thousands, except share and per share data)
|
|
|
Common Stock |
|
|
Treasury Stock |
|
|
Additional |
|
|
Accumulated Other |
|
|
Retained Earnings |
|
|
Total |
|
||||||||||||||
|
|
|
Number of Shares |
|
|
$0.001 Par Value |
|
|
Number of Shares |
|
|
Cost |
|
|
Paid-In Capital |
|
|
Comprehensive (Loss) Gain |
|
|
(Accumulated Deficit) |
|
|
Stockholders’ Equity |
|
||||||||
|
Balance, December 31, 2016 |
|
|
52,601,284 |
|
|
$ |
52 |
|
|
|
25,105,745 |
|
|
$ |
(162,731 |
) |
|
$ |
296,853 |
|
|
$ |
(248 |
) |
|
$ |
(16,363 |
) |
|
$ |
117,563 |
|
|
Issuance of common stock from stock options and restricted stock units |
|
|
737,013 |
|
|
|
1 |
|
|
|
— |
|
|
|
— |
|
|
|
941 |
|
|
|
— |
|
|
|
— |
|
|
|
942 |
|
|
Purchase of common stock through stock repurchase program |
|
|
— |
|
|
|
— |
|
|
|
749,437 |
|
|
|
(8,085 |
) |
|
|
— |
|
|
|
— |
|
|
|
— |
|
|
|
(8,085 |
) |
|
Shelf registration and other fees |
|
|
— |
|
|
|
— |
|
|
|
— |
|
|
|
— |
|
|
|
(3 |
) |
|
|
— |
|
|
|
— |
|
|
|
(3 |
) |
|
Stock-based compensation expense |
|
|
— |
|
|
|
— |
|
|
|
— |
|
|
|
— |
|
|
|
6,912 |
|
|
|
— |
|
|
|
— |
|
|
|
6,912 |
|
|
Tax withholdings related to net share settlement of RSU’s |
|
|
— |
|
|
|
— |
|
|
|
— |
|
|
|
— |
|
|
|
(3,940 |
) |
|
|
— |
|
|
|
— |
|
|
|
(3,940 |
) |
|
Unrealized gain on investments (net of tax provision of $7) |
|
|
— |
|
|
|
— |
|
|
|
— |
|
|
|
— |
|
|
|
— |
|
|
|
13 |
|
|
|
— |
|
|
|
13 |
|
|
Unrealized gain on foreign currency translation |
|
|
— |
|
|
|
— |
|
|
|
— |
|
|
|
— |
|
|
|
— |
|
|
|
300 |
|
|
|
— |
|
|
|
300 |
|
|
Reclassification for adoption of ASU 2016-09 |
|
|
— |
|
|
|
— |
|
|
|
— |
|
|
|
— |
|
|
|
— |
|
|
|
— |
|
|
|
242 |
|
|
|
242 |
|
|
Net income |
|
|
— |
|
|
|
— |
|
|
|
— |
|
|
|
— |
|
|
|
— |
|
|
|
— |
|
|
|
6,803 |
|
|
|
6,803 |
|
|
Balance, December 31, 2017 |
|
|
53,338,297 |
|
|
$ |
53 |
|
|
|
25,855,182 |
|
|
$ |
(170,816 |
) |
|
$ |
300,763 |
|
|
$ |
65 |
|
|
$ |
(9,318 |
) |
|
$ |
120,747 |
|
|
Issuance of common stock from stock options and restricted stock units |
|
|
779,028 |
|
|
|
1 |
|
|
|
— |
|
|
|
— |
|
|
|
1,004 |
|
|
|
— |
|
|
|
— |
|
|
|
1,005 |
|
|
Purchase of common stock through stock repurchase program |
|
|
— |
|
|
|
— |
|
|
|
471,098 |
|
|
|
(7,089 |
) |
|
|
— |
|
|
|
— |
|
|
|
— |
|
|
|
(7,089 |
) |
|
Stock-based compensation expense |
|
|
— |
|
|
|
— |
|
|
|
— |
|
|
|
— |
|
|
|
8,397 |
|
|
|
— |
|
|
|
— |
|
|
|
8,397 |
|
|
Tax withholdings related to net share settlement of RSU’s |
|
|
— |
|
|
|
— |
|
|
|
— |
|
|
|
— |
|
|
|
(3,150 |
) |
|
|
— |
|
|
|
— |
|
|
|
(3,150 |
) |
|
Unrealized gain on investments (net of tax provision of $11) |
|
|
— |
|
|
|
— |
|
|
|
— |
|
|
|
— |
|
|
|
— |
|
|
|
15 |
|
|
|
— |
|
|
|
15 |
|
|
Unrealized loss on foreign currency translation |
|
|
— |
|
|
|
— |
|
|
|
— |
|
|
|
— |
|
|
|
— |
|
|
|
(295 |
) |
|
|
— |
|
|
|
(295 |
) |
|
Net income |
|
|
— |
|
|
|
— |
|
|
|
— |
|
|
|
— |
|
|
|
— |
|
|
|
— |
|
|
|
12,955 |
|
|
|
12,955 |
|
|
Balance, December 31, 2018 |
|
|
54,117,325 |
|
|
$ |
54 |
|
|
|
26,326,280 |
|
|
$ |
(177,905 |
) |
|
$ |
307,014 |
|
|
$ |
(215 |
) |
|
$ |
3,637 |
|
|
$ |
132,585 |
|
|
Issuance of common stock from stock options and restricted stock units |
|
|
763,323 |
|
|
|
1 |
|
|
|
— |
|
|
|
— |
|
|
|
385 |
|
|
|
— |
|
|
|
— |
|
|
|
386 |
|
|
Purchase of common stock through stock buyback |
|
|
— |
|
|
|
— |
|
|
|
411,849 |
|
|
|
(7,067 |
) |
|
|
— |
|
|
|
— |
|
|
|
— |
|
|
|
(7,067 |
) |
|
Tax withholdings related to net share settlement of RSU’s |
|
|
23,176 |
|
|
|
— |
|
|
|
23,176 |
|
|
|
— |
|
|
|
(2,790 |
) |
|
|
— |
|
|
|
— |
|
|
|
(2,790 |
) |
|
Stock-based compensation expense |
|
|
— |
|
|
|
— |
|
|
|
— |
|
|
|
— |
|
|
|
13,066 |
|
|
|
— |
|
|
|
— |
|
|
|
13,066 |
|
|
Unrealized loss on foreign currency exchange |
|
|
— |
|
|
|
— |
|
|
|
— |
|
|
|
— |
|
|
|
— |
|
|
|
(104 |
) |
|
|
— |
|
|
|
(104 |
) |
|
Net income |
|
|
— |
|
|
|
— |
|
|
|
— |
|
|
|
— |
|
|
|
— |
|
|
|
— |
|
|
|
16,875 |
|
|
|
16,875 |
|
|
Balance, December 31, 2019 |
|
|
54,903,824 |
|
|
$ |
55 |
|
|
|
26,761,305 |
|
|
$ |
(184,972 |
) |
|
$ |
317,675 |
|
|
$ |
(319 |
) |
|
$ |
20,512 |
|
|
$ |
152,951 |
|
|
|
|
|
|
|
|
|
|
|
|
|
|
|
|
|
|
|
|
|
|
|
|
|
|
|
|
|
|
|
|
|
|
|
See accompanying Notes to Consolidated Financial Statements.
57
TechTarget, Inc.
Consolidated Statements of Cash Flows
(in thousands)
|
|
|
For the Years Ended December 31, |
|
|||||||||
|
|
|
2019 |
|
|
2018 |
|
|
2017 |
|
|||
|
Operating Activities: |
|
|
|
|
|
|
|
|
|
|
|
|
|
Net income |
|
$ |
16,875 |
|
|
$ |
12,955 |
|
|
$ |
6,803 |
|
|
Adjustments to reconcile net income to net cash provided by operating activities: |
|
|
|
|
|
|
|
|
|
|
|
|
|
Depreciation and amortization |
|
|
4,999 |
|
|
|
4,548 |
|
|
|
4,636 |
|
|
Provision for bad debt |
|
|
339 |
|
|
|
986 |
|
|
|
806 |
|
|
Amortization of investment premiums |
|
— |
|
|
|
73 |
|
|
|
262 |
|
|
|
Stock-based compensation |
|
|
14,217 |
|
|
|
9,113 |
|
|
|
6,912 |
|
|
Amortization of debt issuance costs |
|
9 |
|
|
298 |
|
|
109 |
|
|||
|
Deferred tax provision |
|
|
(1,097 |
) |
|
|
(137 |
) |
|
|
895 |
|
|
Changes in operating assets and liabilities: |
|
|
|
|
|
|
|
|
|
|
|
|
|
Accounts receivable |
|
|
2,601 |
|
|
|
(1,548 |
) |
|
|
(7,855 |
) |
|
Operating lease assets (ROU) |
|
|
2,736 |
|
|
|
— |
|
|
|
— |
|
|
Prepaid expenses and other current assets |
|
|
1,011 |
|
|
|
(150 |
) |
|
|
(1,105 |
) |
|
Other assets |
|
|
(74 |
) |
|
|
11 |
|
|
|
45 |
|
|
Accounts payable |
|
|
164 |
|
|
|
332 |
|
|
|
(810 |
) |
|
Income taxes payable |
|
|
2,524 |
|
|
|
(398 |
) |
|
|
2,744 |
|
|
Accrued expenses and other current liabilities |
|
|
(792 |
) |
|
|
(212 |
) |
|
|
(157 |
) |
|
Accrued compensation expenses |
|
|
94 |
|
|
|
336 |
|
|
|
670 |
|
|
Operating lease liability (ROU) |
|
|
(2,920 |
) |
|
|
— |
|
|
|
— |
|
|
Contract liabilities |
|
|
(1,237 |
) |
|
|
(2,025 |
) |
|
|
1,519 |
|
|
Other liabilities |
|
|
— |
|
|
|
(305 |
) |
|
|
3,175 |
|
|
Net cash provided by operating activities |
|
|
39,449 |
|
|
|
23,877 |
|
|
|
18,649 |
|
|
|
|
|
|
|
|
|
|
|
|
|
|
|
|
Investing activities: |
|
|
|
|
|
|
|
|
|
|
|
|
|
Purchases of property and equipment, and other capitalized assets |
|
|
(6,335 |
) |
|
|
(5,538 |
) |
|
|
(4,137 |
) |
|
Purchases of investments |
|
|
(5,012 |
) |
|
|
— |
|
|
|
(500 |
) |
|
Proceeds from sales and maturities of investments |
|
|
500 |
|
|
|
7,600 |
|
|
|
10,900 |
|
|
Acquisitions of business net |
|
|
— |
|
|
|
(370 |
) |
|
|
— |
|
|
Net cash (used in) provided by investing activities |
|
|
(10,847 |
) |
|
|
1,692 |
|
|
|
6,263 |
|
|
|
|
|
|
|
|
|
|
|
|
|
|
|
|
Financing activities: |
|
|
|
|
|
|
|
|
|
|
|
|
|
Tax withholdings related to net share settlements |
|
|
(2,790 |
) |
|
|
(3,150 |
) |
|
|
(3,940 |
) |
|
Purchase of treasury shares and related costs |
|
|
(7,067 |
) |
|
|
(7,089 |
) |
|
|
(8,085 |
) |
|
Registration and other fees |
|
|
— |
|
|
|
— |
|
|
|
(3 |
) |
|
Proceeds from exercise of stock options |
|
|
386 |
|
|
|
1,005 |
|
|
|
942 |
|
|
Term loan proceeds |
|
|
— |
|
|
|
25,000 |
|
|
|
— |
|
|
Debt issuance costs |
|
|
— |
|
|
|
(44 |
) |
|
|
(50 |
) |
|
Loan Agreement and Term loan principal payment |
|
|
(1,250 |
) |
|
|
(32,500 |
) |
|
|
(6,250 |
) |
|
Net cash used in financing activities |
|
|
(10,721 |
) |
|
|
(16,778 |
) |
|
|
(17,386 |
) |
|
Effect of exchange rate changes on cash and cash equivalents |
|
|
(67 |
) |
|
|
(84 |
) |
|
|
(45 |
) |
|
Net increase in cash and cash equivalents |
|
|
17,814 |
|
|
|
8,707 |
|
|
|
7,481 |
|
|
Cash and cash equivalents at beginning of period |
|
|
34,673 |
|
|
|
25,966 |
|
|
|
18,485 |
|
|
Cash and cash equivalents at end of period |
|
$ |
52,487 |
|
|
$ |
34,673 |
|
|
$ |
25,966 |
|
|
|
|
|
|
|
|
|
|
|
|
|
|
|
|
Supplemental disclosure of cash flow information: |
|
|
|
|
|
|
|
|
|
|
|
|
|
Cash (received) paid for taxes, net |
|
$ |
3,581 |
|
|
$ |
2,625 |
|
|
$ |
(43 |
) |
|
Property and equipment included in accounts payable and in accrued expenses and other liabilities |
|
$ |
— |
|
|
$ |
— |
|
|
$ |
959 |
|
See accompanying Notes to Consolidated Financial Statements
58
TechTarget, Inc.
Notes to Consolidated Financial Statements
Years Ended December 31, 2019, 2018, and 2017
(In thousands, except share and per share data, where otherwise noted or instances where expressed in millions)
1. Organization and Operations
TechTarget, Inc. and its subsidiaries (the “Company”) is a leading provider of specialized online content for buyers of enterprise information technology (“IT”) products and services, and a leading provider of purchase-intent marketing and sales services for enterprise technology vendors. The Company’s service offerings enable technology vendors to better identify, reach and influence corporate IT decision makers actively researching specific IT purchases. The Company improves vendors’ ability to impact these audiences for business growth using advanced targeting, analytics and data services complemented with customized marketing programs that integrate demand generation and brand advertising techniques. The Company operates a network of over 140 websites, each of which focuses on a specific IT sector such as storage, security or networking. IT and business professionals have become increasingly specialized, and they have come to rely on the Company’s sector-specific websites for purchasing decision support. The Company’s content platform enables IT and business professionals to navigate the complex and rapidly changing IT landscape where purchasing decisions can have significant financial and operational consequences. At critical stages of the purchase decision process, these content offerings through different channels meet IT and business professionals’ needs for expert, peer and IT vendor information and provide a platform on which B2B technology companies can launch targeted marketing campaigns which generate measurable return on investment. Based upon the logical clustering of members’ respective job responsibilities and the marketing focus of the products being promoted by the Company’s customers, the Company categorizes its content offerings to address the key market opportunities and audience extensions across a portfolio of distinct market categories: Security; Networking; Storage; Data Center and Virtualization Technologies; CIO/IT Strategy; Business Applications and Analytics; Application Architecture and Development; and ANCL Channel.
2. Summary of Significant Accounting Policies
The accompanying consolidated financial statements reflect the application of certain significant accounting policies as described below and elsewhere in these Notes to Consolidated Financial Statements.
Principles of Consolidation
The accompanying Consolidated Financial Statements include the accounts of the Company and its wholly-owned subsidiaries, TechTarget Securities Corporation (“TSC”), TechTarget Limited, TechTarget (HK) Limited (“TTGT HK”), TechTarget (Australia) Pty Ltd., TechTarget (Singapore) Pte Ltd., E-Magine Médias SAS (“LeMagIT”) and TechTarget Germany GmbH. TSC is a Massachusetts corporation. TechTarget Limited is a subsidiary doing business principally in the United Kingdom. TTGT HK is a subsidiary incorporated in Hong Kong in order to facilitate the Company’s activities in the Asia-Pacific region. In 2018, TechTarget modified its PRC operations consolidating its activities with other TechTarget locations. TechTarget (Beijing) Information Technology Consulting Co. Ltd. (“TTGT Consulting”) and Keji Wangtuo Information Technology Co., Ltd., (“KWIT”), which were incorporated under the laws of the People’s Republic of China (“PRC”), were closed during 2018. TechTarget (Australia) Pty Ltd. and TechTarget (Singapore) Pte Ltd. are the entities through which the Company does business in Australia and Singapore, respectively; LeMagIT and TechTarget Germany GmbH, both wholly-owned subsidiaries of TechTarget Limited, are entities through which the Company does business in France and Germany, respectively.
Reclassifications
The Company historically presented it revenue broken out into online and events, the events product line was phased out in 2017. Immaterial 2017 events revenue was reclassed for presentation purposes into the current revenue presentation on the Consolidated Statements of Income. This reclassification had no effect on total revenue, operating expenses or net income.
Use of Estimates
The preparation of consolidated financial statements in conformity with GAAP requires management to make estimates and assumptions that affect the reported amounts of assets and liabilities and disclosures of contingent assets and liabilities at the date of the consolidated financial statements and the reported amounts of revenues and expenses during the reporting period. On an ongoing basis, the Company evaluates its estimates, including those related to revenues, long-lived assets, goodwill, the allowance for doubtful accounts, stock-based compensation, earnouts, self-insurance accruals, the allocation of purchase price to intangibles and goodwill, and income taxes. Estimates of the carrying value of certain assets and liabilities are based on historical experience and on various other assumptions that the Company believes to be reasonable. Actual results could differ from those estimates.
59
Revenue Recognition
On January 1, 2018, we adopted Topic 606 using the modified retrospective method applied to those contracts which were not completed as of January 1, 2018. Results for reporting periods beginning after January 1, 2018 are presented under Topic 606, while prior period amounts are not adjusted and continue to be reported in accordance with our historic accounting under Topic 605.
The Company generates revenues from the sale of targeted marketing and advertising campaigns, which it obtains via its network of websites and delivers through its various data analytics solutions. Revenue is recognized when performance obligations are satisfied by transferring promised goods or services to customers, as determined by applying a five-step process consisting of: a) identifying the contract, or contracts, with a customer, b) identifying the performance obligations in the contract, c) determining the transaction price, d) allocating the transaction price to the performance obligations in the contract, and e) recognizing revenue when, or as, performance obligations are satisfied.
Revenue Recognition under Accounting Standards Codification (“ASC”) 605, Revenue Recognition
During 2017, the Company recognized revenue under ASC 605. The Company generates its revenues from the sale of targeted marketing and advertising campaigns, which are delivered via its data analytics solutions. In all cases, revenue is recognized only when the price is fixed or determinable, persuasive evidence of an arrangement exists, the service is performed, and collectability of the resulting receivable is reasonably assured.
Revenue Recognition under ASC 606, Revenue from Contacts with Customers (“ASC 606”)
During 2019 and 2018, the Company recognized revenue under ASC 606. The Company generates its revenues from the sale of targeted marketing and advertising campaigns, which it delivers via its data analytic solutions. Revenue is recognized when performance obligations are satisfied by transferring promised goods or services to customers, as determined by applying a five-step process consisting of: a) identifying the contract, or contracts, with a customer, b) identifying the performance obligations in the contract, c) determining the transaction price, d) allocating the transaction price to the performance obligations in the contract, and e) recognizing revenue when, or as, performance obligations are satisfied.
The Company’s offerings consist of:
IT Deal Alert: IT Deal Alert provides a suite of products that leverages detailed purchase intent data that the Company collect about end-user IT organizations. Through proprietary scoring methodologies, we use this insight to help our customers identify and prioritize accounts. We provide this insight primarily through Priority EngineTM, Qualified Sales OpportunitesTM and Deal DataTM . Revenue from Priority Engine which allows customers access to purchase intent data through the life of the contract is recognized ratably over the contract period. For Priority Engine as well as other duration based solutions, which are discussed below, revenue is recognized ratably over the contract period using the same time-based measure of progress for each of the distinct performance obligations. Determining whether products and services are considered distinct performance obligations that should be accounted for separately versus together may require significant judgment. Revenue from Qualified Sales Opportunities, Deal Data and Research is recognized at the point in time when control is transferred to the customer, which occurs when the related reports are provided to the customer.
Demand Solutions, Brand Solutions, and Custom Content: Demand solutions offerings provide the Company’s customers the opportunity to maximize return on investment by capturing sales leads from the distribution and promotion of content to its audience. Demand solutions may contain the following components: White Papers, Webcasts, Podcasts, Videocasts and Virtual Trade Shows, and Content Sponsorship, which the Company may utilize at its discretion. Brand Solutions provide the Company’s customers to target audiences of IT and business professionals actively researching information related to their products and services. This can be accomplished through on-network or off-network branding as well as through the hosting of Microsites. The Company will at times create white papers, case studies, webcasts, or videos to its customers’ specifications through its Custom Content team (“custom content”).
Revenue from demand and brand solutions is primarily recognized when the transfer of control occurs. Certain of the contracts within demand and brand solutions are duration-based campaigns which, in the event of customer cancellation, provide the Company with an enforceable right to a proportional payment for the portion of the campaign based on services provided. Accordingly, revenue from duration-based campaigns is recognized using a time-based measure of progress, which the Company believes best depicts how it satisfies its performance obligations in these arrangements as control is continuously transferred throughout the contract period. Revenue from custom content creation is recognized over the expected period of performance using a single measure of progress, typically based on hours incurred.
To determine standalone selling price for the individual performance obligations in the arrangement, the Company uses an estimate of the observable selling prices in separate transactions. The Company establishes best estimates considering multiple factors including, but not limited to, class of client, size of transaction, available inventory, pricing strategies and market conditions. The Company uses a range of amounts to estimate stand-alone selling price when it sells the goods and services separately and needs to determine whether a discount is to be allocated based upon the relative stand-alone selling price to the various goods and services. Judgment is required to determine the standalone selling price for each distinct performance obligation.
60
Fair Value of Financial Instruments
Financial instruments consist of cash and cash equivalents, short-term and long-term investments, accounts receivable, accounts payable, long-term debt and contingent consideration. Due to their short-term nature and liquidity, the carrying value of these instruments, with the exception of contingent consideration and long-term debt, approximates their estimated fair values. See Note 4 for further information on the fair value of the Company’s investments. The Company classifies all of its short-term and long-term investments as available-for-sale. Amounts outstanding under the Company’s long-term debt are subject to variable rates of interest based on current market rates, and as such, the Company believes the carrying amount of these obligations approximates fair value. The fair value of contingent consideration was estimated using a discounted cash flow method.
Long-Lived Assets, Goodwill and Indefinite-lived Intangible Assets
Long-lived assets consist primarily of property and equipment, capitalized software, goodwill and other intangible assets. The Company reviews long-lived assets, including property and equipment and finite intangible assets, for impairment whenever events or changes in circumstances indicate that the carrying amount of an asset may not be recoverable. Conditions that would trigger an impairment assessment include, but are not limited to, a significant adverse change in legal factors or business climate that could affect the value of an asset or an adverse action or a significant decrease in the market price. A specifically identified intangible asset must be recorded as a separate asset from goodwill if either of the following two criteria is met: (1) the intangible asset acquired arises from contractual or other legal rights; or (2) the intangible asset is separable. Accordingly, intangible assets consist of specifically identified intangible assets. Goodwill is the excess of any purchase price over the estimated fair value of net tangible and intangible assets acquired.
Goodwill and indefinite-lived intangible assets are not amortized but are reviewed annually for impairment or more frequently if impairment indicators arise. Separable intangible assets that are not deemed to have an indefinite life are amortized over their estimated useful lives, which range from eighteen months to seventeen years, using methods of amortization that are expected to reflect the estimated pattern of economic use, and are reviewed for impairment when events or changes in circumstances suggest that the assets may not be recoverable. Consistent with the Company’s determination that it has a single reporting segment, it has been determined that there is a single reporting unit and goodwill is therefore tested for impairment at the entity level. The Company performs its annual test of impairment of goodwill as of December 31st of each year and whenever events or changes in circumstances suggest that the carrying amount may not be recoverable using the two-step process required by ASC 350, Intangibles – Goodwill and Other (“ASC 350”). The first step of the impairment test is to identify potential impairment by comparing the reporting unit’s fair value with its net book value (or carrying amount), including goodwill. The fair value is estimated based on a market value approach. If the fair value of the reporting unit exceeds its carrying amount, the reporting unit’s goodwill is not considered to be impaired and the second step of the impairment test is not performed. Whenever indicators of impairment become present, the Company would perform the second step and compare the implied fair value of the reporting unit’s goodwill, as defined by ASC 350, to it carrying value to determine the amount of the impairment loss, if any. As of December 31, 2019, there were no indications of impairment based on the step one analysis, and the Company’s estimated fair value exceeded its goodwill carrying value by a significant margin.
Based on the aforementioned evaluation, the Company believes that, as of the balance sheet date presented, none of the Company’s goodwill or other long-lived assets were impaired. The Company did not have any intangible assets with indefinite lives as of December 31, 2019 or 2018.
Allowance for Doubtful Accounts
The Company reduces gross trade accounts receivable for an allowance for doubtful accounts. The allowance for doubtful accounts is the Company’s best estimate of the amount of probable credit losses in its existing accounts receivable. The allowance for doubtful accounts is reviewed on a regular basis, and all past due balances are reviewed individually for collectability. Account balances are charged against the allowance after all means of collection have been exhausted and the potential for recovery is considered remote. Provisions for doubtful accounts are recorded in general and administrative expense.
Below is a summary of the changes in the Company’s allowance for doubtful accounts for the years ended December 31, 2019, 2018, and 2017.
|
|
|
Balance at Beginning of Year |
|
|
Provision |
|
|
Acquired in Business Combinations |
|
|
Write-offs, Net of Recoveries |
|
|
Balance at End of Year |
|
|||||
|
Year ended December 31, 2017 |
|
$ |
1,961 |
|
|
$ |
806 |
|
|
|
— |
|
|
$ |
(984 |
) |
|
$ |
1,783 |
|
|
Year ended December 31, 2018 |
|
$ |
1,783 |
|
|
$ |
986 |
|
|
|
— |
|
|
$ |
(670 |
) |
|
$ |
2,099 |
|
|
Year ended December 31, 2019 |
|
$ |
2,099 |
|
|
$ |
339 |
|
|
|
— |
|
|
$ |
(539 |
) |
|
$ |
1,899 |
|
61
Property and Equipment and Other Capitalized Assets
Property and equipment and other capitalized assets are stated at cost. Property and equipment acquired through acquisitions of businesses are initially recorded at fair value. Depreciation is calculated on the straight-line method based on the month the asset is placed in service over the following estimated useful lives:
|
|
|
Estimated Useful Life |
|
Furniture and fixtures |
|
5 - 10 years |
|
Computer equipment and software |
|
3 years |
|
Internal-use software and website development costs |
|
3 - 5 years |
|
Leasehold improvements |
|
Shorter of useful life or remaining duration of lease |
Property and equipment and other capitalized assets consist of the following:
|
|
|
As of December 31, |
|
|||||
|
|
|
2019 |
|
|
2018 |
|
||
|
Furniture and fixtures |
|
$ |
1,267 |
|
|
$ |
1,266 |
|
|
Computer equipment and software |
|
|
4,461 |
|
|
|
4,201 |
|
|
Leasehold improvements |
|
|
3,779 |
|
|
|
3,844 |
|
|
Internal-use software and website development costs |
|
|
28,546 |
|
|
|
29,692 |
|
|
|
|
|
38,053 |
|
|
|
39,003 |
|
|
Less: accumulated depreciation and amortization |
|
|
(25,682 |
) |
|
|
(28,102 |
) |
|
|
|
$ |
12,371 |
|
|
$ |
10,901 |
|
Depreciation expense was $4.9 million, $4.4 million, and $4.5 million for the years ended December 31, 2019, 2018, and 2017, respectively. Repairs and maintenance charges that do not increase the useful life of the assets are charged to operations as incurred. The Company wrote off approximately $7.3 million, $1.5 million, and $0.6 million of fully depreciated assets that were no longer in service during 2019, 2018, and 2017, respectively. Depreciation expense is classified as a component of operating expense in the Company’s results of operations with the exception of certain depreciation expense which is classified as a component of cost of goods sold.
Internal-Use Software and Website Development Costs
The Company capitalizes costs incurred during the development of its website applications and infrastructure as well as certain costs relating to internal-use software. The Company begins to capitalize costs to develop software and website applications when planning stage efforts are successfully completed, management has authorized and committed project funding, and it is probable that the project will be completed, and the software will be used as intended. Judgment is required in determining the point at which various projects enter the state at which costs may be capitalized, in assessing the ongoing value of the capitalized costs and in determining the estimated useful lives over which the costs are amortized, which is generally four years. To the extent that the Company changes the manner in which it develops and tests new features and functionalities related to its websites, assesses the ongoing value of capitalized assets, or determines the estimated useful lives over which the costs are amortized, the amount of website development costs it capitalizes and amortizes in future periods would be impacted. The estimated useful life of costs capitalized is evaluated for each specific project. Capitalized internal-use software and website development costs are reviewed for recoverability whenever events or changes in circumstances indicate that the carrying amount of the asset may not be recoverable. An impairment loss would be recognized only if the carrying amount of the asset is not recoverable and exceeds its fair value. The Company capitalized internal-use software and website development costs of $5.1 million, $3.0 million, and $2.9 million for the years ended December 31, 2019, 2018, and 2017, respectively.
Concentrations of Credit Risk and Off-Balance Sheet Risk
Financial instruments that potentially expose the Company to concentrations of credit risk consist mainly of cash and cash equivalents, investments and accounts receivable. The Company maintains its cash and cash equivalents and investments principally in accredited financial institutions of high credit standing. The Company routinely assesses the credit worthiness of its customers. The Company generally has not experienced any significant losses related to individual customers or groups of customers in any particular industry or area. The Company does not require collateral. Due to these factors, no additional credit risk beyond amounts provided for collection losses is believed by management to be probable in the Company’s accounts receivable.
At December 31, 2019 and 2018, no customer represented 10% of total accounts receivable. No single customer accounted for 10% or more of total revenues in the years ended December 31, 2019, 2018, or 2017.
62
Income Taxes
The Company’s deferred tax assets and liabilities are recognized based on temporary differences between the financial reporting and income tax bases of assets and liabilities using statutory rates. A valuation allowance is established against net deferred tax assets if, based upon the weight of available evidence, it is more likely than not that some or all of the deferred tax assets will not be realized. The Company records a liability for unrecognized tax benefits resulting from uncertain tax positions taken or expected to be taken in a tax return using a “more likely than not” threshold as required by the provisions of ASC 740-10, Accounting for Uncertainty in Income Taxes (“ASC 740”).
The Company recognizes interest and penalties related to unrecognized tax benefits, if any, in income tax expense.
Stock-Based Compensation
The Company has stock-based employee compensation plans which are more fully described in Note 11. Stock-based compensation cost is measured at the grant date based on the fair value of the award and is recognized in the Consolidated Statement of Income and Comprehensive Income using the straight-line method over the vesting period of the award. The Company uses the Black-Scholes option-pricing model to determine the fair value of stock option awards.
Comprehensive Income
Comprehensive income includes all changes in equity during a period, except those resulting from investments by stockholders and distributions to stockholders. The Company's comprehensive income includes changes in the fair value of the Company’s unrealized gains on available for sale securities and foreign currency translation adjustments.
There were no reclassifications out of accumulated other comprehensive income in the periods ended December 31, 2019, 2018, or 2017.
Foreign Currency
The functional currency for each of the Company’s subsidiaries is the local currency of the country in which it is incorporated. All assets and liabilities are translated into U.S. dollar equivalents at the exchange rate in effect on the balance sheet date or at a historical rate. Revenues and expenses are translated at average exchange rates. Translation gains or losses are recorded in stockholders’ equity as an element of accumulated other comprehensive income (loss).
Net Income Per Share
Basic earnings per share is computed based on the weighted average number of common shares and vested restricted stock units outstanding during the period. Because the holders of unvested restricted stock units do not have non-forfeitable rights to dividends or dividend equivalents, the Company does not consider these restricted stock units to be participating securities that should be included in its computation of earnings per share under the two-class method. Diluted earnings per share is computed using the weighted average number of common shares and vested, undelivered restricted stock units outstanding during the period, plus the dilutive effect of potential future issuances of common stock relating to stock option and restricted stock unit programs using the treasury stock method. In calculating diluted earnings per share, the dilutive effect of stock options and restricted stock units is computed using the average market price for the respective period. In addition, the assumed proceeds under the treasury stock method include the average unrecognized compensation expense of stock options and restricted stock units that are in-the-money. This results in the “assumed” buyback of additional shares, thereby reducing the dilutive impact of stock options and restricted stock units.
63
A reconciliation of the numerator and denominator used in the calculation of basic and diluted net income per share is as follows:
|
|
|
For the Years Ended December 31, |
|
|||||||||
|
|
|
2019 |
|
|
2018 |
|
|
2017 |
|
|||
|
Numerator: |
|
|
|
|
|
|
|
|
|
|
|
|
|
Net income |
|
$ |
16,875 |
|
|
$ |
12,955 |
|
|
$ |
6,803 |
|
|
Denominator: |
|
|
|
|
|
|
|
|
|
|
|
|
|
Basic: |
|
|
|
|
|
|
|
|
|
|
|
|
|
Weighted average shares of common stock and vested, undelivered restricted stock units outstanding |
|
|
27,873,745 |
|
|
|
27,738,178 |
|
|
|
27,550,044 |
|
|
Diluted: |
|
|
|
|
|
|
|
|
|
|
|
|
|
Weighted average shares of common stock and vested, undelivered restricted stock units outstanding |
|
|
27,873,745 |
|
|
|
27,678,959 |
|
|
|
27,550,044 |
|
|
Effect of potentially dilutive shares |
|
|
437,942 |
|
|
|
973,855 |
|
|
|
721,340 |
|
|
Total weighted average shares of common stock and vested, undelivered restricted stock units outstanding and potentially dilutive shares |
|
|
28,311,687 |
|
|
|
28,652,814 |
|
|
|
28,271,384 |
|
|
Calculation of Net Income Per Common Share: |
|
|
|
|
|
|
|
|
|
|
|
|
|
Basic: |
|
|
|
|
|
|
|
|
|
|
|
|
|
Net income applicable to common stockholders |
|
$ |
16,875 |
|
|
$ |
12,955 |
|
|
$ |
6,803 |
|
|
Weighted average shares of stock outstanding |
|
|
27,873,745 |
|
|
|
27,738,178 |
|
|
|
27,550,044 |
|
|
Net income per common share |
|
$ |
0.61 |
|
|
$ |
0.47 |
|
|
$ |
0.25 |
|
|
Diluted: |
|
|
|
|
|
|
|
|
|
|
|
|
|
Net income applicable to common stockholders |
|
$ |
16,875 |
|
|
$ |
12,955 |
|
|
$ |
6,803 |
|
|
Weighted average shares of stock outstanding |
|
|
28,311,687 |
|
|
|
28,652,814 |
|
|
|
28,271,384 |
|
|
Net income per common share(1) |
|
$ |
0.60 |
|
|
$ |
0.45 |
|
|
$ |
0.24 |
|
|
(1) |
In calculating diluted earnings per share, 0.3 million, 0.5 million, and 0.7 million shares related to outstanding stock options and unvested, undelivered restricted stock units were excluded for the years ended December 31, 2019, 2018, and 2017, respectively, because they were anti-dilutive. |
Recent Accounting Pronouncements
Recently Adopted Accounting Guidance
In February 2016, the FASB issued ASU No. 2016-02, Leases (Topic 842) (“ASU 2016-02”). ASU 2016-02 establishes a right-of-use (“ROU”) model that requires a lessee to record a ROU asset and a lease liability on the balance sheet for all leases with terms longer than twelve months. Leases will be classified as either finance or operating, with classification affecting the pattern of expense recognition in the Consolidated Statements of Income and Comprehensive Income. ASU 2016-02 is effective for fiscal years beginning after December 15, 2018, including interim periods within those fiscal years. A modified retrospective transition approach is required for lessees, capital and operating leases, existing at, or entered into after, the beginning of the earliest comparative period presented in the financial statements, with certain practical expedients available. The Company adopted ASU 2016-02 in the first quarter of 2019 using the modified retrospective approach, and elected the package of practical expedients permitted under the transition guidance. Results and disclosure requirements for reporting periods beginning after January 1, 2019 are presented under Topic 842, while prior period amounts have not been adjusted and continue to be reported in accordance with our historical accounting under Topic 840.
We elected the package of practical expedients permitted under the transition guidance, which allowed us to carryforward our historical lease classification, our assessment on whether a contract was or contains a lease, and our initial direct costs for any leases that existed prior to January 1, 2019. We also elected to combine our lease and non-lease components and to keep leases with an initial term of 12 months or less off the balance sheet and recognize the associated lease payments in the consolidated statements of income on a straight-line basis over the lease term. The Company recorded operating lease assets with right-of-use of $27.5 million and $2.9 million current operating lease liability and $29.2 million non-current operating lease liability as of January 1, 2019, of which $4.9 million and $0.3 million were reclassified from deferred rent and prepaid rent, respectively (see Note 10).
64
In May 2014, the FASB issued ASU No. 2014-09, Revenue from Contracts with Customers (Topic 606) (“ASU 2014-09”), which supersedes the revenue recognition requirements in ASC 605, Revenue Recognition. ASU 2014-09 is based on the principle that revenue is recognized to depict the transfer of goods or services to customers in an amount that reflects the consideration to which the entity expects to be entitled in exchange for those goods or services. ASU 2014-09 also requires additional disclosure about the nature, amount, timing and uncertainty of revenue and cash flows arising from customer contracts, including significant judgments and changes in judgments and assets recognized from costs incurred to obtain or fulfill a contract.
The standard may be applied retrospectively to each prior period presented, or using the modified retrospective approach, with the cumulative effect recognized as of the date of initial application. The Company adopted the standard effective January 1, 2018, using the modified retrospective approach (see Note 3).
Accounting Guidance Not Yet Adopted
In January 2017, the FASB issued ASU No. 2017-04, Intangibles-Goodwill and Other (Topic 350), Simplifying the Test for Goodwill Impairment ("ASU 2017-04"). ASU 2017-04 eliminates the requirement to calculate the implied fair value of goodwill to measure a goodwill impairment charge (step 2 of the goodwill impairment test) and instead requires only a one-step quantitative impairment test, performed by comparing the fair value of goodwill with its carrying amount. ASU 2017-04 is effective on a prospective basis effective for goodwill impairment tests in fiscal years beginning after December 15, 2019. Early adoption is permitted for goodwill impairment tests performed on testing dates after January 1, 2017. We will adopt the new standard effective January 1, 2020 and do not expect the adoption of this guidance to have a material impact on our consolidated financial statements.
In August 2018, the FASB issued ASU No. 2018-15, Intangibles-Goodwill and Other-Internal-Use Software (Subtopic 350-40): Customer’s Accounting for Implementation Costs Incurred in a Cloud Computing Arrangement that is a Service Contract, which requires implementation costs incurred by customers in cloud computing arrangements (i.e., hosting arrangements) to be capitalized under the same premises of authoritative guidance for internal-use software, and deferred over the non-cancellable term of the cloud computing arrangements plus any optional renewal periods that are reasonably certain to be exercised by the customer or for which the exercise is controlled by the service provider. ASU 2018-15 is effective for fiscal years beginning after December 15, 2019, and interim periods within those fiscal years, with early adoption permitted. We will adopt the new standard effective January 1, 2020 and do not expect the adoption of this guidance to have a material impact on our consolidated financial statements.
In June 2016, the FASB issued ASU 2016-03, “Measurement of Credit Losses on Financial Instruments,” (ASU 2016-03) which amends ASC 326 “Financial Instruments—Credit Losses” which introduces a new methodology for accounting for credit losses on financial instruments. The guidance establishes a new forward looking "expected loss model" that requires entities to estimate current expected credit losses on accounts receivable and financial instruments by using all practical and relevant information. We will adopt the new standard effective January 1, 2020 and do not expect the adoption of this guidance to have a material impact on our consolidated financial statements.
In August 2018, the FASB issued Accounting Standard Update No. 2018-13, “Changes to Disclosure Requirements for Fair Value Measurements” (Topic 820) (ASU 2018-13), which improved the effectiveness of disclosure requirements for recurring and nonrecurring fair value measurements. The standard removes, modifies, and adds certain disclosure requirements. We will adopt the new standard effective January 1, 2020 and do not expect the adoption of this guidance to have a material impact on our consolidated financial statements.
In December 2019, the FASB issued Accounting Standard Update No. 2019-12, Income Taxes (Topic 740): “Simplifying the Accounting for Income Taxes” (ASU 2019-12), which simplifies the accounting for income taxes. This guidance will be effective for us in the first quarter of 2021 on a prospective basis, and early adoption is permitted. We are currently evaluating the impact of the new guidance on our consolidated financial statements.
Disaggregation of Revenue
The following table depicts the disaggregation of revenue according to categories consistent with how the Company evaluates its financial performance and economic risk. International revenue consists of international geo-targeted campaigns, which are campaigns targeted at an audience of members outside of North America.
|
|
|
Years Ended December 31, |
|
|||||||||
|
|
|
2019 |
|
|
2018 |
|
|
2017 |
|
|||
|
North America |
|
$ |
89,582 |
|
|
$ |
82,660 |
|
|
$ |
73,349 |
|
|
International |
|
|
44,375 |
|
|
|
38,673 |
|
|
|
35,207 |
|
|
Total Revenue |
|
$ |
133,957 |
|
|
$ |
121,333 |
|
|
$ |
108,556 |
|
65
Contract liabilities
Timing may differ between the satisfaction of performance obligations and the invoicing and collection of amounts related to the Company’s contracts with customers. Liabilities are recorded for amounts that are collected in advance of the satisfaction of performance obligations. Contract liabilities on the accompanying Consolidated Balance Sheets were $4.3 million and $5.6 million at December 31, 2019 and December 31, 2018, respectively. The Company’s adoption of ASC 606 reduced the Company’s accounts receivable and deferred revenue by $3.5 million as of January 1, 2018. Additionally, certain customers may receive credits, which are accounted for as a material right. The Company estimates these amounts based on the expected amount of future services to be provided to customers and allocates a portion of the transaction price to these material rights. The Company recognizes these material rights as the material rights are exercised. The resulting amounts included in contract liabilities on the accompanying Consolidated Balance Sheets were $2.4 million and $3.5 million at December 31, 2019 and December 31, 2018, respectively.
|
|
|
Accounts Receivable |
|
|
|
Year-to-Date Activity |
|
(in thousands) |
|
|
|
Balance Accounts Receivable December 31,2017 prior to adoption of ASC 606 |
|
$ |
29,601 |
|
|
Adjustment to accounts receivable as a result of adoption of ASC 606 |
|
|
3,510 |
|
|
Balance at January 1, 2018 |
|
$ |
26,091 |
|
|
|
|
|
|
|
|
|
|
Contract Liabilities |
|
|
|
Year-to-Date Activity |
|
(in thousands) |
|
|
|
Balance Deferred Revenue December 31,2017 prior to adoption of ASC 606 |
|
$ |
7,598 |
|
|
Adjustment to deferred revenue as a result of adoption of ASC 606 |
|
|
3,510 |
|
|
Balance at January 1, 2018 |
|
|
4,088 |
|
|
Deferral of revenue |
|
|
5,573 |
|
|
Recognition of previously unearned revenue |
|
|
(4,088 |
) |
|
Balance at December 31, 2018 |
|
$ |
5,573 |
|
|
Deferral of revenue |
|
|
7,666 |
|
|
Recognition of previously unearned revenue |
|
|
(8,904 |
) |
|
Balance at December 31,2019 |
|
$ |
4,335 |
|
The Company elected to apply the following practical expedients:
|
|
• |
Existence of a Significant Financing Component in a Contract. As a practical expedient, the Company has not assessed whether a contract has a significant financing component because the Company expects at contract inception that the period between payment by the customer and the transfer of promised goods or services by the Company to the customer will be one year or less. Payment terms and conditions vary by contract type, although terms generally include requirement of payment within 30 to 90 days. In addition, the Company has determined that the payment terms that the Company provides to its customers are structured primarily for reasons other than the provision of financing to the customer. |
|
|
• |
Costs to Obtain a Contract. The Company’s revenues are primarily generated from customer contracts that are for one year or less. Costs primarily consist of incentive compensation paid based on the achievements of sales targets in a given period for related revenue streams and are recognized in the month when the revenue is earned. As a practical expedient, for amortization periods which are determined to be one year or less, the Company expenses any incremental costs of obtaining the contract with a customer when incurred. For those customer contracts greater than one year, the Company capitalizes and amortizes the expenses over the period of benefit. |
|
|
• |
Revenues Invoiced. The Company has applied the practical expedient for certain revenue streams to exclude the value of remaining performance obligations for (i) contracts with an original expected term of one year or less or (ii) contracts for which the Company recognizes revenue in proportion to the amount it has the right to invoice for services performed. |
4. Fair Value Measurements
The Company measures certain financial assets and liabilities at fair value on a recurring basis, including cash equivalents, short-term and long-term investments and contingent consideration. The fair value of these financial assets and liabilities was determined based on three levels of input as follows:
|
|
• |
Level 1. Quoted prices in active markets for identical assets and liabilities; |
66
|
|
• |
Level 2. Observable inputs other than quoted prices in active markets; and |
|
|
• |
Level 3. Unobservable inputs. |
The fair value hierarchy of the Company’s financial assets and liabilities carried at fair value and measured on a recurring basis is as follows:
|
|
|
|
|
|
|
Fair Value Measurements at Reporting Date Using |
|
|||||||||
|
|
|
December 31, 2019 |
|
|
Quoted Prices in Active Markets for Identical Assets (Level 1) |
|
|
Significant Other Observable Inputs (Level 2) |
|
|
Significant Unobservable Inputs (Level 3) |
|
||||
|
Assets: |
|
|
|
|
|
|
|
|
|
|
|
|
|
|
|
|
|
Short-term investments(2) |
|
$ |
5,012 |
|
|
$ |
— |
|
|
$ |
5,012 |
|
|
$ |
— |
|
|
Total assets |
|
$ |
5,012 |
|
|
$ |
— |
|
|
$ |
5,012 |
|
|
$ |
— |
|
|
|
|
|
|
|
|
Fair Value Measurements at Reporting Date Using |
|
|||||||||
|
|
|
December 31, 2018 |
|
|
Quoted Prices in Active Markets for Identical Assets (Level 1) |
|
|
Significant Other Observable Inputs (Level 2) |
|
|
Significant Unobservable Inputs (Level 3) |
|
||||
|
Assets: |
|
|
|
|
|
|
|
|
|
|
|
|
|
|
|
|
|
Money market funds(1) |
|
$ |
15,070 |
|
|
$ |
15,070 |
|
|
$ |
— |
|
|
$ |
— |
|
|
Short-term investments(2) |
|
|
500 |
|
|
|
— |
|
|
|
500 |
|
|
|
— |
|
|
Total assets |
|
$ |
15,570 |
|
|
$ |
15,070 |
|
|
$ |
500 |
|
|
$ |
— |
|
|
(1) |
Included in cash and cash equivalents on the accompanying consolidated balance sheets; valued at quoted market prices in active markets. |
|
(2) |
Short-term investments consist of municipal bonds, corporate bonds, bond funds, U.S. Treasury securities, and government agency bonds; their fair value is calculated using an interest rate yield curve for similar instruments. |
5. Acquisition
Oceanos Marketing, Inc.
The Company made a small, non-material acquisition on August 1, 2018 acquiring substantially all of the operating assets of Oceanos Marketing, Inc. which is a Massachusetts-based contact data management company for $0.6 million.
6. Cash, Cash Equivalents and Investments
Cash and cash equivalents consist of highly liquid investments with maturities of three months or less at date of purchase. Cash equivalents are carried at cost, which approximates their fair market value. Cash and cash equivalents consisted of the following:
|
|
|
As of December 31, |
|
|||||
|
|
|
2019 |
|
|
2018 |
|
||
|
Cash |
|
$ |
52,487 |
|
|
$ |
19,603 |
|
|
Money market funds |
|
|
— |
|
|
|
15,070 |
|
|
Total cash and cash equivalents |
|
$ |
52,487 |
|
|
$ |
34,673 |
|
The Company’s short-term investments are accounted for as available for sale securities. These investments are recorded at fair value with the related unrealized gains and losses included in accumulated other comprehensive loss, a component of stockholders’ equity, net of tax. The cumulative unrealized loss, net of taxes, was zero, $15 and $17 as of December 31, 2019, 2018, and 2017, respectively. Realized gains and losses on the sale of these investments are determined using the specific identification method. There were no realized gains or losses in 2019, 2018, or 2017.
67
Short-term and long-term investments consisted of the following:
|
|
|
December 31, 2019 |
|
|||||||||||||
|
|
|
Amortized Cost |
|
|
Gross Unrealized Gains |
|
|
Gross Unrealized Losses |
|
|
Estimated Fair Value |
|
||||
|
Short-term investments: |
|
|
|
|
|
|
|
|
|
|
|
|
|
|
|
|
|
Bond funds |
|
$ |
5,012 |
|
|
$ |
— |
|
|
$ |
— |
|
|
$ |
5,012 |
|
|
Total short-term investments |
|
$ |
5,012 |
|
|
$ |
— |
|
|
$ |
— |
|
|
$ |
5,012 |
|
|
|
|
December 31, 2018 |
|
|||||||||||||
|
|
|
Amortized Cost |
|
|
Gross Unrealized Gains |
|
|
Gross Unrealized Losses |
|
|
Estimated Fair Value |
|
||||
|
Short-term investments: |
|
|
|
|
|
|
|
|
|
|
|
|
|
|
|
|
|
U.S. Treasury securities |
|
$ |
500 |
|
|
$ |
— |
|
|
$ |
— |
|
|
$ |
500 |
|
|
Total short-term investments |
|
$ |
500 |
|
|
$ |
— |
|
|
$ |
— |
|
|
$ |
500 |
|
The Company had no securities in an unrealized loss position at December 31, 2019 and December 31, 2018.
At December 31, 2018 the US treasury security had a maturity date of January 2019. All income generated from these investments is recorded as interest income.
7. Goodwill
The changes in the carrying amount of goodwill are as follows:
|
|
|
As of December 31, |
|
|||||
|
|
|
2019 |
|
|
2018 |
|
||
|
Balance as of beginning of year |
|
$ |
93,687 |
|
|
$ |
93,793 |
|
|
Effect of exchange rate changes |
|
|
(48 |
) |
|
|
(202 |
) |
|
Additions |
|
|
— |
|
|
|
96 |
|
|
Balance as of end of year |
|
$ |
93,639 |
|
|
$ |
93,687 |
|
8. Intangible Assets
The following table summarizes the Company’s intangible assets, net:
|
|
|
|
|
|
|
As of December 31, 2019 |
|
|||||||||
|
|
|
Estimated Useful Lives (Years) |
|
|
Gross Carrying Amount |
|
|
Accumulated Amortization |
|
|
Net |
|
||||
|
Customer, affiliate and advertiser relationships |
|
5-17 |
|
|
$ |
6,520 |
|
|
$ |
(6,290 |
) |
|
$ |
230 |
|
|
|
Developed websites, technology and patents |
|
|
10 |
|
|
|
1,476 |
|
|
|
(1,026 |
) |
|
|
450 |
|
|
Trademark, trade name and domain name |
|
5-8 |
|
|
|
1,792 |
|
|
|
(1,763 |
) |
|
|
29 |
|
|
|
Proprietary user information database and internet traffic |
|
|
5 |
|
|
|
1,122 |
|
|
|
(1,122 |
) |
|
|
— |
|
|
Non-Compete agreement |
|
|
1.5 |
|
|
|
10 |
|
|
|
(9 |
) |
|
|
1 |
|
|
Total intangible assets |
|
|
|
|
|
$ |
10,920 |
|
|
$ |
(10,210 |
) |
|
$ |
710 |
|
68
|
|
|
|
|
|
|
As of December 31, 2018 |
|
|||||||||
|
|
|
Estimated Useful Lives (Years) |
|
|
Gross Carrying Amount |
|
|
Accumulated Amortization |
|
|
Net |
|
||||
|
Customer, affiliate and advertiser relationships |
|
5-17 |
|
|
$ |
6,500 |
|
|
$ |
(6,256 |
) |
|
$ |
244 |
|
|
|
Developed websites, technology and patents |
|
|
10 |
|
|
|
1,502 |
|
|
|
(958 |
) |
|
|
544 |
|
|
Trademark, trade name and domain name |
|
5-8 |
|
|
|
1,784 |
|
|
|
(1,730 |
) |
|
|
54 |
|
|
|
Proprietary user information database and internet traffic |
|
|
5 |
|
|
|
1,110 |
|
|
|
(1,110 |
) |
|
|
— |
|
|
Non-Compete agreement |
|
|
1.5 |
|
|
|
10 |
|
|
|
(3 |
) |
|
|
7 |
|
|
Total intangible assets |
|
|
|
|
|
$ |
10,906 |
|
|
$ |
(10,057 |
) |
|
$ |
849 |
|
Intangible assets are amortized over their estimated useful lives, which range from eighteen months to seventeen years, using methods of amortization that are expected to reflect the estimated pattern of economic use. The remaining amortization expense will be recognized over a weighted average period of approximately 4.97 years. Amortization expense was $0.1 million, $0.1 million and $0.2 million for the years ended December 31, 2019, 2018, and 2017, respectively. Amortization expense is recorded within operating expenses as the intangible assets consist of customer-related assets and website traffic that the Company considers to be in support of selling and marketing activities. The Company did not write off any intangible assets in 2019. The Company wrote off $0.7 million fully amortized intangible assets in 2018. The Company did not write off any amortized intangible assets in 2017.
The Company expects amortization expense of intangible assets to be as follows:
|
Years Ending December 31: |
|
Amortization Expense |
|
|
|
2020 |
|
$ |
112 |
|
|
2021 |
|
|
127 |
|
|
2022 |
|
|
156 |
|
|
2023 |
|
|
37 |
|
|
Thereafter |
|
|
278 |
|
|
|
|
$ |
710 |
|
9. Loan Agreement and Prior Term Loan Agreement
On May 9, 2016, the Company entered into a Senior Secured Credit Facilities Credit Agreement for a term loan (the “Term Loan Agreement”). Under the Term Loan Agreement, the Company borrowed and received $50.0 million in aggregate principal amount pursuant to a five-year term loan (the “Term Loan”).
At the Company’s option, the Term Loan Agreement bore interest at either an annual rate of 1.50% plus the higher of (a) the Prime Rate in effect on such day and (b) the Federal Funds Effective Rate in effect on such day plus 0.50%, or the London Interbank Offered Rate (“LIBOR”) plus 2.50%.
On December 24, 2018, the Company entered into a Loan and Security Agreement (the “Loan Agreement”) with Western Alliance Bank as the lender. The Loan Agreement provides for a $25 million term loan facility with a maturity date of December 10, 2023 and replaced the Term Loan.
The borrowings under the Loan Agreement are secured by a lien on substantially all of the assets of the Company, including a pledge of the stock of certain of its wholly-owned subsidiaries (limited, in the case of the stock of certain foreign subsidiaries of the Company, to no more than 65% of the capital stock of such subsidiaries). Borrowings under the Loan Agreement must be repaid quarterly, with applicable interest paid monthly, in the following manner: 1.25% of the initial aggregate borrowings are due and payable each quarter for the first two loan years, 1.88% of the initial aggregate borrowings are due and payable each quarter for the third loan year, and 2.50% of the initial aggregate borrowings are due and payable each quarter for the fourth and fifth loan years. At maturity, all outstanding amounts, including unpaid principal and accrued and unpaid interest, under the Loan Agreement will be due and payable.
The borrowings are subject to a leverage ratio, measured quarterly. The Loan Agreement also requires the Company to make representations and warranties and to comply with certain other covenants and agreements that are customary in loan agreements of this type.
69
Borrowings under the Loan Agreement bear interest, on the outstanding daily balance thereof, at a floating per annum rate equal to one and three-eighths percent (1.375%) above the greater of (a) the one (1) month U.S. LIBOR rate reported in The Wall Street Journal as of such date or (b) two percent (2.00%).
The Loan Agreement required the Company to pay a one-time non-refundable facility fee of $25,000 on the closing date.
The borrowings under the Loan Agreement may be prepaid by the Company at its option without penalty, provided the Company complies with the notice provision of the document. The Loan Agreement also contains customary events of default, subject to grace periods in certain cases, which may cause repayment of the Term Loan to be accelerated.
Interest expense under the Loan Agreement was $0.9 million in 2019 and under the Term Loan Agreement was $1.4 million in 2018, which includes non-cash interest expense of $9 thousand and $0.3 million in 2019 and 2018, respectively, related to the amortization of deferred issuance costs. During 2019, the Company made principal payments totaling $1.3 million on the Loan Agreement. The Term Loan Agreement was paid in full during 2018. Interest cash payments were $0.9 million, $1.2 million and $1.4 million in 2019, 2018 and 2017, respectively.
Expected future installment payments on the principal by year and amounts included in the Company’s Consolidated Balance Sheet as of December 31, 2019 related to the Loan Agreement are as follows:
|
Years Ending December 31: |
|
|
|
|
|
2020 |
|
$ |
1,250 |
|
|
2021 |
|
|
1,875 |
|
|
2022 |
|
|
2,500 |
|
|
2023 |
|
|
18,125 |
|
|
Total principal on loan agreement |
|
|
23,750 |
|
|
Unamortized debt issuance costs |
|
|
(36 |
) |
|
Carrying amount of loan agreement |
|
|
23,714 |
|
|
Less: current portion of loan agreement, net of $9 in unamortized debt issuance costs |
|
|
(1,241 |
) |
|
Long-term portion of loan agreement, net of $27 in unamortized debt issuance costs |
|
$ |
22,473 |
|
At December 31, 2019, the Company was in compliance with all covenants under the Loan Agreement.
Leases
On January 1, 2019, the Company adopted Topic 842 using the modified retrospective approach. The Company recorded operating lease assets (right -of-use assets) of $27.5 million and operating lease liabilities of $32.1 million. There was no impact to retained earnings upon adoption of Topic 842.
The Company conducts its operations in leased office facilities under various noncancelable operating lease agreements that expire through December 2029.
On October 26, 2017, the Company and Hines Global REIT Riverside Center, LLC (“Hines”) entered into a Third Amendment (the “Third Amendment”) to the lease agreement for office space in Newton, Massachusetts, dated as of August 4, 2009, by and between the Company and MA-Riverside Project, L.L.C. (predecessor-in-interest to Hines) as amended (the “Newton Lease”). The Third Amendment extends the lease term to December 31, 2029 and preserves the Company’s option to extend the term for an additional five-year period subject to certain terms and conditions set forth in the Newton Lease. The Third Amendment reduces the rentable space from approximately 110,000 square feet to approximately 74,000 square feet effective January 1, 2018 and provides the Company with a one-time cash allowance of up to $3.3 million, which may be used by the Company for any purpose. Beginning on January 1, 2018, base monthly rent under the Third Amendment will be $0.3 million. The base rent will increase biennially at a rate averaging approximately 1% per year, beginning on January 1, 2020. The Company remains responsible for certain other costs under the Third Amendment, including operating expense and taxes.
70
The Newton Lease contains rent concessions, which the Company is receiving over the life of the Newton Lease. Certain of the Company’s operating leases include lease incentives and escalating payment amounts and are renewable for varying periods. The Company is recognizing the related rent expense on a straight-line basis over the term of each lease, taking into account the lease incentives and escalating lease payments. Total rent expense under the Company’s leases was approximately $4.0 million, $4.5 million, and $4.4 million for the years ended December 31, 2018 and 2017, respectively.
We have various non-cancelable lease agreements for certain of our offices with original lease periods expiring between 2019 and 2029. Our lease terms may include options to extend or terminate the lease at our option. Leases with renewal option allow the Company to extend the lease term typically between 1 and 5 years. When determining the lease term, renewal options reasonably certain of being exercised are included in the lease term. When determining if a renewal option is reasonably certain of being exercised, the Company considers several economic factors, including but not limited to, the significance of leasehold improvements incurred on the property, whether the asset is difficult to replace, underlying contractual obligations, or specific characteristics unique to that particular lease that would make it reasonably certain that the Company would exercise such option. Renewal and termination options were generally not included in the lease term for the Company's existing operating leases. Certain of the arrangements have discounted rent periods or escalating rent payment provisions. Leases with an initial term of twelve months or less are not recorded on the consolidated balance sheets. We recognize rent expense on a straight-line basis over the lease term.
As of December 31, 2019, operating lease assets were $26.4 million and operating lease liabilities were $30.7 million. The maturity of the Company’s operating lease liabilities as of December 31, 2019 were as follows:
|
|
|
|
|
|
|
|
|
Minimum Lease |
|
|
|
Years Ending December 31: |
|
Payments |
|
|
|
2020 |
|
$ |
3,746 |
|
|
2021 |
|
|
4,180 |
|
|
2022 |
|
|
3,781 |
|
|
2023 |
|
|
3,696 |
|
|
2024 |
|
|
3,725 |
|
|
Thereafter |
|
|
17,760 |
|
|
Total future minimum lease payments |
|
$ |
36,888 |
|
|
Less imputed interest |
|
|
6,147 |
|
|
Total operating lease liabilities |
|
$ |
30,741 |
|
|
|
|
|
|
|
|
Included in the condensed consolidated balance sheet: |
|
|
|
|
|
Current operating lease liabilities |
|
$ |
2,571 |
|
|
Non-current operating lease liabilities |
|
|
28,170 |
|
|
Total operating lease liabilities |
|
$ |
30,741 |
|
The total lease cost is comprised of the following amounts (in thousands):
|
|
|
|
Twelve Months Ended |
|
|
|
|
|
|
December 31,2019 |
|
|
|
Operating lease expense |
|
|
$ |
3,865 |
|
|
Short-term lease expense |
|
|
|
117 |
|
|
Total lease expense |
|
|
$ |
3,982 |
|
The following summarizes additional information related to operating leases:
|
|
|
As of |
|
|
|
|
|
December 31,2019 |
|
|
|
Weighted-average years remaining lease term — operating leases |
|
|
5.4 |
|
|
Weighted-average discount rate — operating leases |
|
|
4 |
% |
If the rate implicit in the lease is not readily determinable, the Company uses its incremental borrowing rate as the discount rate. The Company uses its best judgment when determining the incremental borrowing rate, which is the rate of interest that the Company would have to pay to borrow on a collateralized basis over a similar term to the lease payments in a similar currency.
71
Supplemental Information for Comparative Periods
Certain of the Company’s operating leases include lease incentives and escalating payment amounts and are renewable for varying periods. The Company is recognizing the related rent expense on a straight-line basis over the term of each lease, taking into account the lease incentives and escalating lease payments.
Total rent expense under the Company’s leases was approximately $4.0 million, and $4.5 million for the years ended December 31, 2018 and 2017, respectively.
As previously disclosed in our 2018 Annual Report on Form 10-K and under the previous lease accounting standard, ASC 840, Leases, the total commitment for non-cancelable operating leases was $39.6 million as of December 31, 2018:
|
Years Ending December 31: |
|
Minimum Lease Payments |
|
|
|
2019 |
|
$ |
4,180 |
|
|
2020 |
|
|
3,629 |
|
|
2021 |
|
|
3,721 |
|
|
2022 |
|
|
3,397 |
|
|
2023 |
|
|
3,397 |
|
|
Thereafter |
|
|
21,267 |
|
|
|
|
$ |
39,591 |
|
Litigation
From time to time and in the ordinary course of business, the Company may be subject to various claims, charges, and litigation. At December 31, 2019 and 2018, the Company did not have any pending claims, charges, or litigation that it expects would have a material adverse effect on its consolidated financial position, results of operations, or cash flows.
11. Stock-Based Compensation
Stock Option and Incentive Plans
In April 2007, the Board approved the 2007 Stock Option and Incentive Plan (the “2007 Plan”), which was approved by the stockholders of the Company and became effective upon the consummation of the Company’s IPO in May 2007. The 2007 Plan allows the Company to grant ISOs, NSOs, stock appreciation rights, deferred stock awards, restricted stock units and other awards. Under the 2007 Plan, stock options could not be granted at less than fair market value on the date of grant and grants generally vest over a three to four-year period. Stock options granted under the 2007 Plan expire no later than ten years after the grant date. Additionally, beginning with awards made in August 2015, the Company had the option to direct a net issuance of shares for satisfaction of tax liability with respect to vesting of awards and delivery of shares. Prior to August 2015, this choice of settlement method was solely at the discretion of the award recipient.
At the inception of the plan, the Company reserved for issuance an aggregate of 2,911,667 shares of common stock under the 2007 Plan, which expired in May 2017. The 2007 Plan was subject to an automatic annual increase of shares on January 1 of each year, beginning on January 1, 2008, equal to the lesser of (a) 2% of the outstanding number of shares of common stock (on a fully-diluted basis) on the immediately preceding December 31 and (b) such lower number of shares as may be determined by the compensation committee of the Board. The number of shares available for issuance under the 2007 Plan was subject to adjustment in the event of a stock split, stock dividend or other change in capitalization. No new awards may be granted under the 2007 Plan; however, the shares of common stock remaining in the 2007 Plan are available for issuance in connection with previously awarded grants under the 2007 Plan. There are 107,500 shares of common stock, including vested and outstanding restricted stock unit awards that under the 2007 Plan as of December 31, 2019.
72
In March 2017, the Board approved the 2017 Stock Option and Incentive Plan (the “2017 Plan”), which was approved by the stockholders of the Company at the 2017 Annual Meeting and became effective June 16, 2017. The 2017 Plan replaces the Company’s 2007 Plan. On that date 3,000,000 shares of Common Stock were reserved for issuance under the 2017 Plan and, generally, shares that are forfeited or canceled from awards under the 2017 Plan also will be available for future awards. Under the 2017 Plan, the Company may grant restricted stock and restricted stock units, non-qualified stock options, stock appreciation rights, performance awards, and other stock-based and cash-based awards. Grants generally vest in equal tranches over a three-year period. Stock options granted under the 2017 Plan expire no later than ten years after the grant date. Shares of stock issued pursuant to restricted stock awards are restricted in that they are not transferable until they vest. Stock underlying awards of restricted stock units are not issued until the units vest. Non-qualified stock options cannot be exercised until they vest. Under the 2017 Plan, all stock options and stock appreciation rights must be granted with an exercise price that is at least equal to the fair market value of the stock on the date of grant. The 2017 Plan broadly prohibits the repricing of options and stock appreciation rights without stockholder approval and requires that no dividends or dividend equivalents be paid with respect to options or stock appreciation rights. The 2017 Plan further provides that, in the event any dividends or dividend equivalents are declared with respect to restricted stock, restricted stock units, other stock-based awards and performance awards (referred to as “full-value awards”), they would be subject to the same vesting and forfeiture provisions as the underlying award. There is a total of 1,363,630 shares of common stock that are subject to outstanding stock grants under the 2017 Plan as of December 31, 2019.
Accounting for Stock-Based Compensation
The Company uses the Black-Scholes option pricing model to calculate the grant-date fair value of an award. The Company calculated the fair values of the options granted using the following estimated weighted-average assumptions:
|
|
|
Years Ended December 31, |
|
|||||||||
|
|
|
2019 |
|
|
2018 |
|
|
2017 |
|
|||
|
Expected volatility |
|
|
39 |
% |
|
|
39 |
% |
|
|
43 |
% |
|
Expected term |
|
6 years |
|
|
6 years |
|
|
6 years |
|
|||
|
Risk-free interest rate |
|
|
2.15 |
% |
|
|
2.82 |
% |
|
|
1.87 |
% |
|
Expected dividend yield |
|
|
— |
% |
|
|
— |
% |
|
|
— |
% |
|
Weighted-average grant date fair value per share |
|
$ |
8.08 |
|
|
$ |
11.94 |
|
|
$ |
4.61 |
|
The expected volatility of options granted has been determined using a weighted average of the historical volatility of the Company’s stock for a period equal to the expected life of the option. The expected life of options has been determined utilizing the “simplified” method. The risk-free interest rate is based on a zero-coupon U.S. treasury instrument whose term is consistent with the expected life of the stock options. The Company has not paid and does not anticipate paying cash dividends on its shares of common stock; therefore, the expected dividend yield is assumed to be zero. The Company applied an estimated annual forfeiture rate based on historical averages in determining the expense recorded in each period.
A summary of the stock option activity under the Company’s stock option plans for the year ended December 31, 2019 is presented below:
|
|
|
Options Outstanding |
|
|
Weighted- Average Exercise Price Per Share |
|
|
Weighted- Average Remaining Contractual Term in Years |
|
|
Aggregate Intrinsic Value |
|
||||
|
Options outstanding at December 31, 2018 |
|
|
186,000 |
|
|
$ |
9.50 |
|
|
|
|
|
|
|
|
|
|
Granted |
|
|
22,500 |
|
|
|
20.32 |
|
|
|
|
|
|
|
|
|
|
Exercised |
|
|
(68,500 |
) |
|
|
5.63 |
|
|
|
|
|
|
$ |
1,331 |
|
|
Forfeited |
|
|
— |
|
|
|
— |
|
|
|
|
|
|
|
|
|
|
Canceled |
|
|
— |
|
|
|
— |
|
|
|
|
|
|
|
|
|
|
Options outstanding at December 31, 2019 |
|
|
140,000 |
|
|
$ |
13.14 |
|
|
|
5.92 |
|
|
$ |
1,861 |
|
|
Options exercisable at December 31, 2019 |
|
|
117,500 |
|
|
$ |
11.76 |
|
|
|
5.25 |
|
|
$ |
1,731 |
|
|
Options vested or expected to vest at December 31, 2019 |
|
|
139,035 |
|
|
$ |
13.09 |
|
|
|
5.90 |
|
|
$ |
1,856 |
|
73
During the years ended December 31, 2019, 2018, and 2017, the total intrinsic value of options exercised (i.e. the difference between the market price of the underlying stock at exercise and the price paid by the employee to exercise the options) was $1.3 million, $2.7 million, and $0.9 million, respectively, and the total amount of cash received by the Company from exercise of these options was $0.4 million, $1.0 million, and $0.9 million, respectively.
Restricted Stock Unit Awards
Restricted stock unit awards are valued at the market price of a share of the Company’s common stock on the date of the grant. A summary of the restricted stock unit award activity under the Company’s plans for the year ended December 31, 2019 is presented below:
|
|
|
Shares |
|
|
Weighted- Average Grant Date Fair Value Per Share |
|
|
Aggregate Intrinsic Value |
|
|||
|
Nonvested outstanding at December 31, 2018 |
|
|
1,197,261 |
|
|
$ |
17.69 |
|
|
|
|
|
|
Granted |
|
|
846,733 |
|
|
|
22.09 |
|
|
|
|
|
|
Vested |
|
|
(739,864 |
) |
|
|
15.42 |
|
|
|
|
|
|
Forfeited |
|
|
(3,000 |
) |
|
|
28.05 |
|
|
|
|
|
|
Nonvested outstanding at December 31, 2019 |
|
|
1,301,130 |
|
|
$ |
21.52 |
|
|
$ |
34,742 |
|
The total grant-date fair value of restricted stock unit awards that vested during the years ended December 31, 2019, 2018, and 2017 was $11.4 million, $7.0 million, and $7.1 million, respectively.
As of December 31, 2019, there was $23.7 million of total unrecognized compensation expense related to stock options and restricted stock units, which is expected to be recognized over a weighted average period of 2 years.
12. Stockholders’ Equity
Common Stock Repurchase Programs
On November 7, 2018 the Company announced a program (the “November 2018 Stock Repurchase Program”) to repurchase shares up to an aggregate amount of $25.0 million whereby the Company was authorized to repurchase the Company’s common stock from time to time on the open market or in privately negotiated transactions at prices and in a manner that may be determined by management. The Company repurchased 411,849 and 243,425 shares at an aggregate purchase price of $7.1 million and $3.1 million and an average share price of $17.14 and $12.82 during the year ended December 31, 2019 and 2018, respectively under the November 2018 Stock Repurchase Program.
In June 2016, the Company announced that the Board had authorized a $20.0 million stock repurchase program (the “June 2016 Repurchase Program”). Pursuant to the June 2016 Repurchase Program, the Company repurchased 211,729 and 749,437 shares of common stock for an aggregate purchase price of $3.9 million, and $8.1 million in, 2018 and 2017 respectively. In August 2018, the June 2016 Common Stock Repurchase plan expired.
Repurchased shares are recorded under the cost method and are reflected as treasury stock in the accompanying Consolidated Balance Sheets.
Reserved Common Stock
As of December 31, 2019, the Company has reserved 2,507,272 shares of common stock for use in settling outstanding options and unvested restricted stock units that have not been issued, as well as future awards available for grant under the 2007 and 2017 Plans.
74
13. Income Taxes
Income before provision for income taxes was as follows:
|
|
|
Years Ended December 31, |
|
|||||||||
|
|
|
2019 |
|
|
2018 |
|
|
2017 |
|
|||
|
United States |
|
$ |
20,709 |
|
|
$ |
11,917 |
|
|
$ |
9,435 |
|
|
Foreign |
|
|
1,339 |
|
|
|
2,926 |
|
|
|
282 |
|
|
Income before income taxes |
|
$ |
22,048 |
|
|
$ |
14,843 |
|
|
$ |
9,717 |
|
The income tax provision consisted of the following:
|
|
|
Years Ended December 31, |
|
|||||||||
|
|
|
2019 |
|
|
2018 |
|
|
2017 |
|
|||
|
Current: |
|
|
|
|
|
|
|
|
|
|
|
|
|
Federal |
|
$ |
3,415 |
|
|
$ |
1,540 |
|
|
$ |
1,543 |
|
|
State |
|
|
538 |
|
|
|
540 |
|
|
|
419 |
|
|
Foreign |
|
|
347 |
|
|
|
(55 |
) |
|
|
57 |
|
|
Total current |
|
|
4,300 |
|
|
|
2,025 |
|
|
|
2,019 |
|
|
Deferred: |
|
|
|
|
|
|
|
|
|
|
|
|
|
Federal |
|
|
742 |
|
|
|
(65 |
) |
|
|
598 |
|
|
State |
|
|
242 |
|
|
|
(53 |
) |
|
|
382 |
|
|
Foreign |
|
|
(111 |
) |
|
|
(19 |
) |
|
|
(85 |
) |
|
Total deferred |
|
|
873 |
|
|
|
(137 |
) |
|
|
895 |
|
|
|
|
$ |
5,173 |
|
|
$ |
1,888 |
|
|
$ |
2,914 |
|
On December 22, 2017, the legislation commonly referred to as the Tax Cuts and Jobs Act of 2017 (“the Act”) was signed into law, making significant changes to the Internal Revenue Code of 1986, as amended. Changes include, but are not limited to, a corporate tax rate decreased from 35% to 21% effective for tax years beginning after December 31, 2017. The Act also provided for a mandatory one-time tax on the deemed repatriation of accumulative foreign earnings of foreign subsidiaries as of December 31 (the “Transition Tax”), a tax on global intangible low-taxed income (‘GILTI’) for tax year beginning after December 31,2017, and modified the rules on the deduction for executive compensation. The Company recognized $0.4 million of current tax benefit related to revaluation of deferred tax balances as a result of the change in tax rate, and $45 thousand of current tax expense related to the Transition Tax, for a net current tax benefit of $0.4 million.
On December 22, 2017, Staff Accounting Bulletin No. 118 (“SAB 118”) was issued to address the application of US GAAP in situations when a registrant does not have the necessary information available, prepared or analyzed (including computations) in reasonable detail to complete the accounting for certain income tax effects of the Act. In accordance with SAB 118, the Company recorded an estimated $45 thousand of current tax expense at December 31, 2017 in connection with the Transition Tax. In the first quarter of 2018 the Company performed additional analysis of historical foreign earnings and as a result recorded an immaterial adjustment to the transition tax. The Company completed its analysis in the fourth quarter of 2018 with no further adjustment and reported a total transition tax of $31 on their Federal tax return.
75
The income tax provision for the years ended December 31, 2019, 2018 and 2017 differs from the amounts computed by applying the statutory federal income tax rate to consolidated income before provision for income taxes as follows:
|
|
|
Years Ended December 31, |
|
|||||||||
|
|
|
2019 |
|
|
2018 |
|
|
2017 |
|
|||
|
Provision computed at statutory rate |
|
$ |
4,630 |
|
|
$ |
3,116 |
|
|
$ |
3,401 |
|
|
Increase resulting from: |
|
|
|
|
|
|
|
|
|
|
|
|
|
Difference in rates for foreign jurisdictions |
|
|
18 |
|
|
|
93 |
|
|
|
37 |
|
|
Tax exempt interest income |
|
|
— |
|
|
|
(2 |
) |
|
|
(12 |
) |
|
Stock-based compensation |
|
|
(425 |
) |
|
|
(1,708 |
) |
|
|
(304 |
) |
|
Other non-deductible expenses |
|
|
243 |
|
|
|
252 |
|
|
|
(101 |
) |
|
Non-deductible officers compensation |
|
|
482 |
|
|
|
198 |
|
|
|
447 |
|
|
State income tax provision |
|
|
615 |
|
|
|
396 |
|
|
|
653 |
|
|
Losses not benefitted |
|
|
— |
|
|
|
23 |
|
|
|
4 |
|
|
Subsidiary earnings taxed in the US |
|
|
(11 |
) |
|
|
(104 |
) |
|
|
127 |
|
|
True-up of prior year returns |
|
|
1 |
|
|
|
(20 |
) |
|
|
(161 |
) |
|
Research and development credit |
|
|
(387 |
) |
|
|
(279 |
) |
|
|
(801 |
) |
|
Tax Cuts and Jobs Act of 2017 |
|
|
— |
|
|
|
(11 |
) |
|
|
(376 |
) |
|
Cancellation of Foreign Subsidiary Debt |
|
|
— |
|
|
|
(127 |
) |
|
|
— |
|
|
Other |
|
|
7 |
|
|
|
61 |
|
|
|
— |
|
|
Provision for income taxes |
|
$ |
5,173 |
|
|
$ |
1,888 |
|
|
$ |
2,914 |
|
Significant components of the Company’s net deferred tax assets and liabilities are as follows:
|
|
|
As of December 31, |
|
|||||
|
|
|
2019 |
|
|
2018 |
|
||
|
Deferred tax assets: |
|
|
|
|
|
|
|
|
|
Net operating loss carryforwards |
|
$ |
99 |
|
|
$ |
33 |
|
|
Contract liabilities |
|
|
— |
|
|
|
— |
|
|
Right of use operating lease liability |
|
|
7,769 |
|
|
|
— |
|
|
Accruals and allowances |
|
|
1,452 |
|
|
|
1,253 |
|
|
Stock-based compensation |
|
|
1,397 |
|
|
|
1,286 |
|
|
Deferred rent expense |
|
|
— |
|
|
|
1,267 |
|
|
Other |
|
|
4 |
|
|
|
4 |
|
|
Gross deferred tax assets |
|
|
10,721 |
|
|
|
3,843 |
|
|
Less valuation allowance |
|
|
(33 |
) |
|
|
(33 |
) |
|
Total deferred tax assets |
|
|
10,688 |
|
|
|
3,810 |
|
|
Deferred tax liabilities: |
|
|
|
|
|
|
|
|
|
Intangible asset amortization |
|
|
(3,204 |
) |
|
|
(2,603 |
) |
|
Right of use operating lease asset |
|
|
(6,650 |
) |
|
|
— |
|
|
Depreciation |
|
|
(2,309 |
) |
|
|
(1,814 |
) |
|
Total deferred tax liabilities |
|
|
(12,163 |
) |
|
|
(4,417 |
) |
|
Net deferred tax liabilities |
|
$ |
(1,475 |
) |
|
$ |
(607 |
) |
|
As reported: |
|
|
|
|
|
|
|
|
|
Non-current deferred tax assets |
|
$ |
136 |
|
|
$ |
55 |
|
|
Non-current deferred tax liabilities |
|
$ |
(1,611 |
) |
|
$ |
(662 |
) |
In evaluating the ability to realize the net deferred tax asset, the Company considers all available evidence, both positive and negative, including past operating results, the existence of cumulative losses in the most recent fiscal years, tax planning strategies that are prudent and feasible, and forecasts of future taxable income. In considering sources of future taxable income, the Company makes certain assumptions and judgments which are based on the plans and estimates used to manage the underlying business of the Company. Changes in the Company’s assumptions and estimates, as well as changes in tax rates, may materially impact income tax expense for the period.
76
The deferred tax assets relating to the foreign net operating losses (“NOLs”) are partially offset by a valuation allowance. The valuation allowance of $33 thousand at both December 31, 2019 and 2018 , relates primarily to Hong Kong foreign NOLs of $0.2 million. The valuation allowance remained the same in 2019 and decreased by, $0.3 million, and $0.1 million during the years ended December 31, 2018, and 2017, respectively. To the extent realization of the deferred tax assets for NOLs becomes more likely than not, recognition of these acquired tax benefits would reduce income tax expense. As of December 31, 2019, the Company had a NOL carryforward of approximately $0.6 million, which may be used to offset future taxable income in foreign jurisdictions indefinitely.
The Company had no unrecognized tax benefits at December 31, 2019. It is not expected that the amount of unrecognized tax benefits will change significantly within the next twelve months.
The Company files income tax returns in the U.S. and in foreign jurisdictions. Generally, the Company is no longer subject to U.S., state, local and foreign income tax examinations by tax authorities in its major jurisdictions for years before 2014, except to the extent of NOL and tax credit carryforwards from those years. Major taxing jurisdictions include the U.S., both federal and state. As of December 31, 2019, the Company also had foreign NOL carryforwards of $0.6 million, which may be used to offset future taxable income in foreign jurisdictions indefinitely. The deferred tax assets related to the foreign NOL carryforwards have been partially offset by a $0.2 million valuation allowance related to Hong Kong.
The Company considers the excess of its financial reporting over its tax basis in investments in foreign subsidiaries essentially permanent in duration and as such has not recognized deferred tax liability related to this difference. Undistributed earnings of the Company’s foreign subsidiaries amounted to approximately $8.3 million as of December 31, 2019. The Company has not provided any additional federal or state income taxes or foreign withholding taxes on the undistributed earnings as such earnings have been indefinitely reinvested in the business. Due to the various methods by which such earnings could be repatriated in the future, the amount of taxes attributable to the undistributed earnings is not practicably determinable.
14. Segment Information
The Company views its operations and manages its business as one operating segment based on factors such as how the Company manages its operations and how its executive management team reviews results and makes decisions on how to allocate resources and assess performance.
Geographic Data
Net sales by campaign target area were as follows (1):
|
|
|
Years Ended December 31, |
|
|||||||||
|
|
|
2019 |
|
|
2018 |
|
|
2017 |
|
|||
|
North America |
|
$ |
89,582 |
|
|
$ |
82,660 |
|
|
$ |
73,349 |
|
|
International |
|
|
44,375 |
|
|
|
38,673 |
|
|
|
35,207 |
|
|
Total Revenue |
|
$ |
133,957 |
|
|
$ |
121,333 |
|
|
$ |
108,556 |
|
|
(1) |
Net sales to customers by campaign target area is based on the geo-targeted (target audience) location of the campaign. |
Net sales to unaffiliated customers by geographic area were as follows (2):
|
|
|
Years Ended December 31, |
|
|||||||||
|
|
|
2019 |
|
|
2018 |
|
|
2017 |
|
|||
|
United States |
|
$ |
99,669 |
|
|
$ |
89,340 |
|
|
$ |
77,982 |
|
|
United Kingdom |
|
|
14,104 |
|
|
|
14,391 |
|
|
|
12,544 |
|
|
Other International |
|
|
20,184 |
|
|
|
17,602 |
|
|
|
18,030 |
|
|
Total |
|
$ |
133,957 |
|
|
$ |
121,333 |
|
|
$ |
108,556 |
|
|
(2) |
Net sales to unaffiliated customers by geographic area is based on the customers’ current billing addresses and does not consider the geo-targeted (target audience) location of the campaign. |
77
Long-lived assets by geographic area were as follows:
|
|
|
Years Ended December 31, |
|
|||||
|
|
|
2019 |
|
|
2018 |
|
||
|
United States |
|
$ |
102,572 |
|
|
$ |
101,051 |
|
|
International |
|
|
4,148 |
|
|
|
4,386 |
|
|
Total |
|
$ |
106,720 |
|
|
$ |
105,437 |
|
Long-lived assets are comprised of property and equipment, net; goodwill; and intangible assets, net. No single country outside of the U.S. accounted for 10% or more of the Company’s long-lived assets during either of these periods.
15. 401(k) Plan
The Company maintains a 401(k)-retirement savings plan (the “Plan”) whereby employees may elect to defer a portion of their salary and contribute the deferred portion to the Plan. The Company contributes an amount equal to 50% of the employee’s contribution to the Plan, up to an annual limit of $3 thousand in 2019 and 2018 and $2 thousand for 2017. The Company contributed $1.2 million, $1.1 million and $0.9 million to the Plan for each of the years ended December 31, 2019, 2018, and 2017 respectively. Employee contributions and the Company’s matching contributions are invested in one or more collective investment funds at the participant’s direction. The Company’s matching contributions vest 25% annually and are 100% vested after four consecutive years of service.
16. Subsequent Events
On February 18, 2020, the Company acquired substantially all of the operating assets of Data Science Central LLC, which is a niche digital publishing and media company focused on data science and business analytics for $5.5 million, plus, contingent consideration of $2.0 million which will become payable upon the achievement of certain revenue objectives during the next two years. The purchase price was paid in cash by the Company.
78
None.
Disclosure Controls and Procedures
The Company is required to maintain disclosure controls and procedures that are designed to ensure that information required to be disclosed in its reports under the Securities Exchange Act of 1934 (the “Exchange Act”) is recorded, processed, summarized and reported within the time periods specified in the Securities and Exchange Commission’s (the “SEC’s”) rules and forms, and that such information is accumulated and communicated to management, including the Company’s Chief Executive Officer and Chief Financial Officer as appropriate, to allow timely decisions regarding required disclosure.
In connection with the preparation of the Annual Report on Form 10-K for the period ended December 31, 2019, management, under the supervision of the Chief Executive Officer (Principal Executive Officer) and Chief Financial Officer (Principal Financial Officer), conducted an evaluation the Company’s of disclosure controls and procedures as of December 31, 2019. Based on that evaluation, the Chief Executive Officer and Chief Financial Officer concluded that the Company’s disclosure controls and procedures were effective at the reasonable assurance level.
Changes in Internal Control Over Financial Reporting
There were no changes in our internal control over financial reporting, identified in connection with the evaluation of such internal control, that occurred during the fourth quarter of 2019 that have materially affected, or are reasonably likely to materially affect, our internal control over financial reporting.
Management’s Annual Report on Internal Control over Financial Reporting
Our management is responsible for establishing and maintaining adequate internal control over financial reporting. Internal control over financial reporting is defined in Rule 13a-15(f) and 15d-15(f) promulgated under the Exchange Act, as a process designed by, or under the supervision of, a company’s principal executive and principal financial officers and effected by the company’s Board of Directors, management and other personnel, to provide reasonable assurance regarding the reliability of financial reporting and the preparation of consolidated financial statements for external purposes in accordance with generally accepted accounting principles. Our internal control over financial reporting includes those policies and procedures that:
|
|
• |
pertain to the maintenance of records that, in reasonable detail, accurately and fairly reflect the transactions and dispositions of the assets of the Company; |
|
|
• |
provide reasonable assurance that transactions are recorded as necessary to permit preparation of consolidated financial statements in accordance with generally accepted accounting principles, and that receipts and expenditures of the Company are being made only in accordance with authorizations of management and directors of the Company; and |
|
|
• |
provide reasonable assurance regarding prevention or timely detection of unauthorized acquisition, use or disposition of the Company’s assets that could have a material effect on the consolidated financial statements. |
Because of its inherent limitations, internal control over financial reporting may not prevent or detect misstatements. Also, projections of any evaluation of effectiveness to future periods are subject to the risk that controls may become inadequate because of changes in conditions, or that the degree of compliance with the policies or procedures may deteriorate.
Management conducted an evaluation of the effectiveness of our internal control over financial reporting based on the criteria for effective control over financial reporting described in Internal Control-Integrated Framework (2013) issued by the Committee of Sponsoring Organizations of the Treadway Commission.
Based on this evaluation, our Chief Executive Officer and Chief Financial Officer concluded that, as of December 31, 2019, our internal control over financial reporting was effective. Management has reviewed its assessment with the Audit Committee.
The independent registered public accounting firm, Stowe and Degon LLC, has audited our consolidated financial statements and has issued an attestation report on our internal control over financial reporting as of December 31, 2019, which is included herein.
79
Report of Independent Registered Public Accounting Firm
Shareholders and Board of Directors
TechTarget, Inc.
Newton, Massachusetts
Opinion on Internal Control over Financial Reporting
We have audited TechTarget, Inc.’s (the “Company’s”) internal control over financial reporting as of December 31, 2018, based on criteria established in Internal Control – Integrated Framework (2013) issued by the Committee of Sponsoring Organizations of the Treadway Commission (the “COSO criteria”). In our opinion, the Company maintained, in all material respects, effective internal control over financial reporting as of December 31, 2018, based on the COSO criteria.
We also have audited, in accordance with the standards of the Public Company Accounting Oversight Board (United States) (“PCAOB”), the consolidated balance sheets of the Company and subsidiaries as of December 31, 2018 and 2017, the related consolidated statements of income and comprehensive income, stockholders’ equity, and cash flows for each of the three years in the period ended December 31, 2018, and the related notes and our report dated March 12, 2019 expressed an unqualified opinion thereon.
Basis for Opinion
The Company’s management is responsible for maintaining effective internal control over financial reporting and for its assessment of the effectiveness of internal control over financial reporting, included in the accompanying Item 9A, Management’s Report on Internal Control over Financial Reporting”. Our responsibility is to express an opinion on the Company’s internal control over financial reporting based on our audit. We are a public accounting firm registered with the PCAOB and are required to be independent with respect to the Company in accordance with U.S. federal securities laws and the applicable rules and regulations of the Securities and Exchange Commission and the PCAOB.
We conducted our audit of internal control over financial reporting in accordance with the standards of the PCAOB. Those standards require that we plan and perform the audit to obtain reasonable assurance about whether effective internal control over financial reporting was maintained in all material respects. Our audit included obtaining an understanding of internal control over financial reporting, assessing the risk that a material weakness exists, and testing and evaluating the design and operating effectiveness of internal control based on the assessed risk. Our audit also included performing such other procedures as we considered necessary in the circumstances. We believe that our audit provides a reasonable basis for our opinion.
Definition and Limitations of Internal Control over Financial Reporting
A company’s internal control over financial reporting is a process designed to provide reasonable assurance regarding the reliability of financial reporting and the preparation of financial statements for external purposes in accordance with generally accepted accounting principles. A company’s internal control over financial reporting includes those policies and procedures that (1) pertain to the maintenance of records that, in reasonable detail, accurately and fairly reflect the transactions and dispositions of the assets of the company; (2) provide reasonable assurance that transactions are recorded as necessary to permit preparation of financial statements in accordance with generally accepted accounting principles, and that receipts and expenditures of the company are being made only in accordance with authorizations of management and directors of the company; and (3) provide reasonable assurance regarding prevention or timely detection of unauthorized acquisition, use, or disposition of the company’s assets that could have a material effect on the financial statements.
Because of its inherent limitations, internal control over financial reporting may not prevent or detect misstatements. Also, projections of any evaluation of effectiveness to future periods are subject to the risk that controls may become inadequate because of changes in conditions, or that the degree of compliance with the policies or procedures may deteriorate.
/s/ BDO USA, LLP
Boston, Massachusetts
March 12, 2019
80
None.
The information required by this item concerning directors and executive officers is incorporated herein by reference under the headings to be titled “Election of Class I Directors” and “Information About Corporate Governance” in our definitive proxy statement to be filed with the Securities and Exchange Commission in connection with the Company’s 2020 Proxy Statement (the “Proxy Statement”). The Proxy Statement is expected to be filed no later than 120 days after the end of our fiscal year ended December 31, 2019 in connection with the solicitation of proxies for the Company’s 2020 annual meeting of stockholders.
The information required by this item with respect to Section 16(a) of the Exchange Act is incorporated herein by reference from the section to be titled “Section 16(a) Beneficial Ownership Reporting Compliance” in our Proxy Statement.
Code of Ethics
The Company has a Code of Business Conduct and Ethics that applies to all of our employees, officers (including our principal executive officer, principal financial officer, principal accounting officer or controller, or persons performing similar functions) as well as the members of the Board of Directors of the Company. The code is available at https:investor.techtarget.com/govdocs. We will make any required disclosure of future changes to the code, or waivers of such provisions, on the same website.
The information required by this item will be set forth under the headings to be titled “Director Compensation,” “Executive Compensation,” and “Compensation Committee Report” in our Proxy Statement and is incorporated herein by reference.
|
Item 12. |
Security Ownership of Certain Beneficial Owners and Management and Related Stockholder Matters |
The information required by this item will be set forth under the headings to be titled “Stock Ownership of Certain Beneficial Owners and Management” and “Equity Compensation Plan Information” in our Proxy Statement and is incorporated herein by reference.
The information required by this item will be set forth under the headings to be titled “Information about Corporate Governance” and “Certain Relationships and Related Party Transactions” in our Proxy Statement and is incorporated herein by reference.
The information required by this item will be set forth under the heading to be titled “Independent Registered Public Accounting Firm” in our Proxy Statement and is incorporated herein by reference.
81
|
|
(a) |
Documents filed as part of this report: |
|
|
(1) |
Financial Statements are filed as part of this Annual Report on Form 10-K. The following consolidated financial statements are included in Item 8: |
|
|
• |
Consolidated Balance Sheets as of December 31, 2019 and 2018 |
|
|
• |
Consolidated Statements of Income and Comprehensive Income for the Years Ended December 31, 2019, 2018, and 2017 |
|
|
• |
Consolidated Statements of Stockholders’ Equity for the Years Ended December 31, 2019, 2018, and 2017 |
|
|
• |
Consolidated Statements of Cash Flows for the Years Ended December 31, 2019, 2018, and 2017 |
|
|
• |
Notes to Consolidated Financial Statements |
|
|
(2) |
Financial statement schedules have been omitted because they are not required or because the required information is given in the Consolidated Financial Statements or Notes thereto. |
|
|
(3) |
Exhibit Index. |
82
|
|
|
|
|
|
|
Incorporated by Reference to |
||||
|
Exhibit Number |
|
Description |
|
Form or Schedule |
|
Exhibit No. |
|
Filing Date with SEC |
|
SEC File Number |
|
|
|
|
|
|
|
|
|
|
|
|
|
|
|
Articles of Incorporation and By-Laws |
|
|
|
|
|
|
|
|
|
|
|
|
|
|
|
|
|
|
|
|
|
3.1 |
|
Fourth Amended and Restated Certificate of Incorporation of the Registrant |
|
10-Q |
|
3.1 |
|
11/13/2007 |
|
001-33472 |
|
|
|
|
|
|
|
|
|
|
|
|
|
3.2 |
|
|
S-1/A |
|
3.3 |
|
3/20/2007 |
|
333-140503 |
|
|
|
|
|
|
|
|
|
|
|
|
|
|
|
|
Instruments Defining the Rights of Security Holders |
|
|
|
|
|
|
|
|
|
|
|
|
|
|
|
|
|
|
|
|
|
4.1 |
|
Specimen Stock Certificate for shares of the Registrant’s Common Stock |
|
S-1/A |
|
4.1 |
|
4/10/2007 |
|
333-140503 |
|
|
|
|
|
|
|
|
|
|
|
|
|
*4.2 |
|
Description of Securities Registered Under Section 12 of the Exchange Act |
|
|
|
|
|
|
|
|
|
|
|
|
|
|
|
|
|
|
|
|
|
|
|
Material Contracts |
|
|
|
|
|
|
|
|
|
|
|
|
|
|
|
|
|
|
|
|
|
10.1 |
|
|
S-1 |
|
10.1 |
|
2/07/2007 |
|
333-140503 |
|
|
|
|
|
|
|
|
|
|
|
|
|
|
10.2 |
|
Form of Indemnification Agreement between the Registrant and its Directors and Officers |
|
S-1/A |
|
10.2 |
|
5/15/2007 |
|
333-140503 |
|
|
|
|
|
|
|
|
|
|
|
|
|
10.3# |
|
|
S-1/A |
|
10.3 |
|
4/20/2007 |
|
333-140503 |
|
|
|
|
|
|
|
|
|
|
|
|
|
|
10.4# |
|
Form of Incentive Stock Option Agreement under the 2007 Stock Option and Incentive Plan |
|
S-1/A |
|
10.4 |
|
4/20/2007 |
|
333-140503 |
|
|
|
|
|
|
|
|
|
|
|
|
|
10.5# |
|
Form of Non-Qualified Stock Option Agreement under the 2007 Stock Option and Incentive Plan |
|
S-1/A |
|
10.5 |
|
4/20/2007 |
|
333-140503 |
|
|
|
|
|
|
|
|
|
|
|
|
|
10.6# |
|
Form of Non-Qualified Stock Option Agreement for Non-Employee Directors |
|
S-1/A |
|
10.5.1 |
|
4/27/2007 |
|
333-140503 |
|
|
|
|
|
|
|
|
|
|
|
|
|
10.7# |
|
Form of Restricted Stock Agreement under the 2007 Stock Option and Incentive Plan |
|
S-1/A |
|
10.6 |
|
4/20/2007 |
|
333-140503 |
|
|
|
|
|
|
|
|
|
|
|
|
|
10.8# |
|
Form of Restricted Stock Unit Agreement under the 2007 Stock Option and Incentive Plan |
|
10-K |
|
10.8 |
|
3/31/2008 |
|
001-33472 |
|
|
|
|
|
|
|
|
|
|
|
|
|
10.09# |
|
Restricted Stock Unit Agreement, dated December 18, 2007, by and between the Registrant and Don Hawk |
|
10-K |
|
10.10 |
|
3/31/2008 |
|
001-33472 |
|
|
|
|
|
|
|
|
|
|
|
|
|
10.10# |
|
|
10-K |
|
10.13 |
|
3/31/2008 |
|
001-33472 |
|
|
|
|
|
|
|
|
|
|
|
|
|
|
10.11# |
|
|
S-1 |
|
10.9 |
|
2/07/2007 |
|
333-140503 |
|
|
|
|
|
|
|
|
|
|
|
|
|
|
10.12# |
|
|
S-1 |
|
10.10 |
|
2/07/2007 |
|
333-140503 |
|
|
|
|
|
|
|
|
|
|
|
|
|
|
10.13# |
|
|
S-1/A |
|
10.10.1 |
|
5/01/2007 |
|
333-140503 |
|
|
|
|
|
|
|
|
|
|
|
|
|
83
|
|
|
|
|
|
|
Incorporated by Reference to |
||||
|
Exhibit Number |
|
Description |
|
Form or Schedule |
|
Exhibit No. |
|
Filing Date with SEC |
|
SEC File Number |
|
|
|
|
|
|
|
|
|
|
|
|
|
10.14# |
|
Form of Nonqualified Stock Option Grant Agreement under the 1999 Stock Option Plan |
|
S-1 |
|
10.11 |
|
2/07/2007 |
|
333-140503 |
|
|
|
|
|
|
|
|
|
|
|
|
|
10.15# |
|
|
10-K |
|
10.25 |
|
3/31/2008 |
|
001-33472 |
|
|
|
|
|
|
|
|
|
|
|
|
|
|
10.16# |
|
|
10-K |
|
10.26 |
|
3/31/2008 |
|
001-33472 |
|
|
|
|
|
|
|
|
|
|
|
|
|
|
10.17# |
|
|
8-K |
|
10.1 |
|
8/7/2009 |
|
001-33472 |
|
|
|
|
|
|
|
|
|
|
|
|
|
|
10.18 |
|
|
8-K |
|
10.1 |
|
11/22/2010 |
|
001-33472 |
|
|
|
|
|
|
|
|
|
|
|
|
|
|
10.19 |
|
|
10-K |
|
10.33 |
|
3/16/2011 |
|
001-33472 |
|
|
|
|
|
|
|
|
|
|
|
|
|
|
10.20# |
|
Employment Agreement dated as of January 1, 2012 between the Registrant and Michael Cotoia |
|
8-K |
|
10.1 |
|
1/10/2012 |
|
001-33472 |
|
|
|
|
|
|
|
|
|
|
|
|
|
10.21# |
|
|
10-K |
|
10.37 |
|
3/15/2012 |
|
001-33472 |
|
|
|
|
|
|
|
|
|
|
|
|
|
|
10.22# |
|
Purchase Agreement between the Company and TCV V, LP and TCV Member Fund, LP, dated December 9, 2014 |
|
8-K |
|
10.1 |
|
12/9/14 |
|
001-33472 |
|
|
|
|
|
|
|
|
|
|
|
|
|
10.23# |
|
|
10-Q |
|
10.1 |
|
11/9/2015 |
|
001-33472 |
|
|
|
|
|
|
|
|
|
|
|
|
|
|
10.24 |
|
Employment Agreement between the Registrant and Michael Cotoia (dated May 3, 2016) |
|
8-K |
|
10.2 |
|
5/9/2016 |
|
001-33472 |
|
|
|
|
|
|
|
|
|
|
|
|
|
10.25 |
|
Employment Agreement between the Registrant and Greg Strakosch (dated May 3, 2016) |
|
8-K |
|
10.3 |
|
5/9/2016 |
|
001-33472 |
|
|
|
|
|
|
|
|
|
|
|
|
|
10.26# |
|
Employment Agreement between the Registrant and Daniel T. Noreck (dated December 19, 2016) |
|
8-K |
|
10.1 |
|
12/19/2016 |
|
001-33472 |
|
|
|
|
|
|
|
|
|
|
|
|
|
10.27 |
|
|
8-K |
|
10.1 |
|
6/20/2017 |
|
001-33472 |
|
|
|
|
|
|
|
|
|
|
|
|
|
|
10.28# |
|
|
10-Q |
|
10.2 |
|
8/9/2017 |
|
001-33472 |
|
|
|
|
|
|
|
|
|
|
|
|
|
|
10.29# |
|
|
10-Q |
|
10.3 |
|
8/9/2017 |
|
001-33472 |
|
|
|
|
|
|
|
|
|
|
|
|
|
|
10.30# |
|
|
8-K |
|
10.1 |
|
10/27/2017 |
|
001-33472 |
|
|
|
|
|
|
|
|
|
|
|
|
|
|
10.31 |
|
|
10Q |
|
10.2 |
|
8/3/2018 |
|
001-33472 |
|
|
|
|
|
|
|
|
|
|
|
|
|
84
|
|
|
|
|
|
|
Incorporated by Reference to |
||||
|
Exhibit Number |
|
Description |
|
Form or Schedule |
|
Exhibit No. |
|
Filing Date with SEC |
|
SEC File Number |
|
|
|
|
|
|
|
|
|
|
|
|
|
10.32# |
|
|
8-K |
|
10.1 |
|
12/28/2018 |
|
001-33472 |
|
|
|
|
|
|
|
|
|
|
|
|
|
|
*10.33# |
|
|
|
|
|
|
|
|
|
|
|
|
|
|
|
|
|
|
|
|
|
|
|
10.34 |
|
|
8-K |
|
10.1 |
|
08/17/2019 |
|
001-33472 |
|
|
|
|
|
|
|
|
|
|
|
|
|
|
16.1 |
|
Changes in Registrant's Certifying Accountant, Letter from BDO USA, LLP dated June 17, 2019. |
|
8-K |
|
16.1 |
|
6/17/2019 |
|
001-33472 |
|
|
|
|
|
|
|
|
|
|
|
|
|
*21.1.# |
|
|
|
|
|
|
|
|
|
|
|
|
|
|
|
|
|
|
|
|
|
|
|
*23.1 |
|
|
|
|
|
|
|
|
|
|
|
|
|
|
|
|
|
|
|
|
|
|
|
*23.2 |
|
|
|
|
|
|
|
|
|
|
|
|
|
|
|
|
|
|
|
|
|
|
|
*31.1 |
|
|
|
|
|
|
|
|
|
|
|
|
|
|
|
|
|
|
|
|
|
|
|
*31.2 |
|
|
|
|
|
|
|
|
|
|
|
|
|
|
|
|
|
|
|
|
|
|
|
*32.1 |
|
|
|
|
|
|
|
|
|
|
|
|
|
|
|
|
|
|
|
|
|
|
|
101.INS |
|
XBRL Instance Document (1) |
|
|
|
|
|
|
|
|
|
|
|
|
|
|
|
|
|
|
|
|
|
101.SCH |
|
XBRL Taxonomy Extension Schema Document (1) |
|
|
|
|
|
|
|
|
|
|
|
|
|
|
|
|
|
|
|
|
|
101.CAL |
|
XBRL Taxonomy Extension Calculation Linkbase Document (1) |
|
|
|
|
|
|
|
|
|
|
|
|
|
|
|
|
|
|
|
|
|
101.DEF |
|
XBRL Taxonomy Extension Definition Linkbase Document (1) |
|
|
|
|
|
|
|
|
|
|
|
|
|
|
|
|
|
|
|
|
|
101.LAB |
|
XBRL Taxonomy Extension Label Linkbase Document (1) |
|
|
|
|
|
|
|
|
|
|
|
|
|
|
|
|
|
|
|
|
|
101.PRE |
|
XBRL Taxonomy Extension Presentation Linkbase Document (1) |
|
|
|
|
|
|
|
|
|
|
|
|
|
|
|
|
|
|
|
|
|
* |
Filed herewith. |
|
# |
Management contract or compensatory plan or arrangement filed as an Exhibit to this report pursuant to 15(a) and 15(c) of Form 10-K. |
|
(1) |
Attached as Exhibit 101 to this report are the following documents formatted in XBRL (Extensible Business Reporting Language): (i) Consolidated Balance Sheets as of December 31, 2019 and December 31, 2018, (ii) Consolidated Statements of Comprehensive Income for the Years ended December 31, 2019, December 31, 2018 and December 31, 2017, (iii) Consolidated Statements of Stockholders’ Equity for the Years ended December 31, 2019, December 31, 2018 and December 31, 2017, (iv) Consolidated Statements of Cash Flows for the Years ended December 31, 2019, December 31, 2018 and December 31, 2017, and (v) Notes to Consolidated Financial Statements. |
None.
85
Pursuant to the requirements of Section 13 or 15(d) of the Securities Exchange Act of 1934, the registrant has duly caused this report to be signed on its behalf by the undersigned, thereunto duly authorized.
|
TECHTARGET, INC. |
||
|
Date: March 16, 2020 |
||
|
|
|
|
|
By: |
|
/s/ Michael Cotoia |
|
|
|
Michael Cotoia |
|
|
|
Chief Executive Officer and Director |
Pursuant to the requirements of the Securities Exchange Act of 1934, this report has been signed below by the following persons on behalf of the registrant and in the capacities and on the dates indicated.
|
Signature |
|
Title |
|
Date |
|
|
|
|
|
|
|
/s/ Michael Cotoia |
|
Chief Executive Officer and Director |
|
March 16, 2020 |
|
Michael Cotoia |
|
(Principal executive officer) |
|
|
|
|
|
|
|
|
|
/s/ Daniel Noreck |
|
Chief Financial Officer and Treasurer |
|
March 16, 2020 |
|
Daniel Noreck |
|
(Principal financial and accounting officer) |
|
|
|
|
|
|
|
|
|
/s/ Greg Strakosch |
|
Executive Chairman |
|
March 16, 2020 |
|
Greg Strakosch |
|
|
|
|
|
|
|
|
|
|
|
/s/ Robert D. Burke |
|
Director |
|
March 16, 2020 |
|
Robert D. Burke |
|
|
|
|
|
|
|
|
|
|
|
/s/ Leonard Forman |
|
Director |
|
March 16, 2020 |
|
Leonard Forman |
|
|
|
|
|
|
|
|
|
|
|
/s/ Bruce Levenson |
|
Director |
|
March 16, 2020 |
|
Bruce Levenson |
|
|
|
|
|
|
|
|
|
|
|
/s/ Roger M. Marino |
|
Director |
|
March 16, 2020 |
|
Roger M. Marino |
|
|
|
|
|
|
|
|
|
|
|
/s/ Christina Van Houten |
|
Director |
|
March 16, 2020 |
|
Christina Van Houten |
|
|
|
|
86