Attached files
| file | filename |
|---|---|
| EX-32.1 - EX-32.1 - Turtle Beach Corp | hear-ex321_6.htm |
| EX-31.2 - EX-31.2 - Turtle Beach Corp | hear-ex312_7.htm |
| EX-31.1 - EX-31.1 - Turtle Beach Corp | hear-ex311_9.htm |
| EX-23.1 - EX-23.1 - Turtle Beach Corp | hear-ex231_8.htm |
| EX-21 - EX-21 - Turtle Beach Corp | hear-ex21_10.htm |
| EX-4.7 - EX-4.7 - Turtle Beach Corp | hear-ex47_299.htm |
UNITED STATES
SECURITIES AND EXCHANGE COMMISSION
Washington, D.C. 20549
FORM 10-K
(Mark one)
|
☒ |
ANNUAL REPORT PURSUANT TO SECTION 13 OR 15(d) OF THE SECURITIES EXCHANGE ACT OF 1934 |
For the fiscal year ended December 31, 2019
or
|
☐ |
TRANSITION REPORT PURSUANT TO SECTION 13 OR 15(d) OF THE SECURITIES EXCHANGE ACT OF 1934 |
For the transition period from to
Commission File Number: 001-35465

TURTLE BEACH CORPORATION
(Exact name of registrant as specified in its charter)
|
|
|
|
|
|
|
Nevada |
27-2767540 |
|
(State or other jurisdiction of incorporation or organization) |
(I.R.S. Employer Identification Number) |
|
11011 Via Frontera, Suite A/B San Diego, California |
|
92127 |
|
(Address of principal executive offices) |
|
(Zip Code) |
(888) 496-8001
(Registrant's telephone number, including area code)
Securities registered pursuant to Section 12(b) of the Act:
|
Title of each class |
Trading Symbols |
Name of each exchange on which registered |
|
Common Stock, par value $0.001 |
HEAR |
Nasdaq |
Securities registered pursuant to Section 12(g) of the Act: None
Indicate by check mark if the registrant is a well-known seasoned issuer, as defined in Rule 405 of the Securities Act. ☐ Yes ☒ No
Indicate by check mark if the registrant is not required to file reports pursuant to Section 13 or Section 15(d) of the Act. ☐ Yes ☒ No
Indicate by check mark whether the registrant (1) has filed all reports required to be filed by Section 13 or 15(d) of the Securities Exchange Act of 1934 during the preceding 12 months (or for such shorter period that the registrant was required to file such reports), and (2) has been subject to such filing requirements for the past 90 days. ☒ Yes ☐ No
Indicate by check mark whether the registrant has submitted electronically every Interactive Data File required to be submitted pursuant to Rule 405 of Regulation S-T (§232.405 of this chapter) during the preceding 12 months (or for such shorter period that the registrant was required to submit such files). ☒ Yes ☐ No
Indicate by check mark whether the registrant is a large accelerated filer, an accelerated filer, a non-accelerated filer, a smaller reporting company or an emerging growth company. See the definitions of “large accelerated filer,” “accelerated filer,” “smaller reporting company” and “emerging growth company” in Rule 12b-2 of the Exchange Act.
|
Large accelerated filer |
☐ |
|
Accelerated filer |
☒ |
|
|
|
|
|
|
|
Non-accelerated filer |
☐ |
|
Smaller reporting company |
☒ |
|
|
|
|
|
|
|
Emerging growth company |
☐ |
|
|
|
If an emerging growth company, indicate by check mark if the registrant has elected not to use the extended transition period for complying with any new or revised financial accounting standards provided pursuant to Section 13(a) of the Exchange Act. ☐
Indicate by check mark whether the registrant is a shell company (as defined in Rule 12b-2 of the Exchange Act). ☐ Yes ☒ No
The aggregate market value of the registrant’s voting stock held by non-affiliates of the registrant as of June 30, 2019 was $157,302,573
The number of shares of Common Stock, $0.001 par value, outstanding on February 28, 2020 was 14,500,433.
DOCUMENTS INCORPORATED BY REFERENCE
The information required by Part III of this Report is incorporated herein by reference from the registrant’s definitive proxy statement or annual report on Form 10-K/A to be filed with the Securities and Exchange Commission within 120 days after the close of the registrant’s fiscal year.
|
|
|
Page |
|
PART I. |
|
|
|
Item 1. |
3 |
|
|
Item 1A. |
7 |
|
|
Item 1B. |
16 |
|
|
Item 2. |
16 |
|
|
Item 3. |
16 |
|
|
Item 4. |
17 |
|
|
|
|
|
|
PART II. |
|
|
|
Item 5. |
18 |
|
|
Item 6. |
19 |
|
|
Item 7. |
Management’s Discussion and Analysis of Financial Condition and Results of Operations |
20 |
|
Item 7A. |
28 |
|
|
Item 8. |
29 |
|
|
Item 9. |
Changes in and Disagreements with Accountants on Accounting and Financial Disclosure |
56 |
|
Item 9A. |
56 |
|
|
Item 9B. |
56 |
|
|
|
|
|
|
PART III. |
|
|
|
Item 10. |
58 |
|
|
Item 11. |
58 |
|
|
Item 12. |
Security Ownership of Certain Beneficial Owners and Management and Related Stockholder Matters |
58 |
|
Item 13. |
Certain Relationships and Related Transactions, and Director Independence |
58 |
|
Item 14. |
58 |
|
|
|
|
|
|
PART IV. |
|
|
|
Item 15. |
59 |
|
|
Item 16. |
59 |
|
|
|
|
|
|
60 |
||
|
62 |
||
1
Statement Regarding Forward-Looking Disclosures
This Annual Report on Form 10-K (this “Report”) includes, and incorporates by reference, certain forward-looking statements within the meaning of the federal securities laws. Statements that are not historical facts, including statements about our beliefs and expectations, are forward-looking statements. Forward-looking statements include statements preceded by, followed by, or that include the words “may,” “could,” “will,” “would,” “should,” “expect,” “plan,” “anticipate,” “believe,” “estimate,” “intend,” “predict,” “seek,” “contemplate,” “potential,” “continue,” and similar expressions. These forward-looking statements reflect the current expectations of Turtle Beach Corporation concerning future events, and actual results may differ materially from current expectations or historical results. Any such forward-looking statements are subject to various risks and uncertainties, including without limitation those discussed in the sections of this Report entitled “Business Overview,” “Risk Factors,” and “Management’s Discussion and Analysis of Financial Condition and Results of Operations.”
Forward-looking statements are only predictions and are not guarantees of performance. These statements are based on our management’s beliefs and assumptions, which in turn are based on currently available information. Important assumptions relating to the forward-looking statements include, among others, assumptions regarding demand for our products, the expansion of product offerings geographically or through new marketing applications, the timing and cost of planned capital expenditures, competitive conditions, and general economic conditions. These assumptions could prove inaccurate. Forward-looking statements also involve known and unknown risks and uncertainties, which could cause actual results to differ materially from those contained in any forward-looking statement. In addition, even if our actual results are consistent with the forward-looking statements contained in this Report, those results may not be indicative of results or developments in subsequent periods. Many of these factors are beyond our ability to control or predict. Such factors include, but are not limited to, the following:
|
|
• |
Our dependence on the success and availability of third-party platforms and software to drive sales; |
|
|
• |
Transitions in video gaming console platforms and the potential impact on our business; |
|
|
• |
Our ability to adapt to new technologies and introduce new products on a timely basis; |
|
|
• |
The impact of competitive products, technologies and pricing; |
|
|
• |
Continued relationships with our largest customers; |
|
|
• |
The impact of seasonality on our business; |
|
|
• |
Global business, political, operational, financial and economic conditions; |
|
|
• |
Our ability to forecast demand for our products; |
|
|
• |
Manufacturing capacity constraints and difficulties; |
|
|
• |
The scope of protection we are able to establish and maintain for intellectual property rights covering our technology; |
|
|
• |
The availability of capital under our revolving credit facility; |
|
|
• |
Estimates of our future revenues, expenses, capital requirements, and our needs for additional financing; |
|
|
• |
Cybersecurity and other information technology risks; |
|
|
• |
The Company’s partnerships with influencers, athletes and esports teams, |
|
|
• |
Our financial performance; and |
|
|
• |
Other factors discussed under Item 1A - Risk Factors, or elsewhere in this Report. |
Except as required by applicable law, including the securities laws of the United States and the rules and regulations of the Securities and Exchange Commission (“SEC”), we undertake no obligation to publicly update or revise any forward-looking statements after we file this Annual Report on Form 10-K, whether as a result of any new information, future events or otherwise. Investors, potential investors, and other readers are urged to consider the above mentioned factors carefully in evaluating the forward‑looking statements and are cautioned not to place undue reliance on such forward‑looking statements. Although we believe that the expectations, reflected in the forward-looking statements are reasonable, we cannot guarantee future results or performance.
Unless the context indicates otherwise, all references in this Report to “we,” “our,” “us,” “the Company,” and “Turtle Beach” refer to Turtle Beach Corporation and its wholly-owned subsidiaries.
2
Turtle Beach Corporation is a leading gaming audio and accessory brand offering a broad selection of cutting-edge, award-winning gaming headsets for Xbox, PlayStation®, and Nintendo consoles, as well as for PC, Mac®, and mobile/tablet devices. For 45 years, Turtle Beach has been a pioneer and key innovator in audio technology and is one of the most recognized names in console gaming in North America and Europe. In 2019, Turtle Beach acquired ROCCAT, a provider of gaming keyboards, mice and other accessories focused in the personal computer (“PC”) peripherals market.
Turtle Beach, headquartered in San Diego, California, was incorporated in the state of Nevada in 2010 and the Company’s stock is traded on the Nasdaq Global Market under the symbol HEAR.
VTB Holdings, Inc. (“VTBH”), a wholly-owned subsidiary of Turtle Beach and the owner of Voyetra Turtle Beach, Inc. (“VTB”), was incorporated in the state of Delaware in 2010. VTB, the owner of Turtle Beach Europe Limited (“TB Europe”), was incorporated in the state of Delaware in 1975 with operations principally located in Valhalla, New York.
Gaming Accessories Business
Turtle Beach launched its first gaming headset – the X51 - in 2005 and has become the leading brand in gaming headsets. The Company designs and markets a large assortment of audio peripherals for Xbox, PlayStation®, and Nintendo consoles, as well as for PC, Mac®, and mobile/tablet devices. The acquisition of the ROCCAT brand expands Turtle Beach’s overall portfolio significantly with over 50 core models across console gaming headsets, PC gaming headsets, PC gaming keyboards, PC gaming mice and other accessories. These products are distributed internationally in North America, South America, Europe, the Middle East, Africa, Australia, and Asia. Turtle Beach products are sold at thousands of storefronts, including major retailers such as Amazon, Argos, Best Buy, GAME, GameStop, EB Games, Media Markt, Saturn, Target and Walmart.
Turtle Beach delivers a wide variety of headsets spanning multiple price points ranging from $20 to $250, with many headsets compatible across all major gaming platforms. We believe the price tiers correspond to customer profiles, beginning with entry-level gamers and progressing through casual, enthusiast, core, and professional esports gamers. Each successive price tier incorporates higher level features, comfort, and finish. For example, premium headset models typically include features like large 50mm speakers, leather-wrapped headbands and ear cushions, memory foam, powerful amplified surround sound, active noise-cancellation, and Bluetooth® connectivity. Additional features include audio presets like Bass Boost and Turtle Beach’s exclusive Superhuman Hearing® sound setting (which may give players a competitive advantage), removable or flip-to-mute microphones, Turtle Beach’s proprietary ProSpecs™ glasses-friendly design, and rechargeable long-lasting batteries.
As gaming consoles have evolved from dedicated video game platforms to home entertainment hubs, and as mobile and tablet devices have become popular entertainment platforms, Turtle Beach has continued to evolve its product lineup to reflect how content is consumed. While each Turtle Beach headset is designed for a primary platform, such as a specific console or PC, nearly all can be used with multiple platforms, and most are compatible with mobile/tablet devices through a standard 3.5mm jack or Bluetooth® connectivity. This primary platform designation, paired with readily identifiable platform-specific packaging designs, often results in Turtle Beach products being displayed in multiple in-store sections by retailers, increasing the prominence of the Turtle Beach brand and its products in physical retail locations and online. Brick and mortar retailers often have kiosks that allow shoppers to try the headsets and experience each headset’s specific fit, feel, and overall audio quality.
In 2019, Turtle Beach was the leading console gaming headset manufacturer in North America with a 43.4% dollar share of the market, as noted in The NPD Group’s retail tracking service, holding seven of the top 10 selling Xbox One models and five of the top 10 selling PlayStation®4 models by revenue. Turtle Beach’s console market share in the UK was 41.3% in 2019 as reported by GfK Global. We believe the Company has achieved these high global market shares by delivering high-quality products that often include first-to-market innovations and robust features, in addition to superior sound and unmatched comfort - key factors that consumers look for when shopping for a gaming headset.
Industry Overview
Gaming Headset Market
Gaming headsets are part of a growing global software and accessories gaming market sized at approximately $152 billion. The global gaming audience now exceeds global cinema and music markets with over 2.5 billion active gamers worldwide. Gaming peripherals, such as headsets, are a $4.1 billion business globally with over 65% of that market in the Americas and Europe where the Company’s business is focused. Gaming headsets represent more than a $2.7 billion global market, or more than 60% of the total gaming peripherals market.
Competitive esports is a global phenomenon where professional gamers train and compete to win prize money, partner with major brands, and attract/gain dedicated fans – similar to traditional professional sports. There were approximately 443 million esports viewers in 2019, and that is expected to surge to roughly 495 million viewers by 2020 (11.7% YOY), according to a report from Newzoo. Of those 495 million projected viewers, 272 million will identify as “occasional viewers” and 223 million will consider themselves “esports enthusiasts”. We believe a quality gaming headset is a must-have piece of equipment for any competitive gamer.
3
Many gamers play online where a gaming headset (which typically includes a microphone allowing players to communicate in real-time) provides a more immersive experience in the industry’s most popular games and franchises.
Xbox and PlayStation® consoles are still the dominant gaming platforms in North America and Europe, however, Nintendo’s Switch™ console continues to perform well two years into its lifecycle. In addition to consoles, personal computers are a popular gaming platform where players utilize a similar style headset. Gaming on mobile/tablet devices represents about a third of the global gaming market, and while headsets can be used for mobile gaming, console and PC gaming are by far the largest drivers of gaming headset use.
Historically, Microsoft and Sony have gone through cycles where their respective console platform is changed significantly or updated to a new version. When Microsoft and Sony launched Pro versions of their existing console platforms in 2016 and 2017, respectively, that did not result in the same levels of disruption as previous cycles in the gaming headset business. Turtle Beach believes this is a good indication that any potential future console transitions will not be as disruptive. In 2019, Microsoft and Sony confirmed plans to release their next generation consoles, Xbox Series X and PlayStation®5, respectively, in late 2020. Further, industry guidance suggests that with the launch of the new systems, and continued sales of the current consoles, combined console hardware sales will set records in 2021 and 2022.
In 2019, the Nintendo Switch™ completed its second full year in the market with more than 52 million units sold through the end of December 2019, during which there has been an expanding library of games and an increased number of multiplayer chat-enabled games. In addition, Nintendo launched a follow-on product, the Nintendo Switch™ Lite, which is the handheld-only version of their popular gaming console.
In addition to console sales, we believe the Xbox, PlayStation®, Nintendo, and PC gaming markets are driven by major game launches and franchises that encourage players to buy equipment and accessories. On Xbox and PlayStation®, flagship games like Call of Duty®, Destiny, Star Wars: Battlefront, Battlefield, Grand Theft Auto, and battle royale games like Fortnite, Apex Legends and PlayerUnknown’s Battlegrounds, are examples of major franchises that prominently feature online multiplayer modes which encourage communication and tend to drive increased gaming headset sales. Many of these established franchises launch new titles annually leading into the holidays and as a result, the gaming headset business tends to be highly seasonal, often with approximately 36%- 43% of sales occurring primarily in the fourth quarter.
PC Accessories Market
PC gaming in the U.S. has seen a resurgence in popularity the past few years while it continues to be a main gaming platform internationally, driven by big AAA game launches, PC-specific esports leagues, teams and players, content creators and influencers, cross-platform play, and more. While most games are available on multiple platforms, gaming on PC offers advantages including improved graphics, the increased speed and precision of mouse/keyboard controls, and more. Gaming mice and keyboards are engineered to provide gamers with higher-end performance and a superior gaming experience through benefits including faster response times, improved materials and build quality, programmable buttons and keys, software suites to customize and control devices and settings, and more.
PC gaming mice come in a variety of different ergonomic shapes and sizes, are available in both wired and wireless models, offer options for different sensors (optical and laser) and responsiveness, and often feature integrated RGB lighting and software to unify with the lighting on other devices for a visually pleasing PC gaming appearance. Similarly, PC gaming keyboards deliver a competitive advantage by registering keystrokes faster than others, offer options for mechanical key switches that feel and sound different, and utilize customizable lighting. The $2.7 billion market for PC gaming headsets, mice and keyboards grew at 7% in 2019 and is forecasted to grow by another 10% in 2020.
Business Strategy
We intend to further build upon Turtle Beach’s brand awareness, superior audio technology and high-quality products, as well as further promote and expand the ROCCAT brand in certain geographic regions to increase sales and profitability. The Company's strategy focuses on the following:
|
• |
Continue to Advance Our Turtle Beach Brand. We believe that our brand’s image among consumers is a competitive advantage, and that our success is attributable to our emphasis on delivering the highest quality, most innovative headsets. |
To maintain our competitive position in our markets we are focused on the following:
|
|
• |
continuing to deliver innovative, high quality gaming headsets that incorporate advanced audio and wireless technology, while providing a superior game and chat audio experience and unmatched comfort; |
|
|
• |
continuing to maintain our position at retail with products available in more locations throughout retailers, including on demo kiosks where consumers can experience the products first-hand, |
|
|
• |
maintaining our strategic relationships, and continuing investment in sponsorships, which we believe provide our brand a larger presence with consumers and creates opportunities for retailers to carry our products; and |
|
|
• |
leveraging high-quality technical support and customer service to exceed consumer expectations and develop brand loyalty. |
4
|
• |
Grow Revenue in New Markets. We intend to increase our sales by continuing to develop internally, or through potential joint venture, partnership or acquisition, products that we offer to our customers with an enhanced focus on growth in the personal computer gaming market. |
Intellectual Property
We operate in an industry where innovation, investment in new ideas, and protection of resulting intellectual property rights are critical to success. We have a substantial base of intellectual property assets to protect our current and future product development, such as key innovations in gaming headsets, and intend to vigorously enforce such rights.
As a third-party gaming headset and peripherals company, certain technology used in the new generation of consoles requires a license to enable products to connect to that platform. While Playstation®4 does not require any license to produce headsets that can connect, certain connections on the Xbox One require the purchase of proprietary chips to integrate into the locked chat audio. The Company currently has the necessary licenses, or can obtain the necessary licenses, to produce compatible products.
Supply Chain and Operations
We have a global network of suppliers that manufacture products to meet our quality standards and cost objectives sought by our customers. We have worked closely with component, manufacturing and global logistic partners to build a supply chain that we consider predictable, scalable and consistent to provide high-quality, reliable products and leading cost management practices. The use of outsourced manufacturing facilities is designed to take advantage of specific expertise and allow for flexibility and scalability to respond to both seasonality and changing demands for our products.
We believe we have solid relationships with our suppliers and that, subject to the discussion in “Risk Factors” and “Management’s Discussion and Analysis of Financial Condition and Results of Operations - Liquidity and Capital Resources,” we will continue to have a sufficient supply of quality products on satisfactory terms.
Retail Distribution
Our products are sold in over 40 countries by retailers such as Amazon, Argos, Best Buy, GAME, GameStop, EB Games, Media Markt, Saturn, Target and Walmart. We often have a broader assortment and more shelf space than competitors at video game and electronics retailers such as Best Buy and GameStop, which we believe reinforces the brand’s authenticity with gaming enthusiasts, and our presence in mass channel retailers such as Walmart and Target enables the brand to reach a wider audience of casual gamers. Our established presence on Amazon and other online retail sites, and positive consumer product ratings on those sites, increases the search visibility of our products and helps to influence both online and in-store sales.
TB Europe serves as a primary sales office for the European market and has strengthened our international operations with support for sales, marketing, customer service and distribution.
Our websites, TurtleBeach.com and ROCCAT.org, are important focal point for our marketing efforts, serving as a destination for paid and earned media. Earned media is favorable publicity gained through promotional efforts other than advertising, as compared with paid media, which refers to publicity gained through advertising. The website acts as a hub for both online and offline activity and provides a direct sales channel for new and refurbished products.
Customers
Our business customer base is comprised primarily of large retailers and distributors, both domestic and international. In 2019, net sales to our major market channels consisted of $146.7 million to North American retail customers, $60.6 million to European customers, $12.3 million to North American distributors and $15.1 million to other customers.
Our five largest individual customers accounted for approximately 62% of our gross sales in 2019, 64% of our gross sales in 2018, and 59% of our gross sales in 2017. During 2019, our three largest customers - Walmart, Game Stop, Target - each accounted for between 10% to 20% of our consolidated net sales.
5
Our business is seasonal with a significant portion of sales and profits typically occurring around the holiday period. Historically, more than 45% of headset business revenues are generated during the period from September through December as new headsets are introduced and consumers engage in holiday shopping. In addition, launches of major new online multiplayer games, and specific retailer purchasing behavior, can drive significant revenue shifts between months and quarters in a given year.
Employees
As of December 31, 2019, Turtle Beach had 245 employees, of which 213 were full-time salaried employees. None of our employees are represented by a labor union. We believe that our relationship with our employees is good.
Available Information
We make available free of charge on or through our website, http://corp.turtlebeach.com, our Annual Report on Form 10-K, Quarterly Reports on Form 10-Q, Current Reports on Form 8-K, proxy statements, and all amendments to those filings as soon as reasonably practicable after such material is electronically filed with, or furnished to, the Securities and Exchange Commission (“SEC”). Information contained on our website is not incorporated by reference unless specifically stated therein.
In addition, the SEC maintains a website that contains reports, proxy statements, and other information about issuers, such as Turtle Beach, who file electronically within the SEC. The address of the website is www.sec.gov.
6
Set forth below is a summary of certain material risks related to an investment in our securities, which should be considered carefully in evaluating such an investment. Our business, financial condition, operating results and cash flows can be affected by a number of factors, whether currently known or unknown, including but not limited to those described below, any one or more of which could, directly or indirectly, cause the Company’s actual results of operations and financial condition to vary materially from past, or from anticipated future, results of operations and financial condition. Any of these factors, in whole or in part, could materially and adversely affect the Company’s business, financial condition, results of operations, cash flows and common stock price. Additional risks and uncertainties not presently known to us or that we currently consider immaterial may also impair our business operations.
Because of the following factors, as well as other factors affecting the Company’s financial condition and operating results, past financial performance should not be considered to be a reliable indicator of future performance, and investors should not use historical trends to anticipate results or trends in future periods. Please also see “Statement Regarding Forward-Looking Disclosures” in the section immediately preceding Item 1 of this Report.
Risks Related to Our Operations
We depend upon the success and availability of third-party gaming platforms and release of certain game titles to drive sales of our headset products.
The performance of our headset business is affected by the continued success of third-party gaming platforms, such as Microsoft's Xbox consoles and Sony's PlayStation® consoles, as well as video games developed by such manufacturers and other third-party publishers. Our business could suffer if any of these parties fail to continue to drive the success of these platforms, develop new or enhanced videogame platforms, develop popular game and entertainment titles for current or future generation platforms or produce and timely release sufficient quantities of such consoles. Further, if a platform is withdrawn from the market or fails to sell, we may be forced to liquidate inventories relating to that platform or accept returns resulting in significant losses.
In 2018, the battle royale genre, such as Fortnite, Apex Legends and PlayerUnknown's Battlegrounds, expanded gaming markets and increased demand for our headset products. If console and personal computer game titles that are enhanced by the use of gaming headsets decline in number, popularity, or are delayed, our revenue and profits may decrease substantially and our business may be adversely affected.
Our brands face significant competition from other consumer electronics companies and this competition could have a material adverse effect on our financial condition and results of operations.
We compete with other producers of video game accessories, including the video game console manufacturers. Our competitors may spend more money and time on developing and testing products, undertake more extensive marketing campaigns, adopt more aggressive pricing policies, pay higher fees to licensors for motion picture, television, sports, music and character properties, or develop more commercially successful products for the personal computer or video game platforms than we do. In addition, competitors with large product lines and popular products, in particular the video game console manufacturers, typically have greater leverage with retailers, distributors and other customers, who may be willing to promote products with less consumer appeal in return for access to those competitors’ more popular products.
In the event that a competitor reduces prices, we could be forced to respond by lowering our prices to remain competitive. If we are forced to lower prices, we may be required to “price protect” products that remain unsold in our customers’ inventories at the time of the price reduction. Price protection results in our issuing a credit to our customers in the amount of the price reduction for each unsold unit in that customer’s inventory. Our price protection policies, which are customary in the industry, can have a major impact on our sales and profitability.
In addition, if console manufacturers implement new technologies, through hardware or software, which would cause our headsets to become incompatible with that hardware manufacturer’s console, there could be unanticipated delays in the release of our products as well as increases to projected development, manufacturing, marketing or distribution costs, any of which could harm our business and financial results.
Further, new and emerging technologies and alternate platforms for gaming, such as mobile devices and virtual reality devices, could make the consoles for which our headsets are designed less attractive or, in time, obsolete, which could require us to transition our business model such as develop products for other gaming platforms.
7
The industries in which we operate are subject to competition in an environment of rapid technological change, and if we do not adapt to, and appropriately allocate our resources among, emerging technologies, our revenues could be negatively affected.
We must make substantial product development and other investments to align our product portfolio and development efforts in response to market changes in the gaming industry. We must anticipate and adapt our products to emerging technologies in order to keep those products competitive. When we choose to incorporate a new technology into our products or to develop a product for a new platform or operating system, we are often required to make a substantial investment prior to the introduction of the product. If we invest in the development of a new technology or for a new platform that does not achieve significant commercial success, our revenues from those products likely will be lower than anticipated and may not cover our costs.
Further, our competitors may adapt to an emerging technology more quickly or effectively than we do, creating products that are technologically superior to ours, more appealing to consumers, or both. If, on the other hand, we elect not to pursue the development of products incorporating a new technology or for new platforms that achieve significant commercial success, our revenues could also be adversely affected. It may take significant time and resources to shift product development resources to that technology or platform and it may be more difficult to compete against existing products incorporating that technology or for that platform. Any failure to successfully adapt to, and appropriately allocate resources among, emerging technologies could harm our competitive position, reduce our share and significantly increase the time it takes us to bring popular products to market.
There are numerous steps required to develop a product from conception to commercial introduction and to ensure timely shipment to retail customers, including designing, sourcing and testing the electronic components, receiving approval of hardware and other third-party licensors, factory availability and manufacturing and designing the graphics and packaging. Any difficulties or delays in the product development process will likely result in delays in the contemplated product introduction schedule. It is common in new product introductions or product updates to encounter technical and other difficulties affecting manufacturing efficiency and, at times, the ability to manufacture the product at all. Although these difficulties can be corrected or improved over time with continued manufacturing experience and engineering efforts, if one or more aspects necessary for the introduction of products are not completed as scheduled, or if technical difficulties take longer than anticipated to overcome, the product introductions will be delayed, or in some cases may be terminated. No assurances can be given that our products will be introduced in a timely fashion, and if new products are delayed, our sales and revenue growth may be limited or impaired.
Our business could be adversely affected by actions on trade by domestic and foreign governments.
The U.S. government has altered its approach to international trade policy and in some cases renegotiated, or terminated, certain existing bilateral or multi-lateral trade agreements and treaties with foreign countries, including the North American Free Trade Agreement (“NAFTA”). In addition, the U.S. government has initiated or is considering imposing tariffs on certain foreign goods, including consumer goods. Related to this action, certain foreign governments, including China, have instituted or are considering imposing tariffs on certain U.S. goods. It remains unclear what the U.S. Administration or foreign governments will or will not do with respect to tariffs, NAFTA or other international trade agreements and policies. A trade war or other governmental action related to tariffs or international trade agreements or policies has the potential to adversely impact demand for our products, our costs, customers, suppliers and/or the U.S. economy or certain sectors thereof and, thus, to adversely impact our businesses. The majority of our production occurs in foreign jurisdictions, including China, and while the majority of our products are currently not subject to tariffs. While we are exploring a shift of some of our manufacturing partners to jurisdictions that are not subject to U.S. tariffs, delays related to such transitions or changes in the U.S. tariffs could have a negative impact on our results of operations and competitive position.
Our business could be adversely affected by significant movements in foreign currency exchange rates.
We are exposed to fluctuations in foreign currency transaction exchange rates, particularly with respect to the Euro and British Pound. Any significant change in the value of currencies of the countries in which we do business relative to the value of the U.S. dollar could affect our ability to sell products competitively and control our cost structure. Additionally, we are subject to foreign exchange translation risk due to changes in the value of foreign currencies in relation to our reporting currency, the U.S. dollar. The translation risk is primarily concentrated in the exchange rate between the U.S. dollar and the British Pound. As the U.S. dollar fluctuates against other currencies in which we transact business, revenue and income can be impacted.
A significant portion of our revenue is derived from a few large customers, and the loss of any such customer, or a significant reduction in purchases by such customer, could have a material adverse effect on our business, financial condition and results of operations.
During 2019, our three largest individual customers accounted for approximately 42% of our gross sales in the aggregate. The loss of, or financial difficulties experienced by, any of these or any of our other significant customers, including as a result of the bankruptcy of a customer, could have a material adverse effect on our business, results of operations, financial condition and liquidity. We do not have long-term agreements with these or other significant customers and our agreements with these customers do not require them to purchase any specific amount of products. All of our customers generally purchase from us on a purchase order basis. As a result, agreements with respect to pricing, returns, cooperative advertising or special promotions, among other things, are subject to periodic negotiation with each customer. No assurance can be given that these or other customers will continue to do business with us or that they will maintain their historical levels of business. In addition, the uncertainty of product orders can make it difficult to forecast our sales and allocate our resources in a manner consistent with actual sales, and our expense levels are based in part on our expectations of future sales. If our expectations regarding future sales are inaccurate, we may be unable to reduce costs in a timely manner to adjust for sales shortfalls. In addition, financial difficulties experienced by a significant customer could increase our exposure to uncollectible receivables and the risk that losses from uncollected receivables exceed the reserves we have set aside in anticipation of this risk or limit our ability to continue to do business with such customers.
8
The manufacture, supply and shipment of our products are dependent upon a limited number of third parties, and our success is dependent upon the ability of these parties to manufacture, supply and ship sufficient quantities of their product components to us in a timely fashion, as well as the continued viability and financial stability of these third-parties.
Because we rely on a limited number of manufacturers and suppliers for our products, we may be materially and adversely affected by the failure of any of those manufacturers and suppliers to perform as expected or supply us with sufficient quantities of their product components to ensure consumer availability of our own products. Our manufacturers and suppliers’ ability to supply products to us is also subject to a number of risks, including the availability of raw materials, their financial instability, the destruction of their facilities, epidemics or work stoppages. Any shortage of raw materials or components or an inability to control costs associated with manufacturing could increase our costs or impair our ability to ship orders in a timely and cost-efficient manner. As a result, we could experience cancellations of orders, refusal to accept deliveries or a reduction in our prices and margins, any of which could harm our financial performance and results of operations.
Recently, the outbreak of the coronavirus disease has led to work and travel restrictions within, to, and out of mainland China and parts of Asia, which in turn has led to factory closures, interruptions in supply chains, increased regulation and workforce shortages. These issues, which may expand depending on the progression of the illness, may make it difficult for our suppliers and manufacturers, especially in Asia, to source raw materials or components, manufacture finished goods and export our products. If the severity and reach of the coronavirus outbreak increases, there may be significant and material disruptions to our supply chain and operations, and delays in the manufacture and shipment of our products, which may then have a material adverse effect on our results of operations.
Moreover, there can be no assurance that such manufacturers and suppliers will not refuse to supply us at prices we deem acceptable, independently market their own competing products in the future, or otherwise discontinue their relationships with us. Our failure to maintain these existing manufacturing and supplier relationships, or to establish new relationships on similar terms in the future, could have a material adverse effect on our business, results of operations, financial condition and liquidity.
In particular, certain of our products have a number of components and subassemblies produced by outside suppliers. In addition, for certain of these items, we qualify only a single source of supply with long lead times, which can magnify the risk of shortages or result in excess supply and also decreases our ability to negotiate price with our suppliers. Also, if we experience quality problems with suppliers, then our production schedules could be significantly delayed or costs significantly increased, which could have an adverse effect on our business, liquidity, results of operation and financial position.
In addition, the ongoing effectiveness of our supply chain is dependent on the timely performance of services by third parties shipping products and materials to and from our warehouse facilities and other locations. If we encounter problems with these shipments, our ability to meet retailer expectations, manage inventory, complete sales and achieve objectives for operating efficiencies could be materially adversely affected and we may be required to incur material additional costs for expedited shipping, including air freight. We have experienced some of these problems in the past and we cannot assure you that we will not experience similar problems in the future.
Our net sales and operating income fluctuate on a seasonal basis and decreases in sales or margins during peak seasons could have a disproportionate effect on our overall financial condition and results of operations.
Historically, a majority of our annual revenues have been generated during the holiday season of September to December. If we do not accurately forecast demand for particular products, we could incur additional costs or experience manufacturing delays. Any shortfall in net sales during this period would cause our annual results of operations to suffer significantly.
Demand for our products depends on many factors such as consumer preferences and the introduction or adoption of game platforms and related content and can be difficult to forecast. If we misjudge the demand for our products, we could face the following problems in our operations, each of which could harm our operating results:
|
|
• |
If our forecasts of demand for products are too high, we may accumulate excess inventories of products, which could lead to markdown allowances or write-offs affecting some or all of such excess inventories. We may also have to adjust the prices of our existing products to reduce such excess inventories; |
|
|
• |
If demand for specific products increases beyond what we forecast, our suppliers and third-party manufacturers may not be able to increase production quickly enough to meet the demand. Our failure to meet market demand may lead to missed opportunities to increase our base of gamers, damage our relationships with retailers or harm our business; |
|
|
• |
The on-going console transition increases the likelihood that we could fail to accurately forecast demand for our new generation console headsets and our existing headsets; and |
|
|
• |
Rapid increases in production levels to meet unanticipated demand could result in increased manufacturing errors, as well as higher component, manufacturing and shipping costs, all of which could reduce our profit margins and harm our relationships with retailers and consumers. |
If we are unable to continue to develop innovative and popular products, or if our design and marketing efforts do not effectively raise the recognition and reputation of our brands, we may not be able to successfully implement our gaming accessory growth strategy.
We believe that our ability to extend the recognition and favorable perception of our Turtle Beach brand, and the recently acquired ROCCAT brand, is critical to implement our gaming accessory growth strategy, which includes further establishing our position in existing gaming headsets, developing a strong position in new console headsets, expanding beyond existing console, PC and mobile applications to new technology applications, accelerating our international growth and expanding complementary product categories. To extend the reach of our Turtle Beach brand, we believe we must devote significant time and resources to product design, marketing and promotions. These expenditures, however, may not result in a sufficient increase in net sales to cover such costs.
9
Transitions in console platforms may adversely affect our headset products.
When new console platforms are announced or introduced into the market, consumers have historically reduced their purchases of game console peripherals and accessories, including headsets, for old generation console platforms in anticipation of new platforms becoming available. During these console transition periods, sales of gaming console headsets related to old generation consoles slow or decline until new platforms are introduced and achieve wide consumer acceptance, which we cannot guarantee. This decrease or decline may not be offset by increased sales of products for the new console platforms. Over time as the old generation platform user base declines, products for the old platforms are typically discontinued which can result in lower margins, excess inventory, excess parts, or similar costs related to end of life of a product model. In addition, as a third party gaming headset company, we are reliant on working with the console manufacturers for our headsets to be compatible with any new console platforms, which if not done on a timely basis may adversely affect sales. Sony and Microsoft may make changes to their platforms that impact how headsets connect with or work with the new consoles which could create a disruption to consumer buying behavior and/or product life-cycles, including if such new consoles are delayed or introduced with limited functionality or compatibility with third party accessories.
As console hardware moves through its life cycle, hardware manufacturers typically enact price reductions, and decreasing prices may put downward pressure on prices for products for such platforms. During platform transitions, we may simultaneously incur costs both in continuing to develop and market new products for prior-generation video game platforms, which may not sell at premium prices, and also in developing products for current-generation platforms, which will not generate immediate or near-term revenue. As a result, our operating results during platform transitions are more volatile and difficult to predict than during other times.
Further, technological and other developments may in the future accelerate the frequency of such console transitions resulting in such disruption occurring more frequently. In addition, competing technologies such as tablet-based gaming and virtual reality may result in further disruption to the overall console gaming market.
Any acquisitions we pursue could disrupt our business and harm our financial condition and results of operations.
As part of our business strategy, we review and intend to continue to review acquisition opportunities that we believe would be advantageous or complementary to the development of our business. During the second quarter of 2019, we acquired certain assets of ROCCAT GmbH and its subsidiaries, and we may acquire additional businesses, assets, or technologies in the future. If we make any acquisitions, we could take any or all of the following actions, any one of which could adversely affect our business, financial condition, results of operations or share price:
|
|
• |
use a significant portion of our available cash; |
|
|
• |
require a significant devotion of management’s time and resources in the pursuit or consummation of any acquisition; |
|
|
• |
incur debt, which may not be available to us on favorable terms and may adversely affect our liquidity; |
|
|
• |
issue equity or equity-based securities that would dilute existing stockholders’ ownership percentage; |
|
|
• |
assume contingent and other liabilities; and |
|
|
• |
take charges in connection with such acquisitions. |
Acquisitions also entail numerous other risks, including, without limitation: difficulties in assimilating acquired operations, products, technologies and personnel; unanticipated costs; diversion of management’s attention from existing operations; risks of entering markets in which we have limited or no prior experience; regulatory approvals; unanticipated costs or liabilities; and potential loss of key employees from either our existing business or the acquired organization. Acquisitions may result in accounting charges for restructuring and other expenses, amortization of purchased technology and intangible assets and stock-based compensation expense, any of which could materially and adversely affect our operating results. We may not be able to realize the anticipated synergies, innovation, operational efficiencies, benefits of or successfully integrate with our existing business the businesses, products, technologies or personnel that we acquire, and our failure to do so could harm our business and operating results.
Turtle Beach relies on its partnerships with influencers, athletes and esports teams to expand our market. If we fail to maintain and expand these types of relationships, our business may suffer.
Relationships with new and established influencers, athletes and esports teams have been, and will continue to be critical to our future success. We rely on these partners to assist us in generating increased acceptance and use of our product offerings. We have established a number of these relationships, and our growth depends on establishing new relationships and maintaining existing ones. Certain partners may not view their relationships with us as significant to their own businesses, and they may reassess their commitment to us or decide to compete directly with us in the future. We cannot guarantee that any partner will perform their obligations as agreed or that we would be able to specifically enforce any agreement with them. Our failure to maintain and expand these relationships may adversely impact our future revenue.
10
The decision by British voters to exit the European Union may negatively impact our operations.
The changes to the trading relationship between the U.K and European Union resulting from the U.K’s exit from the European Union (“Brexit”) will likely result in increased cost of goods imported into and exported from the U.K. and may decrease the profitability of our U.K. and other European operations. Additional currency volatility could drive a weaker British pound, which increases the cost of goods imported into our U.K. operations and may decrease the profitability of our U.K. operations. A weaker British pound versus the Euro and U.S. dollar also causes local currency results of our U.K. operations to be translated into fewer U.S. dollars during a reporting period. With a range of outcomes still possible, the impact from Brexit remains uncertain and will depend, in part, on the final outcome of tariff, trade, regulatory and other negotiations.
Loss of our key management and other personnel could impact our business.
Our future success depends largely upon the continued service of our executive officers and other key management and technical personnel and on our ability to continue to attract, retain and motivate qualified personnel. In addition, competition for skilled and non-skilled employees among companies like ours is intense, and the loss of skilled or non-skilled employees or an inability to attract, retain and motivate additional skilled and non-skilled employees required for the operation and expansion of our business could hinder our ability to conduct research activities successfully, develop new products, attract customers and meet customer shipments.
If we are unable to protect our information systems against service interruption, misappropriation of data or breaches of security, our operations could be disrupted, our reputation may be damaged, and we may be financially liable for damages.
We rely heavily on information systems to manage our operations, including a full range of retail, financial, sourcing and merchandising systems. We regularly make investments to upgrade, enhance or replace these systems, as well as leverage new technologies to support our growth strategies. In addition, we have implemented enterprise-wide initiatives that are intended to standardize business processes and optimize performance. Any delays or difficulties in transitioning to new systems or integrating them with current systems or the failure to implement our initiatives in an orderly and timely fashion could result in additional investment of time and resources, which could impair our ability to improve existing operations and support future growth, and ultimately have a material adverse effect on our business.
The reliability and capacity of our information systems are critical. Despite preventative efforts, our systems are vulnerable to damage or interruption from, among other things, natural disasters, technical malfunctions, inadequate systems capacity, human error, power outages, computer viruses and security breaches. Any disruptions affecting our information systems could have a material adverse impact on our business. In addition, any failure to maintain adequate system security controls to protect our computer assets and sensitive data, including associate and client data, from unauthorized access, disclosure or use could damage our reputation with our associates and our clients, exposing us to financial liability, legal proceedings (such as class action lawsuits), and regulatory action. While we have implemented measures to prevent security breaches and cyber incidents, our preventative measures and incident response efforts may not be entirely effective. As a result, we may not be able to immediately detect any security breaches, which may increase the losses that we would suffer. Finally, our ability to continue to operate our business without significant interruption in the event of a disaster or other disruption depends, in part, on the ability of our information systems to operate in accordance with our disaster recovery and business continuity plans.
Our reliance on information systems and other technology also gives rise to cybersecurity risks, including security breach, espionage, system disruption, theft and inadvertent release of information. The occurrence of any of these events could compromise our networks, and the information stored there could be accessed, publicly disclosed, lost or stolen. Any such access, disclosure or other loss of information could result in legal claims or proceedings, liability or regulatory penalties under laws protecting the privacy of personal information, disrupt operations, and damage our reputation, which could adversely affect our business. In addition, as security threats continue to evolve we may need to invest additional resources to protect the security of our systems.
Our results of operations and financial condition may be adversely affected by global business, political, operational, financial and economic conditions.
We face business, political, operational, financial and economic risks inherent in international business, many of which are beyond our control, including:
|
|
• |
trade restrictions, higher tariffs, currency fluctuations or the imposition of additional regulations relating to import or export of our products, especially in China, where many of our Turtle Beach products are manufactured, which could force us to seek alternate manufacturing sources or increase our costs; |
|
|
• |
difficulties obtaining domestic and foreign export, import and other governmental approvals, permits and licenses, and compliance with foreign laws, which could halt, interrupt or delay our operations if we cannot obtain such approvals, permits and licenses; |
|
|
• |
difficulties encountered by our international distributors or us in staffing and managing foreign operations or international sales, including higher labor costs; |
|
|
• |
transportation delays and difficulties of managing international distribution channels; |
|
|
• |
longer payment cycles for, and greater difficulty collecting, accounts receivable; |
|
|
• |
political and economic instability, including wars, terrorism, political unrest, boycotts, curtailment of trade and other business restrictions, any of which could materially and adversely affect our net sales and results of operations; |
|
|
• |
the impact of a global epidemic of disease on consumer retail markets and manufacturing; and |
|
|
• |
natural disasters. |
11
Any of these factors could reduce our net sales, decrease our gross margins, increase our expenses or reduce our profitability. Should we establish our own operations in international territories where we currently utilize a distributor, we will become subject to greater risks associated with operating outside of the United States.
The electronics industry in general has historically been characterized by a high degree of volatility and is subject to substantial and unpredictable variations resulting from changing business cycles. Our operating results will be subject to fluctuations based on general economic conditions, and in particular conditions that impact discretionary consumer spending. The audio products sector of the electronics industry has and may continue to experience a slowdown in sales, which adversely impacts our ability to generate revenues and impacts the results of our future operations. A lack of available credit in financial markets may adversely affect the ability of our commercial customers to finance purchases and operations and could result in an absence of orders or spending for our products as well as create supplier disruptions. We are unable to predict the likely duration and severity of any adverse economic conditions and disruptions in financial markets and the effects they will have on our business and its financial condition.
Further, certain Turtle Beach products are manufactured in China for export to the United States and worldwide. As a result of opposition to policies of the Chinese government and China’s growing trade surpluses with the United States, there has been, and in the future may be, opposition to the extension of normal trade relations (“NTR”) status for China. The loss of NTR status for China, further changes in tariff structures or adoption in the United States of other trade policies adverse to China could increase our manufacturing expenses and make it more difficult for us to manufacture our products in China.
If we fail to maintain an effective system of internal controls, we may not be able to accurately report financial results or prevent fraud, which could have an adverse effect on our business and financial condition.
Effective internal controls are necessary to provide reliable financial reports and to assist in the effective prevention of fraud. Any inability to provide reliable financial reports or prevent fraud could harm our business. The Sarbanes-Oxley Act requires, among other things, that we evaluate our systems and processes and test our internal controls over financial reporting to allow management and our independent registered public accounting firm, as applicable, to report on the effectiveness of our internal control over financial reporting. We have reported the remediation of a material weakness related to the review of material non-routine transactions or events disclosed in our 2018 Annual Report on Form 10-K. In the future, if we are not able to remediate any identified material weakness or otherwise comply with the requirements of Section 404 of the Sarbanes-Oxley Act, or if we or our independent registered public accounting firm identifies deficiencies in our internal control over financial reporting that are deemed to be material weaknesses, investors could lose confidence in the accuracy and completeness of our financial reports, the market price of our common stock could decline and we could be subject to sanctions, investigations by the Nasdaq Stock Market, LLC, the SEC or other regulatory authorities, or shareholder litigation.
In addition, failure to maintain effective internal controls could result in financial statements that do not accurately reflect our financial condition or results of operations. There can be no assurance that we will be able to maintain a system of internal controls that fully complies with the requirements of the Sarbanes-Oxley Act of 2002 or that our management and independent registered public accounting firm will continue to conclude that our internal controls are effective.
Risks Related to our Intellectual Property and other Legal and Regulatory Matters
Our competitive position will be adversely damaged if our products are found to infringe on the intellectual property rights of others.
Other companies and our competitors may currently own or obtain patents or other proprietary rights that might prevent, limit or interfere with our ability to make, use or sell our products. Although we do not believe that our products infringe the proprietary rights of any third parties, there can be no assurance that infringement or other legal claims will not be asserted against us or that we will not be found to infringe the intellectual property rights of others. The electronics industry is characterized by vigorous protection and pursuit of intellectual property rights or positions, resulting in significant and often protracted and expensive litigation. In the event of a successful claim of infringement against us and our failure or inability to license the infringed technology, our business and operating results could be adversely affected. Any litigation or claims, whether or not valid, could result in substantial costs or a diversion of our resources. An adverse result from intellectual property litigation could force us to do one or more of the following:
|
|
• |
cease selling, incorporating or using products or services that incorporate the challenged intellectual property; |
|
|
• |
obtain a license from the holder of the infringed intellectual property right, which license may not be available on reasonable terms, if at all; and/or |
|
|
• |
redesign products or services that incorporate the disputed technology. |
If we are forced to take any of the foregoing actions, we could face substantial costs and shipment delays and our business could be seriously harmed. Although we carry general liability insurance, our insurance may not cover potential claims of this type or may be inadequate to insure us for all liability that may be imposed.
12
In addition, it is possible that our customers or end users may seek indemnity from us in the event that our products are found or alleged to infringe the intellectual property rights of others. Any such claim for indemnity could result in substantial expenses to us that could harm our operating results.
If we are unable to obtain and maintain intellectual property rights and/or enforce those rights against third parties who are violating those rights, our business could suffer.
We rely on various intellectual property rights, including patents, trademarks, trade secrets and trade dress to protect our Turtle Beach brand name, reputation, product appearance, and technology. Although we have entered into confidentiality and invention assignment agreements with our employees and contractors, and nondisclosure agreements with selected parties with whom we conduct business to limit access to and disclosure of our proprietary information, these contractual arrangements and the other steps we have taken to protect our intellectual property may not prevent misappropriation of that intellectual property or deter independent third-party development of similar technologies. Monitoring the unauthorized use of proprietary technology and trademarks is costly, and any dispute or other litigation, regardless of outcome, may be costly and time consuming and may divert the attention of management and key personnel from our business operations. The steps taken by us may not prevent unauthorized use of proprietary technology or trademarks. Many features of our products are not protected by patents; we may not have the legal right to prevent others from reverse engineering or otherwise copying and using these features in competitive products. If we fail to protect or to enforce our intellectual property rights successfully, our competitive position could suffer, which could adversely affect our financial results.
We are susceptible to counterfeiting of our products, which may harm our reputation for producing high-quality products and force us to incur expenses in enforcing our intellectual property rights. Such claims and lawsuits can be expensive to resolve, require substantial management time and resources, and may not provide a satisfactory or timely result, any of which may harm our results of operations. As some of our products are sold internationally, we are also dependent on the laws of a range of countries to protect and enforce our intellectual property rights. These laws may not protect intellectual property rights to the same extent or in the same manner as the laws of the United States.
Further, we are party to licenses that grant us rights to intellectual property, including trademarks, which are necessary or useful to our Turtle Beach business. One or more of our licensors may allege that we have breached our license agreement with them, and seek to terminate our license. If successful, this could result in our loss of the right to use the licensed intellectual property, which could adversely affect our ability to commercialize our technologies or products, as well as harm our competitive business position and our business prospects.
Our success also depends in part on our ability to obtain and enforce intellectual property protection of our technology, particularly our patents. There is no guarantee any patent be granted on any patent application that we have filed or may file. Claims allowed from existing or pending patents may not be of sufficient scope or strength to protect the economic value of our technologies. Further, any patent that we may obtain will expire, and it is possible that it may be challenged, invalidated or circumvented.
We may initiate claims or litigation against third parties in the future for infringement of our proprietary rights or to determine the scope and validity of our proprietary rights or the proprietary rights of our competitors. These claims could result in costly litigation and divert the efforts of our technical and management personnel. As a result, our operating results could suffer and our financial condition could be harmed.
We are dependent upon third-party intellectual property to manufacture some of our products.
The performance of certain technology used in new generation consoles, such as integrated voice and chat audio from the Xbox One, is improved by a licensed component to ensure compatibility with our products.
While we currently believe that we have the necessary licenses, or can obtain the necessary licenses, in order to produce compatible products, there is no guarantee that our licenses will be renewed or granted in the first instance. Moreover, if these first parties enter into license agreements with companies other than us for their “closed systems” or if we are unable to obtain sufficient quantities of these headset adapters or chips, we would be placed at a competitive disadvantage.
In order for certain of our headsets to connect to the Xbox One's advanced features and controls, a proprietary computer chip or wireless module is required. As a result, with respect to our products designed for the Xbox One, we are currently reliant on Microsoft or their designated supplier to provide us with sufficient quantities. If we are unable to obtain sufficient quantities of these headset adapters or chips, sales of such Xbox One headsets and consequently our revenues would be adversely affected.
We are licensed and approved by Microsoft to develop and sell Xbox One compatible audio products pursuant to a license agreement under which we have the right to manufacture (including through third party manufacturers), market and sell audio products for the Xbox One video game console (the “Xbox One Agreement”). Our Xbox One headsets are dependent on this license. Microsoft has the right to terminate the Xbox One Agreement under certain circumstances set forth in the agreement. Should the Xbox One Agreement be terminated, our headset offerings may be limited, thereby significantly reducing our revenues.
Accordingly, Microsoft, Sony and other third-party gaming platform manufacturers may control our ability to manufacture headsets compatible with their platforms, and could cause unanticipated delays in the release of our products as well as increases to projected development, manufacturing, licensing, marketing or distribution costs, any of which could negatively impact our business.
13
Our products may be subject to warranty claims, product liability and product recalls.
We may be subject to product liability or warranty claims that could result in significant direct or indirect costs, or we could experience greater returns from retailers than expected, which could harm our net sales. The occurrence of any quality problems due to defects in our products could make us liable for damages and warranty claims in excess of any existing reserves. In addition to the risk of direct costs to correct any defects, warranty claims, product recalls or other problems, any negative publicity related to the perceived quality of our products could also affect our brand image, decrease retailer and distributor demand and our operating results and financial condition could be adversely affected.
We could incur unanticipated expenses in connection with warranty or product liability claims relating to a recall of one or more of our products, which could require significant expenditures to defend. Additionally, we may be required to comply with governmental requirements to remedy the defect and/or notify consumers of the problem that could lead to unanticipated expense, and possible product liability litigation against a customer or us.
Changes in laws or regulations or the manner of their interpretation or enforcement could adversely impact our financial performance and restrict our ability to operate our business or execute our strategies.
New laws or regulations, or changes in existing laws or regulations or the manner of their interpretation or enforcement, may create uncertainty for public companies, increase our cost of doing business and restrict our ability to operate our business or execute our strategies. This could include, among other things, compliance costs and enforcement under the Dodd-Frank Wall Street Reform and Consumer Protection Act (the “Dodd-Frank Act”).
We continually evaluate and monitor developments with respect to new and proposed laws, regulations, standards and rules and cannot predict or estimate the amount of the additional costs we may incur or the timing of such costs. Any such new or changed laws, regulations, standards and rules may be subject to varying interpretations and as a result, their application in practice may evolve over time as new guidance is provided by regulatory and governing bodies. This could result in continuing uncertainty regarding compliance matters and higher costs necessitated by ongoing revisions to disclosure and governance practices. We are committed to maintaining high standards of corporate governance and public disclosure. If our efforts to comply with new or changed laws, regulations and standards differ from the activities intended by regulatory or governing bodies due to ambiguities related to practice, regulatory authorities may initiate legal proceedings against us and we may be harmed.
We are subject to various environmental laws and regulations that could impose substantial costs on us and may adversely affect our business, operating results and financial condition.
Our operations and some of our products are regulated under various federal, state, local and international environmental laws. In addition, regulatory bodies in many of the jurisdictions in which we operate propose, enact and amend environmental laws and regulations on a regular basis. If we were to violate or become liable under these environmental laws, we could be required to incur additional costs to comply with such regulations and may incur fines and civil or criminal sanctions, third-party property damage or personal injury claims, or could be required to incur substantial investigation or remediation costs. Liability under environmental laws may be joint and several and without regard to comparative fault. The ultimate costs under environmental laws and the timing of these costs are difficult to predict. Although we cannot predict the ultimate impact of any new environmental laws and regulations, such laws may result in additional costs or decreased revenue, and could require that we redesign or change how we manufacture our products, any of which could have a material adverse effect on our business. Additionally, to the extent that our competitors choose not to abide by these environmental laws and regulations, we may be at a cost disadvantage, thereby hindering our ability to effectively compete in the marketplace.
Failure to comply with the U.S. Foreign Corrupt Practices Act or other applicable anti-corruption legislation could result in fines, criminal penalties and an adverse effect on our business.
Our products are sold in over 40 countries, including countries known to have a reputation for corruption. We are committed to doing business in accordance with applicable anti-corruption laws. We are subject, however, to the risk that our officers, directors, employees, agents and collaborators may take action determined to be in violation of such anti-corruption laws, including the U.S. Foreign Corrupt Practices Act of 1977, the U.K. Bribery Act 2010, the European Union Anti-Corruption Act and other similar laws, or that subjects us to trade sanctions administered by the Office of Foreign Assets Control and the U.S. Department of Commerce. Any such violation could result in substantial fines, sanctions, civil and/or criminal penalties or curtailment of operations in certain jurisdictions, and might adversely affect our results of operations. In addition, actual or alleged violations could damage our reputation and ability to do business.
We are party to ongoing stockholder litigation, and in the future could be party to additional stockholder litigation, any of which could harm our business, financial condition and operating results.
We have had, and may continue to have, actions brought against us by stockholders in connection with the merger, past transactions, changes in our stock price or other matters. Any such claims, whether or not resolved in our favor, could divert our management and other resources from the operation of our business and otherwise result in unexpected and substantial expenses that would adversely and materially impact our business, financial condition and operating results. For example, and as further described in Note 13, “Commitments and Contingencies,” we are involved in legal proceedings related to the merger of VTBH and Paris Acquisition Corp. involving certain of our stockholders.
14
We depend upon the availability of capital under our revolving credit facility to finance our operations. Any additional financing that we may need may not be available on favorable terms, or at all.
In addition to cash flow generated from operations, we finance our operations with a credit facility (the “Credit Facility”) provided by Bank of America, as Agent, Sole Lead Arranger and Sole Bookrunner. If we are unable to comply with the financial and other covenants contained in the Credit Facility and are unable to obtain a waiver under the Credit Facility, Bank of America may declare the outstanding borrowings under the Credit Facility immediately due and payable. Such an event would have an immediate and material adverse impact on our business, results of operations, and financial condition. We would be required to obtain additional financing from other sources, and we cannot predict whether or on what terms, if any, additional financing might be available. If we are required to seek additional financing and are unable to obtain it, we may have to change our business and capital expenditure plans, which may have a materially adverse effect on our business, financial condition and results of operations. In addition, the debt under the Credit Facility could make it more difficult to obtain other debt financing in the future, which could put us at a competitive disadvantage to competitors with less debt. The Credit Facility contains financial and other covenants that we are obligated to maintain. The Credit Facility contain certain financial covenants and other restrictions that limit our ability, among other things, to incur certain additional indebtedness; pay dividends and repurchase stock; make certain investments and other payments; enter into certain mergers or consolidations; engage in sale and leaseback transactions and transactions with affiliates; and encumber and dispose of assets.
If we violate any of these covenants, we will be in default under the Credit Facility. If a default occurs and is not timely cured or waived, Bank of America could seek remedies against us, including termination or suspension of obligations to make loans and issue letters of credit, and acceleration of amounts due under the applicable Credit Facility. No assurance can be given that we will be able to maintain compliance with these covenants in the future. The Credit Facility is asset based and can only be drawn down in an amount to which eligible collateral exists and can be negatively impacted by extended collection of accounts receivable, unexpectedly high product returns and slow-moving inventory, among other factors. In addition, we have granted the lender a first-priority lien against substantially all of our assets, including trade accounts receivable and inventories. Failure to comply with the operating restrictions or financial covenants could result in a default which could cause the lender to accelerate the timing of payments and exercise their lien on substantially all of our assets.
If suppliers, customers, landlords, employees or other stakeholders lose confidence in our business, it may be more difficult for us to operate and may materially adversely affect our business, results of operations and financial condition.
If suppliers, customers, landlords, employees or other stakeholders have doubts regarding our ability to continue as a going concern, this could materially adversely affect our ability to operate. Concerns about our financial condition may cause our suppliers and other counterparties to tighten credit terms or cease doing business with us altogether, which would have a material adverse effect on our business and results of operations.
Risks Related to Ownership of our Common Stock
The market price of our common stock may fluctuate significantly.
We cannot predict the prices at which our common stock may trade. The market price of our common stock may fluctuate widely, depending on many factors, some of which may be beyond our control, including but not limited to:
|
|
• |
actual or anticipated fluctuations in our operating results due to factors related to our business; |
|
|
• |
success or failure of our business strategy; |
|
|
• |
the success of third-party gaming platforms and certain game titles to drive sales; |
|
|
• |
our quarterly or annual earnings, or those of other companies in our industry; |
|
|
• |
changes in earnings estimates by securities analysts or our ability to meet those estimates; |
|
|
• |
our ability to execute transformation, restructuring and realignment actions; |
|
|
• |
the operating and stock price performance of other comparable companies; |
|
|
• |
overall market fluctuations and, |
|
|
• |
general economic conditions and other external factors. |
Stock markets in general have experienced volatility that has often been unrelated to the operating performance of a particular company. These broad market fluctuations could adversely affect the trading price of our common stock.
15
Item 1B - Unresolved Staff Comments
None.
The table below describes our principal facilities as of December 31, 2019.
|
Location |
|
State or Country |
|
Principal Business Activity |
|
Approx. Square Feet |
|
|
Expiration Date of Lease |
|
|
San Diego |
|
CA |
|
Corporate Headquarters |
|
|
13,450 |
|
|
2021 |
|
Valhalla |
|
NY |
|
Administration |
|
|
11,800 |
|
|
2020 |
|
Basingstoke |
|
U.K. |
|
Administration |
|
|
3,650 |
|
|
2027 |
In December 2019, the Company entered into lease for 15,758 square feet of general office space at 44 South Broadway, White Plains, NY pursuant to a 10-year lease that will commence upon the landlord’s substantial completion of certain specifications.
The Company is subject to various legal proceedings and claims that arise in the ordinary course of its business. Although the amount of any liability that could arise with respect to these actions cannot be determined with certainty, in the Company’s opinion, any such liability will not have a material adverse effect on its consolidated financial position, consolidated results of operations or liquidity.
Shareholders Class Action: On August 5, 2013, VTBH and the Company (f/k/a Parametric Sound Corporation) announced that they had entered into the Merger Agreement pursuant to which VTBH would acquire an approximately 80% ownership interest and existing shareholders would maintain an approximately 20% ownership interest in the combined company (the “Merger”). Following the announcement, several shareholders filed class action lawsuits in California and Nevada seeking to enjoin the Merger. The plaintiffs in each case alleged that members of the Company’s Board of Directors breached their fiduciary duties to the shareholders by agreeing to a merger that allegedly undervalued the Company. VTBH and the Company were named as defendants in these lawsuits under the theory that they had aided and abetted the Company’s Board of Directors in allegedly violating their fiduciary duties. The plaintiffs in both cases sought a preliminary injunction seeking to enjoin closing of the Merger, which, by agreement, was heard by the Nevada court with the California plaintiffs invited to participate. On December 26, 2013, the court in the Nevada case denied the plaintiffs’ motion for a preliminary injunction. Following the closing of the Merger, the Nevada plaintiffs filed a second amended complaint, which made essentially the same allegations and sought monetary damages as well as an order rescinding the Merger. The California plaintiffs dismissed their action without prejudice, and sought to intervene in the Nevada action, which was granted. Subsequent to the intervention, the plaintiffs filed a third amended complaint, which made essentially the same allegations as prior complaints and sought monetary damages. On June 20, 2014, VTBH and the Company moved to dismiss the action, but that motion was denied on August 28, 2014. On September 14, 2017, a unanimous en banc panel of the Nevada Supreme Court granted defendants’ petition for writ of mandamus and ordered the trial court to dismiss the complaint but provided a limited basis upon which plaintiffs could seek to amend their complaint. Plaintiffs amended their complaint on December 1, 2017 to assert the same claims in a derivative capacity on behalf of the Company, as a well as in a direct capacity, against VTBH, Stripes Group, LLC, SG VTB Holdings, LLC, and the former members of the Company’s Board of Directors. All defendants moved to dismiss this amended complaint on January 2, 2018, and those motions were denied on March 13, 2018. Defendants petitioned the Nevada Supreme Court to reverse this ruling on April 18, 2018. On June 15, 2018, the Nevada Supreme Court denied defendants’ writ petition without prejudice. The district court subsequently entered a pretrial schedule and set trial for November 2019. On January 18, 2019, the district court certified a class of shareholders of the Company as of January 15, 2014. On October 11, 2019, the parties notified the District Court that they had reached a settlement that would resolve the pending action if ultimately approved by the Court. On January 13, 2020, the District Court preliminarily approved the settlement agreement between the plaintiffs and all Defendants. A final approval hearing has been scheduled for May 18, 2020. All pending court dates and deadlines, including the trial date, have been stayed while the parties proceed with the settlement process.
Commercial Dispute: On July 20, 2016, Bigben Interactive S.A. (“BigBen”) filed a statement of claim before the Regional Court of Berlin, Germany against VTB, which statement of claim was formally serviced upon VTB on June 28, 2017. The statement of claim alleges that VTB’s termination of a distribution agreement by and between BigBen and VTB breached the terms thereof and was invalid, and that BigBen is entitled to damages amounting to €5.0 million plus accrued interest thereon plus certain additional damages as a result of such invalid termination. VTB filed its statement of defense with the court on September 21, 2017. On January 7, 2019, the Regional Court of Berlin issued its judgment on this dispute, dismissing BigBen’s claim in its entirety. On February 7, 2019, BigBen Interactive S.A. filed an appeal against the judgment of the Regional Court of Berlin on January 7, 2019 (the "Judgment"). On April 15, 2019, Big Ben provided the reasoning for its appeal against the Judgment. On June 21, VTB replied to the reasoning for the appeal. Upon Big Ben’s application, the Higher Regional Court of Berlin has reviewed the provisions of the Judgment specifically relating to preliminary enforceability of the Judgment in separate proceedings and before the appellate proceedings regarding the main part of the Judgment. On July 9, 2019, the Higher Regional Court of Berlin completely rejected Big Ben’s applications with regard to the suspension of the preliminary enforceability of the Judgment. On November 19, 2019, an oral hearing was held at the at the Higher Regional Court of Berlin on Big Ben’s appeal against the Judgement on January 7, 2019. A date for the next oral hearing at the Higher Regional Court of Berlin has not yet been scheduled.
16
Employment Litigation: On April 20, 2017, a former employee filed an action in the Superior Court for the County of San Diego, State of California. The complaint alleges claims including wrongful termination, retaliation and various other provisions of the California Labor Code. The complaint seeks unspecified economic and non-economic losses, as well as allegedly unpaid wages, unreimbursed business expenses, statutory penalties, interest, punitive damages and attorneys’ fees. The Company filed a cross-complaint against the former employee on May 25, 2017 for certain activities related to his employment with the Company. Discovery is closed and the case is set for trial on April 6, 2020 in San Diego County Superior Court.
The Company will continue to vigorously defend itself in the foregoing matters. However, litigation and investigations are inherently uncertain. Accordingly, the Company cannot predict the outcome of these matters. The Company has not recorded any accrual at December 31, 2019 for contingent losses associated with these matters based on its belief that losses, while possible, are not probable. Further, any possible range of loss cannot be reasonably estimated at this time. The unfavorable resolution of these matters could have a material adverse effect on the Company’s business, results of operations, financial condition, or cash flows. The Company is engaged in other legal actions, not described above, arising in the ordinary course of its business and, while there can be no assurance, believes that the ultimate outcome of these other legal actions will not have a material adverse effect on its business, results of operations, financial condition, or cash flows.
Item 4 - Mine Safety Disclosures
Not applicable.
17
Item 5 - Market for the Registrant’s Common Equity, Related Stockholder Matters and Issuer Purchases of Equity Securities
The Company’s stock is traded on the Nasdaq Global Market under the symbol “HEAR.” The number of holders of record of common stock at February 28, 2020 was 955.
Stock Performance Graph
Notwithstanding any statement to the contrary in any of our previous or future filings with the SEC, the following information relating to the price performance of our common stock shall not be deemed to be “filed” with the SEC for purposes of Section 18 of the Securities Exchange Act of 1934, as amended (the “Exchange Act”), to be “soliciting material” or subject to Rule 14A of the Exchange Act, or to be incorporated by reference into any of our filings under the Securities Act of 1933, as amended (the “Securities Act”) or the Exchange Act whether made before or after the date of this Report, except to the extent we specifically incorporate it by reference into such filing.
The following graph shows a comparison from December 31, 2014 through December 31, 2019 of the cumulative total return assuming a $100 investment in our common stock, the S&P 500 Index and the S&P 500 Consumer Durables Index. In accordance with the rules of the Securities and Exchange Commission, the returns are indexed to a value of $100 at December 31, 2014 and assume that all dividends, if any, were reinvested. The comparisons in this graph below are based on historical data and are not intended to forecast or be indicative of future performance of our common stock.
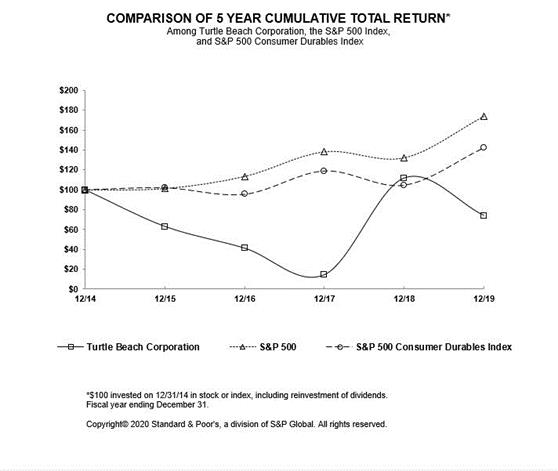
Dividend Policy
We have not paid regular cash dividends on our common stock and do not anticipate paying cash dividends in the foreseeable future. Any future determination to pay cash dividends will be at the discretion of our board of directors and will depend on our financial condition, operating results, capital requirements and such other factors as our board of directors deems relevant.
18
Unregistered Sale of Equity Securities and Issuer Purchases of Equity Securities
On April 9, 2019, the Company’s board of directors authorized a stock repurchase program to acquire up to $15.0 million of its common stock. Any repurchases under the program will be made from time to time on the open market at prevailing market prices. The following table summarizes, by month, the repurchases made during the three months ended December 31, 2019, under the repurchase program and in connection with shares repurchased from employees to satisfy tax withholding obligations in connection with the vesting of restricted stock awards.
|
|
|
Issuer Purchases of Equity Securities |
|
|||||||||||||
|
|
|
Total Number of Shares Purchased |
|
|
Average Price Paid Per Share |
|
|
Total Number of Shares Purchased As Part of Publicly Announced Plans or Programs |
|
|
Approximate Dollar Value of Shares that May Yet Be Purchased Under the Plans or Programs |
|
||||
|
Period |
|
|
|
|
|
|
|
|
|
|
|
|
|
|
|
|
|
October 1 - 31, 2019 |
|
|
— |
|
|
$ |
— |
|
|
|
— |
|
|
|
— |
|
|
November 1 - 30, 2019 |
|
|
71,704 |
|
|
$ |
8.89 |
|
|
|
65,500 |
|
|
$ |
12,476,035 |
|
|
December 1 - 31, 2019 |
|
|
— |
|
|
$ |
— |
|
|
|
— |
|
|
|
— |
|
|
Total |
|
|
71,704 |
|
|
$ |
8.89 |
|
|
|
65,500 |
|
|
|
|
|
For the fourth quarter of 2019, we repurchased approximately $0.1 million of common shares related to employee transactions. These amounts represent common shares repurchased from employees in an amount equal to the statutory tax liability associated with the vesting of their equity awards, which is then remitted on behalf of the employee.
Securities Authorized for Issuance under Equity Compensation Plans
See Part III, Item 12 - Security Ownership of Certain Beneficial Owners and Management and Related Stockholder Matters in this Annual Report for disclosure relating to our equity compensation plans. Such information will be included in our Proxy Statement or an amendment to this Form 10-K, which is incorporated herein by reference.
Item 6 - Selected Financial Data
The following table sets forth selected consolidated financial data for each of the five years ended December 31, 2019. This selected financial data should be read in conjunction with “Management’s Discussion and Analysis of Financial Condition and Results of Operations” and the consolidated financial statements and the notes thereto included in this Report.
|
|
|
Year Ended December 31, |
|
|||||||||||||||||
|
|
|
2019 (1) |
|
|
2018 |
|
|
2017 |
|
|
2016 (2) |
|
|
2015 (3) |
|
|||||
|
|
|
(in thousands, except per share data) |
|
|||||||||||||||||
|
Net Revenue |
|
$ |
234,663 |
|
|
$ |
287,437 |
|
|
$ |
149,135 |
|
|
$ |
173,978 |
|
|
$ |
162,747 |
|
|
Cost of Revenue |
|
|
155,950 |
|
|
|
178,738 |
|
|
|
98,132 |
|
|
|
131,368 |
|
|
|
122,056 |
|
|
Gross Profit |
|
|
78,713 |
|
|
|
108,699 |
|
|
|
51,003 |
|
|
|
42,610 |
|
|
|
40,691 |
|
|
Gross Margin |
|
|
33.5 |
% |
|
|
37.8 |
% |
|
|
34.2 |
% |
|
|
24.5 |
% |
|
|
25.0 |
% |
|
Operating income (loss) |
|
|
10,427 |
|
|
|
54,041 |
|
|
|
4,798 |
|
|
|
(77,701 |
) |
|
|
(74,399 |
) |
|
Operating Margin |
|
|
4.4 |
% |
|
|
18.8 |
% |
|
|
3.2 |
% |
|
|
(44.7 |
%) |
|
|
(45.7 |
%) |
|
Net income (loss) |
|
$ |
17,944 |
|
|
$ |
39,190 |
|
|
$ |
(3,248 |
) |
|
$ |
(87,182 |
) |
|
$ |
(82,907 |
) |
|
Net earnings (loss) per share: |
|
|
|
|
|
|
|
|
|
|
|
|
|
|
|
|
|
|
|
|
|
Basic |
|
$ |
1.24 |
|
|
$ |
2.90 |
|
|
$ |
(0.26 |
) |
|
$ |
(7.18 |
) |
|
$ |
(7.85 |
) |
|
Diluted |
|
$ |
1.04 |
|
|
$ |
2.74 |
|
|
$ |
(0.26 |
) |
|
$ |
(7.18 |
) |
|
$ |
(7.85 |
) |
|
Weighted average number of shares: |
|
|
|
|
|
|
|
|
|
|
|
|
|
|
|
|
|
|
|
|
|
Basic |
|
|
14,483 |
|
|
|
13,512 |
|
|
|
12,336 |
|
|
|
12,148 |
|
|
|
10,567 |
|
|
Diluted |
|
|
15,688 |
|
|
|
14,289 |
|
|
|
12,336 |
|
|
|
12,148 |
|
|
|
10,567 |
|
|
Balance Sheet Data |
|
|
|
|
|
|
|
|
|
|
|
|
|
|
|
|
|
|
|
|
|
Cash and cash equivalents |
|
|
8,249 |
|
|
|
7,078 |
|
|
|
5,247 |
|
|
|
6,183 |
|
|
|
7,114 |
|
|
Total Assets |
|
|
131,351 |
|
|
|
121,920 |
|
|
|
94,251 |
|
|
|
94,800 |
|
|
|
172,460 |
|
|
Total Debt |
|
|
15,655 |
|
|
|
37,385 |
|
|
|
70,265 |
|
|
|
66,875 |
|
|
|
64,806 |
|
|
Series B Redeemable Preferred Stock |
|
|
— |
|
|
|
— |
|
|
|
18,921 |
|
|
|
17,480 |
|
|
|
16,145 |
|
|
(1) |
In 2019, we acquired ROCCAT, which contributed revenue of $14.4 million in the year and $23.9 million of total assets on the date of acquisition. |
|
(2) |
Includes a $7.1 million charge for inventory reserves associated with the HyperSound restructuring and goodwill and other intangibles impairment charges of $63.2 million. |
|
(3) |
Includes goodwill impairment charge of $49.8 million. |
19
Item 7. Management’ s Discussion and Analysis of Financial Condition and Results of Operations
The following discussion should be read in conjunction with our consolidated financial statements and the notes thereto. This discussion summarizes the significant factors affecting our results of operations and the financial condition of our business during each of the fiscal years in the three-year period ended December 31, 2019.
Turtle Beach Corporation (herein referred to as the “Company,” “we,” “us,” or “our”), headquartered in San Diego, California, and incorporated in the state of Nevada in 2010, is a premier audio technology company with expertise and experience in developing, commercializing and marketing innovative products across a range of large addressable markets under the Turtle Beach® and ROCCAT® brands.
|
|
• |
Turtle Beach is a worldwide leader of feature-rich headset solutions for use across multiple platforms, including video game and entertainment consoles, handheld consoles, personal computers (“PC”), tablets and mobile devices. |
|
|
• |
ROCCAT is a gaming headsets, keyboards, mice and other accessories brand focused in the personal computer peripherals market. |
Business Trends
Gaming Headset Market
Based on sales tracking data from The NPD Group, Inc. (“NPD Group”), the console gaming headset market in our largest market, North America, increased just over 70% in 2018 to record levels on the popularity of battle royale games, and while the market declined from the prior year records, the overall market has increased over historic levels. The Company’s market share in North America was 43.4% in 2019.
Traditionally, the gaming market has grown as new gamers enter and some existing gamers upgraded headsets. However, the emergence of battle royale games that are highly social, collaborative and competitive, contributed to a higher growth in the video game industry and a higher proportion of gamers using headsets. And given that the vast majority of the gaming headset market is driven by replacement and upgrading, this large influx of new gaming headset users could drive an increase in demand for gaming headsets in future years.
PC Accessories Market
PC gaming in the U.S. has seen a resurgence in popularity the past few years while it continues to be a main gaming platform internationally, driven by big AAA game launches, PC-specific esports leagues, teams and players, content creators and influencers, cross-platform play, and more. While most games are available on multiple platforms, gaming on PC offers advantages including improved graphics, the increased speed and precision of mouse/keyboard controls, and more. Gaming mice and keyboards are engineered to provide gamers with higher-end performance and a superior gaming experience through benefits including faster response times, improved materials and build quality, programmable buttons and keys, software suites to customize and control devices and settings, and more. The $2.7 billion market for PC gaming headsets, mice and keyboards grew at 7% in 2019 and is forecasted to grow by another 10% in 2020.
Seasonality
Our gaming accessories business is seasonal with a significant portion of sales and profits typically occurring around the holiday period. Historically, more than 45% of revenues are generated during the period from September through December as new products are introduced and consumers engage in holiday shopping. Additionally, with the new Xbox Series X and PlayStation®5 planned to launch holiday 2020, incremental sales may be driven by gamers seeking out the latest accessories to complement their new game systems.
In connection with the seasonality of the business, the Company’s borrowings on the revolving credit facility increase as a result of the holiday inventory build leading up to year-end and decline on gross receipts during the first quarter of the following year., The Company generally does not hold a large cash balance.
Results of Operations
Management Overview
As anticipated, our headset sales declined, $67.2 million, from 2018’s record levels where the popularity of battle royale games generated a first time buy effect, but were significantly higher, up $71.1 million, than the level seen in 2017. Further, because the entry level price segments make up less of the overall market, there was a mix impact that reduced our share to 43.4% of the market, based on recent NPD Group North American data, but remained above our 42.4% share in 2017. Based on NPD’s sell-through console gaming headset data, Turtle Beach maintained its position in the sub-$50 price tier with the Recon 70 series, and in the $50-to-$99 price tier with the wireless Stealth 600 series.
20
For 2019, our reported net income was $17.9 million, or diluted net income per share of $1.04, including a $7.4 million benefit from the reversal of the valuation allowance on our deferred tax assets, with cash from operating activities of $39.4 million reflective of lower borrowing costs and operating expenses.
Forward looking, we continue to be very excited about the upcoming launches of PlayStation®5 and Microsoft's Xbox Series X, but believe that the current consoles will continue to constitute a strong installed base of headset buyers where potential console price reductions could boost sales of games and accessories for these legacy systems. As such, our console product portfolio plans reflect 2020 as an important transition year.
Additionally, we continued our push into the PC market with the acquisition of the ROCCAT portfolio of PC gaming keyboards and mice. Since the acquisition, we've worked to integrate the ROCCAT team, align many of the internal processes, modified the plans for the combined PC product portfolio, developed our approach to branding and solidified our overall multi-year PC market plan.
Key Performance Indicators and Non-GAAP Measures
Management routinely reviews key performance indicators including revenue, operating income and margins, and earnings per share, among others. In addition, we believe certain other measures provide useful information to management and investors about us and our financial condition and results of operations for the following reasons: (i) they are measures used by our board of directors and management team to evaluate our operating performance; (ii) they are measures used by our management team to make day-to-day operating decisions; (iii) the adjustments made are often viewed as either non-recurring or not reflective of ongoing financial performance or have no cash impact on operations; and (iv) they are used by securities analysts, investors and other interested parties as a common operating performance measure to compare results across companies in our industry by adjusting for potential differences caused by variations in capital structures (affecting relative interest expense), and the age and book value of facilities and equipment (affecting relative depreciation and amortization expense). These metrics, however, are not measures of financial performance under accounting principles generally accepted in the United States of America (“GAAP”) and, given the limitations of these metrics as analytical tools, should not be considered a substitute for gross profit, gross margins, net income (loss) or other consolidated income statement data as determined in accordance with GAAP. We consider the following non-GAAP measures, which may not be comparable to similarly titled measures reported by other companies, to be key performance indicators:
|
|
• |
Adjusted EBITDA is defined as net income (loss) before interest, taxes, depreciation and amortization, stock-based compensation (non-cash) and certain non-recurring special items that we believe are not representative of core operations. |
|
|
• |
Cash Margins is defined as gross margin excluding depreciation, amortization and stock-based compensation. |
Adjusted EBITDA
Adjusted EBITDA (and a reconciliation to net income (loss), the nearest GAAP financial measure) for the years ended December 31, 2019, 2018 and 2017 are as follows:
|
|
|
Year Ended |
|
|||||||||
|
|
|
December 31, |
|
|||||||||
|
|
|
2019 |
|
|
2018 |
|
|
2017 |
|
|||
|
|
|
(in thousands) |
|
|||||||||
|
Net income (loss) |
|
$ |
17,944 |
|
|
$ |
39,190 |
|
|
$ |
(3,248 |
) |
|
Interest expense |
|
|
929 |
|
|
|
5,335 |
|
|
|
7,916 |
|
|
Depreciation and amortization |
|
|
5,198 |
|
|
|
4,257 |
|
|
|
4,422 |
|
|
Stock-based compensation |
|
|
3,558 |
|
|
|
1,877 |
|
|
|
1,430 |
|
|
Income tax expense (benefit) |
|
|
(6,237 |
) |
|
|
1,737 |
|
|
|
593 |
|
|
Unrealized loss (gain) on financial instrument obligation |
|
|
(1,601 |
) |
|
|
5,291 |
|
|
|
— |
|
|
Restructuring charges |
|
|
— |
|
|
|
— |
|
|
|
533 |
|
|
Change in fair value of contingent consideration |
|
|
(471 |
) |
|
|
— |
|
|
|
— |
|
|
Business transaction expense |
|
|
3,516 |
|
|
|
— |
|
|
|
(79 |
) |
|
Adjusted EBITDA |
|
$ |
22,836 |
|
|
$ |
57,687 |
|
|
$ |
11,567 |
|
Comparison of the Year Ended December 31, 2019 to the Year Ended December 31, 2018
Net income for the year ended December 31, 2019 was $17.9 million compared to a net income of $39.2 million in the prior year, inclusive of a $1.6 million unrealized financial instrument obligation gain and a $5.3 million unrealized financial instrument obligation loss, for the years ended December 31, 2019 and 2018, respectively.
For the year ended December 31, 2019, Adjusted EBITDA was $22.8 million compared to $57.7 million, for the year ended December 31, 2018. Net income and Adjusted EBITDA decreased primarily due to a decline in the gaming accessory market from the battle royale driven record levels in the prior year and, certain initial investments in the recently acquired ROCCAT branded products.
21
Comparison of the Year Ended December 31, 2018 to the Year Ended December 31, 2017
Net income for the year ended December 31, 2018 was $39.2 million compared to a net loss of $3.2 million in the prior year. For the year ended December 31, 2018, Adjusted EBITDA was $57.7 million compared to $11.6 million, including investments of $1.0 million in the HyperSound business, for the year ended December 31, 2017. Net income and Adjusted EBITDA increased on higher revenues and fixed cost leveraging margin improvement as a result of strong consumer demand related to battle royale style game launches.
Financial Results
The following table sets forth the Company’s statements of operations for the periods presented:
|
|
|
Year Ended |
|
|||||||||
|
|
|
December 31, |
|
|||||||||
|
|
|
2019 |
|
|
2018 |
|
|
2017 |
|
|||
|
|
|
(in thousands) |
|
|||||||||
|
Net revenue |
|
$ |
234,663 |
|
|
$ |
287,437 |
|
|
$ |
149,135 |
|
|
Cost of revenue |
|
|
155,950 |
|
|
|
178,738 |
|
|
|
98,132 |
|
|
Gross profit |
|
|
78,713 |
|
|
|
108,699 |
|
|
|
51,003 |
|
|
Gross margin |
|
|
33.5 |
% |
|
|
37.8 |
% |
|
|
34.2 |
% |
|
|
|
|
|
|
|
|
|
|
|
|
|
|
|
Operating expenses |
|
|
68,286 |
|
|
|
54,658 |
|
|
|
46,205 |
|
|
Operating income |
|
|
10,427 |
|
|
|
54,041 |
|
|
|
4,798 |
|
|
Interest expense |
|
|
929 |
|
|
|
5,335 |
|
|
|
7,916 |
|
|
Other non-operating expense (income), net |
|
|
(2,209 |
) |
|
|
7,779 |
|
|
|
(463 |
) |
|
Income (loss) before income tax |
|
|
11,707 |
|
|
|
40,927 |
|
|
|
(2,655 |
) |
|
Income tax expense (benefit) |
|
|
(6,237 |
) |
|
|
1,737 |
|
|
|
593 |
|
|
Net income (loss) |
|
$ |
17,944 |
|
|
$ |
39,190 |
|
|
$ |
(3,248 |
) |
Net Revenue and Gross Profit
The following table summarizes net revenue and gross profit for the periods presented:
|
|
|
Year Ended |
|
|||||||||
|
|
|
December 31, |
|
|||||||||
|
|
|
2019 |
|
|
2018 |
|
|
2017 |
|
|||
|
|
|
(in thousands) |
|
|||||||||
|
Net Revenue |
|
$ |
234,660 |
|
|
$ |
287,378 |
|
|
$ |
148,828 |
|
|
Gross Profit |
|
$ |
78,713 |
|
|
$ |
108,784 |
|
|
$ |
51,217 |
|
|
Gross Margin |
|
|
33.5 |
% |
|
|
37.9 |
% |
|
|
34.4 |
% |
|
Cash Margin (1) |
|
|
34.4 |
% |
|
|
38.2 |
% |
|
|
34.8 |
% |
|
(1) |
Excludes non-cash charges of $2.1 million, $0.9 million, and $0.6 million, respectively. |
Comparison of the Year Ended December 31, 2019 to the Year Ended December 31, 2018
Net revenues for year ended December 31, 2019 decreased $52.7 million, or 18.3%, as a result of the decrease in demand from the prior period when battle royale driven consumer demand reached record levels. While the overall gaming accessory market declined across all channels, the Company held 43.4% of the North American console market revenue share on the strong performance of the Stealth 600 Series, which continued to be the top selling console model, and the recently released Recon 70 Series.
For the year ended December 31, 2019, gross profit as a percentage of net revenue decreased to 33.5% from 37.9% in the prior year. Margins were impacted by a more normal level of promotions, product mix, increased refurbishment and warehouse costs, and a decline in volume-based fixed cost leveraging.
Comparison of the Year Ended December 31, 2018 to the Year Ended December 31, 2017
Net revenues for year ended December 31, 2018 increased $138.6 million, or 93.1%, as a result of the increase in demand for gaming headsets that accompanied the growing popularity of the battle royale style games and reduced promotional spend. This increase was driven by higher volumes across all channels as battle royale releases, such as Fortnite and Apex Legends, generated sales of gaming headsets in the $100 and below price point, which includes our Ear Force Recon 50 Series, Stealth 600 Series and Recon Chat headsets, from new gamers and upgrade purchases from existing players.
22
For the year ended December 31, 2018, gross profit as a percentage of net revenue increased to 37.9% from 34.4% in the prior year. Headset margins were positively impacted by product and customer mix combined with higher volume drive fixed-cost leveraging and a less promotional environment as compared to the prior period in which channel inventories were much higher than normal following weaker than expected performance of the major holiday game releases. These improvements were partially offset by incremental air freight ($4.0 million) incurred to keep pace with increased consumer demand.
Operating Expenses
|
|
|
Year Ended |
|
|||||||||
|
|
|
December 31, |
|
|||||||||
|
|
|
2019 |
|
|
2018 |
|
|
2017 |
|
|||
|
|
|
(in thousands) |
|
|||||||||
|
Selling and marketing |
|
$ |
38,634 |
|
|
$ |
32,389 |
|
|
$ |
24,385 |
|
|
Research and development |
|
|
7,856 |
|
|
|
5,611 |
|
|
|
5,587 |
|
|
General and administrative |
|
|
18,280 |
|
|
|
16,658 |
|
|
|
15,700 |
|
|
Acquisition integration costs |
|
|
3,516 |
|
|
|
— |
|
|
|
— |
|
|
Restructuring charges |
|
|
— |
|
|
|
— |
|
|
|
533 |
|
|
Total operating expenses |
|
$ |
68,286 |
|
|
$ |
54,658 |
|
|
$ |
46,205 |
|
Selling and Marketing
Selling and marketing expense for the year ended December 31, 2019 totaled $38.6 million, or 16.5% as a percentage of net revenues, compared to $32.4 million, or 11.3% as a percentage of net revenues, for the prior year. This increase was primarily due to incremental costs associated with ROCCAT related headcount and expenses and certain digital and sponsorship initiatives, partially offset by decreases in revenue-based commissions and advertising display depreciation.
Selling and marketing expense for the year ended December 31, 2018 totaled $32.4 million, or 11.3% as a percentage of net revenues, compared to $24.4 million, or 16.4% as a percentage of net revenues, for the year ended December 31, 2017. This increase was primarily due to variable sales-based commissions, higher volume-based web costs and increased marketing and consumer spend related to the expansion of our eSports presence, new product video production, in-store promotional material and direct media buys.
Research and Development
For the year ended December 31, 2019, we invested $7.9 million, which consisted of $6.4 million related to new product initiatives and patent-related expenses associated with certain headset products and $1.5 million related to incremental ROCCAT-related headcount and expenses. For the years ended December 31, 2018 and 2017, we expended $5.6 million and $5.6 million, respectively, reflective of continued expansion of our new generation headset portfolio including the launch of the Atlas line of PC gaming headsets.
General and Administrative
General and administrative expenses for the year ended December 31, 2019 increased $1.6 million to $18.3 million compared to $16.7 million for the year ended December 31, 2018. The year-over-year increase was primarily due to incremental ROCCAT-related costs ($1.9 million) and higher non-cash stock expense ($1.0 million), partially offset by lower variable compensation costs ($1.2 million).
General and administrative expenses for the year ended December 31, 2018 increased $1.0 million to $16.7 million compared to $15.7 million for the year ended December 31, 2017. The year-over-year increase was primarily due to higher variable compensation costs and stock compensation expenses ($1.0 million) and certain legal expenses and settlement costs ($0.5 million), partially offset by lower professional service fees ($0.4 million).
Interest Expense
Interest expense decreased $4.4 million for the year ended December 31, 2019 compared to the prior year due to the full repayment of the subordinated notes and term loans, and the exchange of the Series B redeemable preferred stock, both of which occurred in 2018.
Interest expense decreased $2.6 million for the year ended December 31, 2018 compared to the year ended December 31, 2017 due to the exchange of the Series B redeemable preferred stock ($1.0 million), the payoff of our term loans ($0.3 million) and subordinated notes ($0.5 million) and lower borrowings on our Credit Facility.
Income Taxes
Income tax benefit for the year ended December 31, 2019 was $6.2 million at an effective tax rate of (53.3)% compared to income tax expense of $1.7 million for the year ended December 31, 2018 at an effective tax rate of 4.2%. The effective tax rate was primarily impacted by
23
a change in the valuation allowance for deferred tax assets of $10.1 million, which included a $7.4 million benefit related to the release of the valuation allowance in certain jurisdictions.
Income tax expense for the year ended December 31, 2018 was $1.7 million at an effective tax rate of 4.2% compared to income tax expense of $0.6 million for the year ended December 31, 2017 at an effective tax rate of 22.3%. The effective tax rate was primarily impacted by foreign entity tax benefits, a “change in ownership” event under Internal Revenue Code Section 382 and the full valuation allowance on domestic earnings.
Other Non-Operating Expense (Income)
Other non-operating income totaled $2.2 million for the year ended December 31, 2019, including a $1.6 million unrealized gain related to the change in value of a financial instrument obligation compared to other non-operating expense of $7.8 million for the year ended December 31, 2018, which included a $5.3 million loss from the change in fair value of a financial instrument, $1.6 million loss on extinguishment related to the prepayment of our Term Loan and Subordinated Notes and the negative exchange impact of the stronger U.S. dollar on our foreign operations. Other non-operating income totaled $0.5 million for the year ended December 31, 2017, as a result of the U.S. dollar weakening.
Liquidity and Capital Resources
Our primary sources of working capital are cash flow from operations and availability of capital under our revolving credit facility. We have funded operations and acquisitions in recent periods with operating cash flows and proceeds from debt and equity financings.
The following table summarizes our sources and uses of cash:
|
|
|
Year Ended |
|
|||||||||
|
|
|
December 31, |
|
|||||||||
|
|
|
2019 |
|
|
2018 |
|
|
2017 |
|
|||
|
|
|
(in thousands) |
|
|||||||||
|
Cash and cash equivalents at beginning of period |
|
$ |
7,078 |
|
|
$ |
5,247 |
|
|
$ |
6,183 |
|
|
Net cash provided by operating activities |
|
|
39,374 |
|
|
|
42,249 |
|
|
|
3,418 |
|
|
Net cash used for investing activities |
|
|
(14,579 |
) |
|
|
(5,079 |
) |
|
|
(4,411 |
) |
|
Net cash used for financing activities |
|
|
(24,180 |
) |
|
|
(35,129 |
) |
|
|
(162 |
) |
|
Effect of foreign exchange on cash |
|
|
556 |
|
|
|
(210 |
) |
|
|
219 |
|
|
Cash and cash equivalents at end of period |
|
$ |
8,249 |
|
|
$ |
7,078 |
|
|
$ |
5,247 |
|
Operating activities
Cash provided by operating activities for the year ended December 31, 2019 was $39.4 million, a decrease of $2.9 million as compared to $42.2 million for the year ended December 31, 2018. This is primarily the result of lower gross receipts, incremental ROCCAT costs, increased sales and marketing-related expenditures, partially offset by a reduction in inventory purchases.
Cash provided by operating activities for the year ended December 31, 2018 was $42.2 million, an increase of $38.8 million as compared to cash used in operating activities of $3.4 million for the year ended December 31, 2017. This is primarily the result of higher gross receipts from the significant increase in revenue and improved days sales outstanding, partially offset by higher inventory levels and freight costs.
Investing activities
Cash used for investing activities was $14.6 million during the year ended December 31, 2019 compared to $5.1 million in 2018, as a result of the $12.7 million related to the ROCCAT acquisition and $1.9 million of capital expenditures, compared to $5.1 million of capital expenditures in the prior year.
Cash used for investing activities was $5.1 million during the year ended December 31, 2018 compared to $4.4 million in 2017, primarily due to additional advertising display and manufacturing investments.
24
Net cash used for financing activities was $24.2 million during the year ended December 31, 2019 compared to net cash used for financing activities of $35.1 million and net cash provided by financing activities of $0.2 million during the years ended December 31, 2018 and 2017, respectively. Financing activities during the year included net repayments on our revolving credit facility of $21.7 million and $2.5 million of common stock repurchases.
Financing activities in 2018 included the repayment of certain subordinated notes of $23.9 million, net term loan repayments of $11.7 million, the exchange of the Series B redeemable preferred stock of $1.4 million and net repayments on our revolving credit facilities of $1.1 million, partially offset by proceeds from exercise of stock options and warrants of $4.2 million.
Financing activities in 2017 included net borrowings on our revolving credit facilities of $2.6 million, term loan repayments of $2.6 million and $0.1 million in debt issuance costs related to certain debt amendments.
Management assessment of liquidity
Management believes that our current cash and cash equivalents, the amounts available under our revolving credit facility and cash flows derived from operations will be sufficient to meet anticipated cash needs for working capital and capital expenditures for at least the next 12 months. Significant assumptions underlie this belief, including, among other things, that there will be no material adverse developments in our business, liquidity or capital requirements.
Foreign cash balances at December 31, 2019 and December 31, 2018 were $5.9 million and $5.2 million, respectively.
Revolving Credit Facility
On December 17, 2018, Turtle Beach and certain of its subsidiaries entered into an amended and restated loan, guaranty and security agreement (“Credit Facility”) with Bank of America, N.A. (“Bank of America”), as Agent, Sole Lead Arranger and Sole Bookrunner, which replaced the then existing asset-based revolving loan agreement. The Credit Facility, which expires on March 5, 2024, provides for a line of credit of up to $80 million inclusive of a sub-facility limit of $12 million for TB Europe, a wholly-owned subsidiary of Turtle Beach. In addition, the Credit Facility provides for a $40 million accordion feature and the ability to increase the borrowing base with a FILO Loan of up to $6.8 million.
On May 31, 2019, the Company amended the Credit Facility to provide for, amongst other items, (i) the addition of TBC Holding Company LLC, a wholly-owned subsidiary of VTB, as an obligor and (ii) the ability to make investments in TB Germany GmbH, a wholly-owned subsidiary of TB Europe, of up to $4 million in connection with the acquisition of ROCCAT and up to an additional $4 million annually.
The maximum credit availability for loans and letters of credit under the Credit Facility is governed by a borrowing base determined by the application of specified percentages to certain eligible assets, primarily eligible trade accounts receivable and inventories, and is subject to discretionary reserves and revaluation adjustments. The Credit Facility may be used for working capital, the issuance of bank guarantees, letters of credit and other corporate purposes.
Amounts outstanding under the Credit Facility bear interest at a rate equal to either a rate published by Bank of America or the LIBOR rate, plus in each case, an applicable margin, which is between 0.50% to 1.25% for base rate loans, 1.25% to 2.00% for U.S. LIBOR loans and U.K. loans and 2.00% and 2.75% for the FILO Loan. In addition, Turtle Beach is required to pay a commitment fee on the unused revolving loan commitment at a rate ranging from 0.25% to 0.50%, and letter of credit fees and agent fees. As of December 31, 2019, interest rates for outstanding borrowings were 5.25% for base rate loans and 3.13% for LIBOR rate loans.
The Company is subject to financial covenant testing if certain availability thresholds are not met or certain other events occur (as defined in the Credit Facility). The Credit Facility requires the Company and its restricted subsidiaries to maintain a fixed charge coverage ratio of at least 1.00 to 1.00 as of the last day of each fiscal quarter.
The Credit Facility also contains affirmative and negative covenants that, subject to certain exceptions, limit our ability to take certain actions, including our ability to incur debt, pay dividends and repurchase stock, make certain investments and other payments, enter into certain mergers and consolidations, engage in sale leaseback transactions and transactions with affiliates and encumber and dispose of assets. Obligations under the Credit Facility are secured by a security interest and lien upon substantially all of the Company’s assets.
As of December 31, 2019, the Company was in compliance with all the financial covenants under the Credit Facility, as amended, and excess borrowing availability was approximately $32.2 million.
25
Series B Redeemable Preferred Stock
On April 23, 2018, the Company facilitated and entered into a series of transactions pursuant to which the Series B redeemable preferred stock was acquired from Dr. Bonanno by non-affiliate investors and subsequently retired. As part of the transactions, the Company entered into (i) an Exchange Agreement (the “Exchange Agreement”) with such non-affiliate investors pursuant to which the Company agreed to exchange the Series B redeemable preferred stock for an aggregate of 1,307,143 newly issued shares of the Company’s common stock and wholly-funded warrants exercisable for an aggregate of 550,000 shares of the Company’s common stock and (ii) a Settlement Agreement (the “Settlement Agreement”) with Dr. Bonanno.
Stock Warrants
In connection with certain subordinated notes, the Company issued warrants to purchase an aggregate 0.4 million shares and 0.3 million shares of the Company’s common stock at an exercise price of $10.16 and $8.00 per share, respectively, to SG VTB Holdings, LLC, all of which were settled through cashless exercises in March 2019.
Critical Accounting Estimates
Our discussion and analysis of our results of operations and capital resources are based on our consolidated financial statements, which have been prepared in conformity with GAAP. The preparation of these consolidated financial statements requires management to make estimates and assumptions that affect the reported amounts of assets, liabilities, revenue and expenses and the disclosure of contingent assets and liabilities. Management bases its estimates, assumptions and judgments on historical experience and on various other factors that it believes to be reasonable under the circumstances.
Different assumptions and judgments would change the estimates used in the preparation of the condensed consolidated financial statements, which, in turn, could change the results from those reported. Management evaluates its estimates, assumptions and judgments on an ongoing basis.
Based on the above, we have determined that our most critical accounting policies are those related to revenue recognition and sales return reserve, inventory valuation, asset impairment, and income taxes.
Revenue Recognition and Sales Return Reserve
Net revenue consists primarily of revenue from the sale of gaming headsets and accessories to wholesalers, retailers and to a lesser extent, on-line customers. Our products function on a standalone basis (in connection with a readily available gaming console, personal computer or stereo) and are not sold with additional services or rights to future goods or services. Revenue is recorded for a contract through the following steps: (i) identifying the contract with the customer; (ii) identifying the performance obligations in the contract; (iii) determining the transaction price; (iv) allocating the transaction price to the performance obligations; and (v) recognizing revenue when or as each performance obligation is satisfied.
Each contract at inception is evaluated to determine whether the contract should be accounted for as having one or more performance obligations. Revenue is recognized when obligations under the terms of a contract with our customer are satisfied; generally this occurs at a point in time when the risk and title to the product transfers to the customer. Our standard terms of delivery are included in our contracts of sale, order confirmation documents, and invoices. The Company excludes sales taxes collected from customers from “Net Revenue” in its Consolidated Statements of Operations.
Certain customers may receive cash-based incentives (including cash discounts, quantity rebates, and price concessions), which are accounted for as variable consideration. Provisions for sales returns are recognized in the period the sale is recorded based upon our prior experience and current trends. These revenue reductions are established by the Company based upon management’s best estimates at the time of sale following the historical trend, adjusted to reflect known changes in the factors that impact such reserves and allowances, and the terms of agreements with customers. We do not expect to have significant changes in our estimates for variable considerations.
Inventory Valuation
Inventories are valued at the lower of weighted average cost or market, at the individual item level. Market is determined based on the estimated net realizable value, which is generally the selling price. Inventory levels are monitored to identify slow-moving items and markdowns are used to increase sales of such products. Physical inventory counts are performed annually in January and estimates are made for any shortage between the date of the physical inventory count and the balance sheet date.
Asset Impairment
Historically, we have had significant long-lived tangible and intangible assets, including goodwill with indefinite lives, which are susceptible to valuation adjustments as a result of changes in various factors or conditions. We assess the potential impairment of intangible and fixed assets whenever events or changes in circumstances indicate that full recoverability of net asset balances through future cash flows is in question. Goodwill and indefinite-lived intangible assets are assessed at least annually, but also whenever events or changes in circumstances indicate the carrying values may not be recoverable. Factors we consider important, which could trigger an impairment of such assets include significant underperformance relative to historical or projected future operating results; significant changes in the manner of use of the acquired assets or the strategy for our overall business; significant negative industry or economic trends; significant decline in our stock price for a sustained period; and a decline in our market capitalization below net book value.
26
Management estimates future pre-tax cash flows based on historical experience, knowledge and market data. Estimates of future cash flows require that we make assumptions and apply judgment, including forecasting future sales and expenses and estimating useful lives of the assets. These estimates can be affected by factors such as future product development and economic conditions that can be difficult to predict, as well as other factors such as those outlined in “Risk Factors.” If the expected future cash flows related to the long-lived assets are less than the assets’ carrying value, an impairment loss would be recognized for the difference between estimated fair value and carrying value.
There are inherent assumptions and estimates used in developing future cash flows requiring management judgment including projecting revenues, interest rates and the cost of capital. Many of the factors used in assessing fair value are outside our control and it is reasonably likely that assumptions and estimates will change in future periods. These changes can result in future impairments.
Income Taxes
We account for income taxes using the asset and liability method. Under the asset and liability method, deferred tax assets and liabilities are recognized based on the differences between the financial statement carrying value of existing assets and liabilities and their respective tax bases. Deferred tax assets and liabilities are measured using enacted tax rates and laws expected to be in effect when the differences are expected to reverse. The effect of a change in tax rates on deferred tax assets and liabilities is recognized in income in the period that includes the enactment date. Inherent in the measurement of these deferred balances are certain judgments and interpretations of existing tax law and other published guidance as applied to our operations. Our effective tax rate considers our judgment of expected tax liabilities in the various jurisdictions within which we are subject to tax.
The determination of the need for a valuation allowance on deferred tax assets requires management to make assumptions and to apply judgment, including forecasting future earnings, taxable income, and the mix of earnings in the jurisdictions in which we operate.
The tax effects of uncertain tax positions taken or expected to be taken in income tax returns are recognized only if they are “more likely-than-not” to be sustained on examination by the taxing authorities based on the technical merits as of the reporting date. The tax benefits recognized in the financial statements from such positions are measured based on the largest benefit that has a greater than fifty percent likelihood of being realized upon ultimate settlement. We recognize estimated accrued interest and penalties related to uncertain tax positions in income tax expense.
There have been no material changes to the critical accounting policies and estimates. See Note 1, “Summary of Significant Accounting Policy,” in the notes to the consolidated financial statements for a complete discussion of recent accounting pronouncements. We are currently evaluating the impact of certain recently issued guidance on our financial condition and results of operations in future periods.
Off-Balance Sheet Arrangements
Off balance sheet arrangements are transactions, agreements, or other contractual arrangements with an unconsolidated entity for which we have an obligation to the entity that is not recorded in the consolidated financial statements. As of December 31, 2019, there are no significant off-balance sheet arrangements.
Contractual Obligations
Our principal commitments primarily consist of obligations for minimum payment commitments to lessors for office space and the revolving credit facility. As of December 31, 2019, the future non-cancelable minimum payments under these commitments were as follows:
|
|
|
Payments Due by Period |
|
|||||||||||||||||
|
(in thousands) |
|
Total |
|
|
Less Than One Year |
|
|
1 - 3 Years |
|
|
3 - 5 Years |
|
|
More Than Five Years |
|
|||||
|
Contractual Obligations: (1) |
|
|
|
|
|
|
|
|
|
|
|
|
|
|
|
|
|
|
|
|
|
Operating lease obligations (2) |
|
$ |
1,989 |
|
|
$ |
697 |
|
|
$ |
909 |
|
|
$ |
204 |
|
|
|
179 |
|
|
Long term debt (3) |
|
|
15,655 |
|
|
|
15,655 |
|
|
|
— |
|
|
|
— |
|
|
|
— |
|
|
Total |
|
$ |
17,644 |
|
|
$ |
16,352 |
|
|
$ |
909 |
|
|
$ |
204 |
|
|
$ |
179 |
|
|
(1) |
Contractual obligations exclude tax liabilities of $1.2 million related to uncertain tax positions because we are unable to make a reasonably reliable estimate of the timing of settlement, if any, of these future payments. |
|
(2) |
Operating lease agreements represent obligations to make payments under non-cancelable lease agreements for its facilities. |
|
(3) |
On December 17, 2018, the Company entered into an amended Credit Facility that expires on March 5, 2024. However, due to certain terms of the facility, the indebtedness is required to be classified as a current liability. Interest payments are not reflected under the Credit Facility because the amount that will be borrowed in future years is uncertain. |
27
Item7A - Qualitative and Quantitative Disclosures about Market Risk
Market risk represents the risk of loss that may impact our financial position due to adverse changes in financial market prices and rates. The Company’s market risk exposure is primarily a result of fluctuations in interest rates, foreign currency exchange rates and inflation.
The Company has used derivative financial instruments, specifically foreign currency forward and option contracts, to manage exposure to foreign currency risks, by hedging a portion of its forecasted expenses denominated in British Pounds expected to occur within a year. The effect of exchange rate changes on foreign currency forward and option contracts is expected to offset the effect of exchange rate changes on the underlying hedged item. The Company does not use derivative financial instruments for speculative or trading purposes. As of December 31, 2019, we do not have any derivative financial instruments.
Interest Rate Risk
The Company’s total variable rate debt consists of $15.7 million outstanding under the Credit Facility. A hypothetical 10% increase in borrowing rates at December 31, 2019 would not result in a material increase in interest expense on principal balances.
Foreign Currency Exchange Risk
The Company has exchange rate exposure, primarily, with respect to the British Pound and Euro. As of December 31, 2019 and 2018, our monetary assets and liabilities which are subject to this exposure are immaterial, therefore the potential immediate loss to us that would result from a hypothetical 10% change in foreign currency exchange rates would not be expected to have a material impact on our earnings or cash flows. This sensitivity analysis assumes an unfavorable 10% fluctuation in the exchange rates affecting the foreign currencies in which monetary assets and liabilities are denominated and does not take into account the offsetting effect of such a change on our foreign currency denominated revenues.
Inflation Risk
The Company is exposed to market risk due to the possibility of inflation, such as increases in the cost of its products. Although the Company does not believe that inflation has had a material impact on its financial position or results of operations to date, a high rate of inflation in the future may have an adverse effect on the Company’s ability to maintain current levels of gross margin and selling, general and administrative expenses as a percentage of net revenue if the selling prices of products do not increase with these increased costs.
28
Item 8. Financial Statements and Supplementary Data
|
INDEX TO CONSOLIDATED FINANCIAL STATEMENTS |
|
|
|
|
|
|
Page |
|
30 |
|
|
|
|
|
Consolidated Financial Statements: |
|
|
|
|
|
31 |
|
|
Consolidated Statements of Operations for the Years Ended December 31, 2019, 2018 and 2017 |
32 |
|
33 |
|
|
Consolidated Statements of Cash Flows for the Years Ended December 31, 2019, 2018 and 2017 |
34 |
|
35 |
|
|
36 |
|
|
Supplemental Schedule - Schedule II Valuation and Qualifying Accounts |
63 |
29
REPORT OF INDEPENDENT REGISTERED PUBLIC ACCOUNTING FIRM
Shareholders and Board of Directors
Turtle Beach Corporation
San Diego, California
Opinion on the Consolidated Financial Statements
We have audited the accompanying consolidated balance sheets of Turtle Beach Corporation (the “Company”) and subsidiaries as of December 31, 2019 and 2018, the related consolidated statements of operations, comprehensive income (loss), stockholders’ equity (deficit), and cash flows for each of the three years in the period ended December 31, 2019, and the related notes and schedule (collectively referred to as the “consolidated financial statements”). In our opinion, the consolidated financial statements present fairly, in all material respects, the financial position of the Company and subsidiaries at December 31, 2019, and the results of their operations and their cash flows for each of the three years in the period ended December 31, 2019, in conformity with accounting principles generally accepted in the United States of America.
We also have audited, in accordance with the standards of the Public Company Accounting Oversight Board (United States) (“PCAOB”), the Company’s internal control over financial reporting as of December 31, 2019 based on criteria established in Internal Control - Integrated Framework (2013) issued by the Committee of Sponsoring Organizations of the Treadway Commission (“COSO”) and our report dated March 13, 2020 expressed an adverse opinion thereon.
Basis for Opinion
These consolidated financial statements are the responsibility of the Company’s management. Our responsibility is to express an opinion on the Company’s consolidated financial statements based on our audits. We are a public accounting firm registered with the Public Company Accounting Oversight Board (United States) (“PCAOB”) and are required to be independent with respect to the Company in accordance with the U.S. federal securities laws and the applicable rules and regulations of the Securities and Exchange Commission and the PCAOB.
We conducted our audits in accordance with the standards of the PCAOB. Those standards require that we plan and perform the audit to obtain reasonable assurance about whether the consolidated financial statements are free of material misstatement, whether due to error or fraud. Our audits included performing procedures to assess the risks of material misstatement of the consolidated financial statements, whether due to error or fraud, and performing procedures that respond to those risks. Such procedures included examining, on a test basis, evidence regarding the amounts and disclosures in the consolidated financial statements. Our audits also included evaluating the accounting principles used and significant estimates made by management, as well as evaluating the overall presentation of the consolidated financial statements. We believe that our audits provide a reasonable basis for our opinion.
|
/s/ BDO USA, LLP |
|
We have served as the Company’s auditor since 2014. |
|
|
|
New York, New York |
|
March 13, 2020 |
30
|
|
|
December 31, |
|
|
December 31, |
|
||
|
|
|
2019 |
|
|
2018 |
|
||
|
ASSETS |
|
(in thousands, except par value and share amounts) |
|
|||||
|
Current Assets: |
|
|
|
|
|
|
|
|
|
Cash and cash equivalents |
|
$ |
8,249 |
|
|
$ |
7,078 |
|
|
Accounts receivable, less allowances of $24,940 and $23,271 in 2019 and 2018, respectively |
|
|
44,530 |
|
|
|
52,797 |
|
|
Inventories |
|
|
45,711 |
|
|
|
49,472 |
|
|
Prepaid expenses and other current assets |
|
|
4,057 |
|
|
|
4,469 |
|
|
Total Current Assets |
|
|
102,547 |
|
|
|
113,816 |
|
|
Property and equipment, net |
|
|
3,962 |
|
|
|
5,856 |
|
|
Deferred income taxes |
|
|
7,439 |
|
|
|
— |
|
|
Goodwill |
|
|
8,515 |
|
|
|
— |
|
|
Intangible assets, net |
|
|
6,011 |
|
|
|
1,036 |
|
|
Other assets |
|
|
2,877 |
|
|
|
1,212 |
|
|
Total Assets |
|
$ |
131,351 |
|
|
$ |
121,920 |
|
|
LIABILITIES AND STOCKHOLDERS’ EQUITY |
|
|
|
|
|
|
|
|
|
Current Liabilities: |
|
|
|
|
|
|
|
|
|
Revolving credit facility |
|
$ |
15,655 |
|
|
$ |
37,385 |
|
|
Accounts payable |
|
|
22,511 |
|
|
|
17,724 |
|
|
Other current liabilities |
|
|
26,422 |
|
|
|
18,488 |
|
|
Total Current Liabilities |
|
|
64,588 |
|
|
|
73,597 |
|
|
Deferred income taxes |
|
|
153 |
|
|
|
187 |
|
|
Financial instrument obligation |
|
|
— |
|
|
|
7,848 |
|
|
Other liabilities |
|
|
3,223 |
|
|
|
2,792 |
|
|
Total Liabilities |
|
|
67,964 |
|
|
|
84,424 |
|
|
Commitments and Contingencies |
|
|
|
|
|
|
|
|
|
Stockholders’ Equity |
|
|
|
|
|
|
|
|
|
Common stock, $0.001 par value - 25,000,000 shares authorized; 14,488,152 and 14,268,184 shares issued and outstanding as of December 31, 2019 and 2018, respectively |
|
|
14 |
|
|
|
14 |
|
|
Additional paid-in capital |
|
|
176,776 |
|
|
|
169,421 |
|
|
Accumulated deficit |
|
|
(113,519 |
) |
|
|
(131,463 |
) |
|
Accumulated other comprehensive income (loss) |
|
|
116 |
|
|
|
(476 |
) |
|
Total Stockholders’ Equity |
|
|
63,387 |
|
|
|
37,496 |
|
|
Total Liabilities and Stockholders’ Equity |
|
$ |
131,351 |
|
|
$ |
121,920 |
|
See accompanying Notes to the Consolidated Financial Statements
31
Consolidated Statements of Operations
|
|
|
Year ended December 31, |
|
|||||||||
|
|
|
2019 |
|
|
2018 |
|
|
2017 |
|
|||
|
|
|
(in thousands, except per-share data) |
|
|||||||||
|
Net revenue |
|
$ |
234,663 |
|
|
$ |
287,437 |
|
|
$ |
149,135 |
|
|
Cost of revenue |
|
|
155,950 |
|
|
|
178,738 |
|
|
|
98,132 |
|
|
Gross profit |
|
|
78,713 |
|
|
|
108,699 |
|
|
|
51,003 |
|
|
Operating expenses: |
|
|
|
|
|
|
|
|
|
|
|
|
|
Selling and marketing |
|
|
38,634 |
|
|
|
32,389 |
|
|
|
24,385 |
|
|
Research and development |
|
|
7,856 |
|
|
|
5,611 |
|
|
|
5,587 |
|
|
General and administrative |
|
|
21,796 |
|
|
|
16,658 |
|
|
|
15,700 |
|
|
Restructuring charges |
|
|
— |
|
|
|
— |
|
|
|
533 |
|
|
Total operating expenses |
|
|
68,286 |
|
|
|
54,658 |
|
|
|
46,205 |
|
|
Operating income |
|
|
10,427 |
|
|
|
54,041 |
|
|
|
4,798 |
|
|
Interest expense |
|
|
929 |
|
|
|
5,335 |
|
|
|
7,916 |
|
|
Other non-operating expense (income), net |
|
|
(2,209 |
) |
|
|
7,779 |
|
|
|
(463 |
) |
|
Income (loss) before income tax |
|
|
11,707 |
|
|
|
40,927 |
|
|
|
(2,655 |
) |
|
Income tax expense (benefit) |
|
|
(6,237 |
) |
|
|
1,737 |
|
|
|
593 |
|
|
Net income (loss) |
|
$ |
17,944 |
|
|
$ |
39,190 |
|
|
$ |
(3,248 |
) |
|
|
|
|
|
|
|
|
|
|
|
|
|
|
|
Net income (loss) per share |
|
|
|
|
|
|
|
|
|
|
|
|
|
Basic |
|
$ |
1.24 |
|
|
$ |
2.90 |
|
|
$ |
(0.26 |
) |
|
Diluted |
|
$ |
1.04 |
|
|
$ |
2.74 |
|
|
$ |
(0.26 |
) |
|
Weighted average number of shares: |
|
|
|
|
|
|
|
|
|
|
|
|
|
Basic |
|
|
14,483 |
|
|
|
13,512 |
|
|
|
12,336 |
|
|
Diluted |
|
|
15,688 |
|
|
|
14,289 |
|
|
|
12,336 |
|
See accompanying Notes to the Consolidated Financial Statements
32
Consolidated Statements of Comprehensive Income (Loss)
|
|
|
Year ended December 31, |
|
|||||||||
|
|
|
2019 |
|
|
2018 |
|
|
2017 |
|
|||
|
|
(in thousands) |
|
||||||||||
|
Net income (loss) |
|
$ |
17,944 |
|
|
$ |
39,190 |
|
|
$ |
(3,248 |
) |
|
Other comprehensive income (loss): |
|
|
|
|
|
|
|
|
|
|
|
|
|
Foreign currency translation adjustment |
|
|
592 |
|
|
|
(273 |
) |
|
|
357 |
|
|
Other comprehensive income (loss) |
|
|
592 |
|
|
|
(273 |
) |
|
|
357 |
|
|
Comprehensive income (loss) |
|
$ |
18,536 |
|
|
$ |
38,917 |
|
|
$ |
(2,891 |
) |
See accompanying Notes to the Consolidated Financial Statements
33
Consolidated Statements of Cash Flows
|
|
|
Year Ended December 31, |
|
|||||||||
|
|
|
2019 |
|
|
2018 |
|
|
2017 |
|
|||
|
|
|
(in thousands) |
|
|||||||||
|
CASH FLOWS FROM OPERATING ACTIVITIES |
|
|
|
|
|
|
|
|
|
|
|
|
|
Net income (loss) |
|
$ |
17,944 |
|
|
$ |
39,190 |
|
|
$ |
(3,248 |
) |
|
Adjustments to reconcile net income (loss) to net cash provided by operating activities: |
|
|
|
|
|
|
|
|
|
|
|
|
|
Depreciation and amortization |
|
|
4,556 |
|
|
|
3,954 |
|
|
|
4,074 |
|
|
Amortization of intangible assets |
|
|
642 |
|
|
|
303 |
|
|
|
348 |
|
|
Amortization of debt financing costs |
|
|
189 |
|
|
|
1,081 |
|
|
|
1,593 |
|
|
Stock-based compensation |
|
|
3,558 |
|
|
|
1,877 |
|
|
|
1,430 |
|
|
Accrued interest on Series B redeemable preferred stock |
|
|
— |
|
|
|
501 |
|
|
|
1,441 |
|
|
Paid-in-kind interest |
|
|
— |
|
|
|
2,028 |
|
|
|
2,508 |
|
|
Deferred income taxes |
|
|
(7,473 |
) |
|
|
549 |
|
|
|
181 |
|
|
Provision for (reversal of) sales returns reserve |
|
|
(397 |
) |
|
|
3,679 |
|
|
|
942 |
|
|
Provision for (reversal of ) doubtful accounts |
|
|
(10 |
) |
|
|
431 |
|
|
|
48 |
|
|
Provision for obsolete inventory |
|
|
3,483 |
|
|
|
3,437 |
|
|
|
1,676 |
|
|
Loss on disposal of property and equipment |
|
|
28 |
|
|
|
111 |
|
|
|
9 |
|
|
Unrealized loss (gain) on financial instrument obligation |
|
|
(1,601 |
) |
|
|
5,291 |
|
|
|
— |
|
|
Decrease in unrecognized tax benefit |
|
|
(686 |
) |
|
|
— |
|
|
|
— |
|
|
Decrease in fair value of contingent consideration |
|
|
(471 |
) |
|
|
— |
|
|
|
|
|
|
Loss on debt extinguishment |
|
|
— |
|
|
|
1,572 |
|
|
|
— |
|
|
Changes in operating assets and liabilities, net of acquisitions: |
|
|
|
|
|
|
|
|
|
|
|
|
|
Accounts receivable |
|
|
9,931 |
|
|
|
(6,978 |
) |
|
|
3,109 |
|
|
Inventories |
|
|
7,264 |
|
|
|
(25,391 |
) |
|
|
(7,496 |
) |
|
Accounts payable |
|
|
(393 |
) |
|
|
4,101 |
|
|
|
1,494 |
|
|
Prepaid expenses and other assets |
|
|
(66 |
) |
|
|
(481 |
) |
|
|
755 |
|
|
Income taxes payable |
|
|
(371 |
) |
|
|
562 |
|
|
|
89 |
|
|
Other liabilities |
|
|
3,247 |
|
|
|
6,432 |
|
|
|
(5,535 |
) |
|
Net cash provided by operating activities |
|
|
39,374 |
|
|
|
42,249 |
|
|
|
3,418 |
|
|
CASH FLOWS FROM INVESTING ACTIVITIES |
|
|
|
|
|
|
|
|
|
|
|
|
|
Purchases of property and equipment |
|
|
(1,912 |
) |
|
|
(5,079 |
) |
|
|
(4,411 |
) |
|
Acquisition of a business, net of cash acquired |
|
|
(12,667 |
) |
|
|
— |
|
|
|
— |
|
|
Net cash used for investing activities |
|
|
(14,579 |
) |
|
|
(5,079 |
) |
|
|
(4,411 |
) |
|
CASH FLOWS FROM FINANCING ACTIVITIES |
|
|
|
|
|
|
|
|
|
|
|
|
|
Borrowings on revolving credit facilities |
|
|
219,910 |
|
|
|
361,073 |
|
|
|
172,694 |
|
|
Repayment of revolving credit facilities |
|
|
(241,640 |
) |
|
|
(362,154 |
) |
|
|
(170,132 |
) |
|
Repayment of capital leases |
|
|
— |
|
|
|
— |
|
|
|
(4 |
) |
|
Proceeds of term loan |
|
|
— |
|
|
|
3,265 |
|
|
|
|
|
|
Repayment of term loan |
|
|
— |
|
|
|
(14,985 |
) |
|
|
(2,647 |
) |
|
Repayment of subordinated notes - related party |
|
|
— |
|
|
|
(23,940 |
) |
|
|
— |
|
|
Settlement of Series B redeemable preferred stock |
|
|
— |
|
|
|
(1,390 |
) |
|
|
— |
|
|
Proceeds from exercise of stock options and warrants |
|
|
330 |
|
|
|
4,235 |
|
|
|
— |
|
|
Repurchase of common stock |
|
|
(2,525 |
) |
|
|
— |
|
|
|
— |
|
|
Repurchase of common stock to satisfy employee tax withholding obligations |
|
|
(255 |
) |
|
|
(246 |
) |
|
|
— |
|
|
Debt financing costs |
|
|
— |
|
|
|
(612 |
) |
|
|
(73 |
) |
|
Cash portion of loss on debt extinguishment |
|
|
— |
|
|
|
(375 |
) |
|
|
— |
|
|
Net cash used for financing activities |
|
|
(24,180 |
) |
|
|
(35,129 |
) |
|
|
(162 |
) |
|
Effect of exchange rate changes on cash and cash equivalents |
|
|
556 |
|
|
|
(210 |
) |
|
|
219 |
|
|
Net increase (decrease) in cash and cash equivalents |
|
|
1,171 |
|
|
|
1,831 |
|
|
|
(936 |
) |
|
Cash and cash equivalents - beginning of period |
|
|
7,078 |
|
|
|
5,247 |
|
|
|
6,183 |
|
|
Cash and cash equivalents - end of period |
|
$ |
8,249 |
|
|
$ |
7,078 |
|
|
$ |
5,247 |
|
|
SUPPLEMENTAL DISCLOSURE OF INFORMATION |
|
|
|
|
|
|
|
|
|
|
|
|
|
Cash paid for interest |
|
$ |
769 |
|
|
$ |
1,496 |
|
|
$ |
1,975 |
|
|
Cash paid for income taxes, net of refunds |
|
$ |
2,317 |
|
|
$ |
— |
|
|
$ |
— |
|
|
Accrual for purchases of property and equipment |
|
$ |
16 |
|
|
$ |
348 |
|
|
$ |
183 |
|
|
Reclassification of financial instrument obligation |
|
$ |
6,248 |
|
|
$ |
— |
|
|
$ |
— |
|
|
Exchange of Series B redeemable preferred stock |
|
$ |
— |
|
|
$ |
18,032 |
|
|
$ |
— |
|
See accompanying Notes to the Consolidated Financial Statements
34
Consolidated Statement of Stockholders’ Equity (Deficit)
|
|
|
Common Stock |
|
|
Additional Paid-In |
|
|
Accumulated |
|
|
Accumulated Other Comprehensive |
|
|
|
|
|
||||||||
|
|
|
Shares |
|
|
Amount |
|
|
Capital |
|
|
Deficit |
|
|
Income (Loss) |
|
|
Total |
|
||||||
|
|
|
(in thousands) |
|
|||||||||||||||||||||
|
Balance at December 31, 2016 |
|
|
12,315 |
|
|
$ |
12 |
|
|
$ |
146,652 |
|
|
$ |
(166,800 |
) |
|
$ |
(560 |
) |
|
$ |
(20,696 |
) |
|
Net loss |
|
|
— |
|
|
|
— |
|
|
|
— |
|
|
|
(3,248 |
) |
|
|
— |
|
|
|
(3,248 |
) |
|
Other comprehensive loss |
|
|
— |
|
|
|
— |
|
|
|
— |
|
|
|
— |
|
|
|
357 |
|
|
|
357 |
|
|
Issuance of restricted stock |
|
|
34 |
|
|
|
— |
|
|
|
— |
|
|
|
— |
|
|
|
— |
|
|
|
— |
|
|
Stock-based compensation |
|
|
— |
|
|
|
— |
|
|
|
1,430 |
|
|
|
— |
|
|
|
— |
|
|
|
1,430 |
|
|
Balance at December 31, 2017 |
|
|
12,349 |
|
|
|
12 |
|
|
|
148,082 |
|
|
|
(170,048 |
) |
|
|
(203 |
) |
|
|
(22,157 |
) |
|
Cumulative effect of the adoption of ASC 606 |
|
|
— |
|
|
|
— |
|
|
|
— |
|
|
|
(605 |
) |
|
|
— |
|
|
|
(605 |
) |
|
Net income |
|
|
— |
|
|
|
— |
|
|
|
— |
|
|
|
39,190 |
|
|
|
— |
|
|
|
39,190 |
|
|
Other comprehensive loss |
|
|
— |
|
|
|
— |
|
|
|
— |
|
|
|
— |
|
|
|
(273 |
) |
|
|
(273 |
) |
|
Issuance of common stock in exchange for Series B redeemable preferred stock, net of issuance costs |
|
|
1,307 |
|
|
|
1 |
|
|
|
15,474 |
|
|
|
— |
|
|
|
— |
|
|
|
15,475 |
|
|
Issuance of restricted stock |
|
|
56 |
|
|
|
— |
|
|
|
— |
|
|
|
— |
|
|
|
— |
|
|
|
— |
|
|
Repurchase of common stock and retirement of related treasury shares |
|
|
(12 |
) |
|
|
— |
|
|
|
(246 |
) |
|
|
— |
|
|
|
— |
|
|
|
(246 |
) |
|
Issuance of common stock upon exercise of warrants |
|
|
77 |
|
|
|
— |
|
|
|
778 |
|
|
|
— |
|
|
|
— |
|
|
|
778 |
|
|
Stock options exercised |
|
|
491 |
|
|
|
1 |
|
|
|
3,456 |
|
|
|
— |
|
|
|
— |
|
|
|
3,457 |
|
|
Stock-based compensation |
|
|
— |
|
|
|
— |
|
|
|
1,877 |
|
|
|
— |
|
|
|
— |
|
|
|
1,877 |
|
|
Balance at December 31, 2018 |
|
|
14,268 |
|
|
|
14 |
|
|
|
169,421 |
|
|
|
(131,463 |
) |
|
|
(476 |
) |
|
|
37,496 |
|
|
Net income |
|
|
— |
|
|
|
— |
|
|
|
— |
|
|
|
17,944 |
|
|
|
— |
|
|
|
17,944 |
|
|
Other comprehensive income, net of tax |
|
|
— |
|
|
|
— |
|
|
|
— |
|
|
|
— |
|
|
|
592 |
|
|
|
592 |
|
|
Reclassification of financial instrument obligation |
|
|
— |
|
|
|
— |
|
|
|
6,248 |
|
|
|
— |
|
|
|
— |
|
|
|
6,248 |
|
|
Issuance of restricted stock |
|
|
130 |
|
|
|
— |
|
|
|
(1 |
) |
|
|
— |
|
|
|
— |
|
|
|
(1 |
) |
|
Repurchase of common stock and retirement of related treasury shares |
|
|
(23 |
) |
|
|
— |
|
|
|
(255 |
) |
|
|
— |
|
|
|
— |
|
|
|
(255 |
) |
|
Common stock buyback |
|
|
(271 |
) |
|
|
— |
|
|
|
(2,525 |
) |
|
|
— |
|
|
|
— |
|
|
|
(2,525 |
) |
|
Issuance of common stock upon exercise of warrants |
|
|
296 |
|
|
|
— |
|
|
|
— |
|
|
|
— |
|
|
|
— |
|
|
|
— |
|
|
Stock options exercised |
|
|
89 |
|
|
|
— |
|
|
|
330 |
|
|
|
— |
|
|
|
— |
|
|
|
330 |
|
|
Stock-based compensation |
|
|
— |
|
|
|
— |
|
|
|
3,558 |
|
|
|
— |
|
|
|
— |
|
|
|
3,558 |
|
|
Balance at December 31, 2019 |
|
|
14,488 |
|
|
$ |
14 |
|
|
$ |
176,776 |
|
|
$ |
(113,519 |
) |
|
$ |
116 |
|
|
$ |
63,387 |
|
See accompanying Notes to the Consolidated Financial Statements
35
Notes to Consolidated Financial Statements
Note 1. Summary of Significant Accounting Policies
Organization
Turtle Beach Corporation (“Turtle Beach” or the “Company”), headquartered in San Diego, California and incorporated in the state of Nevada in 2010, is a premier audio technology company with expertise and experience in developing, commercializing and marketing innovative products across a range of large addressable markets under the Turtle Beach® and ROCCAT® brands. Turtle Beach is a worldwide leader of feature-rich headset solutions for use across multiple platforms, including video game and entertainment consoles, handheld consoles, personal computers (“PC”), tablets and mobile devices. ROCCAT is a gaming keyboards, mice and other accessories brand focused in the PC peripherals market.
VTB Holdings, Inc. (“VTBH”), a wholly-owned subsidiary of Turtle Beach and the owner of Voyetra Turtle Beach, Inc. (“VTB”), was incorporated in the state of Delaware in 2010. VTB, the owner of Turtle Beach Europe Limited (“TB Europe”), was incorporated in the state of Delaware in 1975 with operations principally located in Valhalla, New York.
Basis of Presentation
The accompanying consolidated financial statements have been prepared pursuant to the rules and regulations of the Securities and Exchange Commission (“SEC”) and, in the opinion of management, reflect all adjustments (which include normal recurring adjustments) considered necessary for a fair presentation of the financial position, results of operations, and cash flows for the periods presented. All intercompany accounts and transactions have been eliminated in consolidation.
Reverse Split
On April 6, 2018, the Company effected a one-for-four reverse stock split of its common stock pursuant to which every four shares of common stock outstanding immediately prior to the reverse split were combined into one share of common stock. As a result of the reverse split, all outstanding share amounts and computations using such amounts in the Company’s financial statements and notes thereto have been retroactively adjusted to reflect the reverse stock split.
Uses of Estimates
The preparation of financial statements in conformity with generally accepted accounting principles requires management to use estimates and assumptions that affect the reported amount of assets and liabilities and disclosures of contingent assets and liabilities at the date of the financial statements, as well as the reported amounts of revenue and expenses during the reporting period. The significant estimates and assumptions used by management affect: sales return reserve, allowances for cash discounts, warranty reserve, valuation of inventory, valuation of long-lived assets, goodwill and other intangible assets, depreciation and amortization of long-lived assets, valuation of deferred tax assets, determination of fair value of stock-based awards, stock warrants and share-based compensation. The Company evaluates estimates and assumptions on an ongoing basis using historical experience and other factors and adjusts those estimates and assumptions when facts and circumstances dictate. As future events and their effects cannot be determined with precision, actual results could differ from these estimates, and those differences could be material to the consolidated financial statements.
Revenue Recognition and Sales Return Reserve
Net revenue consists primarily of revenue from the sale of gaming headsets and accessories to wholesalers, retailers and to a lesser extent, on-line customers. These products function on a standalone basis (in connection with a readily available gaming console, personal computer or stereo) and are not sold with additional services or rights to future goods or services. Revenue is recorded for a contract through the following steps: (i) identifying the contract with the customer; (ii) identifying the performance obligations in the contract; (iii) determining the transaction price; (iv) allocating the transaction price to the performance obligations; and (v) recognizing revenue when or as each performance obligation is satisfied.
Each contract at inception is evaluated to determine whether the contract should be accounted for as having one or more performance obligations. The Company's business activities were determined to be a single performance obligation with revenue recognized when obligations under the terms of a contract with its customer are satisfied; generally this occurs at a point in time when the risk and title to the product transfers to the customer. The Company's standard terms of delivery are included in its contracts of sale, order confirmation documents, and invoices. The Company excludes sales taxes collected from customers from “Net Revenue” in its Consolidated Statements of Operations.
36
Certain customers may receive cash-based incentives (including cash discounts, quantity rebates, and price concessions), which are accounted for as variable consideration. Provisions for sales returns are recognized in the period the sale is recorded based upon the Company's prior experience and current trends. These revenue reductions are established by the Company based upon management’s best estimates at the time of sale following the historical trend, adjusted to reflect known changes in the factors that impact such reserves and allowances, and the terms of agreements with customers. As of December 31, 2019, the Company had an allowance for cash discounts of $16.0 million and an allowance for sales returns of $8.8 million, and does not expect to have significant changes in its estimates for variable considerations.
Cost of Revenue and Operating Expenses
The following table illustrates the primary costs classified in each major expense category:
|
Cost of Revenue |
|
Operating Expenses |
|
Cost to manufacture products; |
|
Payroll, bonus and benefit costs; |
|
Freight costs associated with moving product from suppliers to distribution centers and to customers; |
|
Costs incurred in the research and development of new products and enhancements to existing products; |
|
Costs associated with the movement of merchandise through customs; |
|
Depreciation related to demonstration units; |
|
Costs associated with material handling and warehousing; |
|
Legal, finance, information systems and other corporate overhead costs; |
|
Global supply chain personnel costs; |
|
Sales commissions, advertising and marketing costs. |
|
Product royalty costs. |
|
|
Product Warranty Obligations
The Company provides for product warranties in accordance with the contract terms given to various customers by accruing estimated warranty costs at the time of revenue recognition. Warranties are generally fulfilled by replacing defective products with new products.
Marketing Costs
Costs associated with the production of advertising, such as print and other costs, as well as costs associated with communicating advertising that has been produced, such as magazine ads, are expensed when the advertising first appears in public. Advertising costs were approximately $7.5 million, $6.7 million and $4.2 million for the years ended December 31, 2019, 2018 and 2017, respectively.
The Company also incurs co-operative advertising costs that represent reimbursements to customers for shared marketing expenses for sale of its products. These reimbursements are recorded as reductions of net revenue based on a percentage of sales for all period presented. Co-operative advertising reimbursements were approximately $5.7 million, $5.4 million and $3.1 million for the years ended December 31, 2019, 2018 and 2017, respectively.
Deferred Financing Costs
Deferred financing costs represent costs incurred in conjunction with our debt financing activities and are capitalized and amortized over the life of the related financing arrangements. If the debt is retired early, the related unamortized deferred financing costs are written off in the period the debt is retired as part of the net carrying value of the debt, and any gains or losses are recorded in the statement of operations under the caption “Other non-operating expense (income), net.”
Stock-Based Compensation
Compensation costs related to stock options and restricted stock grants are calculated based on the fair value of the stock-based awards on the date of grant, net of estimated forfeitures. The grant date fair value of awards is determined using the Black-Scholes option-pricing model and the related stock-based compensation is recognized on a straight-line basis over the period in which an employee is required to provide service in exchange for the award, which is generally four years.
The Company estimates its forfeiture rate based on an analysis of actual forfeitures and will continue to evaluate the adequacy of the forfeiture rate based on actual forfeiture experience, analysis of employee turnover behavior, and other factors. The impact from any forfeiture rate adjustment would be recognized in the period of adjustment and if the actual number of future forfeitures differs from estimates, the Company might be required to record adjustments to stock-based compensation expense.
For stock-based awards issued to non-employees, including consultants, compensation expense is based on the fair value of the awards calculated using the Black-Scholes option-pricing model over the service performance period. The fair value of options granted to non-employees for each reporting period is remeasured over the vesting period and recognized as an expense over the period the services are received.
37
Management-approved restructuring activities are periodically initiated to achieve cost savings through reduced operational redundancies and to position the Company strategically in the market in response to prevailing economic conditions and associated customer demand. Costs associated with restructuring actions can include severance, infrastructure charges to vacate facilities or consolidate operations, contract termination costs and other related charges. For involuntary separation plans, a liability is recognized when it is probable and reasonably estimable. For one-time termination benefits, such as additional severance pay or benefit payouts, and other exit costs, such as lease termination costs, the liability is measured and recognized initially at fair value in the period in which the liability is incurred, with subsequent changes to the liability recognized as adjustments in the period of change.
Net Earnings (Loss) per Common Share
Basic earnings (loss) per share is calculated by dividing net income (loss) associated with common stockholders by the weighted average number of common shares outstanding during the period. Diluted earnings (loss) per share assumes the issuance of additional shares of common stock by the Company upon exercise of all outstanding stock options, stock warrants and contingently issuable securities if the effect is dilutive, in accordance with the treasury stock method.
Cash Equivalents
Cash and short-term highly liquid investments with original maturity dates of three months or less at time of purchase and no redemption restrictions are considered cash and cash equivalents.
Inventories
Inventories consist primarily of finished goods and related component parts, and are stated at the lower of weighted average cost or market value (estimated net realizable value) using the first in, first out (“FIFO”) method. The Company maintains an inventory allowance for returned goods, slow-moving and unused inventories based on the historical trend and estimates. Inventory write-downs, once established, are not reversed as they establish a new cost basis for the inventory. Inventory write-downs are included as a component of cost of revenues in the accompanying consolidated statements of operations.
Property and Equipment, net
Property and equipment are presented at cost less accumulated depreciation and amortization. Repairs and maintenance expenditures are expensed as incurred. Depreciation and amortization are computed on a straight-line basis over the following estimated useful lives:
|
|
|
Estimated Life |
|
Machinery and equipment |
|
3 years |
|
Software and software development |
|
2-3 years |
|
Furniture and fixtures |
|
5 years |
|
Tooling |
|
2 years |
|
Leasehold improvements |
|
Term of lease or economic life of asset, if shorter |
|
Demonstration units and convention booths |
|
2 years |
Valuation of Long-Lived and Intangible Assets and Goodwill
At acquisition, we estimate and record the fair value of purchased intangible assets, which primarily consists of in-process research and development, customer relationships, trademarks and trade names, and patents. The fair values of these intangible assets are estimated based on the Company’s assessment. Goodwill is the excess of the purchase price over the fair value of identifiable net assets acquired in business combinations. Goodwill and certain other intangible assets having indefinite lives are not amortized to earnings, but instead are subject to periodic testing for impairment. Intangible assets determined to have definite lives are amortized over their remaining useful lives.
Long-lived and intangible assets are assessed for potential impairment whenever events or changes in circumstances indicate that full recoverability of net asset balances through future cash flows is in question. Goodwill and indefinite-lived intangible assets are assessed at least annually, but also whenever events or changes in circumstances indicate the carrying values may not be recoverable. Factors that could trigger an impairment review include (a) significant underperformance relative to historical or projected future operating results; (b) significant changes in the manner of use of the acquired assets or the strategy for the Company’s overall business; (c) significant negative industry or economic trends; (d) significant decline in the Company’s stock price for a sustained period; and (e) a decline in the Company’s market capitalization below net book value.
Assessment for possible impairment is based on the Company’s ability to recover the carrying value of the long-lived asset from the expected future pre-tax cash flows. The expected future pre-tax cash flows are estimated based on historical experience, internal knowledge and market data. Estimates of future cash flows require the Company to make assumptions and to apply judgment, including forecasting future sales and expenses and estimating the useful lives of assets. If the expected future cash flows related to the long-lived assets are less than the assets’ carrying value, an impairment charge is recognized for the difference between estimated fair value and carrying value.
38
When performing the Company’s evaluation of goodwill for impairment, if it concludes qualitatively that it is not more likely than not that the fair value of the reporting unit is less than its carrying amount, then the two-step impairment test is not required. If the Company is unable to reach this conclusion, then we would perform the two-step impairment test. Initially, the fair value of the reporting unit is compared to its carrying amount. To the extent the carrying amount of a reporting unit exceeds the fair value of the reporting unit; we are required to perform a second step, as this is an indication that the reporting unit goodwill may be impaired. In this step, the Company compares the implied fair value of the reporting unit goodwill with the carrying amount of the reporting unit goodwill and recognize a charge for impairment to the extent the carrying value exceeds the implied fair value. The implied fair value of goodwill is determined by allocating the fair value of the reporting unit to all of the assets (recognized and unrecognized) and liabilities of the reporting unit in a manner similar to a purchase price allocation. The residual fair value after this allocation is the implied fair value of the reporting unit goodwill. In addition, identifiable intangible assets having indefinite lives are reviewed for impairment on an annual basis using a methodology consistent with that used to evaluate goodwill.
There are inherent assumptions and estimates used in developing future cash flows requiring management judgment including projecting revenues, interest rates and the cost of capital. Many of the factors used in assessing fair value are outside the Company’s control and it is reasonably likely that assumptions and estimates will change in future periods. These changes can result in future impairments. In the event the Company’s planning assumptions were modified resulting in impairment to our assets, the associated expense would be included in the Consolidated Statements of Operations, which could materially impact its business, financial condition and results of operations.
In connection with the ROCCAT acquisition, the Company performed a valuation of the acquired goodwill and intangible assets and recorded $8.5 million of goodwill based on the fair values of the assets acquired and liabilities assumed. The Company conducted its annual impairment assessment on December 31, 2019 taking a qualitative evaluation approach to determine if there were any adverse market factors or changes in circumstances that would indicate that the carrying value of goodwill as determined in connection with the current year acquisition may not be recoverable. The Company’s qualitative assessment included an analysis of business changes, economic outlook, financial trends and forecasts, and events or circumstances that could unfavorably impact the key assumptions. Based on this review, management determined that no events or changes in circumstances indicated that the carrying value may not be recoverable and further consideration of potential goodwill impairment was not considered necessary.
Income Taxes
The Company accounts for income taxes in accordance with the asset and liability method. Under the asset and liability method, deferred tax assets and liabilities are recognized based on the differences between the financial statement carrying value of existing assets and liabilities and their respective tax bases based on enacted tax laws and statutory tax rates applicable to the periods in which the Company expects the temporary differences to reverse. The Company had elected to record a “deferred charge” for basis differences relating to intra-entity profits as recognition as a deferred tax asset is prohibited.
A valuation allowance is established for deferred tax assets when management anticipates that it is more likely than not that all, or a portion, of these assets would not be realized. In determining whether a valuation allowance is warranted, all positive and negative evidence and all sources of taxable income such as prior earnings history, expected future earnings, carryback and carryforward periods and tax strategies are considered to estimate if sufficient future taxable income will be generated to realize the deferred tax asset. The assessment of the adequacy of a valuation allowance is based on estimates of taxable income by jurisdiction and the period over which deferred tax assets will be recoverable. In the event that actual results differ from these estimates, or these estimates are adjusted in future periods for current trends or expected changes in assumptions, the Company may need to modify the level of valuation allowance which could materially impact our business, financial condition and results of operations.
The tax effects of uncertain tax positions taken or expected to be taken in income tax returns are recognized only if they are “more likely-than-not” to be sustained on examination by the taxing authorities based on the technical merits as of the reporting date. The tax benefits recognized in the financial statements from such positions are measured based on the largest benefit that has a greater than fifty percent likelihood of being realized upon ultimate settlement. The Company recognizes estimated accrued interest and penalties related to uncertain tax positions in income tax expense.
The Company and its domestic subsidiaries file a consolidated federal income tax return, while the Company’s foreign subsidiary files in its respective local jurisdictions.
Fair Value of Financial Instruments
The Company determines fair value as the price that would be received to sell an asset or paid to transfer a liability in an orderly transaction between market participants at the measurement date. The Company uses a hierarchical structure to prioritize the inputs used to measure fair value into three broad levels. The fair value hierarchy gives the highest priority to quoted prices in active markets for identical assets or liabilities (Level 1), then to quoted market prices for similar assets or liabilities in active or inactive markets (Level 2) and gives the lowest priority to unobservable inputs (Level 3).
Financial instruments consist of cash and cash equivalents, accounts receivable, accounts payable, revolving line of credit, long-term debt and warrants reported as a financial instrument obligation. Cash equivalents are stated at amortized cost, which approximated fair value as of the consolidated balance sheet dates due to the short period of time to maturity; and accounts receivable and accounts payable are stated at their carrying value, which approximates fair value due to the short time to the expected receipt or payment. The revolving line of credit and long-term debt are stated at the carrying value as the stated interest rate approximates market rates currently available to the Company, which are considered Level 2 inputs. The wholly-funded warrants are stated at their fair value based on a Black-Scholes pricing model.
39
The Company did not have any non-financial assets or non-financial liabilities recognized at fair value on a recurring basis at December 31, 2019 and 2018.
Foreign Currency Translation
Balance sheet accounts of the Company’s foreign subsidiaries are translated at the exchange rate in effect at the end of each period. Statement of operations accounts are translated using the weighted average of the prevailing exchange rates during each period. Gains or losses resulting from foreign currency transactions are included in the Company’s Consolidated Statements of Operations under the caption “Other non-operating expense (income), net” whereas translation adjustments are reflected in the Consolidated Statements of Comprehensive Income (Loss) under the caption “Foreign currency translation adjustment.”
Concentration of Credit Risk
Financial instruments that potentially subject the Company to concentrations of credit risk consist principally of investments in cash, cash equivalents and accounts receivables. The Company is exposed to credit risk and liquidity risk in the event of default by the financial institutions or issuers of investments in excess of FDIC insured limits. The Company performs periodic evaluations of the relative credit standing of these financial institutions and limits the amount of credit exposure with any institution.
Accounts receivable are unsecured and represent amounts due based on contractual obligations of customers. The Company’s three largest individual customers accounted for approximately 42% of its gross sales in the aggregate for the year ended December 31, 2019, or individually 11%, 20% and 11%, compared to 13%, 19% and 11% in 2018 and 16%, 14% and 13% in 2017. In addition, these three customers accounted for 33%, 29% and 9% of accounts receivable as of December 31, 2019 and 30%, 29% and 18% as of December 31, 2018.
Concentrations of credit risk with respect to accounts receivable are mitigated by performing ongoing credit evaluations of customers to assess the probability of collection based on a number of factors, including past transaction experience with the customer, evaluation of their credit history, limiting the credit extended, and review of the invoicing terms of the contract. In addition, the Company has credit insurance in place through a third-party insurer against defaults by certain other domestic and international customers, subject to policy limits. The Company generally does not require customers to provide collateral to support accounts receivable. The Company has recorded an allowance for doubtful accounts for those receivables that were determined not to be collectible.
Foreign cash balances at December 31, 2019 and 2018 were $5.9 million and $5.2 million, respectively.
Segment Information
The company operates in a single reportable segment and two reporting unit structure. The entire business is managed by a single management team whose chief operating decision maker is the Chief Executive Officer, who reviews financial information presented on a consolidated basis for purposes of allocating resources and evaluating financial performance.
Recent Accounting Pronouncements
In February 2016, the FASB issued ASU No. 2016-02, Leases, that introduced the recognition of a right-of-use asset, which is an asset that represents the lessee’s right to use, or control the use of, a specified asset for the lease term and, a lease liability, which is a lessee’s obligation to make lease payments arising from a lease, measured on a discounted basis for all leases (with the exception of short-term leases). The Company adopted this standard on its effective date of January 1, 2019, using the optional alternative approach, which applies the provisions of the new guidance at the effective date without adjusting the comparative periods. As part of the adoption of the new standard, the Company elected the package of practical expedients that permits entities to not reassess prior conclusions regarding lease identification, lease classification, and initial direct costs under the new standard. Upon adoption of the new standard as it relates to the Company's accounting for real estate operating leases, assets and liabilities increased by approximately $3.3 million.
In January 2017, the FASB issued ASU No. 2017-04, Intangibles-Goodwill and Other: Simplifying the Test for Goodwill Impairment, which simplifies how an entity is required to test goodwill for impairment. A goodwill impairment will be measured by the amount by which a reporting unit’s carrying value exceeds its fair value, with the amount of impairment not to exceed the carrying amount of goodwill. ASU 2017-04 is effective for goodwill impairment tests in fiscal years beginning after December 15, 2019, and for interim periods within those fiscal years, and must be adopted on a prospective basis. Early adoption is permitted. The Company does not expect the adoption of this guidance to have a material impact on its financial statements.
In June 2018, the FASB issued ASU 2018-07, Improvements to Non-employee Share-Based Payment Accounting, that expands the scope of Topic 718, Compensation—Stock Compensation, to include share-based payments issued to non-employees for goods or services and substantially aligned the accounting for share-based payments to non-employees and employees. The amendments are effective for fiscal years beginning after December 15, 2019, and interim periods within fiscal years beginning after December 15, 2020. The Company is evaluating the effect that this guidance will have on the financial statements and related disclosures.
40
In August 2018, the FASB issued ASU No. 2018-13, Changes to the Disclosure Requirements for Fair Value Measurement, that removes certain disclosure requirements related to the fair value hierarchy, modifies existing disclosure requirements related to measurement uncertainty and adds new disclosure requirements. The new disclosure requirements include disclosing the changes in unrealized gains and losses for the period included in other comprehensive income for recurring Level 3 fair value measurements held at the end of the reporting period and the range and weighted average of significant unobservable inputs used to develop Level 3 fair value measurements. The provisions of this ASU are effective for years beginning after December 15, 2019, with early adoption permitted. Certain disclosures in the new guidance will need to be applied on a retrospective basis and others on a prospective basis.
In December 2019, the FASB issued ASU No. 2019-12, Simplifying the Accounting for Income Taxes, which amends ASC Topic 740 by removing certain exceptions related to the approach for intraperiod tax allocation, the methodology for calculating income taxes in an interim period and the recognition of deferred tax liabilities for outside basis differences. It also simplifies aspects of the accounting for franchise taxes and enacted changes in tax laws or rates and clarifies the accounting for transactions that result in a step-up in the tax basis of goodwill. The pronouncement is effective for fiscal years beginning after December 15, 2020, or for any interim periods within those fiscal years, with early adoption permitted. The Company does not expect the adoption of this guidance to have a material impact on its financial statements.
Note 2. Acquisitions
ROCCAT
On May 31, 2019, the Company completed its acquisition of the business and assets of ROCCAT, a provider of gaming keyboards, mice and other accessories for a purchase price of approximately $12.7 million and up to $3.4 million in potential earn-outs based on revenues for the years ending December 31, 2019 and 2020, as provided in the asset purchase agreement. The purchase price was paid in cash at closing and was funded by the Company’s cash reserves and additional borrowings under its credit facility. In addition, business transaction costs incurred in connection with the acquisition of $3.5 million for the year ended December 31, 2019 were recorded as a component of “General and administrative” expenses in the Condensed Consolidated Statements of Operations.
The preliminary ROCCAT purchase price allocation as of May 31, 2019 is shown in the following table:
|
(In thousands) |
|
Amount |
|
|
|
Receivables |
|
$ |
1,257 |
|
|
Inventories |
|
|
6,986 |
|
|
Property and equipment |
|
|
1,110 |
|
|
Intangible assets |
|
|
5,589 |
|
|
Other long-term assets |
|
|
461 |
|
|
Accounts payable |
|
|
(5,510 |
) |
|
Accrued and other current liabilities |
|
|
(3,821 |
) |
|
Contingent consideration |
|
|
(1,592 |
) |
|
Other non-current liabilities |
|
|
(328 |
) |
|
Total identifiable net assets |
|
|
4,152 |
|
|
Goodwill |
|
|
8,515 |
|
|
Total consideration |
|
$ |
12,667 |
|
The fair values of ROCCAT’s assets and liabilities are provisional and were determined based on preliminary estimates and assumptions that management believes are reasonable. The preliminary purchase price allocation is subject to further refinement and may require significant adjustments to arrive at the final purchase price allocation. These adjustments will primarily relate to certain short-term assets, intangible assets, and certain liabilities including contingent consideration. The final determination of the fair value of certain assets and liabilities will be completed as soon as the necessary information is available, including the completion of a valuation of the tangible and intangible assets and the contingent consideration, but no later than one year from the acquisition date.
The goodwill from the acquisition of ROCCAT, which is fully deductible for tax purposes, consists largely of synergies and economies of scale expected from combining the operations of ROCCAT and the Company’s existing business.
The estimate of fair value of ROCCAT’s identifiable intangible assets was determined primarily using the “income approach,” which requires a forecast of all of the expected future cash flows either through the use of the multi-period excess earnings method or the relief-from-royalty method. Some of the more significant assumptions inherent in the development of intangible asset values include: the amount and timing of projected future cash flows, the discount rate selected to measure the risks inherent in the future cash flows, the assessment of the intangible asset’s life cycle, as well as other factors. The following table summarizes key information underlying intangible assets related to the
ROCCAT acquisition:
41
|
(In thousands) |
|
Life |
|
Amount |
|
|
|
Customer relationships |
|
7 Years |
|
$ |
2,119 |
|
|
Tradenames |
|
10 Years |
|
|
2,686 |
|
|
Developed technology |
|
7 Years |
|
|
784 |
|
|
Total |
|
|
|
$ |
5,589 |
|
For the year ended December 31, 2019, ROCCAT had revenue of $14.4 million. The Company is are unable to provide the results of operations attributable to ROCCAT as those operations were substantially integrated into our legacy business.
The Company has not presented combined pro forma financial information of the Company and the pre-acquisition ROCCAT business because the results of operations of the acquired business are considered immaterial.
In connection with the $1.6 million fair value of the potential $3.4 million earn-outs, for the year ended December 31, 2019, the fair value of the contingent consideration decreased $0.5 million primarily as a result of the revenues not achieving the stated threshold in the asset purchase agreement.
Note 3. Fair Value Measurement
The Company follows a three-level fair value hierarchy that prioritizes the inputs used to measure fair value. This hierarchy requires entities to maximize the use of observable inputs and minimize the use of unobservable inputs. The three levels of inputs used to measure fair value are as follows:
|
|
• |
Level 1 — Quoted prices in active markets for identical assets or liabilities. |
|
|
• |
Level 2 — Observable inputs other than quoted prices included in Level 1, such as quoted prices for markets that are not active, or other inputs that are observable or can be corroborated by observable market data. |
|
|
• |
Level 3 — Unobservable inputs that are supported by little or no market activity and that are significant to the fair value of the assets or liabilities. This includes certain pricing models, discounted cash flow methodologies and similar techniques that use significant unobservable inputs. |
Financial instruments consist of cash and cash equivalents, accounts receivable, accounts payable, debt instruments and certain warrants. As of December 31, 2019 and 2018, the Company has not elected the fair value option for any financial assets and liabilities for which such an election would have been permitted, and the only outstanding financial assets and liabilities recorded at fair value on a recurring basis were the wholly-funded warrants reported as a financial instrument obligation.
The following is a summary of the carrying amounts and estimated fair values of our financial instruments at December 31, 2019 and 2018:
|
|
|
December 31, 2019 |
|
|
December 31, 2018 |
|
||||||||||
|
|
|
Reported |
|
|
Fair Value |
|
|
Reported |
|
|
Fair Value |
|
||||
|
|
|
(in thousands) |
|
|||||||||||||
|
Financial Assets and Liabilities: |
|
|
|
|
|
|
|
|
|
|
|
|
|
|
|
|
|
Cash and cash equivalents |
|
$ |
8,249 |
|
|
$ |
8,249 |
|
|
$ |
7,078 |
|
|
$ |
7,078 |
|
|
Revolving credit facility |
|
$ |
15,655 |
|
|
$ |
15,655 |
|
|
$ |
37,385 |
|
|
$ |
37,385 |
|
|
Financial instrument obligation |
|
$ |
— |
|
|
$ |
— |
|
|
$ |
7,848 |
|
|
$ |
7,848 |
|
|
Contingent consideration liabilities |
|
$ |
1,121 |
|
|
$ |
1,121 |
|
|
$ |
— |
|
|
$ |
— |
|
Cash equivalents are stated at amortized cost, which approximates fair value as of the consolidated balance sheet dates, due to the short period of time to maturity; and accounts receivable and accounts payable are stated at their carrying value, which approximates fair value due to the short time to the expected receipt or payment. The carrying value of the Credit Facility equals fair value as the stated interest rate approximates market rates currently available to the Company, which is considered a Level 2 input. The Company values contingent consideration related to business combinations using a weighted probability calculation of potential payment scenarios discounted at rates reflective of the risks associated with the expected future cash flows.
The liability-classified warrants reported as a financial instrument obligation were classified within Level 3 because the Company used a Black-Scholes pricing model to estimate the fair value based on inputs that were not observable in any market.
42
Note 4. Allowance for Sales Returns
The following table provides the changes in the Company’s sales return reserve, which is classified as a reduction of accounts receivable:
|
|
|
Year ended December 31, |
|
|||||||||
|
|
|
2019 |
|
|
2018 |
|
|
2017 |
|
|||
|
|
|
in thousands |
|
|||||||||
|
Balance, beginning of period |
|
$ |
9,212 |
|
|
$ |
5,533 |
|
|
$ |
4,591 |
|
|
Reserve accrual |
|
|
16,866 |
|
|
|
21,340 |
|
|
|
10,457 |
|
|
Recoveries and deductions, net |
|
|
(17,263 |
) |
|
|
(17,661 |
) |
|
|
(9,515 |
) |
|
Balance, end of period |
|
$ |
8,815 |
|
|
$ |
9,212 |
|
|
$ |
5,533 |
|
Note 5. Composition of Certain Financial Statement Items
Inventories
Inventories consist of the following:
|
|
|
December 31, 2019 |
|
|
December 31, 2018 |
|
||
|
|
|
(in thousands) |
|
|||||
|
Raw materials |
|
$ |
1,288 |
|
|
$ |
1,410 |
|
|
Finished goods |
|
|
44,423 |
|
|
|
48,062 |
|
|
Total inventories |
|
$ |
45,711 |
|
|
$ |
49,472 |
|
Property and Equipment, net
Property and equipment, net consists of the following:
|
|
|
December 31, 2019 |
|
|
December 31, 2018 |
|
||
|
|
|
(in thousands) |
|
|||||
|
Machinery and equipment |
|
$ |
1,783 |
|
|
$ |
1,616 |
|
|
Software and software development |
|
|
439 |
|
|
|
306 |
|
|
Furniture and fixtures |
|
|
601 |
|
|
|
535 |
|
|
Tooling |
|
|
5,340 |
|
|
|
3,925 |
|
|
Leasehold improvements |
|
|
1,326 |
|
|
|
1,325 |
|
|
Demonstration units and convention booths |
|
|
12,051 |
|
|
|
11,659 |
|
|
Total property and equipment, gross |
|
|
21,540 |
|
|
|
19,366 |
|
|
Less: accumulated depreciation and amortization |
|
|
(17,578 |
) |
|
|
(13,510 |
) |
|
Total property and equipment, net |
|
$ |
3,962 |
|
|
$ |
5,856 |
|
Depreciation and amortization expense on property and equipment for the years ended December 31, 2019, 2018 and 2017 was $4.6 million, $4.0 million and $4.1 million, respectively.
Other Current Liabilities
Other current liabilities consist of the following:
|
|
|
December 31, 2019 |
|
|
December 31, 2018 |
|
||
|
|
|
(in thousands) |
|
|||||
|
Accrued customer fees |
|
$ |
3,147 |
|
|
$ |
570 |
|
|
Accrued royalty |
|
|
3,880 |
|
|
|
4,069 |
|
|
Accrued employee expenses |
|
|
3,674 |
|
|
|
4,570 |
|
|
Accrued marketing |
|
|
3,695 |
|
|
|
1,692 |
|
|
Foreign tax liability |
|
|
2,504 |
|
|
|
1,311 |
|
|
Accrued expenses |
|
|
9,522 |
|
|
|
6,276 |
|
|
Total other current liabilities |
|
$ |
26,422 |
|
|
$ |
18,488 |
|
43
Other non-operating expense (income), net
Other non-operating expense (income), net consists of the following:
|
|
|
Year Ended |
|
|||||||||
|
|
|
December 31, |
|
|||||||||
|
|
|
2019 |
|
|
2018 |
|
|
2017 |
|
|||
|
|
|
(in thousands) |
|
|||||||||
|
Unrealized loss (gain) on financial instrument obligation |
|
$ |
(1,601 |
) |
|
$ |
5,291 |
|
|
$ |
— |
|
|
Change in fair value of contingent consideration |
|
|
(471 |
) |
|
|
— |
|
|
|
— |
|
|
Loss on debt extinguishment |
|
|
— |
|
|
|
1,572 |
|
|
|
— |
|
|
Other non-operating expense (income) |
|
|
(137 |
) |
|
|
916 |
|
|
|
(463 |
) |
|
Total other non-operating expense (income),net |
|
$ |
(2,209 |
) |
|
$ |
7,779 |
|
|
$ |
(463 |
) |
Note 6. Goodwill and Other Intangible Assets
Acquired Intangible Assets
Acquired identifiable intangible assets, and related accumulated amortization, as of December 31, 2019 and 2018 consist of:
|
|
|
December 31, 2019 |
|
|||||||||
|
|
|
Gross Carrying Value |
|
|
Accumulated Amortization |
|
|
Net Book Value |
|
|||
|
|
|
(in thousands) |
|
|||||||||
|
Customer relationships |
|
$ |
7,915 |
|
|
$ |
5,024 |
|
|
$ |
2,891 |
|
|
Tradenames |
|
|
2,686 |
|
|
|
157 |
|
|
|
2,529 |
|
|
Developed technology |
|
|
784 |
|
|
|
65 |
|
|
|
719 |
|
|
Foreign currency |
|
|
(1,004 |
) |
|
|
(876 |
) |
|
|
(128 |
) |
|
Total Intangible Assets |
|
$ |
10,381 |
|
|
$ |
4,370 |
|
|
$ |
6,011 |
|
|
|
|
December 31, 2018 |
|
|||||||||
|
|
|
Gross Carrying Value |
|
|
Accumulated Amortization |
|
|
Net Book Value |
|
|||
|
|
|
(in thousands) |
|
|||||||||
|
Customer relationships |
|
$ |
5,796 |
|
|
$ |
4,539 |
|
|
$ |
1,257 |
|
|
Foreign currency |
|
|
(1,158 |
) |
|
|
(937 |
) |
|
|
(221 |
) |
|
Total Intangible Assets |
|
$ |
4,638 |
|
|
$ |
3,602 |
|
|
$ |
1,036 |
|
In connection with the October 2012 acquisition of TB Europe, the acquired intangible asset related to customer relationships is being amortized over an estimated useful life of thirteen years with the amortization being included within sales and marketing expense.
Amortization expense related to definite lived intangible assets was $0.6 million, $0.3 million and $0.3 million for the years ended December 31, 2019, 2018 and 2017, respectively.
As of December 31, 2019, estimated annual amortization expense related to definite lived intangible assets in future periods is as follows:
|
|
|
(in thousands) |
|
|
|
2020 |
|
$ |
942 |
|
|
2021 |
|
|
901 |
|
|
2022 |
|
|
866 |
|
|
2023 |
|
|
837 |
|
|
2024 |
|
|
813 |
|
|
Thereafter |
|
|
1,780 |
|
|
Total |
|
$ |
6,139 |
|
44
Changes in the carrying values of goodwill for twelve months ended December 31, 2019 are as follows:
|
|
|
(in thousands) |
|
|
|
Balance as of January 1, 2019 |
|
$ |
— |
|
|
ROCCAT Acquisition |
|
|
8,515 |
|
|
Balance as of December 31, 2019 |
|
$ |
8,515 |
|
Note 7. Credit Facilities and Long-Term Debt
|
|
December 31, 2019 |
|
|
December 31, 2018 |
|
||
|
|
(in thousands) |
|
|||||
|
Revolving credit facility, maturing March 2024 |
$ |
15,655 |
|
|
$ |
37,385 |
|
Total interest expense, inclusive of amortization of deferred financing costs, on long-term debt obligations was $0.9 million, $4.3 million and $5.8 million for the years ended December 31, 2019, 2018 and 2017, respectively.
Amortization of deferred financing costs was $0.2 million, $1.1 million and $1.6 million for the years ended December 31, 2019, 2018 and 2017, respectively. In connection with the Company’s amendment and restatement of its Credit Facility (as noted below), the Company incurred $0.6 million of financing costs that have been deferred, added to the then remaining unamortized financing costs and will be recognized over the term of the respective agreement.
Revolving Credit Facility
On December 17, 2018, Turtle Beach and certain of its subsidiaries entered into an amended and restated loan, guaranty and security agreement (“Credit Facility”) with Bank of America, N.A. (“Bank of America”), as Agent, Sole Lead Arranger and Sole Bookrunner, which replaced the then existing asset-based revolving loan agreement. The Credit Facility, which expires on March 5, 2024, provides for a line of credit of up to $80 million inclusive of a sub-facility limit of $12 million for TB Europe, a wholly-owned subsidiary of Turtle Beach. In addition, the Credit Facility provides for a $40 million accordion feature and the ability to increase the borrowing base with a FILO Loan of up to $6.8 million.
On May 31, 2019, the Company amended the Credit Facility to provide for, amongst other items, (i) the addition of TBC Holding Company LLC, a wholly-owned subsidiary of VTB, as an obligor and (ii) the ability to make investments in TB Germany GmbH, a wholly-owned subsidiary of TB Europe, of up to $4 million in connection with the acquisition of ROCCAT and up to an additional $4 million annually.
The maximum credit availability for loans and letters of credit under the Credit Facility is governed by a borrowing base determined by the application of specified percentages to certain eligible assets, primarily eligible trade accounts receivable and inventories, and is subject to discretionary reserves and revaluation adjustments. The Credit Facility may be used for working capital, the issuance of bank guarantees, letters of credit and other corporate purposes.
Amounts outstanding under the Credit Facility bear interest at a rate equal to either a rate published by Bank of America or the LIBOR rate, plus in each case, an applicable margin, which is between 0.50% to 1.25% for base rate loans, 1.25% to 2.00% for U.S. LIBOR loans and U.K. loans and 2.00% and 2.75% for the FILO Loan. In addition, Turtle Beach is required to pay a commitment fee on the unused revolving loan commitment at a rate ranging from 0.25% to 0.50%, and letter of credit fees and agent fees. As of December 31, 2019, interest rates for outstanding borrowings were 5.25% for base rate loans and 3.13% for LIBOR rate loans.
The Company is subject to quarterly financial covenant testing if certain availability thresholds are not met or certain other events occur (as defined in the Credit Facility). The Credit Facility requires the Company and its restricted subsidiaries to maintain a fixed charge coverage ratio of at least 1.00 to 1.00 as of the last day of each fiscal quarter.
The Credit Facility also contains affirmative and negative covenants that, subject to certain exceptions, limit the Company's ability to take certain actions, including its ability to incur debt, pay dividends and repurchase stock, make certain investments and other payments, enter into certain mergers and consolidations, engage in sale leaseback transactions and transactions with affiliates and encumber and dispose of assets. Obligations under the Credit Facility are secured by a security interest and lien upon substantially all of the Company's assets.
As of December 31, 2019, the Company was in compliance with all the financial covenants under the Credit Facility, as amended, and excess borrowing availability was approximately $32.2 million.
45
The provision (benefit) for income taxes consists of the following:
|
|
|
Year Ended |
|
|||||||||
|
|
|
|
|
|
|
|
|
|
|
|
|
|
|
|
|
2019 |
|
|
2018 |
|
|
2017 |
|
|||
|
|
|
(in thousands) |
|
|||||||||
|
Federal: |
|
|
|
|
|
|
|
|
|
|
|
|
|
Current |
|
$ |
230 |
|
|
$ |
423 |
|
|
$ |
227 |
|
|
Deferred |
|
|
(5,910 |
) |
|
|
— |
|
|
|
— |
|
|
Total Federal |
|
|
(5,680 |
) |
|
|
423 |
|
|
|
227 |
|
|
State and Local: |
|
|
|
|
|
|
|
|
|
|
|
|
|
Current |
|
|
114 |
|
|
|
300 |
|
|
|
185 |
|
|
Deferred |
|
|
(1,529 |
) |
|
|
— |
|
|
|
— |
|
|
Total State and Local |
|
|
(1,415 |
) |
|
|
300 |
|
|
|
185 |
|
|
Foreign |
|
|
|
|
|
|
|
|
|
|
|
|
|
Current |
|
|
897 |
|
|
|
378 |
|
|
|
— |
|
|
Deferred |
|
|
(39 |
) |
|
|
636 |
|
|
|
181 |
|
|
Total Foreign |
|
|
858 |
|
|
|
1,014 |
|
|
|
181 |
|
|
Total |
|
$ |
(6,237 |
) |
|
$ |
1,737 |
|
|
$ |
593 |
|
The reconciliation between the provision (benefit) for income taxes and the expected provision (benefit) for income taxes at the U.S. federal statutory rate is as follows:
|
|
|
Year Ended |
|
|||||||||
|
|
|
December 31, |
|
|||||||||
|
|
|
2019 |
|
|
2018 |
|
|
2017 |
|
|||
|
|
|
(in thousands) |
|
|||||||||
|
U.S. Operations |
|
$ |
8,030 |
|
|
$ |
37,466 |
|
|
$ |
(3,722 |
) |
|
Foreign Operations |
|
|
3,677 |
|
|
|
3,461 |
|
|
|
1,067 |
|
|
Income (loss) before income taxes |
|
|
11,707 |
|
|
|
40,927 |
|
|
|
(2,655 |
) |
|
Federal statutory rate |
|
|
21 |
% |
|
|
21 |
% |
|
|
35 |
% |
|
Provision for income taxes at federal statutory rate |
|
|
2,458 |
|
|
|
8,595 |
|
|
|
(929 |
) |
|
State taxes, net of federal benefit |
|
|
989 |
|
|
|
594 |
|
|
|
157 |
|
|
Foreign tax rate differential |
|
|
(33 |
) |
|
|
(50 |
) |
|
|
(92 |
) |
|
Change in valuation allowance |
|
|
(10,112 |
) |
|
|
(8,497 |
) |
|
|
(10,043 |
) |
|
Change in tax rate |
|
|
— |
|
|
|
— |
|
|
|
10,526 |
|
|
Interest on Series B redeemable preferred stock |
|
|
— |
|
|
|
105 |
|
|
|
504 |
|
|
Unrealized loss (gain) on financial instrument obligation |
|
|
(336 |
) |
|
|
1,111 |
|
|
|
— |
|
|
Subpart F Income |
|
|
— |
|
|
|
— |
|
|
|
502 |
|
|
Excess tax benefit recognized |
|
|
(44 |
) |
|
|
(1,175 |
) |
|
|
(782 |
) |
|
Foreign tax credit |
|
|
— |
|
|
|
(358 |
) |
|
|
— |
|
|
Global intangible low taxed income |
|
|
637 |
|
|
|
456 |
|
|
|
— |
|
|
Prior year adjustment |
|
|
429 |
|
|
|
— |
|
|
|
241 |
|
|
Change in unrecognized tax benefits |
|
|
(715 |
) |
|
|
634 |
|
|
|
(27 |
) |
|
Nondeductible compensation |
|
|
402 |
|
|
|
136 |
|
|
|
— |
|
|
Other |
|
|
88 |
|
|
|
186 |
|
|
|
536 |
|
|
Provision (benefit) for income taxes |
|
$ |
(6,237 |
) |
|
$ |
1,737 |
|
|
$ |
593 |
|
The income tax provision (benefit) reflects the current and deferred tax consequences of events that have been recognized in the Company’s Consolidated Financial Statements or tax returns. The Tax Cuts and Jobs Act of 2017 (the “Tax Act”) made broad changes to the U.S. tax code. The changes include, but are not limited to, reducing the U.S. federal corporate tax rate from 35% to 21%, introducing bonus depreciation that will allow for full expensing of qualified property, eliminating the corporate alternative minimum tax (“AMT”) and changing how existing AMT credits can be realized. Consequently, we have re-measured our deferred tax assets and liabilities based on the rates at which they are expected to reverse in the future, which is generally 21%. The Tax Act also requires a deemed repatriation of foreign earnings and profits. As such, the Company reported a deemed repatriation of foreign earnings totaling $0.5 million as of December 31, 2017 related to its European subsidiary. The Company considers the earnings of certain non-U.S. subsidiaries to be indefinitely reinvested outside the United States and the current plans do not demonstrate a need to repatriate them to fund our U.S. operations.
46
The tax effects of significant items comprising the Company’s deferred tax assets/(liabilities) are as follows:
|
|
|
December 31, 2019 |
|
|
December 31, 2018 |
|
||
|
|
|
(in thousands) |
|
|||||
|
Allowance for doubtful accounts |
|
$ |
34 |
|
|
$ |
39 |
|
|
Inventories |
|
|
720 |
|
|
|
758 |
|
|
Employee benefits |
|
|
2,048 |
|
|
|
2,304 |
|
|
Net operating loss |
|
|
3,272 |
|
|
|
5,870 |
|
|
Sales reserves |
|
|
1,644 |
|
|
|
1,920 |
|
|
Unrecognized tax benefits |
|
|
387 |
|
|
|
521 |
|
|
Depreciation and amortization |
|
|
182 |
|
|
|
(512 |
) |
|
Intangible assets |
|
|
(140 |
) |
|
|
(176 |
) |
|
Other |
|
|
32 |
|
|
|
94 |
|
|
|
|
|
8,179 |
|
|
|
10,818 |
|
|
Valuation allowance |
|
|
(893 |
) |
|
|
(11,005 |
) |
|
Net deferred tax assets (liabilities) |
|
$ |
7,286 |
|
|
$ |
(187 |
) |
At December 31, 2019, the Company has $7.0 million of federal net operating loss carryforwards and $20.8 million of state net operating loss carryforwards, which will begin to expire in 2029. In October 2018, as a result of certain trading activity in the Company's common stock, the change of ownership provisions of Internal Revenue Code Section 382 (“Section 382”) were triggered. Based on the Section 382 limitation, the Company was not able to utilize its net operating losses to fully offset its taxable income in 2018. The Company believes, based on the estimated Section 382 limitation and the net operating loss carryforward period, that the pre-ownership change net operating losses will be fully utilized in future years if the Company generates sufficient taxable income.
The realization of deferred tax assets depends on the generation of future taxable income during the periods in which those temporary differences are deductible. During 2015, as a result of cumulative losses in prior years primarily due to incremental costs associated with the console transition, acquisition costs and initial investments in the HyperSound business, the Company concluded that a full valuation allowance was required on its net domestic deferred tax assets. During the fourth quarter of 2019, the Company concluded that it was more likely than not that the deferred tax assets would be realized. This conclusion was based on the recent profitability in 2019 and 2018, including the previous winddown of a business that was the cause of significant losses in previous years. For the year ended December 31, 2019, the Company reported a change in the valuation allowance for deferred tax assets of $10.1 million. The Company continues to maintain a valuation allowance on certain state net operating losses as it is not more likely than not that the losses in those specific jurisdictions will be realized.
A reconciliation of the beginning and ending amounts of unrecognized tax benefits is as follows:
|
|
|
December 31, 2019 |
|
|
December 31, 2018 |
|
||
|
|
|
(in thousands) |
|
|||||
|
Gross unrecognized tax benefit, beginning of period |
|
$ |
1,695 |
|
|
$ |
1,468 |
|
|
Additions based on tax positions related to the current year |
|
|
213 |
|
|
|
227 |
|
|
Settlements related to tax positions in a prior period |
|
|
(376 |
) |
|
|
— |
|
|
Decreases based on tax positions in a prior period |
|
|
(293 |
) |
|
|
— |
|
|
Gross unrecognized tax benefit, end of period |
|
$ |
1,239 |
|
|
$ |
1,695 |
|
The Company recognizes only those tax positions that meet the more-likely-than-not recognition threshold, and establishes tax reserves for uncertain tax positions that do not meet this threshold. The Company has settled uncertain tax positions in certain jurisdictions, which resulted in a decrease in amounts based on tax positions in prior periods of approximately $0.7 million for the year ended December 31, 2019. To the extent the remaining unrecognized tax benefits of approximately $1.2 million at December 31, 2019, are ultimately recognized, such recognition will impact the Company’s effective tax rate in future periods. The Company is currently in discussions with certain additional jurisdictions regarding uncertain tax positions and based on those discussions estimates that the amounts based on tax positions in prior periods will potentially decrease by $0.1 million within the next twelve months. Interest and penalties associated with income tax matters are included in the provision for income taxes. As of December 31, 2019, the Company had uncertain tax positions of $1.9 million, inclusive of $0.7 million of interest and penalties.
We are currently under examination by certain state and local taxing jurisdictions. Further, at any given time, multiple tax years may be subject to examination by various taxing authorities. The recorded amounts of income tax are subject to adjustment upon examination, changes in interpretation and changes in judgment utilized in determining estimates.
47
The Company files U.S., state and foreign income tax returns in jurisdictions with various statutes of limitations. Below is a summary of the filing jurisdictions and open tax years:
|
|
|
Open Years |
|
U.S. Federal |
|
2016 - 2018 |
|
California |
|
2015 - 2018 |
|
New Jersey |
|
2015 - 2018 |
|
New York |
|
2016 - 2018 |
|
Pennsylvania |
|
2016 - 2018 |
|
Texas |
|
2015 - 2018 |
|
United Kingdom |
|
2016 - 2018 |
Note 9. Preferred Stock
Series B Redeemable Preferred Stock
In September 2010, VTBH issued 1,000,000 shares of non-voting Series B Redeemable Preferred Stock (“Series B Preferred Stock”) with a fair value of $12.4 million. The Series B Preferred Stock was required to be redeemed on the earlier of September 28, 2030, or the occurrence of a liquidation event at its original issue price of $12.425371 per share plus any accrued but unpaid dividends. Dividends were cumulative and accrued at a rate of 8.0% per annum, compounded quarterly, and payable as and when declared by the Board of Directors. The Series B Preferred Stock did not contain any conversion rights.
On February 18, 2015, Dr. John Bonanno (“Dr. Bonanno”), the original holder of the Series B Preferred Stock, filed a complaint in Delaware Chancery Court alleging breach of contract. According to the complaint, the merger between VTBH and Turtle Beach purportedly triggered a contractual obligation for VTBH to redeem Dr. Bonanno’s stock. Dr. Bonanno requested a declaratory judgment stating that he was entitled to damages, including a redemption of his stock valued at $15.1 million (equal to the original issue price of his stock plus accrued dividends) as well as other costs and expenses.
On April 23, 2018, the Company facilitated and entered into a series of transactions pursuant to which the Series B Preferred Stock was acquired from Dr. Bonanno by non-affiliate investors and subsequently retired. As part of the transactions, the Company entered into (i) an Exchange Agreement (the “Exchange Agreement”) with such non-affiliate investors pursuant to which the Company agreed to exchange the Series B Preferred Stock for an aggregate of 1,307,143 newly issued shares of the Company’s common stock and wholly-funded warrants exercisable for an aggregate of 550,000 shares of the Company’s common stock and (ii) a Settlement Agreement (the “Settlement Agreement”) with Dr. Bonanno.
Pursuant to the Settlement Agreement, Dr. Bonanno agreed to discontinue certain previously disclosed claims and actions against the Company related to the Series B Preferred Stock, as well as to provide a release of the Company with respect to all such claims and any other claims related to Dr. Bonanno’s ownership or disposition of the Series B Preferred Stock. In connection with and as consideration thereof, the Company agreed to pay Dr. Bonanno a cash sum of $1.0 million to settle nonredemption claims in connection with the matter, and to pay an additional $1.25 million if a change of control transaction meeting certain specified requirements is consummated within three years of the date of the Settlement Agreement.
Accordingly, on April 26, 2018, all exchanged shares of Series B Preferred Stock were retired, and no shares of Series B Preferred Stock remain outstanding. The redemption value of the Series B Preferred Stock was $19.4 million as of the transaction date, and $18.9 million as of December 31, 2017.
The Company assessed the relative fair values of the Series B Preferred Stock retired pursuant to the Exchange Agreement and Settlement Agreement to determine the amount of the total transaction consideration transferred that was allocable to each component. The Company determined the fair value of the Series B Preferred Stock to be greater than the total consideration transferred. In addition, the Company was not able to reliably estimate the fair value of the litigation settlement. Based on these fair value assessments, the Company utilized the residual approach and first allocated proceeds to the Series B Preferred Stock, which resulted in no amount of the consideration being allocated to the litigation settlement. Accordingly, the entire transaction was accounted for as an equity transaction with the difference between the carrying value of the Series B Preferred Stock and the fair value of the consideration transferred included in stockholders’ equity.
Under the initial terms of the warrants, the holders had the right to receive, at their option, a cash payment for the remaining unexercised portion of the warrants upon the Company consummating a Fundamental Transaction (as defined in the warrant agreement, and including any merger, consolidation, sale or other reorganization event in which its common stock is converted into or exchanged for securities, cash or other property). If so elected by the warrant holders, the cash payment would have been based on a Black-Scholes pricing model and would have been made upon the consummation of a Fundamental Transaction or during the ensuing 30-day period thereafter. As a result of these terms regarding the possible future cash payment, the Company accounted for the warrants issued in connection with the retirement of the Series B Preferred Stock as a financial instrument obligation that is marked to market each period, with subsequent changes in fair value reported in earnings. The fair value of the warrants upon issuance and at December 31, 2018, was $2.6 million and $7.8 million, respectively. On March 20, 2019, the Company amended the terms of the warrant agreement so that the value of the warrant no longer have to be adjusted to fair value. See Note 11. Stock-Based Compensation for further discussion.
48
For the year ended December 31, 2019 and December 31, 2018, respectively, the company recognized an unrealized gain of $1.6 million and unrealized loss of $5.3 million on the warrants that is included in “Other non-operating expense (income), net” in the Consolidated Statement of Operations.
For the year ended December 31, 2019, the Company recognized no interest expense on the Series B Preferred Stock. For the years ended December 31, 2018 and 2017, the Company recognized $0.5 million and $1.4 million, respectively. There were no dividends declared during the years ended December 31, 2019, 2018 and 2017.
Registration Rights Agreement
In connection with the Exchange Agreement, the Company entered into an agreement (the “Registration Rights Agreement”) with certain non-affiliate investors pursuant to which, among other things, the Company agreed to file a registration statement to register for resale the shares of common stock (i) issued and outstanding as a result of the consummation of the transactions contemplated by the Exchange Agreement and (ii) issuable upon the exercise of the wholly-funded warrants. The Company is required to cause the registration statement to be declared effective as soon as practicable, but in no event later than 90 days after the closing of the transactions contemplated by the Exchange Agreement, which occurred on April 26, 2018. The Company also agreed, among other things, to indemnify the investors under the registration statement from certain liabilities and to pay all fees and expenses incident to the Company’s performance of or compliance with the Registration Rights Agreement.
Note 10. Net Income (Loss) Per Share
The following table sets forth the computation of basic and diluted net income (loss) per share of common stock attributable to common stockholders:
|
|
|
Year Ended |
|
|||||||||
|
|
|
December 31, |
|
|||||||||
|
|
|
2019 |
|
|
2018 |
|
|
2017 |
|
|||
|
|
|
(in thousands, except per-share data) |
|
|||||||||
|
Net income (loss) |
|
$ |
17,944 |
|
|
$ |
39,190 |
|
|
$ |
(3,248 |
) |
|
Unrealized gain on financial instrument obligation |
|
|
(1,601 |
) |
|
|
— |
|
|
|
— |
|
|
Net income (loss) - diluted |
|
$ |
16,343 |
|
|
$ |
39,190 |
|
|
$ |
(3,248 |
) |
|
|
|
|
|
|
|
|
|
|
|
|
|
|
|
Weighted average common shares outstanding — Basic |
|
|
14,483 |
|
|
|
13,512 |
|
|
|
12,336 |
|
|
Plus incremental shares from assumed conversions: |
|
|
|
|
|
|
|
|
|
|
|
|
|
Dilutive effect of restricted stock |
|
|
19 |
|
|
|
31 |
|
|
|
— |
|
|
Dilutive effect of stock options |
|
|
432 |
|
|
|
565 |
|
|
|
— |
|
|
Dilutive effect of warrants |
|
|
754 |
|
|
|
181 |
|
|
|
— |
|
|
Weighted average common shares outstanding — Diluted |
|
|
15,688 |
|
|
|
14,289 |
|
|
|
12,336 |
|
|
Net income (loss) per share: |
|
|
|
|
|
|
|
|
|
|
|
|
|
Basic |
|
$ |
1.24 |
|
|
$ |
2.90 |
|
|
$ |
(0.26 |
) |
|
Diluted |
|
$ |
1.04 |
|
|
$ |
2.74 |
|
|
$ |
(0.26 |
) |
Incremental shares from stock options and restricted stock awards are computed by the treasury stock method. The weighted average shares listed below were not included in the computation of diluted earnings per share because to do so would have been anti-dilutive for the periods presented or were otherwise excluded under the treasury stock method. The treasury stock method calculates dilution assuming the exercise of all in-the-money options and vesting of restricted stock, reduced by the repurchase of shares with the proceeds from the assumed exercises, unrecognized compensation expense for outstanding awards and the estimated tax benefit of the assumed exercises.
|
|
|
Year Ended |
|
|||||||||
|
|
|
December 31, |
|
|||||||||
|
|
|
2019 |
|
|
2018 |
|
|
2017 |
|
|||
|
|
(in thousands) |
|
||||||||||
|
Stock options |
|
|
480 |
|
|
|
86 |
|
|
|
1,589 |
|
|
Warrants |
|
|
— |
|
|
|
377 |
|
|
|
765 |
|
|
Unvested restricted stock awards |
|
|
194 |
|
|
|
107 |
|
|
|
36 |
|
|
Total |
|
|
674 |
|
|
|
570 |
|
|
|
2,390 |
|
Note 11. Equity and Stock-Based Compensation
Stock Repurchase Activity
49
On April 9, 2019, the Company’s board of directors authorized a stock repurchase program to acquire up to $15.0 million of its common stock. Any repurchases under the program will be made from time to time on the open market at prevailing market prices. During the year ended December 31, 2019, the Company repurchased 0.3 million shares of its common stock for a total cost of $2.5 million.
Stock-Based Compensation
On October 30, 2013, the Board of Directors adopted, and on December 27, 2013, the stockholders approved, the 2013 Stock-Based Incentive Compensation Plan (the “2013 Plan”), that became effective upon consummation of the Merger on January 15, 2014 and was subsequently amended at our 2019 Annual Meeting. Our stock-based compensation program is a broad-based program designed to attract and retain employees while also aligning employees’ interests with the interests of our shareholders. In addition, members of our Board of Directors participate in our stock-based compensation program in connection with their service on our board.
Stock option awards outstanding under the 2013 Plan are time-based and granted at exercise prices which are equal to the market value of the Company’s common stock on the grant date and expire no later than ten years from the date of grant, but only to the extent they have vested. The options generally vest as specified in the option agreements subject, in some instances, to acceleration in certain circumstances. The restrictions on restricted stock generally lapse over a three-year period from the date of the grant. In the event a participant terminates employment with the Company, any vested stock options and any restricted stock still subject to restrictions are generally forfeited if they are not exercised within 90 days.
The following table presents the stock activity and the total number of shares available for grant as of December 31, 2019:
|
|
|
(in thousands) |
|
|
|
Balance at December 31, 2018 |
|
|
1,201 |
|
|
Plan amendment |
|
|
1,440 |
|
|
Options granted |
|
|
(627 |
) |
|
Restricted stock granted |
|
|
(292 |
) |
|
Forfeited/Expired shares added back |
|
|
55 |
|
|
Balance at December 31, 2019 |
|
|
1,777 |
|
Total estimated stock-based compensation expense for employees and non-employees, related to all of the Company's stock-based awards, was comprised as follows:
|
|
|
Year ended December 31, |
|
|||||||||
|
|
|
2019 |
|
|
2018 |
|
|
2017 |
|
|||
|
|
|
(in thousands) |
|
|||||||||
|
Cost of revenue |
|
$ |
150 |
|
|
$ |
289 |
|
|
$ |
(66 |
) |
|
Selling and marketing |
|
|
691 |
|
|
|
186 |
|
|
|
100 |
|
|
Research and development |
|
|
417 |
|
|
|
136 |
|
|
|
232 |
|
|
General and administrative |
|
|
2,300 |
|
|
|
1,266 |
|
|
|
1,164 |
|
|
Total stock-based compensation |
|
$ |
3,558 |
|
|
$ |
1,877 |
|
|
$ |
1,430 |
|
Forfeitures on option grants are estimated at 10% based on evaluation of historical and expected future turnover for non-executives and 0% for executives. Stock-based compensation expense was recorded net of estimated forfeitures, such that expense was recorded only for those stock-based awards that are expected to vest. The Company reviews this assumption periodically and will adjust it if it is not representative of future forfeiture data and trends within employee types (executive vs. non-executive).
In 2017, due to changes in the reporting of stock compensation, the Company’s previously unrecognized excess tax benefit related to the exercise of nonqualified stock options totaling $2.2 million was recognized as a deferred tax asset. The associated tax benefit recognized in the Consolidated Statements of Operations for the fiscal years ended December 31, 2019 and 2018 was approximately $0.1 million and $1.2 million, respectively.
50
|
|
|
Options Outstanding |
|
|||||||||||||
|
|
|
Number of Shares Underlying Outstanding Options |
|
|
Weighted- Average Exercise Price |
|
|
Weighted- Average Remaining Contractual Term |
|
|
Aggregate Intrinsic Value |
|
||||
|
|
|
|
|
|
|
|
|
|
|
(in years) |
|
|
|
|
|
|
|
Outstanding at December 31, 2018 |
|
|
1,654,729 |
|
|
$ |
6.41 |
|
|
|
7.36 |
|
|
$ |
14,374,572 |
|
|
Granted |
|
|
626,636 |
|
|
|
11.45 |
|
|
|
|
|
|
|
|
|
|
Exercised |
|
|
(88,927 |
) |
|
|
3.71 |
|
|
|
|
|
|
|
|
|
|
Forfeited |
|
|
(49,513 |
) |
|
|
13.57 |
|
|
|
|
|
|
|
|
|
|
Outstanding at December 31, 2019 |
|
|
2,142,925 |
|
|
$ |
7.83 |
|
|
|
7.13 |
|
|
$ |
6,545,982 |
|
|
Vested and expected to vest at December 31, 2019 |
|
|
2,091,287 |
|
|
$ |
7.82 |
|
|
|
7.09 |
|
|
$ |
6,451,094 |
|
|
Exercisable at December 31, 2019 |
|
|
1,063,745 |
|
|
$ |
6.54 |
|
|
|
5.48 |
|
|
$ |
3,926,696 |
|
Aggregate intrinsic value represents the difference between the estimated fair value of the underlying common stock and the exercise price of outstanding, in-the-money options. The aggregate intrinsic value of options exercises was $0.6 million and $9.0 million for the years ended December 31, 2019 and 2018, respectively.
As of December 31, 2019, total unrecognized compensation cost related to non-vested stock options granted to employees was $3.5 million, which is expected to be recognized over a remaining weighted average vesting period of 2.7 years.
Determination of Fair Value
Option valuation models require the input of highly subjective assumptions, including expected stock price volatility. The Black-Scholes option pricing model was developed for use in estimating the fair value of traded options, which have no vesting restrictions and are fully transferable. The fair value of options granted under the 2013 Plan was estimated on the date of grant using the Black-Scholes option pricing model with the following assumptions:
|
Expected term (in years) |
|
|
6.1 |
|
|
Risk-free interest rate |
|
1.5% - 2.7% |
|
|
|
Expected volatility |
|
38.0% - 48.2% |
|
|
|
Dividend rate |
|
0% |
|
|
Each of these inputs is subjective and generally requires significant judgment to determine. The risk-free rate is based on a zero-coupon U.S. Treasury rate in effect at the time of grant with maturity dates that coincide with the expected life of the options. The expected life of the options is based on a simplified weighted average taking into account the vesting conditions and contractual life of the award. Since the Company has a limited trading history for its common stock, the expected volatility was derived from the historical stock volatilities of several unrelated public companies within the Company’s industry that are considered to be comparable to the Company’s business over a period equivalent to the expected term of the stock option grants.
The weighted average grant date fair value of options granted during the three years ended December 31, 2019 was $4.71, $3.33, and $0.29, respectively. The total estimated fair value of employee options vested during the three years ended December 31, 2019 was $1.0 million, $0.7 million and $1.3 million, respectively.
Restricted Stock Activity
|
|
|
Shares |
|
|
Weighted Average Grant Date Fair Value Per Share |
|
||
|
Nonvested restricted stock at December 31, 2018 |
|
|
265,636 |
|
|
$ |
19.29 |
|
|
Granted |
|
|
292,423 |
|
|
|
11.51 |
|
|
Vested |
|
|
(131,594 |
) |
|
|
15.80 |
|
|
Shares forfeited |
|
|
(4,975 |
) |
|
|
12.10 |
|
|
Nonvested restricted stock at December 31, 2019 |
|
|
421,490 |
|
|
$ |
15.06 |
|
As of December 31, 2019 total unrecognized compensation cost related to the nonvested restricted stock awards granted was $5.5 million, which is expected to be recognized over a remaining weighted average vesting period of 2.6 years.
51
In connection with certain subordinated notes, the Company issued warrants to purchase an aggregate 0.4 million shares and 0.3 million shares of the Company’s common stock at an exercise price of $10.16 and $8.00 per share, respectively, to SG VTB Holdings, LLC, all of which were settled through cashless exercises during the year ended December 31, 2019.
In connection with the retirement of the Series B Preferred Stock in April 2018, the Company issued wholly-funded warrants exercisable for an aggregate of 0.5 million shares of its common stock. Under the terms of the warrants, the holders had the right to receive, at their option, a cash payment for the remaining unexercised portion of the warrants upon the Company consummating a Fundamental Transaction (as defined in the warrant agreement, and including any merger, consolidation, sale or other reorganization event in which its common stock is converted into or exchanged for securities, cash or other property). If so elected by the warrant holders, the cash payment will be based on a Black-Scholes pricing model and will be made upon the consummation of a Fundamental Transaction or during the ensuing 30-day period thereafter. As a result of these terms regarding the possible future cash payment, the Company accounted for the warrants issued in connection with the retirement of the Series B Preferred Stock as a financial instrument obligation that is marked to market each period, with subsequent changes in fair value reported in earnings.
On March 30, 2019, the Company and the warrant holders entered into an amendment to the warrant agreement that revises the terms under which warrant holders may exercise their rights under a Fundamental Transaction. As a result of this amendment, the warrants are no longer accounted for as a financial instrument obligation and reported as a liability that is marked to market each period with changes in fair value reported in earnings. The warrants were marked to market through March 30, 2019, the execution date of the amendment, at which time the warrants are accounted for as an equity instrument. The fair value on that date of $6.2 million was reclassified to additional paid-in-capital. For the years ended December 31, 2019 and 2018, the Company recognized an unrealized gain of $1.6 million and unrealized loss of $5.3 million, respectively, on the warrants that is included in “Other non-operating expense (income), net” in the Condensed Consolidated Statement of Operations.
Phantom Equity Activity
In November 2011, VTBH adopted a 2011 Phantom Equity Appreciation Plan (“the Appreciation Plan”) that covers certain employees, consultants, and directors of VTBH (“Participants”) who are entitled to phantom units, as applicable, pursuant to the provisions of their respective award agreements. The Appreciation Plan is shareholder-approved, which permits the granting of phantom units to Participants of up to 1,500,000 units. These units are not exercisable or convertible into shares of common stock, but give the holder a right to receive a cash bonus equal to the appreciation in value between the exercise price and value of common stock at the time of a change in control event as defined in the plan.
As of December 31, 2019 and 2018, 178,586 phantom units at a weighted-average exercise price of $3.72 have been granted and are outstanding. Because these phantom units are not exercisable or convertible into common shares, the share amounts and exercise prices were not subject to the exchange ratio provided by the Merger agreement. As of December 31, 2019, compensation expense related to the Appreciation Plan units remained unrecognized because a change in control of VTB, as defined in the plan, had not occurred and is not anticipated by the Company. In July 2015, the Appreciation Plan was terminated as to new grants, but vested phantom units remain in place.
Note 12. Segment Information
The company operates in a single reportable segment and two reporting unit structure. The entire business is managed by a single management team whose chief operating decision maker is the Chief Executive Officer, who reviews financial information presented on a consolidated basis for purposes of allocating resources and evaluating financial performance.
The following table represents total net revenue based on where customers are physically located:
|
|
|
Year Ended |
|
|||||||||
|
|
|
December 31, |
|
|||||||||
|
|
|
2019 |
|
|
2018 |
|
|
2017 |
|
|||
|
|
|
(in thousands) |
|
|||||||||
|
North America |
|
$ |
166,748 |
|
|
$ |
215,601 |
|
|
$ |
103,159 |
|
|
United Kingdom |
|
|
25,671 |
|
|
|
34,509 |
|
|
|
21,113 |
|
|
Europe |
|
|
34,707 |
|
|
|
30,244 |
|
|
|
20,277 |
|
|
Other |
|
|
7,537 |
|
|
|
7,083 |
|
|
|
4,586 |
|
|
Total net revenues |
|
$ |
234,663 |
|
|
$ |
287,437 |
|
|
$ |
149,135 |
|
52
The following table represents property and equipment, net based on physical location:
|
|
|
Year Ended |
|
|||||
|
|
|
December 31, |
|
|||||
|
|
|
2019 |
|
|
2018 |
|
||
|
|
|
(in thousands) |
|
|||||
|
United States |
|
$ |
2,906 |
|
|
$ |
5,705 |
|
|
International |
|
|
1,056 |
|
|
|
151 |
|
|
Total |
|
$ |
3,962 |
|
|
$ |
5,856 |
|
Note 13. Commitments and Contingencies
Litigation
The Company is subject to various legal proceedings and claims that arise in the ordinary course of its business. Although the amount of any liability that could arise with respect to these actions cannot be determined with certainty, in the Company’s opinion, any such liability will not have a material adverse effect on its consolidated financial position, consolidated results of operations or liquidity.
Shareholders Class Action: On August 5, 2013, VTBH and the Company (f/k/a Parametric Sound Corporation) announced that they had entered into the Merger Agreement pursuant to which VTBH would acquire an approximately 80% ownership interest and existing shareholders would maintain an approximately 20% ownership interest in the combined company. Following the announcement, several shareholders filed class action lawsuits in California and Nevada seeking to enjoin the Merger. The plaintiffs in each case alleged that members of the Company’s Board of Directors breached their fiduciary duties to the shareholders by agreeing to a merger that allegedly undervalued the Company. VTBH and the Company were named as defendants in these lawsuits under the theory that they had aided and abetted the Company’s Board of Directors in allegedly violating their fiduciary duties. The plaintiffs in both cases sought a preliminary injunction seeking to enjoin closing of the Merger, which, by agreement, was heard by the Nevada court with the California plaintiffs invited to participate. On December 26, 2013, the court in the Nevada case denied the plaintiffs’ motion for a preliminary injunction. Following the closing of the Merger, the Nevada plaintiffs filed a second amended complaint, which made essentially the same allegations and sought monetary damages as well as an order rescinding the Merger. The California plaintiffs dismissed their action without prejudice, and sought to intervene in the Nevada action, which was granted. Subsequent to the intervention, the plaintiffs filed a third amended complaint, which made essentially the same allegations as prior complaints and sought monetary damages. On June 20, 2014, VTBH and the Company moved to dismiss the action, but that motion was denied on August 28, 2014. On September 14, 2017, a unanimous en banc panel of the Nevada Supreme Court granted defendants’ petition for writ of mandamus and ordered the trial court to dismiss the complaint but provided a limited basis upon which plaintiffs could seek to amend their complaint. Plaintiffs amended their complaint on December 1, 2017 to assert the same claims in a derivative capacity on behalf of the Company, as a well as in a direct capacity, against VTBH, Stripes Group, LLC, SG VTB Holdings, LLC, and the former members of the Company’s Board of Directors. All defendants moved to dismiss this amended complaint on January 2, 2018, and those motions were denied on March 13, 2018. Defendants petitioned the Nevada Supreme Court to reverse this ruling on April 18, 2018. On June 15, 2018, the Nevada Supreme Court denied defendants’ writ petition without prejudice. The district court subsequently entered a pretrial schedule and set trial for November 2019. On January 18, 2019, the district court certified a class of shareholders of the Company as of January 15, 2014. On October 11, 2019, the parties notified the District Court that they had reached a settlement that would resolve the pending action if ultimately approved by the Court. On January 13, 2020, the District Court preliminarily approved the settlement agreement between the plaintiffs and all Defendants. A final approval hearing has been scheduled for May 18, 2020. All pending court dates and deadlines, including the trial date, have been stayed while the parties proceed with the settlement process.
Commercial Dispute: On July 20, 2016, Bigben Interactive S.A. (“BigBen”) filed a statement of claim before the Regional Court of Berlin, Germany against VTB, which statement of claim was formally serviced upon VTB on June 28, 2017. The statement of claim alleges that VTB’s termination of a distribution agreement by and between BigBen and VTB breached the terms thereof and was invalid, and that BigBen is entitled to damages amounting to €5.0 million plus accrued interest thereon plus certain additional damages as a result of such invalid termination. VTB filed its statement of defense with the court on September 21, 2017. On January 7, 2019, the Regional Court of Berlin issued its judgment on this dispute, dismissing BigBen’s claim in its entirety. On February 7, 2019, BigBen Interactive S.A. filed an appeal against the judgment of the Regional Court of Berlin on January 7, 2019 (the "Judgment"). On April 15, 2019, Big Ben provided the reasoning for its appeal against the Judgment. On June 21, 2019, VTB replied to the reasoning for the appeal. Upon Big Ben’s application, the Higher Regional Court of Berlin has reviewed the provisions of the Judgment specifically relating to preliminary enforceability of the Judgment in separate proceedings and before the appellate proceedings regarding the main part of the Judgment. On July 9, 2019, the Higher Regional Court of Berlin completely rejected Big Ben’s applications with regard to the suspension of the preliminary enforceability of the Judgment. On November 19, 2019, an oral hearing was held at the Higher Regional Court of Berlin on Big Ben’s appeal against the Judgement on January 7, 2019. A date for the next oral hearing at the Higher Regional Court of Berlin has not yet been scheduled.
Employment Litigation: On April 20, 2017, a former employee filed an action in the Superior Court for the County of San Diego, State of California. The complaint alleges claims including wrongful termination, retaliation and various other provisions of the California Labor Code. The complaint seeks unspecified economic and non-economic losses, as well as allegedly unpaid wages, unreimbursed business expenses,
53
statutory penalties, interest, punitive damages and attorneys’ fees. The Company filed a cross-complaint against the former employee on May 25, 2017 for certain activities related to his employment with the Company. Discovery is closed and the case is set for trial on April 6, 2020 in San Diego County Superior Court.
The Company will continue to vigorously defend itself in the foregoing matters. However, litigation and investigations are inherently uncertain. Accordingly, the Company cannot predict the outcome of these matters. The Company has not recorded any accrual at December 31, 2019 for contingent losses associated with these matters based on its belief that losses, while possible, are not probable. Further, any possible range of loss cannot be reasonably estimated at this time. The unfavorable resolution of these matters could have a material adverse effect on the Company’s business, results of operations, financial condition, or cash flows. The Company is engaged in other legal actions, not described above, arising in the ordinary course of its business and, while there can be no assurance, believes that the ultimate outcome of these other legal actions will not have a material adverse effect on its business, results of operations, financial condition, or cash flows.
Warranties
The Company warrants products against certain manufacturing and other defects. These product warranties are provided for specific periods of time depending on the nature of the product. Warranties are generally fulfilled by replacing defective products with new products. The following table provides the changes in our product warranties, which are included in other current liabilities:
|
|
|
Year ended December 31, |
|
|||||||||
|
|
|
2019 |
|
|
2018 |
|
|
2017 |
|
|||
|
|
|
(in thousands) |
|
|||||||||
|
Warranty, beginning of period |
|
$ |
668 |
|
|
$ |
472 |
|
|
$ |
639 |
|
|
Warranty costs accrued |
|
|
816 |
|
|
|
864 |
|
|
|
310 |
|
|
Settlements of warranty claims |
|
|
(742 |
) |
|
|
(668 |
) |
|
|
(477 |
) |
|
Warranty, end of period |
|
$ |
742 |
|
|
$ |
668 |
|
|
$ |
472 |
|
Operating Leases – Right of Use Assets
The Company adopted ASU 2016-02, Leases, on January 1, 2019. The Company determines whether an arrangement is a lease at inception. The Company leases office spaces that provide for future minimum rental lease payments under non-cancelable operating leases that have remaining lease terms of one year to nine years, and do not contain any material residual value guarantees or material restrictive covenants.
The components of the right-of-use assets and lease liabilities were as follows:
|
|
|
Balance Sheet Classification |
|
December 31, 2019 |
|
|
|
|
|
|
|
(in thousands) |
|
|
|
Right-of-use assets |
|
Other assets |
|
$ |
1,770 |
|
|
|
|
|
|
|
|
|
|
Lease liability obligations, current |
|
Other current liabilities |
|
$ |
595 |
|
|
Lease liability obligations, noncurrent |
|
Other liabilities |
|
|
1,280 |
|
|
Total lease liability obligations |
|
|
|
$ |
1,875 |
|
|
Weighted-average remaining lease term (in years) |
|
|
|
|
3.0 |
|
|
Weighted-average discount rate |
|
|
|
|
3.75 |
% |
During the year ended December 31, 2019, the Company recognized approximately $1.0 million of lease costs in operating expenses and approximately $1.7 million of operating cash flows from operating leases.
Approximate future minimum lease payments for the Company’s right of use assets over the remaining lease periods as of December 31, 2019
|
|
|
(in thousands) |
|
|
|
2020 |
|
|
660 |
|
|
2021 |
|
|
581 |
|
|
2022 |
|
|
227 |
|
|
2023 |
|
|
103 |
|
|
2024 |
|
|
103 |
|
|
Thereafter |
|
|
293 |
|
|
Total minimum payments |
|
|
1,967 |
|
|
Less: Imputed interest |
|
|
(92 |
) |
|
Total |
|
$ |
1,875 |
|
54
Note 14. Selected Quarterly Financial Data - Unaudited
|
Fiscal 2019 |
|
Quarter |
|
|||||||||||||
|
|
|
First |
|
|
Second |
|
|
Third |
|
|
Fourth |
|
||||
|
|
|
(in thousands, except per share data) |
|
|||||||||||||
|
Net Revenue |
|
$ |
44,846 |
|
|
$ |
41,330 |
|
|
$ |
46,723 |
|
|
$ |
101,764 |
|
|
Gross Margin |
|
|
14,787 |
|
|
|
13,171 |
|
|
|
15,043 |
|
|
|
35,712 |
|
|
Net Income (Loss) |
|
|
3,055 |
|
|
|
(2,373 |
) |
|
|
(3,124 |
) |
|
|
20,386 |
|
|
Earnings (Loss) Per Share |
|
|
|
|
|
|
|
|
|
|
|
|
|
|
|
|
|
Basic |
|
$ |
0.21 |
|
|
$ |
(0.16 |
) |
|
$ |
(0.22 |
) |
|
$ |
1.41 |
|
|
Diluted |
|
$ |
0.19 |
|
|
$ |
(0.16 |
) |
|
$ |
(0.22 |
) |
|
$ |
1.29 |
|
|
Fiscal 2018 |
|
Quarter |
|
|||||||||||||
|
|
|
First |
|
|
Second |
|
|
Third |
|
|
Fourth |
|
||||
|
|
|
(in thousands, except per share data) |
|
|||||||||||||
|
Net Revenue |
|
$ |
40,886 |
|
|
$ |
60,805 |
|
|
$ |
74,427 |
|
|
$ |
111,319 |
|
|
Gross Margin |
|
|
15,029 |
|
|
|
20,277 |
|
|
|
30,502 |
|
|
|
42,891 |
|
|
Net Income (Loss) |
|
|
1,962 |
|
|
|
(2,318 |
) |
|
|
14,932 |
|
|
|
24,614 |
|
|
Earnings (Loss) Per Share |
|
|
|
|
|
|
|
|
|
|
|
|
|
|
|
|
|
Basic |
|
$ |
0.16 |
|
|
$ |
(0.17 |
) |
|
$ |
1.07 |
|
|
$ |
1.73 |
|
|
Diluted |
|
$ |
0.16 |
|
|
$ |
(0.17 |
) |
|
$ |
0.91 |
|
|
$ |
1.33 |
|
55
Item 9 - Changes in and Disagreements with Accountants on Accounting and Financial Disclosure
None.
Item 9A - Controls and Procedures
Disclosure Controls and Procedures
Disclosure controls and procedures (as defined in Rules 13(a)-15(e) and 15(d)-15(e) of the Securities Exchange Act of 1934, as amended (the “Exchange Act”), are designed to ensure that (1) information required to be disclosed in reports filed or submitted under the Exchange Act is recorded, processed, summarized and reported within the time periods specified in SEC rules and forms; and (2) that such information is accumulated and communicated to management, including the principal executive officer and principal financial officer, to allow timely decisions regarding required disclosures.
We assessed the effectiveness of the Company’s internal control over financial reporting as of December 31, 2019. In making this assessment, we used the framework and criteria established in Internal Control—Integrated Framework (2013), issued by the Committee of Sponsoring Organizations of the Treadway Commission. Based on our assessment using those criteria, we concluded that, as of December 31, 2019, our internal control over financial reporting was effective.
At the conclusion of the period covered by this Annual Report on Form 10-K, we carried out an evaluation, under the supervision of our Chief Executive Officer (our principal executive officer, or PEO) and our Chief Financial Officer (our principal financial officer, or PFO), of the effectiveness of the design and operation of our disclosure controls and procedures. Based upon that evaluation, our PEO and PFO concluded that our disclosure controls and procedures, as defined in Rule 13a-15(e) of the Exchange Act, were effective as of December 31, 2019.
Management’s Report on Internal Control over Financial Reporting
Our management is responsible for establishing and maintaining adequate internal control over financial reporting (as defined in Rule 13a-15(f) or 15d-15(f) of the Exchange Act). Our internal control system was designed to provide reasonable assurance to our management and Board of Directors regarding the preparation and fair presentation of published financial statements.
All internal control systems, no matter how well designed, have inherent limitations. Because of these inherent limitations, internal control over financial reporting can provide only reasonable assurance with respect to financial statement preparation and presentation, and may not prevent or detect misstatements. Projections of any evaluation of effectiveness to future periods are subject to the risk that controls may become inadequate because of changes in conditions, or that the degree of compliance with the policies or procedures may deteriorate.
We assessed the effectiveness of the Company’s internal control over financial reporting as of December 31, 2019. In making this assessment, we used the framework and criteria established in Internal Control—Integrated Framework (2013), issued by the Committee of Sponsoring Organizations of the Treadway Commission. Based on our assessment using those criteria, we concluded that, as of December 31, 2019, our internal control over financial reporting was effective.
BDO USA, LLP, the independent registered public accounting firm that audited the Company’s financial statements included in this Annual Report on Form 10-K, has also audited the Company’s internal control over financial reporting as of December 31, 2019 as stated in its report which appears following Item 9B of this Annual Report on Form 10-K.
Changes in Internal Control over Financial Reporting
There were no changes in the Company's internal control over financial reporting that occurred during the quarter ended December 31, 2019 that have materially affected, or are reasonably likely to materially affect, our internal control over financial reporting.
None
56
REPORT OF INDEPENDENT REGISTERED PUBLIC ACCOUNTING FIRM
Shareholders and Board of Directors
Turtle Beach Corporation
San Diego, California
Opinion on Internal Control over Financial Reporting
We have audited Turtle Beach Corporation (the “Company’s”) internal control over financial reporting as of December 31, 2019, based on criteria established in Internal Control - Integrated Framework (2013) issued by the Committee of Sponsoring Organizations of the Treadway Commission (the “COSO criteria”). In our opinion, the Company maintained, in all material respects, effective internal control over financial reporting as of December 31, 2019, based on the COSO criteria.
We also have audited, in accordance with the standards of the Public Company Accounting Oversight Board (United States) (“PCAOB”), the consolidated balance sheets of the Company as of December 31, 2019 and 2018, the related consolidated statements of operations, comprehensive income (loss), stockholders’ equity (deficit), and cash flows for each of the three years in the period ended December 31, 2019, and the related notes and schedule (collectively referred to as “the financial statements”) and our report dated March 13, 2020 expressed an unqualified opinion thereon.
Basis for Opinion
The Company’s management is responsible for maintaining effective internal control over financial reporting and for its assessment of the effectiveness of internal control over financial reporting, included in the accompanying “Item 9A, Management’s Report on Internal Control over Financial Reporting”. Our responsibility is to express an opinion on the Company’s internal control over financial reporting based on our audit. We are a public accounting firm registered with the PCAOB and are required to be independent with respect to the Company in accordance with U.S. federal securities laws and the applicable rules and regulations of the Securities and Exchange Commission and the PCAOB.
We conducted our audit of internal control over financial reporting in accordance with the standards of the PCAOB. Those standards require that we plan and perform the audit to obtain reasonable assurance about whether effective internal control over financial reporting was maintained in all material respects. Our audit included obtaining an understanding of internal control over financial reporting, assessing the risk that a material weakness exists, and testing and evaluating the design and operating effectiveness of internal control based on the assessed risk. Our audit also included performing such other procedures as we considered necessary in the circumstances. We believe that our audit provides a reasonable basis for our opinion.
Definition and Limitations of Internal Control over Financial Reporting
A company’s internal control over financial reporting is a process designed to provide reasonable assurance regarding the reliability of financial reporting and the preparation of financial statements for external purposes in accordance with generally accepted accounting principles. A company’s internal control over financial reporting includes those policies and procedures that (1) pertain to the maintenance of records that, in reasonable detail, accurately and fairly reflect the transactions and dispositions of the assets of the company; (2) provide reasonable assurance that transactions are recorded as necessary to permit preparation of financial statements in accordance with generally accepted accounting principles, and that receipts and expenditures of the company are being made only in accordance with authorizations of management and directors of the company; and (3) provide reasonable assurance regarding prevention or timely detection of unauthorized acquisition, use, or disposition of the company’s assets that could have a material effect on the financial statements.
Because of its inherent limitations, internal control over financial reporting may not prevent or detect misstatements. Also, projections of any evaluation of effectiveness to future periods are subject to the risk that controls may become inadequate because of changes in conditions, or that the degree of compliance with the policies or procedures may deteriorate.
|
/s/ BDO USA, LLP |
|
|
|
New York, New York |
|
March 13, 2020 |
57
Item 10 - Directors, Executive Officers and Corporate Governance
The information required by this Item is incorporated herein by reference to the information in our Definitive Proxy Statement to be filed with the SEC within 120 days after the end of the Company’s fiscal year ended December 31, 2019 in connection with our 2020 Annual Meeting of Stockholders (the “2020 Proxy Statement”) or an amendment to this Report filed within the same time period (the “Amendment”), in either case, set forth under the captions “Election of Directors,” “Management Information,” “Corporate Governance” and “Delinquent Section 16(a) Reports.”
We have adopted a code of business conduct and ethics that applies to our Chief Executive Officer and Chief Financial Officer. This code of business conduct and ethics is available on the Company’s website corp.turtlebeach.com. The information on our website is not a part of or incorporated by reference into this Report. If the Company makes any amendments to this code other than technical, administrative or other non-substantive amendments, or grants any waivers, including implicit waivers, from a provision of this code to the Company’s Chief Executive Officer or Chief Financial Officer, the Company will disclose the nature of the amendment or waiver, its effective date and to whom it applies by posting such information on the Company’s website at corp.turtlebeach.com.
Item 11 - Executive Compensation
The information required by this Item is incorporated herein by reference to the information in our 2020 Proxy Statement or the Amendment set forth under captions “Corporate Governance,” and “Executive Compensation.”
Item 12 - Security Ownership of Certain Beneficial Owners and Management and Related Stockholder Matters
The information required by this Item is incorporated herein by reference to the information in our 2020 Proxy Statement or the Amendment set forth under the captions “Executive Compensation” and “Security Ownership of Certain Beneficial Owners and Management.”
Item 13 - Certain Relationships and Related Transactions, and Director Independence
The information required by this Item is incorporated herein by reference to the information in our 2020 Proxy Statement or the Amendment set forth under the captions “Corporate Governance” and “Executive Compensation.”
Item 14 - Principal Accounting Fees and Services
The information required by this Item is incorporated herein by reference to the information in our 2020 Proxy Statement or the Amendment set forth under the captions “Audit and Non-Audit Fees.”
58
Item 15. Exhibits and Financial Statement Schedules
|
a. |
List of documents filed as part of this Annual Report: |
|
|
1. |
The following Consolidated Financial Statements of the Company are filed as part of this Annual Report: |
Report of Independent Registered Public Accounting Firm;
Consolidated Statements of Operations for the Fiscal Years Ended December 31, 2019, 2018 and 2017;
Consolidated Statements of Comprehensive Income (Loss) for the Fiscal Years Ended December 31, 2019, 2018 and 2017;
Consolidated Balance Sheets as of December 31, 2019 and 2018;
Consolidated Statements of Stockholders’ Equity for the Fiscal Years Ended December 31, 2019, 2018 and 2017;
Consolidated Statements of Cash Flows for the Fiscal Years Ended December 31, 2019, 2018 and 2017; and
Notes to the Consolidated Financial Statements.
|
|
2. |
The following financial schedule and related report for the years 2019, 2018 and 2017 is submitted herewith: |
Schedule II - Valuation and Qualifying Accounts
All other schedules have been omitted because they are not applicable, not required or the information has been otherwise supplied in the financial statements or notes thereto.
|
|
3. |
The exhibits listed in the Exhibit Index attached hereto are filed as part of this Annual Report and incorporated herein by reference |
|
b. |
The exhibits listed in the Exhibit Index attached hereto are filed as part of this Annual Report and incorporated herein by reference. |
|
c. |
Not applicable. |
None.
59
|
|
Agreement and Plan of Merger, dated August 5, 2013, among the Company, Merger Sub and VTBH (Incorporated by reference to Exhibit 2.1 to the Company’s Current Report on Form 8-K originally filed with the SEC on August 5, 2013). |
|
|
|
|
|
|
|
Articles of Incorporation of Turtle Beach Corporation, as amended (Incorporated by reference to Exhibit 3.1 to the Company’s Quarterly Report on Form 10-Q originally filed with the SEC on August 6, 2018). |
|
|
|
|
|
|
|
Bylaws, as amended, of Turtle Beach Corporation (Incorporated by reference to Exhibit 3.1 to the Company’s Form 8-K originally filed with the SEC on June 20, 2019). |
|
|
|
|
|
|
|
Third Amended and Restated Certificate of Incorporation of VTBH (Incorporated by reference to Exhibit B to Exhibit 3.1 to the Company’s Current Report on Form 8-K originally filed with the Securities and Exchange Commission on August 5, 2013). |
|
|
|
|
|
|
|
Stockholder Agreement dated August 5, 2013 among Turtle Beach Corporation and certain of our shareholders. (Incorporated by reference to Exhibit 99.1 to the Company’s Current Report on Form 8-K filed with the Securities and Exchange Commission on August 5, 2013). |
|
|
|
|
|
|
|
Amendment No. 1 to the Stockholder Agreement, dated July 10, 2014, by and among the Company and the shareholders party thereto (Incorporated by reference to Exhibit 10.2 to the Company’s Current Report on Form 8-K filed with the Securities and Exchange Commission on July 10, 2014). |
|
|
|
|
|
|
|
Form of Turtle Beach Corporation stock certificate. (Incorporated by reference to Exhibit 4.1 to the Company's Form 10/A filed with the Securities and Exchange Commission on July 27, 2010.) |
|
|
|
|
|
|
|
Warrant, issued to SG VTB Holdings, LLC, dated July 22, 2015 (Incorporated by reference to Exhibit 4.1 to the Company’s Current Report on Form 8-K filed with the Securities and Exchange Commission on July 23, 2015). |
|
|
|
|
|
|
|
Warrant, issued to SG VTB Holdings, LLC, dated November 16, 2015 (Incorporated by reference to Exhibit 4.1 to the Company’s Current Report on Form 8-K filed with the Securities and Exchange Commission on November 20, 2015). |
|
|
|
|
|
|
|
Registration Rights Agreement, dated April 23, 2018, by and among Turtle Beach Corporation and the investors named therein. (Incorporated by reference to Exhibit 4.2 to the Company's Current Report on Form 8-K filed with the Securities and Exchange Commission on April 27, 2018). |
|
|
|
|
|
|
|
Description of the Registrant’s Securities Registered Pursuant to Section 12 of the Securities and Exchange Act of 1934. |
|
|
|
|
|
|
|
First Amendment to Amended and Restated Loan, Guaranty and Security Agreement, dated as of December 17, 2018, by and among Turtle Beach Corporation, Voyetra Turtle Beach, Inc., Turtle Beach Europe Limited, VTB Holdings, Inc., the financial institutions party thereto and Bank of America, N.A., as administrative agent, collateral agent and security trustee for the lenders. (Incorporated by reference to Exhibit 10.1 to the Company's Current Report on Form 8-K filed with the Securities and Exchange Commission on December 19, 2018). |
|
|
|
|
|
|
|
Amended and Restated Turtle Beach Corporation 2013 Stock-Based Incentive Plan, as amended. (Incorporated by reference to Exhibit 10.3 to the Company’s Quarterly Report on Form 10-Q originally filed with the SEC on August 9, 2019). |
|
|
|
|
|
|
|
Turtle Beach Corporation Annual Incentive Bonus Plan (Incorporated by reference to Annex F to the Company’s Definitive Proxy Statement on Schedule 14A originally filed with the SEC on December 3, 2013). |
|
|
|
|
|
|
|
Master Services Agreement, dated October 6, 2015, between the Company and Hon Hai Precision Industry Co. Ltd. (Incorporated by reference to Exhibit 10.25 to the Company’s Annual Report on Form 10-K filed with the Securities and Exchange Commission on March 30, 2016). |
|
|
|
|
|
|
|
VTB Holdings, Inc. 2011 Phantom Equity Appreciation Plan (Incorporated by reference to Exhibit 10.13 to the Company’s Quarterly Report on Form 10-Q filed with the Securities and Exchange Commission on May 12, 2014). |
|
|
|
|
|
|
|
Offer Letter, dated as of August 13, 2012, between Voyetra Turtle Beach, Inc. and Juergen Stark (Incorporated by reference to Exhibit 10.14 to the Company’s Quarterly Report on Form 10-Q filed with the Securities and Exchange Commission on May 12, 2014). |
|
|
|
|
|
|
|
Stock Option Agreement, dated as of May 29, 2015, by and between the Company and Juergen Stark. (Incorporated by reference to Exhibit 10.28 to the Company’s Annual Report on Form 10-K filed with the Securities and Exchange Commission on March 30, 2016). |
|
|
|
|
|
|
|
Offer Letter, dated as of September 16, 2013, by and between Voyetra Turtle Beach, Inc. and John Hanson. (Incorporated by reference to Exhibit 10.26 to the Company’s Quarterly Report on Form 10-Q filed with the Securities and Exchange Commission on May 12, 2014). |
|
|
|
|
|
60
|
|
ROCCAT Asset Purchase Agreement (Incorporated by reference to Exhibit 10.2 to the Company’s Quarterly Report on Form 10-Q filed with the Securities and Exchange Commission on May 8, 2019). |
|
|
|
|
|
|
|
Form of Indemnification Agreement (Incorporated by reference to Exhibit 10.20 to the Company’s Annual Report on Form 10-K filed with the Securities and Exchange Commission on March 30, 2015). |
|
|
|
|
|
|
21** |
|
|
|
|
|
|
|
23.1** |
|
|
|
|
|
|
|
31.1** |
|
|
|
|
|
|
|
31.2** |
|
|
|
|
|
|
|
32.1** |
|
|
|
|
|
|
|
|
|
Extensible Business Reporting Language (XBRL) Exhibits |
|
|
|
|
|
101.INS |
|
XBRL Instance Document** |
|
|
|
|
|
101.SCH |
|
XBRL Taxonomy Extension Schema Document** |
|
|
|
|
|
101.CAL |
|
XBRL Taxonomy Extension Calculation Linkbase Document** |
|
|
|
|
|
101.DEF |
|
XBRL Taxonomy Extension Definition Linkbase Document** |
|
|
|
|
|
101.LAB |
|
XBRL Taxonomy Extension Labels Linkbase Document** |
|
|
|
|
|
101.PRE |
|
XBRL Taxonomy Extension Presentation Linkbase Document** |
|
|
|
|
|
* |
|
All exhibits and schedules to the Agreement and Plan of Merger have been omitted pursuant to Item 601(b)(2) of Regulation S-K. The Company will furnish the omitted exhibits and schedules to the SEC upon request by the SEC. |
|
** |
|
Filed herewith. |
|
*** |
|
Furnished herewith. |
|
† |
|
Management contract or compensatory plan. |
|
^ |
|
Portions of this exhibit (indicted by asterisks) have been omitted. |
61
Pursuant to the requirements of Section 13 or 15(d) of the Securities Exchange Act of 1934, the registrant has duly caused this Report to be signed on its behalf by the undersigned, thereunto duly authorized.
|
|
|
|
|
TURTLE BEACH CORPORATION |
|
|
|
|
|
|
|
Date: |
March 13, 2020 |
|
By: |
/s/ JOHN T. HANSON |
|
|
|
|
|
John T. Hanson Chief Financial Officer, Treasurer and Secretary |
|
|
|
|
|
(Principal Financial Officer) |
Pursuant to the requirements of the Securities Exchange Act of 1934, this Report has been signed below by the following persons on behalf of the registrant and in the capacities and on the dates indicated.
|
Date: |
March 13, 2020 |
|
/s/ JUERGEN STARK |
|
|
|
|
Juergen Stark, Chairman and Chief Executive Officer |
|
|
|
|
(Principal Executive Officer) |
|
|
|
|
|
|
Date: |
March 13, 2020 |
|
/s/ JOHN T. HANSON |
|
|
|
|
John T. Hanson, Chief Financial Officer, Treasurer and Secretary |
|
|
|
|
(Principal Financial and Accounting Officer) |
|
Date: |
March 13, 2020 |
|
/s/ WILLIAM E. KEITEL |
|
|
|
|
William E. Keitel, Lead Independent Director |
|
Date: |
March 13, 2020 |
|
/s/ GREGORY BALLARD |
|
|
|
|
Gregory Ballard, Director |
|
Date: |
March 13, 2020 |
|
/s/ KELLY THOMPSON |
|
|
|
|
Kelly Thompson, Director |
|
Date: |
March 13, 2020 |
|
/s/ ANDREW WOLFE |
|
|
|
|
Andrew Wolfe, Director |
62
Schedule II - Valuation and Qualifying Accounts
Years ended December 31, 2019, 2018 and 2017
|
Description |
|
Balance - Begin |
|
|
Additions |
|
|
Deductions / Other |
|
|
Balance - End |
|
||||
|
|
|
(in thousands) |
|
|||||||||||||
|
Year Ended December 31, 2019: |
|
|
|
|
|
|
|
|
|
|
|
|
|
|
|
|
|
Allowance for sales returns |
|
$ |
9,212 |
|
|
$ |
16,866 |
|
|
$ |
(17,263 |
) |
|
$ |
8,815 |
|
|
Allowance for cash discounts |
|
|
13,892 |
|
|
|
18,935 |
|
|
$ |
(16,848 |
) |
|
|
15,979 |
|
|
Allowance for doubtful accounts |
|
|
167 |
|
|
|
6 |
|
|
$ |
(27 |
) |
|
|
146 |
|
|
|
|
|
|
|
|
|
|
|
|
|
|
|
|
$ |
24,940 |
|
|
Year Ended December 31, 2018 |
|
|
|
|
|
|
|
|
|
|
|
|
|
|
|
|
|
Allowance for sales returns |
|
$ |
5,533 |
|
|
$ |
21,340 |
|
|
$ |
(17,661 |
) |
|
$ |
9,212 |
|
|
Allowance for cash discounts |
|
|
7,108 |
|
|
|
26,194 |
|
|
$ |
(19,410 |
) |
|
|
13,892 |
|
|
Allowance for doubtful accounts |
|
|
63 |
|
|
|
389 |
|
|
$ |
(285 |
) |
|
|
167 |
|
|
|
|
|
|
|
|
|
|
|
|
|
|
|
|
$ |
23,271 |
|
|
Year Ended December 31, 2017: |
|
|
|
|
|
|
|
|
|
|
|
|
|
|
|
|
|
Allowance for sales returns |
|
$ |
4,591 |
|
|
$ |
10,457 |
|
|
$ |
(9,515 |
) |
|
$ |
5,533 |
|
|
Allowance for cash discounts |
|
|
7,775 |
|
|
|
17,967 |
|
|
|
(18,634 |
) |
|
|
7,108 |
|
|
Allowance for doubtful accounts |
|
|
136 |
|
|
|
49 |
|
|
|
(122 |
) |
|
|
63 |
|
|
|
|
|
|
|
|
|
|
|
|
|
|
|
|
$ |
12,704 |
|
63