Attached files
UNITED STATES
SECURITIES AND EXCHANGE COMMISSION
WASHINGTON, D.C. 20549
FORM 10-K
þ ANNUAL REPORT PURSUANT TO SECTION 13 OR 15(d) OF THE SECURITIES EXCHANGE ACT OF 1934
FOR THE FISCAL YEAR ENDED DECEMBER 31, 2019
OR
¨ TRANSITION REPORT PURSUANT TO SECTION 13 OR 15(d) OF THE SECURITIES EXCHANGE ACT OF 1934
FOR THE TRANSITION PERIOD FROM __________ TO ________
COMMISSION FILE NUMBER: 001-37796
Infrastructure and Energy Alternatives, Inc.
(Exact Name of Registrant as Specified in Charter)
Delaware | 47-4787177 | |||
(State or Other Jurisdiction of Incorporation) | (IRS Employer Identification No.) | |||
6325 Digital Way, Suite 460 Indianapolis, Indiana | 46278 | |||
(Address of Principal Executive Offices) | (Zip Code) | |||
Registrant’s telephone number, including area code: (765) 828-2580
Securities registered pursuant to Section 12(b) of the Act:
Title of Each Class | Trading Symbol(s) | Name of Exchange on Which Registered | ||
Common Stock, $0.0001 par value | IEA | The NASDAQ Stock Market LLC | ||
Warrants for Common Stock | IEAWW | The NASDAQ Stock Market LLC | ||
Securities registered pursuant to Section 12(g) of the Act: None
Indicate by check mark if the registrant is a well-known seasoned issuer, as defined in Rule 405 of the Securities Act. ¨ Yes þ No
Indicate by check mark if the registrant is not required to file reports pursuant to Section 13 or Section 15(d) of the Act. ¨ Yes þ No
Indicate by check mark whether the registrant (1) has filed all reports required to be filed by Section 13 or 15(d) of the Securities Exchange Act of 1934 during the preceding 12 months (or such shorter period that the registrant was required to file such reports) and (2) has been subject to such filing requirements for the past ninety days. þ Yes ¨ No
Indicate by check mark whether the registrant has submitted electronically, every Interactive Data File required to be submitted pursuant to Rule 405 of Regulation S-T (§232.405 of this chapter) during the preceding 12 months (or for such shorter period that the registrant was required to submit such files). þ Yes ¨ No
Indicate by check mark whether the registrant is a large accelerated filer, an accelerated filer, a non-accelerated filer, a smaller reporting company, or an emerging growth company. See the definitions of "large accelerated filer," "accelerated filer," "smaller reporting company" and "emerging growth company" in Rule 12b-2 of the Exchange Act:
Large accelerated filer ¨ Accelerated filer ¨ Non-accelerated filer þ Smaller reporting company þ Emerging growth Company ¨
If an emerging growth company, indicate by check mark if the registrant has elected not to use the extended transition period for complying with any new or revised financial accounting standards provided pursuant to Section 13(a) of the Exchange Act. ¨
Indicate by check mark whether the registrant is a shell company (as defined in Rule 12b-2 of the Act). ¨ Yes þ No
The aggregate market value of the registrant’s outstanding Common Stock held by non-affiliates of the registrant computed by reference to the price at which the Common Stock was last sold as of the last business day of the registrant’s most recently completed second fiscal quarter was approximately $19.7 million on June 28, 2019. The registrant, solely for purposes of this required presentation, deemed the Board of Directors, Executive Officers and Infrastructure and Energy Alternatives, LLC as affiliates.
Number of shares of Common Stock outstanding as of the close of business on March 11, 2020: 22,266,233.
Portions of the registrant's definitive proxy statement to be filed with the Securities and Exchange Commission pursuant to Regulation 14A for the 2020 annual meeting of shareholders is incorporated by reference in Part III of this Form 10-K to the extent stated herein.
Infrastructure and Energy Alternatives, Inc. | ||
Table of Contents | ||
Page | ||
Forward-Looking Statements
This Annual Report on Form 10-K contains forward-looking statements within the meaning of Section 27A of the Securities Act of 1933, as amended (the “Securities Act”) and Section 21E of the Securities Exchange Act of 1934, as amended (the “Exchange Act”). The forward-looking statements can be identified by the use of forward-looking terminology including “may,” “should,” “likely,” “will,” “believe,” “expect,” “anticipate,” “estimate,” “forecast,” “seek,” “target,” “continue,” “plan,” “intend,” “project,” or other similar words. All statements, other than statements of historical fact included in this Annual Report, regarding expectations for future financial performance, business strategies, expectations for our business, future operations, financial position, estimated revenues and losses, projected costs, prospects, plans, objectives and beliefs of management are forward-looking statements.
These forward-looking statements are based on information available as of the date of this Annual Report and our management’s current expectations, forecasts and assumptions, and involve a number of judgments, risks and uncertainties. Although we believe that the expectations reflected in such forward-looking statements are reasonable, we cannot give any assurance that such expectations will prove correct. Forward-looking statements should not be relied upon as representing our views as of any subsequent date. As a result of a number of known and unknown risks and uncertainties, our actual results or performance may be materially different from those expressed or implied by these forward-looking statements. Some factors that could cause actual results to differ include:
• | availability of commercially reasonable and accessible sources of liquidity and bonding; |
• | our ability to generate cash flow and liquidity to fund operations; |
• | the timing and extent of fluctuations in geographic, weather and operational factors affecting our customers, projects and the industries in which we operate, including impact of the coronavirus strain or COVID-19; |
• | our ability to identify acquisition candidates, integrate acquired businesses and realize upon the expected benefits of the acquisition of Consolidated Construction Solutions I LLC (including its wholly owned subsidiaries Saiia LLC (“Saiia”) and the American Civil Constructors LLC (the “ACC Companies”) (collectively, “CCS”), and William Charles Construction Group, including Ragnar Benson (collectively, “William Charles”); |
• | consumer demand; |
• | our ability to grow and manage growth profitably; |
• | the possibility that we may be adversely affected by economic, business, and/or competitive factors; |
• | market conditions, technological developments, regulatory changes or other governmental policy uncertainty that affects us or our customers; |
• | our ability to manage projects effectively and in accordance with management estimates, as well as the ability to accurately estimate the costs associated with our fixed price and other contracts, including any material changes in estimates for completion of projects; |
• | the effect on demand for our services and changes in the amount of capital expenditures by customers due to, among other things, economic conditions, commodity price fluctuations, the availability and cost of financing, and customer consolidation; |
• | the ability of customers to terminate or reduce the amount of work, or in some cases, the prices paid for services, on short or no notice; |
• | customer disputes related to the performance of services; |
• | disputes with, or failures of, subcontractors to deliver agreed-upon supplies or services in a timely fashion; |
• | our ability to replace non-recurring projects with new projects; |
• | the impact of U.S. federal, local, state, foreign or tax legislation and other regulations affecting the renewable energy industry and related projects and expenditures; |
• | the effect of state and federal regulatory initiatives, including costs of compliance with existing and future safety and environmental requirements; |
• | fluctuations in maintenance, materials, labor and other costs; |
• | our beliefs regarding the state of the renewable wind energy market generally; and |
• | the “Risk Factors” described in this Annual Report on Form 10-K, and in our quarterly reports, other public filings and press releases. |
We do not undertake any obligation to update forward-looking statements to reflect events or circumstances after the date they were made, whether as a result of new information, future events or otherwise, except as may be required under applicable securities laws.
3
PART I
ITEM 1. BUSINESS
Business Overview
Infrastructure and Energy Alternatives, Inc., a Delaware corporation (‘‘IEA’’, the ‘‘Company’’, ‘‘we’’, ‘‘us’’, or ‘‘our’’) is a holding company that, through various subsidiaries, is a leading diversified infrastructure construction company with specialized energy and heavy civil expertise throughout the United States (“U.S.”). The Company specializes in providing complete engineering, procurement and construction (“EPC”) services throughout the U.S. for the renewable energy, traditional power and civil infrastructure industries. These services include the design, site development, construction, installation and restoration of infrastructure. Although the Company has historically focused on the wind industry, its recent acquisitions have expanded its construction capabilities and geographic footprint in the areas of environmental remediation, industrial maintenance, specialty paving, heavy civil and rail infrastructure construction, creating a diverse national platform of specialty construction capabilities. We believe we have the ability to continue to expand these services because we are well-positioned to leverage our expertise and relationships in the wind energy business to provide complete infrastructure solutions in all areas.
Our Common Stock trades on the NASDAQ Capital Market under the symbol ‘‘IEA’’. We were founded in 1947 as White Construction and we became a public company as Infrastructure and Energy Alternatives, Inc. in March 2018 when we merged with a special purpose acquisition company (a non-operating shell company).
Merger and Acquisitions
Public Company - On March 26, 2018, we consummated a merger (the “Merger”) pursuant to an Agreement and Plan of Merger, dated November 3, 2017, by and among M III Acquisition Corporation (“M III”), IEA Energy Services, LLC (“IEA Services”), a Delaware limited liability company, Infrastructure and Energy Alternatives, LLC (the “Seller”), a Delaware limited liability company and the parent of IEA Services immediately prior to such time, and the other parties thereto, which provided for, among other things, the merger of IEA Services with and into a wholly-owned subsidiary of M III. See Note 2. Merger and Acquisitions in the notes to the audited consolidated financial statements for more information on the Merger and the continuing ownership of the Company by M III and Seller.
Acquisition of CCS, including Saiia and the ACC Companies - On September 25, 2018, we acquired CCS, a leading provider of environmental and industrial engineering services. The wholly-owned subsidiaries of CCS, Saiia and ACC Companies generally enter into contracts with both government and non-government customers to provide EPC services for environmental, heavy-civil and mining projects. We believe our acquisition of Saiia and the ACC Companies provides IEA with a strong and established presence in the environmental and industrial engineering markets, enhanced civil construction capabilities and an expanded domestic footprint in less-seasonal Southeast, West and Southwest markets.
Acquisition of William Charles Construction Group, including Ragnar Benson - On November 2, 2018, we acquired William Charles, a leader in engineering and construction solutions for the rail infrastructure and heavy civil construction industries. We believe our acquisition of William Charles provides IEA with a market leading position in the attractive rail infrastructure market and continue to bolster our further growth in the heavy civil and construction footprint across the Midwest and Southwest.
Reportable Segments
The Company operated as one reportable segment for 2018 and evaluated the business as a renewable construction company. In late 2018, the Company completed two significant acquisitions that construct projects outside of the renewable market. Accordingly, as of December 31, 2019, we operate our business as two reportable segments: the Renewables segment and the Specialty Civil segment. The 2018 segment presentation has been recast to be consistent to the 2019 segmentation.
Each of our reportable segments is comprised of similar business units that specialize in services unique to the respective markets that each segment serves. Driving the end-user focused segments are differences in the economic characteristics of each segment; the nature of the services provided by each segment; the production processes of each segment; and the type or class of customer using the segment’s services.
4
The classification of revenue and gross profit for segment reporting purposes can at times require judgment on the part of management. Our segments may perform services across industries or perform joint services for customers in multiple industries. To determine reportable segment gross profit, certain allocations, including allocations of shared and indirect costs, such as facility costs, equipment expenses and indirect operating expenses, were made based on segment revenue.
The following is a brief description of the Company's reportable segments:
Renewables Segment
The Renewables segment operates throughout the United States and specializes in a range of services that include full EPC project delivery, design, site development, construction, installation and restoration of infrastructure services for the wind and solar industries.
Specialty Civil Segment
The Specialty Civil segment operates throughout the United States and specializes in a range of services that include:
• | Heavy civil construction services such as high-altitude road and bridge construction, specialty paving, industrial maintenance and other local, state and government projects. |
• | Environmental remediation services such as site development, environmental site closure and outsourced contract mining and coal ash management services. |
• | Rail Infrastructure services such as planning, creation and maintenance of infrastructure projects for major railway and intermodal facilities construction. |
Industry Trends
Our industry is composed of national, regional and local companies in a range of industries, including renewable power generation, traditional power generation and the civil infrastructure industries. We believe the following industry trends will help to drive our growth and success over the coming years:
Renewable Power Generation
In recent years, we have maintained a heavy focus on construction of renewable power production capacity as renewable energy, particularly from wind and solar, has become widely accepted within the electric utility industry and has become a cost-effective solution for the creation of new generating capacity. We believe that this shift has occurred because renewable energy power generation has reached a level of scale and maturity that permits these technologies to now be cost-effective competitors to more traditional power generation technologies, including on an unsubsidized basis. Under many circumstances, wind and solar power production offer the lowest levelized cost of energy (i.e., the all-in cost of generating power, including construction and operating costs) of any technology. As a result, wind and solar power are among the leading sources of new power generation capacity in the U.S., and wind and utility-scale solar energy generation is projected to become even more cost-effective in coming years as technological improvements make wind turbines and photovoltaic cells (and other solar generating technologies) even more efficient.
Governmental policies focused on a clean environment and the desire to decrease U.S. dependence on foreign oil imports have created incentives historically for the development of renewable energy production capacity and have created demand for more domestic, environmentally sensitive electrical power production facilities, such as wind and solar collection farms. The federal government has offered tax credits for investments in renewable energy infrastructure and production of power from renewable sources. Other tax incentives available to the renewable energy industry include accelerated tax depreciation provisions, including bonus depreciation, for certain renewable energy generation assets, such as equipment using solar or wind energy. These incentives specify a five-year depreciable life for qualifying assets rather than the longer depreciable lives of many non-renewable energy assets. In addition to shorter depreciable lives, those assets qualifying for bonus depreciation benefit from significant allowable first-year depreciation.
In addition to federal policies that historically have favored power production from renewable sources, a number of states also have supported the expansion of renewable energy generating capacity. Currently, nearly 40 states, as well as the
5
District of Columbia and four territories, have adopted renewable portfolio standards or goals. Similarly, we believe that many corporations and retail consumers are increasingly focused on obtaining energy from renewable sources and have become a significant driver of incremental demand for wind and solar energy production capacity.
The market for the development of utility-scale wind and solar power generation is expected to remain robust. The Annual Energy Outlook 2020 published by the U.S. Department of Energy (“DOE”) in January 2020 projected the addition of approximately 117 gigawatts of new utility-scale wind and solar capacity from 2020 to 2023. We estimate that EPC services will account for approximately 30% of the estimated $28.4 billion of construction over that time period. Although this demand is driven, in part, by accelerated, incremental investment in renewable power generation sources during the phase-out period for existing tax incentives, fundamental demand for renewable power construction-and particularly for utility-scale solar farms-is projected to remain strong thereafter. See Regulation and Environmental Matters below for further discussion of phase-out period.
Specialty Civil
Heavy Civil Construction
During 2018, heavy civil construction was only a small part of our business and accounted for less than 10% of our revenue. Heavy civil construction has become a more significant part of our business in 2019 due to the contributions of the companies we acquired during 2018, which are in this sector. State and federal funding for this industry has been neglected for decades, but the near-term outlook on both state and federal levels is that spending for infrastructure may experience significant growth over the next few years. Not only do we believe that state and federal funding is likely to increase, but alternative methods of construction, such as public and private partnerships, have gained significant traction in the United States in recent years. The FMI 2020 Overview Report published in the fourth quarter of 2019 project that nonresidential construction put in place for the United States will be over $850 million per year from 2020 to 2023.
We believe that our business relationships with customers in these sectors are excellent and the strong reputation that our acquired companies have built has provided us with the right foundation to continue to grow our revenue base. Additionally, there is significant overlap in labor, skills and equipment needs between our renewable energy construction business and our heavy civil infrastructure business, which we expect will continue to provide us with operating efficiencies as we continue to expand this sector. Our renewable energy experience provides us with expertise in working in difficult conditions and environments, which we believe will provide us with a competitive advantage when bidding for more complicated and often higher margin civil and infrastructure projects.
Rail
For more than 150 years, the U.S. rail network has been a critical component of the U.S. transportation system and economy. Today it carries approximately one-third of U.S. exports and delivers five million tons of freight and approximately 85,000 passengers each day. According to the 2017 Infrastructure Report Card, the private freight rail industry owns the vast majority of the nation’s rail infrastructure, and continues to make significant capital investment — $27.1 billion in 2015 — to ensure the network’s good condition. Despite this investment, U.S. rail still faces clear challenges, most notably in passenger rail, which faces the dual problems of aging infrastructure and insufficient funding.
Federal forecasts predict an approximate 40% increase in U.S. freight shipments, including by rail, by 2040. To prepare for the future, the U.S. Department of Transportation has worked with the transportation industry to draft the first National Freight Strategic Plan, which addresses impediments to the efficient flow of goods in support of the nation’s economy. The Fixing America’s Surface Transportation (FAST) Act complete the strategic plan by 2017 and be updated every five years. Through the FAST Act, Congress created a new federally-funded, freight-focused competitive grant program. Fostering Advancements in Shipping And Transportation For The Long-Term Achievement of National Efficiencies (FASTLANE) grants are expected to provide $4.5 billion through 2020 to freight and highway projects of national or regional significance.
We believe that the acquisition of William Charles including Ragnar Benson, provides the Company with the ability to capitalize on the new rail infrastructure construction that will be required to support the increase in U.S. freight shipments.
6
Environmental Remediation
Coal-fired power plants have significant and recurring environmental management needs, because they consistently generate various waste byproducts throughout the power generation process. The primary type of these waste byproducts are CCRs, commonly known as coal ash. According to the American Coal Ash Association, more than 102.3 million tons of coal ash were generated in 2018, and according to the U.S. Environmental Protection Agency (“EPA”), coal ash is one of the largest types of waste in the U.S. Coal ash management is mission-critical to the daily operations of power plants, as they generally only have on-site storage capacity for three to four days of CCR waste accumulation.
According to the American Coal Ash Association, as of 2018, approximately 42% of coal ash generated was disposed of. According to the EPA, approximately 80% of coal ash that was disposed of in 2012 was disposed of on-site in ash ponds or landfills. These sites are typically large and will require significant capital from their owners, as well as specialized environmental expertise, to monitor on an ongoing basis, remediate, relocate the waste or completely close in an environmentally sustainable way.
As a result of our recent acquisition of Saiia and their ability to build strong relationships in the environmental remediation business, the Company intends to continue to increase its growth of this area as a part of our business. We believe that with Saiia's reputation and our cross-selling capabilities, we will be able to capture further market share and facilitate more self-performing environmental remediation opportunities in other projects that we undertake.
Electrical Power and High Voltage Opportunities
The U.S. electrical transmission and distribution infrastructure requires significant ongoing maintenance, upgrade and expansion to manage power line congestion and avoid delivery failures. Regional shifts in population and industry may also create pockets of demand for increased transmission and distribution construction and upgrades. According to the DOE’s Annual Energy Outlook 2020 published in January 2020, significant new electricity generating capacity is expected to be added through 2050, all of which must be connected to the existing electric grid.
Renewable energy generation projects, which are typically located in remote areas, often require investment in new transmission lines to interconnect with the electrical grid. Although we have outsourced our high-voltage electrical needs historically, we implemented a program during 2018 to upgrade our in-house capability to complete this work and continually strive to increase the portion of our high-voltage electrical work that we self-perform. In 2019, we self-performed electrical work on 10 projects that afforded us the opportunity to capture incremental margin on our projects and to provide enhanced service to our customers.
We believe that the same capabilities that we are building in order to self-perform high-voltage electrical work will enable us to capture incremental revenue by providing these services to third parties. With investment by utilities and transmission companies to modernize, secure and visually improve the existing transmission system expected to be strong over the coming years, we expect that our existing customer relationships and reputation will leave us well-positioned for growth in this sector.
Strategy
The key elements of our business strategy are as follows:
Retention of strong relationships with our customers for further diversification — We believe that we have strong, long-term relationships with each of our customers and have historically worked together with them to meet their needs. By leveraging our established relationships with these customers, we intend to provide expanded products and services that will continue to diversify our revenue streams and assist our customers with their business strategies.
Maintain Operational Excellence — We have a continual focus on maintaining operational excellence, which includes the following:
• | Quality - We believe in satisfying our clients, mitigating risk, and driving improvement by performing work right the first time. |
• | Technical Expertise - We have an established reputation for safe, high quality performance, reliable customer service and technical expertise in constructing technically demanding projects. |
7
• | Safety - We believe the safety of our employees, the public and the environment is a moral obligation as well as good business. By identifying and concentrating resources to address jobsite hazards, we continually strive to reduce our incident rates and the costs associated with accidents. |
• | Productivity - We strive to use our resources efficiently to deliver work on time and on budget. |
Ownership of Equipment — Many of our services are equipment intensive and certain key equipment used by us is specialized or customized for our businesses. The cost of construction equipment, and in some cases the availability of construction equipment, provides a significant barrier to entry into several of our businesses. We believe that our ownership and ability to lease a large and varied construction fleet at a reasonable cost, enables us to compete more effectively by ensuring availability and maximizing returns on investment of the equipment.
Customers
We have longstanding customer relationships with many established companies in the renewable energy, thermal power, petrochemical, environmental remediation, civil and industrial power industries, with a recurring base of blue-chip utility customers, as well as original equipment manufacturers that produce the equipment for our business. We have completed wind projects with top U.S. developers or owners, rail infrastructure projects with top railroads and heavy civil construction projects with top government agencies.
Although we are not dependent upon any one customer in any year, a relatively small number of repeat customers constitute a substantial portion of our total revenues. Accordingly, our management is responsible for developing and maintaining existing relationships with customers to secure additional projects and increase revenue from our current customer base. We believe that our strategic relationships with customers will result in future opportunities. Our management is also focused on pursuing growth opportunities with prospective new customers.
The Company had the following approximate revenue and accounts receivable concentrations, net of allowances, for the periods ended:
Revenue % | Accounts Receivable % | ||||||||||||
Year Ended December 31, | December 31, | ||||||||||||
2019 | 2018 | 2017 | 2019 | 2018 | |||||||||
Company A (Renewables Segment) | * | 21.0 | % | * | * | 20.0 | % | ||||||
Company B (Specialty Civil Segment) | 10.9 | % | * | * | * | 19.0 | % | ||||||
Company C (Renewables Segment) | * | * | 21.0 | % | * | * | |||||||
Company D (Renewables Segment) | * | * | 11.0 | % | * | * | |||||||
Company E (Renewables Segment) | * | * | 11.0 | % | * | * | |||||||
Company F (Renewables Segment) | * | * | 14.0 | % | * | * | |||||||
———
* Amount was not above 10% threshold.
Our work is generally performed pursuant to contracts for specific projects or jobs that require the construction or installation of an entire complex of specified units within an infrastructure system. Customers are billed monthly throughout the completion of work on a project; however, some contracts provide for additional billing upon the achievement of specific completion milestones, which may increase the billing period to more than one month. Such contracts may include retainage provisions under which, generally, from 5% to 10% of the contract price is withheld until the work has been completed and accepted by the customer. Because we may not be able to maintain our current revenue levels or our current level of capacity and resource utilization if we are not able to replace work from completed projects with new project work, we actively review our backlog of project work and take appropriate action to minimize such exposure.
We believe that our industry experience, technical expertise and reputation for customer service, as well as the relationships developed between our customers and our senior management and project management teams are important to our being retained by our customers.
8
Backlog
Estimated backlog represents the amount of revenue we expect to realize in 2020 and beyond from the uncompleted portions of existing construction contracts, including new contracts under which work has not begun and awarded contracts for which the definitive project documentation is being prepared, as well as revenue from change orders and renewal options. Estimated backlog for work under fixed price contracts and cost-reimbursable contracts is determined based on historical trends, anticipated seasonal impacts, experience from similar projects and estimates of customer demand based on communications with our customers. These contracts are included in backlog based on the estimated total contract price upon completion.
As of December 31, 2019 our total backlog was approximately $2.2 billion compared to $2.1 billion as of December 31, 2018. We expect to realize approximately 65.0% of our estimated backlog during 2020 and 35.0% during 2021 and beyond.
The following table summarizes our backlog by segment for December 31:
(in millions) | ||||||
Segments | December 31, 2019 | December 31, 2018 | ||||
Renewables | 1,582.5 | 1,246.8 | ||||
Specialty Civil | 588.7 | 868.8 | ||||
Total | $ | 2,171.2 | $ | 2,115.6 | ||
Based on historical trends in the Company’s backlog, we believe awarded contracts to be firm and that the revenue for such contracts will be recognized over the life of the project. Timing of revenue for construction and installation projects included in our backlog can be subject to change as a result of customer delays, regulatory factors, weather and/or other project-related factors. These changes could cause estimated revenue to be realized in periods later than originally expected, or not at all. In the past, we have occasionally experienced postponements, cancellations and reductions on construction projects, due to market volatility and regulatory factors. There can be no assurance as to our customers’ requirements or the accuracy of our estimates. As a result, our backlog as of any particular date is an uncertain indicator of future revenue and earnings and may not result in actual revenue or profits.
Backlog is not a term recognized under U.S. GAAP, although it is a common measurement used in our industry. Backlog also differs from the amount of our remaining performance obligations, which are described in Note 1 - Business, Basis of Presentation and Significant Accounting Policies in the notes to the consolidated financial statements. As of December 31, 2019, total backlog differed from the amount of our remaining performance obligations primarily due to the inclusion of contracts that were awarded but not yet fully executed. Additionally, our methodology for determining backlog may not be comparable to the methodologies used by others. See ‘‘Risk Factors’’ for a discussion of the risks associated with our backlog.
Safety and Insurance/Risk Management
We strive to instill and enforce safe work habits in our employees, and we require that our employees participate in training programs relevant to their employment, including all those required by law. We evaluate employees in part based upon their safety performance and the safety performance of the employees they supervise. Our business units have established robust safety programs to encourage, monitor and improve compliance with safety procedures and regulations including, behavioral based safety, jobsite safety analysis, site-specific safety orientation, subcontractor orientation, site safety audits, accident and incident safety investigations, OSHA 30-hour and 10-hour training, drug and alcohol testing and regular trainings in fall protection, confined spaces, crane rigging and flagman, first aid, CPR and AED, among others.
Our business involves the use of heavy equipment and exposure to potentially dangerous workplace conditions. While we are committed to operating safely and prudently, we may be subject to claims by employees, customers and third parties for property damage and personal injuries that occur in connection with our work. We maintain insurance policies for worker’s compensation, employer liability, automobile liability, general liability, inland marine property and equipment, professional and pollution liability, excess liability, and director and officers’ liability. See Note 9. Commitments and Contingencies in the notes to the audited consolidated financial statements.
9
Our business may subject us to the risk of adverse site conditions and unfavorable weather. While we mitigate these risks contractually to the extent possible, market conditions prevent us from fully passing these risks to our customers, and there is not a robust insurance market to cover these risks. While we have evaluated the feasibility of insurance products to mitigate weather risk, we do not believe that the current insurance market offers commercially practicable solutions to protect the Company against significant losses caused by adverse weather.
Suppliers, Materials and Working Capital
Under many of our contracts, our customers provide the necessary materials and supplies for projects and we are responsible for the installation, but not the cost or warranty of those materials. Under certain other projects, we purchase the necessary materials and supplies on behalf of our customers from third-party providers. We are not dependent upon any one vendor and have not experienced significant difficulty in obtaining project-related materials or supplies as and when required for the projects we manage.
We utilize independent contractors to assist on projects and to help manage our work flow. Our independent contractors typically provide their own vehicles, tools and insurance coverage. We need working capital to support seasonal variations in our business, such as the impact of weather conditions on external construction and maintenance work and the spending patterns of our customers, both of which influence the timing of associated spending to support related customer demand. See ‘‘Management’s Discussion and Analysis of Financial Condition and Results of Operations.’’
We bear some risk of increases in the price of materials and supplies used in the performance of our work, such as aggregate, reinforcing steel, cable, and fuel. These risks are managed contractually, by entering into contracts with suppliers that fix the price paid by the Company within the budget established for a project, or by passing the risk of commodity cost increases to the customer.
Competition
We compete with a number of companies in the markets in which we operate, ranging from small local independent companies to large national firms, and some of our customers employ their own personnel to perform the type of services we provide.
The primary factors influencing competition in our industry are price, reputation, quality and delivery, relevant expertise, adequate financial resources, geographic presence, high safety ratings and a proven track record of operational success. We believe that our national platform, track record of completion, relationships with vendors, strong safety record and access to skilled labor enables us to compete favorably in all of these factors. We also believe that our ability to provide unionized and non-unionized workforces across a national footprint allows us to compete for a broad range of projects. While we believe our customers consider a number of factors when selecting a service provider, they award most of their work through a bid process. We believe our safety record, experience, quality of service and price are often principal factors in determining which service provider is selected.
Seasonality
Our revenues and results of operations can be subject to seasonal and other variations. These variations are influenced by weather, customer spending patterns, bidding seasons, receipt of required regulatory approvals, permits and rights of way, project timing and schedules and holidays. See ‘‘Management’s Discussion and Analysis of Financial Condition and Results of Operations-Impact of Seasonality and Cyclical Nature of Business.’’
Regulation and Environmental Matters
We are subject to state and federal laws that apply to businesses generally, including laws and regulations related to labor relations, wages, worker safety and environmental protection.
We are also subject to numerous environmental laws, including the handling, transportation and disposal of non-hazardous and hazardous substances and wastes, as well as emissions and discharges into the environment, including discharges into air, surface water, groundwater and soil. We also are subject to laws and regulations that impose liability and cleanup responsibility for releases of hazardous substances into the environment.
We believe we have all material licenses and permits needed to conduct operations and that we are in material compliance with applicable regulatory requirements. However, we could incur significant liabilities if we fail to comply
10
with applicable regulatory requirements. See ‘‘Risk Factors-We could incur substantial costs to comply with environmental, health, and safety laws and regulations and to address violations of liabilities under these requirements.’’
The potential impact of climate change on our operations is highly uncertain. Climate change may result in, among other things, changes in rainfall patterns, storm patterns and intensity and temperature levels. Our operating results are significantly influenced by weather and major changes in historical weather patterns could significantly impact our future operating results. For example, if climate change results in significantly more adverse weather conditions in a given period, we could experience reduced productivity and increases in certain other costs, which could negatively impact revenues and gross margins.
In light of changes in federal government priorities and the cost-competitiveness of wind and solar power production, certain of the tax credits for production of renewable energy are phasing out. The Consolidated Appropriations Act of 2016 (‘‘CAA’’), which contains certain federal tax incentives applicable to the renewable energy industry, provided for the gradual elimination of certain of these incentives. Currently, the tax code provides that the production tax credit for wind projects (the ‘‘PTC’’) applies to qualifying projects for which the construction commencement date was prior to January 1, 2021. The PTC was reduced by 20% for 2017, has been reduced by 40% for 2018, and finally will be reduced by 60% for 2019, and by 40% for 2020. Similarly, a phase down rate of the investment tax credit (the ‘‘ITC’’), which is available in lieu of PTC, is available for wind projects: 30% ITC for projects commencing before 2017, 24% for projects commencing in 2017, 18% for projects commencing in 2018 and 12% for projects commencing in 2019, and 18% for projects commencing in 2020. Solar projects, however, will be eligible for an investment tax credit (the ‘‘Solar ITC’’) only. The Solar ITC is 30% for projects commencing prior to 2020 and will be reduced to 26% for projects commencing in 2020 and to 22% for projects commencing in 2021. After 2021, the Solar ITC will remain at 10% for projects that commence prior to 2022, but are placed in service after 2023.
On December 16, 2019, the federal government implemented an agreement that extended lapsed and expiring tax breaks. The extension provides a single year extension of the PTC at a 60% level and the ITC at an 18% level to qualifying projects for which the construction commencement date is now prior to January 1, 2021.
Additionally, although the enactment of the 2017 Tax Act in December 2017 did not modify the existing production tax credit and investment tax credit incentive structures, a base erosion and anti-abuse tax, or ‘‘BEAT’’ provision, contained in the 2017 Tax Act imposes a minimum tax on certain corporations, and only 80% of the value of any such corporation’s production or investment tax credits can be applied as a reduction to such corporation’s BEAT liability. Accordingly, this BEAT provision could reduce the incentive for certain taxable investors to invest in tax equity financing arrangements and could materially reduce the value and availability such tax credits, grants and incentives for certain participants and financing sources in the wind and solar industry. The 2017 Tax Act permits the immediate expensing of certain capital expenditures between September 27, 2017 and January 1, 2023, but this new rule could be less valuable than a dollar-for-dollar investment tax credit or production tax credit, given the reduced corporate income tax rate of 21%. Any of the foregoing changes arising from the 2017 Tax Act, as well as other changes in law not mentioned herein, could adversely impact the demand for development of wind and solar energy generation facilities. See ‘‘Risk Factors-The U.S. wind and solar industries benefit from tax and other economic incentives and political and governmental policies.’’ for a discussion of the risks associated with these federal and state tax incentives.
Employees
The Company has a workforce of both union and non-union employees that allows us to work anywhere in the U.S. We have a scalable workforce, with approximately 3,250 peak employees. As of December 31, 2019, we had 2,650 employees, 690 of whom were represented by unions or were subject to collective bargaining agreements. See Note 13. Employee Benefit Plans in the notes to the audited consolidated financial statements, which are incorporated herein by reference.
We hire employees from a number of sources, including our industry, trade schools, colleges and universities. We attract and retain employees by offering a competitive salary, benefits package, opportunities for advancement and an exemplary safety record. We strive to offer a caring and stable work environment that enables our employees to improve their performance, and enhance their skills and knowledge. We believe that our corporate culture and core value system helps us to attract and retain employees. We provide opportunities for promotion and mobility within our organization, which we also believe helps us to retain our employees. Our employees participate in ongoing educational programs, some of which are internally developed, to enhance their technical and management skills through classroom and field training. We believe we have good relationships with employees and unions.
11
Available Information
Our principal executive offices are located at 6325 Digital Way, Suite 460, Indianapolis, Indiana 46278, and our telephone number is (765) 828-2580. Our website is located at www.iea.net. We make available our periodic reports and other information filed with or furnished to the Securities and Exchange Commission (the “SEC”), including our annual reports on Form 10-K, our quarterly reports on Form 10-Q, our current reports on Form 8-K, proxy statements, and all amendments to those reports, free of charge through our website, as soon as reasonably practicable after those reports and other information are electronically filed with or furnished to the SEC. Any materials filed with the SEC may be read and copied at the SEC’s website at www.sec.gov.
ITEM 1A. RISK FACTORS
You should carefully consider the risks described below together with the other information contained in this Annual Report on Form 10-K. If any of the risks below were to occur, our business, financial condition, results of operations, profitability, cash flows and growth prospects could be adversely impacted, and the price of our common stock could decline.
Risks Related to IEA
Our business is seasonal and is affected by adverse weather conditions and the spending patterns of our customers, exposing us to variable quarterly results.
Some of our customers reduce their expenditures and work order requests towards the end of the calendar year. Adverse weather conditions, particularly during the fall and winter seasons, can also affect our ability to perform outdoor services in certain regions of North America. As a result, we generally experience reduced revenue in the first quarter of each calendar year. Natural catastrophes such as hurricanes or other severe weather could also have a negative effect on the economy overall and on our ability to perform outdoor services in affected regions or utilize equipment and crews stationed in those regions, which could negatively affect our results of operations, cash flows and liquidity.
Our results for the year ended December 31, 2019 and 2018, reflect the effect of multiple severe weather events on our wind business that began late in the third quarter of 2018 and were completed in the second quarter of 2019. These weather conditions had a significant impact on the construction of six wind projects across South Texas, Iowa, and Michigan, resulting in additional labor, equipment and material costs as well as change orders.
The cumulative impact of these severe weather events negatively impacted our liquidity during 2019 and, combined with the inability to timely recover excess costs from these adverse weather conditions required us to seek additional financing and to renegotiate our senior credit facility. There can be no assurance that our liquidity will not be negatively impacted in the future due to significant adverse weather conditions.
Our failure to recover adequately on claims against project owners, subcontractors or suppliers for payment or performance could have a material adverse effect on our financial results.
We occasionally bring claims against project owners for additional costs that exceed the contract price or for amounts not included in the original contract price. Similarly, we present change orders and claims to our subcontractors and suppliers. If we fail to properly document the nature of change orders or claims, or are otherwise unsuccessful in negotiating a reasonable settlement, we could incur reduced profits, cost overruns or a loss on the project. These types of claims can often occur due to matters such as owner-caused delays, changes from the initial project scope and adverse conditions, which result in additional cost, both direct and indirect, or from project or contract terminations. From time to time, these claims can be the subject of lengthy and costly proceedings, and it is often difficult to accurately predict when these claims will be fully resolved. When these types of events occur and unresolved claims are pending, we may invest significant working capital in projects to cover cost overruns pending the resolution of the relevant claims. A failure to promptly recover on these types of claims could have a material adverse effect on our liquidity and financial results.
Our business may be affected by delays, which could increase our costs and reduce profitability.
Our projects involve challenging engineering, procurement and construction phases that may occur over extended time periods and that may involve many parties. Delays on a particular project can arise from a number of events involving the customer, third parties and us, including delays in design and engineering; delays or difficulties in obtaining equipment and materials; schedule changes; failures to timely obtain permits or rights-of-way or to meet other regulatory requirements; delays due to epidemics and pandemics; weather-related delays; and other governmental, market and political events, many of which
12
are beyond our control. A significant amount of equipment used in our projects is sourced from China. The current Corona virus outbreak could cause meaningful delays in owner and third party provided equipment being manufactured and shipped out of China. Excessive delays in connection with the Corona virus outbreak could result in project delays and increased costs.
We perform work under a variety of conditions, including, but not limited to, challenging and hard to reach terrain and difficult site conditions. Some of our contracts require that we assume the risk should actual site conditions vary from those expected, and these projects may be at increased risk for delays.
Delays may result in the cancellation or deferral of project work (including through a customer and or third party’s assertion of force majeure, or our assertion of force majeure), which could lead to a decline in revenue from lost project work, or, for project deferrals, could cause us to incur costs which are not reimbursable by the customer, and may lead to personnel shortages on other projects scheduled to commence at a later date. In some cases, delays and additional costs may be substantial, and we may be required to cancel a project and/or compensate the customer for the delay. We may not be able to recover any of such costs. Any such delays or cancellations or errors or other failures to meet customer expectations could result in damage claims substantially in excess of the revenue associated with a project. Delays or cancellations could also negatively impact our reputation or relationships with our customers, which could adversely affect our ability to secure new contracts and our business, financial condition, results of operations, profitability, cash flows and growth prospects.
Our failure to properly manage projects may result in additional costs or claims, which could have a material adverse effect on our business, financial condition, results of operations, profitability, cash flows and growth prospects.
The quality of our performance on a project depends in large part upon our ability to manage our client relationship and the project itself and to timely deploy appropriate resources, including third-party contractors and our own personnel. Some of our agreements require that we share in cost overages or pay liquidated damages if we do not meet project deadlines; therefore, any failure to properly estimate or manage cost or delays in the completion of projects, could subject us to penalties. Further, any defects or errors, or failures to meet our customers’ expectations could result in damage claims against us, and because of the substantial cost of, and potentially long lead-times necessary to acquire certain of the materials and equipment used in our complex projects, damage claims may substantially exceed the amount we can charge for our associated services. Our business, financial condition, results of operations, profitability, cash flows and growth prospects could be adversely affected if we miscalculate the resources or time needed to complete a project with capped or fixed fees, or the resources or time needed to meet contractual milestones.
We may be unable to obtain sufficient bonding capacity to support certain service offerings, and the need for performance and surety bonds may reduce our availability under our Third A&R Credit Agreement.
Some of our contracts require performance and payment bonds. If we are not able to renew or obtain a sufficient level of bonding capacity in the future, we may be precluded from being able to bid for certain contracts or successfully contract with certain customers. In addition, even if we are able to successfully renew or obtain performance or payment bonds, we may be required to post letters of credit or other collateral security in connection with the bonds, which would only be obtainable if we have sufficient availability under our Third A&R Credit Agreement and, if available, would reduce availability for borrowings under our Third A&R Credit Agreement. Furthermore, under standard terms in the surety market, sureties issue bonds on a project-by-project basis and can decline to issue bonds at any time or require the posting of additional collateral at any time. If we were to experience an interruption or reduction in the availability of bonding capacity as a result of these or any other reasons, we may be unable to compete for or work on certain projects that require bonding.
Our failure to comply with the regulations of OSHA and other state and local agencies that oversee transportation and safety compliance could adversely affect our business, financial condition, results of operations, profitability, cash flows and growth prospects.
The Occupational Safety and Health Act of 1970, as amended, establishes certain employer responsibilities, including maintenance of a workplace free of recognized hazards likely to cause death or serious injury, compliance with standards promulgated by the Occupational Safety and Health Administration (“OSHA”) and various recordkeeping, disclosure and procedural requirements. Various standards, including standards for notices of hazards and safety in excavation and demolition work, may apply to our operations. We have incurred, and will continue to incur, capital and operating expenditures and other costs in the ordinary course of business in complying with OSHA and other state and local laws and regulations, and could incur penalties and fines in the future, including, in extreme cases, criminal sanctions.
While we have invested, and will continue to invest, substantial resources in occupational health and safety programs, our industry involves a high degree of operational risk, and there can be no assurance that we will avoid significant liability.
13
Although we have taken what we believe to be appropriate precautions, we have had employee injuries in the past, and may suffer additional injuries in the future. Serious accidents of this nature may subject us to substantial penalties, civil litigation or criminal prosecution. Personal injury claims for damages, including for bodily injury or loss of life, could result in substantial costs and liabilities, which could materially and adversely affect our financial condition, results of operations or cash flows. In addition, if our safety record were to deteriorate, or if we suffered substantial penalties or criminal prosecution for violation of health and safety regulations, customers could cancel existing contracts and not award future business to us, which could materially adversely affect our business, financial condition, results of operations, profitability, cash flows and growth prospects.
Our business is subject to physical hazards that could result in substantial liabilities and weaken our financial condition.
Construction projects undertaken by us expose our employees to heavy equipment, mechanical failures, transportation accidents, adverse weather conditions and the risk of damage to equipment and property. These hazards can cause personal injuries and loss of life, severe damage to or destruction of property and equipment and other consequential damages and could lead to suspension of operations and large damage claims which could, in some cases, substantially exceed the amount we charge for the associated services. In addition, if serious accidents or fatalities occur, or if our safety records were to deteriorate, we may be restricted from bidding on certain work and obtaining new contracts and certain existing contracts could be terminated. Our safety processes and procedures are monitored by various agencies and ratings bureaus. The occurrence of accidents in our business could result in significant liabilities, employee turnover, increase the costs of our projects, or harm our ability to perform under our contracts or enter into new customer contracts, all of which could materially adversely affect our business, financial condition, results of operations, profitability, cash flows and growth prospects.
Our experience modification rate, a measure of our history and safety record as compared to other businesses in our industry, was 0.60 and our total recordable incident rate was 0.87 in 2019, both of which were significantly below the industry averages of 1.0 and 2.8, respectively, reported by the U.S. Department of Labor and U.S. Bureau of Labor Statistics. While these standards are still below industry averages, we experienced a fatality at one of our work sites in 2018 and there is no guarantee, based on the hazards discussed above, that we can maintain these averages.
We are self-insured against certain potential liabilities.
Although we maintain insurance policies with respect to employer’s liability, general liability, auto and workers compensation claims, those policies are subject to deductibles or self-insured retention amounts of up to $500,000 per occurrence. We are primarily self-insured for all claims that are less than the amount of the applicable deductible/self-insured retention. In addition, for health insurance coverage for our employees not part of a collective bargaining agreement, we provide employee health care benefit plans. Our health insurance plans have a self-insurance component up to specified deductibles per individual per year.
Our insurance policies include various coverage requirements, including the requirement to give appropriate notice. If we fail to comply with these requirements, our coverage could be denied.
Projected losses under our insurance programs are accrued based upon our estimates of the ultimate liability for claims reported and an estimate of claims incurred but not reported. Insurance liabilities are difficult to assess and estimate due to unknown factors, including the severity of an injury, the extent of damage, the determination of our liability in proportion to other parties and the number of incidents not reported. The accruals are based upon known facts and historical trends.
Acquisition activity presents certain risks to our business, operations and financial position, and we may not realize the financial and strategic goals contemplated at the time of a transaction.
We expect that the acquisitions will be an important part of our long-term growth strategy. Successful execution following the closing of an acquisition is essential to achieving the anticipated benefits of the transaction. We have made acquisitions to expand into new markets and our acquisition strategy depends on our ability to complete and integrate the acquisitions. Mergers and acquisitions are inherently risky, and any mergers and acquisitions that we complete may not be successful. The process of integrating an acquired company’s business into our operations and investing in new technologies is challenging and may result in expected or unexpected operating or compliance challenges, which may require significant expenditures and a significant amount of our management’s attention that would otherwise be focused on the ongoing operation of our business. The potential difficulties or risks of integrating an acquired company’s business include, among others:
• | the effect of the acquisition on our financial and strategic positions and our reputation; |
14
• | risk that we fail to successfully implement our business plan for the combined business; |
• | risk that we are unable to obtain the anticipated benefits of the acquisition, including synergies or economies of scale; |
• | risk that we are unable to complete development and/or integration of acquired technologies; |
• | risk that the market does not accept the integrated product portfolio; |
• | challenges in reconciling business practices or in integrating product development activities, logistics or information technology and other systems; |
• | challenges in reconciling accounting issues, especially if an acquired company utilizes accounting principles different from those we use; |
• | retention risk with respect to key customers, suppliers and employees and challenges in retaining, assimilating and training new employees; |
• | potential failure of the due diligence processes to identify significant problems, liabilities or other shortcomings or challenges of an acquired company, which could result in unexpected litigation, regulatory exposure, financial contingencies and known and unknown liabilities; and |
• | challenges in complying with newly applicable laws and regulations, including obtaining or retaining required approvals, licenses and permits. |
Our acquisitions may also result in the expenditure of available cash and amortization of expenses any of which could have a material adverse effect on our operating results or financial condition. Investments in immature businesses with unproven track records and technologies have an especially high degree of risk, with the possibility that we may lose the value of our entire investments or incur additional unexpected liabilities. Large or costly acquisitions or investments may also diminish our capital resources and liquidity or limit our ability to engage in additional transactions for a period of time. All of the foregoing risks may be magnified as the cost, size or complexity of an acquisition or acquired company increases, or where the acquired company’s products, market or business are materially different from ours, or where more than one integration is occurring simultaneously or within a concentrated period of time.
In addition, in the future we may require significant financing to complete an acquisition or investment, whether through bank loans, raising of debt or otherwise. We cannot assure you that such financing options will be available to us on reasonable terms, or at all. If we are not able to obtain such necessary financing, it could have an impact on our ability to consummate a substantial acquisition or investment and execute our growth strategy. Alternatively, we may issue a significant number of shares as consideration for an acquisition, which would have a dilutive effect on our existing stockholders.
If we are unable to attract and retain qualified managers and skilled employees, we will be unable to operate efficiently, which could reduce our revenue, profitability and liquidity.
Our business is labor intensive, and some of our operations experience a high rate of employee turnover. In addition, given the nature of the highly specialized work we perform, many of our employees are trained in, and possess, specialized technical skills that are necessary to operate our business and maintain productivity and profitability. At times of low unemployment rates in the areas we serve, it can be difficult for us to find qualified and affordable personnel. We may be unable to hire and retain a sufficiently skilled labor force necessary to support our operating requirements and growth strategy. Our labor and training expenses may increase as a result of a shortage in the supply of skilled personnel. We may not be able to pass these expenses on to our customers, which could adversely affect our profitability. Additionally, our business is managed by a number of key executive and operational officers and is dependent upon retaining and recruiting qualified management. Labor shortages, increased labor or training costs, or the loss of key personnel could materially adversely affect our business, financial condition, results of operations, profitability, cash flows and growth prospects.
The U.S. wind and solar industries benefit from tax and other economic incentives and political and governmental policies. A significant change in these incentives and policies could materially and adversely affect our business, financial condition, results of operations, cash flows and growth prospects.
The Consolidated Appropriations Act of 2016 (“CAA”) extended certain provisions of the Internal Revenue Code, which contains federal tax incentives applicable to the renewable energy industry, provided for the gradual elimination of
15
certain of these incentives. Currently, the tax code provides that the production tax credit for wind projects (the ‘‘PTC’’) applies to qualifying projects for which the construction commencement date was prior to January 1, 2021. The PTC was reduced by 20% for 2017, has been reduced by 40% for 2018, and finally will be reduced by 60% for 2019, and by 40% for 2020. Similarly, a phase down rate of the investment tax credit (the ‘‘ITC’’), which is available in lieu of PTC, is available for wind projects: 30% ITC for projects commencing before 2017, 24% for projects commencing in 2017, 18% for projects commencing in 2018 and 12% for projects commencing in 2019, and 18% for projects commencing in 2020. Solar projects, however, will be eligible for an investment tax credit (the ‘‘Solar ITC’’) only. The Solar ITC is 30% for projects commencing prior to 2020 and will be reduced to 26% for projects commencing in 2020 and to 22% for projects commencing in 2021. After 2021, the Solar ITC will remain at 10% for projects that commence prior to 2022, but are placed in service after 2023.
On December 16, 2019, the federal government implemented an agreement that extended lapsed and expiring tax breaks. The extension provides a single year extension of the PTC at a 60% level and the ITC at an 18% level to qualifying projects for which the construction commencement date is now prior to January 1, 2021.
The PTC, ITC, Solar ITC and cash grant program provide material incentives to develop wind energy generation facilities and thereby impact the demand for our manufactured products and services. The increased demand for our products and services resulting from the credits and incentives may continue until such credits or incentives lapse. The failure of Congress to extend or renew these incentives beyond their current expiration dates could significantly delay the development of wind energy generation facilities and the demand for wind turbines, towers and related components. In addition, we cannot assure you that any subsequent extension or renewal of the PTC, ITC, Solar ITC or cash grant program would be enacted prior to its expiration or, if allowed to expire, that any extension or renewal enacted thereafter would be enacted with retroactive effect. It is possible that these federal incentives will not be extended beyond their current expiration dates. Any delay or failure to extend or renew the PTC, ITC, Solar ITC or cash grant program in the future could have a material adverse impact on our business, results of operations, financial performance and future development efforts.
State renewable energy portfolio standards generally require state-regulated electric utilities to supply a certain proportion of electricity from renewable energy sources or devote a certain portion of their plant capacity to renewable energy generation. Typically, subject utilities comply with such standards by qualifying for renewable energy credits evidencing the share of electricity that was produced from renewable sources. Under many state standards, these renewable energy credits can be unbundled from their associated energy and traded in a market system allowing generators with insufficient credits to meet their applicable state mandate. These standards have spurred significant growth in the wind energy industry and a corresponding increase in the demand for our manufactured products. Currently, the majority of states and the District of Columbia have renewable energy portfolio standards in place and certain states have voluntary utility commitments to supply a specific percentage of their electricity from renewable sources. The enactment of renewable energy portfolio standards in additional states or any changes to existing renewable energy portfolio standards, or the enactment of a federal renewable energy portfolio standard or imposition of other greenhouse gas regulations may impact the demand for our products. We cannot assure you that government support for renewable energy will continue. The elimination of, or reduction in, state or federal government policies that support renewable energy could have a material adverse impact on our business, financial condition, results of operations, profitability, cash flows and growth prospects.
Contracts with federal, state and local governments pose additional risks, including lack of funding, onerous terms, and competitive bidding processes.
We derive a portion of our revenues from contracts with federal, state and local governments and their agencies and departments. These contracts are directly affected by changes in governmental spending and availability of adequate funding. Factors that could affect current and future governmental spending include:
• | policy or spending changes implemented by current administrations, departments or other government agencies; |
• | governmental shutdowns, failure to pass budget appropriations, continuing funding resolutions or other budgetary decisions; |
• | changes, delays or cancellations of government programs or requirements; |
• | adoption of new laws or regulations that affect companies providing services; |
• | curtailment of the governments’ outsourcing of services to private contractors; or |
• | the level of political instability due to war, conflict, epidemics, pandemics or natural disasters. |
16
Contracts with federal, state and local governments and their agencies and departments are often subject to various uncertainties, rules, restrictions, regulations, oversight audits and profit and cost controls. If we violate a rule or regulation, fail to comply with a contractual or other restriction or do not satisfy an audit, a variety of penalties can be imposed on us including monetary damages, withholding or delay of payments to us and criminal and civil penalties. In “qui tam” actions brought by individuals or the government under the U.S. Federal False Claims Act or under similar state and local laws, treble damages can be awarded. Government contracts may also contain unlimited indemnification obligations. In addition, most of our government clients may modify, delay, curtail, renegotiate or terminate contracts at their convenience any time prior to their completion.
Many government contracts are awarded through a rigorous competitive process. Governments and their agencies have increasingly relied upon multiple-year contracts with multiple contractors that generally require those contractors to engage in an additional competitive bidding process for each task order issued under a contract. This process may result in us facing significant additional pricing pressure and uncertainty and incurring additional costs. Moreover, we may not be awarded government contracts because of existing policies designed to protect small businesses and under-represented minorities. Any of the foregoing events could negatively affect our results of operations, cash flows and liquidity.
Amounts included in our backlog may not result in actual revenue or translate into profits. Our backlog is subject to cancellation and unexpected adjustments and therefore is an uncertain indicator of future operating results.
Our backlog consists of the estimated amount of services to be completed from future work on uncompleted contracts or work that has been awarded with contracts still being negotiated. It also includes revenue from change orders and renewal options. Most of our contracts are cancelable on short or no advance notice. Reductions in backlog due to cancellation by a customer, or for other reasons, could significantly reduce the revenue that we actually receive from contracts in backlog. In the event of a project cancellation, we may be reimbursed for certain costs, but we typically have no contractual right to the total revenues reflected in our backlog.
Backlog amounts are determined based on target price estimates that incorporate historical trends, anticipated seasonal impacts, experience from similar projects and from communications with our customers. These estimates may prove inaccurate, which could cause estimated revenue to be realized in periods later than originally expected, or not at all. In the past, we have occasionally experienced postponements, cancellations and reductions in expected future work due to changes in our customers’ spending plans, as well as on construction projects, due to market volatility, regulatory and other factors. There can be no assurance as to our customers’ requirements or the accuracy of our estimates. As a result, our backlog as of any particular date is an uncertain indicator of future revenue and earnings. In addition, contracts included in our backlog may not be profitable. If our backlog fails to materialize, our business, financial condition, results of operations, profitability, cash flows and growth prospects could be materially and adversely affected.
We may choose, or be required, to pay our subcontractors even if our customers do not pay, or delay paying us for the related services.
We use subcontractors to perform portions of our services. In some cases, we pay our subcontractors before our customers pay us for the related services. We could experience a material decrease in profitability and liquidity if we choose, or are required, to pay our subcontractors for work performed for customers that fail to pay, or delay paying us, for the related work.
Our subcontractors may fail to satisfy their obligations to us or other parties, or we may be unable to maintain these relationships, either of which may have a material adverse effect on our business, financial condition, results of operations, profitability, cash flows and growth prospects.
We depend on subcontractors to perform work on some of our projects. There is a risk that we may have disputes with subcontractors arising from, among other things, the quality and timeliness of the work they perform, customer concerns about our subcontractors, or our failure to extend existing work orders or issue new work orders under a subcontracting arrangement. If any of our subcontractors fails to deliver the agreed-upon supplies and/or perform the agreed-upon services on a timely basis, then our ability to fulfill our obligations as a prime contractor may be jeopardized. In addition, the absence of qualified subcontractors with whom we have satisfactory relationships could adversely affect our ability to perform under some of our contracts or the quality of the services we provide. Any of these factors could have a material adverse effect on our results of operations, cash flows and liquidity.
17
We also rely on suppliers to obtain the necessary materials for certain projects, and on equipment manufacturers and lessors to provide us with the equipment we require to conduct our operations. Although we are not dependent on any single supplier or equipment manufacturer or lessor, any substantial limitation on the availability of required suppliers or equipment could negatively affect our operations. Market and economic conditions could contribute to a lack of available suppliers or equipment. If we cannot acquire sufficient materials or equipment, it could materially and adversely affect our business, financial condition, results of operations, profitability, cash flows and growth prospects.
Many of our customers are regulated by federal and state government agencies, and the addition of new regulations or changes to existing regulations may adversely impact demand for our services and the profitability of those services.
Many of our energy customers are regulated by the Federal Energy Regulatory Commission, or FERC, and our utility customers are regulated by state public utility commissions. These agencies could change the way in which they interpret the application of current regulations and/or may impose additional regulations. Interpretative changes or new regulations having an adverse effect on our customers and the profitability of the services they provide could reduce demand for our services, which could adversely affect our results of operations, cash flows and liquidity.
Any future restrictions or regulations which might be adopted could lead to operational delays, increased operating costs for our customers in the wind industry that could result in reduced capital spending and/or delays or cancellations of future wind infrastructure projects, which could materially and adversely affect our business, financial condition, results of operations, profitability, cash flows and growth prospects.
We could incur substantial costs to comply with environmental, health, and safety laws and regulations and to address violations of or liabilities under these requirements.
Our operations and products are subject to a variety of environmental laws and regulations in the jurisdictions in which we operate and sell products governing, among other things, air emissions, wastewater discharges, the use, handling and disposal of hazardous materials, soil and groundwater contamination, employee health and safety, and product content, performance and packaging. We cannot guarantee that we will at all times be in compliance with such laws and regulations and if we fail to comply with these laws and regulations or our permitting and other requirements, we may be required to pay fines or be subject to other sanctions. Also, certain environmental laws can impose the entire or a portion of the cost of investigating and cleaning up a contaminated site, regardless of fault, upon any one or more of a number of parties, including the current or previous owner or operator of the site. These environmental laws also impose liability on any person who arranges for the disposal or treatment of hazardous substances at a contaminated site. Third parties may also make claims against owners or operators of sites and users of disposal sites for personal injuries and property damage associated with releases of hazardous substances from those sites.
Changes in existing environmental laws and regulations, or their application, could cause us to incur additional or unexpected costs to achieve or maintain compliance. The assertion of claims relating to on- or off-site contamination, the discovery of previously unknown environmental liabilities, or the imposition of unanticipated investigation or cleanup obligations, could result in potentially significant expenditures to address contamination or resolve claims or liabilities. Such costs and expenditures could have a material adverse effect on our business, financial condition, results of operations, profitability, cash flows and growth prospects.
We may not accurately estimate the costs associated with services provided under fixed price contracts, which could impair our financial performance.
We derive a significant portion of our revenue from fixed-price contracts. Under these contracts, we typically set the price of our services on a per unit or aggregate basis and assume the risk that certain costs associated with our performance may be greater than what we estimated. In addition, we enter into contracts for specific projects or jobs that may require the installation or construction of an entire infrastructure system or specified units within an infrastructure system, which are priced on a per unit basis. Profitability will be reduced if actual costs to complete each unit exceed our original estimates. If estimated costs to complete the remaining work for the project exceed the expected revenue to be earned, the full amount of any expected loss on the project is recognized in the period the loss is determined. Our profitability is therefore dependent upon our ability to accurately estimate the costs associated with our services and our ability to execute in accordance with our plans. A variety of factors affect these costs, such as lower than anticipated productivity, conditions at work sites differing materially from those anticipated at the time we bid on the contract and higher costs of materials and labor. These variations, along with other risks inherent in performing fixed price contracts, may cause actual project revenue and profits to differ from original estimates. As a result, if actual costs exceed our estimates, we could have lower margins than anticipated, or losses, which could reduce our business, financial condition, results of operations, profitability, cash flows and growth prospects.
18
We recognize revenue from installation/construction fixed price contracts using the cost-to cost input method (formerly known as percentage-of-completion method); therefore, variations of actual results from our assumptions may reduce our profitability.
Revenues derived from fixed-price contracts that are recognized as performance obligations are satisfied over time (formerly known as the percentage-of-completion method), measured by the relationship of total cost incurred compared to total estimated contract costs (cost-to-cost input method). The cost-to-cost input method therefore relies on estimates of total expected contract costs. Contract revenue and total cost estimates are reviewed and revised on an ongoing basis as the work progresses. Adjustments arising from changes in the estimates of contracts revenue or costs are reflected in the fiscal period in which such estimates are revised. Estimates are based on management’s reasonable assumptions, judgment and experience, but are subject to the risks inherent in estimates, including unanticipated delays or technical complications. Variances in actual results from related estimates on a large project, or on several smaller projects, could be material. The full amount of an estimated loss on a contract is recognized in the period that our estimates indicate such a loss. Such adjustments and accrued losses could result in reduced profitability, which could negatively impact our liquidity and results of operations.
We derive a significant portion of our revenue from a concentrated base of customers, and the loss of a small number of our significant customers, or a reduction in their demand for our services, could impair our financial performance.
Our business is concentrated among relatively few customers, and a significant proportion of our services are provided on a project-by-project basis. Although we have not been dependent upon any one customer, our revenue could significantly decline if we were to lose a small number of our significant customers, or if a few of our customers elected to perform the work that we provide with in-house service teams. In addition, our results of operations, cash flows and liquidity could be negatively affected if our customers reduce the amount of business they provide to us, or if we complete the required work on non-recurring projects and cannot replace them with similar projects. Many of the contracts with our largest customers may be canceled on short or no advance notice. Any of these factors could negatively impact our results of operations, cash flows and liquidity. See “Note 1. Business, Basis of Presentation and Significant Accounting Policies” and “Note 9. Commitments and Contingencies,” in the notes to audited consolidated financial statements.
A drop in the price of energy sources other than solar or wind energy would adversely affect our results of operations.
We believe that a customer’s decision to invest in solar or wind projects, as opposed to other forms of electric power generation, is to a significant degree driven by the levelized cost of energy production. Changes in technology or cost of commodities could lessen the appeal of wind-generated electricity and other renewables relative to other technologies for power generation. Similarly, government support for other forms of renewable or non-renewable power generation could make construction of wind and solar generating projects less attractive to customers economically. The ability of energy conservation technologies, public initiatives and government incentives to reduce electricity consumption could also lead to a reduction in the need for new generating capacity and in turn reduce demand for our services. If prices for electricity generated by wind or solar facilities are not competitive or demand for new production falls, our business, financial condition, results of operations, profitability, cash flows and growth prospects may be materially harmed.
Increases in the costs of fuel could reduce our operating margins.
The price of fuel needed to run our vehicles and equipment is unpredictable and fluctuates based on events outside our control, including geopolitical developments, supply and demand for oil and gas, actions by the oil and gas producers, war and unrest in oil producing countries, regional production patterns and environmental concerns. Any increase in fuel costs could materially reduce our profitability and liquidity because most of our contracts do not allow us to adjust our pricing for such expenses.
We maintain a workforce based upon current and anticipated workloads. We could incur significant costs and reduced profitability from underutilization of our workforce if we do not receive future contract awards, if these awards are delayed, or if there is a significant reduction in the level of work we provide.
Our estimates of future performance and results of operations depend on, among other factors, whether and when we receive new contract awards, which affect the extent to which we are able to utilize our workforce. The rate at which we utilize our workforce is affected by a variety of factors, including our ability to manage attrition, our ability to forecast our need for services, which allows us to maintain an appropriately sized workforce, our ability to transition employees from completed projects to new projects or between internal business groups, and our need to devote resources to non-chargeable activities such as training or business development. While our estimates are based upon our good faith judgment, these estimates can be
19
unreliable and may frequently change based on newly available information. In the case of large-scale projects where timing is often uncertain, it is particularly difficult to predict whether and when we will receive a contract award. The uncertainty of contract award timing can present difficulties in matching our workforce size to our contract needs. If an expected contract award is delayed or not received, we could incur costs resulting from reductions in staff or redundancy of facilities, which could reduce our profitability and cash flows.
In the ordinary course of our business, we may become subject to lawsuits, indemnity or other claims, which could materially and adversely affect our business, financial condition, results of operations, profitability, cash flows and growth prospects.
From time to time, we are subject to various claims, lawsuits and other legal proceedings brought or threatened against us in the ordinary course of our business. These actions and proceedings may seek, among other things, compensation for alleged personal injury, workers’ compensation, employment discrimination and other employment-related damages, breach of contract, property damage, environmental liabilities, multiemployer pension plan withdrawal liabilities, punitive damages and civil penalties or other losses, liquidated damages, consequential damages, or injunctive or declaratory relief. We may also be subject to litigation involving allegations of violations of the Fair Labor Standards Act and state wage and hour laws. In addition, we generally indemnify our customers for claims related to the services we provide and actions we take under our contracts, and, in some instances, we may be allocated risk through our contract terms for actions by our customers or other third parties.
Claimants may seek large damage awards and defending claims can involve significant costs. When appropriate, we establish reserves against these items that we believe to be adequate in light of current information, legal advice and professional indemnity insurance coverage, and we adjust such reserves from time to time according to developments. See “Note 9. Commitments and Contingencies” in the notes to the audited consolidated financial statements. We could experience a reduction in our profitability and liquidity if our legal reserves are inadequate, our insurance coverage proves to be inadequate or becomes unavailable, or our self-insurance liabilities are higher than expected. The outcome of litigation is difficult to assess or quantify, as plaintiffs may seek recovery of very large or indeterminate amounts in these types of lawsuits or proceedings, and the magnitude of the potential loss may remain unknown for substantial periods of time. Furthermore, because litigation is inherently uncertain, the ultimate resolution of any such claim, lawsuit or proceeding through settlement, mediation, or court judgment could have a material adverse effect on our business, financial condition or results of operations. In addition, claims, lawsuits and proceedings may harm our reputation or divert management’s attention from our business or divert resources away from operating our business, and cause us to incur significant expenses, any of which could have a material adverse effect on our business, financial condition, results of operations, profitability, cash flows and growth prospects.
Certain of our businesses have employees who are represented by unions or are subject to collective bargaining agreements. The use of a unionized workforce and any related obligations could adversely affect our business, financial condition, results of operations, profitability, cash flows and growth prospects.
Certain of our employees are represented by labor unions and collective bargaining agreements. Although all such collective bargaining agreements prohibit strikes and work stoppages, we cannot be certain that strikes or work stoppages will not occur despite the terms of these agreements. Strikes or work stoppages could adversely affect our relationships with our customers and cause us to lose business. Additionally, as current agreements expire, the labor unions may not be able to negotiate extensions or replacements on terms favorable to their members, or at all, or avoid strikes, lockouts or other labor actions from time to time that may affect their members. Therefore, it cannot be assured that new agreements will be reached with employee labor unions as existing contracts expire, or on desirable terms. Any action against us relating to the union workforce we employ could have a material adverse effect on our business, financial condition, results of operations, profitability, cash flows and growth prospects.
Our participation in multiemployer pension plans may subject us to liabilities that could materially and adversely affect our business, financial condition, results of operations, profitability, cash flows and growth prospects.
Substantially all of our collective bargaining agreements require us to participate with other companies in multiemployer pension plans. To the extent that U.S. registered plans are underfunded defined benefit plans, the Employee Retirement Income Security Act of 1974, as amended by the Multiemployer Pension Plan Amendments Act of 1980 (collectively, “ERISA”), subjects participating employers to substantial liabilities upon the employer’s complete or partial withdrawal from, or upon termination of, such plans. Under current law pertaining to employers that are contributors to U.S. registered multiemployer defined benefit plans, a plan’s termination, an employer’s voluntary withdrawal from, or the mass withdrawal of contributing employers from, an underfunded multiemployer defined benefit plan requires participating employers to make payments to the plan for their proportionate share of the multiemployer plan’s unfunded vested liabilities.
20
These liabilities include an allocable share of the unfunded vested benefits of the plan for all plan participants, not only for benefits payable to participants of the contributing employer. As a result, participating employers may bear a higher proportion of liability for unfunded vested benefits if the other participating employers cease to contribute to, or withdraw from, the plan. The allocable portion of liability to participating employers could be more disproportionate if employers that have withdrawn from the plan are insolvent, or if they otherwise fail to pay their proportionate share of the withdrawal liability. We currently contribute, and in the past have contributed to, plans that are underfunded, and, therefore, could have potential liability associated with a voluntary or involuntary withdrawal from, or termination of, these plans. We currently do not intend to withdraw from such plans. However, there can be no assurance that we will not be assessed liabilities in the future, either because of our withdrawal from such plans or due to a “mass withdrawal” of contributing employers.
In addition, the Pension Protection Act of 2006, as amended, added special funding and operational rules generally applicable to plan years beginning after 2007 for multiemployer plans that are classified as “endangered,” “seriously endangered” or “critical” status based on multiple factors (including, for example, the plan’s funded percentage, cash flow position and whether it is projected to experience a minimum funding deficiency). Plans in these classifications must adopt measures to improve their funded status through a funding improvement or rehabilitation plan, as applicable, which may require additional contributions from employers (which may take the form of a surcharge on benefit contributions) and/or modifications to retiree benefits.
Based upon the information available to us from plan administrators as of December 31, 2019, several of the multiemployer pension plans in which we participate are sufficiently underfunded that they meet the one or more of the classifications described above. As a result, we could be required to increase our contributions, including in the form of a surcharge on future benefit contributions. The amount of additional funds we may be obligated to contribute in the future cannot be estimated, as these amounts are based on future levels of work of the union employees covered by these plans, investment returns and the funding status of the plans. See Note 13. Employee Benefit Plans of the accompanying notes to our consolidated financial statements included in Item 8. for a further description of the funding status of the plans in which we participate.
Potential withdrawal liabilities, requirements to pay increased contributions, and/or surcharges in connection with any of the multiemployer pension plans in which we participate could negatively impact our business, financial condition, results of operations, profitability, cash flows and growth prospects.
Our financial results are based, in part, upon estimates and assumptions that may differ from actual results.
In preparing our consolidated financial statements in conformity with U.S. GAAP, management makes a number of estimates and assumptions that affect the amounts reported in our consolidated financial statements. These estimates and assumptions must be made because certain information used in the preparation of our consolidated financial statements is either dependent on future events or cannot be calculated with a high degree of precision from data available. In some cases, these estimates are particularly uncertain and we must exercise significant judgment. Key estimates include: the recognition of revenue and project profit or loss, which we define as project revenue less project costs of revenue, including project-related depreciation, in particular, on long-term construction contracts or other projects accounted for under the percentage-of-completion method, for which the recorded amounts require estimates of costs to complete projects, ultimate project profit and the amount of probable contract price adjustments; allowances for doubtful accounts; estimated fair values of goodwill and intangible assets, acquisition-related contingent consideration, investments in equity investees; asset lives used in computing depreciation and amortization; accrued self-insured claims; share-based compensation; other reserves and accruals; accounting for income taxes; and the estimated impact of contingencies and ongoing litigation. Actual results could differ materially from the estimates and assumptions that we use, which could have a material adverse effect on our results of operations, cash flows and liquidity. See “Note 1. Business, Basis of Presentation and Significant Accounting Policies” in the notes to our audited consolidated financial statements.
We may have additional tax liabilities associated with our domestic operations and discontinued Canadian operations.
Management must exercise significant judgment in determining our provision for income taxes due to lack of clear and concise tax laws and regulations in certain jurisdictions. Tax laws may be changed or clarified and such changes may adversely affect our tax provisions. We are audited by various U.S. tax authorities and in the ordinary course of our business there are many transactions and calculations for which the ultimate tax determination may be uncertain. Although we believe that our tax estimates are reasonable and that we maintain appropriate reserves for our potential liability, the final outcome of tax audits and related litigation could be materially different from that which is reflected in our financial statements.
21
Unanticipated changes in effective tax rates or adverse outcomes resulting from examination of our income or other tax returns could adversely affect our financial condition and results of operations.
We are subject to income taxes in the United States, and our domestic tax liabilities are subject to the allocation of expenses in differing jurisdictions. Our future effective tax rates could be subject to volatility or adversely affected by a number of factors, including:
• | changes in the valuation of our deferred tax assets and liabilities; |
• | expected timing and amount of the release of any tax valuation allowances; |
• | tax effects of stock-based compensation; |
• | costs related to intercompany restructurings; |
• | changes in tax laws, regulations or interpretations thereof; and |
• | lower than anticipated future earnings in jurisdictions where we have lower statutory tax rates and higher than anticipated future earnings in jurisdictions where we have higher statutory tax rates. |
In addition, we may be subject to audits of our income, sales and other transaction taxes by U.S. federal and state authorities. Outcomes from these audits could have an adverse effect on our financial condition and results of operations.
Warranty claims resulting from our services could have a material adverse effect on our business.
We generally warrant the work we perform for a two year period following substantial completion of a project, subject to further extensions of the warranty period following repairs or replacements. Historically, warranty claims have not been material, but such claims could potentially increase. If warranty claims occur, we could be required to repair or replace warrantied items at our cost, or, if our customers elect to repair or replace the warrantied item using the services of another provider, we could be required to pay for the cost of the repair or replacement. Additionally, while we generally require that the materials provided to us by suppliers have warranties consistent with those we provide to our customers, if any of these suppliers default on their warranty obligations to us, we may incur costs to repair or replace the defective materials for which we are not reimbursed. The costs associated with such warranties, including any warranty-related legal proceedings, could have a material adverse effect on our results of operations, cash flows and liquidity.
We rely on information, communications and data systems in our operations.
Systems and information technology interruptions and/or breaches in our data security could adversely affect our ability to operate and our operating results or could result in harm to our reputation. We are heavily reliant on computer, information and communications technology and related systems in order to operate. From time to time, we experience system interruptions and delays. Our operations could be interrupted or delayed, or our data security could be breached, if we are unable to add software and hardware, effectively maintain and upgrade our systems and network infrastructure and/or take other steps to improve the efficiency of and protect our systems. In addition, our computer and communications systems and operations could be damaged or interrupted by natural disasters, power loss, telecommunications failures, computer viruses, acts of war or terrorism, physical or electronic break-ins and similar events or disruptions, including breaches by computer hackers and cyber-terrorists. Any of these or other events could cause system interruptions, delays and/or loss of critical data including private data, could delay or prevent operations, including the processing of transactions and reporting of financial results, processing inefficiency, downtime, or could result in the unintentional disclosure of customer or our information, which could adversely affect our operating results, harm our reputation and result in significant costs, fines or litigation. Similar risks could affect our customers and vendors, indirectly affecting us. While management has taken steps to address these concerns by implementing network security and internal control measures, there can be no assurance that a system failure or loss or data security breach will not materially adversely affect our financial condition and operating results.
22
Risks Related to Our Capital Structure
We have a significant amount of debt. Our substantial indebtedness could adversely affect our business, financial condition and results of operations and our ability to meet our payment obligations.
We have a significant amount of debt and substantial debt service requirements. This level of debt could have significant consequences on our future operations, including:
• | making it more difficult for us to meet our payment and other obligations; |
• | our failure to comply with the financial and other restrictive covenants contained in our debt agreements, which could trigger events of default that could result in all of our debt becoming immediately due and payable; |
• | reducing the availability of our cash flows to fund working capital, capital expenditures, acquisitions or strategic investments and other general corporate requirements, and limiting our ability to obtain additional financing for these purposes; |
• | subjecting us to increased interest expense related to our indebtedness with variable interest rates, including borrowings under our credit facility; |
• | limiting our flexibility in planning for, or reacting to, and increasing our vulnerability to changes in our business, the industry in which we operate and the general economy; |
• | placing us at a competitive disadvantage compared to our competitors that have less debt or are less leveraged; |
• | making cash dividends more expensive under our Series B Preferred Stock; and |
• | preventing us from paying dividends. |
Any of the above-listed factors could have an adverse effect on our business, financial condition and results of operations and our ability to meet our payment obligations. Our ability to meet our payment and other obligations under our debt instruments depends on our ability to generate significant cash flow in the future. This, to some extent, is subject to general economic, financial, competitive, legislative and regulatory factors as well as other factors that are beyond our control. We cannot assure you that our business will generate cash flow from operations, or that future borrowings will be available to us under our Third A&R Credit Agreement in an amount sufficient to enable us to meet our payment obligations and to fund other liquidity needs. If we are not able to generate sufficient cash flow to service our debt obligations, we may need to refinance or restructure our debt, sell assets, reduce or delay capital investments, or seek to raise additional capital, and some of these activities may be on terms that are unfavorable or highly dilutive. Our ability to refinance our indebtedness will depend on the capital markets and our financial condition at such time. If we are unable to implement one or more of these alternatives, we may not be able to meet our payment obligations.
Our Third A&R Credit Agreement, the Series A Preferred Stock and Series B Preferred Stock impose restrictions on us that may prevent us from engaging in transactions that might benefit us.
The Third A&R Credit Agreement contains restrictions that, among other things prevents or restricts us from:
• | engaging in certain transactions with affiliates; |
• | buying back shares or paying dividends in excess of specified amounts; |
• | making investments and acquisitions in excess of specified amounts; |
• | incurring additional indebtedness in excess of specified amounts; |
• | creating certain liens against our assets; |
• | prepaying subordinated indebtedness; |
23
• | engaging in certain mergers or combinations; |
• | failing to satisfy certain financial tests; and |
• | engaging in transactions that would result in a “change of control.” |
Additionally, the holders of our Series A Preferred Stock and Ares, in the case of our Series B Preferred Stock have the right to consent to certain actions prior to us undertaking them, including, but not limited to:
• | creating or authorizing any senior stock, parity stock and stock that votes together with the Series A Preferred Stock or Series B Preferred Stock, or capital stock of a subsidiary; |
• | reclassifications, alterations or amendments of any of our capital stock or of our subsidiaries that would render such capital stock senior or on parity to the Series A Preferred Stock or Series B Preferred Stock; |
• | entering into any agreement with respect to, or consummating, any merger, consolidation or similar transaction with any other person pursuant to which we or a subsidiary of ours would not be the surviving entity, if as a result of such transaction, any capital stock or equity or equity-linked securities of such person would rank senior to or pari passu with the Series A Preferred Stock or Series B Preferred Stock; |
• | entering certain agreements with respect to, or consummating, any merger, consolidation or similar transaction with any other person pursuant to which we or a subsidiary of ours would not be the surviving entity, if as a result of such transaction, any capital stock or equity or equity-linked securities of such person would rank senior to or on parity with such Series A Preferred Stock or Series B Preferred Stock; |
• | assuming, incurring or guarantying, or authorizing the creation, assumption, incurrence or guarantee of, any indebtedness for borrowed money (subject to certain exceptions); |
• | authorizing or consummating certain change of control events or liquidation events; or |
• | altering, amending, supplementing, restating, waiving or otherwise modifying the certificates governing the Series A Preferred Stock or Series B Preferred Stock or any other of our documents in a manner that would reasonably be expected to be materially adverse to the rights or obligations of the holders of Series A Preferred Stock or Series B Preferred Stock. |
The Series B Preferred Stock contains additional consent rights, including with respect to:
• | increasing the size of the Board; |
• | conducting any business or entering into or conducting any transaction or series of transaction with, or for the benefit of, any affiliate, subject to limitations; |
• | entering into any transaction, contract, agreement or series of related transactions, contracts, or agreement with respect to the provision of services to customers exceeding certain amounts; or |
• | with respect to Saiia, subject to certain limitations: (i) entering into any agreement with respect to, or consummate any, merger, consolidation or similar transaction with Saiia or any of its subsidiaries, (ii) assuming, incurring or guaranteeing, or authorizing the creation, assumption, incurrence or guarantee of any indebtedness by, or for the benefit of Saiia or any of its subsidiaries, (iii) creating, incurring, assuming or suffering to exist any lien upon or with respect to any property or assets for the benefit of Saiia or any of its subsidiaries or security any obligations of Saiia or any of its subsidiaries above certain limits, (iv) consummating any sale, lease, transfer, issuance or other disposition, including by means of a merger, consolidation or similar transaction, of any shares of capital stock of a subsidiary or any other of our assets or of or any subsidiary to Saiia or any of its subsidiaries, or (v) subject to certain exceptions, making any advance, loan, extension of credit or capital contribution to, or purchase any capital stock, bonds, notes, debentures or other debt securities of Saiia or any of its subsidiaries. |
Accordingly, provisions in the Third A&R Credit Agreement that restrict our business could make compliance with the terms and conditions of the Third A&R Credit Agreement more difficult. Furthermore, provisions in the Third A&R Credit Agreement, as well as rights of holders of the Series A Preferred Stock and Series B Preferred Stock could impact our ability to engage in transactions we deem beneficial.
24
There may be future sales of our Common Stock or other dilution of our equity that could adversely affect the market price of our Common Stock. In connection with certain completed acquisitions, we have issued shares of our Common Stock, and we additionally have the option to issue shares of our Common Stock instead of cash as consideration for future earn-out obligations.
We may agree to issue additional shares in connection with other future acquisition or financing transactions, which, if issued, would dilute your share ownership and could lead to volatility in our Common Stock price. We grow our business organically as well as through acquisition. One method of acquiring companies or otherwise funding our corporate activities is through the issuance of equity securities. In connection with certain acquisitions, we have the option to issue shares of our Common Stock instead of paying cash for the related earn-out obligations. Such issuances could have the effect of diluting our earnings per share as well as our existing stockholders’ individual ownership percentages and could lead to volatility in our Common Stock price.
We are not restricted from issuing additional Common Stock. The issuance of additional shares of our Common Stock in connection with future acquisitions, convertible securities or other issuances of our Common Stock, including restricted stock awards, restricted stock units and/or options, or otherwise, will dilute the ownership interest of our holders of our Common Stock. Sales of a substantial number of shares of our Common Stock or other equity-related securities in the public market could depress the market price of our Common Stock and impair our ability to raise capital through the sale of additional equity or equity-linked securities. We cannot predict the effect that future sales of our Common Stock or other equity-related securities would have on the market price of our Common Stock.
Oaktree and M III Sponsor I LLC have significant ability to influence corporate decisions.
Oaktree and its affiliates own 10,313,500 shares of Common Stock, which represents approximately 46.3% of the total issued and outstanding Common Stock, and M III Sponsor I, LLC ("M III Sponsor") and its affiliates own 1,217,206 shares of Common Stock, which represents approximately 5.5% of the issued and outstanding Common Stock. All percentages are based upon 22,266,233 shares of Common Stock outstanding as of March 11, 2019. These amounts do not include shares of Common Stock issuable upon conversion of Series A Preferred Stock, Series B Preferred Stock or warrants held by Oaktree Capital Group, LLC and its affiliates, and warrants held by M III Sponsor and its affiliates.
As long as Oaktree and M III Sponsor own or control a significant percentage of our outstanding voting power, they will have the ability to significantly influence all corporate actions requiring stockholder approval, including the election and removal of directors and the size of our board of directors, any amendment to our Certificate of Incorporation or our Amended and Restated Bylaws (the "Bylaws"), or the approval of any merger or other significant corporate transaction, including a sale of substantially all of our assets.
In addition, pursuant to the terms of the Third Amended and Restated Investor Rights Agreement, dated as of January 23, 2020 (the "Third A&R Investor Rights Agreement"), each of Oaktree and M III Sponsor have consent rights over certain matters for so long as Oaktree or M III Sponsor and certain of their permitted transferees and affiliates, directly or indirectly, beneficially own at least fifty percent (50%) of the Common Stock (including unvested founder shares, in the case of M III Sponsor) beneficially owned by Oaktree or the Sponsors, respectively, as of the closing of our business combination, including: (i) entering into, waiving, amending or otherwise modifying the terms of any transaction or agreement between us and any of our subsidiaries, on the one hand, and (a) M III Sponsor or their affiliates or any affiliate of us, on the other hand (in the case of Oaktree), other than the exercise of any rights under certain existing agreements (without giving effect to any subsequent amendments) or (b) Oaktree or their affiliates (in the case of M III Sponsor), subject to certain exceptions, and other than the exercise of any rights under certain existing agreements (without giving effect to any subsequent amendments); (ii) in the case of Oaktree, hiring or removing the Chief Executive Officer or any other executive officer or amending, supplementing, waiving or failing to enforce the Voting Agreement (as defined herein); or (iii) except as contemplated by the Third A&R Investor Rights Agreement, increasing or decreasing the size of the Board.
Under the Third A&R Investor Rights Agreement, Oaktree and M III Sponsor also have ongoing rights to nominate one director, depending on the ownership interests of Oaktree or M III Sponsor.
The interests of Oaktree and M III Sponsor may not align with the interests of our other stockholders. Oaktree and M III Sponsor are in the business of making investments in companies and may acquire and hold interests in businesses that compete directly or indirectly with us. Oaktree and M III Sponsor may also pursue acquisition opportunities that may be complementary to our business, and, as a result, those acquisition opportunities may not be available to us. Our Certificate of Incorporation also provides that M III Sponsor and Oaktree and their respective partners, principals, directors, officers,
25
members, managers and/or employees, including any of the foregoing who serve as officers or directors of the post-combination company, do not have any fiduciary duty to refrain from engaging directly or indirectly in the same or similar business activities or lines of business as the post-combination company or any of its subsidiaries.
Ares may have the ability to influence certain corporate decisions through the exercise of certain rights, including under the respective certificates of designation for the Series B-1 Preferred Stock, Series B-2 Preferred Stock and Series B-3 Preferred Stock.
ASSF IV and ASOF Holdings, each a fund affiliated with Ares, collectively own 160,000 shares of Series B Preferred Stock and warrants exercisable for 5,996,310 shares of Common Stock. Ares has the right to appoint two directors to our Board pursuant to the terms of the certificate of designations for the Series B-1 Preferred Stock and Series B-2 Preferred Stock, but has agreed to only nominate one member so long as the terms of the Waiver Agreement (as defined herein) are satisfied. On March 4, 2020, Ares designated a director to our Board. Ares has consent rights under the respective certificate of designations for the Series B Preferred Stock. Please see "-Third A&R Credit Agreement, the Series A Preferred Stock and Series B Preferred Stock impose restrictions on us that may prevent us from engaging in transactions that might benefit us. The interests of Ares, ASSF IV and ASOF Holdings may not align with the interests of our other stockholders. Ares, ASSF IV and ASOF Holdings are in the business of making investments in companies and may acquire and hold interests in businesses that compete directly or indirectly with us. Ares, ASSF IV and ASOF Holdings may also pursue acquisition opportunities that may be complementary to our business, and, as a result, those acquisition opportunities may not be available to us.
Our liquidity remains seasonally constrained and we could require additional sources of liquidity in the future to fund our operations and service our indebtedness.
We have experienced decreased liquidity due to the increase of our required seasonal payments and interest under our Third A&R Credit Agreement, acquisition integration costs and delayed collections for costs relating to the multiple severe weather events in the third quarter 2018 and were completed in the second quarter of 2019. Although we have taken steps to enhance our liquidity, our liquidity remains seasonally constrained.
We anticipate that our existing cash balances, funds generated from operations, proceeds from the issuance of the Series B Preferred and borrowings under our Third A&R Credit Agreement will be sufficient to meet our cash requirements for the next twelve months, but we cannot provide any assurance that these sources will be sufficient because there are many factors that could affect our liquidity, including some that are beyond our control. Factors that could cause our future liquidity to vary materially from expectations include, but are not limited to, weather events, bonding obligations, contract disputes with customers, loss of customers, spending patterns of customers, unforeseen costs and expenses and our ability to maintain compliance with the covenants and restrictions in our Third A&R Credit Agreement (or obtain waivers in the event of noncompliance). If we encounter circumstances that place unforeseen constraints on our capital resources, we will be required to take additional measures to conserve or enhance liquidity.
In the future, we may require additional funds for operating purposes and may seek to raise additional funds through debt or equity financing. If we ever need to seek additional financing, there is no assurance that this additional financing will be available, or if available, will be on reasonable terms. If our liquidity and capital resources are insufficient to meet our working capital requirements or fund our debt service obligations, we could face substantial liquidity problems, may not be able to generate sufficient cash to service all our indebtedness and may be forced to take other actions to satisfy our obligations under our indebtedness, which may not be successful. In the event we are not able to fund our working capital, we will not be able to implement or may be required to delay all or part of our business plan, and our ability to improve our operations, generate positive cash flows from operating activities and expand the business would be materially adversely affected.
If our results of operations were negatively impacted by unforeseen factors, or impacted to a greater degree than anticipated, we might not be able to maintain compliance with the covenants and restrictions in our Third A&R Credit Agreement. If we are unable to comply with the financial covenants in the future, and are unable to obtain a waiver or forbearance, it would result in an uncured default under the Third A&R Credit Agreement. If a default under the Third A&R Credit Agreement were not cured or waived, we would be unable to borrow under the Third A&R Credit Agreement and the indebtedness thereunder could be declared immediately due and payable. A default under our Third A&R Credit Agreement may also be considered a default under certain other of our instruments and contracts. If we were unable to borrow under the Third A&R Credit Agreement, we would need to meet our capital requirements using other sources. Alternative sources of liquidity may not be available on acceptable terms if at all. Even if we were able to obtain an amendment, forbearance agreement or waiver in the future, we might be required to agree to other changes to the Third A&R Credit Agreement, including increased interest rates or premiums, more restrictive covenants and/or pay a fee for such amendment, forbearance
26
agreement or waiver. Any of these events would have a material adverse effect on our business, financial condition and liquidity.
As of December 31, 2019, we are no longer an “emerging growth company” and are therefore subject to the auditor attestation requirement in the assessment of our internal control over financial reporting and certain other increased disclosure and governance requirements.
As of December 31, 2019, the Company's total annual gross revenues exceed $1.07 billion and we are no longer an “emerging growth company,” as defined in the Jumpstart Our Business Startups Act (the “JOBS Act”). Therefore, we are now subject to certain requirements that apply to other public companies but did not previously apply to us due to our status as an emerging growth company. These requirements include but are not limited to:
• | compliance with the auditor attestation requirement in the assessment of our internal control over financial reporting pursuant to Section 404 of Sarbanes-Oxley Act; |
• | compliance with any new rules that may be adopted by the Public Company Accounting Oversight Board; |
• | compliance with any new or revised financial accounting standards applicable to public companies without an extended transition period. See below for further discussion of financial accounting standards adopted in the current year; |
• | full disclosure regarding executive compensation required of larger public companies; and |
• | compliance with the requirement of holding a nonbinding advisory vote on executive compensation and obtaining shareholder approval of any golden parachute payments not previously approved. |
Failure to comply with these requirements could subject us to enforcement actions by the SEC, divert management’s attention, damage our reputation, and adversely affect our business, results of operations, or financial condition. In particular, if our independent registered public accounting firm is not able to render the required attestation, it could result in lost investor confidence in the accuracy, reliability, and completeness of our financial reports. We expect that the loss of “emerging growth company” status and compliance with these increased requirements will require management to expend additional time while also condensing the time frame available to comply with certain requirements, which may further increase our legal and financial compliance costs.
Our quarterly operating results may fluctuate significantly and could fall below the expectations of securities analysts and investors due to seasonality and other factors, some of which are beyond our control, resulting in a decline in our stock price.
Our quarterly operating results may fluctuate significantly because of several factors, including:
• | weather events; |
• | labor availability and costs for hourly and management personnel; |
• | profitability of our products and services, especially in new markets and due to seasonal fluctuations; |
• | changes in interest rates; |
• | impairment of long-lived assets; |
• | macroeconomic conditions, both nationally and locally; |
• | negative publicity relating to products and services we offer; |
• | changes in consumer preferences and competitive conditions; |
• | expansion to new markets; and |
• | fluctuations in commodity prices. |
27
Our Certificate of Incorporation, Bylaws and certain provision of Delaware law contain anti-takeover provisions that could impair a takeover attempt.
As a Delaware corporation, anti-takeover provisions may impose an impediment to the ability of others to acquire control of us, even if a change of control would be of benefit to our stockholders. In addition, certain provisions of our Certificate of Incorporation and our Bylaws, also may impose an impediment or discourage others from a takeover.
These provisions include:
• | a staggered board of directors providing for three classes of directors, which limits the ability of a stockholder or group to gain control of our board of directors; |
• | a prohibition on stockholder action by written consent, which forces stockholder action to be taken at an annual or special meeting of our stockholders; |
• | a prohibition on stockholders calling a special meeting and the requirement that a special meeting of stockholders may only be called by (i) the chairman of our Board, (ii) our Chief Executive Officer, (iii) a majority of our Board, or (iv) directors designated by M III Sponsor or Oaktree subject to certain conditions set forth in the Third A&R Investor Rights Agreement; and |
• | the requirement that changes or amendments to certain provisions of our Certificate of Incorporation or Bylaws must be approved by holders of at least two-thirds of the Common Stock and, in some cases under our Bylaws, 80% of the Common Stock. |
The terms of our Series A Preferred Stock and Series B Preferred Stock reduce the likelihood of dividend payments on our Common Stock, and may otherwise adversely affect the Common Stock.
If not paid in cash at a rate of 10% per annum, dividends on our Series A Preferred Stock will accrue and increase the stated value of the Series A Preferred Stock at a rate of 12% per annum. If not paid in cash at a rate of 13.5% per annum (or 12% in the event our Total Net Leverage Ratio is less than or equal to 1.50 to 1.00), dividends on our Series B Preferred Stock will accrue and increase the stated value of the Series B Preferred Stock at a rate of 15% per annum.
If we elect not to pay cash dividends, or our business does not generate enough cash to make the cash dividends on the Series A Preferred Stock and Series B Preferred Stock, dividends will accrue and increase the stated value. An increase in the stated value would result in an increase in the aggregate amount of cash we need to pay future cash dividends. Dividends on the Series A Preferred Stock and Series B Preferred Stock rank senior in priority to dividends on our Common Stock. Accordingly, the terms of the Series A Preferred Stock and Series B Preferred Stock reduce the likelihood that we will pay dividends on our Common Stock in the future, which may cause the price of our Common Stock to decline. An increase in the stated value may also result in holders of Series A Preferred Stock and Series B Preferred Stock having larger claims in the event of our liquidation or dissolution.
Our Common Stockholders may face substantial dilution as a result of warrants.
On May 20, 2019, under the First Equity Commitment Agreement, we issued the First ECA Warrants exercisable into an aggregate of 2,545,934 shares of Common Stock. On August 30, 2019, under the Second Equity Commitment Agreement, we issued the Second ECA Warrants exercisable into an aggregate of 900,000 shares of Common Stock. On November 14, 2019, we issued the Third ECA Warrants exercisable into 3,568,750 shares of Common Stock. On November 14, 2019, we also issued the Preferred Exchange Agreement Warrants exercisable into 657,383 shares of Common Stock pursuant to the Preferred Exchange Agreement.
Each of the First Equity Commitment Agreement, Second Equity Commitment Agreement, Third Equity Commitment Agreement and Preferred Exchange Agreement has provisions that require us to issue additional warrants upon additional issuances of Common Stock and warrants. These additional issuances may result in a significant additional number of warrants and Common Stock, the exact number of which cannot be determined and which may are depend on future events, many of which are out of our control
The warrants issued under the First Equity Commitment Agreement, Second Equity Commitment Agreement, Third Equity Commitment Agreement and Preferred Exchange Agreement are exercisable into our Common Stock at an exercise price per share of $0.0001, which the holder may pay by check or wire transfer, or by instructing us to withhold a number of
28
shares of Common Stock then issuable upon exercise of the Warrant with an aggregate fair market value as of the date of exercise equal to the aggregate exercise price, or any combination of the foregoing. The number of shares of Common Stock issuable upon exercise of the warrants adjust for dividends, subdivisions or combinations; cash distributions or other distributions; reorganization, reclassification, consolidation or merger; and spin-offs.
The shares of Common Stock that may be issued under the warrants pursuant to the First Equity Commitment Agreement, Second Equity Commitment Agreement, Third Equity Commitment Agreement and Preferred Exchange Agreement are subject to that certain Amended and Restated Registration Rights Agreement, dated March 26, 2018, as amended (the “Registration Rights Agreement”), and accordingly, we may be required to register the shares of Common Stock underlying the warrants for resale.
Accordingly, our presently existing warrants and warrants that may be issued in the future may result in substantial additional issuances and resales of Common Stock. In certain instances, the timing and number of additional warrants that may be issued is unknown and dependent upon future events and circumstances, some of which are outside of our control. Additional issuances of Common Stock, and/or sales of Common Stock, would have the effect of diluting our earnings per share as well as our existing shareholders’ individual ownership percentages and could lead to volatility in our Common Stock price. Sales of a substantial number of shares of our Common Stock could depress the market price of our Common Stock and impair our ability to raise capital through the sale of additional equity or equity-linked securities.
The Series A Preferred Stock may result in substantial dilution to holders of our Common Stock.
On November 14, 2019, we issued 19,123.87 shares of Series B-3 Preferred Stock and 657,383 Preferred Exchange Agreement Warrants to IEA LLC in exchange for 50% of the outstanding Series A Preferred Stock pursuant to the Preferred Exchange Agreement. As of the date hereof, we have 17,482.5 shares of Series A Preferred Stock outstanding. Any holder of Series A Preferred Stock may elect, by written notice to us (w) at any time and from time to time on or after the third anniversary of March 26, 2018, (x) at any time and from time to time if the terms of the Series B Preferred Stock or Third A&R Credit Agreement (or other facility) would prohibit the payment of cash dividends on the Series A Preferred Stock, (y) at any time any shares of Series B Preferred Stock are outstanding, or (z) at any time and from time to time on or after the non-payment of dividends when due, failure to redeem shares of Series A Preferred Stock when required or any other material default (in each case, as further specified in the certificate) until such non-payment, failure or default is cured by us, to cause us to convert, without the payment of additional consideration by such holder, all or any portion of the issued and outstanding shares of Series A Preferred Stock held by such holder, as specified by such holder in such notice, into a number of shares of Common Stock determined by dividing (i) the stated value plus accrued and unpaid dividends by (ii) the VWAP per share of Common Stock for the 30 consecutive trading days ending on the trading day immediately preceding the conversion date. In the event the Series A Preferred Stock is converted following an uncured non-payment, failure or default event, or if a holder of Series A Preferred Stock is converting pursuant to (x) or (y) above, for the purposes of the foregoing calculation, VWAP per share shall be multiplied by 90%. The “VWAP per share” is defined as the per share volume-weighted average price as reported by Bloomberg (as further described in the certificate governing the Series A Preferred Stock).
The shares of Common Stock that may be issued upon conversion of the Series A Preferred Stock are subject to the Registration Rights Agreement, and accordingly, we may be required to register the shares of Common Stock underlying the Series A Preferred Stock for resale.
Accordingly, the Series A Preferred Stock may result in substantial additional issuances and resales of Common Stock. The timing and number of shares of Common Stock that may be issued as a result of the Series A Preferred Stock is unknown and dependent upon future events and circumstances, some of which are outside of our control. Additional issuances of Common Stock, and/or sales of Common Stock, would have the effect of diluting our earnings per share as well as our existing shareholders’ individual ownership percentages and could lead to volatility in our Common Stock price. Sales of a substantial number of shares of our Common Stock could depress the market price of our Common Stock and impair our ability to raise capital through the sale of additional equity or equity-linked securities.
Our stock price has experienced significant volatility.
Our stock price has declined significantly since the third quarter of 2018, and has exhibited substantial volatility in 2019, including following our press releases on August 14, 2019 and October 9, 2019. Our price may fluctuate in response to a number of events and factors, including, but not limited to:
• | actual or anticipated quarterly operating results; |
29
• | new developments and significant transactions; |
• | the financial projections we provide to the public, and any changes to the projections or failure to meet the projections; |
• | changes in our credit ratings; |
• | the public’s reaction to our press releases, other public announcements and filings with the SEC; |
• | changes in financial estimates, recommendations and coverages by securities analysts; |
• | media coverage of our business and financial performance; |
• | trends in our industry; |
• | significant changes in our management; |
• | lawsuits threatened or filed against us; and |
• | general economic conditions. |
Price volatility over a given period or a low stock price may result in a number of negative outcomes, including, but not limited to:
• | creating potential limitations on the ability to raise capital through the issuance of equity or equity linked securities; |
• | impacting the value of our equity compensation, which affects our ability to recruit and retain employees; |
• | decreasing the value of the contingent earn-out related to our merger agreement, held in large part by members of management, which could cause a decline in job satisfaction or lead to management turnover; |
• | difficulty complying with the listing standards of NASDAQ; and |
• | increasing the risk of regulatory proceedings and litigation, including class action securities litigation |
If any of these outcomes were to occur, it could materially and adversely affect our business, financial condition, or results of operations, and the value of your investment.
Risks Related to Our Industry and Our Customers’ Industries
Economic downturns could reduce capital expenditures in the industries we serve, which could result in decreased demand for our services.
The demand for our services has been, and will likely continue to be, cyclical in nature and vulnerable to general downturns in the U.S. economy. During economic downturns, our customers may not have the ability to fund capital expenditures for infrastructure, or may have difficulty obtaining financing for planned projects. In addition, uncertain or adverse economic conditions that create volatility in the credit and equity markets may reduce the availability of debt or equity financing for our customers, causing them to reduce capital spending. This has resulted, and in the future could result, in cancellations of projects or deferral of projects to a later date. Such cancellations or deferrals could materially and adversely affect our results of operations, cash flows and liquidity. These conditions could also make it difficult to estimate our customers’ demand for our services and add uncertainty to the determination of our backlog.
In addition, our customers are negatively affected by economic downturns that decrease the need for their services or the profitability of their services. During an economic downturn, our customers also may not have the ability or desire to continue to fund capital expenditures for infrastructure or may outsource less work. A decrease in related project work could negatively impact demand for the services we provide and could materially adversely affect our business, financial condition, results of operations, profitability, cash flows and growth prospects.
30
Our customers may be adversely affected by market conditions and economic downturns, which could impair their ability to pay for our services.
Slowing conditions in the industries we serve, as well as economic downturns or bankruptcies within these industries, may impair the financial condition of one or more of our customers and hinder their ability to pay us on a timely basis. In difficult economic times, some of our clients may find it difficult to pay for our services on a timely basis, increasing the risk that our accounts receivable could become uncollectible and ultimately be written off. In certain cases, our clients are project-specific entities that do not have significant assets other than their interests in the project. From time to time, it may be difficult for us to collect payments owed to us by these clients. Delays in client payments may require us to make a working capital investment, which could negatively impact our cash flows and liquidity. If a client fails to pay us on a timely basis or defaults in making payments on a project for which we have devoted significant resources, it could materially and adversely affect our business, financial condition, results of operations, profitability, cash flows and growth prospects.
Our industry is highly competitive, which may reduce our market share and harm our financial performance.
We compete with other companies in most of the markets in which we operate, ranging from small independent firms servicing local markets to larger firms servicing regional and national markets. We also face competition from existing and prospective customers that employ in-house personnel to perform some of the services we provide. Additionally, organizations that have adequate financial resources and access to technical expertise and skilled personnel may become a competitor. Most of our customers’ work is awarded through a bid process. Consequently, although management believes reliability is often more important to customers than price, price is often the principal factor that determines which service provider is selected, especially on smaller, less complex projects. Smaller competitors sometimes win bids for these projects based on price alone due to their lower costs and financial return requirements. Additionally, our bids for certain projects may not be successful because of a customer’s perception of our relative ability to perform the work as compared to our competitors or a customer’s perception of technological advantages held by our competitors as well as other factors. Our business, financial condition, results of operations, profitability, cash flows and growth prospects could be materially and adversely affected if we are unsuccessful in bidding for projects or renewing our contracts, or if our ability to win such projects or agreements requires that we accept lower margins.
Many of the industries we serve are subject to customer consolidation, rapid technological and regulatory changes, and our inability or failure to adjust to our customers’ changing needs could result in decreased demand for our services.
We derive a substantial portion of our revenue from customers in the heavy civil and power generation industries, which are subject to consolidation, rapid changes in technology and governmental regulation. Consolidation of any of our customers, or groups of our customers, could result in the loss of one or more of these customers, or could affect customer demand for the services we provide. Additionally, changes in technology may reduce demand for the services we provide.
New technologies or upgrades to existing technologies by customers could reduce demand for our services. Technological advances may result in lower costs for sources of energy, which could render existing renewable energy projects and technologies uncompetitive or obsolete. Our failure to rapidly adopt and master new technologies as they are developed in any of the industries we serve could have a material adverse effect on our results of operations, cash flows and liquidity. Furthermore, certain of our customers face stringent regulatory and environmental requirements and permitting processes as they implement plans for their projects, any of which could result in delays, reductions and cancellations of projects, which could materially and adversely affect our business, financial condition, results of operations, profitability, cash flows and growth prospects.
ITEM 1B. UNRESOLVED STAFF COMMENTS
Not Applicable.
31
ITEM 2. PROPERTIES
Our corporate headquarters, located in Indianapolis, Indiana, is a leased facility approximating 27,000 square feet. We also lease from an affiliate a 56,000 square foot office and 26,000 square foot maintenance facility in Clinton, Indiana. As of December 31, 2019, our operations were conducted from approximately 15 locations within the U.S. None of these facilities is material to our operations because most of our services are performed on customers’ premises or on public rights of way and suitable alternative locations are available in substantially all areas where we currently conduct business. We also own property and equipment that had a net book value of approximately $140.5 million as of December 31, 2019. This property and equipment includes trucks, tractors, trailers, forklifts, backhoes, sidebooms, bulldozers, excavators, trenchers, graders, loaders, scrapers, drilling machines, cranes, computers, computer software, office and building equipment, including furniture and fixtures and other equipment. Substantially all of our equipment is acquired from third-party vendors, upon none of which we depend, and we did not experience any difficulties in obtaining desired equipment in 2019.
ITEM 3. LEGAL PROCEEDINGS
IEA is subject to a variety of legal cases, claims and other disputes that arise from time to time in the ordinary course of its business. IEA cannot provide assurance that it will be successful in recovering all or any of the potential damages it has claimed or in defending claims against IEA. While the lawsuits and claims are asserted for amounts that may be material, should an unfavorable outcome occur, management does not currently expect that any currently pending matters will have a material adverse effect on our financial position, results of operations or cash flows. However, an unfavorable resolution of one or more of such matters could have a material adverse effect on IEA’s business, financial condition, results of operations and cash flows.
ITEM 4. MINE SAFETY DISCLOSURES
Not applicable.
PART II
ITEM 5. MARKET FOR REGISTRANT’S COMMON EQUITY, RELATED SHAREHOLDER MATTERS AND ISSUER PURCHASES OF EQUITY SECURITIES
Market Information and Holders
Our Common Stock is listed on the NASDAQ stock market under the symbol IEA. As of January 31, 2020, there were 1134 holders of record of our common shares. Our warrants are listed on the NASDAQ Capital Market under the symbol IEAW. As of January 31, 2020, there were 307 holders of record of our warrants.
Dividend Policy
Our current credit facility includes certain limitations on the payment of cash dividends on our common shares. We have not paid any cash dividends since our initial public offering and do not anticipate paying any cash dividends on our common shares in the foreseeable future.
Stock Performance
The performance graph below compares the cumulative nine month total return for our Common Stock with the cumulative total return (including reinvestment of dividends) of the Russell Broadbased Index Total Return (“Russell 3000”), and with that of our peer group, which is composed of MasTec, Inc., Quanta Services, Inc., MYR Group, Inc., Construction Partners, Inc., Emcor Corporation, Granite Construction, Inc., Tetra Tech, Inc., Willdan Group, Inc., Dycom Industries, Inc. and Primoris Services Corporation. The graph assumes that the value of the investment in our Common Stock, as well as that of the Russell 3000 and our peer group, was $100 on March 31, 2018 and tracks it quarterly through December 31, 2019. The comparisons in the graph are based upon historical data and are not intended to forecast or be indicative of possible future performance of our Common Stock.
32
The performance graph shall not be deemed incorporated by reference by any general statement incorporating by reference this Annual Report into any filing under the Securities Act or the Exchange Act, except to the extent we specifically incorporate this information by reference, and shall not otherwise be deemed filed under such acts.
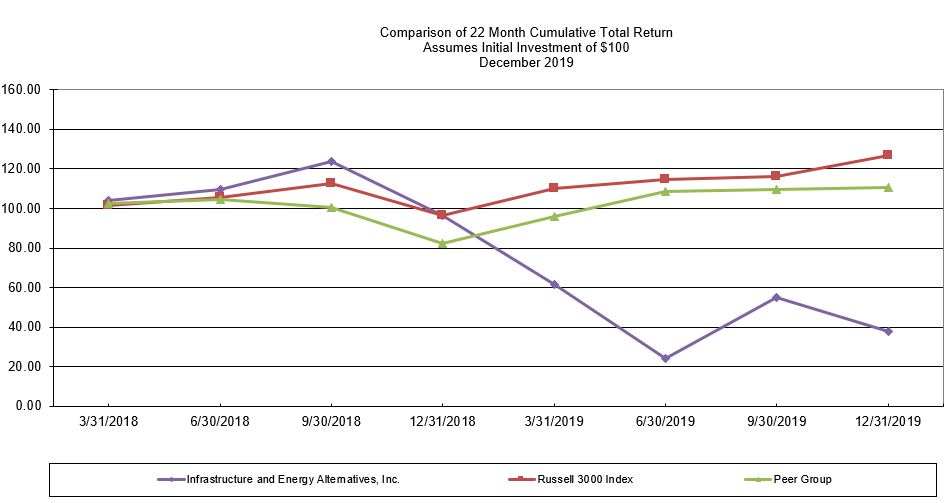
33
ITEM 6. SELECTED FINANCIAL DATA
The information below is only a summary and should be read in conjunction with “Item 7. Management’s Discussion and Analysis of Financial Condition and Results of Operations” and our audited consolidated financial statements and the accompanying notes included in “Item 8. Financial Statements and Supplementary Data” in this Annual Report on Form 10-K.
For the Years Ended December 31, | |||||||||||||||||||
(in thousands, except per share data) | 2019(4) | 2018 | 2017 | 2016 | 2015 | ||||||||||||||
Statement of Operations Data: | |||||||||||||||||||
Revenue(1) | $ | 1,459,763 | $ | 779,343 | $ | 454,949 | $ | 602,665 | $ | 204,640 | |||||||||
Cost of revenue | 1,302,746 | 747,817 | 388,928 | 517,419 | 184,850 | ||||||||||||||
Gross profit | $ | 157,017 | $ | 31,526 | $ | 66,021 | $ | 85,246 | $ | 19,790 | |||||||||
Selling, general and administrative expenses | $ | 120,186 | $ | 72,262 | $ | 33,543 | $ | 30,705 | $ | 27,169 | |||||||||
Income (loss) from operations | 36,831 | (40,736 | ) | 32,478 | 54,541 | (8,907 | ) | ||||||||||||
Other (expense) income, net: | (27,959 | ) | 32,038 | (2,090 | ) | (303 | ) | 317 | |||||||||||
Net income (loss) from continuing operations | $ | 6,231 | $ | 4,244 | $ | 16,525 | $ | 64,451 | $ | (8,696 | ) | ||||||||
Net income (loss) from discontinued operations | — | — | — | 1,087 | (19,487 | ) | |||||||||||||
Net income (loss) | $ | 6,231 | $ | 4,244 | $ | 16,525 | $ | 65,538 | $ | (28,183 | ) | ||||||||
Earnings Per Share Data:(2) | |||||||||||||||||||
Net (loss) income from continuing operations per common share - basic(3) | $ | (0.97 | ) | $ | (2.01 | ) | $ | 0.77 | $ | 2.99 | $ | (0.40 | ) | ||||||
Net income (loss) from discontinued operations per common share - basic | — | — | — | 0.05 | (0.90 | ) | |||||||||||||
Net (loss) income per common share - basic | $ | (0.97 | ) | $ | (2.01 | ) | $ | 0.77 | $ | 3.04 | $ | (1.30 | ) | ||||||
Cash Flow Data: | |||||||||||||||||||
Net cash provided by (used in) operating activities | $ | 79,812 | $ | 47,018 | $ | (9,109 | ) | $ | 53,591 | $ | (5,617 | ) | |||||||
Net cash (used in) provided by investing activities | 610 | (169,834 | ) | (3,508 | ) | (3,000 | ) | 352 | |||||||||||
Net cash provided by (used in) financing activities | (4,474 | ) | 189,250 | (4,113 | ) | (29,617 | ) | 8,541 | |||||||||||
As of December 31, | |||||||||||||||||||
2019(4) | 2018 | 2017 | 2016 | 2015 | |||||||||||||||
Balance Sheet Data: | |||||||||||||||||||
Cash and cash equivalents | $ | 147,259 | $ | 71,311 | $ | 4,877 | $ | 21,607 | $ | — | |||||||||
Accounts receivable, net | 203,645 | 225,366 | 60,981 | 69,977 | 37,594 | ||||||||||||||
Contract assets(4) | 179,303 | 47,121 | 18,613 | 14,143 | 16,016 | ||||||||||||||
Property, plant and equipment, net | 140,488 | 176,178 | 30,905 | 20,540 | 14,152 | ||||||||||||||
Total assets | 824,921 | 639,228 | 126,703 | 147,716 | 74,363 | ||||||||||||||
Accounts payable and accrued liabilities | 335,886 | 252,134 | 70,030 | 97,244 | 79,043 | ||||||||||||||
Contract liabilities(4) | 115,634 | 62,234 | 7,398 | 28,181 | 15,902 | ||||||||||||||
Long-term debt | 162,901 | 328,307 | 33,674 | — | 27,946 | ||||||||||||||
Debt Series B Preferred Stock | 166,141 | — | — | — | — | ||||||||||||||
Total liabilities | 916,541 | 735,441 | 136,722 | 134,841 | 150,207 | ||||||||||||||
Preferred stock | 17,483 | 34,965 | — | — | — | ||||||||||||||
Total stockholders' (deficit) equity | (109,103 | ) | (131,178 | ) | (10,019 | ) | 12,875 | (75,844 | ) | ||||||||||
(1) The Company had two acquisitions in late 2018. As of December 31, 2019 and 2018 the acquired businesses revenue was $582.3 million and $125.6 million respectively.
(2) The calculation of weighted average common shares outstanding during the periods preceding a reverse recapitalization generally requires the Company to use the capital structure of the entity deemed to be the acquirer for accounting purposes to
34
calculate EPS. However, as a limited liability company, IEA Services had no outstanding common shares prior to the Merger. Therefore, the weighted average common shares outstanding for all comparable prior periods preceding the Merger is based on the capital structure of the acquired company, as management believes that is the most useful measure. See Note 10. Earnings (Loss) Per Share in the notes to the audited consolidated financial statements included in Item 8.
(3) Net income used in calculation of earnings per share for December 31, 2019 and 2018, reflect declared preferred dividends of $2.9 million and $1.6 million, respectively and adjustments of $23.1 million and $46.3 million, respectively, for the contingent consideration fair value adjustment. See Note 10. Earnings (Loss) Per Share in the notes to the audited consolidated financial statements included in Item 8.
(4) On January 1, 2019 the Company adopted Accounting Standards Codification Topic 606 and 842 using the modified retrospective approach. Given that approach, these standards did not have an impact on fiscal years 2015-2018. See Note 1. Business, Basis of Presentation and Significant Accounting Policies and Note 3. Contract Assets and Liabilities in the notes to the audited consolidated financial statements included in Item 8 for further discussion.
35
ITEM 7. MANAGEMENT’S DISCUSSION AND ANALYSIS OF FINANCIAL CONDITION AND RESULTS OF OPERATIONS
The following discussion and analysis of our financial condition and results of operations should be read in conjunction with our audited consolidated financial statements and the notes to those financial statements included as Item 8 in this Annual Report on Form 10-K. This discussion and analysis includes forward-looking statements that are based on current expectations and are subject to uncertainties and unknown or changed circumstances. For further discussion, please see “Forward-Looking Statements” at the beginning of this Annual Report on Form 10-K. Our actual results may differ materially from those anticipated in these forward-looking statements as a result of many factors, including those risks inherent with our business as discussed in “Item 1A. Risk Factors.”
Throughout this section, unless otherwise noted, “IEA,” the “Company,” “we,” “us” and “our” refer to Infrastructure and Energy Alternatives, Inc. and its consolidated subsidiaries. Certain amounts in this section may not foot due to rounding.
Overview
We are a leading diversified infrastructure construction company with specialized energy and heavy civil expertise throughout the United States. The Company specializes in providing complete engineering, procurement and construction services throughout the United States for the renewable energy, traditional power and civil infrastructure industries. These services include the design, site development, construction, installation and restoration of infrastructure. We are one of three Tier 1 providers in the wind energy industry and have completed more than 200 wind and solar projects in 40 states. Although the Company has historically focused on the wind industry, its recent acquisitions have expanded its construction capabilities and geographic footprint in the areas of environmental remediation, industrial maintenance, specialty paving, heavy civil and rail infrastructure construction, creating a diverse national platform of specialty construction capabilities. We believe we have the ability to continue to expand these services because we are well-positioned to leverage our expertise and relationships in the wind energy business to provide complete infrastructure solutions in all areas.
We segregate our business into two reportable segments: the Renewables (“Renewables”) segment and the Heavy Civil and Industrial (“Specialty Civil”) segment. See Segment Results for a description of the reportable segments and their operations.
Our results for the year ended December 31, 2019 and 2018, reflect the effect of multiple severe weather events on our Renewable business that began late in the third quarter of 2018 and were completed in the second quarter of 2019. These weather conditions had a significant impact on the construction of six wind projects across South Texas, Iowa, and Michigan, resulting in additional labor, equipment and material costs. Although these projects are all now completed, and we are collecting and continuing to collect on change orders relating to force majeure provisions of the contracts with respect to certain of these projects, we are continuing to feel the impacts of these events on our business, including with respect to our financial and liquidity positions and operating cash flows. In connection with the adverse weather effects, the Company took steps in 2019 that it believes enhanced its liquidity. See “Results of Operations” and “Liquidity and Capital Resources”
Merger and Acquisitions
Our long-term diversification and growth strategy has been to broaden our solar, power generation, and civil infrastructure capabilities and geographic presence and to expand the services we provide within our existing business areas. We took important steps in late 2018 by deepening our capabilities and entering new sectors that are synergistic with our existing capabilities and product offerings.
On March 26, 2018, we consummated the Merger pursuant to an Agreement and Plan of Merger, dated November 3, 2017, by and among M III, IEA Services, a Delaware limited liability company, Infrastructure and Energy Alternatives, LLC (the “Seller”), a Delaware limited liability company and the parent of IEA Services immediately prior to such time, and the other parties thereto, which provided for, among other things, the Merger of IEA Services with and into a wholly-owned subsidiary of M III. See Note 2. Merger and Acquisitions in the notes to the audited consolidated financial statements for more information on the Merger.
On September 25, 2018, we acquired CCS, a leading provider of environmental and industrial engineering services. The wholly-owned subsidiaries of CCS, Saiia and the ACC Companies, generally enter into contracts with both government and non-government customers to provide EPC services for environmental, heavy-civil and mining projects. We believe our
36
acquisition of Saiia and the ACC Companies will provide IEA with a strong and established presence in the environmental and industrial engineering markets, enhanced civil construction capabilities and an expanded domestic footprint in less-seasonal Southeast, West and Southwest markets.
On November 2, 2018, we acquired William Charles, a leader in engineering and construction solutions for the rail infrastructure and heavy civil construction industries. We believe our acquisition of William Charles will provide IEA with a market leading position in the attractive rail civil infrastructure market and continue to bolster our further growth in the heavy civil and construction footprint across the Midwest and Southwest.
We believe that through the Merger and the acquisitions above that the Company has transformed its business into a diverse national platform of specialty construction capabilities with market leadership in niche markets, including renewables, environmental remediation and industrial maintenance services, heavy civil and rail.
Economic, Industry and Market Factors
We closely monitor the effects that changes in economic and market conditions may have on our customers. General economic and market conditions can negatively affect demand for our customers’ products and services, which can lead to reductions in our customers’ capital and maintenance budgets in certain end-markets. In the face of increased pricing pressure, we strive to maintain our profit margins through productivity improvements and cost reduction programs. Other market, regulatory and industry factors could also affect demand for our services, such as:
• | changes to our customers’ capital spending plans; |
• | mergers and acquisitions among the customers we serve; |
• | access to capital for customers in the industries we serve; |
• | new or changing regulatory requirements or other governmental policy uncertainty; |
• | economic, market or political developments; and |
• | changes in technology, tax and other incentives. |
While we actively monitor economic, industry and market factors that could affect our business, we cannot predict the effect that changes in such factors may have on our future results of operations, liquidity and cash flows, and we may be unable to fully mitigate, or benefit from, such changes.
Impact of Seasonality and Cyclical Nature of Business
Our revenue and results of operations are subject to seasonal and other variations. These variations are influenced by weather, customer spending patterns, bidding seasons, project schedules and timing, in particular, for large non-recurring projects and holidays. Typically, our revenue in our Renewable segment is lowest in the first quarter of the year because cold, snowy or wet conditions experienced in the northern climates are not conducive to efficient or safe construction practices. Revenue in the second quarter is typically higher than in the first quarter, as some projects begin, but continued cold and wet weather and effects from thawing ground conditions can often impact second quarter productivity. The third and fourth quarters are typically the most productive quarters of the year as a greater number of projects are underway and weather is normally more accommodating to construction projects. In the fourth quarter, many projects tend to be completed by customers seeking to spend their capital budgets before the end of the year, which generally has a positive impact on our revenue. Nevertheless, the holiday season and inclement weather can cause delays, which can reduce revenue and increase costs on affected projects. Any quarter may be positively or negatively affected by adverse or unusual weather patterns, including from excessive rainfall, warm winter weather or natural catastrophes such as hurricanes or other severe weather, making it difficult to predict quarterly revenue and margin variations. The Company has started construction on 2020 renewable projects in late 2019 due to the desire of our customers to finish these projects before September 30, 2020. This shift in demand will impact 2020 quarterly revenues, which we currently anticipate will shift revenue from the fourth quarter back into the second and third quarter of 2020.
Our revenue and results of operations for our Specialty Civil segment are also effected by seasonality but to a lesser extent as these projects are more geographically diverse and located in less severe weather areas. While the first and second quarter revenues are typically lower than the third and fourth quarter, this diversity has allowed this segment to be less seasonal over the course of the year.
37
Our industry is also highly cyclical. Fluctuations in end-user demand within the industries we serve, or in the supply of services within those industries, can impact demand for our services. As a result, our business may be adversely affected by industry declines or by delays in new projects. Variations in project schedules or unanticipated changes in project schedules, in particular, in connection with large construction and installation projects, can create fluctuations in revenue, which may adversely affect us in a given period. In addition, revenue from master service agreements, while generally predictable, can be subject to volatility. The financial condition of our customers and their access to capital, variations in project margins, regional, national and global economic, political and market conditions, regulatory or environmental influences, and acquisitions, dispositions or strategic investments can also materially affect quarterly results. Accordingly, our operating results in any particular period may not be indicative of the results that can be expected for any other period.
Our results for the year ended December 31, 2019 and 2018, reflect the effect of multiple severe weather events on our Renewable business that began late in the third quarter of 2018 and were completed in the second quarter of 2019. These weather conditions had a significant impact on the construction of six wind projects across South Texas, Iowa, and Michigan, resulting in additional labor, equipment and material costs as well as change orders. See “Results of Operations” for further discussion of weather impact.
Critical Accounting Policies and Estimates
This management’s discussion and analysis of our financial condition and results of operations is based upon IEA’s consolidated financial statements included in Item 8, which have been prepared in accordance with GAAP. The preparation of these consolidated financial statements requires the use of estimates and assumptions that affect the amounts reported in our consolidated financial statements and the accompanying notes. We base our estimates on historical experience and on various other assumptions that we believe to be reasonable under the circumstances, the results of which form the basis of making judgments about the carrying values of assets and liabilities that are not readily apparent from other sources. Given that management estimates, by their nature, involve judgments regarding future uncertainties, actual results may differ from these estimates if conditions change or if certain key assumptions used in making these estimates ultimately prove to be inaccurate. For discussion of all of our significant accounting policies, see Note 1. Business, Basis of Presentation and Significant Accounting Policies to our consolidated financial statements.
We believe that the accounting policies described below are the most critical in the preparation of our consolidated financial statements as they are important to the portrayal of our financial condition and require significant or complex judgment and estimates on the part of management.
Revenue Recognition for Projects
The Company adopted the requirements of Accounting Standards Update (“ASU”) 2014-09, Revenue from Contracts with Customers, which is also referred to as Accounting Standards Codification (“ASC”) Topic 606, under the modified retrospective transition approach effective January 1, 2019, with application to all existing contracts that were not substantially completed as of January 1, 2019. The impacts of adoption on the Company’s opening balance sheet were primarily related to variable consideration on unapproved change orders. The prior year comparative information has not been restated and continues to be reported under the accounting standards in effect for those periods; however, certain balances have been reclassified to conform to the current year presentation. See further discussion in Note 1. Business, Basis of Presentation and Significant Accounting Policies in Item 8. Financial Statements.
Contracts
The Company derives revenue primarily from construction projects performed under contracts for specific projects requiring the construction and installation of an entire infrastructure system or specified units within an infrastructure system, which are subject to multiple pricing options, including fixed price, time and materials, or unit price. Renewable energy projects are performed for private customers while our specialty civil projects are performed for a mix of public and private customers.
Revenue from construction contracts is recognized over time using the cost-to-cost measure of progress. For these contracts, the cost-to-cost measure of progress best depicts the continuous transfer of control of goods or services to the customer. Such contracts provide that the customer accept completion of progress to date and compensate the Company for services rendered.
Contract costs include all direct materials, labor and subcontracted costs, as well as indirect costs related to contract performance, such as indirect labor, supplies, tools, repairs and the operational costs of capital equipment. The cost estimation and review process for recognizing revenue over time under the cost-to-cost method is based on the professional knowledge
38
and experience of the Company’s project managers, engineers and financial professionals. Management reviews estimates of total contract transaction price and total project costs on an ongoing basis. Changes in job performance, job conditions and management’s assessment of expected variable consideration are factors that influence estimates of the total contract transaction price, total costs to complete those contracts and profit recognition. Changes in these factors could result in revisions to revenue and costs of revenue in the period in which the revisions are determined on a prospective basis, which could materially affect the Company’s consolidated results of operations for that period. Provisions for losses on uncompleted contracts are recorded in the period in which such losses are determined.
Performance Obligations
A performance obligation is a promise in a contract to transfer a distinct good or service to the customer, and is the unit of account under Topic 606. The transaction price of a contract is allocated to each distinct performance obligation and recognized as revenue when or as the performance obligation is satisfied. The Company’s contracts often require significant integrated services, and even when delivering multiple distinct services, are generally accounted for as a single performance obligation. Contract amendments and change orders are generally not distinct from the existing contract due to the significant integrated service provided in the context of the contract, and are accounted for as a modification of the existing contract and performance obligation. The majority of the Company’s performance obligations are completed within one year with the exception of certain specialty civil service contracts.
Remaining performance obligations represent the amount of unearned transaction prices for fixed price contracts and open purchase orders for which work is wholly or partially unperformed. As of December 31, 2019, the amount of the Company’s remaining performance obligations was $1,315 million. The Company expects to recognize approximately $1,124 million of its remaining performance obligations as revenue in 2020, with the remainder recognized primarily in 2021.
Variable Consideration
Transaction pricing for the Company’s contracts may include variable consideration, which is comprised of items such as change orders, claims, incentives and liquidated damages. Management estimates variable consideration for a performance obligation utilizing estimation methods that best predict the amount of consideration to which the Company will be entitled. Variable consideration is included in the estimated transaction price to the extent it is probable that a significant reversal of cumulative revenue recognized will not occur when the uncertainty associated with the variable consideration is resolved. Management’s estimates of variable consideration and determination of whether to include estimated amounts in transaction price are based largely on engineering studies and legal opinions, past practices with the customer, specific discussions, correspondence or preliminary negotiations with the customer and all other relevant information that is reasonably available. The effect of variable consideration on the transaction price of a performance obligation is typically recognized as an adjustment to revenue on a cumulative catch-up basis. To the extent unapproved change orders, claims and liquidated damages reflected in transaction price are not resolved in the Company’s favor, or to the extent incentives reflected in transaction price are not earned, there could be reductions in, or reversals of, previously recognized revenue.
As of December 31, 2019 and 2018, the Company included approximately $73.3 million and $45.0 million, respectively, of unapproved change orders and/or claims in the transaction price for certain contracts that were in the process of being resolved in the normal course of business, including through negotiation, arbitration and other proceedings. These transaction price adjustments are included within Contract Assets or Contract Liabilities as appropriate. The Company actively engages with its customers to complete the final approval process, and generally expects these processes to be completed within one year. Amounts ultimately realized upon final acceptance by customers could be higher or lower than such estimated amounts.
Business Combinations
We account for our business combinations by recognizing and measuring in the financial statements the identifiable assets acquired, the liabilities assumed and any non-controlling interests (if applicable) in the acquiree at the acquisition date. The purchase is accounted for using the acquisition method, and the fair value of purchase consideration is allocated to the tangible and intangible assets acquired and the liabilities assumed based on their estimated fair values. The excess, if any, of the fair value of the purchase consideration over the fair value of the identifiable net assets is recorded as goodwill. Conversely, the excess, if any, of the net fair values of the identifiable net assets over the fair value of the purchase consideration is recorded as a gain. The fair values of net assets acquired are calculated using expected cash flows and industry-standard valuation techniques and these valuations require management to make significant estimates and assumptions. These estimates and assumptions are inherently uncertain and, as a result, actual results may materially differ from estimates. Significant estimates include, but are not limited to, future expected cash flows, useful lives and discount rates.
39
Due to the time required to gather and analyze the necessary data for each acquisition, U.S. GAAP provides a “measurement period” of up to one year in which to finalize these fair value determinations. During the measurement period, preliminary fair value estimates may be revised if new information is obtained about the facts and circumstances existing as of the date of acquisition, or based on the final net assets and working capital of the acquired business, as prescribed in the applicable purchase agreement. Such adjustments may result in the recognition, or adjust the fair values, of acquisition-related assets and liabilities and/or consideration paid, and are referred to as “measurement period” adjustments. For further discussion, see Note 2. Merger and Acquisitions included in Item 8.
Goodwill
We have goodwill that has been recorded in connection with our businesses. For the year ended December 31, 2019, management performed a qualitative assessment for its Renewable Segment goodwill by examining relevant events and circumstances that could have an affect on its fair value, such as macroeconomic conditions, industry and market conditions, entity-specific events, financial performance and other relevant factors or events that could affect earnings and cash flows. Based on evaluation of these qualitative assessments, it was determined that there was no goodwill impairment for these years.
In our Specialty Civil segment, we valued these reporting units using the income approach based on their expected future cash flows. The critical assumptions that factored into the valuations are the projected future revenues and operating EBITDA margins of the business, their terminal growth rates, as well as the discount rate used to present value the future cash flows. While none of our reporting units recorded a goodwill impairment in 2019, we determined that the CCS Reporting Unit is our only reporting unit where the estimated fair value does not substantially exceed the carrying value. The estimated fair value of the reporting unit exceeds its carrying amount by approximately 2.8 percent. Total goodwill in this reporting unit is $29.8 million. The goodwill in this reporting unit is primarily attributable to the acquisition of CCS at fair value late in fiscal 2018. As a result, we did not expect the estimated fair value would exceed the carrying value by a significant amount.
Impairment of Property, Plant and Equipment and Intangibles
We review long-lived assets that are held and used for impairment whenever events or changes in circumstances indicate that their carrying amounts may not be recoverable. If an evaluation is required, the estimated future undiscounted cash flows associated with the asset are compared with the asset’s carrying amount to determine if there has been an impairment, which is calculated as the difference between the fair value of an asset and its carrying value. Estimates of future undiscounted cash flows are based on expected growth rates for the business, anticipated future economic conditions and estimates of residual values. Fair values take into consideration management’s estimates of risk-adjusted discount rates, which are believed to be consistent with assumptions that market participants would use in their estimates of fair value. There were no impairments of property, plant and equipment or intangible assets recognized during the years ended December 31, 2019, 2018 and 2017.
“Emerging Growth Company” Status
As of December 31, 2019, the Company's total annual gross revenues exceed $1.07 billion and we are no longer an “emerging growth company,” as defined in the Jumpstart Our Business Startups Act (the “JOBS Act”). See Note 1. Business, Basis of Presentation and Significant Accounting Policies to our consolidated financial statements for more information.
40
Results of Operations
Comparison of Years Ended December 31, 2019 and 2018
The following table reflects our consolidated results of operations in dollar and percentage of revenue terms for the periods indicated:
Year Ended December 31, | 2019 vs. 2018 | ||||||||||||||||
(in thousands, except percentages) | 2019 | 2018 | $ Change | % Change | |||||||||||||
Revenue | $ | 1,459,763 | 100.0 | % | $ | 779,343 | 100.0 | % | 680,420 | 87.3 | |||||||
Cost of revenue | 1,302,746 | 89.2 | % | 747,817 | 96.0 | % | 554,929 | 74.2 | |||||||||
Gross profit | 157,017 | 10.8 | % | 31,526 | 4.0 | % | 125,491 | 398.1 | |||||||||
Selling, general and administrative expenses | 120,186 | 8.2 | % | 72,262 | 9.3 | % | 47,924 | 66.3 | |||||||||
Income (loss) from operations | 36,831 | 2.5 | % | (40,736 | ) | (5.2 | )% | 77,567 | (190.4 | ) | |||||||
Other income (expense), net: | |||||||||||||||||
Interest expense, net | (51,260 | ) | (3.5 | )% | (12,080 | ) | (1.6 | )% | (39,180 | ) | 324.3 | ||||||
Contingent consideration fair value adjustment | 23,082 | 1.6 | % | 46,291 | 5.9 | % | (23,209 | ) | 50.1 | ||||||||
Other expense | (4,043 | ) | (0.3 | )% | (2,173 | ) | (0.3 | )% | (1,870 | ) | 86.1 | ||||||
Income (loss) before benefit for income taxes | 4,610 | 0.3 | % | (8,698 | ) | (1.1 | )% | 13,308 | (153.0 | ) | |||||||
Benefit for income taxes | 1,621 | 0.1 | % | 12,942 | 1.7 | % | (11,321 | ) | (87.5 | ) | |||||||
Net income | $ | 6,231 | 0.4 | % | $ | 4,244 | 0.5 | % | 1,987 | 46.8 | |||||||
Revenue. Revenue increased by 87.3%, or $680.4 million, during the year ended December 31, 2019 as compared to the same period in 2018. The increase in revenue was primarily due to an increase in revenue from our acquired businesses of $456.6 million coupled with larger projects and volume in 2019, better performance on Renewable projects due to a non-occurrence of severe weather events in the third and fourth quarter of 2019 and the ability to begin work on several projects that we had slated for 2020 starts.
Cost of revenue. Cost of revenue increased by 74.2%, or $554.9 million, during the year ended December 31, 2019 as compared to the same period in 2018, primarily due to the cost of revenue increase of $402.7 million from our acquired businesses, coupled with approximately $150.0 million of increased costs of revenue in our Renewable operations. As discussed under "Impact of Seasonality and Cyclical Nature of Our Business," cost of revenue was negatively impacted by multiple severe weather events that began in the late 2018 and continued into the second quarter of 2019. The weather conditions had a significant impact on the construction of six wind projects across South Texas, Iowa and Michigan resulting in additional labor, equipment and material costs.
Gross profit. Gross profit increased by 398.1%, or $125.5 million, during the year ended December 31, 2019 as compared to the same period in 2018. As a percentage of revenue, gross profit increased 6.8% and totaled 10.8% for the year ended December 31, 2019 as compared to 4.0% in the prior-year period. While our gross profit percentages for Renewable and Specialty Civil was consistent in 2019, the Renewable gross profit percentage in 2018 was much lower due to extreme weather on six projects. The dollar increase was primarily due to gross profit from our acquired businesses of $53.9 million, coupled with the work stoppages related to extreme weather on six projects of $35.8 million in the prior year.
Selling, general and administrative expenses. Selling, general and administrative expenses increased by 66.3%, or $47.9 million, during the year ended December 31, 2019 as compared to the same period in 2018. Selling, general and administrative expenses were 8.2% of revenue for the year ended December 31, 2019, compared to 9.3% for the same period in 2018. The increase in selling, general and administrative expenses was primarily driven by an increase of $42.6 million related to our acquired businesses coupled with increases in acquisition integration costs, legal project settlement costs and stock compensation expense, offset by a reduction of merger and acquisition costs and diversification costs.
Interest expense, net. Interest expense, net increased by 324.3%, or $39.2 million, during the year ended December 31, 2019 as compared to the same period in 2018. This increase was driven by higher debt balances in 2019 compared to 2018, coupled with an increase in dividends related to Series B Preferred Stock of $10.4 million, which are recorded as interest expense.
41
Contingent consideration fair value adjustment. The merger agreement requires the Company to issue additional shares of our Common Stock to the Seller if certain financial targets for 2019 and 2018 were achieved. The Company determined at December 31, 2019 and 2018, that the financial targets were not achieved. Therefore, the Company recorded fair value adjustments at the end of 2019, to remove the remaining liability for the contingent consideration. See Note 8. Fair Value of Financial Instruments in Item 8 for further discussion related to inputs into the fair value adjustment.
Other income (expense). Other income decreased by 86.1%, or $1.9 million, during the year ended December 31, 2019 as compared to the same period in 2018, primarily related to the fair value adjustment on warrant related liabilities.
Provision for income taxes. Income tax expense decreased by 87.5%, or $11.3 million, during the year ended December 31, 2019, compared to the same period in 2018. The effective tax rates for the years ended December 31, 2019 and 2018 were (35.2)% and 148.8%, respectively. The lower effective tax rate in 2019 was primarily attributable to lower non-taxable gain from contingent consideration and the effects of non-deductible interest from Series B Preferred Stock. There were no changes in uncertain tax positions during the years ended December 31, 2019 and 2018.
Comparison of Years Ended December 31, 2018 and 2017
The following table reflects our consolidated results of operations in dollar and percentage of revenue terms for the periods indicated:
Year Ended December 31, | 2018 vs. 2017 | ||||||||||||||||
(in thousands, except percentages) | 2018 | 2017 | $ Change | % Change | |||||||||||||
Revenue | $ | 779,343 | 100.0 | % | $ | 454,949 | 100.0 | % | 324,394 | 71.3 | |||||||
Cost of revenue | 747,817 | 96.0 | % | 388,928 | 85.5 | % | 358,889 | 92.3 | |||||||||
Gross profit | 31,526 | 4.0 | % | 66,021 | 14.5 | % | (34,495 | ) | (52.2 | ) | |||||||
Selling, general and administrative expenses | 72,262 | 9.3 | % | 33,543 | 7.4 | % | 38,719 | 115.4 | |||||||||
(Loss) Income from operations | (40,736 | ) | (5.2 | )% | 32,478 | 7.1 | % | (73,214 | ) | (225.4 | ) | ||||||
Other (expense) income, net: | |||||||||||||||||
Interest expense, net | (12,080 | ) | (1.6 | )% | (2,201 | ) | (0.5 | )% | (9,879 | ) | 448.8 | ||||||
Contingent consideration fair value adjustment | 46,291 | 5.9 | % | — | — | % | 46,291 | — | % | ||||||||
Other (expense) income | (2,173 | ) | (0.3 | )% | 111 | — | % | (2,284 | ) | (2,057.7 | ) | ||||||
Income before benefit (provision) for income taxes | (8,698 | ) | (1.1 | )% | 30,388 | 6.7 | % | (39,086 | ) | (128.6 | ) | ||||||
Benefit (provision) for income taxes | 12,942 | 1.7 | % | (13,863 | ) | (3.0 | )% | 26,805 | (193.4 | ) | |||||||
Net income | $ | 4,244 | 0.5 | % | $ | 16,525 | 3.6 | % | (12,281 | ) | (74.3 | ) | |||||
Revenue. Revenue increased by 71.3%, or $324.4 million, during the year ended December 31, 2018 as compared to the same period in 2017. The increase in revenue is primarily due to the increased project volume, coupled with larger revenue projects in 2018. The Company generated approximately $156.3 million more in revenue related to our top ten projects under construction this year compared to the prior year and, to a lesser extent, the fourth quarter revenue of $125.6 million from our acquired businesses.
Cost of revenue. Cost of revenue increased by 92.3%, or $358.9 million, during the year ended December 31, 2018 as compared to the same period in 2017, primarily due to the larger volume of business in 2018, including cost of revenue of $115.4 million from our acquired businesses. As discussed under "Impact of Seasonality and Cyclical Nature of Our Business," cost of revenue for the year was negatively impacted by multiple severe weather events that began in the late third quarter and continued into the fourth quarter of 2018. The weather conditions had a significant impact on the construction of six wind projects across South Texas, Iowa and Michigan resulting in additional labor, equipment and material costs.
Gross profit. Gross profit decreased by 52.2%, or $34.5 million, during the year ended December 31, 2018 as compared to the same period in 2017. As a percentage of revenue, gross profit declined and totaled 4.0% for the year ended December 31, 2018 as compared to 14.5% in the prior-year period. The decrease in margin was primarily due to work stoppages related to extreme weather on six projects of $35.8 million coupled with a negative impact due to the previously disclosed customer dispute, both due to unbilled revenue and costs associated with the project, of approximately $8.5 million. To a lesser extent, the remaining decrease in margin also reflected early signs of labor and other cost inflation due to increasingly robust construction markets across the country.
42
Selling, general and administrative expenses. Selling, general and administrative expenses increased by 115.4%, or $38.7 million, during the year ended December 31, 2018 as compared to the same period in 2017. Selling, general and administrative expenses were 9.3% of revenue for the year ended December 31, 2018, compared to 7.4% for the same period in 2017. The increase in selling, general and administrative expenses was primarily driven by $14.2 million of acquisition-related expenses incurred for our 2018 acquisitions, $8.5 million of Merger-related transaction costs and $6.9 million of staffing related expenses due to higher project volume and, to a lesser extent, the fourth quarter selling, general and administrative expenses of $8.6 million from our acquired businesses.
Interest expense, net. Interest expense, net increased by 448.8%, or $9.9 million, during the year ended December 31, 2018 as compared to the same period in 2017. This increase was driven by the increased borrowings under our lines of credit to support the increased revenue base from our wind business and our new term loan to finance the acquisition of our acquired businesses.
Contingent consideration fair value adjustment. In the fourth quarter of 2018, the Company recognized a $46.3 million adjustment to the fair value of its contingent consideration incurred in connection with the Merger. The merger agreement requires the Company to issue additional shares of our Common Stock to the Seller if certain financial targets for 2018 and 2019 are achieved. The fair value calculation derived an adjustment to the liability based on 2018 actual financial results and the expected probability of reaching the full amount of contingent consideration in 2019. See Note 8. Fair Value of Financial Instruments in Item 8 for further discussion related to inputs into the fair value adjustment.
Other income (expense). Other income decreased by 2,057.7%, or $2.3 million, to an expense of $2.2 million during the year ended December 31, 2018 as compared to the same period in 2017. The decrease in other income compared to the prior year period was primarily the result of a $1.8 million loss on the extinguishment of debt recognized in 2018.
Provision for income taxes. Income tax expense decreased by 193.4%, or $26.8 million, to a benefit of $12.9 million for the year ended December 31, 2018, compared to an expense of $13.9 million for the same period in 2017. The effective tax rates for the years ended December 31, 2018 and 2017 were 148.8% and 45.6%, respectively. The higher effective tax rate is primarily attributable to the permanent item pertaining to contingent consideration and state taxes, partially offset by tax law changes which reduced the federal statutory rate. The difference between the Company’s effective tax rate and the federal statutory rate primarily results from permanent adjustments and current state taxes. There were no changes in uncertain tax positions during the years ended December 31, 2018 and 2017.
Segment Results
The Company operated as one reportable segment for 2018 and evaluated the business as a renewable construction company. In late 2018, the Company completed two significant acquisitions that construct projects outside of the renewable market. In 2019, we operated our business as two reportable segments: the Renewables segment and the Specialty Civil segment. The 2018 segment presentation has been recast to be consistent to the 2019 segmentation.
Each of our reportable segments is comprised of similar business units that specialize in services unique to the respective markets that each segment serves. The classification of revenue and gross profit for segment reporting purposes can at times require judgment on the part of management. Our segments may perform services across industries or perform joint services for customers in multiple industries. To determine reportable segment gross profit, certain allocations, including allocations of shared and indirect costs, such as facility costs, equipment costs and indirect operating expenses, were made based on segment revenue.
Separate measures of the Company’s assets, including capital expenditures and cash flows by reportable segment are not produced or utilized by management to evaluate segment performance. A substantial portion of the Company’s fixed assets are owned by and accounted for in our equipment department, including operating machinery, equipment and vehicles, as well as office equipment, buildings and leasehold improvements, and are used on an interchangeable basis across our reportable segments. As such, for reporting purposes, total under/over absorption of equipment expenses consisting primarily of depreciation is allocated to the Company's two reportable segments based on segment revenue.
The following is a brief description of the Company's reportable segments:
Renewables Segment
The Renewables segment operates throughout the United States and specializes in a range of services that include full EPC project delivery, design, site development, construction, installation and restoration of infrastructure services for the wind and solar industries.
43
Specialty Civil Segment
The Specialty Civil segment operates throughout the United States and specializes in a range of services that include:
• | Heavy civil construction services such as high-altitude road and bridge construction, specialty paving, industrial maintenance and other local, state and government projects. |
• | Environmental remediation services such as site development, environmental site closure and outsourced contract mining and coal ash management services. |
• | Rail Infrastructure services such as planning, creation and maintenance of infrastructure projects for major railway and intermodal facilities construction. |
Segment Revenue
Revenue by segment was as follows:
For the years ended December 31, | ||||||||||
(in thousands) | 2019 | 2018 | ||||||||
Segment | Revenue | % of Total Revenue | Revenue | % of Total Revenue | ||||||
Renewables | $ | 834,029 | 57.1 | % | $ | 621,628 | 79.8 | % | ||
Specialty Civil | 625,734 | 42.9 | % | 157,715 | 20.2 | % | ||||
Total revenue | $ | 1,459,763 | 100.0 | % | $ | 779,343 | 100.0 | % | ||
Segment Gross Profit
Gross profit by segment was as follows:
For the years ended December 31, | ||||||||||
(in thousands) | 2019 | 2018 | ||||||||
Segment | Gross Profit | Gross Profit Margin | Gross Profit | Gross Profit Margin | ||||||
Renewables | $ | 88,309 | 10.6 | % | $ | 16,030 | 2.6 | % | ||
Specialty Civil | 68,708 | 11.0 | % | 15,496 | 9.8 | % | ||||
Total gross profit | $ | 157,017 | 10.8 | % | $ | 31,526 | 4.0 | % | ||
Liquidity and Capital Resources
Historically, our primary sources of liquidity have been cash flows from operations, our cash balances and availability under our A&R Credit Agreement (as defined herein). During 2019, we experienced decreased liquidity arising from, among other things, acquisition integration costs and delayed collections for costs relating to the multiple severe weather events in the third quarter and fourth quarter of 2018.
As a result, during the year ended December 31, 2019, we issued and sold: (1) 50,000 shares of Series B-1 Preferred Stock (“Series B-1 Preferred Stock”) and warrants for 2,545,934 shares of common stock on May 20, 2019 for an aggregate purchase price of $50.0 million, before expenses; (2) 50,000 shares of Series B-2 Preferred Stock (the “Series B-2 Preferred Stock”) and warrants for 900,000 shares of common stock on August 30, 2019 for an aggregate purchase price of $50.0 million, before expenses; and (3) 80,000 shares of Series B-3 Preferred Stock (the “Series B-3 Preferred Stock” and, together with the Series B-1 Preferred Stock and Series B-2 Preferred Stock, the “Series B Preferred Stock”) and warrants for 3,568,750 shares of common stock on November 14, 2019 for an aggregate purchase price of $80.0 million, before expenses.
44
Additionally, on November 14, 2019, we exchanged 17,482.5 shares of Series A Preferred Stock (half of the issued and outstanding Series A Preferred Stock) for 19,123.87 shares of Series B-3 Preferred Stock and warrants for 657,383 shares of common stock. See Note 7. Fair Value of Financial Instruments included as Part of Item 8 for further discussion.
On March 4, 2020 we also completed a rights offering, and issued and sold 350 shares of Series B-3 Preferred Stock and 12,029 warrants to purchase common stock for aggregate proceeds of $0.4 million, before expense.
We believe these steps strengthened our balance sheet and provide us the financial flexibility we need to execute our future business plan, supporting our recent growth and a larger, more diversified platform. There can be no assurance, however, that these steps will provide the intended benefits. Please see “Part I, Item 1A. Risk Factors.”
We anticipate that our existing cash balances, funds generated from operations, and borrowings will be sufficient to meet our cash requirements for the next twelve months. As of December 31, 2019, we had approximately $147.3 million in cash and $29.0 million available under our credit facility. To the extent that cash from operations and borrowings under our revolving credit facility are not sufficient to meet our liquidity needs in the next twelve months, we expect to access other sources of liquidity through alternative sources such as issuance of debt and equity securities, expansions of our credit facility or other sources. There can be no assurance that any such sources will be available or if they are available that we can obtain capital from such sources on commercially reasonable terms.
Sources and Uses of Cash
Sources and uses of cash are summarized below for the periods indicated:
Year Ended December 31, | ||||||||||||
(in thousands) | 2019 | 2018 | 2017 | |||||||||
Net cash provided by (used in) operating activities | $ | 79,812 | $ | 47,018 | $ | (9,109 | ) | |||||
Net cash provided by (used in) investing activities | 610 | (169,834 | ) | (3,508 | ) | |||||||
Net cash (used in) provided by financing activities | (4,474 | ) | 189,250 | (4,113 | ) | |||||||
Operating Activities. Net cash provided by operating activities for the year ended December 31, 2019 was $79.8 million as compared to $47.0 million for the same period in 2018. The $32.8 million increase in operating cash flow for the year ended December 31, 2019 as compared to the same period in 2018 was attributable to the timing of receipts from customers and payments to vendors in the ordinary course of business. The increase is primarily attributable to $70.2 million more cash collected for accounts receivable and contract assets, offset by $17.0 million less cash paid for accounts payable and contract liabilities.
The $56.1 million increase in operating cash flow for the year ended December 31, 2018 as compared to the same period in 2017 was attributable to the timing of receipts from customers and payments to vendors in the ordinary course of business. The increase is primarily attributable to $122.6 million less cash paid for accounts payable and accrued liabilities, coupled with a $46.6 million increase from billings in excess of costs and estimated earnings on uncompleted contracts, partially offset by $45.3 million less cash collected from accounts receivable, a decrease in operating income (excluding non-cash items) of $61.5 million and additional cash paid for interest of $8.6 million.
Investing Activities. Net cash provided by investing activities for the year ended December 31, 2019 was $0.6 million as compared to net cash used by investing activities of $169.8 million for the same period in 2018. The primary decrease was mainly due to the $166.7 million spent in 2018 for two acquisitions.
The $166.3 million increase in net cash used by investing activities for the year ended December 31, 2018 as compared to the same period in 2017 was due to net cash paid for two acquisitions of $166.7 million.
Financing Activities. Net cash used by financing activities for the year ended December 31, 2019 was $4.5 million as compared to net cash provided in financing activities of $189.3 million for the same period in 2018. The $193.8 million decrease in cash for financing activities in 2019 compared to 2018 was primarily attributable to a reduction of proceeds from debt of $446.8, offset by proceeds received in 2019, from Series B Preferred Stock and sale-leaseback transactions of $204.3 coupled with lower payments and extinguishment of debt of $53.5 million.
45
The $193.4 million increase in cash in 2018 compared to 2017 was primarily attributable to an increase in net proceeds from debt of $189.6 million, coupled with reduced distributions of $34.7 million, which was partially offset by a $25.8 million use of cash in connection with the Merger and a $4.1 million increase in capital lease payments.
Capital Expenditures
For the year ended December 31, 2019, we incurred 22.9 million in finance lease payments and an additional $6.8 million in cash purchases. We estimate that we will spend approximately two percent of revenue for capital expenditures in 2020. Actual capital expenditures may increase or decrease in the future depending upon business activity levels, as well as ongoing assessments of equipment lease versus buy decisions based on short and long-term equipment requirements.
Working Capital
We require working capital to support seasonal variations in our business, primarily due to the effect of weather conditions on external construction and maintenance work and the spending patterns of our customers, both of which influence the timing of associated spending to support related customer demand. Our business is typically slower in the first quarter of each calendar year. Working capital needs are generally lower during the spring when projects are awarded and we receive down payments from customers. Conversely, working capital needs generally increase during the summer or fall months due to increased demand for our services when favorable weather conditions exist in many of the regions in which we operate. Again, working capital needs are typically lower and working capital is converted to cash during the winter months. These seasonal trends, however, can be offset by changes in the timing of projects, which can be affected by project delays or accelerations and/or other factors that may affect customer spending.
Generally, we receive 5% to 10% cash payments from our customers upon the inception of the projects. Timing of billing milestones and project close-outs can contribute to changes in unbilled revenue. As of December 31, 2019, substantially all of our costs and estimated earnings in excess of billings on uncompleted contracts will be billed to customers in the normal course of business. Net accounts receivable balances, which consist of contract assets including retainage, increased to $382.9 million as of December 31, 2019 from $272.5 million as of December 31, 2018, due primarily to higher levels of revenue, timing of project activity and collection of billings to customers.
Our billing terms are generally net 30 days, and some of our contracts allow our customers to retain a portion of the contract amount (generally, from 5% to 10%) until the job is completed. As part of our ongoing working capital management practices, we evaluate opportunities to improve our working capital cycle time through contractual provisions and certain financing arrangements. Our agreements with subcontractors often contain a ‘‘pay-if-paid’’ provision, whereby our payments to subcontractors are made only after we are paid by our customers.
Third A&R Credit Agreement
At closing of the CCS acquisition, IEA Services entered into a credit agreement for a new credit facility, which was amended and restated in connection with the closing of the William Charles acquisition, and was further amended and restated on November 16, 2018 (as amended and restated, the “A&R Credit Agreement”). The A&R Credit Agreement provided for a term loan facility of $300.0 million and a revolving line of credit of $50.0 million, which was available for revolving loans and letters of credit.
On May 20, 2019, the Third A&R Credit Agreement (the “Third A&R Credit Agreement”) became effective. The Third A&R Credit Agreement bifurcated the remaining principal amount of the initial term loan facility of $300.0 million (the “Initial Term Loan”) into two tranches: (i) the consenting lender term loan tranche (i.e., lenders that sign the Third A&R Credit Agreements) and (ii) the non-consenting lender term loan tranche (i.e., lenders that do not sign the Third A&R Credit Agreements). The Third A&R Credit Agreements leaves in place the revolving credit facility of $50.0 million (the “Initial Revolving Facility”), which provides for swing line loans of up to $20.0 million (“Swing Line Loans”) and standby and commercial letters of credit. Obligations under the Third A&R Credit Agreement are guaranteed by all of the present and future assets of the Company, Intermediate Holdings (as defined therein) and the Subsidiary Guarantors (as defined therein), subject to customary carve-outs.
Interest on the consenting lender term loan tranche accrues at a per annum rate of, at the Company's option, (x) LIBOR plus a margin of 8.25% or (y) an alternate base rate plus a margin of 7.25%; provided, however, that upon achieving a First Lien Net Leverage Ratio (as defined below) of no greater than 2.67:1.00, the margin shall permanently step down to (y) for LIBOR loans, 6.75% and (x) for alternative base rate loans, 5.75%. Interest on the non-consenting lender term loan tranche will stay at a per annum rate of, at the Company’s option, (x) LIBOR plus a margin of 6.25% or (y) an alternate base rate plus a
46
margin of 5.25%. Interest on Initial Revolving Facility borrowings and Swing Line Loans accrues at a rate of, at the Company's option, (x) LIBOR plus a margin of 4.25% or (y) the applicable base rate plus a margin of 3.25%. Default interest will accrue on the obligations at the otherwise applicable rate plus 3%.
The Initial Revolving Facility is required to be repaid and terminated on September 25, 2023. Borrowings under the Initial Revolving Facility will be able to be paid and reborrowed. The Initial Term Loan will mature on September 25, 2024. Borrowings under the Initial Term Loan are required to be repaid on the last business day of each March, June, September and December, continuing with the first fiscal quarter following the effective date of the Third A&R Credit Agreement, in an amount equal to 2.5% of the initial balance of the Initial Term Loan and will not be able to be reborrowed.
Beginning with 2020, an additional annual payment of a percentage of Excess Cash Flow (as defined in the Third A&R Credit Agreement) over the prior year is required on the Initial Term Loan depending upon the First Lien Net Leverage Ratio as of the last day of such year. The First Lien Net Leverage Ratio is defined as the ratio of: (A) the excess of (i) consolidated total debt that, as of such date, is secured by a lien on any asset of property of the Company or any restricted subsidiary that is not expressly subordinated to the lien securing the obligations under the Third A&R Credit Agreement, over (ii) certain net cash as of such date not to exceed $50,000,000, to (B) consolidated EBITDA, calculated on a pro forma basis for the most recently completed measurement period. The required payment percentage of Excess Cash Flow depending upon the First Lien Net Leverage Ratio will be as follows:
Required Payment Amount | Ratio |
100% of Excess Cash Flow | Greater than 5.00 : 1.00 |
75% of Excess Cash Flow | Less than or equal to 5.00 : 1.00 but greater than 1.76 : 1.00 |
50% of Excess Cash Flow | Less than or equal to 1.76 : 1.00 but greater than 1.26 : 1.00 |
25% of Excess Cash Flow | Less than or equal to 1.26 : 1.00 but greater than 0.76 : 1.00 |
0% of Excess Cash Flow | Less than or equal to 0.76 : 1.00 |
Under the Third A&R Credit Agreement, the Company will be required to not permit the First Lien Net Leverage Ratio, as of the last day of any consecutive four fiscal quarter period to be greater than:
Measurement Period | Ratio |
From and after fiscal quarter ending March 31, 2019 through December 31, 2019 | 4.75 : 1.00 |
From and after fiscal quarter ending March 31, 2020 through December 31, 2020 | 3.50 : 1.00 |
From and after fiscal quarter ending March 31, 2021 through December 31, 2021 | 2.75 : 1.00 |
From and after the fiscal quarter ending March 31, 2022 | 2.25 : 1.00 |
Under the Third A&R Credit Agreement, the Company was not able to utilize an equity infusion to cure a covenant violation in any quarter ending in 2019, excluding the Series B Preferred Stock. Thereafter, the Company will have access to a customary equity cure.
In addition, the Company and Borrower are subject to affirmative covenants, including, but not limited to, requiring (i) delivery of financial statements, budgets and forecasts; (ii) delivery of certificates and other information; (iii) delivery of notices (of any default, force majeure event, material adverse condition, ERISA event, material litigation or material environmental event); (iv) payment of tax obligations; (v) preservation of existence; (vi) maintenance of properties; (vii) maintenance of insurance; (viii) compliance with laws; (ix) maintenance of books and records; (x) inspection rights; (xi) use of proceeds; (xii) covenants to guarantee obligations and give security; (xiii) compliance with environmental laws; and (xiv) ongoing communication with the Lenders (as defined therein).
The Company and Borrower are also subject to additional negative covenants, some of which will include less flexibility than the corresponding negative covenants in the A&R Credit Agreement, including, but not limited to, restrictions (subject to certain exceptions) on (i) liens; (ii) indebtedness (including guarantees and other contingent obligations); (iii) investments (including loans, advances and acquisitions); (iv) mergers and other fundamental changes; (v) sales and other dispositions of property or assets; (vi) payments of dividends and other distributions and share repurchases; (vii) changes in the nature of the business; (viii) transactions with affiliates; (ix) burdensome agreements; (x) payments and modifications of certain debt instruments; (xi) changes in fiscal periods; (xii) amendments of organizational documents; (xiii) division/series transactions; and (xiv) sale and lease-back transactions.
47
Events of default under the Third A&R Credit Agreement include, but are not limited to, (i) failure to pay any principal or interest when due; (ii) any material breach of the representations and warranties made in the Third A&R Credit Agreement; (iii) failure to obverse or perform covenants; and (iv) certain events of bankruptcy and judgements. Upon any event of default, the Lenders will be permitted to cease making loans, declare the unpaid principal amount of all outstanding loans and all other obligations immediately due and payable, enforce liens and security interests, and exercise all other rights and remedies available under the loan documents or applicable law.
Series A Preferred Stock
As of December 31, 2019, we had 17,482 shares of Series A Preferred Stock outstanding, with each share having an initial stated value of $1,000 plus accumulated but unpaid dividends. Dividends are paid on the Series A Preferred Stock as, if and when declared by our Board. To the maximum extent permitted by the terms of the Series B Preferred Stock and the Third A&R Credit Agreement, dividends are required to be declared and paid in cash quarterly in arrears on each March 31, June 30, September 30 and December 31 on the stated value at the following rates:
•6% per annum from the original issuance of the Series A Preferred Stock on March 26, 2018 (the “Closing Date”) until the date (the “18 Month Anniversary Date”) that is 18 months from the Closing Date; and
•10% per annum during the period from and after the 18 Month Anniversary Date;
So long as any shares of Series B Preferred Stock are outstanding or from and after the occurrence of any non-payment event or default event and until cured or waived, the foregoing rates will increase by 2% per annum.
If not paid in cash, dividends will accrue on the stated value and will increase the stated value on and effective as of the applicable dividend date without any further action by the Board at the following rates:
•8% per annum during the period from May 20, 2019 through the 18 Month Anniversary Date; and
•12% per annum during the period from and after the 18 Month Anniversary Date.
From and after the occurrence of any non-payment event or default event and until cured or waived, the foregoing will increase by two percent (2%) per annum.
The Series A Preferred Stock do not have a scheduled redemption date or maturity date. Subject to the terms of the Series B Preferred Stock, we may, at any time and from time to time, redeem all or any portion of the shares of Series A Preferred Stock then outstanding. As a condition to the consummation of any change of control (as described in the certificate governing the Series A Preferred Stock), we are required to redeem all shares of Series A Preferred Stock then outstanding. We are also required to use the net cash proceeds from certain transactions to redeem the maximum number of shares of Series A Preferred Stock that can be redeemed with such net cash proceeds, except as prohibited by the Third A&R Credit Agreement.
During the year ended December 31, 2019, dividends on the Series A Preferred Stock were treated as follows:
•On March 31, 2019, dividends with respect to the dividend period of January 1, 2019 through March 31, 2019 accrued at a rate of 8% and increased the stated value.
•On June 30, 2019, dividends with respect to the dividend period of April 1, 2019 through June 30, 2019 accrued at a rate of 8% and increased the stated value.
•On September 30, 2019, dividends with respect to the dividend period of July 1, 2019 through September 30, 2019 accrued at a rate of (i) 8%, for the period of July 1, 2019 through September 26, 2019, and (ii) 12%, for the period of September 27, 2019 through September 30, 2019, and increased the stated value.
•On December 31, 2019, dividends with respect to the dividend period of October 1, 2019 through December 31, 2019 accrued at a rate of 12% and increased the stated value.
Based on the stated value of the Series A Preferred Stock as of December 31, 2019 after giving effect to the accrual of dividends, we would be required to pay quarterly cash dividends in the aggregate of $1.9 million on the Series A Preferred Stock. If our business does not generate enough cash to pay future cash dividends, the dividends will accrue at a rate of 12% per annum and increase the stated value of the Series A Preferred Stock, which will make cash dividends on the Series A Preferred Stock more difficult for us to make in the future. We do not presently expect to pay cash dividends, although an actual decision regarding
48
payment of cash dividends on the Series A Preferred Stock will be made at the time of the applicable dividend payment based upon availability of capital resources, business conditions, other cash requirements, and other relevant factors.
Series B Preferred Stock
As of December 31, 2019, we had 199,124 shares of Series B Preferred Stock outstanding, with each share having an initial stated value of $1,000 plus accumulated but unpaid dividends. Our Common Stock and Series A Preferred Stock are junior to the Series B Preferred Stock. Dividends are paid on the Series B Preferred Stock when declared by our Board. To the extent not prohibited by applicable law, dividends are required to be declared and paid in cash quarterly in arrears on each March 31, June 30, September 30 and December 31 at the following rates:
• | On Series B Preferred Stock with respect to any dividend period for which the Total Net Leverage Ratio is greater than 1.50 to 1.00, 15% per annum (or 13.5% per annum if a deleveraging event has occurred prior to the date dividends are paid with respect to such dividend period) and (ii) with respect to any dividend period for which the Total Net Leverage Ratio is less than or equal to 1.50 to 1.00, 12% per annum. |
If not paid in cash, dividends will accrue on the stated value and will increase the stated value on and effective of the applicable dividend date without any further action by the Board at a rate of 15% per annum; provided, further, that, from and after the occurrence of any non-payment event or default event and until cured or waived, the foregoing rates will increase by two percent (2%) per annum.
Until the Series B Preferred Stock is redeemed, neither we nor any of our subsidiaries can declare, pay or set aside any dividends on shares of any other class or series of capital stock, except in limited circumstances. We are required to redeem all shares of Series B Preferred Stock outstanding on February 15, 2025 at the then stated value plus all accumulated and unpaid dividends thereon through the day prior to such redemption. Subject to compliance with the terms of any credit agreement, we are also required to redeem all of the Series B Preferred Stock as a condition to the consummation of certain changes in control (as defined in certificate governing the Series B Preferred Stock), as well as use the net cash proceeds from certain transactions to redeem shares of Series B Preferred Stock.
During the year ended December 31, 2019, dividends on the Series B Preferred Stock were treated as follows:
•On June 30, 2019, dividends with respect to the dividend period of April 1, 2019 through June 30, 2019 accrued at a rate of 18% and increased the stated value.
•On September 30, 2019, dividends with respect to the dividend period of July 1, 2019 through September 30, 2019 accrued at a rate of 18% and increased the stated value.
•On December 31, 2019, dividends with respect to the dividend period of October 1, 2019 through December 31, 2019 accrued at a rate of 15% and increased the stated value.
Based on the stated value of the Series B Preferred Stock as of December 31, 2019 after giving effect to the accrual of dividends, we would be required to pay quarterly cash dividends in the aggregate of $10.4 million on the Series B Preferred Stock. If our business does not generate enough cash to pay future cash dividends, the dividends will accrue at a rate of 15% per annum and increase the stated value of the Series A Preferred Stock, which will make cash dividends on the Series B Preferred Stock more difficult for us to make in the future. We do not presently expect to pay cash dividends, although an actual decision regarding payment of cash dividends on the Series B Preferred Stock will be made at the time of the applicable dividend payment based upon availability of capital resources, business conditions, other cash requirements, and other relevant factors.
Letters of Credit and Surety Bonds
In the ordinary course of business, we are required to post letters of credit and surety bonds to customers in support of performance under certain contracts. Such letters of credit are generally issued by a bank or similar financial institution. The letter of credit or surety bond commits the issuer to pay specified amounts to the holder of the letter of credit or surety bond under certain conditions. If the letter of credit or surety bond issuer were required to pay any amount to a holder, we would be required to reimburse the issuer, which, depending upon the circumstances, could result in a charge to earnings. As of December 31, 2019 and 2018, we were contingently liable under letters of credit issued under our respective revolving lines of credit in the amount of $21.0 million and $3.0 million, respectively, related to projects. In addition, as of December 31, 2019 and 2018, we had outstanding surety bonds on projects of $2.4 billion and $1.7 billion, respectively, which includes the
49
bonding lines of the acquired companies as of December 31, 2018. We anticipate that our current bonding capacity will be sufficient for the next twelve months based on current backlog and available capacity.
Contractual Obligations
The following table sets forth our contractual obligations and commitments for the periods indicated as of December 31, 2019:
Payments due by period | ||||||||||||||||||||
(in thousands) | Total | Less than 1 year | 1 to 3 years | 3 to 5 years | More than 5 years | |||||||||||||||
Debt (principal)(1) | $ | 187,143 | $ | 1,946 | $ | 1,994 | $ | 183,203 | $ | — | ||||||||||
Debt (interest)(2) | 89,432 | 19,031 | 37,993 | 32,408 | — | |||||||||||||||
Finance leases(3) | 69,387 | 25,966 | 39,935 | 3,486 | — | |||||||||||||||
Operating leases(4) | 59,950 | 12,308 | 18,502 | 8,679 | 20,461 | |||||||||||||||
Total | $ | 405,912 | $ | 59,251 | $ | 98,424 | $ | 227,776 | $ | 20,461 | ||||||||||
———
(1) | Represents the contractual principal payment due dates on our outstanding debt. |
(2) | Includes variable rate interest using December 31, 2019 rates. |
(3) | We have obligations, exclusive of associated interest, recognized under various finance leases for equipment totaling $69.4 million at December 31, 2019. Net amounts recognized within property, plant and equipment, net in the consolidated balance sheet under these capitalized lease agreements at December 31, 2019 totaled $82.1 million. |
(4) | We lease real estate, vehicles, office equipment and certain construction equipment from unrelated parties under non-cancelable leases. Lease terms range from month-to-month to terms expiring through 2038. |
Off-Balance Sheet Arrangements
As is common in our industry, we have entered into certain off-balance sheet arrangements in the ordinary course of business. Our significant off-balance sheet transactions include liabilities associated with letter of credit obligations, surety and performance and payment bonds entered into in the normal course of business, liabilities associated with deferred compensation plans and liabilities associated with certain indemnification and guarantee arrangements. See Note 8. Debt and Note 9. Commitments and Contingencies to our consolidated financial statements for further discussion pertaining to certain of our off-balance sheet arrangements.
Recently Issued Accounting Pronouncements
See Note 1. Business, Basis of Presentation and Significant Accounting Policies to our consolidated financial statements included in this Annual Report on 10-K for disclosures concerning recently issued accounting standards. These disclosures are incorporated herein by reference.
Backlog
Backlog is discussed in Item 1. Business of this Annual Report on Form 10-K, which is incorporated herein by reference.
50
Quarterly Financial Information (Unaudited)
Summarized quarterly results of operations for the year ended December 31, 2019 were as follows:
($ in thousands, except per share data) | First Quarter | Second Quarter | Third Quarter | Fourth Quarter | |||||||||||
Revenue (1) | $ | 189,781 | $ | 327,961 | $ | 422,022 | $ | 519,999 | |||||||
Gross profit | 5,744 | 31,422 | 52,870 | 66,981 | |||||||||||
(Loss) income from operations | (22,010 | ) | 5,544 | 21,557 | 31,740 | ||||||||||
Net (loss) income | (23,639 | ) | 6,208 | 12,609 | 11,053 | ||||||||||
Net (loss) income per common share - basic | $ | (1.09 | ) | $ | (0.61 | ) | $ | 0.37 | $ | 0.51 | |||||
Net (loss) income per common share - diluted | $ | (1.09 | ) | $ | (0.61 | ) | $ | 0.24 | $ | 0.31 | |||||
Weighted average common shares outstanding - basic | 22,188,757 | 22,252,489 | 20,446,811 | 20,446,811 | |||||||||||
Weighted average common shares outstanding - diluted | 22,188,757 | 22,252,489 | 35,419,432 | 35,711,512 | |||||||||||
(1) The first quarter ended March 31, 2019, reported revenue was adjusted by $1.0 million for the adoption of ASC 606.
Summarized quarterly results of operations for the year ended December 31, 2018 were as follows:
($ in thousands, except per share data) | First Quarter | Second Quarter | Third Quarter | Fourth Quarter | |||||||||||
Revenue | $ | 50,135 | $ | 174,073 | $ | 279,279 | $ | 275,856 | |||||||
Gross profit | (3,085 | ) | 16,799 | 27,008 | (9,196 | ) | |||||||||
Income from operations | (20,045 | ) | 7,601 | 10,044 | (38,336 | ) | |||||||||
Net income | (17,392 | ) | 4,915 | 5,736 | 10,985 | ||||||||||
Net income per common share - basic | $ | (0.81 | ) | $ | 0.20 | $ | 0.24 | $ | (1.63 | ) | |||||
Net income per common share - diluted | (0.81 | ) | 0.19 | 0.23 | (1.63 | ) | |||||||||
Weighted average common shares outstanding - basic | 21,577,650 | 21,577,650 | 21,577,650 | 21,928,029 | |||||||||||
Weighted average common shares outstanding - diluted | 21,577,650 | 25,392,159 | 25,100,088 | 21,928,029 | |||||||||||
Certain transactions affecting comparisons of the Company's quarterly results, which may not represent the amounts recognized for the full year for such transactions, include the following:
• | There were two acquisitions completed in the second half of 2018. This increased total revenue and gross profit for each quarter in 2019 and the third and fourth quarter of 2018. |
• | Certain projects incurred significant weather related costs in the fourth quarter of 2018, that increased costs required to complete those projects and decreased gross margin significantly. |
• | Net income used in calculation of earnings per share for 2019 and 2018, reflects $2.9 million and $1.6 million of preferred dividends and an adjustment of $23.1 million and $46.3 million for the contingent consideration fair value adjustment. See Note 10. Earnings (Loss) Per Share in the notes to the audited consolidated financial statements included in Item 8. |
• | Beginning in the third quarter of 2019, there is an adjustment for removal of 1.8 million unvested shares. The number of outstanding shares of Common Stock for voting purposes remains at 22.3 million shares, as the aforementioned 1.8 million shares are entitled to vote those shares during the vesting period. See Note 10. Earnings (Loss) Per Share in the notes to the audited consolidated financial statements included in Item 8. |
51
ITEM 7A. QUANTITATIVE AND QUALITATIVE DISCLOSURES ABOUT MARKET RISK
Credit Risk
We are subject to concentrations of credit risk related to our net receivable position with customers, which includes amounts related to billed and unbilled accounts receivable and costs and estimated earnings in excess of billings on uncompleted contracts net of advanced billings with the same customer. We grant credit under normal payment terms, generally without collateral, and as a result, we are subject to potential credit risk related to our customers’ ability to pay for services provided. This risk may be heightened if there is depressed economic and financial market conditions. However, we believe the concentration of credit risk related to billed and unbilled receivables and costs and estimated earnings in excess of billings on uncompleted contracts is limited because of the high creditworthiness and diversity of our customers.
Interest Rate Risk
Borrowings under our new credit facility are at variable rates of interest and expose us to interest rate risk. As of December 31, 2019, we had not entered into any derivative financial instruments to manage this interest rate risk. If interest rates increase, our debt service obligations on the variable rate indebtedness will increase even though the amount borrowed remains the same, and our net income and cash flows, including cash available for servicing our indebtedness, will correspondingly decrease. Our outstanding principal on debt as of December 31, 2019 was $187.1 million. A one hundred basis point change in the LIBOR rate would increase or decrease interest expense by $1.9 million.
52
ITEM 8. FINANCIAL STATEMENTS AND SUPPLEMENTARY DATA
Index to Consolidated Financial Statements | |
Page | |
53
REPORT OF INDEPENDENT REGISTERED PUBLIC ACCOUNTING FIRM
To the shareholders and the Board of Directors of Infrastructure and Energy Alternatives, Inc.
Opinions on the Financial Statements and Internal Control over Financial Reporting
We have audited the accompanying consolidated balance sheets of Infrastructure and Energy Alternatives, Inc. (the "Company") as of December 31, 2019 and 2018, the related consolidated statements of operations, stockholders’ equity (deficit), and cash flows, for the years then ended, and the related notes (collectively referred to as the "financial statements"). We also have audited the Company’s internal control over financial reporting as of December 31, 2019, based on criteria established in Internal Control - Integrated Framework (2013) issued by the Committee of Sponsoring Organizations of the Treadway Commission (COSO).
In our opinion, the financial statements referred to above present fairly, in all material respects, the financial position of the Company as of December 31, 2019 and 2018, and the results of its operations and its cash flows for the years then ended, in conformity with accounting principles generally accepted in the United States of America. Also, in our opinion, the Company maintained, in all material respects, effective internal control over financial reporting as of December 31, 2019, based on criteria established in Internal Control - Integrated Framework (2013) issued by COSO.
Change in Accounting Principles
As discussed in Note 1 to the financial statements, the Company has changed its method of accounting for revenue recognition in fiscal year 2019, due to the adoption of Accounting Standards Update No. 2014-9, Revenue from Contracts with Customers (Topic 606) under the modified retrospective method. Additionally, the Company changed its method of accounting for leases in fiscal year 2019, due to the adoption of Accounting Standards Update No. 2016-02, Leases (Topic 842), under the modified retrospective method.
Basis for Opinions
The Company’s management is responsible for these financial statements, for maintaining effective internal control over financial reporting, and for its assessment of the effectiveness of internal control over financial reporting, included in the accompanying Management’s Annual Report on Internal Control Over Financial Reporting. Our responsibility is to express an opinion on these financial statements and an opinion on the Company’s internal control over financial reporting based on our audits. We are a public accounting firm registered with the Public Company Accounting Oversight Board (United States) (PCAOB) and are required to be independent with respect to the Company in accordance with the U.S. federal securities laws and the applicable rules and regulations of the Securities and Exchange Commission and the PCAOB.
We conducted our audits in accordance with the standards of the PCAOB. Those standards require that we plan and perform the audits to obtain reasonable assurance about whether the financial statements are free of material misstatement, whether due to error or fraud, and whether effective internal control over financial reporting was maintained in all material respects.
Our audits of the financial statements included performing procedures to assess the risks of material misstatement of the financial statements, whether due to error or fraud, and performing procedures to respond to those risks. Such procedures included examining, on a test basis, evidence regarding the amounts and disclosures in the financial statements. Our audits also included evaluating the accounting principles used and significant estimates made by management, as well as evaluating the overall presentation of the financial statements. Our audit of internal control over financial reporting included obtaining an understanding of internal control over financial reporting, assessing the risk that a material weakness exists, and testing and evaluating the design and operating effectiveness of internal control based on the assessed risk. Our audits also included performing such other procedures as we considered necessary in the circumstances. We believe that our audits provide a reasonable basis for our opinions.
54
Definition and Limitations of Internal Control over Financial Reporting
A company’s internal control over financial reporting is a process designed to provide reasonable assurance regarding the reliability of financial reporting and the preparation of financial statements for external purposes in accordance with generally accepted accounting principles. A company’s internal control over financial reporting includes those policies and procedures that (1) pertain to the maintenance of records that, in reasonable detail, accurately and fairly reflect the transactions and dispositions of the assets of the company; (2) provide reasonable assurance that transactions are recorded as necessary to permit preparation of financial statements in accordance with generally accepted accounting principles, and that receipts and expenditures of the company are being made only in accordance with authorizations of management and directors of the company; and (3) provide reasonable assurance regarding prevention or timely detection of unauthorized acquisition, use, or disposition of the company’s assets that could have a material effect on the financial statements.
Because of its inherent limitations, internal control over financial reporting may not prevent or detect misstatements. Also, projections of any evaluation of effectiveness to future periods are subject to the risk that controls may become inadequate because of changes in conditions, or that the degree of compliance with the policies or procedures may deteriorate.
/s/ Deloitte & Touche LLP
Indianapolis, Indiana
March 11, 2020
We have served as the Company's auditor since 2018.
55
Report of Independent Registered Public Accounting Firm
Shareholders and Board of Directors of Infrastructure and Energy Alternatives, Inc.
Indianapolis, Indiana
Opinion on the Financial Statements
We have audited the accompanying consolidated statements of operations, stockholders’ equity (deficit), and cash flows of Infrastructure and Energy Alternatives, Inc. (the "Company") for the year ended December 31, 2017, and the related notes (collectively referred to as the "financial statements"). In our opinion, the financial statements present fairly, in all material respects, the Company’s results of operations and cash flows for the year ended December 31, 2017, in conformity with accounting principles generally accepted in the United States of America.
Basis for Opinion
These financial statements are the responsibility of the Company's management. Our responsibility is to express an opinion on the Company's financial statements based on our audit. We are a public accounting firm registered with the Public Company Accounting Oversight Board (United States) ("PCAOB") and are required to be independent with respect to the Company in accordance with the U.S. federal securities laws and the applicable rules and regulations of the Securities and Exchange Commission and the PCAOB.
We conducted our audit in accordance with the standards of the PCAOB. Those standards require that we plan and perform the audit to obtain reasonable assurance about whether the financial statements are free of material misstatement, whether due to error or fraud. The Company is not required to have, nor were we engaged to perform, an audit of its internal control over financial reporting. As part of our audit we are required to obtain an understanding of internal control over financial reporting but not for the purpose of expressing an opinion on the effectiveness of the Company's internal control over financial reporting. Accordingly, we express no such opinion.
Our audit included performing procedures to assess the risks of material misstatement of the financial statements, whether due to error or fraud, and performing procedures that respond to those risks. Such procedures included examining, on a test basis, evidence regarding the amounts and disclosures in the financial statements. Our audit also included evaluating the accounting principles used and significant estimates made by management, as well as evaluating the overall presentation of the financial statements. We believe that our audit provides a reasonable basis for our opinion.
We served as the Company's auditor from 2016 to 2017.
/s/ Crowe LLP
Indianapolis, Indiana
February 19, 2018
56
INFRASTRUCTURE AND ENERGY ALTERNATIVES, INC.
Consolidated Balance Sheets
($ in thousands, except per share data)
December 31, | |||||||
2019 | 2018 | ||||||
Assets | |||||||
Current assets: | |||||||
Cash and cash equivalents | $ | 147,259 | $ | 71,311 | |||
Accounts receivable, net | 203,645 | 161,366 | |||||
Contract assets | 179,303 | 111,121 | |||||
Prepaid expenses and other current assets | 16,855 | 12,864 | |||||
Total current assets | 547,062 | 356,662 | |||||
Property, plant and equipment, net | 140,488 | 176,178 | |||||
Operating lease asset | 43,431 | — | |||||
Intangible assets, net | 37,272 | 50,874 | |||||
Goodwill | 37,373 | 40,257 | |||||
Company-owned life insurance | 4,752 | 3,854 | |||||
Deferred income taxes | 12,992 | 11,215 | |||||
Other assets | 1,551 | 188 | |||||
Total assets | $ | 824,921 | $ | 639,228 | |||
Liabilities, Preferred Stock and Stockholders' Deficit | |||||||
Current liabilities: | |||||||
Accounts payable | $ | 177,783 | $ | 158,075 | |||
Accrued liabilities | 158,103 | 94,059 | |||||
Contract liabilities | 115,634 | 62,234 | |||||
Current portion of finance lease obligations | 23,183 | 17,615 | |||||
Current portion of operating lease obligations | 9,628 | — | |||||
Current portion of long-term debt | 1,946 | 32,580 | |||||
Total current liabilities | 486,277 | 364,563 | |||||
Finance lease obligations, less current portion | 41,055 | 45,912 | |||||
Operating lease obligations, less current portion | 34,572 | — | |||||
Long-term debt, less current portion | 162,901 | 295,727 | |||||
Debt - Series B Preferred Stock | 166,141 | — | |||||
Series B Preferred Stock - warrant obligations | 17,591 | — | |||||
Deferred compensation | 8,004 | 6,157 | |||||
Contingent consideration | — | 23,082 | |||||
Total liabilities | 916,541 | 735,441 | |||||
Commitments and contingencies: | |||||||
Preferred stock, $0.0001 par value per share; 1,000,000 shares authorized; 17,483 and 34,965 shares issued and outstanding at December 31, 2019 and December 31, 2018, respectively | 17,483 | 34,965 | |||||
Stockholders' equity (deficit): | |||||||
Common stock, $0.0001 par value per share; 100,000,000 shares authorized; 20,460,533 and 22,155,271 shares issued and 20,446,811 and 22,155,271 outstanding at December 31, 2019 and December 31, 2018, respectively | 2 | 2 | |||||
Treasury stock, 13,722 shares at cost | (76 | ) | — | ||||
Additional paid-in capital | 17,167 | 4,751 | |||||
Accumulated deficit | (126,196 | ) | (135,931 | ) | |||
Total stockholders' deficit | (109,103 | ) | (131,178 | ) | |||
Total liabilities, preferred stock and stockholders' deficit | $ | 824,921 | $ | 639,228 | |||
See accompanying notes to consolidated financial statements.
57
INFRASTRUCTURE AND ENERGY ALTERNATIVES, INC.
Consolidated Statements of Operations
($ in thousands, except per share data)
Year Ended December 31, | |||||||||||
2019 | 2018 | 2017 | |||||||||
Revenue | $ | 1,459,763 | $ | 779,343 | $ | 454,949 | |||||
Cost of revenue | 1,302,746 | 747,817 | 388,928 | ||||||||
Gross profit | 157,017 | 31,526 | 66,021 | ||||||||
Selling, general and administrative expenses | 120,186 | 72,262 | 33,543 | ||||||||
Income (loss) from operations | 36,831 | (40,736 | ) | 32,478 | |||||||
Other income (expense), net: | |||||||||||
Interest expense, net | (51,260 | ) | (12,080 | ) | (2,201 | ) | |||||
Contingent consideration fair value adjustment | 23,082 | 46,291 | — | ||||||||
Other (expense) income | (4,043 | ) | (2,173 | ) | 111 | ||||||
Income (loss) before benefit (provision) for income taxes | 4,610 | (8,698 | ) | 30,388 | |||||||
Benefit (provision) for income taxes | 1,621 | 12,942 | (13,863 | ) | |||||||
Net income | $ | 6,231 | $ | 4,244 | $ | 16,525 | |||||
Net (loss) income per common share - basic and diluted | $ | (0.97 | ) | $ | (2.01 | ) | $ | 0.77 | |||
Weighted average common shares outstanding - basic and diluted | 20,431,096 | 21,665,965 | 21,577,650 | ||||||||
See accompanying notes to consolidated financial statements.
58
INFRASTRUCTURE AND ENERGY ALTERNATIVES, INC.
Consolidated Statements of Stockholders' Equity (Deficit)
(In thousands)
Common Stock | Additional Paid-in Capital | Accumulated Deficit | Treasury Stock | Accumulated Other Comprehensive Income | Total Equity (Deficit) | ||||||||||||||||||||||||
Shares | Par Value | Shares | Par Value | ||||||||||||||||||||||||||
Balance, January 1, 2017 | 21,578 | 2 | 36,009 | (23,136 | ) | — | — | — | 12,875 | ||||||||||||||||||||
Net income | — | — | — | 16,525 | — | — | — | 16,525 | |||||||||||||||||||||
Share-based compensation | — | — | 53 | — | — | — | — | 53 | |||||||||||||||||||||
Distributions | — | — | (31,328 | ) | (3,410 | ) | — | — | — | (34,738 | ) | ||||||||||||||||||
Distribution of land and building | — | — | (4,734 | ) | — | — | — | — | (4,734 | ) | |||||||||||||||||||
Balance, December 31, 2017 | 21,578 | 2 | — | (10,021 | ) | — | — | — | (10,019 | ) | |||||||||||||||||||
Net income | — | — | — | 4,244 | — | — | — | 4,244 | |||||||||||||||||||||
Share-based compensation | — | — | 1,072 | — | — | — | — | 1,072 | |||||||||||||||||||||
Issuance of common stock | 577 | — | 5,276 | — | — | — | — | 5,276 | |||||||||||||||||||||
Issuance of preferred stock | — | — | — | (34,965 | ) | — | — | — | (34,965 | ) | |||||||||||||||||||
Contingent consideration | — | — | — | (69,373 | ) | — | — | — | (69,373 | ) | |||||||||||||||||||
Merger recapitalization transaction | — | — | — | (25,816 | ) | — | — | — | (25,816 | ) | |||||||||||||||||||
Preferred dividends | — | — | (1,597 | ) | — | — | — | — | (1,597 | ) | |||||||||||||||||||
Balance, December 31, 2018 | 22,155 | $ | 2 | $ | 4,751 | $ | (135,931 | ) | — | $ | — | $ | — | $ | (131,178 | ) | |||||||||||||
Net income | — | — | — | $ | 6,231 | — | — | — | $ | 6,231 | |||||||||||||||||||
Removal of Earnout Shares (See Note 10) | (1,805 | ) | — | — | — | — | — | — | $ | — | |||||||||||||||||||
Share-based compensation | — | — | 4,016 | — | — | — | — | $ | 4,016 | ||||||||||||||||||||
Share-based payment transaction | 111 | — | 235 | — | (14 | ) | (76 | ) | — | $ | 159 | ||||||||||||||||||
Rights offering deemed dividend (See Note 7) | — | — | (1,383 | ) | — | — | — | $ | (1,383 | ) | |||||||||||||||||||
Series B Preferred Stock - Warrants at close | — | — | 12,423 | — | — | — | — | $ | 12,423 | ||||||||||||||||||||
Merger recapitalization transaction | — | — | — | 2,754 | — | — | — | $ | 2,754 | ||||||||||||||||||||
Cumulative effect from adoption of new accounting standard, net of tax | — | — | — | 750 | — | — | — | $ | 750 | ||||||||||||||||||||
Preferred dividends | — | — | (2,875 | ) | — | — | — | — | $ | (2,875 | ) | ||||||||||||||||||
Balance, December 31, 2019 | 20,461 | $ | 2 | $ | 17,167 | $ | (126,196 | ) | (14 | ) | $ | (76 | ) | $ | — | $ | (109,103 | ) | |||||||||||
See accompanying notes to consolidated financial statements.
59
INFRASTRUCTURE AND ENERGY ALTERNATIVES, INC.
Consolidated Statements of Cash Flows
($ in thousands)
Year Ended December 31, | |||||||||||
2019 | 2018 | 2017 | |||||||||
Cash flows from operating activities: | |||||||||||
Net income | $ | 6,231 | $ | 4,244 | $ | 16,525 | |||||
Adjustments to reconcile net income to net cash provided by (used in) operating activities: | |||||||||||
Depreciation and amortization | 48,220 | 16,699 | 5,044 | ||||||||
Contingent consideration fair value adjustment | (23,082 | ) | (46,291 | ) | — | ||||||
Warrant liability fair value adjustment | 2,262 | — | — | ||||||||
Amortization of debt discounts and issuance costs | 5,435 | 1,321 | — | ||||||||
Loss on extinguishment of debt | — | 1,836 | — | ||||||||
Share-based compensation expense | 4,016 | 1,072 | 53 | ||||||||
Deferred compensation | 1,847 | (482 | ) | 944 | |||||||
Allowance for doubtful accounts | 33 | (174 | ) | 81 | |||||||
Accrued dividends on Series B Preferred Stock | 10,389 | — | — | ||||||||
Deferred income taxes | (1,563 | ) | (12,017 | ) | 11,451 | ||||||
Other, net | 1,623 | 1,034 | (244 | ) | |||||||
Changes in operating assets and liabilities: | |||||||||||
Accounts receivable | (42,312 | ) | (36,430 | ) | 8,915 | ||||||
Contract assets | (67,222 | ) | (2,901 | ) | (4,470 | ) | |||||
Prepaid expenses and other assets | (4,222 | ) | (2,123 | ) | 587 | ||||||
Accounts payable and accrued liabilities | 84,689 | 95,398 | (27,212 | ) | |||||||
Contract liabilities | 53,468 | 25,832 | (20,783 | ) | |||||||
Net cash provided by (used in) operating activities | 79,812 | 47,018 | (9,109 | ) | |||||||
Cash flows from investing activities: | |||||||||||
Company-owned life insurance | (898 | ) | 396 | (2,036 | ) | ||||||
Purchases of property, plant and equipment | (6,764 | ) | (4,230 | ) | (2,248 | ) | |||||
Proceeds from sale of property, plant and equipment | 8,272 | 690 | 776 | ||||||||
Acquisition of businesses, net of cash acquired | — | (166,690 | ) | — | |||||||
Net cash provided by (used in) investing activities | 610 | (169,834 | ) | (3,508 | ) | ||||||
Cash flows from financing activities: | |||||||||||
Proceeds from long-term debt and line of credit - short-term | 50,400 | 497,272 | 33,674 | ||||||||
Payments on long-term debt | (217,034 | ) | (155,359 | ) | — | ||||||
Payments on line of credit - short-term | — | (38,447 | ) | — | |||||||
Extinguishment of debt | — | (53,549 | ) | — | |||||||
Debt financing fees | (22,246 | ) | (26,641 | ) | — | ||||||
Payments on capital lease obligations | (22,850 | ) | (7,138 | ) | (3,049 | ) | |||||
Sale-leaseback transaction | 24,343 | — | — | ||||||||
Distributions | — | — | (34,738 | ) | |||||||
Preferred dividends | — | (1,072 | ) | — | |||||||
Proceeds from issuance of stock - Series B Preferred Stock | 180,000 | — | — | ||||||||
Proceeds from stock-based awards, net | 159 | — | — | ||||||||
Merger recapitalization transaction | 2,754 | (25,816 | ) | — | |||||||
Net cash (used in) provided by financing activities | (4,474 | ) | 189,250 | (4,113 | ) | ||||||
Net change in cash and cash equivalents | 75,948 | 66,434 | (16,730 | ) | |||||||
Cash and cash equivalents, beginning of the period | 71,311 | 4,877 | 21,607 | ||||||||
Cash and cash equivalents, end of the period | $ | 147,259 | $ | 71,311 | $ | 4,877 | |||||
See accompanying notes to consolidated financial statements.
60
INFRASTRUCTURE AND ENERGY ALTERNATIVES, INC.
Consolidated Statements of Cash Flows
($ in thousands)
(Continued)
Year Ended December 31, | |||||||||||
2019 | 2018 | 2017 | |||||||||
Supplemental disclosures: | |||||||||||
Cash paid for interest | $ | 35,950 | $ | 10,817 | $ | 2,221 | |||||
Cash paid (refund) for income taxes | (173 | ) | (962 | ) | 3,686 | ||||||
Schedule of non-cash activities: | |||||||||||
Acquisition of assets/liabilities through finance lease | $ | 2,018 | $ | 48,951 | $ | 18,309 | |||||
Acquisition of assets/liabilities through operating lease | 28,498 | — | — | ||||||||
Acquisition of equipment through note payable | 1,937 | — | — | ||||||||
Series A Preferred Stock exchange for Series B Preferred Stock | 19,124 | — | — | ||||||||
Merger-related contingent consideration | — | 69,373 | — | ||||||||
Issuance of common stock | — | 95,558 | — | ||||||||
Issuance of preferred stock | — | 34,965 | — | ||||||||
Preferred dividends declared | 2,875 | 525 | — | ||||||||
Distribution of land and building | — | — | 4,734 | ||||||||
See accompanying notes to consolidated financial statements.
61
INFRASTRUCTURE AND ENERGY ALTERNATIVES, INC.
Notes to Consolidated Financial Statements
Note 1. Business, Basis of Presentation and Significant Accounting Policies
Infrastructure and Energy Alternatives, Inc. (f/k/a M III Acquisition Corporation (“M III”)), a Delaware corporation, is a holding company organized on August 4, 2015 (together with its wholly-owned subsidiaries, “IEA” or the “Company”).
The Company specializes in providing complete engineering, procurement and construction (“EPC”) services throughout the United States (“U.S.”) for the renewable energy, traditional power and civil infrastructure industries. These services include the design, site development, construction, installation and restoration of infrastructure. Although the Company has historically focused on the wind industry, its 2018 acquisitions expanded its construction capabilities and geographic footprint in the areas of renewables, environmental remediation, industrial maintenance, specialty paving, heavy civil and rail infrastructure construction, creating a diverse national platform of specialty construction capabilities.
Acquisitions
On March 26, 2018 (the “Closing Date”), the Company consummated a merger (the “Merger”) pursuant to an Agreement and Plan of Merger, dated November 3, 2017 (as amended, the “Merger Agreement”), by and among M III, IEA Energy Services, LLC (“IEA Services”), a Delaware limited liability company, Infrastructure and Energy Alternatives, LLC (the “Seller”), a Delaware limited liability company and the parent of IEA Services immediately prior to such time, and the other parties thereto, which provided for, among other things, the merger of IEA Services with and into a wholly-owned subsidiary of M III. Following the Merger, M III Acquisition Corporation changed its name to Infrastructure and Energy Alternatives, Inc. See Note 2. Merger and Acquisitions for more information about the Merger.
On September 25, 2018, IEA Services completed its acquisition of Consolidated Construction Solutions I LLC (“CCS”), provide EPC services, through its wholly-owned subsidiaries, Saiia LLC (“Saiia”) and American Civil Constructors LLC (the “ACC Companies”) for environmental, heavy civil and mining projects. On November 2, 2018, IEA Services completed its acquisition of William Charles Construction Group, including its wholly-owned subsidiary Ragnar Benson (“William Charles”), a provider of engineering and construction solutions for the rail infrastructure and heavy civil construction industries. See Note 2. Merger and Acquisitions for further discussion of these acquisitions.
Principles of Consolidation
The accompanying consolidated financial statements include the accounts of Infrastructure and Energy Alternatives, Inc. and its wholly-owned direct and indirect domestic and foreign subsidiaries: IEA Intermediate Holdco, LLC (“Holdings”), IEA Services, IEA Management Services, Inc., IEA Constructors, LLC (f/k/a IEA Renewable, Inc.), White Construction, LLC (“White”), Bianci Electrical, LLC (f/k/a White Electrical Constructors, Inc.), IEA Equipment Management, Inc., White’s wholly-owned subsidiary H.B. White Canada Corp. (“H.B. White”), and from their dates of acquisition in 2018, CCS and William Charles. All intercompany accounts and transactions are eliminated in consolidation.
Reportable Segments
We segregate our business into two reportable segment: the Renewables (“Renewables”) segment and the Heavy Civil and Industrial (“Specialty Civil”) segment. See Note 14. Segments for a description of the reportable segments and their operations. Operations prior to the Merger are the historical operations of IEA Services as discussed in Note 2. Merger and Acquisitions.
Basis of Accounting and Use of Estimates
The accompanying consolidated financial statements have been prepared in accordance with generally accepted accounting principles in the U.S. (“GAAP”). The preparation of the consolidated financial statements in conformity with GAAP requires the use of estimates and assumptions that affect the amounts reported in the consolidated financial statements and the accompanying notes. Key estimates include: the recognition of revenue and project profit or loss ; fair value estimates, including those related to acquisitions and contingent consideration; valuations of goodwill and intangible assets; asset lives used in computing depreciation and amortization; accrued self-insured claims; other reserves and accruals; accounting for income taxes; and the estimated impact of contingencies and ongoing litigation. While management believes that such estimates are reasonable when considered in conjunction with the Company’s consolidated financial position and results of operations, actual results could differ materially from those estimates.
62
“Emerging Growth Company”
As of December 31, 2019, the Company's total annual gross revenues exceed $1.07 billion and we no longer qualify as an “emerging growth company,” as defined in the Jumpstart Our Business Startups Act (the “JOBS Act”). Therefore, we are now subject to certain requirements that apply to other public companies, but did not previously apply to us due to our status as an emerging growth company. These requirements include but are not limited to:
• | compliance with the auditor attestation requirement in the assessment of our internal control over financial reporting pursuant to Section 404 of Sarbanes-Oxley Act; |
• | compliance with any new rules that may be adopted by the Public Company Accounting Oversight Board; |
• | compliance with any new or revised financial accounting standards applicable to public companies without an extended transition period. See below for further discussion of financial accounting standards adopted in the current year; |
• | full disclosure regarding executive compensation required of larger public companies; and |
• | compliance with the requirement of holding a nonbinding advisory vote on executive compensation and obtaining shareholder approval of any golden parachute payments not previously approved. |
Cash and Cash Equivalents
The Company considers all unrestricted, highly liquid investments with a maturity of three months or less when purchased to be cash and cash equivalents. The Company maintains cash balances, which, at times, may exceed the amounts insured by the Federal Deposit Insurance Corporation.
Accounts Receivable
The Company does not accrue interest to its customers and carries its customer receivables at their face amounts, less an allowance for doubtful accounts. Accounts receivable and contract assets include amounts billed to customers under the terms and provisions of the contracts. Most billings are determined based on contractual terms. As is common practice in the industry, the Company classifies all accounts receivable and contract assets, including retainage, as current assets. The contracting cycle for certain long-term contracts may extend beyond one year, and accordingly, collection of retainage on those contracts may extend beyond one year. Contract assets include amounts billed to customers under retention provisions in construction contracts. Such provisions are standard in the Company’s industry and usually allow for a small portion of progress billings on the contract price, typically 10%, to be withheld by the customer until after the Company has completed work on the project. Based on the Company’s experience with similar contracts in recent years, billings for such retention balances at each balance sheet date are finalized and collected after project completion. Generally, unbilled amounts will be billed and collected within one year. The Company determined that there are no material amounts due past one year and no material amounts billed but not expected to be collected within one year.
The Company grants trade credit, on a non-collateralized basis, to its customers and is subject to potential credit risk related to changes in business and overall economic activity. The Company analyzes specific accounts receivable and contract assets balances, historical bad debts, customer credit-worthiness, current economic trends and changes in customer payment terms when evaluating the adequacy of the allowance for doubtful accounts. In the event that a customer balance is deemed to be uncollectible, the account balance is written off against the allowance for doubtful accounts.
Activity in the allowance for doubtful accounts for the periods indicated was as follows:
Year Ended December 31, | |||||||||||
(in thousands) | 2019 | 2018 | 2017 | ||||||||
Allowance for doubtful accounts at beginning of period | $ | 42 | $ | 216 | $ | 135 | |||||
Plus: provision for (reduction in) allowance | 33 | (174 | ) | 81 | |||||||
Less: write-offs, net of recoveries | — | — | — | ||||||||
Allowance for doubtful accounts at period-end | $ | 75 | $ | 42 | $ | 216 | |||||
Revenue Recognition
The Company adopted the requirements of Accounting Standards Update (“ASU”) 2014-09, Revenue from Contracts with Customers, which is also referred to as Accounting Standards Codification (“ASC”) Topic 606, under the modified
63
retrospective transition approach effective January 1, 2019, with application to all existing contracts that were not substantially completed as of January 1, 2019. The impacts of adoption on the Company’s opening balance sheet were primarily related to variable consideration on unapproved change orders. The prior year comparative information has not been restated and continues to be reported under the accounting standards in effect for those periods; however, certain balances have been reclassified to conform to the current year presentation.
The effect of the changes made to the Company’s consolidated January 1, 2019 balance sheet for the adoption of ASC Topic 606 were as follows:
Balance Sheet (in thousands) | Balance as of December 31, 2018 (a) | Adjustment due to Topic 606(b) | Balance as of December 31, 2018 | ASC 606 Cumulative Effect Adjustment | Balance as of January 1, 2019 | |||||
Assets | ||||||||||
Accounts receivable, net (b) | 225,366 | (64,000 | ) | 161,366 | — | 161,366 | ||||
Costs and estimated earnings in excess of billings on uncompleted contracts | 47,121 | (47,121 | ) | — | — | — | ||||
Contract assets (b) | — | 111,121 | 111,121 | 961 | 112,082 | |||||
Deferred income taxes | 11,215 | — | 11,215 | (279 | ) | 10,936 | ||||
Liabilities | ||||||||||
Billings in excess of costs and estimated earnings on uncompleted contracts | 62,234 | (62,234 | ) | — | — | — | ||||
Contract liabilities (b) | — | 62,234 | 62,234 | (68 | ) | 62,166 | ||||
Equity | ||||||||||
Accumulated deficit | (135,931 | ) | — | (135,931 | ) | 750 | (135,181 | ) | ||
(a) | Balances as previously reported on the Company’s Annual Report on Form 10-K for the year ended December 31, 2018. |
(b) | Prior to the adoption of Topic 606, retainage receivable balances were included within accounts receivable. Prior year’s retainage receivables balance has been reclassified to contract assets to conform to the current year presentation. |
Under Topic 606, revenue is recognized when control of promised goods and services is transferred to customers, and the amount of revenue recognized reflects the consideration to which an entity expects to be entitled in exchange for the goods and services transferred. Revenue is recognized by the Company primarily over time utilizing the cost-to-cost measure of progress for fixed price, time and materials and other service contracts, consistent with the Company’s previous revenue recognition practices.
The adoption of Topic 606 did not have a material effect on the Company's consolidated financial statements; related to revenues, contract assets/liabilities, deferred taxes and net loss as compared with the Company’s previous revenue recognition practices under ASC Topic 605.
Contracts
The Company derives revenue primarily from construction projects performed under contracts for specific projects requiring the construction and installation of an entire infrastructure system or specified units within an infrastructure system, which are subject to multiple pricing options, including fixed price, time and materials, or unit price with a breakdown shown below. Renewable energy projects are performed for private customers while our specialty civil projects are performed for a mix of public and private customers.
Revenue derived from projects billed on a fixed-price basis totaled 94.8%, 96.2% and 97.8% of consolidated revenue from continuing operations for the years ended December 31, 2019, 2018 and 2017, respectively. Revenue and related costs for construction contracts billed on a time and materials basis are recognized as the services are rendered. Revenue derived from projects billed on a time and materials basis totaled 5.2%, 3.8% and 2.2% of consolidated revenue from continuing operations for the years ended December 31, 2019, 2018 and 2017, respectively.
Revenue from construction contracts is recognized over time using the cost-to-cost measure of progress. For these contracts, the cost-to-cost measure of progress best depicts the continuous transfer of control of goods or services to the
64
customer. Such contracts provide that the customer accept completion of progress to date and compensate the Company for services rendered.
Contract costs include all direct materials, labor and subcontracted costs, as well as indirect costs related to contract performance, such as indirect labor, supplies, tools, repairs and the operational costs of capital equipment. The cost estimation and review process for recognizing revenue over time under the cost-to-cost method is based on the professional knowledge and experience of the Company’s project managers, engineers and financial professionals. Management reviews estimates of total contract transaction price and total project costs on an ongoing basis. Changes in job performance, job conditions and management’s assessment of expected variable consideration are factors that influence estimates of the total contract transaction price, total costs to complete those contracts and profit recognition. Changes in these factors could result in revisions to revenue and costs of revenue in the period in which the revisions are determined on a prospective basis, which could materially affect the Company’s consolidated results of operations for that period. Provisions for losses on uncompleted contracts are recorded in the period in which such losses are determined.
Performance Obligations
A performance obligation is a promise in a contract to transfer a distinct good or service to the customer, and is the unit of account under Topic 606. The transaction price of a contract is allocated to each distinct performance obligation and recognized as revenue when or as the performance obligation is satisfied. The Company’s contracts often require significant integrated services, and even when delivering multiple distinct services, are generally accounted for as a single performance obligation. Contract amendments and change orders are generally not distinct from the existing contract due to the significant integrated service provided in the context of the contract, and are accounted for as a modification of the existing contract and performance obligation. The majority of the Company’s performance obligations are completed within one year with the exception of certain specialty civil service contracts.
When more than one contract is entered into with a customer on or close to the same date, the Company evaluates whether those contracts should be combined and accounted for as a single contract as well as whether those contracts should be accounted for as more than one performance obligation. This evaluation requires significant judgment and is based on the facts and circumstances of the various contracts, which could change the amount of revenue and profit recognition in a given period depending upon the outcome of the evaluation.
Remaining performance obligations represent the amount of unearned transaction prices for fixed price contracts and open purchase orders for which work is wholly or partially unperformed. As of December 31, 2019, the amount of the Company’s remaining performance obligations was $1,315.2 million. The Company expects to recognize approximately 85.5% of its remaining performance obligations as revenue in 2020, with the remainder recognized primarily in 2021.
Variable Consideration
Transaction pricing for the Company’s contracts may include variable consideration, which is comprised of items such as change orders, claims, incentives and liquidated damages. Management estimates variable consideration for a performance obligation utilizing estimation methods that best predict the amount of consideration to which the Company will be entitled. Variable consideration is included in the estimated transaction price to the extent it is probable that a significant reversal of cumulative revenue recognized will not occur when the uncertainty associated with the variable consideration is resolved. Management’s estimates of variable consideration and determination of whether to include estimated amounts in transaction price are based largely on engineering studies and legal opinions, past practices with the customer, specific discussions, correspondence or preliminary negotiations with the customer and all other relevant information that is reasonably available. The effect of variable consideration on the transaction price of a performance obligation is typically recognized as an adjustment to revenue on a cumulative catch-up basis. To the extent unapproved change orders, claims and liquidated damages reflected in transaction price are not resolved in the Company’s favor, or to the extent incentives reflected in transaction price are not earned, there could be reductions in, or reversals of, previously recognized revenue.
As of December 31, 2019 and 2018, the Company included approximately $73.3 million and $45.0 million, respectively, of unapproved change orders and/or claims in the transaction price for certain contracts that were in the process of being resolved in the normal course of business, including through negotiation, arbitration and other proceedings. These transaction price adjustments are included within Contract Assets or Contract Liabilities as appropriate. The Company actively engages with its customers to complete the final approval process, and generally expects these processes to be completed within one year. Amounts ultimately realized upon final acceptance by customers could be higher or lower than such estimated amounts.
65
Disaggregation of Revenue
The following tables disaggregate revenue by contract type, which the Company believes best depicts how the nature, amount, timing and uncertainty of its revenue and cash flows are affected by economic factors for the year ended December 31, 2019:
(in thousands) | December 31, 2019 | |||
Renewables | ||||
Wind | 830,653 | |||
Solar | 3,376 | |||
$ | 834,029 | |||
Specialty Civil | ||||
Heavy civil | 351,476 | |||
Rail | 174,332 | |||
Environmental | 99,926 | |||
$ | 625,734 | |||
The Company had the following approximate revenue and accounts receivable concentrations, net of allowances, for the periods ended:
Revenue % | Accounts Receivable % | ||||||||||||
Year Ended December 31, | December 31, | ||||||||||||
2019 | 2018 | 2017 | 2019 | 2018 | |||||||||
Company A (Renewables Segment) | * | 21.0 | % | * | * | 20.0 | % | ||||||
Company B (Specialty Civil Segment) | 10.9 | % | * | * | * | 19.0 | % | ||||||
Company C (Renewables Segment) | * | * | 21.0 | % | * | * | |||||||
Company D (Renewables Segment) | * | * | 11.0 | % | * | * | |||||||
Company E (Renewables Segment) | * | * | 11.0 | % | * | * | |||||||
Company F (Renewables Segment) | * | * | 14.0 | % | * | * | |||||||
———
* Amount was not above 10% threshold.
Self-Insurance
The Company is self-insured up to the amount of its deductible for its medical and workers’ compensation insurance policies. For the years ended December 31, 2019, 2018 and 2017, the Company maintained insurance policies subject to per claim deductibles of $0.5 million, for its workers' compensation policy. Liabilities under these insurance programs are accrued based upon management’s estimates of the ultimate liability for claims reported and an estimate of claims incurred but not reported with assistance from third-party actuaries. The Company’s liability for employee group medical claims is based on analysis of historical claims experience and specific knowledge of actual losses that have occurred. The Company is also required to post letters of credit and provide cash collateral to certain of its insurance carriers and to obtain surety bonds in certain states.
The Company’s self-insurance liability is reflected in the consolidated balance sheets within accrued liabilities. The determination of such claims and expenses and the appropriateness of the related liability is reviewed and updated quarterly, however, these insurance liabilities are difficult to assess and estimate due to unknown factors, including the severity of an injury, the determination of the Company’s liability in proportion to other parties and the number of incidents not reported. Accruals are based upon known facts and historical trends. Although management believes its accruals are adequate, a change in experience or actuarial assumptions could materially affect the Company’s results of operations in a particular period. As of December 31, 2019 and 2018, the gross amount accrued for medical insurance claims totaled $0.7 million and $0.6 million, respectively, and the gross amount accrued for workers’ compensation claims totaled $3.2 million and $2.1 million, respectively. For the years ended December 31, 2019, 2018 and 2017, health care expense totaled $5.9
66
million, $2.4 million and $1.1 million, respectively, and workers' compensation expense totaled $9.1 million, $5.8 million and $3.4 million, respectively.
Company-Owned Life Insurance
The Company has life insurance policies on certain key executives. Company-owned life insurance is recorded at its cash surrender value or the amount that can be realized.
As of December 31, 2019 and 2018, the Company had a long-term asset of $4.8 million and $3.9 million, respectively, related to these policies. For the years ended December 31, 2019, 2018 and 2017, the Company recognized an increase of $0.9 million, a decrease of $0.4 million and an increase of $2.0 million, respectively, in the cash surrender value of these policies.
Leases
In the ordinary course of business, the Company enters into agreements that provide financing for machinery and equipment and for other of its facility, vehicle and equipment needs. The Company reviews all arrangements for potential leases, and at inception, determines whether a lease is an operating or finance lease. Lease assets and liabilities, which generally represent the present value of future minimum lease payments over the term of the lease, are recognized as of the commencement date. Leases with an initial lease term of twelve months or less are classified as short-term leases and are not recognized in the consolidated balance sheets unless the lease contains a purchase option that is reasonably certain to be exercised.
Lease term, discount rate, variable lease costs and future minimum lease payment determinations require the use of judgment, and are based on the facts and circumstances related to the specific lease. Lease terms are generally based on their initial non-cancelable terms, unless there is a renewal option that is reasonably certain to be exercised. Various factors, including economic incentives, intent, past history and business need are considered to determine if a renewal option is reasonably certain to be exercised. The implicit rate in a lease agreement is used when it can be determined. Otherwise, the incremental borrowing rate, which is based on information available as of the lease commencement date, including applicable lease terms and the current economic environment, is used to determine the value of the lease obligation.
Property, Plant and Equipment, Net
Property, plant and equipment is recorded at cost, or if acquired in a business combination, at the acquisition-date fair value, less accumulated depreciation. Depreciation of property, plant and equipment, including property and equipment under capital leases, is computed using the straight-line method over the estimated useful lives of the respective assets. Leasehold improvements are depreciated over the shorter of the term of the lease or the estimated useful lives of the improvements. Expenditures for repairs and maintenance are charged to expense as incurred, and expenditures for betterments and major improvements are capitalized and depreciated over the remaining useful lives of the assets. The carrying amounts of assets sold or retired and the related accumulated depreciation are eliminated in the year of disposal, with resulting gains or losses included in other income or expense.
The assets’ estimated lives used in computing depreciation for property, plant and equipment are as follows:
Buildings and leasehold improvements | 2 to 39 years |
Construction equipment | 3 to 15 years |
Office equipment, furniture and fixtures | 3 to 7 years |
Vehicles | 3 to 5 years |
Intangible Assets, Net
The Company's intangible assets represent finite-lived assets that were acquired in a business combination, consisting of customer relationships, trade names and backlog, and are recorded at acquisition-date fair value, less accumulated amortization. These assets are amortized over their estimated lives, which are generally based on contractual or legal rights. Amortization of customer relationship and trade name intangibles is recorded within selling, general and administrative expenses in the consolidated statements of operations, and amortization of backlog intangibles is recorded within cost of revenue. The straight-line method of amortization is used because it best reflects the pattern in which the economic benefits of
67
the intangibles are consumed or otherwise used up. The amounts and useful lives assigned to intangible assets acquired impact the amount and timing of future amortization.
Impairment of Property, Plant and Equipment and Intangibles
Management reviews long-lived assets that are held and used for impairment whenever events or changes in circumstances indicate that their carrying amounts may not be recoverable. If an evaluation is required, the estimated future undiscounted cash flows associated with the asset are compared with the asset’s carrying amount to determine if there has been an impairment, which is calculated as the difference between the fair value of an asset and its carrying value. Estimates of future undiscounted cash flows are based on expected growth rates for the business, anticipated future economic conditions and estimates of residual values. Fair values take into consideration management’s estimates of risk-adjusted discount rates, which are believed to be consistent with assumptions that marketplace participants would use in their estimates of fair value. There were no impairments of property, plant and equipment or intangible assets recognized during the years ended December 31, 2019, 2018 and 2017.
Goodwill
Goodwill represents the excess purchase price paid over the fair value of acquired intangible and tangible assets. Goodwill is not amortized but rather is assessed at least annually for impairment on October 1st and tested for impairment more frequently if events and circumstances indicate that the asset might be impaired. The Company may assess its goodwill for impairment initially using a qualitative approach to determine whether conditions exist to indicate that it is more likely than not that the fair value of a reporting unit is less than its carrying value. If management concludes, based on its assessment of relevant events, facts and circumstances, that it is more likely than not that a reporting unit’s carrying value is greater than its fair value, then a quantitative analysis will be performed to determine if there is any impairment.
The quantitative assessment for goodwill requires the Company to compare the carrying value of a reporting unit, including goodwill, to its fair value using the income approach. The income approach uses a discounted cash flow model, which involves significant estimates and assumptions including preparation of revenue and profitability growth forecasts, selection of a discount rate and selection of a terminal year multiple. If the fair value of the respective reporting unit exceeds its carrying amount, goodwill is not considered to be impaired. If the carrying amount of a reporting unit exceeds its fair value, the Company would record an impairment charge equal to the difference, not to exceed the carrying amount of goodwill.
In our Specialty Civil segment, we valued these reporting units using the income approach based on their expected future cash flows. The critical assumptions that factored into the valuations are the projected future revenues and operating EBITDA margins of the business, their terminal growth rates, as well as the discount rate used to present value the future cash flows. While none of our reporting units recorded a goodwill impairment in 2019, we determined that the CCS Reporting Unit is our only reporting unit where the estimated fair value does not substantially exceed the carrying value. The estimated fair value of the reporting unit exceeds its carrying amount by approximately 2.8%. Total goodwill in this reporting unit is $29.8 million. The goodwill in this reporting unit is primarily attributable to the acquisition of CCS at fair value late in fiscal 2018. As a result, we did not expect the estimated fair value would exceed the carrying value by a significant amount.
Business Combinations
The Company accounts for its business combinations by recognizing and measuring in its financial statements the identifiable assets acquired, the liabilities assumed and any non-controlling interests (if applicable) in the acquiree at the acquisition date. Purchase are accounted for using the acquisition method, and the fair value of purchase consideration is allocated to the tangible and intangible assets acquired and the liabilities assumed based on their estimated fair values. The excess, if any, of the fair value of the purchase consideration over the fair value of the identifiable net assets is recorded as goodwill. Conversely, the excess, if any, of the net fair values of the identifiable net assets over the fair value of the purchase consideration is recorded as a gain. The fair values of net assets acquired are calculated using expected cash flows and industry-standard valuation techniques, and these valuations require management to make significant estimates and assumptions. These estimates and assumptions are inherently uncertain, and as a result, actual results may materially differ from estimates. Significant estimates include, but are not limited to, future expected cash flows, useful lives and discount rates. During the measurement period, which is one year from the acquisition date, the Company may record adjustments to the assets acquired and liabilities assumed, with a corresponding offset to either goodwill or gain, depending on whether the fair value of purchase consideration is in excess of or less than net assets acquired. Upon the conclusion of the measurement period, any subsequent adjustments are recorded to earnings. Acquisition costs related to business combinations are expensed as incurred.
68
Contingent Consideration
As part of the Merger, the Company agreed to issue additional common shares to the Seller upon satisfaction of financial targets for 2019 and 2018. This contingent liability, which is presented as contingent consideration in the consolidated balance sheets, was measured at its estimated fair value as of the Closing Date using a Monte Carlo simulation and subsequent changes in fair value are recorded within other (expense) income, net in the consolidated statement of operations. See Note 7. Fair Value of Financial Instruments for further discussion.
Debt Issuance Costs
Financing costs incurred with securing a term loan or series B preferred stock are deferred and amortized to interest expense, net over the maturity of the respective agreements using the effective interest method and are presented as a direct deduction from the carrying amount of the related debt. Financing costs incurred with securing a revolving line of credit are deferred and amortized to interest expense, net over the contractual term of the arrangement on a straight-line basis and are presented as a direct deduction from the carrying amount of the related debt.
Stock-Based Compensation
IEA has an equity plan which grants stock options (“Options”) and restricted stock units (“RSUs”) to certain key employees and members of the Board of Directors of the Company (the “Board”) for their services. The Company recognizes compensation expense for these awards in accordance with the provisions of ASC 718, Stock Compensation, which requires the recognition of expense related to the fair value of the awards in the Company’s consolidated statement of operations.
The Company estimates the grant-date fair value of each award at issuance. For awards subject to service-based vesting conditions, the Company recognizes compensation expense equal to the grant-date fair value on a straight-line basis over the requisite service period, which is generally the vesting term. Forfeitures are accounted for when incurred. For awards subject to both performance and service-based vesting conditions, the Company recognizes stock-based compensation expense using the straight-line recognition method when it is probable that the performance condition will be achieved.
Income Taxes
Income taxes are accounted for under the asset and liability method. Deferred tax assets and liabilities are recognized for the estimated future tax consequences attributable to differences between the financial statement carrying amounts of existing assets and liabilities and their respective tax bases. Deferred tax assets and liabilities are measured using enacted tax rates in effect for the year in which those temporary differences are expected to be recovered or settled. Where applicable, the Company records a valuation allowance to reduce any deferred tax assets that it determines will not be realizable in the future.
On December 22, 2017, the U.S. government enacted comprehensive tax legislation commonly referred to as the Tax Cuts and Jobs Act (the “2017 Tax Act”), which enacted major changes to the U.S. tax code, including a reduction in the U.S. federal corporate income tax rate from 35% to 21%, effective January 1, 2018. As a result, the Company’s U.S. deferred income tax balances were required to be remeasured in 2017. Management considered the implications of the 2017 Tax Act, including the rate change, 100% immediate expensing, toll charge, Alternative Minimum Tax (“AMT”) credit change and state impacts on the calculation of the provision for income taxes for the year ended December 31, 2017 and the effect of these changes in tax law was $0.3 million, which the Company recognized within the provision for income taxes in the consolidated statement of operations for the year ended December 31, 2017.
The Company recognizes the benefit of an uncertain tax position that it has taken or expects to take on income tax returns it files if such tax position is more likely than not to be sustained on examination by the taxing authorities, based on the technical merits of the position. These tax benefits are measured based on the largest benefit that has a greater than 50% likelihood of being realized upon ultimate resolution.
69
Litigation and Contingencies
Accruals for litigation and contingencies are reflected in the consolidated financial statements based on management’s assessment, including advice of legal counsel, of the expected outcome of litigation or other dispute resolution proceedings and/or the expected resolution of contingencies. Liabilities for estimated losses are accrued if the potential loss from any claim or legal proceeding is considered probable and the amount can be reasonably estimated. Significant judgment is required in both the determination of probability of loss and the determination as to whether the amount is reasonably estimable. Accruals are based only on information available at the time of the assessment due to the uncertain nature of such matters. As additional information becomes available, management reassesses potential liabilities related to pending claims and litigation and may revise its previous estimates, which could materially affect the Company’s results of operations in a given period.
Fair Value of Financial Instruments
The Company applies ASC 820, Fair Value Measurement, which establishes a framework for measuring fair value and clarifies the definition of fair value within that framework. ASC 820 defines fair value as an exit price, which is the price that would be received for an asset or paid to transfer a liability in the Company’s principal or most advantageous market in an orderly transaction between market participants on the measurement date. The fair value hierarchy established in ASC 820 generally requires an entity to maximize the use of observable inputs and minimize the use of unobservable inputs when measuring fair value. Observable inputs reflect the assumptions that market participants would use in pricing the asset or liability and are developed based on market data obtained from sources independent of the reporting entity. Unobservable inputs reflect the entity’s own assumptions based on market data and the entity’s judgments about the assumptions that market participants would use in pricing the asset or liability and are to be developed based on the best information available in the circumstances.
The valuation hierarchy is composed of three levels. The classification within the valuation hierarchy is based on the lowest level of input that is significant to the fair value measurement. The levels within the valuation hierarchy are described below:
Level 1 - Assets and liabilities with unadjusted, quoted prices listed on active market exchanges. Inputs to the fair value measurement are observable inputs, such as quoted prices in active markets for identical assets or liabilities.
Level 2 - Inputs to the fair value measurement are determined using prices for recently traded assets and liabilities with similar underlying terms, as well as direct or indirect observable inputs, such as interest rates and yield curves that are observable at commonly quoted intervals.
Level 3 - Inputs to the fair value measurement are unobservable inputs, such as estimates, assumptions and valuation techniques when little or no market data exists for the assets or liabilities. The Company has Series B Preferred Stock, Warrants and the Rights Offering value in Level 3.
Fair values of financial instruments are estimated using public market prices, quotes from financial institutions and other available information.
Segments
Operating segments are identified as components of an enterprise about which separate discrete financial information is available for evaluation by the chief operating decision maker, or decision-making group, in making decisions on how to allocate resources and assess performance. The Company’s chief operating decision makers are the chief executive officer and chief financial officer. The Company reports its operations as two reportable segments.
Recently Adopted Accounting Standards - Guidance Adopted in 2019
In May 2014, the FASB issued Topic 606, which replaces most existing revenue recognition guidance in GAAP. The core principle of the guidance is that a company should recognize revenue to depict the transfer of promised goods or services to customers in an amount that reflects the consideration the company expects to receive in exchange for those goods or services. To achieve this core principle, the guidance provides a five-step analysis of transactions to determine when and how revenue is recognized. The guidance addresses several areas including transfer of control, contracts with multiple performance obligations and costs to obtain and fulfill contracts. The guidance also requires additional disclosure about the nature, amount, timing and uncertainty of revenue and cash flows arising from customer contracts, including significant judgments and changes in judgments and assets recognized from costs incurred to obtain or fulfill a contract.
70
The Company adopted the requirements of Topic 606, under the modified retrospective transition approach effective January 1, 2019, with application to all existing contracts that were not substantially completed as of January 1, 2019. The impacts of adoption on the Company’s opening balance sheet were primarily related to variable consideration on unapproved change orders. The prior year comparative information has not been restated and continues to be reported under the accounting standards in effect for those periods; however, certain balances have been reclassified to conform to the current year presentation. See “Revenue Recognition” section above and Note 4. Contract Assets and Liabilities for further discussion of adopted guidance.
In February 2016, the FASB issued ASU 2016-02, Leases (Topic 842), which is effective for annual reporting periods beginning after December 15, 2018. Under Topic 842, lessees will be required to recognize the following for all leases (with the exception of short-term leases) at the commencement date: i) a lease liability, which is a lessee’s obligation to make lease payments arising from a lease, measured on a discounted basis, and ii) a right-of-use asset, which is an asset that represents the lessee’s right to use, or control the use of, a specified asset for the lease term. Topic 842 requires entities to adopt the new lease standard using a modified retrospective method and initially apply the related guidance at the beginning of the earliest period presented in the financial statements.
The Company adopted Topic 842 using the modified retrospective method as of January 1, 2019, without adjusting comparative periods in the financial statements. The most significant effect of the new guidance was the recognition of operating lease right-of-use assets and a liability for operating leases. The accounting for finance leases (capital leases) was substantially unchanged. The Company elected to utilize the package of practical expedients that allowed entities to: (1) not reassess whether any expired or existing contracts were or contained leases; (2) retain the existing classification of lease contracts as of the date of adoption; (3) not reassess initial direct costs for any existing leases; and (4) not separate non-lease components for all classes of leased assets. The Company recognized approximately $23.1 million of lease assets and liabilities for operating leases upon adoption of ASU 2016-02. The adoption of Topic 842 did not have an effect on the Company's results of operations or cash flows. For additional information about the Company’s leases, see Note 9. Commitments and Contingencies.
In January 2017, the FASB issued ASU 2017-04,"Intangibles—Goodwill and Other (Topic 350): Simplifying the Test for Goodwill Impairment". ASU 2017-04 removes the second step of the goodwill impairment test, which requires a hypothetical purchase price allocation. A goodwill impairment will now be the amount by which a reporting unit's carrying value exceeds its fair value, not to exceed the carrying amount of goodwill. ASU 2017-04 is effective for interim and annual reporting periods beginning after December 15, 2019, with early adoption permitted. We adopted the standard on January 1, 2019, and it did not have an impact on our financial position, results of operations, or cash flows.
Recently Issued Accounting Standards Not Yet Adopted
In June 2016, the FASB issued ASU 2016-13,“Financial Instruments—Credit Losses (Topic 326): Measurement of Credit Losses on Financial Instruments”, which introduced an expected credit loss methodology for the measurement and recognition of credit losses on most financial assets, including trade accounts receivables. The expected credit loss methodology under ASU 2016-13 is based on historical experience, current conditions and reasonable and supportable forecasts, and replaces the probable/incurred loss model for measuring and recognizing expected losses under current GAAP. The ASU also requires disclosure of information regarding how a company developed its allowance, including changes in the factors that influenced management’s estimate of expected credit losses and the reasons for those changes. The ASU and its related clarifying updates are effective for fiscal years beginning after December 15, 2019, and interim periods within those fiscal years, with early adoption permitted. We are still evaluating the new standard but do not expect it to have a material impact on our estimate of the allowance for uncollectable accounts.
In August 2018, the FASB issued ASU 2018-13, Fair Value Measurement (Topic 820), Disclosure Framework - Changes to the Disclosure Requirements for Fair Value Measurement, which eliminates certain disclosure requirements for recurring and non-recurring fair value measurements, such as the amount of and reason for transfers between Level 1 and Level 2 of the fair value hierarchy, and adds new disclosure requirements for Level 3 measurements. This ASU is effective for all entities for fiscal years beginning after December 15, 2019, including interim periods within those fiscal years, with early adoption permitted for any eliminated or modified disclosures. Certain disclosures per this ASU are required to be applied on a retrospective basis and others on a prospective basis. We do not expect the adoption of this ASU to have a material impact on our disclosures.
In December 2019, the FASB issued ASU No. 2019-12,“Income Taxes (Topic 740): Simplifying the Accounting for Income Taxes”, which removes certain exceptions to the general principles in Topic 740 and also clarifies and amends existing
71
guidance to improve consistent application. This ASU is effective for fiscal years beginning after December 15, 2020, and interim periods within those fiscal years. Depending on the amendment, adoption may be applied on the retrospective, modified retrospective, or prospective basis. We are currently evaluating the potential effects of adopting the provisions of ASU No. 2019-12.
Management has evaluated other recently issued accounting pronouncements and does not believe that they will have a significant impact on the Company's consolidated financial statements and related disclosures.
Note 2. Merger and Acquisitions
Merger and Recapitalization
The Merger, as described in Note 1. Business, Basis of Presentation and Significant Accounting Policies, has been accounted for as a reverse recapitalization in accordance with GAAP. As such, IEA Services is treated as the continuing company and M III is treated as the ‘‘acquired’’ company for financial reporting purposes. This determination was primarily based on IEA Services’ operations comprising substantially all of the ongoing operations of the post-combination company, M III directors not constituting a majority of the Board of the post-combination company, IEA Services’ senior management comprising substantially all of the senior management of the post-combination company and the Seller holding a 48.3% voting interest in the Company, while no single M III shareholder holds more than a 20% voting interest. Accordingly, for accounting purposes, the Merger is treated as the equivalent of IEA Services issuing stock for the net assets of M III, accompanied by a recapitalization. The net assets of M III are stated at historical cost, with no goodwill or other intangible assets recorded. Operations prior to the Merger are the historical operations of IEA Services.
The amount of merger consideration paid at the Closing Date to IEA (the “Merger Consideration”) was $81.4 million in cash, and 10,428,500 shares of common stock and 34,965 shares of Series A convertible preferred stock with an aggregate stated value of $126.3 million at the Closing Date. Immediately following the closing, the Seller owned approximately 48.3% of the Company’s common stock and other stockholders owned approximately 51.7% of the Company’s outstanding common stock. The Merger Consideration was subject to adjustment based on final determinations of IEA Services’ closing date working capital and indebtedness, which determination was finalized approximately 45 days after the Closing Date with minimal impact to the Merger Consideration as calculated on the Closing Date of the Merger.
Pursuant to the Merger Agreement, the Company was required to issue to the Seller up to an additional 9,000,000 common shares in the aggregate based upon satisfaction of financial targets for 2018 and 2019. As of December 31, 2019, the financial targets were not achieved, for further discussion see Note 7. Fair Value of Financial Instruments for further discussion.
Acquisitions
CCS
On September 25, 2018, IEA Services acquired CCS for $106.6 million in cash. The Company financed this acquisition through borrowings on its new credit facility as discussed in Note 8. Debt.
The wholly-owned subsidiaries of CCS, Saiia and the ACC Companies, generally enter into long-term contracts with both government and non-government customers to provide EPC services for environmental, heavy civil and mining projects. As discussed in Note 1. Business, Basis of Presentation and Significant Accounting Policies, this acquisition is being accounted for as a business combination under the acquisition method of accounting.
William Charles
On November 2, 2018, IEA Services acquired William Charles for $77.7 million, consisting of $73.2 million in cash and $4.5 million of the Company's common stock (477,621 common shares at $9.45 share price). The Company financed the cash portion of this acquisition through borrowings on its new credit facility as discussed in Note 8. Debt.
William Charles generally enters into long-term contracts with both government and non-government customers to provide EPC services for rail civil infrastructure, environmental and heavy civil projects. As discussed in Note 1. Business, Basis of Presentation and Significant Accounting Policies, this acquisition is being accounted for as a business combination under the acquisition method of accounting.
Acquisition Accounting
The following table summarizes the amounts recognized for assets acquired and liabilities assumed as of the respective acquisition date at fair value for the business combinations described above. The values for CCS were finalized as of June 30, 2019 and finalized for William Charles as of September 30, 2019.
Identifiable assets acquired and liabilities assumed (in thousands) | CCS(1) | William Charles(2) | |||||
Cash | $ | 6,413 | $ | 6,641 | |||
Accounts receivable | 58,041 | 69,740 | |||||
Costs and estimated earnings in excess of billings on uncompleted contracts | 9,512 | 16,095 | |||||
Other current assets | 1,813 | 7,999 | |||||
Property, plant and equipment | 59,952 | 47,899 | |||||
Intangible assets: | |||||||
Customer relationships(3) | 19,500 | 7,000 | |||||
Trade names(3) | 8,900 | 4,500 | |||||
Backlog(3) | 8,400 | 5,500 | |||||
Deferred income taxes(4) | (2,361 | ) | — | ||||
Other non-current assets | 134 | 75 | |||||
Accounts payable and accrued liabilities | (25,219 | ) | (60,962 | ) | |||
Billings in excess of costs and estimated earnings on uncompleted contracts | (14,194 | ) | (14,810 | ) | |||
Debt, less current portion | (52,257 | ) | (15,672 | ) | |||
Capital lease obligations, including current portion | (1,124 | ) | — | ||||
Other non-current liabilities | (704 | ) | (907 | ) | |||
Total identifiable net assets | 76,806 | 73,098 | |||||
Goodwill | 29,773 | 4,581 | |||||
Total purchase consideration | $ | 106,579 | $ | 77,679 | |||
———
(1) The estimated acquisition-date fair values pertaining to CCS reflect the following significant changes from December 31, 2018: an increase to property, plant and equipment of $2.5 million, an increase to deferred income taxes of $1.6 million, and a decrease to goodwill of $4.1 million.
(2) | The estimated acquisition-date fair values pertaining to William Charles reflect the following change from December 31, 2018; a decrease to property, plant and equipment of $1.2 million and an increase to goodwill of $1.2 million. |
(3) | See Note 5. Goodwill and Intangible Assets, Net for disclosure of the weighted average amortization period for each major class of acquired intangible asset. |
(4) The Company's consolidated deferred income taxes are presented as a net deferred tax asset (long-term) in the consolidated balance sheet as of December 31, 2019.
Goodwill is calculated as the excess of the consideration transferred over the net assets recognized and represents the future economic benefits arising from other assets acquired that could not be individually identified and separately recognized. Specifically, the goodwill recorded as part of the acquisitions of CCS and William Charles is related to the expected, specific synergies and other benefits that the Company believes will result from combining the operations of CCS and William Charles with the operations of IEA. This goodwill is related to the Company's Specialty Civil segment and is deductible for income tax purposes, with the exception of $2.9 million for CCS that is not deductible.
Impact of Acquisitions
The following table summarizes the results of operations included in the Company's consolidated statement of operations for CCS and William Charles from their respective date of acquisition.
Year Ended December 31, 2019 | Year Ended December 31, 2018 | ||||||||||||||
(in thousands) | CCS | William Charles | CCS | William Charles | |||||||||||
Revenue | $ | 281,095 | $ | 301,185 | $ | 76,029 | $ | 49,607 | |||||||
Net (loss) income | 39 | 11,702 | (613 | ) | 2,256 | ||||||||||
72
Acquisition-related costs incurred by the Company for the acquisitions of CCS and William Charles were $6.6 million and $7.6 million, respectively, for the year ended December 31, 2018, and are included within selling, general and administrative expenses in the consolidated statement of operations. Such costs primarily consisted of professional services and adviser fees. There were no acquisition-related costs incurred for the years ended December 31, 2019 and 2017.
The following table provides the supplemental unaudited total revenue and net (loss) income of the Company had the acquisition date of CCS and William Charles been the first day of IEA's fiscal year 2017 and 2019 statement of operation results.
Year Ended December 31, | |||||||||||
(in thousands, except per share data) | 2019 | Pro forma 2018 | Pro forma 2017 | ||||||||
Revenue | $ | 1,459,763 | $ | 1,257,616 | $ | 997,018 | |||||
Net (loss) income | 6,231 | (840 | ) | 5,792 | |||||||
Net (loss) income per common share - basic and diluted | (0.97 | ) | (2.25 | ) | 0.27 | ||||||
The amounts in the supplemental unaudited pro forma results apply the Company's accounting policies and reflect certain adjustments to, among other things, (i) exclude the impact of transaction costs incurred in connection with the acquisitions, (ii) include additional depreciation and amortization that would have been charged assuming the same fair value adjustments to property, plant and equipment and acquired intangibles had been applied on January 1, 2017 and (iii) include additional interest expense that would have been charged assuming the incremental borrowings the Company incurred to finance the acquisitions had been outstanding on January 1, 2017. Accordingly, these supplemental unaudited pro forma results have been prepared for comparative purposes only and are not intended to be indicative of the results of operations that would have occurred had the acquisitions actually occurred in the prior year period or indicative of the results of operations for any future period.
Note 3. Contract Assets and Liabilities
The timing of when we bill our customers is generally dependent upon agreed-upon contractual terms, milestone billings based on the completion of certain phases of the work, or when services are provided. Sometimes, billing occurs subsequent to revenue recognition, resulting in unbilled revenue, which is a contract asset. Also, we sometimes receive advances or deposits from our customers before revenue is recognized, resulting in deferred revenue, which is a contract liability.
Contract assets in the Consolidated Balance Sheets represents the following:
• | costs and estimated earnings in excess of billings, which arise when revenue has been recorded but the amount will not be billed until a later date; and |
• | retainage amounts for the portion of the contract price earned by us for work performed, but held for payment by the customer as a form of security until we reach certain construction milestones; |
Contract assets consist of the following:
December 31, | |||||
(in thousands) | 2019 | 2018 | |||
Costs and estimated earnings in excess of billings on uncompleted contracts | 91,543 | 47,121 | |||
Retainage receivable | 87,760 | 64,000 | |||
179,303 | 111,121 | ||||
73
Contract liabilities in the Consolidated Balance Sheets represents billings in excess of costs and estimated earnings on billings in excess of contract revenue recognized to date, and the accrued loss provision.
Contract liabilities consist of the following:
December 31, | |||||
(in thousands) | 2019 | 2018 | |||
Billings in excess of costs and estimated earnings on uncompleted contracts | 115,570 | 60,735 | |||
Loss on contracts in progress | 64 | 1,431 | |||
115,634 | 62,166 | ||||
The contract receivables amount as of December 31, 2019 and 2018 includes unapproved change orders of approximately $9.2 million and 9.2 million , respectively, for which the Company is pursuing settlement through dispute resolution.
Gross profit for the year ended December 31, 2018 includes a charge of approximately $5.6 million related to a dispute with a specific customer concerning change orders with respect to one specific project completed in the second quarter of 2018. The Company believes that the charge reflected in the disputed change orders are properly the obligation of the customer. Nonetheless, the Company elected to settle the dispute and absorb these costs in order to maintain a valuable customer relationship. There were no similar charges included within gross profit for the years ended December 31, 2019 and 2017.
Note 4. Property, Plant and Equipment, Net
Property, plant and equipment, net consisted of the following as of the dates indicated:
December 31, | |||||||
(in thousands) | 2019 | 2018 | |||||
Buildings and leasehold improvements | $ | 2,919 | $ | 4,614 | |||
Land | 17,600 | 19,394 | |||||
Construction equipment | 173,434 | 175,298 | |||||
Office equipment, furniture and fixtures | 3,487 | 2,994 | |||||
Vehicles | 6,087 | 4,991 | |||||
Total property, plant and equipment | 203,527 | 207,291 | |||||
Accumulated depreciation | (63,039 | ) | (31,113 | ) | |||
Property, plant and equipment, net | $ | 140,488 | $ | 176,178 | |||
Depreciation expense for property, plant and equipment was $34.6 million, $13.7 million and $5.0 million for the years ended December 31, 2019, 2018 and 2017, respectively.
In October 2017, IEA Services made an equity distribution to the Seller in the form of land and a building with a total net book value at the date of distribution of $4.7 million.
Note 5. Goodwill and Intangible Assets, Net
The following table provides the changes in the carrying amount of goodwill for 2019 and 2018:
(in thousands) | Renewables | Specialty Civil | Total | ||||||||
January 1, 2018 | $ | 3,020 | $ | — | $ | 3,020 | |||||
Acquisitions | — | 37,237 | 37,237 | ||||||||
December 31, 2018 | 3,020 | 37,237 | 40,257 | ||||||||
Acquisition adjustments | — | (2,884 | ) | (2,884 | ) | ||||||
December 31, 2019 | $ | 3,020 | 34,353 | $ | 37,373 | ||||||
74
Intangible assets, net consisted of the following as of the dates indicated:
December 31, 2019 | December 31, 2018 | ||||||||||||||||||||||||||
($ in thousands) | Gross Carrying Amount | Accumulated Amortization | Net Book Value | Weighted Average Remaining Life | Gross Carrying Amount | Accumulated Amortization | Net Book Value | Weighted Average Remaining Life | |||||||||||||||||||
Customer relationships | $ | 26,500 | $ | (4,695 | ) | $ | 21,805 | 6 years | $ | 27,000 | $ | (814 | ) | $ | 26,186 | 7 years | |||||||||||
Trade names | 13,400 | (3,305 | ) | 10,095 | 4 years | 13,400 | (575 | ) | 12,825 | 5 years | |||||||||||||||||
Backlog | 13,900 | (8,528 | ) | 5,372 | 1 year | 13,400 | (1,537 | ) | 11,863 | 2 years | |||||||||||||||||
$ | 53,800 | $ | (16,528 | ) | $ | 37,272 | $ | 53,800 | $ | (2,926 | ) | $ | 50,874 | ||||||||||||||
Amortization expense associated with intangible assets for the years ended December 31, 2019, 2018 and 2017 totaled $13.6 million, $3.0 million and $0.1 million, respectively.
The following table provides the annual intangible amortization expense expected to be recognized for the years 2020 through 2024:
(in thousands) | 2020 | 2021 | 2022 | 2023 | 2024 | ||||||||||||||
Amortization expense | $ | 11,837 | $ | 6,466 | $ | 6,466 | $ | 5,841 | $ | 3,786 | |||||||||
Note 6. Accrued Liabilities
Accrued liabilities consisted of the following as of the dates indicated:
December 31, | |||||||
(in thousands) | 2019 | 2018 | |||||
Accrued project costs | $ | 120,755 | $ | 61,689 | |||
Accrued compensation and related expenses | 26,367 | 15,939 | |||||
Other accrued expenses | 10,981 | 16,431 | |||||
$ | 158,103 | $ | 94,059 | ||||
Note 7. Fair Value of Financial Instruments
The following table presents the Company's financial instruments measured at fair value on a recurring basis, classified in the fair value hierarchy (Level 1, 2 or 3) based on the inputs used for valuation in the consolidated balance sheets:
December 31, 2019 | December 31, 2018 | ||||||||||||||||||||||||||||||
(in thousands) | Level 1 | Level 2 | Level 3 | Total | Level 1 | Level 2 | Level 3 | Total | |||||||||||||||||||||||
Liabilities | |||||||||||||||||||||||||||||||
Contingent consideration | $ | — | $ | — | $ | — | $ | — | $ | — | $ | — | $ | 23,082 | $ | 23,082 | |||||||||||||||
Series B Preferred Stock - Series A Conversion Warrants and Exchange Warrants | — | — | 4,317 | 4,317 | — | — | — | — | |||||||||||||||||||||||
Series B-1 Preferred Stock - Additional 6% Warrants | — | — | 400 | 400 | — | — | — | — | |||||||||||||||||||||||
Series B-3 Preferred - Closing Warrants | — | — | 11,491 | 11,491 | — | — | — | — | |||||||||||||||||||||||
Rights offering | — | — | 1,383 | 1,383 | — | — | — | — | |||||||||||||||||||||||
Total liabilities | $ | — | $ | — | $ | 17,591 | $ | 17,591 | $ | — | $ | — | $ | 23,082 | $ | 23,082 | |||||||||||||||
75
The following table reconciles the beginning and ending balances of recurring fair value measurements using Level 3 inputs for the years ended December 31, 2019 and 2018. There were no changes in such balances for the year ended December 31, 2017.
(in thousands) | Contingent Consideration | Series B Preferred - Series A Conversion Warrants and Exchange Warrants | Series B Preferred - Additional 6% Warrants | Series B-3 Preferred - Closing Warrants | Rights Offering | ||||||||||
Beginning Balance, December 31, 2017 | $ | — | $ | — | $ | — | $ | — | $ | — | |||||
Contingent consideration issued during Merger | 69,373 | — | — | — | — | ||||||||||
Fair value adjustment - (gain) recognized in other income | (46,291 | ) | — | — | — | — | |||||||||
Ending Balance, December 31, 2018 | $ | 23,082 | $ | — | $ | — | $ | — | $ | — | |||||
Preferred Series B Stock - initial fair value | — | 5,646 | 400 | 7,900 | 1,383 | ||||||||||
Fair value adjustment - (gain) loss recognized in other income | (23,082 | ) | (1,329 | ) | — | 3,591 | — | ||||||||
Ending Balance, December 31, 2019 | $ | — | $ | 4,317 | $ | 400 | $ | 11,491 | $ | 1,383 | |||||
Contingent Consideration
Pursuant to the Merger Agreement, the Company shall issue to the Seller up to an additional 9,000,000 common shares in the aggregate, which shall be fully earned if the final 2018 and 2019 financial targets are achieved. As of December 31, 2018, the Company recorded the contingent consideration liability at fair value, which was estimated using a Monte Carlo simulation based on certain significant unobservable inputs, such as a risk rate premium, peer group EBITDA volatility, stock price volatility and projected Adjusted EBITDA for the Company for 2019. The calculation derived a fair value adjustment of $46.3 million to the liability based on 2018 actual financial results and the expected probability of reaching the full amount of contingent consideration in 2019. The Company did not achieve the 2019 financial targets and therefore recorded a $23.1 million fair value adjustment to the liability.
Significant unobservable inputs used in the fair value calculation as of the periods indicated were as follows:
December 31, 2018 | March 26, 2018 | ||||
Risk premium adjustment | 8.0 | % | 5.0 | % | |
Risk-free rate | 2.6 | % | 2.0 | % | |
EBITDA volatility | 14.0 | % | 24.5 | % | |
Stock price volatility | 37.1 | % | 27.9 | % | |
Correlation of EBITDA and stock price | 75.0 | % | 75.0 | % | |
The following table sets forth information regarding the Company's assets measured at fair value on a non-recurring basis (in thousands):
December 31, 2019 | December 31, 2018 | ||||||||||||||||||||||||||||||
(in thousands) | Level 1 | Level 2 | Level 3 | Total | Level 1 | Level 2 | Level 3 | Total | |||||||||||||||||||||||
Liabilities: | |||||||||||||||||||||||||||||||
Series B Preferred Stock | $ | — | $ | — | $ | 153,400 | $ | 153,400 | $ | — | $ | — | $ | — | $ | — | |||||||||||||||
Equity: | |||||||||||||||||||||||||||||||
Series B-1 and B-2 Preferred Stock - Warrants at closing | $ | — | $ | — | $ | 14,100 | $ | 14,100 | $ | — | $ | — | $ | — | $ | — | |||||||||||||||
76
As described below, the Company entered into three Equity Commitment agreements at various dates during the year with Ares Management (“Ares”) and funds managed by Oaktree Capital Management (“Oaktree”). These resulted in Series B-1 Preferred Stock (the “Series B-1 Preferred Stock”), Series B-2 Preferred Stock (the “Series B-2 Preferred Stock”) and Series B-3 Preferred Stock (the “Series B-3 Preferred Stock”) (collectively referred to as “Series B Preferred Stock”).
On May 20, 2019, the Company entered into the Amended and Restated Equity Commitment Agreement (the “First Equity Commitment Agreement”), by and among the Company and the commitment parties thereto. Pursuant to the First Equity Commitment Agreement, the Company issued and sold on May 20, 2019, 50,000 shares of Series B-1 Preferred Stock, with each share having an initial stated value of $1,000 plus accumulated but unpaid dividends for gross cash proceeds of $50.0 million. The First Equity Commitment Agreement also required the Company to provide warrants for common stock at closing that equaled 10% of the fully diluted issued and outstanding common stock as of such date (the “Warrants at closing”), and in the future could be required to provide additional warrants in the event of conversion of the Series A Preferred Stock (“Series A Conversion Warrants”) and warrants for up to 6% of the fully diluted issued and outstanding common stock if the Company fails to meet certain Adjusted EBITDA thresholds on a trailing twelve-month basis on the last calendar day of May 2020 through April 2021 (the “Additional 6% Warrants”).
On August 13, 2019, the Company entered into the Second Equity Commitment Agreement (the “Second Equity Commitment Agreement”). Pursuant to the Second Equity Commitment Agreement, the Company issued and sold on August 30, 2019, 50,000 shares of Series B-2 Preferred Stock and 900,000 warrants to purchase common stock (“Warrants”) for an aggregate purchase price of $50.0 million.
On October 29, 2019, the Company entered into the Third Equity Commitment Agreement (the “Third Equity Commitment Agreement”) among the Company, funds managed by Ares and funds managed by Oaktree. Pursuant to the Third Equity Commitment Agreement, the Company agreed to issue and sell 80,000 shares of newly designated Series B-3 Preferred Stock (the “Series B-3 Preferred Stock”) and 3,568,750 Warrants for an aggregate purchase price of $80.0 million (the “Initial Closing”).
After the Initial Closing, Ares and Oaktree, pursuant to the Third Equity Commitment Agreement each required, subject to certain conditions, to purchase up to an additional 15,000 shares and 515,625 warrants if the Company did not repay at least $15.0 million of term loan by December 2019 (2019 Commitment). The agreement also required, subject to certain conditions to purchase up to an additional 15,000 shares and 515,625 warrants if the Company did not repay an additional $15.0 million of term loan by March 2020 (2020 Commitment). As of December 31, 2019, the Company had repaid $15.0 million of the debt related to the term loan and expects to pay the remaining $15.0 million in March 2020.
Rights Offering Agreement
On October 29, 2019, the Company entered into the Rights Offering Agreement (the “Rights Agreement”). The Company has agreed to conduct a rights offering and to distribute a transferrable right, but not the obligation, to purchase Series B-3 Preferred Stock and warrants to purchase common stock to the holders of the Company’s outstanding Common Stock (the “Rights Offering”). The Rights Offering will be subject to a maximum participation of 15,000 shares of Series B-3 Preferred Stock being issued, plus warrants at the rate of 5.5 per $160 of Series B-3 Preferred Stock purchased. On March 4, 2020, the Company completed the Rights Offering. For further discussion see Note 16. Subsequent Event.
Preferred Stock Exchange Agreement
On October 29, 2019, the Company entered into the Preferred Stock Exchange Agreement (the “Exchange Agreement”). Pursuant to the Exchange Agreement, the holder of our Series A Preferred Stock agreed to exchange 50% of its total Series A Preferred Stock outstanding into shares of Series B-3 Preferred Stock and Warrants. On November 14, 2019 the holders of the Series A Preferred Stock exchanged 17,482.5 million shares and were issued 657,383 exchange warrants.
The information below describes the balance sheet classification and the recurring/nonrecurring fair value measurement:
Series B Preferred Stock (non-recurring) - The Series B Preferred Stock were recorded at relative fair value as debt which was estimated using a discounted cashflow model based on certain significant unobservable inputs, such as accumulated dividend rates, and projected Adjusted EBITDA for the life of the Series B Preferred Stock. The fair value of the liability for each of the transactions, was a combined $153.4 million and recorded on the balance sheet as debt.
77
Series B-1 and Series B-2 Preferred Stock - Warrants at closing (non-recurring) - The Warrants at closing, with an exercise price of $0.0001, represented (on an if-converted to common stock basis) 10% of the issued and outstanding common stock of the Company based on the Company’s fully diluted share count on May 20, 2019 (including the number of shares of common stock that may be issued pursuant to all restricted stock awards, restricted stock units, stock options and any other securities or rights (directly or indirectly) convertible into, exchangeable for or to subscribe for common stock that are outstanding on May 20, 2019 (excluding any shares of common stock issuable (a) pursuant to the merger agreement for our business combination, (b) upon conversion of shares of Series A Preferred Stock, (c) upon the exercise of any warrant with an exercise price of $11.50 or higher or (d) upon the exercise of any equity issued pursuant to the Company’s long term incentive plan or other equity plan with a strike price of $11.50 or higher). The 2,545,934 if-converted shares of common stock at closing were valued at the closing stock price of $4.21 on May 20, 2019 and recorded in additional paid in capital.
On August 30, 2019, 900,000 if-converted shares of common stock were issued and were valued at the closing stock price of $3.75 and recorded in additional paid in capital.
Series B-3 Preferred Stock - Warrants at closing (recurring) - On November 14, 2019, 3,568,750 if converted shares of common stock were issued and were valued at the closing stock price of $2.20 and these were recorded as a liability and marked to market at December 31, 2019 at a price of $3.22.
Series B Preferred Stock - Series A Conversion Warrants and Exchange Warrants (recurring) - The certificate of designation for the Series A Preferred Stock was amended in connection with the Company entering into the First Equity Commitment Agreement. The conversion rights were amended to allow the holders of Series A Preferred Stock to convert all or any portion of Series A Preferred Stock outstanding at any point in time. If converted, the holders of the Series B Preferred Stock would be entitled to additional warrants, with an exercise price of $0.0001. These warrants were fair valued using the closing stock price of $4.21 on May 20, 2019, at an estimated if-converted share count and recorded as a liability. On October 29, 2019, the holders of Series A Preferred Stock converted 50% of their shares to Series B Preferred Stock and reduced the number of the potential additional warrants. In the exchange the holders of Series A Preferred Stock were issued 657,383 if-converted shares of common stock at the closing stock price of $2.20 and these were recorded as a liability and marked to market at December 31, 2019 at a price of $3.22.
Series B-1 Preferred Stock - Additional 6% Warrants (recurring) - The Additional 6% Warrants are issuable if the Company fails to meet certain Adjusted EBITDA thresholds on a trailing twelve-month basis from May 31, 2020 through April 30, 2021. The Company recorded the Additional 6% Warrants at fair value, which was estimated using a Monte Carlo Simulation based on certain significant unobservable inputs, such as a risk rate premium, Adjusted EBITDA volatility, stock price volatility and projected Adjusted EBITDA for the Company for 2019. The Additional 6% Warrants were recorded as a liability.
Rights offering - The Company is currently conducting a rights offering and each shareholder as of the record date was issued a right to purchase Series B Preferred Stock and 34.38 warrants. The right that was issued was fair valued using a Black-Scholes model based on certain significant unobservable inputs, such as a risk rate premium, stock price volatility, dividend yield and expected term of rights offering. The right offering fair value was recorded as a liability and was a deemed dividend to common stockholders and reflected as a reduction in additional paid in capital.
2019 Commitment and 2020 Commitment - The Company used a probability weighted assumption to value the 2019 and 2020 Commitment. The probability of the Company having to take the 2019 or 2020 Commitment was low and the fair value was immaterial. These were not recorded as liabilities as of December 31, 2019.
Other financial instruments of the Company not listed in the table above primarily consist of cash and cash equivalents, accounts receivable, accounts payable and other current liabilities that approximate their fair values, based on the nature and short maturity of these instruments, and they are presented in the Company's consolidated balance sheets at carrying cost. Additionally, management believes that the carrying value of the Company's outstanding debt balances, further discussed in Note 8. Debt, approximate fair value due to their floating interest rates.
78
Note 8. Debt
Debt consists of the following obligations as of:
December 31, | |||||||
(in thousands) | 2019 | 2018 | |||||
Term loan | $ | 182,687 | $ | 300,000 | |||
Line of credit | — | 46,500 | |||||
Commercial equipment notes | 4,456 | 5,341 | |||||
Total principal due for long-term debt | 187,143 | 351,841 | |||||
Unamortized debt discount and issuance costs | (22,296 | ) | (23,534 | ) | |||
Less: Current portion of long-term debt | (1,946 | ) | (32,580 | ) | |||
Long-term debt, less current portion | $ | 162,901 | $ | 295,727 | |||
Debt - Series B Preferred Stock | 180,444 | — | |||||
Unamortized debt discount and issuance costs | (14,303 | ) | — | ||||
Long-term Series B Preferred Stock | 166,141 | — | |||||
Merger Credit Facility
In conjunction with the completion of the Merger, IEA Services refinanced its prior credit facility with a new facility that provided for aggregate revolving borrowings of up to $50.0 million and a $50.0 million delayed draw term loan facility. Upon closing of the acquisition of CCS in September 2018, the outstanding borrowings under this Merger credit facility of $53.5 million were repaid, plus accrued and unpaid interest, using proceeds from the new credit facility described below, and the Merger credit facility was terminated. The Company recognized a $1.8 million loss on extinguishment of debt upon this termination, primarily due to the write-off of the unamortized debt issuance costs and discount for this facility as of such date, which is reflected within other expense in the consolidated statement of operations for the year ended December 31, 2018.
Acquisition Credit Facility
At closing of the CCS acquisition, IEA Services entered into a credit agreement for a new credit facility, which was amended and restated in connection with the closing of the William Charles acquisition, and was further amended and restated on November 16, 2018 (as amended and restated, the “A&R Credit Agreement”). The A&R Credit Agreement provides for a term loan facility of $300.0 million and a revolving line of credit of $50.0 million, which is available for revolving loans and letters of credit. Availability on the line of credit is subject to customary borrowing base calculations.
On September 25, 2018, $200.0 million was drawn on the term loan facility and $20.5 million was drawn on the line of credit to pay the CCS acquisition consideration, repay borrowings under the Merger credit facility and repay certain assumed indebtedness of Saiia and the ACC Companies. The remaining $100.0 million was drawn on the term loan facility on November 2, 2018 to pay the cash portion of the William Charles acquisition consideration and to repay certain assumed indebtedness of William Charles, and an additional $26.0 million of revolving loans were drawn in the third and fourth quarter of 2018, to be used for working capital and other general corporate purposes, for total outstanding revolving loans of $46.5 million as of December 31, 2018. The Company capitalized $24.5 million of financing fees that were incurred to obtain this new credit facility.
Third Amended and Restated Credit Agreement
On May 20, 2019, the Third Amended and Restated Credit and Guarantee Agreement (the “Third A&R Credit Agreement”) became effective.
Term loan borrowings mature on September 25, 2024 and are subject to quarterly amortization of principal, commencing on the last day of the first quarter of 2019, in an amount equal to 2.5% of the aggregate principal amount of such loans. Beginning with 2020, an additional annual payment is required equal to 75% of Excess Cash Flow (as defined in the “Third A&R Credit Agreement”) for the preceding fiscal year if such Excess Cash Flow is greater than $2.5 million, with the percentage of Excess Cash Flow subject to reduction based upon the Company’s consolidated leverage ratio.
79
Borrowings under the term loan are required to be repaid on the last business day of each March, June, September and December, continuing with the first fiscal quarter following the effective date of the Third A&R Credit Agreement, in an amount equal to 2.5% of the initial balance of the initial term loan and will not be able to be reborrowed. Borrowings under the revolving line of credit mature on September 25, 2023.
Interest on the consenting lender term loan tranche accrues at a per annum interest rate of, at the Company's option, (x) LIBOR plus a margin of 8.25% or (y) an alternate base rate plus a margin of 7.25%; provided however, that upon achieving a First Lien Net Leverage Ratio (as defined below) of no greater than 2.67:1.00, the margin shall permanently step down to (y) for LIBOR loans, 6.75% and (y) for alternative base rate loans, 5.75%. Interest on the non-consenting lender term loan tranche will stay at a per annum interest rate of (x) Libor plus a margin of 6.25% or (y) an alternate base rate plus a margin of 5.25%. Interest on initial revolving facility borrowings and swing line loans accrues at a rate of, at the Company's option, (x) Libor plus a margin of 4.25% or (y) the applicable base rate plus a margin of 3.25%. The weighted average interest rate on borrowings under this credit facility as of December 31, 2019 and 2018, was 10.35% and 8.82%, respectively.
Obligations under this credit facility are guaranteed by Infrastructure and Energy Alternatives, Inc., Holdings and each existing and future, direct and indirect, wholly-owned, material domestic subsidiary of Infrastructure and Energy Alternatives, Inc. other than IEA Services (together with IEA Services, the “Credit Parties”), and are secured by all of the present and future assets of the Credit Parties, subject to customary carve-outs.
Debt Covenants
The terms of the Third A&R Credit Agreement include customary affirmative and negative covenants and provide for customary events of default, which include, among others, nonpayment of principal or interest and failure to timely deliver financial statements. Under the Third A&R Credit Agreement, the financial covenant to which the Credit Parties as defined therein are subject provides that the First Lien Net Leverage Ratio (as defined therein) may not exceed (i) prior to the fiscal quarter ending December 31, 2019, 4.75:1.0, (ii) from and after the fiscal quarter ending December 31, 2020, 3.50:1.0, (iii) from an prior to the fiscal quarter ending December 31, 2021, 2.75:1.0, and (iv) from an after March 31, 2022, 2.25:1.0. Under the Third A&R Credit Agreement, the Company is not to obtain an equity infusion to cure for any covenant violations for fiscal quarter ending in 2019, excluding the Series B Preferred Stock. Thereafter, the Company will have access to a customary equity cure.
The Third A&R Credit Agreement also includes certain limitations on the payment of cash dividends on the Company's common shares and provides for other restrictions on (subject to certain exceptions) liens, indebtedness (including guarantees and other contingent obligations), investments (including loans, advances and acquisitions), mergers and other fundamental changes and sales and other dispositions of property or assets, among others.
Contractual Maturities
Contractual maturities of the Company's outstanding principal on debt obligations as of December 31, 2019 are as follows:
(in thousands) | Maturities | ||
2020 | $ | 1,946 | |
2021 | 1,211 | ||
2022 | 783 | ||
2023 | 536 | ||
2024 | 182,667 | ||
Thereafter | — | ||
Total | $ | 187,143 | |
Letters of Credit and Surety Bonds
In the ordinary course of business, the Company is required to post letters of credit and surety bonds to customers in support of performance under certain contracts. Such letters of credit are generally issued by a bank or similar financial institution. The letter of credit or surety bond commits the issuer to pay specified amounts to the holder of the letter of credit or surety bond under certain conditions. If the letter of credit or surety bond issuer were required to pay any amount to a holder, the Company would be required to reimburse the issuer, which, depending upon the circumstances, could result in a charge to
80
earnings. As of December 31, 2019 and 2018, the Company was contingently liable under letters of credit issued under its respective revolving lines of credit in the amount of $21.0 million and $3.0 million, respectively, related to projects. In addition, as of December 31, 2019 and 2018, the Company had outstanding surety bonds on projects of $2.4 billion and $1.7 billion, respectively.
Note 9. Commitments and Contingencies
In the ordinary course of business, the Company enters into agreements that provide financing for machinery and equipment and for other of its facility, vehicle and equipment needs. The Company reviews all arrangements for potential leases, and at inception, determines whether a lease is an operating or finance lease. Lease assets and liabilities, which generally represent the present value of future minimum lease payments over the term of the lease, are recognized as of the commencement date. Under Topic 842, leases with an initial lease term of twelve months or less are classified as short-term leases and are not recognized in the consolidated balance sheets unless the lease contains a purchase option that is reasonably certain to be exercised.
Lease term, discount rate, variable lease costs and future minimum lease payment determinations require the use of judgment, and are based on the facts and circumstances related to the specific lease. Lease terms are generally based on their initial non-cancelable terms, unless there is a renewal option that is reasonably certain to be exercised. Various factors, including economic incentives, intent, past history and business need are considered to determine if a renewal option is reasonably certain to be exercised. The implicit rate in a lease agreement is used when it can be determined. Otherwise, the incremental borrowing rate, which is based on information available as of the lease commencement date, including applicable lease terms and the current economic environment, is used to determine the value of the lease obligation.
The Company has obligations, exclusive of associated interest, recognized under various finance leases for equipment totaling $64.2 million and $63.5 million at December 31, 2019 and 2018, respectively. Gross amounts recognized within property, plant and equipment, net in the consolidated balance sheets under these finance lease agreements at December 31, 2019 and 2018 totaled $116.1 million and $76.9 million, less accumulated depreciation of $34.0 million and $10.1 million, respectively, for net balances of $82.1 million and $66.8 million. Depreciation of assets held under the finance leases is included within cost of revenue in the consolidated statements of operations.
The future minimum payments of finance lease obligations are as follows:
(in thousands) | |||
2020 | $ | 25,966 | |
2021 | 22,000 | ||
2022 | 17,935 | ||
2023 | 3,486 | ||
2024 | — | ||
Thereafter | — | ||
Future minimum lease payments | 69,387 | ||
Less: Amount representing interest | 5,149 | ||
Present value of minimum lease payments | 64,238 | ||
Less: Current portion of finance lease obligations | 23,183 | ||
Finance lease obligations, less current portion | $ | 41,055 | |
Operating Leases
In the ordinary course of business, the Company enters into non-cancelable operating leases for certain of its facility, vehicle and equipment needs, including a related party lease (see Note 15. Related Parties). Rent and related expense for operating leases that have non-cancelable terms totaled approximately $9.9 million, $6.1 million and $1.6 million for the years ended December 31, 2019, 2018 and 2017, respectively. If the operating lease expense is related to projects it is charged to that specific project and included in cost of revenue. In addition, the Company has short-term equipment rentals, which are less than a year in duration and expense as incurred.
The Company has long-term power-by-the-hour equipment rental agreements, included in non-cancelable operating lease expense above, with a construction equipment manufacturer that have a guaranteed minimum monthly hour requirement.
81
The minimum guaranteed amount based on the Company's current operations is $3.2 million per year. Total expense under these agreements was $4.4 million for the year ended December 31, 2019.
The future minimum payments under non-cancelable operating leases are as follows:
(in thousands) | |||
2020 | $ | 12,308 | |
2021 | 10,353 | ||
2022 | 8,149 | ||
2023 | 5,697 | ||
2024 | 2,982 | ||
Thereafter | 20,461 | ||
Future minimum lease payments | 59,950 | ||
Less: Amount representing interest | 15,750 | ||
Present value of minimum lease payments | 44,200 | ||
Less: Current portion of operating lease obligations | 9,628 | ||
Operating lease obligations, less current portion | $ | 34,572 | |
Lease Information
For the year ended | |||
December 31, 2019 | |||
Finance Lease cost: | |||
Amortization of right-of-use assets | 22,609 | ||
Interest on lease liabilities | 5,480 | ||
Operating lease cost | 9,871 | ||
Short-term lease cost | 46,540 | ||
Variable lease cost | 4,361 | ||
Sublease Income | (103 | ) | |
Total lease cost | $ | 88,758 | |
Other information: | |||
Cash paid for amounts included in the measurement of lease liabilities | |||
Operating cash flows from finance leases | $ | 5,480 | |
Operating cash flows from operating leases | $ | 17,061 | |
Financing cash flows from finance leases | $ | 22,850 | |
Right-of-use assets obtained in exchange for new finance lease liabilities | $ | 2,018 | |
Right-of-use assets obtained in exchange for new operating lease liabilities | $ | 28,498 | |
Weighted-average remaining lease term - finance leases | 2.85 years | ||
Weighted-average remaining lease term - operating leases | 8.24 years | ||
Weighted-average discount rate - finance leases | 6.60 | % | |
Weighted-average discount rate - operating leases | 6.93 | % | |
82
Deferred Compensation
The Company has two deferred compensation plans. The first plan is a supplemental executive retirement plan established in 1993 that covers four specific employees or former employees, whose deferred compensation is determined by the number of service years. Payment of the benefits is to be made for 20 years after employment ends. Two former employees are currently receiving benefits, and two participants are still employees of the Company. The two current employees have both reached the full benefit level, and as a result, the present value of the liability is estimated using the normal retirement method. Payments under this plan for 2019 were $0.1 million. Maximum aggregate payments per year if all participants were retired would be $0.3 million. As of December 31, 2019 and 2018, the Company had a long-term liability of $4.3 million and $3.2 million, respectively, for the supplemental executive retirement plan.
The Company offers a non-qualified deferred compensation plan which is made up of an executive excess plan and an incentive bonus plan. This plan was designed and implemented to enhance employee savings and retirement accumulation on a tax-advantaged basis, beyond the limits of traditional qualified retirement plans. This plan allows employees to: (i) defer annual compensation from multiple sources; (ii) create wealth through tax-deferred investments; (iii) save and invest on a pretax basis to meet accumulation and retirement planning needs; and (iv) utilize a diverse choice of investment options to maximize returns. Executive awards are expensed when vested. Project Management Incentive Payments are expensed when awarded as they are earned through the course of the performance of the project to which they are related. Other incentive payments are expensed when vested as they are considered to be earned by retention. Unrecognized compensation expense for the non-qualified deferred compensation plan at December 31, 2019, 2018 and 2017 was $1.5 million, $2.2 million and $1.3 million, respectively. As of December 31, 2019 and 2018, the Company had a long-term liability of $3.7 million and $3.0 million, respectively, for deferred compensation to certain current and former employees.
Legal Proceedings
The Company is involved in a variety of legal cases, claims and other disputes that arise from time to time in the ordinary course of its business. While the Company believes it has good defense against these cases and intends to defend them vigorously, it cannot provide assurance that it will be successful in recovering all or any of the potential damages it has claimed or in defending claims against the Company. While the lawsuits and claims are asserted for amounts that may be material, should an unfavorable outcome occur, management does not currently expect that any currently pending matters will have a material adverse effect on the Company’s financial position, results of operations or cash flows. However, an unfavorable resolution of one or more of such matters could have a material adverse effect on the Company's business, financial condition, results of operations and cash flows.
Note 10. Earnings (Loss) Per Share
The Company calculates basic earnings (loss) per share (“EPS”) by dividing income (loss) available to common stockholders by the weighted average number of common shares outstanding during the period.
Subsequent to the issuance of the Company's condensed consolidated financial statements for the three and six months ended June 30, 2019, the Company identified a computational error related to the number of outstanding common shares included in its earnings (loss) per share calculations during 2018 and 2019. Management has concluded that the impact of this error on all historical periods is immaterial and therefore has not adjusted the earnings (loss) per share amounts for any periods prior to September 30, 2019. Rather, the adjustment to remove 1.8 million unvested shares has been made beginning with the three- and nine-months ended September 30, 2019. The number of outstanding shares of Common Stock for voting purposes remains at 22.3 million shares, as the aforementioned 1.8 million shares are entitled to vote those shares during the vesting period.
Income (loss) available to common stockholders is computed by deducting the dividends accumulated for the period on cumulative preferred stock from net income. If there is a net loss, the amount of the loss is increased by those preferred dividends. The contingent consideration fair value adjustment is a mark-to-market adjustment based on the Company not reaching the required financial targets for 2018 and 2019. See Note. 7 Fair Value of Financial Instruments for further discussion. The Company is required to reverse the mark-to-market adjustment from the numerator as shown below.
Diluted EPS assumes the dilutive effect of (i) contingently issuable earn-out shares, (ii) Series A cumulative convertible preferred stock, using the if-converted method, and (iii) the assumed exercise of in-the-money stock options and warrants and the assumed vesting of outstanding RSUs, using the treasury stock method.
83
Whether the Company has net income or a net loss determines whether potential issuances of common stock are included in the diluted EPS computation or whether they would be anti-dilutive. As a result, if there is a net loss, diluted EPS is computed in the same manner as basic EPS is computed. Similarly, if the Company has net income but its preferred dividend adjustment made in computing income available to common stockholders results in a net loss available to common stockholders, diluted EPS would be computed in the same manner as basic EPS.
The calculations of basic and diluted EPS, are as follows:
Year Ended December 31, | |||||||||||
($ in thousands, except per share data) | 2019 | 2018 | 2017 | ||||||||
Numerator: | |||||||||||
Net income from continuing operations | $ | 6,231 | $ | 4,244 | $ | 16,525 | |||||
Less: Convertible preferred share dividends | (2,875 | ) | (1,597 | ) | — | ||||||
Less: Contingent consideration fair value adjustment | (23,082 | ) | (46,291 | ) | — | ||||||
Net (loss) income available to common stockholders | $ | (19,726 | ) | $ | (43,644 | ) | $ | 16,525 | |||
Denominator: | |||||||||||
Weighted average common shares outstanding - basic and diluted(1) | 20,431,096 | 21,665,965 | 21,577,650 | ||||||||
Anti-dilutive:(2) | |||||||||||
Convertible preferred shares | 8,816,119 | 3,100.085 | — | ||||||||
Series B Preferred Stock - Warrants at Closing | 2,389,719 | — | — | ||||||||
RSUs | 904,608 | 59.445 | — | ||||||||
Net (loss) income per common share - basic and diluted | $ | (0.97 | ) | $ | (2.01 | ) | $ | 0.77 | |||
———
(1) | The contingent earn-out shares were not included at December 31, 2019 and 2018. See Note 7. Fair Value of Financial of Financial Instruments for discussion regarding the Company's contingently issuable earn-out shares that were not potentially dilutive. |
(2) | As of December 31, 2019 and 2018, there were warrants to purchase 8,480,000 shares of common stock at $11.50 per share but were not potentially dilutive as the warrants’ exercise price was greater than the average market price of the common stock during the period. |
(3) | As of December 31, 2019 and 2018, there were 646,405 and 713,260, of unvested Options and 817,817 and 187,026 of unvested performance RSUs were also not potentially dilutive as the respective exercise price or average stock price required for vesting of such award was greater than the average market price of the common stock during the period. |
The calculation of weighted average common shares outstanding during the periods preceding a reverse recapitalization generally requires the Company to use the capital structure of the entity deemed to be the acquirer for accounting purposes to calculate EPS. However, as a limited liability company, IEA Services had no outstanding common shares prior to the Merger. Therefore, the weighted average common shares outstanding for all comparable prior periods preceding the Merger is based on the capital structure of the acquired company, as management believes that is the most useful measure.
Shares Outstanding | ||
Company (f/k/a M III Acquisition Corp.) shares outstanding as of December 31, 2017 | 19,210,000 | |
Redemption of shares by M III stockholders prior to the Merger | (7,967,165 | ) |
Common shares issued pursuant to Advisor Commitment Agreements, net of forfeited sponsor founder shares | (93,685 | ) |
Shares issued to Infrastructure and Energy Alternatives, LLC/Seller | 10,428,500 | |
IEA shares outstanding as of March 26, 2018 | 21,577,650 | |
At the closing of the Merger, 34,965 shares of Series A convertible preferred stock were issued to the Seller with an initial stated value of $1,000 per share, for total consideration of $35.0 million.
On October 29, 2019, the Company entered into the Preferred Stock Exchange Agreement (the “Exchange Agreement”). Pursuant to the Exchange Agreement, the holder of our Series A Preferred Stock has agreed to exchange half
84
of its total Series A Preferred Stock outstanding into shares of Series B-3 Preferred Stock and Warrants. As of December 31, 2019, the Company has 17,482.5 shares of Series A convertible preferred stock and dividends are paid on the Series A Preferred Stock when declared by our Board. To extent permitted, dividends are required to be paid in cash quarterly in arrears on each March 31, June 30, September 30 and December 31 on the stated value at the following rates:
•6% per annum from the original issuance of the Series A Preferred Stock on March 26, 2018 (the “Closing Date”) until the date (the “18 Month Anniversary Date”) that is 18 months from the Closing Date; and
•10% per annum during the period from and after the 18 Month Anniversary Date;
So long as any shares of Series B Preferred Stock are outstanding or from and after the occurrence of any non-payment event or default event and until cured or waived, the foregoing rates will increase by 2% per annum.
If not paid in cash, dividends will accrue on the stated value and will increase the stated value on and effective as of the applicable dividend date without any further action by the Board at the following rates:
•8% per annum during the period from May 20, 2019 through the 18 Month Anniversary Date; and
•12% per annum during the period from and after the 18 Month Anniversary Date.
For the years ended December 31, 2019 and 2018, the Board declared $2.9 million and $1.6 million, respectively, in dividends to holders of Series A preferred stock.
Note 11. Stock-Based Compensation
The 2011 Profits Interest Unit Incentive Plan (the “2011 Equity Plan”) was terminated upon the closing of the Merger in March 2018 and all equity-based awards, which were granted in the form of profit units of the Seller, were canceled with no such amounts available for future issuance under the 2011 Equity Plan.
In March 2018, the Company adopted the 2018 IEA Equity Incentive Plan (the “2018 Equity Plan”), which provided for 2,157,765 shares to be available for granting to certain officers, directors and employees under the plan. The plan allows for the granting of both RSUs and Options. In June 2019, the Company amended the 2018 Equity Plan to include an additional 2,000,000 shares to be available for granting.
Stock-based compensation cost is measured at the date of grant based on the calculated fair value of the stock-based award and is recognized as expense using the straight-line method over the employee’s requisite service period (generally the vesting period of the award) within selling, general and administrative expenses. The following table provides the components of stock-based compensation expense under the 2018 Equity Plan and the associated tax benefit recognized for the year ended December 31, 2019 and 2018. For the year ended December 31, 2017, the Company recognized $0.1 million of expense under the 2011 Equity Plan.
(in thousands) | 2019 | 2018 | ||||
Options | $ | 825 | $ | 487 | ||
RSUs | 2,193 | 585 | ||||
Directors' compensation | 998 | — | ||||
Stock-based compensation expense | 4,016 | 1,072 | ||||
Tax benefit for stock-based compensation expense | — | — | ||||
Stock-based compensation expense, net of tax | $ | 4,016 | $ | 1,072 | ||
Employee Options
Options are granted with exercise prices equal to market prices on the date of grant and expire 10 years from the date of grant. Options are typically granted to officers and key employees selected by the Compensation Committee of the Board.
85
The following table summarizes all Option activity:
Number of Options | Weighted Average Exercise Price | Aggregate Intrinsic Value (in thousands) | Weighted Average Remaining Contractual Term (in years) | |||||||||
Outstanding at January 1, 2018 | — | $ | — | |||||||||
Granted | 713,260 | 10.37 | ||||||||||
Exercised | — | — | ||||||||||
Forfeited | — | — | ||||||||||
Outstanding at December 31, 2018 | 713,260 | $ | 10.37 | — | — | |||||||
Granted | — | — | ||||||||||
Exercised | — | — | ||||||||||
Forfeited | (66,855 | ) | 10.37 | |||||||||
Outstanding at December 31, 2019 | 646,405 | $ | 10.37 | — | 8.25 | |||||||
Vested or expected to vest at December 31, 2019 | 646,405 | 10.37 | — | 8.25 | ||||||||
Exercisable at December 31, 2019 | 80,806 | 10.37 | — | 8.25 | ||||||||
The Company has a policy of issuing new common shares to satisfy the exercise of Options. As of December 31, 2019, there was $1.9 million of unrecognized stock-based compensation expense for unvested Options, and the expected remaining expense period was 2.25 years.
The weighted average grant-date fair value per share of Options granted in 2018 was $10.37. The Company estimated the fair value of Options issued using the Black-Scholes option pricing model. Expected volatilities were based on the historical volatility of the Company’s stock, peer group and other factors. The Company used historical data to estimate Option exercises and employee terminations within the valuation model. Dividends were based on an estimated dividend yield. The risk-free interest rates used for the periods within the contractual life of the Options were based on the U.S. Treasury rates in effect at the time of the grant. Option valuation models require the input of subjective assumptions including the expected volatility and lives.
The following assumptions were used to value Option grants during 2018:
2018 | ||
Expected dividend yield | — | % |
Expected volatility | 35.00 | % |
Risk-free interest rate | 2.63 | % |
Expected life (in years) | 4.0 | |
Employee RSUs
RSUs are awarded to select employees and, when vested, entitle the holder to receive a specified number of shares of the Company's common stock, including shares resulting from dividend equivalents paid on such RSUs. The value of RSU grants was measured as of the grant date using the closing price of IEA's common stock.
86
The following table summarizes all activity for RSUs awarded to employees during 2019:
Number of RSUs | Weighted Average Grant-Date Fair Value Per Share | |||||
Unvested at January 1, 2018 | — | $ | — | |||
Granted (1) | 449,050 | 10.37 | ||||
Vested | — | — | ||||
Forfeited | — | — | ||||
Unvested at December 31, 2018 | 449,050 | $ | 10.37 | |||
Granted (2) | 1,720,396 | $ | 2.96 | |||
Vested (3) | (42,378 | ) | 10.37 | |||
Forfeited | (47,060 | ) | 8.44 | |||
Unvested at December 31, 2019 | 2,080,008 | $ | 4.27 | |||
(1) Includes 187,026 shares related to performance stock units, where 50% vest upon reaching a stock price of $12.00 and the remaining vest on $14.00.
(2) Includes 648,323 shares related to performance stock units that vest upon reaching 2019 Adjusted EBITDA targets and vest ratable over a three year period.
(3) The tax benefit related to vestings that occurred during 2019 was $0.1 million. There was no tax benefit during 2018.
As of December 31, 2019, there was $6.2 million of unrecognized stock-based compensation expense for unvested RSUs awarded to employees, and the expected remaining expense period was 2.75 years.
Non-employee Director RSUs
For service in 2019, the non-employee directors of the Board were granted 105,595 RSUs on December 31, 2019, valued at $0.6 million. These RSUs will vest on March 26, 2020. The value of RSU grants was measured as of the grant date using the closing price of IEA's common stock. As of December 31, 2019, there was $0.2 million of unrecognized stock-based compensation expense for unvested non-employee director RSUs, and the expected remaining expense period was 3 months.
87
Note 12. Income Taxes
The Company is a corporation that is subject to U.S. federal income tax, various state income taxes, Canadian federal taxes and provincial taxes.
(Loss) income before income taxes and the related tax (benefit) provision are as follows:
Year ended December 31, | |||||||||||
(in thousands) | 2019 | 2018 | 2017 | ||||||||
(Loss) income before income taxes: | |||||||||||
U.S operations | $ | 6,374 | $ | (7,955 | ) | $ | 29,313 | ||||
Non-U.S. operations | (1,764 | ) | (743 | ) | 1,075 | ||||||
Total (loss) income before taxes | $ | 4,610 | $ | (8,698 | ) | $ | 30,388 | ||||
Current (benefit) provision: | |||||||||||
Federal | $ | (148 | ) | $ | (23 | ) | $ | 313 | |||
State | 90 | (902 | ) | 2,099 | |||||||
Total current (benefit) provision | (58 | ) | (925 | ) | 2,412 | ||||||
Deferred (benefit) provision: | |||||||||||
Federal | (1,146 | ) | (10,399 | ) | 11,637 | ||||||
State | (417 | ) | (1,618 | ) | (186 | ) | |||||
Total deferred (benefit) provision | (1,563 | ) | (12,017 | ) | 11,451 | ||||||
Total (benefit) provision for income taxes | $ | (1,621 | ) | $ | (12,942 | ) | $ | 13,863 | |||
A reconciliation of the statutory federal income tax rate to the Company’s effective tax rate from continuing operations is as follows:
Year ended December 31, | ||||||||
2019 | 2018 | 2017 | ||||||
Federal statutory rate | 21.0 | % | 21.0 | % | 34.0 | % | ||
State and local income taxes, net of federal benefits | (7.2 | ) | 26.5 | 3.9 | ||||
Permanent items | (51.2 | ) | 101.1 | 3.8 | ||||
Other | 2.2 | 0.2 | 3.9 | |||||
Effective tax rate | (35.2 | )% | 148.8 | % | 45.6 | % | ||
The permanent differences for the year ended December 31, 2019 primarily consist of a benefit related to contingent consideration fair value adjustments offset by a negative impact of non-deductible interest expenses on the Series B Preferred Stock. The most significant difference between the years ended December 31, 2019 and 2018 relate to these permanent items and state taxes. The differences in the effective tax rate between the years ended December 31, 2018 and 2017 related to the change in the U.S. federal corporate income tax rate as a result of the 2017 Tax Act, the permanent items pertaining to contingent consideration, the Merger, the acquisitions made in 2018, and state taxes.
88
Deferred taxes reflect the tax effects of the differences between the amounts recorded as assets and liabilities for financial statement purposes and the comparable amounts recorded for income tax purposes. Significant components of the deferred tax assets (liabilities) as of December 31, 2019 and 2018, respectively, are as follows:
December 31, | |||||||
(in thousands) | 2019 | 2018 | |||||
Deferred tax assets: | |||||||
Allowance for doubtful accounts | $ | 19 | $ | 15 | |||
Accrued liabilities and deferred compensation | 2,891 | 1,999 | |||||
Alternative minimum tax credit carryforwards | — | 1,069 | |||||
Net operating loss carryforwards | 10,097 | 10,701 | |||||
Transaction costs | 1,767 | 1,695 | |||||
Section 163(j) interest limitation | 6,770 | 2,810 | |||||
Other reserves and accruals | 1,289 | 436 | |||||
Intangible amortization | 864 | — | |||||
Operating lease right of use asset | 11,284 | — | |||||
Less: valuation allowance | — | — | |||||
Total deferred tax assets | 34,981 | 18,725 | |||||
Deferred tax liabilities: | |||||||
Property, plant and equipment | (9,373 | ) | (5,795 | ) | |||
Equipment under capital lease | (577 | ) | (426 | ) | |||
Operating lease liability | (11,126 | ) | — | ||||
Intangibles | — | (949 | ) | ||||
Goodwill | (913 | ) | (340 | ) | |||
Other | — | — | |||||
Total deferred tax liabilities | (21,989 | ) | (7,510 | ) | |||
Net deferred tax asset | $ | 12,992 | $ | 11,215 | |||
The Company assesses the realizability of the deferred tax assets at each balance sheet date based on actual and forecasted operating results in order to determine the proper amount, if any, required for a valuation allowance. The ultimate realization of deferred tax assets is dependent upon the generation of future taxable income during the periods in which those temporary differences become deductible. Management considers the scheduled reversal of deferred tax liabilities (including the impact of available carryback and carryforward periods), projected future taxable income and tax-planning strategies in making this assessment. The Company believes ownership changes have occurred in the past. This may impact the Company's ability to utilize portions of its net operating losses and interest carry forward in future periods. However, it is management’s belief that it is more likely than not that the net deferred tax assets related to the Company will be utilized prior to expiration.
As of December 31, 2019, the Company had a federal net operating loss carryover of $37.0 million and net operating loss carryovers in certain state tax jurisdictions of approximately $37.6 million. An amount of $11.1 million of the federal net operating loss carryover was incurred before 2018 and will begin to expire in 2034. The state net operating loss carryovers will begin to expire in 2025. As of December 31, 2019, the Company has an interest carryforward of $26.0 million. This amount can be carried forward indefinitely.
The Company files income tax returns in U.S. federal, state and certain international jurisdictions. For federal and certain state income tax purposes, the Company's 2017 through 2019 tax years remain open for examination by the tax authorities under the normal statute of limitations. For certain international income tax purposes, the Company’s 2014 through 2019 tax years remain open for examination by the tax authorities under the normal statute of limitations.
89
The Company classifies interest expense and penalties related to unrecognized tax benefits as components of the income tax provision. There were no such interest or penalties recognized in the consolidated statements of operations for the years ended December 31, 2019, 2018 and 2017, and there were no corresponding accruals as of December 31, 2019 and 2018. As of December 31, 2019 and 2018, the Company had not identified any uncertain tax positions for which recognition was required.
Note 13. Employee Benefit Plans
The Company participates in numerous multi-employer pension plans (“MEPPs”) that provide retirement benefits to certain union employees in accordance with various collective bargaining agreements (“CBAs”). As of December 31, 2019, 2018 and 2017, 27%, 26% and 25%, respectively, of the Company’s employees were members of collective bargaining units. As one of many participating employers in these MEPPs, the Company is responsible, with the other participating employers, for any plan underfunding. Contributions to a particular MEPP are established by the applicable collective bargaining agreements; however, required contributions may increase based on the funded status of a MEPP and legal requirements of the Pension Protection Act of 2006, which requires substantially underfunded MEPPs to implement a funding improvement plan (“FIP”) or a rehabilitation plan (“RP”) to improve their funded status. Factors that could impact the funded status of a MEPP include investment performance, changes in the participant demographics, decline in the number of contributing employers, changes in actuarial assumptions and the utilization of extended amortization provisions. If a contributing employer stops contributing to a MEPP, the unfunded obligations of the MEPP may be borne by the remaining contributing employers. Assets contributed to an individual MEPP are pooled with contributions made by other contributing employers; the pooled assets will be used to provide benefits to the Company’s employees and the employees of the other contributing employers.
An FIP or RP requires a particular MEPP to adopt measures to correct its underfunding status. These measures may include, but are not limited to: (a) an increase in the contribution rate as a signatory to the applicable collective bargaining agreement, (b) a reallocation of the contributions already being made by participating employers for various benefits to individuals participating in the MEPP and/or (c) a reduction in the benefits to be paid to future and/or current retirees. In addition, the Pension Protection Act of 2006 requires that a 5% surcharge be levied on employer contributions for the first year commencing shortly after the date the employer receives notice that the MEPP is in critical status and a 10% surcharge on each succeeding year until a collective bargaining agreement is in place with terms and conditions consistent with the RP. The zone status included in the table below is based on information that the Company received from the plan and is certified by the plan’s actuary. Among other factors, plans in the red zone are generally less than 65% funded, plans in the yellow zone are greater than 65% and less than 80% funded, and plans in the green zone are at least 80% funded.
The Company could also be obligated to make payments to MEPPs if the Company either ceases to have an obligation to contribute to the MEPP or significantly reduces its contributions to the MEPP because of a reduction in the number of employees who are covered by the relevant MEPP for various reasons. Due to uncertainty regarding future factors that could trigger a withdrawal liability, as well as the absence of specific information regarding the MEPP’s current financial situation, the Company is unable to determine (a) the amount and timing of any future withdrawal liability, if any, and (b) whether participation in these MEPPs could have a material adverse impact on the Company’s financial condition, results of operations or cash flows.
The nature and diversity of the Company’s business may result in volatility of the amount of contributions to a particular MEPP for any given period. That is because, in any given market, the Company could be working on a significant project and/or projects, which could result in an increase in its direct labor force and a corresponding increase in its contributions to the MEPP(s) dictated by the applicable collective bargaining agreement. When the particular project(s) finishes and is not replaced, the level of direct labor of contributions to a particular MEPP could also be affected by the terms of the collective bargaining agreement, which could require at a particular time, an increase in the contribution rate and/or surcharges.
The following tables list the MEPPs the Company considered individually significant in 2019, 2018 and 2017. The Company considers individually significant to be any plan over 5% of its total contributions to all MEPPs for that year. For the years ended December 31, 2019, 2018 and 2017, these plans represented 51%, 63% and 54% of total dollars contributed by the Company, respectively, and three of 56, six of 55 and four of 52 total plans contributed to by the Company. All of the Company's contributions were less than 5% of the total plan contributions contributed by all participating employers. This information was obtained from the respective plans’ Form 5500 for the most current available filing, which among other things, disclose the names of individual participating employers whose annual contributions account for more than 5% of the
90
aggregate annual amount contributed by all participating employers for a plan year. These dates may not correspond with the Company’s calendar year contributions.
For the year ended December 31, 2019:
MEPP | Federal ID# | PPA Zone Status | FIP/RP Status | 2019 Contributions | Surcharge | Plan Year | Expiration of CBA | |||||||||
Central Pension Fund of the IUOE & Participating Employers | 36-6052390 | Green | No | $ | 3,679 | No | January 2019 | March 2023, March 2020, May 2020, | ||||||||
Midwest Operating Engineers Pension Trust Fund | 36-6140097 | Green | No | 2,673 | No | April 2019 | May 2022 | |||||||||
Central Laborers' Pension Fund | 37-6052379 | Yellow | Implemented | 2,489 | No | December 2018 | April 2021 | |||||||||
Other funds | 8,643 | |||||||||||||||
Total Multiemployer pension plan contributions | $ | 17,484 | ||||||||||||||
For the year ended December 31, 2018:
MEPP | Federal ID# | PPA Zone Status | FIP/RP Status | 2018 Contributions | Surcharge | Plan Year | Expiration of CBA | |||||||||
Central Pension Fund of the IUOE & Participating Employers | 36-6052390 | Green | No | $ | 2,906 | No | January 2018 | April 2019, March 2023, March 2020, May 2020 | ||||||||
Upstate New York Engineers Pension Fund | 15-0614642 | Red | Implemented | 1,100 | No | March 2017 | June 2019 | |||||||||
Central Laborers' Pension Fund | 37-6052379 | Yellow | Implemented | 1,330 | No | January 2018 | April 2021 | |||||||||
Iron Workers Local Union No. 25 Pension Plan | 38-6056780 | Red | Implemented | 998 | No | April 2018 | May 2019 | |||||||||
Operating Engineers' Local 324 Pension Fund | 38-1900637 | Red | Implemented | 840 | No | April 2018 | April 2018 | |||||||||
Laborers National Pension Fund | 75-1280827 | Red | Implemented | 744 | No | 2018 | March 2019 | |||||||||
Other funds | 4,748 | |||||||||||||||
Total Multiemployer pension plan contributions | $ | 12,666 | ||||||||||||||
For the year ended December 31, 2017:
MEPP | Federal ID# | PPA Zone Status | FIP/RP Status | 2017 Contributions | Surcharge | Plan Year | Expiration of CBA | |||||||||
Central Pension Fund of the IUOE & Participating Employers | 36-6052390 | Green | No | $ | 1,646 | No | January 2017 | April 2019, March 2018, May 2018 | ||||||||
Central Laborers' Pension Fund | 37-6052379 | Yellow | Implemented | 839 | No | December 2016 | April 2018 | |||||||||
Upstate New York Engineers Pension Fund | 15-0614642 | Red | Implemented | 597 | No | March 2017 | June 2018 | |||||||||
Iron Workers St. Louis District Council Pension Trust | 43-6052659 | Green | No | 384 | No | October 2016 | April 2017 | |||||||||
Other funds | 2,946 | |||||||||||||||
Total Multiemployer pension plan contributions | $ | 6,412 | ||||||||||||||
The zone status above represents the most recent available information for the respective MEPP, which is 2018 for the plan year ended in 2019, 2017 for the plan year ended in 2018 and 2016 for the plan year ended in 2017.
Note 14. Segments
The Company operated as one reportable segment for 2018 and evaluated the business as a renewable construction company. In late 2018, the Company completed two significant acquisitions that construct projects outside of the renewable market. As of December 31, 2019, we operate our business as two reportable segments: the Renewables segment and the Specialty Civil segment. The 2018 segment presentation has been recast to be consistent with the 2019 segmentation.
91
Each of our reportable segments is comprised of similar business units that specialize in services unique to the respective markets that each segment serves. The classification of revenue and gross profit for segment reporting purposes can at times require judgment on the part of management. Our segments may perform services across industries or perform joint services for customers in multiple industries. To determine reportable segment gross profit, certain allocations, including allocations of shared and indirect costs, such as facility costs, equipment costs and indirect operating expenses, were made based on segment revenue.
Separate measures of the Company’s assets, including capital expenditures and cash flows by reportable segment are not produced or utilized by management to evaluate segment performance. A substantial portion of the Company’s fixed assets are owned by and accounted for in our equipment department, including operating machinery, equipment and vehicles, as well as office equipment, buildings and leasehold improvements, and are used on an interchangeable basis across our reportable segments. As such, for reporting purposes, total under/over absorption of equipment expenses consisting primarily of depreciation is allocated to the Company's two reportable segments based on segment revenue.
The following is a brief description of the Company's reportable segments:
Renewables Segment
The Renewables segment operates throughout the United States and specializes in a range of services that include full EPC project delivery, design, site development, construction, installation and restoration of infrastructure services for the wind and solar industries.
Specialty Civil Segment
The Specialty Civil segment operates throughout the United States and specializes in a range of services that include:
• | Heavy civil construction services such as high-altitude road and bridge construction, specialty paving, industrial maintenance and other local, state and government projects. |
• | Environmental remediation services such as site development, environmental site closure and outsourced contract mining and coal ash management services. |
• | Rail Infrastructure services such as planning, creation and maintenance of infrastructure projects for major railway and intermodal facilities construction. |
Segment Revenue
Revenue by segment was as follows:
For the years ended December 31, | ||||||||||
(in thousands) | 2019 | 2018 | ||||||||
Segment | Revenue | % of Total Revenue | Revenue | % of Total Revenue | ||||||
Renewables | $ | 834,029 | 57.1 | % | $ | 621,628 | 79.8 | % | ||
Specialty Civil | 625,734 | 42.9 | % | 157,715 | 20.2 | % | ||||
Total revenue | $ | 1,459,763 | 100.0 | % | $ | 779,343 | 100.0 | % | ||
92
Segment Gross Profit
Gross profit by segment was as follows:
For the years ended December 31, | ||||||||||
(in thousands) | 2019 | 2018 | ||||||||
Segment | Gross Profit | Gross Profit Margin | Gross Profit | Gross Profit Margin | ||||||
Renewables | 88,309 | 10.6 | % | $ | 16,030 | 2.6 | % | |||
Specialty Civil | 68,708 | 11.0 | % | 15,496 | 9.8 | % | ||||
Total gross profit | $ | 157,017 | 10.8 | % | $ | 31,526 | 4.0 | % | ||
Note 15. Related Parties
Credit Support Fees
The Company had debt facilities and other obligations under surety bonds and stand-by letters of credit under the old credit facility that were guaranteed by the two funds that had majority ownership in the Seller. The Company paid a fee for those guarantees based on the total amount outstanding. The Company expensed $0.2 million and $1.5 million related to these fees during the years ended December 31, 2018 and 2017, respectively. There was no expenses for credit support fees during December 31, 2019.
Clinton Lease Agreement
On October 20, 2017, the ownership of a building and land was transferred from White to Clinton RE Holdings, LLC (Cayman) (“Cayman Holdings”), a directly owned subsidiary of the Seller. White then entered into a lease with Cayman Holdings for use of the building and land. This lease has been classified as an operating lease with monthly payments through 2038. The Company's rent expense related to the lease was $0.7 million, $0.7 million and $0.1 million for the years ended December 31, 2019, 2018 and 2017, respectively.
On October 30, 2019, Cayman Holdings sold the building to a third party that assumed the future payments and terms of the existing lease. The Company will continue to have rent expense related to the lease but it will no longer be with a related party.
Related Party Shareholders
Type of Equity | Holder | Ownership Percentage | |
Series A Preferred, Series A Conversion Warrants and Exchange Warrants, Series B-3 Preferred Stock (exchange agreement) | Infrastructure and Energy Alternatives, LLC | 100 | % |
Series B-1 Preferred Stock, Series A Conversion Warrants, Additional 6% Warrants, Warrants at closing | Ares | 60 | % |
Oaktree Power Opportunities Fund III Delaware, L.P. | 40 | % | |
Rights offering backstop | Ares | 50 | % |
Oaktree Power Opportunities Fund III Delaware, L.P. | 50 | % | |
Series B-2 and B-3 Preferred Stock, Warrants at Closing | Ares | 100 | % |
Note 16. Subsequent Event
On March 4, 2020 we completed the rights offering, and issued and sold 350 shares of Series B-3 Preferred Stock and 12,029 warrants to purchase common stock for aggregate proceeds of $0.4 million, before expense.
93
ITEM 9. CHANGES IN AND DISAGREEMENTS WITH ACCOUNTANTS ON ACCOUNTING AND FINANCIAL DISCLOSURE
None.
ITEM 9A. CONTROLS AND PROCEDURES
Disclosure Controls and Procedures
The Company maintains disclosure controls and procedures that are designed to ensure that information required to be disclosed in the Company’s Exchange Act reports is recorded, processed, summarized and reported within the time periods specified in the SEC’s rules and forms, and that such information is accumulated and communicated to the Company’s management, including its Chief Executive Officer and Chief Financial Officer, as appropriate, to allow timely decisions regarding required disclosure.
As of December 31, 2019, an evaluation was performed under the supervision and with the participation of the Company’s management, including the Chief Executive Officer and Chief Financial Officer, of the effectiveness of the design and operation of the Company’s disclosure controls and procedures. Based on that evaluation, the Company’s management, including the Chief Executive Officer and Chief Financial Officer, concluded that the Company’s disclosure controls and procedures were effective as of December 31, 2019.
Management’s Annual Report on Internal Control over Financial Reporting
Our management is responsible for establishing and maintaining adequate internal control over financial reporting as defined in Rules 13a-15(f) and 15d-15(f) under the Securities Exchange Act of 1934. Our internal control over financial reporting is designed to provide reasonable assurance regarding the reliability of financial reporting and the preparation of financial statements for external purposes in accordance with GAAP and includes those policies and procedures that (1) pertain to the maintenance of records that, in reasonable detail, accurately and fairly reflect the transactions and dispositions of the assets of the Company; (2) provide reasonable assurance that transactions are recorded as necessary to permit preparation of financial statements in accordance with GAAP, and that receipts and expenditures of the Company are being made only in accordance with authorizations of management and directors of the Company; and (3) provide reasonable assurance regarding prevention or timely detection of unauthorized acquisition, use, or disposition of the Company’s assets that could have a material effect on the financial statements.
Because of its inherent limitations, internal control over financial reporting may not prevent or detect misstatements. Also, projections of any evaluation of effectiveness to future periods are subject to the risk that controls may become inadequate because of changes in conditions, or that the degree of compliance with the policies or procedures may deteriorate.
Management has assessed the effectiveness of the Company’s internal control over financial reporting as of December 31, 2019, utilizing the criteria in the Committee of Sponsoring Organizations of the Treadway Commission’s Internal Control-Integrated Framework (2013). Based on its assessment, our management concluded the Company’s internal control over financial reporting was effective as of December 31, 2019.
Independent Registered Public Accounting Firm Report
Deloitte & Touche LLP, the independent registered public accounting firm that audited our consolidated financial statements included in this Annual Report on Form 10-K, has issued a report on our internal control over financial reporting as of December 31, 2019. The report, which expresses an unqualified opinion on the effectiveness of our internal control over financial reporting as of December 31, 2019, is included in “Item 8. Financial Statements and Supplemental Data” under the heading “Report of Independent Registered Public Accounting Firm.”
94
ITEM 9B. OTHER INFORMATION
Letter Agreement
On March 5, 2020, the Company entered into a letter agreement (the “Letter Agreement”) with Peter Moerbeek. The Letter Agreement specifies that Mr. Moerbeek will serve as interim Chief Financial Officer. During service as interim Chief Financial Officer, Mr. Moerbeek will earn an annual base salary of $450,000, and will also receive a housing and vehicle allowance. Mr. Moerbeek will be eligible for an annual cash bonus based on performance as mutually agreed with the Company, and will also participate in the Company’s benefit plans that are generally available to other employees. The foregoing description of the Letter Agreement is qualified in its entirety by reference to the full text of the Letter Agreement, which is filed as Exhibit 10.51 to this Annual Report on Form 10-K and incorporated in this Item 9B by reference.
Separation Agreement and General Release
On March 11, 2020, the Company entered into a Separation Agreement and General Release (the “Release”) with Andrew Layman, the Company’s former Chief Financial Officer. The Release provides that the Company and Mr. Layman separated effective February 20, 2020. The Company will pay the following amounts to Mr. Layman under the Release Agreement (collectively, the “Separation Pay”):
• | Severance pay in the total gross amount of $400,000, minus tax deductions and withholdings in twelve monthly installments, in accordance with the Company’s normal payroll practices; |
• | Mr. Layman’s 2019 annual incentive cash bonus earned during 2019 under the 2019 Annual Incentive Compensation Plan (“AICP”) in the lump sum amount of $302,180.00, which amount shall be paid at the same time as the other 2019 AICP awards are paid to Company employees; and |
• | The annual incentive cash bonus that otherwise would have been payable to Employee for 2020 in the lump sum amount of $36,427.00. |
Payment of the Separation Pay is conditional on expiration of a seven day revocation period. In addition to the amounts set forth above, the Company will accelerate vesting of 13,113 options held by Mr. Layman to March 10, 2020, which were originally scheduled to vest on March 26, 2020. Mr. Layman will also retain 6,887 restricted stock units scheduled to vest on March 26, 2020. All remaining unvested incentive awards are forfeited and cancelled. Mr. Layman is also entitled to certain continuing medical, dental and vision benefits as specified in the Release.
The Release provides for a general release of claims by Mr. Layman and the Company. Mr. Layman has reaffirmed certain non-competition, non-solicitation, non-disclosure and other obligations in his employment agreement; provided, however, that the Release amends the duration of the non-competition obligations from eighteen months to twelve months.
The foregoing description of the Release is qualified in its entirety by reference to the full text of the Release, which is filed as Exhibit 10.52 to this Annual Report on Form 10-K and incorporated in this Item 9B by reference.
95
PART III
Certain information required by Part III is omitted from this Annual Report on Form 10-K because the registrant will file with the U.S. Securities and Exchange Commission a definitive proxy statement pursuant to Regulation 14A in connection with the solicitation of proxies for the Company's annual meeting of shareholders (the “2020 Proxy Statement”) within 120 days after the end of the fiscal year covered by this Annual Report on Form 10-K, and certain information included therein is incorporated herein by reference.
ITEM 10. DIRECTORS, EXECUTIVE OFFICERS AND CORPORATE GOVERNANCE
The information required under this Item 10 is incorporated by reference to our 2020 Proxy Statement.
ITEM 11. EXECUTIVE COMPENSATION
The information required under this Item 11 is incorporated by reference to our 2020 Proxy Statement.
ITEM 12. SECURITY OWNERSHIP OF CERTAIN BENEFICIAL OWNERS AND MANAGEMENT AND RELATED SHAREHOLDER MATTERS
The information required under this Item 12 is incorporated by reference to our 2020 Proxy Statement.
ITEM 13. CERTAIN RELATIONSHIPS AND RELATED TRANSACTIONS, AND DIRECTOR INDEPENDENCE
The information required under this Item 13 is incorporated by reference to our 2020 Proxy Statement.
ITEM 14. PRINCIPAL ACCOUNTING FEES AND SERVICES
The information required under this Item 14 is incorporated by reference to our 2020 Proxy Statement.
96
PART IV
ITEM 15. EXHIBITS AND FINANCIAL STATEMENT SCHEDULES
(A) The Company has filed the following documents as part of this Annual Report on Form 10-K:
1. | Financial Statements - the Company's consolidated financial statements, notes to those consolidated financial statements and the report of the Company's independent registered public accounting firm related to the consolidated financial statements are set forth under Item 8. Financial Statements and Supplementary Data. |
2. | Financial Statement Schedules - All schedules are omitted because they are not applicable, not required, or the information is included in the consolidated financial statements. |
3. | Exhibits - see below. |
The following is a complete list of exhibits filed as part of this Annual Report on Form 10-K, some of which are incorporated herein by reference from certain other of the Company's reports, registration statements and other filings with the SEC, as referenced below:
Exhibit Number | Description | |
2.1# | ||
2.2 | ||
2.3 | ||
2.4 | ||
2.5 | ||
2.6 | ||
97
2.7 | ||
2.8# | ||
2.9 | ||
3.1 | ||
3.2 | ||
3.3 | ||
3.4 | ||
3.5 | ||
3.6 | ||
3.7 | ||
3.8 | ||
3.9 | ||
3.10 | ||
4.1 | ||
4.2 | ||
4.3 | ||
4.4 | ||
4.5 | ||
4.6 | ||
98
4.7 | ||
4.8 | ||
4.9 | ||
4.10 | ||
4.11 | ||
4.12 | ||
4.13 | ||
10.1 | ||
10.2 | ||
10.3 | ||
10.4 | ||
10.5 | ||
10.6 | ||
10.7 | ||
10.8 | ||
99
10.9 | ||
10.10 | ||
10.11 | ||
10.12 | ||
10.13 | ||
10.14 | ||
10.15 | ||
10.16 | ||
10.17 | ||
10.18 | ||
10.19# | ||
10.20# | ||
10.21# | ||
100
10.22†^ | ||
10.23 | ||
10.24† | ||
10.25† | ||
10.26† | ||
10.27† | ||
10.28† | ||
10.29† | ||
10.30 | ||
10.31† | ||
10.32† | ||
10.33† | ||
10.34*† | ||
10.35† | ||
10.36 | ||
10.37 | ||
10.38 | ||
101
10.39 | ||
10.40 | ||
10.41 | ||
10.42 | ||
10.43 | ||
10.44 | ||
10.45 | ||
10.46 | ||
10.47 | ||
10.48 | ||
10.49 | ||
10.50 | ||
10.51*† | ||
10.52*† | ||
102
16.1 | ||
21.1* | ||
23.1* | ||
23.2* | ||
31.1* | ||
31.2* | ||
32.1** | ||
32.2** | ||
101.INS* | XBRL Instance Document | |
101.SCH* | XBRL Taxonomy Extension Schema Document | |
101.CAL* | XBRL Taxonomy Extension Calculation Linkbase Document | |
101.DEF* | XBRL Taxonomy Extension Definition Linkbase Document | |
101.LAB* | XBRL Taxonomy Extension Label Linkbase Document | |
101.PRE* | XBRL Taxonomy Extension Presentation Linkbase Document | |
*Filed herewith.
**Furnished herewith
# Schedules have been omitted pursuant to Item 601(b)(2) of Regulation S-K. We will furnish the omitted schedules to the Securities and Exchange Commission upon request by the Commission.
† Indicates a management contract or compensatory plan or arrangement.
^ We have entered into Indemnification Agreements with all of our executive officers and directors.
ITEM 16. FORM 10-K SUMMARY
Not applicable.
103
SIGNATURES
Pursuant to the requirements of Section 13 or 15(d) of the Securities Exchange Act of 1934, the registrant has duly caused this report to be signed on its behalf by the undersigned, thereunto duly authorized.
INFRASTRUCTURE AND ENERGY ALTERNATIVES, INC. (Registrant) | ||
Dated: March 11, 2020 | By: | /s/ JP Roehm |
Name: JP Roehm | ||
Title: President and Chief Executive Officer | ||
Pursuant to the requirements of the Securities Exchange Act of 1934, this report has been signed below by the following persons on behalf of the registrant and in the capacities and on the dates indicated.
Signature | Title | Date | |||
By: | /s/ JP Roehm | President, Chief Executive Officer and Director | March 11, 2020 | ||
Name: JP Roehm | (Principal executive officer) | ||||
By: | /s/ Peter J. Moerbeek | Chief Financial Officer | March 11, 2020 | ||
Name: Peter J. Moerbeek | (Principal financial officer) | ||||
By: | /s/ Bharat Shah | Chief Accounting Officer | March 11, 2020 | ||
Name: Bharat Shah | (Principal accounting officer) | ||||
By: | /s/ Derek Glanvill | Director and Chairman | March 11, 2020 | ||
Name: Derek Glanvill | |||||
By: | /s/ Peter Jonna | Director | March 11, 2020 | ||
Name: Peter Jonna | |||||
By: | /s/ Charles Garner | Director | March 11, 2020 | ||
Name: Charles Garner | |||||
By: | /s/ Terence Montgomery | Director | March 11, 2020 | ||
Name: Terence Montgomery | |||||
By: | /s/ Matthew Underwood | Director | March 11, 2020 | ||
Name: Matthew Underwood | |||||
By: | /s/ John Eber | Director | March 11, 2020 | ||
Name: John Eber | |||||
104