Attached files
| file | filename |
|---|---|
| EX-32.1 - EXHIBIT 32.1 - Business First Bancshares, Inc. | ex_173725.htm |
| EX-31.2 - EXHIBIT 31.2 - Business First Bancshares, Inc. | ex_173724.htm |
| EX-31.1 - EXHIBIT 31.1 - Business First Bancshares, Inc. | ex_173723.htm |
| EX-21.1 - EXHIBIT 21.1 - Business First Bancshares, Inc. | ex_173722.htm |
UNITED STATES
SECURITIES AND EXCHANGE COMMISSION
Washington, D.C. 20549
FORM 10-K
(Mark One)
|
☒ |
ANNUAL REPORT PURSUANT TO SECTION 13 OR 15(d) OF THE SECURITIES EXCHANGE ACT OF 1934 |
For the fiscal year ended December 31, 2019
or
|
☐ |
TRANSITION REPORT PURSUANT TO SECTION 13 OR 15(d) OF THE SECURITIES EXCHANGE ACT OF 1934 |
For the transition period from to
Commission file number: 001-38447
BUSINESS FIRST BANCSHARES, INC.
(Exact name of registrant as specified in its charter)
|
Louisiana |
20-5340628 |
|
|
(State or other jurisdiction of incorporation or organization) |
(I.R.S. Employer Identification Number) |
|
|
500 Laurel Street, Suite 101 |
70801 |
|
|
(Address of principal executive offices) |
(Zip code) |
|
|
(225) 248-7600 (Registrant’s telephone number, including area code) |
||
Securities registered under Section 12(b) of the Exchange Act:
|
Title of each class |
Trading Symbol(s) |
Name of each exchange on which registered |
|
Common Stock, par value $1.00 per share |
BFST |
Nasdaq Global Select Market |
Securities registered under Section 12(g) of the Exchange Act: None
|
Indicate by check mark if the registrant is a well-known seasoned issuer, as defined in Rule 405 of the Securities Act. |
Yes ☐ No ☒ |
|||
|
Indicate by check mark if the registrant is not required to file reports pursuant to Section 13 or Section 15(d) of the Act. |
Yes ☐ No ☒ |
|||
|
Indicate by check mark whether the registrant: (1) has filed all reports required to be filed by Section 13 or 15(d) of the Securities Exchange Act of 1934 during the preceding 12 months, and (2) has been subject to such filing requirements for the past 90 days. |
Yes ☒ No ☐ |
|||
|
Indicate by check mark whether the registrant has submitted electronically every Interactive Date File required to be submitted pursuant to Rule 405 of Regulation S-T (§232.405 of this chapter) during the preceding 12 months (or for such shorter period that the registrant was required to submit such files). |
Yes ☒ No ☐ |
|||
| Indicate by check mark whether the registrant is a large accelerated filer, an accelerated filer, a non-accelerated filer, smaller reporting company, or an emerging growth company. See the definitions of “large accelerated filer,” “accelerated filer,” “smaller reporting company,” and “emerging growth company” in Rule 12b-2 of the Exchange Act. |
| Large accelerated filer | ☐ | Accelerated filer | ☒ | |
| Non-accelerated filer | ☐ | Smaller reporting company | ☒ | |
| Emerging growth company | ☒ |
|
If an emerging growth company, indicate by a check mark if the registrant has elected not to use the extended transition period for complying with any new or revised financial accounting standards provided pursuant to Section 13(a) of the Exchange Act. |
☒ |
|
Indicate by check mark whether the registrant is a shell company (as defined in Rule 12b-2 of the Act). |
Yes ☐ No ☒ |
The aggregate market value of the shares of common stock held by non-affiliates based on the closing price of the common stock on the Nasdaq Global Select Market on June 30, 2019, the last day of the Registrant’s most recently completed second fiscal quarter, was approximately $323.0 million.
As of March 4, 2020, there were 13,437,633 outstanding shares of the registrant’s common stock, $1.00 par value per share.
Document Incorporated By Reference:
Portions of the registrant’s Definitive Proxy Statement relating to the 2020 Annual Meeting of Shareholders are incorporated by reference in Part III of this Annual Report on Form 10-K to the extent stated herein. Such Definitive Proxy Statement will be filed with the Securities and Exchange Commission within 120 days after the end of the registrant’s fiscal year ended December 31, 2019.
table of contents
|
ITEM 1. |
3 |
|
|
ITEM 1A. |
21 |
|
|
ITEM 1B. |
43 |
|
|
ITEM 2. |
43 |
|
|
ITEM 3. |
43 |
|
|
ITEM 4. |
43 |
|
|
ITEM 5. |
44 |
|
|
ITEM 6. |
47 |
|
|
ITEM 7. |
Management’s Discussion and Analysis of Financial Condition and Results of Operations |
47 |
|
ITEM 7A. |
78 |
|
|
ITEM 8. |
79 |
|
|
ITEM 9. |
Changes in and Disagreements with Accountants on Accounting and Financial Disclosures |
126 |
|
ITEM 9A. |
126 |
|
|
ITEM 9B. |
126 |
|
|
ITEM 10. |
127 |
|
|
ITEM 11. |
127 |
|
|
ITEM 12. |
Security Ownership of Certain Beneficial Owners and Management and Related Shareholder Matters |
127 |
|
ITEM 13. |
Certain Relationships and Related Transactions, and Director Independence |
127 |
|
ITEM 14. |
127 |
|
|
ITEM 15. |
128 |
|
|
ITEM 16. |
130 |
|
| 131 |
Important Notice about Information in this Annual Report on Form 10-K
When we refer in this Report to “we,” “our,” “us,” “Business First” and the “Company,” we are referring to Business First Bancshares, Inc. and its consolidated subsidiaries, including b1BANK, formerly known as Business First Bank, which we sometimes refer to as “the Bank”, unless the context indicates otherwise.
The information contained in this Annual Report on Form 10-K is accurate only as of the date of this annual report and as of the dates specified herein.
FORWARD LOOKING STATEMENTS
This Annual Report on Form 10-K, or the “Report,” contains forward-looking statements within the meaning of Section 27A of the Securities Act of 1933 (the “Securities Act”) and 21E of the Securities Exchange Act of 1934 (the “Exchange Act”). These forward-looking statements include statements that reflect the current views of our senior management with respect to our financial performance and future events with respect to our business and the banking industry in general, including, without limitation, statements relating to the anticipated benefits of our recently completed acquisitions of Minden Bancorp, Inc. and its subsidiary, MBL Bank, and Richland State Bancorp, Inc. and its subsidiary, Richland State Bank. These statements are often, but not always, made through the use of words or phrases such as “may,” “should,” “could,” “predict,” “potential,” “believe,” “will likely result,” “expect,” “will continue,” “anticipate,” “seek,” “estimate,” “intend,” “plan,” “projection,” “would” and “outlook,” and similar expressions of a future or forward-looking nature. These statements involve estimates, assumptions and risks and uncertainties. Accordingly, there are or will be important factors that could cause our actual results to differ materially from those indicated in these statements.
We believe these factors include, but are not limited to, the following:
|
● |
risks related to the integration of any acquired businesses, including exposure to potential asset quality and credit quality risks and unknown or contingent liabilities, the time and costs associated with integrating systems, technology platforms, procedures and personnel, the need for additional capital to finance such transactions, and possible failures in realizing the anticipated benefits from acquisitions; |
|
● |
changes in the strength of the United States (“U.S.”) economy in general and the local economy in our local market areas adversely affecting our customers and their ability to transact profitable business with us, including the ability of our borrowers to repay their loans according to their terms or a change in the value of the related collateral; |
|
● |
economic risks posed by our geographic concentration in Louisiana and the Dallas/Fort Worth metroplex; |
|
● |
the ability to sustain and continue our organic loan and deposit growth, and manage that growth effectively; |
|
● |
market declines in industries to which we have exposure, such as the volatility in oil prices and downturn in the energy industry that impact certain of our borrowers and investments that operate within, or are backed by collateral associated with, the energy industry; |
|
● |
volatility and direction of interest rates and market prices, which could reduce our net interest margins, asset valuations and expense expectations; |
|
● |
interest rate risk associated with our business; |
|
● |
changes in the levels of loan prepayments and the resulting effects on the value of our loan portfolio; |
|
● |
increased competition in the financial services industry, particularly from regional and national institutions; |
|
● |
increased credit risk in our assets and increased operating risk caused by a material change in commercial, consumer and/or real estate loans as a percentage of our total loan portfolio; |
|
● |
changes in the value of collateral securing our loans; |
|
● |
deteriorating asset quality and higher loan charge-offs, and the time and effort required to resolve problem assets; |
|
● |
the failure of assumptions underlying the establishment of and provisions made to our allowance for credit losses; |
|
● |
changes in the availability of funds resulting in increased costs or reduced liquidity; |
|
● |
our ability to maintain important deposit customer relationships and our reputation; |
|
● |
a determination or downgrade in the credit quality and credit agency ratings of the securities in our securities portfolio; |
|
● |
increased asset levels and changes in the composition of assets and the resulting impact on our capital levels and regulatory capital ratios; |
|
● |
our ability to prudently manage our growth and execute our strategy; |
|
● |
risks associated with our acquisition and de novo branching strategy; |
|
● |
the loss of senior management or operating personnel and the potential inability to hire qualified personnel at reasonable compensation levels; |
|
● |
legislative or regulatory developments, including changes in the laws, regulations, interpretations or policies relating to financial institutions, accounting, tax, trade, monetary and fiscal matters; |
|
● |
government intervention in the U.S. financial system; |
|
● |
changes in statutes and government regulations or their interpretations applicable to us, including changes in tax requirements and tax rates; |
|
● |
natural disasters and adverse weather, acts of terrorism, an outbreak of hostilities or other international or domestic calamities, epidemics and pandemics such as coronavirus, and other matters beyond our control; and |
|
● |
other risks and uncertainties listed from time to time in our reports and documents filed with the U.S. Securities and Exchange Commission (“SEC”). |
The foregoing factors should not be construed as exhaustive and should be read together with the other cautionary statements included in this Report. If one or more events related to these or other risks or uncertainties materialize, or if our underlying assumptions prove to be incorrect, actual results may differ materially from what we anticipate. Accordingly, you should not place undue reliance on any such forward-looking statements. Any forward-looking statement speaks only as of the date on which it is made and we do not undertake any obligation to update any forward-looking statement or statements to reflect events or circumstances after the date on which such statement is made or to reflect the occurrence of unanticipated events. New factors emerge from time to time, and it is not possible for us to predict which will arise. In addition, we cannot assess the impact of each factor on our business or the extent to which any factor, or combination of factors, may cause actual results to differ materially from those contained in any forward-looking statements.
Part I
ITEM 1. Business.
General
Business First Bancshares, Inc. is a bank holding company headquartered in Baton Rouge, Louisiana, and the parent company of b1BANK, formerly known as Business First Bank, a Louisiana state banking association and community-based financial institution that offers a full array of banking products and services. We currently operate throughout the state of Louisiana and Dallas, Texas, from a network of 26 full-service banking centers.
Since our founding in 2006, our mission has not changed – we seek to be the financial institution of choice for our markets’ small-to-midsized businesses and their owners and employees. To achieve this goal, we focus on recruiting, retaining and empowering talented bankers who are intimately familiar with and well respected in the communities that they serve, and on providing market-leading products and services that add value to our customers’ businesses. We are currently one of the ten largest Louisiana-based financial institutions. As of December 31, 2019, on a consolidated basis, we had total assets of $2.3 billion, total loans of $1.7 billion, total deposits of $1.8 billion and shareholders’ equity of $285.1 million.
During the second quarter of 2018, we listed our common stock on the Nasdaq Global Select Market under the symbol “BFST”.
Our Business Strategy
We believe a bank should be measured by the value it adds to its customers’ businesses. We hold that our customers’ needs are best met through local bankers with deep market experience who are empowered with decision-making authority and supported by centralized risk management practices and advanced technology. We understand our competitive strengths and pursue disciplined growth through the careful selection of markets and our position within those markets. Our expansion strategy primarily consists of identifying and recruiting talented teams of bankers in desirable markets and providing them with a platform to better serve their clients.
We believe there is an area stretching from Dallas, Texas to Jackson, Mississippi, along the I-20 corridor and from Houston, Texas to Mobile, Alabama, along the I-10/12 corridors whose small-to-midsized businesses and high net worth individuals are underserved relative to other parts of the country and are well suited for our commercial and private banking products and services. We intend to leverage our competitive strengths to take advantage of what we believe are significant growth opportunities both within our existing footprint and in this larger region. Our growth strategy includes:
|
● |
Expanding Presence in Existing Markets. While we maintain a strong position in almost all of our markets as one of the top two or three community banks by deposit market share, we are continually working to strengthen our presence in our existing markets. As community bankers, we know that relationships are at the heart of our business, and we are always looking to identify and recruit talented bankers within, as well as outside of, our existing markets. Additionally, we constantly stress deposit growth to our bankers as our ability to grow our loan portfolio within our markets is limited by our ability to fund those loans. Although many of our markets are currently serviced by only one of our banking centers, in keeping with our branch-lite model, we may consider adding more banking centers or complementary offices in strategic locations in our markets. |
|
● |
Opportunistic Market Expansion. We are well positioned to expand along the I-10/12 and I-20 corridors into the nearby Dallas/Fort Worth, Houston, and East Texas markets to the west, and into the Jackson and Gulfport/Biloxi, Mississippi markets to the east. We believe these markets have attractive demographics and a significant concentration of small-to-midsized businesses and high net worth individuals that are historically underserved by the banking industry. We intend to focus on growing into these markets as we identify specific opportunities to recruit talented and entrepreneurial teams of local bankers who fit our culture and banking strategy. Each of our expansions into new markets to date has been accomplished organically. |
|
● |
Disciplined Acquisition Strategy. While we will remain focused on organic expansion, we will continue to identify and evaluate opportunities for strategic business acquisitions as they arise from time to time. We have historically maintained a disciplined and conservative approach to strategic acquisitions, with our only acquisitions to date being the acquisition of American Gateway Financial Corporation within our home market of Baton Rouge in 2015, the acquisition of Minden Bancorp, Inc. within our second oldest market, Northwest Louisiana, on January 1, 2018, and on December 1, 2018, we acquired Richland State Bancorp, Inc. which is in the Northeast Louisiana region, all three of which are described in further detail below. We have also entered into an agreement and plan of reorganization to acquire Pedestal Bancshares, Inc., which operates in southern Louisiana, as discussed below. We will carefully consider acquisition opportunities that we believe are consistent with our strategic vision and provide attractive risk-adjusted returns to our shareholders. |
Acquisition Activity
American Gateway Financial Corporation. On March 31, 2015, we acquired American Gateway Financial Corporation, or AGFC, and its wholly-owned banking subsidiary, American Gateway Bank. Prior to the merger, AGFC operated ten full-service banking locations in the Baton Rouge market. We acquired total assets of $371.5 million, total loans of $143.2 million, and total deposits of $283.3 million in the transaction. The acquisition greatly expanded our branch network within the West Baton Rouge and East Baton Rouge markets and enhanced our core deposit portfolio.
Minden Bancorp, Inc. On October 5, 2017, we entered into a definitive agreement to acquire Minden Bancorp, Inc., or MBI, and its wholly-owned banking subsidiary, MBL Bank. The acquisition was consummated on January 1, 2018. As a result of the transaction, we acquired MBL Bank’s two full-service banking locations in the Shreveport-Bossier City metropolitan area, total assets of $317.4 million, net loans of $192.7 million, and total deposits of $264.0 million. The acquisition expanded our presence in our Northwest Louisiana market and added what we believe to be a strong portfolio of core deposits to our business.
Richland State Bancorp, Inc. On June 4, 2018, we entered into a definitive agreement to acquire Richland State Bancorp, Inc., or RSBI, and its wholly-owned banking subsidiary, Richland State Bank. The acquisition was consummated on December 1, 2018. As a result of the transaction, we acquired Richland State Bank’s banking locations stretching across Louisiana along the I-20 corridor, total assets of $316.4 million, net loans of $190.8 million, and total deposits of $290.0 million. The acquisition expanded our presence in Louisiana by establishing a footprint in the Northeast Louisiana market.
Pedestal Bancshares, Inc. On January 22, 2020, we entered into an agreement and plan of reorganization with Pedestal Bancshares, Inc., the bank holding company with respect to Pedestal Bank, headquartered in Houma, Louisiana. Pedestal Bank operates from 22 branch locations across southern Louisiana.
Our Competitive Strengths
We believe the following competitive strengths differentiate us from our peers and position us for future growth:
|
● |
Sophisticated Business Lending Capabilities. Unlike traditional community banks, we specifically target business customers with complex needs that require a degree of business lending expertise that is typically found only at larger institutions. We primarily target small-to-midsized businesses with credit needs between $1 million and $10 million, whose banking needs are typically too complex for traditional community banks but are not large enough to attract personalized attention and service from larger institutions. In addition to offering the real estate lending typically available from a community bank, we began focusing heavily on our commercial and industrial, or C&I products after the economic downturn in 2008 and have developed extensive C&I expertise across our markets. C&I lending requires experienced bankers with a deep understanding of our customers’ businesses and their banking needs, which we believe is well suited for our “high touch” approach to banking. We believe that we have developed an expertise in this small-to-midsized business banking niche that is historically underserved, positioning us for meaningful growth going forward. We have also built treasury and cash management programs that cater to our target customers. |
|
● |
True Community Banking Model. Despite being located in Louisiana’s largest metropolitan areas and in the largest metropolitan area in the state of Texas, we have a true community banking mindset. That means relationship-based banking by bankers who live and work in our markets. Our market presidents and their teams are trained in credit underwriting and asset/liability management, as we view them as comprehensive bankers rather than just credit producers. The experience and talent of our market presidents and their respective banking teams allow us to decentralize significant decision-making authority while maintaining disciplined credit practices. In our experience, developing credit underwriting expertise “on the front lines” promotes quality loan generation and maximizes efficiency. Further, our emphasis on asset/liability management training allows our local banking teams to understand the importance of quality core deposit funding, which we believe is vital to our continued loan growth. In this sense, we view b1BANK as a network of true community banks, not as a typical regional financial institution that makes important credit and strategic decisions at the corporate level without input from its local bankers. In addition, our executive team is located throughout the state of Louisiana, rather than all being in Baton Rouge, providing the bank with a more informed view of our footprint and the best uses of our capital across our footprint |
|
● |
Entrepreneurial Culture. We have worked hard to build a team of self-starters who are passionate about the business of banking. We have found success recruiting bankers at much larger institutions who are frustrated by excess bureaucracy, overly centralized decision-making, and an escalated focus on the pursuit of larger business banking clients that larger banks perceive as more profitable than the small-to-midsized businesses we target. Likewise, we have successfully recruited bankers at peer or smaller institutions that do not have the available resources or operating platform to appropriately serve the more sophisticated banking needs of the small-to-midsized businesses in our markets. Our executive team is young and energetic. We believe their collaborative and cohesive approach to working relationships permeates every level of our organization, creating synergies that leave us well-positioned for future growth and helps us attract and retain other talented and entrepreneurial bankers as members of our team. |
|
● |
History of Disciplined Expansion. Since our founding in 2006, we have grown rapidly across the state of Louisiana and into Dallas. Each of our expansions were initiated with careful identification and recruitment of local banking teams and thoughtful consideration of each market’s different industries and credit exposures. Our banking centers are carefully situated in locations, typically downtowns and suburban centers, optimized for small-to-midsized business customers and high net worth individuals. This disciplined approach to expansion and growth entails not only recruiting the right bankers in the right markets, but in continuing to focus on the customer base that we are optimized to serve rather than chasing larger relationships as we grow. Over the years, the magnitude of our large banking relationships has changed very little, but the number of our large relationships has grown significantly. In order to continue to serve our customers as they grow without taking undue risk, we have developed a strong participation network that we believe underscores the strength of our underwriting process and the quality of our portfolio. We believe that it is important to keep sight of where our strengths lie and not pursue growth blindly. |
|
● |
Strong Platform for Growth. As a necessary complement to our style of sophisticated community banking, we have made significant investments to build a strong operational platform to empower our individual markets to thrive, to create operational efficiencies across our diverse markets, and to position us for future growth without commensurate growth in operational expenses. We have invested heavily in risk management personnel and modeling capabilities in recent years – we believe our underwriting capabilities are second to none in our markets, and our strong participation network and asset quality metrics are evidence of those capabilities. We invest in technology, which we believe will allow us to maintain staffing that is skewed towards the production side of our business and to accommodate future growth without commensurate increases in operating expenses. We believe our investments in technology will also allow us to maintain our “high tech/high touch” approach without the need for an extensive network of brick and mortar locations. |
Our Markets
Our banking operations are currently organized into nine markets in Louisiana, which include the six largest metropolitan areas in the state, and the Dallas, Texas market, which we service through 26 full-service banking centers. We converted our two loan production offices into full banking centers in the second quarter of 2018. We will continue to look for talented teams of bankers in markets and potential acquisitions that fit our model going forward.
Our Products and Services
b1BANK is an independent financial institution that is engaged in substantially all of the business operations customarily conducted by financial institutions in Louisiana and Texas. We offer, among other products, checking, savings and money market accounts, certificates of deposit, commercial and consumer loans, mortgage loans, real estate loans, and other installment and term loans. In addition, b1BANK offers our customers wealth management products, drive-through banking facilities, automated teller machines, night depository, personalized checks, credit cards, debit cards, internet banking, electronic funds transfers through ACH services, domestic and foreign wire transfers, traveler’s checks, cash management, vault services, loan and deposit sweep accounts, and lock box services.
Lending Activities
As a business-focused community-based financial institution, we offer a variety of business-related loans, including commercial lines of credit, working capital loans, commercial real estate-backed loans (including loans secured by owner occupied commercial properties), term loans, equipment financing, acquisition, expansion and development loans, borrowing base loans, real estate construction loans, agricultural loans, homebuilder loans, letters of credit and other loan products to small-to-midsized businesses, real estate developers, mortgage lenders, manufacturing and industrial companies and other businesses. We also offer various consumer loans to individuals and professionals including residential real estate loans, home equity loans, installment loans, unsecured and secured personal lines of credit, and standby letters of credit. Lending activities originate from the efforts of our bankers, with an emphasis on lending to small-to-midsized businesses, their owners and employees, and high net worth individuals located in our market areas. Although all lending involves a degree of risk, we work to mitigate these risks through conservative underwriting policies and consistent monitoring of credit quality indicators.
Commercial and Industrial Loans. We make C&I loans, including commercial lines of credit, working capital loans, term loans, equipment financing, asset acquisition, expansion and development loans, borrowing base loans, letters of credit and other loan products, primarily in our target markets that are underwritten on the basis of the borrower’s ability to service the debt from income. We typically take as collateral a lien on general business assets including, among other things, available real estate, accounts receivable, promissory notes, inventory and equipment and generally obtain a personal guaranty of the borrower or principal. Our C&I loans generally have variable interest rates and terms that typically range from one-to-five years depending on factors such as the type and size of the loan, the financial strength of the borrower/guarantor and the age, type and value of the collateral. Fixed rate C&I loan maturities are generally short-term, with one-to-five year maturities, or include periodic interest rate resets. Our underwriting policy does allow for exceptions in which the term and amortization of a C&I loan may be longer than five years; however, the term and amortization must be consistent with the useful life and depreciation rates of the underlying collateral and an underwriting exception will be noted. In general, C&I loans may involve increased credit risk and, therefore, typically yield a higher return than commercial real estate loans. The increased risk in C&I loans derives from the expectation that such loans generally are serviced principally from the operations of the business, and those operations may not be successful. Any interruption or discontinuance of operating cash flows from the business, which may be influenced by events not under the control of the borrower such as economic events and changes in governmental regulations, could materially affect the ability of the borrower to repay the loan. In addition, the collateral securing C&I loans generally includes moveable property such as equipment and inventory, which may decline in value more rapidly than we anticipated, exposing us to increased credit risk. As a result of these additional complexities, variables and risks, C&I loans require extensive underwriting and servicing.
Construction and Development Loans. Our construction portfolio includes loans to small-to-midsized businesses to construct owner-user properties, loans to developers of commercial real estate investment properties and residential developments and, to a lesser extent, loans to individual clients for construction of single family homes in our market areas. Construction and development loans are generally made with a term of one-to-two years with interest paid monthly. Our underwriting policy does allow for exceptions in which the term of a construction and development loan may be longer than two years; however, the term must be realistic and consistent with the borrower’s documented ability to repay. The ratio of the loan principal to the value of the collateral, as established by independent appraisal, typically will not exceed regulatory supervisory guidelines. Loan proceeds are disbursed based on the percentage of completion and only after the project has been inspected by an experienced construction lender or third-party inspector. Risks associated with construction and development loans include fluctuations in the value of real estate, project completion risk and change in market trends. We are also exposed to risk based on the ability of the construction loan borrower to finance the loan or sell the property upon completion of the project, which may be affected by changes in secondary market terms and criteria for permanent financing since the time that we funded the loan.
Commercial Real Estate Loans. We offer real estate loans for commercial property that is owner-occupied as well as commercial property owned by real estate investors. Commercial loans that are secured by owner-occupied commercial real estate and primarily collateralized by operating cash flows are also included in this category of loan. Commercial real estate loan terms are generally five years or less and amortization is generally limited to 20 years or less, although payments may be structured on a longer amortization basis in unusual cases. The interest rates on our commercial real estate loans may be fixed or adjustable, although rates typically are not fixed for a period exceeding five years. We generally charge an origination fee for our services. We typically require personal guarantees from the principal owners of the business supported by a review of the principal owners’ personal financial statements and global debt service obligations. Risks associated with commercial real estate loans include fluctuations in the value of real estate, the overall strength of the economy, new job creation trends, tenant vacancy rates, environmental contamination and the quality of the borrower’s management. We make efforts to limit our risk by analyzing borrowers’ cash flow and collateral value. The real estate securing our existing commercial real estate loans includes a wide variety of property types, such as owner-occupied offices/warehouses/production facilities, office buildings, hotels, mixed-use residential/commercial properties, retail centers and multifamily properties. Our commercial real estate loan portfolio presents a higher risk profile than our consumer real estate and consumer loan portfolios.
Residential Real Estate Loans. We offer first and second lien one-to-four family mortgage loans, as well as home equity lines of credit, in each case primarily on owner-occupied primary residences. Our retail consumer real estate lending products are offered primarily to consumer customers within our geographic markets. We also originate for resale one-to-four family mortgage loans, and those loans are included as a part of our consumer real estate loan portfolio until sold to investors. Although our consumer real estate loan portfolio presents lower levels of risk than our commercial, commercial real estate and construction loan portfolios, we are exposed to risk based on fluctuations in the value of the real estate collateral securing the loan, as well as changes in the borrower’s financial condition, which could be affected by numerous factors, including divorce, job loss, illness or other personal hardship.
Consumer Loans. While our focus is on service to small-to-midsized businesses, we also make a variety of loans to individuals for personal, family and household purposes, including secured and unsecured installment and term loans. We offer consumer loans as an accommodation to our existing customers and do not market consumer loans to persons who do not have a pre-existing relationship with us. Our consumer loans, which are underwritten primarily based on the borrower’s financial condition and, in some cases, are unsecured credits, subject us to risk based on changes in the borrower’s financial condition, which could be affected by numerous factors, including divorce, job loss, illness or other personal hardship, and fluctuations in the value of the real estate or personal property securing the consumer loan, if any.
Credit Policies and Procedures
General. We adhere to what we believe are disciplined underwriting standards, but also remain cognizant of the need to serve the credit needs of customers in our primary market areas by offering flexible loan solutions in a responsive and timely manner. We maintain asset quality through an emphasis on local market knowledge, long-term customer relationships, consistent and thorough underwriting for all loans and a conservative credit culture. We also seek to maintain a broadly diversified loan portfolio across customer, product and industry types. Our lending policies do not provide for any loans that are highly speculative, subprime, or that have high loan-to-value ratios. These components, together with active credit management, are the foundation of our credit culture, which we believe is critical to enhancing the long-term value of our organization to our customers, employees, shareholders and communities.
Credit Concentrations. In connection with the management of our credit portfolio, we actively manage the composition of our loan portfolio, including credit concentrations. Our loan approval policies establish concentration limits with respect to industry and loan product type to enhance portfolio diversification. In general, loan product concentration levels, our commercial real estate concentrations, and industry concentration levels are monitored monthly and reviewed by the Bank’s Board of Directors.
Loan Approval Process. We seek to achieve an appropriate balance between prudent, disciplined underwriting and flexibility in our decision-making and responsiveness to our customers. Our board has established an “in-house” lending limit to any single customer equal to 15% of the Bank’s Tier 1 and Tier 2 Capital in the case of loans that are not fully secured, with an additional 10% of the Bank’s Tier 1 and Tier 2 Capital in the case of loans that are fully secured by readily marketable collateral having a market value, as determined by reliable and continuously available price quotations at least equal to the amount of the loan. The capital calculation will be as of the prior month end. As of December 31, 2019, the Bank had a legal lending limit of approximately $121.1 million for loans not fully secured with readily marketable collateral, and its “in-house” lending limit was $38.2 million as of such date. Our credit underwriters are based throughout our footprint and service all of our markets from those locations.
Our credit approval policies provide for various levels of officer and senior management lending authority for new credits and renewals, which are based on position, capability and experience. We approve loans under three types of authority, Matrix (which includes Executive and Directors’ Loan Committees), Incremental, and Consumer authority. With the exception of loans secured by cash deposited with us, all commercial loans require a minimum of two approvers (the banker and one other individual with higher authority). When using the Matrix authority, senior lenders have authority up to $250,000, market presidents have authority up to $500,000, regional market presidents have authority up to $1.0 million, the chief banking officer and credit managers have authority up to $1.5 million, regional chief executive officers have authority up to $2.0 million and the Chief Executive Officer, Chief Financial Officer, and Chief Credit Executive each have authority up to $2.5 million. All relationships exceeding $2.5 million are approved by the Directors’ Loan Committee. Loans may be approved using the Incremental authority when the relationship has already been approved using the Matrix authority, with market presidents being able to approve up to $250,000, regional market presidents up to $500,000 and higher authorities up to $1.0 million, cumulatively. Consumer loans which present an aggregate lending exposure under $1.0 million (residential) or $250,000 (other) are approved on a transactional basis by appropriate consumer lending personnel using credit underwriting software which recommends approval or decline based on Bank policy guidelines. Loans exceeding the noted amounts or loans with policy exceptions must be approved by an appropriate override authority (including Senior or Executive level management or Loan Committee authority), which we believe provides platform scalability and furthers our fair lending compliance efforts. These parameters are reviewed periodically by the Bank’s board of directors. We believe that our credit approval process provides for thorough underwriting and efficient decision making.
Credit Risk Management. Credit risk management involves a partnership between our executive team and our market presidents. Loan officers, credit administration personnel and senior management proactively support collection activities. Our evaluation and compensation program for our loan officers includes significant goals, such as the percentages of past due loans and charge-offs to total loans in the officer’s portfolio, that we believe motivate the loan officers to focus on the origination and maintenance of high-quality credits consistent with our strategic focus on asset quality. Our policies require rapid notification of delinquency and prompt initiation of collection actions.
We maintain a list of loans, or the Watch List that receive additional attention if we believe there may be a potential credit risk. The Watch List is presented to the Board of Directors monthly. Loan officers are encouraged to bring potential credit issues to the attention of credit administration personnel, and loan grades are updated as deemed appropriate. Additionally, we periodically have an independent, third-party review performed on our loan portfolio. This review includes analysis of the borrower’s and guarantor’s financial condition, the Bank’s collateral position, and other credit risk factors. Results of the review as well as management responses are presented to the Bank’s Risk Committee. Finally, we perform stress testing on key segments of our portfolio in which we evaluate the impact of declining economic conditions on the portfolio based on previous recessionary periods. The reporting and reviews provide management with additional information for assessing our asset quality.
Deposits
Our deposits serve as the primary funding source for lending, investing and other general banking purposes. We offer business accounts and cash management services, including business checking and savings accounts, and treasury management services. We also provide a full range of deposit products and services, including a variety of checking and savings accounts, certificates of deposit, money market accounts, debit cards, remote deposit capture, online banking, mobile banking, e-Statements, bank-by-mail and direct deposit services. We solicit deposits through our relationship-driven team of dedicated and accessible bankers and through community-focused marketing and have recently implemented an incentive bonus program with our bankers to encourage deposit growth. We also seek to cross-sell deposit products at loan origination.
Given the diverse nature of our banking location network and our relationship-driven approach to our customers, we believe our deposit base is comparatively less sensitive to interest rate variations than our competitors. Nevertheless, we attempt to competitively price our deposit products to promote core deposit growth. As a business-focused bank offering comprehensive business banking services, we encourage our customers to bank their deposits with us and believe that the quality of our lending relationships and personalized service helps us in these efforts.
Wealth Solutions Services
We offer wealth management and other fiduciary and private banking services targeted to high net worth individuals, including professionals, business owners, families and professional service companies. In addition to fiduciary and investment management fee income, we believe these services enable us to build new relationships and expand existing relationships to grow our deposits and loans. Through our wealth management line of business, we offer financial planning, retirement services and trust and investment management by a team of seasoned advisors providing access to a wide range of certificates of deposits, mutual funds, annuities, individual retirement accounts, money market accounts and other financial products. Our private banking products and services are offered at all of our banking centers.
Other Products and Services
In addition to traditional banking activities and the other products and services specified above, we provide a broad array of financial services to our customers, including debit and credit card products, treasury and cash management services, merchant services, employee and payroll benefits solutions (including payroll cards and bank-at-work benefits) automated clearing house services, lock-box services, remote deposit capture services, international trade finance, international trade services, foreign exchange services, and other treasury services.
Subsidiaries
We have two wholly-owned subsidiaries. b1BANK, formerly known as Business First Bank, is a direct, wholly-owned subsidiary of Business First Bancshares, Inc. Business First Insurance, LLC is a wholly-owned subsidiary of b1BANK, and is, therefore, an indirect wholly-owned subsidiary of the Company. Business First Insurance, LLC is currently inactive and does not engage in any material business activities.
Competition
The banking and financial services industry is highly competitive, and we compete with a wide range of financial institutions within our markets, including local, regional and national commercial banks and credit unions. We also compete with mortgage companies, brokerage firms, consumer finance companies, mutual funds, securities firms, insurance companies, third-party payment processors, fintech companies and other financial intermediaries for certain of our products and services. Some of our competitors are not subject to the regulatory restrictions and level of regulatory supervision applicable to us.
Interest rates on loans and deposits, as well as prices on fee-based services, are typically significant competitive factors within banking and financial services industry. Many of our competitors are much larger financial institutions that have greater financial resources than we do and compete aggressively for market share. These competitors attempt to gain market share through their financial product mix, pricing strategies and banking center locations. Other important competitive factors in our industry and markets include office locations and hours, quality of customer service, community reputation, continuity of personnel and services, capacity and willingness to extend credit, and ability to offer sophisticated banking products and services. While we seek to remain competitive with respect to fees charged, interest rates and pricing, we believe that our broad and sophisticated commercial banking product suite, our high-quality customer service culture, and our positive reputation and community relationships will enable us to compete successfully within our markets and enhance our ability to attract and retain customers.
Employees
As of December 31, 2019, we had 355 full-time equivalent employees. None of our employees are represented by any collective bargaining unit or are parties to a collective bargaining unit. We are committed to hiring and retaining high quality employees to execute our strategic plan, and we believe our relations with our employees are good.
Available Information
The Company files reports and other information with the Securities and Exchange Commission, or SEC, under the Securities Exchange Act of 1934, as amended. The SEC maintains an Internet site that contains reports, proxy and information statements and other information about issuers, like the Company, who file electronically with the SEC. The address of that site is http://www.sec.gov.
Documents filed by the Company with the SEC are available from the Company without charge (except for exhibits to the documents). You may obtain documents filed by the Company with the SEC by requesting them in writing or by telephone from the Company at the following address:
Business First Bancshares, Inc.
500 Laurel Street, Suite 101
Baton Rouge, Louisiana 70801
Attention: Heather Roemer, Corporate Secretary
Telephone: (225) 248-7600
www.b1bank.com
Documents filed by the Company with the SEC are also available on the Company’s website, www.b1bank.com. Information furnished by the Company and information on, or accessible through, the SEC’s or the Company’s website is not part of this Annual Report on Form 10-K.
Supervision and Regulation
General
The U.S. banking industry is highly regulated under federal and state law. Consequently, our growth and earnings performance will be affected not only by management decisions and general and local economic conditions, but also by the statutes administered by, and the regulations and policies of, various governmental regulatory authorities. These authorities include the Federal Reserve, FDIC, CFPB, Louisiana OFI, IRS and state taxing authorities. The effect of these statutes, regulations and policies, and any changes to such statutes, regulations and policies, can be significant and cannot be predicted.
The primary goals of the bank regulatory scheme are to maintain a safe and sound banking system, facilitate the conduct of sound monetary policy and promote fairness and transparency for financial products and services. The system of supervision and regulation applicable to us and our subsidiaries establishes a comprehensive framework for their respective operations and is intended primarily for the protection of the FDIC’s Deposit Insurance Fund, the Bank’s depositors and the public, rather than our shareholders or creditors. The description below summarizes certain elements of the applicable bank regulatory framework. This description is not intended to describe all laws and regulations applicable to us and our subsidiaries, and the description is qualified in its entirety by reference to the full text of the statutes, regulations, policies, interpretive letters and other written guidance that are described herein.
Business First Bancshares, Inc.
As a bank holding company, the Company is subject to regulation under the Bank Holding Company Act of 1956, or the BHC Act, and to supervision, examination and enforcement by the Federal Reserve. The BHC Act and other federal laws subject bank holding companies to particular restrictions on the types of activities in which they may engage, and to a range of supervisory requirements and activities, including regulatory enforcement actions for violations of laws and regulations. The Federal Reserve’s jurisdiction also extends to any company that we directly or indirectly control, such as any nonbank subsidiaries and other companies in which we own a controlling investment.
Financial Services Industry Reform. In 2010, the Dodd-Frank Wall Street Reform and Consumer Protection Act, or Dodd-Frank Act was enacted. The Dodd-Frank Act broadly affected the financial services industry by implementing changes to the financial regulatory landscape aimed at strengthening the sound operation of the financial services sector.
In addition, the Dodd-Frank Act addressed many investor protection, corporate governance and executive compensation matters affecting publicly-traded companies. However, the Jumpstart our Business Startups Act of 2012, or JOBS Act, provided certain exceptions to these requirements for so long as a publicly-traded qualifies as an emerging growth company. In 2018, the Economic Growth, Regulatory Relief, and Consumer Protection Act, or EGRRCPA, revised certain aspects of the Dodd-Frank Act. Among other things, EGRRCPA exempts banks with less than $10 billion in assets (and total trading assets and trading liabilities of 5% or less of total assets) from Volcker Rule requirements relating to proprietary trading and clarifies definitions pertaining to HVCRE, which require higher capital allocations, so that only loans with increased risk are subject to higher risk weightings. Further changes effected by the passage of EGRRCPA are discussed below.
Revised Rules on Regulatory Capital. Regulatory capital rules pursuant to the Basel III requirements, released in July 2013 and effective January 1, 2015, implemented higher minimum capital requirements for bank holding companies and banks. These rules include a new common equity Tier 1, or CET1, capital requirement and establish criteria that instruments must meet to be considered common equity Tier 1 capital, additional Tier 1 capital or Tier 2 capital. The revised capital rules require banks and bank holding companies to maintain a minimum CET1 capital ratio of 4.5% of risk-based assets, a total Tier 1 capital ratio of 6.0% of risk-based assets, a total capital ratio of 8.0% of risk-based assets and a leverage ratio of 4.0% of average assets.
The capital rules also require banks to maintain a CET1 capital ratio of 6.5%, a total Tier 1 capital ratio of 8.0%, a total capital ratio of 10.0% and a leverage ratio of 5.0% to be deemed “well capitalized” for purposes of certain rules and prompt corrective action requirements. The risk-based ratios include a “capital conservation buffer” of 2.5% above its minimum risk-based capital requirements that must be composed of common equity Tier 1 capital. This buffer will help to ensure that banking organizations conserve capital when it is most needed, allowing them to better weather periods of economic stress. The buffer is measured relative to risk-weighted assets. An institution would be subject to limitations on certain activities including payment of dividends, share repurchases and discretionary bonuses to executive officers if its capital level is below the buffered ratio. As of December 31, 2019, the Company’s capital meets or exceeds these capital requirements on a fully phased-in basis.
On September 17, 2019, the FDIC and other federal bank regulatory agencies approved the community bank leverage ratio (CBLR) framework as part of the directive under Section 201 of the EGRRCPA. This framework became effective January 1, 2020, and is available to the Bank and Company as an alternative to the Basel III risk-based capital framework. The CBLR framework is an optional framework that is designed to reduce burden by removing the requirements for calculating and reporting risk-based capital ratios for qualifying community banking organizations that opt into the framework. Specifically, depository institutions and depository institution holding companies that have less than $10 billion in total consolidated assets and meet other qualifying criteria, including a tier 1 leverage ratio of greater than 9 percent, are considered qualifying community banking organizations and are eligible to opt into the CBLR framework. The Company and Bank currently qualify to opt into the CBLR framework. The Company and Bank have not yet finalized a decision, but do preliminarily intend to opt in to the CBLR framework for the quarter ended March 31, 2020.
Imposition of Liability for Undercapitalized Subsidiaries. Bank regulators are required to take prompt corrective action to resolve problems associated with insured depository institutions whose capital declines below certain levels. In the event an institution becomes undercapitalized, it must submit a capital restoration plan. The capital restoration plan will not be accepted by the regulators unless each company having control of the undercapitalized institution guarantees the subsidiary’s compliance with the capital restoration plan up to a certain specified amount. Any such guarantee from a depository institution’s holding company is entitled to a priority of payment in bankruptcy.
The aggregate liability of the holding company of an undercapitalized bank is limited to the lesser of 5.0% of the institution’s assets at the time it became undercapitalized or the amount necessary to cause the institution to be adequately capitalized. The bank regulators have greater power in situations where an institution becomes significantly or critically undercapitalized or fails to submit a capital restoration plan. For example, a bank holding company controlling such an institution can be required to obtain prior Federal Reserve approval of proposed dividends, or might be required to consent to a consolidation or to divest the troubled institution or other affiliates.
Acquisitions by Bank Holding Companies. The BHC Act, requires every bank holding company to obtain the prior approval of the Federal Reserve before it acquires all or substantially all of the assets of any bank, or ownership or control of any voting shares of any bank or bank holding company if after such acquisition it would own or control, directly or indirectly, more than 5.0% of the voting shares of such bank or bank holding company. In approving bank or bank holding company acquisitions by bank holding companies, the Federal Reserve is required to consider, among other things, the effect of the acquisition on competition, the financial condition, managerial resources and future prospects of the bank holding company and the banks concerned, the convenience and needs of the communities to be served (including the record of performance under the CRA), the effectiveness of the applicant in combating money laundering activities and the extent to which the proposed acquisition would result in greater or more concentrated risks to the stability of the U.S. banking or financial system. Our ability to make future acquisitions will depend on our ability to obtain approval for such acquisitions from the Federal Reserve. The Federal Reserve could deny our application based on the above criteria or other considerations. For example, we could be required to sell banking centers as a condition to receiving regulatory approval, which condition may not be acceptable to us or, if acceptable to us, may reduce the benefit of a proposed acquisition.
Control Acquisitions. Federal and state laws, including the BHC Act and the Change in Bank Control Act, or CBCA, impose additional prior notice or approval requirements and ongoing regulatory requirements on any investor that seeks to acquire direct or indirect “control” of an FDIC-insured depository institution or bank holding company. Whether an investor “controls” a depository institution is based on all of the facts and circumstances surrounding the investment. As a general matter, an investor is deemed to control a depository institution or other company if the investor owns or controls 25.0% or more of any class of voting securities. Subject to rebuttal, an investor is presumed to control a depository institution or other company if the investor owns or controls 10.0% or more of any class of voting securities and either the depository institution or company is a public company or no other person will hold a greater percentage of that class of voting securities after the acquisition. If an investor’s ownership of our voting securities were to exceed certain thresholds, the investor could be deemed to “control” us for regulatory purposes, which could subject such investor to regulatory filings or other regulatory consequences. The requirements of the BHC Act and the CBCA could limit our access to capital and could limit parties who could acquire shares of our common stock.
Regulatory Restrictions on Dividends; Source of Strength. As a bank holding company, the Company is subject to certain restrictions on dividends under applicable banking laws and regulations. The Federal Reserve has issued a supervisory letter that provides that a bank holding company should not pay dividends unless: (1) its net income over the last four quarters (net of dividends paid) has been sufficient to fully fund the dividends; (2) the prospective rate of earnings retention appears to be consistent with the capital needs, asset quality and overall financial condition of the bank holding company and its subsidiaries; and (3) the bank holding company will continue to meet minimum required capital adequacy ratios. Failure to comply with the supervisory letter could result in a supervisory finding that the bank holding company is operating in an unsafe and unsound manner. In addition, the Company’s ability to pay dividends may also be limited as a result of the capital conservation buffer under the Basel III regulatory capital framework. In the current financial and economic environment, the Federal Reserve Board has indicated that bank holding companies should carefully review their dividend policy and has discouraged payment ratios that are at maximum allowable levels unless both asset quality and capital are very strong. The Federal Reserve may further restrict the payment of dividends by engaging in supervisory action to restrict dividends or by requiring us to maintain a higher level of capital than would otherwise be required under the Basel III minimum capital requirements.
Under longstanding Federal Reserve policy which has been codified by the Dodd-Frank Act, the Company is expected to act as a source of financial strength to, and to commit resources to support, the Bank. This support may be required at times when we may not be inclined to provide it. In addition, any capital loans that the Company makes to the Bank are subordinate in right of payment to deposits and to certain other indebtedness of the Bank. As discussed above, in certain circumstances, the Company could also be required to guarantee the capital restoration plan of the Bank, if it became undercapitalized for purposes of the Federal Reserve’s prompt corrective action regulations. In the event of our bankruptcy, any commitment by us to a federal bank regulatory agency to maintain the capital of the Bank under a capital restoration plan would be assumed by the bankruptcy trustee and entitled to a priority of payment.
In the event of a bank holding company’s bankruptcy under Chapter 11 of the U.S. Bankruptcy Code, the trustee will be deemed to have assumed and will be required to cure immediately any deficit under any commitment by the debtor holding company to any of the federal banking agencies to maintain the capital of an insured depository institution, and any claim for breach of such obligation will generally have priority over most other unsecured claims.
Scope of Permissible Activities. Under the BHC Act, the Company is prohibited from acquiring a direct or indirect interest in or control of more than 5.0% of the voting shares of any company that is not a bank or financial holding company and from engaging directly or indirectly in activities other than those of banking, managing or controlling banks or furnishing services to or performing services for its subsidiary banks, except that the Company may engage in, directly or indirectly, and may own shares of companies engaged in certain activities found by the Federal Reserve to be so closely related to banking or managing and controlling banks as to be a proper incident thereto. These activities include, among others, operating a mortgage, finance, credit card or factoring company; performing certain data processing operations; providing investment and financial advice; acting as an insurance agent for certain types of credit-related insurance; leasing personal property on a full-payout, nonoperating basis; and providing certain stock brokerage and investment advisory services. In approving acquisitions or the addition of activities, the Federal Reserve considers, among other things, whether the acquisition or the additional activities can reasonably be expected to produce benefits to the public, such as greater convenience, increased competition, or gains in efficiency, that outweigh such possible adverse effects as undue concentration of resources, decreased or unfair competition, conflicts of interest or unsound banking practices.
Notwithstanding the foregoing, the Gramm-Leach-Bliley Act, also known as the Financial Services Modernization Act of 1999, effective March 11, 2000, or the GLB Act, amended the BHC Act and eliminated the barriers to affiliations among banks, securities firms, insurance companies and other financial service providers. The GLB Act permitted bank holding companies to become financial holding companies and thereby affiliate with securities firms and insurance companies and engage in other activities that are financial in nature. The GLB Act defines “financial in nature” to include, among other things, securities underwriting, dealing and market making; sponsoring mutual funds and investment companies; insurance underwriting and agency; merchant banking activities; and activities that the Federal Reserve has determined to be closely related to banking. No regulatory approval will be required for a financial holding company to acquire a company, other than a bank or savings association, engaged in activities that are financial in nature or incidental to activities that are financial in nature, as determined by the Federal Reserve. We currently have no plans to make a financial holding company election, although we may make a financial holding company election in the future if we desire to engage in any lines of business that are impermissible for bank holding companies but permissible for financial holding companies.
Safe and Sound Banking Practices. Bank holding companies are not permitted to engage in unsafe and unsound banking practices. The Federal Reserve’s Regulation Y, for example, generally requires a bank holding company to provide the Federal Reserve with prior notice of any redemption or repurchase of its own equity securities, if the consideration to be paid, together with the consideration paid for any repurchases or redemptions in the preceding year, is equal to 10.0% or more of the bank holding company’s consolidated net worth. The Federal Reserve may oppose the transaction if it believes that the transaction would constitute an unsafe or unsound practice or would violate any law or regulation. In certain circumstances, the Federal Reserve could take the position that paying a dividend would constitute an unsafe or unsound banking practice.
The Federal Reserve has broad authority to prohibit activities of bank holding companies and their nonbanking subsidiaries which represent unsafe and unsound banking practices, result in breaches of fiduciary duty or which constitute violations of laws or regulations, and can assess civil money penalties or impose enforcement action for such activities. The penalties can be as high as $1,000,000 for each day the activity continues.
Anti-tying Restrictions. Bank holding companies and their affiliates are prohibited from tying the provision of certain services, such as extensions of credit, to other nonbanking services offered by a bank holding company or its affiliates.
b1BANK
The Bank is a commercial bank chartered under the laws of the State of Louisiana. In addition, its deposits are insured by the FDIC to the maximum extent permitted by law. As a result, the Bank is subject to extensive regulation, supervision and examination by the Louisiana Office of Financial Institutions and the FDIC. Finally, we are also subject to secondary oversight by state banking authorities in other states in which we may maintain banking offices. The bank regulatory agencies have the power to enforce compliance with applicable banking laws and regulations. These requirements and restrictions include requirements to maintain reserves against deposits, restrictions on the nature and amount of loans that may be made and the interest that may be charged thereon and restrictions relating to investments and other activities of the Bank.
Capital Adequacy Requirements. The FDIC and Louisiana Office of Financial Institutions monitor the capital adequacy of the Bank by using a combination of risk-based guidelines and leverage ratios similar to those applied at the holding company level. These agencies consider the bank’s capital levels when taking action on various types of applications and when conducting supervisory activities related to the safety and soundness of the bank and the banking system. Under the revised capital rules which became effective on January 1, 2015, the Bank is required to maintain four minimum capital standards: (1) a leverage capital ratio of at least 4.0%, (2) a common equity Tier 1 risk-based capital ratio of 4.5%, (3) a Tier 1 risk-based capital ratio of at least 6.0%, and (4) a total risk-based capital ratio of at least 8.0%.
The Basel III framework also implements a requirement for all FDIC-insured banks to maintain a capital conservation buffer above the minimum capital requirements to avoid certain restrictions on capital distributions and discretionary bonus payments to executive officers. The capital conservation buffer must be composed solely of common equity Tier 1 capital and effectively requires banking organizations to maintain regulatory risk-based capital ratios at least 2.5% above the minimum risk-based capital requirements set forth above.
These capital requirements are minimum requirements. The FDIC or Louisiana Office of Financial Institutions may also set higher capital requirements if warranted by the risk profile of the Bank, economic conditions impacting its markets or other circumstances particular to the bank. For example, FDIC guidance provides that higher capital may be required to take adequate account of, among other things, interest rate risk and the risks posed by concentrations of credit, nontraditional activities or securities trading activities. In addition, the FDIC’s prompt corrective action regulations discussed below, in effect, increase the minimum regulatory capital ratios for banking organizations. Failure to meet capital guidelines could subject the Bank to a variety of enforcement remedies, including issuance of a capital directive, restrictions on business activities and other measures under the FDIC’s prompt corrective action regulations.
As previously mentioned, the Bank preliminarily intends to opt in to the CBLR framework for the quarter ended March 31, 2020.
Corrective Measures for Capital Deficiencies. The federal banking regulators are required by the Federal Deposit Insurance Act, or FDI Act, to take “prompt corrective action” with respect to capital-deficient institutions that are FDIC-insured. For this purpose, a financial institution is placed in one of the following five capital tiers: “well capitalized,” “adequately capitalized,” “undercapitalized,” “significantly undercapitalized” and “critically undercapitalized.” The institution’s capital tier depends upon how its capital levels compare with various relevant capital measures and certain other factors, as established by regulation.
To be well capitalized, a financial institution must have a total risk-based capital ratio of at least 10.0%, a Tier 1 risk-based capital ratio of at least 8.0%, a common equity Tier 1 risk-based capital ratio of at least 6.5%, and a leverage ratio of at least 5.0%, and must not be subject to any written agreement, order or directive requiring it to maintain a specific capital level for any capital measure. As of December 31, 2019, the Bank met the requirements to be categorized as well capitalized under the prompt corrective action framework currently in effect.
Banks that are adequately, but not well, capitalized may not accept, renew or rollover brokered deposits except with a waiver from the Federal Reserve and are subject to restrictions on the interest rates that can be paid on its deposits. The FDIC’s prompt corrective action regulations also generally prohibit a bank from making any capital distributions (including payment of a dividend) or paying any management fee to its parent holding company if the bank would thereafter be undercapitalized. Undercapitalized institutions are also subject to growth limitations, may not accept, renew or rollover brokered deposits, and are required to submit a capital restoration plan. The agencies may not accept such a plan without determining, among other things, that the plan is based on realistic assumptions and is likely to succeed in restoring the bank’s capital. Significantly undercapitalized depository institutions may be subject to a number of requirements and restrictions, including orders to sell sufficient voting stock to become adequately capitalized, requirements to reduce total assets, and cessation of receipt of deposits from correspondent banks. Generally, subject to a narrow exception, the FDIC must appoint a receiver or conservator for an institution that is critically undercapitalized. The capital classification of a bank also affects the frequency of regulatory examinations, the bank’s ability to engage in certain activities and the deposit insurance premiums paid by the bank.
Branching. Under Louisiana law, the Bank is permitted to establish additional branch offices within Louisiana, subject to the approval of the Louisiana Office of Financial Institutions. As a result of the Dodd-Frank Act, the Bank may also establish additional branch offices outside of Louisiana, subject to prior regulatory approval, so long as the laws of the state where the branch is to be located would permit a state bank chartered in that state to establish a branch. Any new branch, whether located inside or outside of Louisiana, must also be approved by the FDIC, as the Bank’s primary federal regulator. The Bank may also establish offices in other states by merging with banks or by purchasing branches of other banks in other states, subject to certain restrictions.
Restrictions on Transactions with Affiliates and Insiders. Transactions between the Bank and its nonbanking subsidiaries and/or affiliates, including the Company, are subject to Section 23A and 23B of the Federal Reserve Act and Regulation W. In general, Section 23A of the Federal Reserve Act imposes limits on the amount of such transactions, and also requires certain levels of collateral for loans to affiliated parties. It also limits the amount of advances to third parties which are collateralized by the securities or obligations of the Company or its subsidiaries. Covered transactions with any single affiliate may not exceed 10.0% of the capital stock and surplus of the Bank, and covered transactions with all affiliates may not exceed, in the aggregate, 20.0% of the Bank’s capital and surplus. For a bank, capital stock and surplus refers to the bank’s Tier 1 and Tier 2 capital, as calculated under the risk-based capital guidelines, plus the balance of the allowance for credit losses excluded from Tier 2 capital. The Bank’s transactions with all of its affiliates in the aggregate are limited to 20.0% of the foregoing capital. “Covered transactions” are defined by statute to include a loan or extension of credit to an affiliate, as well as a purchase of securities issued by an affiliate, a purchase of assets (unless otherwise exempted by the Federal Reserve) from the affiliate, the acceptance of securities issued by the affiliate as collateral for a loan, and the issuance of a guarantee, acceptance or letter of credit on behalf of an affiliate. In addition, in connection with covered transactions that are extensions of credit, the Bank may be required to hold collateral to provide added security to the Bank, and the types of permissible collateral may be limited. The Dodd-Frank Act generally enhances the restrictions on transactions with affiliates, including an expansion of what types of transactions are covered transactions to include credit exposures related to derivatives, repurchase agreement and securities lending arrangements and an increase in the amount of time for which collateral requirements regarding covered transactions must be satisfied.
Affiliate transactions are also subject to Section 23B of the Federal Reserve Act which generally requires that certain transactions between the Bank and its affiliates be on terms substantially the same, or at least as favorable to the Bank, as those prevailing at the time for comparable transactions with or involving other nonaffiliated persons. The Federal Reserve has also issued Regulation W which codifies prior regulations under Sections 23A and 23B of the Federal Reserve Act and interpretive guidance with respect to affiliate transactions.
The restrictions on loans to directors, executive officers, principal shareholders and their related interests (collectively referred to herein as “insiders”) contained in Section 22(h) of the Federal Reserve Act and in Regulation O promulgated by the Federal Reserve apply to all insured institutions and their subsidiaries and bank holding companies. These restrictions include limits on loans to one borrower and conditions that must be met before such a loan can be made. There is also an aggregate limitation on all loans to insiders and their related interests. Generally, the aggregate of these loans cannot exceed the institution’s total unimpaired capital and surplus, although a bank’s regulators may determine that a lesser amount is appropriate. Loans to senior executive officers of a bank are even further restricted. Insiders are subject to enforcement actions for accepting loans in violation of applicable restrictions.
Restrictions on Distribution of Bank Dividends and Assets. The Bank is subject to certain restrictions on dividends under federal and state laws, regulations and policies. In general, the Bank may pay dividends to the Company without the approval of the Louisiana Office of Financial Institutions so long as the amount of the dividend does not exceed the Bank’s net profits earned during the current year combined with its retained net profits of the immediately preceding year. The Bank is required to obtain the approval of the Louisiana Office of Financial Institutions for any amount in excess of this threshold. In addition, under federal law, the Bank may not pay any dividend to the Company if it is undercapitalized or the payment of the dividend would cause it to become undercapitalized. The FDIC may further restrict the payment of dividends by engaging in supervisory action to restrict dividends or by requiring the Bank to maintain a higher level of capital than would otherwise be required to be adequately capitalized for regulatory purposes. Under the Basel III regulatory capital framework, the failure to maintain an adequate capital conservation buffer, as discussed above, may also result in dividend restrictions. Moreover, if, in the opinion of the FDIC, the Bank is engaged in an unsound practice (which could include the payment of dividends), the FDIC may require, generally after notice and hearing, the Bank to cease such practice. The FDIC has indicated that paying dividends that deplete a depository institution’s capital base to an inadequate level would be an unsafe banking practice. The FDIC has also issued policy statements providing that insured depository institutions generally should pay dividends only out of current operating earnings.
Further, in the event of a liquidation or other resolution of an insured depository institution, the claims of depositors and other general or subordinated creditors are entitled to a priority of payment over the claims of holders of any obligation of the institution to its shareholders, including any depository institution holding company (such as us) or any shareholder or creditor thereof.
Incentive Compensation Guidance. The federal banking agencies have issued comprehensive guidance on incentive compensation policies intended to ensure that the incentive compensation policies of banking organizations do not undermine the safety and soundness of those organizations by encouraging excessive risk-taking. The incentive compensation guidance sets expectations for banking organizations concerning their incentive compensation arrangements and related risk-management, control and governance processes. The incentive compensation guidance, which covers all employees that have the ability to materially affect the risk profile of an organization, either individually or as part of a group, is based upon three primary principles: (1) balanced risk-taking incentives, (2) compatibility with effective controls and risk management and (3) strong corporate governance. Any deficiencies in compensation practices that are identified may be incorporated into the organization’s supervisory ratings, which can affect its ability to make acquisitions or take other actions. In addition, under the incentive compensation guidance, a banking organization’s federal supervisor may initiate enforcement action if the organization’s incentive compensation arrangements pose a risk to the safety and soundness of the organization. Further, a provision of the Basel III capital standards described above would limit discretionary bonus payments to bank executives if the institution’s regulatory capital ratios fail to exceed certain thresholds. A number of federal regulatory agencies proposed rules that would require enhanced disclosure of incentive-based compensation arrangements initially in April 2011, and again in April and May 2016, but the rules have not been finalized and would mostly apply to banking organizations with over $50 billion in total assets. The scope and content of the U.S. banking regulators’ policies on executive compensation are continuing to develop and are likely to continue evolving in the near future.
Audit Reports. For insured institutions with total assets of $1.0 billion or more, financial statements prepared in accordance with GAAP, management’s certifications signed by our and the Bank’s chief executive officer and chief accounting or financial officer concerning management’s responsibility for the financial statements, and an attestation by the auditors regarding the Bank’s internal controls must be submitted. For institutions with total assets of more than $3.0 billion, independent auditors may be required to review quarterly financial statements. FDICIA requires that the Bank have an independent audit committee, consisting of outside directors only, or that we have an audit committee that is entirely independent. The committees of such institutions must include members with experience in banking or financial management, must have access to outside counsel and must not include representatives of large customers. The Bank’s audit committee consists entirely of independent directors.
Deposit Insurance Assessments. The FDIC insures the deposits of federally insured banks up to prescribed statutory limits for each depositor through the Deposit Insurance Fund and safeguards the safety and soundness of the banking and thrift industries. The maximum amount of deposit insurance for banks and savings institutions is $250,000 per depositor. The amount of FDIC assessments paid by each insured depository institution is based on its relative risk of default as measured by regulatory capital ratios and other supervisory factors and is calculated based on an institution’s average consolidated total assets minus average tangible equity.
We are generally unable to control the amount of premiums that we are required to pay for FDIC insurance. At least semi-annually, the FDIC will update its loss and income projections for the Deposit Insurance Fund and, if needed, will increase or decrease assessment rates, following notice-and-comment rulemaking, if required. If there are additional bank or financial institution failures or if the FDIC otherwise determines to increase assessment rates, the Bank may be required to pay higher FDIC insurance premiums. Any future increases in FDIC insurance premiums may have a material and adverse effect on our earnings.
Financial Modernization. Under the GLB Act, banks may establish financial subsidiaries and engage, subject to limitations on investment, in activities that are financial in nature, other than insurance underwriting as principal, insurance company portfolio investment, real estate development, real estate investment, annuity issuance and merchant banking activities. To do so, a bank must be well capitalized, well managed and have a CRA rating from its primary federal regulator of satisfactory or better. Subsidiary banks of financial holding companies or banks with financial subsidiaries must remain well capitalized and well managed in order to continue to engage in activities that are financial in nature without regulatory actions or restrictions. Such actions or restrictions could include divestiture of the “financial in nature” subsidiary or subsidiaries. In addition, a financial holding company or a bank may not acquire a company that is engaged in activities that are financial in nature unless each of the subsidiary banks of the financial holding company or the bank has a CRA rating of satisfactory or better. Neither we nor the Bank maintains a financial subsidiary.
Brokered Deposit Restrictions. Insured depository institutions that are categorized as adequately capitalized institutions under the FDI Act and corresponding federal regulations cannot accept, renew or roll over brokered deposits, without receiving a waiver from the FDIC, and are subject to restrictions on the interest rates that can be paid on any deposits. The EGRRCPA exempted reciprocal deposits from the definition of brokered deposits. Insured depository institutions that are categorized as undercapitalized capitalized institutions under the FDI Act and corresponding federal regulations may not accept, renew, or roll over brokered deposits. The Bank is not currently subject to such restrictions.
Concentrated Commercial Real Estate Lending Regulations. The federal banking regulatory agencies have promulgated guidance governing financial institutions with concentrations in commercial real estate lending. The guidance provides that a bank has a concentration in commercial real estate lending if (1) total reported loans for acquisition, construction, land development, and other land represent 100.0% or more of total risk-based capital or (2) total reported loans secured by multifamily and nonfarm nonresidential properties and loans for acquisition, construction, land development, and other land represent 300.0% or more of total risk-based capital and the bank’s commercial real estate loan portfolio has increased 50% or more during the prior 36 months. Owner occupied loans are excluded from this second category. If a concentration is present, management must employ heightened risk management practices that address, among other things, Board and management oversight and strategic planning, portfolio management, development of underwriting standards, risk assessment and monitoring through market analysis and stress testing, and maintenance of increased capital levels as needed to support the level of commercial real estate lending. We are currently operating with real estate loan portfolios within such percentage levels.
Community Reinvestment Act. The CRA and the regulations issued thereunder are intended to encourage banks to help meet the credit needs of their entire assessment area, including low and moderate income neighborhoods, consistent with the safe and sound operations of such banks. These regulations also provide for regulatory assessment of a bank’s record in meeting the needs of its assessment area when considering applications to establish branches, merger applications and applications to acquire the assets and assume the liabilities of another bank. The Financial Institution Reform Recovery and Enforcement Act, or FIRREA requires federal banking agencies to make public a rating of a bank’s performance under the CRA. In the case of a bank holding company, the CRA performance record of the banks involved in the transaction are reviewed in connection with the filing of an application to acquire ownership or control of shares or assets of a bank or to merge with any other bank holding company. An unsatisfactory CRA record could substantially delay approval or result in denial of an application. The Bank received a “satisfactory” rating in its most recent CRA examination in 2017.
Consumer Laws and Regulations. The Bank is subject to numerous laws and regulations intended to protect consumers in transactions with the Bank. These laws include, among others, laws regarding unfair, deceptive and abusive acts and practices, usury laws, and other federal consumer protection statutes. These federal laws include the Electronic Fund Transfer Act, the Equal Credit Opportunity Act, the Fair Credit Reporting Act, the Fair Debt Collection Practices Act, the Real Estate Procedures Act of 1974, the S.A.F.E. Mortgage Licensing Act of 2008, the Truth in Lending Act and the Truth in Savings Act, among others. Many states and local jurisdictions have consumer protection laws analogous, and in addition, to those enacted under federal law. These laws and regulations mandate certain disclosure requirements and regulate the manner in which financial institutions must deal with customers when taking deposits, making loans and conducting other types of transactions. Failure to comply with these laws and regulations could give rise to regulatory sanctions, customer rescission and registration rights, action by state and local attorneys general and civil or criminal liability.
In addition, the Dodd-Frank Act created the CFPB. The CFPB has broad authority to regulate the offering and provision of consumer financial products. The Dodd-Frank Act gives the CFPB authority to supervise and examine depository institutions with more than $10.0 billion in assets for compliance with these federal consumer laws. The authority to supervise and examine depository institutions with $10.0 billion or less in assets for compliance with federal consumer laws remains largely with those institutions’ primary regulators. However, the CFPB may participate in examinations of these smaller institutions on a “sampling basis” and may refer potential enforcement actions against such institutions to their primary regulators. Accordingly, the CFPB may participate in examinations of the Bank, which currently has assets of less than $10.0 billion, and could supervise and examine our other direct or indirect subsidiaries that offer consumer financial products or services. The CFPB also has supervisory and examination authority over certain nonbank institutions that offer consumer financial products. The Dodd-Frank Act identifies a number of covered nonbank institutions, and also authorizes the CFPB to identify additional institutions that will be subject to its jurisdiction. In addition, the Dodd-Frank Act permits states to adopt consumer protection laws and regulations that are stricter than those regulations promulgated by the CFPB, and state attorneys general are permitted to enforce consumer protection rules adopted by the CFPB against certain institutions.
Mortgage Lending Rules. The Dodd-Frank Act authorized the CFPB to establish certain minimum standards for the origination of residential mortgages, including a determination of the borrower’s ability to repay. Under the Dodd-Frank Act and related rules, financial institutions may not make a residential mortgage loan unless they make a “reasonable and good faith determination” that the consumer has a “reasonable ability” to repay the loan. The Dodd-Frank Act allows borrowers to raise certain defenses to foreclosure but provides a full or partial safe harbor from such defenses for loans that are “qualified mortgages.” The rules define “qualified mortgages,” imposing both underwriting standards – for example, a borrower’s debt-to-income ratio may not exceed 43.0% – and limits on the terms of their loans. Certain loans, including interest-only loans and negative amortization loans, cannot be qualified mortgages. EGRRCPA, among other matters, expanded the definition of qualified mortgages for banks with less than $10 billion in assets.
Anti-Money Laundering and OFAC. Under federal law, including the Bank Secrecy Act, or BSA, and the USA PATRIOT Act of 2001, certain financial institutions, such as the Bank, must maintain anti-money laundering programs that include established internal policies, procedures and controls; a designated BSA officer; an ongoing employee training program; and testing of the program by an independent audit function. Financial institutions are also prohibited from entering into specified financial transactions and account relationships and must meet enhanced standards for due diligence and customer identification especially in their dealings with foreign financial institutions and foreign customers. Financial institutions must take reasonable steps to conduct enhanced scrutiny of account relationships to guard against money laundering and to report any suspicious transactions, and law enforcement authorities have been granted increased access to financial information maintained by financial institutions. The Financial Crimes Enforcement Network, or FinCEN, issued final rules under the BSA in July 2016 that clarify and strengthen the due diligence requirements for banks with regard to their customers.
The Office of Foreign Assets Control, or OFAC, administers laws and Executive Orders that prohibit U.S. entities from engaging in transactions with certain prohibited parties. OFAC publishes lists of persons and organizations suspected of aiding, harboring or engaging in terrorist acts, known as Specially Designated Nationals and Blocked Persons. Generally, if a bank identifies a transaction, account or wire transfer relating to a person or entity on an OFAC list, it must freeze the account or block the transaction, file a suspicious activity report and notify the appropriate authorities.
Bank regulators routinely examine institutions for compliance with these obligations and they must consider an institution’s compliance in connection with the regulatory review of applications, including applications for bank mergers and acquisitions. Failure of a financial institution to maintain and implement adequate programs to combat money laundering and terrorist financing and comply with OFAC sanctions, or to comply with relevant laws and regulations, could have serious legal, reputational and financial consequences for the institution.
Privacy. The federal banking regulators have adopted rules that limit the ability of banks and other financial institutions to disclose non-public information about consumers to non-affiliated third parties. These limitations require disclosure of privacy policies to consumers and, in some circumstances, allow consumers to prevent disclosure of certain personal information to a non-affiliated third party. These regulations affect how consumer information is transmitted through financial services companies and conveyed to outside vendors. In addition, consumers may also prevent disclosure of certain information among affiliated companies that is assembled or used to determine eligibility for a product or service, such as that shown on consumer credit reports and asset and income information from applications. Consumers also have the option to direct banks and other financial institutions not to share information about transactions and experiences with affiliated companies for the purpose of marketing products or services. In addition to applicable federal privacy regulations, the Bank is subject to certain state privacy laws.
Federal Home Loan Bank System. The FHLB system, of which the Bank is a member, consists of 11 regional FHLBs governed and regulated by the Federal Housing Finance Board, or FHFB. The FHLBs serve as reserve or credit facilities for member institutions within their assigned regions. The reserves are funded primarily from proceeds derived from the sale of consolidated obligations of the FHLB system. The FHLBs make loans (i.e., advances) to members in accordance with policies and procedures established by the FHLB and the Boards of directors of each regional FHLB.
As a system member, according to currently existing policies and procedures, the Bank is entitled to borrow from the Dallas FHLB provided it posts acceptable collateral. The Bank is also required to own a certain amount of capital stock in the FHLB. The Bank is in compliance with the stock ownership rules with respect to such advances, commitments and letters of credit and collateral requirements with respect to home mortgage loans and similar obligations. All loans, advances and other extensions of credit made by the FHLB to the Bank are secured by a portion of the respective mortgage loan portfolio, certain other investments and the capital stock of the FHLB held by the Bank.
Enforcement Powers. The bank regulatory agencies have broad enforcement powers, including the power to terminate deposit insurance, impose substantial fines and other civil and criminal penalties, and appoint a conservator or receiver. Failure to comply with applicable laws, regulations and supervisory agreements, breaches of fiduciary duty or the maintenance of unsafe and unsound conditions or practices could subject us or our subsidiaries, including the Bank, as well as their respective officers, directors, and other institution-affiliated parties, to administrative sanctions and potentially substantial civil money penalties. For example, the regulatory authorities may appoint the FDIC as conservator or receiver for a banking institution (or the FDIC may appoint itself, under certain circumstances) if any one or more of a number of circumstances exist, including, without limitation, the fact that the banking institution is undercapitalized and has no reasonable prospect of becoming adequately capitalized, fails to become adequately capitalized when required to do so, fails to submit a timely and acceptable capital restoration plan or materially fails to implement an accepted capital restoration plan.
Effect of Governmental Monetary Policies
The commercial banking business is affected not only by general economic conditions but also by U.S. fiscal policy and the monetary policies of the Federal Reserve. Some of the instruments of monetary policy available to the Federal Reserve include changes in the discount rate on member bank borrowings, the fluctuating availability of borrowings at the “discount window,” open market operations, the imposition of and changes in reserve requirements against member banks’ deposits and certain borrowings by banks and their affiliates and assets of foreign branches. These policies influence to a significant extent the overall growth of bank loans, investments, and deposits and the interest rates charged on loans or paid on deposits. We cannot predict the nature of future fiscal and monetary policies or the effect of these policies on our operations and activities, financial condition, results of operations, growth plans or future prospects.
Impact of Current Laws and Regulations
The cumulative effect of these laws and regulations, while providing certain benefits, adds significantly to the cost of our operations and thus have a negative impact on our profitability. There has also been a notable expansion in recent years of financial service providers that are not subject to the examination, oversight, and other rules and regulations to which we are subject. Those providers, because they are not so highly regulated, may have a competitive advantage over us and may continue to draw large amounts of funds away from traditional banking institutions, with a continuing adverse effect on the banking industry in general.
Future Legislation and Regulatory Reform
From time to time, various legislative and regulatory initiatives related to financial institutions are introduced in Congress and state legislatures. New regulations and statutes are regularly proposed that contain wide-ranging proposals for altering the structures, regulations and competitive relationships of financial institutions operating in the United States. We cannot predict whether or in what form any proposed regulation or statute will be adopted or the extent to which our business may be affected by any new regulation or statute. Future legislation, regulation and policies, and the effects of that legislation and regulation and those policies, may have a significant influence on our operations and activities, financial condition, results of operations, growth plans or future prospects and the overall growth and distribution of loans, investments and deposits. Such legislation, regulation and policies have had a significant effect on the operations and activities, financial condition, results of operations, growth plans and future prospects of commercial banks in the past and are expected to continue to do so.
ITEM 1A. Risk Factors.
In evaluating our business, you should consider carefully the factors described below. The occurrence of one or more of these events could significantly and adversely affect our business, prospects, financial condition, results of operations and cash flows. You should also consider the cautionary statement regarding the use of forward-looking statements elsewhere in this Report.
Risks Relating to our Business
As a business operating in the financial services industry, our business and operations may be adversely affected in numerous and complex ways by weak economic conditions.
Our businesses and operations, which primarily consist of lending money to customers in the form of loans, borrowing money from customers in the form of deposits and investing in securities, are sensitive to general business and economic conditions in the United States. The current economic environment is characterized by historically low interest rates, which impacts our ability to attract deposits and to generate attractive earnings through our loan and investment portfolio. Uncertainty about federal fiscal monetary and related policies, the medium and long-term fiscal outlook of the federal government, and future tax rates is a concern for businesses, consumers, and investors in the United States. Changes in any of these policies are influenced by macroeconomic conditions and other factors that are beyond our control. In addition, economic conditions in foreign countries, including global political hostilities or public health outbreaks and uncertainty over the stability of foreign currencies, could affect the stability of global financial markets, which could hinder domestic economic growth.
Adverse economic conditions in the United States and in foreign countries, including adverse conditions resulting from natural disasters and adverse weather, acts of terrorism, an outbreak of hostilities or other international or domestic calamities, epidemics and pandemics such as coronavirus, and other matters beyond our control, and the government policy responses to such conditions, could have an adverse effect on our business, financial condition, results of operations and prospects.
All of these factors could be detrimental to our business, and the interplay between these factors can be complex and unpredictable.
The geographic concentration of our business in the state of Louisiana and in Dallas imposes risks and may magnify the consequences of any regional or local economic downturn affecting our markets, including any downturn in the real estate sector.
We conduct our operations exclusively in the state of Louisiana and Dallas, Texas. As of December 31, 2019, the substantial majority of the loans in our loan portfolio were made to borrowers who live and/or conduct business in our markets and the substantial majority of our secured loans were secured by collateral located in our markets. Accordingly, we are exposed to risks associated with a lack of geographic diversification as any regional or local economic downturn that affects our markets, our existing or prospective borrowers, or property values in our markets may affect us and our profitability more significantly and more adversely than our competitors whose operations are less geographically focused.
The economic conditions in our markets are highly dependent on the real estate sector as well as the technology, financial services, insurance, transportation, manufacturing and energy sectors. Any downturn or adverse development in these sectors, particularly the real estate and energy sectors in our markets, could have a material adverse impact on our business, financial condition and results of operations, and future prospects. Any adverse economic developments, among other things, could negatively affect the volume of loan originations, increase the level of nonperforming assets, increase the rate of foreclosure losses on loans, and reduce the value of our loans.
We face significant competition to attract and retain customers, which could impair our growth, decrease our profitability or result in loss of market share.
We operate in the highly competitive banking industry and face significant competition for customers from bank and non-bank competitors, particularly regional and nationwide institutions, in originating loans, attracting deposits and providing other financial services. Our competitors are generally larger and may have significantly more resources, greater name recognition, and more extensive and established branch networks or geographic footprints than we do. Because of their scale, many of these competitors can be more aggressive than we can on loan and deposit pricing. Also, many of our non-bank competitors have fewer regulatory constraints and may have lower cost structures. We expect competition to continue to intensify due to financial institution consolidation; legislative, regulatory and technological changes; and the emergence of alternative banking sources.
Our ability to compete successfully will depend on a number of factors, including, among other things:
|
● |
our ability to develop, maintain and build long-term customer relationships based on top quality service, high ethical standards and safe, sound assets; |
|
● |
our scope, relevance and pricing of products and services offered to meet customer needs and demands; |
|
● |
the rate at which we introduce new products and services relative to our competitors; |
|
● |
customer satisfaction with our level of service; |
|
● |
our ability to expand our market position; |
|
● |
industry and general economic trends; and |
|
● |
our ability to keep pace with technological advances and to invest in new technology. |
Increased competition could require us to increase the rates we pay on deposits or lower the rates we offer on loans, which could reduce our profitability. Our failure to compete effectively in our primary markets could cause us to lose market share and could have an adverse effect on our business, financial condition and results of operations.
Our success is largely dependent upon our ability to successfully execute our business strategy, and failure to successfully execute our business strategy could have an adverse effect on our business, financial condition and results of operations.
Our success, including our ability to achieve our growth and profitability goals, is dependent on the ability of our management team to execute on our long-term business strategy, which requires them to, among other things:
|
● |
attract and retain experienced and talented bankers in each of our markets; |
|
● |
maintain adequate funding sources, including by continuing to attract stable, low-cost deposits; |
|
● |
increase our operating efficiency and profitability; |
|
● |
implement new technologies to enhance the client experience, keep pace with our competitors and improve efficiency; |
|
● |
attract and maintain commercial banking relationships with well-qualified businesses, real estate developers and investors with proven track records in our market areas; |
|
● |
attract sufficient loans that meet prudent credit standards, including in our commercial and industrial and owner-occupied commercial real estate loan categories; |
|
● |
maintain adequate liquidity and regulatory capital and comply with applicable federal and state banking regulations; |
|
● |
obtain federal and state regulatory approvals; |
|
● |
manage our credit, interest rate and liquidity risk; |
|
● |
develop new, and grow our existing, streams of noninterest income; |
|
● |
oversee the performance of third party service providers that provide material services to our business; and |
|
● |
maintain expenses in line with their current projections. |
Failure to achieve these strategic goals could adversely affect our ability to successfully implement our business strategies and could negatively impact our business, growth prospects, financial condition and results of operations. Furthermore, if we do not manage our growth effectively, our business, financial condition, results of operations and future prospects could be negatively affected, and we may not be able to continue to implement our business strategy and successfully conduct our operations.
We rely heavily on our executive management team and other key employees, and an unexpected loss of their service could have an adverse effect on our business, financial condition and results of operations.
Our success depends in large part on the performance of our key personnel, as well as on our ability to attract, motivate and retain highly qualified senior and middle management and other skilled employees. Competition for employees is intense, and the process of locating key personnel with the combination of skills and attributes required to execute our business plan may be lengthy. We may not be successful in retaining our key employees, and the unexpected loss of services of one or more of our key personnel could have an adverse effect on our business because of their skills, knowledge of our primary markets, years of industry experience and the difficulty of promptly finding qualified replacement personnel. If the services of any of our key personnel should become unavailable for any reason, we may not be able to identify and hire qualified persons on terms acceptable to us, or at all, which could have an adverse effect on our business, financial condition and results of operations.
Our ability to attract and retain profitable bankers is critical to the success of our business strategy, and any failure to do so could have a material adverse effect on our business, financial condition and results of operations.
Our ability to retain and grow our loans, deposits and fee income depends upon the business generation capabilities, reputation and relationship management skills of our bankers. If we were to lose the services of any of our bankers, including profitable bankers employed by banks that we may acquire, to a new or existing competitor or otherwise, we may not be able to retain valuable relationships and some of our customers could choose to use the services of a competitor instead of our services.
Our growth strategy also relies on our ability to attract and retain additional profitable bankers. We may face difficulties in recruiting and retaining bankers of our desired caliber, including as a result of competition from other financial institutions. In particular, many of our competitors are significantly larger with greater financial resources, and may be able to offer more attractive compensation packages and broader career opportunities. Additionally, we may incur significant expenses and expend significant time and resources on training, integration and business development before we are able to determine whether a new banker will be profitable or effective. If we are unable to attract and retain profitable bankers, or if our bankers fail to meet our expectations in terms of customer relationships and profitability, we may be unable to execute our business strategy, which could have an adverse effect on our business, financial condition and results of operations.
We may not be able to adequately measure and limit our credit risk, which could lead to unexpected losses.
Our business depends on our ability to successfully measure and manage credit risk. As a lender, we are exposed to the risk that the principal of, or interest on, a loan will not be repaid timely or at all or that the value of any collateral supporting a loan will be insufficient to cover our outstanding exposure. In addition, we are exposed to risks with respect to the period of time over which the loan may be repaid, risks relating to proper loan underwriting, risks resulting from changes in economic and industry conditions, and risks inherent in dealing with individual loans and borrowers. The creditworthiness of a borrower is affected by many factors including local market conditions and general economic conditions. If the overall economic climate in the United States, generally, or our market areas, specifically, experiences material disruption, our borrowers may experience difficulties in repaying their loans, the collateral we hold may decrease in value or become illiquid, and the level of nonperforming loans, charge-offs and delinquencies could rise and require significant additional provisions for credit losses. Additional factors related to the credit quality of commercial loans include the quality of the management of the business and the borrower’s ability both to properly evaluate changes in the supply and demand characteristics affecting our market for products and services and to effectively respond to those changes. Additional factors related to the credit quality of commercial real estate loans include tenant vacancy rates and the quality of management of the property.
Our risk management practices, such as monitoring the concentration of our loans within specific industries and our credit approval, review and administrative practices, may not adequately reduce credit risk, and our credit administration personnel, policies and procedures may not adequately adapt to changes in economic or any other conditions affecting customers and the quality of the loan portfolio. In addition, many of our loans are made to small and midsized businesses that may be less able to withstand competitive, economic and financial pressures than larger borrowers. A failure to effectively measure and limit the credit risk associated with our loan portfolio may result in loan defaults, foreclosures and additional charge-offs, and may necessitate that we significantly increase our allowance for credit losses, each of which could adversely affect our net income. As a result, our inability to successfully manage credit risk could have an adverse effect on our business, financial condition and results of operations.
Our commercial real estate loan portfolio exposes us to risks that may be greater than the risks related to our other mortgage loans.
Our loan portfolio includes owner-occupied and non-owner-occupied commercial real estate loans for individuals and businesses for various purposes, which are secured by commercial properties, as well as real estate acquisition, construction and development loans. As of December 31, 2019, approximately $941.9 million, or 55.1% of our loan portfolio is secured by commercial real estate. These loans typically involve repayment dependent upon income generated, or expected to be generated, by the property securing the loan in amounts sufficient to cover operating expenses and debt service, which may be adversely affected by changes in the economy or local market conditions. These loans expose us to greater credit risk than loans secured by residential real estate because the collateral securing these loans typically cannot be liquidated as easily as residential real estate because there are fewer potential purchasers of the collateral. Additionally, non-owner-occupied commercial real estate loans generally involve relatively large balances to single borrowers or related groups of borrowers. Accordingly, charge-offs on non-owner-occupied commercial real estate loans may be larger on a per loan basis than those incurred with our residential or consumer loan portfolios. Unexpected deterioration in the credit quality of our commercial real estate loan portfolio would require us to increase our provision for loan losses, which would reduce our profitability, and could adversely affect our business, financial condition, results of operations and prospects.
Because a significant portion of our loan portfolio is comprised of real estate loans, negative changes in the economy affecting real estate values and liquidity could impair the value of collateral securing our real estate loans and result in loan and other losses.
The market value of real estate can fluctuate significantly in a short period of time. As of December 31, 2019, approximately $1.2 billion, or 72.2%, of our total loans was comprised of loans with real estate as a primary or secondary component of collateral. Adverse changes affecting real estate values and the liquidity of real estate in one or more of our markets could increase the credit risk associated with our loan portfolio, and could result in losses that adversely affect our business, financial condition, and results of operation. Negative changes in the economy affecting real estate values and liquidity in our market areas could significantly impair the value of property pledged as collateral on loans and affect our ability to sell the collateral upon foreclosure without a loss or additional losses. Collateral may have to be sold for less than the outstanding balance of the loan, which could result in losses on such loans. Such declines and losses could have adverse effect on our business, financial condition and results of operations. If real estate values decline, it is also more likely that we would be required to increase our allowance for loan losses, which could have an adverse effect on our business, financial condition and results of operations.
We engage in lending secured by real estate and may be forced to foreclose on the collateral and own the underlying real estate, subjecting us to the costs and potential risks associated with the ownership of the real property.
Since we originate loans secured by real estate, we may have to foreclose on the collateral property to protect our investment and may thereafter own and operate such property, in which case we would be exposed to the risks inherent in the ownership of real estate. As of December 31, 2019, we held approximately $4.0 million in other real estate owned, or “OREO”. The amount that we, as a mortgagee, may realize after a default is dependent upon factors outside of our control, including, but not limited to general or local economic conditions, environmental cleanup liability, assessments, interest rates, real estate tax rates, operating expenses of the mortgaged properties, ability to obtain and maintain adequate occupancy of the properties, zoning laws, governmental and regulatory rules, and natural disasters. Our inability to manage the amount of costs or size of the risks associated with the ownership of real estate, or writedowns in the value of OREO, could have an adverse effect on our business, financial condition and results of operations.
A large portion of our loan portfolio is comprised of commercial loans secured by receivables, inventory, equipment or other commercial collateral, the deterioration in value of which could expose us to credit losses and could adversely affect our business, financial condition and results of operations.
As of December 31, 2019, approximately $390.4 million, or 22.8%, of our total loans were commercial loans to businesses. In general, these loans are collateralized by general business assets, including, among other things, accounts receivable, inventory and equipment and most are backed by a personal guaranty of the borrower or principal. These commercial loans are typically larger in amount than loans to individuals and, therefore, have the potential for larger losses on a single loan basis. Additionally, the repayment of commercial loans is subject to the ongoing business operations of the borrower. The collateral securing such loans generally includes movable property, such as equipment and inventory, which may decline in value more rapidly than we anticipate exposing us to increased credit risk. In addition, a portion of our customer base, including customers in the energy and real estate business, may be exposed to volatile businesses or industries which are sensitive to commodity prices or market fluctuations, such as energy prices. Accordingly, negative changes in commodity prices and real estate values and liquidity could impair the value of the collateral securing these loans. Significant adverse changes in the economy or local market conditions in which our commercial lending customers operate could cause rapid declines in loan collectability and the values associated with general business assets resulting in inadequate collateral coverage that may expose us to credit losses and could adversely affect our business, financial condition and results of operations.
Our portfolio contains a number of large loans to certain borrowers, and deterioration in the financial condition of these large loans could have a significant adverse impact on our asset quality.
Our growth over the past several years has been partially attributable to our ability to originate and retain relatively large loans given our asset size. As of December 31, 2019, our average loan size (including unfunded commitments) was approximately $253,000. Further, as of December 31, 2019, our 20 largest borrowing relationships ranged from approximately $11.4 million to $23.8 million (including unfunded commitments) and averaged approximately $14.1 million in total commitments and $9.9 million in principal balance, respectively. Along with other risks inherent in our loans, such as the deterioration of the underlying businesses or property securing these loans, the higher average size of our loans presents a risk to our lending operations. Because we have a large average loan size, if only a few of our largest borrowers become unable to repay their loan obligations as a result of economic or market conditions or personal circumstances, our nonperforming loans and our provision for loan losses could increase significantly, which could have an adverse effect on our business, financial condition and results of operations.
Our allowance for loan losses may prove to be insufficient to absorb losses inherent in our loan portfolio, which could have a material adverse effect on our business, financial condition and results of operations.
We maintain an allowance for loan losses that represents management’s judgment of probable losses and risks inherent in our loan portfolio. As of December 31, 2019, our allowance for loan losses totaled $12.1 million, which represents approximately 0.71% of our total loans held for investment. The level of the allowance reflects management’s continuing evaluation of general economic conditions, diversification and seasoning of the loan portfolio, historic loss experience, identified credit problems, delinquency levels and adequacy of collateral. The determination of the appropriate level of the allowance for loan losses is inherently highly subjective and requires us to make significant estimates of and assumptions regarding current credit risks and future trends, all of which may undergo material changes. Inaccurate management assumptions, deterioration of economic conditions affecting borrowers, new information regarding existing loans, identification or deterioration of additional problem loans, acquisition of problem loans and other factors, both within and outside of our control, may require us to increase our allowance for loan losses. In addition, our regulators, as an integral part of their periodic examination, review our methodology for calculating, and the adequacy of, our allowance for loan losses and may direct us to make additions to the allowance based on their judgments about information available to them at the time of their examination. Further, if actual charge-offs in future periods exceed the amounts allocated to the allowance for loan losses, we may need additional provisions for loan losses to restore the adequacy of our allowance for loan losses. Finally, the measure of our allowance for loan losses is dependent on the adoption and interpretation of accounting standards. The Financial Accounting Standards Board recently issued a new credit impairment model, the Current Expected Credit Loss, or CECL model, which will become applicable to us on January 1, 2023, unless adopted earlier. CECL will require financial institutions to estimate and develop a provision for credit losses at origination for the lifetime of the loan, as opposed to reserving for incurred or probable losses up to the balance sheet date. Under the CECL model, credit deterioration would be reflected in the income statement in the period of origination or acquisition of the loan, with changes in expected credit losses due to further credit deterioration or improvement reflected in the periods in which the expectation changes. Accordingly, the CECL model could require financial institutions like the Bank to increase their allowances for loan losses. Moreover, the CECL model likely would create more volatility in our level of allowance for loan losses. If we are required to materially increase our level of allowance for loan losses for any reason, such increase could adversely affect our business, financial condition and results of operations.
The small-to-midsized businesses that we lend to may have fewer resources to weather adverse business developments, which may impair a borrower’s ability to repay a loan, and such impairment could have a material adverse effect on our business, financial condition and results of operations.
We focus our business development and marketing strategy primarily on small-to-midsized businesses. Small-to-midsized businesses frequently have smaller market shares than their competition, may be more vulnerable to economic downturns, often need substantial additional capital to expand or compete and may experience substantial volatility in operating results, any of which may impair a borrower’s ability to repay a loan. In addition, the success of a small-to-midsized business often depends on the management skills, talents and efforts of one or two people or a small group of people, and the death, disability or resignation of one or more of these people could have an adverse impact on the business and its ability to repay its loan. If general economic conditions negatively impact the markets in which we operate and small-to-midsized businesses are adversely affected or our borrowers are otherwise harmed by adverse business developments, this, in turn, could have a material adverse effect on our business, financial condition and results of operations.
The borrowing needs of our customers may increase, especially during a challenging economic environment, which could result in increased borrowing against our contractual obligations to extend credit.
A commitment to extend credit is a formal agreement to lend funds to a customer as long as there is no violation of any condition established under the agreement. The actual borrowing needs of our customers under these credit commitments have historically been lower than the contractual amount of the commitments. A significant portion of these commitments expire without being drawn upon. Because of the credit profile of our customers, we typically have a substantial amount of total unfunded credit commitments, which is not reflected on our balance sheet. As of December 31, 2019, we had $389.9 million in unfunded credit commitments to our customers. Actual borrowing needs of our customers may exceed our expectations, especially during a challenging economic environment when our customers’ companies may be more dependent on our credit commitments due to the lack of available credit elsewhere, the increasing costs of credit, or the limited availability of financings from venture firms. This could adversely affect our liquidity, which could impair our ability to fund operations and meet obligations as they become due and could have a material adverse effect on our business, financial condition and results of operations.
Our ability to maintain our reputation is critical to the success of our business.
Our business plan emphasizes relationship banking. We have benefited from strong relationships with and among our customers. As a result, our reputation is one of the most valuable components of our business. Our growth over the past several years has depended on attracting new customers from competing financial institutions and increasing our market share, primarily by the involvement in our primary markets and word-of-mouth advertising, rather than on growth in the market for banking services in our primary markets. As such, we strive to enhance our reputation by recruiting, hiring and retaining employees who share our core values of being an integral part of the communities we serve and delivering superior service to our customers. If our reputation is negatively affected by the actions of our employees or otherwise, our existing relationships may be damaged. We could lose some of our existing customers, including groups of large customers who have relationships with each other, and we may not be successful in attracting new customers. Any of these developments could have an adverse effect on our business, financial condition and results of operations.
Our business has grown rapidly, and we may not be able to maintain our historical rate of growth, which could have an adverse effect on our ability to successfully implement our business strategy.
Our business has grown rapidly. Financial institutions that grow rapidly can experience significant difficulties as a result of rapid growth. Furthermore, our primary strategy focuses on organic growth, supplemented by acquisitions of banking teams or other financial institutions. We may be unable to execute on aspects of our growth strategy to sustain our historical rate of growth or we may be unable to grow at all. More specifically, we may be unable to generate sufficient new loans and deposits within acceptable risk and expense tolerances, obtain the personnel or funding necessary for additional growth or find suitable banking teams or acquisition candidates. Various factors, such as economic conditions and competition, may impede or prohibit the growth of our operations, the opening of new branches, and the consummation of acquisitions. Further, we may be unable to attract and retain experienced bankers, which could adversely affect our growth. The success of our strategy also depends on our ability to effectively manage growth, which is dependent upon a number of factors, including our ability to adapt existing credit, operational, technology and governance infrastructure to accommodate expanded operations. If we fail to build infrastructure sufficient to support rapid growth or fail to implement one or more aspects of our strategy, we may be unable to maintain historical earnings trends, which could have an adverse effect on our business, financial condition and results of operations.
We may not be able to manage the risks associated with our anticipated growth and expansion through de novo branching.
Our business strategy includes evaluating strategic opportunities to grow through de novo branching, and we believe that banking location expansion has been meaningful to our growth since inception. De novo branching carries with it certain potential risks, including significant startup costs and anticipated initial operating losses; an inability to gain regulatory approval; an inability to secure the services of qualified senior management to operate the de novo banking location and successfully integrate and promote our corporate culture; poor market reception for de novo banking locations established in markets where we do not have a preexisting reputation; challenges posed by local economic conditions; challenges associated with securing attractive locations at a reasonable cost; and the additional strain on management resources and internal systems and controls. Failure to adequately manage the risks associated with our anticipated growth through de novo branching could have an adverse effect on our business, financial condition and results of operations.
We may pursue acquisitions in the future, which could expose us to financial, execution and operational risks that could have an adverse effect on our business, financial condition, results of operations and growth prospects.
Although we generally plan to continue to grow our business organically, we may from time to time consider acquisition opportunities that we believe complement our activities and have the ability to enhance our profitability. Our acquisition activities could be material to our business and involve a number of risks, including those associated with:
|
● |
the identification of suitable candidates for acquisition; |
|
● |
the diversion of management attention from the operation of our existing business to identify, evaluate and negotiate potential transactions; |
|
● |
the ability to attract funding to support additional growth within acceptable risk tolerances; |
|
● |
the use of inaccurate estimates and judgments to evaluate credit, operations, management and market risks with respect to the target institution or assets; |
|
● |
the ability to maintain asset quality; |
|
● |
the adequacy of due diligence and the potential exposure to unknown or contingent liabilities related to the acquisition |
|
● |
the retention of customers and key personnel, including bankers; |
|
● |
the timing and uncertainty associated with obtaining necessary regulatory approvals; |
|
● |
the incurrence of an impairment of goodwill associated with an acquisition and adverse effects on our results of operations |
|
● |
the ability to successfully integrate acquired businesses; and |
|
● |
the maintenance of adequate regulatory capital. |
The market for acquisition targets is highly competitive, which may adversely affect our ability to find acquisition candidates that fit our strategy and standards at acceptable prices. We face significant competition in pursuing acquisition targets from other banks and financial institutions, many of which possess greater financial, human, technical and other resources than we do. Our ability to compete in acquiring target institutions will depend on our available financial resources to fund the acquisitions, including the amount of cash and cash equivalents we have and the liquidity and value of our common stock. In addition, increased competition may also drive up the acquisition consideration that we will be required to pay in order to successfully capitalize on attractive acquisition opportunities. To the extent that we are unable to find suitable acquisition targets, an important component of our growth strategy may not be realized.
Acquisitions of financial institutions also involve operational risks and uncertainties, such as unknown or contingent liabilities with no available manner of recourse, exposure to unexpected problems such as asset quality, the retention of key employees and customers, and other issues that could negatively affect our business. We may not be able to complete future acquisitions or, if completed, we may not be able to successfully integrate the operations, technology platforms, management, products and services of the entities that we acquire or to realize our attempts to eliminate redundancies. The integration process may also require significant time and attention from our management that would otherwise be directed toward servicing existing business and developing new business. Failure to successfully integrate the entities we acquire into our existing operations in a timely manner may increase our operating costs significantly and could have an adverse effect on our business, financial condition and results of operations. Further, acquisitions typically involve the payment of a premium over book and market values and, therefore, some dilution of our tangible book value and net income per share may occur in connection with any future acquisition, and the carrying amount of any goodwill that we currently maintain or may acquire may be subject to impairment in future periods.
Interest rate shifts could have an adverse effect on our business, financial condition, results of operations and growth prospects.
The majority of our banking assets are monetary in nature and subject to risk from changes in interest rates. Like most financial institutions, our earnings and cash flows depend to a great extent upon the level of our net interest income, or the difference between the interest income we earn on loans, investments and other interest-earning assets, and the interest we pay on interest-bearing liabilities, such as deposits and borrowings. Changes in interest rates can increase or decrease our net interest income, because different types of assets and liabilities may react differently, and at different times, to market interest rate changes. When interest-bearing liabilities mature or reprice more quickly, or to a greater degree than interest-earning assets in a period, an increase in interest rates could reduce net interest income. Similarly, when interest-earning assets mature or reprice more quickly, or to a greater degree than interest-bearing liabilities, falling interest rates could reduce net interest income. As of December 31, 2019, 30.4% of our earning assets and 56.1% of our interest-bearing liabilities were variable rate. Our interest sensitivity profile was asset sensitive as of December 31, 2019, meaning that we estimate our net interest income would increase more from rising interest rates than from falling interest rates.
Additionally, an increase in interest rates may, among other things, reduce the demand for loans and our ability to originate loans and decrease loan repayment rates. A decrease in the general level of interest rates may affect us through, among other things, increased prepayments on our loan portfolio and increased competition for deposits. Accordingly, changes in the level of market interest rates affect our net yield on interest-earning assets, loan origination volume, loan portfolio and our overall results. Although our asset-liability management strategy is designed to control and mitigate exposure to the risks related to changes in market interest rates, those rates are affected by many factors outside of our control, including governmental monetary policies, inflation, deflation, recession, changes in unemployment, the money supply, international disorder and instability in domestic and foreign financial markets.
The markets in which we operate are susceptible to hurricanes and other natural disasters and adverse weather, which could result in a disruption of our operations and increases in loan losses.
A significant portion of our business is generated from markets that have been, and may continue to be, damaged by major hurricanes, floods, tropical storms, tornadoes and other natural disasters and adverse weather. Natural disasters can disrupt our operations, cause widespread property damage, and severely depress the local economies in which we operate. If the economies in our primary markets experience an overall decline as a result of a natural disaster, adverse weather, or other disaster, demand for loans and our other products and services could be reduced. In addition, the rates of delinquencies, foreclosures, bankruptcies and losses on loan portfolios may increase substantially, as uninsured property losses or sustained job interruption or loss may materially impair the ability of borrowers to repay their loans. Moreover, the value of real estate or other collateral that secures the loans could be materially and adversely affected by a disaster. A disaster could, therefore, result in decreased revenue and loan losses that could have an adverse effect on our business, financial condition and results of operations.
We earn income by originating residential mortgage loans for resale in the secondary mortgage market, and disruptions in that market could reduce our operating income.
Historically, we have earned income by originating mortgage loans for sale in the secondary market. A historical focus of our loan origination and sales activities has been to enter into formal commitments and informal agreements with larger banking companies and mortgage investors. Under these arrangements, we originate single family mortgages that are priced and underwritten to conform to previously agreed criteria before loan funding and are delivered to the investor shortly after funding. However, in the recent past, disruptions in the secondary market for residential mortgage loans have limited the market for, and liquidity of, most mortgage loans other than conforming Fannie Mae and Federal Home Loan Mortgage Corporation, or Freddie Mac, loans. The effects of these disruptions in the secondary market for residential mortgage loans may reappear.
In addition, because government-sponsored entities like Fannie Mae and Freddie Mac, who account for a substantial portion of the secondary market, are governed by federal law, any future changes in laws that significantly affect the activity of these entities could, in turn, adversely affect our operations. In September 2008, Fannie Mae and Freddie Mac were placed into conservatorship by the federal government. The federal government has for many years considered proposals to reform Fannie Mae and Freddie Mac, but the results of any such reform and their impact on us are difficult to predict. To date, no reform proposal has been enacted.
These disruptions may not only affect us but also the ability and desire of mortgage investors and other banks to purchase residential mortgage loans that we originate. As a result, we may not be able to maintain or grow the income we receive from originating and reselling residential mortgage loans, which would reduce our operating income. Additionally, we may be required to hold mortgage loans that we originated for sale, increasing our exposure to interest rate risk and the value of the residential real estate that serves as collateral for the mortgage loan.
New lines of business, products, product enhancements or services may subject us to additional risks.
From time to time, we implement new lines of business, or offer new products and product enhancements as well as new services within our existing lines of business and we will continue to do so in the future. There are substantial risks and uncertainties associated with these efforts, particularly in instances where the markets are not fully developed. In implementing, developing or marketing new lines of business, products, product enhancements or services, we may invest significant time and resources, although we may not assign the appropriate level of resources or expertise necessary to make these new lines of business, products, product enhancements or services successful or to realize their expected benefits. Further, initial timetables for the introduction and development of new lines of business, products, product enhancements or services may not be achieved, and price and profitability targets may not prove feasible. External factors, such as compliance with regulations, competitive alternatives and shifting market preferences, may also impact the ultimate implementation of a new line of business or offerings of new products, product enhancements or services. Furthermore, any new line of business, product, product enhancement or service could have a significant impact on the effectiveness of our system of internal controls. Failure to successfully manage these risks in the development and implementation of new lines of business or offerings of new products, product enhancements or services could have an adverse impact on our business, financial condition or results of operations.
A lack of liquidity could impair our ability to fund operations, which could have an adverse effect on our business, financial condition and results of operations.
Liquidity is essential to our business, and we monitor our liquidity and manage our liquidity risk at the holding company and bank levels. We rely on our ability to generate deposits and effectively manage the repayment and maturity schedules of our loans and investment securities, respectively, to ensure that we have adequate liquidity to fund our operations. An inability to raise funds through deposits, borrowings, the sale of our investment securities, the sale of loans, and other sources could have a substantial negative effect on our liquidity. Our most important source of funds is deposits. Deposit balances can decrease when customers perceive alternative investments as providing a better risk/return tradeoff. If customers move money out of bank deposits and into other investments such as money market funds, we would lose a relatively low-cost source of funds, increasing our funding costs and reducing our net interest income and net income.
Other primary sources of funds consist of cash flows from operations, maturities and sales of investment securities, and proceeds from the issuance and sale of our equity and debt securities to investors. Additional liquidity is provided by the ability to borrow from the Federal Reserve Bank of Atlanta, or Federal Reserve Bank, and the Federal Home Loan Bank of Dallas, or FHLB. We also borrow funds from third-party lenders, such as other financial institutions. Our access to funding sources in amounts adequate to finance or capitalize our activities, or on terms that are acceptable to us, could be impaired by factors that affect us directly or the financial services industry or economy in general, such as disruptions in the financial markets or negative views and expectations about the prospects for the financial services industry. Our access to funding sources could also be affected by a decrease in the level of our business activity as a result of a downturn in our primary market area or by one or more adverse regulatory actions against us.
Any decline in available funding could adversely impact our ability to originate loans, invest in securities, meet our expenses, or to fulfill obligations such as repaying our borrowings or meeting deposit withdrawal demands, any of which could have a material adverse impact on our liquidity and could, in turn, have an adverse effect on our business, financial condition and results of operations. In addition, because our primary asset at the holding company level is the Bank, our liquidity at the holding company level depends primarily on our receipt of dividends from the Bank. If the Bank is unable to pay dividends to us for any reason, we may be unable to satisfy our holding company level obligations, which include funding operating expenses and debt service.
We have a concentration of deposit accounts with state and local municipalities that is a material source of our funding, and the loss of these deposits or significant fluctuations in balances held by these public bodies could force us to fund our business through more expensive and less stable sources.
As of December 31, 2019, $302.2 million, or approximately 17.0%, of our total deposits consisted of deposit accounts of public bodies, such as state or local municipalities, or public funds. These types of deposits are often secured and typically fluctuate on a seasonal basis due to timing differences between tax collection and expenditures. Municipal deposits are also generally more sensitive to interest rates and may require competitive rates at placement and subsequent rollover dates, which may make it more difficult for the Bank to attract and retain public and municipal deposits. Withdrawals of deposits or significant fluctuation in a material portion of our largest public fund depositors could force us to rely more heavily on borrowings and other sources of funding for our business and withdrawal demands, adversely affecting our net interest margin and results of operations. We may also be forced, as a result of any withdrawal of deposits, to rely more heavily on other, potentially more expensive and less stable funding sources. Consequently, the occurrence of any of these events could have an adverse effect on our business, financial condition and results of operations.
We may need to raise additional capital in the future, and if we fail to maintain sufficient capital, we may not be able to maintain regulatory compliance, which could have an adverse effect on our business, financial condition and results of operations.
We face significant capital and other regulatory requirements as a financial institution. We may need to raise additional capital in the future to provide us with sufficient capital resources and liquidity to meet our commitments and business needs, which could include the possibility of financing acquisitions. In addition, we, on a consolidated basis, and b1BANK, on a stand-alone basis, must meet certain regulatory capital requirements and maintain sufficient liquidity in such amounts as the regulators may require from time to time. Importantly, regulatory capital requirements could increase from current levels, which could require us to raise additional capital or reduce our operations. Even if we satisfy all applicable regulatory capital minimums, our regulators could ask us to maintain capital levels which are significantly in excess of those minimums. Our ability to raise additional capital depends on conditions in the capital markets, economic conditions and a number of other factors, including investor perceptions regarding the banking industry, market conditions and governmental activities, and on our financial condition and performance. Accordingly, we cannot assure you that we will be able to raise additional capital if needed or on terms acceptable to us. If we fail to maintain capital to meet regulatory requirements, we could be subject to enforcement actions, which could have an adverse effect on our business, financial condition and results of operations.
We utilize alternative sources of funding, which may become more expensive or may not be available in the future, which could have an adverse effect on our business, financial condition and results of operations.
Along with its core deposits, the Bank utilizes alternative funding methods, including brokered and wholesale time deposits, short- and long-term borrowings through a correspondent bank, FHLB advances, securities sold under agreements to repurchase and Federal Funds Purchased borrowings. As of December 31, 2019, brokered and wholesale deposits comprised 12.7% of our total deposits, and our borrowings comprised 65.2% of our total shareholders’ equity. If these funding sources become more expensive or difficult to access, our net interest income may decline, our liquidity and ability to make new loans may be impaired, or we may fail to meet regulatory capital requirements, any of which could have an adverse effect on our business, financial condition and results of operations.
The fair value of our investment securities can fluctuate due to factors outside of our control.
As of December 31, 2019, the fair value of our investment securities portfolio was approximately $278.2 million, which included a net unrealized gain of approximately $3.3 million. Factors beyond our control can significantly influence the fair value of securities in our portfolio and can cause potential adverse changes to the fair value of these securities. These factors include, but are not limited to, rating agency actions in respect of the securities, defaults by the issuer or with respect to the underlying securities, and changes in market interest rates and continued instability in the capital markets. Any of these factors, among others, could cause other-than-temporary impairments and realized or unrealized losses in future periods and declines in other comprehensive income, which could have an adverse effect on our business, results of operations, financial condition and future prospects. The process for determining whether impairment of a security is other-than-temporary often requires complex, subjective judgments about whether there has been a significant deterioration in the financial condition of the issuer, whether management has the intent or ability to hold a security for a period of time sufficient to allow for any anticipated recovery in fair value, the future financial performance and liquidity of the issuer and any collateral underlying the security, and other relevant factors.
If we fail to maintain an effective system of disclosure controls and procedures and internal control over financial reporting, we may not be able to accurately report our financial results or prevent fraud.
Ensuring that we have adequate disclosure controls and procedures, including internal controls over financial reporting, in place so we can produce accurate financial statements on a timely basis is costly and time-consuming and needs to be reevaluated frequently. As a public company, we are subject to the requirements of Section 404 of the Sarbanes-Oxley Act of 2002, or the Sarbanes-Oxley Act, which require annual management assessments of the effectiveness of our internal controls over financial reporting and, when we cease to be an emerging growth company under the JOBS Act, will require a report by our independent auditors addressing these assessments. Our management may conclude that our internal controls over financial reporting are not effective due to our failure to cure any identified material weakness or otherwise. Moreover, even if our management concludes that our internal controls over financial reporting are effective, our independent registered public accounting firm may not conclude that our internal controls over financial reporting are effective. In the future, our independent registered public accounting firm may not be satisfied with our internal controls over financial reporting or the level at which our controls are documented, designed, operated or reviewed, or we and our accounting firm may have differences in opinion regarding the applicable requirements. In addition, during the course of the evaluation, documentation and testing of our internal controls over financial reporting, we may identify deficiencies that we may not be able to remediate in time to meet the deadline imposed by the Securities and Exchange Commission, or the SEC, for compliance with the requirements of Section 404 of the Sarbanes-Oxley Act. Any such deficiencies may also subject us to adverse regulatory consequences. If we fail to achieve and maintain the adequacy of our internal controls over financial reporting, as these standards are modified, supplemented or amended from time to time, we may be unable to report our financial information on a timely basis, we may not be able to conclude on an ongoing basis that we have effective internal controls over financial reporting in accordance with the Sarbanes-Oxley Act, and we may suffer adverse regulatory consequences. There could also be a decline in investor confidence as to the reliability our financial statements, which could result in a decline in the value of our capital stock.
Our financial results depend on management’s selection of accounting methods and certain assumptions and estimates.
Our financial condition and results of operations are based on our consolidated financial statements, which have been prepared in accordance with generally accepted accounting principles in the United States, or GAAP, and with general practices within the financial services industry. The preparation of financial statements in conformity with GAAP requires us to make estimates and assumptions that affect the reported amounts of certain assets and liabilities, disclosure of contingent assets and liabilities and the reported amount of related revenues and expenses. Certain accounting policies inherently are based to a greater extent on estimates, assumptions and judgments of management and, as such, have a greater possibility of producing results that could be materially different than originally reported. They require management to make subjective or complex judgments, estimates or assumptions, and changes in those estimates or assumptions could have a significant impact on our consolidated financial statements. These critical accounting policies include the allowance for loan losses, accounting for income taxes, the determination of fair value for financial instruments and accounting for stock-based compensation. Because of the uncertainty of estimates involved in these matters, we may be required to significantly increase our allowance for loan losses or sustain loan losses that are significantly higher than the reserve provided, significantly increase our accrued tax liability or otherwise incur charges that could have a material adverse effect on our business, financial condition and results of operations.
From time to time, the Financial Accounting Standards Board, or FASB, and the SEC change the financial accounting and reporting standards or the interpretation of such standards that govern the preparation of our consolidated financial statements which could affect our critical accounting policies and the estimates and assumptions made by management. These changes are beyond our control, can be difficult to predict, and could materially impact how we report our financial condition and results of operations.
We have a continuing need for technological change, and we may not have the resources to effectively implement new technology, or we may experience operational challenges when implementing new technology.
The financial services industry is undergoing rapid technological changes with frequent introductions of new technology-driven products and services. In addition to better serving customers, the effective use of technology increases efficiency and enables financial institutions to reduce costs. Our future success will depend, at least in part, upon our ability to address the needs of our customers by using technology to provide products and services that will satisfy customer demands for convenience as well as to create additional efficiencies in our operations as we continue to grow and expand our products and service offerings. We may experience operational challenges as we implement these new technology enhancements or products, which could result in us not fully realizing the anticipated benefits from such new technology or require us to incur significant costs to remedy any such challenges in a timely manner.
Many of our larger competitors have substantially greater resources to invest in technological improvements. As a result, they may be able to offer additional or superior products compared to those that we will be able to provide, which would put us at a competitive disadvantage. Accordingly, we may lose customers seeking new technology-driven products and services to the extent we are unable to provide such products and services.
We rely on third parties to provide key components of our business infrastructure, and a failure of these parties to perform for any reason could disrupt our operations.
Third parties provide key components of our business infrastructure such as data processing, internet connections, network access, core application processing, statement production and account analysis. Our business depends on the successful and uninterrupted functioning of our information technology and telecommunications systems and third-party servicers. The failure of these systems, or the termination of a third-party software license or service agreement on which any of these systems is based, could interrupt our operations. Because our information technology and telecommunications systems interface with and depend on third-party systems, we could experience service denials if demand for such services exceeds capacity or such third-party systems fail or experience interruptions. Replacing vendors or addressing other issues with our third-party service providers could entail significant delay and expense. If we are unable to efficiently replace ineffective service providers, or if we experience a significant, sustained or repeated, system failure or service denial, it could compromise our ability to operate effectively, damage our reputation, result in a loss of customer business, and subject us to additional regulatory scrutiny and possible financial liability, any of which could have an adverse effect on our business, financial condition and results of operations.
We could be subject to losses, regulatory action or reputational harm due to fraudulent and negligent acts on the part of loan applicants, our employees and vendors.
In deciding whether to extend credit or enter into other transactions with clients and counterparties, and the terms of any such transaction, we may rely on information furnished by or on behalf of clients and counterparties, including financial statements, property appraisals, title information, employment and income documentation, account information and other financial information. We may also rely on representations of clients and counterparties as to the accuracy and completeness of that information and, with respect to financial statements, on reports of independent auditors. Any such misrepresentation or incorrect or incomplete information, whether fraudulent or inadvertent, may not be detected prior to funding. In addition, one or more of our employees or vendors could cause a significant operational breakdown or failure, either as a result of human error or where an individual purposefully sabotages or fraudulently manipulates our loan documentation, operations or systems. Whether a misrepresentation is made by the applicant or another third party, we generally bear the risk of loss associated with the misrepresentation. A loan subject to a material misrepresentation is typically unsellable or subject to repurchase if it is sold prior to detection of the misrepresentation. The sources of the misrepresentations may also be difficult to locate, and we may be unable to recover any of the monetary losses we may suffer as a result of the misrepresentations. Any of these developments could have an adverse effect on our business, financial condition and results of operations.
Unauthorized access, cyber-crime and other threats to data security may require significant resources, harm our reputation, and otherwise have an adverse effect on our business, financial condition and results of operations.
We necessarily collect, use and hold personal and financial information concerning individuals and businesses with which we have a banking relationship. Threats to data security, including unauthorized access, and cyber-attacks, rapidly emerge and change, exposing us to additional costs for protection or remediation and competing time constraints to secure our data in accordance with customer expectations and statutory and regulatory privacy and other requirements. It is difficult or impossible to defend against every risk being posed by changing technologies, as well as criminals intent on committing cyber-crime. Increasing sophistication of cyber-criminals and terrorists make keeping up with new threats difficult and could result in a breach. Controls employed by our information technology department and our other employees and vendors could prove inadequate. We could also experience a breach due to intentional or negligent conduct on the part of employees or other internal sources, software bugs or other technical malfunctions, or other causes. As a result of any of these threats, our customer accounts may become vulnerable to account takeover schemes or cyber-fraud. Our systems and those of our third party vendors may also become vulnerable to damage or disruption due to circumstances beyond our or their control, such as from catastrophic events, power anomalies or outages, natural disasters, network failures, and viruses and malware.
A breach of our security that results in unauthorized access to our data could expose us to a disruption or challenges relating to our daily operations as well as to data loss, litigation, damages, fines and penalties, significant increases in compliance costs, and reputational damage, any of which could have an adverse effect on our business, results of operations, financial condition and future prospects.
We are subject to environmental liability risk associated with our lending activities.
In the course of our business, we may purchase real estate, or we may foreclose on and take title to real estate. As a result, we could be subject to environmental liabilities with respect to these properties. We may be held liable to a governmental entity or to third parties for property damage, personal injury, investigation and clean-up costs incurred by these parties in connection with environmental contamination or may be required to investigate or clean up hazardous or toxic substances or chemical releases at a property. The costs associated with investigation or remediation activities could be substantial. In addition, if we are the owner or former owner of a contaminated site, we may be subject to common law claims by third parties based on damages and costs resulting from environmental contamination emanating from the property. Any significant environmental liabilities could cause an adverse effect on our business, financial condition and results of operations.
We are subject to claims and litigation pertaining to intellectual property.
Banking and other financial services companies, such as ours, rely on technology companies to provide information technology products and services necessary to support their day-to-day operations. Technology companies frequently enter into litigation based on allegations of patent infringement or other violations of intellectual property rights. In addition, patent holding companies seek to monetize patents they have purchased or otherwise obtained. Competitors of our vendors, or other individuals or companies, may from time to time claim to hold intellectual property sold to us by our vendors. Such claims may increase in the future as the financial services sector becomes more reliant on information technology vendors. The plaintiffs in these actions frequently seek injunctions and substantial damages.
Regardless of the scope or validity of such patents or other intellectual property rights, or the merits of any claims by potential or actual litigants, we may have to engage in protracted litigation. Such litigation is often expensive, time-consuming, disruptive to our operations and distracting to management. If we are found to infringe one or more patents or other intellectual property rights, we may be required to pay substantial damages or royalties to a third party. In certain cases, we may consider entering into licensing agreements for disputed intellectual property, although no assurance can be given that such licenses can be obtained on acceptable terms or that litigation will not occur. These licenses may also significantly increase our operating expenses. If legal matters related to intellectual property claims were resolved against us or settled, we could be required to make payments in amounts that could have an adverse effect on our business, financial condition and results of operations.
If the goodwill that we have recorded or may record in connection with a business acquisition becomes impaired, it could require charges to earnings.
Goodwill represents the amount by which the cost of an acquisition exceeded the fair value of net assets we acquired in connection with the purchase of another financial institution. We review goodwill for impairment at least annually, or more frequently if a triggering event occurs which indicates that the carrying value of the asset might be impaired.
Our goodwill impairment test involves a two-step process. Under the first step, the estimation of fair value of the reporting unit is compared to its carrying value including goodwill. If step one indicates a potential impairment, the second step is performed to measure the amount of impairment, if any. If the carrying amount of the reporting unit goodwill exceeds the implied fair value of that goodwill, an impairment loss is recognized in an amount equal to that excess. Any such adjustments are reflected in our results of operations in the periods in which they become known. As of December 31, 2019, our goodwill totaled $48.5 million. While we have not recorded any impairment charges since we initially recorded the goodwill, there can be no assurance that our future evaluations of our existing goodwill or goodwill we may acquire in the future will not result in findings of impairment and related write-downs, which could adversely affect our business, financial condition and results of operations.
Risks Related to the Regulation of Our Industry
We operate in a highly regulated environment and the laws and regulations that govern our operations, corporate governance, executive compensation and accounting principles, or changes in them, or our failure to comply with them, could have an adverse effect on our business, financial condition and results of operations.
We are subject to extensive regulation, supervision and legal requirements that govern almost all aspects of our operations. These laws and regulations are not intended to protect our shareholders. Rather, these laws and regulations are intended to protect customers, depositors, the Deposit Insurance Fund and the overall financial stability of the United States, and not shareholders or counterparties. These laws and regulations, among other matters, prescribe minimum capital requirements, impose limitations on the business activities in which we can engage, limit the dividend or distributions that the Bank can pay to us, restrict the ability of institutions to guarantee our debt, and impose certain specific accounting requirements on us that may be more restrictive and may result in greater or earlier charges to earnings or reductions in our capital than GAAP would require. Compliance with laws and regulations can be difficult and costly, and changes to laws and regulations often impose additional compliance costs. Our failure to comply with these laws and regulations, even if the failure follows good faith effort or reflects a difference in interpretation, could subject us to restrictions on our business activities, fines and other penalties, any of which could adversely affect our results of operations, capital base and the price of our securities. Further, any new laws, rules and regulations could make compliance more difficult or expensive. All of these laws and regulations, and the supervisory framework applicable to our industry, could have a material adverse effect on our business, financial condition, and results of operations.
If we do not meet minimum capital requirements, we will be subject to prompt corrective action by federal bank regulatory agencies. Prompt corrective action can include progressively more restrictive constraints on operations, management and capital distributions. Failure to meet the capital conservation buffer will result in certain limitations on dividends, capital repurchases, and discretionary bonus payments to executive officers. We have submitted a comprehensive capital plan to our regulators for review. Even if we satisfy the objectives of our capital plan and meet minimum capital requirements, it is possible that our regulators may ask us to raise additional capital. For additional discussion regarding our capital requirements, please see “Supervision and Regulation – Regulatory Capital Requirements.”
Federal and state banking agencies periodically conduct examinations of our business, including compliance with laws and regulations, and our failure to comply with any supervisory actions to which we are or become subject as a result of such examinations could have an adverse effect on our business, financial condition, results of operations and prospects.
The Board of Governors of the Federal Reserve System, or the Federal Reserve, the Federal Deposit Insurance Corporation, or the FDIC, and the Louisiana Office of Financial Institutions, or the Louisiana OFI, periodically conduct examinations of various aspects of our business, including our compliance with laws and regulations. If, as a result of an examination, a federal or state banking agency were to determine that our financial condition, capital resources, asset quality, earnings prospects, management, liquidity or other aspects of any of our operations had become unsatisfactory, or that we or the Bank were in violation of any law or regulation, it may take a number of different remedial actions as it deems appropriate. These actions include the power to enjoin “unsafe or unsound” practices, to require affirmative action to correct any conditions resulting from any violation or practice, to issue an administrative order that can be judicially enforced, to direct an increase in our capital, to restrict our growth, to assess civil monetary penalties against us or the Bank or our respective officers or directors, to remove officers and directors and, if it is concluded that such conditions cannot be corrected or there is an imminent risk of loss to depositors, to terminate the Bank’s deposit insurance and place it into receivership or conservatorship. Any such regulatory action could have a material adverse effect on our business, results of operations, financial condition and prospects.
We are subject to stringent capital requirements, which may result in lower returns on equity, require us to raise additional capital, limit growth opportunities or result in regulatory restrictions.
The Dodd-Frank Act required the federal banking agencies to establish stricter risk-based capital requirements and leverage limits to apply to banks and bank holding companies. See “PART I – ITEM 1. Business – Supervision and Regulation – New Revised Rules on Regulatory Capital.” If we do not meet minimum capital requirements, we will be subject to prompt corrective action by federal bank regulatory agencies. Prompt corrective action can include progressively more restrictive constraints on operations, management and capital distributions.
Failure to meet the capital conservation buffer will result in certain limitations on dividends, capital repurchases, and discretionary bonus payments to executive officers. We have submitted a comprehensive capital plan to our regulators for review. Even if we satisfy the objectives of our capital plan and meet minimum capital requirements, it is possible that our regulators may ask us to raise additional capital. For additional discussion regarding our capital requirements, please see “Supervision and Regulation - Regulatory Capital Requirements.”
New activities and expansion require regulatory approvals, and failure to obtain them may restrict our growth.
From time to time, we may complement and expand our business by pursuing strategic acquisitions of financial institutions and other complementary businesses. Generally, we must receive state and federal regulatory approval before we can acquire an FDIC-insured depository institution or related business. In determining whether to approve a proposed acquisition, federal banking regulators will consider, among other factors, the effect of the acquisition on competition, our financial condition, our future prospects, and the impact of the proposal on U.S. financial stability. The regulators also review current and projected capital ratios and levels, the competence, experience and integrity of management and its record of compliance with laws and regulations, the convenience and needs of the communities to be served, including the acquiring institution’s record of compliance under the Community Reinvestment Act, or CRA, and the effectiveness of the acquiring institution in combating money laundering activities. Such regulatory approvals may not be granted on terms that are acceptable to us, or at all. We may also be required to sell branches as a condition to receiving regulatory approval, which condition may not be acceptable to us or, if acceptable to us, may reduce the benefit of any acquisition.
In addition to the acquisition of existing financial institutions, as opportunities arise, we plan to continue de novo branching as a part of our organic growth strategy. De novo branching and any acquisitions carry with them numerous risks, including the inability to obtain all required regulatory approvals. The failure to obtain these regulatory approvals for potential future strategic acquisitions and de novo branches could impact our business plans and restrict our growth.
We face a risk of noncompliance and enforcement action with the Bank Secrecy Act and other anti-money laundering statutes and regulations.
The Bank Secrecy Act, the USA PATRIOT Act of 2001, and other laws and regulations require financial institutions, among other duties, to institute and maintain an effective anti-money laundering program and file suspicious activity and currency transaction reports as appropriate. The federal Financial Crimes Enforcement Network is authorized to impose significant civil money penalties for violations of those requirements and has recently engaged in coordinated enforcement efforts with the individual federal banking regulators, as well as the U.S. Department of Justice, Drug Enforcement Administration and Internal Revenue Service. We are also subject to increased scrutiny of compliance with the rules enforced by the Office of Foreign Assets Control. To comply with regulations, guidelines and examination procedures in this area, we have dedicated significant resources to our anti-money laundering program. If our policies, procedures and systems are deemed deficient, we could be subject to liability, including fines and regulatory actions, which may include restrictions on our ability to pay dividends and the necessity to obtain regulatory approvals to proceed with certain aspects of our business plan, including acquisitions and de novo branching. Failure to maintain and implement adequate programs to combat money laundering and terrorist financing could also have serious reputational consequences for us.
We are subject to numerous laws designed to protect consumers, including the CRA and fair lending laws, and failure to comply with these laws could lead to a wide variety of sanctions.
The CRA, the Equal Credit Opportunity Act, the Fair Housing Act and other fair lending laws and regulations impose nondiscriminatory lending requirements on financial institutions. The Department of Justice and other federal agencies are responsible for enforcing these laws and regulations. A successful regulatory challenge to an institution’s performance under the CRA or fair lending laws and regulations could result in a wide variety of sanctions, including damages and civil money penalties, injunctive relief, restrictions on mergers and acquisitions activity, restrictions on expansion, and restrictions on entering new business lines. Private parties may also have the ability to challenge an institution’s performance under fair lending laws in private class action litigation. Such actions could have a material adverse effect on our business, financial condition, results of operations and prospects.
The performance of a financial institution under the CRA in meeting the credit needs of its community is a factor that must be taken into consideration when the federal banking agencies evaluate applications related to mergers and acquisitions, as well as branch opening and relocations. If we are unable to maintain at least a “satisfactory” CRA rating, our ability to complete the acquisition of another financial institution or open a new branch will be adversely impacted. If we receive an overall CRA rating of less than “Satisfactory”, our regulators would not re-evaluate our rating until our next CRA examination, which may not occur for one or more years, and it is possible that a low CRA rating would not improve in the future.
Federal, state and local consumer lending laws may restrict our ability to originate certain mortgage loans, increase our risk of liability with respect to such loans, or increase the time and expense associated with the foreclosure process or prevent us from foreclosing at all.
Federal, state and local laws have been adopted that are intended to eliminate certain lending practices considered “predatory.” These laws prohibit practices such as steering borrowers away from more affordable products, selling unnecessary insurance to borrowers, repeatedly refinancing loans and making loans without a reasonable expectation that the borrowers will be able to repay the loans irrespective of the value of the underlying property. It is our policy not to make predatory loans, but these laws create the potential for liability with respect to our lending and loan investment activities. They increase our cost of doing business and, ultimately, may prevent us from making certain loans and cause us to reduce the average percentage rate or the points and fees on loans that we do make.
Additionally, consumer protection initiatives or changes in state or federal law may substantially increase the time and expense associated with the foreclosure process or prevent us from foreclosing at all. While historically the states in which we operate have had foreclosure laws that are favorable to lenders, a number of states in recent years have either considered or adopted foreclosure reform laws that make it substantially more difficult and expensive for lenders to foreclose on properties in default, and we cannot be certain that the states in which we operate will not adopt similar legislation in the future. If new state or federal laws or regulations are ultimately enacted that significantly raise the cost of foreclosure or raise outright barriers, such could have an adverse effect on our business, financial condition and results of operation.
The expanding body of federal, state and local regulations and/or the licensing of loan collections or other aspects of our business and our sales of loans to third parties may increase the cost of compliance and the risks of noncompliance and subject us to litigation.
Loan collection is subject to extensive regulation by federal, state and local governmental authorities as well as to various laws and judicial and administrative decisions imposing requirements and restrictions on those activities. The volume of new or modified laws and regulations has increased in recent years and, in addition, some individual municipalities have begun to enact laws that restrict loan collection activities including delaying or temporarily preventing foreclosures or forcing the modification of certain mortgages. If regulators impose new or more restrictive requirements, we may incur additional significant costs to comply with such requirements which may further adversely affect us. In addition, were we to be subject to regulatory investigation or regulatory action regarding our loan modification and foreclosure practices, it could have an adverse effect on our business, financial condition and results of operation.
In addition, we have sold loans to third parties. In connection with these sales, we or certain of our subsidiaries or legacy companies make or have made various representations and warranties, breaches of which may result in a requirement that we repurchase the loans, or otherwise make whole or provide other remedies to counterparties. These aspects of our business or our failure to comply with applicable laws and regulations could possibly lead to: civil and criminal liability; loss of licensure; damage to our reputation in the industry; fines and penalties and litigation, including class action lawsuits; and administrative enforcement actions. Any of these outcomes could materially and adversely affect us.
Potential limitations on incentive compensation contained in proposed federal agency rulemaking may adversely affect our ability to attract and retain our highest performing employees.
In April 2011 and May 2016, the FDIC, other federal banking agencies and the SEC jointly published proposed rules designed to implement provisions of the Dodd-Frank Act prohibiting incentive compensation arrangements that would encourage inappropriate risk taking at covered financial institutions, which includes a bank or bank holding company with $1 billion or more in assets, such as the Bank and the Company. It cannot be determined at this time whether or when a final rule will be adopted and whether compliance with such a final rule will substantially affect the manner in which we structure compensation for our executives and other employees. Depending on the nature and application of the final rules, we may not be able to successfully compete with certain financial institutions and other companies that are not subject to some or all of the rules to retain and attract executives and other high performing employees. If this were to occur, relationships that we have established with our customers may be impaired, which could in turn adversely impact our business, financial condition and results of operations.
Increases in FDIC insurance premiums could adversely affect our earnings and results of operations.
The deposits of the Bank are insured by the FDIC up to legal limits and, accordingly, subject it to the payment of FDIC deposit insurance assessments. The Bank’s regular assessments are determined by the level of its assessment base and its risk classification, which is based on its regulatory capital levels and the level of supervisory concern that it poses. Moreover, the FDIC has the unilateral power to change deposit insurance assessment rates and the manner in which deposit insurance is calculated and also to charge special assessments to FDIC-insured institutions. The FDIC utilized all of these powers during the financial crisis for the purpose of restoring the reserve ratios of the Deposit Insurance Fund. Any future special assessments, increases in assessment rates or premiums, or required prepayments in FDIC insurance premiums could reduce our profitability or limit our ability to pursue certain business opportunities, which could materially and adversely affect our business, financial condition, and results of operations.
The Federal Reserve may require us to commit capital resources to support the Bank.
Under longstanding Federal Reserve policy which has been codified by the Dodd-Frank Act, we are expected to act as a source of financial and managerial strength to the Bank and to commit resources to support the Bank. Under the “source of strength” doctrine, the Federal Reserve may require us to make capital injections into the Bank at times when we may not be inclined to do so and may charge us with engaging in unsafe and unsound practices for failure to commit such resources. Accordingly, we could be required to provide financial assistance to the Bank if it experiences financial distress.
Such a capital injection may be required at a time when our resources are limited and we may be required to borrow the funds or to raise additional equity capital to make the required capital injection. In the event of our bankruptcy, the bankruptcy trustee will assume any commitment by us to a federal bank regulatory agency to maintain the capital of a subsidiary bank. Moreover, bankruptcy law provides that claims based on any such commitment will be entitled to a priority of payment over the claims of our general unsecured creditors, including the holders of any note obligations.
We are subject to commercial real estate lending guidance issued by the federal banking regulators that impacts our operations and capital requirements.
The federal banking regulators have issued guidance regarding concentrations in commercial real estate lending directed at institutions that have particularly high concentrations of commercial real estate loans within their lending portfolios. This guidance suggests that institutions whose commercial real estate loans exceed certain percentages of capital should implement heightened risk management practices appropriate to their concentration risk and may be required to maintain higher capital ratios than institutions with lower concentrations in commercial real estate lending. As of December 31, 2019, our total loans for acquisition, construction, land development and other land equaled 95.9% of the Bank’s total risk-based capital and combined with our total loans secured by multifamily, non-farm non-residential non-owner occupied, and other loans for real estate purposes equaled 222.4% of the Bank’s total risk-based capital. We were within the 300.0% and 100.0% regulatory guidelines. Management has implemented controls to monitor our commercial real estate lending concentrations, but we cannot predict the extent to which this guidance will impact our operations or capital requirements.
We are subject to laws regarding the privacy, information security and protection of personal information and any violation of these laws or another incident involving personal, confidential or proprietary information of individuals could damage our reputation and otherwise adversely affect our operations and financial condition.
Our business requires the collection and retention of large volumes of customer data, including personally identifiable information in various information systems that we maintain and in those maintained by third parties with whom we contract to provide data services. We also maintain important internal company data such as personally identifiable information about our employees and information relating to our operations. We are subject to complex and evolving laws and regulations governing the privacy and protection of personal information of individuals (including customers, employees, suppliers and other third parties). For example, our business is subject to the Gramm-Leach-Bliley Act which, among other things: (i) imposes certain limitations on our ability to share nonpublic personal information about our customers with nonaffiliated third parties; (ii) requires that we provide certain disclosures to customers about our information collection, sharing and security practices and afford customers the right to “opt out” of any information sharing by us with nonaffiliated third parties (with certain exceptions); and (iii) requires that we develop, implement and maintain a written comprehensive information security program containing appropriate safeguards based on our size and complexity, the nature and scope of our activities, and the sensitivity of customer information we process, as well as plans for responding to data security breaches. Various state and federal banking regulators and states have also enacted data security breach notification requirements with varying levels of individual, consumer, regulatory or law enforcement notification in certain circumstances in the event of a security breach. Ensuring that our collection, use, transfer and storage of personal information complies with all applicable laws and regulations can increase our costs. Furthermore, we may not be able to ensure that all of our clients, suppliers, counterparties and other third parties have appropriate controls in place to protect the confidentiality of the information that they exchange with us, particularly where such information is transmitted by electronic means. If personal, confidential or proprietary information of customers or others were to be mishandled or misused (in situations where, for example, such information was erroneously provided to parties who are not permitted to have the information, or where such information was intercepted or otherwise compromised by third parties), we could be exposed to litigation or regulatory sanctions under personal information laws and regulations. Concerns regarding the effectiveness of our measures to safeguard personal information, or even the perception that such measures are inadequate, could cause us to lose customers or potential customers for our products and services and thereby reduce our revenues. Accordingly, any failure or perceived failure to comply with applicable privacy or data protection laws and regulations may subject us to inquiries, examinations and investigations that could result in requirements to modify or cease certain operations or practices or in significant liabilities, fines or penalties, and could damage our reputation and otherwise adversely affect our operations and financial condition.
Risks Associated with our Common Stock
The market price of our common stock may be subject to substantial fluctuations, which may make it difficult for you to sell your shares at the volume, prices and times desired.
Assuming the presence of a public market for our common stock, the market price of our common stock may be highly volatile, which may make it difficult for you to resell your shares at the volume, prices and times desired. There are many factors that may impact the market price and trading volume of our common stock, including, without limitation:
|
● |
actual or anticipated fluctuations in our operating results, financial condition or asset quality; |
|
● |
changes in economic or business conditions; |
|
● |
the effects of, and changes in, trade, monetary and fiscal policies, including the interest rate policies of the Federal Reserve, or in laws or regulations affecting us; |
|
● |
the public reaction to our press releases, our other public announcements and our filings with the SEC; |
|
● |
changes in accounting standards, policies, guidance, interpretations or principles; |
|
● |
the number of securities analysts covering us; |
|
● |
publication of research reports about us, our competitors, or the financial services industry generally, or changes in, or failure to meet, securities analysts’ estimates of our financial and operating performance, or lack of research reports by industry analysts or ceasing of coverage; |
|
● |
changes in market valuations or earnings of companies that investors deem comparable to us; |
|
● |
the trading volume of our common stock; |
|
● |
future issuances of our common stock or other securities; |
|
● |
future sales of our common stock by us or our directors, executive officers or significant shareholders; |
|
● |
additions or departures of key personnel; |
|
● |
perceptions in the marketplace regarding our competitors and us; |
|
● |
significant acquisitions or business combinations, strategic partnerships, joint ventures or capital commitments by or involving our competitors or us; |
|
● |
other economic, competitive, governmental, regulatory and technological factors affecting our operations, pricing, products and services; and |
|
● |
other news, announcements or disclosures (whether by us or others) related to us, our competitors, our core market or the financial services industry. |
In particular, the realization of any of the risks described in this “Risk Factors” section could have a material adverse effect on the market price of our common stock and cause the value of your investment to decline. The stock market and, in particular, the market for financial institution stocks have experienced substantial fluctuations in recent years, which in many cases have been unrelated to the operating performance and prospects of particular companies. In addition, significant fluctuations in the trading volume in our common stock may cause significant price variations to occur. Increased market volatility could have an adverse effect on the market price of our common stock, which could make it difficult to sell your shares at the volume, prices and times desired.
Future sales or the availability for sale of substantial amounts of our common stock in the public market could adversely affect the prevailing market price of our common stock and impair our ability to raise capital through future sales of equity securities.
Our articles of incorporation authorize us to issue up to 50,000,000 shares of common stock. As of March 4, 2020, there are 13,437,633 shares of our common stock issued and outstanding. We may issue shares of our common stock or other securities from time to time for any number of reasons, including as consideration for future acquisitions and investments and under compensation and incentive plans. If any such acquisition or investment is significant, the number of shares of our common stock, or the number or aggregate principal amount, as the case may be, of other securities that we may issue may in turn be substantial. We may also grant registration rights covering those securities in connection with any such acquisitions and investments.
We cannot predict the size of future issuances of our common stock or the effect, if any, that future issuances and sales of our common stock will have on the market price of our common stock. Sales of substantial amounts of our common stock (including shares of our common stock issued in connection with an acquisition or under a compensation or incentive plan), or the perception that such sales could occur, may adversely affect prevailing market prices for our common stock and could impair our ability to raise capital through future sales of our securities.
The rights of our common shareholders are subordinate to the rights of our outstanding subordinated notes and may be subordinate to the rights of the holders of any senior indebtedness or preferred stock that we may issue in the future.
Shares of our common stock are equity interests and do not constitute indebtedness. As such, shares of our common stock rank junior to all of our outstanding indebtedness, including our outstanding subordinated notes in the amount of $25.0 million, and to other non-equity claims against us and our assets available to satisfy claims against us, including in our liquidation.
Our board of directors also has the authority to issue in the aggregate up to 5,000,000 shares of preferred stock, and to determine the terms of each issue of preferred stock and any indebtedness, without shareholder approval. Accordingly, you should assume that any shares of preferred stock and any indebtedness that we may issue in the future will also be senior to our common stock. As a result, holders of our common stock bear the risk that our future issuances of debt or equity securities or our incurrence of other borrowings may negatively affect the market price of our common stock.
We are an “emerging growth company,” and the reduced reporting requirements applicable to emerging growth companies may make our common stock less attractive to investors.
We are an “emerging growth company,” as defined in the JOBS Act. For as long as we continue to be an emerging growth company we are eligible to take advantage of certain exemptions from various reporting requirements that are applicable to other public companies that are not “emerging growth companies.” These include, without limitation, an exemption from the auditor attestation requirements of Section 404(b) of the Sarbanes-Oxley Act, reduced financial reporting requirements, reduced disclosure obligations regarding executive compensation in our periodic reports and proxy statements, and exemptions from the requirements of holding a non-binding advisory vote on executive compensation and shareholder approval of any golden parachute payments not previously approved.
We will be an emerging growth company until December 31, 2020. Investors may find our common stock less attractive if we rely on these exemptions, which may result in a less active trading market and increased volatility in our stock price.
Our dividend policy may change without notice, and our future ability to pay dividends is subject to restrictions.
Holders of our common stock are entitled to receive only such cash dividends as our board of directors may declare out of funds legally available for the payment of dividends. Although we have declared a quarterly cash dividend on our common stock since the second quarter of 2016, we have no obligation to continue paying dividends, and we may change our dividend policy at any time without notice to our shareholders. Our ability to pay dividends may also be limited on account of any outstanding indebtedness or preferred stock we may issue in the future, as we generally be required to make payments on any outstanding indebtedness and outstanding preferred stock before any dividends can be paid on our common stock. Finally, because our primary asset is our investment in the stock of the Bank, we are dependent upon dividends from the Bank to pay our operating expenses, satisfy our obligations and to pay dividends on our common stock, and the Bank’s ability to pay dividends on its common stock will substantially depend upon its earnings and financial condition, liquidity and capital requirements, the general economic and regulatory climate and other factors deemed relevant by its board of directors. There are numerous laws and banking regulations that limit our and the Bank’s ability to pay dividends. See “Dividend Policy” and “Supervision and Regulation — Dividends.”
Our corporate governance documents, and certain corporate and banking laws applicable to us, could make a takeover more difficult.
Certain provisions of our articles of incorporation and bylaws, each as amended and restated, and corporate and federal banking laws, could make it more difficult for a third party to acquire control of our organization or conduct a proxy contest, even if those events were perceived by many of our shareholders as beneficial to their interests. These provisions, and the corporate and banking laws and regulations applicable to us:
|
● |
enable our board of directors to issue additional shares of authorized, but unissued capital stock; |
|
● |
enable our board of directors, without shareholder approval, to issue “blank check” preferred stock with such designations, rights and preferences as may be determined from time to time by the board; |
|
● |
enable our board of directors to increase the size of the board and fill the vacancies created by the increase; |
|
● |
do not provide for cumulative voting in the election of directors; |
|
● |
enable our board of directors to amend our bylaws without shareholder approval; |
|
● |
require the vote of holders of at least 80% of the outstanding shares of our capital stock to modify the sections of our articles of incorporation addressing limitation of liability and indemnification of our officers and directors; |
|
● |
require the request of holders of at least 25% of the outstanding shares of our capital stock entitled to vote at a meeting to call a special shareholders’ meeting; |
|
● |
establish an advance notice procedure for director nominations and other shareholder proposals; and |
|
● |
require prior regulatory application and approval of any transaction involving control of our organization. |
These provisions may discourage potential acquisition proposals and could delay or prevent a change in control, including under circumstances in which our shareholders might otherwise receive a premium over the market price of our shares. See “Description of our Capital Stock” and “Supervision and Regulation.”
An investment in Business First’s common stock is not an insured deposit and is subject to risk of loss.
Your investment in our common stock is not a bank deposit and is not insured or guaranteed by the FDIC or any other government agency. Your investment is subject to investment risk, and you must be capable of affording the loss of your entire investment.
ITEM 1B. Unresolved Staff Comments.
Not applicable.
ITEM 2. Properties.
Our current principal offices are located at 500 Laurel Street, Baton Rouge, Louisiana. We currently operate out of 26 banking centers located throughout the State of Louisiana and Dallas, Texas. Our office locations are either owned or leased. We believe that our facilities are adequately covered by insurance and that these facilities are adequate to meet our needs.
ITEM 3. Legal Proceedings.
We are not currently subject to any material legal proceedings. We are from time to time subject to claims and litigation arising in the ordinary course of business. These claims and litigation may include, among other things, allegations of violation of banking and other applicable regulations, competition law, labor laws and consumer protection laws, as well as claims or litigation relating to intellectual property, securities, breach of contract and tort. We intend to defend ourselves vigorously against any pending or future claims and litigation.
At this time, in the opinion of management, the likelihood is remote that the impact of such proceedings, either individually or in the aggregate, would have a material adverse effect on our combined results of operations, financial condition or cash flows. However, one or more unfavorable outcomes in any claim or litigation against us could have a material adverse effect for the period in which they are resolved. In addition, regardless of their merits or their ultimate outcomes, such matters are costly, divert management’s attention and may materially adversely affect our reputation, even if resolved in our favor.
ITEM 4. Mine Safety Disclosures.
Not applicable.
Part II
ITEM 5. Market for Registrant’s Common Equity, Related Shareholder Matters and Issuer Purchases of Equity Securities.
Common Stock
Our common stock is traded on the Nasdaq Global Select Market under the symbol “BFST”. Our shares have been traded on the Nasdaq Global Select Market since April 11, 2018. Prior to that date, there was no public trading market for our common stock. As of March 4, 2020, there were 13,437,633 issued and outstanding shares of our common stock held of record by approximately 748 shareholders. As of March 4, 2020, we also had outstanding 395,300 options to purchase shares of our common stock issued under our equity compensation plans, as described below.
Dividends
In 2016, our board of directors made the determination to begin paying regular quarterly dividends; however, we are not obligated to pay dividends. The payment of future dividends and our dividend policy will depend on our earnings, capital requirements and financial condition, as well as other factors that our board of directors deems relevant. For additional discussion of legal and regulatory restrictions on the payment of dividends, see “PART I - ITEM 1. Business – Supervision and Regulation.”
Securities Authorized for Issuance under Equity Compensation Plans
In 2006, our board of directors adopted the 2006 Stock Option Plan pursuant to which we were permitted to issue stock options to purchase up to 1,500,000 shares of our common stock, all of which could be issued as either incentive stock options under Section 422A of the Internal Revenue Code of 1986, as amended, or non-qualified stock options. Although our 2006 Stock Option Plan expired on December 22, 2016 and we are no longer permitted to issue additional stock options under this plan, as of December 31, 2019, we had 725,300 outstanding and unexercised stock options that have been issued to our executive officers and key personnel and remain subject to the terms and conditions of the 2006 Stock Option Plan until they are exercised or forfeited.
On June 29, 2017, our shareholders approved the 2017 Equity Incentive Plan, or the Plan. The Plan provides for the grant of various types of equity grants and awards, including incentive stock options, nonstatutory stock options, stock appreciation rights, restricted stock, restricted stock units, performance units, performance shares and other stock-based awards to eligible participants, which includes our employees, directors and consultants. The Plan has reserved 500,000 shares of common stock for grant, award or issuance to eligible participants, all of which may be subject to incentive stock option treatment. As of December 31, 2019, there were 93,525 shares issued under this Plan to our employees, directors or consultants.
The following table summarizes information as of December 31, 2019 relating to the number of securities to be issued upon the exercise of the outstanding options and warrants and their weighted-average exercise price.
|
Number of Securities to Be Issued Upon Exercise of Outstanding Options, Warrants and Rights |
Weighted-Average Exercise Price of Outstanding Options, Warrants and Rights |
Number of Securities Remaining Available For Future Issuance Under Equity Compensation Plans |
||||||||||
|
Equity compensations plans approved by security holders |
725,300 | $ | 12.55 | 406,475 | ||||||||
|
Equity compensation plans not approved by security holders |
— | — | — | |||||||||
|
Total equity compensation plans |
725,300 | $ | 12.55 | 406,475 | ||||||||
Recent Sales of Unregistered Securities
None.
Purchases of Equity Securities by the Issuer and Affiliated Purchasers
On December 13, 2018, our board of directors approved a resolution authorizing management to repurchase shares of its common stock with an aggregate purchase price of up to $15,000,000 from time to time, subject to certain limitations and conditions. The stock repurchase program was effective immediately and will continue for a period of 24 months. The stock repurchase program does not obligate Business First to repurchase any shares of its common stock and there is no assurance that Business First will do so. No shares were repurchased during the quarter ended December 31, 2019. As of December 31, 2019, $12,447,000 remains available to repurchase shares under the stock repurchase program.
Stock Performance Graph
The following table and graph compares the cumulative total shareholder return on our common stock to the cumulative total return of the S&P 500 Index and the SNL Bank Index for banks with $1.0 billion to $5.0 billion in total assets for the period beginning on April 11, 2018, the first day of trading of our common stock on the Nasdaq Global Select Market, through December 31, 2019. The following assumes $100 invested on April 11, 2018 in our common stock at the closing price of $25.02 per share, otherwise reflects our stock and the S&P 500 and SNL Bank $1.0 to $5.0 Billion Index values as of close of trading, and assumes the reinvestment of dividends, if any. The historical stock price performance for our common stock shown on the graph below is not necessarily indicative of future stock performance.
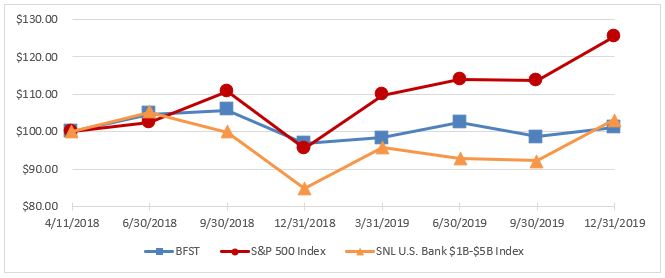
|
Apr 11, 2018 |
Jun 30, 2018 |
Sep 30, 2018 |
Dec 31, 2018 |
|||||||||||||
|
Business First Bancshares, Inc. |
$ | 100.00 | $ | 104.65 | $ | 105.78 | $ | 96.83 | ||||||||
|
S&P 500 Index |
100.00 | 102.46 | 110.76 | 95.44 | ||||||||||||
|
SNL U.S. Bank $1B-$5B Index |
100.00 | 105.27 | 99.92 | 84.91 | ||||||||||||
|
Mar 31, 2019 |
Jun 30, 2019 |
Sep 30, 2019 |
Dec 31, 2019 |
|||||||||||||
|
Business First Bancshares, Inc. |
$ | 98.39 | $ | 102.45 | $ | 98.65 | $ | 101.20 | ||||||||
|
S&P 500 Index |
109.72 | 114.00 | 113.65 | 125.49 | ||||||||||||
|
SNL U.S. Bank $1B-$5B Index |
95.91 | 93.01 | 92.26 | 103.22 | ||||||||||||
Source: S&P Global Market Intelligence
ITEM 6. Selected Financial Data.
As a smaller reporting company, we are not required to provide the information required by this Item.
ITEM 7. Management’s Discussion and Analysis of Financial Condition and Results of Operations.
This discussion presents management’s analysis of our results of operations and financial condition over each of the last two most recent fiscal years. The discussion should be read in conjunction with our financial statements and the notes related thereto which appear elsewhere in this Report.
The following discussion and analysis is to focus on significant changes in the financial condition of Business First and its subsidiaries from December 31, 2018 to December 31, 2019 and its results of operations for the year ended December 31, 2019. This discussion and analysis is intended to highlight and supplement information presented elsewhere in this Report, particularly the consolidated financial statements and related notes appearing in Item 8. This discussion and analysis contains forward-looking statements that are subject to certain risks and uncertainties and are based on certain assumptions that Business First believes are reasonable but may prove to be inaccurate. Certain risks, uncertainties and other factors, including those set forth under “Forward-Looking Statements,” “Risk Factors” and elsewhere in this statement, may cause actual results to differ materially from those projected results discussed in the forward-looking statements appearing in this discussion and analysis. Business First assumes no obligation to update any of these forward-looking statements.
Overview
We are a registered bank holding company headquartered in Baton Rouge, Louisiana. Through our wholly-owned subsidiary, b1BANK, a Louisiana state chartered bank, we provide a broad range of financial services tailored to meet the needs of small to medium-sized businesses and professionals. Since our inception in 2006, our priority has been and continues to be creating shareholder value through the establishment of an attractive commercial banking franchise in Louisiana and across our region. We consider our primary market to include the State of Louisiana and Dallas, Texas. We currently operate out of 26 banking centers in markets across Louisiana and Texas. As of December 31, 2019, we had total assets of $2.3 billion, total loans of $1.7 billion, total deposits of $1.8 billion, and total shareholders’ equity of $285.1 million.
As a bank holding company operating through one market segment, community banking, we generate most of our revenues from interest income on loans, customer service and loan fees, and interest income from securities. We incur interest expense on deposits and other borrowed funds and noninterest expense, such as salaries and employee benefits and occupancy expenses. We analyze our ability to maximize income generated from interest-earning assets and expense of our liabilities through our net interest margin. Net interest margin is a ratio calculated as net interest income divided by average interest-earning assets. Net interest income is the difference between interest income on interest-earning assets, such as loans and securities, and interest expense on interest-bearing liabilities, such as deposits and borrowings, which are used to fund those assets.
Changes in the market interest rates and the interest rates we earn on interest-earning assets or pay on interest-bearing liabilities, as well as the volume and types of interest-earning assets, interest-bearing and noninterest-bearing liabilities and shareholders’ equity, are usually the largest drivers of periodic changes in net interest spread, net interest margin and net interest income. Fluctuations in market interest rates are driven by many factors, including governmental monetary policies, inflation, deflation, macroeconomic developments, changes in unemployment, the money supply, political and international conditions, and conditions in domestic and foreign financial markets. Periodic changes in the volume and types of loans in our loan portfolio are affected by, among other factors, economic and competitive conditions in our markets and across our region, as well as developments affecting the real estate, technology, financial services, insurance, transportation, manufacturing and energy sectors within our markets.
While we continue to prioritize organic growth, we also seek to capitalize upon other opportunities as they arise. Below is a summary of recent transactions that have contributed to our growth. For additional information about these transactions, See “Note 3 – Mergers and Acquisitions” in our audited consolidated financial statements included in Item 8 of this Report.
Acquisition of American Gateway Financial Corporation
After the close of business on March 31, 2015, we merged with American Gateway Financial Corporation (“AGFC”), parent bank holding company for American Gateway Bank, pursuant to which the operations of AGFC were merged with us and ten former American Gateway Bank branches were added to our branch network. Total assets acquired were $371.5 million, which included loans of $143.2 million and securities available for sale of $108.4 million, and deposits of $283.3 million were assumed in the transaction. Shareholders of AGFC received merger consideration of $10.00 in cash and 11.88 shares of our common stock in exchange for each share of AGFC common stock.
Private Placement and Acquisition of Minden Bancorp, Inc.
On October 5, 2017, we entered into a definitive agreement to acquire Minden Bancorp, Inc., or MBI, and its banking subsidiary MBL Bank. In connection with the acquisition of MBI, on October 12, 2017 we completed the issuance and sale of 3,299,925 shares of our common stock in a private placement offering at a price of $20.00 per share. The aggregate offering price totaled $66.0 million, and the aggregate placement agent fee and commission was $3.3 million.
The acquisition of MBI was consummated on January 1, 2018. At December 31, 2017, MBI had fair values of approximately $317.4 million in total assets, $192.7 million in net loans, $264.0 million in total deposits, and $30.6 million in total shareholders’ equity.
Acquisition of Richland State Bancorp, Inc.
On June 4, 2018, we entered into a definitive agreement to acquire Richland State Bancorp, Inc., or RSBI, and its banking subsidiary Richland State Bank. The acquisition of RSBI was consummated on November 30, 2018. At November 30, 2018, RSBI had fair values of approximately $316.4 million in total assets, $190.8 million in net loans, $290.0 million in total deposits, and $25.4 million in total shareholders’ equity.
Financial Highlights
The financial highlights as of and for the year ended December 31, 2019 include:
|
• |
Total assets of $2.3 billion, a $178.9 million, or 8.5%, increase from December 31, 2018. |
|
|
• |
Total loans of $1.7 billion, a $181.8 million, or 11.9%, increase from December 31, 2018. |
|
|
• |
Total deposits of $1.8 billion, a $48.1 million, or 2.8%, increase from December 31, 2018. |
|
|
• |
Net income of $23.8 million, a $9.7 million, or 68.7%, increase from the year ended December 31, 2018. |
|
|
• |
Net interest income of $80.2 million, an $18.0 million, or 28.9%, increase from the year ended December 31, 2018. |
|
|
• |
An allowance for loan and lease losses of 0.71% of total loans held for investment, compared to 0.73% as of December 31, 2018, and a ratio of nonperforming loans to total loans held for investment of 0.53%, compared to 0.89% as of December 31, 2018. |
|
|
• |
Earnings per share for the year ended December 31, 2019 of $1.79 per basic share and $1.74 per diluted share, compared to $1.27 per basic share and $1.22 per diluted share for the year ended December 31, 2018. |
|
|
• |
Return on average assets of 1.11% compared to 0.84% for the year ended December 31, 2018. |
|
• |
Return on average equity of 8.70% compared to 7.04% for the year ended December 31, 2018. |
|
|
• |
Capital ratios for Tier 1 Leverage, Common Equity Tier 1, Tier 1 Risk-based and Total Risk-based Capital of 10.56%, 11.43%, 11.43% and 13.30%, respectively compared to 11.66%, 11.83%, 11.83% and 13.91%, respectively as of December 31, 2018. |
|
|
• |
Book value per share of $21.47, an increase of 9.1% from $19.68 at December 31, 2018. |
Results of Operations for the Years Ended December 31, 2019 and 2018
Performance Summary
For the year ended December 31, 2019, net income was $23.8 million, or $1.79 per basic share and $1.74 per diluted share, compared to net income of $14.1 million, or $1.27 per basic share and $1.22 per diluted share, for the year ended December 31, 2018. Return on average assets increased to 1.11% for the year ended December 31, 2019 from 0.84% for the year ended December 31, 2018. Return on average equity increased to 8.70% for the year ended December 31, 2019, as compared to 7.04% for the year ended December 31, 2018. The increases were largely attributable to the acquisition of RSBI and growth of the loan portfolio.
Net Interest Income
Our operating results depend primarily on our net interest income, calculated as the difference between interest income on interest-earning assets, such as loans and securities, and interest expense on interest-bearing liabilities, such as deposits and borrowings. Fluctuations in market interest rates impact the yield and rates paid on interest sensitive assets and liabilities. Changes in the amount and type of interest-earning assets and interest-bearing liabilities also impact net interest income. The variance driven by the changes in the amount and mix of interest-earning assets and interest-bearing liabilities is referred to as a “volume change.” Changes in yields earned on interest-earning assets and rates paid on interest-bearing deposits and other borrowed funds are referred to as a “rate change.”
To evaluate net interest income, we measure and monitor (1) yields on our loans and other interest-earning assets, (2) the costs of our deposits and other funding sources, (3) our net interest spread and (4) our net interest margin. Net interest spread is the difference between rates earned on interest-earning assets and rates paid on interest-bearing liabilities. Net interest margin is calculated as net interest income divided by average interest-earning assets. Because noninterest-bearing sources of funds, such as noninterest-bearing deposits and shareholders’ equity also fund interest-earning assets, net interest margin includes the benefit of these noninterest-bearing sources. We calculate average assets, liabilities, and equity using a monthly average, and average yield/rate utilizing a 30/360 day convention.
For the year ended December 31, 2019, net interest income totaled $80.2 million, and net interest margin and net interest spread were 4.10% and 3.67%, respectively. For the year ended December 31, 2018 net interest income totaled $62.2 million and net interest margin and net interest spread were 4.02% and 3.71%, respectively. The average yield on the loan portfolio was 5.86% for the year ended December 31, 2019, compared to 5.55% for the year ended December 31, 2018, and the average yield on total interest-earning assets was 5.29% for the year ended December 31, 2019, compared to 4.92% for the year ended December 31, 2018. For the year ended December 31, 2019, overall cost of funds (which includes noninterest-bearing deposits) increased 31 basis points compared to the year ended December 31, 2018, primarily due to our issuance of subordinated debt in December 2018 and increasing rates on interest-bearing deposits.
The following table presents, for the periods indicated, an analysis of net interest income by each major category of interest-earning assets and interest-bearing liabilities, the average amounts outstanding and the interest earned or paid on such amounts. The table also sets forth the average rate earned on interest-earning assets, the average rate paid on interest-bearing liabilities, and the net interest margin on average total interest-earning assets for the same periods. Interest earned on loans that are classified as nonaccrual is not recognized in income; however the balances are reflected in average outstanding balances for the period. For the years ended December 31, 2019 and 2018, interest income not recognized on nonaccrual loans was not material. Any nonaccrual loans have been included in the table as loans carrying a zero yield. The average total loans reflected below is net of deferred loan fees and discounts. Acquired loans were recorded at fair value at acquisition and accrete interest income over the remaining lives of the respective loans.
|
For the Years Ended December 31, |
||||||||||||||||||||||||
|
2019 |
2018 |
|||||||||||||||||||||||
|
Average |
Interest |
Average |
Average |
Interest |
Average |
|||||||||||||||||||
|
(Dollars in thousands) |
||||||||||||||||||||||||
|
Assets |
||||||||||||||||||||||||
|
Interest-earning assets: |
||||||||||||||||||||||||
|
Total loans |
$ | 1,628,803 | $ | 95,433 | 5.86 | % | $ | 1,258,178 | $ | 69,780 | 5.55 | % | ||||||||||||
|
Securities available for sale |
300,038 | 7,225 | 2.41 | % | 258,153 | 5,834 | 2.26 | % | ||||||||||||||||
|
Interest-bearing deposits in other banks |
27,878 | 809 | 2.90 | % | 31,475 | 581 | 1.85 | % | ||||||||||||||||
|
Total interest-earning assets |
1,956,719 | 103,467 | 5.29 | % | 1,547,806 | 76,195 | 4.92 | % | ||||||||||||||||
|
Allowance for loan losses |
(11,762 | ) | (9,749 | ) | ||||||||||||||||||||
|
Noninterest-earning assets |
191,124 | 144,120 | ||||||||||||||||||||||
|
Total assets |
$ | 2,136,081 | $ | 103,467 | $ | 1,682,177 | $ | 76,195 | ||||||||||||||||
|
Liabilities and Shareholders’ Equity |
||||||||||||||||||||||||
|
Interest-bearing liabilities: |
||||||||||||||||||||||||
|
Interest-bearing deposits |
$ | 1,316,896 | $ | 19,753 | 1.50 | % | $ | 1,051,932 | $ | 11,833 | 1.12 | % | ||||||||||||
|
Subordinated debt |
25,000 | 1,688 | 6.75 | % | 2,083 | 69 | 3.31 | % | ||||||||||||||||
|
Advances from FHLB |
69,183 | 1,581 | 2.29 | % | 84,187 | 1,849 | 2.20 | % | ||||||||||||||||
|
Other borrowings |
29,419 | 247 | 0.84 | % | 17,766 | 215 | 1.21 | % | ||||||||||||||||
|
Total interest-bearing liabilities |
1,440,498 | 23,269 | 1.62 | % | 1,155,968 | 13,966 | 1.21 | % | ||||||||||||||||
|
Noninterest-bearing liabilities: |
||||||||||||||||||||||||
|
Noninterest-bearing deposits |
402,147 | 319,623 | ||||||||||||||||||||||
|
Other liabilities |
20,231 | 6,393 | ||||||||||||||||||||||
|
Total noninterest-bearing liabilities |
422,378 | 326,016 | ||||||||||||||||||||||
|
Shareholders’ equity |
273,205 | 200,193 | ||||||||||||||||||||||
|
Total liabilities and shareholders’ equity |
$ | 2,136,081 | $ | 1,682,177 | ||||||||||||||||||||
|
Net interest rate spread(1) |
3.67 | % | 3.71 | % | ||||||||||||||||||||
|
Net interest income |
$ | 80,198 | $ | 62,229 | ||||||||||||||||||||
|
Net interest margin(2) |
4.10 | % | 4.02 | % | ||||||||||||||||||||
|
(1) |
Net interest spread is the average yield on interest-earning assets minus the average rate on interest-bearing liabilities. |
|
(2) |
Net interest margin is equal to net interest income divided by average interest-earning assets. |
The following table presents information regarding the dollar amount of changes in interest income and interest expense for the periods indicated for each major component of interest-earning assets and interest-bearing liabilities, and distinguishes between the changes attributable to changes in volume and changes attributable to changes in interest rates. For purposes of these tables, changes attributable to both rate and volume that cannot be segregated have been allocated to rate.
|
For the Year Ended December 31, 2019 |
||||||||||||
|
Increase (Decrease) due to change in |
||||||||||||
|
Volume |
Rate |
Total |
||||||||||
|
(Dollars in thousands) |
||||||||||||
|
Interest-earning assets: |
||||||||||||
|
Total loans |
$ | 21,715 | $ | 3,938 | $ | 25,653 | ||||||
|
Securities available for sale |
1,009 | 382 | 1,391 | |||||||||
|
Interest-earning deposits in other banks |
(104 | ) | 332 | 228 | ||||||||
|
Total increase (decrease) in interest income |
$ | 22,620 | $ | 4,652 | $ | 27,272 | ||||||
|
Interest-bearing liabilities: |
||||||||||||
|
Interest-bearing deposits |
$ | 3,974 | $ | 3,946 | $ | 7,920 | ||||||
|
Subordinated debt |
1,547 | 72 | 1,619 | |||||||||
|
Advances from FHLB |
(343 | ) | 75 | (268 | ) | |||||||
|
Other borrowings |
98 | (66 | ) | 32 | ||||||||
|
Total increase (decrease) in interest expense |
5,276 | 4,027 | 9,303 | |||||||||
|
Increase (decrease) in net interest income |
$ | 17,344 | $ | 625 | $ | 17,969 | ||||||
Provision for Loan Losses
Our provision for loan losses is a charge to income in order to bring our allowance for loan losses to a level deemed appropriate by management. For a description of the factors taken into account by management in determining the allowance for loan losses see “—Financial Condition—Allowance for Loan Losses.” The provision for loan losses was $2.6 million and $2.4 million for the years ended December 31, 2019 and 2018, respectively. The provision during the year ended December 31, 2019 was impacted by a higher loan portfolio balance.
Noninterest Income (“Other Income”)
Our primary sources of noninterest income are service charges on deposit accounts, debit card and automated teller machine (“ATM”) fee income, and income from bank-owned life insurance. The following table presents, for the periods indicated, the major categories of noninterest income:
|
For the Years Ended |
Increase |
|||||||||||
|
2019 |
2018 |
(Decrease) | ||||||||||
|
(Dollars in thousands) |
||||||||||||
|
Noninterest income: |
||||||||||||
|
Service charges on deposit accounts |
$ | 4,035 | $ | 2,810 | $ | 1,225 | ||||||
|
Debit card and ATM fee income |
1,847 | 1,033 | 814 | |||||||||
|
Bank-owned life insurance income |
687 | 668 | 19 | |||||||||
|
Gain on sales of investment securities |
106 | 7 | 99 | |||||||||
|
Brokerage commissions |
73 | 515 | (442 | ) | ||||||||
|
Mortgage origination income |
421 | 237 | 184 | |||||||||
|
Correspondent bank income |
418 | 427 | (9 | ) | ||||||||
|
Rental income |
490 | 661 | (171 | ) | ||||||||
|
Gain on sale of banking center |
581 | — | 581 | |||||||||
|
Gain (Loss) on sale / disposal of other assets |
(774 | ) | 438 | (1,212 | ) | |||||||
|
Pass-through income (loss) from SBIC partnerships |
1,553 | 222 | 1,331 | |||||||||
|
Other |
1,271 | 761 | 510 | |||||||||
|
Total noninterest income |
$ | 10,708 | $ | 7,779 | $ | 2,929 | ||||||
Noninterest income for the year ended December 31, 2019 increased $2.9 million, or 37.7%, to $10.7 million compared to noninterest income of $7.8 million for the same period in 2018. The components of noninterest income with significant fluctuations compared to the prior year period were as follows:
Service charges on deposit accounts. We earn fees from our customers for deposit-related services, and these fees constitute a significant and predictable component of our noninterest income. Service charges on deposit accounts were $4.0 million for the year ended December 31, 2019 as compared to $2.8 million for the same time period in 2018, an increase of $1.2 million, or 43.6%. The increase was primarily due to increases in deposit balances and accounts from the acquisition of RSBI and organic growth.
Debit card and ATM fee income. We earn fees from our customers based upon card activity, and these fees constitute a significant recurring component of our noninterest income. Fee income was $1.8 million and $1.0 million for the years ended December 31, 2019 and 2018, respectively, representing an increase of $814,000, or 78.8%. The increase was primarily due to the additional accounts from the acquisition of RSBI and organic growth.
Brokerage commissions. We earn commissions from brokerage services provided by our Wealth Solutions Group. Brokerage commissions totaled $73,000 and $515,000 for the years ended December 31, 2019 and 2018, respectively. The decrease of $442,000, or 85.8%, for the year ended December 31, 2019, compared to the same time period in 2018, was primarily due to restructuring our brokerage activities and the resulting accounting implications on the presentation of gross income recognition.
Rental income. We received rental income from the sublease of our former corporate offices. The lease ended in September 2019. Rental income totaled $490,000 and $661,000 for the years ended December 31, 2019 and 2018, respectively. The decrease of $171,000, or 25.9%, was primarily from the result of the subleases of our former corporate offices expiring in September 2019.
Gain on sale of banking center. We sold a banking center located in Mangham, Louisiana that resulted in a gain of $581,000 during the second quarter of 2019.
Loss on sale / disposal of other assets. During the year ended December 31, 2019, we had $774,000 in losses that were largely attributable to the renovation of the Port Allen, Louisiana banking center and the changing of signs on our banking centers due to the rebranding of the bank. During the year ended December 31, 2018, we closed three branch locations. As part of the process of closing those branches, we moved the buildings to other real estate owned and recognized $402,000 in net gains.
Pass-through income from SBIC partnerships. We are an investor in several SBIC programs, which are joint ventures between various investors with venture capital, the Small Business Administration (“SBA”), and small business borrowers. Those programs are starting to mature and become profitable. Pass-through income from SBIC partnerships was $1.6 million for the year ended December 31, 2019, compared to $222,000 for the same time period in 2018, an increase of $1.3 million, or 599.5%. The increase was largely driven by a dividend recapitalization transaction which occurred during 2019.
Other. This category includes a variety of other income producing activities, including wire transfer fees, mortgage-related income, insurance commissions, credit card income and participation fee income. Other income increased $510,000, or 67.0%, for the year ended December 31, 2019, compared to the same period in 2018. The increase for the year ended December 31, 2019, compared to the same period in 2018, is primarily due to increases in the use of these services by legacy RSBI customers. We also received a grant for the year ended December 31, 2019, in the amount of $113,000 that represented part of the increase.
Noninterest Expense (“Other Expense”)
Generally, noninterest expense is composed of all employee expenses and costs associated with operating our facilities, obtaining and retaining customer relationships and providing bank services. The largest component of noninterest expense is salaries and employee benefits. Noninterest expense also includes operational expenses, such as occupancy expenses, depreciation and amortization, professional and regulatory fees, including Federal Deposit Insurance Corporation (“FDIC”) assessments, data processing expenses, and advertising and promotion expenses.
The following table presents, for the periods indicated, the major categories of noninterest expense:
|
For the Years Ended |
Increase |
|||||||||||
|
2019 |
2018 |
(Decrease) | ||||||||||
|
(Dollars in thousands) |
||||||||||||
|
Salaries and employee benefits |
$ | 35,126 | $ | 27,862 | $ | 7,264 | ||||||
|
Non-staff expenses: |
||||||||||||
|
Occupancy of bank premises |
4,332 | 3,509 | 823 | |||||||||
|
Depreciation and amortization |
2,494 | 1,730 | 764 | |||||||||
|
Data processing |
2,049 | 1,557 | 492 | |||||||||
|
FDIC assessment fees |
278 | 1,221 | (943 | ) | ||||||||
|
Legal and other professional fees |
1,319 | 1,695 | (376 | ) | ||||||||
|
Advertising and promotions |
1,535 | 1,239 | 296 | |||||||||
|
Utilities and communications |
1,334 | 1,073 | 261 | |||||||||
|
Ad valorem shares tax |
1,423 | 1,135 | 288 | |||||||||
|
Directors’ fees |
570 | 436 | 134 | |||||||||
|
Other real estate owned expenses and write-downs |
750 | 9 | 741 | |||||||||
|
Merger and conversion related expenses |
330 | 3,024 | (2,694 | ) | ||||||||
|
Other |
6,908 | 5,758 | 1,150 | |||||||||
|
Total noninterest expense |
$ | 58,448 | $ | 50,248 | $ | 8,200 | ||||||
Noninterest expense for the year ended December 31, 2019 increased $8.2 million, or 16.3%, to $58.4 million compared to noninterest expense of $50.2 million for the same period in 2018. The components of noninterest expense with significant fluctuations compared to the prior year period were as follows:
Salaries and employee benefits. Salaries and employee benefits are the largest component of noninterest expense and include payroll expense, the cost of incentive compensation, benefit plans, health insurance and payroll taxes. Salaries and employee benefits were $35.1 million for the year ended December 31, 2019, an increase of $7.3 million, or 26.1%, compared to the same period in 2018. The increase was primarily due to additional hires for new positions, our merit increase cycle, and the acquisition of RSBI (including severance and retention payments related to the acquisition) and its legacy operations and employees. As of December 31, 2019, we had 355 full-time equivalent employees, compared to 333 full-time equivalents as of December 31, 2018. Salaries and employee benefits included stock-based compensation expense of $1.1 million and $1.0 million for the years ended December 31, 2019 and 2018, respectively.
Occupancy of bank premises. Expense associated with occupancy of premises was $4.3 million for the year ended December 31, 2019 and $3.5 million for the same period in 2018. The increase of $823,000, or 23.5%, for the year ended December 31, 2019, compared to the same period in 2018, may be attributed primarily to increased rent expense on our corporate office location and the acquisition of RSBI and its legacy branch locations.
Depreciation and amortization. Depreciation and amortization costs were $2.5 million and $1.7 million for the years ended December 31, 2019 and 2018, respectively. This category includes leasehold, furniture, fixtures and equipment depreciation totaling $1.6 million and $1.2 million for the years ended December 31, 2019 and 2018, respectively. The amortization of intangible assets was $905,000 and $559,000 for the years ended December 31, 2019 and 2018, respectively. The increase in depreciation and amortization primarily resulted from the acquisition of RSBI’s assets and the core deposit intangible recorded in connection with the RSBI acquisition.
Data processing. Data processing fees were $2.0 million and $1.6 million for the years ended December 31, 2019 and 2018, respectively. The increase of $500,000, or 31.6%, for the year ended December 31, 2019, compared to the same period in 2018, is primarily due to increased costs in connection with the RSBI acquisition.
FDIC assessment fees. FDIC assessment fees were $278,000 and $1.2 million for the years ended December 31, 2019 and 2018, respectively. The decrease for the year ended December 31, 2019, compared to the same period in 2018, is primarily due to increased capital ratios and a $427,000 credit back to the Bank in 2019.
Legal and other professional fees. Legal and other professional fees were $1.3 million and $1.7 million for the years ended December 31, 2019 and 2018, respectively. Other professional fees include audit, loan review, compliance, and other consultants. The decrease of $376,000, or 22.2%, for the year ended December 31, 2019 was due primarily to legal fees in 2018 related to acquisitions and our listing on the Nasdaq Global Select Market.
Advertising and promotions. Advertising and promotions costs were $1.5 million and $1.2 million for the years ended December 30, 2019 and 2018, respectively. The increase for the year ended December 31, 2019, compared to the same period in 2018, is largely attributable to production costs for future advertising campaigns.
Ad valorem shares tax. Ad valorem shares tax expense was $1.4 million and $1.1 million for the years ended December 31, 2019 and 2018, respectively. The increase for the year ended December 31, 2019, compared to the same period in 2018, was primarily due to our increased taxes and to the acquisition of RSBI and its legacy operations.
Merger and conversion related expenses. Merger and conversion related expenses for the years ended December 31, 2019 and 2018 were related to the acquisition of MBI and RSBI.
Other. This category includes various operating and administrative expenses including business development expenses (i.e. travel and entertainment, donations and club dues), insurance, supplies and printing, equipment rent, and software support and maintenance. Other noninterest expense increased $1.2 million, or 20.0%, for the year ended December 31, 2019 compared to the same period in 2018. The increase was primarily due to the acquisition of RSBI and its legacy operations.
Income Tax Expense
The amount of income tax expense is influenced by the amounts of our pre-tax income, tax-exempt income and other nondeductible expenses. Deferred tax assets and liabilities are reflected at currently enacted income tax rates in effect for the period in which the deferred tax assets and liabilities are expected to be realized or settled. As changes in tax laws or rates are enacted, deferred tax assets and liabilities are adjusted through the provision for income taxes. Valuation allowances are established when necessary to reduce deferred tax assets to the amount expected to be realized.
For the year ended December 31, 2019, income tax expense totaled $6.1 million, an increase of $2.8 million, or 85.4%, compared to $3.3 million for the same period in 2018. For the years ended December 31, 2019 and 2018, our effective tax rates were 20.4% and 18.9%, respectively. Our income tax rate expense for both years was affected primarily by tax-exempt income generated by municipal securities, bank-owned life insurance and by other nondeductible expenses (including acquisition-related expenses). Our effective tax rate for the year ended December 31, 2019, was also impacted by a nondeductible goodwill write-off associated with a branch sale.
Financial Condition
Our total assets increased $178.9 million, or 8.5%, from $2.1 billion as of December 31, 2018 to $2.3 billion as of December 31, 2019.
Loan Portfolio
Our primary source of income is interest on loans to individuals, professionals and small to medium-sized businesses in our markets. Our loan portfolio consists primarily of commercial loans and real estate loans secured by commercial real estate properties located in our primary market areas. Our loan portfolio represents the highest yielding component of our earning asset base.
As of December 31, 2019, total loans, including mortgage loans held for sale, were $1.7 billion, an increase of $182.0, million or 11.9%, compared to $1.5 billion as of December 31, 2018. The increase was primarily due to our continued loan penetration in our primary market areas. Additionally, $251,000 and $58,000 in mortgage loans were classified as loans held for sale as of December 31, 2019 and 2018, respectively.
Total loans held for investment as a percentage of deposits were 96.0% and 88.2% as of December 31, 2019 and 2018, respectively. Total loans as a percentage of assets were 75.2% and 73.0% as of December 31, 2019 and 2018, respectively.
The following table summarizes our loan portfolio by type of loan as of the dates indicated:
|
As of December 31, 2019 |
As of December 31, 2018 |
|||||||||||||||
|
Amount |
Percent |
Amount |
Percent |
|||||||||||||
|
(Dollars in thousands) |
||||||||||||||||
|
Commercial |
$ | 390,398 | 22.8 | % | $ | 363,640 | 23.8 | % | ||||||||
|
Real estate: |
||||||||||||||||
|
Construction and land |
244,181 | 14.3 | 211,054 | 13.8 | ||||||||||||
|
Farmland |
48,681 | 2.9 | 45,989 | 3.0 | ||||||||||||
|
1-4 family residential |
293,142 | 17.1 | 270,583 | 17.7 | ||||||||||||
|
Multi-family residential |
36,454 | 2.1 | 39,273 | 2.6 | ||||||||||||
|
Nonfarm nonresidential |
612,608 | 35.8 | 518,660 | 33.9 | ||||||||||||
|
Consumer |
84,801 | 5.0 | 79,270 | 5.2 | ||||||||||||
|
Total loans held for investment |
$ | 1,710,265 | 100.0 | % | $ | 1,528,469 | 100.0 | % | ||||||||
Commercial loans. Commercial loans are underwritten after evaluating and understanding the borrower’s ability to operate profitably and effectively. These loans are made based primarily on the identified cash flows of the borrower and, secondarily, on the underlying collateral provided by the borrower. Most commercial loans are secured by the assets being financed or other business assets, such as accounts receivable or inventory, and generally include personal guarantees.
Commercial loans increased $26.8 million, or 7.4%, to $390.4 million as of December 31, 2019 from $363.6 million as of December 31, 2018, primarily due to the efforts of our bankers who attracted new clients and leveraged existing bank relationships to fund expansion and growth opportunities.
Construction and land. Construction and land development loans are comprised of loans to fund construction, land acquisition and land development construction. The properties securing the portfolio are located primarily throughout Louisiana and Dallas, Texas, and are generally diverse in terms of type.
Construction and land loans increased $33.1 million, or 15.7%, to $244.2 million as of December 31, 2019 from $211.1 million as of December 31, 2018, primarily due to opportunities to fund small residential land development projects with proven developers who are existing customers of the Bank and have demonstrated a successful track record for many years.
1-4 family residential. Our 1-4 family residential loan portfolio is comprised of loans secured by single family homes, which are both owner-occupied and investor owned. Our 1-4 family residential loans have a relatively small balance spread between many individual borrowers and are generally offered as accommodations to existing customers.
1-4 family residential loans increased $22.6 million, or 0.8%, to $293.1 million as of December 31, 2019 from $270.6 million as of December 31, 2018.
Nonfarm nonresidential. Nonfarm nonresidential loans are underwritten primarily based on projected cash flows and, secondarily, as loans secured by real estate. These loans may be more adversely affected by conditions in the real estate markets or in the general economy. The properties securing the portfolio are located throughout Louisiana and Texas and are generally diverse in terms of type. This diversity helps reduce the exposure to adverse economic events that affect any single industry.
Nonfarm nonresidential loans increased $93.9 million, or 18.1%, to $612.6 million as of December 31, 2019 from $518.7 million as of December 31, 2018.
Other loan categories. Other categories of loans included in our loan portfolio include farmland and agricultural loans made to farmers and ranchers relating to their operations, multi-family residential loans, and consumer loans. None of these categories of loans represents a significant portion of our total loan portfolio.
The contractual maturity ranges of loans in our loan portfolio and the amount of such loans with fixed and floating interest rates in each maturity range as of date indicated are summarized in the following tables:
|
As of December 31, 2019 |
||||||||||||||||
|
One Year |
One |
After Five |
Total |
|||||||||||||
|
(Dollars in thousands) |
||||||||||||||||
|
Commercial |
$ | 141,403 | $ | 194,612 | $ | 54,383 | $ | 390,398 | ||||||||
|
Real estate: |
||||||||||||||||
|
Construction and land |
116,928 | 118,922 | 8,331 | 244,181 | ||||||||||||
|
Farmland |
8,428 | 31,982 | 8,271 | 48,681 | ||||||||||||
|
1-4 family residential |
37,418 | 171,235 | 84,489 | 293,142 | ||||||||||||
|
Multi-family residential |
5,994 | 16,130 | 14,330 | 36,454 | ||||||||||||
|
Nonfarm nonresidential |
70,862 | 370,951 | 170,795 | 612,608 | ||||||||||||
|
Consumer |
22,363 | 60,648 | 1,790 | 84,801 | ||||||||||||
|
Total loans held for investment |
$ | 403,396 | $ | 964,480 | $ | 342,389 | $ | 1,710,265 | ||||||||
|
Amounts with fixed rates |
$ | 165,154 | $ | 746,457 | $ | 266,488 | $ | 1,178,099 | ||||||||
|
Amounts with floating rates |
238,242 | 218,023 | 75,901 | 532,166 | ||||||||||||
|
As of December 31, 2018 |
||||||||||||||||
|
One Year |
One |
After Five |
Total |
|||||||||||||
|
(Dollars in thousands) |
||||||||||||||||
|
Commercial |
$ | 137,581 | $ | 161,874 | $ | 64,185 | $ | 363,640 | ||||||||
|
Real estate: |
||||||||||||||||
|
Construction and land |
104,033 | 74,730 | 32,291 | 211,054 | ||||||||||||
|
Farmland |
12,340 | 31,755 | 1,894 | 45,989 | ||||||||||||
|
1-4 family residential |
40,613 | 137,617 | 92,353 | 270,583 | ||||||||||||
|
Multi-family residential |
12,253 | 12,945 | 14,075 | 39,273 | ||||||||||||
|
Nonfarm nonresidential |
61,561 | 294,683 | 162,416 | 518,660 | ||||||||||||
|
Consumer |
36,129 | 37,161 | 5,980 | 79,270 | ||||||||||||
|
Total loans held for investment |
$ | 404,510 | $ | 750,765 | $ | 373,194 | $ | 1,528,469 | ||||||||
|
Amounts with fixed rates |
$ | 147,087 | $ | 541,076 | $ | 267,748 | $ | 955,911 | ||||||||
|
Amounts with floating rates |
257,423 | 209,689 | 105,446 | 572,558 | ||||||||||||
Nonperforming Assets
Loans are considered past due if the required principal and interest payments have not been received as of the date such payments were due. Loans are placed on nonaccrual status when, in management’s opinion, the borrower may be unable to meet payment obligations as they become due, as well as when required by regulatory provisions. Loans may be placed on nonaccrual status regardless of whether or not such loans are considered past due. When interest accrual is discontinued, all unpaid accrued interest is generally reversed. Interest income is subsequently recognized only to the extent cash payments are received in excess of principal due, or interest may be recognized on a cash basis as long as the remaining book balance of the loan is deemed collectible. Loans are returned to accrual status when all the principal and interest amounts contractually due are brought current and future payments are reasonably assured.
We have several procedures in place to assist in maintaining the overall quality of our loan portfolio. We have established underwriting guidelines to be followed by our bankers, and we also monitor our delinquency levels for any negative or adverse trends. There can be no assurance, however, that our loan portfolio will not become subject to increasing pressures from deteriorating borrower credit due to general economic conditions.
We believe our conservative lending approach and focused management of nonperforming assets has resulted in sound asset quality and timely resolution of problem assets. We had $13.2 million and $15.5 million in nonperforming assets as of December 31, 2019 and 2018, respectively. We had $9.0 million in nonperforming loans as of December 31, 2019 compared to $13.6 million as of December 31, 2018. The decrease in nonperforming assets from December 31, 2018 to December 31, 2019 is primarily due to the reduction in nonaccrual loans and loans past due 90 or more days.
The following table presents information regarding nonperforming loans at the dates indicated:
|
As of and for the Year Ended |
||||||||
|
December 31, |
December 31, |
|||||||
|
Nonaccrual loans |
$ | 8,977 | $ | 11,691 | ||||
|
Accruing loans 90 or more days past due |
72 | 1,876 | ||||||
|
Total nonperforming loans |
9,049 | 13,567 | ||||||
|
Repossessed assets |
160 | 11 | ||||||
|
Other real estate owned: |
||||||||
|
Commercial real estate, construction, land and land development |
3,808 | 1,568 | ||||||
|
Residential real estate |
228 | 341 | ||||||
|
Total other real estate owned |
4,036 | 1,909 | ||||||
|
Total nonperforming assets |
$ | 13,245 | $ | 15,487 | ||||
|
Restructured loans-nonaccrual |
$ | 2,106 | $ | 2,900 | ||||
|
Restructured loans-accruing |
2,921 | 2,920 | ||||||
|
Ratio of nonperforming loans to total loans held for investment |
0.53 | % | 0.89 | % | ||||
|
Ratio of nonperforming assets to total assets |
0.58 | 0.74 | ||||||
|
As of and for the Year Ended |
||||||||
|
December 31, |
December 31, |
|||||||
|
Nonaccrual loans by category: |
||||||||
|
Real estate: |
||||||||
|
Construction and land |
$ | 397 | $ | 32 | ||||
|
Farmland |
339 | 112 | ||||||
|
1-4 family residential |
2,349 | 2,728 | ||||||
|
Multi-family residential |
— | — | ||||||
|
Nonfarm nonresidential |
3,655 | 6,031 | ||||||
|
Commercial |
1,825 | 2,663 | ||||||
|
Consumer |
412 | 125 | ||||||
|
Total |
$ | 8,977 | $ | 11,691 | ||||
Potential Problem Loans
From a credit risk standpoint, we classify loans in one of four categories: pass, special mention, substandard or doubtful. Loans classified as loss are charged-off. The classifications of loans reflect a judgment about the risks of default and loss associated with the loan. Ratings are adjusted to reflect the degree of risk and loss that is believed to be inherent in each credit. Our methodology is structured so that specific allocations are increased in accordance with deterioration in credit quality (and a corresponding increase in risk of loss) or decreased in accordance with improvement in credit quality (and a corresponding decrease in risk of loss).
Credits rated special mention show clear signs of financial weaknesses or deterioration in credit worthiness; however, such concerns are not so pronounced that we generally expect to experience significant loss within the short-term. Such credits typically maintain the ability to perform within standard credit terms and credit exposure is not as prominent as credits with a lower rating.
Credits rated substandard are those in which the normal repayment of principal and interest may be, or has been, jeopardized by reason of adverse trends or developments of a financial, managerial, economic or political nature, or important weaknesses which exist in collateral. A protracted workout on these credits is a distinct possibility. Prompt corrective action is therefore required to reduce exposure and to assure that adequate remedial measures are taken by the borrower. Credit exposure becomes more likely in such credits and a serious evaluation of the secondary support to the credit is performed.
Credits rated doubtful have all the weaknesses inherent in those rated substandard, with the added characteristic that the weaknesses make collection or liquidation in full, on the basis of currently existing facts, conditions, and values, highly questionable and improbable.
The following tables summarize our internal ratings of our loans held for investment as of the dates indicated.
|
As of December 31, 2019 |
||||||||||||||||||||
|
Pass |
Special Mention |
Substandard |
Doubtful |
Total |
||||||||||||||||
|
(Dollars in thousands) |
||||||||||||||||||||
|
Real estate: |
||||||||||||||||||||
|
Construction and land |
$ | 241,519 | $ | 1,141 | $ | 1,124 | $ | 397 | $ | 244,181 | ||||||||||
|
Farmland |
46,591 | 1,737 | 14 | 339 | 48,681 | |||||||||||||||
|
1-4 family residential |
284,381 | 3,175 | 3,237 | 2,349 | 293,142 | |||||||||||||||
|
Multi-family residential |
36,422 | — | 32 | — | 36,454 | |||||||||||||||
|
Nonfarm nonresidential |
594,046 | 11,077 | 3,830 | 3,655 | 612,608 | |||||||||||||||
|
Commercial |
374,500 | 9,219 | 4,854 | 1,825 | 390,398 | |||||||||||||||
|
Consumer |
82,726 | 1,538 | 125 | 412 | 84,801 | |||||||||||||||
|
Total |
$ | 1,660,185 | $ | 27,887 | $ | 13,216 | $ | 8,977 | $ | 1,710,265 | ||||||||||
|
As of December 31, 2018 |
||||||||||||||||||||
|
Pass |
Special Mention |
Substandard |
Doubtful |
Total |
||||||||||||||||
|
(Dollars in thousands) |
||||||||||||||||||||
|
Real estate: |
||||||||||||||||||||
|
Construction and land |
$ | 209,027 | $ | 718 | $ | 1,277 | $ | 32 | $ | 211,054 | ||||||||||
|
Farmland |
45,563 | 153 | 161 | 112 | 45,989 | |||||||||||||||
|
1-4 family residential |
260,325 | 4,601 | 2,929 | 2,728 | 270,583 | |||||||||||||||
|
Multi-family residential |
39,237 | — | 36 | — | 39,273 | |||||||||||||||
|
Nonfarm nonresidential |
494,698 | 14,421 | 3,510 | 6,031 | 518,660 | |||||||||||||||
|
Commercial |
347,839 | 5,690 | 7,448 | 2,663 | 363,640 | |||||||||||||||
|
Consumer |
77,731 | 1,180 | 234 | 125 | 79,270 | |||||||||||||||
|
Total |
$ | 1,474,420 | $ | 26,763 | $ | 15,595 | $ | 11,691 | $ | 1,528,469 | ||||||||||
Allowance for Loan Losses
We maintain an allowance for loan losses that represents management’s best estimate of the loan losses and risks inherent in the loan portfolio. In determining the allowance for loan losses, we estimate losses on specific loans, or groups of loans, where the probable loss can be identified and reasonably determined. The balance of the allowance for loan losses is based on internally assigned risk classifications of loans, historical loan loss rates, changes in the nature of the loan portfolio, overall portfolio quality, industry concentrations, delinquency trends, current economic factors and the estimated impact of current economic conditions on certain historical loan loss rates. For additional discussion of our methodology, please refer to “—Critical Accounting Policies—Allowance for loan losses.”
In connection with our review of the loan portfolio, we consider risk elements attributable to particular loan types or categories in assessing the quality of individual loans. Some of the risk elements we consider include:
|
• |
for commercial and industrial loans, the operating results of the commercial, industrial or professional enterprise, the borrower’s business, professional and financial ability and expertise, the specific risks and volatility of income and operating results typical for businesses in that category, and the value, nature and marketability of collateral; |
|
• |
for commercial mortgage loans and multifamily residential loans, the debt service coverage ratio (income from the property in excess of operating expenses compared to loan payment requirements), operating results of the owner in the case of owner occupied properties, the loan to value ratio, the age and condition of the collateral, and the volatility of income, property value and future operating results typical for properties of that type; |
|
• |
for 1-4 family residential mortgage loans, the borrower’s ability to repay the loan, including a consideration of the debt to income ratio and employment and income stability, the loan to value ratio, and the age, condition and marketability of the collateral; and |
|
• |
for construction, land development and other land loans, the perceived feasibility of the project including the ability to sell developed lots or improvements constructed for resale or the ability to lease property constructed for lease, the quality and nature of contracts for presale or prelease, if any, the experience and ability of the developer, and the loan to value ratio. |
As of December 31, 2019, the allowance for loan losses totaled $12.1 million, or 0.71%, of total loans held for investment. As of December 31, 2018, the allowance for loan losses totaled $11.2 million, or 0.73%, of total loans held for investment.
The following table presents, as of and for the periods indicated, an analysis of the allowance for loan losses and other related data:
|
As of and for the Year Ended |
||||||||
|
December 31, 2019 |
December 31, 2018 |
|||||||
|
Average loans outstanding(1) |
$ | 1,628,803 | $ | 1,258,178 | ||||
|
Gross loans held for investment outstanding at end of period |
$ | 1,710,265 | $ | 1,528,469 | ||||
|
Allowance for loan losses at beginning of period |
11,220 | 8,765 | ||||||
|
Provision for loan losses |
2,606 | 2,390 | ||||||
|
Charge-offs: |
||||||||
|
Real estate: |
||||||||
|
Construction, land and farmland |
4 | 90 | ||||||
|
Residential |
162 | 294 | ||||||
|
Nonfarm non-residential |
51 | — | ||||||
|
Commercial |
1,556 | — | ||||||
|
Consumer |
52 | 88 | ||||||
|
Total charge-offs |
1,825 | 472 | ||||||
|
Recoveries: |
||||||||
|
Real estate: |
||||||||
|
Construction, land and farmland |
— | 398 | ||||||
|
Residential |
14 | 18 | ||||||
|
Nonfarm non-residential |
4 | 13 | ||||||
|
Commercial |
41 | 28 | ||||||
|
Consumer |
64 | 80 | ||||||
|
Total recoveries |
123 | 537 | ||||||
|
Net charge-offs (recoveries) |
1,702 | (65 | ) | |||||
|
Allowance for loan losses at end of period |
$ | 12,124 | $ | 11,220 | ||||
|
Ratio of allowance to end of period loans held for investment |
0.71 | % | 0.73 | % | ||||
|
Ratio of net charge-offs (recoveries) to average loans |
0.10 | 0.00 | ||||||
|
(1) |
Excluding loans held for sale. |
Although we believe that we have established our allowance for loan losses in accordance with GAAP and that the allowance for loan losses was adequate to provide for known and inherent losses in the portfolio at all times shown above, future provisions will be subject to ongoing evaluations of the risks in our loan portfolio. If we experience economic declines or if asset quality deteriorates, material additional provisions could be required.
The following table shows the allocation of the allowance for loan losses among loan categories and certain other information as of the dates indicated. The allocation of the allowance for loan losses as shown in the table should neither be interpreted as an indication of future charge-offs, nor as an indication that charge-offs in future periods will necessarily occur in these amounts or in the indicated proportions. The total allowance is available to absorb losses from any loan category.
|
As of December 31, |
As of December 31, |
|||||||||||||||
|
Amount |
Percent |
Amount |
Percent |
|||||||||||||
|
(Dollars in |
(Dollars in |
|||||||||||||||
|
Real estate: |
||||||||||||||||
|
Construction and land |
$ | 1,868 | 15.4 | % | $ | 1,590 | 14.2 | % | ||||||||
|
Farmland |
229 | 1.9 | 104 | 0.9 | ||||||||||||
|
1-4 family residential |
1,888 | 15.6 | 1,538 | 13.7 | ||||||||||||
|
Multi-family residential |
226 | 1.9 | 236 | 2.1 | ||||||||||||
|
Nonfarm nonresidential |
3,882 | 32.0 | 2,715 | 24.2 | ||||||||||||
|
Total real estate |
8,093 | 66.8 | 6,183 | 55.1 | ||||||||||||
|
Commercial |
3,414 | 28.1 | 4,453 | 39.7 | ||||||||||||
|
Consumer |
617 | 5.1 | 584 | 5.2 | ||||||||||||
|
Total allowance for loan losses |
$ | 12,124 | 100.0 | % | $ | 11,220 | 100.0 | % | ||||||||
Securities
We use our securities portfolio to provide a source of liquidity, an appropriate return on funds invested, manage interest rate risk, meet collateral requirements, and meet regulatory capital requirements. As of December 31, 2019, the carrying amount of investment securities totaled $278.2 million, a decrease of $31.3 million, or 10.1%, compared to $309.5 million as of December 31, 2018. Securities represented 12.2% and 14.8% of total assets as of December 31, 2019 and 2018, respectively.
Our investment portfolio consists entirely of securities classified as available for sale. As a result, the carrying values of our investment securities are adjusted for unrealized gain or loss, and any gain or loss is reported on an after-tax basis as a component of other comprehensive income in shareholders’ equity. The following tables summarize the amortized cost and estimated fair value of investment securities as of the dates shown:
|
As of December 31, 2019 |
||||||||||||||||
|
Amortized |
Gross |
Gross |
Fair Value |
|||||||||||||
|
(Dollars in thousands) |
||||||||||||||||
|
U.S. government agencies |
$ | 15,654 | $ | 303 | $ | 20 | $ | 15,937 | ||||||||
|
Corporate bonds |
23,774 | 98 | 158 | 23,714 | ||||||||||||
|
Mortgage-backed securities |
137,817 | 2,139 | 497 | 139,459 | ||||||||||||
|
Municipal securities |
97,641 | 1,447 | 5 | 99,083 | ||||||||||||
|
Total |
$ | 274,886 | $ | 3,987 | $ | 680 | $ | 278,193 | ||||||||
|
As of December 31, 2018 |
||||||||||||||||
|
Amortized |
Gross |
Gross |
Fair Value |
|||||||||||||
|
(Dollars in thousands) |
||||||||||||||||
|
U.S. government agencies |
$ | 17,529 | $ | 54 | $ | 144 | $ | 17,439 | ||||||||
|
Corporate bonds |
13,052 | 76 | 436 | 12,692 | ||||||||||||
|
Mortgage-backed securities |
168,854 | 328 | 3,564 | 165,618 | ||||||||||||
|
Municipal securities |
114,472 | 250 | 955 | 113,767 | ||||||||||||
|
Total |
$ | 313,907 | $ | 708 | $ | 5,099 | $ | 309,516 | ||||||||
All of our mortgage-backed securities are agency securities. We do not hold any Fannie Mae or Freddie Mac preferred stock, corporate equity, collateralized debt obligations, collateralized loan obligations, structured investment vehicles, private label collateralized mortgage obligations, subprime, Alt-A, or second lien elements in our investment portfolio. As of December 31, 2019, the investment portfolio did not contain any securities that are directly backed by subprime or Alt-A mortgages.
Management evaluates securities for other-than-temporary impairment, at least on a quarterly basis, and more frequently when economic or market conditions warrant such an evaluation.
The following tables set forth the fair value, maturities and approximated weighted average yield based on estimated annual income divided by the average amortized cost of the securities portfolio as of the dates indicated. The contractual maturity of a mortgage-backed security is the date at which the last underlying mortgage matures.
|
As of December 31, 2019 |
||||||||||||||||||||||||||||||||||||||||
|
Within One |
After One Year |
After Five Years but |
After Ten |
Total |
||||||||||||||||||||||||||||||||||||
|
Amount |
Yield |
Amount |
Yield |
Amount |
Yield |
Amount |
Yield |
Total |
Yield |
|||||||||||||||||||||||||||||||
|
(Dollars in thousands) |
||||||||||||||||||||||||||||||||||||||||
|
U.S. government agencies |
$ | 2,995 | 2.86 | % | $ | 1,733 | 2.71 | % | $ | 10,608 | 2.90 | % | $ | 601 | 3.51 | % | $ | 15,937 | 2.89 | % | ||||||||||||||||||||
|
Corporate bonds |
6,481 | 3.43 | % | 2,000 | 2.82 | % | 15,233 | 5.40 | % | — | — | % | 23,714 | 4.64 | % | |||||||||||||||||||||||||
|
Mortgage-backed securities |
2,340 | 1.89 | % | 10,906 | 2.09 | % | 68,686 | 2.29 | % | 57,527 | 2.56 | % | 139,459 | 2.38 | % | |||||||||||||||||||||||||
|
Municipal securities |
15,201 | 2.00 | % | 36,460 | 2.18 | % | 36,631 | 2.30 | % | 10,791 | 2.91 | % | 99,083 | 2.28 | % | |||||||||||||||||||||||||
|
Total |
$ | 27,017 | 2.43 | % | $ | 51,099 | 2.20 | % | $ | 131,158 | 2.70 | % | $ | 68,919 | 2.62 | % | $ | 278,193 | 2.56 | % | ||||||||||||||||||||
|
As of December 31, 2018 |
||||||||||||||||||||||||||||||||||||||||
|
Within One |
After One Year |
After Five Years but |
After Ten |
Total |
||||||||||||||||||||||||||||||||||||
|
Amount |
Yield |
Amount |
Yield |
Amount |
Yield |
Amount |
Yield |
Total |
Yield |
|||||||||||||||||||||||||||||||
|
(Dollars in thousands) |
||||||||||||||||||||||||||||||||||||||||
|
U.S. government agencies |
$ | 997 | 1.11 | % | $ | 6,915 | 2.85 | % | $ | 9,527 | 2.85 | % | $ | — | — | % | $ | 17,439 | 2.75 | % | ||||||||||||||||||||
|
Corporate bonds |
— | — | % | 8,316 | 3.78 | % | 4,376 | 5.22 | % | — | — | % | 12,692 | 4.28 | % | |||||||||||||||||||||||||
|
Mortgage-backed securities |
71 | 1.27 | % | 13,308 | 2.45 | % | 82,754 | 2.16 | % | 69,485 | 2.82 | % | 165,618 | 2.46 | % | |||||||||||||||||||||||||
|
Municipal securities |
14,227 | 1.98 | % | 45,674 | 2.09 | % | 38,222 | 2.20 | % | 15,644 | 2.77 | % | 113,767 | 2.21 | % | |||||||||||||||||||||||||
|
Total |
$ | 15,295 | 1.92 | % | $ | 74,213 | 2.42 | % | $ | 134,879 | 2.32 | % | $ | 85,129 | 2.81 | % | $ | 309,516 | 2.46 | % | ||||||||||||||||||||
The contractual maturity of mortgage-backed securities, collateralized mortgage obligations and asset backed securities is not a reliable indicator of their expected life because borrowers have the right to prepay their obligations at any time. Mortgage-backed securities and asset-backed securities are typically issued with stated principal amounts and are backed by pools of mortgage loans and other loans with varying maturities. The term of the underlying mortgages and loans may vary significantly due to the ability of a borrower to pre-pay. Monthly pay downs on mortgage-backed securities tend to cause the average life of the securities to be much different than the stated contractual maturity. During a period of increasing interest rates, fixed rate mortgage-backed securities do not tend to experience heavy prepayments of principal and, consequently, the average life of this security will be lengthened. If interest rates begin to fall, prepayments may increase, thereby shortening the estimated life of this security. The weighted average life of our investment portfolio was 4.23 years with an estimated effective duration of 40.64 months as of December 31, 2019.
As of December 31, 2019 and 2018, we did not own securities of any one issuer for which aggregate adjusted cost exceeded 10% of the consolidated shareholders’ equity as of such respective dates.
Deposits
We offer a variety of deposit accounts having a wide range of interest rates and terms including demand, savings, money market and time accounts. We rely primarily on competitive pricing policies, convenient locations and personalized service to attract and retain these deposits.
Total deposits as of December 31, 2019 were $1.8 billion, an increase of $48.1 million, or 2.8%, compared to $1.7 billion as of December 31, 2018.
Noninterest-bearing deposits as of December 31, 2019 were $398.8 million compared to $382.4 million as of December 31, 2018, an increase of $16.5 million, or 4.3%.
Average deposits for the year ended December 31, 2019 were $1.7 billion, an increase of $347.5 million, or 25.3%, over the full year average for the year ended December 31, 2018 of $1.4 billion. The average rate paid on total interest-bearing deposits increased over this period from 1.12% for the year ended December 31, 2018 to 1.50% for the year ended December 31, 2019. The increase in average rates was driven by a strategic increase in the pricing of interest-bearing demand accounts and certificates of deposit in order to improve liquidity. In addition, the stability and the continued growth of noninterest-bearing demand accounts served to reduce the cost of deposits to 1.15% for the year ended December 31, 2019 and 0.86% for the year ended December 31, 2018.
The following table presents the daily average balances and weighted average rates paid on deposits for the periods indicated:
|
For the Year Ended December 31, 2019 |
For the Year Ended December 31, 2018 |
|||||||||||||||
|
Average |
Average |
Average |
Average |
|||||||||||||
|
(Dollars in thousands) |
(Dollars in thousands) |
|||||||||||||||
|
Interest-bearing demand accounts |
$ | 35,444 | 1.37 | % | $ | 37,178 | 0.88 | % | ||||||||
|
Negotiable order of withdrawal (“NOW”) accounts |
255,648 | 0.85 | % | 183,705 | 0.57 | % | ||||||||||
|
Limited access money market accounts and savings |
432,186 | 0.99 | % | 356,880 | 0.74 | % | ||||||||||
|
Certificates and other time deposits > $250k |
176,987 | 2.15 | % | 152,159 | 1.60 | % | ||||||||||
|
Certificates and other time deposits < $250k |
416,631 | 2.16 | % | 322,010 | 1.67 | % | ||||||||||
|
Total interest-bearing deposits |
1,316,896 | 1.50 | % | 1,051,932 | 1.12 | % | ||||||||||
|
Noninterest-bearing demand accounts |
402,147 | — | % | 319,623 | — | % | ||||||||||
|
Total deposits |
$ | 1,719,043 | 1.15 | % | $ | 1,371,555 | 0.86 | % | ||||||||
The ratio of average noninterest-bearing deposits to average total deposits for the years ended December 31, 2019 and 2018 was 23.4% and 23.3%, respectively.
The following table sets forth the contractual maturities of certain certificates of deposit at December 31, 2019:
|
Certificates of Deposit More Than $250,000 |
Certificates of Deposit of $100,000 Through $250,000 |
|||||||
|
(Dollars in thousands) |
||||||||
|
3 months or less |
$ | 25,263 | $ | 48,426 | ||||
|
More than 3 months but less than 6 months |
36,283 | 59,340 | ||||||
|
More than 6 months but less than 12 months |
33,388 | 137,606 | ||||||
|
12 months or more |
57,925 | 87,065 | ||||||
|
Total |
$ | 152,859 | $ | 332,437 | ||||
Borrowings
We utilize short-term and long-term borrowings to supplement deposits to fund our lending and investment activities. In addition, we use short-term borrowings to periodically repurchase outstanding shares of our common stock and for general corporate purposes. Each of these relationships are discussed below.
FHLB advances. The FHLB allows us to borrow on a blanket floating lien status collateralized by certain securities and loans. As of December 31, 2019 and 2018, total borrowing capacity of $626.3 million and $544.0 million, respectively, was available under this arrangement and $93.0 million and $55.0 million, respectively, was outstanding with a weighted average stated interest rate of 2.06% as of December 31, 2019 and 2.47% as of December 31, 2018. Our current FHLB advances mature within five years. We utilize these borrowings to meet liquidity needs and to fund certain fixed rate loans in our portfolio.
The following table presents our FHLB borrowings at the dates indicated.
|
FHLB |
||||
|
(Dollars in Thousands) |
||||
|
December 31, 2019 |
||||
|
Amount outstanding at year-end |
$ | 93,000 | ||
|
Weighted average stated interest rate at year-end |
2.06 | % | ||
|
Maximum month-end balance during the year |
$ | 128,000 | ||
|
Average balance outstanding during the year |
$ | 69,183 | ||
|
Weighted average interest rate during the year |
2.28 | % | ||
|
December 31, 2018 |
||||
|
Amount outstanding at year-end |
$ | 55,000 | ||
|
Weighted average stated interest rate at year-end |
2.47 | % | ||
|
Maximum month-end balance during the year |
$ | 105,000 | ||
|
Average balance outstanding during the year |
$ | 84,187 | ||
|
Weighted average interest rate during the year |
2.20 | % | ||
Subordinated Note Purchase Agreement (“Subordinated Debt”). In December 2018 we issued subordinated notes in the amount of $25.0 million. The subordinated notes bear a fixed rate of interest at 6.75% until December 31, 2028 and a floating rate thereafter through maturity in 2033. The balance outstanding at both December 31, 2019 and 2018 was $25.0 million. This subordinated notes were issued for the purpose of paying off our long term advance and line of credit with First National Bankers Bank (“FNBB”), for general corporate purposes and to provide Tier 2 capital. The subordinated notes are redeemable by the Company at its option beginning in 2028.
The following table presents the Subordinated Debt at the dates indicated.
|
Subordinated Debt |
||||
|
(Dollars in Thousands) |
||||
|
December 31, 2019 |
||||
|
Amount outstanding at year-end |
$ | 25,000 | ||
|
Weighted average stated interest rate at year-end |
6.75 | % | ||
|
Maximum month-end balance during the year |
$ | 25,000 | ||
|
Average balance outstanding during the year |
$ | 25,000 | ||
|
Weighted average interest rate during the year |
6.75 | % | ||
|
December 31, 2018 |
||||
|
Amount outstanding at year-end |
$ | 25,000 | ||
|
Weighted average stated interest rate at year-end |
6.75 | % | ||
|
Maximum month-end balance during the year |
$ | 25,000 | ||
|
Average balance outstanding during the year |
$ | 1,027 | ||
|
Weighted average interest rate during the year |
6.75 | % | ||
FNBB revolving advances. FNBB allows us to borrow on a revolving basis up to $5.0 million. This line of credit, established on September 12, 2016, was secured by a pledge of and security interest in the common stock of our wholly-owned subsidiary, b1BANK. This line of credit did not have a balance at December 31, 2019 and 2018, respectively. This line of credit carries a variable interest rate equal to the Wall Street Journal Prime rate. This FNBB line was established for the purpose of repurchasing shares of our common stock from certain of our shareholders and for general corporate purposes.
Correspondent Bank Federal Funds Purchased Relationships
We maintain Federal Funds Purchased Relationships with the following financial institutions and limits as of December 31, 2019:
|
Fed Funds Purchased |
||||
|
(Dollars in Thousands) |
||||
|
FNBB |
$ | 35,000 | ||
|
Compass Bank |
30,000 | |||
|
The Independent Bankers Bank |
25,000 | |||
|
First Horizon Bank |
17,000 | |||
|
ServisFirst Bank |
10,000 | |||
|
CenterState Bank |
9,000 | |||
|
Total |
$ | 126,000 | ||
The following table represents combined Federal Funds Purchased for all relationships at the dates indicated.
|
Fed Funds |
||||
|
(Dollars in Thousands) |
||||
|
December 31, 2019 |
||||
|
Amount outstanding at year-end |
$ | — | ||
|
Weighted average interest rate at year-end |
— | % | ||
|
Maximum month-end balance during the year |
$ | 975 | ||
|
Average balance outstanding during the year |
$ | 206 | ||
|
Weighted average interest rate during the year |
2.77 | % | ||
|
December 31, 2018 |
||||
|
Amount outstanding at year-end |
$ | — | ||
|
Weighted average interest rate at year-end |
— | % | ||
|
Maximum month-end balance during the year |
$ | — | ||
|
Average balance outstanding during the year |
$ | 114 | ||
|
Weighted average interest rate during the year |
2.44 | % | ||
Liquidity and Capital Resources
Liquidity
Liquidity involves our ability to utilize funds to support asset growth and acquisitions or reduce assets to meet deposit withdrawals and other payment obligations, to maintain reserve requirements and otherwise to operate on an ongoing basis and manage unexpected events. For the years ended December 31, 2019 and 2018, liquidity needs were primarily met by core deposits, security and loan maturities, and amortizing investment and loan portfolios. Although access to brokered deposits, purchased funds from correspondent banks and overnight advances from the FHLB and our FNBB revolving line are available and have been utilized on occasion to take advantage of investment opportunities, we do not generally rely on these external funding sources. As of December 31, 2019 and 2018, we maintained six lines of credit with commercial banks which provide for extensions of credit with an availability to borrow up to an aggregate $126.0 million and $126.0 million as of December 31, 2019 and 2018, respectively. There were no funds under these lines of credit outstanding as of December 31, 2019 and 2018.
The following table illustrates, during the periods presented, the mix of our funding sources and the average assets in which those funds are invested as a percentage of average total assets for the period indicated. Average assets totaled $2.1 billion and $1.7 billion for the years ended December 31, 2019 and 2018, respectively.
|
For the Year Ended |
For the Year Ended |
|||||||
|
Sources of Funds: |
||||||||
|
Deposits: |
||||||||
|
Noninterest-bearing |
18.8 | % | 19.0 | % | ||||
|
Interest-bearing |
61.7 | 62.5 | ||||||
|
Subordinated debt |
1.2 | 0.1 | ||||||
|
Advances from FHLB |
3.2 | 5.0 | ||||||
|
Other borrowings |
1.4 | 1.1 | ||||||
|
Other liabilities |
0.9 | 0.4 | ||||||
|
Shareholders’ equity |
12.8 | 11.9 | ||||||
|
Total |
100.0 | % | 100.0 | % | ||||
|
Uses of Funds: |
||||||||
|
Loans |
75.7 | % | 74.2 | % | ||||
|
Securities available for sale |
14.0 | 15.3 | ||||||
|
Interest-bearing deposits in other banks |
1.3 | 1.9 | ||||||
|
Other noninterest-earning assets |
9.0 | 8.6 | ||||||
|
Total |
100.0 | % | 100.0 | % | ||||
|
Average noninterest-bearing deposits to average deposits |
23.4 | % | 23.3 | % | ||||
|
Average loans to average deposits |
94.8 | 91.7 | ||||||
Our primary source of funds is deposits, and our primary use of funds is loans. We do not expect a change in the primary source or use of our funds in the foreseeable future. Our average loans increased 29.5% for the year ended December 31, 2019 compared to the same period in 2018, primarily due to the acquisition of RSBI and organic growth. We predominantly invest excess deposits in overnight deposits with the Federal Reserve, securities, interest-bearing deposits at other banks or other short-term liquid investments until needed to fund loan growth. Our securities portfolio had a weighted average life of 4.23 years and an effective duration of 40.64 months as of December 31, 2019 and a weighted average life of 4.50 years and an effective duration of 44.69 months as of December 31, 2018.
As of December 31, 2019, we had outstanding $389.9 million in commitments to extend credit and $24.4 million in commitments associated with outstanding standby and commercial letters of credit. As of December 31, 2018, we had outstanding $322.5 million in commitments to extend credit and $11.5 million in commitments associated with outstanding standby and commercial letters of credit. Because commitments associated with letters of credit and commitments to extend credit may expire unused, the total outstanding may not necessarily reflect the actual future cash funding requirements. See “Off Balance Sheet Items” below for additional information.
As of December 31, 2019, we had no exposure to future cash requirements associated with known uncertainties or capital expenditures of a material nature. As of December 31, 2019, we had cash and cash equivalents of $89.4 million compared to $96.1 million as of December 31, 2018.
Capital Resources
Total shareholders’ equity increased to $285.1 million as of December 31, 2019, compared to $260.1 million as of December 31, 2018, an increase of $25.0 million, or 9.6%. This increase was primarily due to $23.8 million in net income and $6.1 million in the change in unrealized gains on our investment portfolio, offset with $5.1 million in paid dividends.
On January 22, 2020, our Board of Directors declared a quarterly dividend based upon our financial performance for the three months ended December 31, 2019 in the amount of $0.10 per share to the common shareholders of record as of February 15, 2020. The dividend was paid on February 28, 2020.
The declaration and payment of dividends to our shareholders, as well as the amounts thereof, are subject to the discretion of the Board and depend upon our results of operations, financial condition, capital levels, cash requirements, future prospects and other factors deemed relevant by the Board. As a bank holding company, our ability to pay dividends is largely dependent upon the receipt of dividends from our subsidiary, b1BANK. There can be no assurance that we will declare and pay any dividends to our shareholders.
Capital management consists of providing equity to support current and future operations. Banking regulators view capital levels as important indicators of an institution’s financial soundness. As a general matter, FDIC-insured depository institutions and their holding companies are required to maintain minimum capital relative to the amount and types of assets they hold. We are subject to regulatory capital requirements at the bank holding company and bank levels. As of December 31, 2019 and 2018, we and b1BANK were in compliance with all applicable regulatory capital requirements, and b1BANK was classified as “well-capitalized,” for purposes of the prompt corrective action regulations. As we employ our capital and continue to grow our operations, our regulatory capital levels may decrease depending on our level of earnings. However, we expect to monitor and control our growth in order to remain in compliance with all regulatory capital standards applicable to us.
The following table presents the actual capital amounts and regulatory capital ratios for us and b1BANK as of the dates indicated.
|
As of December 31, 2019 |
As of December 31, 2018 |
|||||||||||||||
|
Amount |
Ratio |
Amount |
Ratio |
|||||||||||||
|
(Dollars in thousands) |
||||||||||||||||
|
Business First Bancshares, Inc. |
||||||||||||||||
|
Total capital (to risk weighted assets) |
$ | 264,495 | 13.30 | % | $ | 242,144 | 13.91 | % | ||||||||
|
Tier 1 capital (to risk weighted assets) |
227,265 | 11.43 | % | 205,924 | 11.83 | % | ||||||||||
|
Common Equity Tier 1 capital (to risk weighted assets) |
227,265 | 11.43 | % | 205,924 | 11.83 | % | ||||||||||
|
Tier 1 Leveraged capital (to average assets) |
227,265 | 10.56 | % | 205,924 | 11.66 | % | ||||||||||
|
b1Bank |
||||||||||||||||
|
Total capital (to risk weighted assets) |
$ | 254,520 | 12.80 | % | $ | 224,356 | 12.90 | % | ||||||||
|
Tier 1 capital (to risk weighted assets) |
242,290 | 12.19 | % | 213,136 | 12.26 | % | ||||||||||
|
Common Equity Tier 1 capital (to risk weighted assets) |
242,290 | 12.19 | % | 213,136 | 12.26 | % | ||||||||||
|
Tier 1 Leveraged capital (to average assets) |
242,290 | 11.27 | % | 213,136 | 12.08 | % | ||||||||||
Long Term Debt
For information on our subordinated debt, please refer to “Borrowings”.
Contractual Obligations
The following table summarizes contractual obligations and other commitments to make future payments as of December 31, 2019 and 2018 (other than non-maturity deposit obligations), which include future cash payments associated with our contractual obligations pursuant to our FHLB advances, subordinated debt, revolving line of credit, and non-cancelable future operating leases. Payments related to leases are based on actual payments specified in underlying contracts. Advances from the FHLB totaled approximately $93.0 million and $55.0 million as of December 31, 2019 and 2018, respectively. As of December 31, 2019 and 2018, the FHLB advances were collateralized by a blanket floating lien on certain securities and loans, had a weighted average stated rate of 2.06% and 2.47%, respectively, and maturities ranging from 2020 through 2024. The subordinated debt totaled $25.0 million at both December 31, 2019 and 2018. This subordinated debt bears interest at a fixed rate of 6.75% through December 31, 2028 and a floating rate, based on a benchmark rate plus 369 basis points, thereafter through maturity in 2033. The revolving line of credit with FNBB had no outstanding balance at both December 31, 2019 and 2018. This line of credit was secured by a pledge of and security interest in the common stock our wholly-owned subsidiary, b1BANK, and carried interest at a variable rate equal to the Wall Street Journal Prime rate.
|
As of December 31, 2019 |
||||||||||||||||||||
|
1 year or less |
More than 1 |
3 years or |
5 years |
Total |
||||||||||||||||
|
(Dollars in thousands) |
||||||||||||||||||||
|
Non-cancelable future operating leases |
$ | 1,820 | $ | 3,194 | $ | 2,779 | $ | 5,449 | $ | 13,242 | ||||||||||
|
Time deposits |
408,926 | 170,808 | 15,722 | — | 595,456 | |||||||||||||||
|
Advances from FHLB |
10,000 | 60,000 | 23,000 | — | 93,000 | |||||||||||||||
|
Subordinated debt |
— | — | — | 25,000 | 25,000 | |||||||||||||||
|
Securities sold under agreements to repurchase |
67,989 | — | — | — | 67,989 | |||||||||||||||
|
Standby and commercial letters of credit |
7,019 | 16,965 | 450 | — | 24,434 | |||||||||||||||
|
Commitments to extend credit |
223,850 | 105,174 | 27,187 | 33,686 | 389,897 | |||||||||||||||
|
Total |
$ | 719,604 | $ | 356,141 | $ | 69,138 | $ | 64,135 | $ | 1,209,018 | ||||||||||
|
As of December 31, 2018 |
||||||||||||||||||||
|
1 year or less |
More than 1 |
3 years or |
5 years |
Total |
||||||||||||||||
|
(Dollars in thousands) |
||||||||||||||||||||
|
Non-cancelable future operating leases |
$ | 2,366 | $ | 3,087 | $ | 2,294 | $ | 4,751 | $ | 12,498 | ||||||||||
|
Time deposits |
374,612 | 166,212 | 30,286 | — | 571,110 | |||||||||||||||
|
Advances from FHLB |
25,000 | — | 30,000 | — | 55,000 | |||||||||||||||
|
Subordinated debt |
— | — | — | 25,000 | 25,000 | |||||||||||||||
|
Securities sold under agreements to repurchase |
12,229 | — | — | — | 12,229 | |||||||||||||||
|
Standby and commercial letters of credit |
8,691 | 2,816 | — | — | 11,507 | |||||||||||||||
|
Commitments to extend credit |
171,113 | 113,441 | 16,696 | 21,216 | 322,466 | |||||||||||||||
|
Total |
$ | 594,011 | $ | 285,556 | $ | 79,276 | $ | 50,967 | $ | 1,009,810 | ||||||||||
Off-Balance Sheet Items
In the normal course of business, we enter into various transactions which, in accordance with GAAP, are not included in our consolidated balance sheets. We enter into these transactions to meet the financing needs of our customers. These transactions include commitments to extend credit and standby and commercial letters of credit which involve, to varying degrees, elements of credit risk and interest rate risk in excess of the amounts recognized in the consolidated balance sheets.
Our commitments associated with outstanding standby and commercial letters of credit and commitments to extend credit expiring by period as of the date indicated are summarized below. Because commitments associated with letters of credit and commitments to extend credit may expire unused, the amounts shown do not necessarily reflect the actual future cash funding requirements.
|
As of December 31, 2019 |
||||||||||||||||||||
|
1 year or less |
More than 1 |
3 years or |
5 years |
Total |
||||||||||||||||
|
(Dollars in thousands) |
||||||||||||||||||||
|
Standby and commercial letters of credit |
$ | 7,019 | $ | 16,965 | $ | 450 | $ | — | $ | 24,434 | ||||||||||
|
Commitments to extend credit |
223,850 | 105,174 | 27,187 | 33,686 | 389,897 | |||||||||||||||
|
Total |
$ | 230,869 | $ | 122,139 | $ | 27,637 | $ | 33,686 | $ | 414,331 | ||||||||||
|
As of December 31, 2018 |
||||||||||||||||||||
|
1 year or less |
More than 1 |
3 years or |
5 years |
Total |
||||||||||||||||
|
(Dollars in thousands) |
||||||||||||||||||||
|
Standby and commercial letters of credit |
$ | 8,691 | $ | 2,816 | $ | — | $ | — | $ | 11,507 | ||||||||||
|
Commitments to extend credit |
171,113 | 113,441 | 16,696 | 21,216 | 322,466 | |||||||||||||||
|
Total |
$ | 179,804 | $ | 116,257 | $ | 16,696 | $ | 21,216 | $ | 333,973 | ||||||||||
Standby and commercial letters of credit are conditional commitments issued by us to guarantee the performance of a customer to a third party. In the event of nonperformance by the customer, we have rights to the underlying collateral, which can include commercial real estate, physical plant and property, inventory, receivables, cash and/or marketable securities. The credit risk to us in issuing letters of credit is essentially the same as that involved in extending loan facilities to our customers.
Commitments to extend credit are agreements to lend to a customer as long as there is no violation of any condition established in the contract. Commitments generally have fixed expiration dates or other termination clauses and may require payment of a fee. Because many of the commitments are expected to expire without being fully drawn upon, the total commitment amounts disclosed above do not necessarily represent future cash requirements. We evaluate each customer’s creditworthiness on a case-by-case basis. The amount of collateral obtained, if considered necessary by us, upon extension of credit, is based on management’s credit evaluation of the customer.
Interest Rate Sensitivity and Market Risk
As a financial institution, our primary component of market risk is interest rate volatility. Our asset liability and funds management policy provides management with the guidelines for effective funds management, and we have established a measurement system for monitoring our net interest rate sensitivity position. We manage our sensitivity position within our established guidelines.
Fluctuations in interest rates will ultimately impact both the level of income and expense recorded on most of our assets and liabilities, and the market value of all interest-earning assets and interest-bearing liabilities, other than those which have a short term to maturity. Interest rate risk is the potential of economic losses due to future interest rate changes. These economic losses can be reflected as a loss of future net interest income and/or a loss of current fair market values. The objective is to measure the effect on net interest income and to adjust the balance sheet to minimize the inherent risk while at the same time maximizing income.
We manage our exposure to interest rates by structuring our balance sheet in the ordinary course of business. We do not enter into instruments such as leveraged derivatives, interest rate swaps, financial options, financial futures contracts or forward delivery contracts for the purpose of reducing interest rate risk. Based upon the nature of our operations, we are not subject to foreign exchange or commodity price risk. We do not own any trading assets.
Our exposure to interest rate risk is managed by the asset-liability committee of b1BANK, in accordance with policies approved by our board of directors. The committee formulates strategies based on appropriate levels of interest rate risk. In determining the appropriate level of interest rate risk, the committee considers the impact on earnings and capital of the current outlook on interest rates, potential changes in interest rates, regional economies, liquidity, business strategies and other factors. The committee meets regularly to review, among other things, the sensitivity of assets and liabilities to interest rate changes, the book and market values of assets and liabilities, unrealized gains and losses, purchase and sale activities, commitments to originate loans and the maturities of investments and borrowings. Additionally, the committee reviews liquidity, cash flow flexibility, maturities of deposits and consumer and commercial deposit activity. Management employs methodologies to manage interest rate risk which include an analysis of relationships between interest-earning assets and interest-bearing liabilities, and an interest rate shock simulation model.
We use interest rate risk simulation models and shock analysis to test the interest rate sensitivity of net interest income and fair value of equity, and the impact of changes in interest rates on other financial metrics. Contractual maturities and re-pricing opportunities of loans are incorporated in the model as are prepayment assumptions, maturity data and call options within the investment portfolio. Average lives of non-maturity deposit accounts are based on standard regulatory decay assumptions and are also incorporated into the model. Model assumptions are revised and updated as more accurate information becomes available. The assumptions used are inherently uncertain and, as a result, the model cannot precisely measure future net interest income or precisely predict the impact of fluctuations in market interest rates on net interest income. Actual results will differ from the model’s simulated results due to timing, magnitude and frequency of interest rate changes, as well as changes in market conditions and the application and timing of various management strategies.
On at least a quarterly basis, we run two simulation models including a static balance sheet and dynamic growth balance sheet. These models test the impact on net interest income and fair value of equity from changes in market interest rates under various scenarios. Under the static and dynamic growth models, rates are shocked instantaneously based upon parallel and non-parallel yield curve shifts. Parallel shock scenarios assume instantaneous parallel movements in the yield curve compared to a flat yield curve scenario. Non-parallel simulation involves analysis of interest income and expense under various changes in the shape of the yield curve. Internal policy regarding internal rate risk simulations currently specifies that for instantaneous parallel shifts of the yield curve, estimated net income at risk for the subsequent one-year period should not decline by more than 5% for a 100 basis point shift, 10% for a 200 basis point shift, and 12.5% for a 300 basis point shift. Internal policy regarding interest rate simulations currently specifies that for instantaneous parallel shifts of the yield curve, estimated fair value of equity at risk for the subsequent one-year period should not decline by more than 10% for a 100 basis point shift, 15% for a 200 basis point shift, and 25% for a 300 basis point shift.
The following table summarizes the simulated change in net interest income and fair value of equity over a 12-month horizon as of the dates indicated:
|
As of December 31, 2019 |
As of December 31, 2018 |
||||||||||||||||
|
Change in Interest Rates (Basis Points) |
Percent Change |
Percent Change |
Percent Change |
Percent Change |
|||||||||||||
|
+300 |
8.40 | % | 2.32 | % | 5.20 | % | (2.07 | %) | |||||||||
|
+200 |
5.50 | % | 1.58 | % | 3.10 | % | (1.24 | %) | |||||||||
|
+100 |
2.80 | % | 0.79 | % | 1.10 | % | (0.64 | %) | |||||||||
|
Base |
0.00 | % | 0.00 | % | 0.00 | % | 0.00 | % | |||||||||
| -100 | (3.20 | %) | (1.93 | %) | (4.40 | %) | (0.29 | %) | |||||||||
The results are primarily due to the balance sheet mix and behavior of demand, money market and savings deposits during such rate fluctuations. We have found that, historically, interest rates on these deposits change more slowly than changes in the discount and federal funds rates. This assumption is incorporated into the simulation model and is generally not fully reflected in a gap analysis. The assumptions incorporated into the model are inherently uncertain and, as a result, the model cannot precisely measure future net interest income or precisely predict the impact of fluctuations in market interest rates on net interest income. Actual results will differ from the model’s simulated results due to timing, magnitude and frequency of interest rate changes, as well as changes in market conditions and the application and timing of various strategies.
Impact of Inflation
Our consolidated financial statements and related notes included elsewhere in this statement have been prepared in accordance with GAAP. These require the measurement of financial position and operating results in terms of historical dollars, without considering changes in the relative value of money over time due to inflation or recession.
Unlike many industrial companies, substantially all of our assets and liabilities are monetary in nature. As a result, interest rates have a more significant impact on our performance than the effects of general levels of inflation. Interest rates may not necessarily move in the same direction or in the same magnitude as the prices of goods and services. However, other operating expenses do reflect general levels of inflation.
Non-GAAP Financial Measures
Our accounting and reporting policies conform to GAAP, and the prevailing practices in the banking industry. However, we also evaluate our performance based on certain additional non-GAAP financial measures. We classify a financial measure as being a non-GAAP financial measure if that financial measure excludes or includes amounts, or is subject to adjustments that have the effect of excluding or including amounts, that are included or excluded, as the case may be, in the most directly comparable measure calculated and presented in accordance with GAAP as in effect from time to time in the United States in our statements of income, balance sheets or statements of cash flows. Non-GAAP financial measures do not include operating and other statistical measures or ratios or statistical measures calculated using exclusively either financial measures calculated in accordance with GAAP, operating measures or other measures that are not non-GAAP financial measures or both.
This discussion and analysis section includes certain non-GAAP financial measures (e.g., referenced as “core” or “tangible”) intended to supplement, not substitute for, comparable GAAP measures. These measures typically adjust income available to common shareholders for certain significant activities or transactions that in management’s opinion can distort period-to-period comparisons of Business First’s performance. Transactions that are typically excluded from non-GAAP measures include realized and unrealized gains/losses on former bank premises and equipment, impaired loan sales, and acquisition-related expenses (including, but not limited to, legal costs, system conversion costs, severance and retention payments, etc.). The measures also typically adjust goodwill and intangible assets from book value and shareholders’ equity.
Management believes presentations of these non-GAAP financial measures provide useful supplemental information that is essential to a proper understanding of the operating results of the Company’s core business. These non-GAAP disclosures are not necessarily comparable to non-GAAP measures that may be presented by other companies. You should understand how such other banking organizations calculate their financial metrics or with names similar to the non-GAAP financial measures we have discussed in this statement when comparing such non-GAAP financial measures.
Core Net Income. Notable noncore events impacting earnings during the year ended December 31, 2019 include $750,000 in noninterest expenses related to acquisition-related activities (including, but not limited to, severance and retention, system conversion, legal costs, etc.). We incurred $720,000 in net losses associated with the disposal of former bank premises and equipment which includes the demolition of a former banking center and the rebranding of b1BANK during the year ended December 31, 2019. We also had $581,000 in gains on the sale of a banking center during the year ended December 31, 2019. Notable noncore events impacting earnings during the year ended December 31, 2018 include $3.6 million in noninterest expenses related to acquisition-related activities. We realized $355,000 in net gains associated with the sale or closure of banking centers during the year ended December 31, 2018. We also incurred $118,000 in noninterest expenses associated with share awards granted to all nonexecutive employees for our Nasdaq listing commencement on April 9, 2018 during the year ended December 31, 2018. Core net income, which excludes noncore income and expenses, for the year ended December 31, 2019 was $24.6 million, or $1.80 per diluted share, compared to core net income of $16.8 million, or $1.45 per diluted share, for the year ended December 31, 2018. As adjusted, core return on average assets and core return on average equity, were 1.15% and 9.01% for the year December 31, 2019, compared to 1.00% and 8.38% for the year ended December 31, 2018.
|
For the Year Ended 2019 |
For the Year Ended 2018 |
For the Year Ended 2017 |
||||||||||
|
(Dollars in thousands, except per share data) |
||||||||||||
|
Core Net Income |
||||||||||||
|
Net income |
$ | 23,772 | $ | 14,091 | $ | 4,848 | ||||||
|
Adjustments: (1) |
||||||||||||
|
Noninterest income |
||||||||||||
|
Sale of impaired credit |
(91 | ) | (87 | ) | (2,750 | ) | ||||||
|
Tax impact |
19 | 18 | 935 | |||||||||
|
(Gains) Losses on former bank premises and equipment |
720 | (355 | ) | — | ||||||||
|
Tax impact |
(151 | ) | 75 | — | ||||||||
|
(Gains) Losses on sales of securities |
(106 | ) | (7 | ) | (31 | ) | ||||||
|
Tax impact |
22 | 1 | 11 | |||||||||
|
Gains on sale of banking center |
(581 | ) | — | — | ||||||||
|
Tax impact |
338 | — | — | |||||||||
|
Noninterest expense |
||||||||||||
|
Early lease termination penalty |
87 | — | — | |||||||||
|
Tax impact |
(18 | ) | — | — | ||||||||
|
Employee share awards – Nasdaq listing |
— | 118 | — | |||||||||
|
Tax impact |
— | (25 | ) | — | ||||||||
|
Acquisition-related expenses (2) |
750 | 3,568 | 129 | |||||||||
|
Tax impact |
(147 | ) | (623 | ) | — | |||||||
|
Core net income |
$ | 24,614 | $ | 16,774 | $ | 3,142 | ||||||
|
Average common shares outstanding |
13,310,577 | 11,124,585 | 7,658,137 | |||||||||
|
Average diluted shares outstanding |
13,670,777 | 11,545,943 | 8,003,822 | |||||||||
|
Core earnings per share - basic |
$ | 1.85 | $ | 1.51 | $ | 0.41 | ||||||
|
Core earnings per share - diluted |
$ | 1.80 | $ | 1.45 | $ | 0.39 | ||||||
|
Total year-to-date average assets |
2,136,081 | 1,682,177 | 1,199,788 | |||||||||
|
Total year-to-date average equity |
273,205 | 200,193 | 131,746 | |||||||||
|
Core return on average assets |
1.15 | % | 1.00 | % | 0.26 | % | ||||||
|
Core return on average equity |
9.01 | % | 8.38 | % | 2.38 | % | ||||||
|
(1) |
Tax rates, exclusive of certain nondeductible acquisition-related expenses and goodwill, utilized were 21% for both 2019 and 2018. These rates approximated the marginal tax rates for the applicable periods. |
|
(2) |
Includes merger and conversion-related expenses and salary and employee benefits. |
Tangible Book Value Per Common Share. Tangible book value per common share is a non-GAAP measure generally used by financial analysts and investment bankers to evaluate financial institutions. We calculate (1) tangible common equity as shareholders’ equity less goodwill and core deposit intangible and other intangible assets, net of accumulated amortization, and (2) tangible book value per common share as tangible common equity divided by shares of common stock outstanding. The most directly comparable GAAP financial measure for tangible book value per common share is book value per common share.
The following table reconciles, as of the dates set forth below, total shareholders’ equity to tangible common equity and presents tangible book value per common share compared to book value per common share:
|
As of December 31, |
||||||||
|
2019 |
2018 |
|||||||
|
(Dollars in thousands, except per share data) |
||||||||
|
Tangible Common Equity |
||||||||
|
Total shareholders’ equity |
$ | 285,097 | $ | 260,058 | ||||
|
Adjustments: |
||||||||
|
Goodwill |
(48,495 | ) | (49,488 | ) | ||||
|
Core deposit and other intangibles |
(6,694 | ) | (7,885 | ) | ||||
|
Total tangible common equity |
$ | 229,908 | $ | 202,685 | ||||
|
Common shares outstanding(1) |
13,279,363 | 13,213,280 | ||||||
|
Book value per common share |
$ | 21.47 | $ | 19.68 | ||||
|
Tangible book value per common share |
$ | 17.31 | $ | 15.34 | ||||
|
(1) |
Excludes the dilutive effect, if any, of 725,300 and 867,705 shares of common stock issuable upon exercise of outstanding stock options and warrants as of December 31, 2019 and 2018, respectively. |
Tangible Common Equity to Tangible Assets. Tangible common equity to tangible assets is a non-GAAP measure generally used by financial analysts and investment bankers to evaluate financial institutions. We calculate tangible common equity, as described above, and tangible assets as total assets less goodwill, core deposit intangible and other intangible assets, net of accumulated amortization. The most directly comparable GAAP financial measure for tangible common equity to tangible assets is total common shareholders’ equity to total assets.
The following table reconciles, as of the dates set forth below, total shareholders’ equity to tangible common equity and total assets to tangible assets:
|
As of December 31, |
||||||||
|
2019 |
2018 |
|||||||
|
(Dollars in thousands, except per share data) |
||||||||
|
Tangible Common Equity |
||||||||
|
Total shareholders’ equity |
$ | 285,097 | $ | 260,058 | ||||
|
Adjustments: |
||||||||
|
Goodwill |
(48,495 | ) | (49,488 | ) | ||||
|
Core deposit and other intangibles |
(6,694 | ) | (7,885 | ) | ||||
|
Total tangible common equity |
$ | 229,908 | $ | 202,685 | ||||
|
Tangible Assets |
||||||||
|
Total assets |
$ | 2,273,835 | $ | 2,094,896 | ||||
|
Adjustments: |
||||||||
|
Goodwill |
(48,495 | ) | (49,488 | ) | ||||
|
Core deposit and other intangibles |
(6,694 | ) | (7,885 | ) | ||||
|
Total tangible assets |
$ | 2,218,646 | $ | 2,037,523 | ||||
|
Common Equity to Total Assets |
12.5 | % | 12.4 | % | ||||
|
Tangible Common Equity to Tangible Assets |
10.4 | % | 9.9 | % | ||||
Critical Accounting Policies
Our consolidated financial statements are prepared in accordance with accounting principles generally accepted in the United States and with general practices within the financial services industry. Application of these principles requires management to make estimates and assumptions that affect the amounts reported in the financial statements and accompanying notes. We base our estimates on historical experience and on various other assumptions that we believe to be reasonable under current circumstances. These assumptions form the basis for our judgments about the carrying values of assets and liabilities that are not readily available from independent, objective sources. We evaluate our estimates on an ongoing basis. Use of alternative assumptions may have resulted in significantly different estimates. Actual results may differ from these estimates.
We have identified the following accounting policies and estimates that, due to the difficult, subjective or complex judgments and assumptions inherent in those policies and estimates and the potential sensitivity of our financial statements to those judgments and assumptions, are critical to an understanding of our financial condition and results of operations. We believe that the judgments, estimates and assumptions used in the preparation of our financial statements are appropriate.
Investment Securities
Securities are classified as held to maturity and carried at amortized cost when management has the positive intent and ability to hold them until maturity. Securities to be held for indefinite periods of time are classified as available for sale and carried at fair value, with the unrealized holding gains and losses reported in other comprehensive income, net of tax. Management determines the appropriate classification of securities at the time of purchase.
Interest income includes amortization of purchase premiums and discounts. Realized gains and losses are derived from the amortized cost of the security sold. Credit related declines in the fair value of held to maturity and available for sale securities below their cost that are deemed to be other than temporary are reflected in earnings as realized losses, with the remaining unrealized loss recognized as a component of other comprehensive income. In estimating other-than-temporary impairment losses, management considers, among other things, (i) the length of time and the extent to which the fair value has been less than cost, (ii) the financial condition and near-term prospects of the issuer, and (iii) the intent and ability of us to retain our investment in the issuer for a period of time sufficient to allow for any anticipated recovery in fair value.
Loans and Allowance for Loan Losses
Loans acquired in business combinations are initially recorded at fair value which includes an estimate of credit losses expected to be realized over the remaining lives of the loans and, therefore, no corresponding allowance for loan losses is recorded for these loans at acquisition. Methods utilized to estimate any subsequently required allowance for loan losses for acquired loans not deemed credit impaired at acquisition are similar to originated loans; however, the estimate of losses is based on the unpaid principal balance and then compared to any remaining unaccreted purchase discount. To the extent the calculated loss is greater than the remaining unaccreted discount, an allowance is recorded for such amount. These loans are stated at the amount of unpaid principal, reduced by any purchase discount or allowance for loan loss, and increased by any purchase premium.
Certain acquired impaired loans, where there is evidence of credit deterioration since origination and it is probable we will be unable to collect all contractually required payments, are accounted for in accordance with FASB ASC 310-30 Loans and Debt Securities Acquired with Deteriorated Credit Quality. The expected cash flows for each loan meeting this criteria are estimated to determine the excess of the contractually required principal and interest at acquisition as an amount that should not be accreted (nonaccretable difference). The expected cash flows for the purchased impaired credits approximated fair value as of the merger date. A discount was recorded on these loans at acquisition to record them at their estimated fair values. As a result, the purchased impaired credits are excluded from the calculation of the allowance for loan losses as of the acquisition date. Under current accounting principles, if we determine that losses arose after the acquisition date, the additional losses will be reflected as a provision to the allowance for loan losses.
The allowance for loan losses is an estimated amount management believes is adequate to absorb inherent losses on existing loans that may be uncollectible based upon review and evaluation of the loan portfolio. Management’s periodic evaluation of the allowance is based on general economic conditions, the financial condition of borrowers, the value and liquidity of collateral, delinquency, prior loan loss experience, and the results of periodic reviews of the portfolio.
The allowance for loan losses is comprised of two components. The first component, the general reserve, is determined in accordance with current authoritative accounting guidance that considers historical loss rates and is adjusted for qualitative factors based upon general economic conditions and other qualitative risk factors both internal and external to us to estimate probable incurred losses. Such qualitative factors include current local economic conditions and trends including unemployment, changes in lending staff, policies and procedures, changes in credit concentrations, changes in the trends and severity of problem loans, and changes in trends in volume and terms of loans. These qualitative factors serve to compensate for additional areas of uncertainty inherent in the portfolio that are not reflected in our historical loss factors. For purposes of determining the general reserve, the loan portfolio, less cash secured loans, government guaranteed loans and impaired loans, is multiplied by our adjusted historical loss rate. The second component of the allowance for loan losses, the specific reserve, is determined in accordance with current authoritative accounting guidance based on probable losses on specific impaired loans.
Due to our growth over the past several years, a portion of the loans in our portfolio and our lending relationships are of relatively recent origin. The new loan portfolios have limited delinquency and credit loss history and have not yet exhibited an observable loss trend. The credit quality of loans in these loan portfolios are impacted by delinquency status and debt service coverage generated by the borrowers’ business, and fluctuations in the value of real estate collateral. Management considers delinquency status to be the most meaningful indicator of the credit quality of one-to-four single family residential, home equity loans and lines of credit and other consumer loans. In general, loans do not begin to show signs of credit deterioration or default until they have been outstanding for some period of time, a process we refer to as “seasoning”. As a result, a portfolio of older loans will usually behave more predictably than a portfolio of newer loans. Because the majority of our portfolio is relatively new, the current level of delinquencies and defaults may not be representative of the level that will prevail when the portfolio becomes more seasoned, which may be higher than current levels. If delinquencies and defaults increase, we may be required to increase our provision for loan losses, which would adversely affect our results of operations and financial condition.
Delinquency statistics are updated at least monthly. Internal risk ratings are considered the most meaningful indicator of credit quality for new commercial, construction, and commercial real estate loans. Internal risk ratings are a key factor in identifying loans that are individually evaluated for impairment and impact management’s estimates of loss factors used in determining the amount of the allowance for loan losses. Internal risk ratings are updated on a continuous basis.
Our policy requires measurement of the allowance for an impaired collateral dependent loan based on the fair value of the collateral. Other loan impairments are measured based on the present value of expected future cash flows or the loan’s observable market price.
From time to time, we modify our loan agreement with a borrower. A modified loan is considered a troubled debt restructuring when two conditions are met: (i) the borrower is experiencing financial difficulty and (ii) concessions are made by us that would not otherwise be considered for a borrower with similar credit risk characteristics. Modifications to loan terms may include a lower interest rate, a reduction of principal, or a longer term to maturity. We review each troubled debt restructured loan and determine on a case by case basis if the loan is subject to impairment and the need for a specific allowance for loan loss allocation. An allowance for loan loss allocation is based on either the present value of estimated future cash flows or the estimated fair value of the underlying collateral.
We have certain lending policies and procedures in place that are designed to maximize loan income with an acceptable level of risk. Management reviews and approves these policies and procedures on a regular basis and makes changes as appropriate. Management receives frequent reports related to loan originations, quality, concentrations, delinquencies, nonperforming and potential problem loans. Diversification in the loan portfolio is a means of managing risk associated with fluctuations in economic conditions, both by type of loan and geography.
Commercial loans are underwritten after evaluating and understanding the borrower’s ability to operate profitably and effectively. Underwriting standards are designed to determine whether the borrower possesses sound business ethics and practices and to evaluate current and projected cash flows to determine the ability of the borrower to repay their obligations as agreed. Commercial loans are primarily made based on the identified cash flows of the borrower and, secondarily, on the underlying collateral provided by the borrower. Most commercial loans are secured by the assets being financed or other business assets, such as accounts receivable or inventory, and include personal guarantees.
Real estate loans are also subject to underwriting standards and processes similar to commercial loans. These loans are underwritten primarily based on projected cash flows and, secondarily, as loans secured by real estate. The repayment of real estate loans is generally largely dependent on the successful operation of the property securing the loans or the business conducted on the property securing the loan. Real estate loans may be more adversely affected by conditions in the real estate markets or in the general economy. The properties securing our real estate portfolio are generally diverse in terms of type and geographic location, throughout the state of Louisiana and Texas. This diversity helps reduce the exposure to adverse economic events that affect any single market or industry.
We utilize methodical credit standards and analysis to supplement our policies and procedures in underwriting consumer loans. Our loan policy addresses types of consumer loans that may be originated and the collateral, if secured, which must be perfected. The relatively smaller individual dollar amounts of consumer loans that are spread over numerous individual borrowers also minimize risk.
Income Taxes
Income taxes are evaluated and assessed by the Company based on the relative risks and appropriate tax treatment of transactions after considering statutes, regulations, judicial precedent and other information. The Company maintains tax accruals consistent with its evaluation of these relative risks. Changes to the estimate of current, accrued, or deferred taxes may occur periodically due to modifications in tax rates, interpretations of tax laws, the status of examinations being conducted by taxing authorities, changes to statutory, judicial and regulatory guidance that impact the relative risks of tax positions, and other facts and circumstances. These changes, when they occur, can affect deferred taxes and accrued taxes as well as the current period’s income tax expense and can be material to the Company’s operating results for any reporting period.
Emerging Growth Company
The JOBS Act permits an “emerging growth company” to take advantage of an extended transition period to comply with new or revised accounting standards applicable to public companies. However, we have “opted out” of this provision. As a result, we will comply with new or revised accounting standards to the same extent that compliance is required for non-emerging growth companies. This decision to opt out of the extended transition period under the JOBS Act is irrevocable.
ITEM 7A. Quantitative and Qualitative Disclosures about Market Risk.
The disclosure contemplated by Item 7A is not required because we are a smaller reporting company.
ITEM 8. Financial Statements and Supplementary Data.
|
CONTENTS |
||
|
Annual Audited Financial Statements: |
||
| 80 - 81 | ||
|
|
||
|
82 |
||
|
|
||
|
83 |
||
|
|
||
|
84 |
||
|
|
||
|
85 |
||
|
|
||
|
86 - 87 |
||
|
|
||
|
88 - 125 |
||
REPORT OF INDEPENDENT REGISTERED PUBLIC ACCOUNTING FIRM
To the Board of Directors and
Shareholders of Business First Bancshares, Inc. and Subsidiaries
Baton Rouge, Louisiana
Opinions on the Financial Statements and Internal Control over Financial Reporting
We have audited the accompanying consolidated balance sheets of Business First Bancshares, Inc. and Subsidiaries (the Company) as of December 31, 2019 and 2018, and the related consolidated statements of income, comprehensive income, shareholders’ equity, and cash flows for each of the years in the three-year period ended December 31, 2019, and the related notes (collectively referred to as the financial statements). We have also audited the Company’s internal control over financial reporting as of December 31, 2019, based on criteria established in Internal Control-Integrated Framework (2013) issued by the Committee of Sponsoring Organizations of the Treadway Commission (COSO).
In our opinion, the consolidated financial statements referred to above present fairly, in all material respects, the financial position of the Company as of December 31, 2019 and 2018, and the results of its operations and its cash flows for each of the years in the three-year period ended December 31, 2019, in conformity with accounting principles generally accepted in the United States of America. Also in our opinion, the Company maintained, in all material respects, effective internal control over financial reporting as of December 31, 2019, based on criteria established in Internal Control-Integrated Framework (2013) issued by the Committee of Sponsoring Organizations of the Treadway Commission (COSO).
Basis for Opinion
The Company’s management is responsible for these financial statements, for maintaining effective internal control over financial reporting, and for its assessment of the effectiveness of internal control over financial reporting included in the accompanying Management’s Report on Internal Control over Financial Reporting. Our responsibility is to express an opinion on these financial statements and an opinion on the Company’s internal control over financial reporting based on our audits. We are a public accounting firm registered with the Public Company Accounting Oversight Board (United States) (PCAOB) and are required to be independent with respect to the Company in accordance with the U.S. federal securities laws and the applicable rules and regulations of the Securities and Exchange Commission and the PCAOB.
We conducted our audits in accordance with the standards of the Public Company Accounting Oversight Board (United States). Those standards require that we plan and perform the audit to obtain reasonable assurance about whether the consolidated financial statements are free of material misstatement, whether due to error or fraud, and whether effective internal control over financial reporting was maintained in all material respects.
Our audits of the financial statements included performing procedures to assess the risks of material misstatement of the financial statements, whether due to error or fraud, and performing procedures that respond to those risks. Such procedures included examining, on a test basis, evidence regarding the amounts and disclosures in the financial statements. Our audits also included evaluating the accounting principles used and significant estimates made by management, as well as evaluating the overall presentation of the financial statements. Our audit of internal control over financial reporting included obtaining an understanding of internal control over financial reporting, assessing the risk that a material weakness exists, and testing and evaluating the design and operating effectiveness of internal control based on the assessed risk. Our audits also included performing such other procedures as we considered necessary in the circumstances. We believe that our audits provide a reasonable basis for our opinions.
Definition and Limitations of Internal Control over Financial Reporting
A company’s internal control over financial reporting is a process designed to provide reasonable assurance regarding the reliability of financial reporting and the preparation of financial statements for external purposes in accordance with generally accepted accounting principles. A company’s internal control over financial reporting includes those policies and procedures that (1) pertain to the maintenance of records that, in reasonable detail, accurately and fairly reflect the transactions and dispositions of the assets of a company; (2) provide reasonable assurance that transactions are recorded as necessary to permit preparation of financial statements in accordance with generally accepted accounting principles, and that receipts and expenditures of the company are being made only in accordance with authorizations of management and directors of the company; and (3) provide reasonable assurance regarding prevention or timely detection of unauthorized acquisition, use, or disposition of the company’s assets that could have a material effect on the financial statements.
Because of its inherent limitations, internal control over financial reporting may not prevent or detect misstatements. Also, projections of any evaluation of effectiveness to future periods are subject to the risk that controls may become inadequate because of changes in conditions, or that the degree of compliance with the policies or procedures may deteriorate.
Respectfully submitted,
/s/ Hannis T. Bourgeois, LLP
We have served as the Company’s auditor since 2006.
Baton Rouge, Louisiana
March 4, 2020
BUSINESS FIRST BANCSHARES, INC. AND SUBSIDIARIES
CONSOLIDATED BALANCE SHEETS
(Dollars in thousands)
|
December 31, |
||||||||
|
2019 |
2018 |
|||||||
| ASSETS | ||||||||
|
Cash and Due from Banks |
$ | 89,371 | $ | 96,072 | ||||
|
Federal Funds Sold |
61,372 | 41,836 | ||||||
|
Securities Available for Sale, at Fair Values |
278,193 | 309,516 | ||||||
|
Mortgage Loans Held for Sale |
251 | 58 | ||||||
|
Loans and Lease Receivable, Net of Allowance for Loan Losses of $12,124 in 2019 and $11,220 in 2018 |
1,698,141 | 1,517,249 | ||||||
|
Premises and Equipment, Net |
29,280 | 15,114 | ||||||
|
Accrued Interest Receivable |
8,025 | 8,223 | ||||||
|
Other Equity Securities |
12,565 | 9,282 | ||||||
|
Other Real Estate Owned |
4,036 | 1,909 | ||||||
|
Cash Value of Life Insurance |
32,568 | 31,882 | ||||||
|
Deferred Taxes |
2,145 | 3,848 | ||||||
|
Goodwill |
48,495 | 49,488 | ||||||
|
Core Deposit Intangible |
6,694 | 7,885 | ||||||
|
Other Assets |
2,699 | 2,534 | ||||||
|
Total Assets |
$ | 2,273,835 | $ | 2,094,896 | ||||
|
LIABILITIES |
||||||||
|
Deposits: |
||||||||
|
Noninterest Bearing |
$ | 398,847 | $ | 382,354 | ||||
|
Interest Bearing |
1,383,163 | 1,351,580 | ||||||
|
Total Deposits |
1,782,010 | 1,733,934 | ||||||
|
Securities Sold Under Agreements to Repurchase |
67,989 | 12,229 | ||||||
|
Subordinated Debt |
25,000 | 25,000 | ||||||
|
Federal Home Loan Bank Borrowings |
93,000 | 55,000 | ||||||
|
Accrued Interest Payable |
1,533 | 1,374 | ||||||
|
Other Liabilities |
19,206 | 7,301 | ||||||
|
Total Liabilities |
1,988,738 | 1,834,838 | ||||||
|
Commitments and Contingencies (See Notes 19, 21 and 22) |
||||||||
|
SHAREHOLDERS' EQUITY |
||||||||
|
Preferred Stock, No Par Value; 5,000,000 Shares Authorized |
- | - | ||||||
|
Common Stock, $1 Par Value; 50,000,000 Shares Authorized; 13,279,363 and 13,213,280 Shares Issued and Outstanding at December 31, 2019 and 2018, respectively |
13,279 | 13,213 | ||||||
|
Additional Paid-in Capital |
212,505 | 212,332 | ||||||
|
Retained Earnings |
56,700 | 37,982 | ||||||
|
Accumulated Other Comprehensive Income (Loss) |
2,613 | (3,469 | ) | |||||
|
Total Shareholders' Equity |
285,097 | 260,058 | ||||||
|
Total Liabilities and Shareholders' Equity |
$ | 2,273,835 | $ | 2,094,896 | ||||
The accompanying notes are an integral part of these financial statements.
BUSINESS FIRST BANCSHARES, INC. AND SUBSIDIARIES
CONSOLIDATED STATEMENTS OF INCOME
(Dollars in thousands, except per share data)
|
Years Ended December 31, |
||||||||||||
|
2019 |
2018 |
2017 |
||||||||||
|
Interest Income: |
||||||||||||
|
Interest and Fees on Loans |
$ | 95,433 | $ | 69,780 | $ | 47,516 | ||||||
|
Interest and Dividends on Securities |
7,225 | 5,834 | 3,829 | |||||||||
|
Interest on Federal Funds Sold and Due From Banks |
809 | 581 | 256 | |||||||||
|
Total Interest Income |
103,467 | 76,195 | 51,601 | |||||||||
|
Interest Expense: |
||||||||||||
|
Interest on Deposits |
19,753 | 11,833 | 6,328 | |||||||||
|
Interest on Borrowings |
3,516 | 2,133 | 901 | |||||||||
|
Total Interest Expense |
23,269 | 13,966 | 7,229 | |||||||||
|
Net Interest Income |
80,198 | 62,229 | 44,372 | |||||||||
|
Provision for Loan Losses |
2,606 | 2,390 | 4,237 | |||||||||
|
Net Interest Income after Provision for Loan Losses |
77,592 | 59,839 | 40,135 | |||||||||
|
Other Income: |
||||||||||||
|
Service Charges on Deposit Accounts |
4,035 | 2,810 | 2,109 | |||||||||
|
Gain on Sales of Securities |
106 | 7 | 31 | |||||||||
|
Other Income |
6,567 | 4,962 | 3,478 | |||||||||
|
Total Other Income |
10,708 | 7,779 | 5,618 | |||||||||
|
Other Expenses: |
||||||||||||
|
Salaries and Employee Benefits |
35,126 | 27,862 | 21,482 | |||||||||
|
Occupancy and Equipment Expense |
7,628 | 5,865 | 4,820 | |||||||||
|
Other Expenses |
15,694 | 16,521 | 10,500 | |||||||||
|
Total Other Expenses |
58,448 | 50,248 | 36,802 | |||||||||
|
Income Before Income Taxes |
29,852 | 17,370 | 8,951 | |||||||||
|
Provision for Income Taxes |
6,080 | 3,279 | 4,103 | |||||||||
|
Net Income |
$ | 23,772 | $ | 14,091 | $ | 4,848 | ||||||
|
Earnings Per Share: |
||||||||||||
|
Basic |
$ | 1.79 | $ | 1.27 | $ | 0.63 | ||||||
|
Diluted |
$ | 1.74 | $ | 1.22 | $ | 0.61 | ||||||
The accompanying notes are an integral part of these financial statements.
BUSINESS FIRST BANCSHARES, INC. AND SUBSIDIARIES
CONSOLIDATED STATEMENTS OF COMPREHENSIVE INCOME
(Dollars in thousands)
|
Years Ended December 31, |
||||||||||||
|
2019 |
2018 |
2017 |
||||||||||
|
Consolidated Net Income |
$ | 23,772 | $ | 14,091 | $ | 4,848 | ||||||
|
Other Comprehensive Income (Loss): |
||||||||||||
|
Unrealized Gain (Loss) on Investment Securities |
7,592 | (2,317 | ) | 1,419 | ||||||||
|
Reclassification Adjustment for Gains (Loss) included in Net Income |
106 | 7 | 31 | |||||||||
|
Income Tax Effect |
(1,616 | ) | 485 | (493 | ) | |||||||
|
Other Comprehensive Income (Loss) |
6,082 | (1,825 | ) | 957 | ||||||||
|
Consolidated Comprehensive Income |
$ | 29,854 | $ | 12,266 | $ | 5,805 | ||||||
The accompanying notes are an integral part of these financial statements.
BUSINESS FIRST BANCSHARES, INC. AND SUBSIDIARIES
CONSOLIDATED STATEMENTS OF CHANGES IN SHAREHOLDERS’ EQUITY
(Dollars in thousands, except per share data)
|
Accumulated |
||||||||||||||||||||
|
Additional |
Other |
Total |
||||||||||||||||||
|
Common |
Paid-In |
Retained |
Comprehensive |
Shareholders' |
||||||||||||||||
|
Stock |
Capital |
Earnings |
Income (Loss) |
Equity |
||||||||||||||||
|
Balances at December 31, 2016 |
$ | 6,917 | $ | 85,133 | $ | 23,839 | $ | (2,330 | ) | $ | 113,559 | |||||||||
|
Comprehensive Income: |
||||||||||||||||||||
|
Net Income |
- | - | 4,848 | - | 4,848 | |||||||||||||||
|
Other Comprehensive Income |
- | - | - | 957 | 957 | |||||||||||||||
|
Reclassify Stranded Tax Effects |
- | - | 271 | (271 | ) | - | ||||||||||||||
|
Cash Dividends Declared, $0.23 Per Share |
- | - | (1,792 | ) | - | (1,792 | ) | |||||||||||||
|
Stock Issuance |
3,299 | 59,156 | - | - | 62,455 | |||||||||||||||
|
Stock Based Compensation Cost |
18 | (77 | ) | - | - | (59 | ) | |||||||||||||
|
Stock Repurchase |
(2 | ) | (40 | ) | 9 | - | (33 | ) | ||||||||||||
|
Balances at December 31, 2017 |
10,232 | 144,172 | 27,175 | (1,644 | ) | 179,935 | ||||||||||||||
|
Comprehensive Income: |
||||||||||||||||||||
|
Net Income |
- | - | 14,091 | - | 14,091 | |||||||||||||||
|
Other Comprehensive Loss |
- | - | - | (1,825 | ) | (1,825 | ) | |||||||||||||
|
Cash Dividends Declared, $0.30 Per Share |
(3,281 | ) | - | (3,281 | ) | |||||||||||||||
|
Stock Issuance |
2,936 | 67,192 | - | - | 70,128 | |||||||||||||||
|
Stock Based Compensation Cost |
49 | 1,050 | - | - | 1,099 | |||||||||||||||
|
Surrendered Shares of Stock Based Compensation |
(4 | ) | (82 | ) | (3 | ) | - | (89 | ) | |||||||||||
|
Balances at December 31, 2018 |
13,213 | 212,332 | 37,982 | (3,469 | ) | 260,058 | ||||||||||||||
|
Comprehensive Income: |
||||||||||||||||||||
|
Net Income |
- | - | 23,772 | - | 23,772 | |||||||||||||||
|
Other Comprehensive Income |
- | - | - | 6,082 | 6,082 | |||||||||||||||
|
Cash Dividends Declared, $0.38 Per Share |
- | - | (5,054 | ) | - | (5,054 | ) | |||||||||||||
|
Stock Issuance |
143 | 1,556 | - | - | 1,699 | |||||||||||||||
|
Stock Based Compensation Cost |
44 | 1,257 | - | - | 1,301 | |||||||||||||||
|
Surrendered Shares of Stock Based Compensation |
(10 | ) | (198 | ) | - | - | (208 | ) | ||||||||||||
|
Stock Repurchase |
(111 | ) | (2,442 | ) | - | - | (2,553 | ) | ||||||||||||
|
Balances at December 31, 2019 |
$ | 13,279 | $ | 212,505 | $ | 56,700 | $ | 2,613 | $ | 285,097 | ||||||||||
The accompanying notes are an integral part of these financial statements.
BUSINESS FIRST BANCSHARES, INC. AND SUBSIDIARIES
CONSOLIDATED STATEMENTS OF CASH FLOWS
(Dollars in thousands)
|
Years Ended December 31, |
||||||||||||
|
2019 |
2018 |
2017 |
||||||||||
|
Cash Flows From Operating Activities: |
||||||||||||
|
Consolidated Net Income |
$ | 23,772 | $ | 14,091 | $ | 4,848 | ||||||
|
Adjustments to Reconcile Net Income to Net Cash Provided by (Used in) Operating Activities: |
||||||||||||
|
Provision for Loan Losses |
2,606 | 2,390 | 4,237 | |||||||||
|
Depreciation and Amortization |
1,588 | 1,172 | 1,181 | |||||||||
|
Net Accretion of Purchase Accounting Valuations |
(2,646 | ) | (719 | ) | (4,529 | ) | ||||||
|
Noncash Compensation (Income) Expense |
1,093 | 1,010 | (59 | ) | ||||||||
|
Net Amortization of Securities |
1,688 | 2,038 | 1,750 | |||||||||
|
Gain on Sales of Securities |
(106 | ) | (7 | ) | (31 | ) | ||||||
|
Noncash (Income) Loss on Other Equity Securities |
(1,684 | ) | (334 | ) | (243 | ) | ||||||
|
(Gain) Loss on Sale of Other Real Estate Owned, Net of Writedowns |
546 | (14 | ) | 276 | ||||||||
|
Increase in Cash Value of Life Insurance |
(686 | ) | (681 | ) | (633 | ) | ||||||
|
Provision (Credit) for Deferred Income Taxes |
336 | (402 | ) | 3,126 | ||||||||
|
Gain on Sale of Branch |
(581 | ) | - | - | ||||||||
|
Changes in Assets and Liabilities: |
||||||||||||
|
(Increase) Decrease in Accrued Interest Receivable |
198 | (970 | ) | (726 | ) | |||||||
|
(Increase) Decrease in Other Assets |
(318 | ) | 1,275 | (675 | ) | |||||||
|
Increase (Decrease) in Accrued Interest Payable |
159 | 184 | (30 | ) | ||||||||
|
Increase (Decrease) in Other Liabilities |
(1,547 | ) | 243 | (524 | ) | |||||||
|
Net Cash Provided by Operating Activities |
24,418 | 19,276 | 7,968 | |||||||||
|
Cash Flows From Investing Activities: |
||||||||||||
|
Purchases of Securities Available for Sale |
(27,223 | ) | (16,106 | ) | (8,581 | ) | ||||||
|
Proceeds from Maturities / Sales of Securities Available for Sale |
25,984 | 11,417 | 7,881 | |||||||||
|
Proceeds from Paydowns of Securities Available for Sale |
38,678 | 33,670 | 19,625 | |||||||||
|
Net Cash Paid in Merger |
- | (9,148 | ) | - | ||||||||
|
Net Cash Paid in Sale of Branch |
(17,448 | ) | - | - | ||||||||
|
Purchases of Other Equity Securities |
(3,031 | ) | (1,175 | ) | (2,453 | ) | ||||||
|
Redemption of Other Equity Securities |
1,432 | 3,176 | 189 | |||||||||
|
Net Increase in Loans |
(189,361 | ) | (168,371 | ) | (164,419 | ) | ||||||
|
Net Purchases of Premises and Equipment |
(3,959 | ) | (919 | ) | (505 | ) | ||||||
|
Loss on Disposal of Premises and Equipment |
774 | - | - | |||||||||
|
Proceeds from Sales of Other Real Estate |
1,400 | 654 | 1,084 | |||||||||
|
Net Increase in Federal Funds Sold |
(19,536 | ) | (23,516 | ) | (6,264 | ) | ||||||
|
Net Cash Used in Investing Activities |
(192,290 | ) | (170,318 | ) | (153,443 | ) | ||||||
(CONTINUED)
|
Years Ended December 31, |
||||||||||||
|
2019 |
2018 |
2017 |
||||||||||
|
Cash Flows From Financing Activities: |
||||||||||||
|
Net Increase in Deposits |
73,319 | 124,471 | 122,738 | |||||||||
|
Net Increase (Decrease) in Securities Sold Under Agreements to Repurchase |
55,760 | (5,757 | ) | (781 | ) | |||||||
|
Net Advances (Repayments) on Federal Home Loan Bank Borrowings |
38,000 | (25,000 | ) | 28,606 | ||||||||
|
Net Decrease in Short Term Borrowings |
- | (862 | ) | - | ||||||||
|
Net Proceeds (Repayments) from Long Term Borrowings |
- | (2,700 | ) | (300 | ) | |||||||
|
Proceeds from Issuance of Subordinated Debt |
- | 25,000 | - | |||||||||
|
Proceeds from Issuance of Common Stock |
823 | 27,652 | 62,455 | |||||||||
|
Repurchase of Common Stock |
(2,553 | ) | - | (33 | ) | |||||||
|
Proceeds from Exercise of Stock Warrants |
876 | - | - | |||||||||
|
Payment of Dividends on Common Stock |
(5,054 | ) | (3,281 | ) | (1,792 | ) | ||||||
|
Net Cash Provided by Financing Activities |
161,171 | 139,523 | 210,893 | |||||||||
|
Net Increase (Decrease) in Cash and Cash Equivalents |
(6,701 | ) | (11,519 | ) | 65,418 | |||||||
|
Cash and Cash Equivalents at Beginning of Period |
96,072 | 107,591 | 42,173 | |||||||||
|
Cash and Cash Equivalents at End of Period |
$ | 89,371 | $ | 96,072 | $ | 107,591 | ||||||
|
Supplemental Disclosures for Cash Flow Information: |
||||||||||||
|
Cash Payments for: |
||||||||||||
|
Interest on Deposits |
$ | 19,616 | $ | 11,384 | $ | 6,351 | ||||||
|
Interest on Borrowings |
$ | 3,494 | $ | 2,098 | $ | 908 | ||||||
|
Income Tax Payments |
$ | 5,600 | $ | 3,342 | $ | 1,800 | ||||||
|
Supplemental Schedule for Noncash Investing and Financing Activities: |
||||||||||||
|
Change in the Unrealized Gain (Loss) on Securities Available for Sale |
$ | 7,698 | $ | (2,310 | ) | $ | 1,450 | |||||
|
Change in Deferred Tax Effect on the Unrealized (Gain) Loss on Securities Available for Sale |
$ | (1,616 | ) | $ | 485 | $ | (493 | ) | ||||
|
Transfer of Loans to Other Real Estate |
$ | 4,102 | $ | 395 | $ | 566 | ||||||
|
Transfer of Other Real Estate to Premises and Equipment |
$ | - | $ | 1,373 | $ | 175 | ||||||
The accompanying notes are an integral part of these financial statements.
BUSINESS FIRST BANCSHARES, INC. AND SUBSIDIARIES
NOTES TO CONSOLIDATED FINANCIAL STATEMENTS
Note 1 – Nature of Operations – Summary of Significant Accounting Policies –
The accounting principles followed by Business First Bancshares, Inc. (the Company) and its wholly-owned subsidiary, b1BANK (the Bank), and the Bank’s wholly-owned subsidiary, Business First Insurance, LLC, are those which are generally practiced within the banking industry. The methods of applying those principles conform with generally accepted accounting principles and have been applied on a consistent basis. The principles which significantly affect the determination of financial position, results of operations, changes in shareholders’ equity and cash flows are summarized below.
Principles of Consolidation
The consolidated financial statements include the accounts of Business First Bancshares, Inc. and its wholly-owned subsidiary, b1BANK (the Bank), and the Bank’s wholly-owned subsidiary, Business First Insurance, LLC (collectively, the Company). All significant intercompany balances and transactions have been eliminated.
Nature of Operations
The Bank operates out of full-service banking centers in markets across Louisiana and in Dallas, Texas. As a state bank, it is subject to regulation by the Office of Financial Institutions, State of Louisiana, and the Federal Deposit Insurance Corporation, and undergoes periodic examinations by these agencies. The Company is also regulated by the Federal Reserve and is subject to periodic examinations.
On January 1, 2018, the Company completed the acquisition of Minden Bancorp, Inc. (MBI), and its wholly-owned subsidiary, MBL Bank, located in Minden, Louisiana, further increasing its presence in the Northwest Louisiana region. The Company paid aggregate cash consideration equal to $56.2 million, or approximately $23.20 in exchange for each share of MBI common stock outstanding immediately prior to the effective time of the acquisition. At December 31, 2017, MBI had fair values of approximately $317.4 million in total assets, $192.7 million in net loans, $264.0 million in total deposits, and $30.6 million in total shareholders’ equity, and was the leading financial institution in Webster Parish, part of the Shreveport-Bossier City MSA, through its two banking center locations.
After the close of business on November 30, 2018, the Company completed the acquisition of Richland State Bancorp, Inc. (RSBI), and its wholly-owned subsidiary, Richland State Bank, located in Rayville, Louisiana. The Company issued 1,679,559 shares of its common stock to the RSBI shareholders for a purchase price of $42.4 million. At November 30, 2018, RSBI had provisional fair values of approximately $316.4 million in total assets, $190.8 million in net loans, $290.0 million in total deposits, and $25.4 million in total shareholders’ equity.
Estimates
Preparation of financial statements in conformity with U.S. GAAP requires management to make estimates and assumptions that affect the amounts reported in the consolidated financial statements and accompanying disclosures. These estimates are based on management’s best knowledge of current events and actions the Company may undertake in the future. Estimates are used in accounting for, among other items, the allowance for loan losses, useful lives for depreciation and amortization, goodwill, fair value of financial instruments, taxes, and contingencies. Estimates that are particularly susceptible to significant change for the Company include the determination of the allowance for loan losses and the assessment of deferred tax assets and liabilities, and therefore are critical accounting policies. Management does not anticipate any material changes to estimates in the near term. Factors that may cause sensitivity to the aforementioned estimates include but are not limited to: external market factors such as market interest rates and employment rates, changes to operating policies and procedures,
economic conditions in our markets, and changes in applicable banking regulations. Actual results may ultimately differ from estimates.
The Bank’s loans are generally secured by specific items of collateral including real property, business assets, and consumer assets. Although the Bank has a diversified loan portfolio, a substantial portion of its debtors’ ability to honor their contracts is dependent on local economic conditions in the Bank’s market area.
While management uses available information to recognize losses on loans, further reductions in the carrying amounts of loans may be necessary based on changes in local economic conditions. In addition, regulatory agencies, as an integral part of their examination process, periodically review the estimated losses on loans. Such agencies may require the Bank to recognize additional losses based on their judgments about information available to them at the time of their examination.
BUSINESS FIRST BANCSHARES, INC. AND SUBSIDIARIES
NOTES TO CONSOLIDATED FINANCIAL STATEMENTS
Because of these factors, it is reasonably possible that the estimated losses on loans may change materially in the near term. However, the amount of the change that is reasonably possible cannot be estimated.
Acquisition Accounting
Acquisitions are accounted for under the purchase method of accounting. Purchased assets and assumed liabilities are recorded at their respective acquisition date fair values, and identifiable intangible assets are recorded at fair value. If the consideration given exceeds the fair value of the net assets received, goodwill is recognized. Fair values are subject to refinement for up to one year after the closing date of an acquisition as information relative to closing date fair values becomes available.
Securities
Management determines the appropriate classification of debt securities (held to maturity, available for sale or trading) at the time of purchase and re-evaluates this classification quarterly. Securities classified as available for sale are those debt securities the Bank intends to hold for an indefinite period of time but not necessarily to maturity. Any decision to sell a security classified as available for sale would be based on various factors, including significant movements in interest rates, changes in the maturity mix of the Bank’s assets and liabilities, liquidity needs, regulatory capital considerations, and other similar factors. Securities available for sale are recorded at fair value. Unrealized gains or losses are reported as a component of comprehensive income. Realized gains or losses, determined on the basis of the cost of specific securities sold, are included in earnings.
Securities classified as held to maturity are those debt securities the Bank has both the intent and ability to hold to maturity regardless of changes in market conditions, liquidity needs or changes in general economic conditions. These securities are recorded at cost adjusted for amortization of premium and accretion of discount, computed by various methods approximating the interest method over their contractual lives. The Bank has no securities classified as held to maturity at December 31, 2019 and 2018.
Securities classified as trading are those securities held for resale in anticipation of short-term market movements. These securities are recorded at market value with any market adjustments included in earnings. The Bank has no securities classified as trading at December 31, 2019 and 2018.
The Bank has invested in Federal Home Loan Bank (FHLB) stock, and other similar stock, which is reflected at cost in these financial statements. As a member of the FHLB System, the Bank is required to purchase and maintain stock in an amount determined by the FHLB. The FHLB stock is redeemable at par value at the discretion of the FHLB.
Loans
Loans are stated at principal amounts outstanding, adjusted for net deferred fees or costs, less the allowance for loan losses. Interest on commercial and consumer loans is accrued daily based on the principal outstanding.
Generally, the Bank discontinues the accrual of interest income when a loan becomes 90 days past due as to principal or interest. When a loan is placed on nonaccrual status, previously recognized but uncollected interest is generally reversed to income. Subsequent cash receipts on nonaccrual loans are generally accounted for on the cost recovery method until the loans qualify for return to accrual status. Interest income may be recognized on a cash basis as long as the remaining book balance of the loan is deemed to be collectible. Loans are returned to accrual status when all the principal and interest amounts contractually due are brought current and future payments are reasonably assured.
The Bank classifies loans as impaired when it is probable the Bank will be unable to collect the scheduled payments of principal and interest when due according to the contractual terms of the loan agreement. The measurement of impaired loans is based on the present value of the expected future cash flows discounted at the loan’s effective interest rate or the loan’s observable market price, or based on the fair value of the collateral if the loan is collateral dependent.
Acquired Loans
Purchased loans acquired in a business combination are recorded at their estimated fair value as of the acquisition date and there is no carryover of the seller’s allowance for loan losses.
BUSINESS FIRST BANCSHARES, INC. AND SUBSIDIARIES
NOTES TO CONSOLIDATED FINANCIAL STATEMENTS
The Company accounts for acquired impaired loans in accordance with ASC 310-30, Loans and Debt Securities Acquired with Deteriorated Credit Quality (“ASC 310-30”). An acquired loan is considered impaired when there is evidence of credit deterioration since origination and it is probable at the date of acquisition that the Company will be unable to collect all contractually required payments. Purchased credit impaired loans are accounted for individually. The Company estimates the amount and timing of undiscounted expected cash flows for each loan, and the expected cash flows in excess of fair value is recorded as interest income over the remaining life of the loan (accretable yield). The excess of the loan’s contractual principal and interest over the expected cash flows is not recorded (nonaccretable difference). Over the life of the loan, expected cash flows continue to be estimated. If the expected cash flows decrease, a provision for loan losses and the establishment of an allowance for loan losses with respect to the acquired impaired loan is recorded. If the expected cash flows increase, it is recognized as part of future interest income.
The performing loans are accounted for under ASC 310-20, Nonrefundable Fees and Other Costs (“ASC 310-20”), with the related discount or premium being adjusted for over the life of the loan and recognized as interest income.
Allowance for Loan Losses
The allowance for loan losses is maintained at a level which, in management’s judgment, is adequate to absorb credit losses inherent in the loan portfolio. The allowance for loan losses is based upon management’s review and evaluation of the loan portfolio. Factors considered in the establishment of the allowance for loan losses include management’s evaluation of specific loans; the level and composition of classified loans; historical loss experience; results of examinations by regulatory agencies; an internal asset review process; expectations of future economic conditions and their impact on particular borrowers; and other judgmental factors. Allowances for impaired loans are generally determined based on collateral values or the present value of estimated cash flows. Management obtains independent appraisals for significant collateral in determining collateral values. Although management uses available information to recognize losses on loans, because of uncertainties associated with local economic conditions, collateral values, and future cash flows on impaired loans, it is reasonably possible that a material change could occur in the allowance for loan losses in the near term. However, the amount of the change that is reasonably possible cannot be estimated.
Loans acquired in business combinations are initially recorded at fair value, which includes an estimate of credit losses expected to be realized over the remaining lives of the loans and, therefore, no corresponding allowance for loan losses is recorded for these loans at acquisition. Methods utilized to estimate any subsequently required allowance for loan losses for acquired loans not deemed credit-impaired at acquisition are similar to originated loans; however, the estimate of loss is based on the unpaid principal balance and then compared to any remaining unaccreted purchase discount. To the extent the calculated loss is greater than the remaining unaccreted discount, an allowance is recorded for such difference.
The allowance for loan losses is based on estimates of probable future losses, and ultimate losses may vary from the current estimates. These estimates are reviewed periodically and as adjustments become necessary, the effect of the change in estimate is charged to operating expenses in the period incurred. All losses are charged to the allowance for loan losses when the loss actually occurs or when management believes that the collectability of the principal is unlikely. Recoveries are credited to the allowance at the time of recovery.
Premises and Equipment
Premises and equipment are stated at cost less accumulated depreciation. Depreciation is provided at rates based upon estimated useful service lives using the straight-line method for financial reporting and accelerated methods for tax reporting purposes.
The costs of assets retired or otherwise disposed of and the related accumulated depreciation are eliminated from the accounts in the year of disposal and the resulting gains or losses are included in current operations. Expenditures for maintenance and repairs are charged to operations as incurred. Costs of major additions and improvements are capitalized.
BUSINESS FIRST BANCSHARES, INC. AND SUBSIDIARIES
NOTES TO CONSOLIDATED FINANCIAL STATEMENTS
Other Real Estate Owned
Real estate properties acquired through or in lieu of loan foreclosure or negotiated settlement are initially recorded at the fair value less estimated selling cost at the date of acquisition. Any write-downs based on the asset’s fair value at the date of acquisition are charged to the allowance for loan losses. After foreclosure, property held for sale is carried at the lower of the new cost basis or fair value less cost to sell. Impairment losses on property to be held and used are measured as the amount by which the carrying amount of a property exceeds its fair value. Costs of significant property improvements are capitalized, whereas costs relating to holding property are expensed. Valuations are periodically performed by management, and any subsequent write-downs are recorded as a charge to operations, if necessary, to reduce the carrying value of a property to the lower of its cost or fair value less cost to sell.
Goodwill and Other Intangible Assets
Goodwill represents the excess of the purchase price over the fair value of the net identifiable assets acquired in a business combination. Goodwill and other intangible assets deemed to have an indefinite useful life are not amortized but instead are subject to review for impairment annually, or more frequently if deemed necessary.
Intangible assets with estimable useful lives are amortized over their respective estimated useful lives and reviewed for impairment. If impaired, the asset is written down to its estimated fair value. Core deposit intangibles representing the value of the acquired core deposit base are generally recorded in connection with business combinations involving banks and branch locations. The Company’s policy is to amortize core deposit intangibles on a straight line basis over their estimated useful life of 10 years. Core deposit intangibles are tested for impairment whenever events or changes in circumstances indicate the carrying amount of the assets may not be recoverable from future undiscounted cash flows.
Income Taxes
The provision for income taxes is based on amounts reported in the statement of income after exclusion of nontaxable income such as interest on state and municipal securities. Also, certain items of income and expense are recognized in different time periods for financial statement purposes than for income tax purposes. Thus, provisions for deferred taxes are recorded in recognition of such temporary differences.
Deferred taxes are provided utilizing a liability method whereby deferred tax assets and liabilities are recognized for the future tax consequences attributable to differences between the reported amounts of existing assets and liabilities and their respective tax basis. Deferred tax assets and liabilities are adjusted for the effects of changes in tax laws and rates on the date of enactment.
The Company files a consolidated federal income tax return. Consolidated income tax expense is allocated on the basis of each entity’s income adjusted for permanent differences.
The Company evaluates all significant tax positions as required by accounting principles generally accepted in the United States of America. As of December 31, 2019 and 2018, the Company does not believe it has taken any positions that would require the recording of any additional tax liability, nor does it believe there are any unrealized tax benefits that would either increase or decrease within the next year.
The Company files income tax returns in the U.S. federal jurisdiction and applicable states. With few exceptions, the Company is no longer subject to federal and state income tax examinations by tax authorities for years before 2016. Any interest and penalties assessed by income taxing authorities are not significant, and are included in other expenses in these financial statements, as applicable.
Stock Based Compensation
As described in Note 16, the Company has issued stock warrants, stock options, stock grants and restricted stock awards which incorporate stock based compensation. The Company has adopted a fair value based method of accounting for these awards. The compensation cost is measured at the grant date based on the value of the award and is recognized over the requisite service period, which is usually the vesting period. Forfeitures are recognized as they occur.
Statements of Cash Flows
For purposes of reporting cash flows, cash and cash equivalents include cash on hand and deposits in other financial institutions.
BUSINESS FIRST BANCSHARES, INC. AND SUBSIDIARIES
NOTES TO CONSOLIDATED FINANCIAL STATEMENTS
Comprehensive Income
Accounting principles generally require that recognized revenue, expenses, gains and losses be included in net income. Although certain changes in assets and liabilities, such as unrealized gains and losses on available for sale securities, are reported as a separate component of the equity section of the balance sheet, such items, along with net income, are components of comprehensive income. The components of comprehensive income are disclosed on the Consolidated Statements of Comprehensive Income for all periods presented.
Advertising
The Company expenses all costs of advertising and promotion the first time the advertising or promotion takes place. For the years ended December 31, 2019, 2018 and 2017, the Company expensed costs of $1.5 million, $1.2 million and $1.2 million, respectively.
Accounting Standards Adopted in 2019
In February 2016, the Financial Accounting Standards Board (“FASB”) issued Accounting Standards Update (“ASU”) 2016-02, Leases (Topic 842), Conforming Amendments Related to Leases. This ASU amends the codification regarding leases in order to increase transparency and comparability. The ASU requires companies to recognize lease assets and liabilities on the statement of condition and disclose key information about leasing arrangements. A lessee would recognize a liability to make lease payments and a right-of-use asset representing its right to use the leased asset for the lease term. The ASU was effective on January 1, 2019. The Company recognized a right-of-use asset and lease liability of approximately $13.2 million as of December 31, 2019. The right-of-use asset and lease liability are recorded within premises and equipment and other liabilities, respectively.
Accounting Standards Not Yet Adopted
In June 2016, the FASB issued ASU 2016-13, Financial Instruments – Credit Losses (Topic 326), Measurement of Credit Losses on Financial Instruments. The amendments introduce an impairment model that is based on current expected credit losses (“CECL”), rather than incurred losses, to estimate credit losses on certain types of financial instruments (ex. loans and held to maturity securities), including certain off-balance sheet financial instruments (ex. commitments to extend credit and standby letters of credit that are not unconditionally cancellable). The CECL should consider historical information, current information, and reasonable and supportable forecasts, including estimates of prepayments, over the contractual term. An entity must use judgment in determining the relevant information and estimation methods that are appropriate in its circumstances. Financial instruments with similar risk characteristics may be grouped together when estimating the CECL. The allowance for credit losses for purchased financial assets with a more-than-insignificant amount of credit deterioration since origination that are measured at amortized cost basis is determined in a similar manner to other financial assets measured at amortized cost basis; however, the initial estimate of expected credit loss would be recognized through an allowance for credit losses with an offset (i.e. increase) to the purchase price at acquisition. Only subsequent changes in the allowance for credit losses are recorded as a credit loss expense for these assets. The ASU also amends the current available for sale security impairment model for debt securities whereby credit losses relating to available for sale debt securities should be recorded through an allowance for credit losses. The amendments will be applied through a modified retrospective approach, resulting in a cumulative-effect adjustment to retained earnings as of the beginning of the first reporting period in which the guidance is effective. On October 18, 2019, FASB approved an effective date delay applicable to smaller reporting companies until January 2023. The Company anticipates electing the delay and implementing the standard sometime after 2020. The adoption of this ASU may have a material effect on the Company’s consolidated financial statements.
On January 26, 2017, the FASB issued ASU 2017-04, Intangibles – Goodwill and Other (Topic 350) which simplifies the accounting for goodwill impairment. The guidance in this ASU removes Step 2 of the goodwill impairment test, which requires a hypothetical purchase price allocation. The goodwill impairment will now be the amount by which a reporting unit’s carrying value exceeds its fair value, not to exceed the carrying amount of goodwill. All other goodwill impairment guidance will remain largely unchanged. Entities will continue to have the option to perform a qualitative assessment to determine if a quantitative impairment test is necessary. The same one-step impairment test will be applied to goodwill at all reporting units, even those with zero or negative carrying amounts. Entities will be required to disclose the amount of goodwill at reporting units with zero or negative carrying amounts. The revised guidance will be applied prospectively, and is effective for calendar year-end ending in 2020 for public business entities. Early adoption is permitted for any impairment tests performed after January 1, 2017. Based on recent goodwill impairment tests, which did not require the application of Step 2, the Company does not expect the adoption of this ASU to have any immediate impact on the consolidated financial statements.
BUSINESS FIRST BANCSHARES, INC. AND SUBSIDIARIES
NOTES TO CONSOLIDATED FINANCIAL STATEMENTS
Note 2 – Reclassifications –
Certain reclassifications may have been made to the prior years’ financial statements in order to conform to the classifications adopted for reporting in 2019. These reclassifications have no effect on previously reported net income.
Note 3 – Mergers and Acquisitions –
On January 1, 2018, the Company completed the acquisition of Minden Bancorp, Inc. (MBI), and its wholly-owned subsidiary, MBL Bank, located in Minden, Louisiana, further increasing its presence in the Northwest Louisiana region. The Company paid aggregate cash consideration equal to $56.2 million, or approximately $23.20 in exchange for each share of MBI common stock outstanding immediately prior to the effective time of the acquisition. At December 31, 2017, MBI had fair values of approximately $317.4 million in total assets, $192.7 million in net loans, $264.0 million in total deposits, and $30.6 million in total shareholders’ equity, and was the leading financial institution in Webster Parish, part of the Shreveport-Bossier City MSA, through its two banking center locations.
|
Cost and Allocation of Purchase Price for Minden Bancorp, Inc. (MBI): |
|||||||
|
(Dollars in thousands, except per share data) |
|
Purchase Price: |
||||||||
|
MBI Shares Outstanding at December 31, 2017 |
2,407,627 | |||||||
|
MBI Restricted Stock Awards Outstanding at December 31, 2017 |
1,480 | |||||||
|
MBI Shares Cashed Out Under Terms of Merger |
2,409,107 | |||||||
|
Exchange Ratio |
23.20 | |||||||
|
Cash Paid to Shareholders for Shares of Common Stock |
$ | 55,891 | ||||||
|
MBI Stock Options Outstanding at December 31, 2017 |
||||||||
|
17,822 Shares at $31.50 Less Strike Price |
||||||||
|
Cash Paid on MBI Options |
296 | |||||||
|
Total Purchase Price |
$ | 56,187 | ||||||
|
Net Assets Acquired: |
||||||||
|
Cash and Cash Equivalents |
$ | 15,891 | ||||||
|
Securities Available for Sale |
99,867 | |||||||
|
Loans and Leases Receivable |
192,714 | |||||||
|
Premises and Equipment, Net |
2,678 | |||||||
|
Cash Value of Life Insurance |
741 | |||||||
|
Core Deposit Intangible |
2,494 | |||||||
|
Other Assets |
3,055 | |||||||
|
Total Assets |
317,440 | |||||||
|
Deposits |
263,951 | |||||||
|
Borrowings |
21,047 | |||||||
|
Other Liabilities |
1,858 | |||||||
|
Total Liabilities |
286,856 | |||||||
|
Net Assets Acquired |
30,584 | |||||||
|
Goodwill Resulting from Merger |
$ | 25,603 |
BUSINESS FIRST BANCSHARES, INC. AND SUBSIDIARIES
NOTES TO CONSOLIDATED FINANCIAL STATEMENTS
After the close of business on November 30, 2018, the Company completed the acquisition of Richland State Bancorp, Inc. (RSBI), and its wholly-owned subsidiary, Richland State Bank, located in Rayville, Louisiana. The Company issued 1,679,559 shares of its common stock to the RSBI shareholders for a purchase price of $42.4 million. At November 30, 2018, RSBI had fair values of approximately $316.4 million in total assets, $190.8 million in net loans, $290.0 million in total deposits, and $25.4 million in total shareholders’ equity.
|
Cost and Allocation of Purchase Price for Richland State Bancorp, Inc. (RSBI): |
||||
|
(Dollars in thousands, except per share data) |
||||
|
Purchase Price: |
||||
|
Shares Issued to RSBI Shareholders on December 1, 2018 |
1,679,559 | |||
|
Closing Stock Price on November 30, 2018 |
25.29 | |||
|
Total Purchase Price |
$ | 42,476 | ||
|
Net Assets Acquired: |
||||
|
Cash and Cash Equivalents |
$ | 40,648 | ||
|
Securities Available for Sale |
63,823 | |||
|
Loans and Leases Receivable |
190,802 | |||
|
Premises and Equipment, Net |
5,282 | |||
|
Cash Value of Life Insurance |
7,260 | |||
|
Core Deposit Intangible |
3,947 | |||
|
Other Assets |
4,668 | |||
|
Total Assets |
316,430 | |||
|
Deposits |
289,979 | |||
|
Other Liabilities |
1,074 | |||
|
Total Liabilities |
291,053 | |||
|
Net Assets Acquired |
25,377 | |||
|
Goodwill Resulting from Merger |
$ | 17,099 | ||
On June 28, 2019, the Company sold a branch that was acquired in the RSBI acquisition. The sale resulted in a net gain of $581,000 and reduced goodwill and core deposit intangible by $1.3 million.
The following unaudited supplemental pro forma information is presented to reflect estimated results assuming MBI and RSBI were acquired as of January 1, 2017. These unaudited pro forma results are not necessarily indicative of the operating results that the Company would have achieved had the acquisitions been completed as of January 1, 2017 and should not be considered representative of future operating results.
BUSINESS FIRST BANCSHARES, INC. AND SUBSIDIARIES
NOTES TO CONSOLIDATED FINANCIAL STATEMENTS
|
For The Year Ended December 31, |
||||||||
|
2018 |
2017 |
|||||||
|
(Dollars in thousands) |
||||||||
|
(except per share data) |
||||||||
|
Interest Income |
$ | 88,277 | $ | 79,230 | ||||
|
Interest Expense |
15,132 | 9,308 | ||||||
|
Net Interest Income |
73,145 | 69,922 | ||||||
|
Provision for Loan Losses |
2,590 | 4,237 | ||||||
|
Net Interest Income after Provision for Loan Losses |
70,555 | 65,685 | ||||||
|
Noninterest Income |
11,496 | 8,705 | ||||||
|
Noninterest Expense |
58,520 | 52,184 | ||||||
|
Income Before Income Taxes |
23,531 | 22,206 | ||||||
|
Income Tax Expense |
4,506 | 8,676 | ||||||
|
Net Income |
$ | 19,025 | $ | 13,530 | ||||
|
Earnings Per Common Share |
||||||||
|
Basic |
$ | 1.50 | $ | 1.03 | ||||
|
Diluted |
$ | 1.45 | $ | 1.01 | ||||
BUSINESS FIRST BANCSHARES, INC. AND SUBSIDIARIES
NOTES TO CONSOLIDATED FINANCIAL STATEMENTS
Note 4 – Earnings per Common Share –
Basic earnings per share (EPS) represents income available to common shareholders divided by the weighted average number of common shares outstanding; no dilution for any potentially convertible shares is included in the calculation. Diluted EPS reflects the potential dilution that could occur if securities or other contracts to issue common stock were exercised or converted into common stock or resulted in the issuance of common stock that then shared in the earnings of the Company. The potential common shares that may be issued by the Company relate to outstanding stock warrants and stock options.
|
Years Ended December 31, |
||||||||||||
|
2019 |
2018 |
2017 |
||||||||||
|
(Dollars in thousands, except per share data) |
||||||||||||
|
Numerator: |
||||||||||||
|
Net Income Available to Common Shares |
$ | 23,772 | $ | 14,091 | $ | 4,848 | ||||||
|
Denominator: |
||||||||||||
|
Weighted Average Common Shares Outstanding |
13,310,577 | 11,124,585 | 7,658,137 | |||||||||
|
Dilutive Effect of Stock Options and Warrants |
360,200 | 421,358 | 345,822 | |||||||||
|
Weighted Average Dilutive Common Shares |
13,670,777 | 11,545,943 | 8,003,959 | |||||||||
|
Basic Earnings Per Common Share From Net Income Available to Common Shares |
$ | 1.79 | $ | 1.27 | $ | 0.63 | ||||||
|
Diluted Earnings Per Common Share From Net Income Available to Common Shares |
$ | 1.74 | $ | 1.22 | $ | 0.61 | ||||||
Note 5 – Cash and Due From Bank –
The Bank is required to maintain funds in cash or on deposit with the Federal Reserve Bank. The Bank had no required reserves as of December 31, 2019 and $1.6 million as of December 31, 2018.
Note 6 – Securities –
The amortized cost and fair values of securities available for sale as of December 31, 2019 and 2018 are summarized as follows:
|
December 31, 2019 |
||||||||||||||||
|
(Dollars in thousands) |
||||||||||||||||
|
Gross |
Gross |
|||||||||||||||
|
Amortized |
Unrealized |
Unrealized |
Fair |
|||||||||||||
|
Cost |
Gains |
Losses |
Value |
|||||||||||||
|
U.S. Government Agencies |
$ | 15,654 | $ | 303 | $ | 20 | $ | 15,937 | ||||||||
|
Corporate Securities |
23,774 | 98 | 158 | 23,714 | ||||||||||||
|
Mortgage-Backed Securities |
137,817 | 2,139 | 497 | 139,459 | ||||||||||||
|
Municipal Securities |
97,641 | 1,447 | 5 | 99,083 | ||||||||||||
|
Total Securities Available for Sale |
$ | 274,886 | $ | 3,987 | $ | 680 | $ | 278,193 | ||||||||
BUSINESS FIRST BANCSHARES, INC. AND SUBSIDIARIES
NOTES TO CONSOLIDATED FINANCIAL STATEMENTS
|
December 31, 2018 |
||||||||||||||||
|
(Dollars in thousands) |
||||||||||||||||
|
Gross |
Gross |
|||||||||||||||
|
Amortized |
Unrealized |
Unrealized |
Fair |
|||||||||||||
|
Cost |
Gains |
Losses |
Value |
|||||||||||||
|
U.S. Government Agencies |
$ | 17,529 | $ | 54 | $ | 144 | $ | 17,439 | ||||||||
|
Corporate Securities |
13,052 | 76 | 436 | 12,692 | ||||||||||||
|
Mortgage-Backed Securities |
168,854 | 328 | 3,564 | 165,618 | ||||||||||||
|
Municipal Securities |
114,472 | 250 | 955 | 113,767 | ||||||||||||
|
Total Securities Available for Sale |
$ | 313,907 | $ | 708 | $ | 5,099 | $ | 309,516 | ||||||||
The following table is a summary of securities with gross unrealized losses and fair values at December 31, 2019 and 2018, aggregated by investment category and length of time in a continued unrealized loss position. Due to the nature of these investments and current prevailing market prices, these unrealized losses are considered a temporary impairment of the securities.
|
December 31, 2019 |
||||||||||||||||||||||||
|
Less Than 12 Months |
12 Months or Greater |
Total |
||||||||||||||||||||||
|
(Dollars in thousands) |
||||||||||||||||||||||||
|
Gross |
Gross |
Gross |
||||||||||||||||||||||
|
Fair |
Unrealized |
Fair |
Unrealized |
Fair |
Unrealized |
|||||||||||||||||||
|
Value |
Losses |
Value |
Losses |
Value |
Losses |
|||||||||||||||||||
|
U.S. Government Agencies |
$ | 2,486 | $ | 20 | $ | - | $ | - | $ | 2,486 | $ | 20 | ||||||||||||
|
Corporate Securities |
- | - | 6,360 | 158 | 6,360 | 158 | ||||||||||||||||||
|
Mortgage-Backed Securities |
950 | 4 | 44,366 | 493 | 45,316 | 497 | ||||||||||||||||||
|
Municipal Securities |
948 | 4 | 1,261 | 1 | 2,209 | 5 | ||||||||||||||||||
|
Total Securities Available for Sale |
$ | 4,384 | $ | 28 | $ | 51,987 | $ | 652 | $ | 56,371 | $ | 680 | ||||||||||||
|
December 31, 2018 |
||||||||||||||||||||||||
|
Less Than 12 Months |
12 Months or Greater |
Total |
||||||||||||||||||||||
|
(Dollars in thousands) |
||||||||||||||||||||||||
|
Gross |
Gross |
Gross |
||||||||||||||||||||||
|
Fair |
Unrealized |
Fair |
Unrealized |
Fair |
Unrealized |
|||||||||||||||||||
|
Value |
Losses |
Value |
Losses |
Value |
Losses |
|||||||||||||||||||
|
U.S. Government Agencies |
$ | 4,399 | $ | 28 | $ | 4,610 | $ | 116 | $ | 9,009 | $ | 144 | ||||||||||||
|
Corporate Securities |
6,274 | 260 | 2,324 | 176 | 8,598 | 436 | ||||||||||||||||||
|
Mortgage-Backed Securities |
67,770 | 1,264 | 61,271 | 2,300 | 129,041 | 3,564 | ||||||||||||||||||
|
Municipal Securities |
40,473 | 484 | 29,782 | 471 | 70,255 | 955 | ||||||||||||||||||
|
Total Securities Available for Sale |
$ | 118,916 | $ | 2,036 | $ | 97,987 | $ | 3,063 | $ | 216,903 | $ | 5,099 | ||||||||||||
Management evaluates securities for other than temporary impairment when economic and market conditions warrant such evaluations. Consideration is given to the extent and length of time the fair value has been below cost, the reasons for the decline in value, and the Company’s intent to sell a security or whether it is more likely than not that the Company will be required to sell the security before the recovery of its amortized cost. The Company developed a process to identify securities that could potentially have a credit impairment that is other than temporary. This process involves evaluating each security for impairment by monitoring credit performance, collateral type, collateral geography, loan-to-value ratios, credit scores, loss severity levels, pricing levels, downgrades by rating agencies, cash flow projections and other factors as indicators of potential credit issues. When the Company determines that a security is deemed to be other than temporarily impaired, an impairment loss is recognized.
BUSINESS FIRST BANCSHARES, INC. AND SUBSIDIARIES
NOTES TO CONSOLIDATED FINANCIAL STATEMENTS
The amortized cost and fair values of securities available for sale as of December 31, 2019 by contractual maturity are shown below. Actual maturities may differ from contractual maturities in mortgage-backed securities because the mortgages underlying the securities may be called or repaid without any penalties.
|
Amortized |
Fair |
|||||||
|
Cost |
Value |
|||||||
|
(Dollars in thousands) |
||||||||
|
Less Than One Year |
$ | 26,988 | $ | 27,017 | ||||
|
One to Five Years |
50,511 | 51,099 | ||||||
|
Over Five to Ten Years |
129,486 | 131,158 | ||||||
|
Over Ten Years |
67,901 | 68,919 | ||||||
|
Total Securities Available for Sale |
$ | 274,886 | $ | 278,193 | ||||
Securities available for sale with a fair value of $165.9 million and $172.2 million, respectively, were pledged as collateral on public deposits and for other purposes as required or permitted by law as of December 31, 2019 and 2018.
There were $112,000, $7,000 and $31,000 realized gross gains from sales or redemptions of securities for the years ended December 31, 2019, 2018 and 2017, respectively. There were $6,000 realized gross losses from sales or redemptions of securities for the year ended December 31, 2019, and no realized gross losses from sales or redemptions of securities for the years ended December 31, 2018 and 2017, respectively.
Other Equity Securities
The Company has invested in the Federal Home Loan Bank of Dallas which is included in other equity securities and reflected at cost in these financial statements. The cost of these securities was $6.1 million and $3.6 million, respectively, at December 31, 2019 and 2018. The Federal Home Loan Bank stock is pledged to secure advances from the Federal Home Loan Bank of Dallas at both December 31, 2019 and 2018. The Company also has investments of $202,000 and $202,000 in The Independent Bankers Bank, $310,000 and $621,000 in Bankers Insurance, LLC, and $655,000 and $655,000 in First National Bankers Bank at December 31, 2019 and 2018, respectively. These investments are carried at cost due to the lack of a quoted market price and a ready market for these types of investments. Additionally, the Company has invested $1.9 million and $1.5 million in McLarty Capital Partners SBIC, L.P., $1.8 million and $1.6 million in McLarty Capital Partners SBIC II, L.P., $1.6 million and $1.1 million in Bluehenge Capital Secured Debt SBIC, L.P., $12,000 and $13,000 in New Louisiana Angel Fund 2, LLC, at December 31, 2019 and 2018, respectively. These investments are accounted for utilizing the equity method of accounting as the Company.
BUSINESS FIRST BANCSHARES, INC. AND SUBSIDIARIES
NOTES TO CONSOLIDATED FINANCIAL STATEMENTS
Note 7 – Loans and the Allowance for Loan Losses –
Loans receivable at December 31, 2019 and 2018 are summarized as follows:
|
December 31, |
||||||||
|
2019 |
2018 |
|||||||
|
(Dollars in thousands) |
||||||||
|
Real estate loans: |
||||||||
|
Construction and land |
$ | 244,181 | $ | 211,054 | ||||
|
Farmland |
48,681 | 45,989 | ||||||
|
1-4 family residential |
293,142 | 270,583 | ||||||
|
Multi-family residential |
36,454 | 39,273 | ||||||
|
Nonfarm nonresidential |
612,608 | 518,660 | ||||||
|
Commercial |
390,398 | 363,640 | ||||||
|
Consumer |
84,801 | 79,270 | ||||||
|
Total loans held for investment |
1,710,265 | 1,528,469 | ||||||
|
Less: |
||||||||
|
Allowance for loan losses |
(12,124 | ) | (11,220 | ) | ||||
|
Net loans |
$ | 1,698,141 | $ | 1,517,249 | ||||
The performing one-to-four family residential, multi-family residential, commercial real estate, and commercial loans are pledged, under a blanket lien, as collateral securing advances from the FHLB at December 31, 2019 and 2018.
Net deferred loan origination fees were $3.0 million and $1.7 million at December 31, 2019 and 2018, respectively, and are netted in their respective loan categories above. In addition to loans issued in the normal course of business, the Company considers overdrafts on customer deposit accounts to be loans, and reclassifies overdrafts as loans in its consolidated balance sheets. At December 31, 2019 and 2018, overdrafts of $276,000 and $858,000, respectively, have been reclassified to loans.
The Bank is the lead lender on participations sold, without recourse, to other financial institutions which amounts are not included in the balance sheet. The unpaid principal balances of mortgages and other loans serviced for others were approximately $129.7 million and $147.0 million at December 31, 2019 and 2018, respectively.
The Bank grants loans and extensions of credit to individuals and a variety of businesses and corporations located in its general market areas throughout Louisiana and Texas. Management segregates the loan portfolio into portfolio segments which is defined as the level at which the Bank develops and documents a systematic method for determining its allowance for loan losses. The portfolio segments are segregated based on loan types and the underlying risk factors present in each loan type. Such risk factors are periodically reviewed by management and revised as deemed appropriate.
Loans acquired in business combinations are initially recorded at fair value, which includes an estimate of credit losses expected to be realized over the remaining lives of the loans and, therefore, no corresponding allowance for loan losses is recorded for these loans at acquisition. Methods utilized to estimate any subsequently required allowance for loan losses for acquired loans not deemed credit-impaired at acquisition are similar to originated loans; however, the estimate of loss is based on the unpaid principal balance and then compared to any remaining unaccreted purchase discount. To the extent the calculated loss is greater than the remaining unaccreted discount, an allowance is recorded for such difference.
Loans acquired in business combinations were recorded at estimated fair value at the acquisition date with no carryover of the related allowance for loan losses.
Total loans held for investment at December 31, 2019 includes $180.0 million of loans acquired in acquisitions that were recorded at fair value as of the acquisition date. Included in the acquired balances at December 31, 2019 were acquired impaired loans accounted for under ASC 310-30 with a net carrying amount of $5.0 million and acquired performing loans not accounted for under ASC 310-30 totaling $177.1 million with a related purchase discount of $2.0 million.
BUSINESS FIRST BANCSHARES, INC. AND SUBSIDIARIES
NOTES TO CONSOLIDATED FINANCIAL STATEMENTS
Total loans held for investment at December 31, 2018 includes $334.8 million of loans acquired in acquisitions that were recorded at fair value as of the acquisition date. Included in the acquired balances at December 31, 2018 were acquired impaired loans accounted for under ASC 310-30 with a net carrying amount of $10.7 million and acquired performing loans not accounted for under ASC 310-30 totaling $327.3 million with a related purchase discount of $3.2 million.
The following tables set forth, as of December 31, 2019 and 2018, the balance of the allowance for loan losses by portfolio segment, disaggregated by impairment methodology, which is then further segregated by amounts evaluated for impairment collectively and individually. The allowance for loan losses allocated to each portfolio segment is not necessarily indicative of future losses in any particular portfolio segment and does not restrict the use of the allowance to absorb losses in other portfolio segments.
Allowance for Credit Losses and Recorded Investment in Loans Receivable
|
December 31, 2019 |
||||||||||||||||||||||||||||||||
|
(Dollars in thousands) |
||||||||||||||||||||||||||||||||
|
Real Estate: |
Real Estate: |
Real Estate: |
Real Estate: |
|||||||||||||||||||||||||||||
|
Construction |
Real Estate: |
1-4 Family |
Multi-family |
Nonfarm |
||||||||||||||||||||||||||||
|
and Land |
Farmland |
Residential |
Residential |
Nonresidential |
Commercial |
Consumer |
Total |
|||||||||||||||||||||||||
|
Allowance for credit losses: |
||||||||||||||||||||||||||||||||
|
Beginning Balance |
$ | 1,590 | $ | 104 | $ | 1,538 | $ | 236 | $ | 2,715 | $ | 4,453 | $ | 584 | $ | 11,220 | ||||||||||||||||
|
Charge-offs |
(2 | ) | (2 | ) | (162 | ) | - | (51 | ) | (1,556 | ) | (52 | ) | (1,825 | ) | |||||||||||||||||
|
Recoveries |
- | - | 14 | - | 4 | 41 | 64 | 123 | ||||||||||||||||||||||||
|
Provision |
280 | 127 | 498 | (10 | ) | 1,214 | 476 | 21 | 2,606 | |||||||||||||||||||||||
|
Ending Balance |
$ | 1,868 | $ | 229 | $ | 1,888 | $ | 226 | $ | 3,882 | $ | 3,414 | $ | 617 | $ | 12,124 | ||||||||||||||||
|
Ending Balance: |
||||||||||||||||||||||||||||||||
|
Individually evaluated for impairment |
$ | - | $ | 4 | $ | 30 | $ | - | $ | 52 | $ | 421 | $ | 49 | $ | 556 | ||||||||||||||||
|
Collectively evaluated for impairment |
$ | 1,868 | $ | 225 | $ | 1,858 | $ | 226 | $ | 3,830 | $ | 2,993 | $ | 568 | $ | 11,568 | ||||||||||||||||
|
Purchased Credit Impaired (1) |
$ | - | $ | - | $ | - | $ | - | $ | - | $ | - | $ | - | $ | - | ||||||||||||||||
|
Loans receivable: |
||||||||||||||||||||||||||||||||
|
Ending Balance |
$ | 244,181 | $ | 48,681 | $ | 293,142 | $ | 36,454 | $ | 612,608 | $ | 390,398 | $ | 84,801 | $ | 1,710,265 | ||||||||||||||||
|
Ending Balance: |
||||||||||||||||||||||||||||||||
|
Individually evaluated for impairment |
$ | 397 | $ | 222 | $ | 2,531 | $ | - | $ | 4,101 | $ | 4,175 | $ | 421 | $ | 11,847 | ||||||||||||||||
|
Collectively evaluated for impairment |
$ | 243,784 | $ | 48,324 | $ | 290,549 | $ | 36,454 | $ | 603,891 | $ | 386,027 | $ | 84,380 | $ | 1,693,409 | ||||||||||||||||
|
Purchased Credit Impaired (1) |
$ | - | $ | 135 | $ | 62 | $ | - | $ | 4,616 | $ | 196 | $ | - | $ | 5,009 | ||||||||||||||||
|
(1) Purchased credit impaired loans are evaluated for impairment on an individual basis. |
BUSINESS FIRST BANCSHARES, INC. AND SUBSIDIARIES
NOTES TO CONSOLIDATED FINANCIAL STATEMENTS
|
December 31, 2018 |
||||||||||||||||||||||||||||||||
|
(Dollars in thousands) |
||||||||||||||||||||||||||||||||
|
Real Estate: |
Real Estate: |
Real Estate: |
Real Estate: |
|||||||||||||||||||||||||||||
|
Construction |
Real Estate: |
1-4 Family |
Multi-family |
Nonfarm |
||||||||||||||||||||||||||||
|
and Land |
Farmland |
Residential |
Residential |
Nonresidential |
Commercial |
Consumer |
Total |
|||||||||||||||||||||||||
|
Allowance for credit losses: |
||||||||||||||||||||||||||||||||
|
Beginning balance |
$ | 1,421 | $ | 76 | $ | 1,284 | $ | 144 | $ | 2,323 | $ | 3,147 | $ | 370 | $ | 8,765 | ||||||||||||||||
|
Charge-offs |
(90 | ) | - | (294 | ) | - | - | - | (88 | ) | (472 | ) | ||||||||||||||||||||
|
Recoveries |
398 | - | 18 | - | 13 | 28 | 80 | 537 | ||||||||||||||||||||||||
|
Provision |
(139 | ) | 28 | 530 | 92 | 379 | 1,278 | 222 | 2,390 | |||||||||||||||||||||||
|
Ending Balance |
$ | 1,590 | $ | 104 | $ | 1,538 | $ | 236 | $ | 2,715 | $ | 4,453 | $ | 584 | $ | 11,220 | ||||||||||||||||
|
Ending Balance: |
||||||||||||||||||||||||||||||||
|
Individually evaluated for impairment |
$ | - | $ | - | $ | 96 | $ | - | $ | 47 | $ | 1,112 | $ | 25 | $ | 1,280 | ||||||||||||||||
|
Collectively evaluated for impairment |
$ | 1,590 | $ | 104 | $ | 1,442 | $ | 236 | $ | 2,668 | $ | 3,341 | $ | 559 | $ | 9,940 | ||||||||||||||||
|
Purchased Credit Impaired (1) |
$ | - | $ | - | $ | - | $ | - | $ | - | $ | - | $ | - | $ | - | ||||||||||||||||
|
Loans receivable: |
||||||||||||||||||||||||||||||||
|
Ending Balance |
$ | 211,054 | $ | 45,989 | $ | 270,583 | $ | 39,273 | $ | 518,660 | $ | 363,640 | $ | 79,270 | $ | 1,528,469 | ||||||||||||||||
|
Ending Balance: |
||||||||||||||||||||||||||||||||
|
Individually evaluated for impairment |
$ | 32 | $ | 112 | $ | 2,728 | $ | - | $ | 4,155 | $ | 5,208 | $ | 125 | $ | 12,360 | ||||||||||||||||
|
Collectively evaluated for impairment |
$ | 211,022 | $ | 45,713 | $ | 267,761 | $ | 39,273 | $ | 507,506 | $ | 354,985 | $ | 79,145 | $ | 1,505,405 | ||||||||||||||||
|
Purchased Credit Impaired (1) |
$ | - | $ | 164 | $ | 94 | $ | - | $ | 6,999 | $ | 3,447 | $ | - | $ | 10,704 | ||||||||||||||||
|
(1) Purchased credit impaired loans are evaluated for impairment on an individual basis. |
Portfolio Segment Risk Factors
Construction and land include loans to small-to-midsized businesses to construct owner-user properties, loans to developers of commercial real estate investment properties and residential developments and, to a lesser extent, loans to individual clients for construction of single-family homes in our market areas. Risks associated with these loans include fluctuations in the value of real estate, project completion risk and change in market trends. We are also exposed to risk based on the ability of the construction loan borrower to finance the loan or sell the property upon completion of the project, which may be affected by changes in secondary market terms and criteria for permanent financing since the time that we funded the loan.
Farmland loans are often for investments related to agricultural businesses and may include construction of facilities. These loans are usually repaid through permanent financing or the cashflow from the borrower’s ongoing operations.
One to four family residential include first and second lien one-to-four family mortgage loans, as well as home equity lines of credit, in each case primarily on owner-occupied primary residences. We are exposed to risk based on fluctuations in the value of the real estate collateral securing the loan, as well as changes in the borrower’s financial condition, which could be affected by numerous factors, including divorce, job loss, illness or other personal hardship.
Multifamily residential loans are generally originated to provide permanent financing for multifamily residential income producing properties. Repayment of these loans primarily relies on successful rental and management of the property.
Nonfarm nonresidential loans are extensions of credit secured by owner occupied and non-owner occupied collateral. Repayment is generally relied upon from the successful operations of the property. General economic conditions may impact the performance of these types of loans, including fluctuations in the value of real estate, vacancy rates, and unemployment trends.
Commercial loans include general commercial and industrial, or C&I, loans, including commercial lines of credit, working capital loans, term loans, equipment financing, asset acquisition, expansion and development loans, borrowing base loans, letters of credit and other loan products, primarily in our target markets that are underwritten on the basis of the borrower’s ability to service the debt from income. Commercial loan risk is derived from the expectation that such loans generally are serviced principally from the operations of the business, and those operations may not be successful. Any interruption or discontinuance of operating cash flows from the business, which may be influenced by events not under the control of the borrower such as economic events and changes in governmental regulations, could materially affect the ability of the borrower to repay the loan.
BUSINESS FIRST BANCSHARES, INC. AND SUBSIDIARIES
NOTES TO CONSOLIDATED FINANCIAL STATEMENTS
Consumer loans include a variety of loans to individuals for personal, family and household purposes, including secured and unsecured installment and term loans. The risk is based on changes in the borrower’s financial condition, which could be affected by numerous factors, including divorce, job loss, illness or other personal hardship, and fluctuations in the value of the real estate or personal property securing the consumer loan, if any.
Management further disaggregates the loan portfolio segments into classes of loans, which are based on the initial measurement of the loan, risk characteristics of the loan and the method for monitoring and assessing the credit risk of the loan.
As of December 31, 2019 and 2018, the credit quality indicators, disaggregated by class of loan, are as follows:
Credit Quality Indicators
|
December 31, 2019 |
||||||||||||||||||||
|
Pass |
Special Mention |
Substandard |
Doubtful |
Total |
||||||||||||||||
|
(Dollars in thousands) |
||||||||||||||||||||
|
Real Estate Loans: |
||||||||||||||||||||
|
Construction and land |
$ | 241,519 | $ | 1,141 | $ | 1,124 | $ | 397 | $ | 244,181 | ||||||||||
|
Farmland |
46,591 | 1,737 | 14 | 339 | 48,681 | |||||||||||||||
|
1-4 family residential |
284,381 | 3,175 | 3,237 | 2,349 | 293,142 | |||||||||||||||
|
Multi-family residential |
36,422 | - | 32 | - | 36,454 | |||||||||||||||
|
Nonfarm nonresidential |
594,046 | 11,077 | 3,830 | 3,655 | 612,608 | |||||||||||||||
|
Commercial |
374,500 | 9,219 | 4,854 | 1,825 | 390,398 | |||||||||||||||
|
Consumer |
82,726 | 1,538 | 125 | 412 | 84,801 | |||||||||||||||
|
Total |
$ | 1,660,185 | $ | 27,887 | $ | 13,216 | $ | 8,977 | $ | 1,710,265 | ||||||||||
|
December 31, 2018 |
||||||||||||||||||||
|
Pass |
Special Mention |
Substandard |
Doubtful |
Total |
||||||||||||||||
|
(Dollars in thousands) |
||||||||||||||||||||
|
Real Estate Loans: |
||||||||||||||||||||
|
Construction and land |
$ | 209,027 | $ | 718 | $ | 1,277 | $ | 32 | $ | 211,054 | ||||||||||
|
Farmland |
45,563 | 153 | 161 | 112 | 45,989 | |||||||||||||||
|
1-4 family residential |
260,325 | 4,601 | 2,929 | 2,728 | 270,583 | |||||||||||||||
|
Multi-family residential |
39,237 | - | 36 | - | 39,273 | |||||||||||||||
|
Nonfarm nonresidential |
494,698 | 14,421 | 3,510 | 6,031 | 518,660 | |||||||||||||||
|
Commercial |
347,839 | 5,690 | 7,448 | 2,663 | 363,640 | |||||||||||||||
|
Consumer |
77,731 | 1,180 | 234 | 125 | 79,270 | |||||||||||||||
|
Total |
$ | 1,474,420 | $ | 26,763 | $ | 15,595 | $ | 11,691 | $ | 1,528,469 | ||||||||||
The above classifications follow regulatory guidelines and can generally be described as follows:
|
● |
Pass loans are of satisfactory quality. |
|
● |
Special mention loans have an existing weakness that could cause future impairment, including the deterioration of financial ratios, past due status, questionable management capabilities and possible reduction in the collateral values. |
BUSINESS FIRST BANCSHARES, INC. AND SUBSIDIARIES
NOTES TO CONSOLIDATED FINANCIAL STATEMENTS
|
● |
Substandard loans have an existing specific and well defined weakness that may include poor liquidity and deterioration of financial ratios. The loan may be past due and related deposit accounts experiencing overdrafts. Immediate corrective action is necessary. |
|
● |
Doubtful loans have specific weaknesses that are severe enough to make collection or liquidation in full highly questionable and improbable. |
As of December 31, 2019 and 2018, loan balances outstanding more than 90 days past due and still accruing interest amounted to $72,000 and $1.9 million, respectively. As of December 31, 2019 and 2018, loan balances outstanding on nonaccrual status amounted to $9.0 million and $11.7 million, respectively. The Bank considers all loans more than 90 days past due as nonperforming loans.
The following tables reflect certain information with respect to the loan portfolio delinquencies by loan class and amount as of December 31, 2019 and 2018. All loans greater than 90 days past due are generally placed on nonaccrual status.
Aged Analysis of Past Due Loans Receivable
|
December 31, 2019 |
||||||||||||||||||||||||||||
|
(Dollars in thousands) |
||||||||||||||||||||||||||||
|
Recorded |
||||||||||||||||||||||||||||
|
Greater |
Investment Over |
|||||||||||||||||||||||||||
|
30-59 Days |
60-89 Days |
Than 90 Days |
Total |
Total Loans |
90 Days Past Due |
|||||||||||||||||||||||
|
Past Due |
Past Due |
Past Due |
Past Due |
Current |
Receivable |
and Still Accruing |
||||||||||||||||||||||
|
Real Estate Loans: |
||||||||||||||||||||||||||||
|
Construction and land |
$ | 483 | $ | 17 | $ | 379 | $ | 879 | $ | 243,302 | $ | 244,181 | $ | - | ||||||||||||||
|
Farmland |
18 | 16 | 143 | 177 | 48,504 | 48,681 | - | |||||||||||||||||||||
|
1-4 family residential |
1,245 | 975 | 1,000 | 3,220 | 289,922 | 293,142 | 29 | |||||||||||||||||||||
|
Multi-family residential |
32 | - | - | 32 | 36,422 | 36,454 | - | |||||||||||||||||||||
|
Nonfarm nonresidential |
181 | 610 | 1,529 | 2,320 | 610,288 | 612,608 | - | |||||||||||||||||||||
|
Commercial |
126 | 142 | 1,311 | 1,579 | 388,819 | 390,398 | - | |||||||||||||||||||||
|
Consumer |
143 | 34 | 405 | 582 | 84,219 | 84,801 | 43 | |||||||||||||||||||||
|
Total |
$ | 2,228 | $ | 1,794 | $ | 4,767 | $ | 8,789 | $ | 1,701,476 | $ | 1,710,265 | $ | 72 | ||||||||||||||
|
December 31, 2018 |
||||||||||||||||||||||||||||
|
(Dollars in thousands) |
||||||||||||||||||||||||||||
|
Recorded |
||||||||||||||||||||||||||||
|
Greater |
Investment Over |
|||||||||||||||||||||||||||
|
30-59 Days |
60-89 Days |
Than 90 Days |
Total |
Total Loans |
90 Days Past Due |
|||||||||||||||||||||||
|
Past Due |
Past Due |
Past Due |
Past Due |
Current |
Receivable |
and Still Accruing |
||||||||||||||||||||||
|
Real Estate Loans: |
||||||||||||||||||||||||||||
|
Construction and land |
$ | 325 | $ | 13 | $ | 89 | $ | 427 | $ | 210,627 | $ | 211,054 | $ | 60 | ||||||||||||||
|
Farmland |
- | 96 | - | 96 | 45,893 | 45,989 | - | |||||||||||||||||||||
|
1-4 family residential |
1,596 | 588 | 1,400 | 3,584 | 266,999 | 270,583 | 270 | |||||||||||||||||||||
|
Multi-family residential |
36 | - | - | 36 | 39,237 | 39,273 | - | |||||||||||||||||||||
|
Nonfarm nonresidential |
2,437 | - | 3,967 | 6,404 | 512,256 | 518,660 | 450 | |||||||||||||||||||||
|
Commercial |
328 | 287 | 3,241 | 3,856 | 359,784 | 363,640 | 1,038 | |||||||||||||||||||||
|
Consumer |
237 | 89 | 106 | 432 | 78,838 | 79,270 | 58 | |||||||||||||||||||||
|
Total |
$ | 4,959 | $ | 1,073 | $ | 8,803 | $ | 14,835 | $ | 1,513,634 | $ | 1,528,469 | $ | 1,876 | ||||||||||||||
BUSINESS FIRST BANCSHARES, INC. AND SUBSIDIARIES
NOTES TO CONSOLIDATED FINANCIAL STATEMENTS
Loan Receivables on Nonaccrual Status
|
December 31, |
||||||||
|
2019 |
2018 |
|||||||
|
(Dollars in thousands) |
||||||||
|
Real Estate Loans: |
||||||||
|
Construction and land |
$ | 397 | $ | 32 | ||||
|
Farmland |
339 | 112 | ||||||
|
1-4 family residential |
2,349 | 2,728 | ||||||
|
Multi-family residential |
- | - | ||||||
|
Nonfarm nonresidential |
3,655 | 6,031 | ||||||
|
Commercial |
1,825 | 2,663 | ||||||
|
Consumer |
412 | 125 | ||||||
|
Total |
$ | 8,977 | $ | 11,691 | ||||
The following is a summary of information pertaining to impaired loans as of December 31, 2019 and 2018. Acquired non-impaired loans are placed on nonaccrual status and reported as impaired using the same criteria applied to the originated portfolio. Purchased impaired credits are excluded from this table. The interest income recognized for impaired loans was $292,000 and $254,000 for the years ended December 31, 2019 and 2018, respectively.
BUSINESS FIRST BANCSHARES, INC. AND SUBSIDIARIES
NOTES TO CONSOLIDATED FINANCIAL STATEMENTS
|
December 31, 2019 |
||||||||||||||||
|
(Dollars in thousands) |
||||||||||||||||
|
Unpaid |
Average |
|||||||||||||||
|
Recorded |
Principal |
Related |
Recorded |
|||||||||||||
|
Investment |
Balance |
Allowance |
Investment |
|||||||||||||
|
With an allowance recorded: |
||||||||||||||||
|
Real Estate Loans: |
||||||||||||||||
|
Construction and land |
$ | - | $ | - | $ | - | $ | 1 | ||||||||
|
Farmland |
20 | 21 | 4 | 21 | ||||||||||||
|
1-4 family residential |
136 | 167 | 30 | 163 | ||||||||||||
|
Multi-family residential |
- | - | - | - | ||||||||||||
|
Nonfarm nonresidential |
721 | 738 | 52 | 601 | ||||||||||||
|
Other Loans: |
||||||||||||||||
|
Commercial |
851 | 926 | 421 | 1,053 | ||||||||||||
|
Consumer |
120 | 123 | 49 | 116 | ||||||||||||
|
Total |
$ | 1,848 | $ | 1,975 | $ | 556 | $ | 1,955 | ||||||||
|
With no allowance recorded: |
||||||||||||||||
|
Real Estate Loans: |
||||||||||||||||
|
Construction and land |
$ | 397 | $ | 420 | $ | - | $ | 184 | ||||||||
|
Farmland |
202 | 207 | - | 177 | ||||||||||||
|
1-4 family residential |
2,395 | 3,041 | - | 2,531 | ||||||||||||
|
Multi-family residential |
- | - | - | - | ||||||||||||
|
Nonfarm nonresidential |
3,381 | 3,693 | - | 3,644 | ||||||||||||
|
Other Loans: |
||||||||||||||||
|
Commercial |
3,323 | 4,173 | - | 4,157 | ||||||||||||
|
Consumer |
301 | 358 | - | 192 | ||||||||||||
|
Total |
$ | 9,999 | $ | 11,892 | $ | - | $ | 10,885 | ||||||||
|
Total Impaired Loans: |
||||||||||||||||
|
Real Estate Loans: |
||||||||||||||||
|
Construction and land |
$ | 397 | $ | 420 | $ | - | $ | 185 | ||||||||
|
Farmland |
222 | 228 | 4 | 198 | ||||||||||||
|
1-4 family residential |
2,531 | 3,208 | 30 | 2,694 | ||||||||||||
|
Multi-family residential |
- | - | - | - | ||||||||||||
|
Nonfarm nonresidential |
4,102 | 4,431 | 52 | 4,245 | ||||||||||||
|
Other Loans: |
||||||||||||||||
|
Commercial |
4,174 | 5,099 | 421 | 5,210 | ||||||||||||
|
Consumer |
421 | 481 | 49 | 308 | ||||||||||||
|
Total |
$ | 11,847 | $ | 13,867 | $ | 556 | $ | 12,840 | ||||||||
BUSINESS FIRST BANCSHARES, INC. AND SUBSIDIARIES
NOTES TO CONSOLIDATED FINANCIAL STATEMENTS
|
December 31, 2018 |
||||||||||||||||
|
(Dollars in thousands) |
||||||||||||||||
|
Unpaid |
Average |
|||||||||||||||
|
Recorded |
Principal |
Related |
Recorded |
|||||||||||||
|
Investment |
Balance |
Allowance |
Investment |
|||||||||||||
|
With an allowance recorded: |
||||||||||||||||
|
Real Estate Loans: |
||||||||||||||||
|
Construction and land |
$ | - | $ | - | $ | - | $ | 22 | ||||||||
|
Farmland |
- | - | - | - | ||||||||||||
|
1-4 family residential |
363 | 451 | 96 | 303 | ||||||||||||
|
Multi-family residential |
- | - | - | - | ||||||||||||
|
Nonfarm nonresidential |
447 | 501 | 47 | 367 | ||||||||||||
|
Other Loans: |
||||||||||||||||
|
Commercial |
1,883 | 2,935 | 1,112 | 547 | ||||||||||||
|
Consumer |
25 | 25 | 25 | 2 | ||||||||||||
|
Total |
$ | 2,718 | $ | 3,912 | $ | 1,280 | $ | 1,241 | ||||||||
|
With no allowance recorded: |
||||||||||||||||
|
Real Estate Loans: |
||||||||||||||||
|
Construction and land |
$ | 32 | $ | 56 | $ | - | $ | 15 | ||||||||
|
Farmland |
112 | 193 | - | 9 | ||||||||||||
|
1-4 family residential |
2,365 | 3,975 | - | 2,708 | ||||||||||||
|
Multi-family residential |
- | - | - | - | ||||||||||||
|
Nonfarm nonresidential |
3,708 | 3,833 | - | 5,240 | ||||||||||||
|
Other Loans: |
||||||||||||||||
|
Commercial |
3,325 | 4,198 | - | 5,350 | ||||||||||||
|
Consumer |
100 | 144 | - | 261 | ||||||||||||
|
Total |
$ | 9,642 | $ | 12,399 | $ | - | $ | 13,583 | ||||||||
|
Total Impaired Loans: |
||||||||||||||||
|
Real Estate Loans: |
||||||||||||||||
|
Construction and land |
$ | 32 | $ | 56 | $ | - | $ | 37 | ||||||||
|
Farmland |
112 | 193 | - | 9 | ||||||||||||
|
1-4 family residential |
2,728 | 4,426 | 96 | 3,011 | ||||||||||||
|
Multi-family residential |
- | - | - | - | ||||||||||||
|
Nonfarm nonresidential |
4,155 | 4,334 | 47 | 5,607 | ||||||||||||
|
Other Loans: |
||||||||||||||||
|
Commercial |
5,208 | 7,133 | 1,112 | 5,897 | ||||||||||||
|
Consumer |
125 | 169 | 25 | 263 | ||||||||||||
|
Total |
$ | 12,360 | $ | 16,311 | $ | 1,280 | $ | 14,824 | ||||||||
BUSINESS FIRST BANCSHARES, INC. AND SUBSIDIARIES
NOTES TO CONSOLIDATED FINANCIAL STATEMENTS
The Company elected to account for certain loans acquired in business combinations as acquired impaired loans under ASC 310-30 due to evidence of credit deterioration at acquisition and the probability that the Company will be unable to collect all contractually required payments. The expected cash flows approximated fair value as of the date of mergers.
The following table presents the changes in the carrying amount of the purchased impaired credits accounted for under ASC 310-30 for the periods presented.
|
Purchased |
||||
|
Impaired Credits |
||||
|
(Dollars in thousands) |
||||
|
Carrying amount - December 31, 2017 |
$ | 696 | ||
|
Carrying amount of purchased impaired credits acquired in MBI acquisition |
5,798 | |||
|
Carrying amount of purchased impaired credits acquired in RSBI acquisition |
4,533 | |||
|
Payments received, net of discounts realized |
(507 | ) | ||
|
Purchased impaired credit participation interest sales proceeds, net of discount realized |
210 | |||
|
Charge-offs |
(26 | ) | ||
|
Carrying amount - December 31, 2018 |
10,704 | |||
|
Payments received, net of discounts realized |
(5,695 | ) | ||
|
Carrying amount - December 31, 2019 |
$ | 5,009 | ||
The Bank seeks to assist customers that are experiencing financial difficulty by renegotiating loans within lending regulations and guidelines. The Bank makes loan modifications, primarily utilizing internal renegotiation programs via direct customer contact, that manage customers’ debt exposures held only by the Bank. Additionally, the Bank makes loan modifications with customers who have elected to work with external renegotiation agencies and these modifications provide solutions to customers’ entire unsecured debt structures. During the periods ended December 31, 2019 and 2018, the concessions granted to certain borrowers included extending the payment due dates, lowering the contractual interest rate, reducing accrued interest, and reducing the debt’s face or maturity amount.
BUSINESS FIRST BANCSHARES, INC. AND SUBSIDIARIES
NOTES TO CONSOLIDATED FINANCIAL STATEMENTS
Once modified in a troubled debt restructuring, a loan is generally considered impaired until its contractual maturity. At the time of the restructuring, the loan is evaluated for an allowance for credit losses. The Bank continues to specifically reevaluate the loan in subsequent periods, regardless of the borrower’s performance under the modified terms. If a borrower subsequently defaults on the loan after it is restructured, the Bank provides an allowance for credit losses for the amount of the loan that exceeds the value of the related collateral.
The following tables present informative data regarding troubled debt restructurings as of December 31, 2019 and 2018.
Modifications as of December 31, 2019:
|
Pre-Modification |
Post-Modification |
|||||||||||
|
Number |
Outstanding |
Outstanding |
||||||||||
|
of |
Recorded |
Recorded |
||||||||||
|
Contracts |
Investment |
Investment |
||||||||||
|
(Dollars in thousands) |
||||||||||||
|
Troubled Debt Restructuring |
||||||||||||
|
Real Estate Loans: |
||||||||||||
|
1-4 family residential |
3 | $ | 235 | $ | 219 | |||||||
|
Nonfarm nonresidential |
3 | 2,411 | 2,044 | |||||||||
|
Other Loans: |
||||||||||||
|
Commercial |
6 | 5,914 | 2,755 | |||||||||
|
Consumer |
1 | 11 | 9 | |||||||||
|
Total |
13 | $ | 8,571 | $ | 5,027 | |||||||
Modifications as of December 31, 2018:
|
Pre-Modification |
Post-Modification |
|||||||||||
|
Number |
Outstanding |
Outstanding |
||||||||||
|
of |
Recorded |
Recorded |
||||||||||
|
Contracts |
Investment |
Investment |
||||||||||
|
(Dollars in thousands) |
||||||||||||
|
Troubled Debt Restructuring |
||||||||||||
|
Real Estate Loans: |
||||||||||||
|
1-4 family residential |
1 | $ | - | $ | - | |||||||
|
Nonfarm nonresidential |
3 | 2,412 | 2,308 | |||||||||
|
Other Loans: |
||||||||||||
|
Commercial |
6 | 5,914 | 3,512 | |||||||||
|
Total |
10 | $ | 8,326 | $ | 5,820 | |||||||
The Bank had $79,000 in troubled debt restructurings that subsequently defaulted during the year ended December 31, 2018 and none during the year ended December 31, 2019.
BUSINESS FIRST BANCSHARES, INC. AND SUBSIDIARIES
NOTES TO CONSOLIDATED FINANCIAL STATEMENTS
Note 8 – Premises and Equipment –
Bank premises and equipment at December 31, 2019 and 2018 consist of the following:
|
2019 |
2018 |
|||||||
|
(Dollars in thousands) |
||||||||
|
Land |
$ | 2,784 | $ | 2,984 | ||||
|
Buildings and Leasehold Improvements |
12,078 | 15,473 | ||||||
|
Furniture and Equipment |
11,862 | 9,373 | ||||||
|
Right of Use Asset |
13,242 | - | ||||||
|
Total Bank Premises and Equipment |
39,966 | 27,830 | ||||||
|
Less: Accumulated Depreciation |
(10,686 | ) | (12,716 | ) | ||||
|
Total Bank Premises and Equipment, net |
$ | 29,280 | $ | 15,114 | ||||
The provision for depreciation and amortization attributable to bank premises and equipment charged to operating expenses was $1.6 million, $1.2 million and $1.2 million for the years ended December 31, 2019, 2018 and 2017, respectively.
Note 9 - Goodwill and Other Intangible Assets –
Goodwill was acquired in acquisitions during the years ended December 31, 2018 and December 31, 2015, respectively, as a result of business combinations. The carrying amount of goodwill as of December 31, 2019 and 2018 was $48.5 million and $49.5 million, respectively. The reduction of $1.0 million in goodwill was the result of a branch sale in 2019. The $1.0 million was recognized as a reduction of the gain on sale. The Company performed the required annual goodwill impairment test as of December 31, 2019. The Company’s annual test did not indicate any impairment.
Core deposit intangibles were acquired in conjunction with the business combinations. A summary of the core deposit intangible asset as of December 31, 2019 and 2018 is as follows:
|
2019 |
2018 |
|||||||
|
(Dollars in thousands) |
||||||||
|
Gross Carrying Amount |
$ | 9,203 | $ | 2,762 | ||||
|
Acquisitions |
- | 6,441 | ||||||
|
Adjustment for Sale of Branch |
(286 | ) | - | |||||
|
Less: Accumulated Amortization |
(2,223 | ) | (1,318 | ) | ||||
|
Net Carrying Amount |
$ | 6,694 | $ | 7,885 | ||||
Amortization expense on the core deposit intangible asset totaled approximately $905,000, $559,000 and $276,000 during the years ended December 31, 2019, 2018 and 2017, respectively. The following table presents the estimated aggregate amortization expense for the periods indicated:
|
December 31, |
||||
|
(Dollars in thousands) |
||||
|
2020 |
$ | 890 | ||
|
2021 |
890 | |||
|
2022 |
890 | |||
|
2023 |
890 | |||
|
2024 |
890 | |||
|
Thereafter |
2,244 | |||
|
Total Core Deposit Intangible |
$ | 6,694 | ||
BUSINESS FIRST BANCSHARES, INC. AND SUBSIDIARIES
NOTES TO CONSOLIDATED FINANCIAL STATEMENTS
Note 10 – Deposits –
Deposit accounts at December 31, 2019 and 2018 are summarized as follows:
|
2019 |
2018 |
|||||||
|
(Dollars in thousands) |
||||||||
|
Noninterest Bearing - DDA |
$ | 398,847 | $ | 382,354 | ||||
|
Noninterest Bearing Deposits |
398,847 | 382,354 | ||||||
|
Interest Bearing - DDA |
45,058 | 40,969 | ||||||
|
NOW and Super NOW Accounts |
295,620 | 310,527 | ||||||
|
Money Market Accounts |
365,114 | 334,763 | ||||||
|
Savings Accounts |
81,915 | 94,211 | ||||||
|
Certificates of Deposit Over $250,000 |
152,859 | 160,145 | ||||||
|
Other Certificates of Deposit |
442,597 | 410,965 | ||||||
|
Interest Bearing Deposits |
1,383,163 | 1,351,580 | ||||||
|
Total Deposits |
$ | 1,782,010 | $ | 1,733,934 | ||||
Approximately 68.7% of certificates of deposit as of December 31, 2019 have stated maturity dates during 2020 and the remaining 31.3% have stated maturity dates during 2021 and beyond.
At December 31, 2019 and 2018, total deposits for the top three customer relationships was approximately $144.5 million and $146.2 million, respectively, which represented 8.1% and 8.4% of total deposits, respectively. Brokered and reciprocal deposits were approximately $100.9 million and $111.8 million at December 31, 2019 and 2018, respectively. Included in these brokered and reciprocal deposits are public fund deposits of approximately $35.4 million and $30.9 million at December 31, 2019 and 2018, respectively. Other public fund deposits were approximately $266.8 million and $263.8 million at December 31, 2019 and 2018, respectively.
BUSINESS FIRST BANCSHARES, INC. AND SUBSIDIARIES
NOTES TO CONSOLIDATED FINANCIAL STATEMENTS
Note 11 – Borrowings –
The Bank had outstanding advances from the Federal Home Loan Bank (FHLB) of $93.0 million and $55.0 million at December 31, 2019 and 2018, respectively, consisting of:
One fixed rate loan of $30.0 million at December 31, 2019 and 2018, with interest at 2.41% paid monthly. Principal is due at maturity in November 2022.
One fixed rate loan of $10.0 million at December 31, 2019, with interest at 2.14% paid monthly. Principal is due at maturity in June 2020.
One fixed rate loan of $30.0 million at December 31, 2019, with interest at 2.03% paid monthly. Principal is due at maturity in June 2022.
One fixed rate loan of $23.0 million at December 31, 2019, with interest at 1.59% paid monthly. Principal is due at maturity in June 2024.
One fixed rate loan of $25.0 million at December 31, 2018, with interest at 2.54% paid monthly. Principal was paid at maturity in June 2019.
These advances are collateralized by the Bank’s investment in Federal Home Loan Bank stock and a blanket lien on qualifying loans in the Bank’s loan portfolio consisting of performing 1-4 family mortgages and certain small business, small farm and small agriculture loans. The blanket lien totaled approximately $626.3 million at December 31, 2019 with unused availability for advances and letters of credit of approximately $330.2 million.
The Bank has outstanding lines of credit with several of its correspondent banks available to assist in the management of short-term liquidity. These agreements provide for interest based upon the federal funds rate on the outstanding balance. Total available lines of credit as of December 31, 2019 and 2018 were $126.0 million and $126.0 million, respectively. There was no balance on these lines at December 31, 2019 and 2018.
The Company has a line of credit with First National Bankers Bank (FNBB) and is allowed to borrow on a revolving basis up to $5.0 million. This line of credit, established on September 12, 2016, is secured by a pledge of and security interest in the common stock of our wholly-owned subsidiary, b1BANK. The Company did not have a balance on the line of credit at December 31, 2019 and 2018, respectively. The line of credit carries a variable interest rate equal to the Wall Street Journal Prime rate. This FNBB line was established for the purpose of repurchasing shares of our common stock from certain of our shareholders and for general corporate purposes.
In December 2018, the Company issued subordinated notes in the amount of $25.0 million. The subordinated notes bear a fixed rate of interest at 6.75% until December 31, 2028 and a floating rate thereafter through maturity in 2033. The subordinated notes were issued for the purpose of paying off the long term advance and line of credit with FNBB, for general corporate purposes and to provide Tier 2 capital. The subordinated notes are redeemable by the Company at its option beginning in 2028.
Note 12 – Securities Sold Under Agreements to Repurchase –
At December 31, 2019 and 2018, the Bank had sold various investment securities with an agreement to repurchase these securities at various times within one year. These securities generally remain under the Bank’s control and are included in securities available for sale. These pledged securities have coupon rates ranging from 1.3% to 7.0% and maturity dates ranging from 2020 to 2045. The related liability to repurchase these securities was $68.0 million and $12.2 million at December 31, 2019 and 2018, respectively.
BUSINESS FIRST BANCSHARES, INC. AND SUBSIDIARIES
NOTES TO CONSOLIDATED FINANCIAL STATEMENTS
Note 13 – Income Taxes –
The consolidated provision (credit) for income taxes consists of the following at December 31, 2019, 2018 and 2017:
|
2019 |
2018 |
2017 |
||||||||||
|
(Dollars in thousands) |
||||||||||||
|
Provision for Current Taxes - Federal |
$ | 6,416 | $ | 3,681 | $ | 977 | ||||||
|
Provision (Credit) for Deferred Taxes |
(336 | ) | (402 | ) | 1,458 | |||||||
|
Adjustment to Deferred Taxes for Enactment of 21% Federal Statutory Rate on December 22, 2017 |
- | - | 1,668 | |||||||||
|
Total Provision for Income Taxes |
$ | 6,080 | $ | 3,279 | $ | 4,103 | ||||||
The provision (credit) for federal income taxes differs from the amount computed by applying federal statutory rates to income from operations as indicated in the following analysis at December 31, 2019, 2018 and 2017:
|
2019 |
2018 |
2017 |
||||||||||
|
(Dollars in thousands) |
||||||||||||
|
Federal Statutory Income Tax |
$ | 6,269 | $ | 3,648 | $ | 3,043 | ||||||
|
Tax Exempt Income |
(556 | ) | (512 | ) | (701 | ) | ||||||
|
Adjustment to Deferred Taxes for Enactment of 21% Federal Statutory Rate on December 22, 2017 |
- | - | 1,668 | |||||||||
|
Goodwill write-off |
216 | - | - | |||||||||
|
Other - Net |
151 | 143 | 93 | |||||||||
|
Total Provision for Income Taxes |
$ | 6,080 | $ | 3,279 | $ | 4,103 | ||||||
Deferred income taxes reflect the net tax effects of temporary differences between the carrying amounts of assets and liabilities for financial reporting purposes and the amounts used for income tax purposes.
The components of the deferred tax assets (liabilities) are as follows:
|
2019 |
2018 |
|||||||
|
(Dollars in thousands) |
||||||||
|
Allowance for Loan Losses |
$ | 2,546 | $ | 2,356 | ||||
|
Acquried Loans Fair Market Value Adjustment |
743 | 1,397 | ||||||
|
Acquired Securities Difference in Basis |
43 | (241 | ) | |||||
|
Amortization of Start-Up Costs |
9 | 17 | ||||||
|
Stock Awards |
734 | 718 | ||||||
|
Depreciation |
(462 | ) | (517 | ) | ||||
|
Reserve on Unfunded Commitments |
22 | - | ||||||
|
Unrealized Loss on Securities |
(694 | ) | 922 | |||||
|
Other Real Estate |
124 | 55 | ||||||
|
Core Deposit Intangible |
(1,406 | ) | (1,656 | ) | ||||
|
Deposit Premium |
- | 67 | ||||||
|
Deferred Compensation |
571 | 548 | ||||||
|
Alternative Minimum Tax Credit |
- | 193 | ||||||
|
Branch Closures |
(115 | ) | (47 | ) | ||||
|
Net Operating Loss Carryforward |
30 | 36 | ||||||
|
Net Deferred Tax Asset |
$ | 2,145 | $ | 3,848 | ||||
BUSINESS FIRST BANCSHARES, INC. AND SUBSIDIARIES
NOTES TO CONSOLIDATED FINANCIAL STATEMENTS
The Company acquired certain deferred tax attributes and liabilities as a result of a merger during 2015, including a net operating loss (“NOL”) carryforward of $287,000 and alternative minimum tax (“AMT”) credit carryforwards of $984,000. The Company is limited in the amount it may deduct against current taxable income each year. As of December 31, 2019 the NOL carryforward was $144,000 and expires in 2033. The AMT credit carryforward was exhausted in 2019.
Note 14 – Accumulated Other Comprehensive Income (Loss) –
The following is a summary of the changes in the balances of each component of accumulated other comprehensive income (loss) for the years ended December 31, 2019 and 2018:
|
2019 |
2018 |
|||||||
|
(Dollars in thousands) |
||||||||
|
Unrealized Gains (Losses) on Securities Available for Sale: |
||||||||
|
Balance at Beginning of Year |
$ | (3,469 | ) | $ | (1,644 | ) | ||
|
Other Comprehensive Income (Loss) |
||||||||
|
Before Reclassifications - Net of Tax |
5,998 | (1,831 | ) | |||||
|
Reclassification Adjustment for Gains |
||||||||
|
Realized - Net of Tax |
84 | 6 | ||||||
|
Other Comprehensive Income (Loss) |
6,082 | (1,825 | ) | |||||
|
Balance at End of Year |
$ | 2,613 | $ | (3,469 | ) | |||
BUSINESS FIRST BANCSHARES, INC. AND SUBSIDIARIES
NOTES TO CONSOLIDATED FINANCIAL STATEMENTS
Note 15 – Shareholders’ Equity and Regulatory Matters –
Shareholders’ Equity of the Company includes the undistributed earnings of the Bank. The Company pays dividends from its assets, which are provided primarily by dividends from the Bank. Certain restrictions exist regarding the ability of the Bank to pay cash distributions. Louisiana statutes require approval to pay distributions in excess of a bank’s earnings in the current year plus retained net profits for the preceding year. The Company paid quarterly common stock dividends totaling $0.38 per share and $0.30 per share for the years ended December 31, 2019 and 2018, respectively, based upon quarterly financial performance.
Common Stock Repurchase Plan
On December 13, 2018, the Company’s board of directors approved a resolution authorizing management to repurchase shares of its common stock with an aggregate purchase price of up to $15 million from time to time, subject to certain limitations and conditions. The stock repurchase program is effective for a period of 24 months. The stock repurchase program does not obligate the Company to repurchase any shares of its common stock. The Company repurchased $2.5 million and $0 shares for the years ended December 31, 2019 and 2018, respectively.
Regulatory Matters
The Company and the Bank are subject to various regulatory capital requirements administered by federal and state banking agencies. Failure to meet minimum regulatory capital requirements can initiate certain mandatory, and possible additional discretionary actions by regulators that, if undertaken, could have a direct material effect on the Company’s and the Bank’s financial statements.
Under the regulatory capital adequacy guidelines and the regulatory framework for prompt corrective action, the Company and the Bank must meet specific capital guidelines involving quantitative measures of assets, liabilities and certain off-balance-sheet items as calculated under regulatory accounting practices. The capital amounts and classification under the prompt corrective action guidelines are also subject to qualitative judgments by the regulators about components, risk weightings and other factors. Prompt corrective action provisions are not applicable to bank holding companies.
Quantitative measures established by regulation to ensure capital adequacy require the Company and the Bank to maintain minimum amounts and ratios. As detailed below, as of December 31, 2019 and 2018, the Bank met all of the capital adequacy requirements to which it is subject.
As of December 31, 2019 and 2018, the Bank was categorized as well capitalized under the regulatory framework for prompt corrective action. To maintain categorized as well capitalized, the Bank will have to maintain minimum total capital, Tier I capital, risk-based common equity Tier I, and Tier I leverage ratios as disclosed in the table below. There are no conditions or events since the most recent notification that management believes have changed the prompt corrective action category.
The following is a summary of the Company’s (consolidated) and the Bank’s actual capital amounts and ratios at December 31, 2019 and 2018.
BUSINESS FIRST BANCSHARES, INC. AND SUBSIDIARIES
NOTES TO CONSOLIDATED FINANCIAL STATEMENTS
|
To Be Well |
||||||||||||||||||||||||
|
Capitalized Under |
||||||||||||||||||||||||
|
For Capital |
Prompt Corrective |
|||||||||||||||||||||||
|
Business First Bancshares, Inc. (Consolidated) |
Actual |
Adequacy Purposes |
Action Provisions |
|||||||||||||||||||||
|
Amount |
Ratio |
Amount |
Ratio |
Amount |
Ratio |
|||||||||||||||||||
|
|
(Dollars in thousands) |
|||||||||||||||||||||||
| December 31, 2019: | ||||||||||||||||||||||||
|
Total Capital (to Risk-Weighted Assets) |
$ | 264,495 | 13.30 | % | $ | 159,120 | 8.00 | % | N/A | N/A | ||||||||||||||
|
Tier I Capital (to Risk-Weighted Assets) |
$ | 227,265 | 11.43 | % | $ | 119,340 | 6.00 | % | N/A | N/A | ||||||||||||||
|
Common Equity Tier 1 Capital (to Risk-Weighted Assets) |
$ | 227,265 | 11.43 | % | $ | 89,505 | 4.50 | % | N/A | N/A | ||||||||||||||
|
Tier I Leveraged Capital (to Average Assets) |
$ | 227,265 | 10.56 | % | $ | 86,058 | 4.00 | % | N/A | N/A | ||||||||||||||
|
December 31, 2018: |
||||||||||||||||||||||||
|
Total Capital (to Risk-Weighted Assets) |
$ | 242,144 | 13.91 | % | $ | 139,237 | 8.00 | % | N/A | N/A | ||||||||||||||
|
Tier I Capital (to Risk-Weighted Assets) |
$ | 205,924 | 11.83 | % | $ | 104,428 | 6.00 | % | N/A | N/A | ||||||||||||||
|
Common Equity Tier 1 Capital (to Risk-Weighted Assets) |
$ | 205,924 | 11.83 | % | $ | 78,321 | 4.50 | % | N/A | N/A | ||||||||||||||
|
Tier I Leveraged Capital (to Average Assets) |
$ | 205,924 | 11.66 | % | $ | 70,641 | 4.00 | % | N/A | N/A | ||||||||||||||
|
To Be Well |
||||||||||||||||||||||||
|
Capitalized Under |
||||||||||||||||||||||||
|
For Capital |
Prompt Corrective |
|||||||||||||||||||||||
|
b1BANK |
Actual |
Adequacy Purposes |
Action Provisions |
|||||||||||||||||||||
|
Amount |
Ratio |
Amount |
Ratio |
Amount |
Ratio |
|||||||||||||||||||
|
|
(Dollars in thousands) |
|||||||||||||||||||||||
| December 31, 2019: | ||||||||||||||||||||||||
|
Total Capital (to Risk-Weighted Assets) |
$ | 254,520 | 12.80 | % | $ | 159,033 | 8.00 | % | $ | 198,791 | 10.00 | % | ||||||||||||
|
Tier I Capital (to Risk-Weighted Assets) |
$ | 242,290 | 12.19 | % | $ | 119,275 | 6.00 | % | $ | 159,033 | 8.00 | % | ||||||||||||
|
Common Equity Tier 1 Capital (to Risk-Weighted Assets) |
$ | 242,290 | 12.19 | % | $ | 89,456 | 4.50 | % | $ | 129,214 | 6.50 | % | ||||||||||||
|
Tier I Leveraged Capital (to Average Assets) |
$ | 242,290 | 11.27 | % | $ | 86,015 | 4.00 | % | $ | 107,518 | 5.00 | % | ||||||||||||
|
December 31, 2018: |
||||||||||||||||||||||||
|
Total Capital (to Risk-Weighted Assets) |
$ | 224,356 | 12.90 | % | $ | 139,126 | 8.00 | % | $ | 173,908 | 10.00 | % | ||||||||||||
|
Tier I Capital (to Risk-Weighted Assets) |
$ | 213,136 | 12.26 | % | $ | 104,345 | 6.00 | % | $ | 139,126 | 8.00 | % | ||||||||||||
|
Common Equity Tier 1 Capital (to Risk-Weighted Assets) |
$ | 213,136 | 12.26 | % | $ | 78,259 | 4.50 | % | $ | 113,040 | 6.50 | % | ||||||||||||
|
Tier I Leveraged Capital (to Average Assets) |
$ | 213,136 | 12.08 | % | $ | 70,592 | 4.00 | % | $ | 88,241 | 5.00 | % | ||||||||||||
BUSINESS FIRST BANCSHARES, INC. AND SUBSIDIARIES
NOTES TO CONSOLIDATED FINANCIAL STATEMENTS
Note 16 – Stock Based Compensation –
Equity Incentive Plan
The Company previously granted options to its employees under its 2006 Stock Option Plan which expired on December 22, 2016. On June 29, 2017, the Company’s shareholders approved its 2017 Equity Incentive Plan (the “Plan”). The Plan provides for the grant of various types of equity grants and awards, including incentive stock options, nonstatutory stock options, stock appreciation rights, restricted stock, restricted stock units, performance units, performance shares and other stock-based awards to eligible participants, which includes the Company’s employees, directors and consultants. The Plan has reserved 500,000 shares of common stock for grant, award or issuance to eligible participants, all of which may be subject to incentive stock option treatment. The Plan is administered by the Compensation Committee of the Company’s Board of Directors, which determines, within the provisions of the Plan, those eligible participants to whom, and the times at which, grants and awards will be made. As of December 31, 2019, 93,525 awards have been granted under the Plan, and 406,475 shares of common stock remain available for grant.
Restricted Stock Awards
The Company issues restricted stock under various plans for certain officers and other key employees. The restricted stock awards may not be sold or otherwise transferred until certain restrictions have lapsed. The holders of the restricted stock receive dividends and have full voting rights with respect to those shares as of the date of grant. The compensation expense for these awards is determined based upon the market value of the Company’s common stock at the grant date applied to the total number of shares awarded and is recognized over the requisite service period.
During the years ended December 31, 2019, 2018 and 2017, the Company issued shares of restricted stock which vest in three equal installments over the requisite service period. For the years ended December 31, 2019, 2018 and 2017, respectively, the Company recognized $1.0 million, $766,000 and $129,000 in compensation costs related to restricted stock awards. At December 31, 2019, 2018 and 2017, respectively, unrecognized share-based compensation associated with these awards totaled $1.7 million, $1.1 million and $92,000. The $1.7 million of unrecognized share-based compensation at December 31, 2019 is expected to be recognized over a weighted average period of 1.9 years.
The table below summarizes the restricted stock award activity for the period presented.
|
Year Ended December 31, 2019 |
Year Ended December 31, 2018 |
Year Ended December 31, 2017 |
||||||||||||||||||||||
|
Weighted Average |
Weighted Average |
Weighted Average |
||||||||||||||||||||||
|
Shares |
Grant Date Fair Value |
Shares |
Grant Date Fair Value |
Shares |
Grant Date Fair Value |
|||||||||||||||||||
|
Balance, at Beginning of Period |
31,002 | $ | 19.58 | 8,662 | $ | 17.00 | - | $ | - | |||||||||||||||
|
Granted |
39,994 | 23.96 | 39,789 | 20.00 | 12,981 | 17.00 | ||||||||||||||||||
|
Forfeited |
(530 | ) | 19.47 | - | - | - | - | |||||||||||||||||
|
Earned and Issued |
(30,495 | ) | 21.31 | (17,449 | ) | 19.26 | (4,319 | ) | 17.00 | |||||||||||||||
|
Balance, at End of Period |
39,971 | $ | 22.64 | 31,002 | $ | 19.58 | 8,662 | $ | 17.00 | |||||||||||||||
Stock Grants
During the years ended December 31, 2019 and 2018, the Company issued a total of 4,440 shares and 3,750 shares of common stock, respectively, to non-employee directors as compensation for their board service. The shares were issued with weighted average grant date fair values of $23.96 per share for the year ended December 31, 2019 and $20.00 per share for the year ended December 31, 2018. During the year ended December 31, 2018, the Company issued 5,552 shares to employees (the shares vested immediately upon issuance) at a weighted average grant date fair value of $25.16 per share. The total stock-based compensation expense was determined based upon the market value of the Company’s common stock at the grant date applied to the total number of shares granted. Included in the grants is director fees expense for the year ended December 31, 2019 of $197,000, and director fees expense and compensation expense of $75,000 and $140,000, respectively, during the year ended December 31, 2018.
BUSINESS FIRST BANCSHARES, INC. AND SUBSIDIARIES
NOTES TO CONSOLIDATED FINANCIAL STATEMENTS
Stock Warrants
In connection with the organization of the Company and the Bank, stock warrants were issued to organizers. The warrants were exercisable by their holders for the purchase of 101,000 shares of common stock of the Company at the exercise price of $10 per share (warrant). All warrants were exercised prior to expiration during the year ended December 31, 2019. The warrants held an intrinsic value of $1.1 million upon exercise.
At December 31, 2018, warrants for 87,625 shares at a weighted average exercise price of $10.00 were outstanding. At December 31, 2018, all of the 87,625 outstanding warrants were vested and there was no unrecognized compensation expense. An amendment effective February 1, 2016 extended the exercise period to February 2, 2019 and retained the $10 per share exercise price with $48,000 of compensation cost recognized on the effective date of this amendment. As a result, in compliance with Section 409A of the Internal Revenue Code of 1986, as amended, the “optionality” of the warrants was eliminated thereby restricting the situations in which the warrants can be exercised to occur upon the earlier of (i) immediately prior to the February 2, 2019 expiration date, (ii) a change in control of the Company or the Bank, (iii) the warrant holder’s death, (iv) the warrant holder becoming disabled, and (v) the warrant holder incurring a separation from the Company or the Bank (if the warrant holder is an employee of the Company or the Bank).
Using the Black-Scholes pricing model for the 87,625 shares (warrants) outstanding, the calculated value of $2.50 per share (warrant) was estimated on the date of grant using the following assumptions: expected dividends of 1%, expected life or term of 6.5 years, risk-free interest rate of 5.04%, and expected volatility of 13.19%. The expected volatility was estimated considering the historical volatility of an appropriate industry sector.
Stock Options
In 2006, the Company established a stock option plan with 1,500,000 shares available to be granted as options under the plan. Under the provisions of the plan, the option price cannot be less than the fair value of the underlying common stock as of the option grant date, and the maximum option term cannot exceed ten years. The 2006 Stock Option Plan expired on December 22, 2016 and the Company is no longer permitted to issue additional stock options under this plan.
Compensation expense recognized as a result of vesting was approximately $77,000, $119,000 and $207,000 for the years ended December 31, 2019, 2018 and 2017, respectively.
The Company uses the Black-Scholes option pricing model to estimate the calculated value of the various share-based awards for the year ended December 31, 2016. There were no share-based awards for the years ended December 31, 2019 and 2018, respectively, since the Plan expired December 22, 2016.
The following is an analysis of the activity related to the stock options:
|
Years Ended December 31, |
||||||||||||||||||||||||
|
2019 |
2018 |
2017 |
||||||||||||||||||||||
|
Number of |
Weighted Average |
Number of |
Weighted Average |
Number of |
Weighted Average |
|||||||||||||||||||
|
Options |
Exercise Price |
Options |
Exercise Price |
Options |
Exercise Price |
|||||||||||||||||||
|
Outstanding Options, at Beginning of Period |
780,080 | $ | 12.74 | 831,080 | $ | 12.73 | 998,480 | $ | 12.82 | |||||||||||||||
|
Granted |
- | - | - | - | - | - | ||||||||||||||||||
|
Exercised |
(54,780 | ) | 15.28 | (49,000 | ) | 12.42 | - | - | ||||||||||||||||
|
Forfeited or Expired |
- | - | (2,000 | ) | 17.11 | (167,400 | ) | 13.25 | ||||||||||||||||
|
Outstanding Options, at End of Period |
725,300 | $ | 12.55 | 780,080 | $ | 12.74 | 831,080 | $ | 12.73 | |||||||||||||||
|
Exercisable, at End of Period |
724,300 | $ | 12.55 | 761,747 | $ | 12.64 | 784,698 | $ | 12.49 | |||||||||||||||
At December 31, 2019, options for 724,300 shares at a weighted average exercise price of $12.55 were vested and exercisable, and there were 1,000 nonvested options and approximately $5,000 of unrecognized compensation costs related to these options which is expected to be recognized over a period of one year. The aggregate intrinsic value of both exercisable and outstanding awards at December 31, 2019 is $9.0 million with a weighted average remaining contractual life of 1.4 years.
BUSINESS FIRST BANCSHARES, INC. AND SUBSIDIARIES
NOTES TO CONSOLIDATED FINANCIAL STATEMENTS
In December 2017, option agreements for 105,250 options that were fully vested and set to expire in December 2017 were amended to extend the expiration date to January 15, 2021, with compensation cost of $63,000 recognized on the effective date of the amendments. In December 2016, option agreements for 330,000 options that were fully vested and set to expire in December 2016 were amended to extend the expiration date to January 15, 2020, with compensation cost of $168,000 recognized on the effective date of the amendments. Since these amendments extended the exercise period and retained the original per share exercise price, the “optionality” was eliminated in compliance with Section 409A of the Internal Revenue Code of 1986, as amended, thereby restricting the situations in which the options can be exercised to occur upon the earlier of (i) immediately prior to the expiration date, (ii) a change in control of the Company or the Bank, (iii) the option holder’s death, (iv) the option holder becoming disabled, and (v) the option holder incurring a separation from the Company or the Bank (if the option holder is an employee of the Company or the Bank).
Note 17 – Employee Benefit Plans –
Defined Contribution Plan
The Bank has a defined contribution plan qualified under Internal Revenue Code 401(K) for those employees who meet the eligibility requirements. Contributions may be made by eligible employees subject to Internal Revenue Service limits. The Bank contributes a matching contribution up to 4% of wages which totaled $967,000, $690,000 and $542,000 and is included in salaries and employee benefits for the years ended December 31, 2019, 2018 and 2017, respectively.
Deferred Compensation
The Company has established certain unfunded nonqualified deferred compensation agreements for the purpose of providing deferred compensation as retirement benefits for a select group of management. At December 31, 2019 and 2018, the Company had recorded accrued liabilities of $2.5 million and $2.4 million, respectively. The expense related to the deferred compensation agreements was $256,000, $224,000 and $209,000 for the years ended December 31, 2019, 2018 and 2017, respectively.
Note 18 – Other Expenses –
An analysis of Other Expenses is as follows for the years ended December 31, 2019, 2018 and 2017:
|
2019 |
2018 |
2017 |
||||||||||
|
(Dollars in thousands) |
||||||||||||
|
Business Development |
$ | 1,535 | $ | 1,239 | $ | 1,193 | ||||||
|
Communications |
1,063 | 885 | 830 | |||||||||
|
Ad Valorem Shares Tax |
1,423 | 1,135 | 804 | |||||||||
|
Data Processing Fees |
2,049 | 1,557 | 1,537 | |||||||||
|
Directors' Fees |
570 | 436 | 400 | |||||||||
|
Insurance |
347 | 256 | 283 | |||||||||
|
Legal and Professional Fees |
1,319 | 1,695 | 1,159 | |||||||||
|
Office Supplies and Printing |
670 | 578 | 421 | |||||||||
|
Regulatory Assessments |
389 | 1,359 | 904 | |||||||||
|
Taxes and Licenses |
88 | 201 | 11 | |||||||||
|
Merger and Conversion Costs |
330 | 3,024 | 129 | |||||||||
|
Other |
5,911 | 4,156 | 2,829 | |||||||||
|
Total Other Expenses |
$ | 15,694 | $ | 16,521 | $ | 10,500 | ||||||
Note 19 – Financial Instruments with Off-Balance-Sheet Risk –
In the normal course of business, the Bank is a party to financial instruments with off-balance-sheet risk to meet the financing needs of its customers. These financial instruments include commitments to extend credit and standby and commercial letters of credit which are not included in the accompanying financial statements. These instruments involve, to varying degrees, elements of credit risk in excess of the amount recognized in the balance sheet.
BUSINESS FIRST BANCSHARES, INC. AND SUBSIDIARIES
NOTES TO CONSOLIDATED FINANCIAL STATEMENTS
The Bank’s exposure to credit loss in the event of nonperformance by the other party to the financial instrument for commitments to extend credit and standby and commercial letters of credit is represented by the contractual amount of those instruments. The Bank’s policy for obtaining collateral, and the nature of such collateral, is essentially the same as that involved in making commitments to extend credit. The Bank uses the same credit policies in making such commitments and conditional obligations as it does for instruments that are included in the balance sheet. In the normal course of business, the Bank has made commitments to extend credit of approximately $389.9 million and standby and commercial letters of credit of approximately $24.4 million at December 31, 2019.
Note 20 – Concentrations of Credit –
The majority of the Bank’s business activities are with customers in the Bank’s market area, which consists primarily of East and West Baton Rouge, Bossier, Caddo, St. Tammany, Lafayette, Calcasieu, Terrebonne, Jefferson, Webster, Richland and adjacent parishes, and the Dallas, Texas area. The majority of such customers are depositors of the Bank. The concentrations of credit by type of loan are shown in Note 7. The Bank, as a matter of policy, does not extend credit to any single borrower or group of related borrowers in excess of the Bank’s legal lending limits. Most of the Bank’s credits are to individuals and businesses secured by real estate. A substantial portion of their ability to pay on their debt is dependent on the local economy and industries in the areas.
Within the loan portfolio, the Bank has a concentration of credits secured by real estate. The Bank had extended credit secured by non-farm non-residential real estate totaling approximately $612.6 million and $518.7 million, which accounted for 35.8% and 33.9% of total loans held for investment at December 31, 2019 and 2018, respectively. Additionally, the Bank had extended credit secured by construction and land development totaling approximately $244.2 million and $211.1 million, respectively; these loans represented 14.3% and 13.8% of total loans held for investment at December 31, 2019 and 2018, respectively.
The Bank maintains amounts on deposit and federal funds sold with correspondent banks which may periodically exceed the federally insured amount.
Note 21 – Leases –
The Bank leases certain branch offices through non-cancelable operating leases with terms that range from one to ten years and contain various renewal options for certain of the leases. Certain leases provide for increases in minimum monthly rental payments as defined by the lease agreement. Rental expense under these agreements was $2.9 million, $2.5 million and $1.8 million for the years ended December 31, 2019, 2018 and 2017, respectively. At December 31, 2019, the Company had a weighted average lease term of 8.3 years and a weighted average discount rate of 3.10%.
Future minimum lease payments under these leases are as follows:
|
December 31, |
||||
|
(Dollars in thousands) |
||||
|
2020 |
$ | 2,200 | ||
|
2021 |
1,990 | |||
|
2022 |
1,809 | |||
|
2023 |
1,701 | |||
|
2024 and Thereafter |
7,341 | |||
|
Total Future Minimum Lease Payments |
15,041 | |||
|
Less Imputed Interest |
(1,799 | ) | ||
|
Present Value of Lease Liabilities |
$ | 13,242 | ||
BUSINESS FIRST BANCSHARES, INC. AND SUBSIDIARIES
NOTES TO CONSOLIDATED FINANCIAL STATEMENTS
Note 22 – Commitments –
SBIC Capital Commitment
The SBIC is a program initiated by the Small Business Administration (SBA) in 1958 to assist in the funding of small business loans. The program is a joint venture between investors with venture capital, the SBA, and small business borrowers. Investors are responsible for funding the first portion of the capital requirements, with the remaining requirement being funded by the SBA. The funds are then lent to small business borrowers.
The Bank has agreed to participate as an investor with McLarty Capital Partners SBIC, L.P. (McLarty), McLarty Capital Partners SBIC II, L.P. (McLarty II), Bluehenge Capital Secured Debt SBIC, L.P. (Bluehenge) and New Louisiana Angel Fund 2, LLC (New Louisiana); details of these commitments at December 31, 2019 are below.
|
McLarty |
McLarty II |
Bluehenge |
New Louisiana |
|||||||||||||
|
(Dollars in thousands) |
||||||||||||||||
|
Total Capital Commitment |
$ | 2,000 | $ | 2,500 | $ | 1,500 | $ | 50 | ||||||||
|
Capital Called |
$ | 1,802 | $ | 2,004 | $ | 1,387 | $ | 13 | ||||||||
|
Remaining Unfunded Capital Commitment |
$ | 198 | $ | 496 | $ | 113 | $ | 37 | ||||||||
Federal Home Loan Bank Letters of Credit
The Bank had outstanding letters of credit on behalf of others from the FHLB of $203.1 million and $137.3 million at December 31, 2019 and 2018, respectively. The outstanding letters of credit as of December 31, 2019 are as follows:
Three letters of credit totaling $30.1 million expires in January 2020.
One letter of credit of $19.0 million expires in February 2020.
Six letters of credit totaling $133.0 million expires in March 2020.
Three letters of credit totaling $7.7 million expires in April 2020.
One letter of credit of $157,000 expires in August 2020.
One letter of credit of $100,000 expires in October 2020.
One letter of credit of $197,000 expires in November 2020.
Two letters of credit totaling $1.3 million expires in December 2020.
One letter of credit of $11.5 million expires in January 2022.
Note 23 – Related Party Transactions –
In the ordinary course of business, the Bank has granted loans to directors, officers and their affiliates. Such loans were made on substantially the same terms as those prevailing at the time for comparable transactions with other customers. Such loans amounted to $24.6 million and $27.4 million at December 31, 2019 and 2018, respectively.
The activity in loans to directors, officers and their affiliates is as follows:
|
2019 |
2018 |
|||||||
|
(Dollars in thousands) |
||||||||
|
Balance - Beginning of Year |
$ | 27,359 | $ | 24,047 | ||||
|
New Loans |
13,767 | 13,478 | ||||||
|
Repayments |
(16,562 | ) | (10,166 | ) | ||||
|
Balance - End of Year |
$ | 24,564 | $ | 27,359 | ||||
Related party deposits totaled $34.4 million and $35.5 million as of December 31, 2019 and 2018, respectively.
BUSINESS FIRST BANCSHARES, INC. AND SUBSIDIARIES
NOTES TO CONSOLIDATED FINANCIAL STATEMENTS
Note 24 – Fair Value of Financial Instruments –
Fair Value Disclosures
The Company groups its financial assets and liabilities measured at fair value in three levels. Fair value should be based on the assumptions market participants would use when pricing the asset or liability and establishes a fair value hierarchy that prioritizes the inputs used to develop those assumptions and measure fair value. The hierarchy requires companies to maximize the use of observable inputs and minimize the use of unobservable inputs. The three levels of inputs used to measure fair value are as follows:
|
● |
Level 1 – Includes the most reliable sources, and includes quoted prices in active markets for identical assets or liabilities. |
|
● |
Level 2 – Includes observable inputs. Observable inputs include inputs other than quoted prices that are observable for the asset or liability (for example, interest rates and yield curves at commonly quoted intervals, volatilities, prepayment speeds, loss severities, credit risks, and default rates) as well as inputs that are derived principally from or corroborated by observable market data by correlation or other means (market-corroborated inputs). |
|
● |
Level 3 – Includes unobservable inputs and should be used only when observable inputs are unavailable. |
Recurring Basis
Fair values of investment securities available for sale were primarily measured using information from a third-party pricing service. This pricing service provides information by utilizing evaluated pricing models supported with market data information. Standard inputs include benchmark yields, reported trades, broker/dealer quotes, issuer spreads, benchmark securities, bids, offers, and reference data from market research publications.
The fair values of mortgage loans held for sale are based on commitments on hand from investors within the secondary market for loans with similar characteristics.
The following tables present the balance of assets and liabilities measured on a recurring basis as of December 31, 2019 and 2018. The Company did not record any liabilities at fair value for which measurement of the fair value was made on a recurring basis.
|
Fair Value |
Level 1 |
Level 2 |
Level 3 |
|||||||||||||
|
(Dollars in thousands) |
||||||||||||||||
|
December 31, 2019 |
||||||||||||||||
|
Available for Sale: |
||||||||||||||||
|
U.S. Government Agency Securities |
$ | 15,937 | $ | - | $ | 15,937 | $ | - | ||||||||
|
Corporate Securities |
23,714 | - | 23,714 | - | ||||||||||||
|
Mortgage-Backed Securities |
139,459 | - | 139,459 | - | ||||||||||||
|
Municipal Securities |
99,083 | - | 92,496 | 6,587 | ||||||||||||
|
Mortgage Loans Held for Sale |
251 | - | 251 | - | ||||||||||||
|
Total |
$ | 278,444 | $ | - | $ | 271,857 | $ | 6,587 | ||||||||
|
December 31, 2018 |
||||||||||||||||
|
Available for Sale: |
||||||||||||||||
|
U.S. Government Agency Securities |
$ | 17,439 | $ | - | $ | 17,439 | $ | - | ||||||||
|
Corporate Securities |
12,692 | - | 12,692 | - | ||||||||||||
|
Mortgage-Backed Securities |
165,618 | - | 165,618 | - | ||||||||||||
|
Municipal Securities |
113,767 | - | 105,383 | 8,384 | ||||||||||||
|
Mortgage Loans Held for Sale |
58 | - | 58 | - | ||||||||||||
|
Total |
$ | 309,574 | $ | - | $ | 301,190 | $ | 8,384 | ||||||||
BUSINESS FIRST BANCSHARES, INC. AND SUBSIDIARIES
NOTES TO CONSOLIDATED FINANCIAL STATEMENTS
Nonrecurring Basis
The Company has segregated all financial assets and liabilities that are measured at fair value on a nonrecurring basis into the most appropriate level within the fair value hierarchy based on the inputs used to determine the fair value at the measurement date in the table below. The Company did not record any liabilities at fair value for which measurement of the fair value was made on a nonrecurring basis.
The fair value of the impaired loans is measured at the fair value of the collateral for collateral-dependent loans. Impaired loans are Level 2 assets measured using appraisals from external parties of the collateral less any prior liens. Repossessed assets are initially recorded at fair value less estimated cost to sell. The fair value of repossessed assets is based on property appraisals and an analysis of similar properties available. As such, the Bank records repossessed assets as Level 2.
|
Fair Value |
Level 1 |
Level 2 |
Level 3 |
|||||||||||||
|
(Dollars in thousands) |
||||||||||||||||
|
December 31, 2019 |
||||||||||||||||
|
Assets: |
||||||||||||||||
|
Impaired Loans |
$ | 15,876 | $ | - | $ | 15,876 | $ | - | ||||||||
|
Repossessed Assets |
4,196 | - | 4,196 | - | ||||||||||||
|
Total |
$ | 20,072 | $ | - | $ | 20,072 | $ | - | ||||||||
|
December 31, 2018 |
||||||||||||||||
|
Assets: |
||||||||||||||||
|
Impaired Loans |
$ | 21,557 | $ | - | $ | 21,557 | $ | - | ||||||||
|
Repossessed Assets |
1,920 | - | 1,920 | - | ||||||||||||
|
Total |
$ | 23,477 | $ | - | $ | 23,477 | $ | - | ||||||||
Fair Value Financial Instruments
The fair value of a financial instrument is the current amount that would be exchanged between willing parties, other than in a forced liquidation. Fair value is best determined based upon quoted market prices. However, in many instances, there are no quoted market prices for the Company’s various financial instruments. In cases where quoted market prices are not available, fair values are based on estimates using present value or other valuation techniques. Those techniques are significantly affected by the assumptions used, including the discount rate and estimates of future cash flows. Accordingly, the fair value estimates may not be realized in an immediate settlement of the instrument. In accordance with generally accepted accounting principles, certain financial instruments and all non-financial instruments are excluded from these disclosure requirements. Accordingly, the aggregate fair value amounts presented may not necessarily represent the underlying fair value of the Company.
The following methods and assumptions were used to estimate the fair value of each class of financial instruments for which it is practicable to estimate that value:
Cash and Short-Term Investments – For those short-term instruments, the carrying amount is a reasonable estimate of fair value.
Securities – Fair value of securities is based on quoted market prices. If a quoted market price is not available, fair value is estimated using quoted market prices for similar securities.
Loans – The fair value for loans is estimated using discounted cash flow analyses, with interest rates currently being offered for similar loans to borrowers with similar credit rates. Loans with similar classifications are aggregated for purposes of the calculations. The allowance for loan losses, which was used to measure the credit risk, is subtracted from loans.
Cash Value of Bank-Owned Life Insurance (BOLI) – The carrying amount approximates its fair value.
Other Equity Securities – The carrying amount approximates its fair value.
BUSINESS FIRST BANCSHARES, INC. AND SUBSIDIARIES
NOTES TO CONSOLIDATED FINANCIAL STATEMENTS
Deposits – The fair value of demand deposits and certain money market deposits is the amount payable at the reporting date. The fair value of fixed-maturity certificates of deposit is estimated using discounted cash flow analyses, with interest rates currently offered for deposits of similar remaining maturities.
Borrowings – The fair value of FHLB advances and other long-term borrowings is estimated using the rates currently offered for advances of similar maturities. The carrying amount of short-term borrowings maturing within ninety days approximates the fair value.
Commitments to Extend Credit and Standby and Commercial Letters of Credit – The fair values of commitments to extend credit and standby and commercial letters of credit do not differ significantly from the commitment amount and are therefore omitted from this disclosure.
The estimated approximate fair values of the Bank’s financial instruments as of December 31, 2019 and 2018 are as follows:
|
Carrying |
Total |
|||||||||||||||||||
|
Amount |
Fair Value |
Level 1 |
Level 2 |
Level 3 |
||||||||||||||||
|
(Dollars in thousands) |
||||||||||||||||||||
|
December 31, 2019 |
||||||||||||||||||||
|
Financial Assets: |
||||||||||||||||||||
|
Cash and Short-Term Investments |
$ | 150,743 | $ | 150,743 | $ | 150,743 | $ | - | $ | - | ||||||||||
|
Securities |
278,193 | 278,193 | - | 271,606 | 6,587 | |||||||||||||||
|
Mortgage Loans Held for Sale |
251 | 251 | - | 251 | - | |||||||||||||||
|
Loans - Net |
1,698,141 | 1,696,470 | - | - | 1,696,470 | |||||||||||||||
|
Cash Value of BOLI |
32,568 | 32,568 | - | 32,568 | - | |||||||||||||||
|
Other Equity Securities |
12,565 | 12,565 | - | - | 12,565 | |||||||||||||||
|
Total |
$ | 2,172,461 | $ | 2,170,790 | $ | 150,743 | $ | 304,425 | $ | 1,715,622 | ||||||||||
|
Financial Liabilities: |
||||||||||||||||||||
|
Deposits |
$ | 1,782,010 | $ | 1,782,692 | $ | - | $ | - | $ | 1,782,692 | ||||||||||
|
Borrowings |
185,989 | 202,863 | - | 202,863 | - | |||||||||||||||
|
Total |
$ | 1,967,999 | $ | 1,985,555 | $ | - | $ | 202,863 | $ | 1,782,692 | ||||||||||
|
December 31, 2018 |
||||||||||||||||||||
|
Financial Assets: |
||||||||||||||||||||
|
Cash and Short-Term Investments |
$ | 137,908 | $ | 137,908 | $ | 137,908 | $ | - | $ | - | ||||||||||
|
Securities |
309,516 | 309,516 | - | 301,132 | 8,384 | |||||||||||||||
|
Mortgage Loans Held for Sale |
58 | 58 | - | 58 | - | |||||||||||||||
|
Loans - Net |
1,517,249 | 1,495,454 | - | - | 1,495,454 | |||||||||||||||
|
Cash Value of BOLI |
31,882 | 31,882 | - | 31,882 | - | |||||||||||||||
|
Other Equity Securities |
9,282 | 9,282 | - | - | 9,282 | |||||||||||||||
|
Total |
$ | 2,005,895 | $ | 1,984,100 | $ | 137,908 | $ | 333,072 | $ | 1,513,120 | ||||||||||
|
Financial Liabilities: |
||||||||||||||||||||
|
Deposits |
$ | 1,733,934 | $ | 1,717,698 | $ | - | $ | - | $ | 1,717,698 | ||||||||||
|
Borrowings |
92,229 | 104,930 | - | 104,930 | - | |||||||||||||||
|
Total |
$ | 1,826,163 | $ | 1,822,628 | $ | - | $ | 104,930 | $ | 1,717,698 | ||||||||||
BUSINESS FIRST BANCSHARES, INC. AND SUBSIDIARIES
NOTES TO CONSOLIDATED FINANCIAL STATEMENTS
Note 25 – Litigation and Contingencies –
In the normal course of business, the Bank is involved in various legal proceedings. In the opinion of management and counsel, the disposition or ultimate resolution of such proceedings would not have a material adverse effect on the Bank’s financial statements.
Note 26 – Subsequent Events –
On January 22, 2020, the Company entered into an agreement and plan of reorganization with Pedestal Bancshares, Inc. headquartered in Houma, Louisiana.
Note 27 – Financial Statements – Parent Company Only –
The balance sheets and statements of income for Business First Bancshares, Inc. (Parent Company) are as follows:
BALANCE SHEETS
AS OF DECEMBER 31, 2019 AND 2018
(Dollars in thousands)
|
2019 |
2018 |
|||||||
|
Assets: |
||||||||
|
Cash |
$ | 6,154 | $ | 14,643 | ||||
|
Investment in Subsidiaries |
300,122 | 267,270 | ||||||
|
Other Assets |
3,843 | 3,217 | ||||||
|
Total Assets |
$ | 310,119 | $ | 285,130 | ||||
|
Liabilities: |
||||||||
|
Accrued Interest Payable |
22 | 69 | ||||||
|
Subordinated Debt |
25,000 | 25,000 | ||||||
|
Other Liabilities |
- | 3 | ||||||
|
Total Liabilities |
25,022 | 25,072 | ||||||
|
Shareholders' Equity: |
||||||||
|
Common Stock |
13,279 | 13,213 | ||||||
|
Additional Paid-in Capital |
212,505 | 212,332 | ||||||
|
Retained Earnings |
56,700 | 37,982 | ||||||
|
Accumulated Other Comprehensive Income (Loss) |
2,613 | (3,469 | ) | |||||
|
Total Shareholders' Equity |
285,097 | 260,058 | ||||||
|
Total Liabilities and Shareholders' Equity |
$ | 310,119 | $ | 285,130 | ||||
BUSINESS FIRST BANCSHARES, INC. AND SUBSIDIARIES
NOTES TO CONSOLIDATED FINANCIAL STATEMENTS
STATEMENTS OF INCOME
FOR THE YEARS ENDED DECEMBER 31, 2019, 2018 AND 2017
(Dollars in thousands)
|
2019 |
2018 |
2017 |
||||||||||
|
Income: |
||||||||||||
|
Interest Income |
$ | 45 | $ | 46 | $ | - | ||||||
|
Expenses: |
||||||||||||
|
Interest Expense |
1,688 | 237 | 155 | |||||||||
|
Other Operating Expenses |
2,138 | 3,275 | 544 | |||||||||
|
Income (Loss) before Income Taxes and Equity in Undistributed Net Income of Subsidiaries |
(3,781 | ) | (3,466 | ) | (699 | ) | ||||||
|
Income Tax Expense (Benefit) |
(783 | ) | (623 | ) | 233 | |||||||
|
Income (Loss) before Equity in Undistributed Net Income of Subsidiaries |
(2,998 | ) | (2,843 | ) | (932 | ) | ||||||
|
Equity in Undistributed Net Income of Subsidiaries |
26,770 | 16,934 | 5,780 | |||||||||
|
Net Income |
$ | 23,772 | $ | 14,091 | $ | 4,848 | ||||||
ITEM 9. Changes In and Disagreements with Accountants on Accounting and Financial Disclosures.
Not applicable.
ITEM 9A. Controls and Procedures.
Disclosure Controls and Procedures
Our management, including our principal executive officer and our principal financial officer, conducted an evaluation of the effectiveness of our disclosure controls and procedures (as defined in Rules 13a-15(e) and 15d-15(e) under the Exchange Act) as of December 31, 2019. Our disclosure controls and procedures are designed to ensure that information required to be disclosed by us in the reports that we file or submit under the Exchange Act is recorded, processed, summarized, and reported within the time periods specified in the SEC’s rules and forms, and that such information is accumulated and communicated to our management, including our principal executive officer and our principal financial officer, to allow timely decisions regarding required disclosure. Based on this evaluation, our principal executive officer and our principal financial officer concluded that our disclosure controls and procedures were effective as of December 31, 2019. The effectiveness of our or any system of disclosure controls and procedures is subject to certain limitations, including the exercise of judgment in designing, implementing and evaluating the controls and procedures, the assumptions used in identifying the likelihood of future events, and the inability to eliminate misconduct completely. As a result, we cannot assure you that our disclosure controls and procedures will detect all errors or fraud.
Management’s Annual Report on Internal Control over Financial Reporting
Management is responsible for establishing and maintaining adequate internal control over financial reporting. Our internal control over financial reporting is a process designed under the supervision of our principal executive officer and our principal financial officer to provide reasonable assurance regarding the reliability of the financial reporting and preparation of our financial statements for external purposes in accordance with the accounting principles generally accepted in the United States of America. Internal control over financial reporting is defined in Rules 13a-15(f) and 15d-15(f) under the Exchange Act.
Our internal control systems are designed to ensure that transactions are properly authorized and recorded in the financial records and to safeguard assets from material loss or misuse. Such assurance cannot be absolute because of inherent limitations in any internal control system.
Management assessed the effectiveness of our internal control over financial reporting as of December 31, 2019 based on the criteria for effective internal control established in Internal Control – Integrated Framework issued by the Committee of Sponsoring Organizations of the Treadway Commission in 2013. Based on the assessment, management determined that we maintained effective internal control over financial reporting as of December 31, 2019. Our independent registered public accountants have issued an audit report on our internal control over financial reporting which appears elsewhere in this Report.
Changes in Internal Control over Financial Reporting
There were no significant changes in our internal control over financial reporting (as defined in Rules 13a-15(f) and 15d-15(f) under the Exchange Act) that occurred during the year ended December 31, 2019, that have materially affected or are reasonably likely to materially affect our internal control over financial reporting.
ITEM 9B. Other Information.
Not applicable.
PART III
ITEM 10. Directors, Executive Officers and Corporate Governance.
The information called for by this item is incorporated herein by reference from our Definitive Proxy Statement for our Annual Meeting of Shareholders being held on June 25, 2020, a copy of which will be filed with the SEC within 120 days of the end of the fiscal year ended December 31, 2019.
ITEM 11. Executive Compensation.
The information called for by this item is incorporated herein by reference from our Definitive Proxy Statement for our Annual Meeting of Shareholders being held on June 25, 2020, a copy of which will be filed with the SEC within 120 days of the end of the fiscal year ended December 31, 2019.
ITEM 12. Security Ownership of Certain Beneficial Owners and Management and Related Shareholder Matters.
The information called for by this item is incorporated herein by reference from our Definitive Proxy Statement for our Annual Meeting of Shareholders being held on June 25, 2020, a copy of which will be filed with the SEC within 120 days of the end of the fiscal year ended December 31, 2019.
ITEM 13. Certain Relationships and Related Transactions, and Director Independence.
The information called for by this item is incorporated herein by reference from our Definitive Proxy Statement for our Annual Meeting of Shareholders being held on June 25, 2020, a copy of which will be filed with the SEC within 120 days of the end of the fiscal year ended December 31, 2019.
ITEM 14. Principal Accounting Fees and Services.
The information called for by this item is incorporated herein by reference from our Definitive Proxy Statement for our Annual Meeting of Shareholders being held on June 25, 2020, a copy of which will be filed with the SEC within 120 days of the end of the fiscal year ended December 31, 2019.
PART IV
ITEM 15. Exhibits and Financial Statement Schedules.
| (a) | List of documents filed as part of this Report | |
| (1) | Financial Statements | |
|
The following financial statements are included in Item 8 of this Report: Report of Independent Registered Public Accounting Firm Consolidated Balance Sheets Consolidated Statements of Income Consolidated Statements of Comprehensive Income Consolidated Statements of Changes in Shareholders’ Equity Consolidated Statements of Cash Flows Notes to Consolidated Financial Statements |
||
| (2) | Financial Statement Schedules | |
| Financial statement schedules are omitted either because they are not required or are not applicable, or because the required information is shown in the financial statements or notes thereto. | ||
| (3) | Exhibits | |
|
NUMBER |
|
DESCRIPTION |
|
2.1 |
|
|
|
2.2 |
|
|
|
2.3 |
|
|
|
2.4 |
|
|
|
2.5 |
|
|
|
3.1 |
|
|
|
3.2 |
|
|
|
4.1 |
|
|
|
4.2 |
||
| 4.3 | Description of Securities Registered under Section 12 of the Exchange Act.* Instruments defining the rights of the long-term debt securities of Business First Bancshares, Inc. and its subsidiaries are omitted pursuant to section (b)(4)(iii)(A) of Item 601 of Regulation S-K. Business First Bancshares, Inc. hereby agrees to furnish copies of these instruments to the SEC upon request. | |
|
10.1 + |
|
|
|
10.3 + |
|
|
|
10.4 + |
|
|
|
10.5 + |
|
|
|
10.6 + |
|
|
|
10.7 + |
|
|
|
10.8 + |
|
|
|
10.9 + |
|
|
|
10.10 + |
|
|
|
10.11 + |
|
|
|
10.12 + |
||
|
10.13 + |
||
|
21.1 |
|
|
|
24.1 |
|
Power of Attorney (contained on the signature page hereto).* |
|
31.1 |
|
Certification of Chief Executive Officer Pursuant to Section 302 of the Sarbanes-Oxley Act of 2002* |
|
31.2 |
|
Certification of Chief Financial Officer Pursuant to Section 302 of the Sarbanes-Oxley Act of 2002* |
|
32.1 |
|
|
|
101.INS |
|
XBRL Instance Document* |
|
101.SCH |
|
XBRL Taxonomy Extension Schema Document* |
|
101.CAL |
XBRL Taxonomy Extension Calculation Linkbase Document* |
|
|
101.DEF |
XBRL Taxonomy Extension Definition Linkbase Document* |
|
|
101.LAB |
XBRL Taxonomy Extension Label Linkbase Document* |
|
|
101.PRE |
|
XBRL Taxonomy Extension Presentation Linkbase Document* |
|
* |
Filed herewith. |
|
|
** |
Furnished herewith, and shall not be deemed “filed” for purposes of Section 18 of the Exchange Act, or otherwise subject to the liability of that section, and shall not be deemed to be incorporated by reference into any filing under the Securities Act or the Exchange Act. |
|
|
+ |
Represents a management contract or a compensatory plan or arrangement. |
|
ITEM 16. Form 10-K Summary.
None.
SIGNATURES
Pursuant to the requirements of the Securities Exchange Act of 1934, as amended, the registrant has duly caused this report to be signed on its behalf by the undersigned, thereunto duly authorized.
| BUSINESS FIRST BANCSHARES, INC. | ||
|
March 12, 2020 |
By: |
/s/ David R. Melville, III |
|
David R. Melville, III |
||
|
President and Chief Executive Officer |
||
The undersigned directors and officers do hereby constitute and appoint David R. Melville, III and Gregory Robertson and either of them, our true and lawful attorneys-in-fact and agents, with full power of substitution and resubstitution, to do any and all acts and things in our name and behalf in our capacities as directors and officers, and to execute any and all instruments for us and in our names in the capacities indicated below, that such person may deem necessary or advisable to enable Business First Bancshares, Inc. to comply with the Securities Exchange Act of 1934 and any rules, regulations and requirements of the Securities and Exchange Commission in connection with this Annual Report on Form 10-K for the fiscal year ended December 31, 2019, including specifically, but not limited to, power and authority to sign for us, or any of us, in the capacities indicated below, any and all amendments hereto; and we do hereby ratify and confirm all that such person or persons shall do or cause to be done by virtue hereof.
Pursuant to the requirements of the Securities Exchange Act of 1934, this report has been signed below by the following persons on behalf of the registrant and in the capacities indicated on the 12th day of March, 2020.
|
Signature |
Title |
Date |
|
|
By: |
/s/ David R. Melville, III |
President, Chief Executive Officer and Director |
March 12, 2020 |
|
David R. Melville, III |
(Principal Executive Officer) |
||
|
By: |
/s/ Gregory Robertson |
Chief Financial Officer |
March 12, 2020 |
|
Gregory Robertson |
(Principal Financial Officer) |
||
|
By |
/s/ Lloyd Benny Alford |
Director |
March 12, 2020 |
|
Lloyd Benny Alford |
|||
|
By |
/s/ Jack E. Byrd, Jr. |
Director |
March 12, 2020 |
|
Jack E. Byrd, Jr. |
|||
|
By: |
/s/ John Graves |
Director |
March 12, 2020 |
|
John Graves |
|||
|
By: |
/s/ Robert S. Greer, Jr. |
Chairman of the Board and Director |
March 12, 2020 |
|
Robert S. Greer, Jr. |
|||
|
By |
/s/ David L. Laxton, III |
Director |
March 12, 2020 |
|
David L. Laxton, III |
|||
|
By |
/s/ Rolfe Hood McCollister, Jr. |
Director |
|
|
Rolfe Hood McCollister, Jr. |
March 12, 2020 |
||
|
By: |
/s/ Andrew D. McLindon |
Director |
|
|
Andrew D. McLindon |
March 12, 2020 |
||
|
By: |
/s/ Patrick E. Mockler |
Director |
|
|
Patrick E. Mockler |
March 12, 2020 |
||
|
By: |
/s/ David A. Montgomery, Jr. |
Director |
|
|
David A. Montgomery, Jr. |
March 12, 2020 |
||
|
By: |
/s/ Arthur Price |
Director |
|
|
Arthur Price |
March 12, 2020 |
||
|
By: |
/s/ Fayez K. Shamieh |
Director |
|
|
Fayez K. Shamieh |
March 12, 2020 |
||
|
By: |
/s/ Kenneth Smith |
Director |
|
|
Kenneth Smith |
March 12, 2020 |
||
|
By: |
/s/ Thomas Everett Stewart, Jr. |
Director |
|
|
Thomas Everett Stewart, Jr. |
March 12, 2020 |
||
|
By: |
/s/ Steve White |
Director |
|
|
Steve White |
March 12, 2020 |
||
|
By: |
/s/ Robert Yarborough |
Director |
|
|
Robert Yarborough |
March 12, 2020 |
132