Attached files
| file | filename |
|---|---|
| EX-99.1 - EX-99.1 - ZAGG Inc | a201912318-kex991.htm |
| 8-K - 8-K - ZAGG Inc | zagg-20200311.htm |
| EX-99.4 - EX-99.4 - ZAGG Inc | a201912318-kex994.htm |
| EX-99.2 - EX-99.2 - ZAGG Inc | a201912318-kex992.htm |
March 11, 2020
ZAGG Inc Supplemental Financial Information - CFO Commentary
Document reference information
ZAGG Inc's (the “Company”) CFO commentary in this document can be referenced in the financial information found in the press release announcing the results of operations for the years ended December 31, 2019 and 2018, including certain supplemental financial information, issued earlier today. The release can be found at investors.ZAGG.com, or in the Form 8-K furnished to the Securities and Exchange Commission website at sec.gov (the URLs are included in this exhibit as inactive textual references and information contained on, or accessible through, our websites is not a part of, and is not incorporated by reference into, this report).
Three Months Ended December 31, 2019 and 2018 Summary Results
(In millions, except per share amounts)
| For the Three Months Ended | |||||||||||
| Summary of quarter-to-date financial results | December 31, 2019 | December 31, 2018 | |||||||||
| Net sales | $ | 189.9 | $ | 166.5 | |||||||
| Gross profit | $ | 67.4 | $ | 58.5 | |||||||
| Gross profit margin | 36 | % | 35 | % | |||||||
| Net income | $ | 25.0 | $ | 14.3 | |||||||
| Diluted earnings per share | $ | 0.85 | $ | 0.52 | |||||||
| Diluted operating earnings per share | $ | 0.94 | $ | 0.55 | |||||||
| Adjusted EBITDA | $ | 30.5 | $ | 28.1 | |||||||
| Diluted shares outstanding | 29.4 | 28.3 | |||||||||
| For the Three Months Ended | |||||||||||||||||||||||
| December 31, 2019 | December 31, 2018 | ||||||||||||||||||||||
| Net sales by category | (%) | ($) | (%) | ($) | |||||||||||||||||||
| Protection (screen protection and cases) | 44 | % | $ | 84.5 | 59 | % | $ | 98.3 | |||||||||||||||
| Power (power management and power cases) | 44 | % | $ | 83.0 | 32 | % | $ | 53.1 | |||||||||||||||
| Audio | 7 | % | $ | 13.2 | 5 | % | $ | 7.8 | |||||||||||||||
| Productivity (keyboards and other) | 5 | % | $ | 9.2 | 4 | % | $ | 7.3 | |||||||||||||||
| For the Three Months Ended | |||||||||||||||||||||||
| December 31, 2019 | December 31, 2018 | ||||||||||||||||||||||
| Net sales by channel | (%) | ($) | (%) | ($) | |||||||||||||||||||
| Indirect | 90 | % | $ | 171.2 | 91 | % | $ | 151.7 | |||||||||||||||
| Website | 6 | % | $ | 11.0 | 5 | % | $ | 8.6 | |||||||||||||||
| Franchisees | 4 | % | $ | 7.7 | 4 | % | $ | 6.2 | |||||||||||||||
| For the Three Months Ended | |||||||||||||||||||||||
| December 31, 2019 | December 31, 2018 | ||||||||||||||||||||||
| Net sales by region | (%) | ($) | (%) | ($) | |||||||||||||||||||
| Domestic | 81 | % | $ | 153.5 | 84 | % | $ | 139.5 | |||||||||||||||
| International | 19 | % | $ | 36.4 | 16 | % | $ | 27.0 | |||||||||||||||
2019 Fourth Quarter Results Discussion
(All comparisons are 2019 consolidated versus 2018 consolidated, unless otherwise noted)
Net sales
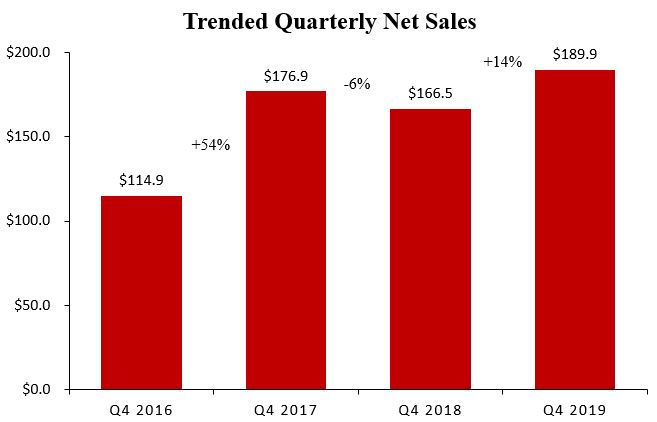
Net sales increased 14% to $189.9 million, compared to $166.5 million. The increase in net sales was primarily attributable to (1) increased sales of protective cases under our Gear4 brand and (2) increased power management sales driven primarily by HALO product sales and new mophie wireless product launches during the second half of 2019. This was partially offset by lower sales of screen protection and power case products.
Gross profit
Gross profit was $67.4 million (36% of net sales) compared to $58.5 million (35% of net sales). Gross profit margin has not changed significantly, although we saw upside from an increase in sales of Gear4 cases, HALO power products, and InvisibleShield VisionGuard products. These improvements were offset by increased duties from product manufactured in China and a decrease in sales of our screen protection products.
Operating expenses
Operating expenses increased 20% to $45.6 million (24% of net sales) compared to $38.1 million (23% of net sales). The increase in operating expenses was primarily attributable to (1) additional selling, general and administrative expense associated with the newly acquired BRAVEN, Gear4, and HALO brands, (2) increased marketing investments to support our growing portfolio of brands and products, (3) investment in our InvisibleShield On Demand infrastructure, and (4) higher amortization of long-lived intangibles related to the BRAVEN, Gear4, and HALO acquisitions. These increases were partially offset by a company-wide restructure executed during the third quarter of 2019 that were realized more fully in the fourth quarter of 2019.
Years Ended December 31, 2019 and 2018 Summary Results
(In millions, except per share amounts)
| For the Years Ended | |||||||||||
| Summary of full year financial results | December 31, 2019 | December 31, 2018 | |||||||||
| Net sales | $ | 521.9 | $ | 538.2 | |||||||
| Gross profit | $ | 183.4 | $ | 185.9 | |||||||
| Gross profit margin | 35 | % | 35 | % | |||||||
| Net income | $ | 13.9 | $ | 39.2 | |||||||
| Diluted earnings per share | $ | 0.48 | $ | 1.38 | |||||||
| Diluted operating earnings per share | $ | 0.85 | $ | 1.44 | |||||||
| Adjusted EBITDA | $ | 44.7 | $ | 76.4 | |||||||
| Diluted shares outstanding | 29.2 | 28.5 | |||||||||
| For the Years Ended | |||||||||||||||||||||||
| December 31, 2019 | December 31, 2018 | ||||||||||||||||||||||
| Net sales by category | (%) | ($) | (%) | ($) | |||||||||||||||||||
| Protection (screen protection and cases) | 52 | % | $ | 273.9 | 57 | % | $ | 309.2 | |||||||||||||||
| Power (power management and power cases) | 36 | % | $ | 187.5 | 32 | % | $ | 174.8 | |||||||||||||||
| Audio | 5 | % | $ | 25.3 | 5 | % | $ | 23.2 | |||||||||||||||
| Productivity (keyboards and other) | 7 | % | $ | 35.2 | 6 | % | $ | 31.0 | |||||||||||||||
| For the Years Ended | |||||||||||||||||||||||
| December 31, 2019 | December 31, 2018 | ||||||||||||||||||||||
| Net sales by channel | (%) | ($) | (%) | ($) | |||||||||||||||||||
| Indirect | 87 | % | $ | 453.6 | 88 | % | $ | 473.9 | |||||||||||||||
| Website | 8 | % | $ | 42.4 | 8 | % | $ | 42.7 | |||||||||||||||
| Franchisees | 5 | % | $ | 25.9 | 4 | % | $ | 21.6 | |||||||||||||||
| For the Years Ended | |||||||||||||||||||||||
| December 31, 2019 | December 31, 2018 | ||||||||||||||||||||||
| Net sales by region | (%) | ($) | (%) | ($) | |||||||||||||||||||
| Domestic | 77 | % | $ | 403.0 | 84 | % | $ | 451.4 | |||||||||||||||
| International | 23 | % | $ | 118.9 | 16 | % | $ | 86.8 | |||||||||||||||
2019 Full Year Results Discussion
(All comparisons are 2019 consolidated versus 2018 consolidated, unless otherwise noted)
Net sales
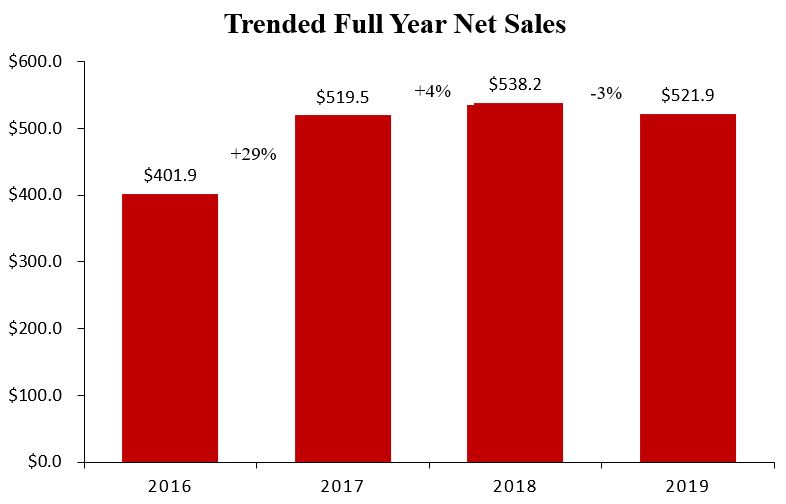
Net sales decreased 3% to $521.9 million compared to $538.2 million. The decrease in net sales was primarily attributable to (1) a decrease in sales of screen protection products due to a pull forward of shipments into the fourth quarter of 2018 ahead of a then-expected tariff increase, combined with softer market demand for smartphones in the U.S. and (2) decreased sales of mophie power management due to challenging sell-in comparisons during the first half of 2019 and a decrease in power case sales. These decreases were partially offset by increased sales of Gear4 cases and HALO products.
Gross profit
Gross profit was $183.4 million (35% of net sales) compared to $185.9 million (35% of net sales). Gross profit margin has not changed significantly, though we saw upside from an increase in sales of Gear4 cases, HALO power products, and InvisibleShield VisionGuard products. These improvements were offset by increased duties from product manufactured in China and a decrease in sales of our screen protection products.
Operating expenses
Operating expenses increased 29% to $173.2 million (33% of net sales) compared to $134.2 million (25% of net sales). The increase in operating expenses was primarily attributable to (1) additional selling, general and administrative expense associated with the newly acquired BRAVEN, Gear4, and HALO brands, (2) severance charges of $2.2 million associated with corporate restructurings during the second and third quarter of 2019, (3) increased marketing investments to support our growing portfolio of brands and products, (4) investment in our Invisible Shield On Demand infrastructure, and (5) higher amortization of long-lived intangibles related to the BRAVEN, Gear4, and HALO acquisitions.
Balance Sheet Highlights (as of December 31, 2019 and 2018)
| December 31, 2019 | December 31, 2018 | ||||||||||
| Cash and cash equivalents | $ | 17.8 | $ | 15.8 | |||||||
| Accounts receivable, net of allowances | $ | 142.8 | $ | 156.7 | |||||||
| Inventories | $ | 144.9 | $ | 82.9 | |||||||
| Line of credit | $ | 107.1 | $ | 58.4 | |||||||
| Net debt (Total debt less cash) | $ | 89.3 | $ | 42.6 | |||||||
| QTD Days sales outstanding (DSOs) | 69 | 87 | |||||||||
Inventory turns* | 4.5x | 6.8x | |||||||||
* Inventory turns defined as trailing 12-month sales divided by period-end inventory (excludes amounts capitalized related to U.S. freight and duties).
Market Share Information
Screen Protection
Despite screen protection market share decline from 2018 to 2019, it appears that the market share losses have stabilized at approximately 45% beginning in the second quarter of 2019. Screen protection has experienced headwinds over the last few years as competition has increased at several retail outlets. To address this competitive threat, we launched (1) additional innovation into our screen protection line during the third quarter of 2019 to further bolster our InvisibleShield VisionGuard products with anti-microbial technology and (2) a segmentation strategy across a number of retail customers that allows us to address lower price points with less feature-rich products.
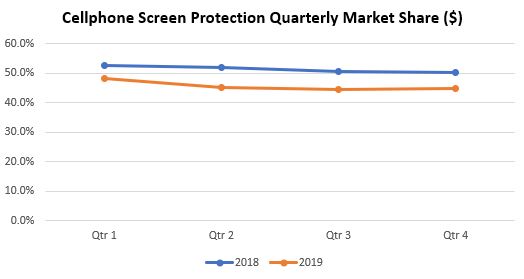
(Source: The NPD Group / Retail Tracking Service for each quarterly period; NPD data refers to dollar share and pertains only to U.S. retail sales)
Portable Power
The quarterly market share increases in the fourth quarters of 2019 and 2018 is driven primarily by on-air sales of HALO products. As new products were released into the market in the fourth quarter of 2019 under the mophie and HALO brands, our overall market share increased.
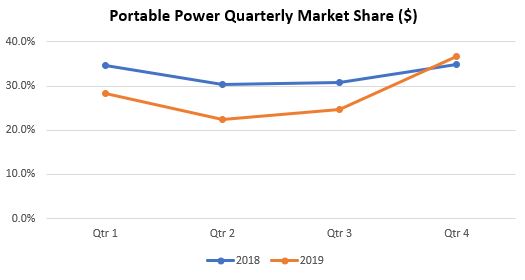
(Source: The NPD Group / Retail Tracking Service for each quarterly period; NPD data refers to dollar share and pertains only to U.S. retail sales)
Wireless Charge Pads
mophie-branded wireless charge pads have been a market leader since the charge pad product's introduction in 2017. Though we saw some decline in market share during the first three quarters of 2019, we re-gained lost share during the fourth quarter of 2019 following the releases of new wireless charging products in September 2019.
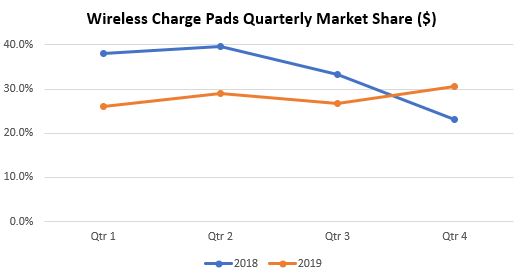
(Source: The NPD Group / Retail Tracking Service for each quarterly period; NPD data refers to dollar share and pertains only to U.S. retail sales)
Restructuring
To position the Company for long-term profitable growth, the Company initiated a restructuring plan during the second quarter of 2019. These initiatives included reductions of approximately 10% of our global headcount, acceleration of cost synergies from recent acquisitions into 2019, and the reduction of a number of discretionary operating expense categories.
As a result, 2019 results include one-time severance restructuring charges totaling approximately $2.2 million. The headcount reductions are expected to provide gross annualized savings of approximately $8.0 million.
2020 Business Outlook
For the full year of 2020, the Company expects:
•Flat net sales compared to 2019
•Gross profit margin as a percentage of net sales in the mid 30's range
•Adjusted EBITDA of approximately $48 million
•Diluted earnings per share of approximately $0.50
About Non-GAAP Financial Information
This supplemental financial information - CFO commentary includes Adjusted EBITDA and Diluted Operating Earnings Per Share. Readers are cautioned that (1) Adjusted EBITDA (earnings before stock-based compensation expense, depreciation and amortization, other expense, net, inventory step-up amount in connection with acquisitions in 2018 and 2019, transaction costs, BRAVEN employee retention bonus, former CFO retention bonus, CEO signing bonus, consulting fee to former CEO, restructuring expenses, adjustment to fair value of acquisition contingent consideration, legal settlements, and income tax (benefit) provision), and (2) Diluted Operating Earnings Per Share (diluted operating earnings per share excluding the impact of amortization expense related 2018 and 2019 acquisitions, transaction costs, inventory step-up amount in connection with acquisitions in 2018 and 2019, BRAVEN employee retention bonus, restructuring expenses, stock-based compensation issued as retention, and adjustment to fair value of acquisition contingent consideration) are not financial measures prepared in accordance with accounting principles generally accepted in the United States of America (“U.S. GAAP”). In addition, this financial information should not be construed as an alternative to any other measure of performance determined in accordance with U.S. GAAP, or as an indicator of operating performance, liquidity or cash flows generated by operating, investing and financing activities, as there may be significant factors or trends that it fails to address. As such, it should be read only in conjunction with our consolidated financial statements prepared in accordance with U.S. GAAP. We present Adjusted EBITDA and Diluted Operating Earnings Per Share because we believe that these measures are helpful to some investors as a measure of performance and to normalize the impact of acquisitions. We caution readers that non-U.S. GAAP financial information, by its nature, departs from traditional accounting conventions. Accordingly, its use can make it difficult to compare current results with results from other reporting periods and with the financial results of other companies. We have provided a reconciliation of Adjusted EBITDA and Diluted Operating Earnings Per Share to the most directly comparable U.S. GAAP measures in the supplemental financial information attached to the press release accompanying this supplemental financial information - CFO commentary.
Cautionary Note Regarding Forward-Looking Statements
This CFO Commentary contains (and oral communications made by us may contain) “forward-looking statements” within the meaning of the safe harbor provisions of the U.S. Private Securities Litigation Reform Act of 1995. Forward-looking statements can be identified by words such as “anticipate,” “believe,” “estimate,” “expect,” “intend,” “plan,” “predict,” “project,” “target,” “future,” “seek,” “likely,” “strategy,” “may,” “should,” “will” and similar references to future periods. Examples of forward-looking statements include, among others, statements we make regarding our outlook for the Company and statements that estimate or project future results of operations or the performance of the Company.
Forward-looking statements are neither historical facts nor assurances of future performance. Instead, they are based only on our current beliefs, expectations and assumptions regarding the future of our business, future plans and strategies, projections, anticipated events and trends, the economy and other future conditions. Because forward-looking statements relate to the future, they are subject to inherent uncertainties, risks and changes in circumstances that are difficult to predict and many of which are outside of our control. Our actual results and financial condition may differ materially from those indicated in the forward-looking statements. Therefore, you should not rely on any of these forward-looking statements. Important factors that could cause our actual results and financial condition to differ materially from those indicated in the forward-looking statements include, among others, the following:
a.the impacts of certain environmental and health risks, including the recent outbreak of the coronavirus (COVID-19) and its potential impact on the Company's operations, sourcing from China, and future demand for the Company's products for an uncertain duration of time;
b.the ability to design, produce, and distribute the creative product solutions required to retain existing customers and to attract new customers;
c.building and maintaining marketing and distribution functions sufficient to gain meaningful international market share for our products;
d.the ability to respond quickly with appropriate products after the adoption and introduction of new mobile devices by major manufacturers like Apple®, Samsung®, and Google®;
e.changes or delays in announced launch schedules for (or recalls or withdrawals of) new mobile devices by major manufacturers like Apple, Samsung, and Google;
f.the ability to successfully integrate new operations or acquisitions;
g.the impacts of inconsistent quality or reliability of new product offerings;
h.the impacts of lower profit margins in certain new and existing product categories, including certain mophie products;
i.the impacts of changes in economic conditions, including on customer demand;
j.managing inventory in light of constantly shifting consumer demand;
k.the failure of information systems or technology solutions or the failure to secure information system data, failure to comply with privacy laws, security breaches, or the effect on the Company from cyber-attacks, terrorist incidents or the threat of terrorist incidents;
l.changes in U.S. and international trade policy and tariffs, including the effect of increases in U.S.-China tariffs on selected materials used in the manufacture of products sold by the Company which are sourced from China;
m.adoption of or changes in accounting policies, principles, or estimates; and
n.changes in the law, economic and financial conditions, including the effect of enactment of US tax reform or other tax law changes.
Any forward-looking statement made by us in this CFO Commentary speaks only as of the date on which such statement is made. New factors emerge from time to time and it is not possible for management to predict all such factors, nor can it assess the impact of any such factor on the business or the extent to which any factor, or combination of factors, may cause results to differ materially from those contained in any forward-looking statement. Readers should also review the risks and uncertainties listed in our most recent Annual Report on Form 10-K and other reports we file with the U.S. Securities and Exchange Commission, including (but not limited to) Item 1A - “Risk Factors” in the Form 10-K and Management's Discussion and Analysis of Financial Condition and Results of Operations and the risks described therein from time to time. We undertake no obligation to publicly update any forward-looking statement, whether written or oral, that may be made from time to time, whether as a result of new information, future developments or otherwise. The forward-looking statements contained in this CFO Commentary are intended to qualify for the safe harbor provisions of Section 27A of the Securities Act of 1933, as amended, and Section 21E of the Securities Exchange Act of 1934, as amended.