Attached files
| file | filename |
|---|---|
| EX-32.2 - EX-32.2 - RigNet, Inc. | rnet-ex322_8.htm |
| EX-32.1 - EX-32.1 - RigNet, Inc. | rnet-ex321_9.htm |
| EX-31.2 - EX-31.2 - RigNet, Inc. | rnet-ex312_11.htm |
| EX-31.1 - EX-31.1 - RigNet, Inc. | rnet-ex311_10.htm |
| EX-23.1 - EX-23.1 - RigNet, Inc. | rnet-ex231_12.htm |
| EX-21.1 - EX-21.1 - RigNet, Inc. | rnet-ex211_176.htm |
| EX-10.15 - EX-10.15 - RigNet, Inc. | rnet-ex1015_405.htm |
| EX-10.14 - EX-10.14 - RigNet, Inc. | rnet-ex1014_404.htm |
| EX-4.1 - EX-4.1 - RigNet, Inc. | rnet-ex41_344.htm |
UNITED STATES
SECURITIES AND EXCHANGE COMMISSION
Washington, D.C. 20549
FORM 10-K
(Mark One)
|
☑ |
ANNUAL REPORT PURSUANT TO SECTION 13 OR 15(d) OF THE SECURITIES EXCHANGE ACT OF 1934 |
For the fiscal year ended December 31, 2019
or
|
☐ |
TRANSITION REPORT PURSUANT TO SECTION 13 OR 15(d) OF THE SECURITIES EXCHANGE ACT OF 1934 |
For the transition period from __________ to __________
Commission file number 001-35003
RigNet, Inc.
(Exact name of registrant as specified in its charter)
|
Delaware |
|
76-0677208 |
|
(State or other jurisdiction of incorporation or organization) |
|
(I.R.S. Employer Identification No.) |
|
|
|
|
|
15115 Park Row Blvd, Suite 300 |
|
|
|
Houston, Texas |
|
77084-4947 |
|
(Address of principal executive offices) |
|
(Zip Code) |
Registrant’s telephone number, including area code: (281) 674-0100
Securities registered pursuant to Section 12(b) of the Act:
|
Title of each class |
Trading Symbol(s) |
Name of each exchange on which registered |
|
Common Stock, $0.001 par value |
RNET |
NASDAQ Global Select Market |
Securities registered pursuant to Section 12(g) of the Act: NONE
Indicate by check mark if the registrant is a well-known seasoned issuer, as defined in Rule 405 of the Securities Act. Yes ☐ No ☑
Indicate by check mark if the registrant is not required to file reports pursuant to Section 13 or Section 15(d) of the Act. Yes ☐ No ☑
Indicate by check mark whether the registrant: (1) has filed all reports required to be filed by Section 13 or 15(d) of the Securities Exchange Act of 1934 during the preceding 12 months (or for such shorter period that the registrant was required to file such reports), and (2) has been subject to such filing requirements for the past 90 days. Yes ☑ No ☐
Indicate by check mark whether the registrant has submitted electronically every Interactive Data File required to be submitted pursuant to Rule 405 of Regulation S-T (§ 232.405 of this chapter) during the preceding 12 months (or for such shorter period that the registrant was required to submit such files). Yes ☑ No ☐
Indicate by check mark whether the registrant is a large accelerated filer, an accelerated filer, a non-accelerated filer, a smaller reporting company or an emerging growth company. See the definitions of “large accelerated filer,” “accelerated filer,” “smaller reporting company” and “emerging growth company” in Rule 12b-2 of the Exchange Act.
|
Large accelerated filer ☐ |
|
Accelerated filer ☑ |
|
Non-accelerated filer ☐ |
|
Smaller reporting company ☑ |
Emerging growth company ☐ |
|
|
|
|
|
|
If an emerging growth company, indicate by check mark if the registrant has elected not to use the extended transition period for complying with any new or revised financial accounting standards provided pursuant to Section 13(a) of the Exchange Act. ☐
Indicate by check mark whether the registrant is a shell company (as defined in Rule 12b-2 of the Act). Yes ☐ No ☑
As of June 30, 2019, which was the last business day of the registrant's most recently completed second fiscal quarter, the aggregate market value of the registrant’s common stock, $0.001 par value per share (the “Common Stock”) held by non-affiliates of the registrant on such date was approximately $147.7 million. At March 9, 2020, there were outstanding 19,979,284 shares of the registrant’s Common Stock.
DOCUMENTS INCORPORATED BY REFERENCE
Portions of the Registrant’s definitive Proxy Statement for its 2020 Annual Meeting of Stockholders to be filed with the Commission within 120 days of December 31, 2019 are incorporated herein by reference in Part III of this Annual Report.
|
|
|
Page |
|
|
|
|
|
|
|
|
|
|
|
|
|
|
3 |
|
|
Item 1 |
5 |
|
|
Item 1A |
19 |
|
|
Item 1B |
30 |
|
|
Item 2 |
30 |
|
|
Item 3 |
30 |
|
|
Item 4 |
30 |
|
|
|
|
|
|
|
|
|
|
|
|
|
|
Item 5 |
31 |
|
|
Item 6 |
32 |
|
|
Item 7 |
Management’s Discussion and Analysis of Financial Condition and Results of Operations |
36 |
|
Item 7A |
49 |
|
|
Item 8 |
49 |
|
|
Item 9 |
Changes in and Disagreements with Accountants on Accounting and Financial Disclosure |
49 |
|
Item 9A |
49 |
|
|
Item 9B |
52 |
|
|
|
|
|
|
|
|
|
|
|
|
|
|
Item 10 |
53 |
|
|
Item 11 |
53 |
|
|
Item 12 |
Security Ownership of Certain Beneficial Owners and Management and Related Stockholder Matters |
53 |
|
Item 13 |
Certain Relationships and Related Transactions, and Director Independence |
53 |
|
Item 14 |
53 |
|
|
|
|
|
|
|
|
|
|
|
|
|
|
Item 15 |
54 |
|
|
Item 16 |
57 |
2
3
|
|
Nessco Group Holdings Ltd., acquired in 2012, primarily provides Systems Integration solutions |
|
|
NOC |
|
Network Operations Center |
|
NPT |
|
Non-productive time |
|
OPEC |
|
Organization of Petroleum Exporting Countries |
|
OTT |
|
Software, IoT and other advanced solutions delivered Over-the-Top of the network layer |
|
PLC |
|
Programmable Logic Controller |
|
PUC |
|
Public Utility Commission |
|
QOS |
|
Quality of Service |
|
ROP |
|
Rate of penetration |
|
SaaS |
|
Software as a Service |
|
SAB |
|
Staff Accounting Bulletin |
|
SAFCON |
|
Safety Controls, Inc., acquired in 2018, provides additional safety, security, and maintenance service solutions for oil and gas |
|
Satellite bandwidth – Ka band |
|
Bandwidth typically operating in a frequency range of 27 – 40 gigahertz |
|
Satellite bandwidth – Ku band |
|
Bandwidth typically operating in a frequency range of 12 – 18 gigahertz |
|
Satellite bandwidth – C band |
|
Bandwidth typically operating in a frequency range of 4 – 8 gigahertz |
|
Satellite bandwidth – L band |
|
Bandwidth typically operating in a frequency range of 1 – 2 gigahertz |
|
SCADA |
|
Supervisory Control and Data Acquisition |
|
SEC |
|
United States Securities and Exchange Commission |
|
SI |
|
Systems Integration |
|
SOC |
|
Security Operations Center |
|
TECNOR |
|
Orgtec S.A.P.I. de C.V., d.b.a. TECNOR, acquired in March 2016, increases solutions offerings in Mexico |
|
The Tax Act |
|
The Tax Cuts and Jobs Act |
|
USF |
|
Universal Service Fund |
|
U.S. GAAP |
|
Generally Accepted Accounting Principles in the United States |
|
VMS |
|
Video Management System |
|
VSAT |
|
Very Small Aperture Terminal satellite receivers |
|
WiMax |
|
Worldwide Interoperability for Microwave Access wireless broadband communication standard |
4
For convenience in this Annual Report on Form 10-K, “RigNet”, the “Company”, “we”, “us”, and “our” refer to RigNet, Inc. and its subsidiaries taken as a whole, unless otherwise noted.
Overview
We are a global technology company that provides customized data and communications services. Customers use our private networks to manage information flows and execute mission-critical operations primarily in remote areas where conventional telecommunications infrastructure is either unreliable or unavailable. We provide our clients what is often the sole means of communications for their remote operations. On top of and vertically integrated into these networks we provide services ranging from fully-managed voice, data, and video to more advanced services including: cybersecurity threat detection and prevention; applications to improve crew welfare, safety or workforce productivity; and a real-time AI-backed data analytics platform to enhance customer decision making and business performance.
We deliver advanced software and communications infrastructure that allow our customers to realize the business benefits of digital transformation. With world-class, ultra-secure solutions spanning global IP connectivity, bandwidth-optimized Over-The-Top (OTT) applications, Industrial Internet of Things (IIoT) big data enablement, and industry-leading machine learning analytics, we support the full evolution of digital enablement, empowering businesses to respond faster to high priority issues, mitigate the risk of operational disruption, and maximize their overall financial performance.
Historically, our primary focus has been on customers in the upstream exploration and production segment of the energy industry, including offshore drilling rigs and production facilities. In recent years, we have increased our service offerings across the energy value chain to provide solutions to midstream and downstream customers where systems integration and IoT solutions are key elements. In addition, we have created channel partners around the world, creating opportunities to sell our industry-leading security, IoT, and machine-learning solutions outside of our traditional energy-focused markets.
Our business operations are divided into the following segments:
|
|
• |
Managed Communications Services (MCS). Our MCS segment provides remote communications, telephony, and technology services for offshore and onshore drilling rigs and production facilities, support vessels, and other remote sites. In addition, our MCS segment sells communications equipment and associated installation and maintenance services. Our services are generally contracted with terms that typically range from one month to five years and are billed as monthly recurring or usage-based fees. |
|
|
• |
Systems Integration (SI). Our Systems Integration segment provides design and implementation services for customer telecommunications systems. Solutions are delivered based on the customer’s specifications, adhering to international industry standards and best practices. Project services may include consulting, design, engineering, project management, procurement, testing, installation, commissioning, and maintenance. Additionally, SI provides complete monitoring and maintenance for fire and gas detection systems and PLC/automation control systems. Projects are bid on a fixed-cost or time and materials basis with revenue recognized on a percentage of completion basis. |
|
|
• |
Corporate. Corporate costs and eliminations primarily represent unallocated executive and support activities, including back-office software development, interest expense, income taxes, and eliminations. |
For financial information about our reportable segments, see Note 12 ─ “Segment Information” in our consolidated financial statements included in this Annual Report on Form 10-K.
5
Managed Communications Services (MCS)
As of December 31, 2019, MCS represented 67.9% of our total revenues. We were the primary provider of remote communications and collaborative services to approximately 500 customers reaching over 1,300 remote sites located in approximately 50 countries on six continents. For the year ended December 31, 2019, our revenue generated from countries outside of the U.S. represented 69.0% of MCS revenue. Key aspects of our services include:
|
|
• |
a secure end-to-end global network to ensure greater network availability, enhanced network cybersecurity and higher Quality of Service (QoS) control to optimize latency-sensitive business applications; |
|
|
• |
a multi-tenant network designed to accommodate multiple customer groups resident at a site, including drilling contractors, exploration and production operators and oilfield service providers; |
|
|
• |
a comprehensive bundle of network optimization value-added services, such as wide-area network acceleration, policy-based content filtering and firewall Wi-Fi hotspot access management, to maximize public-private sharing of assets for multiple tenants and customer groups at one site; |
|
|
• |
proactive network monitoring and management through Network Operations Centers (NOC) that actively manage network availability and serve as in-bound call centers for troubleshooting, 24 hours per day, 365 days per year; and |
|
|
• |
maintenance and support through geographically deployed engineering and service support teams as well as warehoused spare equipment inventories. |
Global MCS Site Counts
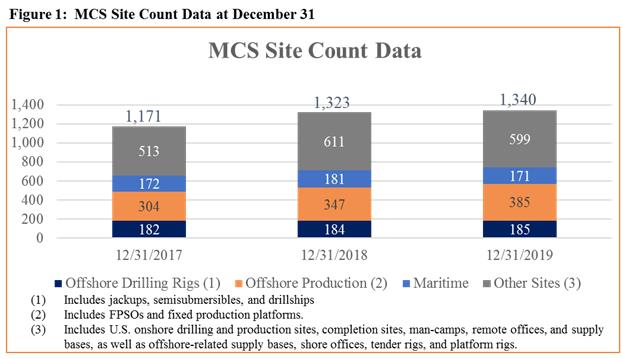
We report the number of sites serviced by MCS on a regular basis and currently define sites based on four categories which include Offshore Drilling Rigs, Offshore Production sites, Maritime, and Other sites, which includes U.S. onshore drilling and production sites, completion sites, man-camps, remote offices, and supply bases, as well as offshore-related supply bases, shore offices, tender rigs, and platform rigs. The MCS site count does not include IoT sites. As of December 31, 2019, we provided MCS to a total of 1,340 U.S. and non-U.S. sites, a 1.3% increase from 1,323 sites served as of December 31, 2018. Site counts fluctuate with industry conditions and are influenced by oil prices, customer capital spending, and other factors. When we provide services for multiple customers at one location, for example, to the drilling contractor, exploration and production operator, and other service companies, we count this as one site. The table below provides site count data as of December 31 of the respective year.
We procure bandwidth from independent commercial satellite-services operators and terrestrial wireless and landline providers to meet the needs of our customers for end-to-end IP-based communications. This allows RigNet
6
to provide hybrid network solutions, which greatly improves network up-time by using multiple and diverse sources of bandwidth. We generally own the network infrastructure and communications equipment we install at remote sites as well as equipment co-located in third-party teleport facilities and data centers, all of which we procure through various equipment providers. By owning the network infrastructure and communications equipment on the customer premises, we are better able to select the optimal equipment for each customer solution as well as ensure the quality of our services.
Applications & Internet-of-Things (Apps & IoT)
Apps & IoT is our fastest growing segment, and is leading our value delivery for our customers’ digital transformation efforts. In addition to already having grown to 14.6% of 2019 revenue compared to 10.8% and. 7.6% of 2018 and 2017 revenue, respectively, the value proposition from Apps & IoT is allowing us to gain share in the MCS market for energy.
The energy sector has embraced “Digital Transformation”, a term that encompasses using technology to significantly reduce human operational process time and increase operating margins. Digital transformation typically uses a combination of Industrial IoT (Internet of Things) combined with powerful Artificial Intelligence (AI) backed predictive analytics to monitor and optimize processes in real-time.
Through our Apps & IoT segment, we deliver a combination of turn-key network solutions, value-added services that simplify the management of multiple communications needs, and digital accelerators that collect, secure and analyze operational intelligence data, allowing our customers to increase margins and focus on core operations. Apps & IoT revenue generated from countries outside of the U.S. represented 32.5% of Apps & IoT revenue. We sell our Apps & IoT services not only via direct sales, but also through a series of channel partners around the world, which enables us to target customers in industry verticals where we have not established a focused salesforce. In some cases, non-energy customers have sought us out because of our unique capabilities.
Apps & IoT services delivered over-the-top of the network layer include:
|
|
• |
The Intelie LIVE and Intelie Planning platforms which provide AI backed advanced real-time predictive analytics and machine learning; |
|
|
• |
Software as a Service (SaaS) applications to enhance remote operations efficiency, safety or crew welfare including weather monitoring primarily in the North Sea (MetOcean) and Advanced Video Intelligence (AVI), including video analytics and a Video Management System (VMS); |
|
|
• |
Machine-to-machine IoT networks such as: Supervisory Control and Data Acquisition (SCADA), Broadband Global Access networks (BGAN), and custom Long-Range Access (LoRA); and |
|
|
• |
LIVE-IT, which is a service introduced in 2019 that allows us to manage our customer’s devices and data at the edge. |
Intelie, our real-time machine learning platform, delivers value to the energy sector and has applications that improve performance and operational safety, enhance well control, and reduce non-productive time (NPT). Examples of Intelie applications follow.
|
|
• |
Industry-proven algorithms transform heterogenous sensor data into key performance indicators (KPIs) to reduce NPT, such as connection time for drill pipe or slip-to-slip time. Another set of models can monitor and advise how to improve the drilling rate of penetration (ROP), the speed at which a drill bit drills through a formation. |
|
|
• |
Intelie improves safety performance using algorithms that verify whether operational policies are being followed, including pressure testing and emergency disconnect sequence (EDS) checks. We can also corroborate that the correct personnel are on board, enhancing a customers’ ability to track personnel and respond during an emergency. |
|
|
• |
Intelie machine learning assists customers with optimizing well-cleaning procedures, the process of bringing up the cuttings that the drill bit generates while drilling. As an example of how this delivers value, the faster the ROP, the more drilling cuttings are generated, which in turn can slow down the ROP as the bit gets stuck on its cuttings. |
7
Intelie has delivered significant results, helping drilling contractors and operators generate time and cost savings in their upstream operations. Examples include reducing NPT by more than 20%. Intelie has also contributed as much as $3.0 million in software savings for a customer by eliminating extra software by consolidating functionality. For one customer, the Intelie platform processed over 300,000 measurements per second at its peak, synthesizing and displaying actionable results to the end-user. Intelie has recently signed a contract to implement Intelie LIVE to support BP’s Remote Collaboration Center and has also been used in oil production and pipeline monitoring use cases. The increased linkage between IoT solutions and Intelie allows us to not only provide communications but also to be directly involved in driving valuable business outcomes for our customers.
RigNet’s IoT network supports almost 11,000 different sites, predominantly in the U.S. A key element of our network, devices using the L-band satellite network, grew substantially during 2019 to include over 6,200 active L-Band enabled IoT sites at the end of December 2019, consuming approximately 80 gigabytes per month of IoT traffic, or roughly 12.9 megabytes per month per site.
We believe the Apps and IoT segment is an important element of our long-term growth.
System Integration (SI)
Due to our deep knowledge of the energy sector’s needs and a wide range of expertise around critical communications in challenging environments, our clients also turn to us to build large network projects, both offshore and onshore. Solutions are delivered based on the customer’s specifications, adhering to international industry standards and best practices. Project services may include consulting, design, engineering, project management, procurement, testing, installation, commissioning, and maintenance. Additionally, SI provides complete monitoring and maintenance for fire and gas detection systems and PLC/automation control systems. Projects are bid on a fixed-cost or time and materials basis with revenue recognized on a percentage of completion basis. As of December 31, 2019, Systems Integration represented 17.6% of our total revenues and revenue generated from countries outside of the U.S. represented 26.9% of SI revenue.
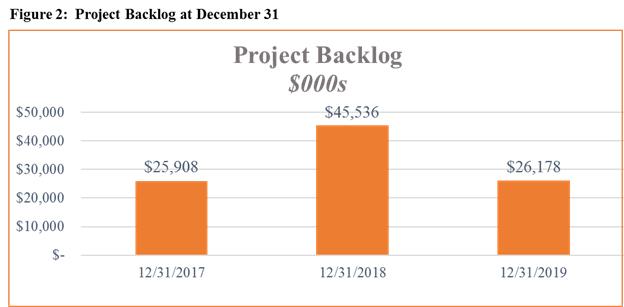
RigNet typically operates as a subcontractor on SI projects, working with other major Engineering, Procurement, and Construction (EPC) companies to deliver the project scope to the end customer. The business is both competitive and cyclical. The typical project length for our SI projects is anywhere from less than one year to approximately three years. Project backlog declined in 2019, meaning that we added $15.7 million in backlog in 2019, but we recognized more revenue and project descoping than we added. Project backlog, or the amount of revenue secured subject to firm contract awards that will be recognized over the life of each project, as of December 31 for the respective years is provided in the table below.
8
Putting the parts back together
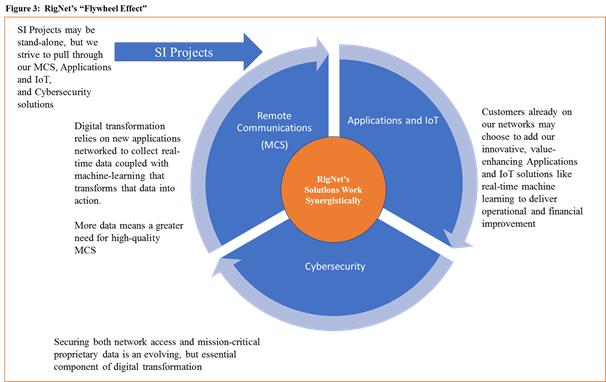
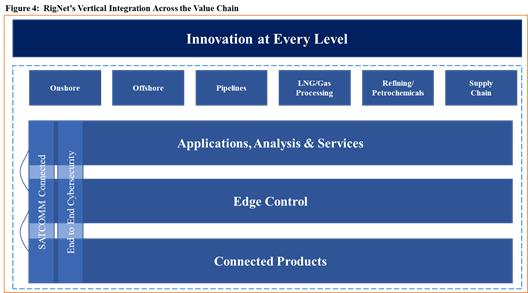
RigNet’s three revenue-generating operating segments can each stand alone as separate services, but many of our global customers are seeing the value in how these products stack together. This has the potential to create what we have termed a synergistic “Flywheel Effect,” illustrated in the graphic below. Customers who are embracing digital transformation are trying to unlock the operational technology potential of Industrial IoT. We believe this will create a proliferation of connected sensors, forming a large neural-network of data, wrapped in cybersecurity for protection and interpreted through SaaS-based machine learning platforms. Customers will be able to accelerate their time to value by working with a set of services that are already vertically integrated and optimized to work under the most extreme of operating conditions. This can lower their execution risk for complex systems integrations and reduce upfront capital risk as a fully-managed SaaS service. For RigNet, the effect creates new streams of revenue, while at the same time stimulates pull-through bandwidth demand for our core network services illustrated in figure 4 below.
9
The technology and remote telecommunications industries are highly dynamic and increasingly evolving with customer needs. We serve customers with customized communications, applications and cybersecurity solutions that connect to remote locations via networks, driving demand for reliable, managed communications services in a variety of environmental conditions. For several decades, our core customer base has primarily been off-shore and remote land oil and gas drilling contractors, exploration and production operators, and oilfield service companies. As part of our growth strategy, we seek to expand to other adjacent markets that share substantially similar technical requirements; these include: global enterprise, midstream pipelines, maritime, engineering and construction, disaster recovery services, banking and government verticals.
The customers we serve depend on maximum reliability, quality and continuity of products and services. Our customers also are generally geographically dispersed and/or have remote operations. These customers are particularly motivated to use secure and highly reliable communications networks because they may require:
|
|
• |
real-time data collection and transfer methods for safe and efficient operational coordination; |
|
|
• |
the ability to maintain safety standards and optimize performance; |
|
|
• |
data and network security designed to defend up to and against state-level actors’ threats; |
|
|
• |
access to key decision makers to enable customers to maximize safety, operational results and financial performance; and |
|
|
• |
access to the internet to allow rig crews and other employees in remote areas to keep in communication with their friends and family and for entertainment during their off-time. |
Our Customers, Their Industry, and Its Impact on RigNet
In 2019, almost all of RigNet’s revenue was derived from customers with some connection to the oil and gas industry. These included our traditional customers in the Upstream segment (drilling contractors, large integrated and independent oil and gas operating companies, and other oilfield service and maritime support companies, etc.), as well as customers in the Midstream segment (pipelines, LNG plants, etc.) and large Engineering, Procurement, and Construction companies working in the Downstream segment. Although no single customer accounted for 10.0% or more of revenue in 2019, our top 5 customers accounted for 25.9% of our total revenue for 2019.
The oil and gas industry is both cyclical and competitive. Our customers’ business plans and activities are significantly impacted by changes in, among other factors, oil and gas prices, global supply and demand for these commodities, geopolitical events, weather, and specific industry sub-segment dynamics (e.g., an oversupply of offshore drilling rigs). Commodity prices are volatile and it is not unusual for our customers to experience rapid increases or declines which can have both short- and long-term impacts on their spending patterns.
In response to continued low oil and gas prices, the industry reduced both capital and operating expenses significantly, negatively impacting RigNet’s business. Recovery for the industry has been challenging. However, 2018 and 2019 saw improved utilization levels for offshore drilling rigs, driven by offshore production declines. The industry we support has a proven resilient need for our advanced software and communications solutions to realize their digital transformation. Additionally, we saw more major construction projects approved for commencement. While we expect conditions for the industry to continue to improve gradually, our long-term growth strategy does not rely solely on significant increases in global offshore drilling activity.
Customer Contracts
In order to streamline the addition of new projects and solidify our position in the market, we have signed master service agreements with most customers. Generally, we prefer to sign long-term contracts with our customers to increase our confidence in our projected financial performance. Nevertheless, the nature of the oil and gas industry requires us to be flexible to ensure we meet the needs of our customers. The specific services being provided are defined under individual service orders that generally have a term of one to five years for offshore customers with renewal options. These contracts have provisions for early termination or reduced payments for warm or cold stacking of assets, with compensation paid to us based on an agreed formula. Land-based contracts are generally shorter term or terminable on short notice without penalty. Service orders are executed under the contracts for individual remote sites or groups of sites, and generally may be terminated early on short notice without penalty in the event of force majeure, breach of the agreement or cold stacking of a drilling rig.
10
RigNet’s basic strategy remains unchanged: accelerate digital transformation for our customers by leveraging our core MCS business and introducing new, value-added service solutions. The strategy is composed of three elements:
|
|
• |
expand the scale and scope of our services within our primary industry vertical, energy; |
|
|
• |
expand into adjacent industry verticals; and |
|
|
• |
acquire new capabilities and/or scale our business through selective mergers, acquisitions, or in-house development; |
As of December 31, 2019, our merger and acquisition activity has been paused as a result of our current debt load and our equity price. We expect to re-engage in M&A activity at the appropriate time. At this time, we believe that we have largely acquired the necessary capability set and that future merger and acquisition activity may be driven by our belief that networks benefit from scale.
Expand the scale and scope of our services
Our market presence and proven quality of service offer significant organic growth opportunities in energy segments adjacent to upstream where we are well-positioned to deliver remote communications solutions.
In the MCS segment, we seek to leverage our current strong market position in drilling rigs, production facilities, and support vessels to grow additional share. Because of established relationships with our customers, reliable and robust service offerings, and high-quality customer service, we believe that we are well-positioned to capture new build rigs that our customers add to their fleets as well as stacked rigs that are reactivated. We also seek to organically gain market share against our competitors. We are continuously working with our suppliers to ensure that we have the newest and most cost-effective solutions for our customers. We continue to grow our network as well. In 2019, we invested in our Gulf of Mexico communications infrastructure, which we believe is the largest over-water microwave-based network in the world. This upgrade, in a partnership with T-Mobile, added 4G LTE services and 5G capabilities to the pre-existing network to provide both enhanced fixed and mobile services to our customers. This LTE network supports a coverage area of more than 60,000 square miles. Furthermore, as the onshore unconventional drilling and production industry has continued to grow, we have expanded our services to include not only onshore drilling rigs, but other onshore oilfield service providers.
We also intend to expand our Apps & IoT market share on a stand-alone basis and by bundling our new capabilities, including machine learning and cybersecurity, with our MCS offerings for both existing and new customers. Our acquisition of Intelie in 2018 enabled us to offer new solutions to help customers across the value chain continue to focus on improving their operational and financial performance. Through Cyphre, we assist our customers in protecting their mission-critical data both onshore and offshore. Furthermore, we continue to develop additional applications via our internal development team, including AVI, CrewConnect™, and other solutions which deliver increased value to our customers. We have also continued to grow our presence in the IoT market, particularly in energy’s midstream segment, where our robust, bandwidth-optimized applications enable customers to safely, reliably, and efficiently monitor and manage their remote sites and networks.
We continue to seek to expand our Systems Integration market share by pursuing new Systems Integration customers and bids for projects globally to address the growing demand for the buildout of large capital projects. We expect to continue to target traditional upstream and downstream opportunities, such as new fixed production platforms or onshore operating shorebases, as well as expanding our opportunity set to include new FPSOs and midstream projects, such as remote LNG liquefaction facilities. Additionally, our Apps & IoT capabilities are opening opportunities to introduce our machine learning and other solutions to our customers on these projects. In 2019, our SI business pulled-through Intelie development work for a workforce tracking project. We are looking at ways to enhance the pull-through business our SI business generates for our other segments.
Expand into adjacent industry verticals
We believe revenue diversity is desirable in terms of product offerings as well as industry exposure. We also believe that networks benefit from scale regardless of which end markets we serve with our managed communications product. As such, we will continue to look for and review opportunities in other remote communications market adjacencies that offer significant opportunities for growth and where we are well positioned to take advantage of these opportunities such as aviation, government, and mining.
11
In 2017, we began to build new capabilities that would be complimentary both to our core MCS business and our improving SI business while enabling us to deliver secure, mission-critical solutions to enable our customers to enjoy the benefits of their digital transformation efforts. The graphic below illustrates our significant strategic acquisitions beginning in 2017, their timing, and our rationale for the transaction in terms of whether the acquired company added a capability, expanded our reach to more customers, or both.
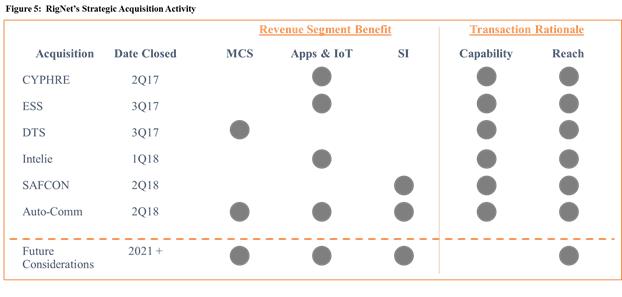
Cyphre was our first acquisition in 2017. As digital transformation efforts continue to touch every part of our customers’ businesses from offshore high-pressure blowout preventers to onshore operations planning, data security has become critical and Cyphre expanded our cybersecurity capabilities with advanced enterprise data protection by leveraging hardware-based encryption.
We acquired two additional companies in 2017, ESS and DTS. ESS expanded our product offering, added to our existing midstream SCADA customer portfolio, and strengthened our IoT market position. DTS enhanced our comprehensive communications and IT services to the onshore, offshore, and maritime industries, as well as disaster relief solutions to global corporate clients.
In 2018, we completed the acquisition of Intelie. Intelie is a real-time, predictive analytics company that combines operational expertise with a machine learning approach. Intelie facilitates innovation via Intelie Pipes, a distributed query language with a complex event processor to aggregate and normalize real-time data from a myriad of data sources. The Intelie platform empowers clients to make timely, data-driven decisions in mission-critical real-time operations, including drilling, and longer-term, data-intensive projects, such as well planning.
Finally, in 2018, we completed the separate, but related, acquisitions of Auto-Comm and SAFCON. Auto-Comm provided a broad range of communications services to the oil and gas industry for both onshore and offshore remote locations. Auto-Comm brought over 30 years of systems integration experience in engineering and design, installation, testing, and maintenance. SAFCON offers a diverse set of safety, security, and maintenance services to the oil and gas industry. Auto-Comm and SAFCON have developed strong relationships with major energy companies that complement the relationships that we have established over the years.
12
We believe that the capabilities acquired through this set of acquisitions have enabled us to provide a unique set of solutions to our customers that will help them to realize the benefits of their digital transformation efforts and provide us with a differentiating competitive advantage
Competitive Strengths
As a global technology company that provides customized communications services, applications, real-time machine learning, and cybersecurity solutions, our competitive strengths include:
|
|
• |
mission-critical services delivered by a trusted provider with global operations; |
|
|
• |
leading-edge technology with proven track record in-market; |
|
|
• |
high-quality customer support with full-time monitoring and regional service centers; |
|
|
• |
scalable systems using standardized equipment that leverage our global infrastructure; |
|
|
• |
customized Systems Integration solutions provided by expert telecoms systems engineers; |
|
|
• |
flexible, provider-neutral technology platforms; |
|
|
• |
long-term relationships with leading companies in the oil and gas, maritime, pipeline and engineering and construction industries; and |
|
|
• |
ability to design and implement a broad range of communication solutions using a range of frequencies and modes of communication. |
Mission-critical services delivered by a trusted provider with global operations: Our longstanding relationships with customers provide us with an in-depth understanding of the mission-critical needs of our customers that enables us to tailor our services to their requirements. Our global presence allows us to serve our clients around the world, except where government restrictions may apply. Our global terrestrial network also allows us to provide quality of service to prioritize various forms of data traffic for a more effective way to prioritize network traffic. Our ability to offer our customers global coverage sets us apart from regional competitors and allows us to match the breadth of our customers’ global operations and speed of deployment. The addition of Cyphre allows us to offer state-of-the-art encryption and network security services for the data communications necessary to safely and efficiently manage remote operations. In addition, our OTT offerings allow us to leverage our network to provide additional offerings for safety, business productivity improvement, and crew comfort.
Leading-edge technology with proven track record in-market: Our Intelie machine learning and real-time predictive analytics including Intelie Pipes and Intelie LIVE are optimized for remote locations in high-latency, high-packet loss environments. We also deliver Advanced Video Intelligence (AVI) and a wide range of Enhanced Cybersecurity Services (ECS), including a Security Operations Center (SOC), Cyphre encryption, AI-backed intrusion detection, conditional access, and security ratings. We also leverage third party relationships and technologies and have a proven track record of delivering technology in high latency remote locations that others lack.
High-quality customer support with full-time monitoring and regional service centers: Our global end-to-end owned and operated network allows us to provide high-quality customer care by enabling us to fully monitor our network. We can easily and rapidly identify and resolve any network problems that our customers may experience. As of December 31, 2019, we had 29 service operations centers and warehouses to support and service our customers’ remote sites. We maintain field technicians as well as adequate spare parts and equipment in these service operations centers. Our Global Customer Care (GCC) team staffs our Network Operations Center (NOC) and Security Operations Center (SOC) 24 hours per day, 365 days per year and provides engineering, service delivery, and change management to customers globally. We provide non-stop, end-to-end monitoring and technical support for every customer. This proactive network monitoring allows us to detect problems instantly and keep our services running at optimum efficiency. Fully managed technology is a key reason why we can support solutions that deliver high performance and new technologies that improve productivity.
Scalable systems using standardized equipment that leverages our global infrastructure: We have built our global satellite and terrestrial network with a sufficient amount of flexibility to support our growth. Our knowledge and capabilities can be applied to remote sites located anywhere in the world. We generally install standardized equipment at each remote site, which allows us to provide support and maintenance services for our equipment in a cost-efficient manner. Not all of the components of equipment that we install at each site are the same, but the components that vary are limited in number and tend to be the same for sites located in the same geography. As of December 31, 2019, we contracted capacity from 55 satellites that are co-located at 21 teleports and 27 datacenters
13
worldwide in order to provide our end-to-end solutions. By leasing rather than owning our satellite capacity and backhaul and owning the on-site equipment at each site, we are able to both minimize the capital investment required by the base network infrastructure and maintain the flexibility to install high-quality equipment at each site tailored to its locale and environmental conditions. We do own and manage the IP layer end-to-end. The standardized nature of our equipment minimizes execution risk, lowers maintenance and inventory carrying costs, and enables ease of service support. In addition, we are able to remain current with technology upgrades due to our back-end flexibility. Our product and service portfolio offers best-in-class technology platforms using the optimal suite of communications and networking capabilities for customers.
Customized Systems Integration solutions provided by expert telecoms systems engineers: We provide global customized Systems Integration solutions. As the demand for additional telecommunications products and telecoms systems increases with each new technological advance, the need for well-designed, efficient and reliable network infrastructures becomes increasingly vital to customers. Our solutions are custom-designed, built and tested by expert engineers based on the customer’s specifications and requirements, as well as international industry standards and best practices. For those customers requiring reliable remote communications services, maintenance and support services and customized solutions for their network infrastructures, RigNet provides a one-stop-shop to satisfy these demands.
Flexible, provider-neutral technology platform: Because we procure communications connections and network equipment from third parties, we are able to customize the best solution for our customers’ needs and reduce our required fixed capital investments. We aim to preserve the flexibility to select particular service providers and equipment so that we may access multiple providers and avoid downtime if any of our initial providers were to experience any problems. By procuring bandwidth from a variety of communications providers instead of owning our own satellites, we are able to minimize capital investment requirements and can expand our geographic coverage in response to customers’ needs with much greater flexibility.
Long-term relationships with leading companies in the oil and gas, maritime, pipeline, and engineering and construction industries: We have established relationships with some of the largest companies in the oil and gas, maritime, pipeline and engineering and construction industries. Some of our key customers are the leading drilling contractors around the world, with combined fleets of hundreds of rigs, as well as leading oil and gas, oilfield service, maritime, pipeline and engineering and construction companies. In most cases, these customers have high standards of service that favor strategic providers such as RigNet and work in partnership with us to serve their remote operations.
The ability to design and implement a broad range of communication solutions using a range of frequencies and modes of communication: We have the ability to design and implement a broad range of communication solutions using a range of frequencies and modes of communication. These modes of communication include wireless satellite Ku, Ka, C and L frequency bands, wireless WiMAX and Line-of-Sight (LOS) microwave, 3G and 4G LTE services, and 5G-capabilities. This range of communications solutions allows us to offer competitive and reliable communications solutions in a broad range of remote geographic locations where our customers operate. This helps us meet our customers’ requirements for choosing their provider(s) based on network availability while factoring in price.
Environmental, Social and Corporate Governance (ESG)
We believe that the digital transformation solutions that we deliver will lead to a safer and more sustainable energy industry. With our highly reliable network and real-time machine learning solutions, our customers can optimize the efficiency of their own operations and monitor and respond to high priority issues faster and with better information. Some of the solutions we have developed to enhance safety and sustainability include:
|
|
• |
Advanced Video Intelligence, which assists customers with real-time risk detection; |
|
|
• |
Machine learning applications for a) well planning and optimization of drilling operations leading to increased safety and efficiency and less demand on resources and b) fuel optimization for international shipping; |
|
|
• |
Workforce safety solutions including workforce tracking, which enables our customers to know where all employees are at safety-sensitive sites, and man-down technology, which enables customers to detect when an employee has fallen or become injured allowing for a speedier emergency response; and |
|
|
• |
Solutions that enable customers to detect and respond to faulty valves in environmentally sensitive areas. |
14
Finally, we are committed to practicing good corporate governance. We believe that a strong, diverse board and management, following good governance practices and engaging in robust discussion and debate will deliver better results to all of our stakeholders, including shareholders, customers, suppliers, employees, and the communities in which we work. We encourage investors to visit the Corporate Responsibility section of our website. The information found on our website is not incorporated into this Annual Report on Form 10-K.
Suppliers
Although we have preferred suppliers of technology, telecommunications, and networking equipment, nearly all technology utilized in our solutions is available from more than one supplier.
In addition, we do not rely on one satellite provider for our entire satellite bandwidth needs except for certain instances in which only one satellite bandwidth provider is available in an operating location, which is typically due to licensing restrictions or where only one satellite provider can offer a particular bandwidth. This approach generally allows us the flexibility to use the satellite provider that offers the best service for specific areas and to change providers if one provider experiences any problems.
Competition
The technology and remote telecommunications industry is highly competitive. We expect competition in the markets that we serve to persist, intensify and change. We face varying degrees of competition from a wide variety of companies, including potential new entrants from providers to adjacent vertical markets and from forward integration by some of our suppliers deeper in the industry value chain.
Our primary global competitor in MCS is Speedcast International Ltd. Both Panasonic, through its ITC Global subsidiary, and Tampnet have expanded their presence as active providers of communications services to the oil and gas, mining and maritime markets. We also compete with regional competitors in the countries in which we operate. Specifically, in our U.S. onshore operations, we face competition from: wireless network providers, drilling instrumentation providers, living quarters companies, and other pure-play providers like us.
With the downturn in the oil and gas industry, price-based competition has become more important. However, our customers require high quality and availability of the service as well as a provider with the ability to restore service quickly when there is an outage. Breadth of service offerings are also important to our oil and gas customers. Our customers depend on maximum availability, quality and continuity of products and services.
While we experience competition in our markets, we believe that our Apps & IoT offerings are a key differentiator that strategically aligns with our customers’ need to achieve digital transformation and business synergy goals. However, as our serviceable market has seen significant expansion due to our organic and inorganic growth in Apps & IoT, so has our competitor list. Our competitors now include IBM, Microsoft, Google, Kongsberg Gruppen and other smaller pure-play providers, as well as large, established oilfield technology providers like Schlumberger and Haliburton. Additionally, in the SI space, we compete primarily with ABB Ltd., Speedcast, and other construction contractors.
Our customers choose the accelerated speed and value created by a vertically aligned stack. We believe that we are unique in our vertical offering of Apps & IoT solutions over-the-top of our MCS offering.
Employees
As of December 31, 2019, we had approximately 625 full-time employees consisting of 296 in North America, 149 in Latin America, 105 employees in Europe/Africa and 75 employees in the Middle East and the Asia Pacific.
Geographic Information
See Note 12 — “Segment Information,” in our consolidated financial statements included in this Annual Report on Form 10-K for more information regarding revenues and assets attributable to our domestic and international operations.
Other Information
Corporate Structure and History
We were incorporated in Delaware on July 6, 2004. Our predecessor began operations in 2000 as RigNet, Inc., a Texas corporation. In July 2004, our predecessor merged into us. The communications services we provide to the
15
offshore drilling and production industry were established in 2001 by our predecessor, who launched initial operations in the Asia Pacific region. Through companies recently acquired, our experience dates back more than 40 years. We have since evolved into one of the leading global providers of remote communications services.
Principal Executive Offices
Our corporate headquarters is located at 15115 Park Row Blvd, Suite 300, Houston, Texas. Our main telephone number is +1 (281) 674-0100.
Company Website and Available Information
The Company’s internet website is www.rig.net. The information found on our website is not incorporated into this Annual Report on Form 10-K. The Company makes available free of charge on its website Annual Reports on Form 10-K, Quarterly Reports on Form 10-Q, Current Reports on Form 8-K, and amendments to those reports filed or furnished pursuant to Section 13(a) or 15(d) of the Securities Exchange Act of 1934, as amended (the Exchange Act). This information can also be found on the SEC website at www.sec.gov.
In addition, in the “Governance” section of the Investors page on our web site, we make available our code of ethics and business conduct, our corporate governance guidelines, the charters for our audit, compensation, and corporate governance and nominating committees and various other corporate governance policies and documents.
Additionally, in the “Corporate Responsibility link on our main website contains important information about our Environmental, Social and Governance (ESG) initiatives including relevant information on policies, safety performance, and employee statistics, as well as our commitment to following good corporate governance practices.
Smaller Reporting Company Status
In June 2018, the SEC issued Release 33-10513; 34-83550, Amendments to Smaller Reporting Company Definition, which changed the definition of a smaller reporting company in Rule 12b-2 of the Exchange Act. Under this release, the new thresholds for qualifying are (1) public float of less than $250 million or (2) annual revenue of less than $100 million and a public float of less than $700 million (including no public float). Under the amended rule, RigNet now qualifies as a smaller reporting company. A smaller reporting company may choose to comply with scaled or non-scaled financial and non-financial disclosure requirements on an item-by-item basis. The Company may determine to provide scaled disclosures of financial or non-financial information in future quarterly reports, annual reports and/or proxy statements if it remains a smaller reporting company under SEC rules.
Forward-Looking Statements
This Annual Report on Form 10-K contains forward-looking statements, within the meaning of Section 27A of the Securities Act of 1933, as amended, and Section 21E of the Exchange Act, as amended, that are subject to a number of risks and uncertainties, many of which are beyond the Company’s control. These statements may include statements about:
|
|
• |
new regulations, delays in drilling permits or other changes in the oil and gas industry; |
|
|
• |
competition and competitive factors in the markets in which we operate; |
|
|
• |
demand for our services and solutions; |
|
|
• |
the advantages of our services compared to others; |
|
|
• |
changes or advances in technology (including satellite capacity) and customer preferences and our ability to adapt our product and services offerings; |
|
|
• |
our ability to develop and maintain positive relationships with our customers; |
|
|
• |
our ability to retain and hire necessary employees and appropriately staff our marketing, sales and distribution efforts; |
|
|
• |
our cash and liquidity needs and expectations regarding cash flow from operations, capital expenditures and borrowing availability under our Revolving Credit Facility; |
|
|
• |
our expectations regarding the deductibility of goodwill for tax purposes; |
|
|
• |
our business and corporate development strategy, including statements concerning our plans regarding and ability to pursue, consummate and integrate merger and acquisition opportunities successfully; |
|
|
• |
the amount and timing of contingent consideration payments arising from our acquisitions; |
16
|
|
• |
our ability to develop and market additional products and services; |
|
|
• |
our cost reduction, restructuring activities and related expenses; and |
|
|
• |
our financial performance, including our ability to expand Adjusted EBITDA through our operational leverage. |
Forward-looking statements may be found in Item 1. “Business;” Item 1A. “Risk Factors;” Item 7. “Management’s Discussion and Analysis of Financial Condition and Results of Operations” and other items within this Annual Report on Form 10-K. In some cases, forward-looking statements can be identified by terminology such as “may,” “could,” “should,” “would,” “expect,” “plan,” “project,” “intend,”, “will”, “anticipate,” “believe,” “estimate,” “predict,” “potential,” “pursue,” “target,” “continue,” the negative of such terms and other comparable terminology that convey uncertainty of future events or outcomes. All of these types of statements, other than statements of historical fact included in this Annual Report on Form 10-K, are forward-looking statements.
The forward-looking statements contained in this Annual Report on Form 10-K are largely based on Company expectations, which reflect estimates and assumptions made by management. These estimates and assumptions reflect management’s best judgment based on currently known market conditions and other factors. Although the Company believes such estimates and assumptions to be reasonable, they are inherently uncertain and involve a number of risks and uncertainties beyond its control. In addition, management’s assumptions may prove to be inaccurate. The Company cautions that the forward-looking statements contained in this Annual Report on Form 10-K are not guarantees of future performance, and it cannot assure any reader that such statements will be realized, or the forward-looking statements or events will occur. Risks, uncertainties and other factors that may cause actual results to differ materially from those expressed or implied in the forward-looking statements include, without limitation:
|
|
• |
the effect of economic conditions in the oil and gas industry, including fluctuations in commodity prices and the level of oil and gas exploration, development and production; |
|
|
• |
the outcome of legal proceedings in which the Company is a party; |
|
|
• |
changes in the demand for our services and solutions; |
|
|
• |
the availability of labor at reasonable prices and/or rates of labor cost inflation; |
|
|
• |
changes in laws and regulations in the telecommunications, technology or oil and gas industries; |
|
|
• |
our ability to renew, extend or retain our contracts or to obtain new contracts with significant customers; |
|
|
• |
our lack of long-term, committed-volume purchase contracts with our customers; |
|
|
• |
increased competition and competitive factors in the markets in which we operate; |
|
|
• |
the concentration of our customer base as well as our dependence on a limited number of key customers; |
|
|
• |
our ability to protect our intellectual property and the cost of doing so; |
|
|
• |
our ability to extend our presence into other verticals and complementary remote communication segments; |
|
|
• |
our ability to increase secondary and tertiary customer penetration at remote sites; |
|
|
• |
the risk that we fail to fully realize the potential benefits of or have difficulty in integrating the companies we acquire or have already acquired; |
|
|
• |
our ability to develop and market additional products and services; |
|
|
• |
the possibility that we or our third-party providers may violate the complex regulatory schemes, including anti-corruption laws, in foreign countries in which we operate; |
|
|
• |
the impact on our business, or the business of our customers, as a result of credit rating downgrades and fluctuating interest rates; |
|
|
• |
changes in currency exchange rates; |
|
|
• |
our ability to comply with the financial covenants in our credit agreement and the consequences of failing to comply with such financial covenants; |
|
|
• |
changes in technology and customer preferences and our ability to adapt our product and services offerings; |
17
|
|
• |
the effect of changes in political conditions in the U.S. and other countries in which we operate; |
|
|
• |
the possibility that we, or our third-party providers, may experience equipment failures, natural disasters, cyber-attacks or terrorist attacks; |
|
|
• |
the possibility that we experience failures in compliance with applicable consumer-protection and data privacy laws and regulations; |
|
|
• |
the possibility that we are unable to operate in certain foreign countries due to export control laws; and |
|
|
• |
other risks and uncertainties described under “Item 1A. Risk Factors” and other sections in this Annual Report on Form 10-K and as included in our other filings with the U.S. Securities and Exchange Commission. |
If one or more of these factors materialize, or if any underlying assumptions prove incorrect, our actual future results, performance or achievements may vary materially from any projected future results, performance or achievements expressed or implied by these forward-looking statements. The forward-looking statements speak only as of the date made, and other than as required by law, the Company undertakes no obligation to publicly update or revise any forward-looking statement, whether as a result of new information, future events or otherwise.
Government Regulation
The following is a summary of the regulatory environment in which we currently operate and does not describe all present or proposed international, federal, state and local legislation and regulations affecting the communications industry, some of which may change the way the industry operates as a result of administrative or judicial proceedings or legislative initiatives. We cannot predict the outcome of any of these matters or the impact on our business.
The telecommunications industry is highly regulated. Most of the services we provide in our MCS segment require licenses or approvals from regulatory authorities in various countries. In the United States, we are subject to the regulatory authority of the Federal Communications Commission (FCC). Regulation of the telecommunications industry continues to change rapidly. Our U.S. services are currently provided on a private carrier basis, rather than a common carrier basis, and are therefore subject to lighter regulation under the U.S. Communications Act of 1934, as amended (the Act), and the regulations of the FCC. If the FCC determines that the services of RigNet or its subsidiaries constitute common carrier offerings subject to common carrier regulations, we may be subject to significant costs to ensure compliance with the applicable provisions of those laws and regulations. We may be subject to enforcement actions including, but not limited to, fines, cease and desist orders, or other penalties if we fail to comply with all applicable requirements.
For our U.S. business, we maintain licenses with rights to the electromagnetic spectrum, including fixed microwave licenses, very small aperture terminal (VSAT) earth station licenses, various private and commercial mobile radio service licenses, and various wireless licenses. Failure to maintain appropriate licenses could subject RigNet to fines imposed by the FCC.
The FCC constantly reviews spectrum policy to ensure it is in alignment with national communications strategy. One such example is the Facilitate America’s Superiority in 5G Technology (FAST), whereby the FCC aims to propel the United States into global 5G leadership. As part of such strategies, the FCC may decide to reallocate spectrum or introduce spectrum sharing among various services. If the FCC introduces spectrum sharing in the frequency bands where RigNet has existing licenses, the new services could cause harmful interference to RigNet’s network and thus degrade its quality. RigNet may not be able to migrate to other frequency bands without incurring significant equipment and logistics costs.
As a non-dominant international and domestic communications carrier, among other requirements, RigNet must pay various fees including contribution of a percentage of its revenues from telecommunications services to the FCC’s Universal Service Fund (USF) and other federal program funds to subsidize certain user segments, file various reports, and comply with rules that protect customer information and the processing of emergency calls. RigNet is also subject to the Communications Assistance for Law Enforcement Act (CALEA) and associated FCC regulations that require telecommunications service providers to configure their networks to facilitate electronic surveillance by law enforcement authorities.
Like the FCC, the state public utility commissions (PUCs) impose various regulatory fees, universal service requirements, reporting and prior approval requirements for transfer or assignments. The FCC and state PUCs have jurisdiction to hear complaints regarding the compliance or non-compliance with these and other carrier requirements of the Act and the FCC’s rules, and similar state laws and regulations.
18
If the FCC or any state PUC determines that RigNet has not complied with federal and/or state regulatory requirements, we may be subject to enforcement actions including, but not limited to, fines, cease and desist orders, license revocation, or other penalties.
Several proceedings pending before the FCC have the potential to significantly alter our USF contribution obligations. The FCC is considering: (1) changing the basis upon which USF contributions are determined from a revenue percentage measurement, as well as increasing the breadth of the USF contribution base to include certain services now exempt from contribution; (2) the classification of MPLS; and (3) the classification of various IP-enabled services. Adoption of these proposals could have a material adverse effect on our costs of providing service. We are unable to predict the timing or outcome of these proceedings. We cannot predict the application and impact of changes to the federal or state USF contribution requirements on the communications industry generally and on certain of our business activities in particular.
We must generally register to provide our telecommunications services in each country in which we do business. The foreign laws and regulations governing these services are often complex and subject to change with short or no notice. At times, the rigs or vessels on which our equipment is located and to which our services are provided will need to operate in a new location on short notice, and we must quickly make regulatory provisions to provide our services in such countries. Failure to comply with any of the laws and regulations to which we are subject may result in various sanctions, including fines, loss of authorizations and denial of applications for new authorizations or for renewal of existing authorizations.
We must comply with export control laws and regulations, trade and economic sanction laws and regulations of the United States and other countries with respect to the export of telecommunications equipment and services. State and local regulations additionally apply to certain aspects of our business. We are also subject to various anti-corruption laws, including the Foreign Corrupt Practices Act, that prohibit the offering or giving anything of value to government officials for the purpose of obtaining or retaining business or for gaining an unfair advantage.
Factors that could materially affect our business, financial position, operating results or liquidity and the trading price of our common stock are described below. This information should be considered carefully, together with other information in this report and other reports and materials we file with the SEC.
A large portion of our business fluctuates with the level of global oil and natural gas exploration, development and production, as a large portion of our customers are energy-related.
Demand for our remote communication services and collaborative applications depends on our customers’ willingness to make operating and capital expenditures to explore, develop and produce oil and natural gas. Our business will suffer if these expenditures decline. Our customers’ willingness to explore, develop and produce oil and natural gas depends largely upon prevailing market conditions that are influenced by numerous factors over which we have no control, including:
|
|
• |
the supply, demand and price expectations for oil and natural gas; |
|
|
• |
capital expenditure levels of producers of oil and natural gas and drilling contractors; |
|
|
• |
the addressable market and utilization rate for drilling rigs and oilfield services; |
|
|
• |
the ability of the Organization of Petroleum Exporting Countries (OPEC) or non-OPEC countries to influence and maintain production levels and pricing; |
|
|
• |
the worldwide political, regulatory and economic environment; |
|
|
• |
natural disasters, acts of war or terrorism, pandemics, or other “acts of God” affecting significant oil-importing countries, including the recent worldwide outbreak of coronavirus and its effect on travel, commerce and industry; |
|
|
• |
the degree to which alternative energy sources displace oil and natural gas; and |
|
|
• |
advances in exploration, development and production technology. |
Oil and gas prices are volatile, and the oil and gas business is cyclical. When prices are perceived as being too low to generate acceptable returns, companies reduce expenditures for exploration and production. Oil prices declined
19
significantly in the last quarter of 2018 and remained depressed throughout 2019. At the start of 2020, oil prices decreased further largely as a result of anticipated declines in demand from the coronavirus outbreak. Subsequently, in March 2020, the Saudi state producer, Aramco, reduced crude pricing in response to a split and price war with Russia. Following the Saudi reduction in pricing, Brent crude spot prices declined steeply to a mid-30 dollar per barrel range. As a result, we have seen a material decline in the demand for our products and services and significant pressure on the prices we can charge. Furthermore, our customers have experienced declines in their cash flows which has led to delays in payment, or nonpayment, for our products and services. Commodity price declines and increased volatility have particularly affected our customers’ budgets for offshore capital investments and expenditures, which has had a material and adverse effect on our addressable market.
Furthermore, the coronavirus has increased the volatility of oil and gas prices and has caused delays, supply chain disruptions and travel restrictions that have impacted the oil and gas industry and certain projects in the Asia Pacific region.
These conditions have had and may continue to have, a material adverse effect on our financial condition, results of operations and cash flows.
Continued growth in satellite capacity has adversely affected our MCS segment revenues.
New digital applications are driving demand growth for bandwidth in our core MCS segment. However, we also continue to see growth in available satellite capacity and expect that growth to continue over the intermediate-term. While we have experienced bandwidth price declines from our satellite suppliers, due to competition for our oil and gas customers and declining capital investment by our customers, we have passed much of our realized savings onto our customers. While our site count has increased in the MCS segment, our revenue has continued to decline. If satellite capacity growth continues to outstrip demand growth or is expected to continue, we may be forced to reduce our prices in the MCS segment further, which could have a material adverse effect on our financial condition, results of operations and cash flows.
If we fail to timely collect receivables, our business and financial results may be harmed.
Some of our customers in the oil and gas industry have been through bankruptcy proceedings or other restructurings. In addition, as the global oil and gas industry has continued to experience reduced activity, many of our customers have unilaterally extended their payment practices. We actively manage our credit exposures and accounts receivable collections, but restructuring or insolvency proceedings by our largest customers, or continued lengthening of payment cycles could significantly and materially harm our business, financial condition and results of operations.
Our industry is characterized by rapid technological change, and if we fail to keep pace with these changes or if access to telecommunications in remote locations becomes easier or less expensive, our business, financial condition and results of operations may be harmed.
Recently some remote communications providers are offering the use of LTE and high-throughput satellite (HTS) service, instead of or in addition to the conventional Ku-band and C-band satellite space segments used today. Our business may be harmed if our competitors are more successful than us in introducing LTE and or HTS services to meet customer needs.
If alternative telecommunications services to remote locations become more readily accessible or less expensive, our business will suffer. New disruptive technologies could make our VSAT-based networks or other services obsolete or less competitive than they are today, requiring us to reduce the prices that we are able to charge for our services or causing us to undergo expensive transitions to new technologies. We may not be able to successfully respond to new technological developments and challenges or identify and respond to new market opportunities, services or solutions offered by competitors. In addition, our efforts to respond to technological innovations and competition may require significant capital investments and resources. Furthermore, if we invest either organically or through acquisition in new technology and any such technology is not successful, our business, financial conditions and results of operations may be harmed.
Our business model has historically required significant capital expenditures to win new business. To the extent we are unsuccessful in shifting some of those capital expenditures to our customers or suppliers, our business, financial condition and results of operations may be harmed.
20
Historically we have purchased much of the equipment to provide new services to our customers and recovered the cost of that equipment through service charges over the life of the contract. This business model requires large capital expenditures at the start of new customer contracts. We are attempting to shift some of the upfront capital expenditures to our customers and/or suppliers through new contractual arrangements with them. However, we may be unsuccessful in shifting those required capital investments to our customers and/or suppliers. To the extent we are unable to finance growth capital or to change our business model, our business, financial condition and results of operations may be harmed. Furthermore, future new technologies could be capital intensive and may require capital expenditures in order for us to remain competitive.
Failure to obtain and retain skilled personnel could impede our business and growth strategy.
Our operations depend on a highly qualified executive, sales, technical, development, service and management team. Competition for personnel talent in the artificial intelligence, machine learning, engineering and cybersecurity industry is intense, and these roles are critical to our operation. Additionally, at our 2020 annual meeting of stockholders we are seeking approval to add additional shares to our 2019 Omnibus Incentive Plan. If stockholders fail to approve this amendment, we will not have sufficient shares available for future inducement and retention awards. If we are unable make future awards, our ability to attract and retain qualified personnel will be materially affected. Failure to attract, recruit, retain and develop qualified personnel could have a material adverse effect on our business, financial condition and results of operations.
In the event that our cybersecurity measures fail or are otherwise inadequate, our systems or reputation may be damaged which could harm our business, financial conditions and results of operations. Further, failure to comply with data privacy requirements applicable to us could result in costly regulatory enforcement actions and the imposition of significant penalties.
We rely heavily on information systems to run our business and our customers rely on our networks and security measures in running their businesses. Given that our customers own and operate critical infrastructure, the nature of cybersecurity threats are advanced and persistent. There can be no assurance that the systems we have designed to prevent or limit the effects of cyber incidents or attacks will be sufficient to prevent or detect such attacks. If such incidents or attacks do occur, they could have a material impact on our systems including degradation of service, service disruption, excessive call volume to call centers and damage to our facilities, equipment and data. In addition, we could be adversely affected by the theft or loss of confidential customer data or intellectual property. With the acquisition of Cyphre, we now market our cybersecurity services as an expertise. A successful cyberattack against us or one of our cybersecurity customers may create negative publicity resulting in reputation or brand damage with customers. We may be required to expend significant resources to protect against these events or to alleviate problems, including reputational harm, customer loss and litigation, caused by these events or the failure or inadequacy of our security systems, which could have a material adverse effect on our business, financial condition and results of operations.
Further, the regulatory framework for privacy issues worldwide is complex and evolving, and we believe it is likely to remain uncertain for the foreseeable future. Many federal, state and foreign government entities and agencies have adopted or are considering adopting laws and regulations regarding the collection, use and disclosure of personal information. In the United States, these include rules and regulations promulgated under the authority of the Federal Trade Commission and state breach notification laws. Internationally, certain of the jurisdictions in which we operate have established their own data security and privacy legal framework with which we must comply. For example, the European Union has issued the General Data Protection Regulation (GDPR), which applies to anyone doing business in Europe. In general, GDPR sets a higher bar for privacy compliance, including new data subject rights, new mandatory security breach notification requirements, requirements to conduct data protection impact assessments and extensive record-keeping requirements. Failure to comply with GDPR can have significant consequences, including substantial fines and reputational damage. We continue to analyze the GDPR in respect of its burden and applicability to our global business operations. We may fail to comply with any of these requirements, and compliance with these requirements may increase our compliance burden and costs.
We have made and may in the future make selective acquisitions. We may not be able to identify suitable acquisition candidates or consummate acquisitions on acceptable terms, or we may be unable to successfully integrate acquisitions, or such acquisitions may underperform, which could disrupt our operations and adversely impact our business and operating results.
21
Although we presently do not have any acquisitions under consideration as of this filing, acquisitions have been a critical part of our strategy in the past and maybe in the future. Acquisitions involve certain known and unknown risks that could cause our actual growth or operating results to differ from our expectations. For example:
|
|
• |
we may not be able to identify suitable acquisition candidates or to consummate acquisitions on acceptable terms; |
|
|
• |
we may pursue international acquisitions, which inherently pose more risks than domestic acquisitions; |
|
|
• |
we compete with others to acquire complementary products, technologies and businesses, which may result in decreased availability of, or increased price for, suitable acquisition candidates; |
|
|
• |
we may not be able to obtain the necessary financing, on favorable terms or at all, to finance any or all of our potential acquisitions; |
|
|
• |
we may ultimately fail to consummate an acquisition even if we announce that we plan to acquire technology, product or business; and |
|
|
• |
acquired technologies, products or businesses may not perform as we expect, and we may fail to realize anticipated revenues and profits. |
In addition, our acquisition strategy may divert management’s attention away from our existing business, resulting in the loss of key customers or employees, and expose us to unanticipated problems or legal liabilities, including responsibility as a successor for undisclosed or contingent liabilities of acquired businesses or assets.
If we fail to conduct due diligence on our potential targets effectively, we may not identify problems at target companies or fail to recognize incompatibilities or other obstacles to successful integration. Our inability to successfully integrate future acquisitions could impede us from realizing all of the benefits of those acquisitions and could severely weaken our business operations. The integration process may disrupt and, if new technologies, products or businesses are not implemented effectively, may preclude the realization of the full benefits expected by us and could harm our results of operations. In addition, the overall integration of new technologies, products or businesses may result in unanticipated problems, expenses, liabilities and competitive responses. The difficulties in integrating acquisitions include, among other things:
|
|
• |
maintaining employee morale and retaining key employees; |
|
|
• |
integrating the cultures of both companies; |
|
|
• |
integrating IT systems, internal control environments, accounting and back-office functions; |
|
|
• |
preserving important strategic customer relationships; |
|
|
• |
consolidating corporate and administrative infrastructures and eliminating duplicative operations; and |
|
|
• |
coordinating and integrating geographically separate organizations. |
In addition, even if we integrate successfully the operations of an acquisition, we may not realize the full benefits of the acquisition, including the synergies or growth opportunities we expect. These benefits may not be achieved within the anticipated time frame, or at all.
Further, acquisitions may cause us to:
|
|
• |
issue common stock that would dilute our current stockholders’ ownership percentage; |
|
|
• |
use a substantial portion of our cash resources; |
|
|
• |
increase our interest expense, leverage and debt service requirements if we incur additional debt or contingent consideration to pay for an acquisition; |
|
|
• |
assume liabilities for which we do not have indemnification from the former owners, or we have disputed or uncollectible indemnification from the former owners; |
|
|
• |
record goodwill and non-amortizable intangible assets that are subject to impairment testing and potential impairment charges; |
22
|
|
• |
experience volatility in earnings due to changes in contingent consideration related to acquisition earn-out liability estimates; |
|
|
• |
incur amortization expenses related to certain intangible assets; |
|
|
• |
lose existing or potential contracts as a result of conflict of interest issues; |
|
|
• |
become subject to adverse tax consequences or deferred compensation charges; |
|
|
• |
incur large and immediate write-offs; or |
|
|
• |
become subject to litigation. |
Furthermore, our acquisitions may not yield the value anticipated at the time of the acquisition, or may underperform.
Attempts to enter new verticals may not be successful.
As part of our growth strategy, we attempt to enter new verticals, and offer new and innovative products and services. We have and intend to enter new verticals and launch new products both organically and through selective mergers and acquisitions. Our attempts to enter new verticals and launch new products and services may not be successful, costing us money and diverting management time and attention.
Our customers may terminate many of our contracts on short notice without penalty, which could harm our business, financial condition and results of operations.
Customers may switch service providers without incurring significant expense relative to the annual cost of the service. Our contracts generally provide that in the event of prolonged loss of service or for other good reasons, our customers may terminate service without penalty. In addition, some of our contracts may be terminated by our customers for no reason and upon short notice. Terms of contracts typically vary with a range from short-term call out work to five years. Work orders placed under such agreements may have shorter terms than the relevant customer agreement. As a result, we may not be able to retain our customers through the end of the terms specified in the contracts, resulting in harm to our business, financial condition and results of operations.
Our updated credit agreement requires us to maintain certain financial covenant ratios. These ratios may limit our capacity to finance our growth strategy and operations. Furthermore, if we fail to comply with the covenants contained in our credit facility, including as a result of events beyond our control, technical or other default could result, which could materially and adversely affect our operating results and our financial condition.
Our credit agreement contains certain covenants and restrictions, including restricting the payment of cash dividends under default and maintaining certain financial covenants such as a consolidated fixed charge coverage ratio of not less than 1.25 to 1.00. Additionally, the Credit Agreement requires a consolidated leverage ratio, as defined in the Credit Agreement, of less than or equal to 3.25 to 1.00 as of December 31, 2019. The consolidated leverage ratio then decreases to 3.00 to 1.00 for three quarters as of June 30, 2020, and then decreases to 2.75 to 1.00 for all remaining quarters. If any default occurs related to these covenants that is not cured or waived, the unpaid principal and any accrued interest can be declared immediately due and payable. The facilities under the credit agreement are secured by substantially all the assets of the Company.
If we approach our covenant limits, we will be limited in our ability to finance capital and operating expenditures and any acquisitions we may pursue in the future. Should this happen we would pursue additional financing, through either debt and / or equity offerings. We may incur financing and legal fees attempting to amend our current Credit Agreement, or in pursuing other debt and or equity financing. If additional capital is needed, we may not be able to obtain debt or equity financing on terms acceptable to us, if at all.
Our growth strategy may require substantial capital expenditures. We may be unable to obtain required capital or financing on satisfactory terms.
To support our growth strategy, we expect to continue to make substantial capital expenditures and may in the future make select acquisitions. Many of our customers now demand newer HTS services, requiring significant capital expenditures to upgrade equipment. We expect to fund capital expenditures and acquisitions, if any, with cash generated by operations and borrowings under our revolving credit facility or capital markets transactions; however, our financing needs may require us to alter or increase our capitalization substantially through the issuance of debt or
23
equity securities. The issuance of additional indebtedness would require that a portion of our cash flow from operations be used for the payment of interest and principal on our indebtedness, thereby reducing our ability to use cash flow from operations to fund working capital, capital expenditures and acquisitions. Furthermore, raising equity capital would generally dilute existing stockholders. If additional capital is needed, we may not be able to obtain debt or equity financing on terms acceptable to us, if at all.
Our strategy of moving up the technology stack entails entering new business lines that could fail to attract or retain users or generate revenue.
A key element of our growth strategy is to move up the technology stack, that is to leverage our existing network to provide application layer solutions to our network customers. In 2017, we began reporting a new segment, Apps & IoT, to capture results from these new OTT services, such as SCADA, MetOcean, BlackTIE, CyphreLink and Advanced Video Intelligence. In addition, in 2018, we acquired Intelie which provides us a real-time machine-to-machine learning offering, Intelie LIVE. We continue to expect to invest in new lines of business, new products and other new initiatives to generate revenue. Our customers may not adopt some of our new offerings. These offerings may present new and difficult technology challenges, and we may be subject to claims if customers of these offerings experience service disruptions or failures or other quality issues. In addition, profitability, if any, in our newer activities may be lower than in our older activities, and we may not be successful enough in these newer activities to recoup our investments in them. Furthermore, efforts at establishing new lines of business could divert management attention from our core MCS network and Systems Integration businesses. If any of this were to occur, it could damage our reputation, limit our growth and negatively affect our operating results.
We rely on third parties, particularly satellite owners, to provide products and services for the operation of our business. Failures by third-party providers have caused, and in the future could cause, service interruptions, harm our business and reputation and result in loss of customers and revenue.
A significant part of our operations and growth depends on third-party providers delivering reliable communications connections, networks, equipment, maintenance, repair and satellite transponder capacity, subjecting our business, reputation and customer revenue to risks beyond our control, such as:
|
|
• |
telecommunications, satellite manufacturing, equipment or control system errors, faults or failures; |
|
|
• |
saturation of communication connection points, networks and third-party facilities; |
|
|
• |
in-orbit risks for satellites including malfunctions, commonly referred to as anomalies, and collisions with meteoroids, decommissioned spacecraft or other space debris; |
|
|
• |
lack of communication service alternatives, including failure of satellite providers to timely replace aging satellites with more modern technology and updated capacities; |
|
|
• |
human error; |
|
|
• |
natural disasters; |
|
|
• |
power loss; |
|
|
• |
labor strikes or work stoppages; |
|
|
• |
unauthorized access or security risks; and |
|
|
• |
sabotage or other intentional acts of vandalism, terrorism or war. |
Our results in 2019, 2018 and 2017 were negatively impacted by certain satellite outages and interruptions by certain of our providers. These incidents caused RigNet to lose forecasted revenues and to experience increased costs as we had to make alternative arrangements for our customers. We cannot assure you that we will not suffer future satellite outages or that any potential future outage will not have a material impact on our business, results of operations or financial condition. Under most of our contracts with satellite service providers, our satellite service providers do not indemnify us for such loss or damage to our business resulting from certain risks, including satellite failures. If any potential claims result in liabilities, we could be required to pay damages or other penalties.
If we lose the right to use or upgrade any products or services provided by a third-party, our customers could experience delays or be unable to access our own services until we can obtain and integrate equivalent technology. There might not always be commercially reasonable hardware or software alternatives to the third-party infrastructure,
24
products and services that we currently license for our operations. Any such alternatives could be more difficult or costly to replace than the third-party infrastructure, products and services we currently use, and integration of the alternatives into our operations could require significant work and substantial time and resources. Any delays or failures associated with our operations may injure our reputation with customers and potential customers and result in an adverse effect on our business, results of operations and financial condition.
Failure of our Line-of-Site network or loss of platform access could materially impact our results of operations.
Our microwave network is a Line-of-Site (LOS) system that operates by relaying microwave communications from one microwave site to another that must be within visible sight. Furthermore, our LTE network is built on the existing infrastructure of our microwave network. We secure access to our customers’ offshore platforms to house our LOS, microwave and LTE network, but the agreements are subject to termination for various reasons, including decommissioning of the platform. When a microwave site on a microwave relay is rendered inoperable subsequent dependent sites can also be rendered inoperable. As such the risk of a LOS, microwave or LTE site being rendered inoperable by weather, technical failure, loss of access to an operator’s platform space or other means will likely negatively affect other dependent microwave sites. We do not insure for loss of a LOS, microwave or LTE site or business interruption caused by the loss of such a site as we believe the cost of such insurance outweighs the risk of potential loss, so the loss of a LOS, microwave or LTE site or any business interruption could require us to spend significant capital to restore network service and / or harm our business, financial condition and results of operations.
We are subject to anti-corruption and export control laws that have stringent compliance standards.
We are subject to a number of applicable export control laws and regulations of the United States as well as comparable laws of other countries. We cannot provide services to or in certain countries subject to United States trade sanctions administered by the Office of Foreign Asset Control of the United States Department of the Treasury or the United States Department of Commerce unless we first obtain the necessary authorizations. If our customers move their sites into countries subject to certain sanctions, we may not be able to serve them, in which case, our revenues will be adversely impacted, and we may incur additional costs. In addition, we are subject to the Foreign Corrupt Practices Act and other anti-corruption laws that, generally, prohibit bribes or unreasonable gifts to governments or officials. Violations of these laws or regulations could result in significant additional sanctions including fines, more onerous compliance requirements, and more extensive debarments from export privileges or loss of authorizations needed to conduct aspects of our international business. In certain countries, we engage third-party agents or intermediaries to act on our behalf in dealings with government officials, such as customs agents, and if these third-party agents or intermediaries violate applicable laws, their actions may result in penalties or sanctions being assessed against us.
Many of our potential customers are resistant to new solutions and technologies, which may limit our growth.
Although there is a strong focus on technology development within the oil and gas industry, some of the companies in the upstream oil and gas industry are relatively conservative and risk-averse with respect to adopting new solutions and technologies in the area of remote communications. As a result of the sustained downturn in oil and gas prices, many of our customers focus on price rather than the value new technologies bring them, further slowing the uptake of new solutions and technologies. Some drilling contractors, oil and gas companies and oilfield service providers may choose not to adopt new solutions and technology, such as our OTT offerings, which may limit our growth potential.
Systems Integration projects are heavily dependent on cost, productivity, schedule and performance management.
We account for Systems Integration contracts using accounting rules for construction-type contracts. Factors that may affect future project costs and margins include the price and availability of labor, equipment and materials, productivity, as well as the time necessary to obtain approvals and permits. If we make inaccurate estimates, or if we find errors or ambiguities as to contract specifications or if circumstances change due to, among other things, unanticipated technical problems, changes in local labor conditions, weather delays, changes in the costs of equipment and materials, or our suppliers’ or subcontractors’ inability to perform, or changes in foreign exchange rates, then cost overruns may occur. We may be required to pay liquidated damages upon our failure to meet schedule or performance requirements of our contracts. In accordance with the accounting guidance, we would record a cumulative adjustment to reduce the margin previously recorded on the related project in the period a change in estimate is needed. If the contract is significant, or we encounter issues that impact multiple contracts, cost overruns could have a material adverse effect on our business, financial condition and results of operations.
25
The uncertainty of our contract award timing can also present difficulties in matching workforce size with contract needs. In some cases, we maintain and bear the cost of a ready workforce that is larger than necessary under existing contracts in anticipation of future workforce needs for expected contract awards. If an expected contract award is delayed or not received, we may incur additional costs resulting from reductions in staff or redundancy of facilities which could have a material adverse effect on our business, financial condition and results of operations.
Furthermore, Systems Integration contracts can require performance bonds, surety bonds and similar instruments. Any inability to secure required performance bonds, surety bonds and similar instruments, could limit business. Although we have not previously had performance bonds, surety bonds and similar instruments called, should such instruments be called in the future, it could have a material adverse effect on our business, financial condition and results of operations.
A significant portion of our revenue is derived from a relatively small number of customers and the loss of any of these customers would materially harm our business, financial condition and results of operations.
Although we continue to diversify our customer base, we still receive a significant portion of our revenue from a relatively small number of large customers, among them being Royal Dutch Shell Plc, Valaris Plc, John Wood Group Plc, BP Plc, Baker Hughes Company, Seadrill Ltd., Bechtel Corporation, Halliburton Company, McDermott International, Chevron Corporation and Veripos Inc.. Although none of these customers represents more than 10% of our annual revenue, should one or more of these customers terminate or significantly reduce their business with us and we were not able to replace such revenue, our business, financial condition and results of operations would be materially harmed. As our top customers are concentrated in energy, should there be any adverse impact on the energy business that caused our customers to reduce demand for our services our financial condition and results of operations would be materially harmed.
We may not be able to compete successfully against current and future competitors.
We expect both product and pricing competition to persist and intensify. Increased competition could cause reduced revenue, price reductions, reduced profits and loss of market share. Our industry is characterized by competitive pressures to provide enhanced functionality for the same or lower price with each new generation of technology. Our primary global competitor is Speedcast International Ltd. Panasonic, through its ITC Global subsidiary, and Tampnet Inc. have begun to expand their presence as active providers of communications services to the oil and gas, mining and maritime markets. We also compete with regional competitors in the countries in which we operate. In addition, in certain markets outside of the U.S., we face competition from local competitors that provide their services at a lower price due to lower overhead costs, including lower costs of complying with applicable government regulations and their willingness to provide services for a lower profit margin. Furthermore, in the Apps and IoT space we compete with IBM, Microsoft, Google, Kongsberg Gruppen and other smaller pure-play companies, as well as large, established oilfield technology providers like Schlumberger and Haliburton. Additionally, in the SI space, we compete primarily with Speedcast and ABB Ltd and other construction contractors. Strong competition and significant investments by competitors to develop new and better solutions may make it difficult for us to maintain our customer base, force us to reduce our prices or increase our costs to develop new solutions.
Furthermore, competition may emerge from companies that we have not previously perceived as competitors or consolidation of our industry may cause existing competitors to become bigger and stronger with more resources, market awareness and market share. For example, we have experienced customer projects where we have bid directly against some of our satellite bandwidth providers, either acting alone or in conjunction with one of our direct competitors. Competition with our satellite bandwidth providers, either alone or in restrictive arrangements with our suppliers or competitors may materially and adversely affect the availability and pricing of our products and services.
As we expand into new markets, we may experience increased competition from some of our competitors that have prior experience or other business in these markets or geographic regions. In addition, some of our customers may decide to insource some of the MCS solutions that we provide, in particular our terrestrial communication services (e.g., Line-of-Site (LOS) or Worldwide Interoperability for Microwave Access (WiMAX)), which do not require the same level of maintenance and support as our other services. Our success will depend on our ability to adapt to these competitive forces, to adapt to technological advances, to develop more advanced services and solutions more rapidly and less expensively than our competitors, to continue to develop and deepen our global sales and business development network, and to educate potential customers about the benefits of using our solutions rather than our competitors’ services or in-sourced solutions. Our failure to successfully respond to these competitive challenges could harm our business, financial condition and results of operations.
26
Our international operations are subject to additional or different risks than our United States operations, which may harm our business and financial results.
We operate in many countries around the world, including countries in Asia, the Middle East, Africa, Latin America and Europe and intend to continue to expand the number of countries in which we operate. However, because operations in some countries may be temporary, the total number of countries in which we operate fluctuates. There are many risks inherent in conducting business internationally that are in addition to or different than those affecting our United States operations, including:
|
|
• |
foreign laws and regulations that may be vague or arbitrary, lack traditional concepts of due process, and be subject to unexpected changes or interpretations, resulting in difficulty enforcing contracts or timely collection of receivables; |
|
|
• |
tariffs, import and export restrictions and other trade barriers; |
|
|
• |
difficulty in staffing and managing geographically dispersed operations and culturally diverse work forces in countries with varying employment laws and practices including restrictions on terminating employees; |
|
|
• |
increased travel, infrastructure and legal compliance costs associated with multiple international locations; |
|
|
• |
differing technology standards; |
|
|
• |
currency exchange rate fluctuation and currency controls; |
|
|
• |
potential political and economic instability, which may include military conflict, nationalization or expropriation; |
|
|
• |
potentially adverse tax consequences; |
|
|
• |
difficulties and expense of maintaining international sales distribution channels; and |
|
|
• |
difficulties in maintaining and protecting our intellectual property. |
The authorities in the countries where we operate may introduce additional regulations for the oil and gas and communications industries. New rules and regulations may be enacted, or existing rules and regulations may be applied or interpreted in a manner which could limit our ability to provide our services. Recently, some of our foreign telecommunications regulators have adopted new interpretations of existing regulations when we have renewed our licenses, causing increased costs in certain jurisdictions. Future amendments to current laws and regulations governing operations and activities in the oil and gas industry and telecommunications industry could harm our operations and financial results. Compliance with and changes in tax laws or adverse positions taken by taxing authorities could be costly and could affect our operating results.
Compliance related tax issues could also limit our ability to do business in certain countries. Changes in tax laws or tax rates, the resolution of tax assessments or audits by various taxing authorities, disagreements with taxing authorities over our tax positions and the ability to fully utilize our tax loss carry-forwards and tax credits could have a significant financial impact on our future operations and the way we conduct, or if we conduct, business in the affected countries.
Our intellectual property rights are valuable, and any failure or inability to sufficiently protect them could harm our business and our operating results.
We own, and maintain certain intellectual property assets, including patents, patent applications, copyrights and trademarks, trade secrets, and rights to certain domain names, which we believe are collectively among our most valuable assets. We seek to protect our intellectual property assets through the laws of the U.S. and other countries of the world, and through contractual provisions. However, the efforts we have taken to protect our intellectual property assets and proprietary rights might not be sufficient or effective at stopping unauthorized use of those rights. If we are unable to protect our proprietary rights from unauthorized use, the value of our intellectual property assets may be reduced.
Internal restructuring activities may negatively impact the Company.
Reductions in resources may adversely affect or delay various sales, marketing, product development and operational activities, which could have a material adverse effect on our financial results. Additionally, restructuring activities could have negative effects on our internal control over financial reporting and employee morale.
27
Information technology infrastructure and systems are critical to supporting our operations, accounting and internal controls; any potential failure of our information technology infrastructure or systems could adversely affect our business, financial conditions and results of operations.
We continue to update and enhance our information systems. If a problem occurs that impairs or compromises this infrastructure, systems upgrades and/or new systems implementations; the resulting disruption could impede our ability to perform accounting, invoice, process orders, generate management reports or otherwise carry on business in the normal course. Any such events could cause us to lose customers and/or revenue and could require us to incur significant expenses to remediate. Additionally, any such events could adversely harm our legal, accounting and compliance capabilities including but not limited to: our ability to (i) timely file reports with the SEC; (ii) maintain effectiveness of internal control; (iii) timely file financial statements required by certain statutes; (iv) timely file compliance reports with our lenders under our credit agreement; and (v) timely file income taxes with the IRS, foreign taxing authorities, and local taxing authorities.
Severe weather in the Gulf of Mexico or other areas where we operate could harm our business, financial condition and results of operations.
Certain areas in and near the Gulf of Mexico and other areas in which our clients operate experience unfavorable weather conditions, including hurricanes and other extreme weather conditions, on a relatively frequent basis. A major storm or threat of a major storm in these areas may harm our business. Our clients’ drilling rigs, production platforms and other vessels in these areas are susceptible to damage and/or total loss by these storms, which may cause them to no longer need our communication services. Our equipment on these rigs, platforms or vessels could be damaged causing us to have service interruptions and lose business or incur significant costs for the replacement of such equipment. Even the threat of a very large storm will sometimes cause our clients to limit activities in an area and thus harm our business. Changing weather conditions could impair satellite connectivity, cause more sites to be shut down and generally cause activities to be limited so that our business may be harmed. This risk is more pronounced for LOS microwave service, as there is a likely loss of service for multiple subsequent microwave sites in the network relay.
Changes in the regulatory framework under which we operate could adversely affect our business prospects or results of operations.
Our U.S. services are provided on a private carrier basis. As such, these services are subject to light or no regulation by the FCC and state PUCs. If the FCC or one or more PUCs or any other telecommunications regulator determine that these services or the services of our subsidiaries or affiliates constitute common carrier offerings or change the regulations applicable to private carriers, we may be subject to significant costs to ensure compliance with the applicable provisions of those laws and regulations. We may be subject to enforcement actions including, but not limited to, fines, cease and desist orders, or other penalties if we fail to comply with those requirements.
Our international operations are also regulated by various non-U.S. governments and international bodies. These regulatory regimes frequently require that we maintain licenses for our operations and conduct our operations in accordance with prescribed standards and requirements. The adoption of new laws or regulations, changes to the existing regulatory framework, new interpretations of the laws that apply to our operations, or the loss of, or a material limitation on, any of our material licenses could materially harm our business, results of operations and financial condition. Recently, some of our foreign telecommunications regulators have adopted new interpretations of existing regulations when we have renewed our licenses, causing increased costs in certain jurisdictions.
The FCC is considering reallocating 6 GHZ technology to allow unlicensed use of this spectrum. Much of our Gulf of Mexico backbone network traffic is carried over 6 GHZ spectrum which we own. Unlicensed use of this spectrum could interfere with our client’s safety critical communications and degrade our overall network performance. Any such interference or degradation of performance could have a material adverse effect on our business, financial condition and results of operations.
If we infringe, or if third parties assert that we infringe, third-party intellectual property rights we could incur significant costs and incur significant harm to our business.
Third parties may assert infringement or other intellectual property claims against us, which could result in substantial damages if it is ultimately determined that our services infringe a third-party’s proprietary rights. Even if claims are without merit, defending a lawsuit takes significant time, may be expensive and may divert management’s attention from our other business concerns.
28
Many of our contracts are governed by the laws of countries that may make them difficult or expensive to interpret or enforce.
Many of our contracts are governed by the laws of countries other than the U.S., which may create both legal and practical difficulties in case of a dispute or conflict. We operate in regions where the ability to protect contractual and other legal rights may be limited. In addition, having to pursue arbitration or litigation in some countries may be more difficult or expensive than pursuing litigation in the United States.
Some of our stockholders could exert control over the Company.
As of February 28, 2020, funds associated with Kohlberg Kravis Roberts & Co. L.P., or KKR, owned in the aggregate shares representing approximately 25.0% of our outstanding voting power and have a seat on our board of directors. Additionally, as of February 28, 2020, funds associated with FMR, LLC, owned in the aggregate shares representing approximately 14.8% of our outstanding voting power, and funds associated with Arrowmark Colorado Holding, LLC, owned in the aggregate shares representing approximately 14.2% of our outstanding voting power. As a result, any of these stockholders could potentially exert significant influence over all matters presented to our stockholders for approval, including election or removal of our directors and change of control transactions. The interests of these stockholders may not always coincide with the interests of the other holders of our common stock.
We are subject to fluctuations in currency exchange rates and limitations on the expatriation or conversion of currencies, which may result in significant financial charges, increased costs of operations or decreased demand for our services and solutions.
During the year ended December 31, 2019, 9.4% of our revenues were earned in non-U.S. currencies, while a significant portion of our capital and operating expenditures and all of our outstanding debt, was priced in U.S. dollars. In addition, we report our results of operations in U.S. dollars. Accordingly, fluctuations in exchange rates relative to the U.S. dollar could have a material effect on our reported earnings or the value of our assets. In the future, a greater portion of our revenues may be earned in non-U.S. currencies, increasing this risk of fluctuations in exchange rates.
Any depreciation of local currencies in the countries in which we conduct business may result in increased costs to us for imported equipment and may, at the same time, decrease demand for our services and solutions in the affected markets. If our operating companies distribute dividends in local currencies in the future, the amount of cash we receive will also be affected by fluctuations in exchange rates. In addition, some of the countries in which we have operations do or may restrict the expatriation or conversion of currency making such cash unavailable for financing of our global operations and capital investments.
Furthermore, a majority of our cash balances are held outside of the United States. Repatriating cash to the United States can require paying taxes in one or more countries making the cash available to us less than that reported in our financial statements.
The average daily trading volume of our common stock is low, which can cause price volatility unrelated to our actual operations and performance.
The average daily trading volume of our common stock in 2019 was approximately 49 thousand shares. Due to the low trading volume, our common stock may be subject to more market volatility than other more liquid stocks, without regard to our performance. Stock price volatility and sustained decreases in our share price could subject our stockholders to losses and subject us to takeover bids or lead to action by NASDAQ. The trading price of our common stock has been, and may continue to be, subject to fluctuations in price in response to various factors, some of which are beyond our control, including, but not limited to:
|
|
• |
quarterly announcements and variations in our results of operations or those of our competitors, either alone or in comparison to analysts’ expectations or prior Company estimates, including announcements of site counts, rates of churn, loss of a material customer, and operating margins that would result in downward pressure on our stock price; |
|
|
• |
the cost and availability or perceived availability of additional capital and market perceptions relating to our access to this capital; |
|
|
• |
announcements by us or our competitors of acquisitions, new products or technologies; |
29
|
|
• |
changes in the valuation of our deferred tax assets; |
|
|
• |
any significant change in our board of directors or management; and |
|
|
• |
perceptions of general market conditions in the technology and communications and oil and gas industries, the U.S. economy and global market conditions. |
In addition, we have little research analyst coverage which could lead to less independent analysis for stockholders.
We are a smaller reporting company and, as such, our common stock may be less attractive to investors.
We are a smaller reporting company, (i.e. a company with less than $250 million of public float) and we are eligible to take advantage of certain exemptions from various reporting requirements applicable to other public companies. We cannot predict if investors will find our common stock less attractive as a result of our smaller reporting company status. If some investors find our common stock less attractive as a result of our choices, there may be a less active trading market for our common stock and our stock price may be more volatile.
Item 1B. Unresolved Staff Comments
Not applicable.
Facilities
We lease 28,808 square feet of headquarters office space located in Houston, Texas. The term of this lease runs through June 2025. We also own a custom built, approximately 26,000 square foot facility in Aberdeen, Scotland and a 55,000 square foot facility in Lafayette, Louisiana.
We have other offices under lease in Denver, Colorado; Stavanger, Norway; Doha, Qatar and Singapore, and additional leased offices, warehouses and service centers in the United States, Brazil, Mexico, Nigeria, Malaysia, Australia, United Arab Emirates and Saudi Arabia. We believe our facilities are adequate for our current needs and for the foreseeable future.
In June 2019, the Company announced that it reached a settlement with Inmarsat plc that concludes the GX Dispute. Pursuant to the settlement the Company paid $45.0 million in June 2019 and paid $5.0 million in July 2019 and will pay $0.8 million in the third quarter of 2020. The Company has an accrued liability of $0.8 million as of December 31, 2019.
The Company, in the ordinary course of business, is a claimant or a defendant in various other legal proceedings, including proceedings as to which the Company has no insurance coverage and those that may involve the filing of liens against the Company or its assets.
Item 4. Mine Safety Disclosures
Not applicable.
30
Item 5. Market for Registrant’s Common Equity, Related Stockholder Matters and Issuer Purchases of Equity Securities
RigNet’s common stock, $0.001 par value, is traded on the NASDAQ Global Select Market (NASDAQ), under the ticker symbol RNET. There were approximately 105 holders of record of RigNet’s common stock as of February 28, 2020.
Dividends
We have not paid any cash dividends on our common stock and do not intend to do so in the foreseeable future. Further, our term loan agreement restricts our ability to pay cash dividends. We currently intend to retain all available funds and any future earnings to support the operation and to finance the growth and development of our business.
Stockholder Return Performance Presentation
The following graph compares the change in the cumulative total stockholder return on our common stock during the period from December 31, 2014 through December 31, 2019, with the cumulative total return on the NASDAQ Composite Index, the PHLX Oil Service Sector Index and the NASDAQ Telecommunications Index. The Oil Service Sector Index is a price-weighted index composed of the common stocks of 15 companies that provide oil drilling and production services, oilfield equipment, support services, and geophysical/reservoir services. The Telecommunications Index tracks NASDAQ listed telecommunications and telecommunications equipment companies. The comparison assumes that $100 was invested on December 31, 2014 in our common stock and in each of the foregoing indices and assumes reinvestment of dividends, if any.
Comparison of Cumulative Total Return
|
12/31/2014 |
|
|
12/31/2015 |
|
|
12/31/2016 |
|
|
12/31/2017 |
|
|
12/31/2018 |
|
|
12/31/2019 |
|
|||||||
|
RigNet, Inc. (1) |
|
100 |
|
|
|
50 |
|
|
|
56 |
|
|
|
36 |
|
|
|
31 |
|
|
|
16 |
|
|
NASDAQ |
|
100 |
|
|
|
106 |
|
|
|
114 |
|
|
|
146 |
|
|
|
140 |
|
|
|
189 |
|
|
Oil Service Sector |
|
100 |
|
|
|
75 |
|
|
|
87 |
|
|
|
71 |
|
|
|
38 |
|
|
|
37 |
|
|
NASDAQ Telecommunications |
|
100 |
|
|
|
93 |
|
|
|
106 |
|
|
|
125 |
|
|
|
129 |
|
|
|
143 |
|
|
(1) |
Based on the last reported sale price of the Company's stock as reported by NASDAQ on the disclosed date or nearest date prior to the disclosed date. |
31
Investors are cautioned against drawing any conclusions from the data contained in the graph as past results are not necessarily indicative of future performance.
Notwithstanding anything to the contrary set forth in any of the Company’s previous or future filings under the Securities Act of 1933 or the Securities Exchange Act of 1934 that might incorporate this Annual Report on Form 10-K or future filings with the SEC, in whole or in part, the preceding performance information shall not be deemed to be “soliciting material” or to be “filed” with the SEC or incorporated by reference into any filing except to the extent this performance presentation is specifically incorporated by reference therein.
Item 6. Selected Financial Data
The following table sets forth our selected consolidated financial data for the periods indicated. Data was derived from RigNet, Inc.’s audited consolidated financial statements. The data set forth should be read together with Item 7. “Management’s Discussion and Analysis of Financial Condition and Results of Operations” and with Item 8. “Financial Statements and Supplementary Data.” Our historical results for any prior period are not necessarily indicative of the results to be expected in the future.
32
We have never declared or paid any cash dividends on our common stock.
|
|
|
Year Ended December 31, |
|
|||||||||||||||||
|
|
2019 |
|
|
2018 |
|
|
2017 |
|
|
2016 |
|
|
2015 |
|
||||||
|
|
|
(in thousands, except per share amounts) |
|
|||||||||||||||||
|
Consolidated Statements of Comprehensive Income (Loss) Data: |
|
|
|
|
|
|
|
|
|
|
|
|
|
|
|
|
|
|
|
|
|
Revenue |
|
$ |
242,931 |
|
|
$ |
238,854 |
|
|
$ |
204,892 |
|
|
$ |
220,623 |
|
|
$ |
271,260 |
|
|
Expenses: |
|
|
|
|
|
|
|
|
|
|
|
|
|
|
|
|
|
|
|
|
|
Cost of revenue (excluding depreciation and amortization) |
|
|
149,753 |
|
|
|
146,603 |
|
|
|
131,166 |
|
|
|
129,759 |
|
|
|
163,238 |
|
|
Depreciation and amortization |
|
|
31,129 |
|
|
|
33,154 |
|
|
|
30,845 |
|
|
|
33,556 |
|
|
|
32,471 |
|
|
Impairment of intangibles |
|
|
- |
|
|
|
- |
|
|
|
- |
|
|
|
397 |
|
|
|
14,262 |
|
|
Change in fair value of earn-out/contingent consideration |
|
|
2,499 |
|
|
|
3,543 |
|
|
|
(320 |
) |
|
|
(1,279 |
) |
|
|
- |
|
|
Gain on sales of property, plant and equipment, net of retirements |
|
|
(4,240 |
) |
|
|
- |
|
|
|
- |
|
|
|
- |
|
|
|
- |
|
|
GX dispute |
|
|
- |
|
|
|
50,612 |
|
|
|
- |
|
|
|
- |
|
|
|
- |
|
|
Selling and marketing |
|
|
12,230 |
|
|
|
12,844 |
|
|
|
8,347 |
|
|
|
7,172 |
|
|
|
9,449 |
|
|
General and administrative |
|
|
53,630 |
|
|
|
53,193 |
|
|
|
44,842 |
|
|
|
53,469 |
|
|
|
63,192 |
|
|
Total expenses |
|
|
245,001 |
|
|
|
299,949 |
|
|
|
214,880 |
|
|
|
223,074 |
|
|
|
282,612 |
|
|
Operating income (loss) |
|
|
(2,070 |
) |
|
|
(61,095 |
) |
|
|
(9,988 |
) |
|
|
(2,451 |
) |
|
|
(11,352 |
) |
|
Interest expense |
|
|
(5,958 |
) |
|
|
(3,969 |
) |
|
|
(2,870 |
) |
|
|
(2,708 |
) |
|
|
(2,054 |
) |
|
Other income (expense), net |
|
|
(13 |
) |
|
|
4 |
|
|
|
133 |
|
|
|
(313 |
) |
|
|
(845 |
) |
|
Loss before income taxes |
|
|
(8,041 |
) |
|
|
(65,060 |
) |
|
|
(12,725 |
) |
|
|
(5,472 |
) |
|
|
(14,251 |
) |
|
Income tax (expense) benefit |
|
|
(10,745 |
) |
|
|
2,746 |
|
|
|
(3,472 |
) |
|
|
(5,825 |
) |
|
|
(2,409 |
) |
|
Net loss |
|
|
(18,786 |
) |
|
|
(62,314 |
) |
|
|
(16,197 |
) |
|
|
(11,297 |
) |
|
|
(16,660 |
) |
|
Less: Net loss (income) attributable to: |
|
|
|
|
|
|
|
|
|
|
|
|
|
|
|
|
|
|
|
|
|
Non-redeemable, non-controlling interest |
|
|
370 |
|
|
|
139 |
|
|
|
(21 |
) |
|
|
210 |
|
|
|
314 |
|
|
Net loss attributable to RigNet, Inc. stockholders |
|
$ |
(19,156 |
) |
|
$ |
(62,453 |
) |
|
$ |
(16,176 |
) |
|
$ |
(11,507 |
) |
|
$ |
(16,974 |
) |
|
Net loss per share attributable to RigNet , Inc. common stockholders: |
|
|
|
|
|
|
|
|
|
|
|
|
|
|
|
|
|
|
|
|
|
Basic |
|
$ |
(0.97 |
) |
|
$ |
(3.34 |
) |
|
$ |
(0.90 |
) |
|
$ |
(0.65 |
) |
|
$ |
(0.97 |
) |
|
Diluted |
|
$ |
(0.97 |
) |
|
$ |
(3.34 |
) |
|
$ |
(0.90 |
) |
|
$ |
(0.65 |
) |
|
$ |
(0.97 |
) |
|
Weighted average shares outstanding: |
|
|
|
|
|
|
|
|
|
|
|
|
|
|
|
|
|
|
|
|
|
Basic |
|
|
19,832 |
|
|
|
18,713 |
|
|
|
18,009 |
|
|
|
17,768 |
|
|
|
17,534 |
|
|
Diluted |
|
|
19,832 |
|
|
|
18,713 |
|
|
|
18,009 |
|
|
|
17,768 |
|
|
|
17,534 |
|
|
Other Non-GAAP Data: |
|
|
|
|
|
|
|
|
|
|
|
|
|
|
|
|
|
|
|
|
|
Adjusted EBITDA |
|
$ |
41,100 |
|
|
$ |
34,793 |
|
|
$ |
29,669 |
|
|
$ |
37,181 |
|
|
$ |
46,907 |
|
The 2018 acquisitions of Auto-Comm, SAFCON and Intelie contributed revenue and net income of $17.7 million and $2.2 million, respectively, for the year ended December 31, 2018. The 2017 acquisitions of ESS, DTS and Cyphre
33
contributed $5.1 million of revenue for the year ended December 31, 2017. The 2017 acquisitions contributed $1.4 million to net income for the year ended December 31, 2017.
|
|
|
December 31, |
|
|||||||||||||||||
|
|
|
2019 |
|
|
2018 |
|
|
2017 |
|
|
2016 |
|
|
2015 |
|
|||||
|
|
|
(in thousands) |
|
|||||||||||||||||
|
Consolidated Balance Sheets Data: |
|
|
|
|
|
|
|
|
|
|
|
|
|
|
|
|
|
|
|
|
|
Cash and cash equivalents |
|
$ |
12,941 |
|
|
$ |
21,711 |
|
|
$ |
34,598 |
|
|
$ |
57,152 |
|
|
$ |
60,468 |
|
|
Restricted cash - current |
|
|
42 |
|
|
|
41 |
|
|
|
43 |
|
|
|
139 |
|
|
|
543 |
|
|
Restricted cash - long-term |
|
|
1,522 |
|
|
|
1,544 |
|
|
|
1,500 |
|
|
|
1,514 |
|
|
|
- |
|
|
Total assets |
|
|
250,980 |
|
|
|
258,925 |
|
|
|
230,094 |
|
|
|
230,972 |
|
|
|
258,116 |
|
|
Current maturities of long-term debt |
|
|
10,793 |
|
|
|
4,942 |
|
|
|
4,941 |
|
|
|
8,478 |
|
|
|
8,421 |
|
|
Long-term debt |
|
|
96,934 |
|
|
|
72,085 |
|
|
|
53,173 |
|
|
|
52,990 |
|
|
|
69,238 |
|
|
Long-term deferred revenue |
|
|
855 |
|
|
|
318 |
|
|
|
546 |
|
|
|
254 |
|
|
|
359 |
|
Non-GAAP Financial Measures
We refer to Adjusted EBITDA in this Annual Report on Form 10-K and from time to time in other filings that we make with the SEC. Adjusted EBITDA is a financial measure that is not calculated in accordance with GAAP and should not be considered as an alternative to net income (loss), operating income (loss), basic or diluted earnings (loss) per share or any other measure of financial performance calculated and presented in accordance with GAAP. Our Adjusted EBITDA may not be comparable to similarly titled measures of other companies because other companies may not calculate Adjusted EBITDA or similarly titled measures in the same manner as we do. We prepare Adjusted EBITDA to eliminate the impact of items that we do not consider indicative of our core operating performance. We encourage you to evaluate these adjustments and the reasons we consider them appropriate.
We define Adjusted EBITDA as net income (loss) plus interest expense, income tax expense (benefit), depreciation and amortization, impairment of goodwill, intangibles, property, plant and equipment, (gain) loss on sales of property, plant and equipment, net of retirements, stock-based compensation, restructuring charges, change in fair value of earn-outs and contingent consideration, executive departure costs, acquisition costs, the GX dispute and non-recurring items.
We believe Adjusted EBITDA is useful to investors in evaluating our operating performance for the following reasons:
|
|
• |
investors and securities analysts use Adjusted EBITDA as a supplemental measure to evaluate the overall operating performance of companies, and we understand investor’s and analyst’s analyses include Adjusted EBITDA; |
|
|
• |
by comparing our Adjusted EBITDA in different periods, investors may evaluate our operating results without the additional variations caused by items that we do not consider indicative of our core operating performance and which are not necessarily comparable from year to year; and |
|
|
• |
Adjusted EBITDA is an integral component of Consolidated EBITDA, as defined and used in the financial covenant ratios in our Credit Agreement. |
Our management uses Adjusted EBITDA:
|
|
• |
to indicate profit contribution; |
|
|
• |
for planning purposes, including the preparation of our annual operating budget and as a key element of annual incentive programs; |
|
|
• |
to allocate resources to enhance the financial performance of our business; and |
|
|
• |
in communications with our Board of Directors concerning our financial performance. |
Although Adjusted EBITDA is frequently used by investors and securities analysts in their evaluations of companies, Adjusted EBITDA has limitations as an analytical tool, and you should not consider it in isolation or as a substitute for analysis of our results of operations as reported under GAAP. Some of these limitations are:
|
|
• |
Adjusted EBITDA does not reflect our cash expenditures or future requirements for capital expenditures or other contractual commitments; |
34
|
|
• |
Adjusted EBITDA does not reflect interest expense or principal payments on debt; |
|
|
• |
Adjusted EBITDA does not reflect cash requirements for income taxes; |
|
|
• |
Adjusted EBITDA does not reflect impairment of goodwill, intangibles and property, plant and equipment; |
|
|
• |
Adjusted EBITDA does not reflect foreign exchange impact of intercompany financing activities; |
|
|
• |
Adjusted EBITDA does not reflect (gain) loss on sales of property, plant and equipment, net of retirements; |
|
|
• |
Adjusted EBITDA does not reflect the stock-based compensation component of employee compensation; |
|
|
• |
Adjusted EBITDA does not reflect acquisition costs; |
|
|
• |
Adjusted EBITDA does not reflect change in fair value of earn-outs and contingent consideration, which may require settlement in cash in the future; |
|
|
• |
Adjusted EBITDA does not reflect executive departure costs; |
|
|
• |
Adjusted EBITDA does not reflect restructuring charges; |
|
|
• |
Adjusted EBITDA does not reflect the GX dispute; |
|
|
• |
Adjusted EBITDA does not reflect the GX Dispute Phase II costs; and |
|
|
• |
although depreciation and amortization are non-cash charges, the assets being depreciated or amortized will often have to be replaced in the future, and Adjusted EBITDA does not reflect any cash requirements for these replacements. |
The following table presents a reconciliation of net loss to Adjusted EBITDA for each of the periods presented. Net loss is the most comparable GAAP measure to Adjusted EBITDA.
|
|
|
Year Ended December 31, |
|
|||||||||||||||||
|
|
|
2019 |
|
|
2018 |
|
|
2017 |
|
|
2016 |
|
|
2015 |
|
|||||
|
|
|
(in thousands) |
|
|||||||||||||||||
|
Reconciliation of Net Loss to Adjusted EBITDA: |
|
|
|
|
|
|
|
|
|
|
|
|
|
|
|
|
|
|
|
|
|
Net loss |
|
$ |
(18,786 |
) |
|
$ |
(62,314 |
) |
|
$ |
(16,197 |
) |
|
$ |
(11,297 |
) |
|
$ |
(16,660 |
) |
|
Interest expense |
|
|
5,958 |
|
|
|
3,969 |
|
|
|
2,870 |
|
|
|
2,708 |
|
|
|
2,054 |
|
|
Depreciation and amortization |
|
|
31,129 |
|
|
|
33,154 |
|
|
|
30,845 |
|
|
|
33,556 |
|
|
|
32,471 |
|
|
Impairment of goodwill, intangibles and property, plant and equipment |
|
|
- |
|
|
|
- |
|
|
|
- |
|
|
|
397 |
|
|
|
14,262 |
|
|
(Gain) loss on sales of property, plant and equipment, net of retirements |
|
|
(4,240 |
) |
|
|
331 |
|
|
|
55 |
|
|
|
(153 |
) |
|
|
(41 |
) |
|
Stock-based compensation |
|
|
8,621 |
|
|
|
4,712 |
|
|
|
3,703 |
|
|
|
3,389 |
|
|
|
3,660 |
|
|
Restructuring costs |
|
|
731 |
|
|
|
842 |
|
|
|
767 |
|
|
|
1,911 |
|
|
|
7,410 |
|
|
Change in fair value of earn-out/contingent consideration |
|
|
2,499 |
|
|
|
3,543 |
|
|
|
(320 |
) |
|
|
(1,279 |
) |
|
|
- |
|
|
Executive departure costs |
|
|
- |
|
|
|
406 |
|
|
|
1,192 |
|
|
|
1,884 |
|
|
|
1,000 |
|
|
Acquisition costs |
|
|
497 |
|
|
|
2,284 |
|
|
|
3,282 |
|
|
|
240 |
|
|
|
342 |
|
|
GX dispute |
|
|
- |
|
|
|
50,612 |
|
|
|
- |
|
|
|
- |
|
|
|
- |
|
|
GX dispute Phase II costs |
|
|
3,946 |
|
|
|
- |
|
|
|
- |
|
|
|
- |
|
|
|
- |
|
|
Income tax expense (benefit) |
|
|
10,745 |
|
|
|
(2,746 |
) |
|
|
3,472 |
|
|
|
5,825 |
|
|
|
2,409 |
|
|
Adjusted EBITDA (non-GAAP measure) |
|
$ |
41,100 |
|
|
$ |
34,793 |
|
|
$ |
29,669 |
|
|
$ |
37,181 |
|
|
$ |
46,907 |
|
35
Item 7. Management’s Discussion And Analysis Of Financial Condition And Results Of Operations
General
The following discussion should be read together with our consolidated financial statements and the related notes included elsewhere in this Annual Report on Form 10-K. This discussion contains forward-looking statements about our business and operations. Our future results may differ materially from those we currently anticipate as a result of the factors we describe under “Risk Factors” and elsewhere in this Annual Report on Form 10-K.
Executive Overview
We deliver advanced software and communications infrastructure that allow our customers to realize the business benefits of digital transformation. With world-class, ultra-secure solutions spanning global IP connectivity, bandwidth-optimized OTT applications, IIoT big data enablement, and industry-leading machine learning analytics, we support the full evolution of digital enablement, empowering businesses to respond faster to high priority issues, mitigate the risk of operational disruption, and maximize their overall financial performance.
Our Operations
We are the leading provider of ultra-secure, intelligent networking solutions and specialized applications. Customers use our private networks to manage information flows and execute mission-critical operations primarily in remote areas where conventional telecommunications infrastructure is either unreliable or unavailable. We provide our clients with what is often the sole means of communication for their remote operations. On top of and vertically integrated into these networks we provide services ranging from fully-managed voice, data, and video to more advanced services including: cyber-security threat detection and prevention; applications to improve crew welfare, safety or workforce productivity; and a real-time AI-backed data analytics platform to enhance customer decision making and business performance.
Segment information is prepared consistent with the components of the enterprise for which separate financial information is available and regularly evaluated by the chief operating decision-maker for the purpose of allocating resources and assessing performance.
|
|
• |
Managed Communications Services (MCS). Our MCS segment provides remote communications, telephony and technology services for offshore and onshore drilling rigs and production facilities, support vessels, and other remote sites. |
|
|
• |
Systems Integration. Our Systems Integration segment provides design and implementation services for customer telecommunications systems. Solutions are delivered based on the customer’s specifications, adhering to international industry standards and best practices. Project services may include consulting, design, engineering, project management, procurement, testing, installation, commissioning and maintenance. Additionally, Systems Integration provides complete monitoring and maintenance for fire and gas detection systems and PLC/automation control systems. |
Corporate and eliminations primarily represents unallocated executive and support activities, including back-office software development, interest expense, income taxes, eliminations, the GX dispute and change in fair value of earn-out/contingent consideration.
Customers in our MCS and Apps & IoT segments are primarily served under fixed-price contracts, either on a monthly, usage or day rate basis or for equipment sales. Our contracts are generally in the form of Master Service Agreements, or MSAs, with specific services being provided under individual service orders. Offshore contracts generally have a term of up to five years with renewal options. Land-based contracts are generally shorter term or terminable on short notice without a penalty. Service orders are executed under the MSA for individual remote sites or groups of sites, and generally permit early termination on short notice without penalty in the event of force majeure, breach of the MSA or cold stacking of a drilling rig (when a rig is taken out of service and is expected to be idle for a protracted period of time). Systems Integration customers are served primarily under fixed-price, long-term contracts.
36
Cost of revenue consists primarily of satellite charges, voice and data termination costs, network operations expenses, internet connectivity fees, equipment purchases for Systems Integration projects and direct service labor. Satellite charges consist of the costs associated with obtaining satellite bandwidth (the measure of capacity) used in the transmission of service to and from contracted satellites. Direct service labor consists of field technicians, our Network Operations Center (NOC) employees, and other employees who directly provide services to customers. Network operations expenses consist primarily of costs associated with the operation of our NOC, which is maintained 24 hours a day, seven days a week. Depreciation and amortization are recognized on all property, plant and equipment either installed at a customer’s site or held at our corporate and regional offices, as well as intangibles arising from acquisitions and internal-use software. Selling and marketing expenses consist primarily of salaries and commissions, travel costs and marketing communications. General and administrative expenses consist of expenses associated with our management, finance, contract, support and administrative functions.
Profitability generally increases or decreases at an MCS site as we add or lose customers and value-added services. Assumptions used in developing the rates for a site may not cover cost variances from inherent uncertainties or unforeseen obstacles, including both physical conditions and unexpected problems encountered with third party service providers.
Recent Developments
On June 24, 2019, we announced that we reached a settlement with Inmarsat plc that concludes the GX Dispute. Pursuant to the settlement we paid $45.0 million in June 2019 and paid $5.0 million in July 2019 and will pay $0.8 million in the third quarter of 2020. We have an accrued liability of $0.8 million as of December 31, 2019. As previously disclosed, Inmarsat plc (Inmarsat), a satellite telecommunications company, filed arbitration with the International Centre for Dispute Resolution tribunal (the panel) in October 2016 concerning a January 2014 take-or-pay agreement to purchase up to $65.0 million, under certain conditions, of GX capacity from Inmarsat over several years. We incurred cost of $3.9 million in GX Dispute Phase II costs for the year ended December 31, 2019. We incurred legal expenses of $2.2 million in connection with the GX dispute for the year ended December 31, 2018.
In the U.S. Gulf of Mexico, we have substantially completed the buildout of our 4G LTE and 5G-enabled network, where we are partnered with T-Mobile, and we are already carrying live traffic. Additionally, we purchased and built-out an office in Lafayette, Louisiana that will consolidate three separate legacy facilities. We moved into the new facility in the third quarter of 2019.
On February 21, 2020, we entered into to the Third Amendment to the Third Amended and Restated Credit Agreement (Amended Credit Agreement), with the same four financial institutions that are part of the current credit agreement. The Amended Credit Agreement provides for a $16.0 million Term Loan, a $100.0 million RCF and a $30.0 million accordion feature. The Term Loan matures on March 31, 2022 with principal installments of $2.0 million due quarterly beginning June 30, 2020. The RCF and accordion, if exercised, mature on August 31, 2022. The Consolidated Leverage Ratio, as defined in the Amended Credit Agreement is set at 3.25 times through third quarter 2020, thereafter stepping down to 3.0 times through second quarter 2021, thereafter stepping down to 2.75 times through the maturity of the revolving facility. The Amended Credit Agreement bears interest at a rate of LIBOR plus a margin ranging from 1.75% to 3.25% based on a consolidated leverage ratio defined in the Amended Credit Agreement. As of February 21, 2020, the outstanding principal amount of the Term Loan was $16.0 million, and the outstanding draws on the RCF were $95.4 million.
As of December 31, 2019, we had backlog for our percentage of completion projects of $26.2 million.
Known Trends and Uncertainties
Operating Matters
Uncertainties in the oil and gas industry may continue to impact our profitability. The fundamentals of the oil and gas industry we serve remain challenged into 2020, particularly offshore. The oil and gas environment continues to be challenged with operators focusing on projects with shorter pay-back periods that generally require less capital investment and lower costs from service providers and drilling contractors. The average price of Brent crude, a key indicator of activity for the oil and gas industry, was $64.28 per barrel for the year ended December 31, 2019 compared to an average of $71.19 per barrel through the year ending December 31, 2018. Brent crude spot prices increased in the first three quarters of 2018 and peaked at $86.07 on October 4, 2018. From the October 4, 2018 high, Brent crude oil prices decreased over 40.0% in the fourth quarter of 2018. In the first half of 2019, Brent crude oil prices recovered to the $70 per barrel range and have then declined in the second half of 2019 to the $60 per barrel range. The outbreak of Coronavirus throughout the world caused demand forecasts to be revised further downward. Subsequently, in
37
March 2020, the Saudi state producer, Aramco, reduced crude pricing in response to a split and price war with Russia. Following the Saudi reduction in pricing, Brent crude spot prices declined steeply to a mid-30 dollar per barrel range. The offshore drilling contracting environment remains challenged, with major offshore drilling contractors having experienced significant pressure on day rates, which in turn has had a negative impact on the rates we are able to charge customers. Generally, a prolonged lower oil price environment decreases exploration and development drilling investment, utilization of drilling rigs and the activity of the global oil and gas industry that we serve.
In addition, uncertainties that could impact our profitability include service responsiveness to remote locations, communication network complexities, political and economic instability in certain regions, cyber-attacks, export restrictions, licenses and other trade barriers. These uncertainties may result in the delay of service initiation, which may negatively impact our results of operations. Additional uncertainties that could impact our operating cash flows include the availability and cost of satellite bandwidth, timing of collecting our receivables, and our ability to increase our contracted services through sales and marketing efforts while leveraging the contracted satellite and other communication service costs.
Sales Tax Audit
We are undergoing a routine sales tax audit from a state where we have operations. The audit can cover up to a four-year period. We are in the early stages of the audit and do not have any estimates of further exposure, if any, for the tax years under review.
Critical Accounting Policies
Certain of our accounting policies require judgment by management in selecting the appropriate assumptions for calculating financial estimates. By their nature, these judgments are subject to an inherent degree of uncertainty. These judgments are based on our historical experience, terms of existing contracts, observance of trends in the industry, information provided by our customers, and information available from other outside sources, as appropriate. Future results may differ from these judgments under different assumptions or conditions. Our accounting policies that require management to apply significant judgment include:
Revenue Recognition - Revenue from Contracts with Customers
Revenue is recognized to depict the transfer of promised goods or services in an amount that reflects the consideration to which we expect to be entitled in exchange for those goods or services.
Revenue Recognition - MCS and Apps & IoT
MCS and Apps & IoT customers are primarily served under fixed-price contracts, either on a monthly, usage or day rate basis or for equipment sales and consulting services. Our contracts are generally in the form of Master Service Agreements, or MSAs, with specific services being provided under individual service orders. Offshore contracts generally have a term of up to five years with renewal options. Land-based contracts are generally shorter term or terminable on short notice without a penalty. Service orders are executed under the MSA for individual remote sites or groups of sites, and generally permit early termination on short notice without penalty in the event of force majeure, breach of the MSA or cold stacking of a drilling rig (when a rig is taken out of service and is expected to be idle for a protracted period of time).
Performance Obligations Satisfied Over Time—The delivery of service represents the single performance obligation under MCS and Apps & IoT contracts. Revenue for contracts is generally recognized over time as service is transferred to the customer and we expect to be entitled to the agreed monthly, day rate or usage rate in exchange for those services.
Performance Obligations Satisfied at a Point in Time—The delivery of equipment represents the single performance obligation under equipment sale contracts. Revenue for equipment sales is generally recognized upon delivery of equipment to customers.
Revenue Recognition – Systems Integration
Revenues related to long-term, fixed-price Systems Integration contracts for customized network solutions are recognized based on the percentage of completion for the contract. At any point, RigNet has numerous contracts in progress, all of which are at various stages of completion. Accounting for revenues and profits on long-term contracts requires estimates of total estimated contract costs and estimates of progress toward completion to determine the extent of revenue and profit recognition.
38
Performance Obligations Satisfied Over Time — The delivery of a Systems Integration solution represents the single performance obligation under Systems Integration contracts. Progress towards completion on fixed-price contracts is measured based on the ratio of costs incurred to total estimated contract costs (the cost-to-cost method). These estimates may be revised as additional information becomes available or as specific project circumstances change.
We review all material contracts on a monthly basis and revise the estimates as appropriate for developments such as providing services, purchasing third-party materials and equipment at costs differing from those previously estimated, and incurring or expecting to incur schedule issues. Changes in estimated final contract revenues and costs can either increase or decrease the final estimated contract profit or loss. Profits are recorded in the period in which a change in estimate is recognized, based on progress achieved through the period of change. Anticipated losses on contracts are recorded in full in the period in which they become evident. Revenue recognized in excess of amounts billed is classified as a current asset under Costs and estimated earnings in excess of billings on uncompleted contracts (CIEB).
Systems Integration contracts are billed in accordance with the terms of the contract which are typically either based on milestones or specified time intervals. As of December 31, 2019 and 2018, the amount of CIEB related to Systems Integration projects was $13.3 million and $7.1 million, respectively. Under long-term contracts, amounts recorded in CIEB may not be realized or paid, respectively, within a one-year period. As of December 31, 2019 and 2018, $1.0 million and none, respectively, of amounts billed to customers in excess of revenue recognized to date are classified as a current liability, under deferred revenue. Additionally as of December 31, 2019 and 2018, there were $2.6 million and $3.3 million of retention included in Accounts Receivable.
Variable Consideration – Systems Integration – We record revenue on contracts relating to certain probable claims and unapproved change orders by including in revenue an amount less than or equal to the amount of costs incurred to date relating to these probable claims and unapproved change orders, thus recognizing no profit until such time as claims are finalized or change orders are approved. The amount of unapproved change orders and claim revenues is included in our Consolidated Balance Sheets as part of CIEB. No material unapproved change orders or claims revenue was included in CIEB as of December 31, 2019 and 2018. As new facts become known, an adjustment to the estimated recovery is made and reflected in the current period.
Revenue related to long-term, fixed-price Systems Integration contracts for customized network solutions are recognized using the percentage-of-completion method. At any point, RigNet has numerous contracts in progress, all of which are at various stages of completion. Accounting for revenues and profits on long-term contracts requires estimates of total estimated contract costs and estimates of progress toward completion to determine the extent of revenue and profit recognition. Progress towards completion on fixed-price contracts is measured based on the ratio of costs incurred to total estimated contract costs (the cost-to-cost method). These estimates may be revised as additional information becomes available or as specific project circumstances change.
Accounts Receivable
Trade accounts receivable are recognized as customers are billed in accordance with customer contracts. We report an allowance for doubtful accounts for probable credit losses existing in accounts receivable. Management determines the allowance based on a review of currently outstanding receivables and our historical collection experience. Individual receivables and balances which have been outstanding greater than 120 days are reviewed individually. Account balances, when determined to be uncollectible, are charged against the allowance.
Property, Plant and Equipment
Property, plant and equipment consists of (i) telecommunication and computer equipment, (ii) furniture and other office equipment, (iii) leasehold improvements, (iv) building and (v) land. All property, plant and equipment, excluding land, is depreciated and stated at acquisition cost net of accumulated depreciation. Depreciation is calculated using the straight-line method over the expected useful lives of the respective assets, which range from one to ten years. We assess the value of property, plant and equipment for impairment when we determine that events and circumstances indicate that the recorded carrying value may not be recoverable. An impairment is determined by comparing estimated future net undiscounted cash flows to the carrying value at the time of the assessment. No impairment to property, plant and equipment was recorded in the years ended December 31, 2019, 2018 or 2017.
Any future downturn in our business could adversely impact the key assumptions in our impairment test. While we believe that there appears to be no indication of current or future impairment, historical operating results may not be indicative of future operating results and events and circumstances may occur causing a triggering event in a period as short as three months.
39
Intangibles consist of customer relationships, covenants-not-to-compete, brand name, licenses, developed technology and backlog acquired as part of our acquisitions. Intangibles also include internal-use software. Intangibles have useful lives ranging from 5.0 to 20.0 years and are amortized on a straight-line basis. We assess the value of intangibles for impairment when we determine that events and circumstances indicate that the recorded carrying value may not be recoverable. An impairment is determined by comparing estimated future net undiscounted cash flows to the carrying value at the time of the assessment.
No impairment to intangibles was recorded in the years ended December 31, 2019, 2018 or 2017.
Any future downturn in our business could adversely impact the key assumptions in our impairment test. While we believe that there appears to be no indication of current or future impairment, historical operating results may not be indicative of future operating results and events and circumstances may occur causing a triggering event in a period as short as three months.
Goodwill
Goodwill resulted from prior acquisitions as the consideration paid for the acquired businesses exceeded the fair value of acquired identifiable net tangible and intangible assets. Goodwill is reviewed for impairment at least annually, as of July 31, with additional evaluations being performed when events or circumstances indicate that the carrying value of these assets may not be recoverable.
The goodwill impairment test is used to identify potential impairment by comparing the fair value of each reporting unit to the book value of the reporting unit, including goodwill. Fair value of the reporting unit is determined using a combination of the reporting unit’s expected present value of future cash flows and a market approach. The present value of future cash flows is estimated using our most recent forecast and our weighted average cost of capital. The market approach uses a market multiple on the reporting unit’s cash generated from operations. Significant estimates for each reporting unit included in our impairment analysis are cash flow forecasts, our weighted average cost of capital, projected income tax rates and market multiples. Changes in these estimates could affect the estimated fair value of our reporting units and result in an impairment of goodwill in a future period. If the fair value of a reporting unit is less than its book value, goodwill of the reporting unit is considered to be impaired. If the book value of the reporting unit’s goodwill exceeds the implied fair value of that goodwill, an impairment loss is recognized in an amount equal to that excess. Any impairment in the value of goodwill is charged to earnings in the period such impairment is determined.
We recorded no goodwill impairments in the years ending December 31, 2019, 2018 or 2017.
MCS had $23.0 million of goodwill as of December 31, 2019, and fair value exceeded carrying value by 16.1% as of the July 31, 2019 annual impairment test. Apps & IoT had $22.5 million of goodwill as of December 31, 2019, and fair value exceeded carrying value by 155.7% as of the July 31, 2019 annual impairment test. Systems Integration had $1.4 million of goodwill as of December 31, 2019, and fair value exceeded carrying value by 29.2% as of the July 31, 2019 annual impairment test. Any future downturn in our business could adversely impact the key assumptions in our impairment test. While we believe that there appears to be no indication of current or future impairment, historical operating results may not be indicative of future operating results and events and circumstances may occur causing a triggering event in a period as short as three months.
While we believe that there appears to be no indication of current or future impairment, historical operating results may not be indicative of future operating results and events and circumstances may occur causing a triggering event in a period as short as three months.
Taxes
Current income taxes are determined based on the tax laws and rates in effect in the jurisdictions and countries that we operate in and revenue is earned. Deferred income taxes reflect the tax effect of net operating losses, foreign tax credits and the tax effects of temporary differences between the carrying amount of assets and liabilities for financial statement and income tax purposes, as determined under enacted tax laws and rates. Valuation allowances are established when management determines that it is more likely than not that some portion or the entire deferred tax asset will not be realized. The financial effect of changes in tax laws or rates is accounted for in the period of enactment.
From time to time, we engage in transactions in which the tax consequences may be subject to uncertainty. In the normal course of business, we prepare and file tax returns based on interpretation of tax laws and regulations, which are subject to examination by various taxing authorities. Such examinations may result in future tax and interest assessments by these taxing authorities. We evaluate our tax positions and recognize only tax benefits for financial
40
purposes that, more likely than not, will be sustained upon examination, including resolutions of any related appeals or litigation processes, based on the technical merits of the position.
We have elected to include income tax related interest and penalties as a component of income tax expense.
New Accounting Pronouncements
No standard implemented during 2019 or 2018 had a material effect on our financial position, cash flow or results of operations. See our audited consolidated financial statements and the notes thereto included in this Annual Report on Form 10-K for more details regarding our implementation and assessment of new accounting standards.
Results of Operations
The following table sets forth selected financial and operating data for the periods indicated.
|
|
|
|
|
|
|
|
|
|
|
|
|
|
|
Percentage Change |
|
|||||
|
|
|
Year Ended December 31, |
|
|
2018 to |
|
|
2017 to |
|
|||||||||||
|
|
|
2019 |
|
|
2018 |
|
|
2017 |
|
|
2019 |
|
|
2018 |
|
|||||
|
|
|
(in thousands, except percentages) |
|
|||||||||||||||||
|
Revenue |
|
$ |
242,931 |
|
|
$ |
238,854 |
|
|
$ |
204,892 |
|
|
|
1.7 |
% |
|
|
16.6 |
% |
|
Expenses: |
|
|
|
|
|
|
|
|
|
|
|
|
|
|
|
|
|
|
|
|
|
Cost of revenue (excluding depreciation and amortization) |
|
|
149,753 |
|
|
|
146,603 |
|
|
|
131,166 |
|
|
|
2.1 |
% |
|
|
11.8 |
% |
|
Depreciation and amortization |
|
|
31,129 |
|
|
|
33,154 |
|
|
|
30,845 |
|
|
|
(6.1 |
)% |
|
|
7.5 |
% |
|
Change in fair value of earn-out/contingent consideration |
|
|
2,499 |
|
|
|
3,543 |
|
|
|
(320 |
) |
|
|
(29.5 |
)% |
|
|
1,207.2 |
% |
|
Gain on sales of property, plant and equipment, net of retirements |
|
|
(4,240 |
) |
|
|
- |
|
|
|
- |
|
|
* |
|
|
* |
|
||
|
GX dispute |
|
|
- |
|
|
|
50,612 |
|
|
|
- |
|
|
* |
|
|
* |
|
||
|
Selling and marketing |
|
|
12,230 |
|
|
|
12,844 |
|
|
|
8,347 |
|
|
|
(4.8 |
)% |
|
|
53.9 |
% |
|
General and administrative |
|
|
53,630 |
|
|
|
53,193 |
|
|
|
44,842 |
|
|
|
0.8 |
% |
|
|
18.6 |
% |
|
Total expenses |
|
|
245,001 |
|
|
|
299,949 |
|
|
|
214,880 |
|
|
|
(18.3 |
)% |
|
|
39.6 |
% |
|
Operating loss |
|
|
(2,070 |
) |
|
|
(61,095 |
) |
|
|
(9,988 |
) |
|
|
(96.6 |
)% |
|
|
511.7 |
% |
|
Other expense, net |
|
|
(5,971 |
) |
|
|
(3,965 |
) |
|
|
(2,737 |
) |
|
|
50.6 |
% |
|
|
44.9 |
% |
|
Loss before income taxes |
|
|
(8,041 |
) |
|
|
(65,060 |
) |
|
|
(12,725 |
) |
|
|
(87.6 |
)% |
|
|
411.3 |
% |
|
Income tax (expense) benefit |
|
|
(10,745 |
) |
|
|
2,746 |
|
|
|
(3,472 |
) |
|
|
(491.3 |
)% |
|
|
(179.1 |
)% |
|
Net loss |
|
|
(18,786 |
) |
|
|
(62,314 |
) |
|
|
(16,197 |
) |
|
|
(69.9 |
)% |
|
|
284.7 |
% |
|
Less: Net income attributable to non-controlling interests |
|
|
370 |
|
|
|
139 |
|
|
|
(21 |
) |
|
|
166.2 |
% |
|
|
(761.9 |
)% |
|
Net loss attributable to RigNet, Inc. stockholders |
|
$ |
(19,156 |
) |
|
$ |
(62,453 |
) |
|
$ |
(16,176 |
) |
|
|
(69.3 |
)% |
|
|
286.1 |
% |
|
Other Non-GAAP Data: |
|
|
|
|
|
|
|
|
|
|
|
|
|
|
|
|
|
|
|
|
|
Adjusted EBITDA |
|
$ |
41,100 |
|
|
$ |
34,793 |
|
|
$ |
29,669 |
|
|
|
18.1 |
% |
|
|
17.3 |
% |
41
The following represents selected financial operating results for our segments:
|
|
|
|
|
|
|
|
|
|
|
|
|
|
|
|
|
|
|
|
|
|
|
|
|
Year Ended December 31, |
|
|
Percentage Change |
|
||||||||||||||
|
|
|
2019 |
|
|
2018 |
|
|
2017 |
|
|
2018 to 2019 |
|
|
2017 to 2018 |
|
|||||
|
|
|
(in thousands, except percentages) |
|
|||||||||||||||||
|
Managed Communications Services: |
|
|
|
|
|
|
|
|
|
|
|
|
|
|
|
|
|
|
|
|
|
Revenue |
|
$ |
164,857 |
|
|
$ |
171,574 |
|
|
$ |
164,238 |
|
|
|
(3.9 |
)% |
|
|
4.5 |
% |
|
Cost of revenue (excluding depreciation and amortization) |
|
|
100,394 |
|
|
|
105,101 |
|
|
|
101,681 |
|
|
|
(4.5 |
)% |
|
|
3.4 |
% |
|
Depreciation and amortization |
|
|
21,403 |
|
|
|
22,759 |
|
|
|
23,202 |
|
|
|
(6.0 |
)% |
|
|
(1.9 |
)% |
|
Selling, general and administrative |
|
|
13,288 |
|
|
|
16,448 |
|
|
|
16,841 |
|
|
|
(19.2 |
)% |
|
|
(2.3 |
)% |
|
Managed Communications Services operating income |
|
$ |
29,772 |
|
|
$ |
27,266 |
|
|
$ |
22,514 |
|
|
|
9.2 |
% |
|
|
21.1 |
% |
|
Applications and Internet-of-Things: |
|
|
|
|
|
|
|
|
|
|
|
|
|
|
|
|
|
|
|
|
|
Revenue |
|
$ |
35,368 |
|
|
$ |
25,713 |
|
|
$ |
15,626 |
|
|
|
37.5 |
% |
|
|
64.6 |
% |
|
Cost of revenue (excluding depreciation and amortization) |
|
|
17,239 |
|
|
|
13,386 |
|
|
|
10,751 |
|
|
|
28.8 |
% |
|
|
24.5 |
% |
|
Depreciation and amortization |
|
|
4,892 |
|
|
|
4,570 |
|
|
|
1,738 |
|
|
|
7.0 |
% |
|
|
162.9 |
% |
|
Selling, general and administrative |
|
|
4,551 |
|
|
|
1,961 |
|
|
|
1,685 |
|
|
|
132.1 |
% |
|
|
16.4 |
% |
|
Applications and Internet-of-Things operating income |
|
$ |
8,686 |
|
|
$ |
5,796 |
|
|
$ |
1,452 |
|
|
|
49.9 |
% |
|
|
299.2 |
% |
|
Systems Integration: |
|
|
|
|
|
|
|
|
|
|
|
|
|
|
|
|
|
|
|
|
|
Revenue |
|
$ |
42,706 |
|
|
$ |
41,567 |
|
|
$ |
25,028 |
|
|
|
2.7 |
% |
|
|
66.1 |
% |
|
Cost of revenue (excluding depreciation and amortization) |
|
|
32,120 |
|
|
|
28,116 |
|
|
|
18,734 |
|
|
|
14.2 |
% |
|
|
50.1 |
% |
|
Depreciation and amortization |
|
|
1,627 |
|
|
|
2,511 |
|
|
|
2,438 |
|
|
|
(35.2 |
)% |
|
|
3.0 |
% |
|
Selling, general and administrative |
|
|
2,530 |
|
|
|
1,698 |
|
|
|
1,403 |
|
|
|
49.0 |
% |
|
|
21.0 |
% |
|
Systems Integration operating income |
|
$ |
6,429 |
|
|
$ |
9,242 |
|
|
$ |
2,453 |
|
|
|
(30.4 |
)% |
|
|
276.8 |
% |
Years Ended December 31, 2019 and 2018
Revenue. Revenue increased by $4.1 million, or 1.7%, to $242.9 million for the year ended December 31, 2019 from $238.9 million for the year ended December 31, 2018, driven by growth in the Apps & IoT segment. Revenue for the Apps & IoT segment grew $9.7 million, or 37.5%, due to our focus on the growth of the application layer, including Intelie. Revenue for the Systems Integration segment increased $1.1 million, or 2.7%, due primarily to productivity on certain large projects. Revenue for the MCS segment decreased $6.7 million, or 3.9% largely due to the loss of drilling contractor Noble Corporation plc as a customer at the end of 2017, with decommissioning occurring throughout 2018.
Cost of Revenue (excluding depreciation and amortization). Cost of revenue (excluding depreciation and amortization) increased by $3.2 million, or 2.1%, to $149.8 million for the year ended December 31, 2019 from $146.6 million for the year ended December 31, 2018. Cost of revenue (excluding depreciation and amortization) increased in the Systems Integration segment by $4.0 million. Cost of revenue (excluding depreciation and amortization) increased in the Apps & IoT segment by $3.9 million as we continue our strategy to grow our application layer and IoT space, including Intelie. Cost of revenue (excluding depreciation and amortization) decreased in the MCS segment by $4.7 million from cost reductions.
Depreciation and Amortization. Depreciation and amortization expenses decreased by $2.0 million to $31.1 million for the year ended December 31, 2019 from $33.2 million for the year ended December 31, 2018. The decrease is primarily attributable to the intangibles from the July 2012 acquisition of Nessco being fully amortized coupled with lower capital expenditures.
Gain on sales of property, plant and equipment, net of retirements. During the year ended December 31, 2019, the Company recognized a gain of $4.2 million on the sale of certain assets.
Selling and Marketing. Selling and marketing expenses decreased by $0.6 million to $12.2 million for the year ended December 31, 2019 from $12.8 million for the year ended December 31, 2018. This decrease was due to cost reductions and reduced personnel costs, offset partially as we re-allocated resources to our Apps & IoT segment.
42
General and Administrative. General and administrative expenses increased by $0.4 million to $53.6 million for the year ended December 31, 2019 from $53.2 million for the year ended December 31, 2018. General and administrative costs increased primarily due to increased stock-based compensation and increased GX Dispute legal expenses, partially offset by reduced personnel costs.
Income Tax Expense. Our effective income tax rate was (133.6%) and 4.2% for the years ended December 31, 2019 and 2018, respectively. Our effective tax rate is affected by factors including changes in valuation allowances, fluctuations in income across jurisdictions with varying tax rates, and changes in income tax reserves, including related penalties and interest. See Note 13 — “Income Taxes,” to our consolidated financial statements included in this Annual Report on Form 10-K for more information regarding the items comprising our effective tax rates.
Years Ended December 31, 2018 and 2017
Revenue. Revenue increased by $34.0 million, or 16.6%, to $238.9 million for the year ended December 31, 2018 from $204.9 million for the year ended December 31, 2017. Revenue increased in all segments. The 2018 acquisitions of Auto-Comm, SAFCON and Intelie contributed revenue of $17.7 million for the year ended December 31, 2018. The Systems Integration segment increased $16.5 million, or 66.1%, primarily due to $13.0 million from the acquisition of Auto-Comm and SAFCON and increased activity against a growing backlog of Systems Integration projects. The Apps & IoT segment increased $10.1 million, or 64.6%, due to our focus on growth of the application layer and IoT space including $2.2 million from the acquisition of Intelie, $1.1 million from the acquisition of Auto-Comm and SAFCON and $4.7 million from owning ESS for the full year ended December 31, 2018 compared to five months in 2017. The MCS segment increased $7.3 million, or 4.5%, due to increased average site count coupled with $1.4 million from the acquisition of Auto-Comm and SAFCON and $2.3 million from owning DTS for the full year ended December 31, 2018 compared to two months in 2017.
Cost of Revenue (excluding depreciation and amortization). Cost of revenue (excluding depreciation and amortization) increased by $15.4 million, or 11.8%, to $146.6 million for the year ended December 31, 2018 from $131.2 million for the year ended December 31, 2017. Cost of revenue (excluding depreciation and amortization) increased in the Systems Integration segment by $9.4 million due to the acquisition of Auto-Comm and SAFCON and increased activity of Systems Integration projects. Cost of revenue (excluding depreciation and amortization) increased in the MCS segment by $3.4 million due to serving an increased site count. Cost of revenue (excluding depreciation and amortization) increased in the Apps & IoT segment by $2.6 million as we invested in our strategy of expanding of the application layer and IoT space including the acquisition of Intelie and ESS.
Depreciation and Amortization. Depreciation and amortization expenses increased by $2.3 million to $33.2 million for the year ended December 31, 2018 from $30.8 million for the year ended December 31, 2017. The increase is primarily attributable to additions to property, plant and equipment and intangibles from acquisitions and capital expenditures.
Selling and Marketing. Selling and marketing expenses increased by $4.5 million to $12.8 million for the year ended December 31, 2018 from $8.3 million for the year ended December 31, 2017. This increase was due to investments made towards our growth strategy including increased sales personnel costs, marketing strategy costs and our sales incentive plan (SIP), which increased with revenue.
Change in fair value of earn-out/contingent consideration. The $3.5 million of expense and $0.3 million of gain, in the years ended December 31, 2018 and 2017, respectively, for change in fair value of earn-out/contingent consideration is detailed in Note 8 of the Notes to Consolidated Financial Statements of this Annual Report on Form 10-K.
GX dispute. The net $50.6 million of expense for the GX dispute in the year ended December 31, 2018 is detailed in Note 9 of the Notes to Consolidated Financial Statements and in Item 3, Legal Proceedings of this Annual Report on Form 10-K.
General and Administrative. General and administrative expenses increased by $8.4 million to $53.2 million for the year ended December 31, 2018 from $44.8 million for the year ended December 31, 2017. The increase in general and administrative expenses included $4.2 million from the acquired business, $2.4 million from bad debt expense, along with other increases from personnel costs and legal expenses.
43
Income Tax Expense. Our effective income tax rate was 4.2% and (27.3)% for the years ended December 31, 2018 and 2017, respectively. Our effective tax rate is affected by factors including changes in valuation allowances, fluctuations in income across jurisdictions with varying tax rates, and changes in income tax reserves, including related penalties and interest. See Note 13 — “Income Taxes,” to our consolidated financial statements included in this Annual Report on Form 10-K for more information regarding the items comprising our effective tax rates.
Liquidity and Capital Resources
At December 31, 2019, we had working capital, including cash, of $29.3 million.
Over the past three years, annual capital expenditures have ranged from $18.3 million to $30.1 million. Based on our current expectations, we believe our liquidity and capital resources will be sufficient for the conduct of our business and operations for the foreseeable future. We may also use a portion of our available cash to finance growth through the acquisition of, or investment in, businesses, products, services or technologies complementary to our current business, through selective mergers, acquisitions, joint ventures or otherwise, or to pay down outstanding debt.
After settlement of intercompany payables and notes at December 31, 2019, there is no cash in foreign subsidiaries available for repatriation to our domestic parent. No deferred tax liability has been recognized as of December 31, 2019 for those earnings that are not considered permanently reinvested.
During the next twelve months, we expect our principal sources of liquidity to be cash flows from operating activities, cash and cash equivalents, borrowing availability under our credit agreement and additional financing activities we may pursue, which may include debt or equity offerings. In forecasting our cash flows we have considered factors including contracted and expected services for customers, and contracted and available satellite bandwidth.
While we believe we have sufficient liquidity and capital resources to meet our current operating requirements, and expansion plans, we may elect to pursue additional expansion opportunities within the next year which could require additional financing, either debt or equity.
Beyond the next twelve months, we expect our principal sources of liquidity to be cash flows provided by operating activities, cash and cash equivalents on hand, borrowing availability under our credit agreement and additional financing activities we may pursue, which may include debt or equity offerings.
|
|
|
Year Ended December 31, |
|
|||||||||
|
|
|
2019 |
|
|
2018 |
|
|
2017 |
|
|||
|
|
|
(in thousands) |
|
|||||||||
|
Consolidated Statements of Cash Flows Data: |
|
|
|
|
|
|
|
|
|
|
|
|
|
Cash and cash equivalents, January 1, |
|
$ |
23,296 |
|
|
$ |
36,141 |
|
|
$ |
58,805 |
|
|
GX Dispute payment |
|
|
(50,000 |
) |
|
|
- |
|
|
|
- |
|
|
Remaining net cash provided by operating activities |
|
|
29,716 |
|
|
|
7,673 |
|
|
|
29,228 |
|
|
Net cash provided by (used in) operating activities |
|
|
(20,284 |
) |
|
|
7,673 |
|
|
|
29,228 |
|
|
Net cash used in investing activities |
|
|
(16,543 |
) |
|
|
(34,198 |
) |
|
|
(49,990 |
) |
|
Net cash provided by (used in) financing activities |
|
|
28,098 |
|
|
|
11,855 |
|
|
|
(2,847 |
) |
|
Changes in foreign currency translation |
|
|
(62 |
) |
|
|
1,825 |
|
|
|
945 |
|
|
Cash and cash equivalents, December 31, |
|
$ |
14,505 |
|
|
$ |
23,296 |
|
|
$ |
36,141 |
|
Currently, the Norwegian Kroner, the British Pound Sterling and the Brazilian Real are the foreign currencies that could materially impact our liquidity. We presently do not hedge these risks, but evaluate financial risks on a regular basis and may utilize financial instruments in place in the future if deemed necessary. During the years ended December 31, 2019, 2018 and 2017, 90.6%, 91.6% and 90.7% of our revenue was denominated in U.S. dollars, respectively.
Operating Activities
Net cash used in operating activities was $20.3 million for the year ended December 31, 2019 compared to net cash provided by operations of $7.7 million for the year ended December 31, 2018. The decrease in cash from operating activities of $28.0 million was primarily due to payment of $50.0 million towards the GX Dispute settlement,
44
partially offset by the timing of collecting receivables. Excluding the $50.0 million GX Dispute settlement payment, the remaining net cash provided by operating activities was $29.7 million.
Net cash provided by operating activities was $7.7 million for the year ended December 31, 2018 compared to $29.2 million for the year ended December 31, 2017. The decrease in cash provided by operating activities during 2018 of $21.6 million was primarily due to the timing of collecting receivables coupled with increased operating loss partially offset by the timing of the payment of accounts payable.
Our cash provided by operations is subject to many variables including the volatility of the oil and gas industry and the demand for our services. Other factors impacting operating cash flows include the availability and cost of satellite bandwidth, as well as the timing of collecting our receivables. Our future cash flow from operations will depend on our ability to increase our contracted services through our sales and marketing efforts while leveraging our contracted satellite and other communication service costs.
Investing Activities
Net cash used in investing activities was $16.5 million, $34.2 million and $50.0 million in the years ended December 31, 2019, 2018 and 2017, respectively. Of these amounts $22.4 million, $30.1 million, and $18.3 million, respectively, were for capital expenditures, a decrease of $7.7 million and an increase of $11.8 million for the years ended December 31, 2019 and 2018, respectively, compared to each of the respective prior periods. Capital expenditures for the year ended December 31, 2019 included $2.8 million for the buildout of the LTE network in the Gulf of Mexico with our partner T-Mobile and $2.4 million for the build-out of our new Lafayette office, which consolidates what was previously three facilities into one facility. Furthermore, the Company had $2.8 million of non-cash vendor financed capital expenditures, which in the first quarter of 2020 has become a debt obligation. We expect our 2020 capital expenditures to be focused on success-based growth. In the years ended December 31, 2019, 2018 and 2017, there were $5.8 million, $1.1 million and $0.5 million, respectively, of proceeds from the sales of property, plant and equipment.
Net cash used in investing activities during the year ended December 31, 2018 included $5.2 million paid net of cash acquired in connection with acquisitions consisting of $1.8 million for Auto-Comm and SAFCON net of cash acquired and $3.2 million for Intelie. Net cash used in investing activities during the year ended December 31, 2017 included $32.2 million paid in connection with acquisitions consisting of $4.9 million for Cyphre, $5.1 million for DTS and $22.2 million for ESS.
Financing Activities
Net cash provided by financing activities was $28.1 million and $11.9 million in the year ended December 31, 2019 and 2018, respectively. Net cash used in financing activities was $2.8 million in the year ended December 31, 2017.
Cash provided by financing activities for the year ended December 31, 2019 included $49.5 million in proceeds from borrowings primarily related to the GX Dispute, partially offset by $19.2 million in principal payments on our long-term debt, $1.4 million withheld to cover employee taxes on stock-based compensation and $0.5 million in financing fees related to the consents, waiver and amendment to the Credit Agreement.
Net cash provided by financing activities for the year ended December 31, 2018 included draws of $23.8 million on our revolving credit facility partially offset by $5.1 million in principal payments on our long-term debt. Additionally, we paid the $8.0 million TECNOR earnout in July 2018, of which $6.4 million is recorded as cash used in financing activities and $1.6 million is recorded as cash used in operating activities. The Company received proceeds from the issuance of common stock upon the exercise of stock options of $1.0 million offset by $1.2 million for stock withheld to cover employee taxes on stock-based compensation.
Cash used in financing activities for the year ended December 31, 2017 included $18.2 million in principal payments on our long-term debt partially offset by draws of $15.0 million on our revolving credit facility. This was partially offset by $0.8 million in proceeds from the issuance of common stock upon the exercise of stock options.
Amendment to the Credit Agreement
On February 21, 2020, we entered into to the Third Amendment to the Third Amended and Restated Credit Agreement (Amended Credit Agreement), with the same four financial institutions that are part of the current credit agreement. The Amended Credit Agreement provides for a $16.0 million Term Loan, a $100.0 million RCF and a
45
$30.0 million accordion feature. The Term Loan matures on March 31, 2022 with principal installments of $2.0 million due quarterly beginning June 30, 2020. The RCF and accordion, if exercised, mature on August 31, 2022.
The Amended Credit Agreement contains certain covenants and restrictions including maintaining a consolidated leverage ratio, as defined in the Credit Agreement, of less than or equal to 3.25 to 1.00 through the third quarter of 2020. The consolidated leverage ratio then steps down to 3.00 to 1.00 through the second quarter of 2021 and then steps down to 2.75 to 1.00 for all remaining quarters. The Amended Credit Agreement requires a consolidated fixed charge coverage ratio of not less than 1.25 to 1.00. If any default occurs related to these covenants that was not cured or waived, the unpaid principal and any accrued interest can be declared immediately due and payable. The facilities under the Credit Agreement are secured by substantially all our assets.
The Amended Credit Agreement bears interest at a rate of LIBOR plus a margin ranging from 1.75% to 3.25% based on a consolidated leverage ratio defined in the Amended Credit Agreement. Interest on the Amended Credit Agreement is payable monthly.
As of February 21, 2020, the outstanding principal amount of the Term Loan was $16.0 million, and the outstanding draws on the RCF were $95.4 million.
Credit Agreement
Prior to signing the Amended Credit Agreement, the Credit Agreement provides for a $15.0 million Term Loan, a $30.0 million Term-Out Loan and an $85.0 million RCF, which includes a $25.0 million sublimit for the issuance of commercial and standby letters of credit and performance bonds issued by the parties under the Credit Agreement. The RCF and Term-Out Loan mature on April 6, 2021. The Term Loan matures on December 31, 2020. We are actively pursuing refinancing our Credit Agreement.
Under the Credit Agreement, the Term Loan, the Term-Out Loan and the RCF bear interest at a rate of LIBOR plus a margin ranging from 1.75% to 3.00%, based on a consolidated leverage ratio defined in the Credit Agreement. Interest is payable monthly and principal installments of $1.25 million and $1.5 million under the Term Loan and Term-Out Loan, respectively, are due quarterly.
The weighted average interest rate for the years ended December 31, 2019 and 2018 was 5.2% and 4.8%, respectively, with an interest rate of 4.8% at December 31, 2019. As of December 31, 2019, the outstanding principal amounts were $5.0 million for the Term Loan, $25.5 million for the Term-Out Loan and $77.2 million for the RCF.
In April 2019, we determined that in periods beginning at least as early as March 31, 2014, we had incurred and not appropriately included certain surety bonds or other similar instruments in our consolidated leverage ratio calculation as defined by the credit agreement. As a result, on May 6, 2019, we entered into a Consent and Waiver (Consent) to the Credit Agreement with the financial institutions party thereto under which we are permitted to exclude certain incurred surety bonds and other similar instruments from the calculation of Consolidated Funded Indebtedness, as defined in the credit agreement, for the period ended December 31, 2019. In addition, the Consent waived all specified violations for all prior periods. On June 7, 2019, the Company entered into a second amendment to the Credit Agreement (Second Amendment), which (i) permits the Company to exclude up to $5.0 million in legal and related costs for the GX Dispute from the calculation of Consolidated EBITDA, (ii) permits the Company to exclude from the calculation of Consolidated Funded Indebtedness up to $30.0 million of undrawn surety bonds and (iii) revises the threshold of proceeds from asset dispositions above which the Company must prepay on the Term Out Loan to $5.0 million. Consolidated EBITDA and Consolidated Funded Indebtedness are non-GAAP metrics defined in the Credit Agreement.
We believe we have accurately calculated and reported our required debt covenant calculations for the reporting period ended December 31, 2019 and are in compliance with the required covenant ratios. We expect to remain in compliance with our required debt covenant calculations for the foreseeable future. In the event that there are changes in economic conditions we can limit or control our spending through reductions in discretionary capital or other types of controllable expenditures, monetization of assets, or any combination of these alternatives if needed to remain in compliance with such covenants.
Off-Balance Sheet Arrangements
We have not engaged in any off-balance sheet arrangements.
46
Contractual Obligations and Commercial Commitments
At December 31, 2019, we had contractual obligations and commercial commitments as follows:
|
|
|
Total |
|
|
2020 |
|
|
2021 - 2022 |
|
|
2023 - 2024 |
|
|
2025 and Beyond |
|
|||||
|
|
|
(in thousands) |
|
|||||||||||||||||
|
Contractual Obligations: |
|
|
|
|
|
|
|
|
|
|
|
|
|
|
|
|
|
|
|
|
|
Term loan (1) |
|
$ |
5,000 |
|
|
$ |
5,000 |
|
|
$ |
- |
|
|
$ |
- |
|
|
$ |
- |
|
|
Term-Out loan (1) |
|
|
25,500 |
|
|
|
6,000 |
|
|
|
19,500 |
|
|
|
- |
|
|
|
- |
|
|
Revolving loan |
|
|
77,150 |
|
|
|
- |
|
|
|
77,150 |
|
|
|
- |
|
|
|
- |
|
|
Finance leases |
|
|
543 |
|
|
|
166 |
|
|
|
332 |
|
|
|
45 |
|
|
|
- |
|
|
Interest (2) |
|
|
9,544 |
|
|
|
4,901 |
|
|
|
4,643 |
|
|
|
- |
|
|
|
- |
|
|
Operating leases |
|
|
10,012 |
|
|
|
2,053 |
|
|
|
2,565 |
|
|
|
2,374 |
|
|
|
3,020 |
|
|
Cyphre contingent consideration |
|
|
3,053 |
|
|
|
325 |
|
|
|
2,728 |
|
|
|
- |
|
|
|
- |
|
|
GX Dispute Settlement |
|
|
750 |
|
|
|
750 |
|
|
|
- |
|
|
|
- |
|
|
|
- |
|
|
Intelie contingent consideration (payable in stock) |
|
|
9,700 |
|
|
|
4,400 |
|
|
|
5,300 |
|
|
|
- |
|
|
|
- |
|
|
Commercial Commitments: |
|
|
|
|
|
|
|
|
|
|
|
|
|
|
|
|
|
|
|
|
|
Satellite and network services |
|
|
34,686 |
|
|
|
20,206 |
|
|
|
14,480 |
|
|
|
- |
|
|
|
- |
|
|
|
|
$ |
175,938 |
|
|
$ |
43,801 |
|
|
$ |
126,698 |
|
|
$ |
2,419 |
|
|
$ |
3,020 |
|
|
|
(1) |
The Amended Credit Agreement combined the Term Loan and Term-Out loan into one $16.0 million Term Loan, with principal installments of $2.0 million due quarterly beginning June 30, 2020. |
(2) Computed on the expected outstanding principal balance through the term of the Credit Agreement, at the interest rate in effect at December 31, 2019.
As of December 31, 2019, there were no outstanding standby letters of credit. There were $1.8 million of performance bonds outstanding.
We have a performance bond facility with a lender in the amount of $1.5 million for our MCS segment. This facility has a maturity date of June 2021. We maintain restricted cash on a dollar for dollar basis to secure this facility.
Non-GAAP Measures
The following table presents a reconciliation of our net loss to Adjusted EBITDA.
|
|
|
Year Ended December 31, |
|
|||||||||
|
|
|
2019 |
|
|
2018 |
|
|
2017 |
|
|||
|
|
|
(in thousands) |
|
|||||||||
|
Net loss |
|
$ |
(18,786 |
) |
|
$ |
(62,314 |
) |
|
$ |
(16,197 |
) |
|
Interest expense |
|
|
5,958 |
|
|
|
3,969 |
|
|
|
2,870 |
|
|
Depreciation and amortization |
|
|
31,129 |
|
|
|
33,154 |
|
|
|
30,845 |
|
|
(Gain) loss on sales of property, plant and equipment, net of retirements |
|
|
(4,240 |
) |
|
|
331 |
|
|
|
55 |
|
|
Stock-based compensation |
|
|
8,621 |
|
|
|
4,712 |
|
|
|
3,703 |
|
|
Restructuring |
|
|
731 |
|
|
|
842 |
|
|
|
767 |
|
|
Change in fair value of earn-out/contingent consideration |
|
|
2,499 |
|
|
|
3,543 |
|
|
|
(320 |
) |
|
Executive departure costs |
|
|
- |
|
|
|
406 |
|
|
|
1,192 |
|
|
Acquisition costs |
|
|
497 |
|
|
|
2,284 |
|
|
|
3,282 |
|
|
GX dispute |
|
|
- |
|
|
|
50,612 |
|
|
|
- |
|
|
GX dispute Phase II costs |
|
|
3,946 |
|
|
|
- |
|
|
|
- |
|
|
Income tax expense (benefit) |
|
|
10,745 |
|
|
|
(2,746 |
) |
|
|
3,472 |
|
|
Adjusted EBITDA (non-GAAP measure) |
|
$ |
41,100 |
|
|
$ |
34,793 |
|
|
$ |
29,669 |
|
We evaluate Adjusted EBITDA generated from our operations to assess the potential recovery of historical capital expenditures, determine timing and investment levels for growth opportunities, extend commitments of satellite
47
bandwidth cost, invest in new products and services, expand or open new offices and service centers, and assess purchasing synergies.
During the year ended December 31, 2019, Adjusted EBITDA increased by $6.3 million from $34.8 million in 2018 to $41.1 million in 2019.
During the year ended December 31, 2018, Adjusted EBITDA increased by $5.1 million from $29.7 million in 2017 to $34.8 million in 2018.
48
Item 7A. Quantitative and Qualitative Disclosures about Market Risk
We are subject to a variety of risks, including foreign currency exchange rate fluctuations relating to foreign operations and certain purchases from foreign vendors. In the normal course of business, we assess these risks and have established policies and procedures to manage our exposure to fluctuations in foreign currency values.
Our objective in managing our exposure to foreign currency exchange rate fluctuations is to reduce the impact of adverse fluctuations in earnings and cash flows associated with foreign currency exchange rates. We presently do not hedge these risks, but evaluate financial risk on a regular basis and may utilize financial instruments in the future if deemed necessary. During the years ended December 31, 2019 and 2018, 9.4% and 8.4%, respectively, of our revenues were earned in non-U.S. currencies. At December 31, 2019 and 2018, we had no significant outstanding foreign exchange contracts.
Our results of operations and cash flows are subject to fluctuations due to changes in interest rates primarily from our variable interest rate long-term debt. We presently do not hedge these risks, but evaluate financial risk on a regular basis and may utilize financial instruments in the future if deemed necessary. The following analysis reflects the annual impacts of potential changes in our interest rate to net loss attributable to us and our total stockholders’ equity based on our outstanding long-term debt on December 31, 2019 and 2018, assuming those liabilities were outstanding for the entire year.
|
|
|
December 31, |
|
|||||
|
|
2019 |
|
|
2018 |
|
|||
|
|
|
(in thousands) |
|
|||||
|
Effect on Net Loss and Equity - Increase/Decrease: |
|
|
|
|
|
|
|
|
|
1% Decrease/increase in rate |
|
$ |
1,077 |
|
|
$ |
770 |
|
|
2% Decrease/increase in rate |
|
$ |
2,155 |
|
|
$ |
1,541 |
|
|
3% Decrease/increase in rate |
|
$ |
3,232 |
|
|
$ |
2,311 |
|
Item 8. Financial Statements and Supplementary Data
Our consolidated financial statements, together with the related notes and report of independent registered public accounting firm, are set forth on the pages indicated in Item 15.
Item 9. Changes in and Disagreements with Accountants on Accounting and Financial Disclosure
None.
Item 9A. Controls and Procedures
Evaluation of Disclosure Controls and Procedures
Our management, with the participation of our Chief Executive Officer (our principal executive officer) and our Chief Financial Officer (our principal financial officer), evaluated the effectiveness of our disclosure controls and procedures as of December 31, 2019. The term “disclosure controls and procedures,” as defined in Rules 13a-15(e) and 15d-15(e) under the Securities Exchange Act of 1934 (the Exchange Act), means controls and other procedures of a company that are designed to ensure that information required to be disclosed by a company in the reports that it files or submits under the Exchange Act is recorded, processed, summarized and reported, within the time periods specified in the SEC's rules and forms. Disclosure controls and procedures include, without limitation, controls and procedures designed to ensure that information required to be disclosed by a company in the reports that it files or submits under the Exchange Act is accumulated and communicated to the company's management, including its principal executive and principal financial officers, as appropriate to allow timely decisions regarding required disclosure. Management recognizes that any controls and procedures, no matter how well designed and operated, can provide only reasonable assurance of achieving their objectives and management necessarily applies its judgment in evaluating the cost-benefit relationship of possible controls and procedures. Based on the evaluation of our disclosure controls and procedures as of December 31, 2019, our Chief Executive Officer and Chief Financial Officer concluded that, as of such date, our disclosure controls and procedures were effective and provide reasonable assurance that information required to be disclosed by the Company is recorded, processed, summarized and reported, within the time periods specified in the SEC's rules and forms.
49
Changes in Internal Control over Financial Reporting
There were no changes in our internal control over financial reporting identified in connection with the evaluation required by Rule 13a-15(d) of the Exchange Act that occurred during the quarter ended December 31, 2019 that has materially affected, or is reasonably likely to materially affect, our internal control over financial reporting.
Limitations of the Effectiveness of Internal Control
A control system, no matter how well conceived and operated, can provide only reasonable, not absolute, assurance that the objectives of the internal control system are met. Because of the inherent limitations of any internal control system, internal control over financial reporting may not detect or prevent misstatements. Projections of any evaluation of the effectiveness to future periods are subject to the risk that controls may become inadequate because of changes in conditions or that the degree of compliance with the policies and procedures may deteriorate.
Management's Annual Report on Internal Control over Financial Reporting
The management report called for by Item 308(a) of Regulation S-K is provided below.
50
Management’s Report on Internal Control over Financial Reporting
The management of RigNet, Inc. and its subsidiaries (the Company) is responsible for establishing and maintaining adequate internal control over financial reporting. The Company’s internal control system was designed to provide reasonable assurance to management and the Board of Directors regarding the reliability of financial reporting and the preparation of financial statements for external purposes in accordance with generally accepted accounting principles.
All internal control systems, no matter how well designed, have inherent limitations. Even those systems determined to be effective can provide only reasonable assurance with respect to financial statement presentation and preparation. Further, because of changes in conditions, the effectiveness of internal control may vary over time.
As of December 31, 2019, our management assessed the effectiveness of our internal control over financial reporting based on the criteria for effective internal control over financial reporting established in Internal Control – Integrated Framework (2013), issued by the Committee of Sponsoring Organizations of the Treadway Commission. Based on the assessment, management determined that we maintained effective internal control over financial reporting as of December 31, 2019, based on those criteria.
Deloitte & Touche LLP, the independent registered public accounting firm that audited our consolidated financial statements included in this Annual Report on Form 10-K, has issued an attestation report on the effectiveness of internal control over financial reporting as of December 31, 2019.
51
REPORT OF INDEPENDENT REGISTERED PUBLIC ACCOUNTING FIRM
To the Stockholders and the Board of Directors of RigNet, Inc.
Opinion on Internal Control over Financial Reporting
We have audited the internal control over financial reporting of RigNet, Inc. and subsidiaries (the "Company") as of December 31, 2019, based on criteria established in Internal Control — Integrated Framework (2013) issued by the Committee of Sponsoring Organizations of the Treadway Commission (COSO). In our opinion, the Company maintained, in all material respects, effective internal control over financial reporting as of December 31, 2019, based on criteria established in Internal Control — Integrated Framework (2013) issued by COSO.
We have also audited, in accordance with the standards of the Public Company Accounting Oversight Board (United States) (PCAOB), the consolidated financial statements as of and for the year ended December 31, 2019, of the Company and our report dated March 11, 2020, expressed an unqualified opinion on those financial statements.
Basis for Opinion
The Company’s management is responsible for maintaining effective internal control over financial reporting and for its assessment of the effectiveness of internal control over financial reporting, included in the accompanying Management’s Report on Internal Control over Financial Reporting. Our responsibility is to express an opinion on the Company’s internal control over financial reporting based on our audit. We are a public accounting firm registered with the PCAOB and are required to be independent with respect to the Company in accordance with the U.S. federal securities laws and the applicable rules and regulations of the Securities and Exchange Commission and the PCAOB.
We conducted our audit in accordance with the standards of the PCAOB. Those standards require that we plan and perform the audit to obtain reasonable assurance about whether effective internal control over financial reporting was maintained in all material respects. Our audit included obtaining an understanding of internal control over financial reporting, assessing the risk that a material weakness exists, testing and evaluating the design and operating effectiveness of internal control based on the assessed risk, and performing such other procedures as we considered necessary in the circumstances. We believe that our audit provides a reasonable basis for our opinion.
Definition and Limitations of Internal Control over Financial Reporting
A company’s internal control over financial reporting is a process designed to provide reasonable assurance regarding the reliability of financial reporting and the preparation of financial statements for external purposes in accordance with generally accepted accounting principles. A company’s internal control over financial reporting includes those policies and procedures that (1) pertain to the maintenance of records that, in reasonable detail, accurately and fairly reflect the transactions and dispositions of the assets of the company; (2) provide reasonable assurance that transactions are recorded as necessary to permit preparation of financial statements in accordance with generally accepted accounting principles, and that receipts and expenditures of the company are being made only in accordance with authorizations of management and directors of the company; and (3) provide reasonable assurance regarding prevention or timely detection of unauthorized acquisition, use, or disposition of the company’s assets that could have a material effect on the financial statements.
Because of its inherent limitations, internal control over financial reporting may not prevent or detect misstatements. Also, projections of any evaluation of effectiveness to future periods are subject to the risk that controls may become inadequate because of changes in conditions, or that the degree of compliance with the policies or procedures may deteriorate.
/s/ DELOITTE & TOUCHE LLP
Houston, Texas
March 11, 2020
None.
52
Certain information required by Part III is omitted from this Annual Report on Form 10-K as we intend to file our definitive Proxy Statement for the 2020 Annual Meeting of Stockholders (the “2020 Proxy Statement”) pursuant to Regulation 14A of the Securities Exchange Act of 1934, as amended, not later than 120 days after the end of the fiscal year covered by this Annual Report on Form 10-K, and certain information included in the Proxy Statement is incorporated herein by reference.
Item 10. Directors, Executive Officers and Corporate Governance
Certain information in response to this item is incorporated herein by reference to “Our Board of Directors and Nominees,” “Our Executive Officers” and “Corporate Governance” in the 2020 Proxy Statement to be filed with the SEC. If applicable, the information required by this Item 10 regarding compliance with Section 16(a) of the Exchange Act will be set forth under the heading “Delinquent Section 16(a) Reports” in the 2020 Proxy Statement and is incorporated herein by reference.
Code of Ethics and Business Conduct
We have adopted a code of ethics and business conduct (code of conduct) applicable to our principal executive, financial and accounting officers. A copy of the code of conduct is available, without charge, on our website at www.rig.net. We intend to satisfy the disclosure requirements of Form 8-K regarding any amendment to, or a waiver from, any provision of our code of ethics by posting such amendment or waiver on our website.
Item 11. Executive Compensation
Information in response to this item is incorporated herein by reference to “Corporate Governance” and “Executive Compensation” in the 2020 Proxy Statement to be filed with the SEC.
Item 12. Security Ownership of Certain Beneficial Owners and Management and Related Stockholder Matters
Information in response to this item is incorporated herein by reference to “Securities Authorized for Issuance under Equity Compensation Plans” and “Security Ownership of Certain Beneficial Owners and Management” in the 2020 Proxy Statement to be filed with the SEC.
Item 13. Certain Relationships and Related Transactions, and Director Independence
Information in response to this item is incorporated herein by reference to “Certain Relationships and Related Transactions” and “Director Independence” in the 2020 Proxy Statement to be filed with the SEC.
Item 14. Principal Accounting Fees and Services
Information in response to this item is incorporated herein by reference to “Fees Paid to Independent Registered Public Accounting Firm” in the 2020 Proxy Statement to be filed with the SEC.
53
Item 15. Exhibits, Financial Statement Schedules
|
(A) |
Consolidated Financial Statements |
|
|
1. |
Consolidated Financial Statements. The consolidated financial statements listed in the accompanying “Index to Consolidated Financial Information” are filed as part of this Annual Report. |
|
|
2. |
Consolidated Financial Statement Schedules. All schedules have been omitted because the information required to be presented in them is not applicable or is shown in the financial statements or related notes. |
|
(B) |
Exhibits |
The exhibits listed below are filed as part of this Annual Report for Form 10-K.
54
|
|
||
|
2.1 |
|
|
|
|
|
|
|
2.2 |
|
|
|
|
|
|
|
2.3 |
|
|
|
|
|
|
|
3.1 |
|
|
|
|
|
|
|
3.2 |
|
|
|
|
|
|
|
3.3 |
|
|
|
|
|
|
|
4.1 |
|
|
|
|
|
|
|
4.2 |
|
|
|
|
|
|
|
10.1+ |
|
|
|
|
|
|
|
10.2+ |
|
|
|
|
|
|
|
10.3+ |
|
|
|
|
|
|
|
10.4+ |
|
|
|
|
|
|
|
10.5+ |
|
|
|
|
|
|
|
10.6+ |
|
|
|
|
|
|
|
10.7+ |
|
|
|
|
|
|
|
10.8+ |
|
|
|
|
|
|
|
10.9+ |
|
|
|
|
|
|
|
10.10+ |
|
|
|
|
|
|
55
|
|
||
|
|
|
|
|
10.12+ |
|
|
|
|
|
|
|
10.13+ |
|
|
|
|
|
|
|
10.14+ |
|
Form of 2019 Target Performance Unit Agreement under the RigNet, Inc. 2019 Omnibus Incentive Plan |
|
|
|
|
|
10.15+ |
|
Form of 2019 Maximum Performance Unit Agreement under the RigNet, Inc. 2019 Omnibus Incentive Plan |
|
|
|
|
|
10.16+ |
|
|
|
|
|
|
|
10.17+ |
|
|
|
|
|
|
|
10.18+ |
|
|
|
|
|
|
|
10.19+ |
|
|
|
|
|
|
|
10.20+ |
|
|
|
|
|
|
|
10.21 |
|
|
|
|
|
|
|
10.22+ |
|
|
|
|
|
|
|
10.23+ |
|
|
|
|
|
|
|
10.24+ |
|
|
|
|
|
|
|
10.25 |
|
|
|
|
|
|
|
10.26 |
|
|
|
|
|
|
56
|
+ |
Indicates management contract or compensatory plan. |
None.
57
Pursuant to the requirements of Section 13 or 15(d) of the Securities Exchange Act of 1934, the Registrant has duly caused this report to be signed on its behalf by the undersigned, thereunto duly authorized.
RIGNET, INC.
|
By: |
/s/ STEVEN E. PICKETT |
|
March 11, 2020 |
|
|
Steven E. Pickett |
|
|
|
|
Chief Executive Officer and President |
|
|
Pursuant to the requirements of the Securities Exchange Act of 1934, this report has been signed below by the following persons on behalf of the Registrant and in the capacities and on the dates indicated.
|
Name |
|
Title |
|
Date |
|
|
|
|
|
|
|
/s/ STEVEN E. PICKETT |
|
Chief Executive Officer and President |
|
March 11, 2020 |
|
Steven E. Pickett |
|
(Principal Executive Officer) |
|
|
|
|
|
|
|
|
|
/s/ LEE M. AHLSTROM |
|
Senior Vice President and |
|
March 11, 2020 |
|
Lee M. Ahlstrom |
|
Chief Financial Officer |
|
|
|
|
|
(Principal Financial Officer) |
|
|
|
|
|
|
|
|
|
/s/ BENJAMIN A. CARTER |
|
Director of Accounting and Reporting |
|
March 11, 2020 |
|
Benjamin A. Carter |
|
(Principal Accounting Officer) |
|
|
|
|
|
|
|
|
|
/s/ JAMES H. BROWNING |
|
Chairman of the Board |
|
March 11, 2020 |
|
James H. Browning |
|
|
|
|
|
|
|
|
|
|
|
/s/ MATTIA CAPRIOLI |
|
Director |
|
March 11, 2020 |
|
Mattia Caprioli |
|
|
|
|
|
|
|
|
|
|
|
/s/ DITLEF DE VIBE |
|
Director |
|
March 11, 2020 |
|
Ditlef de Vibe |
|
|
|
|
|
|
|
|
|
|
|
/s/ KEVIN MULLOY |
|
Director |
|
March 11, 2020 |
|
Kevin Mulloy |
|
|
|
|
|
|
|
|
|
|
|
/s/ KEVIN J. O’HARA |
|
Director |
|
March 11, 2020 |
|
Kevin J. O’Hara |
|
|
|
|
|
|
|
|
|
|
|
/s/ KEITH OLSEN |
|
Director |
|
March 11, 2020 |
|
Keith Olsen |
|
|
|
|
|
|
|
|
|
|
|
/s/ GAIL SMITH |
|
Director |
|
March 11, 2020 |
|
Gail Smith |
|
|
|
|
|
|
|
|
|
|
|
/s/ BRENT K. WHITTINGTON |
|
Director |
|
March 11, 2020 |
|
Brent K. Whittington |
|
|
|
|
58
INDEX TO CONSOLIDATED FINANCIAL STATEMENTS
|
|
Page |
|
|
|
|
F-2 |
|
|
|
|
|
F-3 |
|
|
|
|
|
F-4 |
|
|
|
|
|
F-5 |
|
|
|
|
|
F-6 |
|
|
|
|
|
F-7 |
F-1
REPORT OF INDEPENDENT REGISTERED PUBLIC ACCOUNTING FIRM
To the Stockholders and the Board of Directors of RigNet, Inc.
Opinion on the Financial Statements:
We have audited the accompanying consolidated balance sheets of RigNet, Inc. and subsidiaries (the "Company") as of December 31, 2019 and 2018, the related consolidated statements of comprehensive loss, cash flows, and equity for each of the three years in the period ended December 31, 2019, and the related notes (collectively referred to as the "financial statements"). In our opinion, the financial statements present fairly, in all material respects, the financial position of the Company as of December 31, 2019 and 2018, and the results of its operations and its cash flows for each of the three years in the period ended December 31, 2019, in conformity with accounting principles generally accepted in the United States of America.
We have also audited, in accordance with the standards of the Public Company Accounting Oversight Board (United States) (PCAOB), the Company's internal control over financial reporting as of December 31, 2019, based on criteria established in Internal Control — Integrated Framework (2013) issued by the Committee of Sponsoring Organizations of the Treadway Commission and our report dated March 11, 2020, expressed an unqualified opinion on the Company's internal control over financial reporting.
Basis for opinion:
These financial statements are the responsibility of the Company’s management. Our responsibility is to express an opinion on the Company's financial statements based on our audits. We are a public accounting firm registered with the PCAOB and are required to be independent with respect to the Company in accordance with the U.S. federal securities laws and the applicable rules and regulations of the Securities and Exchange Commission and the PCAOB.
We conducted our audits in accordance with the standards of the PCAOB. Those standards require that we plan and perform the audit to obtain reasonable assurance about whether the financial statements are free of material misstatement, whether due to error or fraud. Our audits included performing procedures to assess the risks of material misstatement of the financial statements, whether due to error or fraud, and performing procedures that respond to those risks. Such procedures included examining, on a test basis, evidence regarding the amounts and disclosures in the financial statements. Our audits also included evaluating the accounting principles used and significant estimates made by management, as well as evaluating the overall presentation of the financial statements. We believe that our audits provide a reasonable basis for our opinion.
/s/ DELOITTE & TOUCHE LLP
Houston, Texas
March 11, 2020
We have served as the Company’s auditor since 2007.
F-2
|
|
|
December 31, |
|
|||||
|
|
|
2019 |
|
|
2018 |
|
||
|
|
|
(in thousands, except share amounts) |
|
|||||
|
ASSETS |
|
|
|
|
|
|
|
|
|
Current assets: |
|
|
|
|
|
|
|
|
|
Cash and cash equivalents |
|
$ |
12,941 |
|
|
$ |
21,711 |
|
|
Restricted cash |
|
|
42 |
|
|
|
41 |
|
|
Accounts receivable, net |
|
|
67,059 |
|
|
|
67,450 |
|
|
Costs and estimated earnings in excess of billings on uncompleted contracts (CIEB) |
|
|
13,275 |
|
|
|
7,138 |
|
|
Prepaid expenses and other current assets |
|
|
6,500 |
|
|
|
6,767 |
|
|
Total current assets |
|
|
99,817 |
|
|
|
103,107 |
|
|
Property, plant and equipment, net |
|
|
60,118 |
|
|
|
63,585 |
|
|
Restricted cash |
|
|
1,522 |
|
|
|
1,544 |
|
|
Goodwill |
|
|
46,792 |
|
|
|
46,631 |
|
|
Intangibles, net |
|
|
30,145 |
|
|
|
33,733 |
|
|
Right-of-use lease asset |
|
|
6,829 |
|
|
|
- |
|
|
Deferred tax and other assets |
|
|
5,757 |
|
|
|
10,325 |
|
|
TOTAL ASSETS |
|
$ |
250,980 |
|
|
$ |
258,925 |
|
|
LIABILITIES AND EQUITY |
|
|
|
|
|
|
|
|
|
Current liabilities: |
|
|
|
|
|
|
|
|
|
Accounts payable |
|
$ |
28,517 |
|
|
$ |
20,568 |
|
|
Accrued expenses |
|
|
16,660 |
|
|
|
16,374 |
|
|
Current maturities of long-term debt |
|
|
10,793 |
|
|
|
4,942 |
|
|
Income taxes payable |
|
|
2,649 |
|
|
|
2,431 |
|
|
GX dispute accrual |
|
|
750 |
|
|
|
50,765 |
|
|
Deferred revenue and other current liabilities |
|
|
11,173 |
|
|
|
5,863 |
|
|
Total current liabilities |
|
|
70,542 |
|
|
|
100,943 |
|
|
Long-term debt |
|
|
96,934 |
|
|
|
72,085 |
|
|
Deferred revenue |
|
|
855 |
|
|
|
318 |
|
|
Deferred tax liability |
|
|
2,672 |
|
|
|
652 |
|
|
Right-of-use lease liability - long-term portion |
|
|
6,329 |
|
|
|
- |
|
|
Other liabilities |
|
|
26,771 |
|
|
|
28,943 |
|
|
Total liabilities |
|
|
204,103 |
|
|
|
202,941 |
|
|
Commitments and contingencies (Note 9) |
|
|
|
|
|
|
|
|
|
Equity: |
|
|
|
|
|
|
|
|
|
Stockholders' equity |
|
|
|
|
|
|
|
|
|
Preferred stock - $0.001 par value; 10,000,000 shares authorized; no shares issued or outstanding at December 31, 2019 and 2018 |
|
|
- |
|
|
|
- |
|
|
Common stock - $0.001 par value; 190,000,000 shares authorized; 19,979,284 and 19,464,847 shares issued and outstanding at December 31, 2019 and 2018, respectively |
|
|
20 |
|
|
|
19 |
|
|
Treasury stock - 203,756 and 91,567 shares at December 31, 2019 and 2018, respectively, at cost |
|
|
(2,693 |
) |
|
|
(1,270 |
) |
|
Additional paid-in capital |
|
|
184,571 |
|
|
|
172,946 |
|
|
Accumulated deficit |
|
|
(115,673 |
) |
|
|
(96,517 |
) |
|
Accumulated other comprehensive loss |
|
|
(19,502 |
) |
|
|
(19,254 |
) |
|
Total stockholders' equity |
|
|
46,723 |
|
|
|
55,924 |
|
|
Non-redeemable, non-controlling interest |
|
|
154 |
|
|
|
60 |
|
|
Total equity |
|
|
46,877 |
|
|
|
55,984 |
|
|
TOTAL LIABILITIES AND EQUITY |
|
$ |
250,980 |
|
|
$ |
258,925 |
|
The accompanying notes are an integral part of the consolidated financial statements.
F-3
CONSOLIDATED STATEMENTS OF COMPREHENSIVE LOSS
|
|
|
Year Ended December 31, |
|
|||||||||
|
|
|
2019 |
|
|
2018 |
|
|
2017 |
|
|||
|
|
|
(in thousands, except per share amounts) |
|
|||||||||
|
Revenue |
|
$ |
242,931 |
|
|
$ |
238,854 |
|
|
$ |
204,892 |
|
|
Expenses: |
|
|
|
|
|
|
|
|
|
|
|
|
|
Cost of revenue (excluding depreciation and amortization) |
|
|
149,753 |
|
|
|
146,603 |
|
|
|
131,166 |
|
|
Depreciation and amortization |
|
|
31,129 |
|
|
|
33,154 |
|
|
|
30,845 |
|
|
Change in fair value of earn-out/contingent consideration |
|
|
2,499 |
|
|
|
3,543 |
|
|
|
(320 |
) |
|
Gain on sales of property, plant and equipment, net of retirements |
|
|
(4,240 |
) |
|
|
- |
|
|
|
- |
|
|
GX dispute |
|
|
- |
|
|
|
50,612 |
|
|
|
- |
|
|
Selling and marketing |
|
|
12,230 |
|
|
|
12,844 |
|
|
|
8,347 |
|
|
General and administrative |
|
|
53,630 |
|
|
|
53,193 |
|
|
|
44,842 |
|
|
Total expenses |
|
|
245,001 |
|
|
|
299,949 |
|
|
|
214,880 |
|
|
Operating loss |
|
|
(2,070 |
) |
|
|
(61,095 |
) |
|
|
(9,988 |
) |
|
Other income (expense): |
|
|
|
|
|
|
|
|
|
|
|
|
|
Interest expense |
|
|
(5,958 |
) |
|
|
(3,969 |
) |
|
|
(2,870 |
) |
|
Other income, net |
|
|
(13 |
) |
|
|
4 |
|
|
|
133 |
|
|
Loss before income taxes |
|
|
(8,041 |
) |
|
|
(65,060 |
) |
|
|
(12,725 |
) |
|
Income tax (expense) benefit |
|
|
(10,745 |
) |
|
|
2,746 |
|
|
|
(3,472 |
) |
|
Net loss |
|
|
(18,786 |
) |
|
|
(62,314 |
) |
|
|
(16,197 |
) |
|
Less: Net loss (income) attributable to: |
|
|
|
|
|
|
|
|
|
|
|
|
|
Non-redeemable, non-controlling interest |
|
|
370 |
|
|
|
139 |
|
|
|
(21 |
) |
|
Net Loss attributable to RigNet, Inc. stockholders |
|
$ |
(19,156 |
) |
|
$ |
(62,453 |
) |
|
$ |
(16,176 |
) |
|
COMPREHENSIVE LOSS |
|
|
|
|
|
|
|
|
|
|
|
|
|
Net loss |
|
$ |
(18,786 |
) |
|
$ |
(62,314 |
) |
|
$ |
(16,197 |
) |
|
Foreign currency translation |
|
|
(248 |
) |
|
|
(4,448 |
) |
|
|
3,165 |
|
|
Comprehensive loss |
|
|
(19,034 |
) |
|
|
(66,762 |
) |
|
|
(13,032 |
) |
|
Less: Comprehensive income (loss) attributable to non-controlling interest |
|
|
370 |
|
|
|
139 |
|
|
|
(21 |
) |
|
Comprehensive loss attributable to RigNet, Inc. stockholders |
|
$ |
(19,404 |
) |
|
$ |
(66,901 |
) |
|
$ |
(13,011 |
) |
|
LOSS PER SHARE - BASIC AND DILUTED |
|
|
|
|
|
|
|
|
|
|
|
|
|
Net loss attributable to RigNet, Inc. common stockholders |
|
$ |
(19,156 |
) |
|
$ |
(62,453 |
) |
|
$ |
(16,176 |
) |
|
Net loss per share attributable to RigNet, Inc. common stockholders, basic |
|
$ |
(0.97 |
) |
|
$ |
(3.34 |
) |
|
$ |
(0.90 |
) |
|
Net loss per share attributable to RigNet, Inc. common stockholders, diluted |
|
$ |
(0.97 |
) |
|
$ |
(3.34 |
) |
|
$ |
(0.90 |
) |
|
Weighted average shares outstanding, basic |
|
|
19,832 |
|
|
|
18,713 |
|
|
|
18,009 |
|
|
Weighted average shares outstanding, diluted |
|
|
19,832 |
|
|
|
18,713 |
|
|
|
18,009 |
|
The accompanying notes are an integral part of the consolidated financial statements.
F-4
CONSOLIDATED STATEMENTS OF CASH FLOWS
|
|
|
Year Ended December 31, |
|
|||||||||
|
|
|
2019 |
|
|
2018 |
|
|
2017 |
|
|||
|
|
|
(in thousands) |
|
|||||||||
|
Cash flows from operating activities: |
|
|
|
|
|
|
|
|
|
|
|
|
|
Net loss |
|
$ |
(18,786 |
) |
|
$ |
(62,314 |
) |
|
$ |
(16,197 |
) |
|
Adjustments to reconcile net loss to net cash provided by operations: |
|
|
|
|
|
|
|
|
|
|
|
|
|
Depreciation and amortization |
|
|
31,129 |
|
|
|
33,154 |
|
|
|
30,845 |
|
|
Stock-based compensation |
|
|
8,621 |
|
|
|
4,712 |
|
|
|
3,703 |
|
|
Amortization of deferred financing costs |
|
|
352 |
|
|
|
184 |
|
|
|
217 |
|
|
Deferred taxes |
|
|
4,643 |
|
|
|
(5,263 |
) |
|
|
3,917 |
|
|
Change in fair value of earn-out/contingent consideration |
|
|
2,499 |
|
|
|
3,543 |
|
|
|
(320 |
) |
|
Accretion of discount of contingent consideration payable for acquisitions |
|
|
341 |
|
|
|
450 |
|
|
|
624 |
|
|
(Gain) loss on sales of property, plant and equipment, net of retirements |
|
|
(4,240 |
) |
|
|
331 |
|
|
|
55 |
|
|
Changes in operating assets and liabilities, net of effect of acquisitions: |
|
|
|
|
|
|
|
|
|
|
|
|
|
Accounts receivable |
|
|
160 |
|
|
|
(15,254 |
) |
|
|
203 |
|
|
Costs and estimated earnings in excess of billings on uncompleted contracts |
|
|
(5,904 |
) |
|
|
(4,103 |
) |
|
|
122 |
|
|
Prepaid expenses and other assets |
|
|
2,155 |
|
|
|
(1,026 |
) |
|
|
4,659 |
|
|
Right-of-use lease asset |
|
|
(1,724 |
) |
|
|
- |
|
|
|
- |
|
|
Accounts payable |
|
|
7,481 |
|
|
|
7,527 |
|
|
|
2,733 |
|
|
Accrued expenses |
|
|
594 |
|
|
|
279 |
|
|
|
3,601 |
|
|
GX dispute |
|
|
(50,000 |
) |
|
|
50,612 |
|
|
|
- |
|
|
Deferred revenue and other current liabilities |
|
|
1,249 |
|
|
|
1,565 |
|
|
|
4,933 |
|
|
Right-of-use lease liability |
|
|
1,282 |
|
|
|
- |
|
|
|
- |
|
|
Other liabilities |
|
|
(136 |
) |
|
|
(5,149 |
) |
|
|
(9,867 |
) |
|
Payout of TECNOR contingent consideration - inception to date change in fair value portion |
|
|
- |
|
|
|
(1,575 |
) |
|
|
- |
|
|
Net cash provided by (used in) operating activities |
|
|
(20,284 |
) |
|
|
7,673 |
|
|
|
29,228 |
|
|
Cash flows from investing activities: |
|
|
|
|
|
|
|
|
|
|
|
|
|
Acquisitions (net of cash acquired) |
|
|
- |
|
|
|
(5,208 |
) |
|
|
(32,205 |
) |
|
Capital expenditures |
|
|
(22,374 |
) |
|
|
(30,072 |
) |
|
|
(18,284 |
) |
|
Proceeds from sales of property, plant and equipment |
|
|
5,831 |
|
|
|
1,082 |
|
|
|
499 |
|
|
Net cash used in investing activities |
|
|
(16,543 |
) |
|
|
(34,198 |
) |
|
|
(49,990 |
) |
|
Cash flows from financing activities: |
|
|
|
|
|
|
|
|
|
|
|
|
|
Proceeds from issuance of common stock upon the exercise of stock options |
|
|
5 |
|
|
|
970 |
|
|
|
916 |
|
|
Stock withheld to cover employee taxes on stock-based compensation |
|
|
(1,423 |
) |
|
|
(1,154 |
) |
|
|
(116 |
) |
|
Subsidiary distributions to non-controlling interest |
|
|
(276 |
) |
|
|
(157 |
) |
|
|
(76 |
) |
|
Payout of TECNOR contingent consideration - fair value on acquisition date portion |
|
|
- |
|
|
|
(6,425 |
) |
|
|
- |
|
|
Proceeds from borrowings |
|
|
49,498 |
|
|
|
23,750 |
|
|
|
15,000 |
|
|
Repayments of long-term debt |
|
|
(19,220 |
) |
|
|
(5,129 |
) |
|
|
(18,171 |
) |
|
Payments of financing fees |
|
|
(486 |
) |
|
|
- |
|
|
|
(400 |
) |
|
Net cash provided by (used in) financing activities |
|
|
28,098 |
|
|
|
11,855 |
|
|
|
(2,847 |
) |
|
Net change in cash and cash equivalents |
|
|
(8,729 |
) |
|
|
(14,670 |
) |
|
|
(23,609 |
) |
|
Cash and cash equivalents: |
|
|
|
|
|
|
|
|
|
|
|
|
|
Balance, January 1, |
|
|
23,296 |
|
|
|
36,141 |
|
|
|
58,805 |
|
|
Changes in foreign currency translation |
|
|
(62 |
) |
|
|
1,825 |
|
|
|
945 |
|
|
Balance, December 31, |
|
$ |
14,505 |
|
|
$ |
23,296 |
|
|
$ |
36,141 |
|
|
Supplemental disclosures: |
|
|
|
|
|
|
|
|
|
|
|
|
|
Income taxes paid |
|
$ |
4,970 |
|
|
$ |
3,967 |
|
|
$ |
2,060 |
|
|
Interest paid |
|
|
5,062 |
|
|
|
3,264 |
|
|
|
1,965 |
|
|
Property, plant and equipment acquired under finance leases |
|
|
556 |
|
|
|
108 |
|
|
|
- |
|
|
Non-cash investing - capital expenditures accrued |
|
|
2,508 |
|
|
|
2,123 |
|
|
|
1,672 |
|
|
Non-cash investing and financing - capital expenditures vendor financed |
|
|
2,756 |
|
|
|
- |
|
|
|
- |
|
|
Non-cash investing and financing - issuance of common stock for the Intelie earn-out |
|
|
3,000 |
|
|
|
- |
|
|
|
- |
|
|
Right-of-use operating lease entered into |
|
|
3,903 |
|
|
|
- |
|
|
|
- |
|
|
Non-cash investing - tenant improvement allowance |
|
|
- |
|
|
|
- |
|
|
|
1,728 |
|
|
Non-cash investing - contingent consideration for acquisitions |
|
|
- |
|
|
|
7,600 |
|
|
|
3,798 |
|
|
Non-cash investing and financing - stock for acquisitions |
|
|
- |
|
|
|
11,436 |
|
|
|
3,304 |
|
|
Liabilities assumed - acquisitions |
|
|
- |
|
|
|
5,610 |
|
|
|
819 |
|
|
|
|
December 31, |
|
|
December 31, |
|
|
December 31, |
|
|||
|
|
|
|
2019 |
|
|
|
2018 |
|
|
|
2017 |
|
|
Cash and cash equivalents |
|
$ |
12,941 |
|
|
$ |
21,711 |
|
|
$ |
34,598 |
|
|
Restricted cash - current portion |
|
|
42 |
|
|
|
41 |
|
|
|
43 |
|
|
Restricted cash - long-term portion |
|
|
1,522 |
|
|
|
1,544 |
|
|
|
1,500 |
|
|
Cash and cash equivalents including restricted cash |
|
$ |
14,505 |
|
|
$ |
23,296 |
|
|
$ |
36,141 |
|
The accompanying notes are an integral part of the consolidated financial statements.
F-5
CONSOLIDATED STATEMENTS OF EQUITY
|
|
|
Common Stock |
|
|
Treasury Stock |
|
|
Additional Paid-In |
|
|
Retained Earnings (Accumulated |
|
|
Accumulated Other Comprehensive |
|
|
Total Stockholders' |
|
|
Non- Redeemable, Non-Controlling |
|
|
|
|
|
|||||||||||||||
|
|
|
Shares |
|
|
Amount |
|
|
Shares |
|
|
Amount |
|
|
Capital |
|
|
Deficit) |
|
|
Income (Loss) |
|
|
Equity |
|
|
Interest |
|
|
Total Equity |
|
||||||||||
|
|
|
(in thousands) |
|
|||||||||||||||||||||||||||||||||||||
|
Balance, January 1, 2017 |
|
|
17,933 |
|
|
|
18 |
|
|
|
- |
|
|
|
- |
|
|
|
147,906 |
|
|
|
(17,550 |
) |
|
|
(17,971 |
) |
|
|
112,403 |
|
|
|
175 |
|
|
|
112,578 |
|
|
Issuance of common stock upon the exercise of stock options |
|
|
70 |
|
|
|
- |
|
|
|
- |
|
|
|
- |
|
|
|
916 |
|
|
|
- |
|
|
|
- |
|
|
|
916 |
|
|
|
- |
|
|
|
916 |
|
|
Issuance of common stock upon the vesting of restricted stock units, net of share cancellations |
|
|
44 |
|
|
|
- |
|
|
|
- |
|
|
|
- |
|
|
|
- |
|
|
|
- |
|
|
|
- |
|
|
|
- |
|
|
|
- |
|
|
|
- |
|
|
Issuance of common stock upon the acquisition of Cyphre |
|
|
192 |
|
|
|
- |
|
|
|
- |
|
|
|
- |
|
|
|
3,304 |
|
|
|
- |
|
|
|
- |
|
|
|
3,304 |
|
|
|
- |
|
|
|
3,304 |
|
|
Stock withheld to cover employee taxes on stock-based compensation |
|
|
(6 |
) |
|
|
- |
|
|
|
6 |
|
|
|
(116 |
) |
|
|
- |
|
|
|
- |
|
|
|
- |
|
|
|
(116 |
) |
|
|
- |
|
|
|
(116 |
) |
|
Stock-based compensation |
|
|
- |
|
|
|
- |
|
|
|
- |
|
|
|
- |
|
|
|
3,703 |
|
|
|
- |
|
|
|
- |
|
|
|
3,703 |
|
|
|
- |
|
|
|
3,703 |
|
|
Foreign currency translation |
|
|
- |
|
|
|
- |
|
|
|
- |
|
|
|
- |
|
|
|
- |
|
|
|
- |
|
|
|
3,165 |
|
|
|
3,165 |
|
|
|
- |
|
|
|
3,165 |
|
|
Non-controlling owner distributions |
|
|
- |
|
|
|
- |
|
|
|
- |
|
|
|
- |
|
|
|
- |
|
|
|
- |
|
|
|
- |
|
|
|
- |
|
|
|
(76 |
) |
|
|
(76 |
) |
|
Net income (loss) |
|
|
- |
|
|
|
- |
|
|
|
- |
|
|
|
- |
|
|
|
- |
|
|
|
(16,176 |
) |
|
|
- |
|
|
|
(16,176 |
) |
|
|
(21 |
) |
|
|
(16,197 |
) |
|
Balance, December 31, 2017 |
|
|
18,233 |
|
|
$ |
18 |
|
|
|
6 |
|
|
$ |
(116 |
) |
|
$ |
155,829 |
|
|
$ |
(33,726 |
) |
|
$ |
(14,806 |
) |
|
$ |
107,199 |
|
|
$ |
78 |
|
|
$ |
107,277 |
|
|
Issuance of common stock upon the exercise of stock options |
|
|
60 |
|
|
|
- |
|
|
|
- |
|
|
|
- |
|
|
|
970 |
|
|
|
- |
|
|
|
- |
|
|
|
970 |
|
|
|
- |
|
|
|
970 |
|
|
Issuance of common stock upon the vesting of restricted stock units, net of share cancellations |
|
|
383 |
|
|
|
- |
|
|
|
- |
|
|
|
- |
|
|
|
- |
|
|
|
- |
|
|
|
- |
|
|
|
- |
|
|
|
- |
|
|
|
- |
|
|
Issuance of common stock for acquisitions |
|
|
789 |
|
|
|
1 |
|
|
|
- |
|
|
|
- |
|
|
|
11,435 |
|
|
|
- |
|
|
|
- |
|
|
|
11,436 |
|
|
|
- |
|
|
|
11,436 |
|
|
Stock withheld to cover employee taxes on stock-based compensation |
|
|
- |
|
|
|
- |
|
|
|
86 |
|
|
|
(1,154 |
) |
|
|
- |
|
|
|
- |
|
|
|
- |
|
|
|
(1,154 |
) |
|
|
- |
|
|
|
(1,154 |
) |
|
Stock-based compensation |
|
. |
|
|
|
- |
|
|
|
- |
|
|
|
- |
|
|
|
4,712 |
|
|
|
- |
|
|
|
- |
|
|
|
4,712 |
|
|
|
- |
|
|
|
4,712 |
|
|
|
Cumulative effect adjustment from implementation of ASU 2016-16 |
|
|
- |
|
|
|
- |
|
|
|
- |
|
|
|
- |
|
|
|
- |
|
|
|
(338 |
) |
|
|
- |
|
|
|
(338 |
) |
|
|
- |
|
|
|
(338 |
) |
|
Foreign currency translation |
|
|
- |
|
|
|
- |
|
|
|
- |
|
|
|
- |
|
|
|
- |
|
|
|
- |
|
|
|
(4,448 |
) |
|
|
(4,448 |
) |
|
|
- |
|
|
|
(4,448 |
) |
|
Non-controlling owner distributions |
|
|
- |
|
|
|
- |
|
|
|
- |
|
|
|
- |
|
|
|
- |
|
|
|
- |
|
|
|
- |
|
|
|
- |
|
|
|
(157 |
) |
|
|
(157 |
) |
|
Net income (loss) |
|
|
- |
|
|
|
- |
|
|
|
- |
|
|
|
- |
|
|
|
- |
|
|
|
(62,453 |
) |
|
|
- |
|
|
|
(62,453 |
) |
|
|
139 |
|
|
|
(62,314 |
) |
|
Balance, December 31, 2018 |
|
|
19,465 |
|
|
$ |
19 |
|
|
|
92 |
|
|
$ |
(1,270 |
) |
|
$ |
172,946 |
|
|
$ |
(96,517 |
) |
|
$ |
(19,254 |
) |
|
$ |
55,924 |
|
|
$ |
60 |
|
|
$ |
55,984 |
|
|
Issuance of common stock upon the exercise of stock options |
|
|
1 |
|
|
|
- |
|
|
|
- |
|
|
|
- |
|
|
|
3 |
|
|
|
- |
|
|
|
- |
|
|
|
3 |
|
|
|
- |
|
|
|
3 |
|
|
Issuance of common stock upon the vesting of Restricted Stock Units, net of share cancellations |
|
|
305 |
|
|
|
1 |
|
|
|
- |
|
|
|
- |
|
|
|
1 |
|
|
|
- |
|
|
|
- |
|
|
|
2 |
|
|
|
- |
|
|
|
2 |
|
|
Issuance of common stock for the Intelie earn-out |
|
|
208 |
|
|
|
- |
|
|
|
- |
|
|
|
- |
|
|
|
3,000 |
|
|
|
- |
|
|
|
- |
|
|
|
3,000 |
|
|
|
- |
|
|
|
3,000 |
|
|
Stock withheld to cover employee taxes on stock-based compensation |
|
|
- |
|
|
|
- |
|
|
|
112 |
|
|
|
(1,423 |
) |
|
|
- |
|
|
|
- |
|
|
|
- |
|
|
|
(1,423 |
) |
|
|
- |
|
|
|
(1,423 |
) |
|
Stock-based compensation |
|
. |
|
|
|
- |
|
|
|
- |
|
|
|
- |
|
|
|
8,621 |
|
|
|
- |
|
|
|
- |
|
|
|
8,621 |
|
|
|
- |
|
|
|
8,621 |
|
|
|
Foreign currency translation |
|
|
- |
|
|
|
- |
|
|
|
- |
|
|
|
- |
|
|
|
- |
|
|
|
- |
|
|
|
(248 |
) |
|
|
(248 |
) |
|
|
- |
|
|
|
(248 |
) |
|
Non-controlling owner distributions |
|
|
- |
|
|
|
- |
|
|
|
- |
|
|
|
- |
|
|
|
- |
|
|
|
- |
|
|
|
- |
|
|
|
- |
|
|
|
(276 |
) |
|
|
(276 |
) |
|
Net income (loss) |
|
|
- |
|
|
|
- |
|
|
|
- |
|
|
|
- |
|
|
|
- |
|
|
|
(19,156 |
) |
|
|
- |
|
|
|
(19,156 |
) |
|
|
370 |
|
|
|
(18,786 |
) |
|
Balance, December 31, 2019 |
|
|
19,979 |
|
|
$ |
20 |
|
|
|
204 |
|
|
$ |
(2,693 |
) |
|
$ |
184,571 |
|
|
$ |
(115,673 |
) |
|
$ |
(19,502 |
) |
|
$ |
46,723 |
|
|
$ |
154 |
|
|
$ |
46,877 |
|
The accompanying notes are an integral part of the consolidated financial statements.
F-6
NOTES TO THE CONSOLIDATED FINANCIAL STATEMENTS
Note 1—Business and Summary of Significant Accounting Policies
Nature of Business
RigNet, Inc. (the Company or RigNet) is a global technology company that provides customized data and communications services. Customers use our private networks to manage information flows and execute mission-critical operations primarily in remote areas where conventional telecommunications infrastructure is either unreliable or unavailable. RigNet provides clients what is often the sole means of communications for their remote operations. On top of and vertically integrated into these networks RigNet provides services ranging from fully-managed voice, data, and video to more advanced services including: cyber security threat detection and prevention; applications to improve crew welfare, safety or workforce productivity; and a real-time AI-backed data analytics platform to enhance customer decision making and business performance.
RigNet delivers advanced software and communications infrastructure that allow our customers to realize the business benefits of digital transformation. With world-class, ultra-secure solutions spanning global IP connectivity, bandwidth-optimized Over-The-Top (OTT) applications, Industrial Internet of Things (IoT) big data enablement, and industry-leading machine learning analytics, RigNet supports the full evolution of digital enablement, empowering businesses to respond faster to high priority issues, mitigate the risk of operational disruption, and maximize their overall financial performance.
Basis of Presentation
The Company presents its financial statements in accordance with generally accepted accounting principles in the United States (U.S. GAAP).
Principles of Consolidation and Reporting
The Company’s consolidated financial statements include the accounts of RigNet, Inc. and all subsidiaries thereof. All intercompany accounts and transactions have been eliminated in consolidation. As of December 31, 2019, 2018 and 2017, non-controlling interest of subsidiaries represents the outside economic ownership interest of Qatar, WLL of less than 3.0%.
Use of Estimates in Preparation of Financial Statements
The preparation of financial statements in conformity with U.S. GAAP requires management to make estimates and assumptions that affect the reported amounts of assets and liabilities, the disclosure of contingent assets and liabilities at the date of the financial statements and the reported amounts of revenue and expenses during the reporting periods, as well as certain financial statement disclosures. The estimates that are particularly significant to the financial statements include estimates related to the Company’s use of the percentage-of-completion method, as well as the Company’s valuation of goodwill, intangibles, stock-based compensation, litigation accruals, income tax valuation allowance and uncertain tax positions. While management believes that the estimates and assumptions used in the preparation of the financial statements are appropriate, future results could differ from these estimates. Further, volatile equity and energy markets combine to increase uncertainty in such estimates and assumptions. As such, estimates and assumptions are adjusted when facts and circumstances dictate, and any changes will be reflected in the financial statements in future periods.
Cash and Cash Equivalents
Cash and cash equivalents consist of cash on-hand and highly-liquid investments purchased with original maturities of three months or less.
Restricted Cash
As of December 31, 2019 and 2018, the Company had restricted cash of $0.1 million and $1.5 million, in current and long-term assets, respectively. The restricted cash in long-term assets is primarily used to collateralize a performance bond in the MCS segment (see Note 6 – “Long-Term Debt”).
F-7
RIGNET, INC.
NOTES TO THE CONSOLIDATED FINANCIAL STATEMENTS – (CONTINUED)
Accounts Receivable
Trade accounts receivable are recognized as customers are billed in accordance with customer contractual agreements. The Company reports an allowance for doubtful accounts for probable credit losses existing in accounts receivable. Management determines the allowance based on a review of currently outstanding receivables and the Company’s historical write-off experience. Individual receivables and balances which have been outstanding greater than 120 days are reviewed individually. Account balances, when determined to be uncollectible, are charged against the allowance.
Property, Plant and Equipment
Property, plant and equipment consists of (i) telecommunication and computer equipment, (ii) furniture and other office equipment, (iii) leasehold improvements, (iv) building and (v) land. All property, plant and equipment, excluding land, is depreciated and stated at acquisition cost net of accumulated depreciation. Depreciation is calculated using the straight-line method over the expected useful lives of the respective assets, which range from one to forty years. The Company assesses the value of property, plant and equipment for impairment when the Company determines that events and circumstances indicate that the recorded carrying value may not be recoverable. An impairment is determined by comparing estimated future net undiscounted cash flows to the carrying value at the time of the assessment. No impairment to property, plant and equipment was recorded in the years ended December 31, 2019, 2018 or 2017.
Maintenance and repair costs are charged to expense when incurred.
Intangibles
Intangibles consist of customer relationships, covenants-not-to-compete, brand name, licenses, developed technology, and backlog acquired as part of the Company’s acquisitions. Intangibles also include internal-use software. The Company’s intangibles have useful lives ranging from 5.0 to 20.0 years and are amortized on a straight-line basis. The Company assesses the value of intangibles for impairment when the Company determines that events and circumstances indicate that the recorded carrying value may not be recoverable. An impairment is determined by comparing estimated future net undiscounted cash flows to the carrying value at the time of the assessment.
No impairment to intangibles was recorded in the years ended December 31, 2019, 2018 or 2017.
Goodwill
Goodwill resulted from prior acquisitions as the consideration paid for the acquired businesses exceeded the fair value of acquired identifiable net tangible and intangible assets. Goodwill is reviewed for impairment at least annually, as of July 31, with additional evaluations being performed when events or circumstances indicate that the carrying value of these assets may not be recoverable.
The goodwill impairment test is used to identify potential impairment by comparing the fair value of each reporting unit to the book value of the reporting unit, including goodwill. Fair value of the reporting unit is determined using a combination of the reporting unit’s expected present value of future cash flows and a market approach. The present value of future cash flows is estimated using our most recent forecast and our weighted average cost of capital. The market approach uses a market multiple on the reporting unit’s cash generated from operations. Significant estimates for each reporting unit included in our impairment analysis are cash flow forecasts, our weighted average cost of capital, projected income tax rates and market multiples. Changes in these estimates could affect the estimated fair value of our reporting units and result in an impairment of goodwill in a future period. If the fair value of a reporting unit is less than its book value, goodwill of the reporting unit is considered to be impaired. If the book value of the reporting unit’s goodwill exceeds the implied fair value of that goodwill, an impairment loss is recognized in an amount equal to that excess. Any impairment in the value of goodwill is charged to earnings in the period such impairment is determined.
The Company performs its annual impairment test on July 31, with the most recent annual test being performed as of July 31, 2019. The July 31, 2019, 2018 and 2017 tests resulted in no impairment as the fair value of each reporting unit exceeded the carrying value plus goodwill of that reporting unit.
F-8
RIGNET, INC.
NOTES TO THE CONSOLIDATED FINANCIAL STATEMENTS – (CONTINUED)
MCS had $23.0 million of goodwill as of December 31, 2019, and fair value exceeded carrying value by 16.1% as of the July 31, 2019 annual impairment test. Apps & IoT had $22.5 million of goodwill as of December 31, 2019, and fair value exceeded carrying value by 155.7% as of the July 31, 2019 annual impairment test. Systems Integration had $1.4 million of goodwill as of December 31, 2019, and fair value exceeded carrying value by 29.2% as of the July 31, 2019 annual impairment test. Any future downturn in our business could adversely impact the key assumptions in our impairment test. While we believe that there appears to be no indication of current or future impairment, historical operating results may not be indicative of future operating results and events and circumstances may occur causing a triggering event in a period as short as three months.
As of December 31, 2019 and 2018, goodwill was $46.8 million and $46.6 million, respectively. In addition to the impact of acquisitions and impairments, goodwill increases or decreases in value due to the effect of foreign currency translation.
Long-Term Debt
Long-term debt is recognized in the consolidated balance sheets, net of costs incurred, in connection with obtaining debt financing. Debt financing costs are deferred and reported as a reduction to the principal amount of the debt. Such costs are amortized over the life of the debt using the effective interest rate method and included in interest expense in the Company’s consolidated financial statements.
Revenue Recognition - Revenue from Contracts with Customers
Revenue is recognized to depict the transfer of promised goods or services in an amount that reflects the consideration to which the Company expects to be entitled in exchange for those goods or services.
Revenue Recognition - MCS and Apps & IoT
MCS and Apps & IoT customers are primarily served under fixed-price contracts, either on a monthly, usage or day rate basis or for equipment sales and consulting services. Contracts are generally in the form of Master Service Agreements, or MSAs, with specific services being provided under individual service orders. Offshore contracts generally have a term of up to five years with renewal options. Land-based contracts are generally shorter term or terminable on short notice without a penalty. Service orders are executed under the MSA for individual remote sites or groups of sites, and generally permit early termination on short notice without penalty in the event of force majeure, breach of the MSA or cold stacking of a drilling rig (when a rig is taken out of service and is expected to be idle for a protracted period of time).
Performance Obligations Satisfied Over Time— The delivery of service represents the single performance obligation under MCS and Apps & IoT contracts. Revenue for contracts is generally recognized over time as service is transferred to the customer and the Company expects to be entitled to the agreed monthly, usage or day rate basis in exchange for those services.
Performance Obligations Satisfied at a Point in Time—The delivery of equipment represents the single performance obligation under equipment sale contracts. Revenue for equipment sales is generally recognized upon delivery of equipment to customers.
Revenue Recognition – Systems Integration
Revenues related to long-term, fixed-price Systems Integration contracts for customized network solutions are recognized based on the percentage of completion for the contract. At any point, RigNet has numerous contracts in progress, all of which are at various stages of completion. Accounting for revenues and profits on long-term contracts requires estimates of total estimated contract costs and estimates of progress toward completion to determine the extent of revenue and profit recognition.
Performance Obligations Satisfied Over Time — The delivery of a Systems Integration solution represents the single performance obligation under Systems Integration contracts. Progress towards completion on fixed-price contracts is measured based on the ratio of costs incurred to total estimated contract costs (the cost-to-cost method). These estimates may be revised as additional information becomes available or as specific project circumstances change.
F-9
RIGNET, INC.
NOTES TO THE CONSOLIDATED FINANCIAL STATEMENTS – (CONTINUED)
The Company reviews all material contracts on a monthly basis and revises the estimates as appropriate for developments such as providing services, purchasing third-party materials and equipment at costs differing from those previously estimated, and incurring or expecting to incur schedule issues. Changes in estimated final contract revenues and costs can either increase or decrease the final estimated contract profit or loss. Profits are recorded in the period in which a change in estimate is recognized, based on progress achieved through the period of change. Anticipated losses on contracts are recorded in full in the period in which they become evident. Revenue recognized in excess of amounts billed is classified as a current asset under Costs and estimated earnings in excess of billings on uncompleted contracts (CIEB).
Systems Integration contracts are billed in accordance with the terms of the contract which are typically either based on milestones or specified time intervals. As of December 31, 2019 and 2018, the amount of CIEB related to Systems Integration projects was $13.3 million and $7.1 million, respectively. Under long-term contracts, amounts recorded in CIEB may not be realized or paid, respectively, within a one-year period. As of December 31, 2019 and 2018, $1.0 million and none, respectively, of amounts billed to customers in excess of revenue recognized to date are classified as a current liability, under deferred revenue and other current liabilities. Additionally as of December 31, 2019 and 2018, there were $2.6 million and $3.3 million of retention included in Accounts Receivable.
Variable Consideration – Systems Integration - The Company records revenue on contracts relating to certain probable claims and unapproved change orders by including in revenue an amount less than or equal to the amount of costs incurred to date relating to these probable claims and unapproved change orders, thus recognizing no profit until such time as claims are finalized or change orders are approved. The amount of unapproved change orders and claim revenues is included in the Company’s Consolidated Balance Sheets as part of CIEB. No material unapproved change orders or claims revenue was included in CIEB as of December 31, 2019 and 2018. As new facts become known, an adjustment to the estimated recovery is made and reflected in the current period.
Backlog - As of December 31, 2019, we had backlog for our percentage of completion projects of $26.2 million, which will be recognized over the remaining contract term for each contract. Percentage of completion contract terms are typically one to three years. As of December 31, 2018, we had backlog for our percentage of completion projects of $45.5 million.
Leases
Effective with adoption of Accounting Standards Update No. 2016-02 (ASU 2016-02), Leases (the new lease standard) on January 1, 2019, we determine if an arrangement is a lease at inception. Operating leases right-of-use assets and liabilities are included in right-to-use lease asset, deferred revenue and other current liabilities, and right-to-use lease liability – long-term portion on our consolidated balance sheets. Finance leases are included in property, plant and equipment; current maturities of long-term debt; and long-term debt on our consolidated balance sheets.
Operating lease right-to-use assets and liabilities are recognized based on the present value of the future minimum lease payments over the lease term. As most of our leases do not provide an implicit rate, we use our incremental borrowing rate based on the information available at commencement date in determining the present value of future payments. Our lease terms may include options to extend or terminate the lease when it is reasonably certain that we will exercise that option. Lease expense for minimum lease payments is recognized on a straight-line basis over the lease term.
Stock-Based Compensation
The Company recognizes expense for stock-based compensation based on the fair value of options and restricted stock on the grant date of the awards. Fair value of options on the grant date is determined using the Black-Scholes model, which requires judgment in estimating the expected term of the option, risk-free interest rate, expected volatility of the Company’s stock and dividend yield of the option. Fair value of restricted stock, restricted stock units and performance share units on the grant date is equal to the market price of RigNet’s common stock on the date of grant. The Company’s policy is to recognize compensation expense for service-based awards on a straight-line basis over the requisite service period of the entire award. Stock-based compensation expense is based on awards ultimately expected to vest.
F-10
RIGNET, INC.
NOTES TO THE CONSOLIDATED FINANCIAL STATEMENTS – (CONTINUED)
Current income taxes are determined based on the tax laws and rates in effect in the jurisdictions and countries that the Company operates in and revenue is earned. Deferred income taxes reflect the tax effect of net operating losses, foreign tax credits and the tax effects of temporary differences between the carrying amount of assets and liabilities for financial statement and income tax purposes, as determined under enacted tax laws and rates. Valuation allowances are established when management determines that it is more likely than not that some portion or the entire deferred tax asset will not be realized. The financial effect of changes in tax laws or rates is accounted for in the period of enactment.
From time to time, the Company engages in transactions in which the tax consequences may be subject to uncertainty. In the normal course of business, the Company prepares and files tax returns based on interpretation of tax laws and regulations, which are subject to examination by various taxing authorities. Such examinations may result in future tax and interest assessments by these taxing authorities. The Company evaluates its tax positions and recognize only tax benefits for financial purposes that, more likely than not, will be sustained upon examination, including resolutions of any related appeals or litigation processes, based on the technical merits of the position.
The Company has elected to include income tax related interest and penalties as a component of income tax expense.
Foreign Currency Translation
The U.S. dollar serves as the currency of measurement and reporting for the Company’s consolidated financial statements. The Company has certain subsidiaries with functional currencies of Norwegian Kroner, British Pound Sterling, or Brazilian Real. The functional currency of all the Company’s other subsidiaries is the U.S. dollar.
Transactions occurring in currencies other than the functional currency of a subsidiary have been converted to the functional currency of that subsidiary at the exchange rate in effect at the transaction date with resulting gains and losses included in current earnings. Carrying values of monetary assets and liabilities in functional currencies other than U.S. dollars have been translated to U.S. dollars based on the U.S. exchange rate at the balance sheet date and the resulting foreign currency translation gain or loss is included in comprehensive income (loss) in the consolidated financial statements.
Recently Issued Accounting Pronouncements
In March 2016, the FASB issued Accounting Standards Update No. 2016-02 (ASU 2016-02), Leases. This ASU is effective for annual reporting periods beginning after December 15, 2018. This ASU introduced a new lessee model that generally brings leases on to the balance sheet. The Company adopted this ASU as of the first quarter 2019, and it required right-of-use liabilities on the consolidated balance sheet of $6.5 million as of March 31, 2019, of which $5.8 million were long-term and $0.7 million were current, with no related impact on the Company’s Consolidated Statement of Equity or Comprehensive Loss. The Company elected the package of practical expedients permitted under the transition guidance within the new standard which, among other things, allows companies to carry forward their historical lease classification, to elect to not separate non-lease components from lease components for all classes of underlying lease assets, and to not record leases with an initial term of less than 12 months. The Company has used the optional transition method permitted under Accounting Standards Update No. 2018-11 (ASU 2018-11). Accordingly, prior year amounts have not been adjusted and continue to be reflected in accordance with the Company’s historical accounting. The Company’s credit agreement excludes the impact of ASU 2016-02.
In June 2016, the FASB issued Accounting Standards Update No. 2016-13 (ASU 2016-13), which measures credit losses on most financial assets and certain other instruments that are not measured at fair value through net income. The update amends the impairment model to utilize a current expected credit loss (CECL) methodology in place of the incurred loss methodology for financial instruments, including trade receivables. The amendment requires entities to consider a broader range of information to estimate expected credit losses, which may result in earlier recognition of losses. Companies will apply this standard’s provisions as a cumulative-effect adjustment to retained earnings as of the beginning of the first reporting period in which the guidance is effective. The new standard is effective for interim and annual reporting periods beginning after December 15, 2019. The Company will adopt the guidance effective January 1, 2020, and expects that the guidance will not have a material impact on the Company’s consolidated financial statements.
F-11
RIGNET, INC.
NOTES TO THE CONSOLIDATED FINANCIAL STATEMENTS – (CONTINUED)
In June 2018, the FASB issued Accounting Standards Update No. 2018-07 (ASU 2018-07), which expands the scope of Topic 718 to include share-based payment transactions for acquiring goods and services from nonemployees. The ASU is effective for annual and interim reporting periods beginning after December 15, 2018. The adoption of this ASU did not have any material impact on the Company’s consolidated financial statements.
In August 2018, the FASB issued ASU No. 2018-13 (ASU 2018-13), which eliminates disclosures, modifies existing disclosures and adds new Fair Value disclosure requirements to Topic 820 for the range and weighted average of significant unobservable inputs used to develop Level 3 fair value measurements. The ASU is effective for annual and interim reporting periods beginning after December 15, 2019. The Company is evaluating the potential impact of this guidance on its consolidated financial statements and will adopt the guidance effective January 1, 2020.
In August 2018, the FASB issued ASU No. 2018-15 (ASU 2018-15), which provides guidance on implementation costs incurred in a cloud computing arrangement that is a service contract. The ASU is effective for annual and interim reporting periods beginning after December 15, 2019. The Company is evaluating the potential impact of this guidance on its consolidated financial statements and will adopt the guidance effective January 1, 2020.
Note 2—Business and Credit Concentrations
The Company is exposed to various business and credit risks including interest rate, foreign currency, credit and liquidity risks.
Interest Rate Risk
The Company has significant interest-bearing liabilities at variable interest rates which generally price monthly. The Company’s variable borrowing rates are tied to LIBOR resulting in interest rate risk (see Note 6— “Long-Term Debt”). The Company presently does not use financial instruments to hedge interest rate risk, but evaluates this on a regular basis and may utilize financial instruments in the future if deemed necessary.
Foreign Currency Risk
The Company has exposure to foreign currency risk, as a portion of the Company’s activities are conducted in currencies other than U.S. dollars. Currently, the Norwegian Kroner, the British Pound Sterling and the Brazilian Real are the currencies that could materially impact the Company’s financial position and results of operations. The Company presently does not hedge these risks, but evaluates financial risk on a regular basis and may utilize financial instruments in the future if deemed necessary. Foreign currency translations are reported as accumulated other comprehensive income (loss) in the Company’s consolidated financial statements.
Credit and Customer Concentration Risk
Credit risk, with respect to accounts receivable, is due to the limited number of customers concentrated in the oil and gas, maritime, pipeline, engineering and construction industries. The Company mitigates the risk of financial loss from defaults through defined collection terms in each contract or service agreement and periodic evaluations of the collectability of accounts receivable. The Company provides an allowance for doubtful accounts which is adjusted when the Company becomes aware of a specific customer’s inability to meet its financial obligations or as a result of changes in the overall aging of accounts receivable.
|
|
|
Year Ended December 31, |
|
|||||||||
|
|
2019 |
|
|
2018 |
|
|
2017 |
|
||||
|
|
|
(in thousands) |
|
|||||||||
|
Accounts receivable |
|
$ |
71,165 |
|
|
$ |
71,649 |
|
|
$ |
51,996 |
|
|
Allowance for doubtful accounts, January 1, |
|
|
(4,199 |
) |
|
|
(2,975 |
) |
|
|
(4,324 |
) |
|
Current year provision for doubtful accounts |
|
|
(1,786 |
) |
|
|
(2,660 |
) |
|
|
(366 |
) |
|
Write-offs |
|
|
1,879 |
|
|
|
1,436 |
|
|
|
1,715 |
|
|
Allowance for doubtful accounts, December 31, |
|
|
(4,106 |
) |
|
|
(4,199 |
) |
|
|
(2,975 |
) |
|
Accounts receivable, net |
|
$ |
67,059 |
|
|
$ |
67,450 |
|
|
$ |
49,021 |
|
Although during 2019, 2018 and 2017 no single customer comprised greater than 10% of revenue, the top 5 customers generated 25.9%, 23.0% and 26.8% of the Company’s 2019, 2018 and 2017 revenue, respectively.
F-12
RIGNET, INC.
NOTES TO THE CONSOLIDATED FINANCIAL STATEMENTS – (CONTINUED)
The Company maintains cash and cash equivalent balances with major financial institutions which, at times, exceed federally insured limits. The Company monitors the financial condition of the financial institutions and has not experienced losses associated with these accounts during 2019, 2018 or 2017. Liquidity risk is managed by continuously monitoring forecasted and actual cash flows and by matching the maturity profiles of financial assets and liabilities (see Note 6— “Long-Term Debt”).
Note 3—Business Combinations
Auto-Comm and SAFCON
On April 18, 2018, RigNet completed the separate acquisitions of Automation Communications Engineering Corp. (Auto-Comm) and Safety Controls, Inc. (SAFCON) for an aggregate purchase price of $6.7 million. Of this aggregate purchase price RigNet paid $2.2 million in cash and $4.1 million in stock in April 2018. In September 2018, the Company paid $0.3 million in cash for a working capital adjustment.
Auto-Comm provides a broad range of communications services, for both onshore and offshore remote locations, to the oil and gas industry. Auto-Comm brings over 30 years of systems integration experience in engineering and design, installation, testing, and maintenance. SAFCON offers a diverse set of safety, security, and maintenance services to the oil and gas industry. Auto-Comm and SAFCON have developed strong relationships with major energy companies that complement the relationships that RigNet has established over the years. Auto-Comm and SAFCON are based in Louisiana.
The assets and liabilities of Auto-Comm and SAFCON have been recorded at their estimated fair values at the date of acquisition. The excess of the purchase price over the estimated fair values of the underlying net tangible and identifiable intangible assets and liabilities has been recorded as goodwill.
The goodwill of $1.4 million arising from the acquisitions consists largely of growth prospects, synergies and other benefits that the Company believes will result from combining the operations of the Company, Auto-Comm and SAFCON, as well as other intangible assets that do not qualify for separate recognition, such as assembled workforce in place at the date of acquisition. The goodwill recognized is expected to be nondeductible for income tax purposes. The acquisitions of Auto-Comm and SAFCON, including goodwill, are included in the Company’s consolidated financial statements as of the acquisition date and are primarily reflected in the Systems Integration segment.
|
|
Weighted Average Estimated Useful Life (Years) |
|
Fair Market Values |
|
||||||
|
|
|
|
|
(in thousands) |
|
|||||
|
Current assets |
|
|
|
|
|
|
|
$ |
4,947 |
|
|
Property and equipment |
|
|
|
|
|
|
|
|
132 |
|
|
Trade name |
|
7 |
|
$ |
540 |
|
|
|
|
|
|
Customer relationships |
|
7 |
|
|
980 |
|
|
|
|
|
|
Total identifiable intangible assets |
|
|
|
|
|
|
|
|
1,520 |
|
|
Goodwill |
|
|
|
|
|
|
|
|
1,387 |
|
|
Current liabilities |
|
|
|
|
|
|
|
|
(1,006 |
) |
|
Deferred tax liability |
|
|
|
|
|
|
|
|
(319 |
) |
|
Total purchase price |
|
|
|
|
|
|
|
$ |
6,661 |
|
Intelie
On March 23, 2018, RigNet completed its acquisition of Intelie™ Soluções Em Informática S.A (Intelie), for an estimated aggregate purchase price of $18.1 million. Of this aggregate purchase price, RigNet paid R$10.6 million (BRL) (or approximately $3.2 million) in cash, $7.3 million in stock and expects to pay $7.6 million worth of RigNet stock as contingent consideration earn-out, estimated as of the date of acquisition. The initial estimate of the earn-out payable was preliminary and remains subject to change based on the achievement of certain post-closing performance targets under the acquisition agreement. The maximum earn-out is $17.0 million payable in stock. Intelie is a real-time, predictive analytics company that combines an operational understanding with a machine learning approach.
F-13
RIGNET, INC.
NOTES TO THE CONSOLIDATED FINANCIAL STATEMENTS – (CONTINUED)
Intelie facilitates innovation via Intelie Pipes™, a distributed query language with a complex event processor to aggregate and normalize real-time data from a myriad of data sources. This technology enables the Intelie LIVE® platform to solve data integration, data quality, data governance and monitoring problems. Intelie LIVE is an operational intelligence platform that empowers clients to make timely, data-driven decisions in mission-critical real-time operations, including drilling, and longer-term, data-intensive projects, such as well planning. Intelie Live has broad applicability across many industry verticals. Intelie is based in Brazil.
The assets and liabilities of Intelie have been recorded at their estimated fair values at the date of acquisition. The excess of the purchase price over the estimated fair values of the underlying net tangible and identifiable intangible assets and liabilities has been recorded as goodwill.
The earn-out for Intelie is measured at fair value in each reporting period, based on level 3 inputs, with any change to fair value recorded in the Consolidated Statements of Comprehensive Loss. As of December 31, 2019, the fair value of the earn-out was $9.7 million with $4.4 million in deferred revenue and other current liabilities and $5.3 million in other long-term liabilities. During the year ended December 31, 2019, RigNet recognized $2.9 million of increase in fair value, paid $3.0 million in RigNet stock for the first annual tranche of the Intelie earn-out and accreted interest expense on the Intelie earn-out of $0.2 million with corresponding changes to other liabilities. During the year ended December 31, 2018, RigNet recognized $1.8 million of increase in the fair value and accreted interest expense of $0.1 million on the Intelie earn-out with corresponding increases to other liabilities. The earn-out is payable in RigNet stock in portions on the first, second and third anniversary of the closing of the acquisition based on certain post-closing performance targets under the acquisition agreement.
The goodwill of $10.7 million arising from the acquisition consists largely of growth prospects, synergies and other benefits that the Company believes will result from combining the operations of the Company and Intelie, as well as other intangible assets that do not qualify for separate recognition, such as assembled workforce in place at the date of acquisition. None of the goodwill recognized is expected to be deductible for income tax purposes. The acquisition of Intelie, including goodwill, is included in the Company’s consolidated financial statements as of the acquisition date and is reflected in the Apps & IoT segment.
|
|
Weighted Average Estimated Useful Life (Years) |
|
Fair Market Values |
|
|
||||||
|
|
|
|
|
(in thousands) |
|
|
|||||
|
Current assets |
|
|
|
|
|
|
|
$ |
589 |
|
|
|
Property and equipment |
|
|
|
|
|
|
|
|
73 |
|
|
|
Trade name |
|
7 |
|
$ |
2,300 |
|
|
|
|
|
|
|
Technology |
|
7 |
|
|
8,400 |
|
|
|
|
|
|
|
Customer relationships |
|
7 |
|
|
320 |
|
|
|
|
|
|
|
Total identifiable intangible assets |
|
|
|
|
|
|
|
|
11,020 |
|
|
|
Goodwill |
|
|
|
|
|
|
|
|
10,744 |
|
|
|
Current liabilities |
|
|
|
|
|
|
|
|
(460 |
) |
|
|
Deferred tax liability |
|
|
|
|
|
|
|
|
(3,825 |
) |
|
|
Total purchase price |
|
|
|
|
|
|
|
$ |
18,141 |
|
(a) |
|
(a) |
Includes $7.6 million in contingent consideration earn-out estimated as of the date of acquisition. |
Actual and Pro Forma Impact of the 2018 Acquisitions
The 2018 acquisitions of Auto-Comm, SAFCON and Intelie contributed revenue and net income of $17.7 million and $2.2 million, respectively, for the year ended December 31, 2018.
F-14
RIGNET, INC.
NOTES TO THE CONSOLIDATED FINANCIAL STATEMENTS – (CONTINUED)
The following table represents supplemental pro forma information as if the 2018 acquisitions had occurred on January 1, 2017.
|
|
Year Ended December 31, |
|
|
Year Ended December 31, |
|
|||
|
|
|
2018 |
|
|
2017 |
|
||
|
|
|
(in thousands, except per share amounts) |
|
|||||
|
Revenue |
|
$ |
243,311 |
|
|
$ |
222,404 |
|
|
Expenses* |
|
|
305,096 |
|
|
|
238,045 |
|
|
Net loss |
|
$ |
(61,785 |
) |
|
$ |
(15,641 |
) |
|
Net loss attributable to RigNet, Inc. common stockholders |
|
$ |
(61,924 |
) |
|
$ |
(15,620 |
) |
|
Net loss per share attributable to RigNet, Inc. common stockholders: |
|
|
|
|
|
|
|
|
|
Basic |
|
$ |
(3.31 |
) |
|
$ |
(0.87 |
) |
|
Diluted |
|
$ |
(3.31 |
) |
|
$ |
(0.87 |
) |
* Note - The Year Ended December 31, 2018 includes a net $50.6 million expense accrual for the GX dispute reported in general and administrative expense. See a more complete discussion of the GX Dispute in Note 9 of the Notes to Consolidated Financial Statements and in Item 3, Legal Proceedings of this Annual Report on Form 10-K.
The Company incurred acquisition-related costs of $0.5 million and $2.3 million in the year ended December 31, 2019 and 2018, respectively, reported in general and administrative expenses.
Note 4—Goodwill and Intangibles
Goodwill
Goodwill resulted from prior acquisitions as the consideration paid for the acquired businesses exceeded the fair value of acquired identifiable net tangible and intangible assets. The goodwill primarily relates to the growth prospects foreseen for the companies acquired, synergies between existing business and the acquired companies and the assembled workforce of the acquired companies. Goodwill balances and changes therein, by reportable segment, as of and for the years ended December 31, 2019 and 2018 are presented below.
|
|
Managed Communication Services |
|
|
Applications and Internet- of-Things |
|
|
Systems Integration |
|
|
Total |
|
|||||
|
|
|
(in thousands) |
|
|||||||||||||
|
Balance, January 1, 2018 |
|
$ |
23,365 |
|
|
$ |
13,723 |
|
|
$ |
- |
|
|
$ |
37,088 |
|
|
Acquisition of Intelie, Auto-Comm and SAFCON |
|
|
- |
|
|
|
10,744 |
|
|
|
1,387 |
|
|
|
12,131 |
|
|
Foreign currency translation |
|
|
(886 |
) |
|
|
(1,702 |
) |
|
|
- |
|
|
|
(2,588 |
) |
|
Balance, December 31, 2018 |
|
|
22,479 |
|
|
|
22,765 |
|
|
|
1,387 |
|
|
|
46,631 |
|
|
Foreign currency translation |
|
|
472 |
|
|
|
(311 |
) |
|
|
- |
|
|
|
161 |
|
|
Balance, December 31, 2019 |
|
$ |
22,951 |
|
|
$ |
22,454 |
|
|
$ |
1,387 |
|
|
$ |
46,792 |
|
F-15
RIGNET, INC.
NOTES TO THE CONSOLIDATED FINANCIAL STATEMENTS – (CONTINUED)
Intangibles consist of customer relationships, brand name, backlog, developed technology, covenants not to compete and licenses acquired as part of the Company’s acquisitions. Intangibles also include internal-use software. The following table reflects intangibles activities for the years ended December 31, 2019 and 2018:
|
|
|
Brand Name |
|
|
Backlog |
|
|
Customer Relation- ships |
|
|
Software |
|
|
Licenses |
|
|
Developed Technology |
|
|
Covenant Not to Compete |
|
|
Customer Contracts |
|
|
Total |
|
|||||||||
|
|
|
(in thousands, except estimated lives) |
|
|||||||||||||||||||||||||||||||||
|
Intangibles Acquired |
|
|
5,943 |
|
|
|
3,282 |
|
|
|
32,437 |
|
|
|
13,694 |
|
|
|
2,500 |
|
|
|
5,903 |
|
|
|
3,040 |
|
|
|
- |
|
|
|
66,799 |
|
|
Accumulated amortization and foreign currency translation, January 1, 2018 |
|
|
(3,698 |
) |
|
|
(3,265 |
) |
|
|
(18,936 |
) |
|
|
(8,071 |
) |
|
|
(1,620 |
) |
|
|
(551 |
) |
|
|
(253 |
) |
|
|
- |
|
|
|
(36,394 |
) |
|
Balance, January 1, 2018 |
|
|
2,245 |
|
|
|
17 |
|
|
|
13,501 |
|
|
|
5,623 |
|
|
|
880 |
|
|
|
5,352 |
|
|
|
2,787 |
|
|
|
- |
|
|
|
30,405 |
|
|
Additions |
|
|
2,840 |
|
|
|
- |
|
|
|
1,300 |
|
|
|
236 |
|
|
|
1,251 |
|
|
|
8,948 |
|
|
|
- |
|
|
|
191 |
|
|
|
14,766 |
|
|
Amortization expense |
|
|
(1,036 |
) |
|
|
(17 |
) |
|
|
(3,349 |
) |
|
|
(2,480 |
) |
|
|
(308 |
) |
|
|
(1,787 |
) |
|
|
(608 |
) |
|
|
(191 |
) |
|
|
(9,776 |
) |
|
Foreign currency translation |
|
|
(366 |
) |
|
|
|
|
|
|
(156 |
) |
|
|
66 |
|
|
|
- |
|
|
|
(1,206 |
) |
|
|
- |
|
|
|
- |
|
|
|
(1,662 |
) |
|
Balance, December 31, 2018 |
|
|
3,683 |
|
|
|
- |
|
|
|
11,296 |
|
|
|
3,445 |
|
|
|
1,823 |
|
|
|
11,307 |
|
|
|
2,179 |
|
|
|
- |
|
|
|
33,733 |
|
|
Additions |
|
|
- |
|
|
|
- |
|
|
|
- |
|
|
|
717 |
|
|
|
- |
|
|
|
5,021 |
|
|
|
- |
|
|
|
- |
|
|
|
5,738 |
|
|
Amortization expense |
|
|
(838 |
) |
|
|
- |
|
|
|
(2,623 |
) |
|
|
(2,447 |
) |
|
|
(285 |
) |
|
|
(2,175 |
) |
|
|
(608 |
) |
|
|
- |
|
|
|
(8,976 |
) |
|
Foreign currency translation |
|
|
(51 |
) |
|
|
- |
|
|
|
(44 |
) |
|
|
45 |
|
|
|
(64 |
) |
|
|
(236 |
) |
|
|
- |
|
|
|
- |
|
|
|
(350 |
) |
|
Balance, December 31, 2019 |
|
$ |
2,794 |
|
|
$ |
- |
|
|
$ |
8,629 |
|
|
$ |
1,760 |
|
|
$ |
1,474 |
|
|
$ |
13,917 |
|
|
$ |
1,571 |
|
|
$ |
- |
|
|
$ |
30,145 |
|
|
Weighted average estimated lives (years) |
|
7.0 |
|
|
- |
|
|
7.0 |
|
|
5.0 |
|
|
|
15.3 |
|
|
5.0 |
|
|
7.0 |
|
|
- |
|
|
|
|
|
|||||||
The following table sets forth amortization expense for intangible assets existing at December 31, 2019 over the next five years (in thousands):
Note 5—Property, Plant and Equipment
Property, plant and equipment consists of the following:
|
|
Estimated |
|
December 31, |
|
||||||
|
|
|
Lives |
|
2019 |
|
|
2018 |
|
||
|
|
|
(in years) |
|
(in thousands) |
|
|||||
|
Telecommunication and computer equipment |
|
1 - 5 |
|
$ |
189,209 |
|
|
$ |
176,518 |
|
|
Furniture and other |
|
5 - 7 |
|
|
13,684 |
|
|
|
10,415 |
|
|
Building |
|
10 - 40 |
|
|
6,225 |
|
|
|
4,419 |
|
|
Land |
|
- |
|
|
1,321 |
|
|
|
1,378 |
|
|
|
|
|
|
|
210,439 |
|
|
|
192,730 |
|
|
Less: Accumulated depreciation |
|
|
|
|
(150,321 |
) |
|
|
(129,145 |
) |
|
|
|
|
|
$ |
60,118 |
|
|
$ |
63,585 |
|
Depreciation expense associated with property, plant and equipment was $22.2 million, $23.4 million and $24.1 million for the years ended December 31, 2019, 2018 and 2017, respectively. No impairment to property, plant and equipment was recorded in the years ended December 31, 2019, 2018 or 2017.
F-16
RIGNET, INC.
NOTES TO THE CONSOLIDATED FINANCIAL STATEMENTS – (CONTINUED)
As of December 31, 2019 and 2018, the following credit facilities and long-term debt arrangements with financial institutions were in place:
|
|
|
December 31, |
|
|||||
|
|
2019 |
|
|
2018 |
|
|||
|
|
|
(in thousands) |
|
|||||
|
Term loan |
|
$ |
5,000 |
|
|
$ |
10,000 |
|
|
Term-Out Loan |
|
|
25,500 |
|
|
|
- |
|
|
Revolving credit facility (RCF) |
|
|
77,150 |
|
|
|
67,150 |
|
|
Unamortized deferred financing costs |
|
|
(466 |
) |
|
|
(315 |
) |
|
Finance lease |
|
|
543 |
|
|
|
192 |
|
|
|
|
|
107,727 |
|
|
|
77,027 |
|
|
Less: Current maturities of long-term debt |
|
|
(10,627 |
) |
|
|
(4,831 |
) |
|
Current maturities of finance lease |
|
|
(166 |
) |
|
|
(111 |
) |
|
|
|
$ |
96,934 |
|
|
$ |
72,085 |
|
Amendment to the Credit Agreement
The Company and certain of its subsidiaries are party to the Third Amendment to the Third Amended and Restated Credit Agreement (Amended Credit Agreement), dated as of February 21, 2020, with the same four financial institutions that are part of the current credit agreement. The Amended Credit Agreement provides for a $16.0 million term loan (Term Loan), a $100.0 million revolving credit facility (RCF) and a $30.0 million accordion feature. The Term Loan matures on March 31, 2022 with principal installments of $2.0 million due quarterly beginning June 30, 2020. The RCF and accordion, if exercised, mature on August 31, 2022.
The Amended Credit Agreement contains certain covenants and restrictions including maintaining a consolidated leverage ratio, as defined in the Credit Agreement, of less than or equal to 3.25 to 1.00 through the third quarter of 2020. The consolidated leverage ratio then steps down to 3.00 to 1.00 through the second quarter of 2021 and then steps down to 2.75 to 1.00 for all remaining quarters. The Amended Credit Agreement requires a consolidated fixed charge coverage ratio of not less than 1.25 to 1.00.
The Amended Credit Agreement bears interest at a rate of LIBOR plus a margin ranging from 1.75% to 3.25% based on a consolidated leverage ratio defined in the Amended Credit Agreement. Interest on the Amended Credit Agreement is payable monthly.
As of February 21, 2020, the outstanding principal amount of the Term Loan was $16.0 million, and the outstanding draws on the RCF were $95.4 million.
Credit Agreement
As of December 31, 2019, prior to signing the Amended Credit Agreement, the Company and certain of its subsidiaries were party to a third amended and restated credit agreement, dated as of November 6, 2017, with four participating financial institutions (as amended from time to time, the Credit Agreement), which provided for a $15.0 million term loan (Term Loan), a $30.0 million term-out facility (Term-Out Loan) and an $85.0 million revolving credit facility (RCF). The RCF and Term-Out Loan were set to mature on April 6, 2021. The Term Loan was set to mature on December 31, 2020.
On February 13, 2019, the Company entered into the first amendment to the Credit Agreement to refinance $30.0 million of outstanding draws under the existing $85.0 million RCF with the new $30.0 million Term-Out Loan.
The Credit Agreement required a $45.0 million reserve (Specified Reserve) under the RCF that was released and made available for borrowing for payment of the GX Dispute settlement. The RCF contains a sub-limit of up to $25.0 million for commercial and stand-by letters of credit and performance bonds issued by the parties under the Credit Agreement. The facilities under the Credit Agreement are secured by substantially all the assets of the Company.
F-17
RIGNET, INC.
NOTES TO THE CONSOLIDATED FINANCIAL STATEMENTS – (CONTINUED)
Under the Credit Agreement, the Term Loan, Term-Out Loan and the RCF bear interest at a rate of LIBOR plus a margin ranging from 1.75% to 3.00% based on a consolidated leverage ratio defined in the Credit Agreement. Interest on the Term Loan, Term-Out Loan and RCF is payable monthly. Principal installments of $1.25 million and $1.5 million under the Term Loan and Term-Out Loan, respectively, are due quarterly. The weighted average interest rate for the year ended December 31, 2019 and 2018 were 5.2% and 4.8%, respectively, with an interest rate of 4.8% at December 31, 2019.
Term Loan
As of December 31, 2019, the Term Loan had an outstanding principal balance of $5.0 million, excluding the impact of unamortized deferred financing costs.
Term-Out Loan
As of December 31, 2019, the Term-Out Loan had an outstanding principal balance of $25.5 million.
RCF
As of December 31, 2019, $77.2 million in draws remain outstanding under the RCF.
Covenants and Restrictions
The Company’s Credit Agreement contains certain covenants and restrictions, including restricting the payment of cash dividends under default, and maintaining certain financial covenants such as a consolidated fixed charge coverage ratio of not less than 1.25 to 1.00. Additionally, the Credit Agreement requires a consolidated leverage ratio, as defined in the Credit Agreement, of less than or equal to 2.75 to 1.00. The consolidated leverage ratio increased to 3.25 to 1.00 for the four quarters starting in the 2nd quarter of 2019. The consolidated leverage ratio then decreases to 3.00 to 1.00 for three quarters, and then decreases to 2.75 to 1.00 for all remaining quarters. If any default occurs related to these covenants that is not cured or waived, the unpaid principal and any accrued interest can be declared immediately due and payable.
In April 2019, the Company determined that in periods beginning at least as early as March 31, 2014, it had incurred and not appropriately included certain surety bonds or other similar instruments in its consolidated leverage ratio calculation as defined by the Credit Agreement. As a result, on May 6, 2019, the Company entered into a Consent and Waiver (Consent) to the Credit Agreement with the financial institutions party thereto under which the Company is permitted to exclude certain incurred surety bonds and other similar instruments from the calculation of Consolidated Funded Indebtedness (as defined in the credit agreement). In addition, the Consent waived all specified violations for all prior periods.
On June 7, 2019, the Company entered into a second amendment to the Credit Agreement (Second Amendment), which (i) permits the Company to exclude up to $5.0 million in legal and related costs for the GX Dispute (see Note 11 – Commitments and Contingencies) from the calculation of Consolidated EBITDA (as defined under the Credit Agreement), (ii) permits the Company to exclude from the calculation of Consolidated Funded Indebtedness up to $30.0 million of undrawn surety bonds and (iii) revises the threshold of proceeds from asset dispositions above which the Company must prepay on the Term Out Loan to $5.0 million. Consolidated EBITDA and Consolidated Funded Indebtedness are non-GAAP metrics defined in the Credit Agreement.
We believe we have accurately calculated and reported our required debt covenant calculations for the December 31, 2019 reporting period and are in compliance with the required covenant ratios.
Performance Bonds and Letters of Credit
As of December 31, 2019, there were $6.4 million of performance bonds, surety bonds and similar instruments outstanding of which $1.8 million is issued by the parties under the Credit Agreement. As of December 31, 2019, there were no outstanding standby letters of credit and bank guarantees.
As of December 31, 2018, there were no outstanding standby letters of credit and there were $30.5 million of performance bonds outstanding of which $1.7 million is issued by the parties under the Credit Agreement.
F-18
RIGNET, INC.
NOTES TO THE CONSOLIDATED FINANCIAL STATEMENTS – (CONTINUED)
In June 2016, the Company secured a performance bond facility with a lender in the amount of $1.5 million for its MCS segment. This facility has a maturity date of June 2021. The Company maintains restricted cash on a dollar for dollar basis to secure this facility.
Deferred Financing Costs
The Company incurred bank fees associated with the Credit Agreement, and certain amendments hereto, which were capitalized and reported as a reduction to long-term debt. Deferred financing costs are expensed using the effective interest method over the life of the agreement. For the years ended December 31, 2019 and 2018, deferred financing cost amortization of $0.4 million and $0.2 million, respectively, is included in interest expense in the Company’s consolidated financial statements.
Debt Maturities
The following table sets forth the aggregate principal maturities of long-term debt, net of deferred financing cost amortization as of December 31, 2019 (in thousands):
Furthermore, the Company had $2.8 million of non-cash vendor financed capital expenditures, which in the first quarter of 2020 has become a debt obligation. As of December 31, 2019, the vendor financed capital expenditures consisted of $0.7 million in accounts payable and $2.1 million in other long-term liabilities, as the financing agreement with the vendor was signed in the first quarter of 2020.
Note 7—Related Party Transactions
The Company has a reseller arrangement with Darktrace, which is an artificial intelligence company in cybersecurity that is partially owned by Kohlberg Kravis Roberts & Co. L.P. (KKR). KKR is a significant stockholder of the Company. Under the arrangement, the Company will sell Darktrace’s cybersecurity audit services with the Company’s cybersecurity offerings. In the years ended December 31, 2019 and 2018, the Company purchased $0.1million and $0.1 million, respectively from Darktrace in the ordinary course of business.
Vissim AS is now a vendor following a competitive request for quote from RigNet in the ordinary course of business. A customer specified Vissim AS by name as a provider for an SI project. Vissim AS is 24% owned by AVANT Venture Capital AS. AVANT Venture Capital is owned by and has as its chairman of its board one of our board members. In the years ended December 31, 2019 and 2018, the Company purchased $0.8 million and none, respectively from Vissim AS in the ordinary course of business.
Note 8—Fair Value Measurements
The Company uses the following methods and assumptions to estimate the fair value of financial instruments:
|
|
• |
Cash and Cash Equivalents — Reported amounts approximate fair value based on quoted market prices (Level 1). |
|
|
• |
Restricted Cash — Reported amounts approximate fair value. |
|
|
• |
Accounts Receivable — Reported amounts, net of the allowance for doubtful accounts, approximate fair value due to the short-term nature of these assets. |
|
|
• |
Accounts Payable, Including Income Taxes Payable and Accrued Expenses — Reported amounts approximate fair value due to the short-term nature of these liabilities. |
|
|
• |
Long-Term Debt — The carrying amount of the Company’s floating-rate debt approximates fair value since the interest rates paid are based on short-term maturities and recent quoted rates from financial institutions. The estimated fair value of debt was calculated based upon observable (Level 2) inputs regarding interest rates available to the Company at the end of each respective period. |
F-19
RIGNET, INC.
NOTES TO THE CONSOLIDATED FINANCIAL STATEMENTS – (CONTINUED)
Fair value is the price that would be received to sell an asset or paid to transfer a liability in an orderly transaction between market participants at the measurement date. For items that are not actively traded, fair value reflects the price in a transaction with a market participant, including an adjustment for risk, not just the mark-to-market value. The fair value measurement standard establishes a fair value hierarchy that prioritizes the inputs to valuation techniques used to measure fair value. As presented in the table below, the hierarchy consists of three broad levels:
Level 1—Inputs are unadjusted quoted prices in active markets for identical assets and liabilities and have the highest priority.
Level 2—Inputs are observable inputs other than quoted prices considered Level 1. Level 2 inputs are market-based and are directly or indirectly observable, including quoted prices for similar instruments in active markets; quoted prices for identical or similar instruments in markets that are not active; or valuation techniques whose inputs are observable. Where observable inputs are available, directly or indirectly, for substantially the full term of the asset or liability, the instrument is categorized in Level 2.
Level 3—Inputs are unobservable (meaning they reflect the Company’s assumptions regarding how market participants would price the asset or liability based on the best available information) and therefore have the lowest priority.
A financial instrument’s level within the fair value hierarchy is based on the lowest level of any input that is significant to the fair value measurement. RigNet believes it uses appropriate valuation techniques, such as market-based valuation, based on the available inputs to measure the fair values of its assets and liabilities. The Company’s valuation technique maximizes the use of observable inputs and minimizes the use of unobservable inputs.
The Company had no derivatives as of December 31, 2019 or 2018.
The Company’s non-financial assets, such as goodwill, intangibles and property, plant and equipment, are measured at fair value, based on level 3 inputs, when there is an indicator of impairment and recorded at fair value only when an impairment charge is recognized.
The earn-out for Intelie is measured at fair value in each reporting period, based on level 3 inputs, with any change to fair value recorded in the Consolidated Statements of Comprehensive Loss. As of December 31, 2019, the fair value of the earn-out was $9.7 million with $4.4 million in deferred revenue and other current liabilities and $5.3 million in other long-term liabilities. During the year ended December 31, 2019, RigNet recognized $2.9 million of increase in fair value, paid $3.0 million in RigNet stock for the first annual tranche of the Intelie earn-out and accreted interest expense on the Intelie earn-out of $0.2 million with corresponding increases to other liabilities. As of December 31, 2018, the fair value of the earn-out was $9.5 million, of which $3.0 million is in other current liabilities and $6.5 million is in other long-term liabilities. During the year ended December 31, 2018, RigNet recognized $1.8 million of increase in the fair value and accreted interest expense of $0.1 million on the Intelie earn-out with corresponding increases to other liabilities. The earn-out is payable in RigNet stock in portions on the first, second and third anniversary of the closing of the acquisition based on certain post-closing performance targets under the acquisition agreement.
The contingent consideration for Cyphre, a cybersecurity company acquired in May 2017, is measured at fair value in each reporting period, based on level 3 inputs, with any change to fair value recorded in the Consolidated Statements of Comprehensive Loss. As of December 31, 2019, the fair value of the contingent consideration was $3.1 million, of which $0.3 million is in other current liabilities and $2.7 million is in other long-term liabilities. During the year ended December 31, 2019, RigNet recognized a $0.4 million decrease in fair value of contingent consideration, paid $0.3 million in required royalty payments and accreted interest expense of $0.1 million on the Cyphre contingent consideration with corresponding changes to other liabilities. As of December 31, 2018, the fair value of the contingent consideration was $3.7 million, of which $0.3 million is in other current liabilities and $3.4 million is in other long-term liabilities. During the year ended December 31, 2018, RigNet recognized a $0.3 million reduction in fair value and accreted interest expense of $0.1 million on the Cyphre contingent consideration with corresponding changes to other liabilities.
The earn-out for Orgtec S.A.P.I. de C.V., d.b.a. TECNOR (TECNOR), acquired in March 2016, was measured at fair value in each reporting period, based on level 3 inputs, with any change to fair value recorded in the Consolidated Statements of Comprehensive Loss. The fair value of the earn-out of $8.0 million was paid in July 2018. The $2.1 million change in fair value in the year ended December 31, 2018 was primarily related to the second quarter 2018 negotiations with the sellers of TECNOR on the amount of the earn-out. There was a $0.3 million and $1.3 million
F-20
RIGNET, INC.
NOTES TO THE CONSOLIDATED FINANCIAL STATEMENTS – (CONTINUED)
reduction in fair value to the TECNOR earn-out in the years ended December 31, 2017 and 2016, respectively, recorded as a reduction of other current liabilities and a decrease to expense in the Corporate segment.
Note 9—Commitments and Contingencies
Global Xpress (GX) Dispute
Inmarsat plc (Inmarsat), a satellite telecommunications company, filed arbitration with the International Centre for Dispute Resolution tribunal (the panel) in October 2016 concerning a January 2014 take-or-pay agreement to purchase up to $65.0 million, under certain conditions, of GX capacity from Inmarsat over several years.
In June 2019, the Company announced that it reached a settlement with Inmarsat plc that concludes the GX Dispute. Pursuant to the settlement the Company paid $45.0 million in June 2019 and paid $5.0 million in July 2019 and will pay $0.8 million in the third quarter of 2020. The Company had an accrued liability of $0.8 million as of December 31, 2019.
The Company incurred cost of $3.9 million in GX Dispute Phase II legal costs for the year ended December 31, 2019. The Company incurred legal expenses of $2.2 million in connection with the GX Dispute for the year ended December 31, 2018.
Other Litigation
The Company, in the ordinary course of business, is a claimant or a defendant in various legal proceedings, including proceedings as to which the Company has no insurance coverage and those that may involve the filing of liens against the Company or its assets.
Sales Tax Audit
The Company is undergoing a routine sales tax audit from a state where the Company has operations. The audit can cover up to a four-year period. The Company is in the early stages of the audit, and does not have any estimates of further exposure, if any, for the tax years under review.
Operating Leases
The Company adopted the new lease accounting standard effective with the first quarter of 2019 and has used the optional transition method permitted under ASU 2018-11. Accordingly, prior year amounts have not been adjusted and continue to be reflected in accordance with the Company’s historical accounting.
The Company’s leasing activities primarily consist of leases of real-estate including office space under lease agreements expiring on various dates through 2025. For the year ended December 31, 2019, 2018 and 2017, the Company recognized expense under operating leases, which approximates cash paid and includes short-term leases, of $2.5 million, $2.8 million and $4.0 million, respectively.
As of December 31, 2019, future undiscounted minimum lease obligation maturities were as follows (in thousands):
|
|
|
2,053 |
|
|
|
2021 |
|
|
1,358 |
|
|
2022 |
|
|
1,207 |
|
|
2023 |
|
|
1,176 |
|
|
2024 |
|
|
1,198 |
|
|
Thereafter |
|
|
3,020 |
|
|
Total lease payments |
|
$ |
10,012 |
|
|
Less present value discount |
|
|
(1,599 |
) |
|
Amounts recognized in Balance Sheet |
|
$ |
8,413 |
|
|
Amounts recognized in Balance Sheet |
|
|
|
|
|
Deferred revenue and other current liabilities |
|
|
2,084 |
|
|
Right-of-use lease liability - long-term portion |
|
|
6,329 |
|
|
Total right-to-use lease liability |
|
$ |
8,413 |
|
F-21
RIGNET, INC.
NOTES TO THE CONSOLIDATED FINANCIAL STATEMENTS – (CONTINUED)
Operating lease right-of-use assets for leases were $6.8 million as of December 31, 2019.
The right-of-use assets and liabilities for leases were discounted at a weighted-average discount rate of 5.1%. The weighted-average remaining lease term as of December 31, 2019 was 7.1 years.
In December 2019, we completed the sale transaction of certain towers. The Company received $4.9 million in proceeds from the sale, resulting in a gain of $4.9 million which is recognized in gain on the sales of property plant and equipment. We leaseback certain communications license agreements that allows us to operate radio communications equipment on a portion of these towers. The initial term on the lease is ten years, and is recognized as an operating lease.
As of December 31, 2018, future undiscounted minimum lease obligation maturities were as follows (in thousands):
Commercial Commitments
The Company enters into contracts for satellite bandwidth and other network services with certain providers.
As of December 31, 2019, the Company had the following commercial commitments related to satellite and network services (in thousands):
Note 10—Stock-Based Compensation
The Company has three stock-based compensation plans as described below.
In May 2019, the Board of Directors adopted the 2019 Omnibus Incentive Plan (2019 Plan). Under the 2019 Plan, the Board of Directors or its designated committee is authorized to issue awards representing a total of 2,175,000 shares of common stock to certain directors, officers and employees of the Company, less any amounts of common stock awarded under the 2010 plan. Awards may be in the form of new stock incentive awards or options including (i) incentive or non-qualified stock options, (ii) stock appreciation rights, (iii) restricted stock, (iv) restricted stock units (RSUs), (v) performance stock, (vi) performance share units (PSUs), (vii) director awards, (viii) annual cash incentive awards, (ix) cash-based awards, (x) substitution awards or (xi) other stock-based awards, as approved by the Board of Directors or its designated committee. Options granted under the 2019 Plan will generally expire at the earlier of a specified period after termination of service or the date specified by the Board of Directors or its designated committee at the date of grant, but not more than ten years from such grant date.
During the year ended December 31, 2019, the Company granted a total of 901,043 stock-based awards to certain directors, officers and employees of the Company under the 2019 Plan. Of these, the Company granted the following stock-based awards associated with the long term incentive plan (LTIP): (i) 662,286 restricted stock units (RSUs) to certain officers and employees that generally vest over a three year period of continued employment, with 33% of the RSUs vesting on each of the first three anniversaries of the grant date, (ii) 25,192 RSUs to certain officers and employees that generally vest over a four year period of continued employment, with 25% of the RSUs vesting on
F-22
RIGNET, INC.
NOTES TO THE CONSOLIDATED FINANCIAL STATEMENTS – (CONTINUED)
each of the first four anniversaries of the grant date and (iii) 213,565 performance share units (PSUs) to certain officers and employees that generally cliff vest on the third anniversary of the grant date and are subject to continued employment and certain performance-based targets. The fair value of RSUs and PSUs is determined based on the closing trading price of the Company’s common stock on the grant date of the award. Compensation expense is recognized on a straight-line basis over the requisite service period of the entire award, net of forfeitures. As of December 31, 2019, no RSUs have vested, no RSUs have been forfeited and 901,043 unvested RSUs were outstanding under the 2019 Plan.
Additionally, during the year ended December 31, 2019, the Company granted 77,486 stock options with an average exercise price of $5.77 to certain officers and employees of the Company under the 2019 Plan. Options granted have a contractual term of ten years and vest over a three-year period of continued employment, with 33.3% of the options vesting on each of the first three anniversaries of the grant date. As of December 31, 2019, the Company has issued 77,486 options under the 2019 Plan, of which no options have been exercised, no options have been returned or forfeited and 77,486 options remain outstanding under the 2019 Plan.
2010 Omnibus Incentive Plan
In May 2010, the Board of Directors adopted the 2010 Omnibus Incentive Plan (2010 Plan). Under the 2010 Plan, the Board of Directors or its designated committee is authorized to issue awards representing a total of four million shares of common stock to certain directors, officers and employees of the Company. Awards may be in the form of new stock incentive awards or options including (i) incentive or non-qualified stock options, (ii) stock appreciation rights, (iii) restricted stock, (iv) restricted stock units (RSUs), (v) performance stock, (vi) performance share units (PSUs), (vii) director awards, (viii) annual cash incentive awards, (ix) cash-based awards, (x) substitution awards or (xi) other stock-based awards, as approved by the Board of Directors or its designated committee. Options granted under the 2010 Plan will generally expire at the earlier of a specified period after termination of service or the date specified by the Board of Directors or its designated committee at the date of grant, but not more than ten years from such grant date. The Company will grant no additional options under the 2010 Plan as the Company’s Board of Directors froze the 2010 Plan.
During the year ended December 31, 2019, the Company granted a total of 587,955 stock-based awards to certain directors, officers and employees of the Company under the 2010 Plan. Of these, the Company granted the following stock-based awards associated with the long term incentive plan (LTIP): (i) 190,588 restricted stock units (RSUs) to certain officers and employees that generally vest over a three year period of continued employment, with 33% of the RSUs vesting on each of the first three anniversaries of the grant date, (ii) 17,481 RSUs to certain officers and employees that generally vest over a four year period of continued employment, with 25% of the RSUs vesting on each of the first four anniversaries of the grant date, (iii) 60,361 performance share units (PSUs) to certain officers and employees that generally cliff vest on the third anniversary of the grant date and are subject to continued employment and certain performance-based targets and (iv) 86,772 RSUs to outside directors that vest in 2020. The ultimate number of PSUs issued is based on a multiple determined by certain performance-based targets. The fair value of RSUs and PSUs is determined based on the closing trading price of the Company’s common stock on the grant date of the award. Compensation expense is recognized on a straight-line basis over the requisite service period of the entire award, net of forfeitures. As of December 31, 2019, 1,114,722 RSUs and shares of restricted stock have vested, 698,266 RSUs and shares of restricted stock have been forfeited and 628,890 unvested RSUs and shares of restricted stock were outstanding under the 2010 Plan.
Additionally, the Company granted 232,753 unrestricted stock grants associated with payment of the Company’s 2018 short term incentive plan to certain officers and employees that vested immediately.
Additionally, during the year ended December 31, 2019, the Company granted 28,923 stock options with an average exercise price of $15.06 to certain officers and employees of the Company under the 2010 Plan. Options granted have a contractual term of seven years and vest over a three-year period of continued employment, with 33.3% of the options vesting on each of the first three anniversaries of the grant date. As of December 31, 2019, the Company has issued 1,233,736 options under the 2010 Plan, of which 193,441 options have been exercised, 711,715 options have been returned or forfeited and 328,580 options remain outstanding under the 2010 Plan.
2006 Long-Term Incentive Plan
In March 2006, the Board of Directors adopted the RigNet 2006 Long-Term Incentive Plan (2006 Plan). Under the 2006 Plan, the Board of Directors is authorized to issue options to purchase RigNet common stock to certain
F-23
RIGNET, INC.
NOTES TO THE CONSOLIDATED FINANCIAL STATEMENTS – (CONTINUED)
officers and employees of the Company. In general, all options granted under the 2006 Plan have a contractual term of ten years and a four-year vesting period, with 25.0% of the options vesting on each of the first four anniversaries of the grant date. The 2006 Plan authorized the issuance of three million options, which was increased to five million in January 2010, net of any options returned or forfeited. As of December 31, 2019, the Company has granted options to purchase 981,125 shares under the 2006 Plan, of which 755,503 options have been exercised, 221,872 options have been returned or forfeited and 3,750 options remain outstanding. The Company will grant no additional options under the 2006 Plan as the Company’s Board of Directors froze the 2006 Plan.
The Company does not accrue or pay dividends with regard to any equity awards.
Stock-based compensation expense related to the Company’s stock-based compensation plans for the years ended December 31, 2019, 2018 and 2017 was $8.6 million, $4.7 million and $3.7 million, respectively, and accordingly, reduced income for each year.
As of December 31, 2019 and 2018, there were $7.5 million and $3.3 million, respectively, of total unrecognized compensation cost related to unvested equity awards granted and expected to vest under the 2019 Plan and 2010 Plan. This cost is expected to be recognized on a remaining weighted-average period of two years.
All outstanding equity instruments are settled in stock. The Company currently does not have any awards accounted for as a liability. The fair value of each stock option award is estimated on the grant date using a Black-Scholes option valuation model, which uses certain assumptions as of the date of grant:
|
|
• |
Expected Volatility—based on peer-group price volatility for periods equivalent to the expected term of the options |
|
|
• |
Expected Term—expected life adjusted based on management’s best estimate for the effects of non-transferability, exercise restriction and behavioral considerations |
|
|
• |
Risk-Free Interest Rate—risk-free rate, for periods within the contractual terms of the options, is based on the U.S. Treasury yield curve in effect at the time of grant |
|
|
• |
Dividend Yield—expected dividends based on the Company’s historical dividend rate at the date of grant |
No options were granted in 2017. The assumptions used for grants made in the years ended December 31, 2019 and 2018 were as follows:
|
|
Year Ended December 31, |
|
||||
|
|
|
2019 |
|
2018 |
|
|
|
Expected volatility |
|
49% to 51% |
|
|
48 |
% |
|
Expected term (in years) |
|
7 |
|
7 |
|
|
|
Risk-free interest rate |
|
1.71% to 2.53% |
|
|
2.8 |
% |
|
Dividend yield |
|
- |
|
- |
|
|
Based on these assumptions, the weighted average grant date fair value of stock options granted, per share, for the year ended December 31, 2019 and 2018 was $4.40 and $7.14, respectively.
The fair value of each RSU and PSU award on the grant date is equal to the market price of RigNet’s stock on the date of grant. The weighted average fair value of RSUs, PSUs and restricted stock granted, per share, for the years ended December 31, 2019, 2018 and 2017 was $9.08, $14.22 and $19.68 respectively.
F-24
RIGNET, INC.
NOTES TO THE CONSOLIDATED FINANCIAL STATEMENTS – (CONTINUED)
The following table summarizes the Company’s stock option activity as of and for the years ended December 31, 2019, 2018 and 2017:
|
|
|
Year Ended December 31, |
|
|||||||||||||||||||||
|
|
2019 |
|
|
2018 |
|
|
2017 |
|
|
|
|
|
||||||||||||
|
|
|
Number of Underlying Shares |
|
|
Weighted Average Exercise Price |
|
|
Number of Underlying Shares |
|
|
Weighted Average Exercise Price |
|
|
Number of Underlying Shares |
|
|
Weighted Average Exercise Price |
|
||||||
|
|
|
(in thousands, except per share amounts) |
|
|||||||||||||||||||||
|
Balance, January 1, |
|
|
324 |
|
|
$ |
20.41 |
|
|
|
381 |
|
|
$ |
21.37 |
|
|
|
499 |
|
|
$ |
20.77 |
|
|
Granted |
|
|
106 |
|
|
$ |
8.30 |
|
|
|
60 |
|
|
$ |
13.50 |
|
|
|
- |
|
|
$ |
- |
|
|
Exercised |
|
|
(1 |
) |
|
$ |
4.39 |
|
|
|
(60 |
) |
|
$ |
16.15 |
|
|
|
(70 |
) |
|
$ |
13.04 |
|
|
Forfeited |
|
|
(16 |
) |
|
$ |
12.90 |
|
|
|
(53 |
) |
|
$ |
23.89 |
|
|
|
(47 |
) |
|
$ |
27.11 |
|
|
Expired |
|
|
(3 |
) |
|
$ |
1.94 |
|
|
|
(4 |
) |
|
$ |
6.55 |
|
|
|
(1 |
) |
|
$ |
8.32 |
|
|
Balance, December 31, |
|
|
410 |
|
|
$ |
17.12 |
|
|
|
324 |
|
|
$ |
20.41 |
|
|
|
381 |
|
|
$ |
21.37 |
|
|
Exercisable, December 31, |
|
|
239 |
|
|
$ |
22.09 |
|
|
|
204 |
|
|
$ |
23.41 |
|
|
|
224 |
|
|
$ |
21.28 |
|
|
|
Year Ended December 31, |
|
||||||||||
|
|
|
2019 |
|
|
2018 |
|
|
2017 |
|
|||
|
|
|
(in thousands) |
|
|||||||||
|
Intrinsic value of options exercised |
|
$ |
5 |
|
|
$ |
1,297 |
|
|
$ |
1,286 |
|
|
Fair value of options vested |
|
$ |
511 |
|
|
$ |
950 |
|
|
$ |
837 |
|
The following table summarizes the Company’s RSU, PSU and restricted stock activity as of and for the years ended December 31, 2019 and 2018:
|
|
Year Ended December 31, |
|
||||||
|
|
|
2019 |
|
|
2018 |
|
||
|
|
|
(in thousands) |
|
|||||
|
Balance, January 1, |
|
|
411 |
|
|
|
436 |
|
|
Granted |
|
|
1,489 |
|
|
|
459 |
|
|
Vested |
|
|
(332 |
) |
|
|
(337 |
) |
|
Forfeited |
|
|
(31 |
) |
|
|
(147 |
) |
|
Balance, December 31, |
|
|
1,537 |
|
|
|
411 |
|
The weighted average remaining contractual term in years for equity awards outstanding as of and for the years ended December 31, 2019, 2018 and 2017 was 2.3 years, 1.7 years and 1.7 years, respectively. At December 31, 2019, equity awards vested and expected to vest totaled 3.9 million with awards available for grant of approximately 0.6 million.
F-25
RIGNET, INC.
NOTES TO THE CONSOLIDATED FINANCIAL STATEMENTS – (CONTINUED)
The following is a summary of changes in unvested equity awards, including stock options, RSUs, PSUs and restricted stock, as of and for the years ended December 31, 2019, 2018 and 2017:
|
|
|
Number of Underlying Shares |
|
|
Weighted Average Grant Date Fair Value |
|
||
|
|
|
(in thousands) |
|
|
|
|
|
|
|
Unvested equity awards, January 1, 2017 |
|
|
473 |
|
|
$ |
16.62 |
|
|
Granted |
|
|
232 |
|
|
$ |
19.42 |
|
|
Vested |
|
|
(182 |
) |
|
$ |
14.16 |
|
|
Forfeited |
|
|
(227 |
) |
|
$ |
11.66 |
|
|
Unvested equity awards, December 31, 2017 |
|
|
296 |
|
|
$ |
24.13 |
|
|
Granted |
|
|
519 |
|
|
$ |
14.03 |
|
|
Vested |
|
|
(259 |
) |
|
$ |
22.03 |
|
|
Forfeited |
|
|
(200 |
) |
|
$ |
12.41 |
|
|
Unvested equity awards, December 31, 2018 |
|
|
356 |
|
|
$ |
17.52 |
|
|
Granted |
|
|
1,595 |
|
|
$ |
8.76 |
|
|
Vested |
|
|
(272 |
) |
|
$ |
7.33 |
|
|
Forfeited |
|
|
(47 |
) |
|
$ |
16.10 |
|
|
Unvested equity awards, December 31, 2019 |
|
|
1,632 |
|
|
$ |
10.70 |
|
Note 11— Earnings (Loss) Per Share
Basic earnings (loss) per share (EPS) are computed by dividing net loss attributable to RigNet common stockholders by the weighted average number of basic shares outstanding during the period. Basic shares equal the total of the common shares outstanding, but excludes the dilutive effect of common shares that could potentially be issued due to the exercise of stock options or vesting of restricted stock, RSUs or PSUs. Diluted EPS is computed by dividing loss attributable to RigNet common stockholders by the weighted average number of diluted shares outstanding during the period. Diluted shares equal the total of the basic shares outstanding and all potentially issuable shares, other than antidilutive shares, if any. The Company uses the treasury stock method to determine the dilutive effect. In periods when a net loss is reported, all common stock equivalents are excluded from the calculation because they would have an anti-dilutive effect, meaning the loss per share would be reduced. Therefore, in periods when a loss is reported, basic and dilutive loss per share are the same. The following table provides a reconciliation of the numerators and denominators of the basic and diluted per share computations for net income attributable to RigNet, Inc. common stockholders:
|
|
|
Year Ended December 31, |
|
|||||||||
|
|
|
2019 |
|
|
2018 |
|
|
2017 |
|
|||
|
|
|
(in thousands) |
|
|||||||||
|
Net loss attributable to RigNet, Inc. common stockholders |
|
$ |
(19,156 |
) |
|
$ |
(62,453 |
) |
|
$ |
(16,176 |
) |
|
Weighted average shares outstanding, basic |
|
|
19,832 |
|
|
|
18,713 |
|
|
|
18,009 |
|
|
Effect of dilutive securities |
|
|
- |
|
|
|
- |
|
|
|
- |
|
|
Weighted average shares outstanding, diluted |
|
|
19,832 |
|
|
|
18,713 |
|
|
|
18,009 |
|
|
Net loss per share attributable to RigNet, Inc. common stockholders, basic |
|
$ |
(0.97 |
) |
|
$ |
(3.34 |
) |
|
$ |
(0.90 |
) |
|
Net loss per share attributable to RigNet, Inc. common stockholders, diluted |
|
$ |
(0.97 |
) |
|
$ |
(3.34 |
) |
|
$ |
(0.90 |
) |
As of December 31, 2019, there were approximately 1,426,281 potentially issuable shares excluded from the Company’s calculation of diluted EPS that were excluded because the Company incurred a loss in the period and to include them would have been anti-dilutive.
As of December 31, 2018, there were approximately 573,481 potentially issuable shares excluded from the Company’s calculation of diluted EPS that were excluded because the Company incurred a loss in the period and to include them would have been anti-dilutive.
F-26
RIGNET, INC.
NOTES TO THE CONSOLIDATED FINANCIAL STATEMENTS – (CONTINUED)
As of December 31, 2017, there were approximately 625,039 potentially issuable shares excluded from the Company’s calculation of diluted EPS that were excluded because the Company incurred a loss in the period and to include them would have been anti-dilutive.
Note 12—Segment Information
Segment information is prepared consistent with the components of the enterprise for which separate financial information is available and regularly evaluated by the chief operating decision-maker for the purpose of allocating resources and assessing performance.
RigNet considers its business to consist of the following segments:
|
|
• |
Managed Communications Services (MCS). The MCS segment provides remote communications, telephony and technology services for offshore and onshore drilling rigs and production facilities, support vessels, and other remote sites. |
|
|
• |
Applications and Internet-of-Things (Apps & IoT). The Apps & IoT segment provides applications over-the-top of the network layer including Software as a Service (SaaS) offerings such as a real-time machine learning and AI data platform (Intelie Pipes and Intelie LIVE), Cyphre Encryption, Enhanced Cybersecurity Services (ECS), edge computing solution services that assist customers with collecting and standardizing the complex data produced by edge devices (LIVE-IT), applications for safety and workforce productivity such as weather monitoring primarily in the North Sea (MetOcean), and certain other value-added services such as Advanced Video Intelligence (AVI). This segment also includes the private machine-to-machine IoT data networks including Supervisory Control and Data Acquisition (SCADA) provided primarily for pipelines. |
|
|
• |
Systems Integration. The Systems Integration segment provides design and implementation services for customer telecommunications systems. Solutions are delivered based on the customer’s specifications, adhering to international industry standards and best practices. Project services may include consulting, design, engineering, project management, procurement, testing, installation, commissioning and maintenance. Additionally, Systems Integration provides complete monitoring and maintenance for fire and gas detection systems and PLC/automation control systems. |
Corporate and eliminations primarily represents unallocated executive and support activities, including back-office software development, interest expense, income taxes, eliminations, the GX dispute and change in fair value of earn-out/contingent consideration.
F-27
RIGNET, INC.
NOTES TO THE CONSOLIDATED FINANCIAL STATEMENTS – (CONTINUED)
The Company’s reportable segment information as of and for the years ended December 31, 2019, 2018 and 2017 is presented below.
|
|
|
Managed Communications Services |
|
|
Applications and Internet- of-Things |
|
|
Systems Integration |
|
|
Corporate and Eliminations |
|
|
Consolidated Total |
|
|||||
|
|
|
(in thousands) |
|
|||||||||||||||||
|
2019 |
|
|
|
|
|
|
|
|
|
|
|
|
|
|
|
|
|
|
|
|
|
Revenue |
|
$ |
164,857 |
|
|
$ |
35,368 |
|
|
$ |
42,706 |
|
|
$ |
- |
|
|
$ |
242,931 |
|
|
Cost of revenue (excluding |
|
|
|
|
|
|
|
|
|
|
|
|
|
|
|
|
|
|
|
|
|
depreciation and amortization) |
|
|
100,394 |
|
|
|
17,239 |
|
|
|
32,120 |
|
|
|
- |
|
|
|
149,753 |
|
|
Depreciation and amortization |
|
|
21,403 |
|
|
|
4,892 |
|
|
|
1,627 |
|
|
|
3,207 |
|
|
|
31,129 |
|
|
Change in fair value of earn-out/ contingent consideration |
|
|
- |
|
|
|
- |
|
|
|
- |
|
|
|
2,499 |
|
|
|
2,499 |
|
|
Gain on sales of property, plant and equipment, net of retirements |
|
|
- |
|
|
|
- |
|
|
|
- |
|
|
|
(4,240 |
) |
|
|
(4,240 |
) |
|
Selling, general and administrative |
|
|
13,288 |
|
|
|
4,551 |
|
|
|
2,530 |
|
|
|
45,491 |
|
|
|
65,860 |
|
|
Operating income (loss) |
|
$ |
29,772 |
|
|
$ |
8,686 |
|
|
$ |
6,429 |
|
|
$ |
(46,957 |
) |
|
$ |
(2,070 |
) |
|
Total assets |
|
|
155,807 |
|
|
|
42,758 |
|
|
|
29,124 |
|
|
|
23,291 |
|
|
|
250,980 |
|
|
Capital expenditures |
|
|
22,165 |
|
|
|
2,083 |
|
|
|
- |
|
|
|
1,267 |
|
|
|
25,515 |
|
|
2018 |
|
|
|
|
|
|
|
|
|
|
|
|
|
|
|
|
|
|
|
|
|
Revenue |
|
$ |
171,574 |
|
|
$ |
25,713 |
|
|
$ |
41,567 |
|
|
$ |
- |
|
|
$ |
238,854 |
|
|
Cost of revenue (excluding |
|
|
|
|
|
|
|
|
|
|
|
|
|
|
|
|
|
|
|
|
|
depreciation and amortization) |
|
|
105,101 |
|
|
|
13,386 |
|
|
|
28,116 |
|
|
|
- |
|
|
|
146,603 |
|
|
Depreciation and amortization |
|
|
22,759 |
|
|
|
4,570 |
|
|
|
2,511 |
|
|
|
3,314 |
|
|
|
33,154 |
|
|
Change in fair value of earn-out/ contingent consideration |
|
|
- |
|
|
|
- |
|
|
|
- |
|
|
|
3,543 |
|
|
|
3,543 |
|
|
GX dispute |
|
|
- |
|
|
|
- |
|
|
|
- |
|
|
|
50,612 |
|
|
|
50,612 |
|
|
Selling, general and administrative |
|
|
16,448 |
|
|
|
1,961 |
|
|
|
1,698 |
|
|
|
45,930 |
|
|
|
66,037 |
|
|
Operating income (loss) |
|
$ |
27,266 |
|
|
$ |
5,796 |
|
|
$ |
9,242 |
|
|
$ |
(103,399 |
) |
|
$ |
(61,095 |
) |
|
|
|
|
|
|
|
|
|
|
|
|
|
|
|
|
|
|
|
|
|
|
|
Total assets |
|
|
171,503 |
|
|
|
47,175 |
|
|
|
24,094 |
|
|
|
16,153 |
|
|
|
258,925 |
|
|
Capital expenditures |
|
|
29,058 |
|
|
|
759 |
|
|
|
- |
|
|
|
706 |
|
|
|
30,523 |
|
|
2017 |
|
|
|
|
|
|
|
|
|
|
|
|
|
|
|
|
|
|
|
|
|
Revenue |
|
$ |
164,238 |
|
|
$ |
15,626 |
|
|
$ |
25,028 |
|
|
$ |
- |
|
|
$ |
204,892 |
|
|
Cost of revenue (excluding |
|
|
|
|
|
|
|
|
|
|
|
|
|
|
|
|
|
|
- |
|
|
depreciation and amortization) |
|
|
101,681 |
|
|
|
10,751 |
|
|
|
18,734 |
|
|
|
- |
|
|
|
131,166 |
|
|
Depreciation and amortization |
|
|
23,202 |
|
|
|
1,738 |
|
|
|
2,438 |
|
|
|
3,467 |
|
|
|
30,845 |
|
|
Change in fair value of earn-out/ contingent consideration |
|
|
- |
|
|
|
- |
|
|
|
- |
|
|
|
(320 |
) |
|
|
(320 |
) |
|
Selling, general and administrative |
|
|
16,841 |
|
|
|
1,685 |
|
|
|
1,403 |
|
|
|
33,260 |
|
|
|
53,189 |
|
|
Operating income (loss) |
|
$ |
22,514 |
|
|
$ |
1,452 |
|
|
$ |
2,453 |
|
|
$ |
(36,407 |
) |
|
$ |
(9,988 |
) |
|
Total assets |
|
|
181,157 |
|
|
|
32,464 |
|
|
|
16,708 |
|
|
|
(235 |
) |
|
|
230,094 |
|
|
Capital expenditures |
|
|
17,066 |
|
|
|
198 |
|
|
|
- |
|
|
|
645 |
|
|
|
17,909 |
|
The following table presents revenue earned from the Company’s domestic and international operations for the years ended December 31, 2019, 2018 and 2017. Revenue is based on the location where services are provided or goods are sold. Due to the mobile nature of RigNet’s customer base and the services provided, the Company works closely with its customers to ensure rig or vessel moves are closely monitored to ensure location of service information is properly reflected.
|
|
|
Year Ended December 31, |
|
|||||||||
|
|
2019 |
|
|
2018 |
|
|
2017 |
|
||||
|
|
|
(in thousands) |
|
|||||||||
|
Domestic |
|
$ |
106,276 |
|
|
$ |
106,189 |
|
|
$ |
63,460 |
|
|
International |
|
|
136,655 |
|
|
|
132,665 |
|
|
|
141,432 |
|
|
Total |
|
$ |
242,931 |
|
|
$ |
238,854 |
|
|
$ |
204,892 |
|
F-28
RIGNET, INC.
NOTES TO THE CONSOLIDATED FINANCIAL STATEMENTS – (CONTINUED)
The following table presents goodwill and long-lived assets for the Company’s domestic and international operations as of December 31, 2019 and 2018.
|
|
|
December 31, |
|
|||||
|
|
|
2019 |
|
|
2018 |
|
||
|
|
|
(in thousands) |
|
|||||
|
Domestic |
|
$ |
76,253 |
|
|
$ |
73,615 |
|
|
International |
|
|
67,631 |
|
|
|
70,334 |
|
|
Total |
|
$ |
143,884 |
|
|
$ |
143,949 |
|
Note 13—Income Taxes
Income Tax Expense
The components of the income tax expense are:
|
|
|
Year Ended December 31, |
|
|||||||||
|
|
|
2019 |
|
|
2018 |
|
|
2017 |
|
|||
|
|
|
(in thousands) |
|
|||||||||
|
Current: |
|
|
|
|
|
|
|
|
|
|
|
|
|
Federal |
|
$ |
- |
|
|
$ |
- |
|
|
$ |
- |
|
|
State |
|
|
412 |
|
|
|
659 |
|
|
|
495 |
|
|
Foreign |
|
|
5,544 |
|
|
|
4,174 |
|
|
|
2,638 |
|
|
Total current |
|
|
5,956 |
|
|
|
4,833 |
|
|
|
3,133 |
|
|
Deferred: |
|
|
|
|
|
|
|
|
|
|
|
|
|
Federal |
|
|
(120 |
) |
|
|
(411 |
) |
|
|
(2,020 |
) |
|
State |
|
|
(268 |
) |
|
|
(1 |
) |
|
|
(8 |
) |
|
Foreign |
|
|
5,177 |
|
|
|
(7,167 |
) |
|
|
2,367 |
|
|
Total deferred |
|
|
4,789 |
|
|
|
(7,579 |
) |
|
|
339 |
|
|
Income tax expense (benefit) |
|
$ |
10,745 |
|
|
$ |
(2,746 |
) |
|
$ |
3,472 |
|
The following table sets forth the components of income (loss) before income taxes:
|
|
|
Year Ended December 31, |
|
|||||||||
|
|
2019 |
|
|
2018 |
|
|
2017 |
|
||||
|
|
|
(in thousands) |
|
|||||||||
|
Income (loss) before income taxes: |
|
|
|
|
|
|
|
|
|
|
|
|
|
United States |
|
$ |
(13,486 |
) |
|
$ |
(63,266 |
) |
|
$ |
(15,019 |
) |
|
Foreign |
|
|
5,445 |
|
|
|
(1,794 |
) |
|
|
2,294 |
|
|
|
|
$ |
(8,041 |
) |
|
$ |
(65,060 |
) |
|
$ |
(12,725 |
) |
F-29
RIGNET, INC.
NOTES TO THE CONSOLIDATED FINANCIAL STATEMENTS – (CONTINUED)
Income tax expense differs from the amount computed by applying the 2019 and 2018 statutory federal income tax rate of 21.0% and the 2017 statutory federal income tax rate of 35% to income (loss) before taxes as follows:
|
|
|
Year Ended December 31, |
|
|||||||||
|
|
|
2019 |
|
|
2018 |
|
|
2017 |
|
|||
|
|
|
(in thousands) |
|
|||||||||
|
United States statutory federal income tax rate |
|
$ |
(1,689 |
) |
|
$ |
(13,663 |
) |
|
$ |
(4,454 |
) |
|
Non-deductible expenses |
|
|
515 |
|
|
|
592 |
|
|
|
(294 |
) |
|
Deferred earnout adjustments |
|
|
703 |
|
|
|
1,253 |
|
|
|
- |
|
|
Noncash compensation |
|
|
27 |
|
|
|
359 |
|
|
|
(30 |
) |
|
U.S. tax on foreign earnings, net of tax credits |
|
|
- |
|
|
|
- |
|
|
|
(1,283 |
) |
|
Changes in valuation allowances |
|
|
7,443 |
|
|
|
7,920 |
|
|
|
(5,956 |
) |
|
Tax credits |
|
|
(1,863 |
) |
|
|
(1,025 |
) |
|
|
(699 |
) |
|
State taxes |
|
|
(58 |
) |
|
|
74 |
|
|
|
224 |
|
|
Effect of operating in foreign jurisdictions |
|
|
2,737 |
|
|
|
1,545 |
|
|
|
2,101 |
|
|
Deemed repatriation transition tax |
|
|
- |
|
|
|
- |
|
|
|
3,807 |
|
|
Reduction of federal corporate tax rate |
|
|
- |
|
|
|
1,823 |
|
|
|
8,190 |
|
|
Changes in prior year estimates |
|
|
526 |
|
|
|
(66 |
) |
|
|
(26 |
) |
|
Changes in uncertain tax benefits |
|
|
1,135 |
|
|
|
(1,506 |
) |
|
|
1,798 |
|
|
Revisions of deferred tax accounts |
|
|
1,217 |
|
|
|
(56 |
) |
|
|
(10 |
) |
|
Other |
|
|
52 |
|
|
|
4 |
|
|
|
104 |
|
|
Income tax expense (benefit) |
|
$ |
10,745 |
|
|
$ |
(2,746 |
) |
|
$ |
3,472 |
|
Deferred Tax Assets and Liabilities
The Company’s deferred tax position reflects the net tax effects of the temporary differences between the carrying amounts of assets and liabilities for financial reporting purposes and the amounts used for income tax reporting. Significant components of the deferred tax assets and liabilities are as follows:
|
|
|
December 31, |
|
|||||
|
|
|
2019 |
|
|
2018 |
|
||
|
|
|
(in thousands) |
|
|||||
|
Deferred tax assets: |
|
|
|
|
|
|
|
|
|
Net operating loss carryforwards |
|
$ |
27,238 |
|
|
$ |
17,934 |
|
|
Federal, state and foreign tax credits |
|
|
13,964 |
|
|
|
13,042 |
|
|
Depreciation and amortization |
|
|
12,396 |
|
|
|
12,359 |
|
|
Unrealized loss on functional currency |
|
|
1,298 |
|
|
|
1,203 |
|
|
Allowance for doubtful accounts |
|
|
1,495 |
|
|
|
1,221 |
|
|
Accruals not currently deductible |
|
|
1,739 |
|
|
|
12,559 |
|
|
Stock-based compensation |
|
|
1,450 |
|
|
|
755 |
|
|
Intercompany interest |
|
|
1,738 |
|
|
|
1,779 |
|
|
Right-of-use lease asset |
|
|
1,770 |
|
|
|
- |
|
|
Other |
|
|
1,375 |
|
|
|
193 |
|
|
Valuation allowance |
|
|
(58,366 |
) |
|
|
(51,316 |
) |
|
Total deferred tax assets |
|
|
6,097 |
|
|
|
9,729 |
|
|
Deferred tax liabilities: |
|
|
|
|
|
|
|
|
|
Depreciation and amortization |
|
|
(1,714 |
) |
|
|
(2,342 |
) |
|
Right-of-use lease liability |
|
|
(1,770 |
) |
|
|
- |
|
|
Other |
|
|
(266 |
) |
|
|
(398 |
) |
|
Total deferred tax liabilities |
|
|
(3,750 |
) |
|
|
(2,740 |
) |
|
Net deferred tax assets |
|
$ |
2,347 |
|
|
$ |
6,989 |
|
F-30
RIGNET, INC.
NOTES TO THE CONSOLIDATED FINANCIAL STATEMENTS – (CONTINUED)
As of December 31, 2019, the Company’s as filed net operating loss and tax credit carryforwards were as follows:
|
Jurisdiction |
|
Expiration Period Begins |
|
Net Operating Loss Carryforwards |
|
|
Tax Credit Carryforwards |
|
||
|
|
|
|
(in thousands) |
|
||||||
|
U.S. Federal |
|
2036 |
|
$ |
20,263 |
|
|
$ |
- |
|
|
U.S. Federal |
|
Indefinite |
|
|
51,785 |
|
|
|
- |
|
|
U.S. Federal |
|
2020 |
|
|
- |
|
|
|
11,793 |
|
|
U.S. State |
|
2021 |
|
|
9,867 |
|
|
|
- |
|
|
Non-U.S. |
|
Indefinite |
|
|
47,729 |
|
|
|
- |
|
|
Non-U.S. |
|
2024 |
|
|
581 |
|
|
|
- |
|
|
|
|
|
|
$ |
130,225 |
|
|
$ |
11,793 |
|
As of December 31, 2019, the Company’s valuation allowances were as follows:
|
Jurisdiction |
|
Valuation Allowances |
|
|
|
|
|
(in thousands) |
|
|
|
United States |
|
$ |
41,456 |
|
|
Norway |
|
|
9,744 |
|
|
United Kingdom |
|
|
2,829 |
|
|
Brazil |
|
|
2,222 |
|
|
Mexico |
|
|
1,231 |
|
|
Other |
|
|
884 |
|
|
|
|
$ |
58,366 |
|
The amount reported on an as filed basis can differ from the amount recorded in the deferred tax assets of the Company’s financial statements due to the utilization or creation of assets in recording uncertain tax benefits.
In assessing deferred tax assets, the Company considers whether a valuation allowance should be recorded for some or all of the deferred tax assets which may not be realized. The ultimate realization of deferred tax assets is dependent upon the generation of future taxable income during the periods in which the temporary differences become deductible. Among other items, the Company considers the scheduled reversal of deferred tax liabilities, projected future taxable income and available tax planning strategies. While the Company expects to realize the remaining net deferred tax assets, changes in future taxable income or in tax laws may alter this expectation and result in future increases to the valuation allowance.
As of December 31, 2019, the Company intends to continue reinvesting earnings outside of the United States for the foreseeable future. This determination is based on estimates that future domestic cash generation will be sufficient to meet future domestic cash needs and on its specific plan for reinvestment of the foreign subsidiaries’ undistributed earnings, with the exception of RigNet Qatar W.L.L. The Company did recognize U.S. taxes on the one-time repatriation tax due under the 2017 Tax Cuts and Jobs Act. While the Company does not expect to repatriate cash to the United States, if these amounts were distributed in the form of dividends or otherwise, the Company may be subject to additional tax liabilities with respect to items such as certain foreign exchange gains or losses, withholding taxes or state taxes It is not practicable at this time to determine the amount of unrecognized deferred tax liabilities with respect to the reinvested foreign earnings.
Uncertain Tax Benefits
The Company evaluates its tax positions and recognizes only tax benefits that, more likely than not, will be sustained upon examination, including resolution of any related appeals or litigation processes, based on the technical merits of the position. The tax position is measured at the largest amount of benefit that has a greater than 50.0% likelihood of being realized upon settlement. At December 31, 2019, 2018 and 2017, the Company’s uncertain tax
F-31
RIGNET, INC.
NOTES TO THE CONSOLIDATED FINANCIAL STATEMENTS – (CONTINUED)
benefits totaling $15.2 million, $16.1 million and $18.8 million, respectively, are reported as other liabilities in the consolidated balance sheets. Changes in the Company’s gross unrecognized tax benefits are as follows:
|
|
|
Year Ended December 31, |
|
|||||||||
|
|
|
2019 |
|
|
2018 |
|
|
2017 |
|
|||
|
|
|
(in thousands) |
|
|||||||||
|
Balance, January 1, |
|
$ |
7,497 |
|
|
$ |
9,637 |
|
|
$ |
13,244 |
|
|
Additions for the current year tax |
|
|
- |
|
|
|
- |
|
|
|
- |
|
|
Additions related to prior years |
|
|
1,027 |
|
|
|
- |
|
|
|
110 |
|
|
Reductions related to lapses in statue of limitations |
|
|
(1,885 |
) |
|
|
(1,262 |
) |
|
|
(327 |
) |
|
Reductions related to prior years |
|
|
- |
|
|
|
(878 |
) |
|
|
(3,390 |
) |
|
Balance, December 31, |
|
$ |
6,639 |
|
|
$ |
7,497 |
|
|
$ |
9,637 |
|
As of December 31, 2019, the Company’s gross unrecognized tax benefits which would impact the annual effective tax rate upon recognition were $6.6 million. In addition, as of December 31, 2019, the Company has recorded related assets, net of a valuation allowance of $0.1 million. The related asset might not be recognized in the same period as the contingent tax liability and like interest and penalties does have an impact on the annual effective tax rate. The Company has elected to include income tax related interest and penalties as a component of income tax expense. As of December 31, 2019, 2018 and 2017, the Company has accrued penalties and interest of approximately $8.6 million, $8.6 million and $9.2 million, respectively. The Company has recognized ($0.1) million, ($0.6) million and $0.3 million of interest and penalties in income tax expense for the years ended December 31, 2019, 2018 and 2017, respectively. To the extent interest and penalties are not assessed with respect to uncertain tax positions, accruals will be reduced and reflected as a reduction to income tax expense.
The Company believes that it is reasonably possible that a decrease of up to $3.2 million in unrecognized tax benefits, including related interest and penalties, may be necessary within the coming year due to lapse in statute of limitations.
The Company files income tax returns in the U.S. federal jurisdiction, and various states and foreign jurisdictions. All of the Company’s federal filings are still subject to tax examinations. With few exceptions, the Company is no longer subject to the foreign income tax examinations by tax authorities for years before 2009.
The IRS finalized the audit of the Company’s 2016 income tax return. There were no assessments or material impact to the Company’s Consolidated Financial Statements.
The Company received a notice informing us of an audit of the Company’s 2016-2017 income tax returns in Singapore. It is unclear if the audit and the appeals process, if necessary, will be completed within the next twelve months. The Company is in the early stages of the audit and is unable to quantify any potential settlement or outcome of the audit at this time.
F-32
RIGNET, INC.
NOTES TO THE CONSOLIDATED FINANCIAL STATEMENTS – (CONTINUED)
Note 14—Supplemental Quarterly Financial Information (Unaudited)
Summarized quarterly supplemental consolidated financial information for 2019 and 2018 are as follows:
|
|
|
2019 Quarter Ended |
|
|||||||||||||
|
|
|
March 31 |
|
|
June 30 |
|
|
September 30 |
|
|
December 31 |
|
||||
|
|
|
(in thousands, except per share data) |
|
|||||||||||||
|
Revenue |
|
$ |
57,510 |
|
|
$ |
60,332 |
|
|
$ |
60,993 |
|
|
$ |
64,096 |
|
|
Operating income (loss) |
|
$ |
(8,121 |
) |
|
$ |
(2,560 |
) |
|
$ |
2,998 |
|
|
$ |
5,613 |
|
|
Net income (loss) |
|
$ |
(11,953 |
) |
|
$ |
(6,126 |
) |
|
$ |
(270 |
) |
|
$ |
(437 |
) |
|
Net income (loss) attributable to RigNet, Inc. common stockholders |
|
$ |
(11,983 |
) |
|
$ |
(6,156 |
) |
|
$ |
(494 |
) |
|
$ |
(523 |
) |
|
Net income (loss) per share attributable to RigNet, Inc. common stockholders, basic |
|
$ |
(0.63 |
) |
|
$ |
(0.32 |
) |
|
$ |
(0.02 |
) |
|
$ |
(0.03 |
) |
|
Net income (loss) per share attributable to RigNet, Inc. common stockholders, diluted |
|
$ |
(0.63 |
) |
|
$ |
(0.32 |
) |
|
$ |
(0.02 |
) |
|
$ |
(0.03 |
) |
|
Weighted average shares outstanding, basic |
|
|
18,949 |
|
|
|
19,082 |
|
|
|
19,970 |
|
|
|
19,975 |
|
|
Weighted average shares outstanding, diluted |
|
|
18,949 |
|
|
|
19,082 |
|
|
|
19,970 |
|
|
|
19,975 |
|
|
|
|
2018 Quarter Ended |
|
|||||||||||||
|
|
March 31 |
|
|
June 30 |
|
|
September 30 |
|
|
December 31 |
|
|||||
|
|
|
(in thousands, except per share data) |
|
|||||||||||||
|
Revenue |
|
$ |
53,833 |
|
|
$ |
60,007 |
|
|
$ |
64,770 |
|
|
$ |
60,244 |
|
|
Operating loss |
|
$ |
(4,470 |
) |
|
$ |
(4,330 |
) |
|
$ |
(1,021 |
) |
|
$ |
(51,274 |
) |
|
Net loss |
|
$ |
(5,526 |
) |
|
$ |
(4,299 |
) |
|
$ |
(2,798 |
) |
|
$ |
(49,691 |
) |
|
Net loss attributable to RigNet, Inc. common stockholders |
|
$ |
(5,556 |
) |
|
$ |
(4,329 |
) |
|
$ |
(2,847 |
) |
|
$ |
(49,721 |
) |
|
Net loss per share attributable to RigNet, Inc. common stockholders, basic |
|
$ |
(0.31 |
) |
|
$ |
(0.23 |
) |
|
$ |
(0.15 |
) |
|
$ |
(2.62 |
) |
|
Net loss per share attributable to RigNet, Inc. common stockholders, diluted |
|
$ |
(0.31 |
) |
|
$ |
(0.23 |
) |
|
$ |
(0.15 |
) |
|
$ |
(2.62 |
) |
|
Weighted average shares outstanding, basic |
|
|
18,146 |
|
|
|
18,639 |
|
|
|
18,905 |
|
|
|
18,948 |
|
|
Weighted average shares outstanding, diluted |
|
|
18,146 |
|
|
|
18,639 |
|
|
|
18,905 |
|
|
|
18,948 |
|
The three months and year ended December 31, 2019 included gain on the sale of certain non-core assets of $4.2 million, or $0.21 per share.
Note 15—Employee Benefits
The Company maintains a 401(k)-plan pursuant to which eligible employees may make contributions through a payroll deduction.
Effective January 1, 2018, the Company re-instated the 401(k) match under which the Company will make matching cash contributions of 100% of each employee’s contribution up to 3.0% of that employee’s eligible compensation and 50% of each employee’s contribution between 3.0% and 5.0% of such employee’s eligible compensation, up to the maximum amount permitted by law. The Company incurred expenses of $1.1 million, $0.8 million and none for the years ended December 31, 2019, 2018 and 2017, respectively, for employer contributions.
F-33
RIGNET, INC.
NOTES TO THE CONSOLIDATED FINANCIAL STATEMENTS – (CONTINUED)
Note 16—Restructuring Costs – Cost Reduction Plans
During the year ended December 31, 2019, the Company incurred a net pre-tax restructuring expense of $0.7 million reported as general and administrative expense, of which $0.2 million was incurred in the third quarter 2019 related to consolidating three separate legacy facilities into our new office in Lafayette, Louisiana and $0.5 million was incurred in the first quarter of 2019 associated with the reduction of 25 employees.
During the year ended December 31, 2018, the Company incurred a net pre-tax restructuring expense of $0.8 million reported as general and administrative expense in the Corporate segment associated with the reduction of 23 employees.
During the year ended December 31, 2017, the Company incurred a net pre-tax restructuring expense of $0.8 million reported as general and administrative expense in the Corporate segment associated with the reduction of 31 employees.
Note 17 –Executive Departure costs
The Company incurred executive departure expense of none, $0.4 million and $1.2 million for the years ended December 31, 2019, 2018 and 2017, respectively, in the corporate segment.
F-34