Attached files
| file | filename |
|---|---|
| EX-32.1 - EXHIBIT 32.1 - NLIGHT, INC. | exhibit321-q4201910xk.htm |
| EX-31.2 - EXHIBIT 31.2 - NLIGHT, INC. | exhibit312-q4201910xk.htm |
| EX-31.1 - EXHIBIT 31.1 - NLIGHT, INC. | exhibit311-q4201910xk.htm |
| EX-23.1 - EXHIBIT 23.1 - NLIGHT, INC. | exhibit231-q4201910xk.htm |
| EX-21.1 - EXHIBIT 21.1 - NLIGHT, INC. | exhibit211-q4201910xk.htm |
| EX-10.21 - EXHIBIT 10.21 - NLIGHT, INC. | nutronicslease.htm |
| EX-4.3 - EXHIBIT 4.3 - NLIGHT, INC. | exhibit43-q4201910xk.htm |
UNITED STATES
SECURITIES AND EXCHANGE COMMISSION
Washington, D.C. 20549
________________________________________________________
FORM 10-K
________________________________________________________
(Mark One)
x ANNUAL REPORT PURSUANT TO SECTION 13 OR 15 (d) OF THE SECURITIES EXCHANGE ACT OF 1934
For the fiscal year ended December 31, 2019
OR
¨ TRANSITION REPORT PURSUANT TO SECTION 13 OR 15(d) OF THE SECURITIES EXCHANGE ACT OF 1934
For the transition period from
to
Commission File Number 001-38462
________________________________________________________
NLIGHT, INC.
(Exact name of Registrant as specified in its charter)
________________________________________________________
Delaware | 91-2066376 | |
(State or other jurisdiction of incorporation or organization) | (I.R.S. Employer Identification Number) | |
5408 NE 88th Street, Building E Vancouver, Washington 98665 | ||
(Address of principal executive office, including zip code) | ||
(360) 566-4460 | ||
(Registrant’s telephone number, including area code) | ||
Securities registered pursuant to Section 12(b) of the Act: | ||
Title of Each Class | Trading Symbol | Name of Exchange on Which Registered |
Common Stock, par value $0.0001 per share | LASR | The Nasdaq Stock Market LLC (The Nasdaq Global Select Market) |
Securities registered pursuant to Section 12(g) of the Act: | ||
None | ||
Indicate by check mark if the registrant is a well-known seasoned issuer, as defined in Rule 405 of the Securities Act. Yes ¨ No x
Indicate by check mark if the registrant is not required to file reports pursuant to Section 13 or Section 15(d) of the Act. Yes ¨ No x
Indicate by check mark whether the registrant (1) has filed all reports required to be filed by Section 13 or 15(d) of the Securities Exchange Act of 1934 during the preceding 12 months (or for such shorter period that the registrant was required to file such reports), and (2) has been subject to such filing requirements for the past 90 days. Yes x No ¨
Indicate by check mark whether the registrant has submitted electronically every Interactive Data File required to be submitted pursuant to Rule 405 of Regulation S-T (§232.405 of this chapter) during the preceding 12 months (or for such shorter period that the registrant was required to submit such files). Yes x No ¨
1
Indicate by check mark whether the registrant is a large accelerated filer, an accelerated filer, a non-accelerated filer, a smaller reporting company or an emerging growth company. See definition of “large accelerated filer,” “accelerated filer,” “smaller reporting company” and “emerging growth company” in Rule 12b-2 of the Exchange Act.
Large accelerated filer | o | Accelerated filer | x | Smaller Reporting Company | o | |
Non-accelerated filer | o | Emerging Growth Company | x | |||
If an emerging growth company, indicate by check mark if the registrant has elected not to use the extended transition period for complying with any new or revised financial accounting standards provided pursuant to Section 13(a) of the Exchange Act. ¨
Indicate by check mark whether the registrant is a shell company (as defined in Rule 12b-2 of the Exchange Act). Yes ¨ No x
The aggregate market value of the voting and non-voting stock held by non-affiliates of the Registrant, based on the closing sale price of the Registrant’s common stock on the last business day of its most recently completed second fiscal quarter (June 30, 2019), as reported on the Nasdaq Global Select Market, was approximately $633.7 million. Shares of common stock held by each executive officer and director and by each other person who may be deemed to be an affiliate of the Registrant, have been excluded from this computation. The determination of affiliate status for this purpose is not necessarily a conclusive determination for other purposes.
As of March 2, 2020, the Registrant had 38,362,820 shares of common stock outstanding.
DOCUMENTS INCORPORATED BY REFERENCE
Portions of the registrant's definitive Proxy Statement for the 2020 Annual Meeting of Stockholders are incorporated herein by reference in Part III of this Annual Report on Form 10-K to the extent stated herein. Such Proxy Statement will be filed with the Securities and Exchange Commission within 120 days of the registrant's fiscal year ended December 31, 2019.
2
TABLE OF CONTENTS | |
Page | |
3
SPECIAL NOTE REGARDING FORWARD-LOOKING STATEMENTS AND INDUSTRY DATA
This Annual Report on Form 10-K contains forward-looking statements within the meaning of Section 27A of the Securities Act of 1933, as amended, and Section 21E of the Securities Exchange Act of 1934, as amended. In some cases, you can identify forward-looking statements by the following words: "ability," "anticipate," "attempt," "believe," "can be," "continue," "could," "depend," "enable," "estimate," "expect," "extend," "grow," "if," "intend," "likely," "may," "objective," "ongoing," "plan," "possible," "potential," "predict," "project," "propose," "rely," "should," "target," "will," "would" or the negative of these terms or other comparable terminology, although not all forward-looking statements contain these words.
These statements involve risks, uncertainties and other factors that may cause our actual results, levels of activity, performance or achievements to be materially different from the information expressed or implied by these forward-looking statements. Although we believe that we have a reasonable basis for each forward-looking statement, we caution you that these statements are based on a combination of facts and factors currently known by us and our projections of the future, about which we cannot be certain. Forward-looking statements include, but are not limited to, statements about: the size of our market opportunity; our ability to compete effectively against other providers of similar products and services, as well as competing technologies; applications and processes that will use lasers, including the suitability of our products; our ability to develop new technology, designs and applications for our lasers; the reduction in cost per brilliant watt and increase in power of semiconductor lasers going forward; the implementation of our business model and strategic plans, including estimates regarding future sales, revenues, expenses, acquisitions, investments, capital requirements and stock performance; our future financial performance; fluctuations in our quarterly results of operations and other operating measures, particularly as a result of seasonality; the regulatory regime for our products and services, domestically and internationally; the adoption of our products or lasers generally and the growth of the laser market broadly and within specific industries; our utilization of vertical integration; our ability to adequately protect our intellectual property rights; our ability to maintain and grow our relationships with our foreign customers; the impact on our sales and operations of public health crises in China, the United States or internationally, including the current COVID-19 outbreak; the effect on our business of litigation to which we are or may become a party; our ability to maintain an effective system of internal controls necessary to accurately report our financial results and prevent fraud; future macroeconomic conditions and the effect of trade restrictions and new or increased tariffs on our products; the sufficiency of our existing liquidity sources to meet our cash needs; and our ability to sustain and manage growth in our business.
You should refer to the "Risk Factors" section of this report for a discussion of other important factors that may cause our actual results to differ materially from those expressed or implied by our forward-looking statements. As a result of these factors, we cannot assure you that the forward-looking statements in this report will prove to be accurate. In addition, statements that "we believe" and similar statements reflect our beliefs and opinions on the relevant subject. These statements are based upon information available to us as of the date of this report, which although we believe such information forms a reasonable basis for such statements, such information may be limited or incomplete, and our statements should not be read to indicate that we have conducted a thorough inquiry into, or review of, all potentially available relevant information. These statements are inherently uncertain and investors are cautioned not to unduly rely upon these statements. Furthermore, if our forward-looking statements prove to be inaccurate, the inaccuracy may be material. In light of the significant uncertainties in these forward-looking statements, you should not regard these statements as a representation or warranty by us or any other person that we will achieve our objectives and plans in any specified time frame, or at all. We undertake no obligation to publicly update any forward-looking statements, whether as a result of new information, future events or otherwise, except as required by law.
PART I
ITEM 1. BUSINESS
Overview
nLIGHT, Inc., is a leading provider of high‑power semiconductor and fiber lasers for industrial, microfabrication, and aerospace and defense applications. Our lasers are changing not only the way things are made but also the things that can be made. Headquartered in Vancouver, Washington, we design, develop and manufacture the critical elements of our lasers, and believe our vertically integrated business model enables us to rapidly introduce innovative products, control our costs and protect our intellectual property.
In November 2019, we acquired Nutronics, Inc. (Nutronics), based in Longmont, Colorado, a leading developer of coherently combined lasers and beam control systems (BCS) for high-energy laser (HEL) systems serving the defense market. Nutronics is focused on accelerating the transition of directed energy technology from the lab to the field. The acquisition of Nutronics complements our existing products and significantly expands our addressable market through the development of directed energy lasers.
4
Until the acquisition of Nutronics we operated as a single operating segment in three primary end markets: Industrial, Microfabrication, and Aerospace and Defense. As of December 31, 2019, we operate in two segments consisting of the Laser Products segment and the Advanced Development segment. The Advanced Development segment includes the operating results of Nutronics since the date of acquisition. All other operating results are included in the Laser Products segment. Our primary end markets did not change as a result of the acquisition.
Products
We design and manufacture a range of high-power semiconductor lasers, fiber lasers and optical fibers. Our products are typically integrated into laser systems or manufacturing tools built by our customers.
Semiconductor Lasers. Our semiconductor lasers serve as the core building block of our products and are deeply integrated with our OEM customers' systems used in applications in the Industrial, Microfabrication, and Aerospace and Defense markets. We sell high-power semiconductor lasers with a broad range of power levels, wavelengths and output fiber sizes. We believe our semiconductor lasers offer the industry's highest brilliance and are among the industry's most reliable.
The core building block of our technology is a compound semiconductor laser chip manufactured from a gallium arsenide wafer. We have developed advanced metal-organic chemical vapor deposition processes that yield high-quality semiconductor material with low-defect density and high uniformity. We believe that our semiconductor laser chips offer industry-leading brilliance as a result of proprietary and trade-secret protected semiconductor laser chip design, laser cavity design and facet passivation.
We patented our multiplexed single-chip architecture for high-power semiconductor laser packaging. Our experience with multiplexed single-chip architecture gives us a performance advantage in multiple critical categories, including power, brilliance, efficiency and reliability. Our extensive experience in optical alignment and package design enables us to overcome many complex thermal and beam stability challenges to produce highly reliable semiconductor lasers.
Fiber Lasers. We offer programmable, serviceable and reliable high-power fiber lasers primarily for use in Industrial, Microfabrication, and Aerospace and Defense applications. Our fiber lasers enable fast, high-quality and efficient processing of materials. The programmability and wide operating range of our fiber lasers makes them easy for our customers to use and expands their applicability. For example, in some cases, a single programmable fiber laser with the ability to program the size and shape of its output beam can take the place of several less-flexible lasers. We have also designed our fiber lasers to enable a tool integrator or end user to perform common field service activities on-site, which results in higher machine uptime, lower cost of ownership and an improved customer experience.
Our fiber lasers use an active fiber that is doped with a rare-earth element to amplify the light from multiple semiconductor laser chips into a much higher brilliance laser beam. The power available from our fiber lasers has increased significantly due to the increase in power of our semiconductor laser chips and advances in our multi-chip semiconductor laser architecture, our direct nanoparticle deposition (DND) active fibers and our proprietary fiber laser architectures. We scale power by both combining the outputs of multiple fiber lasers and by increasing the output power of each individual fiber laser.
Our fiber lasers offer many features, including all-fiber programmable beam sizes and shapes, programmable waveforms, high-speed waveform modulation capabilities, hardware back-reflection suppression, operability in harsh environments, quick and easy serviceability and industry-leading power stability. The resulting performance and quality provide significant advantages over alternative laser and non-laser solutions for existing applications and support the commercial feasibility of an increasing number of new applications. We intend to continue to aggressively advance our fiber laser, semiconductor laser and active fiber technologies to further improve our performance, programmability, serviceability and reliability advantages.
Optical Fibers. Our active optical fibers are used as the gain medium in which lasing, or amplification, of light occurs in our fiber lasers. Our active fibers consist of an inner core that is doped with rare-earth ions and an outer core of un-doped glass for guiding the power delivered from our semiconductor lasers.
We utilize a proprietary and patented process for making our fibers, which we call DND. We have been developing and improving our DND technology for more than a decade. Our DND process enables simultaneous, single-step deposition of all elements in the active fiber and provides high compositional uniformity and independent control of refractive-index and doping profiles. Our DND technology enables high doping concentration, which allows for higher power and efficiency and shorter fiber length.
5
Our passive optical fibers route and deliver the optical energy generated in our semiconductor lasers and fiber lasers. Our passive fibers are designed to match the optical guiding properties of our rare earth-doped fibers, enabling compatibility with and low-loss splicing of our active fiber within our fiber lasers.
Markets
We sell our products into three primary end markets: Industrial, Microfabrication, and Aerospace and Defense.
Industrial. The productivity, efficiency and versatility offered by high-power fiber lasers have been critical in making them a key part of the evolution of the industrial ecosystem. Material processing applications, the largest of which is cutting, and others such as welding, cladding, heat treating, and additive manufacturing, comprise most of the industrial laser market. High-power fiber lasers are rapidly replacing gas and other legacy lasers for cutting, due to their significantly faster speed, higher quality and lower cost when used across a wide range of metals. High-power fiber lasers also continue to take market share from non-laser cutting techniques and are expanding into other applications such as cutting metal tubes and other three-dimensional parts.
The factors driving the utilization of high-power fiber lasers in metal welding applications, including increased speed, quality and cost, are like those that have fueled their adoption for metal cutting. Fiber laser welding can be done faster, with deeper penetration, less distortion and lower heat input than traditional methods like arc welding. These advantages have fueled adoption of high-power fiber lasers across the automotive industry where system productivity and versatility are critical. Other metal fabrication industries, such as aerospace, energy and light manufacturing, are also embracing the unique capabilities offered by high-power fiber lasers for welding applications as they seek improved production efficiencies, including energy efficiency, and higher levels of industrial automation.
In addition to improving traditional manufacturing processes, fiber lasers are also enabling new applications such as metal additive manufacturing. High-power fiber lasers provide the precise power needed to fuse metal powders into intricate three-dimensional metal structures. Advancements in laser technology are also enabling manufacturers to produce ever-larger parts with more complex geometries at faster speeds and lower costs.
Microfabrication. Microfabrication refers to the process of creating three-dimensional microscale structures, typically by ablating, annealing, etching and drilling. Many of the microscale features incorporated into products in the automotive, electronics, medical, semiconductor and other markets are made commercially viable by the precise power delivery of lasers. Preferences for brighter, more vibrant displays in mobile phones, tablets and televisions, and the desire for thinner products with improved battery life and energy efficiency are placing greater importance on the need for components that are smaller, more robust and less expensive, which we believe will drive demand for lasers.
Aerospace and Defense. Lasers are used today in a variety of aerospace and defense applications, such as range finding, imaging and directed energy defense systems. Directed energy defense systems utilize concentrated electrical or optical energy rather than chemical or kinetic force to incapacitate, damage, disable or destroy. Compared to conventional weapons, directed energy weapons using high-power fiber lasers offer ultra-precise targeting, low cost per use and a nearly unlimited magazine. Over the past decade, directed energy technologies have improved steadily, culminating in a series of successful demonstrations of significantly higher power, multi-kilowatt systems. Systems using high-power fiber lasers have shown the highest degree of operational viability.
Semiconductor and fiber lasers are displacing legacy lasers and non-laser energy sources across a wide range of applications in the Industrial, Microfabrication, and Aerospace and Defense markets. In the Industrial market, high-power semiconductor and fiber lasers have enabled the creation of next-generation industrial systems to perform manufacturing processes such as cutting, welding and drilling, as well as advanced manufacturing techniques such as additive manufacturing. In the Microfabrication market, many of the critical microscale features incorporated into products in the automotive, electronics, medical, semiconductor and other markets are made commercially viable by the precise power delivery of lasers. In the Aerospace and Defense market, high-power semiconductor and fiber lasers are currently used across a wide range of mission critical applications, such as defending aircraft against missiles, and are enabling next-generation defense systems.
Research and Development
Our research and development activities include innovation of existing products that enhance performance at reduced cost, and the design of new products that address select market opportunities. While we seek to improve our products on all operating characteristics, we believe we lead the market in terms of semiconductor laser chip brilliance. We work closely with customers to develop products to meet customer application and performance needs, making our research and development efforts more efficient. We also benefit from our vertically integrated business model, as we are able to conduct design cycles more rapidly through control of the full production process.
6
We intend to continue our commitment to research and development and to introduce new products, solutions and complementary products to maintain and strengthen our competitive position.
Intellectual Property
Our success depends in part upon our ability to continue to innovate and invest in research and development to meet the needs of our customers, and to maintain and protect our proprietary technology. To accomplish this, we rely on a combination of intellectual property rights, including patents, trade secrets, copyrights and trademarks, as well as customary contractual protections with our customers, suppliers, employees and consultants that access our material intellectual property.
We have generated, and continue to generate and maintain, patents and other intellectual property rights covering innovations that are intended to create a competitive advantage, and to support the protection of our investments in research and development. Although we believe that our patents and other intellectual property rights have significant value, we do not believe that maintaining or growing our business is materially dependent on any single patent. Due to the rapid pace of innovation within the markets that we serve, it is possible that our protection through patents may be less important than factors such as our technological expertise, continuing development of new products and technologies, protection of trade secrets, market penetration, customer relationships, and our ability to provide support and service to customers worldwide.
No assurance can be given that any patents will not be challenged, invalidated or circumvented, or that the rights granted thereunder will provide us with a sustained competitive advantage. In addition, there can be no assurance that we will be able to protect our technology, or that competitors will not be able to independently develop similar or functionally competitive technologies, design around our patents, or attempt to manufacture and sell infringing products in countries that do not strongly enforce intellectual property rights.
Sales and Marketing
We market and sell our products to global OEMs primarily through our direct sales force located in the United States, China, South Korea, Finland and various European countries. To supplement our direct sales team, we have contracts in place with independent sales representatives and distributors in Asia and Europe. We selected these independent representatives and distributors based on their ability to provide effective field sales, marketing communications and technical support for select products and markets in target geographies. Our sales and marketing efforts are conducted through an integrated process that involves our direct sales force, field applications engineers, or FAEs, customer service representatives and our senior management team.
Our FAEs work closely with our sales and engineering teams to provide product development support to our OEM customers. Our integrated sales and marketing strategy enables us to be highly responsive and successful in navigating each customer's unique and oftentimes complex design qualification process.
We maintain customer support and field service staff in our major markets in the United States, Europe, China, South Korea, and India. We work closely with customers to service equipment and train customers to use and repair our products and explore additional applications for our technologies. We plan to expand our support and field service footprint, particularly in locations where business volume requires local service capabilities.
Customers
We sell to and support over 350 customers worldwide. A few customers drive a significant portion of our revenues. In the aggregate, our top ten customers accounted for approximately 53%, 56% and 61% of our revenues in 2019, 2018 and 2017, respectively. Our global customers include Raytheon, Suzhou Quick Laser Technology, Applied Materials, Lumentum, MKS Instruments, Northrop Grumman, Advanced Optowave, HK Laser and Systems, and the United States Government.
Information concerning revenue by end-market, geographic region based upon ship-to location, and segment appears under Item 7: Management's Discussion and Analysis of Financial Condition, and Notes 3 and 18 of the Notes to Consolidated Financial Statements included in Part II, Item 8 of this Annual Report on Form 10-K.
Backlog
Backlog represents orders that have been received for products, contract research and development, or other services for which a contractual agreement is in place and delivery or performance is expected to occur. Backlog totaled $112.1 million and $38.0 million as of December 31, 2019 and 2018, respectively. Approximately 25% of the backlog as of December 31, 2019 is not
7
expected to be filled within the next 12 months. Our backlog is not necessarily indicative of revenues for any specific future period due to possible order cancellations or deferrals, and shipping or acceptance delays. Delays in delivery schedules or a reduction in backlog during any period could have a material adverse effect on our business and results of operations.
Seasonality
Our quarterly revenues can fluctuate with general economic trends, holidays in foreign countries such as Chinese New Year in the first quarter of our fiscal year, the timing of capital expenditures by our customers, and general economic trends. In addition, as is typical in our industry, we tend to recognize a larger percentage of our quarterly revenues in the last month of the quarter, which may impact our working capital trends.
Competition
The industries in which we operate have significant price and technological competition. We compete not only with companies providing semiconductor and fiber lasers, but with companies offering conventional laser or non-laser solutions for the applications we target. Some of our competitors are larger and have substantially greater financial, research and development, managerial, sales, service and marketing resources and larger installed customer bases than we do.
We compete with companies that offer fiber lasers and other lasers such as IPG Photonics Corporation, Maxphotonics, and Raycus Fiber Laser Technologies. We also compete with widely used non-laser production methods, such as plasma cutting, water-jet cutting and resistance welding.
Manufacturing
We manufacture, package and test the critical elements of our high-power semiconductor and fiber lasers, including semiconductor laser chips and optical fiber in-house. Our vertically integrated business model enables us to control and protect our proprietary technologies and process knowledge. We outsource components and materials when we feel that a specific component, by itself, does not provide enough competitive advantage to warrant investment in the capital and human resources necessary for its manufacture. We work with our suppliers in these situations to ensure consistent quality and delivery performance. In many cases, components are custom manufactured for us based on our proprietary specifications.
We purchase raw materials used to manufacture our products and other components, such as semiconductor wafer substrates, fiber laser chip packages, optics and other materials, from single or limited-source suppliers. We typically purchase our materials through purchase orders or agreed-upon terms and conditions, and we do not have guaranteed supply arrangements with many of these suppliers. To mitigate raw material supply risks, we take a variety of actions such as second source qualification, accumulation of safety stock and vendor surveillance.
Our primary manufacturing facilities are in Vancouver, Washington; Hillsboro, Oregon; Lohja, Finland and Shanghai, China. We manufacture certain electrical-optical components in our Vancouver, Washington; Shanghai, China and Hillsboro, Oregon facilities. We maintain our fiber operations and manufacture fiber in Finland.
We believe our existing manufacturing facilities are adequate to meet current anticipated demand. If additional capacity is needed, we believe that such capacity will be available on commercially reasonable terms.
Regulation
We are subject to significant regulation by local, state, federal and international laws in all jurisdictions in which we operate. Compliance to these requirements can be costly and time consuming. We believe that our operations, products, services and actions substantially comply with applicable regulations in all jurisdictions. However, the risk of non-compliance cannot be eliminated and therefore there is no assurance that future costs related to these regulations will not be incurred. There is also the possibility that regulations will be retroactively applied, interpreted or applied differently to our operations, products, services and actions which will require significant time and resources.
Employees
As of December 31, 2019 we had a total of 1,100 full-time employees worldwide. Of our total full-time employees at our facilities, approximately 560 were in the United States, 470 were in China and 70 were in the rest of the world. In Finland, certain employees belong to labor unions for their specialty. There are no labor unions to which our employees belong in any other location. We have
8
not experienced any employee-led work stoppages at any of our facilities. We consider our relationship with our employees to be good.
Corporate Information
We maintain a website at www.nlight.net. We make available free of charge through our investor relations website, http://investors.nlight.net/IR, our annual reports, quarterly reports, current reports, proxy statements and all amendments to those reports as soon as reasonably practicable after such material is electronically filed or furnished with the United State Securities and Exchange Commission, or SEC. The reference to our website does not constitute incorporation by reference of the information contained at the site.
The SEC also maintains an Internet website that contains reports and other information regarding issuers, such as nLIGHT, Inc., that file electronically with the SEC. The SEC's Internet website is located at http://www.sec.gov.
We were incorporated under the name nLight Corporation in Washington in June 2000. We reincorporated in Delaware under the name nLight Photonics Corporation in August 2000 and changed our name to nLIGHT, Inc. in January 2016.
ITEM 1A. RISK FACTORS
You should carefully consider the following risk factors, in addition to the other information contained in this report, including the section captioned “Management’s Discussion and Analysis of Financial Condition and Results of Operations” and our consolidated financial statements and related notes. This report also contains forward-looking statements that involve risks and uncertainties. Our actual results could differ materially from those anticipated in the forward-looking statements as a result of factors that are described below and elsewhere in this report.
Risks Related to Our Business and Industry
We have a history of losses, and as our operating costs increase we may not be able to generate sufficient revenues to achieve or maintain profitability in the future.
Although we first became profitable in 2017, we have incurred recurring net losses since our inception in 2000 through 2016, and in 2019. We had net income (loss) of $(12.9) million and $13.9 million for the year ended December 31, 2019 and 2018, respectively. We had an accumulated deficit of $(117.5) million as of December 31, 2019.
We expect our operating costs to continue to increase in future periods as we expend substantial financial and other resources on, among other things, business and headcount expansion in operations, sales and marketing, research and development, and administration as a public company. These expenditures may not result in additional revenues or the growth of our business. If we fail to grow revenues or to sustain profitability while our operating costs increase, our business, financial condition, results of operations and growth prospects will be materially adversely affected.
Downturns in the markets we serve could materially adversely affect our revenues and profitability.
Our results of operations may vary based on the impact of changes in the industries we serve or in the global economy. A large portion of our revenue growth substantially depends on demand for our products in the Industrial and Microfabrication markets. For our products sold to the Industrial market, we believe demand is largely based on general economic conditions. Adverse changes in the global economy have occurred and may occur in the future as a result of declining or flat global or regional economic conditions, fluctuations in currency and commodity prices, trade restrictions or impositions of new or increased tariffs, wavering confidence, unemployment, declines in stock markets, contraction of credit availability or other factors affecting economic conditions generally. We cannot predict the timing, strength or duration of any economic slowdown or recovery, whether global, regional or within specific markets.
For the Microfabrication market, a portion of our revenues depends on the demand for our products from semiconductor equipment companies. The semiconductor equipment market has historically been characterized by sudden and severe cyclical variations in product supply and demand, which have often severely affected the demand for manufacturing equipment, including laser-based tools and systems. The timing, severity and duration of these market cycles are difficult to predict, which limits our ability to predict our business prospects and financial results in this market and we may not be able to respond effectively to these cycles.
During industry downturns in the past, our revenues from the Microfabrication market declined suddenly and significantly, and this is likely to occur again in the event of industry downturns in the future.
9
Our revenue growth rate in prior periods may not be indicative of our future performance.
Between 2016 and 2018, we experienced substantial levels of revenue growth. However, our historical revenue growth rate may not be indicative of future growth, and we may not achieve similar revenue growth rates in future periods. You should not rely on our revenues for any prior quarterly or annual periods as an indication of our future revenues or revenue growth. Our results of operations may vary as a result of a number of factors, including our ability to execute on our business strategy and expand our manufacturing capacity, the general economic conditions and the legal and regulatory environment in the United States, China and globally, as well as other factors that are outside of our control. For the year ended December 31, 2019, our revenues have decreased 7.7% compared to the same period of 2018.
We have high levels of fixed costs and inventory levels that may materially adversely affect our gross profits and results of operations in the event that demand for our products declines or we maintain excess inventory levels.
We conduct our own manufacturing operations and have a high fixed cost base, including significant costs for the employees in our manufacturing operations. We may not be able to adjust our production levels or fixed costs quickly enough or sufficiently to adapt to rapidly changing market conditions. Gross profit, in absolute dollars and as a percentage of revenues, is impacted by our volumes, product sales mix, the corresponding absorption of fixed manufacturing overhead expenses, production costs and manufacturing yields. In addition, because we design and manufacture our key components, insufficient demand for our products will subject us to the risks of high inventory carrying costs and increased inventory obsolescence. If our capacity and production levels are not properly sized in relation to expected demand, we may need to record write-downs for excess or obsolete inventory. If these anticipated sales do not occur, we may need to record write-downs for excess inventory.
The markets for our products are highly competitive. If we fail to compete successfully, our business, financial condition, results of operations and growth prospects will be materially adversely affected.
The industries in which we operate have significant price and technological competition. We compete not only with companies providing semiconductor and fiber lasers, but with companies offering conventional laser or non-laser solutions for the applications we target. Some of our competitors are larger and have substantially greater manufacturing, financial and research and development resources and larger installed customer bases than we do. Some of these competitors may receive substantial government subsidies allowing them to compete more aggressively. Certain of these competitors also have higher sales volume than we do, which can enable such competitors to lower the prices of their products. To compete, we may be forced to lower our prices, which could negatively impact our revenues and gross margins. For example, certain of our competitors have substantially reduced the price of their fiber lasers sold in the China market. In some instances, we have reduced the price of our fiber lasers sold in China. It is unclear whether our competitors' price reductions will continue for the foreseeable future; however, the recent decline in the selling price of certain of our current fiber laser product offerings could negatively affect our near-term results of operations. Consolidation in our industry could intensify the competitive pressures that we face. Our competitors worldwide include BWT Beijing Ltd., Coherent, Inc., II-VI Incorporated, IPG Photonics Corporation, Lumentum Holdings Inc., Maxphotonics Co., Ltd., Raycus Fiber Laser Technologies Co. Ltd. and Trumpf GmbH + Co. KG.
We also compete with widely used non-laser production methods, such as plasma cutting, water-jet cutting and resistance welding. We believe that competition will be particularly intense from makers of CO2, YAG and disc lasers, as makers of these laser solutions may lower their prices in order to maintain market share and have committed significant research and development resources to pursue opportunities related to these technologies. If manufacturers of these non-laser and legacy laser solutions offer significantly lower prices than we do for our products, customers may choose to purchase their products instead of ours, despite any technical or performance advantage our products may offer.
Our OEM customers' internal production of laser technologies presents additional competitive pressure. To the extent our OEM customers move towards using such in-house technologies, we may need to lower our prices to remain competitive, or otherwise our market share and revenues may be materially adversely affected.
To be competitive, we believe that we will be required to continue to invest significantly in research and development and manufacturing facilities. We may not have sufficient resources to continue to make these investments and we may not be able to make the technological advances or price adjustments necessary to compete successfully. Any failure to compete successfully will materially adversely affect our business, financial condition, results of operations and growth prospects.
Our inability to manage risks associated with our international customers and operations could materially adversely affect our business.
Approximately 62% and 63% of our revenues were derived from sales to customers outside of North America for the year ended December 31, 2019 and 2018, respectively. We anticipate that foreign revenues, particularly revenues from Asia, will continue to account for a significant portion of our revenues in the foreseeable future. Our products are sold in over 30 countries. Our principal
10
markets outside of North America include China, Japan, South Korea, Thailand and other Asian countries, and Germany, U.K. and other European countries. Our primary offices outside of the United States are in Lohja, Finland; Shanghai, China and Seoul, South Korea. We have substantial tangible assets outside of the United States, particularly in China and Finland.
Our foreign operations and revenues are subject to a number of risks, including the impact of recessions and other economic conditions in economies outside the United States, unexpected changes in regulatory requirements, certification requirements, environmental regulations, reduced protection for intellectual property rights in some countries, potentially adverse tax consequences, political and economic instability, import/export regulations, tariffs and trade barriers, compliance with applicable United States and foreign anti-corruption laws, cultural and management differences, pandemic illness, reliance in some jurisdictions on third-party revenues from channel partners, preference for locally produced products, shipping, or other logistics complications, and longer accounts receivable collection periods.
Our business could also be impacted by international conflicts, terrorist and military activity, civil unrest and pandemic illness, which could cause a slowdown in customer orders, cause customer order cancellations or negatively impact availability of supplies or limit our ability to produce or timely service our installed base of products. Political, economic and monetary instability and changes in governmental regulations or policies, including trade tariffs and protectionism, could materially adversely affect both our ability to effectively operate our foreign offices and the ability of our foreign suppliers to supply us with required materials or services. Any interruption or delay in the supply of our required components, products, materials or services, or our inability to obtain these components, materials, products or services from alternate sources at acceptable prices and within a reasonable amount of time, could impair our ability to meet scheduled product deliveries to our customers and could cause customers to cancel orders.
Our failure to manage the foregoing risks associated with our operations in Finland, China and South Korea and our other existing and potential future international business operations could materially adversely affect our business, financial condition, results of operations and growth prospects.
We have substantial sales and operations in China, which exposes us to risks inherent in doing business there.
Our business operations in China and our sales to Chinese customers are critical to our success. As of December 31, 2019, we had approximately 470 full-time employees at our Shanghai facility where we have high-volume manufacturing, fiber laser assembly and sales operations. Moreover, approximately 36% and 37% of our revenues were derived from China for the year ended December 31, 2019 and 2018, respectively. As a result, downturns in the Chinese economy could materially adversely affect our results of operations. The Chinese economy differs from the economies of other developed countries in many respects, including the level of government involvement, level of development, growth rate and control of foreign exchange and allocation of resources. The Chinese economy has been transitioning from a planned economy to a more market-oriented economy. Despite reforms, the government continues to exercise significant control over China's economic growth by way of the allocation of resources, control over foreign currency-denominated obligations and monetary policy and provision of preferential treatment to particular industries or companies. We cannot predict the future economic policies of the Chinese government or their effect on the regional or global economy and we cannot predict other governments' economic policies toward China. For example, the United States and China have imposed a number of tariffs and other restrictions on items imported or exported between the United States and China, and could impose additional tariffs. These or other events may lead to a significant reduction in demand for our products, which could materially adversely affect our results of operations.
The political, legal and regulatory climate in China, both nationally and regionally, is fluid and unpredictable, and operating in China exposes us to political and legal risks. Our ability to operate in China may be materially adversely affected by changes in Chinese laws and regulations such as those related to, among other things, taxation, import and export tariffs, environmental regulations, land use rights, intellectual property, currency controls, network security, privacy, employee benefits and overtime policies and other matters. Our operations in China are subject to numerous laws, regulations, rules and specifications relating to human health and safety and the environment. Applicable laws, rules and regulations often lack clarity and it is difficult to predict how any of these laws, rules and regulations will be enforced. If we or our employees or agents violate, or are alleged to have violated, any of these laws, rules and regulations, we or our employees could be subject to civil or criminal penalties, damages or fines, or our employees or agents could be detained, imprisoned or prevented from entering China, any of which could materially adversely affect our results of operations.
Any current or future outbreak of a health epidemic or other adverse public health developments, such as the pneumonia caused by the COVID-19 coronavirus, could disrupt our manufacturing and supply chain and adversely affect our business and operating results.
11
Our business could be adversely affected by the effects of health epidemics, particularly in regions where we have significant operations or concentrations of customers or suppliers. For example, we rely on the manufacturing, assembly and sales activities and certain other critical business operations conducted from our office in Shanghai, China, and several of our customers and suppliers are also located in cities throughout China. As a result, we could be adversely affected by health epidemics in China, and in particular we expect the recent outbreak of the novel strain of coronavirus named COVID-19 that was first identified in Wuhan, China to adversely impact our revenues for the first quarter of 2020 and potentially beyond. Consequences of the COVID-19 outbreak have included disruptions to and restrictions on our ability to travel and temporary closures of our Shanghai office and the facilities of various of our customers and suppliers in China. Our operating results could be further adversely affected to the extent that the COVID-19 outbreak harms the Chinese economy in general or if it evolves into a worldwide health crises.
Tariffs and global trade policies could increase the cost of our products, which could adversely impact the competitiveness of our products and our financial results.
The United States Government has recently imposed new or higher tariffs on specified products imported from China to penalize China for what it characterizes as unfair trade practices and China has responded by imposing new or higher tariffs on specified products imported from the United States. Based on our initial experience with the tariff changes, the new tariffs have a direct impact on our operations and financial results, as we maintain a significant portion of our operations, sales, and manufacturing in China. While there is uncertainty as to the duration of the tariffs or potential future increases, and we are actively taking remedial actions to minimize the financial impact, the tariffs may materially increase the cost of our raw materials and finished goods, and may negatively impact our margins as we may not be able to pass on the additional cost through increasing the prices of our products. Tariffs may cause the depreciation of the RMB currency and a contraction of certain industries that will likely be affected by the tariffs, including the Industrial market. As such, there may be potential decrease in the spending powers of our Chinese customers which may lead to fewer business opportunities and our operation may be negatively impacted. In addition, future actions or escalations by either the United States or China that affect trade relations may cause global economic uncertainty and potentially have a negative impact on our business and we cannot provide any assurances as to whether such actions will occur or the form that they may take.
Significant United Kingdom or European developments stemming from the United Kingdom’s decision to withdraw from the European Union could have a material adverse effect on us.
In June 2016, the United Kingdom held a referendum and voted in favor of leaving the European Union, and in March 2017, the government of the United Kingdom formally initiated the withdrawal process. The United Kingdom left the European Union on January 31, 2020 and during the “transition period” ending on December 31, 2020 (extendable for up to two years) the United Kingdom is essentially still treated as a member state of the European Union with the regulatory regime remaining the same across the United Kingdom and the European Union. At the end of the transition period, the trading relationship between the United Kingdom and the European Union will be governed by whatever agreement the two parties can reach by then. On that short timetable the United Kingdom and the European Union are likely to focus on ensuring tariff-free trade, but it is unclear whether there will be any formal regulatory alignment between the United Kingdom and the European Union after the transition period. In the unlikely event that the United Kingdom leaves the European Union without an agreement, the United Kingdom will be completely separated from a regulatory perspective from the European Union immediately upon the exit date.
Negotiations related to the United Kingdom's exit from the European Union, or Brexit, have created political and economic uncertainty, particularly in the United Kingdom and the European Union, and this uncertainty may last for years. Our business in the United Kingdom, the European Union, and worldwide could be affected during this period of uncertainty, and perhaps longer, by the impact of Brexit. There are many ways in which our business could be affected, only some of which we can identify as of the date of this report.
Brexit has caused, and may continue to cause, significant volatility in global financial markets, including in global currency and debt markets. This volatility could cause a slowdown in economic activity in the United Kingdom, Europe or globally, which could adversely affect our operating results and growth prospects. In addition, our business could be negatively affected by new trade agreements between the United Kingdom and other countries, including the United States, and by the possible imposition of trade or other regulatory barriers in the United Kingdom. These possible negative impacts, and others resulting from Brexit may adversely affect our operating results and growth prospects.
Our manufacturing capacity and operations may not be appropriate for future levels of demand and may materially adversely affect our gross margins.
When market demand increases, we must be able to rapidly and effectively increase our manufacturing capacity to meet increases in customer demand, and if we fail to do so we may lose business to our competitors and our relationships with our customers
12
may be harmed. To maintain our competitive position and to meet anticipated demand for our products, we have invested significantly in the expansion and automation of our manufacturing and operations throughout the world and may continue to do so in the future. If the demand for our products does not increase or if our revenues decrease from current levels, we may have significant excess manufacturing capacity and under-absorption of our fixed costs, which could in turn materially adversely affect our gross margins and profitability.
In connection with any expansion, we may incur cost overruns, construction delays, labor difficulties or regulatory issues which could cause our capital expenditures to be higher than what we currently anticipate, possibly by a material amount, which would in turn adversely impact our results of operations. Expansion activities can also cause disruptions to existing manufacturing capabilities. Moreover, we may experience higher costs due to yield loss, production inefficiencies and equipment problems until any operational issues associated with the addition of new equipment or opening of new manufacturing facilities are resolved.
We rely on a small number of customers for a significant portion of our revenues, and if we lose any of these customers or they significantly curtail their purchases of our products, our results of operations could be materially adversely affected.
We rely on a few customers for a significant portion of our revenues. In the aggregate, our top ten customers accounted for approximately 53% and 56% of our revenues during the year ended December 31, 2019 and 2018, respectively. Quick Laser Technology Co., Ltd accounted for 11% and 13% of our revenues for the year ended December 31, 2019 and 2018, respectively, and Raytheon accounted for 13% of our revenues for the year ended December 31, 2019. We generally do not enter into long-term purchase agreements with our customers that obligate them to purchase our products. Our business is characterized by short-term purchase orders issued by our customers, which are likely to be favorable to those customers. If any of our principal customers discontinues its relationship with us, develops its own products instead of using ours, replaces us as a vendor for certain products or suffers downturns in its business resulting in a cancellation of orders or an inability to place new orders, then our business, financial condition, results of operations and growth prospects could be materially adversely affected.
If we are unable to protect our proprietary technology and intellectual property rights, our competitive position could be harmed and our results of operations could be materially adversely affected.
Our success depends in part upon our ability to obtain, maintain and enforce patents, trade secrets, trademarks and other intellectual property rights and to operate without infringing on or otherwise violating the proprietary rights of others or having third parties infringe, misappropriate or circumvent the rights we own or license. We rely on a variety of intellectual property rights, including patents, copyrights, trademarks, trade secrets, technical know-how and other unpatented proprietary information to protect our products, product development and manufacturing activities from unauthorized copying by third parties.
Our patents do not cover all of our technologies, systems, products and product components and our competitors or others may design around our patented technologies. Some of our know-how or technology is not patented or patentable and may constitute trade secrets. To protect our trade secrets, we have a policy of requiring our employees, consultants, advisors and other collaborators who contribute to or access our material intellectual property to enter into invention assignment and confidentiality agreements. We also rely on customary contractual protections with our suppliers and customers, and we implement security measures intended to protect our trade secrets, know-how or other proprietary information. However, we cannot guarantee we have entered into appropriate agreements with all parties that have had access to our trade secrets, know-how or other proprietary information. We also cannot assure you that those agreements will provide meaningful protection for our trade secrets, know-how or other proprietary information in the event of any unauthorized use or disclosure. Our trade secrets, know-how or other proprietary information could be obtained by third parties as a result of breaches of our physical or electronic security systems or our suppliers, employees or consultants could assert rights to our intellectual property.
We have significant international operations and we are subject to foreign laws which differ in many respects from U.S. laws. Effective intellectual property protection may be unavailable or more limited in foreign jurisdictions in which we operate, such as China, relative to those protections available in the United States. Although we typically enter into invention assignment and confidentiality agreements with our employees who contribute to our material intellectual property to protect our proprietary information, our ability to enforce such agreements in foreign jurisdictions is uncertain. In the past, certain of our employees have been hired by our competitors. These former employees are contractually prohibited from misappropriating our confidential information, including trade secrets; however, we cannot be certain that such contractual obligations will be honored. While we monitor our competitors' activities for evidence of infringement of our proprietary rights, we cannot be certain that such infringement will be detected. If we pursue litigation to assert our intellectual property rights, an adverse decision in any legal action could limit our ability to assert our intellectual property rights, limit the value of our technology or otherwise materially adversely affect our business, financial condition or results of operations.
Monitoring unauthorized use of our intellectual property is difficult and costly. Unauthorized use of our intellectual property may have already occurred or may occur in the future. The steps that we take to acquire ownership of our employees' inventions and trade secrets in foreign countries may not have been effective under all such local laws, which could expose us to potential claims
13
or the inability to protect intellectual property developed by our employees. Furthermore, any changes in, or unexpected interpretations of, the trade secret and other intellectual property laws in any country in which we operate may materially adversely affect our ability to enforce our trade secret and intellectual property positions. Our failure to identify unauthorized use or otherwise adequately protect our intellectual property could jeopardize our competitive advantage and materially adversely affect our business. Moreover, any litigation in connection with unauthorized use of our intellectual property could be time consuming, and we could be forced to incur significant costs and divert our attention and the efforts of our employees, which could, in turn, result in lower revenues and higher expenses, and we may not be successful in enforcing our intellectual property rights.
Intellectual property claims could result in costly litigation and harm our business.
There has been significant litigation involving intellectual property rights in many technology-based industries, including our own. We continue to face risks and uncertainties in connection with any patent litigation, including the risk that patents issued to others may harm our ability to do business; that there could be existing patents of which we are unaware that could be pertinent to our business; and that it is not possible for us to know whether there are patent applications pending that our products might infringe upon, since patent applications often are not disclosed until a patent is issued or published. Moreover, the frequency with which new patents are granted and the diversity of jurisdictions in which they are granted make it impractical and expensive for us to monitor all patents that may be relevant to our business.
From time to time, we have been notified of allegations and claims that we may be infringing patents or otherwise violating intellectual property rights owned by third parties. In the future, we may be a party to litigation as a result of an alleged infringement, misappropriation, or other violation of others' intellectual property, whether through direct claims or by way of indemnification claims of our customers or suppliers. If any pending or future intellectual property-related litigation proceedings result in an adverse outcome then we could be required to:
• | cease the manufacture, use or sale of the infringing products, processes or technology; |
• | pay substantial damages for infringement; |
• | expend significant resources to develop non-infringing products, processes or technology; |
• | license technology from the party claiming infringement, which license may not be available on commercially reasonable terms, or at all; |
• | cross-license our technology to a competitor to resolve an infringement claim, which could weaken our ability to compete with that competitor; or |
• | pay substantial damages to our direct or indirect customers to cause our end users to discontinue their use of, or replace, infringing products with non-infringing products. |
In addition, intellectual property lawsuits can be brought by third parties against our customers and end-users that incorporate our products into their systems or processes. Because we generally indemnify customers against third-party infringement claims relating to our products, we may incur liabilities in connection with lawsuits against our customers. Any such lawsuits, whether or not they have merit, could be time-consuming to defend, damage our reputation and result in substantial and unanticipated costs.
Having to defend any such lawsuits, and any adverse consequences that might arise, could materially adversely affect our business, financial condition, results of operations and growth prospects.
If we are unable to develop new products, applications and end markets for our high-performance lasers and increase our market share in existing applications, our business, financial condition, results of operations and growth prospects will be materially adversely affected.
Any future success will depend in part on our ability to continue to generate sales of semiconductor lasers and fiber lasers in applications where legacy lasers have been used, or in new and developing markets and applications for lasers where they have not been used previously. As semiconductor and fiber lasers reach higher levels of penetration in core materials processing applications, the development of new applications, end markets and products outside our core applications becomes more important to our growth.
Our current and potential customers may have substantial investment in, and know-how related to, their existing laser and non-laser technologies. They may perceive risks relating to the reliability, quality, usefulness and profitability of integrating semiconductor lasers or fiber lasers in their systems when compared to other laser or non-laser technologies available in the market or that they manufacture themselves. Although we believe that semiconductor lasers and fiber lasers generally exhibit superior performance compared to other lasers or tools, customers may be reluctant to change from incumbent suppliers or cease using their own solutions, or we may miss the design and procurement cycles of our customers. Many of our target markets, such as Industrial and Aerospace and Defense, have historically been slow to adopt new technologies. These markets often require long testing and qualification periods or lengthy government approval processes before adopting new technologies.
14
Introduction of new products and product enhancements will require that we effectively transfer production processes from research and development to manufacturing and coordinate our efforts with those of our suppliers to achieve increased production volume rapidly. If we are unable to implement our strategy to develop new applications and end markets for our products or develop new products, our business, financial condition, results of operations and growth prospects could be materially adversely affected. In addition, any newly developed or enhanced products may not achieve market acceptance or may be rendered obsolete or less competitive by the introduction of new products by other companies.
Fluctuations in our quarterly results of operations may increase the volatility of our stock price and may be difficult to predict.
We have experienced, and expect to continue to experience, fluctuations in our quarterly results of operations. We believe that fluctuations in quarterly results may cause the market price of our common stock to increase or decrease, perhaps substantially. Factors which have had or may in the future have an influence on our results of operations in a particular quarter include:
• | the increase, decrease, cancellation or rescheduling of significant customer orders; |
• | declines in selling prices for our products; |
• | government-mandated quarantines or closures applicable to our facilities or the facilities of our customers or suppliers; |
• | delays in our product-shipment timing, obtaining licenses or other import/export approvals, customer or end-user sales or deployment cycles, or work performed under development contracts; |
• | seasonality attributable to different purchasing patterns and levels of activity throughout the year in the areas where we operate; |
• | the impact of the COVID-19 outbreak and other public health crises on our sales and operations; |
• | the impact of new acquisitions and the success of our integration efforts; |
• | the timing of revenue recognition based on the installation or acceptance of certain products shipped to our customers; |
• | timing variability in product introductions, enhancements, services and technologies by us and our competitors and market acceptance of these new or enhanced products, services and technologies; |
• | different capital expenditure and budget cycles for our customers, which affect the timing of their spending; |
• | our ability to obtain export licenses for our products on a timely basis or at all; |
• | changes in tariffs imposed by the U.S., China and other foreign governments; |
• | the rate at which our present and future customers and end users adopt our technologies; |
• | the gain or loss of a key customer; |
• | product or customer mix; |
• | competitive pricing pressures and new market entrants; |
• | our ability to design, manufacture and introduce new products on a cost-effective and timely basis; |
• | our ability to manage our inventory levels and any write-downs for excess or obsolete inventory; |
• | our ability to collect outstanding accounts receivable balances; |
• | changes in the amount and timing of our operating costs, including those related to the expansion of our business, operations and infrastructure; |
• | impairment of values for goodwill, intangibles and other long-lived assets; |
• | foreign currency fluctuations; |
• | changes in jurisdictional income mix and tax rules and regulations in countries where we operate; and |
• | economic and market conditions in a particular geography or country. |
A substantial portion of our operating expenses are fixed for the short-term, and as a result, fluctuations in revenues or unanticipated expenses can have a material and immediate impact on our profitability. In addition, we often recognize a substantial portion of our revenues in the last month of each fiscal quarter. Our expenses for any given quarter are typically based on expected revenues, and if revenues are below expectations in any given quarter, the adverse impact of the shortfall on our results of operations may be magnified by our inability to adjust spending quickly enough to compensate for the shortfall. We also base our manufacturing on our forecasted product mix for the quarter. If the actual product mix varies significantly from our forecast, we may not be able to fill some orders during that quarter, which would result in delays in the shipment of our products. Accordingly, variations in timing of sales, particularly for our higher priced, higher margin products, can cause significant fluctuations in quarterly results of operations.
Due to these and other factors, particularly varying product mix from quarter to quarter, we believe that quarter-to-quarter and year-to-year comparisons of our historical results of operations may not be meaningful. You should not rely on our results for any quarter or year as an indication of our future performance. Our results of operations in future quarters and years may be below public market analysts' or investors' expectations, which would likely cause the price of our stock to fall, perhaps significantly. In addition, over the past several years, U.S. and global equity markets have experienced significant price and volume fluctuations that have affected the stock prices of many technology companies both in and outside our industry. There has not always been a direct correlation between this volatility and the performance of particular companies subject to these stock price fluctuations. These factors, as well as general economic and political conditions or investors' concerns regarding the credibility of corporate
15
financial statements, may materially adversely affect the market price of our stock in the future.
Products in the laser industry are experiencing declining average selling prices, and any future success depends in part on our ability to increase our volumes and decrease our costs to offset potential declines in the average selling prices of our products.
Products in the laser industries generally, and our products specifically, are experiencing and may in the future continue to experience a significant decline in average selling prices, or ASPs, on maturing products as a result of increased competition and price pressures from customers. As competing products become more widely available, the ASPs of our products may decrease. Due to the fixed cost of production, the average cost per unit of our products typically declines as our production volumes rise. For this reason, we may decide to offer products at ASPs that result in low initial gross margins to us with an intention to drive sales and production volumes higher, in turn lowering our average cost per unit. Because of these factors, we have experienced and we may continue to experience fluctuations in our results of operations on a quarterly or annual basis. If the ASPs of our products decline and we are unable to increase our unit volumes, introduce new or enhanced products with higher ASPs or reduce manufacturing costs to offset anticipated decreases in the prices of our existing products, our gross margins could decline, which in turn could materially adversely affect our business, financial condition, results of operations and growth prospects.
We participate in markets that are subject to rapid technological change and require significant research and development expenses to develop and maintain products that are able to achieve market acceptance.
The markets for our products are characterized by rapid technological change, frequent product introductions, substantial capital investment, volatility of product supply and demand, changing customer requirements and evolving industry standards. Our future performance will depend in part on the successful development, introduction and market acceptance of new and enhanced products that address these changes as well as current and potential customer requirements. We expect that new technologies will emerge as competition and our customers' need for higher and more cost-effective tools increase. The introduction of new and enhanced products may cause our customers to defer or cancel orders for existing products. To the extent customers defer or cancel orders for existing products due to a slowdown in demand or in the expectation of a new product release, or if there is any delay in development or introduction of our new products or enhancements of our products, our business, financial condition, results of operations and growth prospects would be materially adversely affected. We also may not be able to develop the underlying core technologies necessary to create new products and enhancements, or to license these technologies from third parties. Product development delays may result from numerous factors, including:
• | changing product specifications and customer requirements; |
• | unanticipated engineering complexities; |
• | expense reduction measures we have implemented, and others we may implement, to conserve our cash and attempt to sustain profitability; |
• | difficulties in hiring and retaining necessary technical personnel; |
• | difficulties in reallocating engineering resources and overcoming resource limitations; and |
• | changing market or competitive product requirements. |
The development of new, technologically advanced products is a complex and uncertain process that requires the accurate prediction of technological and market trends, as well as the investment of significant research and development expenses. Further, we typically invest substantial resources in advance of material sales of our products to our customers. Our research and development costs were $28.1 million and $21.1 million for the year ended December 31, 2019 and 2018, respectively. We cannot assure you that our expenditures for research and development will result in the introduction of new products or, if such products are introduced, that those products will achieve sufficient market acceptance or generate revenues to offset the costs of development. Ramping of production capacity also entails risks of delays which can limit our ability to realize the full benefit of the new product introduction. We cannot assure you that we will be able to identify, develop, manufacture, market or support new or enhanced products successfully, if at all, or on a timely basis. Further, we cannot assure you that our new products will gain market acceptance or that we will be able to respond effectively to product announcements by competitors, technological changes or emerging industry standards. Many of these factors are beyond our control. Any failure to respond to technological change would materially adversely affect our business, financial condition, results of operations and growth prospects.
Additionally, our product offerings may become obsolete given the frequent introduction of alternative technologies. In the event either our customers or our products fail to gain and maintain market acceptance, it would likely materially adversely affect our business, financial condition, results of operations and growth prospects.
Reliance on customers in the aerospace and defense industry for a significant portion of our revenues could materially adversely affect our business, financial condition, results of operations and growth prospects.
For the year ended December 31, 2019 and 2018, we derived approximately 24% and 18%, respectively, of our revenues from customers in the Aerospace and Defense industry. From time to time, we have experienced declining aerospace and defense-related
16
revenues. The Aerospace and Defense market is largely dependent upon government budgets, in particular defense budgets, which are driven by numerous factors, including geopolitical events, macroeconomic conditions and the ability of the U.S. government to enact relevant legislation. As a result, our future revenues are subject in part to the uncertainties of governmental budgeting and appropriations and national defense policies and priorities, constraints of the budgetary process and timing and potential changes to these policies and priorities. Future spending levels are subject to a wide range of outcomes, depending on Congressional action, all of which are beyond our control. Moreover, no assurance can be given that an increase in defense spending will be allocated to programs that would benefit our business.
Many of our customers in the defense industry are subcontractors that must negotiate our proposals with the U.S. government. Our continuing relationship and the ability of these customers to pay for our products is dependent on the U.S. government's decision to accept or reject our customers' terms, which can be delayed for a substantial period of time and is largely outside of our control. Such delays could result in decreased revenues and could materially adversely harm our results of operations in any given period.
Our agreements with the U.S. government and suppliers to the U.S. government subject us to unique risks.
We must comply with and are affected by laws and regulations relating to the award, administration and performance of U.S. government contracts. The U.S. government contracting party may require us to increase production of certain solutions sold to the U.S. government due to changes in U.S. national security strategy and/or priorities or other reasons, in which case we may be required to decrease production of other products or sales to other customers to meet the requirements of the U.S. government. In addition, the U.S. government routinely retains rights to intellectual property developed in connection with a government contract. The U.S. government could exercise these rights in certain circumstances in the future, which could have the effect of decreasing the benefit we are able to realize commercially from such intellectual property.
U.S. government agencies, including the Defense Contract Audit Agency, the Defense Contract Management Agency and various agency Inspectors General, routinely audit and investigate government contractors. These agencies review a contractor's performance under its contracts, its cost structure, its business systems and compliance with applicable laws, regulations and standards. The U.S. government has the ability to decrease or withhold certain payments when it deems systems subject to its review to be inadequate. Additionally, any costs found to be misclassified may be subject to repayment. We have unaudited and unsettled incurred cost claims related to past years, which places risk on our ability to issue final billings on contracts for which authorized and appropriated funds may be expiring.
If an audit or investigation uncovers improper or illegal activities, we may be subject to civil or criminal penalties and administrative sanctions, including reductions of the value of contracts, contract modifications or terminations, forfeiture of profits, suspension of payments, penalties, fines and suspension, or prohibition from doing business with the U.S. government. In addition, we could suffer serious reputational harm if allegations of impropriety were made against us. Similar government oversight exists in most other countries where we conduct business. Any such imposition of penalties, or the loss of such government contracts, could materially adversely affect our business, financial condition, results of operations and growth prospects.
We are exposed to foreign currency risk, which may materially adversely affect our revenues, cost of revenues and operating margins and could result in exchange losses.
We conduct our business and incur costs in the local currency of most countries in which we operate. For the year ended December 31, 2019 and 2018, our revenues outside North America represented approximately 62% and 63%, respectively, of our revenues. We incur currency transaction risk whenever one or more of our operating subsidiaries enter into a transaction using currencies different than their functional currency. Changes in exchange rates can also affect our results of operations when the value of revenues and expenses of foreign subsidiaries are translated to U.S. dollars. We do not actively hedge our foreign currency exposure and we cannot accurately predict the impact of future exchange rate fluctuations on our results of operations. Further, given the volatility of exchange rates, we may not be able to effectively manage our currency risks, and any volatility in currency exchange rates may increase the price of our products in local currency to our foreign customers or increase the manufacturing cost of our products, which could decrease demand for our products in such markets. Any of the foregoing could materially adversely affect our business, financial condition, results of operations and growth prospects.
The long sales cycles for our products may cause us to incur significant expenses without offsetting revenues.
Our products represent a large investment for our customers and they typically expend significant effort in evaluating, testing and qualifying our products before making a decision to purchase them, resulting in a lengthy initial sales cycle. While our customers are evaluating our products and before they place an order with us, we may incur substantial sales and marketing and research and development expenses to customize our products to the customers’ needs. We may also expend significant management efforts, increase manufacturing capacity and order long lead-time components or materials prior to receiving an order. Even after this evaluation process, a potential customer may not purchase our products. As a result, these long sales cycles may cause us to incur
17
significant expenses without receiving revenues to offset such expenses soon thereafter or at all. This, in turn, can materially adversely affect our business, financial condition, our results of operations and growth prospects.
Because we lack long-term purchase commitments from our customers, our revenues can be difficult to predict, which could lead to excess or obsolete inventory and materially adversely affect our results of operations.
We generally do not enter into long-term agreements with our customers obligating them to purchase our products. Our business is characterized by short-term purchase orders and shipment schedules and, in some cases, orders may be canceled or delayed without penalty. As a result, it is difficult to forecast our revenues and to determine the appropriate levels of inventory required to meet future demand. This could lead to increased inventory levels and increased carrying costs and risk of excess or obsolete inventory due to unanticipated reductions in purchases by our customers. Write-downs have been recorded as a result of changes in demand or uncertainties related to the recoverability of the value of inventories due to technological and product changes. If we are unable to accurately forecast the demand for our products, fail to accurately forecast the timing of such demand, or are unable to consistently negotiate acceptable purchase order terms with customers, we could incur significant expenses, and our business, financial condition, results of operations and growth prospects may be materially adversely affected.
If we fail to effectively manage our growth or, alternatively, our spending during downturns, our business could be disrupted, which could materially adversely affect our results of operations.
Growth in revenues, combined with the challenges of managing geographically dispersed operations, can place a significant strain on our management systems and resources, and our anticipated growth in future operations could continue to place such a strain. The failure to effectively manage our growth could disrupt our business and materially adversely affect our results of operations. Our ability to successfully offer our products and implement our business plan in evolving markets requires an effective planning and management process. Even if executed successfully, our expansion may not deliver the anticipated increase in revenues and other benefits to compensate for the expenses incurred. This could materially adversely affect our business, financial condition, results of operations and growth prospects. In economic downturns, we must effectively manage our spending and operations to ensure that our competitive position during the downturn, as well as our future opportunities when the economy improves, remains intact. The failure to effectively manage our spending and operations could disrupt our business and materially adversely affect our results of operations.
Our estimates of market opportunity and forecasts of market growth may prove to be inaccurate, and even if the market in which we compete achieves the forecasted growth, our business could fail to grow at similar rates, if at all.
Our market opportunity estimates and growth forecasts are subject to significant uncertainty and are based on assumptions and estimates that may not prove to be accurate. Similarly, our estimates regarding the continued reduction in cost per brilliant watt and increase in power output of semiconductor lasers is based on assumptions and prior experience, and may not continue at the same rate, which could materially adversely affect the growth of high-power fiber lasers generally, and our growth specifically. Even if the markets in which we compete meet our size estimates and growth forecasts, and even if semiconductor lasers continue to become less expensive and more powerful, our business could fail to grow for a variety of reasons, which would adversely affect our results of operations.
We depend on internal production and outside single or limited-source suppliers for many of our key components and raw materials, including cutting-edge optics and materials. Any interruption in the supply of these key components and raw materials could materially adversely affect our business, financial condition, results of operations and growth prospects.
We rely exclusively on our own production capabilities to manufacture certain of our key components, such as semiconductor lasers, specialty optical fibers and optical components. Certain of our components, such as our semiconductor lasers, which are manufactured at our Vancouver, Washington facility, and our active fibers, which are manufactured at our Lohja, Finland facility, rely on processes and equipment that cannot be easily moved or replaced. If our manufacturing activities were obstructed or hampered significantly at these, or our other facilities, it could take a considerable length of time, at an increased cost, for us to resume manufacturing, which could materially harm our business and results of operations.
Also, we purchase certain raw materials and components, which are key elements to manufacture our products, from single- or limited-source suppliers. We generally do not have guaranteed supply arrangements with our suppliers. Some of our suppliers are relatively small private companies that may discontinue their operations at any time and may be particularly susceptible to prevailing economic conditions. Some of our suppliers are also our competitors. Our key suppliers may not have the ability to increase their production in line with our customers' demands. This can become acute during times of high growth in our customers' businesses. As a result, we experienced, and may in the future experience, longer lead times or delays in fulfillment of our orders. Furthermore, other than our current suppliers, there may be a limited number of entities from which we could obtain these supplies. We do not anticipate that we would be able to purchase these materials that we require in a short period of time or at the same cost from other sources in commercial quantities or that have our required performance specifications. In addition, if quality issues arise with
18
these outsourced materials and go undetected by us, the use of such defective materials in our products could compromise their quality and harm our reputation.
For certain long lead-time supplies or in order to lock in pricing, we may be obligated to place purchase orders which are not cancelable or otherwise assume liability for a large amount of the ordered supplies, which limits our ability to adjust down our inventory liability in the event of market downturns or other customer cancellations or rescheduling of their purchase orders for our products. Some of our products require designs and specifications which are at the cutting-edge of available technologies. Our and our customers' designs and specifications frequently change to meet rapidly evolving market demands. Accordingly, certain of our products require components and supplies which may be technologically difficult and unpredictable to manufacture. By their very nature, these types of components may only be available by a single supplier. These characteristics place further pressure on the timely delivery of such components. Any interruption or delay in the supply of any of these components or materials, or the inability to obtain these components and materials from alternate sources at acceptable prices and within a reasonable amount of time, could materially adversely affect our ability to meet customer orders. If our suppliers face financial or other difficulties, do not maintain sufficient inventory on hand or if there are significant changes in demand for the components and materials we obtain from them, they could limit the availability of these components and materials to us. Any of the foregoing could materially adversely affect our business, financial condition, results of operations and growth prospects.
We depend on our OEM customers and system integrators to incorporate our products into their systems.
Our revenues depend in part on our ability to maintain existing and secure new OEM customers. Our revenues also depend in part upon the ability of our current and potential OEM customers and system integrators to incorporate our products into their systems, and to sell such systems successfully. The commercial success of these systems depends to a substantial degree on the efforts of these OEM customers and system integrators to develop and market products that incorporate our technologies. Relationships and experience with traditional laser makers, limited marketing resources, reluctance to invest in research and development and other factors affecting these OEM customers and third-party system integrators could have a substantial impact upon demand for our products, and in turn upon our revenues and financial results. If OEM customers or integrators are not able to adapt existing tools or develop new systems to take advantage of the features and benefits of lasers, or if they perceive us to be an actual or potential competitor, then the opportunities to expand our revenues and increase our margins may be severely limited or delayed. In addition, some of our OEM customers are developing their own laser sources. If they are successful, this may reduce our revenues from these customers.
Failure to effectively maintain and expand our field service and support organization could materially adversely affect our business, financial condition, results of operations and growth prospects.
It is important for us to provide rapid, responsive service directly to our customers throughout the world and to maintain and expand our own personnel resources to provide these services. Any actual or perceived lack of adequate field service in the locations where we sell or try to sell our products may negatively impact our sales efforts and, consequently, our revenues. This requires us to recruit and train additional qualified field service and support personnel as well as maintain effective and highly trained organizations that can provide service to our customers in various countries. We may not be able to attract and train additional qualified personnel to expand our direct support operations successfully, in a cost-effective manner or at all. We also may not be able to find and engage additional qualified third-party resources to supplement and enhance our direct support operations. Further, we may incur significantly higher costs in providing these field and support services if competition for or unavailability of these services is limited. Failure to implement and manage our support operation effectively could materially adversely affect our relationships with our customers, as well as our business, financial condition, results of operations and growth prospects.
Our products could contain defects, which may reduce sales of those products, harm market acceptance of our high-performance laser products or result in claims against us.
The manufacture of our high-performance lasers involves highly complex and precise processes. Despite testing by us and our customers, errors have been found in our products and may be found in the future. In addition, some of our products are combined with products from other vendors, which may contain defects. As a result, should problems occur, it may be difficult to identify the source of the problem. Our products are typically sold with warranty provisions that require us to remedy deficiencies in quality or performance over a specified period of time at no cost to our customers. Reserves for estimated warranty claims are recorded during the period of sale. The determination of such reserves requires us to make estimates of failure rates and expected costs to repair or replace the products under warranty. We typically establish warranty reserves based on historical warranty costs for each product line. If actual return rates and/or repair and replacement costs differ significantly from our estimates, adjustments to cost of revenues may be required in future periods, which could materially adversely affect our results of operations. These defects may cause us to incur significant warranty, support and repair costs, incur additional costs related to a recall, divert the attention of our engineering personnel from our product development efforts and harm our relationships with our customers. These problems could result in, among other things, loss of revenues or a delay in revenue recognition, loss of market share, harm to our reputation
19
or a delay or loss of market acceptance of our laser products. Defects, integration issues or other performance problems in our products could also result in personal injury or financial or other damages to our customers, which in turn could damage market acceptance of our products. Our customers could also seek damages from us for their losses. A product liability claim brought against us, even if unsuccessful, could be time-consuming and costly to defend, and could harm our reputation. We cannot assure investors that our product liability insurance would adequately protect our assets from the financial impact of defending a product liability claim. Any product liability claim brought against us, with or without merit, could increase our product liability insurance rates or prevent us from securing insurance coverage in the future.
We may experience lower than expected manufacturing yields, which would adversely affect our gross margins.
The manufacture of semiconductor lasers and their packaging is a highly complex process. Manufacturers often encounter difficulties in achieving acceptable product yields from laser and packaging operations. We have from time to time experienced lower than anticipated manufacturing yields for our lasers. If we do not achieve planned yields, our product costs could increase, resulting in lower gross margins, and key component availability would decrease, which could result in delays in fulfilling customer orders or rolling out new product lines.
A breach of our information technology and security systems could materially adversely affect our business.
We use information technology and security systems to maintain our facility's physical security and to protect proprietary and confidential information, including that of our customers, suppliers and employees. Accidental or willful security breaches or other unauthorized access to our facilities or information systems, or viruses, loggers, or other malfeasant code in our data or software, could compromise this information. The consequences of such loss and possible misuse of our proprietary and confidential information could include, among other things, unfavorable publicity, damage to our reputation, difficulty marketing our products, customer allegations of breach-of-contract, litigation by affected parties and possible financial liabilities for damages, any of which could materially adversely affect our business, financial condition, reputation and relationships with customers and partners. We also rely on a number of third-party "cloud-based" providers of corporate infrastructure services relating to, among other things, human resources, electronic communication services and some financial functions, and we are therefore dependent on the security systems of these providers. Any security breaches or other unauthorized access to our service-providers' systems or viruses, loggers or other malfeasant code in their data or software could expose us to information loss and misappropriation of confidential information. Because the techniques used to obtain unauthorized access to or sabotage security systems change frequently and are often not recognized until after an attack, we may be unable to anticipate the techniques or implement adequate preventative measures, thereby exposing us to material adverse effects on our business, financial condition, results of operations and growth prospects.
Our business could be materially adversely affected if one or more members of our executive management team or key personnel departed.
Any future success is substantially dependent on the continued contributions of our executive officers, including Scott Keeney, our chairman of the board, president and chief executive officer. We are also dependent on key technologists, and other key engineering, sales, marketing, manufacturing and support personnel, any of whom may leave, which could harm our business and reputation in the market. Our business requires engineering staff with experience in several disciplines, including semiconductor physics, chemistry, material science, electrical engineering, optical engineering, and mechanical engineering. We will need to continue to recruit and retain highly skilled engineers for certain functions.
Any future success also depends in part on our ability to identify, attract, hire, train, retain and motivate highly skilled research and development, managerial, operations, sales, marketing and customer service personnel. We are continually recruiting such personnel. However, competition for such personnel can be strong and we can provide no assurance that we will be successful in attracting or retaining such personnel now or in the future. In addition, particularly in the high-technology industry, the value of stock options, restricted stock units, grants or other share-based compensation is an important element in the retention of employees. Declines in the value of our common stock could materially adversely affect our ability to retain employees and we may have to take additional steps to make the equity component of our compensation packages more appealing to attract and retain employees. These steps could result in dilution to stockholders.
If we fail to attract, integrate and retain the necessary personnel, our ability to extend and maintain our scientific expertise and grow our business could suffer significantly. The loss of any key employee, the failure of any key employee to adequately perform in his or her current position, our inability to attract, train and retain skilled employees as needed or the inability of our key employees to expand, train and manage our employee base as needed, could materially adversely affect our business, financial condition, results of operations and growth prospects.
We are subject to regulatory compliance requirements, including Section 404 of the Sarbanes-Oxley Act of 2002. If we fail to maintain an effective system of internal controls we may not be able to accurately report our consolidated financial results or
20
prevent fraud.
We are subject to the SEC's rules implementing Sections 302 and 404 of the Sarbanes-Oxley Act, which require management to certify financial and other information in our quarterly and annual reports and provide an annual management report on the effectiveness of internal controls over financial reporting. However, our independent registered public accounting firm will not be required to report on the effectiveness of our internal control over financial reporting pursuant to Section 404 of the Sarbanes-Oxley Act until the date we are no longer an "emerging growth company" as defined in the JOBS Act. Effective internal controls are necessary for us to provide reliable financial reports and prevent fraud.
Our testing of key controls over financial reporting, or the subsequent testing by our independent registered public accounting firm once required under the Sarbanes-Oxley Act, may reveal deficiencies in our internal control over financial reporting that are deemed to be material weaknesses. If we are not able to comply with the requirements of Section 404 in a timely manner, or if we or our independent registered public accounting firm identify deficiencies in our internal control over financial reporting that are deemed to be material weaknesses, the market price of our stock would likely decline and we could be subject to lawsuits, sanctions or investigations by regulatory authorities, which would require additional financial and management resources.
In addition, the Sarbanes-Oxley Act requirements may be modified, supplemented or amended from time to time. Implementing the changes may take significant time and may require additional employee compliance training. We or our independent registered public accounting firm may discover internal controls that need improvement. A discovery of a material weakness, even if quickly remedied, could reduce the market’s confidence in our financial statements and harm our stock price. Any inability to provide reliable financial reports or prevent fraud could harm our business. We cannot assure you that we will be able to fully comply with the requirements of the Sarbanes-Oxley Act or that management or our independent registered public accounting firm will conclude that our internal controls are effective in future periods. Irrespective of compliance with Section 404, any failure of our internal controls could have a material adverse effect on our stated operating results and harm our reputation.
In addition, we are subject to the reporting requirements of the Exchange Act, the listing requirements of the Nasdaq Stock Market, and other applicable securities rules and regulations. As a consequence, and particularly after we cease to be an "emerging growth company," we expect to continue to incur legal, accounting and other expenses. We also anticipate that we will continue to incur costs associated with corporate governance requirements, including requirements of the SEC and the Nasdaq Stock Market. We expect these rules and regulations to increase our legal and financial compliance costs and to make some activities more time-consuming and costly. We also expect that these rules and regulations may make it more difficult and more expensive for us to obtain director and officer liability insurance and we may be required to accept reduced policy limits and coverage or incur substantially higher costs to obtain the same or similar coverage. As a result, it may be more difficult for us to attract and retain qualified individuals to serve on our Board of Directors or as executive officers. We are currently evaluating and monitoring developments with respect to these rules, and we cannot predict or estimate the amount of additional costs we may incur or the timing of such costs.
Our operations are conducted in a limited number of locations. Any disruption at our facilities could delay revenues or increase our expenses.
An earthquake, fire, flood or other natural or manmade disaster could disable our facilities, disrupt operations or cause catastrophic losses. Our major manufacturing and research and development facilities are located in Vancouver, Washington; Hillsboro, Oregon; Longmont, Colorado; Shanghai, China; and Lohja, Finland. Some of our facilities, such as our headquarters and key manufacturing and development facilities in Vancouver, Washington, are located in areas with a known history of seismic and volcanic activity. We also have facilities in areas with a known history of flooding, such as our location in Shanghai, China, and there is a risk of flooding and snowstorms at our location in Lohja, Finland. A loss at any of these or other of our or our suppliers' facilities could disrupt operations, delay production and shipments, reduce revenues and generate potentially significant expenses to repair or replace damaged facilities. The insurance we maintain against earthquakes, floods and other natural or manmade disasters may not be adequate to cover our losses in any particular case.
We are subject to governmental export and import controls that could subject us to liability or impair our ability to compete in international markets.
The U.S. and various foreign governments have imposed controls, export license requirements and restrictions on the import or export of certain products, technologies and software. We must export our products in compliance with U.S. export controls, including the Commerce Department's Export Administration Regulations, the State Department's International Traffic in Arms Regulations, or ITAR, and various economic and trade sanctions established by the Treasury Department's Office of Foreign Assets Controls. We may not always be successful in obtaining necessary export licenses, and our failure to obtain required import or export approval for our products or limitations on our ability to export or sell our products imposed by these laws may harm our
21
international and domestic revenues. Noncompliance with these laws could have negative consequences, including government investigations, penalties and reputational harm.
In addition, compliance with the directives of the Directorate of Defense Trade Controls, or DDTC, may result in substantial expenses and diversion of management attention. Any failure to adequately address the directives of DDTC could result in civil fines or suspension or loss of our export privileges, any of which could materially adversely affect our business, financial condition, results of operations and growth prospects.
Changes in our products or changes in export, import and economic sanctions laws and regulations may delay our introduction of new products in international markets, prevent our customers from deploying our products internationally or, in some cases, prevent the export or import of our products to or from certain countries altogether. In addition to the tariffs imposed by the U.S. Government on certain items imported from China, it is possible that additional sanctions or restrictions may be imposed by the United States on items imported into the United States from China. Similarly, in addition to the tariffs imposed by China on certain items imported from the United States, it is possible that additional sanctions or restrictions may be imposed by China on items imported into China from the United States. Any such measures could further adversely affect our ability to sell our products to existing or potential customers and harm our ability to compete internationally and grow our business. Any change in export or import regulations or legislation, shift or change in enforcement, or change in the countries, persons or technologies targeted by these regulations, could result in decreased use of our products by, or in our decreased ability to export or sell our products to, existing or potential customers with international operations. In such event, our business, financial condition, results of operations and growth prospects could be materially adversely affected.
We are subject to anti-corruption, anti-bribery, anti-money laundering and similar laws, and non-compliance with such laws can subject us to criminal penalties or significant fines and harm our business and reputation.
We are subject to anti-corruption and anti-bribery and similar laws, such as the U.S. Foreign Corrupt Practices Act of 1977, as amended, or the FCPA, the U.S. domestic bribery statute contained in 18 U.S.C. § 201, the U.S. Travel Act, the USA PATRIOT Act, the U.K. Bribery Act 2010, the Proceeds of Crime Act 2002 and possibly other anti-corruption, anti-bribery and anti-money laundering laws in countries in which we conduct activities. Anti-corruption and anti-bribery laws have been enforced aggressively in recent years and are interpreted broadly and prohibit companies and their employees and agents from promising, authorizing, making, offering, soliciting or accepting improper payments or other benefits to or from government officials and others in the public and private sectors. We can be held liable for the corrupt or other illegal activities of our employees, representatives, contractors, business partners and agents, even if we do not explicitly authorize or have actual knowledge of such activities. China also strictly prohibits bribery of government officials and commercial bribery. Our operations in China create the risk of unauthorized payments or offers of payments by our employees, consultants, sales agents or distributors, even though they may not always be subject to our control.
While we have policies and procedures in this area, we cannot guarantee that improprieties committed by our employees or third parties will not occur. Noncompliance with these laws could subject us to investigations, sanctions, settlements, prosecution, other enforcement actions, disgorgement of profits, significant fines, damages, other civil and criminal penalties or injunctions, suspension or debarment from contracting with certain persons, the loss of export privileges, whistleblower complaints, reputational harm, adverse media coverage and other collateral consequences. If any subpoenas or investigations are launched, or governmental or other sanctions are imposed, or if we do not prevail in any possible civil or criminal litigation, our business, financial condition, results of operations and growth prospects could be materially adversely affected. In addition, responding to any action will likely result in a materially significant diversion of management's attention and resources and significant defense and compliance costs and other professional fees. In certain cases, enforcement authorities may even require us to appoint an independent compliance monitor, which can result in added costs and administrative burdens. Any investigations, actions or sanctions or other previously mentioned harm could materially adversely affect our business, financial condition, results of operations and growth prospects.
Changes in U.S. or foreign tax law may materially adversely affect our business, financial condition, results of operations and growth prospects.
The Tax Cuts and Jobs Act, or 2017 Tax Act, brought about extensive changes to the U.S. corporate tax system. The 2017 Tax Act includes changes that reduce U.S. corporate tax rates, change how U.S. multinational corporations, like us, are taxed on international earnings, repeal domestic manufacturing deduction, accelerate tax revenue recognition, allow capitalization of research and development expenditures, place additional limitations on executive compensation and limitations on the deductibility of interest. Due to the large and expanding scale of our international business activities, any changes in the U.S. or foreign taxation of such activities may increase our worldwide effective tax rate and the amount of taxes we pay and seriously harm our business.
Additionally, under the applicable laws and regulations in China, arrangements and transactions among related parties may be subject to audit or challenge by the Chinese tax authorities. We would be subject to adverse tax consequences if the Chinese tax
22
authorities were to determine that the transactions with or between our subsidiaries were not executed on an arm's-length basis, and as a result the Chinese tax authorities could require that our Chinese subsidiaries adjust their taxable income upward for Chinese tax purposes. Such an adjustment could materially adversely affect us by increasing our tax expenses.
We regularly assess the likelihood of favorable or unfavorable outcomes resulting from these examinations to determine the adequacy of our provision for income taxes. Although we believe our tax estimates are reasonable, there can be no assurance that any final determination will not be materially different than the treatment reflected in our historical income tax provisions and accruals, which could materially adversely affect our business, financial condition, results of operations and growth prospects.
We could be subject to additional income tax liabilities.
We are subject to income taxes in the United States and certain other foreign jurisdictions. Judgment is required in evaluating our worldwide provision for income taxes. During the ordinary course of business, there are many transactions for which the ultimate tax determination is uncertain. For example, our effective tax rates could be adversely affected by earnings being lower than anticipated in countries where we have lower statutory rates and higher than anticipated in countries where we have higher statutory rates, by changes in foreign currency exchange rates, by changes in the valuation of our deferred tax assets and liabilities, or by changes in the relevant tax, accounting and other laws, regulations, principles and interpretations. We are subject to audit in various jurisdictions, and such jurisdictions may assess additional income tax against us. Although we believe our tax estimates are reasonable, the final determination of tax audits and any related litigation could be materially different from our historical income tax provisions and accruals. The results of an audit or litigation could have a material adverse effect on our operating results or cash flows in the period or periods for which that determination is made.
Our international operations subject us to potential adverse tax consequences.
We generally conduct our international operations through wholly-owned subsidiaries and report our taxable income in various jurisdictions worldwide based upon our business operations in those jurisdictions. Our intercompany relationships are subject to complex transfer pricing regulations administered by taxing authorities in various jurisdictions. The relevant taxing authorities may disagree with our determinations as to the income and expenses attributable to specific jurisdictions. If such a disagreement were to occur, and our position was not sustained, we could be required to pay additional taxes, interest and penalties, which could result in one-time tax charges, higher effective tax rates, reduced cash flows and lower overall profitability of our operations. We believe that our financial statements reflect adequate reserves to cover such a contingency, but there can be no assurances in that regard.
Our reported financial results may be materially adversely affected by changes in accounting principles generally accepted in the United States.
Generally accepted accounting principles in the United States, or GAAP, are subject to interpretation by the Financial Accounting Standards Board, or FASB, the SEC, and various bodies formed to promulgate and interpret appropriate accounting principles. A change in these principles or interpretations could have a significant effect on our reported financial results, and could affect the reporting of transactions completed before the announcement of a change.
In particular, in February 2016 the FASB issued ASU No. 2016‑02, Leases (Topic 842). ASU 2016‑02 requires a lessee to recognize a right of use asset and a lease liability for virtually all leases, other than leases that meet the definition of short‑term. The standard is effective for annual reporting periods of emerging growth companies beginning after December 15, 2019. We expect to implement the provisions of ASU 2016‑02, as amended, as of January 1, 2020. We are currently evaluating the impact of this ASU, as amended, and cannot reasonably estimate the quantitative impact on the financial statements.
We are subject to various environmental laws and regulations that could impose substantial costs upon us and may materially adversely affect our business, financial condition, results of operations and growth prospects.
We are subject to a variety of federal, state, local and foreign environmental regulations relating to the use, storage, discharge and disposal of hazardous chemicals used during our manufacturing process or requiring design changes or recycling of products we manufacture. We could incur costs, fines and civil or criminal sanctions, third-party property damage or personal injury claims, or could be required to incur substantial investigation or remediation costs, if we were to violate or become liable under environmental laws. Liability under environmental laws can be joint and several and without regard to comparative fault. Compliance with current or future environmental laws and regulations could restrict our ability to expand our facilities or require us to acquire additional expensive equipment, modify our manufacturing processes or incur other significant expenses in order to remain in compliance with such laws and regulations. At this time, we do not believe the costs to maintain compliance with current environmental laws to be material. If such costs were to become material in the future, whether due to unanticipated changes in environmental laws or their interpretations, unanticipated changes in our operations or other unanticipated changes, we may be required to dedicate additional staff or financial resources in order to maintain compliance. There can be no assurance that violations
23
of environmental laws or regulations will not occur in the future as a result of the lack of, or failure to obtain, permits, human error, accident, equipment failure or other causes.
Results of future litigation could materially adversely affect our business, financial condition, results of operations and growth prospects.
From time to time, we have been subject to litigation. The outcome of any litigation, regardless of its merits, is inherently uncertain. Future litigation could result in significant damages payable by us, and could harm our reputation. Even if we are successful in our defense, such litigation could still result in a diversion of management's attention and our resources and we may be required to incur significant expenses defending against these claims. We cannot predict our future commitments with respect to any matters encountered in the future, or their eventual outcome. Where we can make a reasonable estimate of the liability relating to pending litigation and determine that it is probable, we record a related liability. As additional information becomes available, we assess the potential liability and revise estimates as appropriate. However, because of uncertainties relating to litigation, the amount of our estimates could be wrong. Any adverse determination related to litigation could require us to change our technology or our business practices, pay monetary damages or fines, or enter into royalty or licensing arrangements, which could materially adversely affect our cash flows, harm our reputation, or otherwise materially adversely affect our business, financial condition, results of operations and growth prospects.
The outcome of any government inquiries and investigations involving our business is unpredictable and an adverse decision in any such matter could materially adversely affect our business, financial condition, results of operations and growth prospects.
We have been involved in certain disputes and have also received requests for information from government authorities. For example, we entered into a civil settlement agreement with the U.S. Department of Justice in March 2015 concerning a matter related to our eligibility for certain contracts awarded to us under the Small Business Innovation Research, or SBIR, Program. We have also received information requests from the Criminal Division of the U.S. Attorney's Office related to our SBIR eligibility and the Criminal Division has interviewed certain of our current and past employees. We have responded to the U.S. Attorney's requests with a production of documents. Although we have not received further inquiries from the Criminal Division since 2015, the Criminal Division has contacted certain of our former employees as recently as June 2017 and the inquiry may be ongoing, and we do not know when it will conclude or whether the Criminal Division will pursue claims against us or our employees. If the Criminal Division or a federal court determines that we or our employees are criminally liable, our business, financial condition, results of operations and growth prospects could be materially adversely affected.
Our growth is dependent, in part, on the successful integration of acquired businesses. Future acquisitions could result in operating difficulties and may materially adversely affect our business, financial condition, results of operations and growth prospects.
On November 14, 2019, we acquired Nutronics, Inc. The successful integration of Nutronics depends on the realization of anticipated efficiencies and synergies. If we are unable to successfully integrate Nutronics, or realize growth, synergies and efficiencies that were expected when determining the transaction consideration, then goodwill and other intangible assets acquired may be considered impaired and result in an adverse impact on our business, financial condition, results of operations and growth prospects.
We have evaluated, and expect to continue evaluating, other potential strategic transactions, and we may pursue one or more transactions, including acquisitions. We have limited experience executing acquisitions. Integrating an acquired company, business or technology may create unforeseen operating difficulties and expenditures. If we fail to successfully integrate our acquisitions, or the people or technologies associated with those acquisitions, into our company, the results of operations of the combined company could be adversely affected. Any integration process will require significant time and resources, require significant attention from management, and disrupt the ordinary functioning of our business, and we may not be able to manage the process successfully, which could adversely affect our business, results of operations, and financial condition.
We may have to pay cash, incur debt, or issue equity securities to pay for any such acquisition, each of which could affect our financial condition or the value of our capital stock. The sale of equity to finance any such acquisitions could result in dilution to our stockholders. If we incur more debt, it would result in increased fixed obligations and could also subject us to covenants or other restrictions that would impede our ability to flexibly operate our business.
Our debt obligations contain restrictions that impact our business and expose us to risks that could materially adversely affect our liquidity and financial condition.
24
In September 2018, we entered into an amended and restated loan facility, or loan facility, with Pacific Western Bank, as lender. This loan facility, as amended in November 2019, imposes certain covenants and restrictions on our business and our ability to obtain additional financing. As of December 31, 2019, we had no outstanding principal amount under the revolving loan facility.
Among other things, our loan facility requires the lender's consent to:
• | merge or consolidate; |
• | sell or transfer assets outside the ordinary course of business; |
• | make certain types of investments and capital expenditures; |
• | incur additional indebtedness or guarantee indebtedness of others; |
• | pay dividends, redeem or repurchase our capital stock; |
• | enter into transactions with affiliates outside the ordinary course of business; and |
• | create liens on our assets. |
Our loan facility also contains affirmative covenants, including a maximum capital expenditures covenant, determined in relation to our Adjusted EBITDA for the quarter, in the event our total cash reserves fall below a certain threshold. The facility contains events of default, including, among others, non-payment defaults, inaccuracy of representations and warranties, covenant defaults, cross-defaults to other indebtedness, judgment defaults, bankruptcy and insolvency defaults and a change of control default.
If we experience a decline in cash flow due to any of the factors described in this "Risk Factors" section or otherwise, we could have difficulty paying interest due and principal amounts outstanding in the future, and meeting the financial covenants set forth in our loan facility. If we are unable to generate sufficient cash flow or otherwise obtain the funds necessary to make required payments under our loan facility, or if we fail to comply with the requirements of our indebtedness, we could default under our loan facility. Any default that is not cured or waived could result in the acceleration of the obligations under the loan facility, an increase in the applicable interest rate under the loan facility, and would permit our lender to exercise remedies with respect to all of the collateral that is securing the loan facility, which includes substantially all of our assets. Any such default could materially adversely affect our liquidity and financial condition.
Even if we comply with all of the applicable covenants, the restrictions on the conduct of our business could materially adversely affect our business by, among other things, limiting our ability to take advantage of financings, mergers, acquisitions and other corporate opportunities that may be beneficial to the business. Even if the loan facility were terminated, additional debt we could incur in the future may subject us to similar or additional covenants, which could place restrictions on the operation of our business.
Our ability to use net operating losses to offset future taxable income may be limited.
As of December 31, 2019, we had U.S. federal and state net operating loss carryforwards, or NOLs, of $95.8 million and $14.0 million, respectively, and federal and state research development credit carryforwards of $5.9 million and $13.0 thousand, respectively, which we may use to reduce future taxable income or offset income taxes due. The NOLs and credit carryforwards start expiring in 2023 and 2020, respectively. Insufficient future taxable income will adversely affect our ability to deploy these NOLs and credit carryforwards. In addition, under Section 382 of the U.S. Internal Revenue Code, or the Code, a corporation that experiences a more than 50% ownership change over a three-year testing period is limited in its ability to use its pre-change NOLs and other tax assets to offset future taxable income or income taxes due. Our existing NOLs and credit carryforwards are subject to limitations arising from previous ownership changes. Our ability to use our NOLs and credit carryforwards could be further limited by Section 382 of the Code if we undergo an ownership change. Future changes in our stock ownership, the causes of which may be outside our control, could result in an ownership change under Section 382 of the Code. Our NOLs may also be impaired under state law. As a result of these limitations, we may not be able to utilize a material portion of, or possibly any of, the NOLs and credit carryforwards, which could materially adversely affect our cash flows.
Risks Related to Ownership of Our Common Stock
The market price of our common stock may be volatile, and the value of your investment could decline significantly.
Technology stocks have historically experienced high levels of volatility. The trading price of our common stock has been and is likely to continue to be volatile. Factors that could cause fluctuations in the trading price of our common stock include the following:
• | price and volume fluctuations in the overall stock market from time to time; |
• | changes in operating performance, stock market valuations and volatility in the market prices of other technology companies generally, or those in our industry in particular; |
• | actual or anticipated quarterly variations in our results of operations or those of our competitors; |
• | actual or anticipated changes in our growth rate relative to our competitors; |
25
• | announcements by us or our competitors of acquisitions, new products, significant contracts, commercial relationships or capital commitments; |
• | manufacturing or supply interruptions; |
• | developments with respect to intellectual property rights; |
• | our ability to develop and market new and enhanced products on a timely basis; |
• | commencement of, or our involvement in, litigation; |
• | major changes in our Board of Directors or management; |
• | changes in governmental regulations or in the status of our regulatory approvals; |
• | the trading volume of our stock; |
• | any future sales or repurchases of our common stock or other securities; |
• | failure of financial analysts to maintain coverage of us, changes in financial estimates by any analysts who follow our company or our failure to meet these estimates or the expectations of investors; |
• | fluctuations in the values of companies perceived by investors to be comparable to us; |
• | the financial projections we may provide to the public, any changes in these projections or our failure to meet these projections; and |
• | general economic conditions and slow or negative growth of related markets. |
The stock market in general, and market prices for the securities of technology companies like ours in particular, have from time to time experienced volatility that often has been unrelated to the operating performance of the underlying companies. These broad market and industry fluctuations may adversely affect the market price of our common stock, regardless of our operating performance. In several recent situations when the market price of a stock has been volatile, holders of that stock have instituted securities class action litigation against the company that issued the stock. If any of our stockholders were to bring a lawsuit against us, the defense and disposition of the lawsuit could be costly and divert the time and attention of our management and materially adversely affect our results of operations.
If securities or industry analysts do not publish research reports about our business, or if they issue an adverse opinion about our business, our stock price and trading volume could decline.
The trading market for our common stock will be influenced by the research and reports that industry or securities analysts publish about us or our business. We do not have any control over these analysts. If one or more of the analysts who cover us issues an adverse opinion about our company, our stock price would likely decline. If one or more of these analysts ceases research coverage of us or fails to regularly publish reports on us, we could lose visibility in the financial markets, which in turn could cause our stock price or trading volume to decline.
Future sales of our common stock could cause our stock price to fall.
Our stock price could decline as a result of sales of a large number of shares of our common stock or the perception that these sales could occur. These sales, or the possibility that these sales may occur, also might make it more difficult for us to sell equity securities in the future at a time and at a price that we deem appropriate.
The holders of 3.8 million shares, or approximately 10.1% of our outstanding common stock, have rights, subject to some conditions, to require us to file registration statements covering the sale of their shares or to include their shares in registration statements that we may file for ourselves or other stockholders, based on our shares outstanding as of December 31, 2019.
In the future, we may issue additional shares of common stock or other equity or debt securities convertible into common stock in connection with a financing, acquisition, commercial relationship, litigation settlement, employee arrangements or otherwise. Any such issuance could result in substantial dilution to our existing stockholders and could cause our stock price to decline.
We are an "emerging growth company," and any decision on our part to comply only with certain reduced reporting and disclosure requirements applicable to emerging growth companies could make our common stock less attractive to investors.
We are an "emerging growth company," as defined in the Jumpstart Our Business Startups, or JOBS, Act enacted in April 2012, and, for as long as we continue to be an "emerging growth company," we may choose to take advantage of exemptions from various reporting requirements applicable to other public companies but not to "emerging growth companies," including, but not limited to, not being required to have our independent registered public accounting firm audit our internal control over financial reporting under Section 404 of the Sarbanes-Oxley Act of 2002, or Section 404, reduced disclosure obligations regarding executive compensation in our periodic reports and proxy statements, and exemptions from the requirements of holding a nonbinding advisory vote on executive compensation and stockholder approval of any golden parachute payments not previously approved. We could be an "emerging growth company" for up to five years following the first sale of our common stock pursuant to an effective registration statement under the Securities Act, although, if we have more than $1.07 billion in annual revenues, if the market
26
value of our common stock that is held by non-affiliates exceeds $700 million as of June 30 of any year, or we issue more than $1.0 billion of non-convertible debt over a three-year period before the end of that five-year period, we would cease to be an "emerging growth company" as of the following December 31. If some investors find our common stock less attractive as a result of any choices to reduce future disclosure, there may be a less active trading market for our common stock and our stock price may be more volatile.
As an "emerging growth company," the JOBS Act allows us to delay adoption of new or revised accounting pronouncements applicable to public companies until such pronouncements are made applicable to private companies. We have elected to use this extended transition period under the JOBS Act. As a result, our financial statements may not be comparable to the financial statements of issuers who are required to comply with the effective dates for new or revised accounting standards that are applicable to public companies, which may make our common stock less attractive to investors.
Delaware and Washington law and provisions in our amended and restated certificate of incorporation and amended and restated bylaws could make a merger, tender offer or proxy contest difficult, thereby depressing the trading price of our common stock.
Anti-takeover provisions in our charter documents and under Delaware and Washington law could make an acquisition of us difficult, limit attempts by our stockholders to replace or remove our current management or Board of Directors and adversely affect our stock price.
Provisions of our amended and restated certificate of incorporation and amended and restated bylaws may delay or discourage transactions involving an actual or potential change in our control or change in our management, including transactions in which stockholders might otherwise receive a premium for their shares, or transactions that our stockholders might otherwise deem to be in their best interests. Therefore, these provisions could adversely affect the price of our stock. Among other things, our amended and restated certificate of incorporation and amended and restated bylaws:
• | permit the Board of Directors to issue up to 5 million shares of preferred stock, with any rights, preferences and privileges as they may designate; |
• | provide that the authorized number of directors may be changed only by resolution of the Board of Directors; |
• | provide that all vacancies on our Board of Directors may only be filled by our Board of Directors and not by stockholders; |
• | divide the Board of Directors into three classes; |
• | provide that a director may only be removed from the Board of Directors by the stockholders for cause; |
• | require that any action to be taken by our stockholders must be effected at a duly called annual or special meeting of stockholders and may not be taken by written consent; |
• | provide that stockholders seeking to present proposals before a meeting of stockholders or to nominate candidates for election as directors at a meeting of stockholders must provide notice in writing in a timely manner and meet specific requirements as to the form and content of a stockholder's notice; |
• | prevent cumulative voting rights (therefore allowing the holders of a plurality of the shares of common stock entitled to vote in any election of directors to elect all of the directors standing for election, if they should so choose); |
• | provide that special meetings of our stockholders may be called only by the chairman of the board, our chief executive officer (or president, in the absence of a chief executive officer) or by the Board of Directors; and |
• | provide that stockholders will be permitted to amend our amended and restated certificate of incorporation, and until December 31, 2020, our amended and restated bylaws only upon receiving at least two-thirds of the total votes entitled to be cast by holders of all outstanding shares then entitled to vote generally in the election of directors, voting together as a single class. |
In addition, because we are incorporated in Delaware, we are governed by the provisions of Section 203 of the Delaware General Corporation Law, which generally prohibits a Delaware corporation from engaging in any of a broad range of business combinations with any "interested" stockholder for a period of three years following the date on which the stockholder became an "interested" stockholder. Likewise, because our principal executive offices are located in Washington, the anti-takeover provisions of the Washington Business Corporation Act may apply to us under certain circumstances now or in the future. These provisions prohibit a "target corporation" from engaging in any of a broad range of business combinations with any stockholder constituting an "acquiring person" for a period of five years following the date on which the stockholder became an "acquiring person."
Our amended and restated bylaws provide that, unless we consent in writing to the selection of an alternative forum, the sole and exclusive forum for (i) any derivative action or proceeding brought on our behalf, (ii) any action asserting a claim of breach of a fiduciary duty owed by any of our directors, officers, or other employees to us or our stockholders, (iii) any action arising pursuant to any provision of the Delaware General Corporation Law, or our amended and restated certificate of incorporation or our amended and restated bylaws or (iv) any other action asserting a claim that is governed by the internal affairs doctrine shall be a state or
27
federal court located within the State of Delaware, in all cases subject to the court having jurisdiction over indispensable parties named as defendants.
Our amended and restated bylaws also provide that the federal district courts of the United States of America will be the exclusive forum for resolving any complaint asserting a cause of action arising under the Securities Act. On December 19, 2018, the Delaware Court of Chancery issued a decision in Matthew Sciabacucchi v. Matthew B. Salzberg et al., C.A. No. 2017-0931-JTL (Del. Ch.), finding that such provisions such as the federal forum provision are not valid under Delaware law. In light of this decision of the Delaware Court of Chancery, we do not intend to enforce the federal forum provision in our amended and restated bylaws unless and until such time there is a final determination by the Delaware Supreme Court regarding the validity of such provisions. To the extent the Delaware Supreme Court makes a final determination that provisions such as the Federal Forum Provision are not valid as a matter of Delaware law, our Board of Directors intends to amend our Bylaws to remove the federal forum provision.
Any person or entity purchasing or otherwise acquiring any interest in any of our securities shall be deemed to have notice of and consented to this provision. These exclusive-forum provisions may limit a stockholder's ability to bring a claim in a judicial forum of its choosing for disputes with us or our directors, officers, or other employees, which may discourage lawsuits against us and our directors, officers, and other employees. If a court were to find either exclusive-forum provision in our amended and restated bylaws to be inapplicable or unenforceable in an action, we may incur additional costs associated with resolving the dispute in other jurisdictions, which could harm our results of operations.
ITEM 1B. UNRESOLVED STAFF COMMENTS
None.
ITEM 2. PROPERTIES
Our facilities are leased and include the following:
Location | Lease Expiration | Approximate Size (sq. ft.) | Primary Functions |
Vancouver, Washington | March 31, 2022 ‑ July 31, 2025 | 122,400 | Corporate headquarters, manufacturing and distribution, service and repair, product design, research and development, sales, marketing and administration |
Hillsboro, Oregon | January 31, 2023 | 30,200 | Manufacturing, distribution and product design |
Longmont, Colorado | October 31, 2021 - July 31, 2022 | 21,700 | Research and development |
Lohja, Finland | April 1, 2022 | 31,800 | Manufacturing and distribution, product design, research and development and administration |
Shanghai, China | April 16, 2019 ‑ January 31, 2021 | 82,800 | Manufacturing and distribution, service and repair, product design, research and development, sales and administration |
Seoul, South Korea | September 30, 2020 -December 31, 2020 | 2,120 | Sales, service and repair |
ITEM 3. LEGAL PROCEEDINGS
In December 2013, we submitted a disclosure letter to the Office of the Inspector General of the Department of Defense advising that we might not have been eligible for certain contracts we were awarded under the Small Business Innovation Research, or SBIR, Program, notwithstanding our prior representations that we were eligible. The matter was referred to the Small Business Administration and the U.S. Department of Justice for investigation of potential violations of the civil False Claims Act. In March 2015, a civil settlement agreement related to the SBIR matter was signed, in which we agreed to pay $420,000 and received a release of any civil liabilities with respect to the SBIR matter. This settlement has been paid in full.
In October 2014, we received a request for information related to the SBIR matter from the U.S. Attorney's Office, Criminal Division. We provided documentation and an explanation of why a criminal investigation was unwarranted. In March 2015, we received an additional request, to which we also responded. The Criminal Division has contacted certain of our former employees as recently as June 2017. Although we are unable to predict the final outcome of this matter, in the event that the Criminal Division brings any claims, we intend to vigorously defend ourselves.
28
We may, from time to time, be party to litigation and subject to claims incident to the ordinary course of business. As our company matures, we may become party to an increasing number of litigation matters and claims. The outcome of litigation and claims cannot be predicted with certainty, and the resolution of these matters could materially adversely affect our business, financial condition, results of operations and growth prospects.
ITEM 4. MINE SAFETY DISCLOSURES
Not Applicable.
PART II
ITEM 5. MARKET FOR REGISTRANT'S COMMON EQUITY, RELATED STOCKHOLDER MATTERS AND ISSUER PURCHASES OF EQUITY SECURITIES
Information About Our Common Stock
Our common stock is listed on the Nasdaq Global Select Market under the symbol "LASR." As of March 2, 2020, there were 158 registered holders of record of our common stock.
Repurchase of Common Stock
In November 2019, our Board of Directors authorized a program to repurchase up to $10 million of our outstanding common stock. This program is intended to offset the potentially dilutive effects of $15.8 million in restricted stock grants awarded in connection with the Nutronics acquisition. During the year ended December 31, 2019, we did not repurchase any shares and, as of December 31, 2019, $10 million remained available for future repurchases.
Recent Sales of Unregistered Securities
On November 5, 2018 we issued 145 thousand shares of common stock to an accredited investor pursuant to the net exercise of warrants to purchase common stock.
This transaction was exempt from registration under the Securities Act in reliance upon Section 3(a)(9) under the Securities Act as an exchange with an existing security holder where no commission or other remuneration is paid or given for soliciting such exchange.
Stock Performance Graph
The following graph compares the cumulative total stockholder return on our common stock with the Nasdaq Composite Index and the Russell 2000 Index. The graph covers the period from April 26, 2018, using the closing price for the first day of trading immediately following the effectiveness of our initial public offering per SEC regulations, through December 31, 2019. No cash dividends have been declared on shares of our common stock. This graph assumes that the value of the investment in our common stock and each index (including reinvestment of dividends) was $100 on April 26, 2018.
29
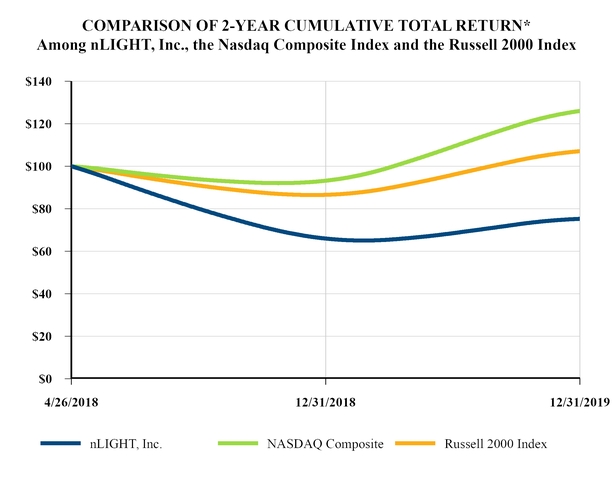
*$100 invested on April 26, 2018 in stock or April 26, 2018 in index, including reinvestment of dividends. Indexes calculated on month-end basis.
The stock price performance shown on the graph above is not necessarily indicative of future price performance. Information used in the graph was obtained from the Nasdaq Global Select Market, a source believed to be reliable, but we are not responsible for any errors or omissions in such information.
ITEM 6. SELECTED CONSOLIDATED FINANCIAL DATA
The following selected consolidated financial data should be read in conjunction with our management's discussion and analysis of financial condition and results of operations and our consolidated financial statements and related notes thereto included elsewhere in this report. The data as of December 31, 2019, 2018 and 2017 is derived from our audited consolidated financial statements. Our historical results are not necessarily indicative of the results for any future period. Amounts shown are in thousands except for per share data.
30
Year Ended December 31, | |||||||||||
2019 | 2018 | 2017 | |||||||||
Consolidated Statement of Operations Data: | |||||||||||
Revenues | $ | 176,619 | $ | 191,359 | $ | 138,580 | |||||
Cost of revenues(1) | 124,280 | 124,398 | 94,306 | ||||||||
Gross profit | 52,339 | 66,961 | 44,274 | ||||||||
Operating expenses: | |||||||||||
Research and development(1) | 28,137 | 21,054 | 15,123 | ||||||||
Sales, general, and administrative(1) | 34,111 | 28,844 | 19,353 | ||||||||
Total operating expenses | 62,248 | 49,898 | 34,476 | ||||||||
Income (loss) from operations | (9,909 | ) | 17,063 | 9,798 | |||||||
Other income (expense): | |||||||||||
Interest income (expense), net | 2,609 | 728 | (1,269 | ) | |||||||
Other expense | 535 | (253 | ) | (1,834 | ) | ||||||
Income (loss) before income taxes | (6,765 | ) | 17,538 | 6,695 | |||||||
Income tax expense | 6,119 | 3,600 | 4,858 | ||||||||
Net income (loss) | $ | (12,884 | ) | $ | 13,938 | $ | 1,837 | ||||
Less: Income allocated to preferred stockholders | — | $ | (4,415 | ) | (1,837 | ) | |||||
Net income (loss) attributable to common stockholders | $ | (12,884 | ) | $ | 9,523 | $ | — | ||||
Net income (loss) per share, basic | $ | (0.35 | ) | $ | 0.38 | $ | 0.00 | ||||
Net income (loss) per share, diluted | $ | (0.35 | ) | $ | 0.32 | $ | 0.00 | ||||
Weighted average shares outstanding: | |||||||||||
Shares used in basic per share calculations | 37,119 | 24,862 | 2,735 | ||||||||
Shares used in diluted per share calculations | 37,119 | 29,959 | 2,735 | ||||||||
Year Ended December 31, | |||||||||||
(1) Stock-based compensation expense by statement of operations line items | 2019 | 2018 | 2017 | ||||||||
Cost of revenues | $ | 1,201 | $ | 456 | $ | 46 | |||||
Research and development | 3,299 | 1,293 | 66 | ||||||||
Sales, general and administrative | 5,230 | 3,056 | 257 | ||||||||
$ | 9,730 | $ | 4,805 | $ | 369 | ||||||
Year Ended December 31, | |||||||||||
2019 | 2018 | 2017 | |||||||||
Select Consolidated Balance Sheet Data: | |||||||||||
Cash and cash equivalents | $ | 117,252 | $ | 149,478 | $ | 36,687 | |||||
Working capital | 173,558 | 195,034 | 55,689 | ||||||||
Total assets | 249,966 | 250,130 | 110,148 | ||||||||
Total debt, including current portion(2) | 51 | 109 | 17,471 | ||||||||
Accumulated deficit | (117,454 | ) | (104,731 | ) | (118,669 | ) | |||||
Total stockholders' equity | 216,608 | 217,783 | 61,283 | ||||||||
(2) Net of debt issuance costs of zero, $42 thousand and zero as of December 31, 2019, 2018 and 2017, respectively.
31
ITEM 7. MANAGEMENT’S DISCUSSION AND ANALYSIS OF FINANCIAL CONDITION AND RESULTS OF OPERATIONS
The following discussion and analysis of our financial condition and results of operations should be read in conjunction with our consolidated financial statements and the related notes included elsewhere in this Annual Report on Form 10-K. In addition to historical consolidated financial information, the following discussion and analysis contains forward-looking statements that involve risks, uncertainties and assumptions as described under the "Special Note Regarding Forward-Looking Statements and Industry Data" that appears earlier in this Annual Report on Form 10-K. Our actual results could differ materially from those anticipated by these forward-looking statements as a result of many factors, including those discussed under "Item 1A: Risk Factors" and elsewhere in this Annual Report on Form 10-K.
Overview
nLIGHT, Inc., headquartered in Vancouver, Washington, is a leading provider of high‑power semiconductor and fiber lasers. Our lasers are changing not only the way things are made but also the things that can be made. We design, develop and manufacture the critical elements of our lasers, and we believe our vertically integrated business model enables us to rapidly introduce innovative products, control our costs and protect our intellectual property.
In November 2019, we acquired the stock of Nutronics, Inc. (Nutronics), based in Longmont, Colorado, a leading developer of coherently combined lasers and beam control systems (BCS) for high-energy laser (HEL) systems serving the defense market, for approximately $17.4 million. The acquisition of Nutronics complements our existing products and significantly expands our addressable market through the development of directed energy lasers. See Note 2 in the Notes to Consolidated Financial Statements for additional information.
As of December 31, 2019, we operate in two segments, consisting of the Laser Products segment and the Advanced Development segment. The Advanced Development segment includes the operating results of Nutronics since the date of acquisition. All other operating results are included in the Laser Products segment. Our primary end markets did not change as a result of the acquisition.
Revenues decreased to $176.6 million in 2019 compared to $191.4 million in 2018 as a result of decreased revenue from the Industrial and Microfabrication markets, offset partially by increased revenues from the Defense and Aerospace markets. We generated a net loss of $12.9 million for fiscal year 2019 as compared to net income of $13.9 million for fiscal year 2018. The decrease in net income was driven by lower overall revenues, increased tariffs, and increased operating expenses, primarily related to stock-based compensation, research and development costs, and costs associated with being a public company. Our results for 2019 include revenue of $2.6 million from Nutronics and a $3.4 million charge for a valuation allowance on deferred tax assets.
Factors Affecting Our Performance
Demand for our Semiconductor and Fiber Laser Solutions
In order to continue to grow our revenues, we must continue to achieve design wins for our semiconductor and fiber lasers. We consider a design win to occur when a customer notifies us that it has selected one of our products to be incorporated into a product or system under development by such customer. For the foreseeable future, our operations will continue to depend upon capital expenditures by customers in the Industrial and Microfabrication markets, which, in turn, depend upon the demand for these customers’ products or services. In addition, in the Aerospace and Defense market, our business depends in large part on continued investment in laser technology by the U.S. government and its allies, and our ability to continue to successfully develop leading technology in this area.
Erosion of average selling prices, or ASPs, of established products is typical in our industry, and the ASPs of our products generally decrease as our products mature. We may also negotiate discounted selling prices from time to time with certain customers that purchase higher volumes, or to penetrate new markets or applications. Historically, we have been able to offset decreasing ASPs by introducing new and higher value products, increasing the sales of our existing products, expanding into new applications and reducing our manufacturing costs. However, recent ASP pressure has been more pronounced, and as a result, we have only been able to partially offset the impact of the lower selling prices. Since the second half of 2018, certain of our competitors have continued to reduce the price of their fiber lasers sold in the China Industrial market. Although we anticipate further increases in product volumes and the continued introduction of new and higher value products, we expect further ASP reduction in the near-term that may cause our revenues to decline or grow at a slower rate.
32
Technology and New Product Development
We invest heavily in the development of our semiconductor and fiber laser technologies to provide solutions to our current and future customers. We anticipate that we will continue to invest in research and development to achieve our technology and product roadmap. Our product development is targeted to specific sectors of the market where we believe the power and performance requirements of our products can provide the most benefit. We believe our close coordination with our customers regarding their future product requirements enhances the efficiency of our research and development expenditures.
Manufacturing Costs and Gross Margins
Our gross profit, in absolute dollars and as a percentage of revenues, is impacted by our product sales mix, sales volumes, changes in ASPs, production volumes, the corresponding absorption of manufacturing overhead expenses, production costs and manufacturing yields. Our product sales mix can affect gross profits due to variations in profitability related to product- configurations and cost profiles, customer volume pricing, availability of competitive products in various markets, and new product introductions, among other factors. Capacity utilization affects our gross margin because we have a high fixed cost base due to our vertically integrated business model. Increases in sales and production volumes drive favorable absorption of fixed costs, improved manufacturing efficiencies and lower production costs. Gross margins may fluctuate from period to period depending on product mix and the level of capacity utilization.
Given the fixed nature of our facilities and equipment costs, we expect gross margin to increase as revenues and volumes increase. Historically, gross margins have fluctuated from period to period depending on product mix and the level of capacity utilization. However, in recent periods, gross margins have been negatively affected by increased tariff costs as a result of the trade war between the United States and China. So long as such increased tariff costs remain in place or increase further, our gross margins may continue to decline unless we can sufficiently increase our prices to offset those costs.
Seasonality
Our quarterly revenues can fluctuate with general economic trends, holidays in foreign countries such as Chinese New Year in the first quarter of our fiscal year, the timing of capital expenditures by our customers, and general economic trends. In addition, as is typical in our industry, we tend to recognize a larger percentage of our quarterly revenues in the last month of the quarter, which may impact our working capital trends.
Results of Operations
The following table sets forth our operating results as a percentage of revenues for the periods indicated:
Year Ended December 31, | |||||||||||
2019 | 2018 | 2017 | |||||||||
Revenues | 100.0 | % | 100.0 | % | 100.0 | % | |||||
Cost of revenues | 70.4 | 65.0 | 68.1 | ||||||||
Gross profit | 29.6 | 35.0 | 31.9 | ||||||||
Operating expenses: | |||||||||||
Research and development | 15.9 | 11.0 | 10.9 | ||||||||
Sales, general and administrative | 19.3 | 15.1 | 14.0 | ||||||||
Total operating expenses | 35.2 | 26.1 | 24.9 | ||||||||
Income (loss) from operations | (5.6 | ) | 8.9 | 7.1 | |||||||
Other income (expense): | |||||||||||
Interest income (expense), net | 1.5 | 0.4 | (0.9 | ) | |||||||
Other income (expense), net | 0.3 | (0.1 | ) | (1.3 | ) | ||||||
Income (loss) before income taxes | (3.8 | ) | 9.2 | 4.8 | |||||||
Income tax expense | 3.5 | 1.9 | 3.5 | ||||||||
Net income (loss) | (7.3 | )% | 7.3 | % | 1.3 | % | |||||
33
Revenues by Segment
Our revenues by segment were as follows for the periods presented (dollars in thousands):
Year Ended December 31, | Change | |||||||||||||||||
2019 | % of Revenue | 2018 | % of Revenue | Amount | % | |||||||||||||
Laser Products | $ | 174,059 | 98.6 | % | $ | 191,359 | 100.0 | % | $ | (17,300 | ) | (9.0 | )% | |||||
Advanced Development | 2,560 | 1.4 | — | — | 2,560 | NM | ||||||||||||
$ | 176,619 | 100.0 | % | $ | 191,359 | 100.0 | % | $ | (14,740 | ) | (7.7 | )% | ||||||
The decrease in Laser Products revenues for 2019 was driven by decreased revenue in the Industrial and Microfabrication markets, offset partially by increased revenue in the Defense and Aerospace markets. Prior to the acquisition of Nutronics in November 2019, we operated only in the Laser Products segment; therefore, no comparative information is presented for 2018 versus 2017.
Revenues by End Market
Our revenues by end market were as follows for the periods presented (dollars in thousands):
Year Ended December 31, | Change | |||||||||||||||||
2019 | % of Revenue | 2018 | % of Revenue | Amount | % | |||||||||||||
Industrial | $ | 76,668 | 43.4 | % | $ | 82,763 | 43.4 | % | $ | (6,095 | ) | (7.4 | )% | |||||
Microfabrication | 57,153 | 32.4 | 74,108 | 38.7 | (16,955 | ) | (22.9 | ) | ||||||||||
Aerospace and Defense | 42,798 | 24.2 | 34,488 | 18.0 | 8,310 | 24.1 | ||||||||||||
$ | 176,619 | 100.0 | % | $ | 191,359 | 100.0 | % | $ | (14,740 | ) | (7.7 | )% | ||||||
Year Ended December 31, | Change | |||||||||||||||||
2018 | % of Revenue | 2017 | % of Revenue | Amount | % | |||||||||||||
Industrial | $ | 82,763 | 43.3 | % | $ | 56,622 | 40.9 | % | $ | 26,141 | 46.2 | % | ||||||
Microfabrication | 74,108 | 38.7 | 60,886 | 43.9 | 13,222 | 21.7 | ||||||||||||
Aerospace and Defense | 34,488 | 18.0 | 21,072 | 15.2 | 13,416 | 63.7 | ||||||||||||
$ | 191,359 | 100.0 | % | $ | 138,580 | 100.0 | % | $ | 52,779 | 38.1 | % | |||||||
The decrease in Industrial market revenue for 2019 compared to 2018 was driven by price reductions in China, partially offset by increased unit sales and increased sales outside of China. The decrease in Microfabrication market revenue for 2019 compared to 2018 was driven primarily by lower unit sales to customers for consumer electronics and semiconductor markets. The increase in Aerospace and Defense market revenue for 2019 compared to 2018 was attributable to higher volumes on our existing customer contracts.
The increase in Industrial market revenue for 2018 compared to 2017 was driven by increased unit sales across all regions. The increase in Microfabrication market revenue for 2018 compared to 2017 was driven primarily by increased unit sales to customers for consumer electronics and semiconductor markets. The increase in Aerospace and Defense market revenue for 2018 compared to 2017 was attributable to sales to new and existing customers for defense applications, as well as new government contracts secured in the second half of 2017.
Revenues by Geographic Region
Our revenues by geographic region were as follows for the periods presented (dollars in thousands):
34
Year Ended December 31, | Change | |||||||||||||||||
2019 | % of Revenue | 2018 | % of Revenue | Amount | % | |||||||||||||
North America | $ | 67,511 | 38.2 | % | $ | 70,694 | 36.9 | % | $ | (3,183 | ) | (4.5 | )% | |||||
China | 64,134 | 36.3 | 70,196 | 36.7 | (6,062 | ) | (8.6 | ) | ||||||||||
Rest of World | 44,974 | 25.5 | 50,469 | 26.4 | (5,495 | ) | (10.9 | ) | ||||||||||
$ | 176,619 | 100.0 | % | $ | 191,359 | 100.0 | % | $ | (14,740 | ) | (7.7 | )% | ||||||
Year Ended December 31, | Change | |||||||||||||||||
2018 | % of Revenue | 2017 | % of Revenue | Amount | % | |||||||||||||
North America | $ | 70,694 | 36.9 | % | $ | 46,489 | 33.5 | % | $ | 24,205 | 52.1 | % | ||||||
China | 70,196 | 36.7 | 55,344 | 39.9 | 14,852 | 26.8 | ||||||||||||
Rest of World | 50,469 | 26.4 | 36,747 | 26.5 | 13,722 | 37.3 | ||||||||||||
$ | 191,359 | 100.0 | % | $ | 138,580 | 100.0 | % | $ | 52,779 | 38.1 | % | |||||||
Geographic revenue information is based on the location to which we ship our products. Changes in revenue by geographic region for 2019 compared to 2018 were driven by decreased revenue from the Industrial end market in China, and decreased revenue from the Microfabrication market in North America and the rest of the world, partially offset by increased revenue from the Aerospace and Defense market in North America. The increase in revenue in each region for 2018 compared to 2017 was due to growth in each of our three key end markets.
Cost of Revenues and Gross Margin
Cost of revenues consists primarily of manufacturing materials, payroll, shipping and handling costs, tariffs and manufacturing-related overhead. We order materials and supplies based on backlog and forecasted customer orders. We expense all warranty costs and inventory provisions as cost of revenues.
Our gross profit and gross margin were as follows for the periods presented (dollars in thousands):
Year Ended December 31, | Change | |||||||||||||||||||||||||
Laser Products | Advanced Development | Corporate and Other | 2019 | 2018 | Amount | % | ||||||||||||||||||||
Gross profit | $ | 53,247 | $ | 293 | $ | (1,201 | ) | $ | 52,339 | $ | 66,961 | $ | (14,622 | ) | (21.8 | )% | ||||||||||
Gross margin | 30.6 | % | 11.4 | % | NM | 29.6 | % | 35.0 | % | — | (5.4 | )% | ||||||||||||||
Year Ended December 31, | Change | |||||||||||||
2018 | 2017 | Amount | % | |||||||||||
Gross profit | $ | 66,961 | $ | 44,274 | $ | 22,687 | 51.2 | % | ||||||
Gross margin | 35.0 | % | 31.9 | % | — | 3.1 | % | |||||||
Gross margin decreased in 2019 compared to 2018 due primarily to price declines for certain products serving the Industrial market, lower production volume and factory utilization, and the negative impact of higher tariff costs, offset partially by product cost improvements.
Gross margin increased in 2018 compared to 2017 as a result of increased production volume and factory utilization, improved manufacturing efficiency, and product cost improvements.
Since we operated only in the Laser Products segment prior to the acquisition of Nutronics, comparative information by segment is not presented.
Operating Expenses
Our operating expenses were as follows for the periods presented (dollars in thousands):
35
Research and Development
Year Ended December 31, | Change | |||||||||||||
2019 | 2018 | Amount | % | |||||||||||
Research and development | $ | 28,137 | $ | 21,054 | $ | 7,083 | 33.6 | % | ||||||
Year Ended December 31, | Change | |||||||||||||
2018 | 2017 | Amount | % | |||||||||||
Research and development | $ | 21,054 | $ | 15,123 | $ | 5,931 | 39.2 | % | ||||||
The increase in research and development expense for 2019 compared to 2018, and 2018 compared to 2017, was driven primarily by increased headcount, higher project-related expenses to support our development efforts, and increased stock-based compensation.
Sales, General and Administrative
Year Ended December 31, | Change | |||||||||||||
2019 | 2018 | Amount | % | |||||||||||
Sales, general, and administrative | $ | 34,111 | $ | 28,844 | $ | 5,267 | 18.3 | % | ||||||
Year Ended December 31, | Change | |||||||||||||
2018 | 2017 | Amount | % | |||||||||||
Sales, general, and administrative | $ | 28,844 | $ | 19,353 | $ | 9,491 | 49.0 | % | ||||||
The increase in sales, general and administrative expense for 2019 compared to 2018 was primarily driven by higher stock-based compensation, increased compensation costs, acquisition costs, and higher business insurance, consulting and professional fees, and other costs related to operating as a public company.
The increase in sales, general and administrative expense for 2018 compared to 2017 was primarily driven by increased headcount and compensations costs, increased stock-based compensation, and higher consulting and professional service fees related to our initial public offering, and operations thereafter as a public company. These increases were partially offset by a decrease in bad debt recoveries.
Interest Income (Expense), net
Year Ended December 31, | Change | |||||||||||||
2019 | 2018 | Amount | % | |||||||||||
Interest income (expense), net | $ | 2,609 | $ | 728 | $ | 1,881 | 258.4 | % | ||||||
Year Ended December 31, | Change | |||||||||||||
2018 | 2017 | Amount | % | |||||||||||
(in thousands, except percentages) | ||||||||||||||
Interest income (expense), net | $ | 728 | $ | (1,269 | ) | $ | 1,997 | (157.4 | )% | |||||
The increase in interest income, net, for 2019 compared to 2018 was primarily attributable to interest income generated on the cash we received from our initial and follow-on public offerings in 2018, and a reduction in interest expense on our loan facilities, which were paid off as of December 31, 2018.
The increase in interest income (expense), net, for 2018 compared to 2017 was primarily due to interest income generated on the cash we received from our initial and follow-on public offerings, and lower balances of debt outstanding coupled with restructuring of our debt facilities.
36
Other Income (Expense), net
Year Ended December 31, | Change | ||||||||||||
2019 | 2018 | Amount | % | ||||||||||
Other income (expense), net | $ | 535 | $ | (253 | ) | $ | 788 | NM | |||||
Year Ended December 31, | Change | |||||||||||||
2018 | 2017 | Amount | % | |||||||||||
(in thousands, except percentages) | ||||||||||||||
Other income (expense), net | $ | (253 | ) | $ | (1,834 | ) | $ | 1,581 | (86.2 | )% | ||||
The increase in other income (expense), net, in 2019 compared to 2018 was mainly due to an increase in gain on sales of assets and lower net unrealized and realized foreign exchange losses. The decrease in other expense, net for 2018 compared to 2017 was primarily attributable to a non-recurring $0.9 million loss on debt extinguishment related to the payoff of a loan facility in 2017.
Income Tax Expense
Year Ended December 31, | Change | |||||||||||||
2019 | 2018 | Amount | % | |||||||||||
Income tax expense | $ | 6,119 | $ | 3,600 | $ | 2,519 | 70.0 | % | ||||||
Year Ended December 31, | Change | |||||||||||||
2018 | 2017 | Amount | % | |||||||||||
Income tax expense | $ | 3,600 | $ | 4,858 | $ | (1,258 | ) | (25.9 | )% | |||||
The increase in tax expense for 2019 compared to 2018 was primarily related to recording a valuation allowance against our China deferred tax assets due to uncertainty with respect to their ultimate realizability, offset partially by changes in the mix of earnings by tax jurisdiction. Our 2019 tax expense is impacted by the geographic location of our pre-tax book income and is primarily related to our operations in Finland and the recording of a valuation allowance against our China deferred tax assets. Our effective tax rate may vary from period to period based on changes in estimated taxable income or loss by jurisdiction, changes to the valuation allowance, changes to U.S. federal, state or foreign tax laws, future expansion into areas with varying country, state, and local income tax rates, deductibility of certain costs and expenses by jurisdiction.
The decrease in tax expense for 2018 compared to 2017 was driven by the change in the jurisdictional mix of earnings, which reflects an increase in income from our U.S. operations compared to a decrease in foreign earnings. There is limited tax expense associated with our operations in the U.S. as we maintain a full valuation allowance against our U.S. deferred tax assets.
Liquidity and Capital Resources
We had cash and cash equivalents of $117.3 million and $149.5 million as of December 31, 2019 and 2018, respectively.
For the year ended December 31, 2019, our principal uses of liquidity were to acquire Nutronics, fund our working capital needs and purchase new capital equipment. To date, our principal sources of liquidity have been the net proceeds we received through sales of equity securities and payments received from customers for our products.
We believe our existing sources of liquidity will be sufficient to meet our working capital and capital expenditure needs for at least the next 12 months. However, we may need to raise additional capital to expand the commercialization of our products, fund our operations and further our research and development activities. Our future capital requirements may vary materially from period to period and will depend on many factors, including the timing and extent of spending on research and development efforts, the expansion of sales and marketing activities, the continuing market acceptance of our products and ongoing investments to support the growth of our business. We may in the future enter into arrangements to acquire or invest in complementary businesses, services, technologies and intellectual property rights. From time to time, we may explore additional financing sources which could include equity, equity‑linked and debt financing arrangements.
37
The following table summarizes our cash flows for the periods presented (in thousands):
Year Ended December 31, | |||||||||||
2019 | 2018 | 2017 | |||||||||
Net cash provided by (used in) operating activities | $ | (4,241 | ) | $ | 3,335 | $ | 3,411 | ||||
Net cash used in investing activities | (30,404 | ) | (11,679 | ) | (5,477 | ) | |||||
Net cash provided by financing activities | 2,452 | 121,301 | 24,419 | ||||||||
Effect of exchange rate changes on cash | (33 | ) | (166 | ) | 834 | ||||||
Net increase (decrease) in cash | $ | (32,226 | ) | $ | 112,791 | $ | 23,187 | ||||
Net Cash Provided by (Used in) Operating Activities
During the year ended December 31, 2019, net cash used in operating activities was $4.2 million, which was primarily driven by $12.9 million of net loss reported for the period, and non‑cash adjustments of $21.9 million related to depreciation and amortization, stock-based compensation, and other items. These items were partially offset by $10.7 million increase in inventory and changes in other operating assets and liabilities. The increase in inventory supported new product introductions, decreased customer lead times and increased safety stock.
During the year ended December 31, 2018, net cash provided by operating activities was $3.3 million, which was driven by $13.9 million of net income reported in the period, and non-cash adjustments of $11.8 million related to depreciation and amortization, stock-based compensation, and other items. In addition, accounts payable and accrued liabilities increased $0.1 million, primarily driven by the timing of vendor payments. These items were offset by increases of $13.7 million in accounts receivable, $6.1 million in inventory, and $2.5 million in prepaids and other current assets.
During the year ended December 31, 2017, net cash provided by operating activities was $3.4 million, which was driven by a $1.8 million of net income reported in the period, non-cash adjustments of $9.0 million related to depreciation, deferred taxes, debt extinguishment, and other items. These positive adjustments were offset by a $9.9 million increase in inventory and $3.5 million increase in accounts receivable, which grew to support higher revenue levels. Those uses of cash were offset by $5.7 million increase in accounts payable and other accrued expenses, driven by increasing volume of material purchases, year-end payroll and bonus accruals, and timing of payments to vendors.
Net Cash Used in Investing Activities
During the year ended December 31, 2019, net cash used in investing activities was $30.4 million, which included $17.4 million for the acquisition of Nutronics, $13.6 million of capital expenditures primarily related to investments in manufacturing equipment for our worldwide operations, and a $0.6 million gain on sales of assets.
During the year ended December 31, 2018, net cash used in investing activities was $11.7 million, which was primarily due to capital expenditures during the period related to investments in manufacturing equipment and facilities, as well as investments in our patent portfolio.
During the year ended December 31, 2017, net cash used in investing activities was $5.5 million, which was primarily due to capital expenditures during the year related to further expanding our manufacturing capacity in our Shanghai facility, purchases of new manufacturing and lab equipment, and investment in our IT infrastructure.
Net Cash Provided by Financing Activities
During the year ended December 31, 2019, net cash provided by financing activities was $2.5 million, which was primarily driven by $3.0 million of proceeds from stock options exercised and employee stock plan purchases, partially offset by $0.5 million of payments related to withholding taxes for restricted stock awards issued.
During the year ended December 31, 2018, net cash provided by financing activities was $121.3 million, which was primarily driven by $138.3 million of net proceeds related to our initial and follow-on public offerings.
During the year ended December 31, 2017, net cash provided by financing activities was $24.4 million which was due to $27.5 million of proceeds related to issuance of convertible preferred stock partially offset by $2.8 million in debt and capital lease payments.
38
Credit Facilities
We have a $40.0 million revolving line of credit (LOC) with Pacific Western Bank, which is secured by our assets and expires in September 2021. Interest on the LOC is based primarily on the London Interbank Offered Rate (LIBOR) plus a fee based on certain liquidity levels. The LOC contains restrictive and financial covenants and bears an unused credit fee of 0.20% on an annualized basis. As of December 31, 2019 and 2018, no amounts were outstanding under the LOC, no letters of credit were outstanding, $40.0 million was available for borrowing, and we were in compliance with all covenants.
Contractual Obligations
The following table sets forth a summary of our significant contractual obligations to make future payments in cash as of December 31, 2019 (in thousands):
Payments Due by Year | |||||||||||||||||||||||||||
2020 | 2021 | 2022 | 2023 | 2024 | Thereafter | Total | |||||||||||||||||||||
Operating lease obligations | $ | 3,060 | $ | 2,358 | $ | 1,334 | $ | 701 | $ | 635 | $ | 172 | $ | 8,260 | |||||||||||||
Royalty obligations | 152 | 170 | 170 | 170 | 170 | 85 | 917 | ||||||||||||||||||||
Purchase commitments | 25,110 | 1,495 | — | — | — | — | 26,605 | ||||||||||||||||||||
Total | $ | 28,322 | $ | 4,023 | $ | 1,504 | $ | 871 | $ | 805 | $ | 257 | $ | 35,782 | |||||||||||||
Critical Accounting Policies and Significant Estimates
Our consolidated financial statements are prepared in accordance with generally accepted accounting principles in the United States and include our accounts and the accounts of our wholly owned subsidiaries. All intercompany transactions and balances have been eliminated in consolidation. The preparation of these financial statements requires our management to make estimates and assumptions that affect the reported amounts of assets, liabilities, revenues, costs and expenses and related disclosures. Our estimates are based on our historical experience and on various other factors that we believe are reasonable under the circumstances, the results of which form the basis for making judgments about the carrying value of assets and liabilities that are not readily apparent from other sources. Actual results may differ from these judgments and estimates under different assumptions or conditions and any such differences may be material. We believe that our significant accounting policies, which are discussed in the footnotes to our consolidated financial statements, and the accounting policies discussed below, involve a greater degree of complexity, involving management's judgments and estimates. Accordingly, these are the policies we believe are critical to understanding our financial condition and historical and future results of operations:
• | revenue recognition |
• | inventory; and |
• | income taxes |
Revenue Recognition
We adopted ASU 2014-09, Revenue from Contracts with Customers (Topic 606) and related amendments, using the cumulative effect method with a date of initial application of January 1, 2019. As such, the comparative period information has not been adjusted and continues to be reported under ASC 605 “Revenue Recognition.” The impact of adoption was immaterial, and we expect the impact of the adoption of the new standard to be immaterial to the consolidated financial statements on an ongoing basis. A majority of our revenue continues to be recognized at a point in time when control transfers based on the terms of the underlying contract.
We recognize revenue upon transferring control of products and services, and the amounts recognized reflect the consideration we expect to be entitled to receive in exchange for these products and services. We consider customer purchase orders, which in some cases are governed by master sales agreements, to be the contracts with a customer. As part of our consideration of the contract, we evaluate certain factors, including the customer's ability to pay (or credit risk). For each contract, we consider the promise to transfer products, each of which is distinct, as the identified performance obligations.
We allocate the transaction price to each distinct product based on its relative standalone selling price. Master sales agreements or purchase orders from customers could include a single product or multiple products. Regardless, the contracted price with the customer is agreed to at the individual product level outlined in the customer contract or purchase order. We do not bundle prices; however, we do negotiate with customers on pricing for the same products based on a variety of factors (e.g., level of contractual
39
volume). We have concluded that the prices negotiated with each individual customer are representative of the stand-alone selling price of the product.
We often receive orders with multiple delivery dates that may extend across several reporting periods. We allocate the transaction price of the contract to each delivery based on the product standalone selling price and invoice for each scheduled delivery upon shipment or delivery and recognize revenues for such delivery at that point, assuming transfer of control has occurred. Rights of return generally are not included in customer contracts. Accordingly, product revenue is recognized upon shipment or delivery, as applicable, and transfer of control. Rights of return are evaluated as they occur.
Revenues recognized at a point in time consist of sales of semiconductor lasers, fiber lasers and other related products. Revenues recognized over time generally consist of development arrangements that are structured based on our costs. Because control transfers over time, revenue is recognized extent of progress towards completion of the performance obligation. We generally use the cost-to-cost measure of progress for our contract because it best depicts the transfer of control to the customer. Billing under these arrangements generally occurs within one month after the work is completed.
Inventory
Inventory is stated at the lower of cost (principally standard cost, which approximates actual cost on a first-in, first-out basis) or net realizable value. Inventory includes raw materials and components that may be specialized in nature and subject to obsolescence. On a quarterly basis, we review inventory quantities on hand and on order under non-cancelable purchase commitments in comparison to our past consumption, recent purchases, backlog and other factors to determine what inventory quantities, if any, may not be sellable. Based on this analysis, we write down the affected inventory value for estimated excess and obsolescence charges. At the point of loss recognition, a new, lower-cost basis for that inventory is established, and subsequent changes in facts and circumstances do not result in the restoration or increase in that newly established cost basis. Market conditions are subject to change, and demand for our products can fluctuate significantly. Actual consumption of inventories could differ from forecasted demand, and this difference could have a material impact on our gross profit and inventory balances based on additional provisions for excess or obsolete inventories or a benefit from the sale of inventories previously written down.
Income Taxes
The determination of our tax provision is highly dependent upon the geographic composition of worldwide earnings and tax regulations governing each region and is subject to judgments and estimates. The calculation of tax liabilities involves significant judgment in estimating the impact of uncertainties in the application of complex tax laws. Resolution of these uncertainties in a manner inconsistent with our expectations could have a material impact on our business, results of operations and financial position. We believe we have adequately reserved for our uncertain tax positions; however, no assurance can be given that the final tax outcome of these matters will not be different than what we expect. We adjust these reserves in light of changing facts and circumstances, such as the closing of a tax audit or the refinement of an estimate. To the extent that the final tax outcome for these matters is different than the amounts recorded, such differences will impact the provision for income taxes in the period in which such determination is made. We provide a valuation allowance for deferred tax assets when we do not consider realization of such assets to be more likely than not. Due to uncertainty with respect to ultimate realizability of U.S. deferred tax assets driven by our historical U.S. entity net operating losses this decade, with the exception of fiscal 2018, we have maintained a full valuation allowance against the U.S. deferred tax assets as of December 31, 2019. Due to uncertainty with respect to the ultimate realizability of our China deferred tax assets driven by recent market declines, we have recorded a valuation allowance against the China deferred tax assets as of December 31, 2019.
We file income tax returns in the U.S. federal jurisdiction, various states and various foreign jurisdictions, including China and Finland. At December 31, 2019, our tax years 2016 through 2019, 2015 through 2019, and 2009 through 2019, remain open for examination in the federal, state and foreign jurisdictions, respectively. However, to the extent allowed by law, the taxing authorities may have the right to examine prior periods where net operating losses and credits were generated and carried forward, and make adjustments up to the net operating loss and credit carryforward amounts. We are not currently under federal, state, or foreign examination by any tax authority.
See Note 15 for additional information, including the Tax Cuts and Jobs Act enacted in December 2017.
40
Off-Balance Sheet Arrangements
Since inception, we have not had any relationships with unconsolidated entities or financial partnerships, such as entities often referred to as structured finance or special purpose entities, which would have been established for the purpose of facilitating off-balance sheet arrangements or for another contractually narrow or limited purpose.
Inflation
We do not believe that inflation has had a material effect on our business, financial condition or results of operations. If our costs were to become subject to significant inflationary pressures, we may not be able to fully offset such higher costs through price increases. Our inability or failure to do so could materially adversely affect our business, financial condition and results of operations.
Recent Accounting Pronouncements
See Note 1 to Consolidated Financial Statements.
ITEM 7A. QUANTITATIVE AND QUALITATIVE DISCLOSURES ABOUT MARKET RISK
Interest Rate Risk
We had cash and cash equivalents of $117.3 million as of December 31, 2019. The goals of our investment policy are liquidity and capital preservation. We do not enter into investments for trading or speculative purposes. We believe that we do not have any material exposure to changes in the fair value of our cash equivalents as a result of changes in interest rates due to the short‑term nature of these assets.
We are subject to interest rate risk in connection with the borrowings under our loan facility. We have a $40.0 million revolving credit facility. As of December 31, 2019, we had no outstanding principal amount under the revolving loan facility. Borrowings under the Revolving Credit Facility bear interest at a per annum rate, depending on certain liquidity thresholds, ranging from adjusted LIBOR plus 1.35% to 2.25%, or prime rate minus 1.40% to 0.50%.
Foreign Currency Risk
Due to our international operations, a significant portion of our revenues, cost of revenues and operating expenses are denominated in currencies other than the USD, principally the Chinese RMB and the Euro. As a result, our international operations give rise to transactional market risk associated with exchange rate movements of the USD, the Chinese RMB and the Euro. We attempt to minimize these exposures by partially or fully offsetting foreign currency denominated assets and liabilities at our subsidiaries that operate in different functional currencies. The effectiveness of this strategy can be limited by the volume of underlying transactions at various subsidiaries and by our ability to accelerate or delay intercompany cash settlements. As a result, we are unable to completely offset the foreign currency denominated assets and liabilities.
At December 31, 2019, our foreign currency exposure was related to our net investment in our foreign subsidiaries. The potential loss in fair value resulting from a hypothetical 10% adverse change in foreign exchange rates would be approximately $1.5 million. Foreign exchange rate gains or losses on foreign investments as of December 31, 2019 are reflected as a cumulative translation adjustment, net of tax, and do not affect our results of operations.
41
ITEM 8. FINANCIAL STATEMENTS AND SUPPLEMENTARY DATA
nLIGHT, INC.
Index to Consolidated Financial Statements
Page | |
Report of Independent Registered Public Accounting Firm | |
Consolidated Balance Sheets | |
Consolidated Statements of Operations | |
Consolidated Statements of Comprehensive Income (Loss) | |
Consolidated Statements of Stockholders' Equity | |
Consolidated Statements of Cash Flows | |
Notes to Consolidated Financial Statements | |
42
Report of Independent Registered Public Accounting Firm
To the Stockholders and Board of Directors
nLIGHT, Inc.:
Opinion on the Consolidated Financial Statements
We have audited the accompanying consolidated balance sheets of nLIGHT, Inc. and subsidiaries (the Company) as of December 31, 2019 and 2018, the related consolidated statements of operations, comprehensive income (loss), stockholders’ equity, and cash flows for each of the years in the three‑year period ended December 31, 2019, and the related notes (collectively, the consolidated financial statements). In our opinion, the consolidated financial statements present fairly, in all material respects, the financial position of the Company as of December 31, 2019 and 2018, and the results of its operations and its cash flows for each of the years in the three‑year period ended December 31, 2019, in conformity with U.S. generally accepted accounting principles.
Change in Accounting Principle
As discussed in Note 3 to the consolidated financial statements, the Company changed its method of accounting for revenue recognition as of January 1, 2019, due to the adoption of Accounting Standards Update (ASU) 2014-09, Revenue from Contracts with Customers (Topic 606) and related amendments.
Basis for Opinion
These consolidated financial statements are the responsibility of the Company’s management. Our responsibility is to express an opinion on these consolidated financial statements based on our audits. We are a public accounting firm registered with the Public Company Accounting Oversight Board (United States) (PCAOB) and are required to be independent with respect to the Company in accordance with the U.S. federal securities laws and the applicable rules and regulations of the Securities and Exchange Commission and the PCAOB.
We conducted our audits in accordance with the standards of the PCAOB. Those standards require that we plan and perform the audit to obtain reasonable assurance about whether the consolidated financial statements are free of material misstatement, whether due to error or fraud. The Company is not required to have, nor were we engaged to perform, an audit of its internal control over financial reporting. As part of our audits, we are required to obtain an understanding of internal control over financial reporting but not for the purpose of expressing an opinion on the effectiveness of the Company’s internal control over financial reporting. Accordingly, we express no such opinion.
Our audits included performing procedures to assess the risks of material misstatement of the consolidated financial statements, whether due to error or fraud, and performing procedures that respond to those risks. Such procedures included examining, on a test basis, evidence regarding the amounts and disclosures in the consolidated financial statements. Our audits also included evaluating the accounting principles used and significant estimates made by management, as well as evaluating the overall presentation of the consolidated financial statements. We believe that our audits provide a reasonable basis for our opinion.
/s/ KPMG LLP | ||
We have served as the Company's auditor since 2003.
Portland, Oregon
March 9, 2020
43
nLIGHT, Inc.
Consolidated Balance Sheets
(In thousands)
As of December 31, | |||||||
2019 | 2018 | ||||||
Assets | |||||||
Current assets: | |||||||
Cash and cash equivalents | $ | 117,252 | $ | 149,478 | |||
Accounts receivable, net of allowances of $269 and $303 | 27,126 | 26,528 | |||||
Inventory | 46,131 | 35,329 | |||||
Prepaid expenses and other current assets | 8,084 | 7,286 | |||||
Total current assets | 198,593 | 218,621 | |||||
Property and equipment, net of accumulated depreciation of $58,633 and $53,812 | 27,747 | 21,462 | |||||
Intangible assets, net of accumulated amortization of $3,150 and $2,049 | 10,006 | 2,686 | |||||
Goodwill | 9,872 | 1,387 | |||||
Other assets, net | 3,748 | 5,974 | |||||
Total assets | $ | 249,966 | $ | 250,130 | |||
Liabilities and Stockholders’ Equity | |||||||
Current liabilities: | |||||||
Accounts payable | $ | 12,700 | $ | 12,068 | |||
Accrued liabilities | 11,605 | 10,708 | |||||
Deferred revenues | 679 | 720 | |||||
Current portion of long-term debt | 51 | 91 | |||||
Total current liabilities | 25,035 | 23,587 | |||||
Non-current income taxes payable | 6,429 | 6,472 | |||||
Long-term debt | — | 18 | |||||
Other long-term liabilities | 1,894 | 2,270 | |||||
Total liabilities | 33,358 | 32,347 | |||||
Stockholders' equity: | |||||||
Preferred stock - $0.0001 par value; 5,000 shares authorized, zero shares issued and outstanding at December 31, 2019 and December 31, 2018 | — | — | |||||
Common stock - $0.0001 par value; 190,000 shares authorized, 38,084 shares issued and outstanding at December 31, 2019 and 36,705 shares issued and outstanding at December 31, 2018 | 15 | 15 | |||||
Additional paid-in capital | 336,732 | 324,656 | |||||
Accumulated other comprehensive loss | (2,685 | ) | (2,157 | ) | |||
Accumulated deficit | (117,454 | ) | (104,731 | ) | |||
Total stockholders’ equity | 216,608 | 217,783 | |||||
Total liabilities and stockholders’ equity | $ | 249,966 | $ | 250,130 | |||
See accompanying notes to consolidated financial statements.
44
nLIGHT, Inc.
Consolidated Statements of Operations
(In thousands, except per share data)
Year Ended December 31, | ||||||||||||
2019 | 2018 | 2017 | ||||||||||
Revenues | $ | 176,619 | $ | 191,359 | $ | 138,580 | ||||||
Cost of revenues | 124,280 | 124,398 | 94,306 | |||||||||
Gross profit | 52,339 | 66,961 | 44,274 | |||||||||
Operating expenses: | ||||||||||||
Research and development | 28,137 | 21,054 | 15,123 | |||||||||
Sales, general, and administrative | 34,111 | 28,844 | 19,353 | |||||||||
Total operating expenses | 62,248 | 49,898 | 34,476 | |||||||||
Income (loss) from operations | (9,909 | ) | 17,063 | 9,798 | ||||||||
Other income (expense): | ||||||||||||
Interest income (expense), net | 2,609 | 728 | (1,269 | ) | ||||||||
Other income (expense), net | 535 | (253 | ) | (1,834 | ) | |||||||
Income (loss) before income taxes | (6,765 | ) | 17,538 | 6,695 | ||||||||
Income tax expense | 6,119 | 3,600 | 4,858 | |||||||||
Net income (loss) | $ | (12,884 | ) | $ | 13,938 | $ | 1,837 | |||||
Less: Income allocated to participating securities | — | (4,415 | ) | (1,837 | ) | |||||||
Net income (loss) attributable to common stockholders | $ | (12,884 | ) | $ | 9,523 | $ | — | |||||
Net income (loss) per share, basic | $ | (0.35 | ) | $ | 0.38 | $ | 0.00 | |||||
Net income (loss) per share, diluted | $ | (0.35 | ) | $ | 0.32 | $ | 0.00 | |||||
Shares used in per share calculations: | ||||||||||||
Basic | 37,119 | 24,862 | 2,735 | |||||||||
Diluted | 37,119 | 29,959 | 2,735 | |||||||||
See accompanying notes to consolidated financial statements.
45
nLIGHT, Inc.
Consolidated Statements of Comprehensive Income (Loss)
(In thousands)
Year Ended December 31, | ||||||||||||
2019 | 2018 | 2017 | ||||||||||
Net income (loss) | $ | (12,884 | ) | $ | 13,938 | $ | 1,837 | |||||
Other comprehensive income (loss): | ||||||||||||
Foreign currency translation adjustments, net of tax | (528 | ) | (1,438 | ) | 2,290 | |||||||
Comprehensive income (loss) | $ | (13,412 | ) | $ | 12,500 | $ | 4,127 | |||||
See accompanying notes to consolidated financial statements.
46
nLIGHT, Inc.
Consolidated Statements of Stockholders' Equity
(In thousands)
Convertible preferred stock | Preferred stock | Common stock | Additional paid-in capital | Accumulated other comprehensive income (loss) | Accumulated deficit | Total stockholders' equity | |||||||||||||||||||||||||||||||
Shares | Amount | Shares | Amount | Shares | Amount | ||||||||||||||||||||||||||||||||
Balance, December 31, 2016 | 19,837 | $ | 10 | — | $ | — | 2,539 | $ | 1 | $ | 153,195 | $ | (3,009 | ) | $ | (120,506 | ) | $ | 29,691 | ||||||||||||||||||
Net income | — | — | — | — | — | — | — | — | 1,837 | 1,837 | |||||||||||||||||||||||||||
Issuance of Series G convertible preferred stock | 4,805 | 2 | — | — | — | — | 27,479 | — | — | 27,481 | |||||||||||||||||||||||||||
Other financing costs | — | — | — | — | — | — | (721 | ) | — | — | (721 | ) | |||||||||||||||||||||||||
Exercise of stock options | — | — | — | — | 440 | 1 | 335 | — | — | 336 | |||||||||||||||||||||||||||
Stock-based compensation | — | — | — | — | — | — | 369 | — | — | 369 | |||||||||||||||||||||||||||
Cumulative translation adjustment, net of tax | — | — | — | — | — | — | — | 2,290 | — | 2,290 | |||||||||||||||||||||||||||
Balance, December 31, 2017 | 24,642 | $ | 12 | — | $ | — | 2,979 | $ | 2 | $ | 180,657 | $ | (719 | ) | $ | (118,669 | ) | $ | 61,283 | ||||||||||||||||||
Net income | — | — | — | — | — | — | — | — | 13,938 | 13,938 | |||||||||||||||||||||||||||
Conversion of convertible preferred stock to common stock | (24,642 | ) | (12 | ) | — | — | 24,642 | 12 | — | — | — | — | |||||||||||||||||||||||||
Issuance of common stock pursuant to initial public offering | — | — | — | — | 6,900 | 1 | 100,947 | — | — | 100,948 | |||||||||||||||||||||||||||
Issuance of common stock pursuant to follow-on offering | — | — | — | — | 1,520 | — | 37,885 | — | — | — | 37,885 | ||||||||||||||||||||||||||
Issuance of common stock pursuant to exercise of warrants | — | — | — | — | 160 | — | — | — | — | — | |||||||||||||||||||||||||||
Exercise of stock options | — | — | — | — | 387 | — | 362 | — | — | 362 | |||||||||||||||||||||||||||
Issuance and conversion of restricted stock awards and units | — | — | — | — | 117 | — | — | — | — | — | |||||||||||||||||||||||||||
Stock-based compensation | — | — | — | — | — | — | 4,805 | — | — | 4,805 | |||||||||||||||||||||||||||
Cumulative translation adjustment, net of tax | — | — | — | — | — | — | — | (1,438 | ) | — | (1,438 | ) | |||||||||||||||||||||||||
Balance, December 31, 2018 | — | $ | — | — | $ | — | 36,705 | $ | 15 | $ | 324,656 | $ | (2,157 | ) | $ | (104,731 | ) | $ | 217,783 | ||||||||||||||||||
Cumulative effect adjustment due to adoption of ASU 2018-07 | — | — | — | — | — | — | (161 | ) | — | 161 | — | ||||||||||||||||||||||||||
Net loss | — | — | — | — | — | — | — | — | (12,884 | ) | (12,884 | ) | |||||||||||||||||||||||||
Issuance of common stock pursuant to exercise of stock options | — | — | — | — | 868 | — | 1,560 | — | — | 1,560 | |||||||||||||||||||||||||||
Issuance of common stock pursuant to vesting of restricted stock awards and units, net of stock withheld for tax | — | — | — | — | 428 | — | (524 | ) | — | — | (524 | ) | |||||||||||||||||||||||||
Issuance of common stock under the Employee Stock Purchase Plan | — | — | — | — | 83 | — | 1,471 | — | — | 1,471 | |||||||||||||||||||||||||||
Stock-based compensation | — | — | — | — | — | — | 9,730 | — | — | 9,730 | |||||||||||||||||||||||||||
Cumulative translation adjustment, net of tax | — | — | — | — | — | — | — | (528 | ) | — | (528 | ) | |||||||||||||||||||||||||
Balance, December 31, 2019 | — | $ | — | — | $ | — | 38,084 | $ | 15 | $ | 336,732 | $ | (2,685 | ) | $ | (117,454 | ) | $ | 216,608 | ||||||||||||||||||
See accompanying notes to consolidated financial statements.
47
nLIGHT, Inc.
Consolidated Statements of Cash Flows
(In thousands)
Year Ended December 31, | |||||||||||
2019 | 2018 | 2017 | |||||||||
Cash flows from operating activities: | |||||||||||
Net income (loss) | $ | (12,884 | ) | $ | 13,938 | $ | 1,837 | ||||
Adjustments to reconcile net income (loss) to net cash provided by (used in) operating activities: | |||||||||||
Depreciation | 6,583 | 5,867 | 5,352 | ||||||||
Amortization | 2,981 | 2,421 | 2,570 | ||||||||
Provision for losses on accounts receivable | 83 | 22 | 232 | ||||||||
Stock-based compensation | 9,730 | 4,805 | 369 | ||||||||
Deferred income taxes | 3,041 | (1,307 | ) | (424 | ) | ||||||
Loss (gain) on disposal of assets | (483 | ) | 12 | 9 | |||||||
Loss on debt extinguishment | — | 12 | 911 | ||||||||
Changes in operating assets and liabilities: | |||||||||||
Accounts receivable, net | (395 | ) | (13,734 | ) | (3,523 | ) | |||||
Inventory | (10,670 | ) | (6,145 | ) | (9,875 | ) | |||||
Prepaid expenses and other current assets | (111 | ) | (2,483 | ) | (639 | ) | |||||
Other assets | (2,669 | ) | (2,262 | ) | (1,148 | ) | |||||
Accounts payable | 844 | 172 | 2,491 | ||||||||
Accrued and other long-term liabilities | 92 | (310 | ) | 3,160 | |||||||
Deferred revenues | (178 | ) | (215 | ) | 731 | ||||||
Non-current income taxes payable | (205 | ) | 2,542 | 1,358 | |||||||
Net cash provided by (used in) operating activities | (4,241 | ) | 3,335 | 3,411 | |||||||
Cash flows from investing activities: | |||||||||||
Acquisition of business, net of cash acquired | (17,400 | ) | — | — | |||||||
Purchases of property, equipment and patents | (13,632 | ) | (11,714 | ) | (5,483 | ) | |||||
Proceeds from sale of assets | 628 | 35 | 6 | ||||||||
Net cash used in investing activities | (30,404 | ) | (11,679 | ) | (5,477 | ) | |||||
Cash flows from financing activities: | |||||||||||
Principal payments on debt and capital leases | (55 | ) | (33,417 | ) | (15,318 | ) | |||||
Net proceeds from debt financing | — | 16,053 | 12,499 | ||||||||
Cash paid on debt extinguishment | — | — | (388 | ) | |||||||
Proceeds from public offerings, net of offering costs | — | 138,303 | — | ||||||||
Proceeds from issuance of convertible preferred stock | — | — | 27,481 | ||||||||
Proceeds from employee stock plan purchases | 1,471 | — | — | ||||||||
Payments of other financing costs | — | — | (191 | ) | |||||||
Proceeds from stock option exercises | 1,560 | 362 | 336 | ||||||||
Tax payments related to stock award issuances | (524 | ) | — | — | |||||||
Net cash provided by financing activities | 2,452 | 121,301 | 24,419 | ||||||||
Effect of exchange rate changes on cash | (33 | ) | (166 | ) | 834 | ||||||
Net increase (decrease) in cash and cash equivalents | (32,226 | ) | 112,791 | 23,187 | |||||||
Cash and cash equivalents, beginning of period | 149,478 | 36,687 | 13,500 | ||||||||
Cash and cash equivalents, end of period | $ | 117,252 | $ | 149,478 | $ | 36,687 | |||||
Supplemental disclosures: | |||||||||||
Cash paid (received) for interest | $ | (2,802 | ) | $ | 941 | $ | 1,437 | ||||
Cash paid for income taxes | 2,335 | 3,665 | 3,493 | ||||||||
Accrued purchases of property, equipment and patents | 828 | 577 | 969 | ||||||||
Accrued deferred offering costs | — | — | 530 | ||||||||
See accompanying notes to consolidated financial statements.
48
nLIGHT, Inc.
Notes to Consolidated Financial Statements
(Unaudited)
Note 1 - Basis of Presentation and Significant Accounting Policies
Basis of Presentation
The accompanying consolidated financial statements include the accounts of nLIGHT, Inc. and its wholly owned subsidiaries (collectively, "nLIGHT" or the "Company"). The wholly owned subsidiaries are Arbor Photonics, LLC, nLIGHT Cayman Ltd., nLIGHT Laser Technology (Shanghai) Co. Ltd, nLIGHT Oy (Finland), nLIGHT Korea Inc. and Nutronics, Inc., which the Company acquired in November 2019. All intercompany balances have been eliminated. Certain immaterial reclassifications were made to the prior period financial statements to conform to the current period presentation.
Use of Estimates
The preparation of consolidated financial statements in conformity with accounting principles generally accepted in the United States of America requires management to make estimates and assumptions that affect the reported amounts of assets and liabilities at the date of the consolidated financial statements and the reported amounts of revenues and expenses during the reporting period. On an ongoing basis, the Company evaluates its estimates, including those related to inventory valuation, allowances for doubtful accounts, warranty, sales return reserves and the recoverability of long-lived assets. Management of the Company bases its estimates on historical experience and on various other assumptions. Actual results could differ from those estimates.
Reclassifications
Certain immaterial reclassifications were made to the prior period financial statements to conform to the current period presentation.
Revenue Recognition
See Note 3 for a detailed description of the Company's revenue recognition policies.
Cash and Cash Equivalents
The Company considers all highly liquid investments with a maturity of three months or less when acquired to be cash equivalents. Cash equivalents included $96.7 million and $123.4 million of highly liquid investments at December 31, 2019 and 2018, respectively. Cash equivalents are carried at cost, which approximates market.
Property and Equipment
Property and equipment are stated at cost. Improvements and replacements are capitalized. Repair and maintenance costs are expensed as incurred. Depreciation is computed using the straight‑line method over the estimated useful life of each asset, generally 2 to 12 years.
Goodwill
Goodwill is recorded when the purchase price of an acquisition exceeds the fair market value of the net assets acquired. Goodwill is not amortized and is tested for impairment at least annually and more frequently if material changes in events or circumstances arise. The Company performs an annual impairment review of goodwill in the fourth quarter of each year using either a qualitative assessment or a quantitative goodwill impairment test. If the qualitative assessment is selected and determines that the fair value of each reporting unit more likely than not exceeds its carrying value, no further assessment is necessary. If a quantitative test is determined necessary and an impairment is indicated, the impairment loss is recorded to the extent that the reporting unit’s carrying amount exceeds the reporting unit’s fair value. An impairment loss cannot exceed the total amount of goodwill allocated to the reporting unit. Based on qualitative assessments performed in fiscal year 2019, 2018 and 2017, the fair values of the laser products reporting unit exceeded its carrying value, and no impairment charges were recorded.
See Note 10 for additional information.
Intangible Assets
Definite-lived intangible assets consist of acquisition-related development programs and intellectual property. The intangible assets are being amortized using the straight-line method over periods of 2 to 5 years, which reflect the pattern in which economic benefits of the assets are expected to be realized.
See Note 10 for additional information.
49
Impairment of Long‑Lived Assets
Long‑lived assets, such as property and equipment, and intangibles subject to amortization, are reviewed for impairment whenever events or changes in circumstances indicate that the carrying amount of an asset may not be recoverable. Recoverability of assets to be held and used is measured by a comparison of the carrying amount of an asset to estimated undiscounted future cash flows expected to be generated by the asset. If the carrying amount of an asset exceeds its estimated future cash flows, an impairment charge is recognized for the amount by which the carrying amount of the asset exceeds the fair value of the asset. There was no impairment of long‑lived assets recorded for the years ended December 31, 2019, 2018 and 2017.
Research and Development Costs
Research and development is defined as activities aimed at developing or significantly improving a product or a process or technique whether the product or process is intended for sale or use. A process also may be used internally as a part of a manufacturing activity. Research and development costs are expensed as incurred.
Income Taxes
The Company accounts for income taxes using the asset and liability approach under which deferred income taxes are provided based upon enacted tax laws and rates applicable to the periods in which taxes become payable.
The Company recognizes the effect of income tax positions only if those positions are more likely than not of being sustained. Recognized income tax positions are measured at the largest amount that is greater than 50% likely to be realized. Changes in recognition or measurement are reflected in the period in which the change in judgment occurs.
Translation of Foreign Currencies
The Company’s international subsidiaries use their local currency as their functional currency. The financial statements of the international subsidiaries are translated to their U.S. dollar equivalents at end‑of‑period currency exchange rates for assets and liabilities and at average currency exchange rates for revenues and expenses. Translation adjustments are recorded as a component of accumulated other comprehensive loss within stockholders’ equity. Realized and unrealized foreign currency gains or losses, net are recorded in other expense within the consolidated statement of operations. Realized and unrealized foreign currency gains and losses were as follows for the periods presented (in thousands):
Year Ended December 31, | ||||||||||||
2019 | 2018 | 2017 | ||||||||||
Realized foreign currency loss | $ | 575 | $ | 734 | $ | 889 | ||||||
Unrealized foreign currency (gain) loss | (381 | ) | 124 | 36 | ||||||||
New Accounting Pronouncements
ASU 2018-07
The Financial Accounting Standards Board (FASB) issued Accounting Standards Update (ASU) No. 2018-07, Improvements to Nonemployee Share-Based Payment Accounting (Topic 718), in June 2018. ASU 2018-07 simplifies the accounting for share-based payments made to nonemployees so the accounting for such payments is substantially the same as those made to employees. The Company adopted ASU 2018-07 on January 1, 2019 using the modified retrospective approach with fair value measurement of unsettled liability-classified nonemployee awards, and recorded a cumulative effect adjustment of $161 thousand to beginning retained earnings.
ASU 2017-04
The FASB issued ASU 2017-04, Intangibles - Goodwill and Other (Topic 350): Simplifying the Test for Goodwill Impairment, in January 2017. ASU 2017-04 eliminated Step 2 from the goodwill impairment test, and now requires an entity to test for goodwill impairment by comparing the fair value of a reporting unit with its carrying amount. An entity should recognize an impairment charge for the amount by which the carrying amount exceeds the reporting unit's fair value; however, the loss recognized should not exceed the total amount of goodwill allowacted to the reporting unit. ASU 2017-04 is effective for all public business entities that are SEC filers for annual or any interim goodwill impairment tests in fiscal years beginning after December 15, 2019 on a prospective basis. The Company adopted ASU 2017-04 for its annual goodwill impairment testing in the fourth quarter of 2019 with no material impact on its consolidated financial statements.
ASU 2017-01
The FASB issued ASU 2017-01, Business Combinations (Topic 805): Clarifying the Definition of a Business, in January 2017. ASU 2017-01 provides a screen to determine when an integrated set of assets and activities (set) is not a business. The screen requires that when substantially all of the fair value of the gross assets acquired (or disposed of) is concentrated in a single
50
identifiable asset or a group of similar identifiable assets, the set is not a business. The amendments in ASU 2017-01 also includes specific requirements if the screen is not met and also aligns the definition of certain elements with those of Topic 606. ASU 2017-01 was effective for for annual reporting periods of emerging growth companies beginning after December 15, 2018, including interim periods within those fiscal years, on a prospective basis. The Company adopted ASU 2017-01 in 2019 with no material impact on its consolidated financial statements.
ASU 2016-13, ASU 2018-19, ASU 2019-04 and ASU 2019-05
The FASB issued ASU 2016-13, Financial Instruments—Credit Losses (Topic 326): Measurement of Credit Losses on Financial Instruments, in June 2016. ASU 2016-13 replaces the incurred loss impairment methodology in current GAAP with a methodology that reflects expected credit losses and requires consideration of a broader range of reasonable and supportable information to inform credit loss estimates. The new standard requires that the income statement reflects the measurement of credit losses for newly recognized financial assets, as well as the changes of expected credit losses that have taken place during the period. The measurement of expected credit losses is based on relevant information related to both past and current events and circumstances. ASU 2016-13 was amended in November 2018 by ASU 2018-19, Codification Improvements to Topic 326, Financial Instruments—Credit Losses, and again in April 2019 by ASU 2019-04, Codification Improvements to Topic 326, Financial Instruments—Credit Losses, Topic 815, Derivatives and Hedging, and Topic 825, Financial Instruments, and in May 2019 by ASU 2019-05, Financial Instruments—Credit Losses (Topic 326): Targeted Transition Relief. ASU 2016-13, as amended, is effective for annual reporting periods of emerging growth companies beginning after December 15, 2020, including interim periods within those fiscal years. An entity will apply the new standard, as amended, using a modified-retrospective approach and record a cumulative effect adjustment to retained earnings as of the beginning of the first reporting period in which the guidance is effective. The Company is currently evaluating the impact on its consolidated financial statements and cannot reasonably estimate the impact on its financial statements at this time.
ASU 2016-02, ASU 2018-10, ASU 2018-11 and ASU 2019-01
The FASB issued ASU 2016-02, Leases (Topic 842), in February 2016. ASU 2016-02 requires the recognition of right-of-use (ROU) assets and lease liabilities on the balance sheet for virtually all leases, other than leases that meet the definition of short-term. ASU 2016-02 was amended in July 2018 by both ASU 2018-10, Codification Improvements to Topic 842, Leases, and ASU 2018-11, Leases (Topic 842): Targeted Improvements, and again in March 2019 by ASU 2019-01, Leases (Topic 842): Codification Improvements. As initially issued, the standard required lessees, upon adoption, to recognize and measure leases at the beginning of the earliest period presented using a modified retrospective approach, which includes a number of optional practical expedients that entities may elect to apply. As amended, the standard allows an alternative transition method that permits entities to use its effective date as the date of initial application, and not restate comparative prior period financial information. ASU 2016-02, as amended, is effective for annual reporting periods of emerging growth companies beginning after December 15, 2019. The Company expects to implement the provisions of ASU 2016‑02, as amended, as of January 1, 2020 using the alternative modified retrospective transition method. The Company is currently evaluating the impact of this ASU, as amended, and cannot reasonably estimate the quantitative impact on the financial statements; however, the Company does expect this ASU, as amended, to have significant additional disclosure requirements.
The standard provides several optional practical expedients in transition. The Company expects to elect the package of practical expedients, which permits the Company to not reassess, under the new standard, its prior conclusions about lease identification, lease classification and initial direct costs. Additionally, the Company does not expect to elect the use-of-hindsight or the practical expedient pertaining to land easements, the latter not being applicable to nLIGHT. The new standard also provides practical expedients for an entity’s ongoing accounting. Further, the Company expects to elect the short-term lease recognition exemption as well as the practical expedient to not separate lease and non-lease components for all its leases.
Note 2 - Acquisition
On November 14, 2019, the Company acquired Nutronics, Inc. (Nutronics), a private company, pursuant to the Stock Purchase Agreement between nLIGHT, Inc. and selling stockholders of Nutronics, Inc. and sellers as of that date. The total acquisition consideration consisted of $17.4 million in cash. Based in Longmont, Colorado, Nutronics is a leading developer of coherently combined lasers and beam control systems (BCS) for high-energy laser (HEL) systems serving the defense market.
The acquisition was accounted for using the acquisition method of accounting in accordance with the FASB Accounting Standards Codification (ASC) Topic No. 805, Business Combinations. The acquired assets and liabilities of Nutronics were recorded at their respective fair values, including an amount for goodwill representing the difference between the acquisition consideration and the fair value of the identifiable net assets.
51
The consolidated statements of operations include the financial results of Nutronics for the stub period subsequent to the acquisition date of November 14, 2019 to the Company's fiscal year end, December 31, 2019. For the stub period, Nutronics contributed $2.6 million of revenue and $0.3 million of gross profit to the Company's consolidated results of operations.
For the year ended December 31, 2019, the Company incurred approximately $0.5 million in transaction costs related to the acquisition, which primarily consisted of consulting, legal, accounting and valuation-related expenses. These expenses were recorded in sales, general and administrative expense in the accompanying consolidated statements of operations.
The acquisition price was allocated to the tangible and identified intangible assets acquired and liabilities assumed as of the closing date of the acquisition based upon their respective fair values. The fair values assigned to assets acquired and liabilities assumed were based on management’s best estimates and assumptions as of the reporting date and are considered preliminary pending finalization of valuation analyses pertaining to intangible assets acquired. Changes to amounts recorded as assets or liabilities may result in corresponding adjustments to goodwill. The table below summarizes the assets acquired and liabilities assumed (in thousands):
Valuation at | ||||
November 14, 2019 | ||||
Cash | $ | 33 | ||
Accounts receivable | 635 | |||
Contract assets | 456 | |||
Inventory | 255 | |||
Other current assets | 201 | |||
Property, plant and equipment | 1,019 | |||
Security deposits | 46 | |||
Tangible assets acquired | 2,645 | |||
Accounts payable | (278 | ) | ||
Other liabilities | (477 | ) | ||
Deferred revenue | (141 | ) | ||
Liabilities assumed | (896 | ) | ||
Total tangible assets acquired and liabilities assumed | 1,749 | |||
Intangible assets | 7,200 | |||
Goodwill | 8,484 | |||
Net assets acquired | $ | 17,433 | ||
The intangible assets as of the November 14, 2019 acquisition date were as follows (in thousands):
Amount | Weighted-Average Useful Life (in years) | ||||
Development programs | $ | 7,200 | 3.1 | ||
Identifiable intangible assets
Customer-related development programs represent the fair value of future projected revenues that will be derived from the research and development awards to existing customers of the acquired company. The fair value of the developed programs was determined based on the Income Approach, utilizing the excess earnings methodology and resulted in a value of $7.2 million which will be amortized over their useful lives. The excess earnings method provides an estimate of the fair value of the development program assets by deducting economic costs from revenue expected to be generated by the assets. These estimated cash flows are then discounted to the present value equivalent. Key assumptions of the valuation included total revenue attributable to the development programs, cost margins, operating expenses, tax rates and discount rates.
Goodwill
The excess of purchase price over the fair value amounts assigned to the assets acquired and liabilities assumed represents the amount of goodwill resulting from the acquisition. The Company believes the factors that contributed to goodwill include synergies that are specific to the consolidated business such as the acquisition of a talented workforce that expands its expertise in
52
governmental grants-related development programs. The Company does not expect any portion of the goodwill to be deductible for tax purposes. The goodwill attributable to the acquisition has been recorded as a non-current asset and is not amortized, but is subject to an annual review for impairment. The goodwill was allocated to the Company's Advanced Development reporting unit.
Segments
Upon the acquisition of Nutronics, we assessed our operating and reportable segments as well as our reporting units for goodwill impairment consideration in accordance with FASB's ASC Topics 280, Segment Reporting, and 350, Intangibles-Goodwill and Other. See Note 18 for additional information.
Pro forma information
Pro forma financial information has not been provided for the purchase as it was not material to the Company’s overall financial position.
Note 3 - Revenue
Adoption of ASC 606
The Company adopted ASU 2014-09, Revenue from Contracts with Customers (Topic 606) and related amendments, using the cumulative effect method with a date of initial application of January 1, 2019. As such, the comparative period information has not been adjusted and continues to be reported under ASC 605, Revenue Recognition. The impact of adoption was immaterial, and the Company expects the impact of the adoption of the new standard to be immaterial to the consolidated financial statements on an ongoing basis. A majority of the Company's revenue continues to be recognized at a point in time when control transfers based on the terms of the underlying contract.
Revenue Recognition
Revenue is recognized when transfer of control to the customer occurs in an amount reflecting the consideration to which the Company expects to be entitled. In order to achieve this core principle, the Company applies the following five step approach: (1) identify the contract with a customer, (2) identify the performance obligations in the contract, (3) determine the transaction price, (4) allocate the transaction price to the performance obligations in the contract, and (5) recognize revenue when a performance obligation is satisfied.
The Company considers customer purchase orders, which in some cases are governed by master sales agreements, to be the contracts with a customer. As part of its consideration of the contract, the Company evaluates certain factors including the customer's ability to pay (or credit risk). For each contract, the Company considers the promise to transfer products and/or services, each of which is distinct, as the identified performance obligations. As the Company's standard payment terms are less than one year, the Company has elected the practical expedient under ASC 606-10-32-18 to not assess whether a contract has a significant financing component. Payment terms in excess of one year are evaluated as they occur.
The Company allocates the transaction price to each distinct product and/or service based on its relative standalone selling price. Master sales agreements or purchase orders from customers could include a single product or multiple products. Regardless, the contracted price with the customer is agreed to at the individual product level outlined in the customer contract or purchase order. The Company does not bundle prices; however, it does negotiate with customers on pricing for the same products based on a variety of factors (e.g., level of contractual volume). The Company has concluded that the prices negotiated with each individual customer are representative of the stand-alone selling price of the product.
Revenue is recognized when control of the product and/or service is transferred to the customer (i.e., when the Company's performance obligation is satisfied), which typically occurs at shipment or delivery, depending on shipping or contract terms.
The Company often receives orders with multiple delivery dates that may extend across several reporting periods. The Company allocates the transaction price of the contract to each delivery based on the product and/or service standalone selling price. The Company invoices for each scheduled delivery upon shipment or delivery and recognizes revenues for such delivery at that point, assuming transfer of control has occurred. As scheduled delivery dates are generally within one year, under the optional exemption provided by ASC 606-10-50-14a revenues allocated to future shipments of partially completed contracts are not disclosed as performance obligations for point in time revenue. Further, the Company recognizes over time revenue as per ASC 606-10-55-18 (invoice practical expedient) for its cost plus contracts and, accordingly, elects not to disclose information related to those performance obligations under ASC 606-10-50-14b.
Rights of return generally are not included in customer contracts. Accordingly, product revenue is recognized upon shipment or delivery, as applicable, and transfer of control. Rights of return are evaluated as they occur.
53
In addition, the Company has elected to account for shipping and handling as fulfillment activities and record them in cost of sales. The election of this practical expedient results in accounting treatment consistent with the Company’s historical accounting policies and therefore, this election does not impact the comparability of the financial statements.
Revenue Recognition at a Point in Time - Revenues recognized at a point in time consist of sales of semiconductor lasers, fiber lasers and other related products.
Revenue Recognition over Time - Revenues recognized over time generally consist of arrangements for goods and services that are structured based on the Company’s costs. Revenue for these arrangements is recognized as control transfers, which occurs as the work is performed. Billing under these arrangements generally occurs within one month after the work is completed.
The following tables represent a disaggregation of revenue from contracts with customers for the periods presented (in thousands):
Sales by End Market
Year Ended December 31, | ||||||||||||
2019 | 2018 | 2017 | ||||||||||
Industrial | $ | 76,668 | $ | 82,763 | $ | 56,622 | ||||||
Microfabrication | 57,153 | 74,108 | 60,886 | |||||||||
Aerospace and Defense | 42,798 | 34,488 | 21,072 | |||||||||
$ | 176,619 | $ | 191,359 | $ | 138,580 | |||||||
Sales by Geography
Year Ended December 31, | ||||||||||||
2019 | 2018 | 2017 | ||||||||||
North America | $ | 67,511 | $ | 70,694 | $ | 46,489 | ||||||
China | 64,134 | 70,196 | 55,344 | |||||||||
Rest of World | 44,974 | 50,469 | 36,747 | |||||||||
$ | 176,619 | $ | 191,359 | $ | 138,580 | |||||||
Sales by Timing of Revenue
Year Ended December 31, | ||||||||||||
2019 | 2018 | 2017 | ||||||||||
Point in time | $ | 168,699 | $ | 185,989 | $ | 137,528 | ||||||
Over time | 7,920 | 5,370 | 1,052 | |||||||||
$ | 176,619 | $ | 191,359 | $ | 138,580 | |||||||
Contract balances - The timing of revenue recognition may differ from the timing of invoicing to customers. Accounts receivable is recorded at the invoiced amount, net of an allowance for doubtful accounts. A receivable is recognized in the period we deliver goods or provide services or when our right to consideration is unconditional. A contract asset is recorded when we have performed under the contract but our right to consideration is conditional on something other than the passage of time. Contract liabilities include payments received in advance of performance under a contract and are satisfied as the associated revenue is recognized.
The Company's contract assets and liabilities are as follows (in thousands):
Balance Sheet | As of December 31, | ||||||||
Classification | 2019 | 2018 | |||||||
Contract assets | Prepaid expenses and other current assets | $ | 2,449 | $ | 331 | ||||
Contract liabilities | Deferred revenue | 881 | 1,240 | ||||||
54
During the year ended December 31, 2019, the Company recognized revenue of $1.2 million that was included in the customer advances and deferred revenue balances at the beginning of the period as the performance obligations under the associated agreements were satisfied.
Note 4 - Accounts Receivable
Trade accounts receivable are recorded at the invoiced amount and do not bear interest. The allowance for doubtful accounts is the Company’s best estimate of the amount of probable credit losses in the Company’s existing accounts receivable. The Company determines the allowance based on historical write‑off experience and knowledge of any applicable circumstances.
Activity related to the allowance for doubtful accounts was as follows (in thousands):
2019 | 2018 | ||||||
Allowance for doubtful accounts, beginning | $ | 303 | $ | 438 | |||
Provision for losses on accounts receivable | 83 | 22 | |||||
Write-offs and recoveries | (117 | ) | (157 | ) | |||
Allowance for doubtful accounts, ending | $ | 269 | $ | 303 | |||
Note 5 - Concentrations of Credit and Other Risks
The following customers accounted for 10% or more of our revenues for the periods presented:
Year Ended December 31, | ||||||
2019 | 2018 | 2017 | ||||
Quick Laser Technology Co., Ltd. | 11% | 13% | 14% | |||
Raytheon Company | 13% | * | * | |||
*Represents less than 10% of total revenues.
Financial instruments that potentially expose the Company to concentrations of credit risk consist principally of accounts receivable. As of December 31, 2019, two customers accounted for approximately 48% of net accounts receivable. As of December 31, 2018, one customer accounted for approximately 17% of net accounts receivable. No other customers accounted for 10% or more of net accounts receivable in either of these periods.
Note 6 - Fair Value of Financial Instruments
The carrying amounts of certain of the Company’s financial instruments, including cash equivalents, accounts receivable and accounts payable, are shown at cost which approximates fair value due to the short term nature of these instruments. The fair value of the Company’s term and revolving loans with Pacific Western Bank, also described in Note 14, approximates the carrying value due to the variable market rate used to calculate interest payments.
The Company does not have any other significant financial assets or liabilities that are measured at fair value.
Fair value is defined as the exchange price that would be received for an asset or paid to transfer a liability (an exit price) in the principal or most advantageous market for the asset or liability in an orderly transaction between market participants on the measurement date. Valuation techniques used to measure fair value must maximize the use of observable inputs and minimize the use of unobservable inputs. The standard describes a fair value hierarchy based on three levels of inputs, of which the first two are considered observable and the last unobservable, that may be used to measure fair value which are the following:
• | Level 1 Inputs: Observable inputs, such as quoted prices (unadjusted) in active markets for identical assets or liabilities at the measurement date. |
• | Level 2 Inputs: Observable inputs, other than Level 1 prices, such as quoted prices in active markets for similar assets and liabilities, quoted prices in markets that are not active, or other inputs that are observable or can be corroborated by observable market data for substantially the full term of the assets or liabilities. |
• | Level 3 Inputs: Unobservable inputs that are supported by little or no market activity and that are significant to the fair value of the assets or liabilities. |
55
The Company’s financial instruments that are carried at fair value consist of Level 1 assets which include highly liquid investments and bank drafts classified as cash equivalents. The Company's fair value hierarchy for its financial instruments consists of cash equivalents as follows (in thousands):
December 31, 2019 | ||||||||||||
Level 1 | Level 2 | Level 3 | Total | |||||||||
Money market securities | $ | 94,260 | $ | — | $ | — | $ | 94,260 | ||||
Commercial paper | 2,401 | — | — | 2,401 | ||||||||
Total | $ | 96,661 | $ | — | $ | — | $ | 96,661 | ||||
December 31, 2018 | ||||||||||||
Level 1 | Level 2 | Level 3 | Total | |||||||||
Money market securities | $ | 123,121 | $ | — | $ | — | $ | 123,121 | ||||
Commercial paper | 299 | — | — | 299 | ||||||||
Total | $ | 123,420 | $ | — | $ | — | $ | 123,420 | ||||
Note 7 - Prepaid Expenses and Other Current Assets
The components of prepaid expenses and other current assets are as follows (in thousands):
As of December 31, | |||||||
2019 | 2018 | ||||||
Contract assets | $ | 2,443 | $ | — | |||
Prepaid tax and duties | 3,090 | 2,777 | |||||
Prepaid expenses | 1,688 | 1,654 | |||||
Value-added tax receivable, net | 468 | 1,489 | |||||
Vendor prepayments | 164 | 1,263 | |||||
Other | 231 | 103 | |||||
$ | 8,084 | $ | 7,286 | ||||
Note 8 - Inventory
Inventory is stated at the lower of average cost and net realizable value. Inventory consisted of the following (in thousands):
As of December 31, | |||||||
2019 | 2018 | ||||||
Raw materials | $ | 16,643 | $ | 14,174 | |||
Work in process and semi-finished goods | 17,723 | 12,807 | |||||
Finished goods | 11,765 | 8,348 | |||||
$ | 46,131 | $ | 35,329 | ||||
56
Note 9 - Property and Equipment
Property and equipment consist of the following (in thousands):
As of December 31, | |||||||||
Useful life (years) | 2019 | 2018 | |||||||
Computer hardware and software | 3-5 | $ | 4,764 | $ | 4,143 | ||||
Manufacturing and lab equipment | 2-7 | 59,395 | 50,797 | ||||||
Office equipment and furniture | 5-7 | 1,462 | 1,127 | ||||||
Leasehold improvements | 2-12 | 20,759 | 19,207 | ||||||
86,380 | 75,274 | ||||||||
Accumulated depreciation | (58,633 | ) | (53,812 | ) | |||||
$ | 27,747 | $ | 21,462 | ||||||
Note 10 - Intangible Assets and Goodwill
Intangibles
The Company capitalizes external costs incurred to file new patent applications and to extend the term of or defend existing patents. In addition, during 2019, the Company acquired certain customer-related development programs as part of its acquisition of Nutronics. The details of amortizing intangible assets are as follows (in thousands, except for estimated useful lives):
As of December 31, | |||||||||||
Estimated useful life (in years) | 2019 | 2018 | |||||||||
Patents | 5 | $ | 5,956 | $ | 4,735 | ||||||
Development programs | 2 | - | 4 | 7,200 | — | ||||||
13,156 | 4,735 | ||||||||||
Accumulated amortization | (3,150 | ) | (2,049 | ) | |||||||
$ | 10,006 | $ | 2,686 | ||||||||
Estimated amortization expense for future years is as follows (in thousands):
2020 | $ | 3,568 | |
2021 | 3,241 | ||
2022 | 1,683 | ||
2023 | 1,280 | ||
2024 | 234 | ||
$ | 10,006 | ||
Goodwill
During 2019, the Company incurred additional goodwill as part of its acquisition of Nutronics. The carrying amount of goodwill by segment was as follows (in thousands):
Laser Products | Advanced Development | Totals | |||||||||
Balance, December 31, 2018 | $ | 1,387 | $ | — | $ | 1,387 | |||||
Business acquisition | — | 8,484 | 8,484 | ||||||||
Balance, December 31, 2019 | $ | 1,387 | $ | 8,484 | $ | 9,872 | |||||
57
Note 11 - Other Assets
Other assets consisted of the following (in thousands):
As of December 31, | |||||||
2019 | 2018 | ||||||
Demonstration assets, net | $ | 1,824 | $ | 1,982 | |||
Deferred tax assets, net | 72 | 3,114 | |||||
Other | 1,852 | 878 | |||||
$ | 3,748 | $ | 5,974 | ||||
Demonstration (demo) assets are equipment that is used for demonstration and other purposes with existing and prospective customers. Demo assets are recorded at cost and amortized over an estimated useful life of approximately two years.
Note 12 - Accrued Liabilities
Accrued liabilities consist of the following (in thousands):
As of December 31, | |||||||
2019 | 2018 | ||||||
Accrued payroll and benefits | $ | 8,208 | $ | 6,474 | |||
Product warranty, current | 1,683 | 2,669 | |||||
Income tax payable | 155 | 258 | |||||
Other accrued expenses | 1,559 | 1,307 | |||||
$ | 11,605 | $ | 10,708 | ||||
Note 13 - Product Warranties
We offer warranties on certain products and record a liability for the estimated future costs associated with warranty claims at the time revenue is recognized. The warranty liability is based on historical experience, any specifically identified failures, and our estimate of future costs.
Product warranty liability activity for the year ended December 31, 2019 and 2018 was as follows (in thousands):
Year Ended December 31, | |||||||
2019 | 2018 | ||||||
Product warranty liability, beginning | $ | 4,555 | $ | 4,186 | |||
Warranty charges incurred, net | (2,382 | ) | (3,152 | ) | |||
Provision for warranty charges, net of adjustments | 811 | 3,521 | |||||
Product warranty liability, ending | $ | 2,984 | $ | 4,555 | |||
Less: current portion of product warranty liability | (1,683 | ) | (2,669 | ) | |||
Non-current portion of product warranty liability | $ | 1,301 | $ | 1,886 | |||
Note 14 - Commitments and Contingencies
Commitments
We have a $40.0 million revolving line of credit (LOC) with Pacific Western Bank which is secured by our assets and expires in September 2021. Interest on the LOC is based primarily on the London Interbank Offered Rate (LIBOR) plus a fee based on certain liquidity levels. The LOC contains restrictive and financial covenants and bears an unused credit fee of 0.20% on an annualized basis. As of December 31, 2019 and 2018, no amounts were outstanding under the LOC, no letters of credit were outstanding, $40.0 million was available for borrowing, and we were in compliance with all covenants.
The Company leases its facilities in Vancouver, Washington; Hillsboro, Oregon; Longmont, Colorado; China; Finland; and South Korea as well as certain equipment under operating leases that expire at various dates through 2025. The Company had deposits
58
of $0.6 million and $0.4 million as of December 31, 2019 and 2018, respectively, relating primarily to rent deposits on the China and Vancouver, Washington facility leases. The following table presents rent expense, before sublease income, and sublease income for the periods presented (in thousands):
Year Ended December 31, | ||||||||||||
2019 | 2018 | 2017 | ||||||||||
Rent expense | $ | 3,250 | $ | 3,169 | $ | 2,724 | ||||||
Sublease income | 51 | 99 | 86 | |||||||||
The minimum future rent payments under noncancelable operating leases as of December 31, 2019 are as follows (in thousands):
2020 | $ | 3,060 | |
2021 | 2,358 | ||
2022 | 1,334 | ||
2023 | 701 | ||
2024 | 635 | ||
Thereafter | 172 | ||
$ | 8,260 | ||
Minimum rent payments under operating leases are recognized on a straight‑line basis over the term of the lease, including any periods of free rent. Deferred rent liability associated with operating leases was $0.3 million and $0.3 million as of December 31, 2019 and 2018, respectively.
Contingencies
Liabilities for loss contingencies are recorded when it is probable that a liability has been incurred and the amount of the loss can be reasonably estimated.
In December 2013, the Company submitted a disclosure letter to the Office of the Inspector General of the Department of Defense advising that it might not have been eligible for certain contracts it was awarded under the Small Business Innovation Research (SBIR) Program, notwithstanding its prior representations that the Company was eligible. The matter was referred to the Small Business Administration and the U.S. Department of Justice (DOJ) for investigation of potential violations of the False Claims Act. In March 2015, a civil settlement agreement related to the SBIR matter was signed. A liability of $420 thousand was recorded at December 31, 2014 and subsequently paid in full in 2017.
In October 2014, the Company received a request for information related to the SBIR matter from the U.S. Attorney’s Office, Criminal Division. The Company provided documentation and an explanation of why a criminal investigation was unwarranted. In March 2015, the Company received an additional request, to which it also responded. Although the Company is unable to predict the final outcome of this matter, it intends to vigorously defend against any future claims.
The Company becomes involved in various legal proceedings and claims incidental to normal business activities. As of December 31, 2019, the Company believes these matters will not have a material adverse effect on the consolidated financial statements.
Note 15 - Income Taxes
Income (loss) before income tax expense was as follows (in thousands):
Year Ended December 31, | |||||||||||
2019 | 2018 | 2017 | |||||||||
Domestic | $ | (14,298 | ) | $ | 10,901 | $ | (9,064 | ) | |||
Foreign | 7,533 | 6,637 | 15,759 | ||||||||
Income (loss) before income tax | $ | (6,765 | ) | $ | 17,538 | $ | 6,695 | ||||
59
Income tax provision was as follows (in thousands):
Year Ended December 31, | |||||||||||
2019 | 2018 | 2017 | |||||||||
Current tax expense (benefit): | |||||||||||
State | $ | (1 | ) | $ | 9 | $ | — | ||||
Foreign | 3,130 | 5,032 | 5,200 | ||||||||
Current tax expense | 3,129 | 5,041 | 5,200 | ||||||||
Deferred tax expense (benefit): | |||||||||||
Federal | 4 | — | — | ||||||||
Foreign | 2,986 | (1,441 | ) | (342 | ) | ||||||
Deferred tax expense (benefit) | 2,990 | (1,441 | ) | (342 | ) | ||||||
Income tax expense | $ | 6,119 | $ | 3,600 | $ | 4,858 | |||||
The income tax provision differs from the amount computed by applying the statutory federal income tax rate to the loss before income tax as a result of the following differences (in thousands):
Year Ended December 31, | |||||||||||
2019 | 2018 | 2017 | |||||||||
Tax computed at federal statutory rate | $ | (1,347 | ) | $ | 3,683 | $ | 2,276 | ||||
State tax, net of federal tax benefit | (133 | ) | 27 | (102 | ) | ||||||
Permanent items | (1,493 | ) | 545 | 1,078 | |||||||
Stock compensation | (1,241 | ) | (497 | ) | — | ||||||
Foreign dividends and unremitted earnings | (352 | ) | 159 | 796 | |||||||
Foreign rate differential | (308 | ) | (347 | ) | (1,897 | ) | |||||
Rate change due to tax reform | 125 | 2,819 | 17,176 | ||||||||
Federal credits | (611 | ) | (619 | ) | (302 | ) | |||||
Tax contingencies, net of reversals | 1,888 | 2,140 | 592 | ||||||||
Other | (351 | ) | (1,040 | ) | 109 | ||||||
Valuation allowance | 9,942 | (3,270 | ) | (14,868 | ) | ||||||
Income tax expense | $ | 6,119 | $ | 3,600 | $ | 4,858 | |||||
The income tax expense recorded primarily relates to operations in China and Finland, which have income tax rates of 25% and 20%, respectively.
60
The tax effects of temporary differences that give rise to significant portions of the deferred tax assets and deferred tax liabilities are as follows (in thousands):
Year Ended December 31, | |||||||||||
2019 | 2018 | 2017 | |||||||||
Deferred tax assets: | |||||||||||
Net operating loss carryforwards | $ | 23,114 | $ | 16,407 | $ | 21,626 | |||||
Research and alternative minimum tax credits | 5,022 | 4,501 | 3,635 | ||||||||
Accrued expenses and other | 3,671 | 2,806 | 1,891 | ||||||||
Inventory | 3,456 | 4,248 | 2,280 | ||||||||
Property and equipment | 887 | 1,334 | 1,644 | ||||||||
Total gross deferred tax assets | 36,150 | 29,296 | 31,076 | ||||||||
Less valuation allowance | (35,545 | ) | (25,603 | ) | (28,873 | ) | |||||
Total deferred tax assets | 605 | 3,693 | 2,203 | ||||||||
Deferred tax liabilities | |||||||||||
Intangible assets | (537 | ) | (579 | ) | (396 | ) | |||||
Total deferred tax liabilities | (537 | ) | (579 | ) | (396 | ) | |||||
Net deferred tax assets | $ | 68 | $ | 3,114 | $ | 1,807 | |||||
Net deferred tax assets of $0.1 million, $3.1 million, and $1.8 million as of December 31, 2019, 2018 and 2017, respectively, are included in other assets within the consolidated balance sheet.
In evaluating its valuation allowance, the Company considers all available positive and negative evidence, including scheduled reversals of deferred tax liabilities, projected future taxable income, tax planning strategies, and recent financial performance. Due to uncertainty with respect to ultimate realizability of deferred tax assets, the Company has provided a valuation allowance against the U.S. and China deferred tax assets. The net change in the total valuation allowance during the years ended December 31, 2019, 2018 and 2017 were an increase of $9.9 million and decreases of $3.3 million and $14.9 million, respectively.
At December 31, 2019, the Company has U.S. and state net operating loss carryforwards of $95.8 million and $14.0 million, respectively. These net operating losses will expire between 2023 and 2039 if not used by the Company to reduce income taxes payable in future periods. The Company has U.S. and state research and development credits of $5.9 million and $13 thousand, respectively. These credits will begin to expire between 2020 and 2039 if not used by the Company to reduce income taxes payable in future periods.
Utilization of net operating loss carryforwards, credit carryforwards and certain deductions have been subject to annual limitations due to ownership change limitations provided by the Internal Revenue Code of 1986, as amended, and similar state provisions. Under Sections 382 and 383 of the Internal Revenue Code of 1986, as amended, substantial changes in the Company's ownership have required the Company to limit the amount of net operating loss and research and development credit carryforwards that were previously available to offset future taxable income. The Company has had three "change in ownership" events that limit the utilization of net operating loss carryforwards. The "change in ownership" events occurred twice in August of 2000 and in January of 2001, and resulted in net operating loss carryforward limitations of $17 thousand, $52 thousand, and $459 thousand for net operating losses generated prior to the change. Additional limitations on the use of these tax attributes could occur in the event of possible disputes arising in examination from various taxing authorities.
61
The following table presents a reconciliation of the changes in the unrecognized tax benefit (in thousands):
Balance at December 31, 2016 | $ | 2,050 | |
Additions based on tax positions related to the current year | 365 | ||
Additions for tax positions of prior years | 99 | ||
Other | 3 | ||
Balance at December 31, 2017 | $ | 2,517 | |
Additions based on tax positions related to the current year | 3,398 | ||
Additions for tax positions of prior years | 92 | ||
Reductions for tax positions of prior years | (49 | ) | |
Reductions as a result of a lapse of applicable statute of limitations | (5 | ) | |
Other | (66 | ) | |
Balance at December 31, 2018 | $ | 5,887 | |
Additions based on tax positions related to the current year | 2,925 | ||
Additions for tax positions of prior years | 2 | ||
Reductions as a result of a lapse of applicable statute of limitations | (22 | ) | |
Other | (52 | ) | |
Balance at December 31, 2019 | $ | 8,740 | |
At December 31, 2019, the Company has $8.7 million of unrecognized tax benefits (excluding interest and penalties). Of this amount, $3.5 million is recorded in non-current income taxes payable and $5.3 million is recorded as an offset to non-current deferred tax assets on the accompanying consolidated balance sheet. The $5.3 million of unrecognized tax benefit in non-current deferred tax assets is entirely offset by a full valuation allowance in both the U.S. and China. Of the Company's unrecognized tax benefits, $8.7 million, if recognized, would impact the effective tax rate. At December 31, 2018, the Company had recorded $3.5 million of unrecognized tax benefits in non-current income taxes payable and $2.4 million of unrecognized tax benefits recognized as an offset to noncurrent deferred tax assets on the accompanying consolidated balance sheet. The Company does not expect a significant decrease to the total amount of unrecognized tax benefits within the next twelve months.
The Company recognizes interest and penalties related to unrecognized tax benefits as a component of income tax expense. The Company has recognized penalties and interest during the years ended December 31, 2019, 2018 and 2017, of $0.3 million, $0.4 million, and $0.4 million, respectively. At December 31, 2019 and 2018 interest and penalties associated with unrecognized tax benefits were $1.6 million and $1.3 million, respectively.
At December 31, 2019, the Company's tax years 2016 through 2019, 2015 through 2019, and 2009 through 2019, remain open for examination in the federal, state and foreign jurisdictions, respectively. However, to the extent allowed by law, the taxing authorities may have the right to examine prior periods where net operating losses and credits were generated and carried forward, and to make adjustments up to the net operating loss and credit carryforward amounts. The Company is not currently under federal, state, or foreign examination.
2017 Tax Act
In December 2017, the Tax Cuts and Jobs Act (the 2017 Tax Act) introduced significant changes to U.S. income tax law. Effective 2017, the 2017 Tax Act included a one-time transition tax on certain foreign earnings and the acceleration of depreciation for certain assets placed into service after September 27, 2017. Effective 2018, the 2017 Tax Act reduced the U.S. statutory tax rate from 34% to 21%, and created new taxes on certain foreign-sourced earnings, repealed the domestic manufacturing deduction, and placed additional limitations on executive compensation and limitations on the deductibility of interest.
The Company recognized the income tax effects of the 2017 Tax Act in its 2017 financial statements in accordance with Staff Accounting Bulletin No. 118 (SAB 118), which provides SEC staff guidance for the application of ASC Topic 740, Income Taxes, in the reporting period in which the 2017 Tax Act was signed into law. As such, the Company's 2017 financial results reflected the income tax effects of the 2017 Tax Act for which the accounting under ASC Topic 740 was complete and provisional amounts for those specific income tax effects of the 2017 Tax Act for which the accounting under ASC Topic 740 was incomplete but a reasonable estimate could be determined. The accounting for the income tax effects of the 2017 Tax Act is considered complete at December 31, 2018, with no material changes to the amounts recorded in 2017.
62
The changes to existing U.S. tax laws as a result of the 2017 Tax Act, which have the most significant impact on the Company's federal income taxes are as follows:
Reduction of the U.S. Corporate Income Tax Rate
The Company measures deferred tax assets and liabilities using enacted tax rates that will apply in the years in which the temporary differences are expected to be recovered or paid. Accordingly, the Company's deferred tax assets and liabilities were remeasured to reflect the reduction in the U.S. corporate income tax rate from 34% to 21%, resulting in a $16.1 million increase in income tax expense for the year ended December 31, 2017 and a corresponding decrease in net deferred tax assets as of December 31, 2017. These adjustments were fully offset with a corresponding adjustment to the valuation allowance.
Transition Tax on Foreign Earnings
The Company recognized a provisional income tax expense of $1.1 million for the year ended December 31, 2017 related to the one-time transition tax on certain foreign earnings. This resulted in a corresponding decrease in deferred tax assets due to the utilization of net operating loss carryforwards. This amount was finalized within the measurement period in accordance with SAB 118 and did not have a material impact to our consolidated financial statements.
Note 16 - Stockholders' Equity and Stock-Based Compensation
Preferred Stock
We have authorized 5.0 million shares of preferred stock, par value $0.0001, none of which is issued and outstanding.
Common Stock
Each share of common stock has the right to one vote. The holders of common stock are also entitled to receive dividends whenever funds are legally available and when declared by the Board of Directors, subject to the prior rights of holders of all classes of stock outstanding having priority rights as to dividends. No dividends have been declared or paid as of December 31, 2019.
Immediately prior to the closing of the Company's initial public offering on April 30, 2018, all shares of the outstanding convertible preferred stock automatically converted on a 1-for-1 basis into an aggregate of 24.6 million shares of common stock. There were no outstanding shares of convertible preferred stock as of December 31, 2018.
Common Stock Repurchase Plan
On November 14, 2019, the Company's Board of Directors authorized the repurchase of up to $10.0 million of its outstanding shares of common stock. This program is intended to offset the potentially dilutive effects of restricted stock grants awarded in connection with the acquisition of Nutronics, Inc. (See Note 2, Acquisition, for additional information.) The repurchases will be made from time to time on the open market at prevailing market prices or in negotiated transactions off the market and are expected to comply with Rule 10b-18 under the Securities Exchange Act of 1934, as amended. Repurchased shares are retired and returned to unissued authorized shares upon settlement of the related transactions with the excess of cost over par value charged to additional paid in capital. As of December 31, 2019, no repurchases had been executed under the program.
Equity Incentive Plans
The Company maintains two stock-based compensation plans: the 2018 Equity Incentive Plan (the 2018 Plan), and the 2001 Stock Option Plan (the 2001 Plan). The Board of Directors adopted, and stockholders approved, the 2018 Plan in April 2018. The 2018 Plan became effective on April 24, 2018, and serves as the successor to the 2001 Plan. There are no shares reserved for future awards under the 2001 Plan. Outstanding awards under the 2001 Plan continue to be subject to the terms and conditions of the 2001 Plan.
Equity-based awards are granted under the 2018 Plan. Restricted stock and restricted stock units granted under the 2018 Plan will generally vest over four years in equal annual tranches. The 2018 Plan also provides for grants of incentive stock options, nonstatutory stock options and stock appreciation rights. The incentive stock options may be granted only to employees, and the nonqualified stock options and all other awards other than incentive stock options, may be granted to employees, directors and consultants. The exercise price of incentive stock options generally must be at least equal to the fair market value of common stock on the date of grant. Stock options and stock appreciation rights granted under the 2018 Plan will generally have a term of ten years and vest over a period as determined by the Compensation Committee of the Board of Directors. The Company has not granted any stock options or stock appreciation rights during fiscal years 2019 and 2018.
As of December 31, 2019, there were approximately 2.6 million shares available for grant under the 2018 Plan.
63
Restricted Stock Awards and Units
Restricted stock award (RSA) and restricted stock unit (RSU) activity under our equity incentive plan was as follows (in thousands, except weighted average grant date fair values):
Number of Restricted Stock Awards | Weighted-Average Grant Date Fair Value | |||||||
RSAs at December 31, 2018 | 115 | $ | 37.15 | |||||
Awards granted | 403 | 18.17 | ||||||
Awards vested | (11 | ) | 37.15 | |||||
Awards forfeited and modified | (48 | ) | 37.15 | |||||
RSAs at December 31, 2019 | 459 | $ | 20.49 | |||||
Number of Restricted Stock Units | Weighted-Average Grant Date Fair Value | |||||||
RSUs at December 31, 2018 | 557 | $ | 30.31 | |||||
Awards granted | 2,107 | 17.86 | ||||||
Awards vested | (117 | ) | 26.94 | |||||
Awards forfeited & modified | (140 | ) | 32.19 | |||||
RSUs at December 31, 2019 | 2,407 | $ | 19.47 | |||||
On November 14, 2019, pursuant to the Stock Purchase Agreement between nLIGHT, Inc. and the former stockholders of Nutronics, the Company granted approximately 1.0 million time-based RSUs as part of ongoing employment agreements with the sellers. The RSUs vest in equal annual amounts over 4 years, and had a total grant date fair value of approximately $15.8 million, of which expense will be recognized on a straight-line basis over the requisite service period of the awards. The grant date fair value of the sellers' RSUs was based on the average closing price of the Company's stock for a certain number of days before the acquisition date. See Note 2 for additional information.
The total fair value of RSAs and RSUs vested during the year ended December 31, 2019 was $0.4 million and $3.1 million, respectively. Awards outstanding as of December 31, 2019 include 0.5 million performance-based awards that will vest upon meeting certain performance criteria. The weighted-average grant date fair value per share of awards granted during the period includes changes in the fair value of performance-based RSAs and RSUs granted in prior periods.
Stock Options
The following table summarizes the Company’s stock option activity during the year ended December 31, 2019 (in thousands, except weighted average exercise prices):
Number of Options | Weighted Average Exercise Price | Weighted Average Remaining Contractual Term (Years) | Aggregate Intrinsic Value | |||||
Outstanding, December 31, 2018 | 5,171 | $1.60 | 7.2 | $83,700 | ||||
Options exercised | (867 | ) | $1.80 | |||||
Options canceled | (65 | ) | $2.52 | |||||
Outstanding, December 31, 2019 | 4,239 | $1.54 | 6.1 | $79,443 | ||||
Options exercisable at December 31, 2019 | 3,047 | $1.03 | 5.7 | $58,654 | ||||
Options vested as of December 31, 2019 and expected to vest after December 31, 2019 | 4,239 | $1.54 | 6.1 | $79,443 | ||||
Total intrinsic value of options exercised for the year ended December 31, 2019 and 2018 was $15.8 million and $6.7 million, respectively. The Company received proceeds of $1.6 million and $0.4 million from the exercise of options for the year ended December 31, 2019 and 2018, respectively.
64
Employee Stock Purchase Plan
During the year ended December 31, 2018, the Company's Board of Directors approved the terms of the 2018 Employee Stock Purchase Plan (the 2018 ESPP). The 2018 ESPP became effective on April 24, 2018. Subject to any limitations therein, the 2018 ESPP allows eligible employees to contribute up to 10% of their earnings for the purchase of common stock at a discounted price per share. The 2018 ESPP provides for separate six-month offering periods commencing on the first trading day on or after May 15 and November 15 of each calendar year. The initial offering period occurred from November 15, 2018 through May 15, 2019.
Information related to activity under the 2018 ESPP was as follows (in thousands, except weighted average per share prices):
Year Ended December 31, | |||
2019 | |||
Shares issued | 83 | ||
Weighted average per share purchase price | $ | 17.72 | |
Weighted average per share discount from the fair value of our common stock on date of issuance | $ | 3.13 | |
As of December 31, 2019, there were 1.5 million shares available for grant under the 2018 ESPP.
Stock-Based Compensation
Total stock-based compensation expense was included in our consolidated statements of operations as follows (in thousands):
Year Ended December 31, | ||||||||||||
2019 | 2018 | 2017 | ||||||||||
Cost of revenues | $ | 1,201 | $ | 456 | $ | 46 | ||||||
Research and development | 3,299 | 1,293 | 66 | |||||||||
Sales, general and administrative | 5,230 | 3,056 | 257 | |||||||||
$ | 9,730 | $ | 4,805 | $ | 369 | |||||||
Changes in metrics and estimated achievement related to 0.2 million performance-based awards in September 2019 resulted in a $2.1 million credit to previously recognized stock-based compensation expense.
Unrecognized Compensation Costs
As of December 31, 2019, total unrecognized stock-based compensation related to outstanding, but unvested stock awards was $49.0 million, which will be recognized over the next five years as follows (in thousands):
2020 | $ | 17,427 | |
2021 | 14,800 | ||
2022 | 11,076 | ||
2023 | 5,719 | ||
$ | 49,022 | ||
Note 17 - 401(k) Plan
The Company has a 401(k) Profit Sharing Plan and Trust (the Plan). Participation in the Plan is voluntary and is available to all employees. Employees are eligible to participate in the Plan on the first day of the month after their first day of employment. Participants may elect to contribute part of their annual salary to the Plan up to the statutorily prescribed limit. The Company may make discretionary matching or qualified nonelective contributions to the Plan. The Company maintains a match of 40% of each dollar up to the first 5% of compensation that is contributed to the Plan. The match is recorded within the cost of revenues and operating expenses in the consolidated statements of operations and were as follows (in thousands):
Year Ended December 31, | ||||||||||||
2019 | 2018 | 2017 | ||||||||||
401(k) match | $ | 668 | $ | 606 | $ | 462 | ||||||
65
Note 18 - Segment and Geographic Information
Prior to the acquisition of Nutronics in the fourth quarter of 2019, the Company operated as one reportable segment. With the addition of Nutronics, the Company currently operates in two reportable segments consisting of the Laser Products segment and the Advanced Development segment. Revenue in the Laser Products Segment includes products that we sell such as fiber lasers, diodes, complete laser systems and components; whereas the Advanced Development Segment revenue is largely based on research and development grants that do not result in the delivery of a standard product.
The Company's chief operating decision‑maker ("CODM") is the chief executive officer, who reviews operating results to make decisions about allocating resources and assessing performance on a total company basis. The following table summarizes the operating results by reportable segment for 2019 (dollars in thousands):
Laser Products | Advanced Development | Corporate and Other | Totals | ||||||||||||
Revenue | $ | 174,059 | $ | 2,560 | $ | — | $ | 176,619 | |||||||
Gross profit | $ | 53,247 | $ | 293 | $ | (1,201 | ) | $ | 52,339 | ||||||
Gross margin | 30.6 | % | 11.4 | % | NM | 29.6 | % | ||||||||
Operating income (loss) | $ | (768 | ) | $ | 186 | $ | (9,326 | ) | $ | (9,909 | ) | ||||
Corporate and Other includes unallocated expenses related to amortization of purchased intangible assets, share-based compensation expense, and acquisition-related costs, which are not used in evaluating the results of, or in allocating resources to, our reportable segments. Acquisition-related costs include transaction costs and any costs directly related to the acquisition and integration of acquired businesses. Since the Company operated only in the Laser Products segment prior to the acquisition of Nutronics in 2019, no comparative information is presented for 2018 or 2017.
The geographic locations of the Company’s long‑lived assets, net, based on location of the assets, are as follows (in thousands):
As of December 31, | |||||||
2019 | 2018 | ||||||
North America | $ | 39,257 | $ | 18,505 | |||
China | 9,797 | 11,533 | |||||
Rest of World | 2,319 | 1,471 | |||||
$ | 51,373 | $ | 31,509 | ||||
Note 19 - Net Income (Loss) per Share
The following table sets forth the calculation of basic and diluted net income (loss) per share attributable to common stockholders during the periods presented (in thousands, except per share amounts):
66
Year Ended December 31, | ||||||||||||
2019 | 2018 | 2017 | ||||||||||
Numerator: | ||||||||||||
Net income (loss) | $ | (12,884 | ) | $ | 13,938 | $ | 1,837 | |||||
Participating securities: | ||||||||||||
Income allocated to participating securities | — | (4,415 | ) | (1,837 | ) | |||||||
Net income (loss) attributable to common stockholders | (12,884 | ) | 9,523 | — | ||||||||
Denominator: | ||||||||||||
Weighted-average shares, basic | 37,119 | 24,862 | 2,735 | |||||||||
Dilutive effect of restricted stock units and awards | — | 11 | — | |||||||||
Dilutive effect of common stock options | — | 5,086 | — | |||||||||
Weighted-average common shares outstanding, diluted | 37,119 | 29,959 | 2,735 | |||||||||
Net income (loss) per share attributable to common stockholders: | ||||||||||||
Basic | $ | (0.35 | ) | $ | 0.38 | $ | 0.00 | |||||
Diluted | $ | (0.35 | ) | $ | 0.32 | $ | 0.00 | |||||
The following potentially dilutive shares of restricted stock awards and units, employee stock purchase plan, and stock options were not included in the calculation of diluted shares above as the effect would have been anti‑dilutive (in thousands):
Year Ended December 31, | |||||||||
2019 | 2018 | 2017 | |||||||
Convertible preferred stock | — | — | 23,095 | ||||||
Preferred stock warrants | — | — | 214 | ||||||
Restricted stock units and awards | 2,426 | 622 | — | ||||||
Common stock options | 4,239 | — | 5,369 | ||||||
Total | 6,665 | 622 | 28,678 | ||||||
Note 20 - Quarterly Results of Operations (unaudited)
The following table summarizes unaudited quarterly financial data for 2019 and 2018 (in thousands, except per share data):
Year Ended December 31, 2019 | |||||||||||||||||||
Q4 | Q3 | Q2 | Q1 | Full Year | |||||||||||||||
Revenues | $ | 42,896 | $ | 43,814 | $ | 48,048 | $ | 41,861 | $ | 176,619 | |||||||||
Gross profit | 9,992 | 12,962 | 15,871 | 13,514 | 52,339 | ||||||||||||||
Net loss attributable to common stockholders | (10,716 | ) | (778 | ) | (155 | ) | (1,235 | ) | (12,884 | ) | |||||||||
Net loss per share, basic | $ | (0.29 | ) | $ | (0.02 | ) | $ | 0.00 | $ | (0.03 | ) | $ | (0.35 | ) | |||||
Net loss per share, diluted | $ | (0.29 | ) | $ | (0.02 | ) | $ | 0.00 | $ | (0.03 | ) | $ | (0.35 | ) | |||||
Year Ended December 31, 2018 | |||||||||||||||||||
Q4 | Q3 | Q2 | Q1 | Full Year | |||||||||||||||
Revenues | $ | 46,162 | $ | 51,025 | $ | 51,705 | $ | 42,467 | $ | 191,359 | |||||||||
Gross profit | 16,506 | 18,047 | 17,679 | 14,729 | 66,961 | ||||||||||||||
Net income attributable to common stockholders | 2,360 | 4,009 | 3,154 | — | 9,523 | ||||||||||||||
Net income per share, basic | $ | 0.06 | $ | 0.11 | $ | 0.13 | $ | 0.00 | $ | 0.38 | |||||||||
Net income per share, diluted | $ | 0.06 | $ | 0.10 | $ | 0.11 | $ | 0.00 | $ | 0.32 | |||||||||
67
ITEM 9. CHANGES IN AND DISAGREEMENTS WITH ACCOUNTANTS ON ACCOUNTING AND FINANCIAL DISCLOSURE
None.
ITEM 9A. CONTROLS AND PROCEDURES
Evaluation of Disclosure Controls and Procedures
Our management, with the participation of our chief executive officer and our chief financial officer, have evaluated our disclosure controls and procedures (as defined in Rules 13a-15(e) and 15d-15(e) under the Exchange Act) as of the end of the period covered by this report. Based on that evaluation, our chief executive officer and our chief financial officer have concluded that, as of such date, our disclosure controls and procedures were, in design and operation, effective.
Changes in Internal Control over Financial Reporting
Beginning January 1, 2019, we adopted Accounting Standards Update (ASU) 2014-09, Revenue from Contracts with Customers (Topic 606) and related amendments, which required the implementation of internal controls to ensure we adequately evaluated our contracts and properly assessed the impact on the new accounting standard. In addition, although the new revenue standard is expected to have an immaterial impact on our ongoing revenues or net income, we implemented changes to our policies and internal controls related to revenue recognition.
Management's Report on Internal Control over Financial Reporting
Our management is responsible for establishing and maintaining adequate internal control over financial reporting as defined in Rules 13a-15(f) and 15d-15(f) under the Exchange Act. Internal control over financial reporting is a process designed by, or under the supervision of, our Principal Executive Officer and Principal Financial Officer, and effected by our board of directors, management and other personnel and consultants, to provide reasonable assurance regarding the reliability of financial reporting and the preparation of financial statements for external purposes in accordance with generally accepted accounting principles, and includes those policies and procedures that:
(i) pertain to the maintenance of records that in reasonable detail accurately and fairly reflect our transactions and dispositions of assets;
(ii) provide reasonable assurance that transactions are recorded as necessary to permit preparation of financial statements in accordance with generally accepted accounting principles, and that our receipts and expenditures are being made only in accordance with the authorization of our management and directors; and
(iii) provide reasonable assurance regarding prevention or timely detection of unauthorized acquisition, use or disposition of our assets that could have a material effect on the financial statements.
Because of its inherent limitations, internal control over financial reporting may not prevent or detect misstatements. Also, projections of any evaluation of effectiveness to future periods are subject to the risk that controls may become inadequate because of changes in conditions, or that the degree of compliance with the policies or procedures may deteriorate.
We acquired Nutronics, Inc. (Nutronics) on November 14, 2019, and we have not yet completed the process of integrating the acquired business’s internal control over financial reporting into our overall internal control over financial reporting process. Accordingly, we excluded from our assessment of internal control over financial reporting as of December 31, 2019, the internal control over financial reporting of Nutronics. Associated with Nutronics are total assets of $20.2 million and net revenues of $2.6 million included in our consolidated financial statements as of and for the fiscal year ended December 31, 2019.
Under the supervision and with the participation of our management, including our chief executive officer and chief financial officer, we conducted an assessment of the effectiveness of our internal control over financial reporting as of December 31, 2019. In making this assessment, our management used the criteria set forth in Internal Control-Integrated Framework (2013) issued by the Committee of Sponsoring Organizations of the Treadway Commission (COSO). Based on the results of this assessment, management has concluded that our internal control over financial reporting was effective as of December 31, 2019.
Inherent Limitation on the Effectiveness of Internal Control
The effectiveness of any system of internal control over financial reporting, including ours, is subject to inherent limitations, including the exercise of judgment in designing, implementing, operating, and evaluating the controls and procedures, and the
68
inability to eliminate misconduct completely. Accordingly, in designing and evaluating the disclosure controls and procedures, management recognizes that any system of internal control over financial reporting, including ours, no matter how well designed and operated, can only provide reasonable, not absolute assurance of achieving the desired control objectives. In addition, the design of disclosure controls and procedures must reflect the fact that there are resource constraints and that management is required to apply its judgment in evaluating the benefits of possible controls and procedures relative to their costs. Moreover, projections of any evaluation of effectiveness to future periods are subject to the risk that controls may become inadequate because of changes in conditions, or that the degree of compliance with the policies or procedures may deteriorate. We intend to continue to monitor and upgrade our internal controls as necessary or appropriate for our business, but cannot assure you that such improvements will be sufficient to provide us with effective internal control over financial reporting.
CEO and CFO Certifications
We have attached as exhibits to this Annual Report on Form 10-K the certifications of our Chief Executive Officer and Chief Financial Officer, which are required in accordance with the Exchange Act. We recommend that this Item 9A be read in conjunction with the certifications for a more complete understanding of the subject matter presented.
ITEM 9B. OTHER INFORMATION
None.
69
PART III
ITEM 10. DIRECTORS, EXECUTIVE OFFICERS AND CORPORATE GOVERNANCE
The information required by this item is incorporated by reference to the Company’s definitive proxy statement relating to the 2020 annual meeting of stockholders. The definitive proxy statement will be filed with the SEC within 120 days after December 31, 2019.
We have adopted a Code of Ethics that applies to our chief executive officer, chief financial officer, principal accounting officer and controller and persons performing similar functions. The Code of Ethics is posted on our website at http://investors.nlight.net/IR/corporate-governance. We intend to satisfy the disclosure requirements under Item 5.05 of Form 8-K regarding an amendment to, or waiver from, a provision of the Code of Ethics by posting such information on our website at the address specified above.
ITEM 11. EXECUTIVE COMPENSATION
The information required by this item is incorporated by reference to the Company’s definitive proxy statement relating to the 2020 annual meeting of stockholders. The definitive proxy statement will be filed with the SEC within 120 days after December 31, 2019.
ITEM 12. SECURITY OWNERSHIP OF CERTAIN BENEFICIAL OWNERS AND MANAGEMENT AND RELATED STOCKHOLDER MATTERS
The information required by this item is incorporated by reference to the Company’s definitive proxy statement relating to the 2020 annual meeting of stockholders. The definitive proxy statement will be filed with the SEC within 120 days after December 31, 2019.
ITEM 13. CERTAIN RELATIONSHIPS AND RELATED TRANSACTIONS, AND DIRECTOR INDEPENDENCE
The information required by this item is incorporated by reference to the Company’s definitive proxy statement relating to the 2020 annual meeting of stockholders. The definitive proxy statement will be filed with the SEC within 120 days after December 31, 2019.
ITEM 14. PRINCIPAL ACCOUNTING FEES AND SERVICES
The information required by this item is incorporated by reference to the Company’s definitive proxy statement relating to the 2020 annual meeting of stockholders. The definitive proxy statement will be filed with the SEC within 120 days after December 31, 2019.
70
PART IV
ITEM 6. EXHIBITS
(a)(1) Financial Statements
We have filed the financial statements listed in the Index to Consolidated Financial Statements as a part of this report.
(a)(2) Financial Statement Schedules
Schedules not listed above have been omitted because they are not required, not applicable, or the required information is otherwise included.
(a)(3) Exhibits
The exhibits listed below are filed as part of this Annual Report on Form 10-K or are incorporated herein by reference, in each case as indicated below.
Exhibit Number | Incorporated by Reference | Filed Herewith | ||||
Description | Form | File No. | Exhibit | Filing Date | ||
3.1 | 10-Q | 001-38462 | 3.1 | May 25, 2018 | ||
3.2 | 10-Q | 001-38462 | 3.2 | May 25, 2018 | ||
3.3 | 8-K | 001-38462 | 3.1 | February 3, 2020 | ||
4.1 | S-1/A | 333-224055 | 4.1 | April 16, 2018 | ||
4.2 | S-1 | 333-224055 | 4.2 | March 30, 2018 | ||
4.3 | X | |||||
10.1 | S-1/A | 333-224055 | 10.1 | April 16, 2018 | ||
10.2+ | S-1 | 333-224055 | 10.2 | March 30, 2018 | ||
10.3+ | S-1/A | 333-224055 | 10.3 | April 16, 2018 | ||
10.4+ | S-1/A | 333-224055 | 10.4 | April 16, 2018 | ||
10.5+ | 8-K | 001-38462 | 10.1 | June 4, 2018 | ||
10.6+ | 8-K | 001-38462 | 10.2 | June 4, 2018 | ||
10.7+ | 8-K | 001-38462 | 10.3 | June 4, 2018 | ||
10.8+ | S-1 | 333-224055 | 10.5 | March 30, 2018 | ||
10.9+ | S-1 | 333-224055 | 10.6 | March 30, 2018 | ||
10.10+ | S-1 | 333-224055 | 10.7 | March 30, 2018 | ||
10.11+ | S-1 | 333-224055 | 10.8 | March 30, 2018 | ||
10.12 | S-1 | 333-224055 | 10.10 | March 30, 2018 | ||
71
Exhibit Number | Incorporated by Reference | Filed Herewith | ||||
Description | Form | File No. | Exhibit | Filing Date | ||
10.13 | 10-Q | 001-38462 | 10.1 | August 10, 2018 | ||
10.14 | 8-K | 001-38462 | 10.1 | September 27, 2018 | ||
10.15 | 8-K | 001-38462 | 10.1 | November 14, 2019 | ||
10.16 | S-1 | 333-224055 | 10.11 | March 30, 2018 | ||
10.17 | S-1 | 333-224055 | 10.12 | March 30, 2018 | ||
10.18 | 8-K | 001-38462 | 10.1 | May 11, 2018 | ||
10.19 | S-1 | 333-224055 | 10.13 | March 30, 2018 | ||
10.20 | S-1 | 333-224055 | 10.14 | March 30, 2018 | ||
10.21 | X | |||||
21.1 | X | |||||
23.1 | X | |||||
31.1 | X | |||||
31.2 | X | |||||
32.1* | X | |||||
101.INS | XBRL Instance Document. | X | ||||
101.SCH | XBRL Taxonomy Extension Schema Document | X | ||||
101.CAL | XBRL Taxonomy Extension Calculation Linkbase Document. | X | ||||
101.DEF | XBRL Taxonomy Extension Definition Linkbase Document | X | ||||
101.LAB | XBRL Taxonomy Extension Label Linkbase Document | X | ||||
101.PRE | XBRL Taxonomy Extension Presentation Linkbase Document | X | ||||
72
* | The certifications furnished in Exhibit 32.1 hereto are deemed to accompany this Annual Report on Form 10-K and will not be deemed "filed" for purposes of Section 18 of the Securities Exchange Act of 1934, as amended, except to the extent that the registrant specifically incorporates it by reference. |
ITEM 16. FORM 10-K SUMMARY
None.
73
SIGNATURES
Pursuant to the requirements of the Securities Exchange Act of 1934, the registrant has duly caused this report to be signed on its behalf by the undersigned, thereunto duly authorized.
NLIGHT, INC. | ||
Date: March 9, 2020 | By: | /s/ SCOTT KEENEY |
Scott Keeney | ||
President and Chief Executive Officer (Principal Executive Officer) | ||
Date: March 9, 2020 | By: | /s/ RAN BAREKET |
Ran Bareket | ||
Chief Financial Officer (Principal Accounting and Financial Officer) | ||
POWER OF ATTORNEY
KNOW ALL PERSONS BY THESE PRESENTS, that each person whose signature appears below constitutes and appoints Scott Keeney and Ran Bareket, and each of them, with full power of substitution and resubstitution and full power to act without the other, as his or her true and lawful attorney-in-fact and agent to act in his or her name, place and stead and to execute in the name and on behalf of each person, individually and in each capacity stated below, and to file, any and all documents in connection therewith, with the Securities and Exchange Commission, granting unto said attorneys-in-fact and agents, and each of them, full power and authority to do and perform each and every act and thing, ratifying and confirming all that said attorneys-in-fact and agents or any of them or their and his or her substitute or substitutes, may lawfully do or cause to be done by virtue thereof.
Pursuant to the requirements of the Securities Act of 1934, this Annual Report on Form 10-K has been signed by the following persons on behalf of the registrant and in the capacities and on the dates indicated:
Signature | Title | Date |
/s/ SCOTT KEENEY | President, Chief Executive Officer and Chairman (Principal Executive Officer) | |
Scott Keeney | March 9, 2020 | |
/s/ RAN BAREKET | Chief Financial Officer (Principal Accounting and Financial Officer) | |
Ran Bareket | March 9, 2020 | |
/s/ BANDEL CARANO | Director | |
Bandel Carano | March 9, 2020 | |
/s/ DOUGLAS CARLISLE | Director | |
Douglas Carlisle | March 9, 2020 | |
/s/ BILL GOSSMAN | Director | |
Bill Gossman | March 9, 2020 | |
/s/ RAYMOND LINK | Director | |
Raymond Link | March 9, 2020 | |
/s/ GARY LOCKE | Director | |
Gary Locke | March 9, 2020 | |
/s/ GEOFFREY MOORE | Director | |
Geoffrey Moore | March 9, 2020 | |
74