Attached files
| file | filename |
|---|---|
| EX-4.6 - EX-4.6 - Portman Ridge Finance Corp | ptmn-ex46_532.htm |
| EX-32.2 - EX-32.2 - Portman Ridge Finance Corp | ptmn-ex322_7.htm |
| EX-32.1 - EX-32.1 - Portman Ridge Finance Corp | ptmn-ex321_6.htm |
| EX-31.2 - EX-31.2 - Portman Ridge Finance Corp | ptmn-ex312_9.htm |
| EX-31.1 - EX-31.1 - Portman Ridge Finance Corp | ptmn-ex311_8.htm |
| EX-23.3 - EX-23.3 - Portman Ridge Finance Corp | ptmn-ex233_228.htm |
| EX-23.2 - EX-23.2 - Portman Ridge Finance Corp | ptmn-ex232_477.htm |
| EX-23.1 - EX-23.1 - Portman Ridge Finance Corp | ptmn-ex231_478.htm |
| EX-21.1 - EX-21.1 - Portman Ridge Finance Corp | ptmn-ex211_10.htm |
UNITED STATES
SECURITIES AND EXCHANGE COMMISSION
Washington, D.C. 20549
FORM 10-K
|
☒ |
ANNUAL REPORT PURSUANT TO SECTION 13 OR 15(d) OF THE SECURITIES EXCHANGE ACT OF 1934 |
For the fiscal year ended December 31, 2019
|
☐ |
TRANSITION REPORT PURSUANT TO SECTION 13 OR 15(d) OF THE SECURITIES EXCHANGE ACT OF 1934 |
For the transition period from to
Commission File No. 814-00735
Portman Ridge Finance Corporation
(Exact name of Registrant as specified in its charter)
|
Delaware |
|
20-5951150 |
|
(State or other jurisdiction of incorporation or organization) |
|
(I.R.S. Employer Identification Number) |
650 Madison Avenue, 23rd Floor
New York, New York 10022
(Address of principal executive offices)
(Registrant's telephone number, including area code)
Securities registered pursuant to Section 12(b) of the Act:
|
Title of each class |
|
Trading Symbol(s) |
|
Name of each exchange on which registered |
|
Common Stock, par value $0.01 per share |
|
PTMN |
|
The NASDAQ Global Select Market |
|
6.125% Notes due 2022 |
|
KCAPL |
|
The NASDAQ Global Select Market |
Indicate by check mark if the registrant is a well-known seasoned issuer, as defined in Rule 405 of the Securities Act. Yes ☐ No ☒
Indicate by check mark if the registrant is not required to file reports pursuant to Section 13 or 15(d) of the Act. Yes ☐ No ☒
Indicate by check mark whether the registrant (1) has filed all reports required to be filed by Section 13 or 15(d) of the Securities Exchange Act of 1934 during the preceding 12 months (or for such shorter period that the Registrant was required to file such reports), and (2) has been subject to such filing requirements for the past 90 days: Yes ☒ No ☐
Indicate by check mark whether the registrant has submitted electronically every Interactive Data File required to be submitted pursuant to Rule 405 of Regulation S-T (§232.405 of this chapter) during the preceding 12 months (or for such shorter period that the registrant was required to submit such files). Yes ☐ No ☐
Indicate by check mark whether the registrant is a large accelerated filer, an accelerated filer, a non-accelerated filer, a smaller reporting company or an emerging growth company. See definitions of “large accelerated filer,” “accelerated filer,” “non-accelerated filer,” “smaller reporting company” and “emerging growth company” in Rule 12b-2 of the Exchange Act:
|
Large accelerated filer |
|
☐ |
Accelerated filer |
|
☒ |
Non‑accelerated filer |
|
☐ |
|
Smaller Reporting Company |
|
☐ |
|
Emerging Growth Company |
|
☐ |
|
|
|
|
|
|
|
|
|
|
If an emerging growth company, indicate by check mark if the registrant has elected not to use the extended transition period for complying with any new or revised financial accounting standards provided pursuant to Section 7(a)(2)(B) of the Securities Act. ☐
Indicate by check mark whether the registrant is a shell company (as defined in Rule 12b-2 of the Act). Yes ☐ No ☒
The aggregate market value of the voting and non-voting common stock held by non-affiliates of the registrant as of June 28, 2019 was approximately $78,725,636 based upon a closing price of $2.25 reported for such date by The NASDAQ Global Select Market. This determination of affiliate status is not necessarily a conclusive determination for other purposes.
The number of outstanding shares of common stock of the registrant as of March 2, 2020 was 44,847,420.
DOCUMENTS INCORPORATED BY REFERENCE
Portions of the registrant’s definitive proxy statement for the 2020 annual meeting of stockholders to be filed with the Securities and Exchange Commission within 120 days following the end of the registrant’s fiscal year-end are incorporated by reference into Part III of this report.
NOTE ABOUT REFERENCES TO Portman Ridge Finance Corporation
In this Annual Report on Form 10-K, the “Company”, “Portman Ridge”, “we”, “us” and “our” refer to Portman Ridge Finance Corporation and its wholly-owned subsidiaries, Great Lakes KCAP Funding I LLC, Great Lakes Portman Ridge Funding, LLC, OHA Investment Sub, LLC, OHA Asset Holdings II, LP, Kohlberg Capital Funding I LLC, KCAP Senior Funding I, LLC and KCAP Senior Funding I Holdings, LLC, unless the context otherwise requires.
NOTE ABOUT TRADEMARKS
Portman Ridge Finance Corporation, our logo and other trademarks of Portman Ridge Finance Corporation are the property of Portman Ridge Finance Corporation. All other trademarks or trade names referred to in this Annual Report are the property of their respective owners.
|
|
|
|
Page |
|
|
|
Part I |
|
|
Item 1. |
|
1 |
|
|
Item 1A. |
|
18 |
|
|
Item 1B. |
|
40 |
|
|
Item 2. |
|
40 |
|
|
Item 3. |
|
40 |
|
|
Item 4. |
|
40 |
|
|
|
|
|
|
|
|
|
Part II |
|
|
Item 5. |
|
41 |
|
|
Item 6. |
|
43 |
|
|
Item 7. |
|
Management’s Discussion and Analysis of Financial Condition and Results of Operations |
45 |
|
Item 7A. |
|
66 |
|
|
Item 8. |
|
67 |
|
|
Item 9. |
|
Changes in and Disagreements with Accountants on Accounting and Financial Disclosure |
67 |
|
Item 9A. |
|
67 |
|
|
Item 9B. |
|
68 |
|
|
|
|
|
|
|
|
|
Part III |
|
|
Item 10. |
|
69 |
|
|
Item 11. |
|
69 |
|
|
Item 12. |
|
Security Ownership of Certain Beneficial Owners and Management and Related Stockholder Matters |
69 |
|
Item 13. |
|
Certain Relationships and Related Transactions, and Director Independence |
69 |
|
Item 14. |
|
69 |
|
|
|
|
|
|
|
|
|
Part IV |
|
|
Item 15. |
|
70 |
|
|
71 |
|||
|
F-1 |
|||
i
CAUTIONARY STATEMENT CONCERNING FORWARD-LOOKING STATEMENTS
This Annual Report on Form 10-K contains forward-looking statements The matters discussed in this Annual Report, as well as in future oral and written statements by the Company, that are forward-looking statements are based on current management expectations that involve substantial risks and uncertainties which could cause actual results to differ materially from the results expressed in, or implied by, these forward-looking statements. Forward-looking statements relate to future events or our future financial performance. We generally identify forward-looking statements by terminology such as “may,” “will,” “should,” “expect,” “plan,” “anticipate,” “could,” “intend,” “target,” “project,” “contemplate,” “believe,” “estimate,” “predict,” “potential,” or “continue” or the negative of these terms or other similar words, although not all forward-looking statements include these words. Important assumptions include our ability to originate new investments, achieve certain margins and levels of profitability, the availability of additional capital, our ability to successfully and profitably integrate acquired assets and companies, and the ability to maintain certain debt to asset ratios. In light of these and other uncertainties, the inclusion of a projection or forward-looking statement in this Annual Report should not be regarded as a representation by us that our plans or objectives will be achieved.
The forward-looking statements contained in this Annual Report on Form 10-K include statements as to:
|
|
• |
our future operating results; |
|
|
• |
our business prospects and the prospects of our existing and prospective portfolio companies; |
|
|
• |
the return or impact of current and future investments; |
|
|
• |
our contractual arrangements and other relationships with third parties; |
|
|
• |
the dependence of our future success on the general economy and its impact on the industries in which we invest; |
|
|
• |
the financial condition and ability of our existing and prospective portfolio companies to achieve their objectives; |
|
|
• |
our expected financings and investments; |
|
|
• |
our regulatory structure and tax treatment; |
|
|
• |
our ability to operate as a business development company and a regulated investment company, including the impact of changes in laws or regulations governing our operations or the operations of our portfolio companies; |
|
|
• |
the adequacy of our cash resources and working capital; |
|
|
• |
the timing of cash flows, if any, from the operations of our portfolio companies; |
|
|
• |
the impact of a protracted decline in the liquidity of credit markets on our business; |
|
|
• |
the impact of fluctuations in interest rates on our business; |
|
|
• |
the valuation of our investments in portfolio companies, particularly those having no liquid trading market; |
|
|
• |
our ability to recover unrealized losses; |
|
|
• |
market conditions and our ability to access additional capital; and |
|
|
• |
the timing, form and amount of any dividend distributions. |
For a discussion of factors that could cause our actual results to differ from forward-looking statements contained in this Annual Report, please see the discussion under “Risk Factors” in Item 1A. You should not place undue reliance on these forward-looking statements. The forward-looking statements made in this Annual Report relate only to events as of the date on which the statements are made. We undertake no obligation to update any forward-looking statement to reflect events or circumstances occurring after the date of this Annual Report unless required by law.
ii
In this Annual Report on Form 10-K, the “Company”, “Portman Ridge”, “we”, “us” and “our” refer to Portman Ridge Finance Corporation and its wholly-owned subsidiaries, Great Lakes KCAP Funding I LLC, Great Lakes Portman Ridge Funding, LLC, OHA Investment Sub, LLC, OHA Asset Holdings II, LP, Kohlberg Capital Funding I LLC, KCAP Senior Funding I, LLC and KCAP Senior Funding I Holdings, LLC, unless the context otherwise requires.
GENERAL
Our Company
We were formed in August 2006 under the former name, Kohlberg Capital Corporation, and completed an initial public offering in December 2006. Until March 31, 2019, we operated as an internally managed business development company (“BDC”). On April 1, 2019, we converted to an external management structure and changed our name to Portman Ridge Finance Corporation, see “-The Externalization” below. We are an externally managed, non-diversified closed-end investment company that has elected to be regulated as a BDC under the Investment Company Act of 1940, as amended (the “1940 Act”).
We originate, structure, and invest in secured term loans, bonds or notes and mezzanine debt primarily in privately-held middle market companies but may also invest in other investments such as loans to publicly-traded companies, high-yield bonds, and distressed debt securities (collectively the “Debt Securities Portfolio”). We also invest in joint ventures and debt and subordinated securities issued by collateralized loan obligation funds (“CLO Fund Securities”). In addition, from time to time we may invest in the equity securities of privately held middle market companies and may also receive warrants or options to purchase common stock in connection with our debt investments.
Our investments in CLO Fund Securities are primarily managed by our formerly wholly-owned asset management subsidiaries Trimaran Advisors and Trimaran Advisors Management, L.L.C. From time-to-time we have also made investments in CLO Fund Securities managed by other asset managers. Our collateralized loan obligation funds (“CLO Funds”) typically invest in broadly syndicated loans, high-yield bonds and other credit instruments. Our investments in CLO Fund Securities are anticipated to provide us with recurring cash distributions.
In our Debt Securities Portfolio, our investment objective is to generate current income and, to a lesser extent, capital appreciation from the investments in senior secured term loans, mezzanine debt and selected equity investments in privately-held middle market companies. We define the middle market as comprising companies with earnings before interest, taxes, depreciation and amortization (“EBITDA”) of $10 million to $50 million and/or total debt of $25 million to $150 million. We primarily invest in first and second lien term loans which, because of their priority in a company’s capital structure, we expect will have lower default rates and higher rates of recovery of principal if there is a default and which we expect will create a stable stream of interest income. We also primarily invest in loans to smaller private companies, publicly-traded companies, high-yield bonds, joint ventures, managed funds, partnerships, and distressed debt securities. The investments in our Debt Securities Portfolio are all or predominantly below investment grade, and have speculative characteristics with respect to the issuer’s capacity to pay interest and repay principal.
Our investment portfolio (excluding our investments in the CLO Funds, Joint Venture and short-term investments) at December 31, 2019 was spread across 24 different industries and 60 different entities with an average par balance per entity of approximately $3.2 million. Our investment portfolio totaled $277.9 million at fair value as of December 31, 2019.
Subject to market conditions, we intend to grow our portfolio of assets by raising additional capital, including through the prudent use of leverage available to us. As a BDC, we are limited in the amount of leverage we can incur under the 1940 Act. Effective March 29, 2019, we are allowed to borrow amounts such that our asset coverage, as defined in the 1940 Act, equals at least 150% after such borrowing. However, we continue to be prohibited by the indenture governing our 6.125% notes due 2022 (the “6.125% Notes due 2022”) from making distributions on our common stock if our asset coverage, as defined in the 1940 Act, falls below 200%. See Note 7 - “Borrowings” to our consolidated financial statements. Because we also recognize the need to have funds available for operating our business and to make investments, we seek to have adequate liquidity at all times to cover normal cyclical swings in funding availability and to allow us to meet abnormal and unexpected funding requirements. As a result, we may hold varying amounts of cash and other short-term investments from time-to-time for liquidity purposes.
We have elected to be treated for U.S. federal income tax purposes as a regulated investment company (“RIC”) under the Internal Revenue Code and intend to operate in a manner to maintain our RIC status. See “-Taxation as a Regulated Investment Company” below.
1
On April 1, 2019 (the “Closing”), we became externally managed (the “Externalization”) by Sierra Crest Investment Management LLC (the “Adviser”), an affiliate of BC Partners LLP, (“BC Partners”), pursuant to a stock purchase and transaction agreement (the “Externalization Agreement”) with BC Partners Advisors L.P. (“BCP”), an affiliate of BC Partners. In connection with the Externalization, our stockholders approved an investment advisory agreement (the “Advisory Agreement”) with the Adviser. See “-Advisory Agreement” below.
Pursuant to the Externalization Agreement with BCP, the Adviser became our investment adviser in exchange for a cash payment from BCP, or its affiliate, of $25 million, or $0.669672 per share of our common stock, directly to our stockholders. In addition, the Adviser (or its affiliate) will use up to $10 million of the incentive fee actually paid to the Adviser prior to the second anniversary of the Closing to buy newly issued shares of our common stock at the most recently determined net asset value per share of our common stock at the time of such purchase. For the period of one year from the first day of the first quarter following the quarter in which the Closing occurred, the Adviser will permanently forego up to the full amount of the incentive fees earned by the Adviser without recourse against or reimbursement by us, to the extent necessary in order to achieve aggregate net investment income per share of common stock for such one-year period to be at least equal to $0.40 per share, subject to certain adjustments. BCP and the Adviser’s total financial commitment to the transactions contemplated by the Externalization Agreement was $35.0 million.
On December 12, 2018, prior to externalization, we and BCP entered into a letter agreement (the “Asset Purchase Letter Agreement”) pursuant to which we and BCP each agreed to use commercially reasonable efforts to effect the sale by BCP (or its affiliates or advisory clients of its affiliates), in one or more transactions, of certain assets held by BCP (or its affiliates or advisory clients thereof) that, taken together, have an aggregate principal amount of approximately $75 million, less $25 million of aggregate amount of capital contributions made by us to the BCP Great Lakes Fund. In the second quarter of 2019 BCP’s obligations under the Asset Purchase Letter Agreement were satisfied.
On the date of the Closing, we changed our name from KCAP Financial, Inc. to Portman Ridge Finance Corporation and on April 2, 2019, began trading on the NASDAQ Global Select Market under the symbol “PTMN.”
In connection with the Closing, all of our then-current directors resigned from their positions on our Board of Directors (the “Board”), with the exceptions of Dean Kehler and Christopher Lacovara. Prior to their resignations, the Board approved an increase in the size of the Board from seven members to eight members and appointed the following new individuals to serve on the Board: Graeme Dell; Alexander Duka; Ted Goldthorpe; George Grunebaum; David Moffitt; and Robert Warshauer. Additionally, in connection with the Closing all of the Company’s then-current officers resigned from their positions with the exceptions of Edward Gilpin and Daniel Gilligan. Effective as of the Closing, Ted Goldthorpe was appointed as President and Chief Executive Officer and Patrick Schafer was appointed as Chief Investment Officer of the Company. In May 2019, Mr. Gilligan resigned as Chief Compliance officer, and Andrew Devine was appointed Chief Compliance Officer.
OHAI Transaction
On December 18, 2019, we completed our acquisition of OHA Investment Corporation (“OHAI”). In accordance with the terms of the merger agreement, each share of common stock, par value $0.001 per share, of OHAI (the “OHAI Common Stock”) issued and outstanding was converted into the right to receive (i) an amount in cash, without interest, equal to approximately $0.42, and (ii) 0.3688 shares of common stock, par value $0.01 per share, of the Company (plus any applicable cash in lieu of fractional shares). Each share of OHAI Common Stock issued and outstanding received, as additional consideration funded by the Adviser, of an amount in cash, without interest, equal to approximately $0.15.
Pursuant to the merger agreement, if at any time within one year after the closing date of the transaction our common stock is trading at a price below 75% of its net asset value, we will initiate an open-market stock repurchase program of up to $10 million to support the trading price of the combined entity for up to one year from the date such program is announced. Our board approved a repurchase program on March 5, 2020. See “Item 5. Market for Registrant’s Common Equity, Related Stockholder Matters and Issuer Purchases of Equity Securities – Issuer Purchases of Equity Securities.”
Asset Manager Affiliates
On December 31, 2018 pursuant to an agreement with LibreMax Intermediate Holdings, LP (“LibreMax”), our wholly-owned subsidiary Commodore Holdings, LLC (“Commodore”) sold Katonah Debt Advisors, L.L.C. (“Katonah Debt Advisors”), Trimaran Advisors, L.L.C. (“Trimaran Advisors”), and Trimaran Advisors Management, L.L.C. (“Trimaran Advisors Management” and, together with Katonah Debt Advisors and Trimaran Advisors, the “Disposed Manager Affiliates”) to LibreMax for a cash purchase price of approximately $37.9 million The Disposed Manager Affiliates manage certain CLO Funds.
As of December 31, 2019, our remaining asset management affiliates (the “Asset Manager Affiliates”) were comprised of Commodore, Katonah Management Holdings, LLC, Katonah X Management LLC (“Katonah X Management”), Katonah 2007-1 Management, LLC (“Katonah 2007-I Management”) and KCAP Management, LLC. Commodore, Katonah X Management and Katonah 2007-1 Management have no operations and are expected to be liquidated.
2
BC Partners’ Corporate Information
BC Partners’ principal executive offices are located at 650 Madison Avenue, 23rd Floor, New York, New York 10022, and our telephone number is (212) 891-2880.
Available Information
We maintain a website on the Internet at http:// www.portmanridge.com. The information contained in our website is not incorporated by reference into this Annual Report. We make copies of our periodic and current reports and other information meeting the informational requirements of the Securities Exchange Act of 1934 (the “Exchange Act”) available on the Investor Relations-SEC Filings section of our website free of charge as soon as reasonably practicable after we electronically file the information with, or furnish it to, the SEC. The SEC maintains an Internet site at http://www.sec.gov that contains reports, proxy and information statements and other information filed electronically by us with the SEC.
Investment Portfolio
Our investment portfolio generates investment income, which is generally used to pay principal and interest on our borrowings, our operating expenses, and to fund distributions to our stockholders. Our investment portfolio consists primarily of our Debt Securities Portfolio, investments in joint ventures and investments in CLO Fund Securities.
Debt Securities Portfolio. We target privately-held middle market companies that have strong historical cash flows, experienced management teams and identifiable and defendable market positions in industries with positive dynamics. We generally target companies that generate positive cash flows because we look to cash flows as the primary source for servicing debt.
We employ a disciplined approach in the selection and monitoring of our investments. Generally, we target investments that will generate a current return through interest income to provide for stability in our shareholder distributions and place less reliance on realized capital gains from our investments. Our investment philosophy is focused on preserving capital with an appropriate return profile relative to risk. Our investment due diligence and selection generally focuses on an underlying issuer’s net cash flow after capital expenditures to service its debt rather than on multiples of net income, valuations or other broad benchmarks which frequently miss the nuances of an issuer’s business and prospective financial performance. We also generally avoid concentrations in any one industry or issuer. We manage risk by following our internal credit policies and procedures.
When we extend senior and junior secured term loans, we will generally take a security interest in the available assets of the portfolio company, including the equity interests of its subsidiaries, which we expect to help mitigate the risk that we will not be repaid. Nonetheless, there is a possibility that our lien could be subordinated to claims of other creditors. Structurally, mezzanine debt ranks subordinate in priority of payment to senior term loans and is often unsecured. Relative to equity, mezzanine debt ranks senior to common and preferred equity in a borrower’s capital structure. Typically, mezzanine debt has elements of both debt and equity instruments, offering the fixed returns in the form of interest payments associated with a loan, while providing an opportunity to participate in the capital appreciation of a borrower, if any, through an equity interest that is typically in the form of equity purchased at the time the mezzanine loan is originated or warrants to purchase equity at a future date at a fixed cost. Mezzanine debt generally earns a higher return than senior secured debt due to its higher risk profile and usually less restrictive covenants. From time to time we may receive warrants in connection with a mezzanine debt investment. The warrants associated with mezzanine debt are typically detachable, which allows lenders to receive repayment of their principal on an agreed amortization schedule on the debt security while retaining an equity interest in the borrower. Mezzanine debt with warrants also may include a “put” feature, which permits the holder to sell its equity interest back to the borrower at a price determined through an agreed formula.
Below are summary attributes for our Debt Securities Portfolio as of and for the year ended December 31, 2019:
|
|
• |
represented approximately 67% of total investment portfolio; |
|
|
• |
contained credit instruments issued by corporate borrowers; |
|
|
• |
primarily comprised of senior secured and junior secured loans (33% and 33% of Debt Securities Portfolio, respectively); |
|
|
• |
spread across 24 different industries and 60 different entities; |
|
|
• |
average par balance per investment of approximately $3.2 million; |
|
|
• |
seven investments were on non-accrual status; and |
|
|
• |
the weighted average contractual interest rate on our loans and debt securities was approximately 10.9%, and the weighted average contractual interest rate on our loans and debt securities, adjusted for non-accrual investments, was approximately 9.0%. |
3
Our Debt Securities Portfolio investments generally range between $1 million to $20 million, although particular investments may be larger or smaller. The size of individual investments will vary according to their priority in a company’s capital structure, with larger investments in more secure positions in an effort to maximize capital preservation. The size of our investments and maturity dates may vary as follows:
|
|
• |
senior secured term loans from $2 to $20 million maturing in five to seven years; |
|
|
• |
second lien term loans from $5 to $15 million maturing in six to eight years; |
|
|
• |
senior unsecured loans from $5 to $23 million maturing in six to eight years; |
|
|
• |
mezzanine loans from $5 to $15 million maturing in seven to ten years; and |
|
|
• |
equity investments from $1 to $5 million. |
Investment in Joint Ventures.
KCAP Freedom 3 LLC. During the third quarter of 2017, the Company and Freedom 3 Opportunities LLC (“Freedom 3 Opportunities”), an affiliate of Freedom 3 Capital LLC, entered into an agreement to create KCAP Freedom 3 LLC (the “Joint Venture”). The Company and Freedom 3 Opportunities contributed approximately $37 million and $25 million, respectively, in assets to the Joint Venture, which in turn used the assets to capitalize a new fund, Great Lakes KCAP F3C Senior Funding L.L.C. (formerly known as KCAP F3C Senior Funding, L.L.C.) (the “Fund”) managed by KCAP Management, LLC, one of the Asset Manager Affiliates. In addition, the Fund used cash on hand and borrowings under a credit facility to purchase approximately $184 million of primarily middle-market loans form us and we used the proceeds from such sale to redeem approximately $147 million in debt issued by KCAP Senior Funding I, LLC (“KCAP Senior Funding”) The Fund invests primarily in middle-market loans and the Joint Venture partners may source middle-market loans from time-to-time for the Fund. During the fourth quarter of 2017, the Fund was refinanced through the issuance of senior and subordinated notes. The Joint Venture purchased 100% of the subordinated notes issued by the Fund. In connection with the refinancing, the Joint Venture made a cash distribution to us of approximately $12.6 million. Approximately $11.2 million of this distribution was a reduction in the cost basis of our investment in the Joint Venture. The final determination of the tax attributes of distributions from the Joint Venture is made on an annual (full calendar year) basis at the end of the year, therefore, any estimate of tax attributes of distributions made on an interim basis may not be representative of the actual tax attributes of distributions for the full year.
While we own a 60% interest in the Joint Venture, the Joint Venture is structured as an unconsolidated Delaware limited liability company. All portfolio and other material decisions regarding the Joint Venture must be submitted to its board of managers, which is comprised of four members, two of whom were selected by us and two of whom were selected by Freedom 3 Opportunities, and must be approved by at least one member appointed by us and one appointed by Freedom 3 Opportunities. In addition, certain matters may be approved by the Joint Venture’s investment committee, which is comprised of one member appointed by us and one member appointed by Freedom 3 Opportunities.
As of December 31, 2019, our investment in the KCAP Freedom 3 LLC Joint Venture was approximately $21.3 million at fair value.
BCP Great Lakes Partnership. BCP Great Lakes Fund LP (the “BCP Great Lakes Partnership”) has invested in BCP Great Lakes Holdings LP, a vehicle formed as a co-investment vehicle to facilitate the participation of certain co-investors to invest, directly or indirectly, in BCP Great Lakes Funding, LLC (the “Great Lakes Joint Venture”). We are a limited partner in the BCP Great Lakes Partnership and do not have any direct or indirect voting interests in the Great Lakes Joint Venture, and treat the investment as a joint venture since an affiliate of our Adviser manages BCP Great Lakes Holdings LP and controls a 50% voting interest in the Great Lakes Joint Venture. The investment strategy of BCP Great Lakes Funding, LLC is to underwrite and hold senior, secured unitranche loans made to middle-market companies. We do not pay any advisory fees in connection with our investment in the BCP Great Lakes Partnership.
In March 2019, prior to the Externalization, we increased our aggregate commitment to the BCP Great Lakes Partnership to $50 million, subject to certain limitations (including that we are not obligated to fund capital calls if such funding would cause the Company to be out of compliance with certain provisions of the 1940 Act). As of December 31, 2019, we had an aggregate $26.3 million unfunded commitment to the BCP Great Lakes Partnership, however, as of that date, our funding commitment was limited to approximately $11.3 million pursuant to the limitations described above. As of December 31, 2019, our investment in the BCP Great Lakes Partnership was approximately $23.8 million at fair value.
CLO Fund Securities. Our investments in CLO Fund Securities are primarily made up of minority investments in the subordinated securities or preferred stock of CLO Funds managed by the Disposed Manager Affiliates. From time-to-time we have also made investments in CLO Fund Securities managed by other asset managers.
4
Below are summary attributes for our CLO Fund Securities, as of and for the year-ended December 31, 2019, unless otherwise specified:
|
|
• |
CLO Fund Securities represented approximately 10% of total investment portfolio at December 31, 2019; |
|
|
• |
CLO Fund Securities Portfolio represented investments in subordinated securities or equity securities issued by CLO Funds; |
|
|
• |
all CLO Funds invested primarily in credit instruments issued by corporate borrowers; |
|
|
• |
U.S. generally accepted accounting principles (“GAAP”) basis investment income of $6.4 million; cash distributions received of approximately $8.7 million (approximately $2.5 million taxable distributable income, $11.2 million tax return of capital to the company). |
Asset Manager Affiliates. As discussed above, in connection with the LibreMax Transaction, on December 31, 2018, our wholly-owned subsidiary Commodore Holdings, LLC sold the Disposed Manager Affiliates, which represented substantially all of our investment in the Asset Manager Affiliates, to LibreMax. Commodore Holdings, LLC received cash proceeds of $37.9 million from the sale and distributed $33.8 million in cash to the Company. All of this cash distribution was recorded as a return of capital, and no realized gain or loss was recognized on this transaction.
Process
We review potential investment opportunities and conduct due diligence that typically includes a review of historical and prospective financial information, participation in a presentation held by the prospective portfolio company’s management and/or the transaction sponsor, a review of the prospective portfolio company’s product or service, an analysis and understanding of the drivers of the particular industry in which the prospective portfolio company operates, and an assessment of the debt service capabilities of the prospective portfolio company under a variety of assumed forecast scenarios.
Due to our ability to source transactions through multiple channels, we expect to continue to maintain a pipeline of opportunities to allow comparative risk return analysis and selectivity. By focusing on the drivers of revenue and cash flow, we develop our own underwriting cases, and multiple stress and event specific case scenarios for each company analyzed.
We focus on lending and investing opportunities in:
|
|
• |
companies with EBITDA of $10 to $50 million; |
|
|
• |
companies with financing needs of $25 to $150 million; |
|
|
• |
companies purchased by well-regarded private equity sponsors; |
|
|
• |
non-sponsored companies with successful business models, management teams and systems; and |
|
|
• |
high-yield bonds and broadly syndicated loans to larger companies on a selective basis. |
We source investment opportunities from:
|
|
• |
private equity sponsors; |
|
|
• |
regional investment banks for non-sponsored companies; |
|
|
• |
financial advisers and other market intermediaries; and |
|
|
• |
other middle market lenders with whom we can participate in loans. |
In our experience, good credit judgment is based on a thorough understanding of both the qualitative and quantitative factors that determine a company’s performance. Our analysis begins with an understanding of the fundamentals of the industry in which a company operates, including the current economic environment and the outlook for the industry. We also focus on the company’s relative position within the industry and our historical ability to weather economic cycles. Other key qualitative factors include the experience and depth of the management team and the financial sponsor, if any.
5
Only after we have a comprehensive understanding of the qualitative factors do we focus on quantitative metrics. We believe that with the context provided by the qualitative analysis, we can gain a better understanding of a company’s financial performance. We analyze a potential portfolio company’s sales growth and margins in the context of our competition as well as our ability to manage our working capital requirements and our ability to generate consistent cash flow. Based upon this historical analysis, we develop a set of projections which represents a reasonable underwriting case of most likely outcomes for the company over the period of our investment. We also look at potential downside cases to determine a company’s ability to service its debt in a stressed credit environment.
Elements of the qualitative analysis we use in evaluating investment opportunities include some combination of the following:
|
|
• |
industry fundamentals; |
|
|
• |
competitive position and market share; |
|
|
• |
impact of historical down-cycles on the industry and us; |
|
|
• |
quality of financial and technology infrastructure; |
|
|
• |
sourcing risks and opportunities; |
|
|
• |
labor and union strategy; |
|
|
• |
technology risk; |
|
|
• |
diversity of customer base and product lines; |
|
|
• |
quality of financial sponsor (if applicable); and |
|
|
• |
acquisition and integration history. |
Elements of the quantitative analysis we use in evaluating investment opportunities include some combination of the following:
|
|
• |
income statement analysis of growth and margin trends; |
|
|
• |
cash flow analysis of capital expenditures and free cash flow; |
|
|
• |
financial ratio and market share standing among comparable companies; |
|
|
• |
financial projections: underwriting versus stress case; |
|
|
• |
event specific credit modeling; |
|
|
• |
credit profile trend; |
|
|
• |
future capital expenditure needs and asset sale plans; |
|
|
• |
downside protection to limit losses in an event of default; |
|
|
• |
risk adjusted returns and relative value analysis; and |
|
|
• |
enterprise and asset valuations. |
The origination, structuring and credit approval processes are fully integrated. Our credit team is directly involved in all due diligence and analysis prior to the formal credit approval process by our Investment Committee.
Investment Committee
The Investment Committee serves to provide investment consistency and adherence to our core investment philosophy and policies.
Upon completion of the due diligence investigation, the underwriting team of investment professionals/analysts will prepare a credit underwriting memorandum that will summarize the contemplated transaction, present the investment highlights, analyze the risk in the transaction and mitigating factors to those risks, analyze the prospective portfolio’s historical financial statements, financial projections, industry and management team, and will then present this memorandum with its recommendations to the Investment Committee for review and approval.
The approval of a majority of the Investment Committee is required for all investments.
6
Our Board, including a majority of its independent directors, oversees and monitors our investment performance and, beginning with the second anniversary of the effective date of our Advisory Agreement, will annually review the compensation we pay to the Adviser.
Our Adviser has significant experience monitoring credit portfolios. Along with origination and credit analysis, portfolio management is one of the key elements of our business. Most of our investments will not be liquid and, therefore, we must prepare to act quickly if potential issues arise so that we can work closely with the Adviser and the private equity sponsor, if applicable, of the portfolio company to take any necessary remedial action. In addition, most of the Adviser’s senior management team, has substantial workout and restructuring experience.
In order to assist us in detecting issues with our Debt Securities Portfolio companies as early as possible, we perform a financial analysis at least quarterly on each portfolio company. This analysis typically includes:
|
|
• |
A summary of the portfolio company’s current total credit exposure as well as our portion of this exposure. |
|
|
• |
A summary and update of the portfolio company’s financial condition and performance, including but not limited to, performance versus plan, deterioration/improvement in market position, or industry fundamentals, management changes or additions, and ongoing business strategy. |
|
|
• |
Reaffirmation of, or proposal to change, the risk rating of the underlying investment. |
|
|
• |
A summary of the portfolio company’s financial covenant results vis a vis financial covenant levels established in the credit agreement. |
Watch list credits are followed closely and discussed more frequently than quarterly, as appropriate.
About the Adviser
The Adviser is an affiliate of BC Partners. LibreMax owns a minority stake in the Adviser. Subject to the overall supervision of the Board, the Adviser is responsible for managing our business and activities, including sourcing investment opportunities, conducting research, performing diligence on potential investments, structuring our investments, and monitoring our portfolio companies on an ongoing basis through a team of investment professionals.
The Adviser seeks to invest on our behalf in performing, well-established middle market businesses that operate across a wide range of industries (i.e., no concentration in any one industry). The Adviser employs fundamental credit analysis, targeting investments in businesses with relatively low levels of cyclicality and operating risk. The holding size of each position will generally be dependent upon a number of factors including total facility size, pricing and structure, and the number of other lenders in the facility. The Adviser has experience managing levered vehicles, both public and private, and seeks to enhance our returns through the use of leverage with a prudent approach that prioritizes capital preservation. The Adviser believes this strategy and approach offers attractive risk/return with lower volatility given the potential for fewer defaults and greater resilience through market cycles.
BC Partners is a leading buyout firm with a 30-year history investing across Europe and North America which has more than $25 billion in assets under management in private equity, private credit and real estate strategies. The assets under management for BC Partners are based on actively managed commitments of its managed funds and relevant vehicles formed for the purpose of co-investing alongside such funds. BC Partners operates a private equity investment platform (“BCP PE”) a credit investment platform (“BCP Credit”) and a real estate investment platform as fully integrated businesses. Our investment activity will take place primarily within the BCP Credit platform. Integration with the broader BC Partners platform allows BCP Credit to leverage a team of investment professionals across its private equity platform including its operations team. The BCP Credit Investment Team (the “Investment Team”) is led by Ted Goldthorpe who sits on both the BCP Credit and BCP PE investment committees. BCP Credit currently manages a private fund in the BCP Credit platform along with several separate managed accounts focused on credit investments and BC Partners Lending Corporation, a private BDC.
Advisory Agreement
The Adviser provides management services to us pursuant to the Advisory Agreement. Under the terms of the Investment Advisory Agreement, the Adviser is responsible for the following:
|
|
• |
managing our assets in accordance with our investment objective, policies and restrictions; |
|
|
• |
determining the composition of our portfolio, the nature and timing of the changes to our portfolio and the manner of implementing such changes; |
7
|
|
• |
monitoring our investments; |
|
|
• |
determining the securities and other assets we will purchase, retain or sell; |
|
|
• |
assisting the Board with its valuation of our assets; |
|
|
• |
directing investment professionals of the Adviser to provide managerial assistance to our portfolio companies; |
|
|
• |
performing due diligence on prospective portfolio companies; |
|
|
• |
exercising voting rights in respect of portfolio securities and other investments for us; |
|
|
• |
serving on, and exercising observer rights for, boards of directors and similar committees of our portfolio companies; and |
|
|
• |
providing us with such other investment advisory, research and related services as we may, from time to time, reasonably require for the investment of capital. |
The Adviser’s services under the Advisory Agreement are not exclusive, and it is free to furnish similar services to other entities so long as its services to us are not impaired.
Term
On April 1, 2019, we entered into the Advisory Agreement with the Adviser. Unless earlier terminated as described below, the Investment Advisory Agreement will remain in effect until April 1, 2021, a period of two years from the date it first became effective and will remain in effect from year-to-year thereafter if approved annually by a majority of the Board or by the holders of a majority of our outstanding shares, and, in each case, a majority of the independent directors.
The Advisory Agreement will automatically terminate within the meaning of the 1940 Act and related SEC guidance and interpretations in the event of its assignment. In accordance with the 1940 Act, without payment of any penalty, we may terminate the Advisory Agreement with the Adviser upon 60 days’ written notice. The decision to terminate the agreement may be made by a majority our Board or the stockholders holding a majority of the outstanding shares of our common stock. See “Advisory Agreement—Removal of Adviser” below. In addition, without payment of any penalty, the Adviser may generally terminate the Advisory Agreement upon 60 days’ written notice and, in certain circumstances, the Adviser may only be able to terminate the Advisory Agreement upon 120 days’ written notice.
Removal of Adviser
The Adviser may be removed our Board or by the affirmative vote of a Majority of the Outstanding Shares. “Majority of the Outstanding Shares” means the lesser of (1) 67% or more of the outstanding shares of our common stock present at a meeting, if the holders of more than 50% of the outstanding shares of our common stock are present or represented by proxy or (2) a majority of outstanding shares of our common stock.
Compensation of Adviser
Pursuant to the terms of the Advisory Agreement, we pay the Adviser (i) a base management fee (the “Base Management Fee”) and (ii) an incentive fee (the “Incentive Fee”). For the period from the date of the Advisory Agreement (the “Effective Date”) through the end of the first calendar quarter after the Effective Date, the Base Management Fee will be calculated at an annual rate of 1.50% of our gross assets, excluding cash and cash equivalents, but including assets purchased with borrowed amounts, as of the end of such calendar quarter. Subsequently, the Base Management Fee will be 1.50% of our average gross assets, excluding cash and cash equivalents, but including assets purchased with borrowed amounts, at the end of the two most recently completed calendar quarters; provided, however, that the Base Management Fee will be 1.00% of our average gross assets, excluding cash and cash equivalents, but including assets purchased with borrowed amounts, that exceed the product of (i) 200% and (ii) the value of our net asset value at the end of the most recently completed calendar quarter. The Incentive Fee consists of two parts: (1) a portion based on our pre-incentive fee net investment income (the “Income-Based Fee”) and (2) a portion based on the net capital gains received on our portfolio of securities on a cumulative basis for each calendar year, net of all realized capital losses and all unrealized capital depreciation on a cumulative basis, in each case calculated from the Effective Date, less the aggregate amount of any previously paid capital gains Incentive Fee (the “Capital Gains Fee”). The Income-Based Fee is 17.50% of pre-incentive fee net investment income with a 7.00% hurdle rate. The Capital Gains Fee is 17.50%. In connection with the Externalization, for the period of one year from the first day of the first quarter following the quarter in which the Closing occurred, the Adviser will permanently forego up to the full amount of the incentive fees earned by the Adviser without recourse against or reimbursement by us, to the extent necessary in order to achieve aggregate net investment income per share of common stock for such one-year period to be at least equal to $0.40 per share, subject to certain adjustments.
8
Pre-incentive fee net investment income means dividends (including reinvested dividends), interest and fee income accrued by us during the calendar quarter, minus operating expenses for the quarter (including the management fee, expenses payable under the administration agreement, and any interest expense and dividends paid on any issued and outstanding preferred stock, but excluding the incentive fee). Pre-incentive fee net investment income includes, in the case of investments with a deferred interest feature (such as original issue discount, debt instruments with payment-in-kind(“PIK”) interest and zero coupon securities), accrued income that we may not have received in cash. The Adviser is not obligated to return the incentive fee it receives on PIK interest that is later determined to be uncollectible in cash. See “Item 1A. Risk Factors— Risks Related to the Adviser and its Affiliates.” Pre-incentive fee net investment income does not include any realized capital gains, realized capital losses or unrealized capital appreciation or depreciation.
To determine the Income-Based Fee, pre-incentive fee net investment income is expressed as a rate of return on the value of our net assets at the end of the immediately preceding calendar quarter. Because of the structure of the incentive fee, it is possible that we may pay an incentive fee in a calendar quarter in which we incur a loss. For example, if we receive pre-incentive fee net investment income in excess of the quarterly hurdle rate, we will pay the applicable incentive fee even if we have incurred a loss in that calendar quarter due to realized capital losses and unrealized capital depreciation. In addition, because the quarterly hurdle rate is calculated based on our net assets, decreases in our net assets due to realized capital losses or unrealized capital depreciation in any given calendar quarter may increase the likelihood that the hurdle rate is reached and therefore the likelihood of us paying an incentive fee for the subsequent quarter. Our net investment income used to calculate this component of the incentive fee is also included in the amount of our gross assets used to calculate the management fee because gross assets are total assets (including cash received) before deducting liabilities (such as declared dividend payments).
The following is a graphical representation of the calculation of the Income-Based Fee:
Quarterly Income-Based Fee
(expressed as a percentage of the value of net assets)
|
0% |
1.75% |
2.121 % |
|
|
|
|
|
← 0% → |
← 100% → |
← 17.5% → |
|
|
|
|
|
|
|
|
|
|
|
|
|
|
|
|
The second component of the incentive fee, the Capital Gains Fee, payable at the end of each calendar year in arrears, equals 17.50% of cumulative realized capital gains through the end of such calendar year commencing with the calendar year ending December 31, 2019, computed net of all realized capital losses and unrealized capital depreciation on a cumulative basis, in each case calculated from the Effective Date, less the aggregate amount of any previously paid capital gains fee for prior periods. We will accrue, but will not pay, a Capital Gains incentive Fee with respect to unrealized appreciation because a Capital Gains incentive Fee would be owed to the Adviser if we were to sell the relevant investment and realize a capital gain. In no event will the capital gains incentive fee payable pursuant to the Investment Advisory Agreement be in excess of the amount permitted by the Investment Advisers Act of 1940, as amended (the “Advisers Act”) including Section 205 thereof.
The fees that are payable under the Investment Advisory Agreement for any partial period will be appropriately prorated.
Limitations of Liability and Indemnification
Under the Advisory Agreement, the Adviser, its officers, managers, partners, agents, employees, controlling persons, members and any other person or entity affiliated with the Adviser, including without limitation its managing member, will not be liable to us for acts or omissions performed in accordance with and pursuant to the Advisory Agreement, except those resulting from acts constituting criminal conduct, gross negligence, willful misfeasance, bad faith or reckless disregard of the duties that the Adviser owes to us under the Advisory Agreement. In addition, as part of the Advisory Agreement, we have agreed to indemnify the Adviser and each of its officers, managers, partners, agents, employees, controlling persons, members and any other person or entity affiliated with the Adviser, including without limitation its general partner, and the Administrator from and against any damages, liabilities, costs and expenses, including reasonable legal fees and other expenses reasonably incurred, in or by reason of any pending, threatened or completed action, suit, investigation or other proceeding (including an action or suit by or in the right of the Company or its security holders) arising out of or otherwise based upon the performance of any of the Adviser’s duties or obligations under the Advisory Agreement or otherwise as an investment adviser of the Company, except where attributable to criminal conduct, gross negligence, willful misfeasance, bad faith or reckless disregard of such person’s duties under the Advisory Agreement.
9
Board Approval of the Advisory Agreement
On December 12, 2018, our then-current Board held an in-person meeting to consider and approve the Advisory Agreement and related matters. The Board was provided the information required to consider the Advisory Agreement, including: (a) the nature, quality and extent of the advisory and other services to be provided to us by the Adviser; (b) comparative data with respect to advisory fees or similar expenses paid by other BDCs with similar investment objectives; (c) our projected operating expenses and expense ratio compared to BDCs with similar investment objectives; (d) any existing and potential sources of indirect income to the Adviser from its relationship with us and the profitability of that relationship; (e) information about the services to be performed and the personnel performing such services under the Advisory Agreement; (f) the organizational capability and financial condition of the Adviser and its affiliates; (g) the Adviser’s practices regarding the selection and compensation of brokers that may execute our portfolio transactions and the brokers’ provision of brokerage and research services to the Adviser; and (h) the possibility of obtaining similar services from other third-party service providers or continuing to operate as an internally managed BDC.
The Board, including a majority of independent directors, will oversee and monitor our investment performance and, beginning with the second anniversary of the effective date of the Advisory Agreement, will annually review the compensation we pay to the Adviser.
Administration Agreement
Under the terms of the Administration Agreement between us and the Administrator, the Administrator will perform, or oversee the performance of, required administrative services, which includes providing office space, equipment and office services, maintaining financial records, preparing reports to stockholders and reports filed with the SEC, and managing the payment of expenses and the performance of administrative and professional services rendered by others. We will reimburse the Administrator for services performed for us pursuant to the terms of the Administration Agreement. In addition, pursuant to the terms of the Administration Agreement, the Administrator may delegate its obligations under the Administration Agreement to an affiliate or to a third party and we will reimburse the Administrator for any services performed for us by such affiliate or third party.
Payments under the Administration Agreement are equal to an amount that reimburses the Administrator for its costs and expenses in performing its obligations and providing personnel and facilities (including rent, office equipment and utilities) for our use under the Administration Agreement, including our allocable portion of the compensation paid to our chief compliance officer and chief financial officer and their respective staff who provide services to us. The Board, including the independent directors, will review the general nature of the services provided by the Administrator as well as the related cost to us for those services and consider whether the cost is reasonable in light of the services provided.
On April 1, 2019, the Board approved the Administration Agreement with the Administrator. Unless earlier terminated as described below, the Administration Agreement will remain in effect until April 1, 2021, a period of two years from the date it first became effective and will remain in effect from year-to-year thereafter if approved annually by a majority of the Board or by the holders of a Majority of the Outstanding Shares, and, in each case, a majority of the independent directors.
We may terminate the Administration Agreement, without payment of any penalty, upon 60 days’ written notice. The decision to terminate the agreement may be made by a majority of the Board or the stockholders holding a Majority of the Outstanding Shares. In addition, the Adviser may terminate the Administration Agreement, without payment of any penalty, upon 60 days’ written notice.
Payment of Our Expenses under Our Advisory and Administration Agreements
Except as specifically provided below, we anticipate that all investment professionals and staffs of the Adviser, when and to the extent engaged in providing investment advisory and management services to us, and the compensation and routine overhead expenses (including rent, office equipment and utilities), of such personnel allocable to such services, will be provided and paid for by the Adviser. We will bear an allocable portion of the compensation paid by the Adviser (or its affiliates) to our chief compliance officer and chief financial officer and their respective staffs (based on a percentage of time such individuals devote, on an estimated basis, to our business affairs). We will also bear all other costs and expenses of our operations, administration and transactions, including, but not limited to (i) investment advisory fees, including management fees and incentive fees, to the Adviser, pursuant to our Advisory Agreement; (ii) an allocable portion of overhead and other expenses incurred by the Adviser (or its affiliates) in performing its administrative obligations under our Advisory Agreement; and (iii) all other expenses of our operations and transactions including, without limitation, those relating to:
|
|
• |
the cost of calculating our net asset value, including the cost of any third-party valuation services; |
|
|
• |
the cost of effecting any sales and repurchases of our common stock and other securities; |
|
|
• |
fees and expenses payable under any dealer manager or placement agent agreements, if any; |
|
|
• |
administration fees payable under our Administration Agreement and any sub-administration agreements, including related expenses; |
|
|
• |
debt service and other costs of borrowings or other financing arrangements; |
10
|
|
• |
expenses, including travel expense, incurred by the Adviser, or members of the investment team, or payable to third parties, performing due diligence on prospective portfolio companies and, if necessary, enforcing our rights; |
|
|
• |
transfer agent and custodial fees; |
|
|
• |
fees and expenses associated with marketing efforts; |
|
|
• |
federal and state registration fees, any stock exchange listing fees and fees payable to rating agencies; |
|
|
• |
federal, state and local taxes; |
|
|
• |
independent directors’ fees and expenses including certain travel expenses; |
|
|
• |
costs of preparing financial statements and maintaining books and records and filing reports or other documents with the SEC (or other regulatory bodies) and other reporting and compliance costs, including registration and listing fees, and the compensation of professionals responsible for the preparation of the foregoing; |
|
|
• |
the costs of any reports, proxy statements or other notices to stockholders (including printing and mailing costs), the costs of any stockholder or director meetings and the compensation of personnel responsible for the preparation of the foregoing and related matters; |
|
|
• |
commissions and other compensation payable to brokers or dealers; |
|
|
• |
research and market data; |
|
|
• |
fidelity bond, directors and officers errors and omissions liability insurance and other insurance premiums; |
|
|
• |
direct costs and expenses of administration, including printing, mailing, long distance telephone and staff; |
|
|
• |
fees and expenses associated with independent audits, outside legal and consulting costs; |
|
|
• |
costs of winding up our affairs; |
|
|
• |
costs incurred by either the Administrator or us in connection with administering our business, including payments under our Administration Agreement; |
|
|
• |
extraordinary expenses (such as litigation or indemnification); and |
|
|
• |
costs associated with reporting and compliance obligations under the 1940 Act and applicable federal and state securities laws. |
Allocation of Investment Opportunities and Potential Conflicts of Interest
Co-Investment Relief
As a BDC, we are subject to certain regulatory restrictions in making investments. For example, BDCs generally are not permitted to co-invest with certain affiliated entities in transactions originated by the BDC or its affiliates in the absence of an exemptive order from the SEC. However, BDCs are permitted to, and may, simultaneously co-invest in transactions where price is the only negotiated term. On October 23, 2018, the SEC issued an exemptive order to an affiliate of the Adviser that permits us to co-invest, subject to the satisfaction of certain conditions, in certain private placement transactions, with other funds managed by us or our affiliates, including BC Partners Lending Corporation, BCP Special Opportunities Fund I LP, BCP Special Opportunities Fund II LP and any future funds that are advised by the Adviser or its affiliated investment advisers. Under the terms of the exemptive order, in order for us to participate in a co-investment transaction a “required majority” (as defined in Section 57(o) of the 1940 Act) of our independent directors must conclude that (i) the terms of the proposed transaction, including the consideration to be paid, are reasonable and fair to us and our stockholders and do not involve overreaching with respect to us or our stockholders on the part of any person concerned, and (ii) the proposed transaction is consistent with the interests of our stockholders and is consistent with our investment objectives and strategies and certain criteria established by our Board.
11
DETERMINATION OF NET ASSET VALUE
We determine the net asset value per share of our common stock quarterly. The net asset value per share is equal to the value of our total assets minus liabilities and any preferred stock outstanding divided by the total number of shares of common stock outstanding.
Our net asset value per share was $3.40 and $4.23 as of December 31, 2019 and December 31, 2018, respectively. Since we report our assets at fair value for each reporting period, net asset value also represents the amount of stockholders’ equity per share for the reporting period. Our net asset value is comprised mostly of investment assets less debt and other liabilities:
|
|
December 31, 2019 |
|
|
December 31, 2018 |
|
|||||||||||
|
|
|
Fair Value(1) |
|
|
per Share(1) |
|
|
Fair Value(1) |
|
|
per Share(1) |
|
||||
|
Investments at fair value: |
|
|
|
|
|
|
|
|
|
|
|
|
|
|
|
|
|
Investments in short-term investments(2) |
|
$ |
4,207,107 |
|
|
$ |
0.09 |
|
|
$ |
44,756,478 |
|
|
$ |
1.20 |
|
|
Investments in debt securities |
|
|
186,802,908 |
|
|
|
4.17 |
|
|
|
147,861,744 |
|
|
|
3.96 |
|
|
Investments in CLO Fund Securities |
|
|
31,968,202 |
|
|
|
0.71 |
|
|
|
44,325,000 |
|
|
|
1.19 |
|
|
Investments in equity securities |
|
|
9,864,419 |
|
|
|
0.22 |
|
|
|
2,038,020 |
|
|
|
0.05 |
|
|
Investments in Asset Manager Affiliates |
|
|
— |
|
|
|
0.00 |
|
|
|
3,470,000 |
|
|
|
0.09 |
|
|
Investment in Joint Ventures |
|
|
45,087,967 |
|
|
|
1.01 |
|
|
|
30,857,107 |
|
|
|
0.83 |
|
|
Investment in Derivatives |
|
|
(33,437 |
) |
|
|
(0.00 |
) |
|
|
— |
|
|
|
— |
|
|
Cash |
|
|
136,864 |
|
|
|
0.00 |
|
|
|
5,417,125 |
|
|
|
0.14 |
|
|
Restricted Cash(3) |
|
|
4,967,491 |
|
|
|
0.11 |
|
|
|
3,907,341 |
|
|
|
0.10 |
|
|
All other assets |
|
|
27,372,742 |
|
|
|
0.61 |
|
|
|
2,831,866 |
|
|
|
0.08 |
|
|
Total Assets |
|
$ |
310,374,263 |
|
|
$ |
6.92 |
|
|
$ |
285,464,681 |
|
|
$ |
7.64 |
|
|
6.125% Notes Due 2022 (net of offering costs) |
|
$ |
75,755,253 |
|
|
$ |
1.69 |
|
|
$ |
75,199,858 |
|
|
$ |
2.01 |
|
|
Great Lakes KCAP Funding I, LLC (net of offering costs) |
|
|
— |
|
|
|
0.00 |
|
|
|
25,200,331 |
|
|
|
0.68 |
|
|
Great Lakes Portman Ridge Funding LLC (net of offering costs) |
|
|
78,108,535 |
|
|
|
1.74 |
|
|
|
— |
|
|
|
— |
|
|
Payable for open trades |
|
|
— |
|
|
|
0.00 |
|
|
|
23,204,564 |
|
|
|
0.62 |
|
|
Other liabilities |
|
|
4,311,905 |
|
|
|
0.10 |
|
|
|
3,838,917 |
|
|
|
0.10 |
|
|
Total Liabilities |
|
|
158,175,693 |
|
|
|
3.53 |
|
|
|
127,443,670 |
|
|
|
3.41 |
|
|
NET ASSET VALUE |
|
$ |
152,198,570 |
|
|
$ |
3.40 |
|
|
$ |
158,021,011 |
|
|
$ |
4.23 |
|
|
(1) |
Our balance sheet at fair value and resultant net asset value are calculated on a basis consistent with GAAP. Our per share presentation of such amounts (other than net asset value per share) is an internally derived non-GAAP performance measure calculated by dividing the applicable balance sheet amount by outstanding shares. We believe that the per share amounts for such balance sheet items are helpful in analyzing our balance sheet both quantitatively and qualitatively. |
|
(2) |
Includes money market accounts and U.S. Treasury Bills. |
|
(3) |
Consists of cash held for interest and principal payments on our borrowings. |
Valuation
As a BDC, we invest primarily in illiquid securities, including loans to and equity of private companies and interests in other illiquid securities, such as interests in CLO Fund Securities, joint ventures, derivatives, partnerships and distressed debt securities. These portfolio investments may be subject to restrictions on resale and will generally have no established trading market. As a result, our Board determines in good faith the fair value of our portfolio investments pursuant to a valuation policy developed in accordance with the Financial Accounting Standards Board Accounting Standards Codification 820, Fair Value Measurements and Disclosures (“ASC 820: Fair Value”), and a valuation process approved by our Board and in accordance with the 1940 Act. Our valuation policy is intended to provide a consistent basis for determining the fair value of the portfolio. Our Board is ultimately and solely responsible for making a good faith determination of the fair value of portfolio investments on a quarterly basis. We use an independent valuation firm to provide third party valuation consulting services to us and the Board of Directors. For additional information concerning valuation, see “Item 7: Management’s Discussion and Analysis of Financial Condition and Results of Operations – Valuation of Portfolio Investments”; and Notes 2 and 4 to the financial statements.
12
Our primary competitors also provide financing to prospective portfolio companies. These include commercial investment banks, specialty finance companies, hedge funds, structured investment funds, and other BDCs. Our competitors may have a lower cost of funds, and many have access to funding sources that are not available to us. Many of these entities have greater managerial resources than we have, and the 1940 Act imposes certain regulatory restrictions on us as a BDC to which many of our competitors are not subject. For additional information concerning the competitive risks we face, see “Item 1A. Risk Factors — Risks Related to Our Business and Structure — We operate in a highly competitive market for investment opportunities.”
Employees
Since the Externalization, we have not had any employees and do not expect to have any employees.
REGULATION
The following discussion is a general summary of some of the material prohibitions and restrictions governing BDCs generally. It does not purport to be a complete description of all the laws and regulations affecting BDCs.
A BDC is a unique kind of investment company that primarily focuses on investing in or lending to private or relatively small publicly traded companies and making managerial assistance available to them. The 1940 Act contains prohibitions and restrictions relating to transactions between BDCs and their directors and officers and certain other related persons and requires that a majority of the directors be persons other than “interested persons,” as that term is defined in the 1940 Act. We have implemented certain procedures to ensure that we do not engage in any prohibited transactions with any persons affiliated with us.
In addition, the 1940 Act provides that we may not change the nature of our business so as to cease to be, or to withdraw our election as, a BDC unless approved by a majority of our outstanding voting securities. A majority of the outstanding voting securities of a company is defined under the 1940 Act as the lesser of (i) 67% or more of such company’s shares present at a meeting or represented by proxy if more than 50% of the outstanding shares of such company are present or represented by proxy or (ii) more than 50% of the outstanding shares of such company.
Qualifying Assets
Under the 1940 Act, a BDC may not acquire any asset other than assets of the type listed in Section 55(a) of the 1940 Act, or “Qualifying Assets,” unless, at the time the acquisition is made, Qualifying Assets represent at least 70% of the company’s total assets. The principal categories of Qualifying Assets relevant to our business are the following:
|
|
• |
Securities of an “eligible portfolio company” purchased in transactions not involving any public offering. An “eligible portfolio company” is defined in the 1940 Act as any issuer which: |
|
|
(a) |
is organized under the laws of, and has its principal place of business in, the United States; |
|
|
(b) |
is not an investment company (other than a small business investment company wholly-owned by the BDC) or a company that would be an investment company but for certain exclusions under the 1940 Act; and |
|
|
(c) |
satisfies any of the following: |
|
|
(i) |
does not have any class of securities listed on a national securities exchange (or, if it has a class of securities listed on a national securities exchange, has an aggregate market value of outstanding voting and non-voting common equity of less than $250 million); |
|
|
(ii) |
is controlled by a BDC or a group of companies including a BDC and the BDC has an affiliated person who is a director of the eligible portfolio company; |
|
|
(iii) |
is a small and solvent company having total assets of not more than $4 million and capital and surplus of not less than $2 million; or |
|
|
(iv) |
does not have outstanding any class of securities with respect to which a broker or dealer may extend margin credit. |
|
|
• |
Securities of any eligible portfolio company that we control; |
|
|
• |
Securities purchased in a private transaction from a U.S. issuer that is not an investment company and is in bankruptcy and subject to reorganization; |
|
|
• |
Securities received in exchange for or distributed on or with respect to securities described above, or pursuant to the conversion of warrants or rights relating to such securities; and |
|
|
• |
Cash, cash equivalents, U.S. government securities or high-quality debt securities maturing in one year or less from the time of investment. |
13
Significant Managerial Assistance
A BDC must be organized and have its principal place of business in the United States and must be operated for the purpose of making investments in the types of securities described above. In addition, BDCs must generally offer to make available to such issuer of the securities (other than small and solvent companies described above) significant managerial assistance; except that, where we purchase such securities in conjunction with one or more other persons acting together, one of the other persons is the group may make available such managerial assistance. Making available significant managerial assistance means, among other things, any arrangement whereby the BDC, through its directors, officers or employees, offers to provide, and, if accepted, does so provide, guidance and counsel concerning the management, operations or business objectives and policies of a portfolio company through monitoring of portfolio company operations, selective participation in board and management meetings, consulting with and advising a portfolio company’s officers or other organizational or financial guidance.
Temporary Investments
Pending investment in other types of “Qualifying Assets,” as described above, our investments may consist of cash, cash equivalents, U.S. government securities or high quality debt securities maturing in one year or less from the time of investment, which we refer to, collectively, as temporary investments, so that at least 70% of our assets are “Qualifying Assets.” Typically, we invest in U.S. treasury bills or in repurchase agreements, provided that such agreements are fully collateralized by cash or securities issued by the U.S. government or its agencies. A repurchase agreement involves the purchase by an investor, such as us, of a specified security and the simultaneous agreement by the seller to repurchase it at an agreed upon future date and at a price which is greater than the purchase price by an amount that reflects an agreed-upon interest rate. There is no percentage restriction on the proportion of our assets that may be invested in such repurchase agreements. However, if more than 25% of our total assets constitute repurchase agreements that are treated, under applicable tax rules, as being issued by a single counterparty, we would not meet the diversification tests imposed on us by the Internal Revenue Code to qualify for tax treatment as a RIC for U.S. federal income tax purposes. Thus, we do not intend to enter into repurchase agreements treated as issued, under applicable tax rules, by a single counterparty in excess of this limit. We monitor the creditworthiness of the counterparties with which we enter into repurchase agreement transactions.
Indebtedness; Coverage Ratio
We are permitted, under specified conditions, to issue multiple classes of indebtedness and one class of stock senior to our common stock if our asset coverage, as defined in the 1940 Act, is at least equal to 200% (or 150% effective as of March 29, 2019) immediately after each such issuance. In addition, with respect to certain types of senior securities, we must make provisions to prohibit any dividend distribution to our stockholders or the repurchase of certain of our securities, unless we meet the applicable asset coverage ratios at the time of the dividend distribution or repurchase. On March 29, 2018, our Board, including a “required majority” (as such term is defined in Section 57(o) of the 1940 Act) of the Board, approved the modified asset coverage requirements set forth in Section 61(a)(2) of the 1940 Act, as amended by the SBCA. As a result, our asset coverage requirement for senior securities was changed from 200% to 150%, effective as of March 29, 2019. However, despite the SBCA, we continue to be prohibited by the indenture governing our 6.125% Notes due 2022 from making distributions on our common stock if our asset coverage, as defined in the 1940 Act, falls below 200%. We may also borrow amounts up to 5% of the value of our total assets for temporary purposes. For a discussion of the risks associated with the resulting leverage, see “Item 1A. Risk Factors — Risks Related to Our Business and Structure — We borrow money, which magnifies the potential for gain or loss on amounts invested and may increase the risk of investing in us.”
Common Stock
We are not generally able to issue and sell our common stock at a price below net asset value per share. We may, however, sell our common stock, at a price below the current net asset value of the common stock if our Board determines that such sale is in our best interests and that of our stockholders, and our stockholders approve such sale. In any such case, the price at which our common stock is to be issued and sold may not be less than a price which, in the determination of our Board, closely approximates the market value of such common stock (less any distributing commission or discount). We may also make rights offerings to our stockholders at prices per share less than the net asset value per share, subject to applicable requirements of the 1940 Act. See “Item 1A. Risk Factors — Risks Relating to Our Business and Structure — Regulations governing our operation as a BDC affect our ability to, and the way in which we, raise additional capital.”
Code of Ethics
We adopted and maintain a code of ethics pursuant to Rule 17j-1 under the 1940 Act that establishes procedures for personal investments and restricts certain personal securities transactions. Personnel subject to the code may invest in securities for their personal investment accounts, including securities that may be purchased or held by us, so long as such investments are made in accordance with the code’s requirements. A copy of the code of ethics is available on the Corporate Governance section of the Company’s website at http://www.portmanridge.com. Our code of ethics is available on the EDGAR Database on the SEC’s Internet site at http://www.sec.gov. Copies may be obtained by electronic request to publicinfo@sec.gov
14
We are committed to maintaining the privacy of our stockholders and safeguarding their non-public personal information. The following information is provided to help you understand what personal information we collect, how we protect that information and why, in certain cases, we may share information with select other parties.
Generally, we do not receive any non-public personal information relating to our stockholders, although some non-public personal information of our stockholders may become available to us. We do not disclose any non-public personal information about our stockholders or former stockholders to anyone, except as is necessary to service stockholder accounts, such as to a transfer agent, or as otherwise permitted by law.
We restrict access to non-public personal information about our stockholders to our employees with a legitimate business need for the information. We maintain safeguards designed to protect the non-public personal information of our stockholders.
Proxy Voting Policy and Procedures
Although the securities we hold are not typically voting securities, some of our investments could entitle us to voting rights. If this were to occur the Adviser would vote its portfolio securities in the best interest of our stockholders and the Adviser would review on a case-by-case basis each proposal submitted to a stockholder vote to determine its impact on the portfolio securities held by us. Although the Adviser would generally vote against proposals that it believes may have a negative impact on our portfolio securities, the Adviser may vote for such a proposal if it were to believe there exists a compelling long-term reason to do so.
Our voting decisions would be made by the Adviser, subject to authority assigned under our Advisory Agreement. To ensure that the Adviser’s vote would not be the product of a conflict of interest, we would require that (1) anyone involved in the decision making process disclose to our Board any potential conflict that he or she is aware of and any contact that he or she has had with any interested party regarding a vote; and (2) employees involved in the decision making process or vote administration are prohibited from revealing how we intend to vote on a proposal to reduce any attempted influence from interested parties.
Exclusion from CFTC Regulation
Rule 4.5 of the Commodity Futures Trading Commission (“CFTC”) permits investment advisers to BDCs to claim an exclusion from the definition of “commodity pool operator” under the Commodities Exchange Act (the “CEA”) with respect to a fund, provided certain requirements are met. In order to permit our Adviser to claim this exclusion with respect to us, we must limit our transactions in certain futures, options on futures and swaps deemed “commodity interests” under CFTC rules (excluding transactions entered into for “bona fide hedging purposes,” as defined under CFTC regulations) such that either: (i) the aggregate initial margin and premiums required to establish such futures, options on futures and swaps do not exceed 5% of the liquidation value of our portfolio, after taking into account unrealized profits and losses on such positions; or (ii) the aggregate net notional value of such futures, options on futures and swaps does not exceed 100% of the liquidation value of our portfolio, after taking into account unrealized profits and losses on such positions. In addition to meeting one of the foregoing trading limitations, we may not market our self as a commodity pool or otherwise as a vehicle for trading in the futures, options or swaps markets. Accordingly, we are not subject to regulation under the CEA or otherwise regulated by the CFTC. If the Adviser was unable to claim the exclusion with respect to us, the Adviser would become subject to registration and regulation as a commodity pool operator, which would subject the Adviser and us to additional registration and regulatory requirements and increased operating expenses.
Other
We are subject to examination by the SEC for compliance with the 1940 Act.
We are required to provide and maintain a bond issued by a reputable fidelity insurance company to protect us against larceny and embezzlement. Furthermore, as a BDC, we are prohibited from indemnifying any director or officer against any liability to our stockholders arising from willful misfeasance, bad faith, gross negligence or reckless disregard of the duties involved in the conduct of such person’s office.
We are required to adopt and implement written policies and procedures reasonably designed to prevent violation of the federal securities laws and to review these policies and procedures annually for their adequacy and the effectiveness of their implementation. We have a designated Chief Compliance Officer who is responsible for administering these policies and procedures.
15
TAXATION AS A REGULATED INVESTMENT COMPANY
We have elected to be treated for U.S. federal income tax purposes as a RIC under Subchapter M of the Internal Revenue Code of 1986, as amended (the “Code”), and intend to operate in a manner to maintain our RIC tax treatment. As a RIC, we generally will not have to pay corporate-level U.S. federal income taxes on any ordinary income or capital gains that we timely distribute to our stockholders as dividends. To qualify for tax treatment as a RIC, we must, among other things, meet certain source-of-income and asset diversification requirements (as described below). In addition, we must distribute to our stockholders, for each taxable year, at least 90% of our “investment company taxable income,” which is generally our net ordinary taxable income plus the excess of our realized net short-term capital gains over our realized net long-term capital losses (the “Annual Distribution Requirement”).
Taxation as a RIC
For any taxable year in which we qualify as a RIC and satisfy the Annual Distribution Requirement, we generally will not be subject to U.S. federal income tax on the portion of our investment company taxable income and net capital gain, defined as net long-term capital gains in excess of net short-term capital losses, we distribute to stockholders. We will be subject to U.S. federal income tax at the regular corporate rates on any investment company taxable income or net capital gain not distributed (or deemed distributed) to our stockholders.
We will be subject to a 4% nondeductible U.S. federal excise tax on our undistributed income unless we distribute in a timely manner for each calendar year an amount at least equal to the sum of (a) 98% of our net ordinary income for that calendar year, (b) 98.2% of our capital gain net income for the one-year period ending October 31 in that calendar year and (c) any income or gains realized, but not distributed, in the preceding year and on which we paid no U.S. federal income tax (the “Excise Tax Avoidance Requirement”). For this purpose, however, any net ordinary income or capital gain net income retained by us that is subject to corporate-level U.S. federal income tax for the tax year ending in that calendar year will be considered to have been distributed by year end (or earlier if estimated taxes are paid). Although we generally endeavor to make sufficient distributions each taxable year to satisfy the Excise Tax Avoidance Requirement, we may incur a U.S. federal excise tax.
To qualify as a RIC for U.S. federal income tax purposes, we must, among other things:
|
|
• |
have an election in effect to be treated as a business development company under the 1940 Act at all times during each taxable year; |
|
|
• |
derive in each taxable year at least 90% of our gross income from dividends, interest, payments with respect to certain securities loans, gains from the sale of stock or other securities or foreign currencies, or other income derived with respect to our business of investing in such stock, securities or currencies, and net income derived from interests in “qualified publicly traded partnerships” (which generally are partnerships that are traded on an established securities market or readily tradable on a secondary market (or the substantial equivalent thereof), other than partnerships that derive 90% of their income from interest, dividends and other permitted RIC income) (the “90% Income Test”); and |
|
|
• |
diversify our holdings so that at the end of each quarter of the taxable year: |
|
|
° |
at least 50% of the value of our assets consists of cash, cash equivalents, U.S. government securities, securities of other RICs, and other securities if such other securities of any one issuer do not represent more than 5% of the value of our assets or more than 10% of the outstanding voting securities of the issuer; and |
|
|
° |
no more than 25% of the value of our assets is invested in the securities, other than U.S. government securities or securities of other RICs, of one issuer or of two or more issuers that are controlled, as determined under applicable tax rules, by us and that are engaged in the same or similar or related trades or businesses or in the securities of one or more qualified publicly traded partnerships (the “Diversification Tests”). |
If we do not satisfy the requirements of the Diversification Tests as of the end of any quarter, we will not lose our status as a RIC provided that (i) we satisfied the requirements in a prior quarter and (ii) our failure to satisfy the requirements in the current quarter is not due in whole or in part to an acquisition of any security or other property.
We may invest in partnerships, including qualified publicly traded partnerships, which may result in our being subject to state, local or foreign income, franchise or withholding liabilities.
We may be required to recognize taxable income in circumstances in which we do not receive cash. For example, if we hold debt obligations that are treated under applicable tax rules as having original issue discount (such as debt instruments with payment-in-kind (“PIK”) interest or, in certain cases, with increasing interest rates or issued with warrants), we must include in income each year a portion of the original issue discount that accrues over the life of the obligation, regardless of whether cash representing such income is received by us in the same taxable year. Because any original issue discount accrued will be included in our investment company taxable income for the year of accrual, we may be required to make a distribution to our stockholders in order to satisfy the Annual Distribution Requirement, even though we will not have received any corresponding cash amount. If we are not able to obtain sufficient cash from other sources to satisfy the Annual Distribution Requirement, we may fail to qualify as a RIC and become subject to corporate-level U.S. federal income taxes on all of our taxable income without the benefit of the dividends-paid deduction.
16
Although we do not presently expect to do so, we are authorized to borrow funds and to sell assets in order (i) to satisfy the Annual Distribution Requirement and to otherwise eliminate our liability for U.S. federal income and excise taxes and (ii) to satisfy the Diversification Tests. However, under the 1940 Act, we are not permitted to borrow additional funds or to make distributions to our stockholders while our debt obligations and other senior securities are outstanding unless a certain “asset coverage” test is met. See “Regulation — Indebtedness; Coverage Ratio.” Moreover, our ability to dispose of assets to meet the Annual Distribution Requirement, the Excise Tax Avoidance Requirement or the Diversification Tests may be limited by (a) the illiquid nature of our portfolio and/or (b) other requirements relating to our qualification as a RIC. If we dispose of assets in order to meet the Annual Distribution Requirement, the Excise Tax Avoidance Requirement, or the Diversification Tests, we may make such dispositions at times that, from an investment standpoint, are not advantageous.
Certain of our investment practices may be subject to special and complex U.S. federal income tax provisions that may, among other things, (a) treat dividends that would otherwise constitute qualified dividend income as non-qualified dividend income, (b) treat dividends that would otherwise be eligible for the corporate dividends received deduction as ineligible for such treatment, (c) disallow, suspend or otherwise limit the allowance of certain losses or deductions, (d) convert lower-taxed long-term capital gain into higher-taxed short-term capital gain or ordinary income, (e) convert an ordinary loss or a deduction into a capital loss (the deductibility of which is more limited), (f) cause us to recognize income or gain without a corresponding receipt of cash, (g) adversely affect the time as to when a purchase or sale of stock or securities is deemed to occur, (h) adversely alter the characterization of certain complex financial transactions and (i) produce income that will not be qualifying income for purposes of the 90% Income Test. We intend to monitor our transactions and may make certain tax elections to mitigate the effect of these provisions and prevent our disqualification as a RIC.
Gain or loss realized by us from warrants acquired by us as well as any loss attributable to the lapse of such warrants generally will be treated as capital gain or loss. Such capital gain or loss generally will be long- term or short-term, depending on how long we held a particular warrant.
Some of the income and fees that we may recognize will not be qualifying income for purposes of the 90% Income Test. In order to ensure that such income and fees do not disqualify us as a RIC for a failure to satisfy the 90% Income Test, we may hold assets that generate such income and provide services that generate such fees indirectly through one or more entities treated as corporations for U.S. federal income tax purposes. Such corporations will be required to pay corporate-level U.S. federal income taxes on their earnings, which ultimately will reduce our return on such income and fees.
Failure to Qualify as a RIC
If we were unable to qualify for treatment as a RIC, we would be subject to tax on all of our taxable income at regular corporate rates, regardless of whether we make any distributions to our stockholders. Distributions would not be required, and any distributions made out of our current or accumulated earnings and profits would be taxable to our stockholders as ordinary dividend income that, subject to certain limitations, may be eligible for the 20.0% maximum rate if paid to non-corporate stockholders. Subject to certain limitations under the Code, corporate distributees would be eligible for the dividends-received deduction. Distributions in excess of our current and accumulated earnings and profits would be treated first as a return of capital to the extent of the stockholder’s tax basis in our stock, and any remaining distributions would be treated as a capital gain provided the stockholder holds our stock as a capital asset. If we fail to qualify as a RIC for a period greater than two taxable years, to qualify as a RIC in a subsequent year we may be subject to regular corporate tax on any net built-in gains with respect to certain of our assets (i.e., the excess of the aggregate gains, including items of income, over aggregate losses that would have been realized with respect to such assets if we had been liquidated) that we elect to recognize on requalification or when recognized over the next five years.
DIVIDEND REINVESTMENT PLAN
We have adopted a dividend reinvestment plan that provides for reinvestment of our distributions on behalf of our stockholders, unless a stockholder elects to receive cash as provided below. As a result, if our Board authorizes, and we declare, a cash distribution, then our stockholders who have not “opted out” of our dividend reinvestment plan will have their cash distributions automatically reinvested in additional shares of our common stock, rather than receiving the cash.
No action is required on the part of a registered stockholder to have such shareholder’s cash distribution reinvested in shares of our common stock. A registered stockholder may elect to receive an entire distribution in cash by notifying American Stock Transfer & Trust Company, the plan administrator and our transfer agent and registrar, in writing so that such notice is received by the plan administrator no later than the record date for distributions to stockholders. The plan administrator will set up an account for shares acquired through the plan for each stockholder who has not elected to receive distributions in cash and hold such shares in non-certificated form. Upon request by a stockholder participating in the plan, received in writing not less than ten days prior to the record date, the plan administrator will, instead of crediting shares to the participant’s account, issue a certificate registered in the participant’s name for the number of whole shares of our common stock and a check for any fractional share.
Those stockholders whose shares are held by a broker or other financial intermediary may receive distributions in cash by notifying their broker or other financial intermediary of their election.
17
We intend to use primarily newly issued shares to implement the plan, whether our shares are trading at a premium or at a discount to net asset value. However, we reserve the right to purchase shares in the open market in connection with our implementation of the plan. The number of shares to be issued to a stockholder is determined by dividing the total dollar amount of the dividend payable to such stockholder by the market price per share of our common stock at the close of regular trading on The NASDAQ Global Select Market on the dividend payment date. Market price per share on that date will be the closing price for such shares on The NASDAQ Global Select Market or, if no sale is reported for such day, at the average of their reported bid and asked prices. Shares purchased in open market transactions by the plan administrator of the dividend reinvestment plan will be allocated to a stockholder based upon the average purchase price, excluding any brokerage charges or other charges, of all shares of common stock purchased with respect to the distribution.
There are no brokerage charges or other charges to stockholders who participate in the plan. The plan administrator’s fees under the plan are paid by us. If a participant elects by written notice to the plan administrator to have the plan administrator sell part or all of the shares held by the plan administrator in the participant’s account and remit the proceeds to the participant, the plan administrator is authorized to deduct a $15.00 transaction fee plus a $0.10 per share brokerage commission from the proceeds.
If your distributions are reinvested, you will be required to pay tax on the distributions in the same manner as if the distributions were received in cash. The taxation of distributions will not be affected by the form in which you receive them.
Participants may terminate their accounts under the plan by notifying the plan administrator via its website at www.amstock.com, by filling out the transaction request form located at bottom of their statement and sending it to the plan administrator at the address set forth below or by calling the plan administrator at 1-866-668-8564.
The plan may be terminated by us upon notice in writing mailed to each participant at least 30 days prior to any record date for the payment of any dividend by us. All correspondence concerning the plan should be directed to, and additional information about the plan may be obtained from, the plan administrator by mail at American Stock Transfer & Trust Company, Attn. Dividend Reinvestment Department, P.O. Box 922, Wall Street Station, New York, NY 10269-0560 or by telephone at 1-866-668-8564.
Investing in our securities involves a high degree of risk. In addition to the other information contained in this annual report on Form 10-K, the following information should be carefully considered before making an investment in our securities. The risks set out below are not the only risks we face. Additional risks and uncertainties not presently known to us or not presently deemed material by us might also impair our operations and performance. If any of the following events occur, our business, financial condition and results of operations could be materially and adversely affected. In such case, our net asset value and the trading price of our securities could decline, and you may lose part or all of your investment.
Risks Related to Economic Conditions
Economic recessions or downturns may have a material adverse effect on our business, financial condition and results of operations, and could impair the ability of our portfolio companies to repay loans.
Economic recessions or downturns may result in a prolonged period of market illiquidity which could have a material adverse effect on our business, financial condition and results of operations. Unfavorable economic conditions also could increase our funding costs, limit our access to the capital markets or result in a decision by lenders not to extend credit to us. These events could limit our investment originations, limit our ability to grow and negatively impact our operating results.
In the event of economic recessions and downturns, the financial results of middle-market companies, like those in which we invest, will likely experience deterioration, which could ultimately lead to difficulty in meeting debt service requirements and an increase in defaults. Additionally, the end markets for certain of our portfolio companies’ products and services would likely experience negative financial trends. The performances of certain of our portfolio companies have been, and may continue to be, negatively impacted by these economic or other conditions, which may ultimately result in our receipt of a reduced level of interest income from our portfolio companies and/or losses or charge offs related to our investments, and, in turn, may adversely affect distributable income. Further, adverse economic conditions may decrease the value of collateral securing some of our loans and the value of our equity investments. As a result, we may need to modify the payment terms of our investments, including changes in payment-in-kind interest provisions and/or cash interest rates. These factors may result in our receipt of a reduced level of interest income from our portfolio companies and/or losses or charge offs related to our investments, and, in turn, may adversely affect distributable income and have a material adverse effect on our results of operations.
18
Capital markets may experience periods of disruption and instability and we cannot predict when these conditions will occur. Such market conditions could materially and adversely affect debt and equity capital markets in the United States and abroad, which could have a negative impact on our business, financial condition and results of operations.
From time-to-time, capital markets may experience periods of disruption and instability. For example, from 2008 to 2009, the global capital markets were unstable as evidenced by the lack of liquidity in the debt capital markets, significant write-offs in the financial services sector, the re-pricing of credit risk in the broadly syndicated credit market and the failure of major financial institutions. Despite actions of the U.S. federal government and various foreign governments, these events contributed to worsening general economic conditions that materially and adversely impacted the broader financial and credit markets and reduced the availability of debt and equity capital for the market as a whole and financial services firms in particular. There have been more recent periods of volatility and there can be no assurance that adverse market conditions will not repeat themselves in the future. If similar adverse and volatile market conditions repeat in the future, we and other companies in the financial services sector may have to access, if available, alternative markets for debt and equity capital in order to grow.
Moreover, the re-appearance of market conditions similar to those experienced from 2008 through 2009 for any substantial length of time or worsened market conditions, including as a result of U.S. government shutdowns or the perceived creditworthiness of the United States, could make it difficult for us to borrow money or to extend the maturity of or refinance any indebtedness we may have under similar terms and any failure to do so could have a material adverse effect on our business. Unfavorable economic and political conditions, including future recessions, political instability, geopolitical turmoil and foreign hostilities, and disease, pandemics and other serious health events, also could increase our funding costs, limit our access to the capital markets or result in a decision by lenders not to extend credit to us.
Recently, the outbreak of the novel coronavirus, or COVID-19, in many countries continues to adversely impact global commercial activity, particularly in China, and has contributed to significant volatility in financial markets. The global impact of the outbreak has been rapidly evolving, and as cases of the virus have continued to be identified in additional countries, many countries have reacted by instituting quarantines and restrictions on travel. Such actions are creating disruption in global supply chains, and adversely impacting a number of industries, such as transportation, hospitality and entertainment. The outbreak could have a continued adverse impact on economic and market conditions and trigger a period of global economic slowdown. The rapid development and fluidity of this situation precludes any prediction as to the ultimate adverse impact of the novel coronavirus. Nevertheless, the novel coronavirus presents material uncertainty and risk with respect to our and our portfolio companies performance and financial results.
We may in the future have difficulty accessing debt and equity capital on attractive terms, or at all, and a severe disruption and instability in the global financial markets or deteriorations in credit and financing conditions may cause us to reduce the volume of loans we originate and/or fund, adversely affect the value of our portfolio investments or otherwise have a material adverse effect on our business, financial condition, results of operations and cash flows.
The United Kingdom referendum decision to leave the European Union may create significant risks and uncertainty for global markets and our investments.
On January 31, 2020, the United Kingdom withdrew from the European Union (“Brexit”), with a transition period lasting until December 31, 2020. During the transition period, existing arrangements between the United Kingdom and the European Union will remain in place while the United Kingdom and the European Union seek to negotiate a free trade agreement that will govern the trading relationship between the United Kingdom and the European Union following the transition period. The longer term economic, legal, political and social framework to be put in place between the United Kingdom and the European Union remains unclear and may to lead to ongoing political and economic uncertainty and periods of exacerbated volatility in both the United Kingdom and in wider European markets for some time. The United Kingdom and Europe may also experience weakening in consumer, corporate and financial confidence. In particular, the decision made in the United Kingdom referendum may lead to a call for similar referenda in other European jurisdictions which may cause increased economic volatility and uncertainty in the European and global markets. This volatility and uncertainty may have an adverse effect on the economy generally and on the ability of us and our portfolio companies to execute our respective strategies and to receive attractive returns.
Terrorist attacks, acts of war or natural disasters may affect any market for our common stock, impact the businesses in which we invest and harm our business, operating results and financial condition.
Terrorist attacks, acts of war or natural disasters may disrupt our operations, as well as the operations of the businesses in which we invest. Such acts have created, and continue to create, economic and political uncertainties and have contributed to global economic instability. Further terrorist activities, military or security operations, or natural disasters could further weaken the domestic/global economies and create additional uncertainties, which may negatively impact the businesses in which we invest directly or indirectly and, in turn, could have a material adverse impact on our business, operating results and financial condition. Losses from terrorist attacks and natural disasters are generally uninsurable.
19
Risks Related to Our Business and Structure
Ineffective internal controls could impact our business and operating results.
Our internal control over financial reporting may not prevent or detect misstatements because of its inherent limitations, including the possibility of human error, the circumvention or overriding of controls, or fraud. Even effective internal controls can provide only reasonable assurance with respect to the preparation and fair presentation of financial statements. If we fail to maintain the adequacy of our internal controls, including any failure to implement required new or improved controls, or if we experience difficulties in their implementation, our business and operating results could be harmed and we could fail to meet our financial reporting obligations.
The Adviser has limited prior experience managing a BDC or a RIC.
The Adviser has limited experience managing a BDC or a RIC and may not be able to successfully operate our business or achieve our investment objective. As a result, an investment in our common stock may entail more risk than the shares of common stock of a comparable company with a substantial operating history.
The 1940 Act and the Code impose numerous constraints on the operations of BDCs and RICs that do not apply to the other types of investment vehicles previously managed by the Adviser’s management team. For example, under the 1940 Act, BDCs are required to invest at least 70% of their total assets primarily in securities of qualifying U.S. private or thinly-traded public companies. Moreover, qualification for RIC tax treatment under Subchapter M of the Code requires, among other things, satisfaction of source-of-income, asset diversification and other requirements. The failure to comply with these provisions in a timely manner could prevent us from qualifying as a BDC or RIC or could force us to pay unexpected taxes and penalties, which could be material. The Adviser’s limited experience in managing a portfolio of assets under such constraints may hinder its ability to take advantage of attractive investment opportunities and, as a result, achieve our investment objective.
The Adviser and its affiliates, including our officers and some of our directors, face conflicts of interest caused by compensation arrangements with us and our affiliates, which could result in actions that are not in the best interests of our stockholders.
The Adviser and its affiliates will receive substantial fees from us in return for their services, including certain incentive fees based on the performance of our investments. These fees could influence the advice provided to us. Generally, the more equity we sell in private offerings and the greater the risk assumed by us with respect to our investments, the greater the potential for growth in our assets and profits, and, correlatively, the fees payable by us to the Adviser. These compensation arrangements could affect the Adviser or its affiliates’ judgment with respect to private offerings of equity and investments made by us, which allows the Adviser to earn increased asset management fees.
We may be obligated to pay the Adviser incentive compensation even if it incurs a net loss due to a decline in the value of our portfolio.
Our Advisory Agreement entitles the Adviser to receive incentive compensation on income regardless of any capital losses. In such case, we may be required to pay the Adviser incentive compensation for a fiscal quarter even if there is a decline in the value of our portfolio or if we incur a net loss for that quarter.
Any incentive fee payable by us that relates to our net investment income may be computed and paid on income that may include interest that has been accrued, but not yet received, including original issue discount, which may arise if we receive fees in connection with the origination of a loan or possibly in other circumstances, or contractual PIK interest, which represents contractual interest added to the loan balance and due at the end of the loan term. To the extent we do not distribute accrued PIK interest, the deferral of PIK interest has the simultaneous effects of increasing the assets under management and increasing the base management fee at a compounding rate, while generating investment income and increasing the incentive fee at a compounding rate. In addition, the deferral of PIK interest would also increase the loan-to-value ratio at a compounding rate if the issuer’s assets do not increase in value, and investments with a deferred interest feature, such as PIK interest, may represent a higher credit risk than loans on which interest must be paid in full in cash on a regular basis.
For example, if a portfolio company defaults on a loan that is structured to provide accrued interest, it is possible that accrued interest previously included in the calculation of the incentive fee will become uncollectible. The Adviser is not under any obligation to reimburse us for any part of the incentive fee it received that was based on accrued income that we never received as a result of a default by an entity on the obligation that resulted in the accrual of such income, and such circumstances would result in us paying an incentive fee on income that we never received.
20
There may be conflicts of interest related to obligations that the Adviser’s senior management and investment team has to other clients.
The members of the senior management and investment team of the Adviser serve or may serve as officers, directors or principals of entities that operate in the same or a related line of business as us, or of investment funds managed by the same personnel. In serving in these multiple capacities, they may have obligations to other clients or investors in those entities, the fulfillment of which may not be in our best interests or in the best interest of our stockholders. Our investment objective may overlap with the investment objectives of such investment funds, accounts or other investment vehicles. In particular, we rely on the Adviser to manage our day-to-day activities and to implement our investment strategy. The Adviser and certain of its affiliates are presently, and plan in the future to continue to be, involved with activities that are unrelated to us. As a result of these activities, the Adviser, its officers and employees and certain of its affiliates will have conflicts of interest in allocating their time between us and other activities in which they are or may become involved, including the management of its affiliated funds. The Adviser and its officers and employees will devote only as much of its or their time to our business as the Adviser and its officers and employees, in their judgment, determine is reasonably required, which may be substantially less than their full time.
We rely, in part, on the Adviser to assist with identifying and executing upon investment opportunities and on our Board to review and approve the terms of our participation in co-investment transactions with the Adviser and its affiliates. The Adviser and its affiliates are not restricted from forming additional investment funds, entering into other investment advisory relationships or engaging in other business activities. These activities could be viewed as creating a conflict of interest in that the time and effort of the members of the Adviser, its affiliates and their officers and employees will not be devoted exclusively to our business, but will be allocated between us and such other business activities of the Adviser and its affiliates in a manner that the Adviser deems necessary and appropriate.
An affiliate of the Adviser manages BC Partners Lending Corporation, which is a BDC that will invest primarily in debt and equity of privately-held middle-market companies, similar to our targets for investment. Therefore, there may be certain investment opportunities that satisfy the investment criteria for BC Partners and us. BC Partners operates as a distinct and separate company and any investment in our common stock will not be an investment in BC Partners. In addition, certain of our executive officers serve in substantially similar capacities for BC Partners and three of our independent directors serve as independent directors of BC Partners Lending Corporation.
The time and resources that individuals employed by the Adviser devote to us may be diverted and we may face additional competition due to the fact that individuals employed by the Adviser are not prohibited from raising money for or managing other entities that make the same types of investments that we target.
Neither the Adviser nor individuals employed by the Adviser are generally prohibited from raising capital for and managing other investment entities that make the same types of investments that we target. As a result, the time and resources that these individuals may devote to us may be diverted. In addition, we may compete with any such investment entity for the same investors and investment opportunities. On October 23, 2018, the SEC issued an order granting an application for exemptive relief to an affiliate of the Adviser that allows BDCs managed by the Adviser, including us, to co-invest, subject to the satisfaction of certain conditions, in certain private placement transactions, with other funds managed by the Adviser or its affiliates, including BCP Special Opportunities Fund I LP and BCP Special Opportunities Fund II LP and any future funds that are advised by the Adviser t or its affiliated investment advisers. Affiliates of the Adviser, whose primary business includes the origination of investments, engage in investment advisory business with accounts that compete with us.
Our base management and incentive fees may induce the Adviser to make speculative investments or to incur leverage.
The incentive fee payable by us to the Adviser may create an incentive for the Adviser to make investments on our behalf that are risky or more speculative than would be the case in the absence of such compensation arrangement. The way in which the incentive fee payable to the Adviser is determined may encourage the Adviser to use leverage to increase the leveraged return on our investment portfolio. The part of the management and incentive fees payable to the Adviser that relates to our net investment income is computed and paid on income that may include interest income that has been accrued but not yet received in cash, such as market discount, debt instruments with PIK interest, preferred stock with PIK dividends and zero coupon securities. This fee structure may be considered to involve a conflict of interest for the Adviser to the extent that it may encourage the Adviser to favor debt financings that provide for deferred interest, rather than current cash payments of interest.
In addition, the fact that our base management fee is payable based upon our gross assets, which would include any borrowings for investment purposes, may encourage the Adviser to use leverage to make additional investments. Under certain circumstances, the use of leverage may increase the likelihood of defaulting on our borrowings, which would disfavor holders of our common stock. Such a practice could result in us investing in more speculative securities than would otherwise be in our best interests, which could result in higher investment losses, particularly during cyclical economic downturns.
21
The Adviser relies on key personnel, the loss of any of whom could impair its ability to successfully manage us.
Our future success depends, to a significant extent, on the continued services of the officers and employees of the Adviser or its affiliates. Our Adviser’s capabilities in structuring the investment process, providing competent, attentive and efficient services to us, and facilitating access to financing on acceptable terms depend on the employment of investment professionals in adequate number and of adequate sophistication to match the corresponding flow of transactions. The departure of key personnel or of a significant number of the investment professionals or partners of our Adviser could have a material adverse effect on our ability to achieve our investment objective. Our Adviser may need to hire, train, supervise and manage new investment professionals to participate in our investment selection and monitoring process and may not be able to find investment professionals in a timely manner or at all.
The Adviser may retain additional consultants, advisors and/or operating partners to provide services to us, and such additional personnel will perform similar functions and duties for other organizations which may give rise to conflicts of interest.
BC Partners may work with or alongside one or more consultants, advisors (including senior advisors and CEOs) and/or operating partners who are retained by BC Partners on a consultancy or retainer or other basis, to provide services to us and other entities sponsored by BC Partners including the sourcing of investments and other investment-related and support services. The functions undertaken by such persons with respect to us and any of our investments will not be exclusive and such persons may perform similar functions and duties for other organizations which may give rise to conflicts of interest. Such persons may also be appointed to the board of directors of companies and have other business interests which give rise to conflicts of interest with the interests of us or a portfolio entity of us. Stockholders should note that such persons may retain compensation that will not offset the base management fee payable to the Adviser, including that: (i) such persons are permitted to retain all directors’ fees, monitoring fees and other compensation received by them in respect of acting as a director or officer of, or providing other services to, a portfolio entity and such amounts shall not be credited against the base management fee; and (ii) certain of such persons may be paid a deal fee, a consultancy fee or other compensation where they are involved in a specific project relating to us, which fee will be paid either by us or, if applicable, the relevant portfolio entity.
The compensation we pay to the Adviser was determined without independent assessment on our behalf, and these terms may be less advantageous to us than if such terms had been the subject of arm’s-length negotiations.
The compensation we pay to the Adviser was not entered into on an arm’s-length basis with an unaffiliated third party. As a result, the form and amount of such compensation may be less favorable to us than they might have been had these been entered into through arm’s-length transactions with an unaffiliated third party.
The Adviser’s influence on conducting our operations gives it the ability to increase its fees, which may reduce the amount of cash flow available for distribution to our stockholders.
The Adviser is paid a base management fee calculated as a percentage of our gross assets and unrelated to net income or any other performance base or measure. The Adviser may advise us to consummate transactions or conduct its operations in a manner that, in the Adviser’s reasonable discretion, is in the best interests of our stockholders. These transactions, however, may increase the amount of fees paid to the Adviser. The Adviser’s ability to influence the base management fee paid to it by us could reduce the amount of cash flow available for distribution to our stockholders.
We operate in a highly competitive market for investment opportunities.
A large number of entities compete with us to make the types of investments that we make. We compete with other BDCs, as well as a number of investment funds, investment banks and other sources of financing, including traditional financial services companies, such as commercial banks and finance companies. Many of our competitors are substantially larger and have considerably greater financial, marketing and other resources than we do. For example, some competitors may have a lower cost of funds and access to funding sources that are not available to us. This may enable some of our competitors to make commercial loans with interest rates that are lower than the rates we typically offer. We may lose prospective portfolio investments if we do not match our competitors’ pricing, terms and structure. If we do match our competitors’ pricing, terms or structure, we may experience decreased net interest income. In addition, some of our competitors may have higher risk tolerances or different risk assessments, which could allow them to consider a wider variety of investments, establish more relationships and build their market shares. Furthermore, many of our potential competitors are not subject to the regulatory restrictions that the 1940 Act imposes on us as a BDC. As a result of this competition, there can be no assurance that we will be able to identify and take advantage of attractive investment opportunities or that we will be able to fully invest our available capital. If we are not able to compete effectively, our business and financial condition and results of operations will be adversely affected.
22
If the Adviser is unable to source investments effectively, we may be unable to achieve our investment objectives and provide returns to stockholders.
Our ability to achieve our investment objective depends on the Adviser’s ability to identify, evaluate and invest in suitable companies that meet our investment criteria. Accomplishing this result on a cost-effective basis is largely a function of the Adviser’s marketing capabilities, its management of the investment process, its ability to provide efficient services and its access to financing sources on acceptable terms. Failure to source investments effectively could have a material adverse effect on our business, financial condition and results of operations.
We may have difficulty paying distributions required to maintain our RIC status if we recognize income before or without receiving cash equal to such income.
In accordance with the Code, we include in income certain amounts that we have not yet received in cash, such as non-cash PIK interest, which represents contractual interest added to the loan balance and due at the end of the loan term. The increases in loan balances as a result of contracted non-cash PIK arrangements are included in income for the period in which such non-cash PIK interest was received, which is often in advance of receiving cash payment, and are separately identified on our statements of cash flows. We also may be required to include in income certain other amounts that we will not receive in cash. Any warrants that we receive in connection with our debt investments generally are valued as part of the negotiation process with the particular portfolio company. As a result, a portion of the aggregate purchase price for the debt investments and warrants is allocated to the warrants that we receive. This generally results in the associated debt investment having “original issue discount” for tax purposes, which we must recognize as ordinary income as it accrues. This increases the amounts we are required to distribute to maintain our qualification for tax treatment as a RIC. Because such original issue discount income might exceed the amount of cash received in a given year with respect to such investment, we might need to obtain cash from other sources to satisfy such distribution requirements. Other features of the debt instruments that we hold may also cause such instruments to generate original issue discount.
Since, in certain cases, we may recognize income before or without receiving cash representing such income, we may have difficulty meeting the annual distribution requirement necessary to maintain RIC tax treatment under the Code. Accordingly, we may have to sell some of our investments at times and/or at prices we would not consider advantageous, raise additional debt or equity capital or forgo new investment opportunities for this purpose. If we are not able to obtain cash from other sources, we may fail to qualify for RIC tax treatment and thus become subject to corporate-level U.S. federal income tax. For additional discussion regarding the tax implications of a RIC, see “Business — Regulation — Taxation as a Regulated Investment Company.”
Any unrealized losses we experience on our loan portfolio may be an indication of future realized losses, which could reduce our resources available to make distributions.
As a BDC, we are required to carry our investments at market value or, if no market value is ascertainable, at the fair value as determined in good faith by our Board pursuant to a valuation methodology approved by our Board. Decreases in the market values or fair values of our investments will be recorded as unrealized losses. An unrealized loss in our loan portfolio could be an indication of a portfolio company’s inability to meet its repayment obligations with respect to the affected loans. This could result in realized losses in the future and ultimately in reductions of our resources available to pay dividends or interest and principal on our securities and could cause you to lose all or part of your investment.
We may experience fluctuations in our quarterly and annual operating results and credit spreads.
We could experience fluctuations in our quarterly and annual operating results due to a number of factors, some of which are beyond our control, including our ability to make investments in companies that meet our investment criteria, the interest rate payable on the debt securities we acquire (which could stem from the general level of interest rates, credit spreads, or both), the default rate on such securities, prepayment upon the triggering of covenants in our middle market loans as well as our CLO Funds, our level of expenses, variations in and timing of the recognition of realized and unrealized gains or losses, the degree to which we encounter competition in our markets and general economic conditions. As a result of these factors, results for any period should not be relied upon as being indicative of performance in future periods.
We are exposed to risks associated with changes in interest rates and spreads.
Changes in interest rates may have a substantial negative impact on our investments, the value of our securities and our rate of return on invested capital. A reduction in the interest spreads on new investments could also have an adverse impact on our net interest income. An increase in interest rates could decrease the value of any investments we hold which earn fixed interest rates, including mezzanine securities and high-yield bonds, and also could increase our interest expense, thereby decreasing our net income. An increase in interest rates due to an increase in credit spreads, regardless of general interest rate fluctuations, could also negatively impact the value of any investments we hold in our portfolio.
23
In addition, an increase in interest rates available to investors could make an investment in our securities less attractive than alternative investments, a situation which could reduce the value of our securities. Conversely, a decrease in interest rates may have an adverse impact on our returns by requiring us to seek lower yields on our debt investments and by increasing the risk that our portfolio companies will prepay our debt investments, resulting in the need to redeploy capital at potentially lower rates. A decrease in market interest rates may also adversely impact our returns on idle funds, which would reduce our net investment income.
The interest rates of our term loans to our portfolio companies that extend beyond 2021 might be subject to change based on recent regulatory changes.
LIBOR, the London interbank offered rate, is the basic rate of interest used in lending between banks on the London interbank market and is widely used as a reference for setting the interest rate on loans globally. We typically use LIBOR as a reference rate in term loans we extend to portfolio companies such that the interest due to us pursuant to a term loan extended to a partner company is calculated using LIBOR. Some of our term loan agreements with partner companies contain a stated minimum value for LIBOR.
In 2017, the United Kingdom’s Financial Conduct Authority, which regulates LIBOR, announced the desire to phase out LIBOR by the end of 2021. The U.S. Federal Reserve, in conjunction with the Alternative Reference Rates Committee, a steering committee comprised of large U.S. financial institutions, is considering replacing U.S.-dollar LIBOR with the Secured Overnight Financing Rate (“SOFR”) a new index calculated by short-term repurchase agreements, backed by Treasury securities. Although there have been a few issuances utilizing SOFR or the Sterling Over Night Index Average, an alternative reference rate that is based on transactions, it is unknown whether these alternative reference rates will attain market acceptance as replacements for LIBOR. Any transition away from LIBOR to alternative reference rates is complex and could have a material adverse effect on our business, financial condition and results of operations, including as a result of any changes in the pricing of our investments, changes to the documentation for certain of our investments and the pace of such changes, disputes and other actions regarding the interpretation of current and prospective loan documentation or modifications to processes and systems.
If LIBOR ceases to exist, we may need to renegotiate any credit agreements extending beyond 2021 with our prospective portfolio companies that utilize LIBOR as a factor in determining the interest rate and may also need to renegotiate the terms of our credit facilities. Any such renegotiations may have a material adverse effect on our business, financial condition and results of operations, including as a result of changes in interest rates payable to us by our portfolio companies or payable by us under our credit facilities. There is currently no definitive information regarding the future utilization of LIBOR or of any particular replacement rate. As such, the potential effect of any such event on our cost of capital and net investment income cannot yet be determined.
We borrow money, which magnifies the potential for gain or loss on amounts invested and may increase the risk of investing in us.
Borrowings, also known as leverage, magnify the potential for gain or loss on amounts invested and, therefore, increase the risks associated with investing in us. We have issued senior securities, and in the future may borrow from, or issue additional senior securities (such as preferred or convertible securities or debt securities) to, banks and other lenders and investors. Subject to prevailing market conditions, we intend to grow our portfolio of assets by raising additional capital, including through the prudent use of leverage available to us. Lenders and holders of such senior securities would have fixed dollar claims on our assets that are superior to the claims of our common stockholders. Leverage is generally considered a speculative investment technique. Any increase in our income in excess of interest payable on our outstanding indebtedness would cause our net income to increase more than it would have had we not incurred leverage, while any decrease in our income would cause net income to decline more sharply than it would have had we not incurred leverage. Such a decline could negatively affect our ability to make distributions to our stockholders and service our debt obligations. In addition, our common stockholders will bear the burden of any increase in our expenses as a result of leverage. There can be no assurance that our leveraging strategy will be successful.
Our outstanding indebtedness imposes, and additional debt we may incur in the future will likely impose, financial and operating covenants that restrict our business activities, including limitations that could hinder our ability to finance additional loans and investments or to make the distributions required to maintain our status as a RIC. A failure to add new debt facilities or issue additional debt securities or other evidences of indebtedness in lieu of or in addition to existing indebtedness could have a material adverse effect on our business, financial condition or results of operations.
24
The following table illustrates the effect of leverage on returns from an investment in our common stock as of December 31, 2019, assuming various annual returns, net of expenses. The calculations in the table below are hypothetical and actual returns may be higher or lower than those appearing in the table below.
|
|
|
|
|
|
|
|
|
|
|
|
||
|
Assumed Return on our Portfolio (Net of Expenses) |
|
(10)% |
|
(5)% |
|
0% |
|
5% |
|
10% |
||
|
Corresponding return to common stockholder(2) |
|
(26.0)% |
|
(15.8)% |
|
(5.6)% |
|
4.6% |
|
14.8% |
||
|
|
|
|
|
|
|
|
|
|
|
|
||
|
(1) |
Assumes $310.4 million in total assets, $157.0 million in debt outstanding and $152.2 million in net assets as of as of December 31, 2019 and a weighted average interest rate of 5.4% as of December 31, 2019. |
|||||||||||
Our indebtedness could adversely affect our financial health and our ability to respond to changes in our business.
With certain limited exceptions, we are only allowed to borrow amounts or issue senior securities such that our asset coverage, as defined in the 1940 Act, is at least 200% (or the 150% asset coverage ratio effective as of March 29, 2019) immediately after such borrowing or issuance. The amount of leverage that we employ in the future will depend on our management’s and our Board’ assessment of market and other factors at the time of any proposed borrowing. There is no assurance that a leveraging strategy will be successful. As a result of the level of our leverage:
|
|
• |
our exposure to risk of loss is greater if we incur debt or issue senior securities to finance investments because a decrease in the value of our investments has a greater negative impact on our equity returns and, therefore, the value of our business if we did not use leverage; |
|
|
• |
the decrease in our asset coverage ratio resulting from increased leverage and the covenants contained in documents governing our indebtedness (which may impose asset coverage or investment portfolio composition requirements that are more stringent than those imposed by the 1940 Act) limit our flexibility in planning for, or reacting to, changes in our business and industry, as a result of which we could be required to liquidate investments at an inopportune time; |
|
|
• |
we are required to dedicate a portion of our cash flow to interest payments, limiting the availability of cash for dividends and other purposes; and |
|
|
• |
our ability to obtain additional financing in the future may be impaired. |
We cannot be sure that our leverage will not have a material adverse effect on us. In addition, we cannot be sure that additional financing will be available when required or, if available, will be on terms satisfactory to us. Further, even if we are able to obtain additional financing, we may be required to use some or all of the proceeds thereof to repay our outstanding indebtedness.
Our Board has approved our ability to incur additional leverage as permitted by recent legislation.
The 1940 Act generally prohibits us from incurring indebtedness unless immediately after such borrowing we have an asset coverage for total borrowings of at least 200% (i.e., the amount of debt may not exceed 50% of the value of our assets). However, the recently enacted SBCA has modified the 1940 Act by allowing a BDC to increase the maximum amount of leverage it may incur from an asset coverage ratio of 200% to an asset coverage ratio of 150%, if certain requirements are met. In other words, prior to the enactment of the SBCA, a BDC could borrow $1 for investment purposes for every $1 of investor equity. Now, for those BDCs that satisfy the SBCA’s approval and disclosure requirements, the BDC can borrow $2 for investment purposes for every $1 of investor equity.
In accordance with the SBCA, on March 29, 2018, our Board, including a “required majority” approved the modified asset coverage requirements set forth in Section 61(a)(2) of the 1940 Act. As a result, our asset coverage requirements for senior securities changed from 200% to 150%, effective March 29, 2019. However, despite the SBCA, we will continue to be prohibited by the indentures governing our 6.125% Notes from making distributions on our common stock if our asset coverage, as defined in the 1940 Act, falls below 200%. In any such event, we would be prohibited from making distributions required to maintain our status as a RIC.
Leverage magnifies the potential for loss on investments in our indebtedness and on invested equity capital. As we use leverage to partially finance our investments, you will experience increased risks of investing in our securities. If the value of our assets increases, then leveraging would cause the net asset value attributable to our common stock to increase more sharply than it would have had we not leveraged. Conversely, if the value of our assets decreases, leveraging would cause net asset value to decline more sharply than it otherwise would have had we not leveraged our business. Similarly, any increase in our income in excess of interest payable on the borrowed funds would cause our net investment income to increase more than it would without the leverage, while any decrease in our income would cause net investment income to decline more sharply than it would have had we not borrowed. Such a decline could negatively affect our ability to pay common stock dividends, scheduled debt payments or other payments related to our securities. Leverage is generally considered a speculative investment technique.
25
We may default under the Revolving Credit Facility or any future borrowing facility we enter into or be unable to amend, repay or refinance any such facility on commercially reasonable terms, or at all, which could have a material adverse effect on our business, financial condition, results of operations and cash flows.
In the event we default under our revolving credit facility (the “Revolving Credit Facility”) or any other future borrowing facility, our business could be adversely affected as we may be forced to sell a portion of our investments quickly and prematurely at prices that may be disadvantageous to us in order to meet our outstanding payment obligations and/or support working capital requirements under the Revolving Credit Facility or such future borrowing facility, any of which would have a material adverse effect on our business, financial condition, results of operations and cash flows. In addition, following any such default, the agent for the lenders under the Revolving Credit Facility or such future borrowing facility could assume control of the disposition of any or all of our assets, including the selection of such assets to be disposed and the timing of such disposition, which would have a material adverse effect on our business, financial condition, results of operations and cash flows.
Provisions in the Revolving Credit Facility or any other future borrowing facility may limit our discretion in operating our business.
The Revolving Credit Facility is, and any future borrowing facility may be, backed by all or a portion of our loans and securities on which the lenders will or, in the case of a future facility, may have a security interest. We may pledge up to 100% of our assets and may grant a security interest in all of our assets under the terms of any debt instrument we enter into with lenders. We expect that any security interests we grant will be set forth in a pledge and security agreement and evidenced by the filing of financing statements by the agent for the lenders. In addition, we expect that the custodian for our securities serving as collateral for such loan would include in its electronic systems notices indicating the existence of such security interests and, following notice of occurrence of an event of default, if any, and during its continuance, will only accept transfer instructions with respect to any such securities from the lender or its designee. If we were to default under the terms of any debt instrument, the agent for the applicable lenders would be able to assume control of the timing of disposition of any or all of our assets securing such debt, which would have a material adverse effect on our business, financial condition, results of operations and cash flows.
In addition, any security interests as well as negative covenants under the Revolving Credit Facility or any other borrowing facility may limit our ability to create liens on assets to secure additional debt and may make it difficult for us to restructure or refinance indebtedness at or prior to maturity or obtain additional debt or equity financing. In addition, if our borrowing base under the Revolving Credit Facility or any other borrowing facility were to decrease, we would be required to secure additional assets in an amount equal to any borrowing base deficiency. In the event that all of our assets are secured at the time of such a borrowing base deficiency, we could be required to repay advances under the Revolving Credit Facility or any other borrowing facility or make deposits to a collection account, either of which could have a material adverse impact on our ability to fund future investments and to make stockholder distributions.
In addition, under the Revolving Credit Facility or any future borrowing facility we will be subject to limitations as to how borrowed funds may be used, which may include restrictions on geographic and industry concentrations, loan size, payment frequency and status, average life, collateral interests and investment ratings, as well as regulatory restrictions on leverage, which may affect the amount of funding that may be obtained. There may also be certain requirements relating to portfolio performance, including required minimum portfolio yield and limitations on delinquencies and charge-offs, a violation of which could limit further advances and, in some cases, result in an event of default. An event of default under the Revolving Credit Facility or any other borrowing facility could result in an accelerated maturity date for all amounts outstanding thereunder, which could have a material adverse effect on our business and financial condition. This could reduce our revenues and, by delaying any cash payment allowed to us under the Revolving Credit Facility or any other borrowing facility until the lenders have been paid in full, reduce our liquidity and cash flow and impair our ability to grow our business and maintain our qualification as a RIC.
Because we intend to continue to distribute substantially all of our income and net realized capital gains to our stockholders, we will need additional capital to finance our growth.
In order to continue to qualify as a RIC, to avoid payment of excise taxes and to minimize or avoid payment of U.S. federal income taxes, we intend to continue to distribute to our stockholders substantially all of our net ordinary income and realized net capital gains (although we may retain certain net long-term capital gains, pay applicable U.S. federal income taxes with respect thereto, and elect to treat as deemed distributions to our stockholders). As a BDC, in order to incur new debt, we are generally required to meet a coverage ratio of total assets to total senior securities, which includes all of our borrowings and any preferred stock we may issue in the future, of at least 200% (or the 150% asset coverage ratio effective as of March 29, 2019), as measured immediately after issuance of such security. This requirement limits the amount that we may borrow. Because we will continue to need capital to grow our loan and investment portfolio, this limitation may prevent us from incurring debt and require us to issue additional equity at a time when it may be disadvantageous to do so. We cannot assure you that debt and equity financing will be available to us on favorable terms, or at all, and debt financings may be restricted by the terms of such borrowings. Also, as a business development company, we generally are not permitted to issue equity securities priced below net asset value without stockholder approval. If additional funds are not available to us, we could be forced to curtail or cease new lending and investment activities.
26
We may from time to time expand our business through acquisitions, which could disrupt our business and harm our financial condition.
We may pursue potential acquisitions of, and investments in, businesses complementary to our business and from time to time engage in discussions regarding such possible acquisitions. Such acquisition and any other acquisitions we may undertake involve a number of risks, including:
|
|
• |
failure of the acquired businesses to achieve the results we expect; |
|
|
• |
substantial cash expenditures; |
|
|
• |
diversion of capital and management attention from operational matters; |
|
|
• |
our inability to retain key personnel of the acquired businesses |
|
|
• |
incurrence of debt and contingent liabilities and risks associated with unanticipated events or liabilities; and |
|
|
• |
the potential disruption and strain on our existing business and resources that could result from our planned growth and continuing integration of our acquisitions. |
If we fail to properly evaluate acquisitions or investments, we may not achieve the anticipated benefits of such acquisitions, we may incur costs in excess of what we anticipate, and management resources and attention may be diverted from other necessary or valuable activities. Any acquisition may not result in short-term or long-term benefits to us. If we are unable to integrate or successfully manage any business that we acquire, we may not realize anticipated cost savings, improved efficiencies or revenue growth, which may result in reduced profitability or operating losses.
We may invest through joint ventures, partnerships or other special purpose vehicles and our investments through these vehicles may entail greater risks, or risks that we otherwise would not incur, if we otherwise made such investments directly.
We may make indirect investments in portfolio companies through joint ventures, partnerships or other special purpose vehicles (“Investment Vehicles”). In general, the risks associated with indirect investments in portfolio companies through a joint venture, partnership or other special purpose vehicle are similar to those associated with a direct investment in a portfolio company. While we intend to analyze the credit and business of a potential portfolio company in determining whether or not to make an investment in an Investment Vehicle, we will nonetheless be exposed to the creditworthiness of the Investment Vehicle. In the event of a bankruptcy proceeding against the portfolio company, the assets of the portfolio company may be used to satisfy its obligations prior to the satisfaction of our investment in the Investment Vehicle (i.e., our investment in the Investment Vehicle could be structurally subordinated to the other obligations of the portfolio company). In addition, if we are to invest in an Investment Vehicle, we may be required to rely on our partners in the Investment Vehicle when making decisions regarding the Investment Vehicle’s investments, accordingly, the value of the investment could be adversely affected if our interests diverge from those of our partners in the Investment Vehicle.
Our Board may change our investment objective, operating policies and strategies without prior notice or stockholder approval.
Our Board has the authority to modify or waive certain of our operating policies and strategies without prior notice and without stockholder approval. However, absent stockholder approval, we may not change the nature of our business so as to cease to be, or withdraw our election as, a BDC. We cannot predict the effect any changes to our current operating policies and strategies would have on our business and operating results. Nevertheless, the effects may adversely affect our business and they could negatively impact our ability to pay you dividends and could cause you to lose all or part of your investment in our securities.
Our businesses may be adversely affected by litigation and regulatory proceedings.
From time to time, we may be subject to legal actions as well as various regulatory, governmental and law enforcement inquiries, investigations and subpoenas. In any such claims or actions, demands for substantial monetary damages may be asserted against us and may result in financial liability or an adverse effect on our reputation among investors. We may be unable to accurately estimate our exposure to litigation risk when we record balance sheet reserves for probable loss contingencies. As a result, any reserves we establish to cover any settlements or judgments may not be sufficient to cover our actual financial exposure, which may have a material impact on our results of operations or financial condition. In regulatory enforcement matters, claims for disgorgement, the imposition of penalties and the imposition of other remedial sanctions are possible.
27
Regulations governing our operation as a BDC affect our ability to, and the way in which we, raise additional capital.
Our business requires a substantial amount of additional capital. We may acquire additional capital from the issuance of senior securities or other indebtedness, the issuance of additional shares of our common stock or from securitization transactions. However, we may not be able to raise additional capital in the future on favorable terms or at all. We may issue debt securities or preferred securities, which we refer to collectively as “senior securities,” and we may borrow money from banks or other financial institutions, up to the maximum amount permitted by the 1940 Act. The 1940 Act permits us to issue senior securities or incur indebtedness only in amounts such that our asset coverage, as defined in the 1940 Act, equals at least 200% (or the 150% asset coverage ratio effective as of March 29, 2019) immediately after such issuance or incurrence. With respect to certain types of senior securities, we must make provisions to prohibit any dividend distribution to our stockholders or the repurchase of certain of our securities, unless we meet the applicable asset coverage ratios at the time of the dividend distribution or repurchase. If the value of our assets declines, we may be unable to satisfy the asset coverage test. Furthermore, any amounts that we use to service our indebtedness would not be available for distributions to our common stockholders.
All of the costs of offering and servicing such debt or preferred stock (if issued by us in the future), including interest or preferential dividend payments thereon, will be borne by our common stockholders. The interests of the holders of any debt or preferred stock we may issue will not necessarily be aligned with the interests of our common stockholders. In particular, the rights of holders of our debt or preferred stock to receive interest, dividends or principal repayment will be senior to those of our common stockholders. Also, in the event we issue preferred stock, the holders of such preferred stock will have the ability to elect two members of our Board. In addition, we may grant a lender a security interest in a significant portion or all of our assets, even if the total amount we may borrow from such lender is less than the amount of such lender’s security interest in our assets.
We are not generally able to issue and sell our common stock at a price below net asset value per share. We may, however, sell our common stock at a price below the then-current net asset value of our common stock if our Board determines that such sale is in the best interests of us and our stockholders, and our stockholders approve, giving us the authority to do so. Although we currently do not have such authorization, we previously sought and received such authorization from our stockholders in the past and may seek such authorization in the future. In any such case, the price at which our securities are to be issued and sold may not be less than a price which, in the determination of our Board, closely approximates the market value of such securities (less any distributing commission or discount). We are also generally prohibited under the 1940 Act from issuing securities convertible into voting securities without obtaining the approval of our existing stockholders. Sales of common stock at prices below net asset value per share dilute the interests of existing stockholders, have the effect of reducing our net asset value per share and may reduce our market price per share. In addition to issuing securities to raise capital as described above; we may securitize a portion of the loans to generate cash for funding new investments. If we are unable to successfully securitize our loan portfolio, our ability to grow our business and fully execute our business strategy and our earnings (if any) may be adversely affected. Moreover, even successful securitization of our loan portfolio might expose us to losses, as the residual loans in which we do not sell interests tend to be those that are riskier and more apt to generate losses.
The application of the risk retention rules under Section 941 of the Dodd-Frank Act to CLOs may have broader effects on the CLO and loan markets in general, potentially resulting in fewer or less desirable investment opportunities for us.
Section 941 of the Dodd-Frank Act added a provision to the Exchange Act requiring the seller, sponsor or securitizer of a securitization vehicle to retain no less than five percent of the credit risk in assets it sells into a securitization and prohibiting such securitizer from directly or indirectly hedging or otherwise transferring the retained credit risk. The responsible federal agencies adopted final rules implementing these restrictions on October 22, 2014. The U.S. risk retention rules became effective with respect to CLOs two years after publication in the Federal Register. Under the final rules, the asset manager of a CLO is considered the sponsor of a securitization vehicle and is required to retain five percent of the credit risk in the CLO, which may be retained horizontally in the equity tranche of the CLO or vertically as a five percent interest in each tranche of the securities issued by the CLO.
On February 9, 2018, the United States Court of Appeals for the District of Columbia (the “D.C. Circuit Court”) ruled in favor of an appeal brought by the Loan Syndications and Trading Association (the “LSTA”) against the SEC and the Board of Governors of the Federal Reserve System (the “Applicable Governmental Agencies”) that managers of so-called “open market CLOs” are not “securitizers” under Section 941 of the Dodd-Frank Act and, therefore, are not subject to the requirements of the U.S. risk retention rules (the “Appellate Court Ruling”). The LSTA was appealing from a judgment entered by the United States District Court for the District of Columbia (the “D.C. District Court”), which granted summary judgment in favor of the SEC and Federal Reserve and against the LSTA with respect to its challenges.
On April 5, 2018, the D.C. District Court entered an order implementing the Appellate Court Ruling and thereby vacated the U.S. risk retention rules insofar as they apply to CLO managers of “open market CLOs.” In addition, the Applicable Governmental Agencies did not request that the case be heard by the United States Supreme Court. Since the Applicable Governmental Agencies have not successfully challenged the Appellate Court Ruling and the D.C. District Court has issued the above described order implementing the Appellate Court Ruling, collateral managers of open market CLOs are no longer required to comply with the U.S. risk retention rules at this time. As such, it is possible that some collateral managers of open market CLOs will decide to dispose of the notes constituting the “eligible vertical interest” or “eligible horizontal interest” they were previously required to retain, or decide to take other action with respect to such notes that is not otherwise permitted by the U.S. risk retention rules. As a result of this decision, certain CLO managers of “open market CLOs” will no longer be required to comply with the U.S. risk retention rules solely because of their roles as managers of “open market CLOs”, and there may be no “sponsor” of such securitization transactions and no party may be required to acquire and retain an economic interest in the credit risk of the securitized assets of such transactions.
28
There can be no assurance or representation that any of the transactions, structures or arrangements currently under consideration by or currently used by CLO market participants will comply with the U.S. risk retention rules to the extent such rules are reinstated or otherwise become applicable to open market CLOs. The ultimate impact of the U.S. risk retention rules on the loan securitization market and the leveraged loan market generally remains uncertain, and any negative impact on secondary market liquidity for securities comprising a CLO may be experienced due to the effects of the U.S. risk retention rules on market expectations or uncertainty, the relative appeal of other investments not impacted by the U.S. risk retention rules and other factors.
If we do not invest a sufficient portion of our assets in Qualifying Assets, we could be precluded from investing according to our current business strategy.
As a BDC, we may not acquire any assets other than Qualifying Assets for purposes of the 1940 Act unless, at the time of and after giving effect to such acquisition, at least 70% of our total assets are “qualifying assets”. See “Item 1: Business — Regulation”.
We believe that most of the senior loans and mezzanine investments that we acquire constitute “qualifying assets.” However, investments in the securities of CLO Funds generally do not constitute “qualifying assets,” and we may invest in other assets that are not “qualifying assets.” If we do not invest a sufficient portion of our assets in “qualifying assets,” we may be precluded from investing in what we believe are attractive investments, which would have a material adverse effect on our business, financial condition and results of operations. Similarly, these rules could prevent us from making follow-on investments in existing portfolio companies (which could result in the dilution of our position).
Our ability to enter into transactions with our affiliates is restricted.
We are prohibited under the 1940 Act from participating in certain transactions with certain of our affiliates without the prior approval of the members of our independent directors and, in some cases, the SEC. Any person that owns, directly or indirectly, 5% or more of our outstanding voting securities is our affiliate for purposes of the 1940 Act and we are generally prohibited from buying or selling any securities (other than our securities) from or to such affiliate, absent the prior approval of our independent directors. The 1940 Act also prohibits certain “joint” transactions with certain of our affiliates, which could include investments in the same portfolio company (whether at the same or different times), without prior approval of our independent directors and, in some cases, the SEC. If a person acquires more than 25% of our voting securities, we will be prohibited from buying or selling any security (other than any security of which we are the issuer) from or to such person or certain of that person’s affiliates, or entering into prohibited joint transactions with such person, absent the prior approval of the SEC. Similar restrictions limit our ability to transact business with our officers or directors or their affiliates.
A failure on our part to maintain our status as a BDC or the application of additional regulatory burdens would significantly reduce our operating flexibility.
If we fail to maintain our status as a BDC, we might be regulated as a closed-end investment company that is required to register under the 1940 Act, which would subject us to additional regulatory restrictions and significantly decrease our operating flexibility. In addition, any such failure could cause an event of default under our outstanding indebtedness, which could have a material adverse effect on our business, financial condition or results of operations.
In December 2019, the CFTC amended certain rules to require BDCs that trade “commodity interests” (as defined under CFTC rules) to a de minimis extent file an electronic notice of exclusion to not be deemed a “commodity pool operator” pursuant to CFTC regulations. This exclusion allows BDCs that trade commodity interests to forgo regulation under the CEA and the CFTC. If our Adviser is unable to claim this exclusion, or fails to do so in the future, with respect to us, the Adviser would become subject to registration and regulation as a commodity pool operator under the CEA. This additional regulation would subject our Adviser and us to additional registration and regulatory requirements, along with increasing operating expenses which could have a material adverse effect on our business, results of operations or financial condition.
Our business and operations could be negatively affected if we become subject to any securities litigation or stockholder activism, which could cause us to incur significant expense, hinder execution of investment strategy and impact our stock price.
In the past, following periods of volatility in the market price of a company’s securities, securities class-action litigation has often been brought against that company. Stockholder activism, which could take many forms or arise in a variety of situations, has been increasing in the BDC space recently. While we are currently not subject to any securities litigation or stockholder activism, we may in the future become the target of securities litigation or stockholder activism. Securities litigation and stockholder activism, including potential proxy contests, could result in substantial costs and divert management’s and our Boards’ attention and resources from our business. Additionally, such securities litigation and stockholder activism could give rise to perceived uncertainties as to our future, adversely affect our relationships with service providers and make it more difficult to attract and retain qualified personnel. Also, we may be required to incur significant legal fees and other expenses related to any securities litigation and activist stockholder matters. Further, our stock price could be subject to significant fluctuation or otherwise be adversely affected by the events, risks and uncertainties of any securities litigation and stockholder activism.
29
We will be subject to corporate-level U.S. federal income taxes if we are unable to qualify as a RIC under Subchapter M of the Code.
To maintain RIC tax treatment under the Code, we must meet the following annual distribution, income source and asset diversification requirements:
|
|
• |
The annual distribution requirement for a RIC will be satisfied if we distribute to our stockholders on an annual basis at least 90% of our net ordinary income and realized net short-term capital gains in excess of realized net long-term capital losses, if any. Because we use debt financing, we are subject to certain asset coverage ratio requirements under the 1940 Act and are (and may in the future become) subject to certain financial covenants under loan, indenture and credit agreements that could, under certain circumstances, restrict us from making distributions necessary to satisfy the distribution requirement. If we are unable to obtain cash from other sources, we could fail to qualify for RIC tax treatment and thus become subject to corporate-level U.S. federal income taxes. |
|
|
• |
The source income requirement will be satisfied if we obtain at least 90% of our income for each year from dividends, interest, gains from the sale of stock or securities or similar sources. |
|
|
• |
The asset diversification requirement will be satisfied if we meet certain asset diversification requirements at the end of each quarter of our taxable year. To satisfy this requirement, at least 50% of the value of our assets must consist of cash, cash equivalents, U.S. Government securities, securities of other RICs, and other acceptable securities; and no more than 25% of the value of our assets can be invested in the securities, other than U.S. government securities or securities of other RICs, of one issuer, of two or more issuers that are controlled, as determined under applicable Code rules, by us and that are engaged in the same or similar or related trades or businesses or of certain “qualified publicly traded partnerships.” If we do not satisfy the diversification requirements as of the end of any quarter, we will not lose our status as RIC provided that (i) we satisfied the requirements in a prior quarter and (ii) our failure to satisfy the requirements in the current quarter is not due in whole or in part to an acquisition of any security or other property. |
Failure to meet these requirements may result in our having to dispose of certain investments quickly in order to prevent the loss of RIC status. Because most of our investments will be in private companies, and therefore will be illiquid, any such dispositions could be made at disadvantageous prices and could result in substantial losses. Moreover, if we fail to maintain RIC tax treatment for any reason and are subject to corporate-level U.S. federal income taxes, the resulting taxes could substantially reduce our net assets, the amount of income available for distribution and the amount of our distributions. Such a failure would have a material adverse effect on us and on our stockholders.
Risks Associated with Our Information Technology Systems
We rely on various information technology systems to manage our operations. Information technology systems are subject to numerous risks including unanticipated operating problems, system failures, rapid technological change, failure of the systems that operate as anticipated, reliance on third party computer hardware, software and IT service providers, computer viruses, telecommunication failures, data breaches, denial of service attacks, spamming, phishing attacks, computer hackers and other similar disruptions, any of which could materially adversely impact our consolidated financial condition and results of operations. Additional risks include, but are not limited to, the following:
Disruptions in current systems or difficulties in integrating new systems.
We regularly maintain, upgrade, enhance or replace our information technology systems to support our business strategies and provide business continuity. Replacing legacy systems with successor systems, making changes to existing systems or acquiring new systems with new functionality have inherent risks including disruptions, delays, or difficulties that may impair the effectiveness of our information technology systems.
Internal and external cyber threats, as well as other disasters, could impair our ability to conduct business effectively.
The occurrence of a disaster, such as a cyber-attack against us or against a third-party that has access to our data or networks, a natural catastrophe, an industrial accident, failure of our disaster recovery systems, or consequential employee error, could have an adverse effect on our ability to communicate or conduct business, negatively impacting our operations and financial condition. This adverse effect can become particularly acute if those events affect our electronic data processing, transmission, storage, and retrieval systems, or impact the availability, integrity, or confidentiality of our data.
We depend heavily upon computer systems to perform necessary business functions. Despite our implementation of a variety of security measures, our computer systems, networks, and data, like those of other companies, could be subject to cyber-attacks and unauthorized access, use, alteration, or destruction, such as from physical and electronic break-ins, unauthorized tampering employee impersonation, social engineering or “phishing” attempts. Like other companies, we may experience threats to our data and systems, including malware and computer virus attacks, unauthorized access, system failures and disruptions. If one or more of these events occurs, it could potentially jeopardize the confidential, proprietary, and other information processed, stored in, and transmitted through our computer systems and networks. Such an attack could cause interruptions or malfunctions in our operations, which could result in financial losses, litigation, regulatory penalties, client dissatisfaction or loss, reputational damage, and increased costs associated with mitigation of damages and remediation.
30
Third parties with which we do business may also be sources of cybersecurity or other technological risk. We outsource certain functions and these relationships allow for the storage and processing of our information, as well as client, counterparty, employee, and borrower information. While we engage in actions to reduce our exposure resulting from outsourcing, ongoing threats may result in unauthorized access, loss, exposure, destruction, or other cybersecurity incident that affects our data, resulting in increased costs and other consequences as described above.
Risks Related to Our Investments
Our investments may be risky, and you could lose all or part of your investment.
We invest primarily in senior secured term loans, mezzanine debt, selected equity investments issued by middle market companies, CLO Funds, Joint Ventures and derivatives. The investments in our Debt Securities Portfolio are all or predominantly below investment grade, may be highly leveraged, and therefore have speculative characteristics with respect to the issuer’s capacity to pay interest and repay principal. Defaults by portfolio companies may harm our operating results.
Secured Loans. When we extend secured term loans, we generally take a security interest (either as a first lien position or as a second lien position) in the available assets of these portfolio companies, including the equity interests of their subsidiaries, which we expect to assist in mitigating the risk that we will not be repaid. However, there is a risk that the collateral securing our loans may decrease in value over time, may be difficult to sell in a timely manner, may be difficult to appraise and may fluctuate in value based upon the success of the business and market conditions, including as a result of the inability of the portfolio company to raise additional capital, and, in some circumstances, our lien could be subordinated to claims of other creditors. In addition, deterioration in a portfolio company’s financial condition and prospects, including its inability to raise additional capital, may be accompanied by deterioration in the value of the collateral for the loan. Consequently, the fact that a loan is secured does not guarantee that we will receive principal and interest payments according to the loan’s terms, or at all, or that we will be able to collect on the loan should we be forced to exercise our remedies.
Mezzanine Debt. Our mezzanine debt investments generally are subordinated to senior loans and generally are unsecured. This may result in an above average amount of risk and volatility or loss of principal.
These investments may entail additional risks that could adversely affect our investment returns. To the extent interest payments associated with such debt are deferred, such debt is subject to greater fluctuations in value based on changes in interest rates and such debt could subject us to phantom income. Since we generally do not receive any cash prior to maturity of the debt, the investment is of greater risk.
Equity Investments. We have made and expect to make selected equity investments in middle market companies. In addition, when we invest in senior secured loans or mezzanine debt, we may acquire warrants in the equity of the portfolio company. Our goal is ultimately to dispose of such equity interests and realize gains upon our disposition of such interests. However, the equity interests we receive may not appreciate in value and, in fact, may decline in value. Accordingly, we may not be able to realize gains from our equity interests, and any gains that we do realize on the disposition of any equity interests may not be sufficient to offset any other losses we experience.
Risks Associated with Middle Market Companies. Investments in middle market companies also involve a number of significant risks, including:
|
|
• |
limited financial resources and inability to meet their obligations, which may be accompanied by a deterioration in the value of any collateral and a reduction in the likelihood of our realizing the value of any guarantees we may have obtained in connection with our investment; |
|
|
• |
shorter operating histories, narrower product lines and smaller market shares than larger businesses, which tend to render them more vulnerable to competitors’ actions and market conditions, as well as general economic downturns; |
|
|
• |
dependence on management talents and efforts of a small group of persons; therefore, the death, disability, resignation or termination of one or more of these persons could have a material adverse impact on our portfolio company and, in turn, on us; |
|
|
• |
less predictable operating results, being parties to litigation from time to time, engaging in rapidly changing businesses with products subject to a substantial risk of obsolescence and requiring substantial additional capital expenditures to support their operations, finance expansion or maintain their competitive position; |
|
|
• |
difficulty accessing the capital markets to meet future capital needs; and |
|
|
• |
generally less publicly available information about their businesses, operations and financial condition. |
31
CLO Fund Investments. Investments in CLO Funds also involve a number of significant risks, including:
|
|
• |
CLOs typically are comprised of a portfolio of senior secured loans; payments on CLO investments are and will be payable solely from the cash-flows from such senior secured loans; |
|
|
• |
CLO investments are exposed to leveraged credit risk; |
|
|
• |
CLO Funds are highly leveraged; |
|
|
• |
there is the potential for interruption and deferral of cash-flow from CLO investments; |
|
|
• |
interest rates paid by corporate borrowers are subject to volatility; |
|
|
• |
the inability of a CLO collateral manager to reinvest the proceeds of the prepayment of senior secured loans may adversely affect us; |
|
|
• |
our CLO investments are subject to prepayments and calls, increasing re-investment risk; |
|
|
• |
we have limited control of the administration and amendment of any CLO in which we invest; |
|
|
• |
senior secured loans of CLOs may be sold and replaced resulting in a loss to us; |
|
|
• |
our financial results may be affected adversely if one or more of our significant equity or junior debt investments in a CLO vehicle defaults on its payment obligations or fails to perform as we expect; and |
|
|
• |
non-investment grade debt involves a greater risk of default and higher price volatility than investment grade debt. |
Our portfolio investments for which there is no readily available market, including our investment in our Asset Manager Affiliates, our Joint Ventures and our investments in CLO Funds, are recorded at fair value as determined in good faith by our Board. As a result, there is uncertainty as to the value of these investments.
Our investments consist primarily of securities issued by privately-held companies, the fair value of which is not readily determinable. In addition, we are not permitted to maintain a general reserve for anticipated loan losses. Instead, we are required by the 1940 Act to specifically value each investment and record an unrealized gain or loss for any asset that we believe has increased or decreased in value. We value these securities at fair value as determined in good faith by our Board pursuant to a valuation methodology approved by our Board. These valuations are initially prepared by our management and reviewed by our Valuation Committee, which uses its best judgment in arriving at the fair value of these securities. However, the Board retains ultimate authority to determine the appropriate valuation for each investment.
We have engaged an independent valuation firm to provide third party valuation consulting services to our Board. Each quarter, the independent valuation firm performs third party valuations on our material investments in illiquid securities, such that they are reviewed at least once during a trailing 12 month period. These third party valuation estimates are one of the relevant data points in the Board’s determination of fair value. The Board intends to continue to engage an independent valuation firm in the future to provide certain valuation services, including the review of certain portfolio assets, as part of the quarterly and annual year-end valuation process. In addition to such third-party input, the types of factors that may be considered in valuing our investments include the nature and realizable value of any collateral, the portfolio company’s ability to make payments and its earnings, the markets in which the portfolio company does business, comparison to publicly-traded companies, discounted cash flow and other relevant factors. Substantially all of our investment in the Asset Manager Affiliates was sold on December 31, 2018. Prior thereto, our investment in our Asset Manager Affiliates was carried at fair value, which was determined after taking into consideration a percentage of assets under management and a discounted cash flow model incorporating different levels of discount rates depending on the hierarchy of fees earned (including the likelihood of realization of senior, subordinate and incentive fees) and prospective modeled performance. Such valuation included an analysis of comparable asset management companies. In addition, our investment in our Joint Venture is carried at fair value, which is determined based on the fair value of the investments held by the Joint Venture. Because such valuations, and particularly valuations of private investments and private companies, are inherently uncertain and may be based on estimates, our determinations of fair value may differ materially from the values that would be assessed if a ready market for these securities existed. Our net asset value could be adversely affected if our determinations regarding the fair value of our illiquid investments were materially higher than the values that we ultimately realize upon the disposal of such securities.
32
We are a non-diversified investment company within the meaning of the 1940 Act, and therefore we may invest a significant portion of our assets in a relatively small number of issuers, which subjects us to a risk of significant loss if any of these issuers defaults on its obligations under any of its debt instruments or as a result of a downturn in the particular industry.
We are classified as a non-diversified investment company within the meaning of the 1940 Act, and therefore we may invest a significant portion of our assets in a relatively small number of issuers in a limited number of industries. Beyond the asset diversification requirements associated with our qualification as a RIC, we do not have fixed guidelines for diversification, and while we are not targeting any specific industries, relatively few industries may become significantly represented among our investments. To the extent that we assume large positions in the securities of a small number of issuers, our net asset value may fluctuate to a greater extent than that of a diversified investment company as a result of changes in the financial condition or the market’s assessment of the issuer, changes in fair value over time or a downturn in any particular industry. We may also be more susceptible to any single economic or regulatory occurrence than a diversified investment company.
Defaults by our portfolio companies could harm our operating results.
A portfolio company’s failure to satisfy financial or operating covenants imposed by us or other debt holders could lead to defaults and, potentially, acceleration of the time when the loans are due and foreclosure on its secured assets. Such events could trigger cross-defaults under other agreements and jeopardize a portfolio company’s ability to meet its obligations under the debt that we hold and the value of any equity securities we own. We may incur expenses to the extent necessary to seek recovery upon default or to negotiate new terms with a defaulting portfolio company. In addition, some of the loans in which we may invest may be "covenant-lite" loans. We use the term "covenant-lite" loans to refer generally to loans that do not have a complete set of financial maintenance covenants. Generally, "covenant-lite" loans provide borrower companies more freedom to negatively impact lenders because their covenants are incurrence-based, which means they are only tested and can only be breached following an affirmative action of the borrower, rather than by a deterioration in the borrower's financial condition. Accordingly, to the extent we invest in "covenant-lite" loans, we may have fewer rights against a borrower and may have a greater risk of loss on such investments as compared to investments in or exposure to loans with financial maintenance covenants.
As part of our lending activities, we may in certain opportunistic circumstances originate loans to companies that are experiencing significant financial or business difficulties, including companies involved in bankruptcy or other reorganization and liquidation proceedings. Any such investment would involve a substantial degree of risk. In any reorganization or liquidation proceeding relating to a company that we fund, we may lose all or part of the amounts advanced to the borrower or may be required to accept collateral with a value less than the amount of the loan advanced by us to the borrower.
When we are a debt or minority equity investor in a portfolio company, which generally is the case, we may not be in a position to control the entity, and its management may make decisions that could decrease the value of our investment.
Most of our investments are either debt or minority equity investments in our portfolio companies. Therefore, we are subject to the risk that a portfolio company may make business decisions with which we disagree, and the stockholders and management of such company may take risks or otherwise act in ways that do not serve our interests. As a result, a portfolio company may make decisions that could decrease the value of our portfolio holdings. In addition, we generally are not in a position to control any portfolio company by investing in its debt securities.
We may have limited access to information about privately held companies in which we invest.
We invest primarily in privately-held companies. Generally, little public information exists about these companies, and we are required to rely on the ability of our investment professionals to obtain adequate information to evaluate the potential returns from investing in these companies. These companies and their financial information are not subject to the Sarbanes-Oxley Act of 2002 and other rules that govern public companies. If we are unable to uncover all material information about these companies, we may not make a fully informed investment decision, and we may lose money on our investment.
Prepayments of our debt investments by our portfolio companies could negatively impact our operating results.
We are subject to the risk that the investments we make in our portfolio companies may be repaid prior to maturity. When this occurs, we generally reinvest these proceeds in temporary investments, pending their future investment in new portfolio companies. These temporary investments typically have substantially lower yields than the debt being prepaid and we could experience significant delays in reinvesting these amounts. Any future investment in a new portfolio company may also be at lower yields than the debt that was repaid. Consequently, our results of operations could be materially adversely affected if one or more of our portfolio companies elects to prepay amounts owed to us. Additionally, prepayments could negatively impact our return on equity, which could result in a decline in the market price of our common stock.
33
We may be unable to invest the net proceeds raised from offerings and repayments from investments on acceptable terms, which would harm our financial condition and operating results.
Until we identify new investment opportunities, we intend to either invest the net proceeds of future offerings and repayments from investments in interest-bearing deposits or other short-term instruments or use the net proceeds from such offerings to reduce then-outstanding debt obligations. We cannot assure you that we will be able to find enough appropriate investments that meet our investment criteria or that any investment we complete using the proceeds from an offering will produce a sufficient return.
Our portfolio companies may incur debt that ranks equal with, or senior to, our investments in such companies.
We invest primarily in debt securities issued by our portfolio companies. In some cases portfolio companies are permitted to have other debt that ranks equal with, or senior to, the debt securities in which we invest. By their terms, such debt instruments may provide that the holders thereof are entitled to receive payment of interest or principal on or before the dates on which we are entitled to receive payments in respect of the debt securities in which we invest. Also, in the event of insolvency, liquidation, dissolution, reorganization or bankruptcy of a portfolio company, holders of debt instruments ranking senior to our investment in that portfolio company would typically be entitled to receive payment in full before we receive any distribution in respect of our investment. After repaying such senior creditors, such portfolio company may not have any remaining assets to use for repaying its obligation to us. In the case of debt ranking equal with debt securities in which we invest, we would have to share on an equal basis any distributions with other creditors holding such debt in the event of an insolvency, liquidation, dissolution, reorganization or bankruptcy of a portfolio company.
Second priority liens on collateral securing loans that we make to our portfolio companies may be subject to control by senior creditors with first priority liens. If there is a default, the value of the collateral may not be sufficient to repay in full both the first priority creditors and us.
Certain loans that we make are secured by a second priority security interest in the same collateral pledged by a portfolio company to secure senior debt owed by the portfolio company to other traditional lenders. Often the senior lender has procured covenants from the portfolio company prohibiting the incurrence of additional secured debt, without the senior lender’s consent. Prior to, and as a condition of, permitting the portfolio company to borrow money from us secured by the same collateral pledged to the senior lender, the senior lender will require assurances that it will control the disposition of any collateral in the event of bankruptcy or other default. In many such cases, the senior lender will require us to enter into an “intercreditor agreement” prior to permitting the portfolio company to borrow from us. Typically, the intercreditor agreements we are requested to execute expressly subordinate our debt instruments to those held by the senior lender and further provide that the senior lender shall control: (1) the commencement of foreclosure or other proceedings to liquidate and collect on the collateral; (2) the nature, timing and conduct of foreclosure or other collection proceedings; (3) the amendment of any collateral document; (4) the release of the security interests in respect of any collateral; and (5) the waiver of defaults under any security agreement. Because of the control we may cede to senior lenders under intercreditor agreements we may enter, we may be unable to realize the proceeds of any collateral securing some of our loans.
There may be circumstances where our debt investments could be subordinated to claims of other creditors or we could be subject to lender liability claims.
Even though we may have structured certain of our investments as senior loans, if one of our portfolio companies were to go bankrupt, depending on the facts and circumstances, including the size of our investment and the extent to which we actually provided managerial assistance to that portfolio company, a bankruptcy court might recharacterize our debt investment and subordinate all or a portion of our claim to that of other creditors. In addition, lenders can be subject to lender liability claims for actions taken by them where they become too involved in the borrower’s business or exercise control over the borrower. It is possible that we could become subject to a lender’s liability claim, including as a result of actions taken in rendering significant managerial assistance.
Our investments in equity securities involve a substantial degree of risk.
We purchase common stock and other equity securities, including warrants. Although equity securities have historically generated higher average total returns than fixed-income securities over the long term, equity securities have also experienced significantly more volatility in those returns. The equity securities we acquire may fail to appreciate and may decline in value or become worthless, and our ability to recover our investment depends on our portfolio company’s success. Investments in equity securities involve a number of significant risks, including the risk of further dilution as a result of additional issuances, inability to access additional capital and failure to pay current distributions. Investments in preferred securities involve special risks, such as the risk of deferred distributions, credit risk, illiquidity and limited voting rights.
34
The lack of liquidity in our investments may adversely affect our business.
We may invest in securities issued by private companies. These securities may be subject to legal and other restrictions on resale or otherwise be less liquid than publicly-traded securities. The illiquidity of these investments may make it difficult for us to sell these investments when desired. In addition, if we are required to liquidate all or a portion of our portfolio quickly, we may realize significantly less than the value at which we had previously recorded these investments. Our investments are usually subject to contractual or legal restrictions on resale or are otherwise illiquid because there is usually no established trading market for such investments. The illiquidity of most of our investments may make it difficult for us to dispose of them at a favorable price, and, as a result, we may suffer losses.
Our investments in foreign securities may involve significant risks in addition to the risks inherent in U.S. investments.
Our investment strategy contemplates that a portion of our investments may be in securities of foreign companies. Investing in foreign companies may expose us to additional risks not typically associated with investing in U.S. companies. These risks include changes in exchange control regulations, political and social instability, expropriation, imposition of foreign taxes, less liquid markets and less available information than is generally the case in the United States, higher transaction costs, less government supervision of exchanges, brokers and issuers, less developed bankruptcy laws, difficulty in enforcing contractual obligations, lack of uniform accounting and auditing standards and greater price volatility.
Although it is anticipated that most of our investments will be denominated in U.S. dollars, our investments that are denominated in a foreign currency will be subject to the risk that the value of a particular currency may change in relation to the U.S. dollar. Among the factors that may affect currency values are trade balances, the level of short-term interest rates, differences in relative values of similar assets in different currencies, long-term opportunities for investment and capital appreciation and political developments.
The disposition of our investments may result in contingent liabilities.
We currently expect that a significant portion of our investments will involve lending directly to private companies. In connection with the disposition of an investment in private securities, we may be required to make representations about the business and financial affairs of the portfolio company typical of those made in connection with the sale of a business. We may also be required to indemnify the purchasers of such investment to the extent that any such representations turn out to be inaccurate or with respect to certain potential liabilities. These arrangements may result in contingent liabilities that ultimately yield funding obligations that must be satisfied through our return of certain distributions previously made to us.
We may not receive any return on our investment in the CLO Funds in which we have invested.
As of December 31, 2019, we had $32.0 million at fair value invested in the subordinated securities, preferred shares, or other securities issued by the CLO Funds. Subordinated securities are the most junior class of securities issued by the CLO Funds and are subordinated in priority of payment to every other class of securities issued by these CLO Funds. Therefore, they only receive cash distributions if the CLO Funds have made all cash interest payments to all other debt securities issued by the CLO Fund. The subordinated securities are also unsecured and rank behind all of the secured creditors, known or unknown, of the CLO Fund, including the holders of the senior securities issued by the CLO Fund. Consequently, to the extent that the value of a CLO Fund’s loan investments has been reduced as a result of conditions in the credit markets, or as a result of defaulted loans or individual fund assets, the value of the subordinated securities at their redemption could be reduced.
Risks Related to Our Common Stock
We may not be able to pay distributions to our stockholders, our distributions may not grow over time, and a portion of distributions paid to our stockholders may be a return of capital.
We intend to continue to make distributions on a quarterly basis to our stockholders out of assets legally available for distribution. We may not be able to achieve investment results that will allow us to make a specified level of cash distributions or year-to-year increases in cash distributions. Our ability to pay distributions might be adversely affected by, among other things, the impact of one or more of the risk factors described herein. In addition, the inability to satisfy the asset coverage test applicable to us as a BDC could limit our ability to pay distributions. In addition, due to the asset coverage test applicable to us as a BDC and covenants that we agreed to in connection with the issuance of the 6.125% Notes Due 2022 we are limited in our ability to make distributions in certain circumstances. In this regard, we agreed in connection with our issuance of 6.125% Notes Due 2022 that for the period of time during which the 6.125% Notes Due 2022 are outstanding, we will not violate (regardless of whether we are subject to) Section 18(a)(1)(B) as modified by Section 61(a)(1) of the 1940 Act. These provisions generally prohibit us from declaring any cash dividend or distribution upon our common stock, or purchasing any such common stock if our asset coverage, as defined in the 1940 Act, is below 200% at the time of the declaration of the dividend or distribution or the purchase and after deducting the amount of such dividend, distribution or purchase. Further, if we invest a greater amount of assets in equity securities that do not pay current dividends, it could reduce the amount available for distribution.
35
All distributions will be paid at the discretion of our Board and will depend on our earnings, our financial condition, maintenance of our RIC status, compliance with applicable BDC regulations and such other factors as our Board may deem relevant from time to time. We cannot assure you that we will pay distributions to our stockholders in the future.
When we make quarterly distributions, we will be required to determine the extent to which such distributions are paid out of current or accumulated earnings, recognized capital gains or capital. To the extent there is a return of capital, investors will be required to reduce their basis in our stock for U.S. federal income tax purposes, which may result in higher tax liability when the shares are sold, even if they have not increased in value or have lost value. Our distributions have over the last several years included a significant return of capital component. For more information about our distributions over the last several years that have included a return of capital component, see Note 8 — “Distributable Taxable Income” to our consolidated financial statements included elsewhere in this Annual Report.
Investing in shares of our common stock may involve an above average degree of risk.
The investments we make in accordance with our investment objective may result in a higher amount of risk, volatility or loss of principal than alternative investment options. Our investments in portfolio companies may be highly speculative, and therefore, an investment in our common stock may not be suitable for investors with lower risk tolerance.
Shares of closed-end investment companies, including BDCs, frequently trade at a discount to their net asset value, and we cannot assure you that the market price of our common stock will not decline below the net asset value of the stock.
We cannot predict the price at which our common stock will trade. Shares of closed-end investment companies frequently trade at a discount to their net asset value and our stock may also be discounted in the market. This characteristic of closed-end investment companies is separate and distinct from the risk that our net asset value per share may decline. We cannot predict whether shares of our common stock will trade above, at or below our net asset value. The risk of loss associated with this characteristic of closed-end investment companies may be greater for investors expecting to sell shares of common stock soon after the purchase of such shares of common stock. In addition, if our common stock trades below its net asset value, we will generally not be able to issue additional shares of our common stock at its market price without first obtaining the approval of our stockholders and our independent directors.
Stockholders will experience dilution in their ownership percentage if they do not participate in our dividend reinvestment plan.
All distributions declared in cash payable to stockholders that are participants in our dividend reinvestment plan will generally be automatically reinvested in shares of our common stock unless the investor opts out of the plan. As a result, stockholders that do not elect to participate in our dividend reinvestment plan will experience dilution over time. Stockholders who do not elect to participate in our dividend reinvestment plan may experience accretion to the net asset value of their shares if our shares are trading at a premium to net asset value and dilution if our shares are trading at a discount to net asset value. The level of accretion or discount would depend on various factors, including the proportion of our stockholders who participate in the plan, the level of premium or discount at which our shares are trading and the amount of the distribution payable to stockholders.
Our share price may be volatile and may fluctuate substantially.
The market price and liquidity of the market for shares of our common stock may be significantly affected by numerous factors, some of which are beyond our control and may not be directly related to our operating performance. These factors include:
|
|
• |
price and volume fluctuations in the overall stock market from time to time; |
|
|
• |
significant volatility in the market price and trading volume of securities of BDCs or other companies in our sector, which are not necessarily related to the operating performance of these companies or to us; |
|
|
• |
our inability to deploy or invest our capital; |
|
|
• |
fluctuations in interest rates; |
|
|
• |
any shortfall in revenue or net income or any increase in losses from levels expected by investors or securities analysts; |
|
|
• |
operating performance of companies comparable to us; |
|
|
• |
changes in regulatory policies or tax rules, particularly with respect to RICs or BDCs; |
|
|
• |
inability to maintain our qualification as a RIC for U.S. federal income tax purposes; |
|
|
• |
changes in earnings or variations in operating results; |
|
|
• |
changes in the value of our portfolio; |
|
|
• |
general economic conditions and trends; and |
|
|
• |
departure of key personnel. |
36
Certain provisions of the Delaware General Corporation Law and our certificate of incorporation and bylaws could deter takeover attempts and have an adverse impact on the price of our common stock.
The Delaware General Corporation Law, our certificate of incorporation and our bylaws contain provisions that may have the effect of discouraging a third party from making an acquisition proposal for us. Our Board is divided into three classes of directors serving staggered three-year terms, which could prevent stockholders from removing a majority of directors in any given election. Our Board may, without stockholder action, authorize the issuance of shares in one or more classes or series, including shares of preferred stock. These anti-takeover provisions may inhibit a change in control in circumstances that could give the holders of our common stock the opportunity to realize a premium over the market price of our common stock.
Risks Related to Our Notes
Our 6.125% Notes Due 2022 are unsecured and therefore are effectively subordinated to any secured indebtedness we have currently incurred or may incur in the future.
Our 6.125% Notes Due 2022 are not secured by any of our assets or any of the assets of our subsidiaries. As a result, the 6.125% Notes Due 2022 are effectively subordinated to any secured indebtedness we have currently incurred and may incur in the future (or any indebtedness that is initially unsecured to which we subsequently grant security) to the extent of the value of the assets securing such indebtedness. In any liquidation, dissolution, bankruptcy or other similar proceeding, the holders of any of our existing or future secured indebtedness and the secured indebtedness of our subsidiaries may assert rights against the assets pledged to secure that indebtedness in order to receive full payment of their indebtedness before the assets may be used to pay other creditors, including the holders of the 6.125% Notes Due 2022 .
The 6.125% Notes Due 2022 are structurally subordinated to the indebtedness and other liabilities of our subsidiaries and portfolio companies with respect to which we hold equity investments.
The 6.125% Notes Due 2022 are obligations exclusively of Portman Ridge Finance Corporation, and not of any of our subsidiaries. None of our subsidiaries are guarantors of the 6.125% Notes Due 2022, and the 6.125% Notes Due 2022 will not be required to be guaranteed by any subsidiary or asset management firm we may acquire or create in the future. Any assets of our subsidiaries will not be directly available to satisfy the claims of our creditors, including holders of the 6.125% Notes Due 2022. Except to the extent we are a creditor with recognized claims against our subsidiaries, all claims of creditors of our subsidiaries will have priority over our equity interests in such entities (and therefore the claims of our creditors, including holders of the 6.125% Notes Due 2022 ) with respect to the assets of such entities. Even if we are recognized as a creditor of one or more of these entities, our claims would still be effectively subordinated to any security interests in the assets of any such entity and to any indebtedness or other liabilities of any such entity senior to our claims. Consequently, the 6.125% Notes Due 2022 are structurally subordinated to all indebtedness and other liabilities of any of our subsidiaries and portfolio companies with respect to which we hold equity investments, or that we may in the future acquire or establish. These entities may incur substantial indebtedness in the future, all of which would be structurally senior to the 6.125% Notes Due 2022.
The indentures under which the 6.125% Notes Due 2022 are issued contain limited protection for holders of the 6.125% Notes Due 2022.
The indentures under which the 6.125% Notes Due 2022 are issued offer limited protection to holders of the 6.125% Notes Due 2022. The terms of the indentures and the 6.125% Notes Due 2022 do not restrict our or any of our subsidiaries, ability to engage in, or otherwise be a party to, a variety of corporate transactions, circumstances or events that could have a material adverse impact on your investment in the 6.125% Notes Due 2022 . In particular, the terms of the indenture and the 6.125% Notes Due 2022 do not place any restrictions on our or our subsidiaries, ability to:
|
|
• |
issue securities or otherwise incur additional indebtedness or other obligations, including (1) any indebtedness or other obligations that would be equal in right of payment to the 6.125% Notes Due 2022 , (2) any indebtedness or other obligations that would be secured and therefore rank effectively senior in right of payment to the 6.125% Notes Due 2022 to the extent of the values of the assets securing such debt, (3) indebtedness of ours that is guaranteed by one or more of our subsidiaries or the Asset Manager Affiliates and which therefore is structurally senior to the 6.125% Notes Due 2022 and (4) securities, indebtedness or obligations issued or incurred by our subsidiaries or the Asset Manager Affiliates that would be senior to our equity interests in those entities and therefore rank structurally senior to the 6.125% Notes Due 2022 with respect to the assets of our subsidiaries and the Asset Manager Affiliates, in each case other than an incurrence of indebtedness or other obligation that would cause a violation of Section 18(a)(1)(A) as modified by Section 61(a)(1) of the 1940 Act or any successor provisions. These provisions generally prohibit us from making additional borrowings, including through the issuance of additional debt or the sale of additional debt securities, unless our asset coverage, as defined in the 1940 Act, equals at least 200% after such borrowings; |
37
|
|
• |
sell assets (other than certain limited restrictions on our ability to consolidate, merge or sell all or substantially all of our assets); |
|
|
• |
enter into transactions with affiliates; |
|
|
• |
create liens (including liens on the shares of our subsidiaries) or enter into sale and leaseback transactions; |
|
|
• |
make investments; or |
|
|
• |
create restrictions on the payment of dividends or other amounts to us from our subsidiaries. |
In addition, the indenture does not require us to offer to purchase the 6.125% Notes Due 2022 in connection with a change of control or any other event.
Furthermore, the terms of the indenture and the 6.125% Notes Due 2022 do not protect holders of the 6.125% Notes Due 2022 in the event that we experience changes (including significant adverse changes) in our financial condition, results of operations or credit ratings, if any, as they do not require that we adhere to any financial tests or ratios or specified levels of net worth, revenues, income, cash flow, or liquidity other than as described above. Any changes to the 200% asset coverage ratio in the 1940 Act could affect the 6.125% Notes Due 2022. As discussed above, on March 29, 2018, our Board, including a “required majority” (as such term is defined in Section 57(o) of the 1940 Act) of the Board, approved the modified asset coverage requirements set forth in Section 61(a)(2) of the 1940 Act, as amended by the SBCA. As a result, our asset coverage requirement for senior securities will be changed from 200% to 150%, effective as of March 29, 2019. However, despite the SBCA, we will continue to be prohibited by the indenture governing our 6.125% Notes Due 2022 from making distributions on our common stock if our asset coverage, as defined in the 1940 Act, falls below 200%. See “Item 1A. Risk Factors — Risks Related to Our Business and Structure — Our Board has approved our ability to incur additional leverage as permitted by recent legislation.”
Our ability to recapitalize, incur additional debt and take a number of other actions that are not limited by the terms of the 6.125% Notes Due 2022 may have important consequences for you as a holder of the 6.125% Notes Due 2022 including making it more difficult for us to satisfy our obligations with respect to the 6.125% Notes Due 2022 or negatively affecting the trading value of the 6.125% Notes Due 2022 .
Other debt we issue or incur in the future could contain more protections for its holders than the indentures and the 6.125% Notes Due 2022, including additional covenants and events of default. The issuance or incurrence of any such debt with incremental protections could affect the market for and trading levels and prices of the 6.125% Notes Due 2022.
Even though the 6.125% Notes Due 2022 are listed on the NASDAQ Global Select Market, an active trading market for the 6.125% Notes Due 2022 may not develop, or if it does develop, it may not be sustained, which could limit your ability to sell the 6.125% Notes Due 2022 or affect the market price of the 6.125% Notes Due 2022
We cannot provide any assurances that an active trading market will develop for the 6.125% Notes Due 2022, or that, if it does develop, it will be sustained or that you will be able to sell your 6.125% Notes Due 2022. The 6.125% Notes Due 2022 may trade at a discount from the price paid for the 6.125% Notes Due 2022 depending on prevailing interest rates, the market for similar securities, our credit ratings, if any, general economic conditions, our financial condition, performance and prospects and other factors.
Accordingly, we cannot assure you that a liquid trading market will develop for the 6.125% Notes Due 2022 or that, if an active trading market for the 6.125% Notes Due 2022 does develop, it will be sustained, that you will be able to sell your 6.125% Notes Due 2022 at a particular time or that the price you receive when you sell will be favorable. To the extent an active trading market does not develop, the liquidity and trading price for the 6.125% Notes Due 2022 may be harmed. Accordingly, you may be required to bear the financial risk of an investment in the 6.125% Notes Due 2022 for an indefinite period of time.
If we default on our obligations to pay our other indebtedness, we may not be able to make payments on the 6.125% Notes Due 2022.
Any default under the agreements governing our indebtedness, that is not waived by the required lenders, and the remedies sought by the holders of such indebtedness could make us unable to pay principal, premium, if any, and interest on the 6.125% Notes Due 2022 and could substantially decrease the market value of the 6.125% Notes Due 2022 . If we are unable to generate sufficient cash flow and are otherwise unable to obtain funds necessary to meet required payments of principal, premium, if any, and interest on our indebtedness, or if we otherwise fail to comply with the various covenants, including financial and operating covenants, in the instruments governing our indebtedness, we could be in default under the terms of the agreements governing such indebtedness. In the event of such default, the holders of such indebtedness could elect to declare all the funds borrowed thereunder to be due and payable, together with accrued and unpaid interest, the lender any debt we may incur in the future could elect to terminate its commitment, cease making further loans and institute foreclosure proceedings against our assets, and we could be forced into bankruptcy or liquidation. If our operating performance declines, we may in the future need to seek to obtain waivers from under any other debt that
38
we may incur in the future to avoid being in default. If we breach our covenants under any debt and seek a waiver, we may not be able to obtain a waiver from the required lenders. If this occurs, we would be in default under any debt, the lender could exercise its rights as described above, and we could be forced into bankruptcy or liquidation. If we are unable to repay debt, lenders having secured obligations could proceed against the collateral securing the debt. Because any future debt we issue will likely have customary cross-default provisions, if such other debt is accelerated, we may be unable to repay or finance the amounts due.
Risks Related to Our Investment Advisory Relationship with the Adviser
Our Adviser selects our investments and our stockholders have no input with respect to investment decisions.
The Adviser selects our investments and our stockholders will have no input with respect to investment decisions. As a result, we will be subject to all of the business risks and uncertainties associated with the origination of new investments, including the risk that we will not achieve our investment objective and that the value of your investment could decline substantially or become worthless.
We are dependent upon the Adviser for our future success.
We have no employees and, as a result, we depend on the diligence, skill and network of business contacts of the Adviser’s investment professionals to source appropriate investments for us. We depend on members of the Adviser’s investment team to appropriately analyze our investments and the Adviser’s investment committee to approve and monitor our portfolio investments. The Adviser’s investment committee, together with the other members of its investment team, evaluate, negotiate, structure, close and monitor our investments. Our future success will depend on the continued availability of the members of the Adviser’s investment committee and the other investment professionals available to the Adviser. We do not have employment agreements with these individuals or other key personnel of the Adviser, and we cannot provide any assurance that unforeseen business, medical, personal or other circumstances would not lead any such individual to terminate his or her relationship with the Adviser. The loss of a material number of senior investment professionals to which the Adviser has access, could have a material adverse effect on our ability to achieve our investment objective as well as on our financial condition and results of operations. In addition, we cannot assure you that the Adviser will remain our investment adviser or that we will continue to have access to the Adviser’s investment professionals or its information and deal flow.
The structure under the Advisory Agreement may induce the Adviser to pursue speculative investments and incur leverage, which may not be in the best interests of our stockholders.
The incentive fees payable by us to the Adviser under the Advisory Agreement may create an incentive for the Adviser to pursue investments on our behalf that are riskier or more speculative than would be the case in the absence of such compensation arrangement. The incentive fees payable to the Adviser are calculated based on a percentage of our return on invested capital. This may encourage the Adviser to use leverage to increase the return on our investments. Under certain circumstances, the use of leverage may increase the likelihood of default, which would impair the value of our common stock. In addition, the Adviser receives the incentive fees based, in part, upon net capital gains realized on our investments. Unlike that portion of incentive fees based on income, there is no hurdle rate applicable to the portion of the incentive fees based on net capital gains. As a result, the Adviser may have a tendency to invest more capital in investments that are likely to result in capital gains as compared to income-producing securities. Such a practice could result in our investing in more speculative securities than would otherwise be the case, which could result in higher investment losses, particularly during economic downturns.
Moreover, because the base management fees payable to the Adviser under the Advisory Agreement are payable based on our gross assets, excluding cash and cash equivalents but including those assets purchased with borrowed amounts, the Adviser has a financial incentive to incur leverage which may not be consistent with our stockholders’ interests.
The Adviser’s liability is limited under the Advisory Agreement, and we are required to indemnify the Adviser against certain liabilities, which may lead the Adviser to act in a riskier manner on our behalf than it would when acting for its own account.
Under the Advisory Agreement, the Adviser will not assume any responsibility to us other than to render the services described in the Advisory Agreement, and it is not be responsible for any action of our Board in declining to follow the Adviser’s advice or recommendations. Pursuant to the Advisory Agreement, the Adviser and its officers, managers, partners, agents, employees, controlling persons, members and any other person or entity affiliated with the Adviser are not be liable to us for their acts under the Advisory Agreement, absent criminal conduct, willful misfeasance, bad faith or gross negligence in the performance of their duties or by reason of the reckless disregard of their duties and obligations. We have agreed to indemnify, defend and protect the Adviser and its officers, managers, partners, agents, employees, controlling persons, members and any other person or entity affiliated with the Adviser with respect to all damages, liabilities, costs and expenses arising out of or otherwise based upon the performance of any of the Adviser’s duties or obligations under the Advisory Agreement or otherwise as the Adviser for us, and not arising out of criminal conduct, willful misfeasance, bad faith or gross negligence in the performance of their duties or by reason of the reckless disregard of their duties and obligations under the Advisory Agreement. These protections may lead the Adviser to act in a riskier manner when acting on our behalf than it would when acting for its own account.
39
The Adviser is able to resign upon 60 days’ written notice, and we may not be able to find a suitable replacement within that time, resulting in a disruption in our operations that could adversely affect our financial condition, business and results of operations.
We are an externally managed BDC pursuant to the Advisory Agreement. Pursuant to the Advisory Agreement, the Adviser has the right to resign upon 60 days’ written notice, whether a replacement has been found or not. If the Adviser resigns, it may be difficult to find a replacement with similar expertise and ability to provide the same or equivalent services on acceptable terms within 60 days, or at all. If a replacement is not found quickly, our business, results of operations and financial condition as well as our ability to pay distributions are likely to be adversely affected and the value of our shares may decline. In addition, the coordination of our internal management and investment activities is likely to suffer if we are unable to identify and reach an agreement with a single institution or group of executives having the expertise possessed by the Adviser. Even if a comparable service provider or individuals performing such services are retained, whether internal or external, their integration into our business and lack of familiarity with our investment objective may result in additional costs and time delays that may materially adversely affect our business, results of operations and financial condition.
We may not replicate our historical performance, or the historical success of other investment vehicles advised by the Adviser.
We cannot provide any assurance that we will replicate our own historical performance, the historical success of the Adviser or the historical performance of other investment vehicles that the Adviser and its investment team advised in the past. Accordingly, our investment returns could be substantially lower than the returns achieved by us in the past or by other clients of the Adviser. We can offer no assurance that the Adviser will be able to continue to implement our investment objective with the same degree of success as it has had in the past.
Risks Relating to the Merger
Sales of shares of our common stock after the completion of our acquisition of OHAI may cause the market price of our common stock to decline.
Former OHAI Stockholders may decide not to hold the shares of our common stock that they received pursuant to the merger agreement. Certain OHAI Stockholders, such as funds with limitations on their permitted holdings of stock in individual issuers, may be required to sell the shares of our common stock that they received pursuant to the merger agreement. In addition, our stockholders may decide not to hold their shares of common stock as a result of the merger. In each case, such sales of our common stock could have the effect of depressing the market price our common stock.
If we sell investments acquired as a result of the merger, it may result in capital gains and increase the incentive fees payable to the Adviser.
Investments that we acquired as a result of the merger are booked at a discount under ASC 805-50, Business Combinations–Related Issues. To the extent we sell one of these acquired investments at a price that is higher than its then-amortized cost, such sale would result in realized capital gain that would be factored in to the amount of the incentive fee on capital gains, if any, that is paid by us to the Adviser. If we sell a significant portion of the investments acquired as a result of the merger, it may materially increase the incentive fee on capital gains paid to the Adviser. The effect on the incentive fee on capital gains has been greater for acquired investments sold closer to the Closing.
None.
We do not own any real estate or other real property.
The Company is not currently a party to any material legal proceedings.
Not applicable.
40
|
Item 5. |
Market for Registrant’s Common Equity, Related Stockholder Matters and Issuer Purchases of Equity Securities |
Our common stock is quoted on The NASDAQ Global Select Market under the symbol “PTMN.” We completed our initial public offering on December 11, 2006 at an initial public offering (“IPO”) price of $15.00 per share. Prior to such date there was no public market for our common stock.
HOLDERS
As of February 24, 2020, there were approximately 52 holders of record of our common stock. This number does not include shareholders for whom shares are held in “nominee” or “street name.”
DIVIDEND POLICY
We intend to continue to make quarterly distributions to our stockholders. Our quarterly distributions, if any, will be determined by our Board. To maintain our RIC status, we must timely distribute an amount equal to at least 90% of our tax basis ordinary income and realized net short-term capital gains in excess of realized net long-term capital losses, if any, reduced by deductible expenses, out of the assets legally available for distribution, for each year. To avoid certain excise taxes imposed on RICs, we are generally required to distribute during each calendar year an amount at least equal to the sum of (1) 98% of our ordinary income for the calendar year, (2) 98.2% of our capital gains in excess of capital losses for the one-year period ending on October 31 of the calendar year and (3) any ordinary income and net capital gains for preceding years that were not distributed during such years and on which we paid no corporate tax. If this requirement is not met, we will be required to pay a nondeductible excise tax equal to 4% of the amount by which the required distribution amount exceeds the actual distribution for the year. The taxable income on which an excise tax is paid is generally carried forward and distributed to stockholders in the next tax year. Depending on the level of taxable income earned in a tax year, we may choose to carry forward taxable income in excess of current year distributions into the next tax year and pay a 4% excise tax on such income, to the extent required.
We cannot assure you that we will achieve results that will permit the payment of any cash distributions and, because we issued public senior securities, we are prohibited from making distributions if doing so causes us to fail to maintain the asset coverage ratio stipulated by the 1940 Act. Similarly, we may be prohibited from making distributions by the terms of any of our other borrowings.
We maintain an “opt out” dividend reinvestment plan for our common stockholders. As a result, if we declare distributions, then stockholders’ cash distributions will be automatically reinvested in additional shares of our common stock, unless they specifically “opt out” of the dividend reinvestment plan so as to receive cash.
41
The following graph compares the return on our common stock with that of the Russell 2000 Index and the Nasdaq Financial 100 Index (IXF), for the period December 11, 2006 (the date of our initial public offering) to December 31, 2019. The graph assumes that, on December 11, 2006, a person invested $100 in each of our common stock, the Russell 2000 Index, and the IFX. The graph measures total shareholder return, which takes into account both changes in stock price and dividends. It assumes that dividends are reinvested.
Shareholder Return Performance Graph Cumulative
Total Return Since Initial Public Offering(1) (Through
December 31, 2019)
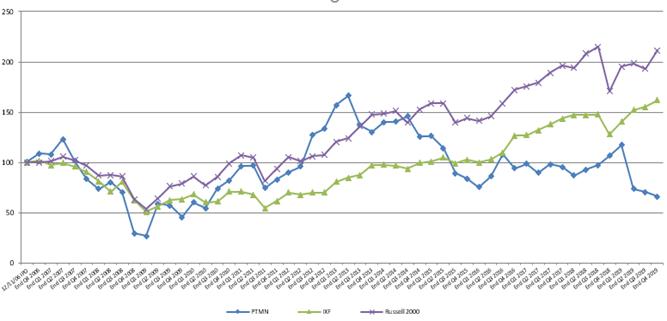
|
(1) |
Total return includes reinvestment of distributions through December 31, 2019. The IXF is an index of diversified financial sector stocks and, as such, the Company believes that it is representative of our industry. The Russell 2000 is a broad based equity market index that tracks companies with a market capitalization that the Company believes are comparable to it. |
ISSUER PURCHASES OF EQUITY SECURITIES
During the quarter ended December 31, 2019, we did not purchase any of our shares of common stock. Pursuant to the merger agreement entered into with OHAI, if at any time within one year after the closing date of the transaction the Company’s common stock is trading at a price below 75% of its net asset value, we will initiate an open-market stock repurchase program of up to $10 million to support the trading price of the combined entity for up to one year from the date such program is announced. In accordance with the merger agreement, on March 5, 2020 our board of directors authorized a stock repurchase program of up to $10 million effective March 6, 2020 and terminating on March 5, 2021. Under this repurchase program, shares may be repurchased from time to time in open market transactions, in privately negotiated transactions or otherwise subject to any agreement to which we are party including any restrictions in the indenture for our 6.125% Notes Due 2022. The timing and actual number of shares repurchased will depend on a variety of factors, including legal requirements, price, and economic and market conditions. This repurchase program may be suspended or discontinued at any time.
SALES OF UNREGISTERED SECURITIES
During the fiscal year ended December 31, 2019, we issued 73,482 shares of common stock pursuant to a dividend reinvestment plan. This issuance was not subject to the registration requirements of the Securities Act. See Note 10 “Stockholders’ Equity,” of our Notes to the Consolidated Financial Statements included herein.
42
The following selected consolidated financial data should be read in conjunction with Part II, Item 7, Management’s Discussion and Analysis of Financial Condition and Results of Operations, and Part II, Item 8, Financial Statements and Supplementary Data, of this Annual Report on Form 10-K. The following selected financial and other data for the years ended December 31, 2019, 2018, 2017, 2016 and 2015 is derived from the audited consolidated financial statements for such years, included in Part II, Item 8, Financial Statements and Supplementary Data, of this Annual Report on Form 10-K.
PORTMAN RIDGE FINANCE CORPORATION
SELECTED FINANCIAL DATA
|
|
Year Ended |
|
|
Year Ended |
|
|
Year Ended |
|
|
Year Ended |
|
|
Year Ended |
|
||||||
|
|
|
December 31, |
|
|
December 31, |
|
|
December 31, |
|
|
December 31, |
|
|
December 31, |
|
|||||
|
|
|
2019 |
|
|
2018 |
|
|
2017 |
|
|
2016 |
|
|
2015 |
|
|||||
|
Income Statement Data: |
|
|
|
|
|
|
|
|
|
|
|
|
|
|
|
|
|
|
|
|
|
Interest and related portfolio income: |
|
|
|
|
|
|
|
|
|
|
|
|
|
|
|
|
|
|
|
|
|
Interest and Dividends |
|
$ |
21,498,294 |
|
|
$ |
22,494,890 |
|
|
$ |
26,363,383 |
|
|
$ |
34,131,571 |
|
|
$ |
39,811,558 |
|
|
Fees and other income |
|
|
137,061 |
|
|
|
245,393 |
|
|
|
491,279 |
|
|
|
668,527 |
|
|
|
366,859 |
|
|
Dividends from Asset Manager Affiliates |
|
|
— |
|
|
|
1,246,510 |
|
|
|
460,000 |
|
|
|
1,400,000 |
|
|
|
5,348,554 |
|
|
Investment income – Joint Ventures |
|
|
4,859,780 |
|
|
|
3,100,000 |
|
|
|
949,037 |
|
|
|
— |
|
|
|
— |
|
|
Total interest and related portfolio income |
|
|
26,495,135 |
|
|
|
27,086,793 |
|
|
|
28,263,699 |
|
|
|
36,200,098 |
|
|
|
45,526,971 |
|
|
Expenses: |
|
|
|
|
|
|
|
|
|
|
|
|
|
|
|
|
|
|
|
|
|
Management fees |
|
|
3,129,079 |
|
|
|
— |
|
|
|
— |
|
|
|
— |
|
|
|
— |
|
|
Performance-based incentive fees |
|
|
— |
|
|
|
— |
|
|
|
— |
|
|
|
— |
|
|
|
— |
|
|
Interest and amortization of debt issuance costs |
|
|
8,261,445 |
|
|
|
7,403,436 |
|
|
|
7,661,407 |
|
|
|
9,110,603 |
|
|
|
11,727,880 |
|
|
Compensation |
|
|
3,688,578 |
|
|
|
4,012,743 |
|
|
|
4,571,309 |
|
|
|
4,103,558 |
|
|
|
3,843,799 |
|
|
Administrative services expense |
|
|
1,243,587 |
|
|
|
— |
|
|
|
— |
|
|
|
— |
|
|
|
— |
|
|
Other |
|
|
7,098,757 |
|
|
|
5,666,137 |
|
|
|
5,011,852 |
|
|
|
4,495,942 |
|
|
|
5,772,502 |
|
|
Total operating expenses |
|
|
23,421,446 |
|
|
|
17,082,316 |
|
|
|
17,244,568 |
|
|
|
17,710,103 |
|
|
|
21,344,181 |
|
|
Management and performance-based incentive fees waived |
|
|
— |
|
|
|
— |
|
|
|
— |
|
|
|
— |
|
|
|
— |
|
|
Net expenses |
|
|
23,421,446 |
|
|
|
17,082,316 |
|
|
|
17,244,568 |
|
|
|
17,710,103 |
|
|
|
21,344,181 |
|
|
Net Investment Income |
|
|
3,073,689 |
|
|
|
10,004,477 |
|
|
|
11,019,131 |
|
|
|
18,489,995 |
|
|
|
24,182,790 |
|
|
Realized and unrealized (losses) gains on investments and debt extinguishment: |
|
|
|
|
|
|
|
|
|
|
|
|
|
|
|
|
|
|
|
|
|
Net realized (losses) |
|
|
(16,695,014 |
) |
|
|
(16,672,029 |
) |
|
|
(11,021,042 |
) |
|
|
(6,341,678 |
) |
|
|
(6,647,478 |
) |
|
Net change in unrealized (losses) gains |
|
|
1,121,364 |
|
|
|
(2,903,994 |
) |
|
|
3,389,993 |
|
|
|
(13,188,048 |
) |
|
|
(36,169,870 |
) |
|
Total net (losses) gains |
|
|
(15,573,650 |
) |
|
|
(19,576,023 |
) |
|
|
(7,631,049 |
) |
|
|
(19,529,726 |
) |
|
|
(42,817,348 |
) |
|
Net (decrease) increase in net assets resulting from operations |
|
$ |
(12,499,961 |
) |
|
$ |
(9,571,546 |
) |
|
$ |
3,388,082 |
|
|
$ |
(1,039,731 |
) |
|
$ |
(18,634,558 |
) |
43
|
|
Year Ended |
|
|
Year Ended |
|
|
Year Ended |
|
|
Year Ended |
|
|
Year Ended |
|
||||||
|
|
|
December 31, |
|
|
December 31, |
|
|
December 31, |
|
|
December 31, |
|
|
December 31, |
|
|||||
|
|
|
2019 |
|
|
2018 |
|
|
2017 |
|
|
2016 |
|
|
2015 |
|
|||||
|
Per Share: |
|
|
|
|
|
|
|
|
|
|
|
|
|
|
|
|
|
|
|
|
|
Earnings per common share – basic |
|
$ |
(0.33 |
) |
|
$ |
(0.26 |
) |
|
$ |
0.09 |
|
|
$ |
(0.03 |
) |
|
$ |
(0.50 |
) |
|
Earnings per common share – diluted |
|
$ |
(0.33 |
) |
|
$ |
(0.26 |
) |
|
$ |
0.09 |
|
|
$ |
(0.03 |
) |
|
$ |
(0.50 |
) |
|
Net investment income per share – basic |
|
$ |
0.08 |
|
|
$ |
0.27 |
|
|
$ |
0.30 |
|
|
$ |
0.50 |
|
|
$ |
0.65 |
|
|
Net investment income per share – diluted |
|
$ |
0.08 |
|
|
$ |
0.27 |
|
|
$ |
0.30 |
|
|
$ |
0.50 |
|
|
$ |
0.65 |
|
|
Distributions declared per common share |
|
$ |
0.32 |
|
|
$ |
0.40 |
|
|
$ |
0.46 |
|
|
$ |
0.57 |
|
|
$ |
0.78 |
|
|
Taxable Distributable Income per basic share |
|
$ |
0.01 |
|
|
$ |
0.25 |
|
|
$ |
0.16 |
|
|
$ |
0.40 |
|
|
$ |
0.63 |
|
|
Balance Sheet Data: |
|
|
|
|
|
|
|
|
|
|
|
|
|
|
|
|
|
|
|
|
|
Investment assets at fair value |
|
$ |
277,897,166 |
|
|
$ |
273,308,349 |
|
|
$ |
311,956,156 |
|
|
$ |
366,471,304 |
|
|
$ |
409,570,495 |
|
|
Total assets |
|
$ |
310,374,263 |
|
|
$ |
285,464,681 |
|
|
$ |
319,808,974 |
|
|
$ |
381,371,983 |
|
|
$ |
421,204,697 |
|
|
Total debt outstanding |
|
$ |
153,863,788 |
|
|
$ |
100,400,189 |
|
|
$ |
101,413,317 |
|
|
$ |
175,548,570 |
|
|
$ |
201,103,761 |
|
|
Stockholders’ equity |
|
$ |
152,198,570 |
|
|
$ |
158,021,011 |
|
|
$ |
181,804,756 |
|
|
$ |
194,924,925 |
|
|
$ |
216,100,470 |
|
|
Net asset value per common share |
|
$ |
3.40 |
|
|
$ |
4.23 |
|
|
$ |
4.87 |
|
|
$ |
5.24 |
|
|
$ |
5.82 |
|
|
Common shares outstanding at end of year |
|
|
44,829,676 |
|
|
|
37,326,846 |
|
|
|
37,339,224 |
|
|
|
37,178,294 |
|
|
|
37,100,005 |
|
|
Other Data: |
|
|
|
|
|
|
|
|
|
|
|
|
|
|
|
|
|
|
|
|
|
Investments funded(1) |
|
|
100,847,747 |
|
|
|
118,159,373 |
|
|
|
227,722,823 |
|
|
|
75,724,590 |
|
|
|
130,954,741 |
|
|
Principal collections related to investment repayments or sales(1) |
|
|
142,428,478 |
|
|
|
112,052,177 |
|
|
|
323,531,633 |
|
|
|
129,191,854 |
|
|
|
129,793,338 |
|
|
Number of portfolio investments at year end(1) |
|
|
98 |
|
|
|
86 |
|
|
|
77 |
|
|
|
125 |
|
|
|
130 |
|
|
Weighted average interest rate on income producing debt investments(2) |
|
|
10.9 |
% |
|
|
10.0 |
% |
|
|
10.1 |
% |
|
|
7.0 |
% |
|
|
7.4 |
% |
|
Weighted average interest rate on income producing debt investments (adjusted for non-accrual and partial non-accrual)(3) |
|
|
9.0 |
% |
|
|
9.1 |
% |
|
|
9.6 |
% |
|
|
7.0 |
% |
|
|
7.4 |
% |
|
(1) |
Does not include short-term investments. |
|
(2) |
Weighted average interest rate on income producing investments is calculated as the weighted average contractual interest rate on par outstanding balances for investments in loans, bonds, and mezzanine debt in our Debt Securities portfolio. The calculation does not include CLO Fund Securities or Joint Ventures. |
|
(3) |
Weighted average interest rate of income producing investments (adjusted for non-accrual and partial non-accrual) is calculated as the weighted average contractual interest rate on par outstanding balances for investments in loans, bonds, and mezzanine debt in our Debt Securities portfolio, excluding contractual income on non-accrual and partial non-accrual investments. The calculation does not include CLO Fund Securities or Joint Ventures. |
44
The following discussion should be read in conjunction with our financial statements and related notes and other financial information appearing elsewhere in this annual report. In addition to historical information, the following discussion and other parts of this annual report contain forward-looking information that involves risks and uncertainties. Our actual results could differ materially from those anticipated by such forward-looking information due to the factors discussed under “Item 1A. Risk Factors” and “Note About Forward-Looking Statements” appearing elsewhere in this annual report. Except as otherwise indicated, the terms “we,” “us,” “our” and the “Company” refer to Portman Ridge Finance Corporation.
THE EXTERNALIZATION
On December 14, 2018, we entered into the Externalization Agreement with BCP, an affiliate of BC Partners, through which the Adviser agreed to become our investment adviser, subject to our stockholders’ approval of the Advisory Agreement between us and the Adviser. At a special meeting of our stockholders held on February 19, 2019, our stockholders approved the Advisory Agreement. The Externalization closed on April 1, 2019 (the “Closing”), and the Company commenced operations as an externally managed BDC managed by the Adviser.
Pursuant to the Externalization Agreement with BCP, the Adviser became our investment adviser in exchange for a cash payment from BCP, or its affiliate, of $25 million, or $0.669672 per share of our common stock, directly to our stockholders. In addition, the Adviser (or its affiliate) will use up to $10 million of the incentive fee actually paid to the Adviser prior to the second anniversary of the Closing to buy newly issued shares of our common stock at the most recently determined net asset value per share of our common stock at the time of such purchase. For the period of one year from the first day of the first quarter following the quarter in which the Closing occurred, the Adviser will permanently forego up to the full amount of the incentive fees earned by the Adviser without recourse against or reimbursement by us, to the extent necessary in order to achieve aggregate net investment income per share of our common stock for such one-year period to be at least equal to $0.40 per share, subject to certain adjustments.
OHAI TRANSACTION
On December 18, 2019, we completed our acquisition of OHA Investment Corporation (“OHAI”). In accordance with the terms of the merger agreement, each share of common stock, par value $0.001 per share, of OHAI (the “OHAI Common Stock”) issued and outstanding was converted into the right to receive (i) an amount in cash, without interest, equal to approximately $0.42, and (ii) 0.3688 shares of common stock, par value $0.01 per share, of the Company (plus any applicable cash in lieu of fractional shares). Each share of OHAI Common Stock issued and outstanding received, as additional consideration funded by Sierra Crest, an amount in cash, without interest, equal to approximately $0.15. As a result of the merger, we issued an aggregate of 7,439,559 shares of our common stock to former OHAI stockholders (approximately 16.6% of the Company’s outstanding shares at December 31, 2019).
Pursuant to the merger agreement, if at any time within one year after the closing date of the transaction our common stock is trading at a price below 75% of its net asset value, we will initiate an open-market stock repurchase of up to $10 million to support the trading price of the combined entity for up to one year from the date such program is announced. Our board approved a repurchase program on March 5, 2020. See “Item 5. Market for Registrant’s Common Equity, Related Stockholder Matters and Issuer Purchases of Equity Securities – Issuer Purchases of Equity Securities.”
45
The merger was accounted for in accordance with the asset acquisition method of accounting as detailed in ASC Topic 805-50. The fair value of the consideration paid, and transaction costs incurred to complete the merger by the Company, including $3.0 million of cash payment (deemed capital contribution) paid at closing directly to shareholders of OHAI from Sierra Crest and LibreMax, was allocated to the OHAI investments acquired, based on their relative fair values as of the date of acquisition. Immediately following the acquisition of OHAI, we recorded OHAI’s net assets at their respective fair values and, as a result, the purchase discount was allocated to the cost basis of the OHAI investments acquired and was immediately recognized as unrealized gain on our Consolidated Statement of Operations. The purchase discount was allocated to the acquired investments on a relative fair value basis and, for debt securities, will generally amortize over the life of the investments through interest income with a corresponding reversal of the unrealized appreciation on the OHAI investments acquired through their maturity. Upon the sale of any of the OHAI acquired investments, we will recognize a realized gain or a reduction in realized losses with a corresponding reversal of the unrealized losses.
|
|
|
|
|
|
|
Common stock issued by the Company (1) |
|
$ |
15,548,678 |
|
|
Cash consideration to OHAI shareholders (2) |
|
|
11,510,688 |
|
|
Transaction costs (excluding offering costs $385,747) |
|
|
851,807 |
|
|
Total purchase consideration |
|
|
27,911,173 |
|
|
Assets acquired: |
|
|
|
|
|
Investments, at fair value (amortized cost of $54,123,811) |
|
|
60,547,193 |
|
|
Cash |
|
|
232,708 |
|
|
Interest receivable |
|
|
592,329 |
|
|
Other assets |
|
|
482,454 |
|
|
Total assets acquired |
|
|
61,854,684 |
|
|
Liabilities assumed: |
|
|
|
|
|
Debt |
|
|
27,394,083 |
|
|
Other liabilities |
|
|
126,046 |
|
|
Total liabilities assumed |
|
|
27,520,129 |
|
|
Net assets acquired |
|
|
34,334,555 |
|
|
Total purchase discount |
|
$ |
(6,423,382 |
) |
|
(1) |
Based on the market price at closing of $2.09 as of December 18, 2019 and the 7,439,559 shares of common stock issued by us in conjunction with the merger. |
|
(2) |
Approximately $8.5 million cash consideration paid by the Company plus $3.0 million cash payment paid directly to shareholders of OHAI at closing from Sierra Crest and LibreMax. |
GENERAL
Since April 1, 2019, we have been an externally managed, non-diversified closed-end investment company that has elected to be regulated as a BDC under the 1940 Act.
We originate, structure, and invest in secured term loans, bonds or notes and mezzanine debt primarily in privately-held middle market companies but may also invest in other investments such as loans to publicly-traded companies, high-yield bonds, and distressed debt securities (collectively the “Debt Securities Portfolio”). We also invest in joint ventures and debt and subordinated securities issued by collateralized loan obligation funds (“CLO Fund Securities”). In addition, from time to time we may invest in the equity securities of privately held middle market companies and may also receive warrants or options to purchase common stock in connection with our debt investments.
In our Debt Securities Portfolio, our investment objective is to generate current income and, to a lesser extent, capital appreciation from the investments in senior secured term loans, mezzanine debt and selected equity investments in privately-held middle market companies. We define the middle market as comprising companies with EBITDA of $10 million to $50 million and/or total debt of $25 million to $150 million. We primarily invest in first and second lien term loans which, because of their priority in a company’s capital structure, we expect will have lower default rates and higher rates of recovery of principal if there is a default and which we expect will create a stable stream of interest income. The investments in our Debt Securities Portfolio are all or predominantly below investment grade, and have speculative characteristics with respect to the issuer’s capacity to pay interest and repay principal.
Our investments in CLO Fund Securities are primarily managed by our formerly wholly-owned asset management subsidiaries Trimaran Advisors and Trimaran Advisors Management, L.L.C. From time-to-time we have also made investments in CLO Fund Securities managed by other asset managers. The CLO Funds typically invest in broadly syndicated loans, high-yield bonds and other credit instruments. Our investments in CLO Fund Securities are anticipated to provide us with recurring cash distributions.
46
Subject to market conditions, we intend to grow our portfolio of assets by raising additional capital, including through the prudent use of leverage available to us. As a BDC, we are limited in the amount of leverage we can incur under the 1940 Act. Effective March 29, 2019, we are now allowed to borrow amounts such that our asset coverage, as defined in the 1940 Act, equals at least 150% after such borrowing. However, we continue to be prohibited by the indenture governing our Notes from making distributions on our common stock if our asset coverage, as defined in the 1940 Act, falls below 200%. In December 2019, our wholly owned subsidiary entered into a Revolving Credit Facility (see “- Financial Condition, Liquidity, and Capital Resources – Borrowings – Great Lakes Portman Ridge Funding LLC.”) See Note 7 - “Borrowings” to our consolidated financial statements.
We have elected to be treated for U.S. federal income tax purposes as a RIC under the Code and intend to operate in a manner to maintain our RIC status. As a RIC, we intend to distribute to our stockholders substantially all of our net ordinary taxable income and the excess of realized net short-term capital gains over realized net long-term capital losses, if any, for each year. To qualify as a RIC, we must, among other things, meet certain source-of-income and asset diversification requirements. Pursuant to this election, we generally will not have to pay corporate-level U.S. federal income taxes on any income that we timely distribute to our stockholders.
PORTFOLIO AND INVESTMENT ACTIVITY
Our primary investments are lending to and investing in middle-market businesses through investments in senior secured loans, junior secured loans, subordinated/mezzanine debt investments, and other equity investments, which may include warrants, investments in joint ventures, and investments in CLO Fund Securities.
Total portfolio investment activity (excluding activity in U.S. treasury bills and money market investments) for the years ended December 31, 2019, 2018, and 2017 was as follows:
|
|
Debt Securities |
|
|
CLO Fund Securities |
|
|
Equity Securities |
|
|
Asset Manager Affiliates |
|
|
Joint Ventures |
|
|
Derivatives |
|
|
Total Portfolio |
|
||||||||
|
Fair Value at December 31, 2016 2017 Activity: |
|
$ |
238,343,330 |
|
|
$ |
54,174,350 |
|
|
$ |
5,056,355 |
|
|
$ |
40,198,000 |
|
|
$ |
— |
|
|
$ |
— |
|
|
|
337,772,035 |
|
|
Purchases / originations / draws |
|
|
181,613,690 |
|
|
|
11,211,368 |
|
|
|
— |
|
|
|
— |
|
|
|
36,738,873 |
|
|
|
— |
|
|
|
229,563,931 |
|
|
Pay-downs / pay-offs / sales |
|
|
(300,625,104 |
) |
|
|
(25,598,497 |
) |
|
|
182,000 |
|
|
|
(2,750,000 |
) |
|
|
(11,824,015 |
) |
|
|
— |
|
|
|
(340,615,616 |
) |
|
Net accretion of interest |
|
|
304,904 |
|
|
|
11,139,633 |
|
|
|
— |
|
|
|
— |
|
|
|
— |
|
|
|
— |
|
|
|
11,444,537 |
|
|
Net realized losses |
|
|
(5,634,255 |
) |
|
|
(1,264,789 |
) |
|
|
— |
|
|
|
— |
|
|
|
— |
|
|
|
— |
|
|
|
(6,899,044 |
) |
|
Increase (decrease) in fair value |
|
|
4,194,914 |
|
|
|
2,016,608 |
|
|
|
(823,671 |
) |
|
|
1,401,000 |
|
|
|
(3,398,858 |
) |
|
|
— |
|
|
|
3,389,993 |
|
|
Fair Value at December 31, 2017 2018 Activity: |
|
$ |
118,197,479 |
|
|
$ |
51,678,673 |
|
|
$ |
4,414,684 |
|
|
$ |
38,849,000 |
|
|
$ |
21,516,000 |
|
|
$ |
— |
|
|
$ |
234,655,836 |
|
|
Purchases / originations / draws |
|
|
92,911,178 |
|
|
|
12,781,528 |
|
|
|
— |
|
|
|
— |
|
|
|
12,466,667 |
|
|
|
— |
|
|
|
118,159,373 |
|
|
Pay-downs / pay-offs / sales |
|
|
(57,125,611 |
) |
|
|
(19,033,322 |
) |
|
|
(1,093,244 |
) |
|
|
(34,800,000 |
) |
|
|
— |
|
|
|
— |
|
|
|
(112,052,177 |
) |
|
Net accretion of interest |
|
|
1,289,512 |
|
|
|
5,878,260 |
|
|
|
— |
|
|
|
— |
|
|
|
— |
|
|
|
— |
|
|
|
7,167,772 |
|
|
Net realized losses |
|
|
9,933 |
|
|
|
(16,484,872 |
) |
|
|
— |
|
|
|
— |
|
|
|
— |
|
|
|
— |
|
|
|
(16,474,939 |
) |
|
Increase (decrease) in fair value |
|
|
(7,420,747 |
) |
|
|
9,504,733 |
|
|
|
(1,283,420 |
) |
|
|
(579,000 |
) |
|
|
(3,125,560 |
) |
|
|
— |
|
|
|
(2,903,994 |
) |
|
Fair Value at December 31, 2018 2019 Activity: |
|
|
147,861,744 |
|
|
|
44,325,000 |
|
|
|
2,038,020 |
|
|
|
3,470,000 |
|
|
|
30,857,107 |
|
|
|
— |
|
|
$ |
228,551,871 |
|
|
Purchases / originations / draws |
|
|
164,680,210 |
|
|
|
— |
|
|
|
14,966,500 |
|
|
|
— |
|
|
|
15,857,536 |
|
|
|
30,609 |
|
|
|
195,534,855 |
|
|
Pay-downs / pay-offs / sales |
|
|
(123,783,352 |
) |
|
|
(13,629,382 |
) |
|
|
(371,222 |
) |
|
|
— |
|
|
|
(4,644,523 |
) |
|
|
— |
|
|
|
(142,428,478 |
) |
|
Net accretion of interest |
|
|
366,805 |
|
|
|
6,162,690 |
|
|
|
— |
|
|
|
— |
|
|
|
— |
|
|
|
— |
|
|
|
6,529,495 |
|
|
Net realized gains (losses) |
|
|
(8,841,780 |
) |
|
|
(1,395,218 |
) |
|
|
(1,912,048 |
) |
|
|
(3,470,000 |
) |
|
|
— |
|
|
|
— |
|
|
|
(15,619,046 |
) |
|
Increase (decrease) in fair value |
|
|
6,519,282 |
|
|
|
(3,494,888 |
) |
|
|
(4,856,831 |
) |
|
|
— |
|
|
|
3,017,847 |
|
|
|
(64,046 |
) |
|
|
1,121,364 |
|
|
Fair Value at December 31, 2019 |
|
$ |
186,802,908 |
|
|
$ |
31,968,202 |
|
|
$ |
9,864,419 |
|
|
$ |
— |
|
|
$ |
45,087,967 |
|
|
$ |
(33,437 |
) |
|
$ |
273,690,059 |
|
47
The level of investment activity for investments funded and principal repayments for our investments can vary substantially from period to period depending on the number and size of investments that we invest in or divest of, and many other factors, including the amount and competition for the debt and equity securities available to middle market companies, the level of merger and acquisition activity for such companies and the general economic environment.
The following table shows the Company’s portfolio by security type at December 31, 2019 and December 31, 2018:
|
|
|
December 31, 2019 |
|
|
December 31, 2018 |
|
||||||||||||||||||
|
|
Cost/Amortized Cost |
|
|
Fair Value |
|
|
%¹ |
|
|
Cost/Amortized Cost |
|
|
Fair Value |
|
|
%¹ |
|
|||||||
|
Short-term investments² |
|
$ |
4,207,107 |
|
|
$ |
4,207,107 |
|
|
|
2 |
|
|
$ |
44,756,478 |
|
|
$ |
44,756,478 |
|
|
|
17 |
|
|
Senior Secured Loan |
|
|
91,245,574 |
|
|
|
88,788,639 |
|
|
|
32 |
|
|
|
86,040,921 |
|
|
|
77,616,209 |
|
|
|
28 |
|
|
Junior Secured Loan |
|
|
100,655,341 |
|
|
|
95,188,373 |
|
|
|
34 |
|
|
|
76,223,561 |
|
|
|
70,245,535 |
|
|
|
26 |
|
|
Senior Unsecured Bond |
|
|
620,145 |
|
|
|
403,615 |
|
|
|
— |
|
|
|
— |
|
|
|
— |
|
|
|
— |
|
|
Subordinated Note |
|
|
2,165,304 |
|
|
|
2,422,281 |
|
|
|
1 |
|
|
|
— |
|
|
|
— |
|
|
|
— |
|
|
CLO Fund Securities |
|
|
46,618,717 |
|
|
|
31,968,202 |
|
|
|
12 |
|
|
|
55,480,626 |
|
|
|
44,325,000 |
|
|
|
16 |
|
|
Equity Securities |
|
|
22,160,993 |
|
|
|
9,864,419 |
|
|
|
4 |
|
|
|
9,477,763 |
|
|
|
2,038,020 |
|
|
|
1 |
|
|
Asset Manager Affiliates³ |
|
|
17,791,230 |
|
|
|
— |
|
|
|
— |
|
|
|
17,791,230 |
|
|
|
3,470,000 |
|
|
|
1 |
|
|
Joint Ventures |
|
|
48,594,539 |
|
|
|
45,087,967 |
|
|
|
16 |
|
|
|
37,381,525 |
|
|
|
30,857,107 |
|
|
|
11 |
|
|
Derivatives |
|
|
30,609 |
|
|
|
(33,437 |
) |
|
|
— |
|
|
|
— |
|
|
|
— |
|
|
|
— |
|
|
Total |
|
$ |
334,089,559 |
|
|
$ |
277,897,166 |
|
|
|
100 |
% |
|
$ |
327,152,104 |
|
|
$ |
273,308,349 |
|
|
|
100 |
% |
|
(1) |
Represents percentage of total portfolio at fair value. |
|
(2) |
Includes money market accounts and U.S. treasury bills at December 31, 2018. |
|
(3) |
Represents the equity investment in the Asset Manager Affiliates. |
48
The industry concentrations, based on the fair value of the Company’s investment portfolio as of December 31, 2019 and December 31, 2018, for our investment portfolio was as follows:
|
|
|
December 31, 2019 |
|
|
December 31, 2018 |
|
||||||||||||||||||
|
|
Cost/Amortized Cost |
|
|
Fair Value |
|
|
%¹ |
|
|
Cost/Amortized Cost |
|
|
Fair Value |
|
|
% |
|
|||||||
|
Aerospace and Defense |
|
$ |
15,706,988 |
|
|
$ |
16,342,388 |
|
|
|
6 |
|
|
$ |
5,434,927 |
|
|
$ |
4,049,940 |
|
|
|
1 |
|
|
Asset Management Company 2 |
|
|
17,791,230 |
|
|
|
— |
|
|
|
- |
|
|
|
17,791,230 |
|
|
|
3,470,000 |
|
|
|
1 |
|
|
Automotive |
|
|
5,504,508 |
|
|
|
5,541,823 |
|
|
|
2 |
|
|
|
— |
|
|
|
— |
|
|
|
— |
|
|
Banking, Finance, Insurance & Real Estate |
|
|
4,679,345 |
|
|
|
4,554,055 |
|
|
|
2 |
|
|
|
8,831,841 |
|
|
|
8,733,933 |
|
|
|
3 |
|
|
Beverage, Food and Tobacco |
|
|
7,899,181 |
|
|
|
7,750,305 |
|
|
|
3 |
|
|
|
5,963,334 |
|
|
|
5,796,506 |
|
|
|
2 |
|
|
Capital Equipment |
|
|
7,450,117 |
|
|
|
6,453,900 |
|
|
|
2 |
|
|
|
10,888,432 |
|
|
|
9,831,391 |
|
|
|
4 |
|
|
Chemicals, Plastics & Rubber |
|
|
345,833 |
|
|
|
389,320 |
|
|
|
0 |
|
|
|
4,862,063 |
|
|
|
4,801,645 |
|
|
|
2 |
|
|
CLO Fund Securities |
|
|
46,618,717 |
|
|
|
31,968,202 |
|
|
|
12 |
|
|
|
55,480,626 |
|
|
|
44,325,000 |
|
|
|
16 |
|
|
Construction & Building |
|
|
— |
|
|
|
— |
|
|
|
- |
|
|
|
1,400,223 |
|
|
|
1,394,163 |
|
|
|
1 |
|
|
Consumer goods: Durable |
|
|
3,413,107 |
|
|
|
2,558,619 |
|
|
|
1 |
|
|
|
1,140,500 |
|
|
|
364,240 |
|
|
|
0 |
|
|
Containers, Packaging and Glass |
|
|
2,831,640 |
|
|
|
2,616,480 |
|
|
|
1 |
|
|
|
1,434,568 |
|
|
|
1,440,525 |
|
|
|
1 |
|
|
Electronics |
|
|
12,511,345 |
|
|
|
13,636,090 |
|
|
|
5 |
|
|
|
3,007,500 |
|
|
|
3,007,500 |
|
|
|
1 |
|
|
Energy: Oil & Gas |
|
|
12,522,303 |
|
|
|
4,919,950 |
|
|
|
2 |
|
|
|
16,827,204 |
|
|
|
8,946,568 |
|
|
|
3 |
|
|
Environmental Industries |
|
|
3,998,816 |
|
|
|
3,924,947 |
|
|
|
1 |
|
|
|
8,371,180 |
|
|
|
6,939,794 |
|
|
|
3 |
|
|
Forest Products & Paper |
|
|
1,570,609 |
|
|
|
1,534,240 |
|
|
|
1 |
|
|
|
1,564,583 |
|
|
|
1,553,920 |
|
|
|
1 |
|
|
Healthcare, Education and Childcare |
|
|
9,353,548 |
|
|
|
9,136,345 |
|
|
|
3 |
|
|
|
— |
|
|
|
— |
|
|
|
— |
|
|
Healthcare & Pharmaceuticals |
|
|
42,461,467 |
|
|
|
33,637,136 |
|
|
|
12 |
|
|
|
38,638,822 |
|
|
|
32,287,288 |
|
|
|
12 |
|
|
High Tech Industries |
|
|
18,816,125 |
|
|
|
17,481,155 |
|
|
|
6 |
|
|
|
23,971,435 |
|
|
|
23,662,459 |
|
|
|
9 |
|
|
Hotel, Gaming & Leisure |
|
|
— |
|
|
|
— |
|
|
|
- |
|
|
|
400,000 |
|
|
|
1,000 |
|
|
|
0 |
|
|
Joint Ventures |
|
|
48,594,539 |
|
|
|
45,087,967 |
|
|
|
16 |
|
|
|
37,381,525 |
|
|
|
30,857,107 |
|
|
|
11 |
|
|
Media: Advertising, Printing & Publishing |
|
|
— |
|
|
|
— |
|
|
|
- |
|
|
|
6,113,852 |
|
|
|
5,590,863 |
|
|
|
2 |
|
|
Media: Broadcasting & Subscription |
|
|
4,614,647 |
|
|
|
4,567,266 |
|
|
|
2 |
|
|
|
— |
|
|
|
— |
|
|
|
— |
|
|
Media: Diversified & Production |
|
|
2,886,325 |
|
|
|
2,887,230 |
|
|
|
1 |
|
|
|
— |
|
|
|
— |
|
|
|
— |
|
|
Metals & Mining |
|
|
1,180,977 |
|
|
|
1,319,500 |
|
|
|
0 |
|
|
|
— |
|
|
|
— |
|
|
|
— |
|
|
Personal, Food and Miscellaneous Services |
|
|
2,534,318 |
|
|
|
2,829,436 |
|
|
|
1 |
|
|
|
— |
|
|
|
— |
|
|
|
— |
|
|
Services: Business |
|
|
22,726,850 |
|
|
|
21,415,794 |
|
|
|
8 |
|
|
|
10,398,710 |
|
|
|
9,213,416 |
|
|
|
3 |
|
|
Services: Consumer |
|
|
4,512,488 |
|
|
|
4,493,529 |
|
|
|
2 |
|
|
|
— |
|
|
|
— |
|
|
|
— |
|
|
Telecommunication |
|
|
8,751,454 |
|
|
|
8,164,050 |
|
|
|
3 |
|
|
|
8,351,775 |
|
|
|
8,343,919 |
|
|
|
3 |
|
|
Textiles and Leather |
|
|
12,389,673 |
|
|
|
12,180,290 |
|
|
|
4 |
|
|
|
10,140,662 |
|
|
|
9,940,294 |
|
|
|
4 |
|
|
Money Market Accounts |
|
|
4,207,107 |
|
|
|
4,207,107 |
|
|
|
2 |
|
|
|
34,757,129 |
|
|
|
34,757,129 |
|
|
|
13 |
|
|
Transportation: Cargo |
|
|
8,216,303 |
|
|
|
8,300,043 |
|
|
|
3 |
|
|
|
4,000,634 |
|
|
|
4,000,400 |
|
|
|
1 |
|
|
U.S. Government Obligations |
|
|
— |
|
|
|
— |
|
|
|
- |
|
|
|
9,999,349 |
|
|
|
9,999,349 |
|
|
|
4 |
|
|
Total |
|
$ |
334,089,558 |
|
|
$ |
277,897,166 |
|
|
|
100 |
% |
|
$ |
327,152,104 |
|
|
$ |
273,308,349 |
|
|
|
100 |
% |
|
(1) |
Calculated as a percentage of total portfolio at fair value. |
|
(2) |
Represents the equity investment in the Asset Manager Affiliates. |
Debt Securities Portfolio
At December 31, 2019 and December 31, 2018, the weighted average contractual interest rate on our loans and debt securities, excluding CLO Fund Securities and Joint Ventures, was approximately 10.9% and 10.1%, respectively. At December 31, 2019 and December 31, 2018, the weighted average contractual interest rate on our loans and debt securities, excluding non-accrual and partial non-accrual investments, excluding CLO Fund Securities and Joint Ventures, was approximately 9.0% and 9.6%, respectively.
The investment portfolio (excluding our investments in the CLO Funds, Joint Ventures and short-term investments) at December 31, 2019 was spread across 24 different industries and 60 different entities with an average par balance per entity of approximately $3.8 million. As of December 31, 2019, seven of our debt investments were on non-accrual status.
49
We may invest up to 30% of our investment portfolio in “non-qualifying” opportunistic investments such as high-yield bonds, debt and equity securities of CLO Funds, foreign investments, joint ventures, managed funds, partnerships and distressed debt or equity securities of large cap public companies. At December 31, 2019 and December 31, 2018, the total amount of non-qualifying assets to total assets was approximately 25.3% and 23%, respectively. A significant portion of non-qualifying assets were foreign investments which were approximately 11% and 16% of our total assets as of December 31, 2019 and 2018, respectively (including our investments in CLO Funds, which are typically domiciled outside the U.S. and represented approximately 10% and 16% of its total assets, respectively). The investments in our Debt Securities Portfolio are all or predominantly below investment grade, and therefore have speculative characteristics with respect to the issuer’s capacity to pay interest and repay principal.
Asset Manager Affiliates
The Disposed Manager Affiliates manage CLO Funds that invest in broadly syndicated loans, high yield bonds and other credit instruments. The CLO Funds managed by the Disposed Asset Manager Affiliates consist primarily of credit instruments issued by corporations. In connection with the LibreMax Transaction, on December 31, 2018, our wholly-owned subsidiary Commodore Holdings, LLC sold the Disposed Manager Affiliates, which represented substantially all of our investment in the Asset Manager Affiliates, to LibreMax for a cash purchase price of approximately $37.9 million. Accordingly, certain CLO Fund investments were reclassified from CLO Funds managed by affiliates to CLO funds managed by non-affiliates on December 31, 2018. Effective April 1, 2019, as a result of the Externalization and related transactions, CLO Fund investments managed by LibreMax were assigned to CLO Funds managed by affiliates. As of December 31, 2019, our Asset Manager Affiliates had approximately $300 million of par value of assets under management, for which management fees were waived and thus were deemed to have no value. As of December 31, 2018, our Asset Manager Affiliates had approximately $300 million of par value of assets under management on which they earned management fees and were valued at approximately $3.5 million.
In connection with the Externalization, during the first quarter of 2019, KCAP Management agreed to waive management fees it is otherwise entitled to receive for managing the Fund. In addition, the Joint Venture was restructured such that we are now entitled to receive a preferred distribution in an amount equal to the fees waived by KCAP Management. The impact of these transactions was a reduction in the fair value of the Asset Manager Affiliates (realized loss) and increase the fair value of our investment in the Joint Venture (unrealized gain) during the first quarter of 2019.
CLO Fund Securities
We have made minority investments in the subordinated securities or preferred shares of CLO Funds managed by the Disposed Manager Affiliates and may selectively invest in securities issued by CLO Funds managed by other asset management companies. As of December 31, 2019 and December 31, 2018, we had approximately $32.0 million and $44.3 million, respectively invested in CLO Fund Securities, issued primarily by CLO Funds managed by the Disposed Manager Affiliates.
The CLO Funds invest primarily in broadly syndicated non-investment grade loans, high-yield bonds and other credit instruments of corporate issuers. The underlying assets in each of the CLO Fund Securities in which we have an investment are generally diversified secured or unsecured corporate debt.
The structure of CLO Funds, which are highly levered, is extremely complicated. Since we primarily invest in securities representing the residual interests of CLO Funds, our investments are much riskier than the risk profile of the loans by which such CLO Funds are collateralized. Our investments in CLO Funds may be riskier and less transparent to us and our stockholders than direct investments in the underlying loans. The CLO Funds in which we invest have debt that ranks senior to our investment. For a more detailed discussion of the risks related to our investments in CLO Funds, please see “Risk Factors — Risks Related to Our Investments — Our investments may be risky, and you could lose all or part of your investment.”
50
Our CLO Fund Securities as of December 31, 2019 and December 31, 2018, were as follows:
|
|
|
|
|
|
|
|
December 31, 2019(2) |
|
|
December 31, 2018(3) |
|
|||||||||||
|
CLO Fund Securities |
|
Investment |
|
%1 |
|
|
Amortized Cost |
|
|
Fair Value |
|
|
Amortized Cost |
|
|
Fair Value |
|
|||||
|
Katonah III, Ltd. |
|
Income Notes |
|
|
|
|
|
$ |
— |
|
|
$ |
— |
|
|
$ |
1,287,155 |
|
|
$ |
369,280 |
|
|
Catamaran CLO 2013- 1 Ltd. |
|
Subordinated Notes |
|
|
23.3 |
|
|
|
6,094,823 |
|
|
|
5,025,536 |
|
|
|
6,378,611 |
|
|
|
7,016,733 |
|
|
Catamaran CLO 2014-1 Ltd. |
|
Subordinated Notes |
|
|
22.2 |
|
|
|
9,995,658 |
|
|
|
6,379,580 |
|
|
|
11,740,622 |
|
|
|
9,777,251 |
|
|
Great Lakes KCAP F3C Senior LLC |
|
Class E Notes |
|
|
27.4 |
|
|
|
— |
|
|
|
— |
|
|
|
4,407,106 |
|
|
|
4,473,840 |
|
|
Dryden 30 Senior Loan Fund |
|
Subordinated Notes |
|
|
6.8 |
|
|
|
1,519,641 |
|
|
|
1,984,155 |
|
|
|
1,438,701 |
|
|
|
1,913,925 |
|
|
Catamaran CLO 2014-2 Ltd. |
|
Subordinated Notes |
|
|
24.9 |
|
|
|
6,072,697 |
|
|
|
1,139,032 |
|
|
|
6,314,484 |
|
|
|
2,158,200 |
|
|
Catamaran CLO 2015-1 Ltd. |
|
Subordinated Notes |
|
|
9.9 |
|
|
|
4,088,504 |
|
|
|
2,514,130 |
|
|
|
4,353,347 |
|
|
|
3,048,698 |
|
|
Catamaran CLO 2016-1 Ltd. |
|
Subordinated Notes |
|
|
24.9 |
|
|
|
9,253,304 |
|
|
|
6,395,016 |
|
|
|
9,717,150 |
|
|
|
7,067,073 |
|
|
Catamaran CLO 2018-1 Ltd. |
|
Subordinated Notes |
|
|
24.8 |
|
|
|
9,594,090 |
|
|
|
8,530,751 |
|
|
|
9,843,450 |
|
|
|
8,500,000 |
|
|
Total |
|
|
|
|
|
|
|
$ |
46,618,717 |
|
|
$ |
31,968,202 |
|
|
$ |
55,480,626 |
|
|
$ |
44,325,000 |
|
|
(1) |
Represents percentage of class held as of December 31, 2019. |
|
(2) |
Other than Katonah III, Ltd and Dryden 30, all of our CLO Fund securities investments were managed by affiliates as of December 31, 2019. |
|
(3) |
Other than Great Lakes KCAP F3C Senior LLC, none of our CLO Fund securities investments were managed by affiliates as of December 31, 2018. |
On December 19, 2017, the Company, in its capacity as the holder of all of the outstanding preferred shares of Katonah 2007-1 CLO Ltd. (“Katonah 2007-1”), exercised its right to cause Katonah 2007-1 to redeem all of its outstanding indebtedness through the sale of its investments and otherwise wind up its business. Katonah 2007-1 was fully liquidated and dissolved in the fourth quarter of 2018. Accordingly, the Company recorded a realized loss during the fourth quarter of 2018 of approximately $10.1 million on our investment in Katonah 2007-1 and a corresponding unrealized gain of the same amount in order to reverse the previously recorded unrealized depreciation with respect to the investment.
Similarly, during the fourth quarter of 2018, each of Grant Grove CLO, Ltd., Trimaran CLO VII, Ltd., and Catamaran 2012-1 Ltd. were fully liquidated and dissolved, and the Company recorded a realized loss of approximately $6.4 million and a corresponding unrealized gain of the same amount in order to revere the previously recorded unrealized depreciation with respect to these investments.
Investment in Joint Ventures
KCAP Freedom 3 LLC
During the third quarter of 2017, we and Freedom 3 Opportunities, an affiliate of Freedom 3 Capital LLC, entered into an agreement to create the Joint Venture. We contributed approximately $37 million and Freedom 3 Opportunities contributed approximately $25 million, in assets to the Joint Venture, which in turn used the assets to capitalize the Fund managed by KCAP Management, LLC, one of the Asset Manager Affiliates. In addition, the Fund used cash on hand and borrowings under a credit facility to purchase approximately $184 million of primarily middle-market loans from us and we used the proceeds from such sale to redeem approximately $147 million in debt issued by KCAP Senior Funding. The Fund invests primarily in middle-market loans and the Joint Venture partners may source middle-market loans from time-to-time for the Fund.
During the fourth quarter of 2017, the Fund was refinanced through the issuance of senior and subordinated notes. The Joint Venture purchased 100% of the subordinated notes issued by the Fund. In connection with the refinancing, the Joint Venture made a cash distribution to us of approximately $12.6 million. $11.8 million of this distribution was a return of capital, reducing the cost basis of our investment in the Joint Venture by that amount. The final determination of the tax attributes of distributions from the Joint Venture is made on an annual (full calendar year) basis at the end of the year, therefore, any estimate of tax attributes of distributions made on an interim basis may not be representative of the actual tax attributes of distributions for the full year.
51
In connection with the Externalization, during the first quarter of 2019, KCAP Management agreed to waive management fees it is otherwise entitled to receive for managing the Fund. In addition, the Joint Venture was restructured such that we are now entitled to receive a preferred distribution in an amount equal to the fees waived by KCAP Management. The impact of these transactions was a reduction in the fair value of the Asset Manager Affiliates (realized loss) and increase the fair value of our investment in the Joint Venture (unrealized gain) during the first quarter of 2019.
We own a 60% economic interest in the Joint Venture. The Joint Venture is structured as an unconsolidated Delaware limited liability company. All portfolio and other material decisions regarding the Joint Venture must be submitted to its board of managers, which is comprised of four members, two of whom were selected by us and two of whom were selected by Freedom 3 Opportunities, and must be approved by at least one member appointed by us and one appointed by Freedom 3 Opportunities. In addition, certain matters may be approved by the Joint Venture’s investment committee, which is comprised of one member appointed by us and one member appointed by Freedom 3 Opportunities.
We have determined that the Joint Venture is an investment company under Accounting Standards Codification (“ASC”), Financial Services — Investment Companies (“ASC 946”), however, in accordance with such guidance, we will generally not consolidate our investment in a company other than a wholly owned investment company subsidiary or a controlled operating company whose business consists of providing services to us. We do not consolidate its interest in the Joint Venture because we do not control the Joint Venture due to allocation of the voting rights among the Joint Venture partners.
KCAP Freedom 3 LLC
Summarized Statements of Financial Condition
|
|
As of December 31, 2019 |
|
|
As of December 31, 2018 |
|
|||
|
Investment at fair value |
|
$ |
33,737,631 |
|
|
$ |
32,621,188 |
|
|
Total Assets |
|
$ |
33,737,631 |
|
|
$ |
32,621,188 |
|
|
Total Liabilities |
|
$ |
135,457 |
|
|
$ |
1,970,455 |
|
|
Total Equity |
|
|
33,602,174 |
|
|
|
30,650,733 |
|
|
Total Liabilities and Equity |
|
$ |
33,737,631 |
|
|
$ |
32,621,188 |
|
52
Summarized Statements of Operations
|
|
Year Ended December 31, |
|
||||||||||
|
|
|
2019 |
|
|
2018 |
|
|
2017 |
|
|||
|
Investment income |
|
$ |
5,127,460 |
|
|
$ |
4,800,844 |
|
|
$ |
2,531,331 |
|
|
Operating expenses |
|
|
86,183 |
|
|
|
126,786 |
|
|
|
435,757 |
|
|
Net investment income |
|
|
5,041,277 |
|
|
|
4,674,058 |
|
|
|
2,095,574 |
|
|
Unrealized appreciation on investments |
|
|
2,951,441 |
|
|
|
(4,951,938 |
) |
|
|
(5,063,254 |
) |
|
Net income |
|
$ |
7,992,718 |
|
|
$ |
(277,880 |
) |
|
$ |
(2,967,680 |
) |
KCAP Freedom 3 LLC
Schedule of Investments
December 31, 2019
|
|
Investment |
|
Percentage Ownership by Joint Venture |
|
|
Amortized Cost |
|
|
Fair Value |
|
||||
|
Great Lakes KCAP F3C Senior, LLC(1)(2)(3) |
|
Subordinated Securities, effective interest 11.2%, 12/29 maturity |
|
|
100.0 |
% |
|
$ |
40,801,382 |
|
|
$ |
33,737,631 |
|
|
Total Investments |
|
|
|
|
|
|
|
$ |
40,801,382 |
|
|
$ |
33,737,631 |
|
|
(1) |
CLO Subordinated Investments are entitled to periodic distributions which are generally equal to the remaining cash flow of the payments made by the underlying fund’s investments less contractual payments to debt holders and fund expenses. The estimated annualized effective yield indicated is based upon a current projection of the amount and timing of these distributions. Such projections are updated on a quarterly basis and the estimated effective yield is adjusted prospectively. |
|
(2) |
Fair value of this investment was determined using significant unobservable inputs, including default rates, prepayment rates, spreads, and the discount rate by which to value the resulting cash flows. |
|
(3) |
Formerly known as KCAP F3C Senior Funding, LLC |
KCAP Freedom 3 LLC
Schedule of Investments
December 31, 2018
|
|
Investment |
|
Percentage Ownership by Joint Venture |
|
|
Amortized Cost |
|
|
Fair Value |
|
||||
|
KCAP F3C Senior Funding, LLC (1)(2) |
|
Subordinated Securities, effective interest 11.5%, 12/29 maturity |
|
|
100.0 |
% |
|
$ |
42,636,380 |
|
|
$ |
32,621,188 |
|
|
Total Investments |
|
|
|
|
|
|
|
$ |
42,636,380 |
|
|
$ |
32,621,188 |
|
|
(1) |
CLO Subordinated Investments are entitled to periodic distributions which are generally equal to the remaining cash flow of the payments made by the underlying fund’s investments less contractual payments to debt holders and fund expenses. The estimated annualized effective yield indicated is based upon a current projection of the amount and timing of these distributions. Such projections are updated on a quarterly basis and the estimated effective yield is adjusted prospectively. |
|
(2) |
Fair value of this investment was determined using significant unobservable inputs, including a third-party broker quote. |
53
BCP Great Lakes Fund LP (the “BCP Great Lakes Partnership”) has invested in BCP Great Lakes Holdings LP, a vehicle formed as a co-investment vehicle to facilitate the participation of certain co-investors to invest, directly or indirectly, in BCP Great Lakes Funding, LLC (the “Great Lakes Joint Venture”). We are a limited partner in the BCP Great Lakes Partnership and do not have any direct or indirect voting interests in the Great Lakes Joint Venture, and treat the investment as a joint venture since an affiliate of our Adviser manages BCP Great Lakes Holdings LP and controls a 50% voting interest in the Great Lakes Joint Venture. The investment strategy of BCP Great Lakes Funding, LLC is to underwrite and hold senior, secured unitranche loans made to middle-market companies. We do not pay any advisory fees in connection with our investment in the BCP Great Lakes Partnership.
The fair value of our investment in the BCP Great Lakes Partnership at December 31, 2019 and December 31, 2018 was $23.8 million and $12.5 million. Fair value has been determined utilizing the practical expedient pursuant to ASC 820-10. Pursuant to the terms of the BCP Great Lakes Fund LP Amended and Restated Exempted Limited Partnership Agreement (the “BCP Great Lakes Partnership Agreement”), generally we may not sell, exchange, assign, pledge or otherwise transfer our interest, in whole or in part, without the prior written consent of the general partner of the Great Lakes Partnership (the “General Partner”) which consent may be given or withheld in the General Partner’s sole and absolute discretion, and may be conditioned upon repayment of our share of indebtedness incurred by BCP Great Lakes Partnership.
In March 2019, prior to the Externalization, we increased our aggregate commitment to the BCP Great Lakes Partnership to $50 million, subject to certain limitations (including that we are not obligated to fund capital calls if such funding would cause the Company to be out of compliance with certain provisions of the 1940 Act). As of December 31, 2019 and December 31, 2018, we had a $26.3 million and $12.5 million, respectively unfunded commitment to the BCP Great Lakes Partnership. However, at December 31, 2019 our funding commitment was limited to approximately $11.3 million pursuant to the limitations described above.
RESULTS OF OPERATIONS
The principal measure of our financial performance is the net increase (decrease) in stockholders’ equity resulting from operations, which includes net investment income (loss) and net realized and unrealized appreciation (depreciation). Net investment income (loss) is the difference between our income from interest, distributions, fees, and other investment income and our operating expenses. Net realized gain (loss) on investments is the difference between the proceeds received from dispositions of portfolio investments and their amortized cost. Net change in unrealized appreciation (depreciation) on investments is the net change in the fair value of our investment portfolio.
Set forth below is a discussion of our results of operations for years ended December 31, 2019, 2018, and 2017.
Revenue
|
|
|
For the Years Ended December 31, |
|
|||||||||
|
|
2019 |
|
|
2018 |
|
|
2017 |
|
||||
|
Investment Income: |
|
|
|
|
|
|
|
|
|
|
|
|
|
Interest from investments in debt securities |
|
$ |
14,983,694 |
|
|
$ |
16,005,663 |
|
|
$ |
15,063,193 |
|
|
Interest from U.S. Treasury Bills and money market investments |
|
|
79,065 |
|
|
|
76,055 |
|
|
|
71,934 |
|
|
Investment income on CLO Fund Securities managed by affiliates |
|
|
4,427,387 |
|
|
|
6,024,935 |
|
|
|
10,807,490 |
|
|
Investment income on CLO Fund Securities managed by non-affiliates |
|
|
2,008,148 |
|
|
|
388,237 |
|
|
|
420,766 |
|
|
Dividends from Asset Manager Affiliates |
|
|
— |
|
|
|
1,246,510 |
|
|
|
460,000 |
|
|
Investment in Joint Ventures |
|
|
4,859,780 |
|
|
|
3,100,000 |
|
|
|
949,037 |
|
|
Capital structuring service fees |
|
|
137,061 |
|
|
|
245,393 |
|
|
|
491,279 |
|
|
Total investment income |
|
$ |
26,495,135 |
|
|
$ |
27,086,793 |
|
|
$ |
28,263,699 |
|
Revenues consist primarily of investment income from interest and dividends on our investment portfolio and various ancillary fees related to our investment holdings.
Interest from Investments in Debt Securities. We generate interest income from our investments in debt securities that consist primarily of senior and junior secured loans. Our Debt Securities Portfolio is spread across multiple industries and geographic locations and, as such, we are broadly exposed to market conditions and business environments. As a result, although our investments are exposed to market risks, we continuously seek to limit concentration of exposure in any particular sector or issuer.
Investment Income on Investments in CLO Fund Securities. We generate investment income from our investments in the securities (typically preferred shares or subordinated securities) of CLO Funds. We distinguish CLO Funds managed by our Asset Manager Affiliates as “CLO Fund Securities Managed by Affiliates”, in our consolidated financial statements. Since the Asset Manager Affiliates were owned throughout 2018 and sold on December 31, 2018, investment income on these CLO Fund Securities is reflected on the statement of operations for the year of 2018 as “managed by affiliates”, while on the consolidated balance sheet at December 31, 2018 these investments are reflected as “managed by non-affiliates”. Effective April 1, 2019, as a result of the Externalization and related transactions, CLO Fund investments managed by LibreMax were assigned to CLO Funds managed by
54
affiliates. CLO Funds invest primarily in broadly syndicated non-investment grade loans, high-yield bonds and other credit instruments of corporate issuers. The underlying assets in each of the CLO Funds in which we have an investment are generally diversified secured or unsecured corporate debt. Our CLO Fund Securities that are subordinated securities or preferred shares (“junior securities”) are subordinated to senior note holders who typically receive a return on their investment at a fixed spread relative to the LIBOR index. The CLO Funds are leveraged funds and any excess cash flow or “excess spread” (interest earned by the underlying securities in the fund less payments made to senior bond holders and less fund expenses and management fees) is paid to the holders of the CLO Fund’s subordinated securities or preferred shares. The level of excess spread from CLO Fund Securities can be impacted by the timing and level of the resetting of the benchmark interest rate for the underlying assets (which reset at various times throughout the quarter) in the CLO Fund and the related CLO Fund note liabilities (which reset at each quarterly distribution date); in periods of short-term and volatile changes in the benchmark interest rate, the levels of excess spread and resulting cash distributions to us can vary significantly.
Interest income on investments in CLO equity investments is recorded using the effective interest method in accordance with the provisions of ASC 325-40, Beneficial Interests in Securitized Financial Assets (“ASC 325-40”), based on the anticipated yield and the estimated cash flows over the projected life of the investment. Yields are revised when there are changes in actual or estimated projected future cash flows due to changes in prepayments and/or re-investments, credit losses or asset pricing. Changes in estimated yield are recognized as an adjustment to the estimated yield prospectively over the remaining life of the investment from the date the estimated yield was changed. Accordingly, investment income recognized on CLO equity securities in our U.S. generally accepted accounting principles (“GAAP”) statement of operations differs from both the tax–basis investment income and from the cash distributions actually received by us during the period. As a RIC, we anticipate a timely distribution of our tax-basis taxable income.
For non-junior class CLO Fund securities, interest is earned at a fixed spread relative to the LIBOR index.
Distributions from Asset Manager Affiliates. Substantially all of our investment in the Asset Manager Affiliates was sold on December 31, 2018. Prior thereto, we had received cash distributions from the Asset Manager Affiliates, which manage CLO Funds that invest primarily in broadly syndicated non-investment grade loans, high yield bonds and other credit instruments issued by corporations. As managers of CLO Funds, the Asset Manager Affiliates receive contractual and recurring management fees from the CLO Funds for their management and advisory services. In addition, the Asset Manager Affiliates may also earn income related to net interest on assets accumulated for future CLO issuances on which they have taken a first loss position in connection with loan warehouse arrangements for their future CLO Funds.
As a result of tax-basis goodwill amortization and certain other tax-related adjustments, portions of distributions received may be deemed return of capital. Our investment in our Asset Manager Affiliates was deemed to have no value at December 31, 2019. There were no distributions from the Asset Manager Affiliates during 2019. For the year ended December 31, 2018, we recognized dividend income of $1.2 million from the Asset Manager Affiliates, while cash distributions received were approximately $36.0 million. The difference between cash distributions received and the tax-basis earnings and profits is recorded as an adjustment to the cost basis of the Asset Manager Affiliates investments. For interim periods, we estimate the tax attributes of any distributions as being either from tax-basis earnings and profits (i.e. dividend income) or return of capital (i.e. adjustment to our cost basis in the Asset Manager Affiliates). The final determination of the tax attributes of distributions from our Asset Manager Affiliates is made on an annual (full calendar year) basis at the end of the year based upon taxable income and distributions for the full-year. Therefore, any estimate of tax attributes of distributions made on a quarterly basis may not be representative of the actual tax attributes of distributions for a full year. The aggregate par value of assets under management by our Asset Manager Affiliates was $300 million as of December 31, 2019 and December 31, 2018.
Investments in Joint Ventures. For the years ended December 31, 2019, 2018 and 2017,we recognized $4.9 million and $3.1 million and $1.0 million, respectively, in investment income from our investments in Joint Ventures. As of December 31, 2019 and December 31, 2018, the fair value of our investments in Joint Ventures was approximately $45.1 million and $30.9 million, respectively. The final determination of the tax attributes of distributions from Joint Ventures is made on an annual (full calendar year) basis at the end of the year based upon taxable income and distributions for the full year. Therefore, any estimate of tax attributes of distributions made on an interim basis may not be representative of the actual tax attributes of distributions for the full year.
Capital Structuring Service Fees. We may earn ancillary structuring and other fees related to the origination, investment, disposition or liquidation of debt and investment securities.
Investment Income
Investment income for the years ended December 31, 2019, 2018 and 2017 was approximately $26.5 million, $27.1 million and $28.3 million respectively. Of these amounts, approximately $15.0 million, $16.0 million and $15.1 million, respectively was attributable to interest income on our Debt Securities Portfolio. The decrease in interest income on our Debt Securities Portfolio during 2019 was primarily the result of additional investments placed on non-accrual status since the prior period and the decrease in LIBOR rates.
At December 31, 2019 and 2018, the weighted average contractual interest rate on our loans and debt securities was approximately 11.0% and 10.0%, respectively. At December 31, 2019 and 2018, the weighted average contractual interest rate on our loans and debt securities, excluding non-accrual and partial non-accrual investments, was approximately 9.0% and 9.1%, respectively.
55
Investment income is primarily dependent on the composition and credit quality of our investment portfolio. Generally, our Debt Securities Portfolio is expected to generate predictable, recurring interest income in accordance with the contractual terms of each loan. Corporate equity securities may pay a dividend and may increase in value for which a gain may be recognized; generally, such dividend payments and gains are less predictable than interest income on our loan portfolio.
For the years ended December 31, 2019, 2018 and 2017, approximately $6.4 million, $6.4 million and $11.2 million, respectively, of investment income was attributable to investments in CLO Fund Securities. On a tax basis, the Company recognized $2.5 million and $3.5 million of taxable distributable income on distributions from our CLO Fund Securities during the year ended December 31, 2019 and 2018, respectively. Distributions from CLO Fund Securities are dependent on the performance of the underlying assets in each CLO Fund; interest payments, principal amortization and prepayments of the underlying loans in each CLO Fund are primary factors which determine the level of distributions on our CLO Fund Securities. The level of excess spread from CLO Fund Securities can be impacted by the timing and level of the resetting of the benchmark interest rate for the underlying assets (which reset at various times throughout the quarter) in the CLO Fund and the related CLO Fund bond liabilities (which reset at each quarterly distribution date); in periods of short-term and volatile changes in the benchmark interest rate, the levels of excess spread and distributions to us can vary significantly.
Expenses
|
|
For the Years Ended December 31, |
|
||||||||||
|
|
|
2019 |
|
|
2018 |
|
|
2017 |
|
|||
|
Expenses: |
|
|
|
|
|
|
|
|
|
|
|
|
|
Management fees |
|
$ |
3,129,079 |
|
|
$ |
— |
|
|
$ |
— |
|
|
Performance-based incentive fees |
|
|
— |
|
|
|
— |
|
|
|
— |
|
|
Interest and amortization of debt issuance costs |
|
|
8,261,445 |
|
|
|
7,403,436 |
|
|
|
7,661,407 |
|
|
Compensation |
|
|
3,688,578 |
|
|
|
4,012,743 |
|
|
|
4,571,309 |
|
|
Professional fees |
|
|
3,466,877 |
|
|
|
3,470,269 |
|
|
|
2,942,059 |
|
|
Insurance |
|
|
704,592 |
|
|
|
321,268 |
|
|
|
347,175 |
|
|
Administrative services expense |
|
|
1,243,587 |
|
|
|
— |
|
|
|
— |
|
|
Other general and administrative expenses |
|
|
1,496,258 |
|
|
|
1,874,600 |
|
|
|
1,722,618 |
|
|
Lease termination costs |
|
|
1,431,030 |
|
|
|
— |
|
|
|
— |
|
|
Total expenses |
|
|
23,421,446 |
|
|
|
17,082,316 |
|
|
|
17,244,568 |
|
|
Management and performance-based incentive fees waived |
|
|
— |
|
|
|
— |
|
|
|
— |
|
|
Net Expenses |
|
$ |
23,421,446 |
|
|
$ |
17,082,316 |
|
|
$ |
17,244,568 |
|
Through March 31, 2019 we were internally managed, and directly incurred the cost of management and operations. As a result, we paid no investment management fees or other fees to an external advisor. Our expenses consisted primarily of interest expense on outstanding borrowings, compensation expense and general and administrative expenses, including professional fees. Interest and compensation expense were typically our largest expenses each period. Since the Closing of the Externalization, we have been externally managed and no longer have any employees. However, in connection with the Advisory Agreement, we pay the Adviser certain investment advisory fees and reimburse the Adviser and Administrator for certain expenses incurred in connection with the services they provide. We bear our allocable portion of the compensation paid by the Adviser (or its affiliates) to our chief compliance officer and chief financial officer and their respective staffs (based on a percentage of time such individuals devote, on an estimated basis, to our business affairs). We also bear all other costs and expenses of our operations, administration and transactions, including, but not limited to (i) investment advisory fees, including management fees and incentive fees, to the Adviser, pursuant to the Advisory Agreement; (ii) our allocable portion of overhead and other expenses incurred by the Adviser (or its affiliates) in performing its administrative obligations under the Advisory Agreement, and (iii) all other expenses of our operations and transactions including, without limitation, those relating to:
|
|
• |
the cost of calculating our net asset value, including the cost of any third-party valuation services; |
|
|
• |
the cost of effecting any sales and repurchases of our common stock and other securities; |
|
|
• |
fees and expenses payable under any dealer manager or placement agent agreements, if any; |
|
|
• |
administration fees payable under the Administration Agreement and any sub-administration agreements, including related expenses; |
|
|
• |
debt service and other costs of borrowings or other financing arrangements; |
|
|
• |
costs of hedging; |
56
|
|
• |
transfer agent and custodial fees; |
|
|
• |
fees and expenses associated with marketing efforts; |
|
|
• |
federal and state registration fees, any stock exchange listing fees and fees payable to rating agencies; |
|
|
• |
federal, state and local taxes; |
|
|
• |
independent directors’ fees and expenses including certain travel expenses; |
|
|
• |
costs of preparing financial statements and maintaining books and records and filing reports or other documents with the SEC (or other regulatory bodies) and other reporting and compliance costs, including registration and listing fees, and the compensation of professionals responsible for the preparation of the foregoing; |
|
|
• |
the costs of any reports, proxy statements or other notices to stockholders (including printing and mailing costs), the costs of any stockholder or director meetings and the compensation of personnel responsible for the preparation of the foregoing and related matters; |
|
|
• |
commissions and other compensation payable to brokers or dealers; |
|
|
• |
research and market data; |
|
|
• |
fidelity bond, directors and officers errors and omissions liability insurance and other insurance premiums; |
|
|
• |
direct costs and expenses of administration, including printing, mailing, long distance telephone and staff; |
|
|
• |
fees and expenses associated with independent audits, outside legal and consulting costs; |
|
|
• |
costs of winding up our affairs; |
|
|
• |
costs incurred by either the Administrator or us in connection with administering our business, including payments under the Administration Agreement; |
|
|
• |
extraordinary expenses (such as litigation or indemnification); and |
|
|
• |
costs associated with reporting and compliance obligations under the 1940 Act and applicable federal and state securities laws. |
Management Fees and Incentive Fees. Management fees for the year ended December 31, 2019 were approximately $3.1 million. There were no incentive fees earned during the year 2019. See “The Externalization” above.
Interest and Amortization of Debt Issuance Costs. Interest expense is dependent on the average outstanding balance on our borrowings and the base index rate for the period. Debt issuance costs represent fees and other direct costs incurred in connection with our borrowings. These amounts are capitalized and amortized over the expected term of the borrowing.
Compensation Expense. Prior to the Closing of the Externalization on April 1, 2019, compensation expense included base salaries, bonuses, stock compensation, employee benefits and employer-related payroll costs. The largest components of total compensation costs are base salaries and bonuses; generally, base salaries are expensed as incurred and annual bonus expenses are estimated and accrued. Our compensation arrangements with our employees contained a profit sharing and/or performance-based bonus component. Following the Closing, we no longer have any employees and therefore do not have any related expenses.
Professional Fees and General and Administrative Expenses. The balance of our expenses includes professional fees (primarily legal, accounting, director fees, valuation and other professional services), insurance costs, Administrative services expense under the Administration Agreement and general administrative and other costs.
Total expenses for the years ended December 31, 2019, 2018 and 2017 were approximately $23.4 million, $17.1 million and $17.2 million, respectively. For the year ended December 31, 2019, we incurred approximately $3.4 million in total expenses in connection with the Externalization and approximately $1.4 million related to the termination of the lease of office space formerly occupied by the Company prior to the Externalization. The impairment charge related to our write down of our lease right-of-use asset is recorded as a separate line item within the expense section of the consolidated statement of operations. For the years ended December 31, 2019, 2018 and 2017, interest expense and amortization on debt issuance costs for the period was approximately $8.3 million, $7.4 million and $7.7 million, respectively, on average debt outstanding of $132 million and $106 million, respectively.
For the years ended December 31, 2019, 2018 and 2017, approximately $3.7 million, $4.0 million and $4.6 million of expenses were attributable to compensation of former employees, including salaries, bonuses, employee benefits, payroll taxes and stock-based
57
compensation expense, respectively. For the year ended December 31, 2019, we incurred approximately $2.2 million in compensation expense (primarily severance) in connection with the Externalization.
For the years ended December 31, 2019, 2018 and 2017, professional fees and insurance expenses totaled approximately $4.2 million, $3.8 million and $3.3 million, respectively. For the year ended December 31, 2019, we incurred approximately $1.0 million of professional fees in connection with the Externalization. For the year ended December 31, 2019, administrative services expense was approximately $1.2 million. Other general and administrative expenses, which includes rent expense on our former lease obligation, technology and other office and administrative expenses, totaled approximately $1.5 million, $1.9 million and $1.7 million for the years ended December 31, 2019, 2018 and 2017, respectively. For the year ended December 31, 2019, we incurred approximately $187,000 in administrative costs in connection with the Externalization.
Net Investment Income and Net Realized Gains (Losses)
Net investment income and net realized gains (losses) represents the change in stockholder’s equity before net unrealized appreciation or depreciation on investments. For the year ended December 31, 2019, net investment income and net realized losses were approximately ($12.5) million, or ($0.33) per share. For the year ended December 31, 2018, net investment income and net realized gains were approximately ($6.5) million, or ($0.17) per share. For the year ended December 31, 2017, net investment income and net realized gains were approximately $4.1 million, or $0.11 per share. Net investment income represents the income earned on our investments less operating and interest expense before net realized gains or losses and unrealized appreciation or depreciation on investments.
Investments are carried at fair value, with changes in fair value recorded as unrealized appreciation (depreciation) in the statement of operations. When an investment is sold or liquidated, any previously recognized unrealized appreciation/depreciation is reversed and a corresponding amount is recognized as realized gain (loss). For the year ended December 31, 2019, GAAP-basis net investment income was approximately $3.1 million or $0.08 per share, while tax-basis distributable income was approximately $0.5 million or $0.01 per share. For the year ended December 31, 2018, GAAP-basis net investment income was approximately $10.0 million or $0.27 per basic share, while tax-basis distributable income was approximately $9.2 million or $0.25 per share.
Net Unrealized (Depreciation) Appreciation on Investments
|
|
|
For the Years Ended December 31, |
|
|||||||||
|
|
2019 |
|
|
2018 |
|
|
2017 |
|
||||
|
Unrealized Gains (Losses) On Investments: |
|
|
|
|
|
|
|
|
|
|
|
|
|
Net change in unrealized appreciation (depreciation) on: |
|
|
|
|
|
|
|
|
|
|
|
|
|
Debt securities |
|
$ |
6,519,282 |
|
|
$ |
(7,420,747 |
) |
|
$ |
4,194,914 |
|
|
Equity securities |
|
|
(4,856,831 |
) |
|
|
(1,283,420 |
) |
|
|
(823,671 |
) |
|
CLO Fund Securities managed by affiliates |
|
|
(6,875,007 |
) |
|
|
17,790,480 |
|
|
|
2,102,279 |
|
|
CLO Fund Securities managed by non-affiliates |
|
|
3,380,119 |
|
|
|
(8,285,747 |
) |
|
|
(85,671 |
) |
|
Asset Manager Affiliates investments |
|
|
— |
|
|
|
(579,000 |
) |
|
|
1,401,000 |
|
|
Joint Venture Investments |
|
|
3,017,847 |
|
|
|
(3,125,560 |
) |
|
|
(3,398,858 |
) |
|
Derivatives |
|
|
(64,046 |
) |
|
|
— |
|
|
|
— |
|
|
Total net unrealized gain (loss) from investment transactions |
|
$ |
1,121,364 |
|
|
$ |
(2,903,994 |
) |
|
$ |
3,389,993 |
|
During the year ended December 31, 2019, our total investments had net unrealized appreciation of approximately $1.1 million. Included in the net unrealized appreciation for the year ended December 31, 2019, are unrealized depreciation on CLO Fund Securities of approximately $3.5 million, net unrealized depreciation on equity securities of approximately $4.9 million, no unrealized on the Asset Manager Affiliates, as well as unrealized appreciation of $3.0 million on our Joint Venture investments and unrealized appreciation on our debt securities of approximately $6.5 million, including approximately $6.4 million of purchase discount related to assets acquired in the OHAI transaction. During the year ended December 31, 2018, our total investments had net unrealized depreciation of approximately $2.9 million. Included in the net unrealized depreciation are unrealized appreciation on CLO Fund Securities of approximately $9.5 million unrealized depreciation and on equity securities of approximately $1.3 million, as well as unrealized depreciation of the Asset Manager Affiliates of $0.6 million, an unrealized depreciation of $3.1 million on our Joint Ventures investment and unrealized depreciation on our debt securities of $7.4 million. During the year ended December 31, 2017, our total investments had net unrealized appreciation of approximately $3.4 million, including net unrealized gains of approximately $2.0 million on CLO Fund Securities and unrealized appreciation of the Asset Manager Affiliates of approximately $1.4 million, net unrealized appreciation on the Debt Securities Portfolio of approximately $4.2 million and net unrealized losses on equity securities of $0.8 million.
58
Net Change in Stockholder’s Equity Resulting from Operations
The net decrease in stockholders’ equity resulting from operations for the year ended December 31, 2019 was approximately ($12.5) million, or $(0.33) per basic share. Net decrease in stockholders’ equity resulting from operations for the year ended December 31, 2018 was approximately ($9.6) million, or $(0.26) per share. Net increase in stockholders’ equity resulting from operations for the year ended December 31, 2017 was approximately $3.4 million, or $0.09 per basic share.
FINANCIAL CONDITION, LIQUIDITY, AND CAPITAL RESOURCES
Liquidity is a measure of our ability to meet potential cash requirements, including ongoing commitments to repay borrowings, fund and maintain investments, pay distributions to our stockholders and other general business needs. We recognize the need to have funds available for operating our business and to make investments. We seek to have adequate liquidity at all times to cover normal cyclical swings in funding availability and to allow us to meet irregular and unexpected funding requirements. We plan to satisfy our liquidity needs through normal operations with the goal of avoiding unplanned sales of assets or emergency borrowing of funds.
As of December 31, 2019 and December 31, 2018 the fair value of investments and cash were as follows:
|
|
|
Investments at Fair Value |
|
|||||
|
Security Type |
|
December 31, 2019 |
|
|
December 31, 2018 |
|
||
|
Cash |
|
$ |
136,864 |
|
|
$ |
5,417,125 |
|
|
Restricted Cash |
|
|
4,967,491 |
|
|
|
3,907,341 |
|
|
Short-term investments |
|
|
4,207,107 |
|
|
|
44,756,478 |
|
|
Senior Secured Loan |
|
|
88,788,639 |
|
|
|
77,616,209 |
|
|
Junior Secured Loan |
|
|
95,188,373 |
|
|
|
70,245,535 |
|
|
Subordinated Note |
|
|
2,422,281 |
|
|
|
— |
|
|
Senior Unsecured Bond |
|
|
403,615 |
|
|
|
— |
|
|
CLO Fund Securities |
|
|
31,968,202 |
|
|
|
44,325,000 |
|
|
Equity Securities |
|
|
9,864,419 |
|
|
|
2,038,020 |
|
|
Joint Ventures |
|
|
45,087,967 |
|
|
|
30,857,107 |
|
|
Derivatives |
|
|
(33,437 |
) |
|
|
— |
|
|
Asset Manager Affiliates |
|
|
— |
|
|
|
3,470,000 |
|
|
Total |
|
$ |
283,001,520 |
|
|
$ |
282,632,815 |
|
Subject to prevailing market conditions, we intend to grow our portfolio of assets by raising additional capital, including through the prudent use of leverage available to us. However, we may face difficulty in obtaining a new debt and equity financing as a result of current market conditions. In this regard, because our common stock has traded at a price below our current net asset value per share and we are limited in our ability to sell our common stock at a price below net asset value per share without stockholder approval (which we currently do not have), we have been and may continue to be limited in our ability to raise equity capital. See “Business – Regulation – Common Stock”. From time to time, we may seek to retire, repurchase, or exchange debt securities in open market purchases or by other means dependent on market conditions, liquidity, contractual obligations, and other matters. We also may repurchase our common stock and our Board has provided authorization to do so. See “Item 5. Market for Registrant’s Common Equity, Related Stockholder Matters and Issuer Purchases of Equity Securities – Issuer Purchases of Equity Securities.” In addition, we evaluate strategic opportunities available to us, including mergers, divestures, spin-offs, joint ventures and other similar transactions from time to time.
Borrowings
We use borrowed funds, known as “leverage,” to make investments and to attempt to increase returns to our shareholders by reducing our overall cost of capital. As a BDC, we are limited in the amount of leverage we can incur under the 1940 Act. We are only allowed to borrow amounts such that our asset coverage, as defined in the 1940 Act, equals at least 150% after such borrowing. As of December 31, 2019, we had approximately $157.0 million of par value of outstanding borrowings and our asset coverage ratio of total assets to total borrowings was 195%, compliant with the minimum asset coverage level of 150% generally required for a BDC by the 1940 Act. We may also borrow amounts of up to 5% of the value of our total assets for temporary purposes.
The Small Business Credit Availability Act (the “SBCA”) has modified the 1940 Act by allowing a BDC to increase the maximum amount of leverage it may incur from an asset coverage ratio of 200% to an asset coverage ratio of 150%, if certain requirements are met. On March 29, 2018, the Board , including a “required majority” (as such term is defined in Section 57(o) of the 1940 Act) of its Board, approved the modified asset coverage requirements set forth in Section 61(a)(2) of the 1940 Act, as amended by the SBCA. As a result, our asset coverage requirements for senior securities changed from 200% to 150%, effective as of March 29, 2019. However, we continue to be prohibited by the indenture governing our Notes from making distributions on our common stock if our asset coverage, as defined in the 1940 Act, falls below 200%, as further described below.
We expect to maintain adequate liquidity and compliance with regulatory and contractual asset coverage requirements.
59
During the third quarter of 2017, we issued $77.4 million aggregate principal amount of our Notes. The net proceeds for the 6.125% Notes Due 2022, after the payment of underwriting expenses, were approximately $74.6 million. Interest on the 6.125% Notes Due 2022 is paid quarterly in arrears on March 30, June 30, September 30 and December 30, at a rate of 6.125% commencing September 30, 2017. The 6.125% Notes Due 2022 mature on September 30, 2022 and are senior unsecured obligations. In addition, due to the asset coverage requirement currently applicable to us as a BDC and a covenant that we agreed to in connection with the issuance of the 6.125% Notes Due 2022, we are limited in our ability to make distributions if its asset coverage, as defined in the 1940 Act, is below 200% at the time of the declaration of the distribution. As a result, despite the SBCA, we will continue to be prohibited by the indenture governing the 6.125% Notes Due 2022 from making distributions on its common stock if its asset coverage, as defined in the 1940 Act, falls below 200%. At December 31, 2019, we were in compliance with all of our debt covenants. The indenture governing the 6.125% Notes Due 2022 contains certain restrictive covenants, including compliance with certain provisions of the 1940 Act relating to borrowing and dividends.
Revolving Credit Facilities
On March 1, 2018, Great Lakes KCAP Funding I, LLC (“Funding”), our wholly owned subsidiary, entered into a senior secured revolving credit facility (the “Prior Revolving Credit Facility”) with certain institutional lenders, State Bank and Trust Company, as the administrative agent, lead arranger and bookrunner, CIBC Bank USA, as documentation agent and us, as the servicer. The maximum commitment amount of the Prior Revolving Credit Facility was increased on March 27, 2019 to $57.5 million, and on April 1, 2019 to $67.5 million, subject to availability under the borrowing base. The Prior Revolving Credit Facility was fully repaid and the related agreements, including security interests in assets pledged as collateral, were terminated on December 23, 2019. Borrowings under the Prior Revolving Credit Facility bore interest at a rate per annum equal to (i) in the case of LIBOR rate loans, an adjusted LIBOR rate for the applicable interest period plus 3.25% or (ii) in the case of base rate loans, the prime rate plus 3.25%. Funding will pay a fee on any undrawn amounts of 0.375% per annum; provided that if 50% or less of the Prior Revolving Credit Facility is drawn, the fee will be 0.50% per annum.
Great Lakes Portman Ridge Funding LLC
On December 18, 2019, Great Lakes Portman Ridge Funding LLC (“GLPRF LLC”), a wholly-owned subsidiary of the Company, entered into a senior secured revolving credit facility (the “Revolving Credit Facility”) with JPMorgan Chase Bank, National Association (“JPM”). JPM serves as administrative agent, U.S. Bank National Association serves as collateral agent, securities intermediary and collateral administrator, and the Company serves as portfolio manager under the Revolving Credit Facility.
Advances under the Revolving Credit Facility bear interest at a per annum rate equal to the three-month LIBOR in effect, plus the applicable margin of 2.85% per annum. GLPRF LLC is required to utilize a minimum of 80% of the commitments under the Revolving Credit Facility, after an initial six-month ramp-up period during which a lesser minimum utilization requirement applies. Unused amounts below such minimum utilization amount accrue interest as if such amounts are outstanding as borrowings under the Revolving Credit Facility. In addition, GLPRF LLC will pay a non-usage fee during the first three years after the closing date in an amount not to exceed 0.50% per annum on the average daily unborrowed portion of the financing commitments in excess of such minimum utilization amount.
The initial principal amount of the Revolving Credit Facility is $115 million. The Revolving Credit Facility has an accordion feature, subject to the satisfaction of various conditions, which could bring total commitments under the Revolving Credit Facility to up to $215 million. Proceeds from borrowings under the Revolving Credit Facility may be used to fund portfolio investments by GLPRF LLC and to make advances under delayed draw term loans where GLPRF LLC is a lender. All amounts outstanding under the Revolving Credit Facility must be repaid by the maturity date of December 18, 2023.
GLPRF LLC’s obligations to the lenders under the Revolving Credit Facility are secured by a first priority security interest in all of SPV’s portfolio of investments and cash. The obligations of GLPRF LLC under the Revolving Credit Facility are non-recourse to the Company, and the Company’s exposure under the Revolving Credit Facility is limited to the value of the Company’s investment in GLPRF LLC.
In connection with the Revolving Credit Facility, GLPRF LLC has made certain customary representations and warranties and is required to comply with various covenants, reporting requirements and other customary requirements for similar facilities. The Revolving Credit Facility contains customary events of default for similar financing transactions, including if a change of control of GLPRF LLC occurs or if the Company is no longer the portfolio manager of GLPRF LLC. Upon the occurrence and during the continuation of an event of default, JPM may declare the outstanding advances and all other obligations under the Revolving Credit Facility immediately due and payable.
The occurrence of an event of default (as described above) or a market value event (as defined in the Revolving Credit Facility) triggers a requirement that GLPRF LLC obtain the consent of JPM prior to entering into certain sales or dispositions with respect to portfolio assets, and the occurrence of a market value event triggers the right of JPM to direct GLPRF LLC to enter into sales or dispositions with respect to any portfolio assets, in each case in JPM’s sole discretion.
At December 31, 2019, GLPRF LLC was in compliance with all of its debt covenants and $79.6 million principal amount of borrowings was outstanding under the Revolving Credit Facility.
60
We intend to continue to make quarterly distributions to our stockholders. To avoid certain excise taxes imposed on RICs, we generally endeavor to distribute during each calendar year an amount at least equal to the sum of:
|
|
• |
98% of our ordinary net taxable income for the calendar year; |
|
|
• |
98.2% of our capital gains, if any, in excess of capital losses for the one-year period ending on October 31 of the calendar year; and |
|
|
• |
any net ordinary income and net capital gains for the preceding year that were not distributed during such year and on which we do not pay corporate tax. |
We may choose to carry forward taxable income in excess of current year distributions into the next tax year and pay a 4% excise tax on such income, to the extent required.
The amount of our declared distributions, as evaluated by management and approved by our Board, is based primarily on our evaluation of our net investment income and distributable taxable income.
As described above, we are prohibited by the indentures governing our Notes from making distributions on our common stock if, at the time of declaration, our asset coverage, as defined in the 1940 Act, is below 200%. In any such event, we would be prohibited from making distributions required in order to maintain our status as a RIC.
The following table sets forth the quarterly distributions paid by us since 2017.
|
|
Distribution |
|
|
Declaration Date |
|
Record Date |
|
Pay Date |
||
|
2019: |
|
|
|
|
|
|
|
|
|
|
|
Fourth quarter |
|
$ |
0.06 |
|
|
11/5/2019 |
|
11/15/2019 |
|
11/29/2019 |
|
Third quarter |
|
|
0.06 |
|
|
8/5/2019 |
|
8/12/2019 |
|
8/29/2019 |
|
Second quarter |
|
|
0.10 |
|
|
3/20/2019 |
|
4/5/2019 |
|
4/26/2019 |
|
First quarter |
|
|
0.10 |
|
|
12/12/2018 |
1 |
1/7/2019 |
|
1/31/2019 |
|
Total declared in 2019 |
|
$ |
0.32 |
|
|
|
|
|
|
|
|
2018: |
|
|
|
|
|
|
|
|
|
|
|
Fourth quarter |
|
$ |
0.10 |
|
|
9/18/2018 |
|
10/9/2018 |
|
10/29/2018 |
|
Third quarter |
|
|
0.10 |
|
|
6/19/2018 |
|
7/6/2018 |
|
7/27/2018 |
|
Second quarter |
|
|
0.10 |
|
|
3/20/2018 |
|
4/6/2018 |
|
4/27/2018 |
|
First quarter |
|
|
0.10 |
|
|
12/13/2017 |
1 |
1/5/2018 |
|
1/25/2018 |
|
Total declared in 2018 |
|
$ |
0.40 |
|
|
|
|
|
|
|
|
2017: |
|
|
|
|
|
|
|
|
|
|
|
Fourth quarter |
|
$ |
0.10 |
|
|
9/22/2017 |
|
10/10/2017 |
|
10/26/2017 |
|
Third quarter |
|
|
0.12 |
|
|
6/20/2017 |
|
7/7/2017 |
|
7/27/2017 |
|
Second quarter |
|
|
0.12 |
|
|
3/21/2017 |
|
4/7/2017 |
|
4/28/2017 |
|
First quarter |
|
|
0.12 |
|
|
12/14/2016 |
1 |
1/6/2017 |
|
1/27/2017 |
|
Total declared in 2017 |
|
$ |
0.46 |
|
|
|
|
|
|
|
|
(1) |
Since the record date of this distribution is subsequent to year-end, it is a subsequent year tax event. |
61
OFF-BALANCE SHEET ARRANGEMENTS
From time-to-time we are a party to financial instruments with off-balance sheet risk in the normal course of business in order to meet the needs of our investment in portfolio companies. Such instruments include commitments to extend credit and may involve, in varying degrees, elements of credit risk in excess of amounts recognized on our balance sheet. Prior to extending such credit, we attempt to limit our credit risk by conducting extensive due diligence, obtaining collateral where necessary and negotiating appropriate financial covenants. As of December 31, 2019 and December 31, 2018, the Company had approximately $31.9 million and $12.9 million in commitments to fund investments, respectively. We may also enter into derivative contracts with off-balance sheet risk in connection with our investing activities.
CONTRACTUAL OBLIGATIONS
The following table summarizes our contractual cash obligations and other commercial commitments as of December 31, 2019:
|
|
Payments Due by Period |
|
||||||||||||||||||
|
Contractual Obligations |
|
Total |
|
|
Less than one year |
|
|
1 - 3 years |
|
|
3 - 5 years |
|
|
More than 5 years |
|
|||||
|
Long-term debt obligations |
|
$ |
156,978,099 |
|
|
$ |
— |
|
|
$ |
77,407,200 |
|
|
$ |
79,570,899 |
|
|
$ |
— |
|
CRITICAL ACCOUNTING POLICIES
The consolidated financial statements are based on the selection and application of critical accounting policies, which require management to make significant estimates and assumptions. Critical accounting policies are those that are both important to the presentation of our financial condition and results of operations and require management’s most difficult, complex, or subjective judgments. Our critical accounting policies are those applicable to the basis of presentation, valuation of investments, and certain revenue recognition matters as discussed below. See Note 2 to our consolidated financial statements, “Significant Accounting Policies — Investments”, contained elsewhere herein:
Valuation of Portfolio Investments
The most significant estimate inherent in the preparation of our consolidated financial statements is the valuation of investments and the related amounts of unrealized appreciation and depreciation of investments recorded.
Value, as defined in Section 2(a)(41) of 1940 Act, is (1) the market price for those securities for which a market quotation is readily available and (2) for all other securities and assets, fair value as determined in good faith by our Board pursuant to procedures approved by our Board. Our valuation policy is intended to provide a consistent basis for determining the fair value of the portfolio based on the nature of the security, the market for the security and other considerations including the financial performance and enterprise value of the portfolio company. Because of the inherent uncertainty of valuation, the Board determined values may differ significantly from the values that would have been used had a ready market existed for the investments, and the differences could be material.
Pursuant to ASC 946: Financial Services — Investment Companies (“ASC 946”), we reflect our investments on our balance sheet at their determined fair value with unrealized gains and losses resulting from changes in fair value reflected as a component of unrealized gains or losses on our statements of operations. Fair value is the amount that would be received to sell the investments in an orderly transaction between market participants at the measurement date (i.e., the exit price).
See Note 4 to the consolidated financial statements for the additional information about the level of market observability associated with investments carried at fair value.
We follow the provisions of ASC 820: Fair Value Measurements and Disclosures (“ASC 820: Fair Value”), which among other matters, requires enhanced disclosures about investments that are measured and reported at fair value. This standard defines fair value and establishes a hierarchal disclosure framework which prioritizes and ranks the level of market price observability used in measuring investments at fair value and expands disclosures about assets and liabilities measured at fair value. ASC 820: Fair Value defines “fair value” as the price that would be received to sell an asset or paid to transfer a liability in an orderly transaction between market participants at the measurement date. This fair value definition focuses on an exit price in the principle, or most advantageous market, and prioritizes, within a measurement of fair value, the use of market-based inputs (which may be weighted or adjusted for relevance, reliability and specific attributes relative to the subject investment) over entity-specific inputs. Market price observability is affected by a number of factors, including the type of investment and the characteristics specific to the investment. Investments with readily available active quoted prices or for which fair value can be measured from actively quoted prices generally will have a higher degree of market price observability and a lesser degree of judgment used in measuring fair value. Subsequent to the adoption of ASC 820: Fair Value, the FASB has issued various staff positions clarifying the initial standard (see Note 2 to the consolidated financial statements: “Significant Accounting Policies — Investments”).
62
ASC 820: Fair Value establishes the following three-level hierarchy, based upon the transparency of inputs to the fair value measurement of an asset or liability as of the measurement date:
Level I — Unadjusted quoted prices are available in active markets for identical investments as of the reporting date. The type of investments included in Level I include listed equities and listed securities. As required by ASC 820: Fair Value, we do not adjust the quoted price for these investments, even in situations where the Company holds a large position and a sale could reasonably affect the quoted price.
Level II — Pricing inputs are other than quoted prices in active markets, which are either directly or indirectly observable as of the reporting date. Such inputs may be quoted prices for similar assets or liabilities, quoted markets that are not active, or other inputs that are observable or can be corroborated by observable market data for substantially the full character of the financial instrument, or inputs that are derived principally from, or corroborated by, observable market information. Investments which are generally included in this category include illiquid debt securities and less liquid, privately held or restricted equity securities, for which some level of recent trading activity has been observed.
Level III — Pricing inputs are unobservable for the investment and includes situations where there is little, if any, market activity for the investment. The inputs may be based on our own assumptions about how market participants would price the asset or liability or may use Level II inputs, as adjusted, to reflect specific investment attributes relative to a broader market assumption. These inputs into the determination of fair value may require significant management judgment or estimation. Even if observable market data for comparable performance or valuation measures (earnings multiples, discount rates, other financial/valuation ratios, etc.) are available, such investments are grouped as Level III if any significant data point that is not also market observable (private company earnings, cash flows, etc.) is used in the valuation methodology.
In certain cases, the inputs used to measure fair value may fall into different levels of the fair value hierarchy. In such cases, an investment’s level within the fair value hierarchy is based on the lowest level of input that is significant to the fair value measurement. We assess of the significance of a particular input to the fair value measurement in its entirety requires judgment, and we consider factors specific to the investment. The majority of our investments are classified as Level III. We evaluate the source of inputs, including any markets in which its investments are trading, in determining fair value. Inputs that are backed by actual transactions, those that are highly correlated to the specific investment being valued and those derived from reliable or knowledgeable sources will tend to have a higher weighting in determining fair value. Our fair value determinations may include factors such as an assessment of each underlying investment, its current and prospective operating and financial performance, consideration of financing and sale transactions with third parties, expected cash flows and market-based information, including comparable transactions, performance factors, and other investment or industry specific market data, among other factors.
We have valued our investments, in the absence of observable market prices, using the valuation methodologies described below applied on a consistent basis. For some investments little market activity may exist; management’s determination of fair value is then based on the best information available in the circumstances, and may incorporate management’s own assumptions and involves a significant degree of management’s judgment.
Our investments in CLO Fund Securities are carried at fair value, which is based either on (i) the present value of the net expected cash inflows for interest income and principal repayments from underlying assets and the cash outflows for interest expense, debt paydown and other fund costs for the CLO Funds which are approaching or past the end of their reinvestment period and therefore are selling assets and/or using principal repayments to pay-down CLO Fund debt, and for which there continue to be net cash distributions to the class of securities we own, or (ii) a discounted cash flow model that utilizes prepayment and loss assumptions based on historical experience and projected performance, economic factors, the characteristics of the underlying cash flow and comparable yields for similar securities or preferred shares to those in which we have invested, or (iii) indicative prices provided by the underwriters or brokers who arrange CLO Funds. We recognize unrealized appreciation or depreciation on our investments in CLO Fund Securities as comparable yields in the market change and/or based on changes in net asset values or estimated cash flows resulting from changes in prepayment or loss assumptions in the underlying collateral pool. As each investment in CLO Fund Securities ages, the expected amount of losses and the expected timing of recognition of such losses in the underlying collateral pool are updated and the revised cash flows are used in determining the fair value of the CLO Fund Securities. We determine the fair value of our investments in CLO Fund Securities on a security-by-security basis.
Our investments in its wholly-owned Asset Manager Affiliates are carried at fair value, which is primarily determined utilizing a discounted cash flow model which incorporates different levels of discount rates depending on the hierarchy of fees earned (including the likelihood of realization of senior, subordinate and incentive fees) and prospective modeled performance (“Discounted Cash Flow”). Such valuation takes into consideration an analysis of comparable asset management companies and a percentage of assets under management. The Asset Manager Affiliates are classified as a Level III investment (as described above). Any change in value from period to period is recognized as net change in unrealized appreciation or depreciation.
We carry investments in joint ventures at fair value based upon the fair value of the investments held by the joint venture.
63
Fair values of other investments for which market prices are not observable are determined by reference to public market or private transactions or valuations for comparable companies or assets in the relevant asset class and/or industry when such amounts are available. Generally, these valuations are derived by multiplying a key performance metric of the investee company or asset (e.g., EBITDA) by the relevant valuation multiple observed for comparable companies or transactions, adjusted by management for differences between the investment and the referenced comparable. Such investments may also be valued at cost for a period of time after an acquisition as the best indicator of fair value. If the fair value of such investments cannot be valued by reference to observable valuation measures for comparable companies, then the primary analytical method used to estimate the fair value is a discounted cash flow method and/or cap rate analysis. A sensitivity analysis is applied to the estimated future cash flows using various factors depending on the investment, including assumed growth rates (in cash flows), capitalization rates (for determining terminal values) and appropriate discount rates to determine a range of reasonable values or to compute projected return on investment.
For bond rated note tranches of CLO Fund securities (those above the junior class) without transactions to support a fair value for the specific CLO Fund and tranche, fair value is based on discounting estimated bond payments at current market yields, which may reflect the adjusted yield on the leveraged loan index for similarly rated tranches, as well as prices for similar tranches for other CLO Funds and also other factors such as indicative prices provided by underwriters or brokers who arrange CLO Funds, and the default and recovery rates of underlying assets in the CLO Fund, as may be applicable. Such model assumptions may vary and incorporate adjustments for risk premiums and CLO Fund specific attributes.
We derive fair value for our illiquid loan investments that do not have indicative fair values based upon active trades primarily by using the Income Approach, and also consider recent loan amendments or other activity specific to the subject asset as described above. Other significant assumptions, such as coupon and maturity, are asset-specific and are noted for each investment in the Schedules of Investments.
The determination of fair value using this methodology takes into consideration a range of factors, including but not limited to the price at which the investment was acquired, the nature of the investment, local market conditions, trading values on public exchanges for comparable securities, current and projected operating performance and financing transactions subsequent to the acquisition of the investment. This valuation methodology involves a significant degree of our judgment.
Our Board may consider other methods of valuation to determine the fair value of investments as appropriate in conformity with GAAP.
Interest Income
Interest income, including amortization of premium and accretion of discount and accrual of payment-in-kind (“PIK”) interest, is recorded on the accrual basis to the extent that such amounts are expected to be collected. We generally place a loan on non-accrual status and cease recognizing interest income on such loan or security when a loan or security becomes 90 days or more past due or if we otherwise do not expect the debtor to be able to service its debt obligations. For investments with PIK interest, which represents contractual interest accrued and added to the principal balance that generally becomes due at maturity, we will not accrue PIK interest if the portfolio company valuation indicates that the PIK interest is not collectible (i.e. via a partial or full non-accrual). Loans which are on partial or full non-accrual remain in such status until the borrower has demonstrated the ability and intent to pay contractual amounts due or such loans become current. As of December 31, 2019, seven of our debt investments were on non-accrual status.
Investment Income on CLO Fund Securities
We receive distributions from our investments in the most junior class of securities of CLO Funds (typically preferred shares or subordinated securities). Our CLO Fund junior class securities are subordinated to senior note holders who typically receive a return on their investment at a fixed spread relative to the LIBOR index. The CLO Funds are leveraged funds and any excess cash flow or “excess spread” (interest earned by the underlying securities in the fund less payments made to senior note holders and less fund expenses and management fees) is paid to the holders of the CLO Fund’s subordinated securities or preferred shares. The level of excess spread from CLO Fund Securities can be impacted from the timing and level of the resetting of the benchmark interest rate for the underlying assets (which reset at various times throughout the quarter) in the CLO Fund and the related CLO Fund note liabilities (which reset at each quarterly distribution date); in periods of short-term and volatile changes in the benchmark interest rate, the levels of excess spread and distributions to us can vary significantly. In addition, the failure of CLO Funds in which we invest to comply with certain financial covenants may lead to the temporary suspension or deferral of cash distributions to us.
GAAP-basis investment income on CLO equity investments is recorded using the effective interest method in accordance with the provisions of ASC 325-40, based on the anticipated yield and the estimated cash flows over the projected life of the investment. Yields are revised when there are changes in actual or estimated projected future cash flows due to changes in prepayments and/or re-investments, credit losses or asset pricing. Changes in estimated yield are recognized as an adjustment to the estimated yield prospectively over the remaining life of the investment from the date the estimated yield was changed. Accordingly, investment income recognized on CLO equity securities in the GAAP statement of operations differs from both the tax-basis investment income and from the cash distributions actually received by us during the period.
64
For non-junior class CLO Fund Securities interest is earned at a fixed spread relative to the LIBOR index.
Distributions from Asset Manager Affiliates
We record distributions from the Asset Manager Affiliates on the declaration date, which represents the ex-dividend date. Distributions in excess of tax-basis earnings and profits are recorded as tax-basis return of capital. For interim periods, we estimate the tax attributes of any distributions as being either from tax-basis earnings and profits (i.e. dividend income) or return of capital (i.e. adjustment to our cost basis in the Asset Manager Affiliates). The final determination of the tax attributes of distributions from our Asset Manager Affiliates is made on an annual (full calendar year) basis at the end of the year based upon taxable income and distributions for the full-year. Therefore, any estimate of tax attributes of distributions made on a quarterly basis may not be representative of the actual tax attributes of distributions for a full year.
Payment in Kind Interest
We may have loans in our portfolio that contain a payment-in-kind (“PIK”) provision. PIK interest, computed at the contractual rate specified in each loan agreement, is added to the principal balance of the loan and recorded as interest income. To maintain our RIC status, this non-cash source of income must be distributed to stockholders in the form of cash dividends, even though we have not yet collected any cash.
Fee Income
Fee income includes fees, if any, for due diligence, structuring, commitment and facility fees, and fees, if any, for transaction services and management services rendered by us to portfolio companies and other third parties. Commitment and facility fees are generally recognized as income over the life of the underlying loan, whereas due diligence, structuring, transaction service and management service fees are generally recognized as income when the services are rendered.
Management Compensation
As a result of the Closing we will no longer issue stock options or restricted stock under the Equity Incentive Plan or the 2008 Non-Employee Director Plan. The 1940 Act does not permit externally managed investment companies and BDCs to issue or have outstanding options or restricted stock granted to directors and employees. Immediately prior to the Closing, by virtue of the Externalization and subject to the execution of an option cancellation agreement, each option to purchase shares of our common stock granted under our 2008 Non-Employee Director Plan that was outstanding immediately prior to the Externalization (each, a “Company Stock Option”) was cancelled in exchange for the payment in cash to the holder thereof.
Immediately prior to the Closing, each restricted share of our (the “Company Restricted Share”) outstanding and not previously forfeited under the Company’s Equity Incentive Plan and the Company’s Non-Employee Director Plan became fully vested, all restrictions with respect to such Company Restricted Shares lapsed, and the holders of such Company Restricted Shares became entitled to receive a pro rata share of the payment due to stockholders in connection with the Externalization.
United States Federal Income Taxes
We have elected to be treated as a RIC and intend to continue to qualify for the tax treatment applicable to RICs under Subchapter M of the Code and, among other things, intend to make the required distributions to our stockholders as specified therein. In order to qualify for tax treatment as a RIC, the Company is required to timely distribute to its stockholders at least 90% of investment company taxable income, as defined by the Code, for each year. Depending on the level of taxable income earned in a tax year, we may choose to carry forward taxable income in excess of current year distributions into the next tax year and pay a 4% excise tax on such income, to the extent required.
Distributions to Shareholders
The amount of our declared distributions, as evaluated by management and approved by our Board, is based primarily on our evaluation of net investment income and distributable taxable income.
Recent Accounting Pronouncements
See Note 2 to the financial statements included in this annual report, for a description of recent accounting pronouncements.
Recent Developments
On February 5, 2020 our Board declared a distribution to shareholders of $0.06 per share for a total of $2.7 million. The record date was February 18, 2020 and the distribution was paid on February 28, 2020.
65
Our business activities contain elements of market risks. We consider our principal market risks to be fluctuations in interest rates and the valuations of our investment portfolio. Managing these risks is essential to our business. Accordingly, we have systems and procedures designed to identify and analyze our risks, to establish appropriate policies and thresholds and to continually monitor these risks and thresholds by means of administrative and information technology systems and other policies and processes.
Interest Rate Risk
Interest rate risk is defined as the sensitivity of our current and future earnings to interest rate volatility, variability of spread relationships, the difference in re-pricing intervals between our assets and liabilities and the effect that interest rates may have on our cash flows. Changes in the general level of interest rates can affect our net interest income, which is the difference between the interest income earned on interest earning assets and our interest expense incurred in connection with our interest bearing debt and liabilities. Changes in interest rates can also affect, among other things, our ability to acquire and originate loans and securities and the value of our investment portfolio.
Our investment income is affected by fluctuations in various interest rates, including LIBOR and prime rates. As of December 31, 2019, approximately 94% of our Debt Securities Portfolio were either floating rate with a spread to an interest rate index such as LIBOR or the prime rate. 82% of these floating rate loans contain LIBOR floors ranging between 1.00% and 1.50%. We generally expect that future portfolio investments will predominately be floating rate investments. As of December 31, 2019, we had approximately $157.0 million (par value) of borrowings outstanding at a current weighted average rate of 5.4%, of which $77.4 million par value had a fixed rate and $79.6 million par value has a floating rate.
Because we borrow money to make investments, our net investment income is dependent upon the difference between our borrowing rate and the rate we earn on the invested proceeds borrowed. In periods of rising or lowering interest rates, the cost of the portion of our debt associated with our 6.125% Notes Due 2022 would remain the same, given that this debt is at a fixed rate, while the interest rate on borrowings under the Revolving Credit Facility would fluctuate with changes in interest rates.
Generally we would expect that an increase in the base rate index for our floating rate investment assets would increase our gross investment income and that a decrease in the base rate index for such assets would decrease our gross investment income (in either case, such increase/decrease may be limited by interest rate floors/minimums for certain investment assets).
We have analyzed the potential impact of changes in interest rates on interest income net of interest expense. Assuming that our balance sheet at December 31, 2019 was to remain constant and no actions were taken to alter the existing interest rate sensitivity, the table below illustrates the impact on net investment income on our Debt Securities Portfolio for various hypothetical increases in interest rates:
|
|
Impact on net investment income from a change in interest rates at: |
|
||||||||||
|
|
|
1% |
|
|
2% |
|
|
3% |
|
|||
|
Increase in interest rate |
|
$ |
1,073,765 |
|
|
$ |
2,043,630 |
|
|
$ |
3,013,496 |
|
|
Decrease in interest rate |
|
$ |
(956,511 |
) |
|
$ |
(789,878 |
) |
|
$ |
(809,503 |
) |
As shown above, net investment income assuming a 1% increase in interest rates would increase by approximately $1.1 million on an annualized basis. If the increase in rates was more significant, such as 2% or 3%, the net effect on net investment income would be an increase of approximately $2.0 million and $3.0 million, respectively.
On an annualized basis, a decrease in interest rates of 1%, 2% and 3% would result in a decrease in net investment income of approximately $1.0 million, $0.8 million and $0.8 million, respectively. The effect on net investment income from declines in interest rates is impacted by interest rate floors on certain of our floating rate investments, as there is no floor on our floating rate debt facility
Although management believes that this measure is indicative of sensitivity to interest rate changes on our Debt Securities Portfolio, it does not adjust for potential changes in credit quality, size and composition of the assets on the balance sheet and other business developments that could affect a net change in assets resulting from operations or net income. Accordingly, no assurances can be given that actual results would not materially differ from the potential outcome simulated by this estimate.
66
We carry our investments at fair value, as determined in good faith by our Board of Directors pursuant to a valuation methodology approved by our Board of Directors. Investments for which market quotations are generally readily available are generally valued at such market quotations. Investments for which there is not a readily available market value are valued at fair value as determined in good faith by our Board of Directors under a valuation policy and consistently applied valuation process. However, due to the inherent uncertainty of determining the fair value of investments that cannot be marked to market, the fair value of our investments may differ materially from the values that would have been used had a ready market existed for such investments. In addition, changes in the market environment and other events that may occur over the life of the investments may cause the value realized on these investments to be different than the valuations that are assigned. The types of factors that we may take into account in fair value pricing of our investments include, as relevant, the nature and realizable value of any collateral, third party valuations, the portfolio company’s ability to make payments and its earnings and discounted cash flow, the markets in which the portfolio company does business, comparison to publicly-traded securities, recent sales of or offers to buy comparable companies, and other relevant factors.
The Company has engaged an independent valuation firm to provide third party valuation consulting services to the Board. Each quarter, the independent valuation firm will perform third party valuations on the Company’s material investments in illiquid securities such that they are reviewed at least once during a trailing 12-month period. These third party valuation estimates were considered as one of the relevant data inputs in the Company’s determination of fair value. The Company intends to continue to engage an independent valuation firm in the future to provide certain valuation services, including the review of certain portfolio assets, as part of the quarterly and annual year-end valuation process.
Our financial statements are annexed to this Annual Report beginning on page F-1.
None
Evaluation of Disclosure Controls and Procedures.
The Company’s management, under the supervision and with the participation of various members of management, including its Chief Executive Officer (“CEO”) and its Chief Financial Officer (“CFO”), has evaluated the effectiveness of its disclosure controls and procedures (as defined in Rule 13a-15(e) or Rule 15d-15(e) of the Securities Exchange Act of 1934, as amended (the “Exchange Act”)) as of the end of the period covered by this report. Based upon that evaluation, the Company’s CEO and CFO have concluded that the Company’s disclosure controls and procedures are effective to ensure that information required to be disclosed by us in reports that we file or submit under the Exchange Acts recorded, processed, summarized, and reported within the time periods specified in the SEC’s rules and forms, and that information required to be disclosed by us in the reports that we file or submit under the Exchange Act is accumulated and communicated to our management, including our CEO and CFO, as appropriate to allow timely decisions regarding required disclosures as of the end of the period covered by this report.
Management’s Report on Internal Control Over Financial Reporting.
General.The Company’s management is responsible for establishing and maintaining adequate internal control over financial reporting as defined in Rules 13a-15(f) of the Exchange Act. The Company’s internal control over financial reporting is designed to provide reasonable assurance regarding the reliability of financial reporting and the preparation of financial statements for external purposes in accordance with generally accepted accounting principles.
Scope of Management’s Report on Internal Control Over Financial Reporting. The Company’s internal control over financial reporting includes those policies and procedures that:
|
|
• |
Pertain to the maintenance of records that in reasonable detail accurately and fairly reflect the transactions and dispositions of the assets of the Company; |
|
|
• |
Provide reasonable assurance that transactions are recorded as necessary to permit preparation of the consolidated financial statements in accordance with generally accepted accounting principles, and that the Company’s receipts and expenditures are being made only in accordance with authorizations of the Company’s management and directors; and |
|
|
• |
Provide reasonable assurance regarding prevention or timely detection of unauthorized acquisition, use or disposition of the Company’s assets that could have a material effect on the Company’s consolidated financial statements. |
Because of its inherent limitations, internal control over financial reporting may not prevent or detect misstatements. Also, projections of any evaluation of effectiveness to future periods are subject to the risk that controls may become inadequate because of changes in conditions, or that the degree of compliance with the policies or procedures may deteriorate.
67
Conclusion.Management, including the Company’s CEO and CFO, assessed the effectiveness of the Company’s internal control over financial reporting as December 31, 2019. In making this assessment, management used the criteria established in the 2013 Internal Control-Integrated Framework issued by the Committee of Sponsoring Organizations of the Treadway Commission (COSO). Based on management’s assessment, management concluded, subject to the limitations described under “Scope of Management’s Report on Internal Control Over Financial Reporting” above, that the Company maintained effective internal control over financial reporting as of December 31, 2019.
Attestation Report of the Independent Registered Public Accounting Firm.
The Company’s independent registered public accounting firm has audited and issued a report on the Company’s internal control over financial reporting, which appears in Item 15 of this report.
Changes in Internal Control Over Financial Reporting.
There have been no changes in our internal control over financial reporting during the fourth quarter of 2019 that have materially affected, or are reasonably likely to materially affect, our internal control over financial reporting.
None.
68
The information required by Item 10 is hereby incorporated by reference from the Company’s definitive Proxy Statement relating to the Company’s 2020 Annual Meeting of Stockholders, to be filed with the Securities and Exchange Commission within 120 days following the end of the Company’s fiscal year.
We have adopted a Sarbanes-Oxley Code of Ethics that applies to directors, officers and employees of the Company. This code of ethics is published on our website at www.portmanridge.com. We intend to disclose any future amendments to, or waivers from, this code of ethics within four business days of the waiver or amendment through a website posting.
The information required by Item 11 is hereby incorporated by reference from the Company’s definitive Proxy Statement relating to the Company’s 2020 Annual Meeting of Stockholders, to be filed with the Securities and Exchange Commission within 120 days following the end of the Company’s fiscal year.
|
Item 12. |
Security Ownership of Certain Beneficial Owners and Management and Related Stockholder Matters |
The information required by Item 12 is hereby incorporated by reference from the Company’s definitive Proxy Statement relating to the Company’s 2020 Annual Meeting of Stockholders, to be filed with the Securities and Exchange Commission within 120 days following the end of the Company’s fiscal year.
The information required by Item 13 is hereby incorporated by reference from the Company’s definitive Proxy Statement relating to the Company’s 2020 Annual Meeting of Stockholders, to be filed with the Securities and Exchange Commission within 120 days following the end of the Company’s fiscal year.
The information required by Item 14 is hereby incorporated by reference from the Company’s definitive Proxy Statement relating to the Company’s 2020 Annual Meeting of Stockholders, to be filed with the Securities and Exchange Commission within 120 days following the end of the Company’s fiscal year.
69
(a) Documents filed as part of this report:
1. For a list of the consolidated financial information included herein, see Index to the Consolidated Financial Statements on page F-1.
2. For a list of the other financial statements and financial statement schedules included herein, see Index to Other Financial Statements and Financial Statement Schedules on page S-1.
3. For a list of other exhibits included herein, see Exhibit List on page E-1.
(b) Exhibits required by Item 601 of Regulation S-K. Reference is made to the Exhibit List filed as a part of this report beginning on page E-1. Each of such exhibits is incorporated by reference herein.
(c) Other financial statements and financial statement schedules. Reference is made to the Index to Other Financial Statements and Financial Statement Schedules on page S-1. Each of such documents is incorporated by reference herein.
70
F-1
REPORT OF INDEPENDENT REGISTERED PUBLIC ACCOUNTING FIRM
To the Stockholders and Board of Directors
Portman Ridge Finance Corporation:
Opinion on the Consolidated Financial Statements
We have audited the accompanying consolidated balance sheet of Portman Ridge Finance Corporation and subsidiaries (the Company), including the consolidated schedule of investments, as of December 31, 2019, the related consolidated statements of operations, changes in net assets, and cash flows for the year ended December 31, 2019, and the related notes (collectively, the consolidated financial statements) and the financial highlights for the year ended December 31, 2019. In our opinion, the consolidated financial statements and financial highlights present fairly, in all material respects, the financial position of the Company as of December 31, 2019, and the results of its operations, changes in its net assets, and its cash flows for the year ended December 31, 2019, and the financial highlights for the year ended December 31, 2019, in conformity with U.S. generally accepted accounting principles.
We also have audited, in accordance with the standards of the Public Company Accounting Oversight Board (United States) (PCAOB), the Company’s internal control over financial reporting as of December 31, 2019, based on criteria established in Internal Control – Integrated Framework (2013) issued by the Committee of Sponsoring Organizations of the Treadway Commission, and our report dated March 6, 2020 expressed an unqualified opinion on the effectiveness of the Company’s internal control over financial reporting.
Basis for Opinion
These consolidated financial statements and financial highlights are the responsibility of the Company’s management. Our responsibility is to express an opinion on these consolidated financial statements and financial highlights based on our audit. We are a public accounting firm registered with the PCAOB and are required to be independent with respect to the Company in accordance with the U.S. federal securities laws and the applicable rules and regulations of the Securities and Exchange Commission and the PCAOB.
We conducted our audit in accordance with the standards of the PCAOB. Those standards require that we plan and perform the audit to obtain reasonable assurance about whether the consolidated financial statements and financial highlights are free of material misstatement, whether due to error or fraud. Our audit included performing procedures to assess the risks of material misstatement of the consolidated financial statements, whether due to error or fraud, and performing procedures that respond to those risks. Such procedures included examining, on a test basis, evidence regarding the amounts and disclosures in the consolidated financial statements and financial highlights. Such procedures also included confirmation of investments owned as of December 31, 2019, by correspondence with custodians, portfolio companies, or agents, or by other appropriate auditing procedures. Our audit also included evaluating the accounting principles used and significant estimates made by management, as well as evaluating the overall presentation of the consolidated financial statements and financial highlights. We believe that our audit provides a reasonable basis for our opinion.
/s/ KPMG LLP
We have served as the Company’s auditor since 2019.
New York, New York
March 6, 2020
F-2
REPORT OF INDEPENDENT REGISTERED PUBLIC ACCOUNTING FIRM
To the Stockholders and Board of Directors
Portman Ridge Finance Corporation:
Opinion on Internal Control Over Financial Reporting
We have audited Portman Ridge Finance Corporation and subsidiaries’ (the Company) internal control over financial reporting as of December 31, 2019, based on criteria established in Internal Control – Integrated Framework (2013) issued by the Committee of Sponsoring Organizations of the Treadway Commission. In our opinion, the Company maintained, in all material respects, effective internal control over financial reporting as of December 31, 2019, based on criteria established in Internal Control – Integrated Framework (2013) issued by the Committee of Sponsoring Organizations of the Treadway Commission.
We also have audited, in accordance with the standards of the Public Company Accounting Oversight Board (United States) (PCAOB), the consolidated balance sheet of the Company, including the consolidated schedule of investments, as of December 31, 2019, the related consolidated statements of operations, changes in net assets, and cash flows for the year ended December 31, 2019, and the related notes (collectively, the consolidated financial statements) and the financial highlights for the year ended December 31, 2019, and our report dated March 6, 2020 expressed an unqualified opinion on those consolidated financial statements and financial highlights.
Basis for Opinion
The Company’s management is responsible for maintaining effective internal control over financial reporting and for its assessment of the effectiveness of internal control over financial reporting, included in the accompanying Management’s Report on Internal Control Over Financial Reporting. Our responsibility is to express an opinion on the Company’s internal control over financial reporting based on our audit. We are a public accounting firm registered with the PCAOB and are required to be independent with respect to the Company in accordance with the U.S. federal securities laws and the applicable rules and regulations of the Securities and Exchange Commission and the PCAOB.
We conducted our audit in accordance with the standards of the PCAOB. Those standards require that we plan and perform the audit to obtain reasonable assurance about whether effective internal control over financial reporting was maintained in all material respects. Our audit of internal control over financial reporting included obtaining an understanding of internal control over financial reporting, assessing the risk that a material weakness exists, and testing and evaluating the design and operating effectiveness of internal control based on the assessed risk. Our audit also included performing such other procedures as we considered necessary in the circumstances. We believe that our audit provides a reasonable basis for our opinion.
Definition and Limitations of Internal Control Over Financial Reporting
A company’s internal control over financial reporting is a process designed to provide reasonable assurance regarding the reliability of financial reporting and the preparation of financial statements for external purposes in accordance with generally accepted accounting principles. A company’s internal control over financial reporting includes those policies and procedures that (1) pertain to the maintenance of records that, in reasonable detail, accurately and fairly reflect the transactions and dispositions of the assets of the company; (2) provide reasonable assurance that transactions are recorded as necessary to permit preparation of financial statements in accordance with generally accepted accounting principles, and that receipts and expenditures of the company are being made only in accordance with authorizations of management and directors of the company; and (3) provide reasonable assurance regarding prevention or timely detection of unauthorized acquisition, use, or disposition of the company’s assets that could have a material effect on the financial statements.
Because of its inherent limitations, internal control over financial reporting may not prevent or detect misstatements. Also, projections of any evaluation of effectiveness to future periods are subject to the risk that controls may become inadequate because of changes in conditions, or that the degree of compliance with the policies or procedures may deteriorate.
/s/ KPMG LLP
New York, New York
March 6, 2020
F-3
REPORT OF INDEPENDENT REGISTERED PUBLIC ACCOUNTING FIRM
To the Shareholders and the Board of Directors of KCAP Financial, Inc.
Opinion on the Financial Statements
We have audited the accompanying consolidated balance sheet of KCAP Financial, Inc. and subsidiaries (the “Company”), including the consolidated schedule of investments, as of December 31, 2018, the related consolidated statements of operations, changes in net assets, and cash flows for each of the two years in the period ended December 31, 2018, the financial highlights for each of the four years in the period ended December 31 2018 and the related notes collectively referred to as the “financial statements”. In our opinion, the financial statements present fairly, in all material respects, the financial position of the Company at December 31, 2018, and the results of their operations, changes in their net assets, and their cash flows for each of the two years in the period ended December 31, 2018, and its financial highlights for each of the four years in the period ended December 31, 2018 in conformity with U.S. generally accepted accounting principles.
Basis for Opinion
These financial statements are the responsibility of the Company’s management. Our responsibility is to express an opinion on the Company’s financial statements based on our audits. We are a public accounting firm registered with the PCAOB and are required to be independent with respect to the Company in accordance with the U.S. federal securities laws and the applicable rules and regulations of the Securities and Exchange Commission and the PCAOB.
We conducted our audits in accordance with the standards of the PCAOB. Those standards require that we plan and perform the audit to obtain reasonable assurance about whether the financial statements are free of material misstatement, whether due to error or fraud. Our audits included performing procedures to assess the risks of material misstatement of the financial statements, whether due to error or fraud, and performing procedures that respond to those risks. Such procedures included examining, on a test basis, evidence regarding the amounts and disclosures in the financial statements. Our procedures included confirmation of investments owned as of December 31, 2018 and 2017, by correspondence with the custodians. Our audits also included evaluating the accounting principles used and significant estimates made by management, as well as evaluating the overall presentation of the financial statements. We believe that our audits provide a reasonable basis for our opinion.
/s/ Ernst & Young LLP
We have served as the Company’s auditor from 2014 to 2018.
New York, New York
February 26, 2019
F-4
PORTMAN RIDGE FINANCE CORPORATION
|
|
December 31, 2019 |
|
|
December 31, 2018 |
|
|||
|
|
|
|
|
|
|
|
|
|
|
ASSETS |
|
|
|
|
|
|
|
|
|
Investments at fair value: |
|
|
|
|
|
|
|
|
|
Short-term investments (cost: 2019 - $4,207,107; 2018 - $44,756,478) |
|
$ |
4,207,107 |
|
|
$ |
44,756,478 |
|
|
Debt securities (amortized cost: 2019 - $194,686,364; 2018 - $162,264,482) |
|
|
186,802,908 |
|
|
|
147,861,744 |
|
|
CLO Fund Securities managed by affiliates (amortized cost: 2019 - $45,099,076; 2018 - $4,407,106) |
|
|
29,984,047 |
|
|
|
4,473,840 |
|
|
CLO Fund Securities managed by non-affiliates (amortized cost: 2019 - $1,519,641; 2018 - $51,073,520) |
|
|
1,984,155 |
|
|
|
39,851,160 |
|
|
Equity securities (cost: 2019 - $22,160,993; 2018 - $9,477,763) |
|
|
9,864,419 |
|
|
|
2,038,020 |
|
|
Asset Manager Affiliates (cost: 2019 - $17,791,230; 2018 - $17,791,230) |
|
|
— |
|
|
|
3,470,000 |
|
|
Joint Ventures (cost: 2019 - $48,594,539; 2018 - $37,381,525) |
|
|
45,087,967 |
|
|
|
30,857,107 |
|
|
Derivatives (cost: 2019 - $30,609; 2018 - $0) |
|
|
(33,437 |
) |
|
|
— |
|
|
Total Investments at Fair Value (cost: 2019 - $334,089,559; 2018 - $327,152,104) |
|
|
277,897,166 |
|
|
|
273,308,349 |
|
|
Cash |
|
|
136,864 |
|
|
|
5,417,125 |
|
|
Restricted cash |
|
|
4,967,491 |
|
|
|
3,907,341 |
|
|
Interest receivable |
|
|
1,367,447 |
|
|
|
1,342,970 |
|
|
Receivable for unsettled trades |
|
|
24,420,045 |
|
|
|
— |
|
|
Due from affiliates |
|
|
473,100 |
|
|
|
1,007,631 |
|
|
Other assets |
|
|
1,112,150 |
|
|
|
481,265 |
|
|
Total Assets |
|
$ |
310,374,263 |
|
|
$ |
285,464,681 |
|
|
LIABILITIES |
|
|
|
|
|
|
|
|
|
6.125% Notes Due 2022 (net of offering costs of: 2019-$1,651,946; 2018 - $2,207,341) |
|
$ |
75,755,253 |
|
|
$ |
75,199,858 |
|
|
Great Lakes KCAP Funding I, LLC Revolving Credit Facility (net of offering costs of: 2018 - $1,155,754) |
|
|
— |
|
|
|
25,200,331 |
|
|
Great Lakes Portman Ridge Funding LLC Revolving Credit Facility (net of offering costs of: 2019-$1,462,364) |
|
|
78,108,535 |
|
|
|
— |
|
|
Payable for unsettled trades |
|
|
— |
|
|
|
23,204,564 |
|
|
Accounts payable and accrued expenses |
|
|
1,386,981 |
|
|
|
3,591,910 |
|
|
Accrued interest payable |
|
|
136,486 |
|
|
|
131,182 |
|
|
Due to affiliates |
|
|
1,711,793 |
|
|
|
115,825 |
|
|
Management and incentive fees payable |
|
|
1,076,645 |
|
|
|
— |
|
|
Total Liabilities |
|
|
158,175,693 |
|
|
|
127,443,670 |
|
|
COMMITMENTS AND CONTINGENCIES (NOTE 9) |
|
|
|
|
|
|
|
|
|
STOCKHOLDERS' EQUITY |
|
|
|
|
|
|
|
|
|
Common stock, par value $0.01 per share, 100,000,000 common shares authorized; 45,024,535 issued, and 44,829,676 outstanding at December 31, 2019, and 37,521,705 issued, and 37,326,846 outstanding at December 31, 2018 |
|
|
448,297 |
|
|
|
373,268 |
|
|
Capital in excess of par value |
|
|
451,353,379 |
|
|
|
306,784,387 |
|
|
Total distributable (loss) earnings |
|
|
(299,603,106 |
) |
|
|
(149,136,644 |
) |
|
Total Stockholders' Equity |
|
|
152,198,570 |
|
|
|
158,021,011 |
|
|
Total Liabilities and Stockholders' Equity |
|
$ |
310,374,263 |
|
|
$ |
285,464,681 |
|
|
NET ASSET VALUE PER COMMON SHARE |
|
$ |
3.40 |
|
|
$ |
4.23 |
|
See accompanying notes to consolidated financial statements.
F-5
PORTMAN RIDGE FINANCE CORPORATION
CONSOLIDATED STATEMENTS OF OPERATIONS
|
|
For the Years Ended December 31, |
|
||||||||||
|
|
|
2019 |
|
|
2018 |
|
|
2017 |
|
|||
|
Investment Income: |
|
|
|
|
|
|
|
|
|
|
|
|
|
Interest from investments in debt securities |
|
$ |
14,377,460 |
|
|
$ |
14,939,309 |
|
|
$ |
13,963,970 |
|
|
Payment-in-kind investment income |
|
|
606,234 |
|
|
|
1,066,354 |
|
|
|
1,099,223 |
|
|
Interest from short-term investments |
|
|
79,065 |
|
|
|
76,055 |
|
|
|
71,934 |
|
|
Investment income on CLO Fund Securities managed by affiliates |
|
|
4,427,387 |
|
|
|
6,024,935 |
|
|
|
10,807,490 |
|
|
Investment income on CLO Fund Securities managed by non-affiliates |
|
|
2,008,148 |
|
|
|
388,237 |
|
|
|
420,766 |
|
|
Dividends from Asset Manager Affiliates |
|
|
— |
|
|
|
1,246,510 |
|
|
|
460,000 |
|
|
Investment income - Joint Ventures |
|
|
4,859,780 |
|
|
|
3,100,000 |
|
|
|
949,037 |
|
|
Capital structuring service fees |
|
|
137,061 |
|
|
|
245,393 |
|
|
|
491,279 |
|
|
Total investment income |
|
|
26,495,135 |
|
|
|
27,086,793 |
|
|
|
28,263,699 |
|
|
Expenses: |
|
|
|
|
|
|
|
|
|
|
|
|
|
Management fees |
|
|
3,129,079 |
|
|
|
— |
|
|
|
— |
|
|
Performance-based incentive fees |
|
|
— |
|
|
|
— |
|
|
|
— |
|
|
Interest and amortization of debt issuance costs |
|
|
8,261,445 |
|
|
|
7,403,436 |
|
|
|
7,661,407 |
|
|
Compensation |
|
|
3,688,578 |
|
|
|
4,012,743 |
|
|
|
4,571,309 |
|
|
Professional fees |
|
|
3,466,877 |
|
|
|
3,470,269 |
|
|
|
2,942,059 |
|
|
Insurance |
|
|
704,592 |
|
|
|
321,268 |
|
|
|
347,175 |
|
|
Administrative services expense |
|
|
1,243,587 |
|
|
|
— |
|
|
|
— |
|
|
Other general and administrative expenses |
|
|
1,496,258 |
|
|
|
1,874,600 |
|
|
|
1,722,618 |
|
|
Lease termination costs |
|
|
1,431,030 |
|
|
|
— |
|
|
|
— |
|
|
Total expenses |
|
|
23,421,446 |
|
|
|
17,082,316 |
|
|
|
17,244,568 |
|
|
Management and performance-based incentive fees waived |
|
|
— |
|
|
|
— |
|
|
|
— |
|
|
Net Expenses |
|
|
23,421,446 |
|
|
|
17,082,316 |
|
|
|
17,244,568 |
|
|
Net Investment Income |
|
|
3,073,689 |
|
|
|
10,004,477 |
|
|
|
11,019,131 |
|
|
Realized And Unrealized (Losses) Gains On Investments: |
|
|
|
|
|
|
|
|
|
|
|
|
|
Net realized (losses) gains from investment transactions |
|
|
(15,619,046 |
) |
|
|
(16,474,939 |
) |
|
|
(6,899,044 |
) |
|
Net change in unrealized (depreciation) appreciation on: |
|
|
|
|
|
|
|
|
|
|
|
|
|
Debt securities |
|
|
6,519,282 |
|
|
|
(7,420,747 |
) |
|
|
4,194,914 |
|
|
Equity securities |
|
|
(4,856,831 |
) |
|
|
(1,283,420 |
) |
|
|
(823,671 |
) |
|
CLO Fund Securities managed by affiliates |
|
|
(6,875,007 |
) |
|
|
17,790,480 |
|
|
|
2,102,279 |
|
|
CLO Fund Securities managed by non-affiliates |
|
|
3,380,119 |
|
|
|
(8,285,747 |
) |
|
|
(85,671 |
) |
|
Asset Manager Affiliates investments |
|
|
— |
|
|
|
(579,000 |
) |
|
|
1,401,000 |
|
|
Joint Venture Investments |
|
|
3,017,847 |
|
|
|
(3,125,560 |
) |
|
|
(3,398,858 |
) |
|
Derivatives |
|
|
(64,046 |
) |
|
|
— |
|
|
|
— |
|
|
Total net change in unrealized appreciation (depreciation) |
|
|
1,121,364 |
|
|
|
(2,903,994 |
) |
|
|
3,389,993 |
|
|
Net realized and unrealized (depreciation) on investments |
|
|
(14,497,682 |
) |
|
|
(19,378,933 |
) |
|
|
(3,509,051 |
) |
|
Realized losses on extinguishments of Debt |
|
|
(1,075,968 |
) |
|
|
(197,090 |
) |
|
|
(4,121,998 |
) |
|
Net (Decrease) Increase In Stockholders’ Equity Resulting From Operations |
|
$ |
(12,499,961 |
) |
|
$ |
(9,571,546 |
) |
|
$ |
3,388,082 |
|
|
Net (Decrease) Increase In Stockholders' Equity Resulting from Operations per Common Share: |
|
|
|
|
|
|
|
|
|
|
|
|
|
Basic: |
|
$ |
(0.33 |
) |
|
$ |
(0.26 |
) |
|
$ |
0.09 |
|
|
Diluted: |
|
$ |
(0.33 |
) |
|
$ |
(0.26 |
) |
|
$ |
0.09 |
|
|
Net Investment (Loss) Income Per Common Share: |
|
|
|
|
|
|
|
|
|
|
|
|
|
Basic: |
|
$ |
0.08 |
|
|
$ |
0.27 |
|
|
$ |
0.30 |
|
|
Diluted: |
|
$ |
0.08 |
|
|
$ |
0.27 |
|
|
$ |
0.30 |
|
|
Weighted Average Shares of Common Stock Outstanding—Basic |
|
|
37,641,650 |
|
|
|
37,356,241 |
|
|
|
37,235,130 |
|
|
Weighted Average Shares of Common Stock Outstanding—Diluted |
|
|
37,641,650 |
|
|
|
37,356,241 |
|
|
|
37,235,130 |
|
See accompanying notes to consolidated financial statements.
F-6
PORTMAN RIDGE FINANCE CORPORATION
CONSOLIDATED STATEMENTS OF CHANGES IN NET ASSETS
|
|
|
Years Ended December 31, |
|
|||||||||
|
|
|
2019 |
|
|
2018 |
|
|
2017 |
|
|||
|
Operations: |
|
|
|
|
|
|
|
|
|
|
|
|
|
Net investment income |
|
$ |
3,073,689 |
|
|
$ |
10,004,477 |
|
|
$ |
11,019,131 |
|
|
Net realized (losses) gains from investment transactions |
|
|
(15,619,046 |
) |
|
|
(16,474,939 |
) |
|
|
(6,899,044 |
) |
|
Realized losses from extinguishments of debt |
|
|
(1,075,968 |
) |
|
|
(197,090 |
) |
|
|
(4,121,998 |
) |
|
Net change in unrealized appreciation on investments |
|
|
1,121,364 |
|
|
|
(2,903,994 |
) |
|
|
3,389,993 |
|
|
Net (decrease) increase in stockholders’ equity resulting from operations |
|
|
(12,499,961 |
) |
|
|
(9,571,546 |
) |
|
|
3,388,082 |
|
|
Stockholder distributions: |
|
|
|
|
|
|
|
|
|
|
|
|
|
Distributions of ordinary income |
|
|
(464,977 |
) |
|
|
(9,192,977 |
) |
|
|
(6,035,683 |
) |
|
Return of capital |
|
|
(11,485,293 |
) |
|
|
(5,688,770 |
) |
|
|
(11,736,777 |
) |
|
Net decrease in net assets resulting from stockholder distributions |
|
|
(11,950,270 |
) |
|
|
(14,881,747 |
) |
|
|
(17,772,460 |
) |
|
|
|
|
|
|
|
|
|
|
|
|
|
|
|
Capital share transactions: |
|
|
|
|
|
|
|
|
|
|
|
|
|
Issuance of common stock for: |
|
|
|
|
|
|
|
|
|
|
|
|
|
Dividend reinvestment plan |
|
|
205,922 |
|
|
|
208,775 |
|
|
|
360,981 |
|
|
Common stock withheld for payroll taxes upon vesting of restricted stock |
|
|
— |
|
|
|
(86,743 |
) |
|
|
(224,944 |
) |
|
Stock based compensation |
|
|
258,936 |
|
|
|
547,696 |
|
|
|
1,127,992 |
|
|
OHAI purchase (net of offering expenses) |
|
|
18,162,932 |
|
|
|
— |
|
|
|
— |
|
|
Net increase in net assets resulting from capital share transactions |
|
|
18,627,790 |
|
|
|
669,728 |
|
|
|
1,264,029 |
|
|
Net assets at beginning of period |
|
|
158,021,011 |
|
|
|
181,804,576 |
|
|
|
194,924,925 |
|
|
Net assets at end of period |
|
$ |
152,198,570 |
|
|
$ |
158,021,011 |
|
|
$ |
181,804,576 |
|
|
Net asset value per common share |
|
$ |
3.40 |
|
|
$ |
4.23 |
|
|
$ |
4.87 |
|
|
Common shares outstanding at end of period |
|
|
44,829,676 |
|
|
|
37,326,846 |
|
|
|
37,339,224 |
|
See accompanying notes to consolidated financial statements.
F-7
PORTMAN RIDGE FINANCE CORPORATION
CONSOLIDATED STATEMENTS OF CASH FLOWS
|
|
|
For the Years Ended December 31, |
|
|||||||||
|
|
|
2019 |
|
|
2018 |
|
|
2017 |
|
|||
|
OPERATING ACTIVITIES: |
|
|
|
|
|
|
|
|
|
|
|
|
|
Net (decrease) increase in stockholders’ equity resulting from operations |
|
$ |
(12,499,961 |
) |
|
$ |
(9,571,546 |
) |
|
$ |
3,388,082 |
|
|
Adjustments to reconcile net (decrease) increase in stockholders’ equity resulting from operations to net cash (used in) provided by in operations: |
|
|
|
|
|
|
|
|
|
|
|
|
|
Net realized losses (gains) on investment transactions |
|
|
15,619,046 |
|
|
|
16,474,939 |
|
|
|
6,899,044 |
|
|
Net change in unrealized appreciation from investments |
|
|
(1,121,364 |
) |
|
|
2,903,994 |
|
|
|
(3,389,993 |
) |
|
Purchases of investments |
|
|
(100,847,747 |
) |
|
|
(118,159,373 |
) |
|
|
(277,367,657 |
) |
|
Proceeds from sales and redemptions of investments |
|
|
142,428,478 |
|
|
|
145,662,223 |
|
|
|
340,797,616 |
|
|
Net accretion of investments |
|
|
(6,529,495 |
) |
|
|
(7,167,772 |
) |
|
|
(11,444,537 |
) |
|
Amortization of original issue discount on indebtedness |
|
|
— |
|
|
|
— |
|
|
|
352,340 |
|
|
Amortization of debt issuance costs |
|
|
1,043,584 |
|
|
|
893,745 |
|
|
|
745,581 |
|
|
Realized losses on extinguishments of debt |
|
|
1,075,968 |
|
|
|
197,090 |
|
|
|
4,121,998 |
|
|
Net amortization of operating lease |
|
|
(165,039 |
) |
|
|
— |
|
|
|
— |
|
|
Payment-in-kind interest income |
|
|
(606,234 |
) |
|
|
(1,066,354 |
) |
|
|
(1,099,223 |
) |
|
Stock-based compensation |
|
|
258,936 |
|
|
|
547,696 |
|
|
|
1,127,992 |
|
|
Cash consideration net of cash acquired from OHAI |
|
|
(8,510,688 |
) |
|
|
— |
|
|
|
— |
|
|
Changes in operating assets and liabilities: |
|
|
|
|
|
|
|
|
|
|
|
|
|
Increase (decrease) in payable for open trades |
|
|
(23,204,564 |
) |
|
|
(11,010,631 |
) |
|
|
26,330,252 |
|
|
(Increase) decrease in receivable for open trades |
|
|
(24,420,045 |
) |
|
|
2,993,750 |
|
|
|
(43,092 |
) |
|
Decrease (increase) in interest and dividends receivable |
|
|
(24,477 |
) |
|
|
(291,699 |
) |
|
|
(17,354 |
) |
|
Increase (decrease) in accrued interest payable |
|
|
84,735 |
|
|
|
131,182 |
|
|
|
(930,086 |
) |
|
(Increase) decrease in other assets |
|
|
(148,431 |
) |
|
|
48,944 |
|
|
|
(62,513 |
) |
|
Decrease (increase) in due from affiliates |
|
|
534,531 |
|
|
|
235,862 |
|
|
|
(630,639 |
) |
|
Increase (decrease) in management and incentive fees payable |
|
|
1,076,645 |
|
|
|
— |
|
|
|
— |
|
|
(Decrease) increase in due to affiliates |
|
|
1,595,968 |
|
|
|
90,742 |
|
|
|
25,083 |
|
|
Decrease (increase) in accounts payable and accrued expenses |
|
|
(1,703,894 |
) |
|
|
1,241,107 |
|
|
|
303,431 |
|
|
Net cash (used in) provided by operating activities |
|
|
(16,064,047 |
) |
|
|
24,153,899 |
|
|
|
89,106,325 |
|
|
FINANCING ACTIVITIES: |
|
|
|
|
|
|
|
|
|
|
|
|
|
Debt issuance costs |
|
|
(1,846,700 |
) |
|
|
(1,459,899 |
) |
|
|
(2,798,940 |
) |
|
Equity issuance costs |
|
|
(385,747 |
) |
|
|
— |
|
|
|
— |
|
|
Issuance (forfeitures) of restricted shares |
|
|
— |
|
|
|
— |
|
|
|
1,303 |
|
|
Common stock withheld for payroll taxes upon vesting of restricted stock |
|
|
— |
|
|
|
(86,743 |
) |
|
|
(224,944 |
) |
|
Distributions to stockholders |
|
|
(11,744,348 |
) |
|
|
(14,672,972 |
) |
|
|
(17,411,479 |
) |
|
Issuance of 6.125% Notes Due 2022 |
|
|
— |
|
|
|
— |
|
|
|
77,407,200 |
|
|
Repayment Senior Funding Notes |
|
|
— |
|
|
|
— |
|
|
|
(147,350,000 |
) |
|
Repayment 7.375 Notes Due 2019 |
|
|
— |
|
|
|
(27,000,000 |
) |
|
|
(6,530,925 |
) |
|
Repayment of OHAI debt assumed |
|
|
(27,394,083 |
) |
|
|
— |
|
|
|
— |
|
|
Borrowings from Revolving Credit Facilities |
|
|
197,320,899 |
|
|
|
49,781,592 |
|
|
|
— |
|
|
Repayment of Revolving Credit Facilities |
|
|
(144,106,085 |
) |
|
|
(23,425,506 |
) |
|
|
— |
|
|
Net cash provided by (used in) financing activities |
|
|
11,843,936 |
|
|
|
(16,863,528 |
) |
|
|
(96,907,785 |
) |
|
CHANGE IN CASH AND RESTRICTED CASH |
|
|
(4,220,111 |
) |
|
|
7,290,371 |
|
|
|
(7,801,460 |
) |
|
CASH AND RESTRICTED CASH, BEGINNING OF PERIOD |
|
|
9,324,466 |
|
|
|
2,034,095 |
|
|
|
9,835,555 |
|
|
CASH AND RESTRICTED CASH, END OF PERIOD |
|
$ |
5,104,355 |
|
|
$ |
9,324,466 |
|
|
$ |
2,034,095 |
|
|
Amounts per balance sheet: |
|
|
|
|
|
|
|
|
|
|
|
|
|
Cash |
|
$ |
136,864 |
|
|
$ |
5,417,125 |
|
|
$ |
2,034,095 |
|
|
Restricted cash |
|
|
4,967,491 |
|
|
|
3,907,341 |
|
|
|
— |
|
|
Total Cash and Restricted cash |
|
$ |
5,104,355 |
|
|
$ |
9,324,466 |
|
|
$ |
2,034,095 |
|
|
Supplemental Information: |
|
|
|
|
|
|
|
|
|
|
|
|
|
Interest paid during the period |
|
$ |
7,081,375 |
|
|
$ |
6,509,669 |
|
|
$ |
6,563,486 |
|
|
Dividends paid during the period under the dividend reinvestment plan |
|
$ |
205,922 |
|
|
$ |
208,775 |
|
|
$ |
360,981 |
|
|
Supplemental non-cash information: |
|
|
|
|
|
|
|
|
|
|
|
|
|
Non-cash purchase of investments |
|
$ |
— |
|
|
$ |
3,281,528 |
|
|
$ |
— |
|
|
Realized loss on Asset Manager Affiliates |
|
$ |
3,470,000 |
|
|
$ |
— |
|
|
$ |
— |
|
|
Initial recognition of operating lease right-of-use asset |
|
$ |
3,309,131 |
|
|
$ |
— |
|
|
$ |
— |
|
|
Initial recognition for operating lease liability |
|
$ |
3,684,121 |
|
|
$ |
— |
|
|
$ |
— |
|
|
Acquisition of OHAI: |
|
|
|
|
|
|
|
|
|
|
|
|
|
Non-cash assets acquired |
|
|
|
|
|
|
|
|
|
|
|
|
|
Investments, at cost |
|
$ |
54,123,811 |
|
|
$ |
— |
|
|
$ |
— |
|
|
Interest receivable |
|
|
592,329 |
|
|
$ |
— |
|
|
$ |
— |
|
|
Other assets |
|
|
482,454 |
|
|
$ |
— |
|
|
$ |
— |
|
|
Total non-cash assets purchased |
|
$ |
55,198,594 |
|
|
$ |
— |
|
|
$ |
— |
|
|
Liabilities assumed |
|
|
|
|
|
|
|
|
|
|
|
|
|
Debt |
|
$ |
27,394,083 |
|
|
$ |
— |
|
|
$ |
— |
|
|
Accounts payable and accrued expenses |
|
|
126,046 |
|
|
$ |
— |
|
|
$ |
— |
|
|
Total liabilities assumed |
|
$ |
27,520,129 |
|
|
$ |
— |
|
|
$ |
— |
|
|
Issuance of common stock |
|
$ |
15,548,678 |
|
|
$ |
— |
|
|
$ |
— |
|
|
Deemed capital contribution from affiliates |
|
$ |
3,000,000 |
|
|
$ |
— |
|
|
$ |
— |
|
|
Transaction costs |
|
$ |
851,807 |
|
|
$ |
— |
|
|
$ |
— |
|
See accompanying notes to consolidated financial statements.
F-8
PORTMAN RIDGE FINANCE CORPORATION
CONSOLIDATED SCHEDULE OF INVESTMENTS
As of December 31, 2019
Debt Securities Portfolio
See accompanying notes to consolidated financial statements.
F-9
|
Portfolio Company / Principal Business |
|
Investment Interest Rate¹ / Maturity15 |
|
Initial Acquisition Date |
|
Principal |
|
|
Amortized Cost |
|
|
Fair Value2 |
|
|||
|
CSM Bakery Solutions Limited (fka CSM Bakery Supplies Limited) Beverage, Food and Tobacco |
(8)(14) |
Junior Secured Loan — Term Loan (Second Lien) 9.8% Cash, 3 month LIBOR(2.03%) + 7.75%; LIBOR Floor 1.00% , Due 7/21 |
|
5/23/2013 |
|
|
3,000,000 |
|
|
|
3,003,785 |
|
|
|
2,868,000 |
|
|
|
|
|
|
|
|
|
|
|
|
|
|
|
|
|
|
|
|
Dental Implant Holdings, LLC Healthcare & Pharmaceuticals |
(8)(14)(20) |
Senior Secured Loan — Term Loan (last out) 8.2% Cash, 1 month LIBOR(1.71%) + 6.50%; LIBOR Floor 1.00% , Due 1/23 |
|
12/18/2019 |
|
|
500,000 |
|
|
|
447,624 |
|
|
|
500,000 |
|
|
|
|
|
|
|
|
|
|
|
|
|
|
|
|
|
|
|
|
Digitran Innovations B.V. (Pomeroy Solutions Holding Company, Inc.) High Tech Industries |
(8)(13) |
Senior Secured Loan — Incremental Tranche 2 Term Loan 11.3% Cash, 1 month LIBOR(1.80%) + 9.50%; , Due 7/24 |
|
12/10/2018 |
|
|
286,430 |
|
|
|
280,909 |
|
|
|
279,441 |
|
|
|
|
|
|
|
|
|
|
|
|
|
|
|
|
|
|
|
|
Digitran Innovations B.V. (Pomeroy Solutions Holding Company, Inc.) High Tech Industries |
(8)(13) |
Senior Secured Loan — Incremental Tranche A-1 TL 11.3% Cash, 1 month LIBOR(1.80%) + 9.50%; , Due 7/24 |
|
12/10/2018 |
|
|
146,079 |
|
|
|
143,339 |
|
|
|
142,515 |
|
|
|
|
|
|
|
|
|
|
|
|
|
|
|
|
|
|
|
|
Digitran Innovations B.V. (Pomeroy Solutions Holding Company, Inc.) High Tech Industries |
(8)(13) |
Senior Secured Loan — Incremental Tranche A-3 Term Loan 11.3% Cash, 1 month LIBOR(1.80%) + 9.50%; , Due 7/24 |
|
12/10/2018 |
|
|
47,738 |
|
|
|
46,803 |
|
|
|
46,574 |
|
|
|
|
|
|
|
|
|
|
|
|
|
|
|
|
|
|
|
|
Digitran Innovations B.V. (Pomeroy Solutions Holding Company, Inc.) High Tech Industries |
(8)(13) |
Senior Secured Loan — Incremental Tranche A-6 Term Loan 11.3% Cash, 1 month LIBOR(1.80%) + 9.50%; , Due 7/24 |
|
12/10/2018 |
|
|
305,427 |
|
|
|
299,362 |
|
|
|
297,974 |
|
|
|
|
|
|
|
|
|
|
|
|
|
|
|
|
|
|
|
|
Digitran Innovations B.V. (Pomeroy Solutions Holding Company, Inc.) High Tech Industries |
(5)(8)(13) |
Senior Secured Loan — Term Loan 11.5% Cash, 3 month LIBOR(1.95%) + 9.50%; LIBOR Floor 1.50% , Due 7/24 |
|
12/10/2018 |
|
|
4,962,406 |
|
|
|
4,919,958 |
|
|
|
3,529,263 |
|
|
|
|
|
|
|
|
|
|
|
|
|
|
|
|
|
|
|
|
Drilling Info Holdings, Inc. High Tech Industries |
(8)(13)(14) |
Senior Secured Loan — 2019 Delayed Draw Term Loan (First Lien) 2.0% Cash, Due 7/25 |
|
6/27/2019 |
|
|
- |
|
|
|
(2,551 |
) |
|
|
- |
|
|
|
|
|
|
|
|
|
|
|
|
|
|
|
|
|
|
|
|
Drilling Info Holdings, Inc. High Tech Industries |
(8)(13)(14) |
Senior Secured Loan — Initial Term Loan (First Lien) 6.0% Cash, 1 month LIBOR(1.80%) + 4.25%; , Due 7/25 |
|
6/27/2019 |
|
|
279,942 |
|
|
|
279,942 |
|
|
|
279,242 |
|
|
|
|
|
|
|
|
|
|
|
|
|
|
|
|
|
|
|
|
Edelman Financial Center, LLC, The (fka Flight Debt Merger Sub Inc.) Banking, Finance, Insurance & Real Estate |
(8)(14) |
Junior Secured Loan — Initial Term Loan (Second Lien) 8.5% Cash, 1 month LIBOR(1.79%) + 6.75%; , Due 7/26 |
|
12/18/2019 |
|
|
300,000 |
|
|
|
267,692 |
|
|
|
299,250 |
|
|
|
|
|
|
|
|
|
|
|
|
|
|
|
|
|
|
|
|
Ensono, LP (formerly known as Acxiom IT Outsourcing, LP) Telecommunication |
(8)(14) |
Junior Secured Loan — Term Loan (Second Lien) 11.0% Cash, 1 month LIBOR(1.80%) + 9.25%; , Due 6/26 |
|
12/18/2019 |
|
|
1,700,000 |
|
|
|
1,499,936 |
|
|
|
1,677,050 |
|
|
|
|
|
|
|
|
|
|
|
|
|
|
|
|
|
|
|
|
Evergreen North America Acquisition, LLC (f/k/a Industrial Services Acquisition, LLC) Environmental Industries |
(8)(13)(14) |
Senior Secured Loan — Term Loan 6.8% Cash, 1 month LIBOR(1.81%) + 5.00%; LIBOR Floor 1.00% , Due 6/22 |
|
6/21/2016 |
|
|
1,039,547 |
|
|
|
1,042,241 |
|
|
|
1,039,547 |
|
See accompanying notes to consolidated financial statements.
F-10
|
Portfolio Company / Principal Business |
|
Investment Interest Rate¹ / Maturity15 |
|
Initial Acquisition Date |
|
Principal |
|
|
Amortized Cost |
|
|
Fair Value2 |
|
|||
|
First American Payment Systems, L.P. Banking, Finance, Insurance & Real Estate |
(8)(13)(14) |
Junior Secured Loan — Tranche B Term Loan (Second Lien) 12.6% Cash, 3 month LIBOR(2.06%) + 10.50%; LIBOR Floor 1.00% , Due 7/24 |
|
1/4/2017 |
|
|
1,500,000 |
|
|
|
1,472,888 |
|
|
|
1,468,500 |
|
|
|
|
|
|
|
|
|
|
|
|
|
|
|
|
|
|
|
|
Firstlight Holdco Inc. Telecommunication |
(8)(14) |
Junior Secured Loan — Initial Term Loan (Second Lien) 9.3% Cash, 1 month LIBOR(1.80%) + 7.50%; , Due 7/26 |
|
12/18/2019 |
|
|
400,000 |
|
|
|
355,145 |
|
|
|
397,000 |
|
|
|
|
|
|
|
|
|
|
|
|
|
|
|
|
|
|
|
|
GI Advo Opco, LLC Healthcare & Pharmaceuticals |
(5)(8) |
Senior Secured Loan — Term Loan 10.8% Cash, Prime (4.75%) + 6.00%; , Due 11/21 |
|
11/19/2015 |
|
|
180,304 |
|
|
|
179,431 |
|
|
|
- |
|
|
|
|
|
|
|
|
|
|
|
|
|
|
|
|
|
|
|
|
GK Holdings, Inc. (aka Global Knowledge) Services: Business |
(8)(13) |
Junior Secured Loan — Initial Term Loan (Second Lien) 12.2% Cash, 3 month LIBOR(1.94%) + 10.25%; LIBOR Floor 1.00% , Due 1/22 |
|
1/30/2015 |
|
|
1,500,000 |
|
|
|
1,491,142 |
|
|
|
1,251,600 |
|
|
|
|
|
|
|
|
|
|
|
|
|
|
|
|
|
|
|
|
Global Tel*Link Corporation Telecommunication |
(8)(14) |
Junior Secured Loan — Loan (Second Lien) 10.0% Cash, 1 month LIBOR(1.80%) + 8.25%; , Due 11/26 |
|
5/21/2013 |
|
|
7,000,000 |
|
|
|
6,896,373 |
|
|
|
6,090,000 |
|
|
|
|
|
|
|
|
|
|
|
|
|
|
|
|
|
|
|
|
Grupo HIMA San Pablo, Inc. Healthcare & Pharmaceuticals |
(8)(13)(14) |
Senior Secured Loan — Term B Loan (First Lien) 10.9% Cash, 3 month LIBOR(1.94%) + 9.00%; LIBOR Floor 1.50% , Due 1/18 |
|
1/30/2013 |
|
|
2,702,232 |
|
|
|
2,702,232 |
|
|
|
2,648,188 |
|
|
|
|
|
|
|
|
|
|
|
|
|
|
|
|
|
|
|
|
Grupo HIMA San Pablo, Inc. Healthcare & Pharmaceuticals |
(5)(8)(13) |
Junior Secured Loan — Term Loan (Second Lien) 13.8% Cash, Due 7/18 |
|
1/30/2013 |
|
|
7,191,667 |
|
|
|
7,169,109 |
|
|
|
4,169,009 |
|
|
|
|
|
|
|
|
|
|
|
|
|
|
|
|
|
|
|
|
Hayward Industries, Inc. Consumer goods: Durable |
(8)(14) |
Junior Secured Loan — Initial Loan (Second Lien) 10.0% Cash, 1 month LIBOR(1.80%) + 8.25%; , Due 8/25 |
|
12/18/2019 |
|
|
2,159,333 |
|
|
|
1,835,957 |
|
|
|
2,058,492 |
|
|
|
|
|
|
|
|
|
|
|
|
|
|
|
|
|
|
|
|
Helix Acquisition Holdings, Inc. (aka MW Industries, Inc) Metals & Mining |
(8)(14) |
Junior Secured Loan — Initial Term Loan (Second Lien) 9.9% Cash, 3 month LIBOR(1.94%) + 8.00%; , Due 9/25 |
|
12/18/2019 |
|
|
1,400,000 |
|
|
|
1,180,977 |
|
|
|
1,319,500 |
|
|
|
|
|
|
|
|
|
|
|
|
|
|
|
|
|
|
|
|
Hoffmaster Group, Inc. Forest Products & Paper |
(8)(13)(14) |
Junior Secured Loan — Initial Term Loan (Second Lien) 11.3% Cash, 1 month LIBOR(1.80%) + 9.50%; LIBOR Floor 1.00% , Due 11/24 |
|
5/6/2014 |
|
|
1,600,000 |
|
|
|
1,570,609 |
|
|
|
1,534,240 |
|
|
|
|
|
|
|
|
|
|
|
|
|
|
|
|
|
|
|
|
Idera, Inc. High Tech Industries |
(8)(13)(14) |
Junior Secured Loan — Loan (Second Lien) 10.8% Cash, 1 month LIBOR(1.80%) + 9.00%; LIBOR Floor 1.00% , Due 6/27 |
|
6/27/2019 |
|
|
7,500,000 |
|
|
|
7,394,304 |
|
|
|
7,495,500 |
|
|
|
|
|
|
|
|
|
|
|
|
|
|
|
|
|
|
|
|
Infobase Holdings, Inc. High Tech Industries |
(8)(13)(14) |
Senior Secured Loan — Term Loan 6.4% Cash, 3 month LIBOR(1.94%) + 4.5%; LIBOR Floor 1.00% , Due 12/22 |
|
12/13/2017 |
|
|
3,914,383 |
|
|
|
3,888,371 |
|
|
|
3,886,590 |
|
See accompanying notes to consolidated financial statements.
F-11
|
Portfolio Company / Principal Business |
|
Investment Interest Rate¹ / Maturity15 |
|
Initial Acquisition Date |
|
Principal |
|
|
Amortized Cost |
|
|
Fair Value2 |
|
|||
|
Ivanti Software, Inc. (fka LANDesk Group, Inc.) High Tech Industries |
(8) |
Junior Secured Loan — Loan (Second Lien) 10.7% Cash, 1 month LIBOR(1.72%) + 9.00%; LIBOR Floor 1.00% , Due 1/25 |
|
3/10/2017 |
|
|
1,228,619 |
|
|
|
1,228,619 |
|
|
|
1,211,787 |
|
|
|
|
|
|
|
|
|
|
|
|
|
|
|
|
|
|
|
|
Kronos Foods Corp Beverage, Food and Tobacco |
(8)(13)(14) |
Senior Secured Loan — Fourth Amendment Term Loan 6.7% Cash, 3 month LIBOR(1.94%) + 4.75%; LIBOR Floor 1.00% , Due 9/22 |
|
6/27/2019 |
|
|
4,937,107 |
|
|
|
4,895,395 |
|
|
|
4,882,305 |
|
|
|
|
|
|
|
|
|
|
|
|
|
|
|
|
|
|
|
|
Location Services Holdings, LLC Services: Business |
(8)(13)(14) |
Senior Secured Loan — Revolving Credit 8.5% Cash, 1 month LIBOR(1.71%) + 6.75%; LIBOR Floor 1.00% , Due 5/20 |
|
11/7/2019 |
|
|
1,979,167 |
|
|
|
1,914,229 |
|
|
|
1,944,135 |
|
|
|
|
|
|
|
|
|
|
|
|
|
|
|
|
|
|
|
|
Ministry Brands, LLC (aka MB Holding) Electronics |
(8)(13)(14) |
Junior Secured Loan — April 2018 Incremental Term Loan (Second Lien) 9.8% Cash, 2 month LIBOR(1.83%) + 8.00%; LIBOR Floor 1.00% , Due 6/23 |
|
12/18/2019 |
|
|
6,000,000 |
|
|
|
5,370,528 |
|
|
|
6,000,000 |
|
|
|
|
|
|
|
|
|
|
|
|
|
|
|
|
|
|
|
|
Navex Topco, Inc. Electronics |
(8)(14)(18) |
Junior Secured Loan — Initial Term Loan (Second Lien) 8.8% Cash, 1 month LIBOR(1.80%) + 7.00%; , Due 9/26 |
|
12/4/2018 |
|
|
7,700,000 |
|
|
|
7,140,816 |
|
|
|
7,636,090 |
|
|
|
|
|
|
|
|
|
|
|
|
|
|
|
|
|
|
|
|
OCI Holdings, LLC Healthcare & Pharmaceuticals |
(5)(8)(13)(18) |
Subordinated Note — Float - 02/2020 15.8% Cash, 5.0% PIK, Due 2/20 |
|
12/18/2019 |
|
|
31,817,483 |
|
|
|
2,165,304 |
|
|
|
2,422,281 |
|
|
|
|
|
|
|
|
|
|
|
|
|
|
|
|
|
|
|
|
PAE Holding Corporation Aerospace and Defense |
(8)(14) |
Junior Secured Loan — Initial Term Loan (Second Lien) 11.3% Cash, 3 month LIBOR(1.85%) + 9.50%; LIBOR Floor 1.00% , Due 10/23 |
|
12/18/2019 |
|
|
6,888,196 |
|
|
|
6,088,533 |
|
|
|
6,802,094 |
|
|
|
|
|
|
|
|
|
|
|
|
|
|
|
|
|
|
|
|
PHI Group, Inc. Transportation: Cargo |
(8)(13)(14) |
Senior Secured Loan — Loan 8.8% Cash, 1 month LIBOR(1.80%) + 7.00%; LIBOR Floor 1.00% , Due 9/24 |
|
7/10/2019 |
|
|
8,375,422 |
|
|
|
8,216,303 |
|
|
|
8,300,043 |
|
|
|
|
|
|
|
|
|
|
|
|
|
|
|
|
|
|
|
|
Phoenix Guarantor Inc. (aka Brightspring) Healthcare & Pharmaceuticals |
(8)(13)(14) |
Junior Secured Loan — Term Loan Second Lien 10.2% Cash, 1 month LIBOR(1.74%) + 8.50%; LIBOR Floor 1.00% , Due 3/27 |
|
12/18/2019 |
|
|
1,200,000 |
|
|
|
1,084,045 |
|
|
|
1,212,000 |
|
|
|
|
|
|
|
|
|
|
|
|
|
|
|
|
|
|
|
|
Pinstripe Holdings, LLC (Aka Cielo) Services: Business |
(8)(13)(14) |
Senior Secured Loan — Initial Term Loan 7.8% Cash, 1 month LIBOR(1.80%) + 6.00%; LIBOR Floor 1.00% , Due 1/25 |
|
1/17/2019 |
|
|
4,962,500 |
|
|
|
4,878,600 |
|
|
|
4,807,670 |
|
|
|
|
|
|
|
|
|
|
|
|
|
|
|
|
|
|
|
|
PSC Industrial Holdings Corp. Environmental Industries |
(8)(13)(14) |
Junior Secured Loan — Initial Term Loan (Second Lien) 10.2% Cash, 1 month LIBOR(1.74%) + 8.50%; LIBOR Floor 1.00% , Due 10/25 |
|
10/5/2017 |
|
|
3,000,000 |
|
|
|
2,956,575 |
|
|
|
2,885,400 |
|
|
|
|
|
|
|
|
|
|
|
|
|
|
|
|
|
|
|
|
PVHC Holding Corp Containers, Packaging and Glass |
(8)(13)(14) |
Senior Secured Loan — Delayed Draw Term Loan 4.8% Cash, Due 8/24 |
|
8/10/2018 |
|
|
- |
|
|
|
(1,424 |
) |
|
|
- |
|
|
|
|
|
|
|
|
|
|
|
|
|
|
|
|
|
|
|
|
PVHC Holding Corp Containers, Packaging and Glass |
(8)(13)(14) |
Senior Secured Loan — Initial Term Loan 6.7% Cash, 3 month LIBOR(1.94%) + 4.75%; LIBOR Floor 1.00% , Due 8/24 |
|
8/10/2018 |
|
|
2,844,000 |
|
|
|
2,833,064 |
|
|
|
2,616,480 |
|
See accompanying notes to consolidated financial statements.
F-12
|
Portfolio Company / Principal Business |
|
Investment Interest Rate¹ / Maturity15 |
|
Initial Acquisition Date |
|
Principal |
|
|
Amortized Cost |
|
|
Fair Value2 |
|
|||
|
Radius Aerospace, Inc. Aerospace and Defense |
(8)(13)(14) |
Senior Secured Loan — Initial Term Loan 7.7% Cash, 3 month LIBOR(1.96%) + 5.75%; LIBOR Floor 1.00% , Due 3/25 |
|
6/27/2019 |
|
|
6,947,500 |
|
|
|
6,852,431 |
|
|
|
6,852,319 |
|
|
|
|
|
|
|
|
|
|
|
|
|
|
|
|
|
|
|
|
Ravn Air Group, Inc. Aerospace and Defense |
(8)(13)(14) |
Senior Secured Loan — Initial Term Loan 7.0% Cash, 3 month LIBOR(1.95%) + 5.00%; LIBOR Floor 1.00% , Due 7/21 |
|
7/29/2015 |
|
|
1,787,814 |
|
|
|
1,787,814 |
|
|
|
1,728,459 |
|
|
|
|
|
|
|
|
|
|
|
|
|
|
|
|
|
|
|
|
Robertshaw US Holding Corp. (fka Fox US Bidco Corp.) Capital Equipment |
(8)(13) |
Junior Secured Loan — Initial Term Loan (Second Lien) 9.8% Cash, 1 month LIBOR(1.81%) + 8.00%; LIBOR Floor 1.00% , Due 2/26 |
|
2/15/2018 |
|
|
3,000,000 |
|
|
|
2,976,852 |
|
|
|
2,753,100 |
|
|
|
|
|
|
|
|
|
|
|
|
|
|
|
|
|
|
|
|
Roscoe Medical, Inc. Healthcare & Pharmaceuticals |
(5)(8)(13) |
Junior Secured Loan — Term Loan (Second Lien) 13.3% Cash, Due 3/21 |
|
3/26/2014 |
|
|
5,000,000 |
|
|
|
4,990,760 |
|
|
|
2,957,000 |
|
|
|
|
|
|
|
|
|
|
|
|
|
|
|
|
|
|
|
|
Roscoe Medical, Inc. Healthcare & Pharmaceuticals |
(5)(8)(13) |
Junior Secured Loan — Term Loan (Second Lien) 13.3% Cash, Due 3/21 |
|
3/26/2014 |
|
|
1,700,000 |
|
|
|
1,695,164 |
|
|
|
1,005,380 |
|
|
|
|
|
|
|
|
|
|
|
|
|
|
|
|
|
|
|
|
Safe Fleet Holdings LLC Automotive |
(8)(14) |
Junior Secured Loan — Initial Term Loan (Second Lien) 8.5% Cash, 1 month LIBOR(1.74%) + 6.75%; LIBOR Floor 1.00% , Due 2/26 |
|
12/18/2019 |
|
|
700,000 |
|
|
|
609,102 |
|
|
|
680,750 |
|
|
|
|
|
|
|
|
|
|
|
|
|
|
|
|
|
|
|
|
Salient CRGT Inc. High Tech Industries |
(8)(14) |
Senior Secured Loan — Initial Term Loan 8.3% Cash, 1 month LIBOR(1.79%) + 6.50%; LIBOR Floor 1.00% , Due 2/22 |
|
2/27/2017 |
|
|
334,873 |
|
|
|
337,069 |
|
|
|
312,269 |
|
|
|
|
|
|
|
|
|
|
|
|
|
|
|
|
|
|
|
|
SCSG EA Acquisition Company, Inc. Healthcare & Pharmaceuticals |
(8)(13)(14) |
Junior Secured Loan — Initial Term Loan (Second Lien) 10.0% Cash, 1 month LIBOR(1.75%) + 8.25%; LIBOR Floor 1.00% , Due 9/24 |
|
8/18/2017 |
|
|
1,000,000 |
|
|
|
992,752 |
|
|
|
995,000 |
|
|
|
|
|
|
|
|
|
|
|
|
|
|
|
|
|
|
|
|
SCSG EA Acquisition Company, Inc. Healthcare & Pharmaceuticals |
(8)(13)(14) |
Junior Secured Loan — Initial Term Loan (Second Lien) 10.0% Cash, 1 month LIBOR(1.76%) + 8.25%; LIBOR Floor 1.00% , Due 9/24 |
|
8/18/2017 |
|
|
5,000,000 |
|
|
|
4,966,615 |
|
|
|
4,975,000 |
|
|
|
|
|
|
|
|
|
|
|
|
|
|
|
|
|
|
|
|
Syndigo LLC Services: Business |
(8)(13)(14) |
Senior Secured Loan — Incremental Term Loan 7.3% Cash, 1 month LIBOR(1.84%) + 5.50%; LIBOR Floor 1.00% , Due 10/24 |
|
8/23/2019 |
|
|
7,917,229 |
|
|
|
7,768,928 |
|
|
|
7,758,884 |
|
|
|
|
|
|
|
|
|
|
|
|
|
|
|
|
|
|
|
|
Tailwind Randys, LLC Automotive |
(8)(14) |
Senior Secured Loan — Initial Term Loan 7.4% Cash, 3 month LIBOR(1.94%) + 5.50%; LIBOR Floor 1.00% , Due 5/25 |
|
6/27/2019 |
|
|
4,975,000 |
|
|
|
4,895,406 |
|
|
|
4,861,073 |
|
|
|
|
|
|
|
|
|
|
|
|
|
|
|
|
|
|
|
|
Tank Partners Equipment Holdings LLC Energy: Oil & Gas |
(5)(8)(13) |
Senior Unsecured Bond — 10.000% - 02/2022 - TankConvert 0.0% Cash, 10.0% PIK, Due 2/22 |
|
2/15/2019 |
|
|
648,879 |
|
|
|
620,145 |
|
|
|
403,615 |
|
See accompanying notes to consolidated financial statements.
F-13
|
Portfolio Company / Principal Business |
|
Investment Interest Rate¹ / Maturity15 |
|
Initial Acquisition Date |
|
Principal |
|
|
Amortized Cost |
|
|
Fair Value2 |
|
|||
|
Teneo Holdings LLC Services: Business |
(8)(13)(14) |
Senior Secured Loan — Initial Term Loan (First Lien) 7.0% Cash, 1 month LIBOR(1.74%) + 5.25%; LIBOR Floor 1.00% , Due 7/25 |
|
8/23/2019 |
|
|
4,987,500 |
|
|
|
4,800,254 |
|
|
|
4,758,075 |
|
|
|
|
|
|
|
|
|
|
|
|
|
|
|
|
|
|
|
|
Tex-Tech Industries, Inc. Textiles and Leather |
(8)(13)(14) |
Junior Secured Loan — Term Loan (Second Lien) 10.7% Cash, 1 month LIBOR(1.70%) + 9.00%; LIBOR Floor 1.00% , Due 8/24 |
|
8/24/2017 |
|
|
12,508,000 |
|
|
|
12,389,673 |
|
|
|
12,180,290 |
|
|
|
|
|
|
|
|
|
|
|
|
|
|
|
|
|
|
|
|
TLE Holdings, LLC Healthcare, Education and Childcare |
(8)(13)(14) |
Senior Secured Loan — Delayed Draw Term Loan 7.7% Cash, 1 month LIBOR(2.20%) + 5.50%; LIBOR Floor 1.00% , Due 6/24 |
|
6/27/2019 |
|
|
207,380 |
|
|
|
205,810 |
|
|
|
205,057 |
|
|
|
|
|
|
|
|
|
|
|
|
|
|
|
|
|
|
|
|
TLE Holdings, LLC Healthcare, Education and Childcare |
(8)(13)(14) |
Senior Secured Loan — Initial Term Loan 7.3% Cash, 1 month LIBOR(1.80%) + 5.50%; LIBOR Floor 1.00% , Due 6/24 |
|
6/27/2019 |
|
|
5,688,912 |
|
|
|
5,665,175 |
|
|
|
5,625,197 |
|
|
|
|
|
|
|
|
|
|
|
|
|
|
|
|
|
|
|
|
TronAir Parent Inc. Aerospace and Defense |
(8)(13)(14) |
Senior Secured Loan — Initial Term Loan (First Lien) 6.7% Cash, 3 month LIBOR(1.91%) + 4.75%; LIBOR Floor 1.00% , Due 9/23 |
|
9/30/2016 |
|
|
979,798 |
|
|
|
978,209 |
|
|
|
959,516 |
|
|
|
|
|
|
|
|
|
|
|
|
|
|
|
|
|
|
|
|
TRSO I, Inc. Energy: Oil & Gas |
(8)(13)(14) |
Junior Secured Loan — Term Loan (Second Lien) 14.0% Cash, Due 3/20 |
|
12/24/2012 |
|
|
1,000,000 |
|
|
|
999,968 |
|
|
|
1,000,000 |
|
|
|
|
|
|
|
|
|
|
|
|
|
|
|
|
|
|
|
|
Vectra Co. Chemicals, Plastics & Rubber |
(8)(14) |
Junior Secured Loan — Initial Loan (Second Lien) 9.0% Cash, 1 month LIBOR(1.80%) + 7.25%; , Due 3/26 |
|
12/18/2019 |
|
|
400,000 |
|
|
|
345,833 |
|
|
|
389,320 |
|
|
|
|
|
|
|
|
|
|
|
|
|
|
|
|
|
|
|
|
Vertafore, Inc. Services: Business |
(8)(14) |
Junior Secured Loan — Initial Term Loan (Second Lien) 9.0% Cash, 1 month LIBOR(1.80%) + 7.25%; , Due 7/26 |
|
12/18/2019 |
|
|
900,000 |
|
|
|
794,083 |
|
|
|
893,430 |
|
|
|
|
|
|
|
|
|
|
|
|
|
|
|
|
|
|
|
|
Wash MultiFamily Acquisition Inc. Personal, Food and Miscellaneous Services |
(8)(14) |
Junior Secured Loan — Initial US Term Loan (Second Lien) 8.8% Cash, 1 month LIBOR(1.80%) + 7.00%; LIBOR Floor 1.00% , Due 5/23 |
|
12/18/2019 |
|
|
2,978,354 |
|
|
|
2,534,318 |
|
|
|
2,829,436 |
|
|
|
|
|
|
|
|
|
|
|
|
|
|
|
|
|
|
|
|
WireCo WorldGroup Inc. Capital Equipment |
(8)(13)(14) |
Junior Secured Loan — Initial Term Loan (Second Lien) 10.8% Cash, 1 month LIBOR(1.80%) + 9.00%; LIBOR Floor 1.00% , Due 9/24 |
|
8/9/2016 |
|
|
3,000,000 |
|
|
|
2,973,265 |
|
|
|
2,869,200 |
|
|
|
|
|
|
|
|
|
|
|
|
|
|
|
|
|
|
|
|
(8)(13)(14) |
Senior Secured Loan — Term Loan 6.9% Cash, 3 month LIBOR(1.90%) + 5.00%; LIBOR Floor 1.00% , Due 11/24 |
|
11/18/2019 |
|
|
2,943,750 |
|
|
|
2,886,325 |
|
|
|
2,887,230 |
|
|
|
|
|
|
|
|
|
|
|
|
|
|
|
|
|
|
|
|
|
Zest Acquisition Corp. Healthcare, Education and Childcare |
(8)(13)(14)(18) |
Junior Secured Loan — Initial Term Loan (Second Lien) 9.3% Cash, 1 month LIBOR(1.75%) + 7.50%; LIBOR Floor 1.00% , Due 3/26 |
|
3/8/2018 |
|
|
3,500,000 |
|
|
|
3,482,564 |
|
|
|
3,306,091 |
|
|
|
|
|
|
|
|
|
|
|
|
|
|
|
|
|
|
|
|
Total Investment in Debt Securities (123% of net asset value at fair value) |
|
|
|
|
|
$ |
230,278,820 |
|
|
$ |
194,686,364 |
|
|
$ |
186,802,908 |
|
See accompanying notes to consolidated financial statements.
F-14
|
Portfolio Company / Principal Business |
|
Investment15 |
|
Initial Acquisition Date |
|
Percentage Ownership/Shares |
|
|
Cost |
|
|
Fair Value2 |
|
|||
|
AAPC Holdings LLC.(8)(13)(22) Healthcare & Pharmaceuticals |
|
Class A Preferred Units; 18% PIK; No maturity |
|
6/27/2019 |
|
|
2.99 |
% |
|
|
5,500,000 |
|
|
|
5,500,000 |
|
|
|
|
|
|
|
|
|
|
|
|
|
|
|
|
|
|
|
|
Advanced Lighting Technologies, Inc.(8)(13)(19) Consumer goods: Durable |
|
Warrant |
|
6/13/2012 |
|
|
1.90 |
% |
|
|
- |
|
|
|
1,000 |
|
|
|
|
|
|
|
|
|
|
|
|
|
|
|
|
|
|
|
|
Advanced Lighting Technologies, Inc.(8)(13)(19) Consumer goods: Durable |
|
Membership Interests |
|
6/13/2012 |
|
|
0.40 |
% |
|
|
182,000 |
|
|
|
1,000 |
|
|
|
|
|
|
|
|
|
|
|
|
|
|
|
|
|
|
|
|
Anthem Sports & Entertainment Inc. (8)(13) Media: Broadcasting & Subscription |
|
Warrant Class A, 9/29 maturity |
|
9/9/2019 |
|
|
0.50 |
% |
|
|
43,887 |
|
|
|
11,485 |
|
|
|
|
|
|
|
|
|
|
|
|
|
|
|
|
|
|
|
|
Anthem Sports & Entertainment Inc. (8)(13)(19) Media: Broadcasting & Subscription |
|
Warrant Class B, 9/29 maturity |
|
9/9/2019 |
|
|
0.50 |
% |
|
|
- |
|
|
|
- |
|
|
|
|
|
|
|
|
|
|
|
|
|
|
|
|
|
|
|
|
Anthem Sports & Entertainment Inc. (8)(13)(19) Media: Broadcasting & Subscription |
|
Warrant Common Stock, 9/29 maturity |
|
9/9/2019 |
|
|
0.50 |
% |
|
|
- |
|
|
|
- |
|
|
|
|
|
|
|
|
|
|
|
|
|
|
|
|
|
|
|
|
ATP Oil & Gas Corporation(8)(12)(19) Energy: Oil & Gas |
|
Limited Term Royalty Interest |
|
12/18/2019 |
|
|
5.00 |
% |
|
|
2,994,029 |
|
|
|
3,445,768 |
|
|
|
|
|
|
|
|
|
|
|
|
|
|
|
|
|
|
|
|
eInstruction Acquisition, LLC(8)(13)(19) Services: Business |
|
Membership Units |
|
7/2/2007 |
|
|
1.10 |
% |
|
|
1,079,617 |
|
|
|
1,000 |
|
|
|
|
|
|
|
|
|
|
|
|
|
|
|
|
|
|
|
|
FP WRCA Coinvestment Fund VII, Ltd.(3)(13)(19) Capital Equipment |
|
Class A Shares |
|
2/2/2007 |
|
|
0.21 |
% |
|
|
1,500,000 |
|
|
|
831,600 |
|
|
|
|
|
|
|
|
|
|
|
|
|
|
|
|
|
|
|
|
New Millennium Holdco, Inc. (Millennium Health, LLC)(8)(13)(19) Healthcare & Pharmaceuticals |
|
Common |
|
10/7/2014 |
|
|
0.20 |
% |
|
|
1,953,299 |
|
|
|
1,000 |
|
|
|
|
|
|
|
|
|
|
|
|
|
|
|
|
|
|
|
|
OCI Holdings, LLC(8)(19)(21) Healthcare & Pharmaceuticals |
|
Class A Units |
|
12/18/2019 |
|
|
20.8 |
% |
|
|
— |
|
|
|
— |
|
|
|
|
|
|
|
|
|
|
|
|
|
|
|
|
|
|
|
|
Roscoe Investors, LLC(8)(13)(19) Healthcare & Pharmaceuticals |
|
Class A Units |
|
3/26/2014 |
|
|
1.56 |
% |
|
|
1,000,000 |
|
|
|
— |
|
|
|
|
|
|
|
|
|
|
|
|
|
|
|
|
|
|
|
|
Tank Partners Equipment Holdings, LLC(8)(13)(16)(19) Energy: Oil & Gas |
|
Class A Units |
|
8/28/2014 |
|
|
48.5 |
% |
|
|
6,228,000 |
|
|
|
— |
|
|
|
|
|
|
|
|
|
|
|
|
|
|
|
|
|
|
|
|
Ohene Holdings B.V.(3)(13)(19) Services: Business |
|
Warrants |
|
3/31/2019 |
|
|
0.2 |
% |
|
|
— |
|
|
|
1,000 |
|
|
|
|
|
|
|
|
|
|
|
|
|
|
|
|
|
|
|
|
TRSO II, Inc.(8)(13)(19) Energy: Oil & Gas |
|
Common Stock |
|
12/24/2012 |
|
|
5.40 |
% |
|
|
1,680,161 |
|
|
|
70,566 |
|
|
|
|
|
|
|
|
|
|
|
|
|
|
|
|
|
|
|
|
Total Investment in Equity Securities (6% of net asset value at fair value) |
|
|
|
|
|
|
|
|
|
$ |
22,160,993 |
|
|
$ |
9,864,419 |
|
See accompanying notes to consolidated financial statements.
F-15
|
Portfolio Company |
|
Investment15,11 |
|
Initial Acquisition Date |
|
Percentage Ownership |
|
|
Amortized Cost |
|
|
Fair Value2 |
|
|||
|
|
Subordinated Securities, effective interest 15.4%, 1/28 maturity |
|
6/4/2013 |
|
|
23.3 |
% |
|
|
6,094,823 |
|
|
|
5,025,536 |
|
|
|
Catamaran CLO 2014-1 Ltd.(3)(6)(13)(18) |
|
Subordinated Securities, effective interest 10.9%, 4/30 maturity |
|
5/6/2014 |
|
|
22.2 |
% |
|
|
9,995,658 |
|
|
|
6,379,580 |
|
|
Dryden 30 Senior Loan Fund(3)(13) |
|
Subordinated Securities, effective interest 29.9%, 11/28 maturity |
|
10/10/2013 |
|
|
6.8 |
% |
|
|
1,519,641 |
|
|
|
1,984,155 |
|
|
Catamaran CLO 2014-2 Ltd.(3)(6)(13)(18) |
|
Subordinated Securities, effective interest 7.8%, 10/26 maturity |
|
8/15/2014 |
|
|
24.9 |
% |
|
|
6,072,697 |
|
|
|
1,139,032 |
|
|
Catamaran CLO 2015-1 Ltd.(3)(6)(13)(18) |
|
Subordinated Securities, effective interest 8.4%, 4/27 maturity |
|
5/5/2015 |
|
|
9.9 |
% |
|
|
4,088,504 |
|
|
|
2,514,130 |
|
|
Catamaran CLO 2016-1 Ltd.(3)(6)(13)(18) |
|
Subordinated Securities, effective interest 8.0%, 1/29 maturity |
|
12/21/2016 |
|
|
24.9 |
% |
|
|
9,253,304 |
|
|
|
6,395,016 |
|
|
Catamaran CLO 2018-1 Ltd(3)(6)(13)(18) |
|
Subordinated Securities, effective interest 13.0%, 10/31 maturity |
|
9/27/2018 |
|
|
24.8 |
% |
|
|
9,594,090 |
|
|
|
8,530,753 |
|
|
|
|
|
|
|
|
|
|
|
|
|
|
|
|
|
|
|
|
Total Investment in CLO Fund Securities (21% of net asset value at fair value) |
|
|
|
|
|
|
|
$ |
46,618,717 |
|
|
$ |
31,968,202 |
|
||
|
|
|
|
|
|
|
|
|
|
|
|
|
|
|
|
|
|
|
|
|
|
|
|
|
|
|
|
|
|
|
|
|
|
||
Asset Manager Affiliates
|
Principal Business |
|
Investment15 |
|
Initial Acquisition Date |
|
Percentage Ownership |
|
|
Cost |
|
|
Fair Value |
|
|||
|
Asset Manager Affiliates(8)(13)(16) |
|
Asset Management Company |
|
12/11/2006 |
|
|
100 |
% |
|
$ |
17,791,230 |
|
|
$ |
- |
|
|
|
|
|
|
|
|
|
|
|
|
|
|
|
|
|
|
|
|
Total Investment in Asset Manager Affiliates (0% of net asset value at fair value) |
|
|
|
|
|
|
|
|
|
$ |
17,791,230 |
|
|
$ |
- |
|
|
Derivatives |
|
|
|
|
|
|
|
|
|
|
|
|
|
|
|
|
|
Portfolio Company / Principal Business |
|
Investment15 |
|
Initial Acquisition Date |
|
|
|
|
|
Cost |
|
|
Fair Value |
|
||
|
AAPC Holdings LLC.(13)(22) Banking, Finance, Insurance & Real Estate |
|
Securities Swap and Option Agreement |
|
9/30/2019 |
|
|
|
|
|
$ |
- |
|
|
$ |
(41,093 |
) |
|
|
|
|
|
|
|
|
|
|
|
|
|
|
|
|
|
|
|
HDNet Holdco LLC (13)(22) Media: Broadcasting & Subscription |
|
Call Option |
|
9/9/2019 |
|
|
|
|
|
|
30,609 |
|
|
|
7,656 |
|
|
|
|
|
|
|
|
|
|
|
|
|
|
|
|
|
|
|
|
Total Derivatives (0% of net asset value at fair value) |
|
|
|
|
|
|
|
|
|
$ |
30,609 |
|
|
$ |
(33,437 |
) |
|
Joint Ventures |
|
|
|
|
|
|
|
|
|
|
|
|
|
|
|
|
|
Portfolio Company / Principal Business |
|
Investment15 |
|
Initial Acquisition Date |
|
Percentage Ownership |
|
|
Cost |
|
|
Fair Value |
|
|||
|
KCAP Freedom 3 LLC(9)(13)(16) |
|
Joint Venture |
|
7/19/2017 |
|
|
60 |
% |
|
$ |
24,914,858 |
|
|
$ |
21,307,899 |
|
|
BCP Great Lakes Holdings LP(10)(17)(18) Limited Partnership |
|
Joint Venture |
|
12/11/2018 |
|
|
37 |
% |
|
|
23,679,681 |
|
|
|
23,780,068 |
|
|
|
|
|
|
|
|
|
|
|
|
|
|
|
|
|
|
|
|
Total Investment in Joint Ventures (29% of net asset value at fair value) |
|
|
|
|
|
|
|
$ |
48,594,539 |
|
|
$ |
45,087,967 |
|
||
Short-term Investments
|
Short-term Investments |
|
Investment15 |
|
Initial Acquisition Date |
|
Yield |
|
|
Par /Amortized Cost |
|
|
Fair Value2 |
|
|||
|
|
Money Market Account |
|
N/A |
|
|
0.45 |
% |
|
$ |
4,207,107 |
|
|
$ |
4,207,107 |
|
|
|
Total Short-term Investments (2% of net asset value at fair value) |
|
|
|
|
|
|
|
|
|
$ |
4,207,107 |
|
|
$ |
4,207,107 |
|
|
|
|
|
|
|
|
|
|
|
|
|
|
|
|
|
|
|
|
Total Investments4 |
|
|
|
|
|
|
|
|
|
$ |
334,089,559 |
|
|
$ |
277,897,166 |
|
|
1 |
A majority of the variable rate loans in the Company’s investment portfolio bear interest at a rate that may be determined by reference to either LIBOR or an alternate Base Rate (commonly based on the Federal Funds Rate or the Prime Rate), which typically resets semi-annually, quarterly, or monthly at the borrower’s option. The Borrower may also elect to have multiple interest reset periods for each December 31, 2019 loan. For each such loan, the Company has provided the weighted average annual stated interest rate in effect at December 31, 2019. As noted in the table above, 82% (based on par) of debt securities contain floors which range between 1.00% and 1.50%. |
See accompanying notes to consolidated financial statements.
F-16
|
2 |
Reflects the fair market value of all investments as of December 31, 2019 as determined by the Company’s Board of Directors. |
|
3 |
Non-U.S. company or principal place of business outside the U.S. |
|
4 |
The aggregate cost of investments for federal income tax purposes is approximately $348 million. The aggregate gross unrealized appreciation is approximately $27.2 million, the aggregate gross unrealized depreciation is approximately $94.9 million, and the net unrealized depreciation is approximately $67.9 million. |
|
5 |
Loan or debt security is on non-accrual status and therefore is considered non-income producing. |
|
6 |
A CLO Fund managed by an affiliate of LibreMax. |
|
7 |
Money market account. |
|
8 |
Qualified asset for purposes of section 55(a) of the Investment Company Act of 1940, as amended (the “1940 Act”). Qualifying assets represent approximately 74.7% of the total assets at December 31, 2019. |
|
9 |
As defined in the 1940 Act, the Company is deemed to be both an “Affiliated Person” and has “Control” of this portfolio company as the Company owns more than 25% of the portfolio company’s outstanding voting securities or has the power to exercise control over management or policies of such portfolio company (including through a management agreement). Other than for purposes of the 1940 Act, the Company does not believe that it has control over this portfolio company. |
|
10 |
Non-voting. |
|
11 |
CLO Subordinated Investments are entitled to periodic distributions which are generally equal to the remaining cash flow of the payments made by the underlying fund’s investments less contractual payments to debt holders and fund expenses. The estimated annualized effective yield indicated is based upon a current projection of the amount and timing of these distributions. Such projections are updated on a quarterly basis and the estimated effective yield is adjusted prospectively. |
|
12 |
This investment is on non-accrual status and receives a 5% royalty interest on oil being produced on certain fields. All production payments received are being applied to the cost basis and are considered return of capital. |
|
13 |
Fair value of this investment was determined using significant unobservable inputs. |
|
14 |
As of December 31, 2019, this investment is owned by Great Lakes Portman Ridge Funding, LLC and was pledged to secure Great Lakes Portman Ridge Funding, LLC’s debt obligation pursuant to its senior secured revolving credit facility (the “Revolving Credit Facility”) with JPMorgan Chase Bank, National Association (“JPM”). |
|
15 |
The Company's investments are generally acquired in private transactions exempt from registration under the Securities Act of 1933, as amended (the “Securities Act”) and, therefore, are generally subject to limitations on resale, and may be deemed to be “restricted securities'' under the Securities Act of 1933. |
|
16 |
As defined in the 1940 Act, the Company is deemed to be both an “Affiliated Person” and has “Control” of this portfolio company as the Company owns more than 25% of the portfolio company’s outstanding voting securities or has the power to exercise control over management or policies of such portfolio company. |
|
17 |
Ownership of LP interest held through the holding company BCP Great Lakes Fund, L.P, a non-U.S. company or principal place of business outside the U.S. |
|
18 |
Under the 1940 Act, the Company is deemed to be an “Affiliated Person” of, as defined in the 1940 Act, this portfolio company as the Company owns at least 5% but no more than 25% of the portfolio company’s outstanding voting securities or is under common control with such portfolio company. Other than for purpose of the 1940 Act, the Company does not believe it has control over this portfolio company. |
|
19 |
Non-income producing. |
|
20 |
Investment is entitled to skim interest which results in a higher interest rate spread of approximately 30 basis points. |
|
21 |
Owns 100% of Class A Units in OHA/OCI Investments, LLC representing 20.8% diluted ownership of OCI Holdings, LLC |
|
22 |
Information related to the Company’s derivatives is presented below as of December 31, 2019: |
|
|
Payments made |
|
Payments received |
|
Counterparty |
|
Maturity date |
|
Notional amount |
|
|
Value |
|
|
Upfront payments/receipts |
|
|
Unrealized gain (loss) |
|
|||||
|
Securities Swap and Option Agreement |
|
18% PIK |
|
16% Cash |
|
Advantage Capital Holdings LLC. |
|
9/15/24 |
|
$ |
5,500,000 |
|
|
$ |
(41,093 |
) |
|
$ |
- |
|
|
$ |
(41,093 |
) |
|
Description |
|
|
|
Counterparty |
|
Number of shares |
|
Notional amount |
|
|
Exercise price |
|
|
Expiration date |
|
Value |
|
|||
|
Call option |
|
|
|
HDNet Holdco LLC |
|
0.2 |
|
$ |
7,656 |
|
|
$ |
0.01 |
|
|
N/A |
|
$ |
7,656 |
|
See accompanying notes to consolidated financial statements.
F-17
PORTMAN RIDGE FINANCE CORPORATION
CONSOLIDATED SCHEDULE OF INVESTMENTS
As of December 31, 2018
Debt Securities Portfolio
|
Principal Business |
|
Investment Interest Rate¹ / Maturity15 |
|
Initial Acquisition Date |
|
Principal |
|
|
Amortized Cost |
|
|
Fair Value2 |
|
|||
|
Advanced Lighting Technologies, Inc.(5)(8)(13) Consumer goods: Durable |
|
Junior Secured Loan — Second Lien Notes 9.8% Cash, 10.0% PIK, 3 month LIBOR(2.80%) + 7.00%; LIBOR Floor 1.00% , Due 10/23 |
|
6/13/2012 |
|
$ |
1,007,062 |
|
|
$ |
958,499 |
|
|
$ |
362,240 |
|
|
|
|
|
|
|
|
|
|
|
|
|
|
|
|
|
|
|
|
AlixPartners, LLP(8)(13) Services: Business |
|
Senior Secured Loan — 2017 Refinancing Term Loan 5.3% Cash, 1 month LIBOR(2.52%) + 2.75%; LIBOR Floor 1.00% , Due 4/24 |
|
12/28/2018 |
|
|
997,462 |
|
|
|
957,563 |
|
|
|
957,563 |
|
|
|
|
|
|
|
|
|
|
|
|
|
|
|
|
|
|
|
|
Asurion, LLC (fka Asurion Corporation)(8)(13) Banking, Finance, Insurance & Real Estate |
|
Senior Secured Loan — Amendment No. 14 Replacement B-4 Term Loan 5.5% Cash, 1 month LIBOR(2.52%)+ 3.00%; LIBOR Floor 1.00% , Due 8/22 |
|
12/28/2018 |
|
|
1,520,851 |
|
|
|
1,463,819 |
|
|
|
1,460,001 |
|
|
|
|
|
|
|
|
|
|
|
|
|
|
|
|
|
|
|
|
BMC Acquisition, Inc. (aka BenefitMall)(8)(13)(14) Banking, Finance, Insurance & Real Estate |
|
Senior Secured Loan — Initial Term Loan 7.8% Cash, 6 month LIBOR(2.59%) + 5.25%; LIBOR Floor 1.00% , Due 12/24 |
|
1/2/2018 |
|
|
2,970,000 |
|
|
|
2,968,502 |
|
|
|
2,942,082 |
|
|
|
|
|
|
|
|
|
|
|
|
|
|
|
|
|
|
|
|
BW NHHC Holdco Inc.(8)(13)(14) Healthcare & Pharmaceuticals |
|
Senior Secured Loan — Initial Term Loan (First Lien) 7.5% Cash, 1 month LIBOR(2.47%) + 5.00% , Due 5/25 |
|
5/16/2018 |
|
|
1,990,000 |
|
|
|
1,962,751 |
|
|
|
1,950,200 |
|
|
|
|
|
|
|
|
|
|
|
|
|
|
|
|
|
|
|
|
Carestream Health, Inc.(8)(13) Healthcare & Pharmaceuticals |
|
Junior Secured Loan — Extended Term Loan (Second Lien) 12.0% Cash, 1 month LIBOR(2.52%) + 9.50%; LIBOR Floor 1.00% , Due 6/21 |
|
10/7/2014 |
|
|
1,510,955 |
|
|
|
1,496,079 |
|
|
|
1,480,736 |
|
|
|
|
|
|
|
|
|
|
|
|
|
|
|
|
|
|
|
|
Child Development Schools, Inc.(8)(13)(14) Services: Business |
|
Senior Secured Loan — Term Loan 6.7% Cash, 3 month LIBOR(2.50%) + 4.25% , Due 5/23 |
|
6/6/2018 |
|
|
4,794,521 |
|
|
|
4,783,918 |
|
|
|
4,782,534 |
|
|
|
|
|
|
|
|
|
|
|
|
|
|
|
|
|
|
|
|
Community Care Health Network, Inc. (aka Matrix Medical Network) (8)(14) Healthcare & Pharmaceuticals |
|
Senior Secured Loan — Closing Date Term Loan 7.3% Cash, 1 month LIBOR(2.52%) + 4.75%; LIBOR Floor 1.00% , Due 2/25 |
|
2/9/2018 |
|
|
1,990,000 |
|
|
|
1,985,635 |
|
|
|
1,873,784 |
|
|
|
|
|
|
|
|
|
|
|
|
|
|
|
|
|
|
|
|
Corsair Gaming, Inc.(8) High Tech Industries |
|
Junior Secured Loan — Term Loan (Second Lien) 11.3% Cash, 3 month LIBOR(2.80%) + 8.50%; LIBOR Floor 1.00% , Due 8/25 |
|
9/29/2017 |
|
|
5,000,000 |
|
|
|
4,936,538 |
|
|
|
4,929,000 |
|
|
|
|
|
|
|
|
|
|
|
|
|
|
|
|
|
|
|
|
Corsair Gaming, Inc.(8)(14) High Tech Industries |
|
Senior Secured Loan — Term Loan (First Lien) 7.1% Cash, 3 month LIBOR(2.80%) + 4.25%; LIBOR Floor 1.00% , Due 8/24 |
|
9/29/2017 |
|
|
1,989,954 |
|
|
|
1,985,554 |
|
|
|
1,968,678 |
|
See accompanying notes to consolidated financial statements.
F-18
|
Principal Business |
|
Investment Interest Rate¹ / Maturity15 |
|
Initial Acquisition Date |
|
Principal |
|
|
Amortized Cost |
|
|
Fair Value2 |
|
|||
|
CSM Bakery Solutions Limited (fka CSM Bakery Supplies Limited)(8) Beverage, Food and Tobacco |
|
Junior Secured Loan — Term Loan (Second Lien)10.2% Cash, 3 month LIBOR(2.41%) + 7.75%; LIBOR Floor 1.00% , Due 7/21 |
|
5/23/2013 |
|
|
3,000,000 |
|
|
|
3,006,304 |
|
|
|
2,841,300 |
|
|
|
|
|
|
|
|
|
|
|
|
|
|
|
|
|
|
|
|
CT Technologies Intermediate Holdings, Inc. (Smart Holdings Corp.) (aka HealthPort)(8)(14) Healthcare & Pharmaceuticals |
|
Senior Secured Loan — New Term Loan Facility 6.8% Cash, 1 month LIBOR(2.52%) + 4.25%; LIBOR Floor 1.00% , Due 12/21 |
|
11/19/2014 |
|
|
3,964,063 |
|
|
|
3,958,001 |
|
|
|
3,306,683 |
|
|
|
|
|
|
|
|
|
|
|
|
|
|
|
|
|
|
|
|
Decolin Inc.(3)(13)(14) Textiles and Leather |
|
Senior Secured Loan — Initial Term Loan 7.0% Cash, 1 month LIBOR(2.51%) + 4.50%; LIBOR Floor 1.00% , Due 12/23 |
|
1/26/2018 |
|
|
2,190,363 |
|
|
|
2,181,096 |
|
|
|
2,092,454 |
|
|
|
|
|
|
|
|
|
|
|
|
|
|
|
|
|
|
|
|
Dell International L.L.C. (EMC Corporation)(8)(13) High Tech Industries |
|
Senior Secured Loan — Refinancing Term B Loan 4.5% Cash, 1 month LIBOR(2.53%) + 2.00%; LIBOR Floor 0.75% , Due 9/23 |
|
12/28/2018 |
|
|
2,000,000 |
|
|
|
1,930,000 |
|
|
|
1,930,000 |
|
|
|
|
|
|
|
|
|
|
|
|
|
|
|
|
|
|
|
|
Digitran Innovations B.V. (Pomeroy Solutions Holding Company, Inc.)(8)(13)(14) High Tech Industries |
|
Senior Secured Loan — Term Loan 10.3% Cash, 3 month LIBOR(2.81%) + 7.50%; LIBOR Floor 1.50% , Due 7/24 |
|
12/10/2018 |
|
|
4,987,469 |
|
|
|
4,938,132 |
|
|
|
4,937,594 |
|
|
|
|
|
|
|
|
|
|
|
|
|
|
|
|
|
|
|
|
Drew Marine Group Inc.(8)(13)(14) Transportation: Cargo |
|
Junior Secured Loan — Term Loan (Second Lien) 9.5% Cash, 1 month LIBOR(2.52%) + 7.00%; LIBOR Floor 1.00% , Due 5/21 |
|
11/19/2013 |
|
|
4,000,000 |
|
|
|
4,000,634 |
|
|
|
4,000,400 |
|
|
|
|
|
|
|
|
|
|
|
|
|
|
|
|
|
|
|
|
Evergreen North America Acquisition, LLC (f/k/a Industrial Services Acquisition, LLC)(8)(13)(14) Environmental Industries |
|
Senior Secured Loan — Term Loan 7.8% Cash, 3 month LIBOR(2.81%) + 5.00%; LIBOR Floor 1.00% , Due 6/22 |
|
6/21/2016 |
|
|
1,103,728 |
|
|
|
1,107,755 |
|
|
|
1,103,728 |
|
|
|
|
|
|
|
|
|
|
|
|
|
|
|
|
|
|
|
|
First American Payment Systems, L.P.(8)(13)(14) Banking, Finance, Insurance & Real Estate |
|
Junior Secured Loan — Term Loan (Second Lien) 13.0% Cash, 3 month LIBOR(2.54%) + 10.50%; LIBOR Floor 1.00% , Due 7/24 |
|
1/4/2017 |
|
|
1,500,000 |
|
|
|
1,466,870 |
|
|
|
1,399,200 |
|
|
|
|
|
|
|
|
|
|
|
|
|
|
|
|
|
|
|
|
Flexera Software LLC (fka Flexera Software, Inc.)(8) High Tech Industries |
|
Junior Secured Loan — Initial Term Loan (Second Lien) 9.8% Cash, 1 month LIBOR(2.53%) + 7.25%; LIBOR Floor 1.00% , Due 2/26 |
|
1/25/2018 |
|
|
1,099,654 |
|
|
|
1,111,477 |
|
|
|
1,090,032 |
|
|
|
|
|
|
|
|
|
|
|
|
|
|
|
|
|
|
|
|
GI Advo Opco, LLC(5)(8)(13)(14) Healthcare & Pharmaceuticals |
|
Senior Secured Loan — Term Loan 9.5% Cash, Due 11/21 |
|
11/19/2015 |
|
|
180,304 |
|
|
|
179,431 |
|
|
|
117,919 |
|
See accompanying notes to consolidated financial statements.
F-19
|
Principal Business |
|
Investment Interest Rate¹ / Maturity15 |
|
Initial Acquisition Date |
|
Principal |
|
|
Amortized Cost |
|
|
Fair Value2 |
|
|||
|
GK Holdings, Inc. (aka Global Knowledge)(8)(13) Services: Business |
|
Junior Secured Loan — Initial Term Loan (Second Lien) 13.1% Cash, 3 month LIBOR(2.80%) + 10.25%; LIBOR Floor 1.00% , Due 1/22 |
|
1/30/2015 |
|
|
1,500,000 |
|
|
|
1,486,831 |
|
|
|
1,376,250 |
|
|
|
|
|
|
|
|
|
|
|
|
|
|
|
|
|
|
|
|
Global Tel*Link Corporation(8)(13) Telecommunications |
|
Junior Secured Loan — Loan (Second Lien) 11.0% Cash, 3 month LIBOR(2.71%) + 8.25% , Due 11/26 |
|
5/21/2013 |
|
|
5,000,000 |
|
|
|
4,915,960 |
|
|
|
4,912,500 |
|
|
|
|
|
|
|
|
|
|
|
|
|
|
|
|
|
|
|
|
Global Tel*Link Corporation(8)(13)(14) Telecommunications |
|
Junior Secured Loan — Loan (Second Lien) 11.0% Cash, 3 month LIBOR(2.71%) + 8.25% , Due 11/26 |
|
5/21/2013 |
|
|
2,000,000 |
|
|
|
1,965,349 |
|
|
|
1,965,000 |
|
|
|
|
|
|
|
|
|
|
|
|
|
|
|
|
|
|
|
|
Global Tel*Link Corporation(8)(13)(14) Telecommunications |
|
Senior Secured Loan — Term Loan (First Lien) 7.0% Cash, 3 month LIBOR(2.71%) + 4.25% , Due 11/25 |
|
12/7/2017 |
|
|
1,473,788 |
|
|
|
1,470,466 |
|
|
|
1,466,419 |
|
|
|
|
|
|
|
|
|
|
|
|
|
|
|
|
|
|
|
|
Grupo HIMA San Pablo, Inc.(8)(13) Healthcare & Pharmaceuticals |
|
Senior Secured Loan — Term B Loan (First Lien) 9.5% Cash, 3 month LIBOR(2.52%) + 7.00%; LIBOR Floor 1.50% , Due 1/18 |
|
1/30/2013 |
|
|
2,813,058 |
|
|
|
2,813,058 |
|
|
|
2,728,666 |
|
|
|
|
|
|
|
|
|
|
|
|
|
|
|
|
|
|
|
|
Grupo HIMA San Pablo, Inc.(5)(13)(14) Healthcare & Pharmaceuticals |
|
Junior Secured Loan — Term Loan (Second Lien) 13.8% Cash, Due 7/18 |
|
1/30/2013 |
|
|
7,191,667 |
|
|
|
7,169,109 |
|
|
|
4,789,650 |
|
|
|
|
|
|
|
|
|
|
|
|
|
|
|
|
|
|
|
|
Harland Clarke Holdings Corp. (fka Clarke American Corp.)(8)(13)(14) Media: Advertising, Printing & Publishing |
|
Senior Secured Loan — Initial Term Loan 7.6% Cash, 3 month LIBOR(2.80%) + 4.75%; LIBOR Floor 1.00% , Due 11/23 |
|
6/18/2013 |
|
|
2,817,177 |
|
|
|
2,836,587 |
|
|
|
2,564,688 |
|
|
|
|
|
|
|
|
|
|
|
|
|
|
|
|
|
|
|
|
Hoffmaster Group, Inc.(8)(13)(14) Forest Products & Paper |
|
Junior Secured Loan — Initial Term Loan (Second Lien) 12.0% Cash, 1 month LIBOR(2.52%) + 9.50%; LIBOR Floor 1.00% , Due 11/24 |
|
5/6/2014 |
|
|
1,600,000 |
|
|
|
1,564,583 |
|
|
|
1,553,920 |
|
|
|
|
|
|
|
|
|
|
|
|
|
|
|
|
|
|
|
|
Infobase Holdings, Inc.(8)(13)(14) High Tech Industries |
|
Senior Secured Loan — Term Loan 7.1% Cash, 3 month LIBOR(2.63%) + 4.50%; LIBOR Floor 1.00% , Due 12/22 |
|
12/13/2017 |
|
|
4,017,393 |
|
|
|
3,981,675 |
|
|
|
3,977,219 |
|
|
|
|
|
|
|
|
|
|
|
|
|
|
|
|
|
|
|
|
Ion Media Networks, Inc.(8)(13) Media: Advertising, Printing & Publishing |
|
Senior Secured Loan — Term B-3 Loan 5.3% Cash, 1 month LIBOR(2.53%) + 2.75%; LIBOR Floor 1.00% , Due 12/20 |
|
12/28/2018 |
|
|
3,000,000 |
|
|
|
2,917,500 |
|
|
|
2,917,500 |
|
|
|
|
|
|
|
|
|
|
|
|
|
|
|
|
|
|
|
|
Ivanti Software, Inc. (fka LANDesk Group, Inc.)(8)(13) High Tech Industries |
|
Junior Secured Loan — Loan (Second Lien) 11.4% Cash, 1 month LIBOR(2.35%) + 9.00%; LIBOR Floor 1.00% , Due 1/25 |
|
3/10/2017 |
|
|
3,228,619 |
|
|
|
3,228,619 |
|
|
|
3,071,062 |
|
See accompanying notes to consolidated financial statements.
F-20
|
Principal Business |
|
Investment Interest Rate¹ / Maturity15 |
|
Initial Acquisition Date |
|
Principal |
|
|
Amortized Cost |
|
|
Fair Value2 |
|
|||
|
Jane Street Group, LLC(8)(13) Banking, Finance, Insurance & Real Estate |
|
Senior Secured Loan — Dollar Term Loan (2018) 5.5% Cash, 1 month LIBOR(2.50%) + 3.00% , Due 8/22 |
|
12/28/2018 |
|
|
2,992,500 |
|
|
|
2,932,650 |
|
|
|
2,932,650 |
|
|
|
|
|
|
|
|
|
|
|
|
|
|
|
|
|
|
|
|
Kellermeyer Bergensons Services, LLC(8) Services: Business |
|
Senior Secured Loan — 2018 Replacement Term Loan (First Lien) 7.5% Cash, 3 month LIBOR(2.71%) + 4.75%; LIBOR Floor 1.00% , Due 10/21 |
|
10/31/2014 |
|
|
2,093,452 |
|
|
|
2,090,784 |
|
|
|
2,096,069 |
|
|
|
|
|
|
|
|
|
|
|
|
|
|
|
|
|
|
|
|
MB Aerospace Holdings II Corp.(8)(13)(14) Aerospace and Defense |
|
Senior Secured Loan — Initial Term Loan (First Lien) 6.0% Cash, 1 month LIBOR(2.52%) + 3.50%; LIBOR Floor 1.00% , Due 1/25 |
|
5/10/2013 |
|
|
1,237,500 |
|
|
|
1,232,118 |
|
|
|
1,149,390 |
|
|
|
|
|
|
|
|
|
|
|
|
|
|
|
|
|
|
|
|
Navex Topco, Inc.(8)(13)(14) Electronics |
|
Junior Secured Loan — Initial Term Loan (Second Lien) 9.5% Cash, 1 month LIBOR(2.53%) + 7.00% , Due 9/26 |
|
12/4/2018 |
|
|
3,000,000 |
|
|
|
3,007,500 |
|
|
|
3,007,500 |
|
|
|
|
|
|
|
|
|
|
|
|
|
|
|
|
|
|
|
|
Playpower, Inc.(8)(13)(14) Construction & Building |
|
Senior Secured Loan — Initial Term Loan (First Lien) 7.6% Cash, 3 month LIBOR(2.80%) + 4.75%; LIBOR Floor 1.00% , Due 6/21 |
|
6/23/2015 |
|
|
1,393,745 |
|
|
|
1,400,223 |
|
|
|
1,394,163 |
|
|
|
|
|
|
|
|
|
|
|
|
|
|
|
|
|
|
|
|
PSC Industrial Holdings Corp.(8)(13) Environmental Industries |
|
Junior Secured Loan — Initial Term Loan (Second Lien) 10.96% Cash, 1 month LIBOR(2.46%) + 8.50%; LIBOR Floor 1.00% , Due 10/25 |
|
10/5/2017 |
|
|
3,000,000 |
|
|
|
2,949,039 |
|
|
|
2,940,300 |
|
|
|
|
|
|
|
|
|
|
|
|
|
|
|
|
|
|
|
|
PVHC Holding Corp(8)(13)(14) Chemicals, Plastics and Rubber |
|
Senior Secured Loan — Initial Term Loan 7.57% Cash, 3 month LIBOR(2.82%) + 4.75%; LIBOR Floor 1.00% , Due 8/24 |
|
8/10/2018 |
|
|
2,872,800 |
|
|
|
2,859,340 |
|
|
|
2,859,872 |
|
|
|
|
|
|
|
|
|
|
|
|
|
|
|
|
|
|
|
|
Q Holding Company (fka Lexington Precision Corporation)(8)(13)(14) Chemicals, Plastics and Rubber |
|
Senior Secured Loan — Term B Loan 7.5% Cash, 1 month LIBOR(2.52%) + 5.00%; LIBOR Floor 1.00% , Due 12/21 |
|
12/16/2016 |
|
|
1,979,381 |
|
|
|
2,002,724 |
|
|
|
1,941,773 |
|
|
|
|
|
|
|
|
|
|
|
|
|
|
|
|
|
|
|
|
Ravn Air Group, Inc.(8)(13)(14) Aerospace and Defense |
|
Senior Secured Loan — Initial Term Loan 7.8% Cash, 3 month LIBOR(2.81%) + 5.00%; LIBOR Floor 1.00% , Due 7/21 |
|
7/29/2015 |
|
|
1,894,549 |
|
|
|
1,894,549 |
|
|
|
1,894,549 |
|
|
|
|
|
|
|
|
|
|
|
|
|
|
|
|
|
|
|
|
Robertshaw US Holding Corp. (fka Fox US Bidco Corp.) (8)(13) Capital Equipment |
|
Junior Secured Loan — Initial Term Loan (Second Lien) 10.6% Cash, 1 month LIBOR(2.56%) + 8.00%; LIBOR Floor 1.00% , Due 2/26 |
|
2/15/2018 |
|
|
3,000,000 |
|
|
|
2,973,097 |
|
|
|
2,775,000 |
|
|
|
|
|
|
|
|
|
|
|
|
|
|
|
|
|
|
|
|
Roscoe Medical, Inc.(8)(13) Healthcare & Pharmaceuticals |
|
Junior Secured Loan — Term Loan (Second Lien) 11.3% Cash, Due 9/19 |
|
3/26/2014 |
|
|
1,700,000 |
|
|
|
1,697,733 |
|
|
|
1,525,750 |
|
See accompanying notes to consolidated financial statements.
F-21
|
Principal Business |
|
Investment Interest Rate¹ / Maturity15 |
|
Initial Acquisition Date |
|
Principal |
|
|
Amortized Cost |
|
|
Fair Value2 |
|
|||
|
Roscoe Medical, Inc.(8)(13)(14) Healthcare & Pharmaceuticals |
|
Junior Secured Loan — Term Loan (Second Lien) 11.3% Cash, Due 9/19 |
|
3/26/2014 |
|
|
5,000,000 |
|
|
|
4,993,345 |
|
|
|
4,487,500 |
|
|
|
|
|
|
|
|
|
|
|
|
|
|
|
|
|
|
|
|
Salient CRGT Inc.(8)(13)(14) HighTech Industries |
|
Senior Secured Loan — Initial Term Loan, 8.3% Cash, 1 month LIBOR(2.52%) + 5.75%; LIBOR Floor 1.00% , Due 2/22 |
|
2/27/2017 |
|
|
1,841,753 |
|
|
|
1,859,440 |
|
|
|
1,758,874 |
|
|
|
|
|
|
|
|
|
|
|
|
|
|
|
|
|
|
|
|
SCSG EA Acquisition Company, Inc.(8) Healthcare & Pharmaceuticals |
|
Junior Secured Loan — Initial Term Loan (Second Lien) 10.6% Cash, 3 month LIBOR(2.40%) + 8.25%; LIBOR Floor 1.00% , Due 9/24 |
|
8/18/2017 |
|
|
1,000,000 |
|
|
|
991,195 |
|
|
|
990,400 |
|
|
|
|
|
|
|
|
|
|
|
|
|
|
|
|
|
|
|
|
SCSG EA Acquisition Company, Inc.(8)(14) Healthcare & Pharmaceuticals |
|
Junior Secured Loan — Initial Term Loan (Second Lien) 10.6% Cash, 3 month LIBOR(2.40%) + 8.25%; LIBOR Floor 1.00% , Due 9/24 |
|
8/18/2017 |
|
|
5,000,000 |
|
|
|
4,959,445 |
|
|
|
4,952,000 |
|
|
|
|
|
|
|
|
|
|
|
|
|
|
|
|
|
|
|
|
Sierra Enterprises, LLC (aka Lyons Magnus)(8)(13)(14) Beverage, Food and Tobacco |
|
Senior Secured Loan — Tranche B-1 Term Loan (First Lien) 6.0% Cash, 1 month LIBOR(2.52%) + 3.50%; LIBOR Floor 1.00% , Due 11/24 |
|
11/3/2017 |
|
|
2,970,056 |
|
|
|
2,957,029 |
|
|
|
2,955,206 |
|
|
|
|
|
|
|
|
|
|
|
|
|
|
|
|
|
|
|
|
Stafford Logistics, Inc.(dba Custom Ecology, Inc.)(5)(8)(13) Environmental Industries |
|
Junior Secured Loan — Restructured Term Loan 1.0% Cash, 8.3% PIK, 3 month LIBOR (2.80%) + 5.50% , Due 10/22 |
|
6/25/2013 |
|
|
2,035,770 |
|
|
|
1,941,220 |
|
|
|
560,855 |
|
|
|
|
|
|
|
|
|
|
|
|
|
|
|
|
|
|
|
|
Stafford Logistics, Inc.(dba Custom Ecology, Inc.)(8)(13)(14) Environmental Industries |
|
Senior Secured Loan — Term Loan 14.8% Cash, 3 month LIBOR(2.82%) + 12.00% , Due 10/22 |
|
6/25/2013 |
|
|
339,788 |
|
|
|
339,788 |
|
|
|
339,788 |
|
|
|
|
|
|
|
|
|
|
|
|
|
|
|
|
|
|
|
|
Tank Partners Holdings, LLC(5)(8)(13) Energy: Oil & Gas |
|
Senior Secured Loan — Loan 3.0% Cash, 12.5% PIK, 1 month PRIME (5.00%)+7.5%; PRIME Floor 3.00% , Due 8/19 |
|
8/28/2014 |
|
|
15,295,083 |
|
|
|
14,149,836 |
|
|
|
7,398,223 |
|
|
|
|
|
|
|
|
|
|
|
|
|
|
|
|
|
|
|
|
Tex-Tech Industries, Inc.(8)(13) Textiles and Leather |
|
Junior Secured Loan — Term Loan (Second Lien) 11.5% Cash, 1 month LIBOR (2.52%) + 9.00%; LIBOR Floor 1.00% , Due 8/24 |
|
8/24/2017 |
|
|
8,008,000 |
|
|
|
7,959,567 |
|
|
|
7,847,840 |
|
|
|
|
|
|
|
|
|
|
|
|
|
|
|
|
|
|
|
|
Time Manufacturing Acquisition, LLC(8)(13)(14) Capital Equipment |
|
Senior Secured Loan — Term Loan 7.6% Cash, 6 month LIBOR(2.63%) + 5.00%; LIBOR Floor 1.00% , Due 2/23 |
|
2/3/2017 |
|
|
3,446,143 |
|
|
|
3,447,715 |
|
|
|
3,430,291 |
|
|
|
|
|
|
|
|
|
|
|
|
|
|
|
|
|
|
|
|
TronAir Parent Inc.(8)(13)(14) Aerospace and Defense |
|
Senior Secured Loan — Initial Term Loan (First Lien) 7.6% Cash, 6 month LIBOR(2.82%) + 4.75%; LIBOR Floor 1.00% , Due 9/23 |
|
9/30/2016 |
|
|
987,374 |
|
|
|
985,337 |
|
|
|
954,001 |
|
|
|
|
|
|
|
|
|
|
|
|
|
|
|
|
|
|
|
|
TRSO I, Inc.(8)(13) Energy: Oil & Gas |
|
Junior Secured Loan — Term Loan (Second Lien) 14.0% Cash, Due 12/19 |
|
12/24/2012 |
|
|
1,000,000 |
|
|
|
997,207 |
|
|
|
1,000,000 |
|
|
Principal Business |
|
Investment Interest Rate¹ / Maturity15 |
|
Initial Acquisition Date |
|
Principal |
|
|
Amortized Cost |
|
|
Fair Value2 |
|
|||
|
Verdesian Life Sciences, LLC(8)(13)(14) Environmental Industries |
|
Senior Secured Loan — Initial Term Loan 7.5% Cash, 1 month LIBOR(2.53%) + 5.00%; LIBOR Floor 1.00% , Due 7/20 |
|
6/25/2014 |
|
|
2,075,305 |
|
|
|
2,033,378 |
|
|
|
1,993,123 |
|
|
|
|
|
|
|
|
|
|
|
|
|
|
|
|
|
|
|
|
Weiman Products, LLC(8)(13)(14) Consumer goods: Non-durable |
|
Senior Secured Loan — Term Loan 7.3% Cash, 3 month LIBOR(2.80%) + 4.50%; LIBOR Floor 1.00% , Due 11/21 |
|
11/22/2013 |
|
|
1,440,525 |
|
|
|
1,434,568 |
|
|
|
1,440,525 |
|
|
|
|
|
|
|
|
|
|
|
|
|
|
|
|
|
|
|
|
WireCo WorldGroup Inc. (8)(13) Capital Equipment |
|
Junior Secured Loan — Initial Term Loan (Second Lien) 11.5% Cash, 1 month LIBOR(2.52%) + 9.00%; LIBOR Floor 1.00% , Due 9/24 |
|
8/9/2016 |
|
|
3,000,000 |
|
|
|
2,967,619 |
|
|
|
2,957,100 |
|
|
|
|
|
|
|
|
|
|
|
|
|
|
|
|
|
|
|
|
Zest Acquisition Corp.(8)(13) Healthcare & Pharmaceuticals |
|
Junior Secured Loan — Initial Term Loan (Second Lien) 10.0% Cash, 1 month LIBOR(2.45%) + 7.50%; LIBOR Floor 1.00% , Due 3/26 |
|
3/8/2018 |
|
|
3,500,000 |
|
|
|
3,479,741 |
|
|
|
3,430,000 |
|
|
|
|
|
|
|
|
|
|
|
|
|
|
|
|
|
|
|
|
(94% of net asset value at fair value) |
|
|
|
|
|
$ |
164,541,812 |
|
|
$ |
162,264,482 |
|
|
$ |
147,861,744 |
|
See accompanying notes to consolidated financial statements.
F-22
See accompanying notes to consolidated financial statements.
F-23
CLO Subordinated Investments
|
|
Investment15,11 |
|
Initial Acquisition Date |
|
Percentage Ownership |
|
|
Amortized Cost |
|
|
Fair Value |
|
||||
|
Katonah III, Ltd.(3)(12)(13) |
|
Subordinated Securities, effective interest N/M, 5/15 maturity16 |
|
12/11/2006 |
|
|
23.1 |
% |
|
$ |
1,287,155 |
|
|
$ |
369,280 |
|
|
Catamaran CLO 2013- 1 Ltd.(3)(13) |
|
Subordinated Securities, effective interest 21.9%, 1/28 maturity |
|
6/4/2013 |
|
|
23.3 |
% |
|
|
6,378,611 |
|
|
|
7,016,733 |
|
|
Catamaran CLO 2014-1 Ltd.(3)(13) |
|
Subordinated Securities, effective interest 13.6%, 4/30 maturity |
|
5/6/2014 |
|
|
25.1 |
% |
|
|
11,740,622 |
|
|
|
9,777,251 |
|
|
Dryden 30 Senior Loan Fund(3)(13) |
|
Subordinated Securities, effective interest 27.0%, 12/29 maturity |
|
10/10/2013 |
|
|
6.8 |
% |
|
|
1,438,701 |
|
|
|
1,913,925 |
|
|
Catamaran CLO 2014-2 Ltd.(3)(13) |
|
Subordinated Securities, effective interest 10.4%, 11/25 maturity |
|
8/15/2014 |
|
|
24.9 |
% |
|
|
6,314,484 |
|
|
|
2,158,200 |
|
|
Catamaran CLO 2015-1 Ltd.(3)(13) |
|
Subordinated Securities, effective interest 11.4%, 10/26 maturity |
|
5/5/2015 |
|
|
9.9 |
% |
|
|
4,353,347 |
|
|
|
3,048,698 |
|
|
Catamaran CLO 2016-1 Ltd.(3)(13) |
|
Subordinated Securities, effective interest 9.1%, 4/27 maturity |
|
12/21/2016 |
|
|
24.9 |
% |
|
|
9,717,150 |
|
|
|
7,067,073 |
|
|
Catamaran CLO 2018-1 Ltd(3)(13) |
|
Subordinated Securities, effective interest 14.5%, 10/31 maturity |
|
9/27/2018 |
|
|
24.8 |
% |
|
|
9,843,450 |
|
|
|
8,500,000 |
|
|
Total Investment in CLO Subordinated Securities |
|
|
|
|
|
|
|
|
|
$ |
51,073,520 |
|
|
$ |
39,851,160 |
|
CLO Rated-Note Investment
|
|
Investment15 |
|
Initial Acquisition Date |
|
Percentage Ownership |
|
|
Amortized Cost |
|
|
Fair Value |
|
||||
|
KCAP 2017-1A(6)(13) |
|
Class E Notes, 10.29% Cash, 3 month LIBOR (2.79%) + 7.50%, Due 12/29 |
|
10/24/2017 |
|
|
27.4 |
% |
|
$ |
4,407,106 |
|
|
$ |
4,473,840 |
|
|
|
|
|
|
|
|
|
|
|
|
|
|
|
|
|
|
|
|
Total Investment in CLO Rated-Note |
|
|
|
|
|
|
|
|
|
$ |
4,407,106 |
|
|
$ |
4,473,840 |
|
|
|
|
|
|
|
|
|
|
|
|
|
|
|
|
|
|
|
|
Total Investment in CLO Fund Securities (28% of net asset value at fair value) |
|
|
|
|
|
|
|
|
|
$ |
55,480,626 |
|
|
$ |
44,325,000 |
|
Asset Manager Affiliates
|
Principal Business |
|
Investment15 |
|
Initial Acquisition Date |
|
Percentage Ownership |
|
|
Cost |
|
|
Fair Value2 |
|
|||
|
Asset Manager Affiliates(8)(13)(17) |
|
Asset Management Company |
|
12/11/2006 |
|
|
100 |
% |
|
$ |
17,791,230 |
|
|
$ |
3,470,000 |
|
|
|
|
|
|
|
|
|
|
|
|
|
|
|
|
|
|
|
|
Total Investment in Asset Manager Affiliates (2% of net asset value at fair value) |
|
|
|
|
|
|
|
|
|
$ |
17,791,230 |
|
|
$ |
3,470,000 |
|
Joint Ventures
|
Principal Business |
|
Investment15 |
|
Initial Acquisition Date |
|
Percentage Ownership |
|
|
Cost |
|
|
Fair Value |
|
|||
|
|
Joint Venture |
|
7/19/2017 |
|
|
60 |
% |
|
$ |
24,914,858 |
|
|
$ |
18,390,440 |
|
|
|
|
|
|
|
|
|
|
|
|
|
|
|
|
|
|
|
|
|
BCP Great Lakes Holdings LP(17) Limited Partnership |
|
Joint Venture |
|
12/11/2018 |
|
|
55.6 |
% |
|
|
12,466,667 |
|
|
|
12,466,667 |
|
|
Total Investment in Joint Ventures (20% of net asset value at fair value) |
|
|
|
|
|
|
|
|
|
$ |
37,381,525 |
|
|
$ |
30,857,107 |
|
See accompanying notes to consolidated financial statements.
F-24
|
|
Investment15 |
|
Initial Acquisition Date |
|
Yield |
|
|
Par /Amortized Cost |
|
|
Fair Value2 |
|
||||
|
US Bank Money Market Account(7)(8) |
|
Money Market Account |
|
N/A |
|
|
0.20 |
% |
|
$ |
34,757,129 |
|
|
$ |
34,757,129 |
|
|
|
|
|
|
|
|
|
|
|
|
|
|
|
|
|
|
|
|
US Treasury Bill (Cusip:912796UH0)(8) |
|
U.S. Government Obligation |
|
|
|
|
1.04 |
% |
|
|
9,999,349 |
|
|
|
9,999,349 |
|
|
Total Short-term Investments (28% of net asset value at fair value) |
|
|
|
|
|
|
|
|
|
$ |
44,756,478 |
|
|
$ |
44,756,478 |
|
|
Total Investments4 |
|
|
|
|
|
|
|
|
|
$ |
327,152,104 |
|
|
$ |
273,308,349 |
|
|
1 |
A majority of the variable rate loans in the Company’s investment portfolio bear interest at a rate that may be determined by reference to either LIBOR or an alternate Base Rate (commonly based on the Federal Funds Rate or the Prime Rate), which typically resets semi-annually, quarterly, or monthly at the borrower’s option. The Borrower may also elect to have multiple interest reset periods for each loan. For each such loan, the Company has provided the weighted average annual stated interest rate in effect at December 31, 2018. As noted in the table above, 81% (based on par) of debt securities contain floors which range between 0.75% and 3.00%. |
|
2 |
Reflects the fair market value of all investments as of December 31, 2018, as determined by the Company’s Board of Directors. |
|
3 |
Non-U.S. company or principal place of business outside the U.S. |
|
4 |
The aggregate cost of investments for federal income tax purposes is approximately $327 million. The aggregate gross unrealized appreciation is approximately $0 million, the aggregate gross unrealized depreciation is approximately $53.8 million, and the net unrealized depreciation is approximately $53.8 million. |
|
5 |
Loan or debt security is on non-accrual status and therefore is considered non-income producing. |
|
6 |
An affiliate CLO Fund managed by an Asset Manager Affiliate (as such term is defined in the notes to the consolidated financial statements). |
|
7 |
Money market account. |
|
8 |
Qualified asset for purposes of section 55(a) of the Investment Company Act of 1940, as amended (the “1940 Act”). Qualifying assets represent approximately 72.0% of the total assets at December 31, 2018. |
|
9 |
As defined in the 1940 Act, the Company is deemed to be both an “Affiliated Person” and has “Control” of this portfolio company as the Company owns more than 25% of the portfolio company’s outstanding voting securities or has the power to exercise control over management or policies of such portfolio company (including through a management agreement). Other than for purposes of the 1940 Act, the Company does not believe that it has control over this portfolio company. |
|
10 |
Non-voting. |
|
11 |
CLO Subordinated Investments are entitled to periodic distributions which are generally equal to the remaining cash flow of the payments made by the underlying fund’s investments less contractual payments to debt holders and fund expenses. The estimated annualized effective yield indicated is based upon a current projection of the amount and timing of these distributions. Such projections are updated on a quarterly basis and the estimated effective yield is adjusted prospectively. |
|
12 |
Notice of redemption has been received for this security. |
|
13 |
Fair value of this investment was determined using significant unobservable inputs. |
|
14 |
As of December 31, 2018, this investment is owned by KCAP Funding I, LLC and was pledged to secure KCAP Funding I, LLC’s debt obligation pursuant to its senior secured revolving credit facility (the “Revolving Credit Facility”) with the Company, as the servicer, certain institutional lenders, State Bank and Trust Company, as the administrative agent, lead arranger and bookrunner, and CIBC Bank USA, as documentation agent. |
|
15 |
The Company's investments are generally acquired in private transactions exempt from registration under the Securities Act of 1933, as amended (the “Securities Act”) and, therefore, are generally subject to limitations on resale, and may be deemed to be “restricted securities'' under the Securities Act of 1933. |
|
16 |
The remaining collateral in these CLO Fund portfolios are illiquid and not producing meaningful cash flows, and thus, the Company’s investment in the CLO Subordinated securities are not currently receiving periodic cash distributions. Accordingly, the Company is no longer recording any investment income from these investments, and has thus noted the effective interest as not meaningful, or N/M. The fair value of the investment reflects the Company’s estimated share of the fair value of the underlying collateral. |
|
17 |
As defined in the 1940 Act, the Company is deemed to be both an “Affiliated Person” and has “Control” of this portfolio company as the Company owns more than 25% of the portfolio company’s outstanding voting securities or has the power to exercise control over management or policies of such portfolio company. |
See accompanying notes to consolidated financial statements.
F-25
PORTMAN RIDGE FINANCE CORPORATION
($ per share)
|
|
|
For the Year Ended December 31, |
|
|||||||||||||||||
|
|
|
20194 |
|
|
20184 |
|
|
20174 |
|
|
20164 |
|
|
20154 |
|
|||||
|
Per Share Data: |
|
|
|
|
|
|
|
|
|
|
|
|
|
|
|
|
|
|
|
|
|
Net asset value, at beginning of period |
|
$ |
4.23 |
|
|
$ |
4.87 |
|
|
$ |
5.24 |
|
|
$ |
5.82 |
|
|
$ |
6.94 |
|
|
Net investment (loss) income1 |
|
|
0.08 |
|
|
|
0.27 |
|
|
|
0.30 |
|
|
|
0.50 |
|
|
|
0.65 |
|
|
Net realized (losses) from investments1 |
|
|
(0.41 |
) |
|
|
(0.44 |
) |
|
|
(0.19 |
) |
|
|
(0.17 |
) |
|
|
(0.17 |
) |
|
Realized (losses) gains from extinguishment of debt1 |
|
|
(0.03 |
) |
|
|
(0.01 |
) |
|
|
(0.11 |
) |
|
|
- |
|
|
|
(0.01 |
) |
|
Net change in unrealized appreciation (depreciation) on investments1 |
|
|
0.03 |
|
|
|
(0.08 |
) |
|
|
0.09 |
|
|
|
(0.36 |
) |
|
|
(0.97 |
) |
|
Net (decrease) increase in net assets resulting from operations |
|
|
(0.33 |
) |
|
|
(0.26 |
) |
|
|
0.09 |
|
|
|
(0.03 |
) |
|
|
(0.50 |
) |
|
Net decrease in net assets resulting from distributions |
|
|
(0.32 |
) |
|
|
(0.40 |
) |
|
|
(0.48 |
) |
|
|
(0.59 |
) |
|
|
(0.63 |
) |
|
Net increase (decrease) in net assets relating to stock-based transactions |
|
|
(0.18 |
) |
(6) |
|
0.02 |
|
|
|
0.02 |
|
|
|
0.04 |
|
|
|
0.01 |
|
|
Net asset value, end of period |
|
$ |
3.40 |
|
|
$ |
4.23 |
|
|
$ |
4.87 |
|
|
$ |
5.24 |
|
|
$ |
5.82 |
|
|
Total net asset value return2 |
|
|
(12.1 |
)% |
|
|
(4.7 |
)% |
|
|
2.1 |
% |
|
|
0.2 |
% |
|
|
(7.1 |
)% |
|
Ratio/Supplemental Data: |
|
|
|
|
|
|
|
|
|
|
|
|
|
|
|
|
|
|
|
|
|
Per share market value at beginning of period |
|
$ |
3.46 |
|
|
$ |
3.41 |
|
|
$ |
3.98 |
|
|
$ |
4.07 |
|
|
$ |
6.82 |
|
|
Per share market value at end of period |
|
$ |
2.12 |
|
|
$ |
3.46 |
|
|
$ |
3.41 |
|
|
$ |
3.98 |
|
|
$ |
4.07 |
|
|
Total market return3 |
|
|
(29.5 |
)% |
|
|
13.2 |
% |
|
|
(2.3 |
)% |
|
|
12.3 |
% |
|
|
(31.1 |
)% |
|
Shares outstanding at end of period |
|
|
44,829,676 |
|
|
|
37,326,846 |
|
|
|
37,339,224 |
|
|
|
37,178,294 |
|
|
|
37,100,005 |
|
|
Net assets at end of period |
|
$ |
152,198,570 |
|
|
$ |
158,021,011 |
|
|
$ |
181,804,576 |
|
|
$ |
194,924,925 |
|
|
$ |
216,100,470 |
|
|
Portfolio turnover rate5 |
|
|
51.7 |
% |
|
|
38.3 |
% |
|
|
100.5 |
% |
|
|
34.3 |
% |
|
|
32.5 |
% |
|
Asset coverage ratio |
|
|
195 |
% |
|
|
249 |
% |
|
|
271 |
% |
|
|
205 |
% |
|
|
202 |
% |
|
Ratio of net investment income to average net assets |
|
|
2.0 |
% |
|
|
5.9 |
% |
|
|
5.8 |
% |
|
|
9.0 |
% |
|
|
9.8 |
% |
|
Ratio of total expenses to average net assets |
|
|
15.1 |
% |
|
|
10.1 |
% |
|
|
9.2 |
% |
|
|
8.6 |
% |
|
|
8.6 |
% |
|
Ratio of interest expense to average net assets |
|
|
5.3 |
% |
|
|
4.4 |
% |
|
|
4.1 |
% |
|
|
4.3 |
% |
|
|
4.7 |
% |
|
Ratio of non-interest expenses to average net assets |
|
|
9.8 |
% |
|
|
5.7 |
% |
|
|
5.1 |
% |
|
|
4.2 |
% |
|
|
3.9 |
% |
|
(1) |
Based on weighted average number of common shares outstanding for the period. |
|
(2) |
Total net asset value return equals the change in the ending of period net asset value per share over the beginning of period net asset value per share plus distributions (including any return of capital), divided by the beginning of period net asset value per share. |
|
(3) |
Total market return equals the change in the ending of period market price per share over the beginning of period price per share plus distributions (including any return of capital), divided by the beginning of period market price per share. |
|
(4) |
Totals may not sum due to rounding. |
|
(5) |
Portfolio turnover rate equals the year-to-date sales and paydowns over the average of the invested assets at fair value. |
|
(6) |
Includes the effects of the share issuance (at net asset value) from the acquisition of OHAI, while utilizing different share counts in calculating the other elements of the change in net asset value throughout the year. |
See accompanying notes to consolidated financial statements.
F-26
PORTMAN RIDGE FINANCE CORPORATION
NOTES TO CONSOLIDATED FINANCIAL STATEMENTS
|
1. |
ORGANIZATION |
Portman Ridge Finance Corporation (“Portman Ridge” or the “Company”), formerly known as KCAP Financial, Inc., is an externally managed, non-diversified closed-end investment company that has elected to be regulated as a business development company (“BDC”) under the Investment Company Act of 1940, as amended (the “1940 Act”). The Company was formed as a Delaware limited liability company on August 8, 2006 and, prior to the issuance of shares of the Company’s common stock in its initial public offering (“IPO”), converted to a corporation incorporated in Delaware on December 11, 2006.
The Company originates, structures, and invests in secured term loans, bonds or notes and mezzanine debt primarily in privately-held middle market companies but may also invest in other investments such as loans to publicly-traded companies, high-yield bonds, and distressed debt securities (collectively the “Debt Securities Portfolio”). The Company also invests in joint ventures and debt and subordinated securities issued by collateralized loan obligation funds (“CLO Fund Securities”). In addition, from time to time the Company may invest in the equity securities of privately held middle market companies and may also receive warrants or options to purchase common stock in connection with its debt investments.
The Company has elected to be treated and intends to continue to qualify as a regulated investment company (“RIC”) under Subchapter M of the Internal Revenue Code of 1986, as amended (the “Code”). To qualify as a RIC, the Company must, among other things, meet certain source-of-income, asset diversification and annual distribution requirements. As a RIC, the Company generally will not have to pay corporate-level U.S. federal income taxes on any income that it distributes in a timely manner to its stockholders.
On March 29, 2018, the Company’s Board of Directors (the “Board”), including a “required majority” (as such term is defined in Section 57(o) of the 1940 Act) of the Board, approved the modified asset coverage requirements set forth in Section 61(a)(2) of the 1940 Act, as amended by the Small Business Credit Availability Act (“SBCA”). As a result, the Company’s asset coverage requirement for senior securities changed from 200% to 150%, effective as of March 29, 2019. However, despite the SBCA, the Company will continue to be prohibited by the indenture governing the Company’s 6.125% Notes Due 2022 (as defined and discussed in Note 7 - “Borrowings” below) from making distributions on our common stock if the Company’s asset coverage, as defined in the 1940 Act, falls below 200%. In any such event, the Company would be prohibited from making distributions required in order to maintain its status as a RIC.
During the third quarter of 2017, the Company formed a joint venture with Freedom 3 Opportunities LLC (“Freedom 3 Opportunities”), an affiliate of Freedom 3 Capital LLC, to create KCAP Freedom 3 LLC (the “Joint Venture”). The Company and Freedom 3 Opportunities contributed approximately $37 million and $25 million, respectively, in assets to the Joint Venture, which in turn used the assets to capitalize a new fund (KCAP FC3 Senior Funding, L.L.C. or the “Fund”) managed by KCAP Management, LLC, one of the Company's indirectly wholly-owned Asset Manager Affiliate (as defined below) subsidiaries. In addition, the Fund used cash on hand and borrowings under a credit facility to purchase approximately $184 million of loans from the Company and the Company used the proceeds from such sale to redeem approximately $147 million in debt issued by KCAP Senior Funding I, LLC (“KCAP Senior Funding”). The Joint Venture may originate loans from time to time and sell them to the Fund.
During the fourth quarter of 2017, the Fund was refinanced through the issuance of senior and subordinated notes. The Joint Venture purchased 100% of the subordinated notes issued by the Fund. In connection with the refinancing, the Company received a cash distribution of $12.6 million, $11.8 million of which was a return of capital.
LibreMax Transaction
On November 8, 2018, the Company entered into an agreement with LibreMax Intermediate Holdings, LP (“LibreMax”) under which Commodore Holdings, LLC (“Commodore”), a wholly-owned subsidiary of the Company, sold the Company’s wholly-owned asset manager subsidiaries Katonah Debt Advisors, LLC (“Katonah Debt Advisors”), Trimaran Advisors, L.L.C. (“Trimaran Advisors”), and Trimaran Advisors Management, L.L.C. (“Trimaran Advisors Management” and, together with Katonah Debt Advisors and Trimaran Advisors, the “Disposed Manager Affiliates”), for a cash purchase price of approximately $37.9 million (the “LibreMax Transaction”). The LibreMax Transaction closed on December 31, 2018. As of December 31, 2019, the Company’s remaining wholly-owned asset management subsidiaries (the “Asset Manager Affiliates”) were comprised of Commodore, Katonah Management Holdings, LLC, Katonah X Management LLC, Katonah 2007-1 Management, LLC and KCAP Management, LLC. Prior to their sale in the LibreMax Transaction, the Disposed Manager Affiliates represented substantially all of the Company’s investment in the Asset Manager Affiliates.
F-27
On December 14, 2018, the Company entered into a stock purchase and transaction agreement (the “Externalization Agreement”) with BC Partners Advisors L.P. (“BCP”), an affiliate of BC Partners LLP, (“BC Partners”), through which Sierra Crest Investment Management LLC (the “Adviser”), an affiliate of BC Partners, became the Company’s investment adviser pursuant to an investment advisory Agreement (the “Advisory Agreement”) with the Company. At a special meeting of the Company’s stockholders (the “Special Meeting”) held on February 19, 2019, the Company’s stockholders approved the Advisory Agreement. The transactions contemplated by the Externalization Agreement closed on April 1, 2019 (the “Closing”), and the Company commenced operations as an externally managed BDC managed by the Adviser on that date.
Pursuant to the Externalization Agreement with BCP, the Adviser became the Company’s investment adviser in exchange for a cash payment from BCP, or its affiliate, of $25 million, or $0.669672 per share of the Company’s common stock, directly to the Company’s stockholders. In addition, the Adviser (or its affiliate) will use up to $10 million of the incentive fee actually paid to the Adviser prior to the second anniversary of the Closing to buy newly issued shares of the Company’s common stock at the most recently determined net asset value per share of the Company’s common stock at the time of such purchase. For the period of one year from the first day of the first quarter following the quarter in which the Closing occurred, the Adviser will permanently forego up to the full amount of the incentive fees earned by the Adviser without recourse against or reimbursement by the Company, to the extent necessary in order to achieve aggregate net investment income per common share of the Company for such one-year period to be at least equal to $0.40 per share, subject to certain adjustments.
On the date of the Closing, the Company changed its name from KCAP Financial, Inc. to Portman Ridge Finance Corporation and on April 2, 2019, began trading on the NASDAQ Global Select Market under the symbol “PTMN.”
On April 1, 2019, in connection with the Closing, all of the Company’s then-current directors resigned from their positions on the Board, with the exceptions of Dean Kehler and Christopher Lacovara. Prior to their resignations, the Board approved an increase in the size of the Board from seven members to eight members and appointed the following new individuals to serve on the Board: Graeme Dell; Alexander Duka; Ted Goldthorpe; George Grunebaum; David Moffitt; and Robert Warshauer. Additionally, in connection with the Closing all of the Company’s then-current officers resigned from their positions with the exceptions of Edward Gilpin and Daniel Gilligan. Effective as of the Closing, Ted Goldthorpe was appointed as President and Chief Executive Officer and Patrick Schafer was appointed as Chief Investment Officer of the Company. In May 2019, Mr. Gilligan resigned as Chief Compliance Officer and Andrew Devine was appointed Chief Compliance Officer.
About the Adviser
The Adviser is an affiliate of BC Partners. LibreMax owns a minority stake in the Adviser. Subject to the overall supervision of the Board, the Adviser is responsible for managing the Company’s business and activities, including sourcing investment opportunities, conducting research, performing diligence on potential investments, structuring the Company’s investments, and monitoring the Company’s portfolio companies on an ongoing basis through a team of investment professionals.
The Adviser seeks to invest on behalf of the Company in performing, well-established middle market businesses that operate across a wide range of industries (i.e., no concentration in any one industry). The Adviser employs fundamental credit analysis, targeting investments in businesses with relatively low levels of cyclicality and operating risk. The holding size of each position will generally be dependent upon a number of factors including total facility size, pricing and structure, and the number of other lenders in the facility. The Adviser has experience managing levered vehicles, both public and private, and seeks to enhance the Company’s returns through the use of leverage with a prudent approach that prioritizes capital preservation. The Adviser believes this strategy and approach offers attractive risk/return with lower volatility given the potential for fewer defaults and greater resilience through market cycles.
OHAI Transaction
On December 18, 2019, the Company completed its acquisition of OHA Investment Corporation (“OHAI”). In accordance with the terms of the merger agreement, each share of common stock, par value $0.001 per share, of OHAI (the “OHAI Common Stock”) issued and outstanding was converted into the right to receive (i) an amount in cash, without interest, equal to approximately $0.42, and (ii) 0.3688 shares of common stock, par value $0.01 per share, of the Company (plus any applicable cash in lieu of fractional shares). Each share of OHAI Common Stock issued and outstanding received, as additional consideration funded by the Adviser, an amount in cash, without interest, equal to approximately $0.15.
Pursuant to the merger agreement, if at any time within one year after the closing date of the transaction the Company’s common stock is trading at a price below 75% of its net asset value, we will initiate an open-market stock repurchase program of up to $10 million to support the trading price of the combined entity for up to one year from the date such program is announced.
F-28
Basis of Presentation
The accompanying consolidated financial statements have been prepared on the accrual basis of accounting in conformity with U.S. generally accepted accounting principles (“GAAP”). The Company is an investment company and follows accounting and reporting guidance in Accounting Standards Codification ("ASC") topic 946 - Financial Services - Investment Companies.
The consolidated financial statements reflect all adjustments, both normal and recurring which, in the opinion of management, are necessary for the fair presentation of the Company’s results of operations and financial condition for the periods presented. Furthermore, the preparation of the consolidated financial statements requires the Company to make significant estimates and assumptions including with respect to the fair value of investments that do not have a readily available market value. Actual results could differ from those estimates, and the differences could be material. The results of operations for the interim periods presented are not necessarily indicative of the operating results to be expected for the full year. Certain prior period amounts have been reclassified to conform to the current year presentation.
The Company consolidates the financial statements of its wholly-owned special purpose financing subsidiaries Great Lakes KCAP Funding I LLC, Kohlberg Capital Funding I LLC, KCAP Senior Funding I, LLC, KCAP Funding I Holdings, LLC and Great Lakes Portman Ridge Funding, LLC in its consolidated financial statements as they are operated solely for investment activities of the Company. The creditors of Great Lakes KCAP Senior Funding I, LLC and Great Lakes Portman Ridge Funding, LLC received security interests in the assets which are owned by them and such assets are not intended to be available to the creditors of Portman Ridge Finance Corporation., or any other affiliate. All of the borrowings of Kohlberg Capital Funding LLC I, KCAP Senior Funding I, LLC and Great Lakes KCAP Funding I, LLC have been fully repaid.
In accordance with Article 6 of Regulation S-X under the Securities Act of 1933, as amended (the “Securities Act”), and the Securities Exchange Act of 1934, as amended (the “Exchange Act”), the Company does not consolidate portfolio company investments, including those in which it has a controlling interest (e.g., the Asset Manager Affiliates), unless the portfolio company qualifies for consolidation.
The Asset Manager Affiliates previously qualified as a “significant subsidiary” and, as a result, the Company is required to include additional financial information regarding the Asset Manager Affiliates in its filings with the SEC. This additional financial information regarding the Asset Manager Affiliates does not directly impact the financial position or results of operations of the Company. Summarized financial information regarding the Asset Manager Affiliates is set forth in Note 5 to these financial statements.
The determination of the tax character of distributions is made on an annual (full calendar-year) basis at the end of the year based upon our taxable income for the full year and the distributions paid during the full year. Therefore, an estimate of tax attributes made on a quarterly basis may not be representative of the actual tax attributes of distributions for a full year.
It is the Company’s primary investment objective to generate current income and capital appreciation by lending directly to privately-held middle market companies. During the year ended December 31, 2019, the Company provided approximately $100.8 million to portfolio companies to support their growth objectives. Approximately $31.9 million of this support was contractually obligated. See also Note 9 – Commitments and Contingencies. As of December 31, 2019, the Company held loans it has made to 60 investee companies with aggregate principal amounts of approximately $230.3 million. The details of such loans have been disclosed on the audited consolidated schedule of investments as well as in Note 4 – Investments. In addition to providing loans to investee companies, from time to time the Company assists investee companies in securing financing from other sources by introducing such investee companies to sponsors or by, among other things, leading a syndicate of lenders to provide the investee companies with financing. During the year ended December 31, 2019, the Company did not recognize any fee income from such or similar activities.
Recently adopted accounting pronouncements
In March 2017, the Financial Accounting Standards Board (“FASB”) issued an Accounting Standards Update, ASU 2017-08, Receivables — Nonrefundable Fees and Other Costs (Subtopic 310-20), Premium Amortization on Purchased Callable Debt Securities (“ASU 2017-08”) which amends the amortization period for certain purchased callable debt securities held at a premium, shortening such period to the earliest call date. ASU 2017-08 does not require any accounting change for debt securities held at a discount; the discount continues to be amortized to maturity. ASU 2017-08 is effective for fiscal years, and interim periods within those fiscal years, beginning after December 15, 2018. The adoption of ASU 2017-08 did not have a material impact on the financial position or results of operations of the Company.
In February 2016, the FASB issued ASU 2016-02, Leases, and several amendments (collectively, “ASU 2016-02”), which requires lessees to recognize assets and liabilities arising from most operating leases on the consolidated statements of financial condition. For operating leases, a lessee is required to do the following: (a) recognize a right-of-use asset and a lease liability, initially measured at the present value of the lease payments, in the statement of financial condition; (b) recognize a single lease cost, calculated so that the cost of the lease is allocated over the lease term on a generally straight-line basis and (c) classify all cash payments within operating activities in the statement of cash flows. The guidance is effective for fiscal periods beginning after December 15, 2018. Effective January 1, 2019, the Company recorded a right of use asset (net of previously deferred rent expense) of approximately $3.3 million and a lease liability of approximately $3.7 million upon adoption of this standard.
F-29
During the second quarter of 2019, the Company recognized an impairment of approximately $1.4 million to reduce the right of use asset related to the Company’s legacy office lease to its estimated fair market value. The impairment charge which was recognized in the Company’s consolidated statement of operations during the second quarter of 2019. The lease was terminated during the fourth quarter of 2019.
Pending Accounting Pronouncements
In August 2018, the FASB issued Accounting Standards Update 2018-13, Fair Value Measurement (Topic 820): Disclosure Framework—Changes to the Disclosure Requirements for Fair Value Measurement (“ASU 2018-13”). The standard will modify the disclosure requirements for fair value measurements by removing, modifying, or adding certain disclosures. ASU 2018-13 is effective for annual reporting periods beginning after December 15, 2019, including interim periods within that reporting period. Early adoption is permitted upon issuance of this ASU 2018-13. We are permitted to early adopt any removed or modified disclosures upon issuance of ASU 2018-13 and delay adoption of the additional disclosures until their effective date. The adoption of ASU 2018-13 did not have a material impact on the financial position or results of operations of the Company.
Investments
Investment transactions are recorded on the applicable trade date. Realized gains or losses are determined using the specific identification method.
Valuation of Portfolio Investments. The Board is ultimately and solely responsible for making a good faith determination of the fair value of portfolio investments on a quarterly basis. Debt and equity securities for which market quotations are readily available are generally valued at such market quotations. Debt and equity securities that are not publicly traded or whose market price is not readily available are valued by the Board based on detailed analyses prepared by management and, in certain circumstances, third parties with valuation expertise. Valuations are conducted by management on 100% of the investment portfolio at the end of each quarter. The Company follows the provisions of ASC 820: Fair Value Measurements and Disclosures (“ASC 820: Fair Value”). This standard defines fair value, establishes a framework for measuring fair value, and expands disclosures about assets and liabilities measured at fair value. ASC 820: Fair Value defines “fair value” as the price that would be received to sell an asset or paid to transfer a liability in an orderly transaction between market participants at the measurement date.
The Company utilizes an independent valuation firm to provide third party valuation consulting services. Each quarter the independent valuation firm will perform third party valuations of the Company’s investments in material illiquid securities such that they are reviewed at least once during a trailing 12-month period. These third party valuation estimates are considered as one of the relevant data points in the Company’s determination of fair value. The Company intends to continue to engage an independent valuation firm in the future to provide certain valuation services, including the review of certain portfolio assets, as part of the quarterly and annual year-end valuation process.
The Board may consider other methods of valuation than those set forth below to determine the fair value of Level III investments as appropriate in conformity with GAAP. Due to the inherent uncertainty of determining the fair value of investments that do not have a readily available market value, the fair value of the Company’s investments may differ materially from the values that would have been used had a readily available market existed for such investments. Further, such investments may be generally subject to legal and other restrictions on resale or otherwise be less liquid than publicly traded securities. In addition, changes in the market environment and other events may occur over the life of the investments that may cause the value realized on such investments to be different from the currently assigned valuations.
The majority of the Company’s investment portfolio is composed of debt and equity securities with unique contract terms and conditions and/or complexity that requires a valuation of each individual investment that considers multiple levels of market and asset specific inputs, which may include historical and forecasted financial and operational performance of the individual investment, projected cash flows, market multiples, comparable market transactions, the priority of the security compared with those of other securities for such issuers, credit risk, interest rates, and independent valuations and reviews.
Debt Securities. To the extent that the Company’s investments are exchange traded and are priced or have sufficient price indications from normal course trading at or around the valuation date (financial reporting date), such pricing will be used to determine the fair value of the investments. Valuations from third party pricing services may be used as an indication of fair value, depending on the volume and reliability of the valuation, sufficient and reasonable correlation of bid and ask quotes, and, most importantly, the level of actual trading activity. However, if the Company has been unable to identify directly comparable market indices or other market guidance that correlate directly to the types of investments the Company owns, the Company will determine fair value using alternative methodologies such as available market data, as adjusted, to reflect the types of assets the Company owns, their structure, qualitative and credit attributes and other asset-specific characteristics.
F-30
The Company derives fair value for its illiquid investments that do not have indicative fair values based upon active trades primarily by using a present value technique that discounts the estimated contractual cash flows for the subject assets with discount rates imputed by broad market indices, bond spreads and yields for comparable issuers relative to the subject assets (the “Income Approach”). The Company also considers, among other things, recent loan amendments or other activity specific to the subject asset. Discount rates applied to estimated contractual cash flows for an underlying asset vary by specific investment, industry, priority and nature of the debt security (such as the seniority or security interest of the debt security) and are assessed relative to leveraged loan and high-yield bond indices, at the valuation date. The Company has identified these indices as benchmarks for broad market information related to its loan and debt securities. Because the Company has not identified any market index that directly correlates to the loan and debt securities held by the Company and therefore uses these benchmark indices, these market indices may require significant adjustment to better correlate such market data for the calculation of fair value of the investment under the Income Approach. Such adjustments require judgment and may be material to the calculation of fair value. Further adjustments to the discount rate may be applied to reflect other market conditions or the perceived credit risk of the borrower. When broad market indices are used as part of the valuation methodology, their use is subject to adjustment for many factors, including priority, collateral used as security, structure, performance and other quantitative and qualitative attributes of the asset being valued. The resulting present value determination is then weighted along with any quotes from observable transactions and broker/pricing quotes. If such quotes are indicative of actual transactions with reasonable trading volume at or near the valuation date that are not liquidation or distressed sales, relatively more reliance will be put on such quotes to determine fair value. If such quotes are not indicative of market transactions or are insufficient as to volume, reliability, consistency or other relevant factors, such quotes will be compared with other fair value indications and given relatively less weight based on their relevancy. Other significant assumptions, such as coupon and maturity, are asset-specific and are noted for each investment in the Consolidated Schedules of Investments included herein.
Equity Securities. The Company’s equity securities in portfolio companies for which there is no liquid public market are carried at fair value based on the enterprise value of the portfolio company, which is determined using various factors, including EBITDA (earnings before interest, taxes, depreciation and amortization) and discounted cash flows from operations, less capital expenditures and other pertinent factors, such as recent offers to purchase a portfolio company’s securities or other liquidation events. The determined fair values are generally discounted to account for restrictions on resale and minority ownership positions. In the event market quotations are readily available for the Company’s equity securities in public companies, those investments may be valued using the Market Approach (as defined below). In cases where the Company receives warrants to purchase equity securities, a market standard Black-Scholes model is utilized.
The significant inputs used to determine the fair value of equity securities include prices, EBITDA and cash flows after capital expenditures for similar peer comparables and the investment entity itself. Equity securities are classified as Level III, when there is limited activity or less transparency around inputs to the valuation given the lack of information related to such equity investments held in nonpublic companies. Significant assumptions observed for comparable companies are applied to relevant financial data for the specific investment. Such assumptions, such as model discount rates or price/earnings multiples, vary by the specific investment, equity position and industry and incorporate adjustments for risk premiums, liquidity and company specific attributes. Such adjustments require judgment and may be material to the calculation of fair value.
Derivatives. The Company recognizes all derivative instruments as assets or liabilities at fair value in its financial statements. Derivative contracts entered into by the Company are not designated as hedging instruments, and as a result the Company presents changes in fair value and realized gains or losses through current period earnings. Derivative instruments are measured in terms of the notional contract amount and derive their value based upon one or more underlying instruments. Derivative instruments are subject to various risks similar to non-derivative instruments including market, credit, liquidity, and operational risks. The Company manages these risks on an aggregate basis as part of its risk management process. The derivatives may require the Company to pay or receive an upfront fee or premium. These upfront fees or premiums are carried forward as cost or proceeds to the derivatives. The Company generally records a realized gain or loss on the expiration, termination, or settlement of a derivative contract. The periodic payments for the securities Swap and Option Agreement (excluding collateral) are included as a realized gain or loss.
The Company values derivative contracts using various pricing models that take into account the terms of the contract (including notional amount and contract maturity) and observable and unobservable inputs such as interest rates and changes in fair value of the reference asset.
Asset Manager Affiliates. The Company’s investments in its wholly-owned asset management companies, the Asset Manager Affiliates, are carried at fair value, which is primarily determined utilizing the discounted cash flow approach, which incorporates different levels of discount rates depending on the hierarchy of fees earned (including the likelihood of realization of senior, subordinate and incentive fees) and prospective modeled performance. Such valuation takes into consideration an analysis of comparable asset management companies and the amount of assets under management. The Asset Manager Affiliates are classified as a Level III investment. Any change in value from period to period is recognized as net change in unrealized appreciation or depreciation. The Company sold substantially all of its investment in the Asset Manager Affiliates on December 31, 2018.
CLO Fund Securities. The Company typically makes a minority investment in the most junior class of securities of CLO Funds. The investments held by CLO Funds generally relate to non-investment grade credit instruments issued by corporations.
The Company’s investments in CLO Fund Securities are carried at fair value, which is based either on (i) the present value of the net expected cash inflows for interest income and principal repayments from underlying assets and cash outflows for interest expense,
F-31
debt pay-down and other fund costs for the CLO Funds that are approaching or past the end of their reinvestment period and therefore are selling assets and/or using principal repayments to pay down CLO Fund debt (or will begin to do so shortly), and for which there continue to be net cash distributions to the class of securities owned by the Company, a Discounted Cash Flow approach, (ii) a discounted cash flow model that utilizes prepayment and loss assumptions based on historical experience and projected performance, economic factors, the characteristics of the underlying cash flow and comparable yields for similar securities or preferred shares to those in which the Company has invested, or (iii) indicative prices provided by the underwriters or brokers who arrange CLO Funds, a Market Approach. The Company recognizes unrealized appreciation or depreciation on the Company’s investments in CLO Fund Securities as comparable yields in the market change and/or based on changes in net asset values or estimated cash flows resulting from changes in prepayment or loss assumptions in the underlying collateral pool. As each investment in CLO Fund Securities ages, the expected amount of losses and the expected timing of recognition of such losses in the underlying collateral pool are updated and the revised cash flows are used in determining the fair value of the CLO Fund investment. The Company determines the fair value of its investments in CLO Fund Securities on a security-by-security basis.
Due to the individual attributes of each CLO Fund Security, they are classified as a Level III investment unless specific trading activity can be identified at or near the valuation date. When available, observable market information will be identified, evaluated and weighted accordingly in the application of such data to the present value models and fair value determination. Significant assumptions to the present value calculations include default rates, recovery rates, prepayment rates, investment/reinvestment rates and spreads and the discount rate by which to value the resulting underlying cash flows. Such assumptions can vary significantly, depending on market data sources which often vary in depth and level of analysis, understanding of the CLO market, detailed or broad characterization of the CLO market and the application of such data to an appropriate framework for analysis. The application of data points are based on the specific attributes of each individual CLO Fund Security’s underlying assets, historic, current and prospective performance, vintage, and other quantitative and qualitative factors that would be evaluated by market participants. The Company evaluates the source of market data for reliability as an indicative market input, consistency amongst other inputs and results and also the context in which such data is presented.
For rated note tranches of CLO Fund Securities (those above the junior class) without transactions to support a fair value for the specific CLO Fund and tranche, fair value is based on discounting estimated bond payments at current market yields, which may reflect the adjusted yield on the leveraged loan index for similarly rated tranches, as well as prices for similar tranches for other CLO Funds and also other factors such as indicative prices provided by underwriters or brokers who arrange CLO Funds, and the default and recovery rates of underlying assets in the CLO Fund, as may be applicable. Such model assumptions may vary and incorporate adjustments for risk premiums and CLO Fund specific attributes.
Short-term investments. Short-term investments are generally comprised of money market accounts, time deposits, and U.S. treasury bills.
Joint Ventures. The Company carries investments in joint ventures (“Joint Ventures”) at fair value based upon the fair value of the investments held by the joint venture. See Note 4 below, for more information regarding the Joint Ventures.
Cash. The Company defines cash as demand deposits. The Company places its cash with financial institutions, and, at times, cash held in checking accounts may exceed the Federal Deposit Insurance Corporation insured limit.
Restricted Cash. Restricted cash and cash equivalents (e.g., money market funds) generally consists of cash held for interest and principal payments on the Company’s borrowings.
Interest Income. Interest income, including the amortization of premium and accretion of discount and accrual of payment-in-kind (“PIK”) interest, is recorded on the accrual basis to the extent that such amounts are expected to be collected. The Company generally places a loan or security on non-accrual status and ceases recognizing interest income on such loan or security when a loan or security becomes 90 days or more past due or if the Company otherwise does not expect the debtor to be able to service its debt obligations. For investments with PIK interest, which represents contractual interest accrued and added to the principal balance that generally becomes due at maturity, we will not accrue PIK interest if the portfolio company valuation indicates that the PIK interest is not collectible (i.e. via a partial or full non-accrual). Loans which are on partial or full non-accrual remain in such status until the borrower has demonstrated the ability and intent to pay contractual amounts due or such loans become current. As of December 31, 2019, seven of our debt investments were on non-accrual status.
Distributions from Asset Manager Affiliates. The Company records distributions from the Asset Manager Affiliates on the declaration date, which represents the ex-dividend date. Distributions in excess of tax-basis earnings and profits of the distributing affiliate company are recognized as tax-basis return of capital. For interim periods, the Company estimates the tax attributes of any distributions as being either from tax-basis earnings and profits (i.e., dividend income) or return of capital (i.e., adjustment to the Company’s cost basis in the Asset Manager Affiliates). The final determination of the tax attributes of distributions from the Asset Manager Affiliates is made on an annual (full calendar year) basis at the end of the year based upon taxable income and distributions for the full-year. Therefore, any estimate of tax attributes of distributions made on a quarterly basis may not be representative of the actual tax attributes of distributions for a full year.
F-32
Investment Income on CLO Fund Securities. The Company generates investment income from its investments in the most junior class of securities issued by CLO Funds (typically preferred shares or subordinated securities). The Company’s CLO Fund junior class securities are subordinated to senior note holders who typically receive a stated interest rate of return based on a floating rate index, such as the London Interbank Offered Rate (“LIBOR”) on their investment. The CLO Funds are leveraged funds and any excess cash flow or “excess spread” (interest earned by the underlying securities in the fund less payments made to senior note holders and less fund expenses and management fees) is paid to the holders of the CLO Fund’s subordinated securities or preferred shares.
GAAP-basis investment income on CLO equity investments is recorded using the effective interest method in accordance with the provisions of ASC 325-40, based on the anticipated yield and the estimated cash flows over the projected life of the investment. Yields are revised when there are changes in actual or estimated projected future cash flows due to changes in prepayments and/or re-investments, credit losses or asset pricing. Changes in estimated yield are recognized as an adjustment to the estimated yield prospectively over the remaining life of the investment from the date the estimated yield was changed. Accordingly, investment income recognized on CLO equity securities in the GAAP statement of operations differs from both the tax–basis investment income and from the cash distributions actually received by the Company during the period.
For non-junior class CLO Fund Securities, interest is earned at a fixed spread relative to the LIBOR index.
Investment income on Joint Ventures. The Company recognizes investment income on its investment in the Joint Ventures based upon its share of the estimated earnings and profits of the Joint Venture on the ex-dividend or ex-distribution date. The final determination of the tax attributes of distributions from the Joint Ventures is made on an annual (full calendar year) basis at the end of the year based upon taxable income and distributions for the full year. Therefore, any estimate of tax attributes of distributions made on an interim basis may not be representative of the actual tax attributes of distributions for the full year.
Capital Structuring Service Fees. The Company may earn ancillary structuring and other fees related to the origination, investment, disposition or liquidation of debt and investment securities. Generally, the Company will capitalize loan origination fees, then amortize these fees into interest income over the term of the loan using the effective interest rate method, recognize prepayment and liquidation fees upon receipt and equity structuring fees as earned, which generally occurs when an investment transaction closes.
Debt Issuance Costs. Debt issuance costs represent fees and other direct costs incurred in connection with the Company’s borrowings. These amounts are capitalized, presented as a reduction of debt, and amortized using the effective interest method over the expected term of the borrowing.
Extinguishment of debt. The Company must derecognize a liability if and only if it has been extinguished through delivery of cash, delivery of other financial assets, delivery of goods or services, or reacquisition by the Company of its outstanding debt securities whether the securities are cancelled or held. If the debt contains a cash conversion option, the Company must allocate the consideration transferred and transaction costs incurred to the extinguishment of the liability component and the reacquisition of the equity component and recognize a gain or loss in the statement of operations.
Expenses. Prior to April 1, 2019, the Company was internally managed and expensed costs, as incurred, with regard to the running of its operations. Primary operating expenses included employee salaries and benefits, the costs of identifying, evaluating, negotiating, closing, monitoring and servicing the Company’s investments and related overhead charges and expenses, including rental expense, and any interest expense incurred in connection with borrowings. Since April 1, 2019, the Company has been externally managed and in connection with the Advisory Agreement, pays the Adviser certain investment advisory fees and reimburses the Adviser and Administrator for certain expenses incurred in connection with the services they provide. See Note 6 “Related Party Transactions - Payment of Expenses under the Advisory and Administration Agreements.” Through December 31, 2018, the Company and the Asset Manager Affiliates shared office space and certain other operating expenses. The Company entered into an overhead allocation agreement with the Asset Manager Affiliates (“Overhead Allocation Agreement”) which provided for the sharing of such expenses based on an allocation of office lease costs and the ratable usage of other shared resources. Until it’s termination in the fourth quarter of 2019, the Company continued to bear the costs associated with the office lease entered into by the Company prior to the Closing.
Shareholder Distributions. Distributions to common stockholders are recorded on the ex-dividend date. The amount of distributions, if any, is determined by the Board each quarter. The Company has adopted a dividend reinvestment plan (the DRIP) that provides for reinvestment of its distributions on behalf of its stockholders, unless a stockholder “opts out” of the DRIP to receive cash in lieu of having their cash distributions automatically reinvested in additional shares of the Company’s common stock.
In accordance with the provisions of ASC 260, “Earnings per Share” (“ASC 260”), basic earnings per share is computed by dividing earnings available to common shareholders by the weighted average number of shares outstanding during the period. Other potentially dilutive common shares, and the related impact to earnings, are considered when calculating earnings per share on a diluted basis.
F-33
The following information sets forth the computation of basic and diluted net increase (decrease) in stockholders’ equity per share for the years ended December 31, 2019, 2018 and 2017:
|
|
|
|
|
|
|
|
||||||
|
|
|
Year Ended December 31, |
|
|||||||||
|
|
|
2019 |
|
|
2018 |
|
|
2017 |
|
|||
|
Net (decrease) increase in net assets resulting from operations |
|
$ |
(12,499,961 |
) |
|
$ |
(9,571,546 |
) |
|
$ |
3,388,082 |
|
|
Net increase in net assets allocated to unvested share awards |
|
|
— |
|
|
|
58,220 |
|
|
|
(27,288 |
) |
|
Net (decrease) increase in net assets available to common stockholders |
|
$ |
(12,499,961 |
) |
|
$ |
(9,513,326 |
) |
|
$ |
3,360,794 |
|
|
Weighted average number of common and common stock equivalent shares outstanding for diluted shares computation |
|
|
37,641,650 |
|
|
|
37,356,241 |
|
|
|
37,235,130 |
|
|
Net (decrease) increase in net assets per basic common shares: |
|
|
|
|
|
|
|
|
|
|
|
|
|
Net (decrease) increase in net assets from operations |
|
$ |
(0.33 |
) |
|
$ |
(0.26 |
) |
|
$ |
0.09 |
|
|
Net (decrease) increase in net assets per diluted shares: |
|
|
|
|
|
|
|
|
|
|
|
|
|
Net (decrease) increase in net assets from operations |
|
$ |
(0.33 |
) |
|
$ |
(0.26 |
) |
|
$ |
0.09 |
|
Share-based awards that contain non-forfeitable rights to dividends or dividend equivalents, whether paid or unpaid, are participating securities and included in the computation of both basic and diluted earnings per share. Grants of restricted stock awards to the Company’s employees and directors are considered participating securities when there are earnings in the period and the earnings per share calculations include outstanding unvested restricted stock awards in the basic weighted average shares outstanding calculation.
There were 0 and 30,000 options to purchase shares of common stock considered for the computation of the diluted per share information for the years ended December 31, 2019 and 2018. Since the effects are anti-dilutive for both periods, the options were not included in the computation. These stock options were cancelled in connection with the Externalization.
|
4. |
INVESTMENTS |
The following table shows the Company’s portfolio by security type at December 31, 2019 and December 31, 2018:
|
|
|
December 31, 2019 |
|
|
December 31, 2018 |
|
||||||||||||||||||
|
|
Cost/Amortized Cost |
|
|
Fair Value |
|
|
%¹ |
|
|
Cost/Amortized Cost |
|
|
Fair Value |
|
|
%¹ |
|
|||||||
|
Short-term investments² |
|
$ |
4,207,107 |
|
|
$ |
4,207,107 |
|
|
|
2 |
|
|
$ |
44,756,478 |
|
|
$ |
44,756,478 |
|
|
|
17 |
|
|
Senior Secured Loan |
|
|
91,245,574 |
|
|
|
88,788,639 |
|
|
|
32 |
|
|
|
86,040,921 |
|
|
|
77,616,209 |
|
|
|
28 |
|
|
Junior Secured Loan |
|
|
100,655,341 |
|
|
|
95,188,373 |
|
|
|
34 |
|
|
|
76,223,561 |
|
|
|
70,245,535 |
|
|
|
26 |
|
|
Senior Unsecured Bond |
|
|
620,145 |
|
|
|
403,615 |
|
|
|
— |
|
|
|
— |
|
|
|
— |
|
|
|
— |
|
|
Subordinated Note |
|
|
2,165,304 |
|
|
|
2,422,281 |
|
|
|
1 |
|
|
|
— |
|
|
|
— |
|
|
|
— |
|
|
CLO Fund Securities |
|
|
46,618,717 |
|
|
|
31,968,202 |
|
|
|
12 |
|
|
|
55,480,626 |
|
|
|
44,325,000 |
|
|
|
16 |
|
|
Equity Securities |
|
|
22,160,993 |
|
|
|
9,864,419 |
|
|
|
4 |
|
|
|
9,477,763 |
|
|
|
2,038,020 |
|
|
|
1 |
|
|
Asset Manager Affiliates³ |
|
|
17,791,230 |
|
|
|
— |
|
|
|
— |
|
|
|
17,791,230 |
|
|
|
3,470,000 |
|
|
|
1 |
|
|
Joint Ventures |
|
|
48,594,539 |
|
|
|
45,087,967 |
|
|
|
16 |
|
|
|
37,381,525 |
|
|
|
30,857,107 |
|
|
|
11 |
|
|
Derivatives |
|
|
30,609 |
|
|
|
(33,437 |
) |
|
|
— |
|
|
|
— |
|
|
|
— |
|
|
|
— |
|
|
Total |
|
$ |
334,089,559 |
|
|
$ |
277,897,166 |
|
|
|
100 |
% |
|
$ |
327,152,104 |
|
|
$ |
273,308,349 |
|
|
|
100 |
% |
|
1 |
Represents percentage of total portfolio at fair value. |
|
2 |
Includes money market accounts and U.S. treasury bills for December 31, 2018. |
|
3 |
Represents the equity investment in the Asset Manager Affiliates. |
F-34
The industry concentrations based on the fair value of the Company’s investment portfolio as of December 31, 2019 and 2018, were as follows:
|
|
|
December 31, 2019 |
|
|
December 31, 2018 |
|
||||||||||||||||||
|
|
Cost/Amortized Cost |
|
|
Fair Value |
|
|
%¹ |
|
|
Cost/Amortized Cost |
|
|
Fair Value |
|
|
% |
|
|||||||
|
Aerospace and Defense |
|
$ |
15,706,988 |
|
|
$ |
16,342,388 |
|
|
|
6 |
|
|
$ |
5,434,927 |
|
|
$ |
4,049,940 |
|
|
|
1 |
|
|
Asset Management Company 2 |
|
|
17,791,230 |
|
|
|
— |
|
|
|
- |
|
|
|
17,791,230 |
|
|
|
3,470,000 |
|
|
|
1 |
|
|
Automotive |
|
|
5,504,508 |
|
|
|
5,541,823 |
|
|
|
2 |
|
|
|
— |
|
|
|
— |
|
|
|
— |
|
|
Banking, Finance, Insurance & Real Estate |
|
|
4,679,345 |
|
|
|
4,554,055 |
|
|
|
2 |
|
|
|
8,831,841 |
|
|
|
8,733,933 |
|
|
|
3 |
|
|
Beverage, Food and Tobacco |
|
|
7,899,181 |
|
|
|
7,750,305 |
|
|
|
3 |
|
|
|
5,963,334 |
|
|
|
5,796,506 |
|
|
|
2 |
|
|
Capital Equipment |
|
|
7,450,117 |
|
|
|
6,453,900 |
|
|
|
2 |
|
|
|
10,888,432 |
|
|
|
9,831,391 |
|
|
|
4 |
|
|
Chemicals, Plastics & Rubber |
|
|
345,833 |
|
|
|
389,320 |
|
|
|
0 |
|
|
|
4,862,063 |
|
|
|
4,801,645 |
|
|
|
2 |
|
|
CLO Fund Securities |
|
|
46,618,717 |
|
|
|
31,968,202 |
|
|
|
12 |
|
|
|
55,480,626 |
|
|
|
44,325,000 |
|
|
|
16 |
|
|
Construction & Building |
|
|
— |
|
|
|
— |
|
|
|
- |
|
|
|
1,400,223 |
|
|
|
1,394,163 |
|
|
|
1 |
|
|
Consumer goods: Durable |
|
|
3,413,107 |
|
|
|
2,558,619 |
|
|
|
1 |
|
|
|
1,140,500 |
|
|
|
364,240 |
|
|
|
0 |
|
|
Containers, Packaging and Glass |
|
|
2,831,640 |
|
|
|
2,616,480 |
|
|
|
1 |
|
|
|
1,434,568 |
|
|
|
1,440,525 |
|
|
|
1 |
|
|
Electronics |
|
|
12,511,345 |
|
|
|
13,636,090 |
|
|
|
5 |
|
|
|
3,007,500 |
|
|
|
3,007,500 |
|
|
|
1 |
|
|
Energy: Oil & Gas |
|
|
12,522,303 |
|
|
|
4,919,950 |
|
|
|
2 |
|
|
|
16,827,204 |
|
|
|
8,946,568 |
|
|
|
3 |
|
|
Environmental Industries |
|
|
3,998,816 |
|
|
|
3,924,947 |
|
|
|
1 |
|
|
|
8,371,180 |
|
|
|
6,939,794 |
|
|
|
3 |
|
|
Forest Products & Paper |
|
|
1,570,609 |
|
|
|
1,534,240 |
|
|
|
1 |
|
|
|
1,564,583 |
|
|
|
1,553,920 |
|
|
|
1 |
|
|
Healthcare, Education and Childcare |
|
|
9,353,548 |
|
|
|
9,136,345 |
|
|
|
3 |
|
|
|
— |
|
|
|
— |
|
|
|
— |
|
|
Healthcare & Pharmaceuticals |
|
|
42,461,467 |
|
|
|
33,637,136 |
|
|
|
12 |
|
|
|
38,638,822 |
|
|
|
32,287,288 |
|
|
|
12 |
|
|
High Tech Industries |
|
|
18,816,125 |
|
|
|
17,481,155 |
|
|
|
6 |
|
|
|
23,971,435 |
|
|
|
23,662,459 |
|
|
|
9 |
|
|
Hotel, Gaming & Leisure |
|
|
— |
|
|
|
— |
|
|
|
- |
|
|
|
400,000 |
|
|
|
1,000 |
|
|
|
0 |
|
|
Joint Ventures |
|
|
48,594,539 |
|
|
|
45,087,967 |
|
|
|
16 |
|
|
|
37,381,525 |
|
|
|
30,857,107 |
|
|
|
11 |
|
|
Media: Advertising, Printing & Publishing |
|
|
— |
|
|
|
— |
|
|
|
- |
|
|
|
6,113,852 |
|
|
|
5,590,863 |
|
|
|
2 |
|
|
Media: Broadcasting & Subscription |
|
|
4,614,647 |
|
|
|
4,567,266 |
|
|
|
2 |
|
|
|
— |
|
|
|
— |
|
|
|
— |
|
|
Media: Diversified & Production |
|
|
2,886,325 |
|
|
|
2,887,230 |
|
|
|
1 |
|
|
|
— |
|
|
|
— |
|
|
|
— |
|
|
Metals & Mining |
|
|
1,180,977 |
|
|
|
1,319,500 |
|
|
|
0 |
|
|
|
— |
|
|
|
— |
|
|
|
— |
|
|
Personal, Food and Miscellaneous Services |
|
|
2,534,318 |
|
|
|
2,829,436 |
|
|
|
1 |
|
|
|
— |
|
|
|
— |
|
|
|
— |
|
|
Services: Business |
|
|
22,726,850 |
|
|
|
21,415,794 |
|
|
|
8 |
|
|
|
10,398,710 |
|
|
|
9,213,416 |
|
|
|
3 |
|
|
Services: Consumer |
|
|
4,512,488 |
|
|
|
4,493,529 |
|
|
|
2 |
|
|
|
— |
|
|
|
— |
|
|
|
— |
|
|
Telecommunication |
|
|
8,751,454 |
|
|
|
8,164,050 |
|
|
|
3 |
|
|
|
8,351,775 |
|
|
|
8,343,919 |
|
|
|
3 |
|
|
Textiles and Leather |
|
|
12,389,673 |
|
|
|
12,180,290 |
|
|
|
4 |
|
|
|
10,140,662 |
|
|
|
9,940,294 |
|
|
|
4 |
|
|
Money Market Accounts |
|
|
4,207,107 |
|
|
|
4,207,107 |
|
|
|
2 |
|
|
|
34,757,129 |
|
|
|
34,757,129 |
|
|
|
13 |
|
|
Transportation: Cargo |
|
|
8,216,303 |
|
|
|
8,300,043 |
|
|
|
3 |
|
|
|
4,000,634 |
|
|
|
4,000,400 |
|
|
|
1 |
|
|
U.S. Government Obligations |
|
|
— |
|
|
|
— |
|
|
|
- |
|
|
|
9,999,349 |
|
|
|
9,999,349 |
|
|
|
4 |
|
|
Total |
|
$ |
334,089,558 |
|
|
$ |
277,897,166 |
|
|
|
100 |
% |
|
$ |
327,152,104 |
|
|
$ |
273,308,349 |
|
|
|
100 |
% |
|
1 |
Calculated as a percentage of total portfolio at fair value. |
|
2 |
Represents the equity investment in the Asset Manager Affiliates. |
The Company may invest up to 30% of the investment portfolio in “non-qualifying” opportunistic investments, including investments in debt and equity securities of CLO Funds, distressed debt or debt and equity securities of large cap public companies. Within this 30% of the portfolio, the Company also may invest in debt of middle market companies located outside of the United States.
F-35
At December 31, 2019 and 2018, the total amount of non-qualifying assets was approximately 25.3% and 28.0% of total assets, respectively. A significant portion of non-qualifying assets were foreign investments which were approximately 10.6% and 16.5%, respectively, of the Company’s total assets (including the Company’s investments in CLO Funds, which are typically domiciled outside the U.S. and represented approximately 10.3% and 15.5% of its total assets on such dates, respectively).
Investments in CLO Fund Securities
The Company has made minority investments in the most junior class of securities (typically preferred shares or subordinated securities) of CLO Funds. These securities also are entitled to recurring distributions which generally equal the net remaining cash flow of the payments made by the underlying CLO Fund’s securities less contractual payments to senior bond holders, management fees and CLO Fund expenses. CLO Funds invest primarily in broadly syndicated non-investment grade loans, high-yield bonds and other credit instruments of corporate issuers. The underlying assets in each of the CLO Funds in which the Company has an investment are generally diversified secured or unsecured corporate debt. The CLO Funds are leveraged funds and any excess cash flow or “excess spread” (interest earned by the underlying securities in the fund less payments made to senior bond holders, fund expenses and management fees) is paid to the holders of the CLO Fund’s subordinated securities or preferred shares.
On October 31, 2017, the Company purchased an additional $4.3 million of notional amount of subordinated notes issued by Catamaran CLO 2014-1 at a cost of $5.4 million.
In December 2017, the Company purchased an additional $201,000 of notional amount of subordinated notes issued by Catamaran CLO 2013-1 at a cost of $201,000.
In December 2017, the Company sold $5.0 million par value of the subordinated notes of Catamaran CLO 2014-1 for $3.0 million.
In September 2018, the Company purchased $10 million par value of the subordinated notes of Catamaran CLO 2018-1 at a cost of approximately $9.5 million.
In December 2018, the Company received $2.5 million of notional amount of subordinated notes of Catamaran 2013-1 with a fair value of $1.4 million and $3.4 million of notional amount of subordinated notes of Catamaran 2014-1 with a fair value of $1.9 million, as consideration for the repayment of a portion of the loans to Trimaran Advisors.
On December 19, 2017, the Company, in its capacity as the holder of all of the outstanding preferred shares of Katonah 2007-1 CLO Ltd. (“Katonah 2007-1”), exercised its right to cause Katonah 2007-1 to redeem all of its outstanding indebtedness through the sale of its investments and otherwise wind up its business. Katonah 2007-1 was fully liquidated and dissolved in the fourth quarter of 2018. Accordingly, the Company recorded a realized loss during the fourth quarter of 2018 of approximately $10.1 million on its investment in Katonah 2007-1 and a corresponding unrealized gain of the same amount in order to reverse the previously recorded unrealized depreciation with respect to the investment.
Similarly, during the fourth quarter of 2018, each of Grant Grove CLO, Ltd., Trimaran CLO VII, Ltd., and Catamaran CLO 2012-1 Ltd. were fully liquidated and dissolved, and the Company recorded a realized loss of approximately $6.4 million and a corresponding unrealized gain of the same amount in order to reverse the previously recorded unrealized depreciation with respect to these investments.
In the first quarter of 2019, the Company sold $2.0 million notional amount of subordinated notes of Catamaran CLO 2014-1 for $800,000.
In June 2019, the Company sold $4.8 million par value of the CLO Rated note issued by Great Lakes KCAP F3C Senior, LLC for $4.4 million.
As of December 31, 2019 all of the Company’s investments in CLO Fund securities were making distributions to the Company.
F-36
The following table details investments in affiliates at December 31, 2019 and 2018:
|
|
|
Industry Classification |
|
Fair Value at December 31, 2018 |
|
|
Purchases/ (Sales) of or Advances/ (Distributions) |
|
|
Net Accretion |
|
|
Transfers In/(Out) of Affiliates |
|
|
Net change in unrealized Gain/(Loss) |
|
|
Realized Gain/(Loss) |
|
|
Fair Value at December 31, 2019 |
|
|
Principal at December 31, 2019 |
|
|
Interest Income |
|
|
Dividend Income |
|
||||||||||
|
Asset Manager Affiliates(4)(6) |
|
Asset Management Company |
|
$ |
3,470,000 |
|
|
|
— |
|
|
|
— |
|
|
|
— |
|
|
|
— |
|
|
$ |
(3,470,000 |
) |
|
$ |
— |
|
|
$ |
17,791,230 |
|
|
$ |
— |
|
|
$ |
— |
|
|
Tank Partners Holdings, LLC(3)(4)(5)(8) |
|
Energy: Oil & Gas |
|
|
1,000 |
|
|
|
6,228,000 |
|
|
|
— |
|
|
|
— |
|
|
|
(5,064,000 |
) |
|
|
(1,165,000 |
) |
|
|
— |
|
|
|
49,000 |
|
|
|
— |
|
|
|
— |
|
|
Tank Partners Holdings, LLC(3)(4)(5) |
|
Energy: Oil & Gas |
|
|
— |
|
|
|
620,145 |
|
|
|
|
|
|
|
— |
|
|
|
(216,529 |
) |
|
|
— |
|
|
|
403,616 |
|
|
|
648,879 |
|
|
|
— |
|
|
|
— |
|
|
KCAP Freedom 3, LLC (3)(5) |
|
Joint Venture |
|
|
18,390,440 |
|
|
|
— |
|
|
|
— |
|
|
|
— |
|
|
|
2,917,459 |
|
|
|
|
|
|
|
21,307,899 |
|
|
|
24,720,000 |
|
|
|
— |
|
|
|
3,750,000 |
|
|
Total controlled affiliates |
|
|
|
|
21,861,440 |
|
|
|
6,848,145 |
|
|
|
— |
|
|
|
— |
|
|
|
(2,363,070 |
) |
|
|
(4,635,000 |
) |
|
|
21,711,515 |
|
|
|
|
|
|
|
— |
|
|
|
3,750,000 |
|
|
|
|
|
|
|
|
|
|
|
|
|
|
|
|
|
|
|
|
|
|
|
|
|
|
|
|
|
|
|
|
|
|
|
|
|
|
|
|
|
|
|
|
|
|
BCP Great Lakes Holdings LP(5)(9) |
|
Joint Venture |
|
|
12,466,667 |
|
|
|
11,213,014 |
|
|
|
— |
|
|
|
— |
|
|
|
100,387 |
|
|
|
— |
|
|
|
23,780,068 |
|
|
|
23,679,681 |
|
|
|
— |
|
|
|
1,109,780 |
|
|
Catamaran CLO 2013-1, Ltd. (1)(2)(3)(7) |
|
CLO Fund Securities |
|
|
— |
|
|
|
(1,208,865 |
) |
|
|
932,029 |
|
|
|
7,506,434 |
|
|
|
(2,204,062 |
) |
|
|
— |
|
|
|
5,025,536 |
|
|
|
11,720,000 |
|
|
|
932,029 |
|
|
|
— |
|
|
Catamaran CLO 2014-1, Ltd. (1)(2)(3)(7) |
|
CLO Fund Securities |
|
|
— |
|
|
|
(1,254,962 |
) |
|
|
933,979 |
|
|
|
9,112,278 |
|
|
|
(2,411,715 |
) |
|
|
— |
|
|
|
6,379,580 |
|
|
|
15,160,600 |
|
|
|
933,979 |
|
|
|
— |
|
|
Catamaran CLO 2014-2, Ltd. (1)(2)(3)(7) |
|
CLO Fund Securities |
|
|
— |
|
|
|
(521,228 |
) |
|
|
277,564 |
|
|
|
2,591,820 |
|
|
|
(1,209,124 |
) |
|
|
— |
|
|
|
1,139,032 |
|
|
|
9,900,000 |
|
|
|
277,564 |
|
|
|
— |
|
|
Catamaran CLO 2015-1, Ltd. (1)(2)(3)(7) |
|
CLO Fund Securities |
|
|
— |
|
|
|
(551,159 |
) |
|
|
336,063 |
|
|
|
3,157,769 |
|
|
|
(428,544 |
) |
|
|
— |
|
|
|
2,514,130 |
|
|
|
4,952,000 |
|
|
|
336,063 |
|
|
|
— |
|
|
Catamaran CLO 2016-1, Ltd. (1)(2)(3)(7) |
|
CLO Fund Securities |
|
|
— |
|
|
|
(1,033,625 |
) |
|
|
666,491 |
|
|
|
7,502,959 |
|
|
|
(740,809 |
) |
|
|
— |
|
|
|
6,395,016 |
|
|
|
10,140,000 |
|
|
|
666,491 |
|
|
|
— |
|
|
Catamaran CLO 2018-1, Ltd. (1)(2)(3)(7) |
|
CLO Fund Securities |
|
|
— |
|
|
|
(1,597,115 |
) |
|
|
991,888 |
|
|
|
8,950,000 |
|
|
|
185,978 |
|
|
|
— |
|
|
|
8,530,751 |
|
|
|
10,000,000 |
|
|
|
991,888 |
|
|
|
— |
|
|
KCAP F3C Senior Funding Rated Notes(3)(7) |
|
CLO Fund Securities |
|
|
4,473,840 |
|
|
|
(4,417,967 |
) |
|
|
18,496 |
|
|
|
— |
|
|
|
(66,734 |
) |
|
|
(7,635 |
) |
|
|
— |
|
|
|
— |
|
|
|
289,373 |
|
|
|
— |
|
|
Navex Topco, Inc.(3)(4)(7) |
|
Electronics |
|
|
— |
|
|
|
496,995 |
|
|
|
5,067 |
|
|
|
6,646,229 |
|
|
|
492,653 |
|
|
|
(4,854 |
) |
|
|
7,636,090 |
|
|
|
7,700,000 |
|
|
|
380,167 |
|
|
|
— |
|
|
Zest Acquisition Corp.(3)(4)(7) |
|
Healthcare, Education and Childcare |
|
|
— |
|
|
|
— |
|
|
|
109 |
|
|
|
3,231,683 |
|
|
|
74,300 |
|
|
|
— |
|
|
|
3,306,092 |
|
|
|
3,500,000 |
|
|
|
244,729 |
|
|
|
— |
|
|
OCI Holdings, LLC(3)(4)(7) |
|
Healthcare & Pharmaceuticals |
|
|
— |
|
|
|
— |
|
|
|
— |
|
|
|
2,422,281 |
|
|
|
— |
|
|
|
— |
|
|
|
2,422,281 |
|
|
|
31,817,483 |
|
|
|
— |
|
|
|
— |
|
|
Total Non-controlled affiliates |
|
|
|
|
16,940,507 |
|
|
|
1,125,088 |
|
|
|
4,161,686 |
|
|
|
51,121,453 |
|
|
|
(6,207,668 |
) |
|
|
(12,489 |
) |
|
|
67,128,578 |
|
|
|
|
|
|
|
5,052,283 |
|
|
|
1,109,780 |
|
|
|
|
|
|
|
|
|
|
|
|
|
|
|
|
|
|
|
|
|
|
|
|
|
|
|
|
|
|
|
|
|
|
|
|
|
|
|
|
|
|
|
|
|
|
Total Affiliated Investments |
|
|
|
$ |
38,801,947 |
|
|
$ |
7,973,232 |
|
|
$ |
4,161,686 |
|
|
$ |
51,121,453 |
|
|
$ |
(8,570,738 |
) |
|
$ |
(4,647,489 |
) |
|
$ |
88,840,092 |
|
|
|
|
|
|
$ |
5,052,283 |
|
|
$ |
4,859,780 |
|
|
1 |
Non-U.S. company or principal place of business outside the U.S. |
|
2 |
A CLO Fund managed by an affiliate of LibreMax. |
|
3 |
Fair value of this investment was determined using significant unobservable inputs. |
|
4 |
Qualified asset for purposes of section 55(a) of the Investment Company Act of 1940. |
|
5 |
As defined in the 1940 Act, the Company is deemed to be both an “Affiliated Person” and has “Control” of this portfolio company as the Company owns more than 25% of the portfolio company’s outstanding voting securities or has the power to exercise control over management or policies of such portfolio company securities or has the power to exercise control over management or policies of such portfolio company (including through a management agreement). Other than for purposes of the 1940 Act, the Company does not believe that it has control over this portfolio company. |
|
6 |
As defined in the 1940 Act, the Company is deemed to be both an “Affiliated Person” and has “Control” of this portfolio company as the Company owns more than 25% of the portfolio company’s outstanding voting securities or has the power to exercise control over management or policies of such portfolio company. |
|
7 |
Under the 1940 Act, the Company is deemed to be an “Affiliated Person” of, as defined in the 1940 Act, this portfolio company as the Company owns at least 5% but no more than 25% of the portfolio company’s outstanding voting securities or is under common control with such portfolio company. Other than for purposes of the 1940 Act, the Company does not believe that it has control over this portfolio company. |
|
8 |
Number of shares held. |
|
9 |
Ownership of LP interest held through the holding company BCP Great Lakes Fund, L.P, a non-U.S. company or principal place of business outside the U.S. |
F-37
During the third quarter of 2019, the Company sold its entire investment in Bristol Hospice, LLC to an affiliate. This transaction was approved by the Board of Directors of the Company.
|
|
Industry Classification |
|
Fair Value at December 31, 2017 |
|
|
Purchases/ (Sales) of or Advances/ (Distributions) |
|
|
Net Accretion |
|
|
Transfers In/(Out) of Affiliates |
|
|
Net change in unrealized Gain/(Loss) |
|
|
Realized Gain/(Loss) |
|
|
Fair Value at December 31, 2018 |
|
|
Interest Income |
|
|
Dividend Income |
|
||||||||||
|
|
Asset Management Company |
|
$ |
38,849,000 |
|
|
$ |
(34,800,000 |
) |
|
|
— |
|
|
|
— |
|
|
|
(579,000 |
) |
|
$ |
— |
|
|
$ |
3,470,000 |
|
|
$ |
— |
|
|
$ |
1,246,510 |
|
|
|
Trimaran Advisors, LLC Revolving Credit Facility(4)(5) |
|
Related Party Loans |
|
|
— |
|
|
|
— |
|
|
|
— |
|
|
|
— |
|
|
|
— |
|
|
|
— |
|
|
|
— |
|
|
|
1,170,825 |
|
|
|
— |
|
|
Trimaran Advisors, LLC Related Party Loan (4)(5) |
|
Related Party Loans |
|
|
8,359,051 |
|
|
|
(8,359,051 |
) |
|
|
— |
|
|
|
— |
|
|
|
— |
|
|
|
— |
|
|
|
— |
|
|
|
765,963 |
|
|
|
|
|
|
Trimaran Advisors, LLC Related Party Loan (4)(5) |
|
Related Party Loans |
|
|
4,418,232 |
|
|
|
(4,418,232 |
) |
|
|
— |
|
|
|
— |
|
|
|
— |
|
|
|
— |
|
|
|
— |
|
|
|
229,380 |
|
|
|
|
|
|
Katonah 2007-I CLO, Ltd. (1)(2)(3)(4) |
|
CLO Fund Securities |
|
|
10,770,486 |
|
|
|
(10,676,556 |
) |
|
|
271,658 |
|
|
|
— |
|
|
|
9,754,423 |
|
|
|
(10,120,011 |
) |
|
|
— |
|
|
|
271,658 |
|
|
|
— |
|
|
Trimaran CLO VII, Ltd. (1)(2)(3)(4) |
|
CLO Fund Securities |
|
|
10,000 |
|
|
|
|
|
|
|
(6,725 |
) |
|
|
— |
|
|
|
369,831 |
|
|
|
(373,105 |
) |
|
|
— |
|
|
|
(6,725 |
) |
|
|
— |
|
|
Catamaran CLO 2012-1, Ltd. (1)(2)(3)(4) |
|
CLO Fund Securities |
|
|
2,320,783 |
|
|
|
(2,596,571 |
) |
|
|
264,746 |
|
|
|
— |
|
|
|
3,527,018 |
|
|
|
(3,515,976 |
) |
|
|
— |
|
|
|
264,746 |
|
|
|
— |
|
|
Catamaran CLO 2013-1, Ltd. (1)(2)(4) |
|
CLO Fund Securities |
|
|
6,923,699 |
|
|
|
147,497 |
|
|
|
1,213,807 |
|
|
|
(7,016,734 |
) |
|
|
(1,268,269 |
) |
|
|
— |
|
|
|
— |
|
|
|
1,213,807 |
|
|
|
— |
|
|
Catamaran CLO 2014-1, Ltd. (1)(2)(4) |
|
CLO Fund Securities |
|
|
8,230,178 |
|
|
|
535,309 |
|
|
|
1,347,240 |
|
|
|
(9,777,251 |
) |
|
|
(335,476 |
) |
|
|
— |
|
|
|
— |
|
|
|
1,347,240 |
|
|
|
— |
|
|
Catamaran CLO 2014-2, Ltd. (1)(2)(4) |
|
CLO Fund Securities |
|
|
4,500,962 |
|
|
|
(985,241 |
) |
|
|
656,919 |
|
|
|
(2,158,200 |
) |
|
|
(2,014,440 |
) |
|
|
— |
|
|
|
— |
|
|
|
656,919 |
|
|
|
— |
|
|
Catamaran CLO 2015-1, Ltd. (1)(2)(4) |
|
CLO Fund Securities |
|
|
3,569,600 |
|
|
|
(573,089 |
) |
|
|
507,789 |
|
|
|
(3,048,696 |
) |
|
|
(455,604 |
) |
|
|
— |
|
|
|
— |
|
|
|
507,789 |
|
|
|
— |
|
|
Catamaran CLO 2016-1, Ltd. (1)(2)(4) |
|
CLO Fund Securities |
|
|
8,530,685 |
|
|
|
(1,282,923 |
) |
|
|
913,272 |
|
|
|
(7,067,073 |
) |
|
|
(1,093,961 |
) |
|
|
— |
|
|
|
— |
|
|
|
913,272 |
|
|
|
— |
|
|
Catamaran CLO 2018-1, Ltd. (1)(2)(4) |
|
CLO Fund Securities |
|
|
— |
|
|
|
9,500,000 |
|
|
|
343,450 |
|
|
|
(8,500,000 |
) |
|
|
(1,343,450 |
) |
|
|
— |
|
|
|
— |
|
|
|
343,450 |
|
|
|
— |
|
|
KCAP F3C Senior Funding Rated Notes(2)(4) |
|
CLO Fund Securities |
|
|
4,632,000 |
|
|
|
— |
|
|
|
37,298 |
|
|
|
— |
|
|
|
(195,458 |
) |
|
|
— |
|
|
|
4,473,840 |
|
|
|
468,755 |
|
|
|
— |
|
|
BCP Great Lakes Holdings LP(7) |
|
Limited Partnership |
|
|
— |
|
|
|
12,466,667 |
|
|
|
— |
|
|
|
— |
|
|
|
— |
|
|
|
— |
|
|
|
12,466,667 |
|
|
|
— |
|
|
|
— |
|
|
KCAP Freedom 3, LLC (4)(6) |
|
Joint Venture |
|
|
21,516,000 |
|
|
|
— |
|
|
|
— |
|
|
|
— |
|
|
|
(3,125,560 |
) |
|
|
— |
|
|
|
18,390,440 |
|
|
|
— |
|
|
|
3,100,000 |
|
|
Tank Partners Holdings, LLC(4)(5) |
|
Unit |
|
|
— |
|
|
|
— |
|
|
|
— |
|
|
|
980,000 |
|
|
|
(979,000 |
) |
|
|
— |
|
|
|
1,000 |
|
|
|
— |
|
|
|
— |
|
|
Total Affiliated Investments |
|
|
|
$ |
122,630,676 |
|
|
$ |
(41,042,190 |
) |
|
$ |
5,549,454 |
|
|
$ |
(36,587,954 |
) |
|
$ |
2,261,054 |
|
|
$ |
(14,009,092 |
) |
|
$ |
38,801,947 |
|
|
$ |
8,147,079 |
|
|
$ |
4,346,510 |
|
|
1 |
Non-U.S. company or principal place of business outside the U.S. |
|
2 |
An affiliate CLO Fund managed by an Asset Manager Affiliate (as such term is defined in the notes to the consolidated financial statements). |
|
3 |
Notice of redemption has been received for this security. |
|
4 |
Fair value of this investment was determined using significant unobservable inputs. |
|
5 |
Qualified asset for purposes of section 55(a) of the Investment Company Act of 1940. |
|
6 |
As defined in the 1940 Act, the Company is deemed to be both an “Affiliated Person” and has “Control” of this portfolio company as the Company owns more than 25% of the portfolio company’s outstanding voting securities or has the power to exercise control over management or policies of such portfolio company (including through a management agreement). Other than for purposes of the 1940 Act, the Company does not believe that it has control over this portfolio company. |
|
7 |
As defined in the 1940 Act, the Company is deemed to be both an “Affiliated Person” and has “Control” of this portfolio company as the Company owns more than 25% of the portfolio company’s outstanding voting securities or has the power to exercise control over management or policies of such portfolio company. |
Investment in Joint Ventures:
For the years ended December 31, 2019, 2018 and 2017, the Company recognized $4.9 million, $3.1 million and $0.9 million, respectively, in investment income from its investments in Joint Ventures. As of December 31, 2019 and December 31, 2018, the aggregate fair value of the Company’s investments in Joint Ventures was approximately $45.1 million and $30.9 million, respectively.
F-38
During the third quarter of 2017, the Company and Freedom 3 Opportunities LLC (“Freedom 3 Opportunities”), an affiliate of Freedom 3 Capital LLC, entered into an agreement to create KCAP Freedom 3 LLC (the “Joint Venture”). The Company and Freedom 3 Opportunities contributed approximately $37 million and $25 million, respectively, in assets to the Joint Venture, which in turn used the assets to capitalize a new fund, Great Lakes KCAP F3C Senior Funding L.L.C. (formerly known as KCAP F3C Senior Funding, L.L.C.) (the “Fund”) managed by KCAP Management, LLC, one of the Asset Manager Affiliates. In addition, the Fund used cash on hand and borrowings under a credit facility to purchase approximately $184 million of primarily middle-market loans form us and we used the proceeds from such sale to redeem approximately $147 million in debt issued by KCAP Senior Funding I, LLC (“KCAP Senior Funding”) The Fund invests primarily in middle-market loans and the Joint Venture partners may source middle-market loans from time-to-time for the Fund.
During the fourth quarter of 2017, the Fund was refinanced through the issuance of senior and subordinated notes. The Joint Venture purchased 100% of the subordinated notes issued by the Fund. In connection with the refinancing, the Joint Venture made a cash distribution to the Company of approximately $12.6 million. $11.8 million of this distribution was a return of capital, reducing the cost basis of its investment in the Joint Venture by that amount. The final determination of the tax attributes of distributions from the Joint Venture is made on an annual (full calendar year) basis at the end of the year, therefore, any estimate of tax attributes of distributions made on an interim basis may not be representative of the actual tax attributes of distributions for the full year.
The Company owns a 60% equity investment in the Joint Venture. The Joint Venture is structured as an unconsolidated Delaware limited liability company. All portfolio and other material decisions regarding the Joint Venture must be submitted to its board of managers, which is comprised of four members, two of whom were selected by the Company and two of whom were selected by Freedom 3 Opportunities, and must be approved by at least one member appointed by the Company and one appointed by Freedom 3 Opportunities. In addition, certain matters may be approved by the Joint Venture’s investment committee, which is comprised of one member appointed by the Company and one member appointed by Freedom 3 Opportunities.
In connection with the Externalization, during the first quarter of 2019, KCAP Management agreed to waive management fees it is otherwise entitled to receive for managing the Fund. In addition, the Joint Venture was restructured such that the Company is now entitled to receive a preferred distribution in an amount equal to the fees waived by KCAP Management. The impact of these transactions was a reduction in the fair value of the Asset Manager Affiliates and an increase in the fair value of the Company’s investment in the Joint Venture during the first quarter of 2019. The reduction in the fair value of the Asset Manager Affiliates was recognized as a realized loss on the consolidated statement of operations. The increase in the fair value of the Company’s investment in the Joint Venture was recognized as an unrealized gain in the consolidated statement of operations.
The Company has determined that the Joint Venture is an investment company under Accounting Standards Codification (“ASC”), Financial Services — Investment Companies (“ASC 946”), however, in accordance with such guidance, the Company will generally not consolidate its investment in a company other than a wholly owned investment company subsidiary or a controlled operating company whose business consists of providing services to the Company. The Company does not consolidate its interest in the Joint Venture because the Company does not control the Joint Venture due to allocation of the voting rights among the Joint Venture partners.
KCAP Freedom 3 LLC
Summarized Statements of Financial Condition
|
|
As of December 31, 2019 |
|
|
As of December 31, 2018 |
|
|||
|
Investment at fair value |
|
$ |
33,737,631 |
|
|
$ |
32,621,188 |
|
|
Total Assets |
|
$ |
33,737,631 |
|
|
$ |
32,621,188 |
|
|
Total Liabilities |
|
$ |
135,457 |
|
|
$ |
1,970,455 |
|
|
Total Equity |
|
|
33,602,174 |
|
|
|
30,650,733 |
|
|
Total Liabilities and Equity |
|
$ |
33,737,631 |
|
|
$ |
32,621,188 |
|
F-39
Summarized Statements of Operations
|
|
Year Ended December 31, |
|
||||||||||
|
|
|
2019 |
|
|
2018 |
|
|
2017 |
|
|||
|
Investment income |
|
$ |
5,127,460 |
|
|
$ |
4,800,844 |
|
|
$ |
2,531,331 |
|
|
Operating expenses |
|
|
86,183 |
|
|
|
126,786 |
|
|
|
435,757 |
|
|
Net investment income |
|
|
5,041,277 |
|
|
|
4,674,058 |
|
|
|
2,095,574 |
|
|
Unrealized appreciation on investments |
|
|
2,951,441 |
|
|
|
(4,951,938 |
) |
|
|
(5,063,254 |
) |
|
Net income |
|
$ |
7,992,718 |
|
|
$ |
(277,880 |
) |
|
$ |
(2,967,680 |
) |
KCAP Freedom 3 LLC
Schedule of Investments
December 31, 2019
|
|
Investment |
|
Percentage Ownership by Joint Venture |
|
|
Amortized Cost |
|
|
Fair Value |
|
||||
|
Great Lakes KCAP F3C Senior, LLC(1)(2)(3) |
|
Subordinated Securities, effective interest 11.2%, 12/29 maturity |
|
|
100.0 |
% |
|
$ |
40,801,382 |
|
|
$ |
33,737,631 |
|
|
Total Investments |
|
|
|
|
|
|
|
$ |
40,801,382 |
|
|
$ |
33,737,631 |
|
|
(1) |
CLO Subordinated Investments are entitled to periodic distributions which are generally equal to the remaining cash flow of the payments made by the underlying fund’s investments less contractual payments to debt holders and fund expenses. The estimated annualized effective yield indicated is based upon a current projection of the amount and timing of these distributions. Such projections are updated on a quarterly basis and the estimated effective yield is adjusted prospectively. |
|
(2) |
Fair value of this investment was determined using significant unobservable inputs, including default rates, prepayment rates, spreads, and the discount rate by which to value the resulting cash flows. |
|
(3) |
Formerly known as KCAP F3C Senior Funding, LLC |
KCAP Freedom 3 LLC
Schedule of Investments
December 31, 2018
|
|
Investment |
|
Percentage Ownership by Joint Venture |
|
|
Amortized Cost |
|
|
Fair Value |
|
||||
|
KCAP F3C Senior Funding, LLC (1)(2) |
|
Subordinated Securities, effective interest 11.5%, 12/29 maturity |
|
|
100.0 |
% |
|
$ |
42,636,380 |
|
|
$ |
32,621,188 |
|
|
Total Investments |
|
|
|
|
|
|
|
$ |
42,636,380 |
|
|
$ |
32,621,188 |
|
|
(1) |
CLO Subordinated Investments are entitled to periodic distributions which are generally equal to the remaining cash flow of the payments made by the underlying fund’s investments less contractual payments to debt holders and fund expenses. The estimated annualized effective yield indicated is based upon a current projection of the amount and timing of these distributions. Such projections are updated on a quarterly basis and the estimated effective yield is adjusted prospectively. |
|
(2) |
Fair value of this investment was determined using significant unobservable inputs, including default rates, prepayment rates, spreads, and the discount rate by which to value the resulting cash flows. |
F-40
BCP Great Lakes Partnership LP
BCP Great Lakes Fund LP (the “BCP Great Lakes Partnership”) has invested in BCP Great Lakes Holdings LP, a vehicle formed as a co-investment vehicle to facilitate the participation of certain co-investors to invest, directly or indirectly, in BCP Great Lakes Funding, LLC. (the “Great Lakes Joint Venture”). The Company is a limited partner in the BCP Great Lakes Partnership and does not have any direct or indirect voting interests in the Great Lakes Joint Venture, and treats the investment as a joint venture since an affiliate of the Adviser manages BCP Great Lakes Holdings LP and controls a 50% voting interest in the Great Lakes Joint Venture. This investment was made prior to the Externalization and as such the Company has changed its characterization from an equity investment prior to the Externalization to a joint venture investment once the Company became externally managed and an affiliate of the Adviser. The investment strategy of BCP Great Lakes Funding, LLC is to underwrite and hold senior, secured unitranche loans made to middle-market companies. The Company does not pay any advisory fees in connection with its investment in the BCP Great Lakes Partnership.
The fair value of the Company’s investment in the BCP Great Lakes Partnership at December 31, 2019 and December 31, 2018 was $23.8 million and $12.5 million. Fair value has been determined utilizing the practical expedient pursuant to ASC 820-10. Pursuant to the terms of the BCP Great Lakes Fund LP Amended and Restated Exempted Limited Partnership Agreement (the “BCP Great Lakes Partnership Agreement”), the Company generally may not sell, exchange, assign, pledge or otherwise transfer its interest, in whole or in part, without the prior written consent of the General Partner which consent may be given or withheld in its sole and absolute discretion, and may be conditioned upon repayment of its share of indebtedness incurred by the partnership.
In March 2019, prior to the Externalization, the Company increased its aggregate commitment to the BCP Great Lakes Partnership to $50 million, subject to certain limitations (including that the Company is not obligated to fund capital calls if such funding would cause the Company to be out of compliance with certain provisions of the Investment Company Act of 1940). As of December 31, 2019 and December 31, 2018, the Company has a $26.3 million and $12.5 million, respectively unfunded commitment to the BCP Great Lakes Partnership. However, at December 31, 2019 our funding commitment was limited to approximately $11.3 million pursuant to the limitations described above.
Fair Value Measurements
The Company follows the provisions of ASC 820: Fair Value, which among other matters, requires enhanced disclosures about investments that are measured and reported at fair value. This standard defines fair value and establishes a hierarchal disclosure framework which prioritizes and ranks the level of market price observability used in measuring investments at fair value and expands disclosures about assets and liabilities measured at fair value. ASC 820: Fair Value defines “fair value” as the price that would be received to sell an asset or paid to transfer a liability in an orderly transaction between market participants at the measurement date. This fair value definition focuses on an exit price in the principle, or most advantageous market, and prioritizes, within a measurement of fair value, the use of market-based inputs (which may be weighted or adjusted for relevance, reliability and specific attributes relative to the subject investment) over entity-specific inputs. Market price observability is affected by a number of factors, including the type of investment and the characteristics specific to the investment. Investments with readily available active quoted prices or for which fair value can be measured from actively quoted prices generally will have a higher degree of market price observability and a lesser degree of judgment used in measuring fair value.
ASC 820: Fair Value establishes the following three-level hierarchy, based upon the transparency of inputs to the fair value measurement of an asset or liability as of the measurement date:
Level I – Unadjusted quoted prices are available in active markets for identical investments as of the reporting date. The type of investments included in Level I include listed equities and listed securities. As required by ASC 820: Fair Value, the Company does not adjust the quoted price for these investments, even in situations where the Company holds a large position and a sale could reasonably affect the quoted price.
Level II – Pricing inputs are other than quoted prices in active markets, which are either directly or indirectly observable as of the reporting date. Such inputs may be quoted prices for similar assets or liabilities, quoted markets that are not active, or other inputs that are observable or can be corroborated by observable market data for substantially the full character of the financial instrument, or inputs that are derived principally from, or corroborated by, observable market information. Investments which are generally included in this category include illiquid debt securities and less liquid, privately held or restricted equity securities for which some level of recent trading activity has been observed.
Level III – Pricing inputs are unobservable for the investment and includes situations where there is little, if any, market activity for the investment. The inputs may be based on the Company’s own assumptions about how market participants would price the asset or liability or may use Level II inputs, as adjusted, to reflect specific investment attributes relative to a broader market assumption. These inputs into the determination of fair value may require significant management judgment or estimation. Even if observable market data for comparable performance or valuation measures (earnings multiples, discount rates, other financial/valuation ratios, etc.) are available, such investments are grouped as Level III if any significant data point that is not also market observable (private company earnings, cash flows, etc.) is used in the valuation methodology.
F-41
In certain cases, the inputs used to measure fair value may fall into different levels of the fair value hierarchy. In such cases, an investment’s level within the fair value hierarchy is based on the lowest level of input that is significant to the fair value measurement. The Company’s assessment of the significance of a particular input to the fair value measurement in its entirety requires judgment, and the Company considers factors specific to the investment. A majority of the Company’s investments are classified as Level III. The Company evaluates the source of inputs, including any markets in which its investments are trading, in determining fair value. Inputs that are highly correlated to the specific investment being valued and those derived from reliable or knowledgeable sources will tend to have a higher weighting in determining fair value. The Company’s fair value determinations may include factors such as an assessment of each underlying investment, its current and prospective operating and financial performance, consideration of financing and sale transactions with third parties, expected cash flows and market-based information, including comparable transactions, performance factors, and other investment or industry specific market data, among other factors.
The following table summarizes the fair value of investments by fair value hierarchy levels provided by ASC 820: Fair Value as of December 31, 2019 and December 31, 2018, respectively:
|
|
As of December 31, 2019 |
|
||||||||||||||||||
|
|
|
Level I |
|
|
Level II |
|
|
Level III |
|
|
NAV |
|
|
Total |
|
|||||
|
Short Term investments |
|
$ |
— |
|
|
$ |
4,207,107 |
|
|
$ |
— |
|
|
$ |
— |
|
|
$ |
4,207,107 |
|
|
Debt securities |
|
|
— |
|
|
|
38,420,182 |
|
|
|
148,382,726 |
|
|
|
— |
|
|
|
186,802,908 |
|
|
CLO Fund securities |
|
|
— |
|
|
|
— |
|
|
|
31,968,202 |
|
|
|
— |
|
|
|
31,968,202 |
|
|
Equity securities |
|
|
— |
|
|
|
— |
|
|
|
9,864,419 |
|
|
|
— |
|
|
|
9,864,419 |
|
|
Joint Ventures |
|
|
— |
|
|
|
— |
|
|
|
21,307,899 |
|
|
|
23,780,068 |
|
|
|
45,087,967 |
|
|
Derivatives |
|
|
— |
|
|
|
— |
|
|
|
(33,437 |
) |
|
|
— |
|
|
|
(33,437 |
) |
|
Total |
|
$ |
— |
|
|
$ |
42,627,289 |
|
|
$ |
211,489,810 |
|
|
$ |
23,780,068 |
|
|
$ |
277,897,166 |
|
|
|
As of December 31, 2018 |
|
||||||||||||||||||
|
|
|
Level I |
|
|
Level II |
|
|
Level III |
|
|
NAV |
|
|
Total |
|
|||||
|
Short Term investments |
|
$ |
9,999,349 |
|
|
$ |
34,757,129 |
|
|
$ |
— |
|
|
$ |
— |
|
|
$ |
44,756,478 |
|
|
Debt securities |
|
|
— |
|
|
|
41,120,073 |
|
|
|
106,741,671 |
|
|
|
— |
|
|
|
147,861,744 |
|
|
CLO Fund securities |
|
|
— |
|
|
|
— |
|
|
|
44,325,000 |
|
|
|
— |
|
|
|
44,325,000 |
|
|
Equity securities |
|
|
— |
|
|
|
— |
|
|
|
2,038,020 |
|
|
|
— |
|
|
|
2,038,020 |
|
|
Asset Manager Affiliates |
|
|
— |
|
|
|
— |
|
|
|
3,470,000 |
|
|
|
— |
|
|
|
3,470,000 |
|
|
Joint Venture |
|
|
— |
|
|
|
— |
|
|
|
18,390,440 |
|
|
|
12,466,667 |
|
|
|
30,857,107 |
|
|
Total |
|
$ |
9,999,349 |
|
|
$ |
75,877,202 |
|
|
$ |
174,965,131 |
|
|
$ |
12,466,667 |
|
|
$ |
273,308,349 |
|
As a BDC, the Company is required to invest primarily in the debt and equity of non-public companies for which there is little, if any, market-observable information. As a result, a significant portion of the Company’s investments at any given time will likely be deemed Level III investments. Investment values derived by a third party pricing service are generally deemed to be Level III values. For those that have observable trades, the Company considers them to be Level II.
The fair value of the Company’s investment in the BCP Great Lakes Partnership at December 31, 2019 and December 31, 2018 was $23.8 million and $12.5 million. Fair value has been determined utilizing the practical expedient pursuant to ASC 820-10.
Subject to the limitations noted above, values derived for debt and equity securities using comparable public/private companies generally utilize market-observable data from such comparables and specific, non-public and non-observable financial measures (such as earnings or cash flows) for the private, underlying company/issuer. Such non-observable company/issuer data is typically provided on a monthly or quarterly basis, is certified as correct by the management of the company/issuer and/or audited by an independent accounting firm on an annual basis. Since such private company/issuer data is not publicly available it is not deemed market-observable data and, as a result, such investment values are grouped as Level III assets.
F-42
The Company’s policy for determining transfers between levels is based solely on the previously defined three-level hierarchy for fair value measurement. Transfers between the levels of the fair value hierarchy are separately noted in the tables below and the reason for such transfer described in each table’s respective footnotes. Certain information relating to investments measured at fair value for which the Company has used unobservable inputs to determine fair value is as follows:
|
|
|
Year Ended December 31, 2019 |
|
|||||||||||||||||||||||||
|
|
|
Debt Securities |
|
|
CLO Fund Securities |
|
|
Equity Securities |
|
|
Asset Manager Affiliate |
|
|
Joint Ventures |
|
|
Derivatives |
|
|
Total |
|
|||||||
|
Balance, December 31, 2018 |
|
$ |
106,741,671 |
|
|
$ |
44,325,000 |
|
|
$ |
2,038,020 |
|
|
$ |
3,470,000 |
|
|
$ |
18,390,440 |
|
|
$ |
— |
|
|
$ |
174,965,131 |
|
|
Transfers out of Level III¹ |
|
|
(10,079,999 |
) |
|
|
— |
|
|
|
— |
|
|
|
— |
|
|
|
— |
|
|
|
— |
|
|
|
(10,079,999 |
) |
|
Transfers into Level III² |
|
|
10,415,885 |
|
|
|
— |
|
|
|
— |
|
|
|
— |
|
|
|
— |
|
|
|
— |
|
|
|
10,415,885 |
|
|
Net accretion |
|
|
209,052 |
|
|
|
6,162,690 |
|
|
|
— |
|
|
|
— |
|
|
|
— |
|
|
|
— |
|
|
|
6,371,742 |
|
|
Purchases |
|
|
108,079,125 |
|
|
|
— |
|
|
|
14,966,500 |
|
|
|
— |
|
|
|
— |
|
|
|
30,609 |
|
|
|
123,076,234 |
|
|
Sales/Paydowns/Return of Capital |
|
|
(71,139,395 |
) |
|
|
(13,629,382 |
) |
|
|
(371,222 |
) |
|
|
|
|
|
|
— |
|
|
|
— |
|
|
|
(85,139,999 |
) |
|
Total realized loss included in earnings |
|
|
(10,084,819 |
) |
|
|
(1,395,218 |
) |
|
|
(1,912,048 |
) |
|
|
(3,470,000 |
) |
|
|
— |
|
|
|
— |
|
|
|
(16,862,085 |
) |
|
Change in unrealized gain (loss) included in earnings |
|
|
14,241,206 |
|
|
|
(3,494,888 |
) |
|
|
(4,856,831 |
) |
|
|
— |
|
|
|
2,917,459 |
|
|
|
(64,046 |
) |
|
|
8,742,900 |
|
|
Balance, December 31, 2019 |
|
$ |
148,382,726 |
|
|
$ |
31,968,202 |
|
|
$ |
9,864,419 |
|
|
$ |
— |
|
|
$ |
21,307,899 |
|
|
$ |
(33,437 |
) |
|
$ |
211,489,810 |
|
|
Changes in unrealized gains (losses) included in earnings related to investments still held at reporting date |
|
$ |
(4,160,677 |
) |
|
$ |
(4,346,029 |
) |
|
$ |
(4,856,831 |
) |
|
$ |
— |
|
|
$ |
2,917,459 |
|
|
$ |
(64,046 |
) |
|
$ |
(10,510,124 |
) |
|
1 |
Transfers out of Level III represent a transfer of $10.1 million relating to debt securities for which pricing inputs, other than their quoted prices in active markets were observable as of December 31, 2019. |
|
2 |
Transfers into Level III represent a transfer of $10.4 million relating to debt securities for which pricing inputs, other than their quoted prices in active markets were unobservable as of December 31, 2019. |
|
|
Year Ended December 31, 2018 |
|
||||||||||||||||||||||
|
|
|
Debt Securities |
|
|
CLO Fund Securities |
|
|
Equity Securities |
|
|
Asset Manager Affiliate |
|
|
Joint Venture |
|
|
Total |
|
||||||
|
Balance, December 31, 2017 |
|
$ |
69,885,455 |
|
|
$ |
51,678,673 |
|
|
$ |
4,414,684 |
|
|
$ |
38,849,000 |
|
|
$ |
21,516,000 |
|
|
$ |
186,343,812 |
|
|
Transfers out of Level III¹ |
|
|
(230,732 |
) |
|
|
— |
|
|
|
— |
|
|
|
— |
|
|
|
— |
|
|
|
(230,732 |
) |
|
Transfers into Level III² |
|
|
16,474,663 |
|
|
|
— |
|
|
|
— |
|
|
|
— |
|
|
|
— |
|
|
|
16,474,663 |
|
|
Net accretion |
|
|
125,614 |
|
|
|
5,878,260 |
|
|
|
— |
|
|
|
— |
|
|
|
— |
|
|
|
6,003,874 |
|
|
Purchases |
|
|
38,099,644 |
|
|
|
12,781,528 |
|
|
|
— |
|
|
|
— |
|
|
|
— |
|
|
|
50,881,172 |
|
|
Sales/Paydowns/Return of Capital |
|
|
(11,116,360 |
) |
|
|
(19,033,322 |
) |
|
|
(1,093,244 |
) |
|
|
(34,800,000 |
) |
|
|
— |
|
|
|
(66,042,926 |
) |
|
Total realized gain included in earnings |
|
|
(51,674 |
) |
|
|
(16,484,872 |
) |
|
|
— |
|
|
|
— |
|
|
|
— |
|
|
|
(16,536,546 |
) |
|
Total unrealized gain (loss) included in earnings |
|
|
(6,444,939 |
) |
|
|
9,504,733 |
|
|
|
(1,283,420 |
) |
|
|
(579,000 |
) |
|
|
(3,125,560 |
) |
|
|
(1,928,186 |
) |
|
Balance, December 31, 2018 |
|
$ |
106,741,671 |
|
|
$ |
44,325,000 |
|
|
$ |
2,038,020 |
|
|
$ |
3,470,000 |
|
|
$ |
18,390,440 |
|
|
$ |
174,965,131 |
|
|
Changes in unrealized gains (losses) included in earnings related to investments still held at reporting date |
|
$ |
(5,197,940 |
) |
|
$ |
6,631,424 |
|
|
$ |
(1,283,420 |
) |
|
$ |
(579,000 |
) |
|
$ |
(3,125,560 |
) |
|
$ |
(3,554,496 |
) |
|
1 |
Transfers out of Level III represent a transfer of $230 thousand relating to debt securities for which pricing inputs, other than their quoted prices in active markets were observable as of December 31, 2018. |
|
2 |
Transfers into Level III represent a transfer of $16.5 million relating to debt securities for which pricing inputs, other than their quoted prices in active markets were unobservable as of December 31, 2018. |
As of December 31, 2019 and December 31, 2018, the Company’s Level II portfolio investments were valued by a third party pricing services for which the prices are not adjusted and for which inputs are observable or can be corroborated by observable market data for substantially the full character of the financial instrument, or by inputs that are derived principally from, or corroborated by, observable market information. The fair value of the Company’s Level II portfolio investments was $42.6 million and $75.9 million as of December 31, 2019 and December 31, 2018, respectively.
F-43
As of December 31, 2019, the Company’s Level III portfolio investments had the following valuation techniques and significant inputs:
|
Type |
|
Fair Value |
|
|
Primary Valuation Methodology |
|
Unobservable Inputs |
|
Range of Inputs (Weighted Average) |
|
|
Debt Securities
|
|
$ |
11,959,848 |
|
|
Enterprise Value |
|
Average EBITDA Multiple |
|
5.0x-8.3x (7.0x) |
|
|
|
136,422,878 |
|
|
Income Approach |
|
Implied Discount Rate |
|
5.9%-24.0% (10.3%) |
|
|
Equity Securities
|
|
|
9,859,419 |
|
|
Enterprise Value |
|
Average EBITDA Multiple / WACC |
|
3.2x-14.5x (14.0x) |
|
|
|
5,000 |
|
|
Options Value |
|
Qualitative Inputs(1) |
|
|
|
|
CLO Fund Securities
|
|
|
|
|
|
|
|
Discount Rate |
|
13.3%-15.0% (13.9%) |
|
|
|
|
|
|
|
|
Probability of Default |
|
1%-2% (1.5%) |
|
|
|
|
31,968,202 |
|
|
Discounted Cash Flow |
|
Loss Severity |
|
20.0%-39.5% (29.5%) |
|
|
|
|
|
|
|
|
|
Recovery Rate |
|
60.5%-80.0% (70.5%) |
|
|
|
|
|
|
|
|
|
Prepayment Rate |
|
15.0%-25.0% (20.0%) |
|
|
Joint Ventures
|
|
|
|
|
|
|
|
Discount Rate |
|
16.0%-17.3% (16.6%) |
|
|
|
|
|
|
|
|
Probability of Default |
|
2%-3% (2.5%) |
|
|
|
|
21,307,899 |
|
|
Discounted Cash Flow |
|
Loss Severity |
|
20.5%-39.5% (30.0%) |
|
|
|
|
|
|
|
|
|
Recovery Rate |
|
60.5%-79.5% (70.0%) |
|
|
|
|
|
|
|
|
|
Prepayment Rate |
|
15.0%-25.0% (20.0%) |
|
|
Derivatives |
|
|
(33,437 |
) |
|
Market Approach |
|
Transacted Value/Contractual Financing Rate |
|
|
|
Total Level III Investments |
|
$ |
211,489,810 |
|
|
|
|
|
|
|
|
1 |
The qualitative inputs used in the fair value measurements of Equity Securities include estimates of the distressed liquidation value of the pledged collateral. In cases where Portman Ridge’s analysis ascribes no residual value to a portfolio company’s equity, Portman Ridge typically elects to mark its position at a nominal amount to account for the investment’s option value. |
|
2 |
The qualitative inputs used in the fair value measurements include the value of the pledged collateral. |
F-44
As of December 31, 2018, the Company’s Level III portfolio investments had the following valuation techniques and significant inputs:
|
|
Fair Value |
|
|
Primary Valuation Methodology |
|
Unobservable Inputs |
|
Range of Inputs (Weighted Average) |
|
|||
|
|
|
|
|
|
|
|
|
Average EBITDA |
|
5.0x – 8.0x (5.2x) |
|
|
|
Debt Securities |
|
$ |
8,661,114 |
|
|
Enterprise Value |
|
Multiple / WACC |
|
15.8% |
|
|
|
|
|
|
98,080,557 |
|
|
Income Approach |
|
Implied Discount Rate |
|
6.3% - 26.8% (11.8%) |
|
|
|
Equity Securities |
|
|
1,979,020 |
|
|
Enterprise Value |
|
Average EBITDA Multiple |
|
4.5x – 11.0x (9.5x) |
|
|
|
|
|
|
59,000 |
|
|
Options Value |
|
Qualitative Inputs(1) |
|
|
|
|
|
|
|
|
|
|
|
|
|
Discount Rate |
|
13.5%-14.0% (13.9%) |
|
|
|
|
|
|
|
|
|
|
|
Probability of Default |
|
0.75%-2% (1.4%) |
|
|
|
|
|
|
35,455,720 |
|
|
Discounted Cash Flow |
|
Loss Severity |
|
20%-36 % (28.3%) |
|
|
|
CLO Fund Securities |
|
|
|
|
|
|
|
Recovery Rate |
|
63.5%-80% (71.7%) |
|
|
|
|
|
|
|
|
|
|
|
Prepayment Rate |
|
10%-20% (15%) |
|
|
|
|
|
|
369,280 |
|
|
Liquidation Value |
|
Qualitative Inputs(2) |
|
|
|
|
|
|
|
|
8,500,000 |
|
|
Market Approach |
|
Third Party Quote |
|
85.0% |
|
|
|
Asset Manager Affiliate |
|
|
3,470,000 |
|
|
Discounted Cash Flow |
|
Discount Rate |
|
4.0% - 10.0% (7.77%) |
|
|
|
Joint Ventures |
|
|
18,390,440 |
|
|
Enterprise Value |
|
Underlying NAV of the CLO |
|
|
|
|
|
Total Level III Investments |
|
$ |
174,965,131 |
|
|
|
|
|
|
|
|
|
|
1 |
The qualitative inputs used in the fair value measurements of Equity Securities include estimates of the distressed liquidation value of the pledged collateral. In cases where Portman Ridge’s analysis ascribes no residual value to a portfolio company’s equity, Portman Ridge typically elects to mark its position at a nominal amount to account for the investment’s option value. |
|
2 |
The qualitative inputs used in the fair value measurements include the value of the pledged collateral. |
The significant unobservable inputs used in the fair value measurement of the Company’s debt securities may include, among other things, broad market indices, the comparable yields of similar investments in similar industries, effective discount rates, average EBITDA multiples, and weighted average cost of capital. Significant increases or decreases in such comparable yields would result in a significantly lower or higher fair value measurement, respectively.
The significant unobservable inputs used in the fair value measurement of the Company’s equity securities include the EBITDA multiple of similar investments in similar industries and the weighted average cost of capital. Significant increases or decreases in such inputs would result in a significantly lower or higher fair value measurement.
Significant unobservable inputs used in the fair value measurement of the Company’s CLO Fund Securities include default rates, recovery rates, prepayment rates, spreads, and the discount rate by which to value the resulting underlying cash flows. Such assumptions can vary significantly, depending on market data sources which often vary in depth and level of analysis, understanding of the CLO market, detailed or broad characterization of the CLO market and the application of such data to an appropriate framework for analysis. The application of data points are based on the specific attributes of each individual CLO Fund Security’s underlying assets, historic, current and prospective performance, vintage, and other quantitative and qualitative factors that would be evaluated by market participants. The Company evaluates the source of market data for reliability as an indicative market input, consistency amongst other inputs and results and also the context in which such data is presented. Significant increases or decreases in probability of default and loss severity inputs in isolation would result in a significantly lower or higher fair value measurement, respectively. In
F-45
general, a change in the assumption of the probability of default is accompanied by a directionally similar change in the assumption used for the loss severity in an event of default. Significant increases or decreases in the discount rate in isolation would result in a significantly lower or higher fair value measurement.
The Company’s investment in the Joint Venture- KCAP Freedom 3 LLC is carried at fair value based upon the fair value of the investments held by the Joint Venture.
The Company values derivative contracts using various pricing models that take into account the terms of the contract (including notional amount and contract maturity) and observable and unobservable inputs such as interest rates and changes in fair value of the reference asset.
The following table details derivative investments at December 31, 2019:
|
|
|
December 31, 2019 |
|
|||||||||||||
|
|
Notional amounts |
|
|
Derivative assets |
|
|
Realized gain(loss) |
|
|
Unrealized gain(loss) |
|
|||||
|
Call option |
|
$ |
7,656 |
|
|
$ |
7,656 |
|
|
$ |
— |
|
|
$ |
(22,953 |
) |
|
Securities Swap and Option Agreement |
|
|
5,500,000 |
|
|
|
(41,093 |
) |
|
|
— |
|
|
|
(41,093 |
) |
|
Total |
|
$ |
5,507,656 |
|
|
$ |
(33,437 |
) |
|
$ |
— |
|
|
$ |
(64,046 |
) |
The Company held no derivatives for the year ended December 31, 2018.
|
5. |
ASSET MANAGER AFFILIATES |
Wholly-Owned Asset Managers
On December 31, 2018, the Company’s wholly-owned subsidiary Commodore Holdings, LLC (“Commodore”) sold its wholly-owned asset management subsidiaries Katonah Debt Advisors, Trimaran Advisors and Trimaran Advisors Management, representing substantially all of the Company’s investment in the Asset Manager Affiliates. Commodore received cash proceeds of $37.9 million from the sale and distributed $33.8 million in cash to the Company. All of this cash distribution was recorded as a return of capital. No realized gain or loss was recognized due to this transaction.
The Asset Manager Affiliates manage CLO Funds primarily for third party investors that invest primarily in broadly syndicated loans, high yield bonds and other credit instruments issued by corporations. At December 31, 2019 and December 31, 2018, the Asset Manager Affiliates had approximately $300 million and $300 million of par value of assets under management, respectively, and the Company’s 100% equity interest in the Asset Manager Affiliates had a fair value of approximately $0 and $3.5 million, respectively.
No distributions were declared during 2019. For year ended December 31, 2018 and 2017, the Asset Manager Affiliates declared cash distributions of $36.0 million and $3.2 million to the Company. Any distributions from the Asset Manager Affiliates out of their estimated tax-basis earnings and profits are recorded as “Dividends from Asset Manager Affiliates” on the Company’s statement of operations. The Company recognized $1.2 million and $460,000 of Dividends from Asset Manager Affiliates, as reflected in the Company’s statement of operations in the year ended December 31, 2018 and 2017. The difference between cash distributions received and the tax-basis earnings and profits of the distributing affiliate are recorded as an adjustment to the cost basis in the Asset Manager Affiliate (i.e., tax-basis return of capital). For the year ended December 31, 2018 all but $1.2 million was a tax-basis return of capital. Distributions receivable, if any, are reflected in the “due from affiliates” account on the consolidated balance sheets.
The tax attributes of distributions received from the Asset Manager Affiliates are determined on an annual basis. The Company makes an estimate of the tax-basis earnings and profits of the Asset Manager Affiliates on a quarterly basis, and any quarterly distributions received in excess of the estimated earnings and profits are recorded as return of capital (reduction in the cost basis of the investment in Asset Manager Affiliate).
While the investment in the Asset Manager Affiliates was deemed to have no value for the year ended December 31, 2019, in accordance with Rules 3-09, Rule 4-08(g) and 1-02 of Regulation S-X, additional financial information with respect to the Asset Manager Affiliates was required to be included in the Company’s SEC filings for 2018 and 2017. The additional information regarding the Asset Manager Affiliates is set forth below. This additional financial information regarding the Asset Manager Affiliates does not directly impact the financial position, results of operations, or cash flows of the Company.
F-46
Summarized Balance Sheet
|
|
As of |
|
||
|
|
December 31, 2018 |
|
||
|
|
|
|
|
|
|
Cash |
|
$ |
1,335,004 |
|
|
Other Assets |
|
|
129,880 |
|
|
Total Assets |
|
$ |
1,464,884 |
|
|
Other Liabilities |
|
$ |
995,270 |
|
|
Total Liabilities |
|
|
995,270 |
|
|
Total Equity |
|
|
469,614 |
|
|
Total Liabilities and Equity |
|
$ |
1,464,884 |
|
Asset Manager Affiliates
Summarized Statements of Operations Information
|
|
For the Year Ended December 31, |
|
||||||
|
|
|
2018 |
|
|
2017 |
|
||
|
Fee Revenue |
|
$ |
11,548,457 |
|
|
$ |
15,283,064 |
|
|
Interest Income |
|
|
3,041,889 |
|
|
|
232,300 |
|
|
Total Income |
|
|
14,590,346 |
|
|
|
15,515,364 |
|
|
Operating Expenses |
|
|
10,700,629 |
|
|
|
10,937,980 |
|
|
Amortization of Intangibles |
|
|
— |
|
|
|
327,541 |
|
|
Interest Expense |
|
|
3,987,891 |
|
|
|
1,044,242 |
|
|
Total Expenses |
|
|
14,688,520 |
|
|
|
12,309,763 |
|
|
Income before unrealized gains on investments and income taxes |
|
|
(98,174 |
) |
|
|
3,205,601 |
|
|
Unrealized gains on investments |
|
|
7,570,688 |
|
|
|
(2,674,885 |
) |
|
(Loss) Income before income taxes |
|
|
7,472,514 |
|
|
|
530,716 |
|
|
Income Tax (Benefit) |
|
|
(1,971,043 |
) |
|
|
(165,449 |
) |
|
Net (Loss) Income |
|
$ |
9,443,557 |
|
|
$ |
696,165 |
|
Except for KCAP Management, LLC, which is a disregarded entity whose tax results are included with the Company’s tax results, as separately regarded entities for tax purposes, the Asset Manager Affiliates are taxed at normal corporate rates. In order to maintain the Company’s RIC status, any tax-basis dividends paid by the Asset Manager Affiliates to the Company would generally need to be distributed to the Company’s shareholders. Generally, such tax-basis dividends of the Asset Manager Affiliates’ income which was distributed to the Company’s shareholders will be considered as qualified dividends for tax purposes. The Asset Manager Affiliates’ taxable net income will differ from GAAP net income because of deferred tax temporary differences and permanent tax adjustments. Deferred tax temporary differences may include differences for the recognition and timing of amortization and depreciation, compensation related expenses, and net loss carryforward, among other things. Permanent differences may include adjustments, limitations or disallowances for meals and entertainment expenses, penalties, tax goodwill amortization and net operating loss carryforward.
Goodwill amortization for tax purposes was created upon the purchase of 100% of the equity interests in Katonah Debt Advisors prior to the Company’s IPO in exchange for shares of the Company’s stock valued at $33 million. Although this transaction was a stock transaction rather than an asset purchase and thus no goodwill was recognized for GAAP purposes, such exchange was considered an asset purchase under Section 351(a) of the Code. At the time of the transfer, Katonah Debt Advisors had equity of approximately $1 million resulting in tax goodwill of approximately $32 million which was being amortized for tax purposes on a straight-line basis over 15 years.
Additional goodwill amortization for tax purposes was created upon the purchase of 100% of the equity interests in Trimaran Advisors by one of the Company’s affiliates, in exchange for shares of the Company’s stock valued at $25.5 million and cash of $13.0 million. The transaction was considered an asset purchase under Section 351(a) of the Code and resulted in tax goodwill of approximately $22.8 million, and tax basis intangible assets of $15.7 million, both of which were being amortized for tax purposes on a straight-line basis over 15 years.
F-47
Advisory Agreement
The Adviser provides management services to the Company pursuant to the Advisory Agreement. Under the terms of the Advisory Agreement, the Adviser is responsible for the following:
|
|
• |
managing the Company’s assets in accordance with our investment objective, policies and restrictions; |
|
|
• |
determining the composition of the Company’s portfolio, the nature and timing of the changes to the portfolio and the manner of implementing such changes; |
|
|
• |
identifying, evaluating and negotiating the structure of the Company’s investments; |
|
|
• |
monitoring the Company’s investments; |
|
|
• |
determining the securities and other assets that the Company will purchase, retain or sell; |
|
|
• |
assisting the Board with its valuation of the Company’s assets; |
|
|
• |
directing investment professionals of the Adviser to provide managerial assistance to the Company’s portfolio companies; |
|
|
• |
performing due diligence on prospective portfolio companies; |
|
|
• |
exercising voting rights in respect of portfolio securities and other investments for the Company; |
|
|
• |
serving on, and exercising observer rights for, boards of directors and similar committees of our portfolio companies; and |
|
|
• |
providing the Company with such other investment advisory, research and related services as we may, from time to time, reasonably require for the investment of capital. |
The Adviser’s services under the Advisory Agreement are not exclusive, and it is free to furnish similar services to other entities so long as its services to us are not impaired.
Term
On April 1, 2019, the Company entered into the Advisory Agreement with the Adviser. Unless earlier terminated as described below, the Investment Advisory Agreement will remain in effect until April 1, 2021, a period of two years from the date it first became effective and will remain in effect from year-to-year thereafter if approved annually by a majority of the Board or by the holders of a majority of the outstanding shares, and, in each case, a majority of the independent directors.
The Advisory Agreement will automatically terminate within the meaning of the 1940 Act and related Securities and Exchange Commission (“SEC”) guidance and interpretations in the event of its assignment. In accordance with the 1940 Act, without payment of any penalty, we may terminate the Advisory Agreement with the Adviser upon 60 days’ written notice. The decision to terminate the agreement may be made by a majority of the Board or the stockholders holding a majority of the outstanding shares of our common stock. See “Advisory Agreement—Removal of Adviser” below. In addition, without payment of any penalty, the Adviser may generally terminate the Advisory Agreement upon 60 days’ written notice and, in certain circumstances, the Adviser may only be able to terminate the Advisory Agreement upon 120 days’ written notice.
Removal of Adviser
The Adviser may be removed by the Board or by the affirmative vote of a Majority of the Outstanding Shares. “Majority of the Outstanding Shares” means the lesser of (1) 67% or more of the outstanding shares of our common stock present at a meeting, if the holders of more than 50% of the outstanding shares of our common stock are present or represented by proxy or (2) a majority of outstanding shares of our common stock.
Compensation of Adviser
Pursuant to the terms of the Advisory Agreement, the Company pays the Adviser (i) a base management fee (the “Base Management Fee”) and (ii) an incentive fee (the “Incentive Fee”). For the period from the date of the Advisory Agreement (the “Effective Date”) through the end of the first calendar quarter after the Effective Date, the Base Management Fee will be calculated at an annual rate of 1.50% of the Company’s gross assets, excluding cash and cash equivalents, but including assets purchased with borrowed amounts, as of the end of such calendar quarter. Subsequently, the Base Management Fee will be 1.50% of the Company’s average gross assets, excluding cash and cash equivalents, but including assets purchased with borrowed amounts, at the end of the two most recently completed calendar quarters; provided, however, that the Base Management Fee will be 1.00% of the Company’s average gross assets, excluding cash and cash equivalents, but including assets purchased with borrowed amounts, that exceed the product of (i) 200% and (ii) the value of the Company’s net asset value at the end of the most recently completed calendar quarter.
F-48
The Incentive Fee consists of two parts: (1) a portion based on the Company’s pre-incentive fee net investment income (the “Income-Based Fee”) and (2) a portion based on the net capital gains received on the Company’s portfolio of securities on a cumulative basis for each calendar year, net of all realized capital losses and all unrealized capital depreciation on a cumulative basis, in each case calculated from the Effective Date, less the aggregate amount of any previously paid capital gains Incentive Fee (the “Capital Gains Fee”). The Income-Based Fee is 17.50% of pre-incentive fee net investment income with a 7.00% hurdle rate. The Capital Gains Fee is 17.50%.
Pre-incentive fee net investment income means dividends (including reinvested dividends), interest and fee income accrued by the Company during the calendar quarter, minus operating expenses for the quarter (including the management fee, expenses payable under the administration agreement, and any interest expense and dividends paid on any issued and outstanding preferred stock, but excluding the incentive fee). Pre-incentive fee net investment income includes, in the case of investments with a deferred interest feature (such as original issue discount, debt instruments with payment-in-kind(“PIK”) interest and zero coupon securities), accrued income that the Company may not have received in cash. The Adviser is not obligated to return the incentive fee it receives on PIK interest that is later determined to be uncollectible in cash. Pre-incentive fee net investment income does not include any realized capital gains, realized capital losses or unrealized capital appreciation or depreciation.
To determine the income incentive fee, pre-incentive fee net investment income is expressed as a rate of return on the value of our net assets at the end of the immediately preceding calendar quarter. Because of the structure of the incentive fee, it is possible that the Company may pay an incentive fee in a calendar quarter in which the Company incurs a loss. For example, if the Company receives pre-incentive fee net investment income in excess of the quarterly hurdle rate, the Company will pay the applicable incentive fee even if the Company has incurred a loss in that calendar quarter due to realized capital losses and unrealized capital depreciation. In addition, because the quarterly hurdle rate is calculated based on our net assets, decreases in the Company’s net assets due to realized capital losses or unrealized capital depreciation in any given calendar quarter may increase the likelihood that the hurdle rate is reached and therefore the likelihood of the Company paying an incentive fee for the subsequent quarter. The Company’s net investment income used to calculate this component of the incentive fee is also included in the amount of the Company’s gross assets used to calculate the management fee because gross assets are total assets (including cash received) before deducting liabilities (such as declared dividend payments).
The second component of the incentive fee, the capital gains incentive fee, payable at the end of each calendar year in arrears, equals 17.50% of cumulative realized capital gains through the end of such calendar year commencing with the calendar year ending December 31, 2019, computed net of all realized capital losses and unrealized capital depreciation on a cumulative basis, in each case calculated from the Effective Date, less the aggregate amount of any previously paid capital gains incentive fee for prior periods. The Company will accrue, but will not pay, a capital gains incentive fee with respect to unrealized appreciation because a capital gains incentive fee would be owed to the Adviser if the Company were to sell the relevant investment and realize a capital gain. In no event will the capital gains incentive fee payable pursuant to the Investment Advisory Agreement be in excess of the amount permitted by the Investment Advisers Act of 1940, as amended (the “Advisers Act”) including Section 205 thereof.
The fees that are payable under the Investment Advisory Agreement for any partial period will be appropriately prorated.
Limitations of Liability and Indemnification
Under the Advisory Agreement, the Adviser, its officers, managers, partners, agents, employees, controlling persons, members and any other person or entity affiliated with the Adviser, including without limitation its managing member, will not be liable to the Company for acts or omissions performed in accordance with and pursuant to the Advisory Agreement, except those resulting from acts constituting criminal conduct, gross negligence, willful misfeasance, bad faith or reckless disregard of the duties that the Adviser owes to the Company under the Advisory Agreement. In addition, as part of the Advisory Agreement, the Company has agreed to indemnify the Adviser and each of its officers, managers, partners, agents, employees, controlling persons, members and any other person or entity affiliated with the Adviser, including without limitation its general partner, and the Administrator from and against any damages, liabilities, costs and expenses, including reasonable legal fees and other expenses reasonably incurred, in or by reason of any pending, threatened or completed action, suit, investigation or other proceeding (including an action or suit by or in the right of the Company or its security holders) arising out of or otherwise based upon the performance of any of the Adviser’s duties or obligations under the Advisory Agreement or otherwise as an investment adviser of the Company, except where attributable to criminal conduct, gross negligence, willful misfeasance, bad faith or reckless disregard of such person’s duties under the Advisory Agreement.
F-49
Board Approval of the Advisory Agreement
On December 12, 2018, the then-current Board of the Company held an in-person meeting to consider and approve the Advisory Agreement and related matters. The Board was provided the information required to consider the Advisory Agreement, including: (a) the nature, quality and extent of the advisory and other services to be provided to the Company by the Adviser; (b) comparative data with respect to advisory fees or similar expenses paid by other BDCs with similar investment objectives; (c) the Company projected operating expenses and expense ratio compared to BDCs with similar investment objectives; (d) any existing and potential sources of indirect income to the Adviser from its relationship with the Company and the profitability of that relationship; (e) information about the services to be performed and the personnel performing such services under the Advisory Agreement; (f) the organizational capability and financial condition of the Adviser and its affiliates; (g) the Adviser’s practices regarding the selection and compensation of brokers that may execute our portfolio transactions and the brokers’ provision of brokerage and research services to the Adviser; and (h) the possibility of obtaining similar services from other third-party service providers or continuing to operate as an internally managed BDC.
The Board, including a majority of independent directors, will oversee and monitor the Company’s investment performance and, beginning with the second anniversary of the effective date of the Advisory Agreement, will annually review the compensation we pay to the Adviser.
The Company incurred management fees of $3.1 million for the year ended December 31, 2019. No incentive fees were earned during for the year ended December 31, 2019.
Administration Agreement
Under the terms of the administration agreement (the “Administration Agreement”) between the Company and BC Partners Management LLC (the “Administrator”), the Administrator will perform, or oversee the performance of, required administrative services, which includes providing office space, equipment and office services, maintaining financial records, preparing reports to stockholders and reports filed with the SEC, and managing the payment of expenses and the performance of administrative and professional services rendered by others. The Company will reimburse the Administrator for services performed for us pursuant to the terms of the Administration Agreement. In addition, pursuant to the terms of the Administration Agreement, the Administrator may delegate its obligations under the Administration Agreement to an affiliate or to a third party and the Company will reimburse the Administrator for any services performed for it by such affiliate or third party.
Payments under the Administration Agreement are equal to an amount that reimburses the Administrator for its costs and expenses in performing its obligations and providing personnel and facilities (including rent, office equipment and utilities) for the Company’s use under the Administration Agreement, including an allocable portion of the compensation paid to the Company’s chief compliance officer and chief financial officer and their respective staff who provide services to the Company. The Board, including the independent directors, will review the general nature of the services provided by the Administrator as well as the related cost to the Company for those services and consider whether the cost is reasonable in light of the services provided.
On April 1, 2019, the Board approved the Administration Agreement with the Administrator. Unless earlier terminated as described below, the Administration Agreement will remain in effect until April 1, 2021, a period of two years from the date it first became effective and will remain in effect from year-to-year thereafter if approved annually by a majority of the Board or by the holders of a Majority of the Outstanding Shares, and, in each case, a majority of the independent directors.
The Company may terminate the Administration Agreement, without payment of any penalty, upon 60 days’ written notice. The decision to terminate the agreement may be made by a majority of the Board or the stockholders holding a Majority of the Outstanding Shares. In addition, the Adviser may terminate the Administration Agreement, without payment of any penalty, upon 60 days’ written notice.
The Company incurred $1.2 million of Administrative services expense for the year ended December 31, 2019.
Payment of Expenses under the Advisory and Administration Agreements
Except as specifically provided below, all investment professionals and staffs of the Adviser, when and to the extent engaged in providing investment advisory and management services to the Company, and the compensation and routine overhead expenses (including rent, office equipment and utilities), of such personnel allocable to such services, is provided and paid for by the Adviser. The Company bears an allocable portion of the compensation paid by the Adviser (or its affiliates) to the Company’s chief compliance officer and chief financial officer and their respective staffs (based on a percentage of time such individuals devote, on an estimated basis, to our business affairs). The Company also bears all other costs and expenses of our operations, administration and transactions, including, but not limited to (i) investment advisory fees, including management fees and incentive fees, to the Adviser, pursuant to the Advisory Agreement; (ii) an allocable portion of overhead and other expenses incurred by the Adviser (or its affiliates) in performing its administrative obligations under the Advisory Agreement, and (iii) all other expenses of our operations and transactions including, without limitation, those relating to:
|
|
• |
the cost of calculating the Company’s net asset value, including the cost of any third-party valuation services; |
|
|
• |
the cost of effecting any sales and repurchases of the Company’s common stock and other securities; |
F-50
|
|
• |
administration fees payable under the Administration Agreement and any sub-administration agreements, including related expenses; |
|
|
• |
debt service and other costs of borrowings or other financing arrangements; |
|
|
• |
costs of hedging; |
|
|
• |
expenses, including travel expense, incurred by the Adviser, or members of the investment team, or payable to third parties, performing due diligence on prospective portfolio companies and, if necessary, enforcing our rights; |
|
|
• |
transfer agent and custodial fees; |
|
|
• |
fees and expenses associated with marketing efforts; |
|
|
• |
federal and state registration fees, any stock exchange listing fees and fees payable to rating agencies; |
|
|
• |
federal, state and local taxes; |
|
|
• |
independent directors’ fees and expenses including certain travel expenses; |
|
|
• |
costs of preparing financial statements and maintaining books and records and filing reports or other documents with the SEC (or other regulatory bodies) and other reporting and compliance costs, including registration and listing fees, and the compensation of professionals responsible for the preparation of the foregoing; |
|
|
• |
the costs of any reports, proxy statements or other notices to stockholders (including printing and mailing costs), the costs of any stockholder or director meetings and the compensation of personnel responsible for the preparation of the foregoing and related matters; |
|
|
• |
commissions and other compensation payable to brokers or dealers; |
|
|
• |
research and market data; |
|
|
• |
fidelity bond, directors and officers errors and omissions liability insurance and other insurance premiums; |
|
|
• |
direct costs and expenses of administration, including printing, mailing, long distance telephone and staff; |
|
|
• |
fees and expenses associated with independent audits, outside legal and consulting costs; |
|
|
• |
costs of winding up our affairs; |
|
|
• |
costs incurred by either the Administrator or us in connection with administering our business, including payments under the Administration Agreement; |
|
|
• |
extraordinary expenses (such as litigation or indemnification); |
|
|
• |
costs associated with reporting and compliance obligations under the 1940 Act and applicable federal and state securities laws; and |
|
|
• |
costs associated with the Company’s legacy lease; |
Co-investment Exemptive Relief
As a BDC, the Company is subject to certain regulatory restrictions in making its investments. For example, BDCs generally are not permitted to co-invest with certain affiliated entities in transactions originated by the BDC or its affiliates in the absence of an exemptive order from the SEC. However, BDCs are permitted to, and may, simultaneously co-invest in transactions where price is the only negotiated term.
On October 23, 2018, the SEC issued an order granting an application for exemptive relief to an affiliate of the Adviser that allows BDCs managed by the Adviser, including the Company, to co-invest, subject to the satisfaction of certain conditions, in certain private placement transactions, with other funds managed by the Advisers or its affiliates, including BCP Special Opportunities Fund I LP, BC Partners Lending Corporation and any future funds that are advised by the Adviser or its affiliated investment advisers. Under the terms of the exemptive order, in order for the Company to participate in a co-investment transaction a “required majority” (as defined in Section 57(o) of the 1940 Act) of the Company’s independent directors must conclude that (i) the terms of the proposed transaction, including the consideration to be paid, are reasonable and fair to the Company and its stockholders and do not involve overreaching with respect of the Company or its stockholders on the part of any person concerned, and (ii) the proposed transaction is consistent with the interests of the Company’s stockholders and is consistent with the Company’s investment objectives and strategies and certain criteria established by the Board.
F-51
On October 30, 2017, the Company entered into a new term loan agreement with Trimaran Advisors, one of the Asset Manager Affiliates. Trimaran Advisors borrowed $8.4 million under this agreement, which bore interest at a rate of 10.5% annually, payable quarterly. The loan matures on April 30, 2030, can be repaid at any time, and must be repaid upon the occurrence of certain events. During the third quarter 2018 $2.1 million of the principal on this loan was repaid by Trimaran Advisors. During the fourth quarter of 2018, Trimaran Advisors repaid this loan in full. Repayment was comprised of $3.0 million of cash and $2.5 million notional amount of subordinated notes of Catamaran 2013-1 with a fair value of $1.4 million and $3.4 million of notional amount of subordinated notes of Catamaran 2014-1 with a fair value of $1.9 million.
On October 31, 2017, Trimaran Advisors capitalized Trimaran Risk Retention Holdings, LLC, a newly-formed wholly-owned subsidiary, with $8.4 million of equity capital. In turn, Trimaran Risk Retention Holdings capitalized Trimaran RR I, LLC, a wholly-owned subsidiary of Trimaran Risk Retention Holdings, LLC, with $8.4 million of equity capital. With this equity contribution and other borrowed funds, Trimaran RR II, LLC purchased $34.8 million notional amount of notes issued by Catamaran CLO 2014-1, Ltd. for aggregate consideration of $35.5 million. On December 21, 2017, the Company entered into another new term loan agreement with Trimaran Advisors, under which Trimaran Advisors borrowed $4.4 million, which also bore interest at a rate of 10.5% annually, payable quarterly. During the second quarter of 2018, this loan was repaid in full by Trimaran Advisors.
On December 21, 2017, Trimaran Advisors contributed $4.4 million of equity capital to Trimaran Risk Retention Holdings, LLC. In turn, Trimaran Risk Retention Holdings contributed $4.4 million of equity capital to Trimaran RR II. With this equity contribution and other borrowed funds, Trimaran RR I, LLC purchased $27.4 million notional amount of notes issued by Catamaran CLO 2015-1, Ltd. for aggregate consideration of $27.4 million.
On June 4, 2018, Trimaran RR I, LLC sold $31.4 million and $24.9 million, of notional amount of notes issued by Catamaran CLO 2014-1, Ltd and Catamaran 2013-1, Ltd, respectively. In December 2018, Trimaran RR I, LLC. distributed to Trimaran $2.5 million notional amount of subordinated notes issued by Catamaran 2013-1 with a fair value of $1.4 million, and a notional amount of $3.4 million of subordinated notes issued by Catamaran 2014-1 with a fair value of $1.9 million.
Trimaran Credit Facility
On February 26, 2013, the Company entered into a senior credit agreement (the “Trimaran Credit Facility”) with Trimaran Advisors, pursuant to which Trimaran Advisors may borrow from time to time up to $20 million from the Company in order to provide capital necessary to support one or more of Trimaran Advisors’ warehouse lines of credit and/or working capital in connection with Trimaran Advisors’ warehouse activities. The Trimaran Credit Facility, which expired on November 20, 2017 and bore interest at an annual rate of 9.0%. On April 15, 2013, the Trimaran Credit Facility was amended and upsized from $20 million to $23 million. Outstanding borrowings on the Trimaran Credit Facility were callable by the Company at any time. The Trimaran Credit Facility was fully repaid and terminated in the fourth quarter of 2018. For the years ended December 31, 2018 and 2017, the Company recognized interest income of approximately $2.2 million and $0.9 million, related to the Trimaran Credit Facility.
|
7. |
BORROWINGS |
The Company’s debt obligations consist of the following:
|
|
|
As of |
|
|
As of |
|
||
|
|
|
December 31, 2019 |
|
|
December 31, 2018 |
|
||
|
|
|
|
|
|
|
|
|
|
|
6.125% Notes Due 2022 (net of offering costs of: 2019-$1,651,946; 2018 - $2,207,341) |
|
$ |
75,755,253 |
|
|
$ |
75,199,858 |
|
|
Great Lakes KCAP Funding I, LLC Revolving Credit Facility (net of offering costs of: 2018 - $1,155,754) |
|
|
— |
|
|
|
25,200,331 |
|
|
Great Lakes Portman Ridge Funding LLC Revolving Credit Facility (net of offering costs of: 2019-$1,462,364) |
|
|
78,108,535 |
|
|
|
— |
|
|
|
|
$ |
153,863,788 |
|
|
$ |
100,400,189 |
|
The weighted average stated interest rate and weighted average maturity on all our debt outstanding as December 31, 2019 of were 5.4% and 3.4 years, respectively, and as of December 31, 2018 were 6.0% and 3.6 years, respectively.
F-52
During the third quarter of 2017, the Company issued $77.4 million in aggregate principal amount of unsecured 6.125% Notes due 2022 (the 6.125% Notes Due 2022). The net proceeds for these Notes, after the payment of underwriting expenses, were approximately $74.6 million. Interest on the 6.125% Notes Due 2022 is paid quarterly in arrears on March 30, June 30, September 30 and December 30, at a rate of 6.125%. The 6.125% Notes Due 2022 mature on September 30, 2022 and are unsecured obligations of the Company. The 6.125% Notes Due 2022 are subject to redemption in whole or in part at any time or from time to time, at the option of the Company, on or after September 30, 2019, at a redemption price per security equal to 100% of the outstanding principal amount thereof plus accrued and unpaid interest payments otherwise payable for the then-current quarterly interest period accrued to the date fixed for redemption. In addition, due to the asset coverage test applicable to the Company as a BDC and a covenant that the Company agreed to in connection with the issuance of the 6.125% Notes Due 2022, the Company is limited in its ability to make distributions in certain circumstances. The indenture governing the 6.125% Notes Due 2022 contains certain restrictive covenants, including compliance with certain provisions of the 1940 Act related to borrowing and dividends. At December 31, 2019, the Company was in compliance with all of its debt covenants.
For the years ended December 31, 2019, 2018 and 2017, interest expense related to the 6.125% Notes Due 2022 was approximately $4.7 million, $4.7 million and $1.6 million, respectively.
In connection with the issuance of the 6.125% Notes Due 2022, the Company incurred approximately $2.9 million of debt offering costs which are being amortized over the expected term of the facility on an effective yield method, of which approximately $1.7 million and $2.2 million remains to be amortized as of December 31, 2019 and December 31, 2018, respectively, and is included on the consolidated balance sheets as a reduction in the related debt liability.
Fair Value of 6.125% Notes Due 2022. The 6.125% Notes Due 2022 were issued via public offering during the third quarter of 2017 and are carried at cost, net of offering costs of $1.7 million and $2.2 million at December 31, 2019 and December 31, 2018. The fair value of the Company’s outstanding 6.125% Notes Due 2022 was approximately $78.1 million and $76.6 million at December 31, 2019 and December 31, 2018. The fair value was determined based on the closing price on December 31, 2019 for the 6.125% Notes Due 2022. The 6.125% Notes Due 2022 are categorized as Level I under the ASC 820 Fair Value Hierarchy.
Revolving Credit Facilities
On March 1, 2018, Great Lakes KCAP Funding I, LLC (“Funding”), our wholly owned subsidiary, entered into a senior secured revolving credit facility (the “Prior Revolving Credit Facility”) with certain institutional lenders, State Bank and Trust Company, as the administrative agent, lead arranger and bookrunner, CIBC Bank USA, as documentation agent and the Company, as the servicer. The maximum commitment amount of the Prior Revolving Credit Facility was increased on March 27, 2019 to $57.5 million, and on April 1, 2019 to $67.5 million, subject to availability under the borrowing base. In December 2019, the Prior Revolving Credit Facility was fully repaid and the related agreements, including security interests in assets pledged as collateral, were terminated on December 23, 2019. The Company recognized a realized loss on extinguishment of debt of approximately $1.1 million in connection with the termination of the Prior Revolving Credit Facility.
Borrowings under the Prior Revolving Credit Facility bore interest at a rate per annum equal to (i) in the case of LIBOR rate loans, an adjusted LIBOR rate for the applicable interest period plus 3.25% or (ii) in the case of base rate loans, the prime rate plus 3.25%. Funding will pay a fee on any undrawn amounts of 0.375% per annum; provided that if 50% or less of the Prior Revolving Credit Facility is drawn, the fee will be 0.50% per annum.
The Prior Revolving Credit Facility was secured by all of the assets held by Funding, and the Company had pledged its interests in Funding as collateral to State Bank and Trust Company, as the administrative agent, to secure the obligations of Funding under the Revolving Credit Facility. The Revolving Credit Agreement includes customary affirmative and negative covenants, including certain limitations on the incurrence of additional indebtedness and liens, as well as usual and customary events of default for revolving credit facilities of this nature.
For the year ended December 31, 2019, interest and fees expense related to the Prior Revolving Credit Facility was approximately $2.3 million. For the year ended December 31, 2018, interest and fees expense related to the Prior Revolving Credit Facility was approximately $1.0 million.
On December 18, 2019, Great Lakes Portman Ridge Funding LLC (“GLPRF LLC”), our wholly-owned subsidiary, entered into a senior secured revolving credit facility (the “Revolving Credit Facility”) with JPMorgan Chase Bank, National Association (“JPM”). JPM serves as administrative agent, U.S. Bank National Association serves as collateral agent, securities intermediary and collateral administrator, and we serve as portfolio manager under the Revolving Credit Facility.
F-53
Advances under the Revolving Credit Facility bear interest at a per annum rate equal to the three-month LIBOR in effect, plus the applicable margin of 2.85% per annum. GLPRF LLC is required to utilize a minimum of 80% of the commitments under the Revolving Credit Facility, after an initial six-month ramp-up period during which a lesser minimum utilization requirement applies. Unused amounts below such minimum utilization amount accrue interest as if such amounts are outstanding as borrowings under the Revolving Credit Facility. In addition, GLPRF LLC will pay a non-usage fee during the first three years after the closing date in an amount not to exceed 0.50% per annum on the average daily unborrowed portion of the financing commitments in excess of such minimum utilization amount.
The initial principal amount of the Revolving Credit Facility is $115 million. The Revolving Credit Facility has an accordion feature, subject to the satisfaction of various conditions, which could bring total commitments under the Revolving Credit Facility to up to $215 million. Proceeds from borrowings under the Revolving Credit Facility may be used to fund portfolio investments by GLPRF LLC and to make advances under delayed draw term loans where GLPRF LLC is a lender. All amounts outstanding under the Revolving Credit Facility must be repaid by the maturity date of December 18, 2023.
GLPRF LLC’s obligations to the lenders under the Revolving Credit Facility are secured by a first priority security interest in all of GLPRF LLC’s portfolio of investments and cash. The obligations of GLPRF LLC under the Revolving Credit Facility are non-recourse to us, and our exposure under the Revolving Credit Facility is limited to the value of our investment in GLPRF LLC. In connection with the Revolving Credit Facility, GLPRF LLC has made certain customary representations and warranties and is required to comply with various covenants, reporting requirements and other customary requirements for similar facilities. The Revolving Credit Facility contains customary events of default for similar financing transactions, including if a change of control of GLPRF LLC occurs or if we are no longer the portfolio manager of GLPRF LLC.
At December 31, 2019, GLPRF LLC was in compliance with all of its debt covenants and $79.6 million principal amount of borrowings was outstanding under the Revolving Credit Facility. The fair value of GLPRF LLC was approximately $79.6 million at December 31, 2019.
7.375% Notes Due 2019
On October 10, 2012, the Company issued $41.4 million in aggregate principal amount of unsecured 7.375% Notes due 2019 (the “7.375% Notes Due 2019”). The net proceeds for these Notes, after the payment of underwriting expenses, were approximately $39.9 million. As of December 31, 2018, there were no 7.375% Notes Due 2019 outstanding. Interest on the 7.375% Notes Due 2019 was paid quarterly in arrears on March 30, June 30, September 30 and December 30, at a rate of 7.375%, commencing December 30, 2012. The 7.375% Notes Due 2019 had a maturity date of September 30, 2019 and were unsecured obligations of the Company. The 7.375% Notes Due 2019 were subject to redemption in whole or in part at any time or from time to time, at the option of the Company, on or after September 30, 2015, at a redemption price per security equal to 100% of the outstanding principal amount thereof plus accrued and unpaid interest payments otherwise payable for the then-current quarterly interest period accrued to the date fixed for redemption. In addition, due to the asset coverage test applicable to the Company as a BDC and a covenant that the Company agreed to in connection with the issuance of the 7.375% Notes Due 2019, the Company was limited in its ability to make distributions in certain circumstances. The indenture governing the 7.375% Notes Due 2019 contains certain restrictive covenants, including compliance with certain provisions of the 1940 Act relating to borrowing and dividends.
For the years ended December 31, 2018 and 2017, interest expense related to the 7.375% Notes Due 2019 was approximately $774,000 and $2.2 million, respectively.
During the second quarter of 2017, approximately $6.5 million par value of the 7.375% Notes Due 2019 was redeemed by the Company, resulting in a realized loss on extinguishment of approximately $107,000. The Company subsequently surrendered these notes to the Trustee for cancellation.
During the first quarter of 2018, approximately $20 million par value of the 7.375% Notes Due 2019 was redeemed by the Company, resulting in a realized loss on extinguishment of approximately $169,000. The Company subsequently surrendered these notes to the Trustee for cancellation.
During the fourth quarter of 2018, all of the remaining $7 million par value of the 7.375% Notes Due 2019 was redeemed by the Company, resulting in a realized loss on extinguishment of approximately $28,000. The Company subsequently surrendered these notes to the Trustee for cancellation.
F-54
Effective December 11, 2006, the Company elected to be treated as a RIC under the Code and adopted a December 31 tax-calendar year end. As a RIC, the Company is not subject to federal income tax on the portion of its taxable income and gains distributed currently to its stockholders as a dividend. The Company’s quarterly distributions, if any, are determined by the Board. The Company anticipates distributing substantially all of its taxable income and gains, within the Subchapter M rules, and thus the Company anticipates that it will not incur any federal or state income tax at the RIC level. As a RIC, the Company is also subject to a federal excise tax based on distributive requirements of its taxable income on a calendar year basis (e.g., calendar year 2019). Depending on the level of taxable income earned in a tax year, the Company may choose to carry forward taxable income in excess of current year distributions into the next tax year and pay a 4% excise tax on such income, to the extent required.
Book and tax basis differences relating to stockholder dividends and distributions and other permanent book and tax differences are typically reclassified among the Company’s capital accounts. In addition, the character of income and gains to be distributed is determined in accordance with income tax regulations that may differ from GAAP; accordingly at calendar years ended December 31, 2019 and 2018, the Company reclassified for book purposes amounts arising from permanent book/tax differences related to the tax treatment of return of capital distributions, non-deductible expenses, and capital loss carryforwards acquired as the result of the merger, as follows:
|
|
|
Year Ended December 31, |
|
|||||
|
|
2019 |
|
|
2018 |
|
|||
|
Capital in excess of par value |
|
$ |
137,501,521 |
|
|
$ |
(18,021,247 |
) |
|
Total distributable (loss) earnings |
|
$ |
(137,501,521 |
) |
|
|
18,021,247 |
|
The following reconciles net increase in net assets resulting from operations to taxable income for the year ended December 31, 2019 and 2018 :
|
|
Year Ended December 31, |
|
||||||
|
|
|
2019 |
|
|
2018 |
|
||
|
Net (decrease) increase in net assets resulting from operations |
|
$ |
(12,499,961 |
) |
|
$ |
(9,571,546 |
) |
|
Net change in unrealized depreciation (appreciation) from investments |
|
|
(1,121,364 |
) |
|
|
2,903,994 |
|
|
Net realized losses |
|
|
16,695,014 |
|
|
|
16,672,029 |
|
|
Book/tax differences on CLO equity investments |
|
|
(3,927,076 |
) |
|
|
(2,953,177 |
) |
|
Other book/tax differences |
|
|
1,318,364 |
|
|
|
2,141,677 |
|
|
Taxable (loss) income before deductions for distributions |
|
$ |
464,977 |
|
|
$ |
9,192,977 |
|
|
Taxable (loss) income before deductions for distributions per weighted average basic shares for the period |
|
$ |
0.01 |
|
|
$ |
0.25 |
|
|
Taxable (loss) income before deductions for distributions per weighted average diluted shares for the period |
|
$ |
0.01 |
|
|
$ |
0.25 |
|
Dividends from Asset Manager Affiliates are recorded based upon a quarterly estimate of tax-basis earnings and profits of each Asset Manager Affiliate. Distributions in excess of the estimated tax-basis quarterly earnings and profits of each distributing Asset Manager Affiliate are recognized as tax-basis return of capital. The actual tax-basis earnings and profits and resulting dividend and/or return of capital for the year will be determined at the end of the tax year for each distributing Asset Manager Affiliate. For the year ended December 31, 2018 and 2017, the Asset Manager Affiliates declared a cash distribution of $36.0 million and $3.2 million to the Company. The Company recognized $1.2 million and $460,000 of dividends from the Asset Manager Affiliates, as reflected in the Company’s statement of operations for the year ended December 31, 2018 and 2017. For the year ended December 31, 2018 and 2017, the difference of $34.8 million and $2.8 million between cash distributions received and the tax-basis earnings and profits of the distributing affiliate, are recorded as an adjustment to the cost basis in the Asset Manager Affiliate (i.e. tax-basis return of capital). During year ended December 31, 2019 the Company did not receive a cash distribution from the Affiliated Manager Affiliates, nor did we recognize any dividends.
F-55
Distributions to shareholders that exceed tax-basis distributable income (tax-basis net investment income and realized gains, if any) are reported as distributions of paid-in capital (i.e. return of capital). The tax character of distributions is made on an annual (full calendar-year) basis. The determination of the tax attributes of our distributions is made at the end of the year based upon our taxable income for the full year and the distributions paid during the full year. Therefore, a determination of tax attributes made on a quarterly basis may not be representative of the actual tax attributes of distributions for a full year.
|
|
Year Ended December 31, |
|
||||||||||||||
|
Distributions paid from: |
|
2019 |
|
|
|
|
2018 |
|
|
|
|
2017 |
|
|||
|
Ordinary Income |
|
$ |
464,977 |
|
|
|
|
$ |
9,192,977 |
|
|
|
|
$ |
6,035,683 |
|
|
Return of Capital |
|
|
11,485,293 |
|
|
|
|
|
5,688,770 |
|
|
|
|
|
11,736,777 |
|
|
Total |
|
$ |
11,950,270 |
|
|
|
|
$ |
14,881,747 |
|
|
|
|
$ |
17,772,460 |
|
As of December 31, 2019 and 2018, the components of accumulated earnings on tax basis were as follows:
|
|
Year Ended December 31, |
|
||||||
|
|
|
2019 |
|
|
2018 |
|
||
|
Capital loss carryforward |
|
$ |
(230,821,193 |
) |
|
$ |
(86,744,479 |
) |
|
Other temporary differences |
|
|
(892,590 |
) |
|
|
(1,264,153 |
) |
|
Net unrealized depreciation |
|
|
(67,889,323 |
) |
|
|
(61,128,013 |
) |
At December 31, 2019, the Company had a net capital loss carryforward of $230.8 million to offset net capital gains. This net capital loss carryforward is not subject to expiration. A portion of the Company’s capital loss carryovers are subject to an annual use limitation under the Code and related regulations.
The Company has certain taxable subsidiaries which have elected to be taxed as corporations for U.S. tax purposes. For the Company's tax year ended December 31, 2019, the taxable subsidiaries’ activity did not result in a material provision for income taxes. As of December 31, 2019, $158,090 of refundable AMT tax credits receivable was included as an asset on the consolidated balance sheets. The taxable subsidiaries have, in aggregate, $23,154,377 of deferred tax assets (primarily due to net operating loss and capital loss carryovers) and $740,628 of deferred tax liabilities (primarily due to unrealized appreciation on investments). The Company has assessed the realizability of the deferred tax assets and recorded a valuation allowance of $22,413,749. A portion of the taxable subsidiaries’ net operating loss and capital loss carryovers are subject to an annual use limitation under the Code and related regulations.
ASC Topic 740 Accounting for Uncertainty in Income Taxes (“ASC 740”) provides guidance for how uncertain tax positions should be recognized, measured, presented, and disclosed in the consolidated financial statements. ASC 740 requires the evaluation of tax positions taken or expected to be taken in the course of preparing the Company’s tax returns to determine whether the tax positions are “more-likely-than-not” of being sustained by the applicable tax authority. The Company recognizes the tax benefits of uncertain tax positions only where the position is “more likely than not” to be sustained assuming examination by tax authorities. Management has analyzed the Company’s tax positions and has concluded that no liability for unrecognized tax benefits should be recorded related to uncertain tax positions taken on returns filed for open tax years (the last three fiscal years) or expected to be taken in the Company’s current year tax return. The Company identifies its major tax jurisdictions as U.S. Federal and New York State, and the Company is not aware of any tax positions for which it is reasonably possible that the total amounts of unrecognized tax benefits will change materially in the next 12 months. Management’s determinations regarding ASC 740 may be subject to review and adjustment at a later date based upon factors including, but not limited to, an ongoing analysis of tax laws, regulations and interpretations thereof.
|
9. |
COMMITMENTS AND CONTINGENCIES |
From time-to-time the Company is a party to financial instruments with off-balance sheet risk in the normal course of business in order to meet the needs of the Company’s investment in portfolio companies. Such instruments include commitments to extend credit and may involve, in varying degrees, elements of credit risk in excess of amounts recognized on the Company’s balance sheet. Prior to extending such credit, the Company attempts to limit its credit risk by conducting extensive due diligence, obtaining collateral where necessary and negotiating appropriate financial covenants. As of December 31, 2019,and 2018, the Company had $31.9 million and $12.9 million unfunded commitments, respectively.
The Company has made an aggregate commitment to the BCP Great Lakes Fund of $50 million, subject to certain limitations (including that the Company is not obligated to fund capital calls if such funding would cause the Company to be out of compliance with certain provisions of the Investment Company Act of 1940). As of December 31, 2019 and December 31, 2018, the Company had a $26.3 million and $12.5 million, respectively unfunded commitment to the BCP Great Lakes Fund, subject to the limitations noted above. However, at December 31, 2019 our funding commitment was limited to approximately $11.3 million pursuant to the limitations described above.
F-56
In the fourth quarter of 2018, the Company undertook the commitments under a lease obligation for its office space. Such obligation was previously with Katonah Debt Advisors. During 2018, the Company and the Asset Manager Affiliates shared the cost of such lease pursuant to an Overhead Allocation agreement. The Company’s portion of rent expense was approximately $491 thousand and $434 thousand for the years ended December 31, 2019 and 2018, respectively.
Effective January 1, 2019, the Company adopted ASU 2016-02, “Leases (Topic 842)”. The right-of-use asset of $3.3 million and lease liability of $3.6 million related to the Company’s office lease were recognized on January 1, 2019 by calculating the present value of lease payments over the lease term. The discount rate used in determining the lease liability was the Company’s estimated incremental borrowing rate of 6.03%. In calculating the initial operating lease liability, the effect of the discounting was approximately $626 thousand. The lease agreement expires on May 31, 2024.
During the second quarter of 2019, the Company recognized an impairment to the operating lease right-of-use asset of approximately $1.4 million to reduce the right-of-use asset to its estimated fair market value. The remaining right of use asset will be amortized to expense in future periods as a component of Other general and administrative expenses. There was no impact to the lease liability as a result of this impairment. The impairment charge was measured using a discounted cash flow analysis and recognized in the statement of operations during the second quarter of 2019 as a result of the Company’s estimated impact of entering into a sublease.
On November 1, 2019, the Company terminated the lease agreement. Excluding the impairment charge, the total operating lease costs were approximately $491 thousand for the year ended December 31, 2019.
|
10. |
STOCKHOLDERS’ EQUITY |
During the year ended December 31, 2019 and 2018, the Company issued 73,842, and 64,671 shares, respectively, of common stock under its dividend reinvestment plan. For the year ended December 31, 2019, there were no grants of restricted stock, 10,571 shares were forfeited, and 113,382 shares vested. The total number of shares of the Company’s common stock outstanding as of December 31, 2019 and December 31, 2018 was 44,829,676 and 37,326,846, respectively.
|
11. |
EQUITY COMPENSATION PLANS |
The Company had an equity incentive plan, established in 2006 and most recently amended, following approval by the Company’s Board and shareholders, on May 4, 2017 (the “Equity Incentive Plan”). The Company reserved 2,000,000 shares of common stock for issuance under the Equity Incentive Plan. In connection with the Closing, the Company terminated the Equity Incentive Plan and will no longer make grants pursuant to the plan. Prior to the Closing, restricted stock granted under the Equity Incentive Plan was granted at a price equal to the fair market value (market closing price) of the shares on the day such restricted stock is granted. Options granted under the Equity Incentive Plan were exercisable at a price equal to the fair market value (market closing price) of the shares on the day the option is granted.
Stock Options
The 2008 Non-Employee Director Plan was originally adopted by the Board and was approved by a vote of the Company’s shareholders at the 2008 Annual Shareholder Meeting (the “2008 Plan”). Effective June 10, 2011, the 2008 Plan was amended and restated in accordance with a resolution of the Board and approved by a vote of the Company’s shareholders at the 2011 Annual Shareholder Meeting (the “2011 Plan”). Effective May 4, 2017, the 2011 Plan was amended and restated in accordance with a resolution of the Board and approved by the Company’s shareholders at the 2017 Annual Shareholder Meeting (the “Non-Employee Director Plan”). In connection with the Closing, the Company terminated the 2008 Plan and will no longer make grants pursuant to the plan.
F-57
Immediately prior to the Closing, by virtue of the Externalization and subject to the execution of an option cancellation agreement, each option to purchase shares of the Company’s common stock granted under the 2008 Plan that was outstanding immediately prior to the Externalization was cancelled in exchange for a payment in cash to the holder thereof.
Information with respect to options granted, exercised and forfeited under the Equity Incentive Plan for the period January 1, 2018 through December 31, 2019 is as follows:
|
|
Non-vested Restricted Shares |
|
||
|
Non-vested shares outstanding at January 1, 2018 |
|
|
297,199 |
|
|
Granted |
|
|
6,000 |
|
|
Vested |
|
|
(122,878 |
) |
|
Forfeited |
|
|
(56,368 |
) |
|
Non-vested shares outstanding at December 31, 2018 |
|
|
123,953 |
|
|
Granted |
|
|
— |
|
|
Vested |
|
|
(113,382 |
) |
|
Forfeited |
|
|
(10,571 |
) |
|
Non-Vested Outstanding at December 31, 2019 |
|
|
— |
|
|
|
Shares |
|
|
Weighted Average Exercise Price per Share |
|
|
Weighted Average Contractual Remaining Term (years) |
|
|
Aggregate Intrinsic Value1 |
|
|||||
|
Options outstanding at January 1, 2018 |
|
|
50,000 |
|
|
$ |
7.72 |
|
|
|
2.4 |
|
|
$ |
— |
|
|
Granted |
|
|
— |
|
|
|
— |
|
|
|
|
|
|
|
|
|
|
Exercised |
|
|
— |
|
|
|
— |
|
|
|
|
|
|
|
|
|
|
Forfeited |
|
|
|
|
|
|
|
|
|
|
|
|
|
|
|
|
|
Expired unexercised |
|
|
(5,000 |
) |
|
|
11.97 |
|
|
|
|
|
|
|
|
|
|
Cancelled |
|
|
(15,000 |
) |
|
|
11.97 |
|
|
|
|
|
|
|
|
|
|
Options outstanding at December 31, 2018 |
|
|
30,000 |
|
|
$ |
4.88 |
|
|
|
0.9 |
|
|
$ |
— |
|
|
Granted |
|
|
— |
|
|
|
— |
|
|
|
|
|
|
|
|
|
|
Exercised |
|
|
— |
|
|
|
— |
|
|
|
|
|
|
|
|
|
|
Forfeited |
|
|
— |
|
|
|
— |
|
|
|
|
|
|
|
|
|
|
Cancelled |
|
|
(30,000 |
) |
|
|
4.88 |
|
|
|
0.6 |
|
|
|
|
|
|
Outstanding at December 31, 2019 |
|
|
— |
|
|
$ |
— |
|
|
|
— |
|
|
$ |
— |
|
|
Total vested at December 31, 2019 |
|
|
— |
|
|
$ |
— |
|
|
|
— |
|
|
|
|
|
|
1 |
Represents the difference between the market value of shares of the Company on March 31, 2019 and the exercise price of the options. |
The Company uses a Binary Option Pricing Model (American, call option) to establish the expected value of all stock option grants. For the three and twelve months ended December 31, 2019 and 2018, the Company did not recognize any non-cash compensation expense related to stock options. At December 31, 2019, the Company had no remaining compensation costs related to unvested stock based awards.
Restricted Stock
Awards of restricted stock granted under the Non-Employee Director Plan vest as follows: 50% of the shares vest on the grant date and the remaining 50% of the shares vest on the earlier of:
|
|
(i) |
the first anniversary of such grant, or |
|
|
(ii) |
the date immediately preceding the next annual meeting of shareholders. |
On May 3, 2018, 6,000 shares of restricted stock were awarded to the Company’s Board.
F-58
Immediately prior to the Closing all restrictions with respect to 3,000 shares of restricted stock outstanding and not previously forfeited under the Non-Employee Director Plan lapsed, and the holders of such restricted stock became entitled to receive a pro rata share of the payment due to stockholders of the Company pursuant to the Externalization Agreement.
On June 16, 2015, the Company received exemptive relief to repurchase shares of its common stock from its employees in connection with certain equity compensation plan arrangements. During the year ended December 31, 2018, the Company repurchased 26,681 shares, of common stock at an aggregate cost of approximately $86,000, in connection with the vesting of employee’s restricted stock, which is reflected as a reduction in Stockholders’ Equity at cost. These shares are not available to be reissued under the Company’s Equity Incentive Plan.
Immediately prior to the Closing, 110,382 shares of restricted stock outstanding and not previously forfeited under the Equity Incentive Plan and the 2008 Plan (as defined below) became fully vested, all restrictions with respect to such restricted stock lapsed, and the holders of such restricted stock became entitled to receive a pro rata share of the payment due to stockholders of the Company pursuant to the Externalization Agreement.
Information with respect to restricted stock granted, exercised and forfeited under the Plan for the period January 1, 2018 through December 31, 2019 is as follows:
|
|
Non-vested Restricted Shares |
|
||
|
Non-vested shares outstanding at January 1, 2018 |
|
|
297,199 |
|
|
Granted |
|
|
6,000 |
|
|
Vested |
|
|
(122,878 |
) |
|
Forfeited |
|
|
(56,368 |
) |
|
Non-vested shares outstanding at December 31, 2018 |
|
|
123,953 |
|
|
Granted |
|
|
— |
|
|
Vested |
|
|
(113,382 |
) |
|
Forfeited |
|
|
(10,571 |
) |
|
Non-Vested Outstanding at December 31, 2019 |
|
|
— |
|
For the year ended December 31, 2019, non-cash compensation expense related to restricted stock was approximately $259,000; all of which was expensed by the Company. For the year ended December 31, 2018, non-cash compensation expense related to restricted stock was approximately $548,000; of this amount approximately $248,000 was expensed by the Company, and approximately $300,000 was a reimbursable expense allocated to the Asset Manager Affiliates.
Distributions were paid on all outstanding shares of restricted stock, whether or not vested. In general, shares of unvested restricted stock were forfeited upon the recipient’s termination of employment.
|
12. |
OTHER EMPLOYEE COMPENSATION |
The Company adopted a 401(k) plan (“401K Plan”) effective January 1, 2007. The 401K Plan was open to all full time employees. The 401K Plan permits an employee to defer a portion of their total annual compensation up to the Internal Revenue Service annual maximum based on age and eligibility. The Company made contributions to the 401K Plan of up to 2% of the Internal Revenue Service’s annual maximum eligible compensation, which fully vests at the time of contribution. Approximately $9,000, $44,000 and $65,000 was expensed during the years ended December 31, 2019, 2018 and 2017, respectively, related to the 401K Plan. This Plan was terminated effective March 31, 2019.
The Company has also adopted a deferred compensation plan (“Profit-Sharing Plan”) effective January 1, 2007. Employees are eligible for the Profit-Sharing Plan provided that they are employed and working with the Company to participate in at least 100 days during the year and remain employed as of the last day of the year. Employees do not make contributions to the Profit-Sharing Plan. On behalf of the employee, the Company may contribute to the Profit-Sharing Plan 1) up to 8.0% of all compensation up to the Internal Revenue Service annual maximum and 2) up to 5.7% excess contributions on any incremental amounts above the social security wage base limitation and up to the Internal Revenue Service annual maximum. Employees vest 100% in the Profit-Sharing Plan after five years of service. Approximately $127,000 and $185,000 was expensed during the year ended December 31, 2018 and 2017, related to the Profit-Sharing Plan. This Plan was terminated effective March 31, 2019, and no expense was recognized during the year ended December 31, 2019.
F-59
On December 18, 2019, we completed our acquisition of OHA Investment Corporation (“OHAI”). In accordance with the terms of the merger agreement, each share of common stock, par value $0.001 per share, of OHAI (the “OHAI Common Stock”) issued and outstanding was converted into the right to receive (i) an amount in cash, without interest, equal to approximately $0.42, and (ii) 0.3688 shares of common stock, par value $0.01 per share, of the Company (plus any applicable cash in lieu of fractional shares). Each share of OHAI Common Stock issued and outstanding received, as additional consideration funded by Sierra Crest, an amount in cash, without interest, equal to approximately $0.15. As a result of the Merger, the Company issued an aggregate of 7,439,559 shares of its common stock to former OHAI stockholders (approximately 16.6% of the Company’s outstanding shares at December 31, 2019).
Pursuant to the merger agreement, if at any time within one year after the closing date of the transaction our common stock is trading at a price below 75% of its net asset value, we will initiate a share buyback program of up to $10 million to support the trading price of the combined entity for up to one year from the date such program is announced.
The merger was accounted for in accordance with the asset acquisition method of accounting as detailed in ASC Topic 805-50. The fair value of the consideration paid, and transaction costs incurred to complete the merger by the Company, including $3.0 million of cash payment (deemed capital contribution) paid at closing directly to shareholders of OHAI from Sierra Crest and LibreMax, was allocated to the OHAI investments acquired, based on their relative fair values as of the date of acquisition. The fair value of the purchase consideration paid by the Company below the fair value of net assets acquired is considered the purchase discount. Immediately following the acquisition of OHAI, the Company recorded OHAI’s net assets at their respective fair values and, as a result, the purchase discount was allocated to the cost basis of the OHAI investments acquired and was immediately recognized as unrealized gain on the Company's Consolidated Statement of Operations. The purchase discount was allocated to the acquired investments on a relative fair value basis and, for performing debt investments, will amortize over the life of the investments through interest income with a corresponding reversal of the unrealized appreciation on the OHAI investments acquired through their maturity. Upon the sale of any of the OHAI acquired investments, the Company will recognize a realized gain or a reduction in realized losses with a corresponding reversal of the unrealized losses.
|
|
|
|
|
|
|
Common stock issued by the Company (1) |
|
$ |
15,548,678 |
|
|
Cash consideration to OHAI shareholders (2) |
|
|
11,510,688 |
|
|
Transaction costs (excluding offering costs $385,747) |
|
|
851,807 |
|
|
Total purchase consideration |
|
|
27,911,173 |
|
|
Assets acquired: |
|
|
|
|
|
Investments, at fair value (amortized cost of $54,123,811) |
|
|
60,547,193 |
|
|
Cash |
|
|
232,708 |
|
|
Interest receivable |
|
|
592,329 |
|
|
Other assets |
|
|
482,454 |
|
|
Total assets acquired |
|
|
61,854,684 |
|
|
Liabilities assumed: |
|
|
|
|
|
Debt |
|
|
27,394,083 |
|
|
Other liabilities |
|
|
126,046 |
|
|
Total liabilities assumed |
|
|
27,520,129 |
|
|
Net assets acquired |
|
|
34,334,555 |
|
|
Total purchase discount |
|
$ |
(6,423,382 |
) |
|
(1) |
Based on the market price at closing of $2.09 as of December 18, 2019 and the 7,439,559 shares of common stock issued by the Company in conjunction with the merger. |
|
(2) |
Approximately $8.5 million cash consideration paid by the Company plus $3.0 million cash payment paid at closing directly to shareholders of OHAI from Sierra Crest and LibreMax. |
F-60
|
|
|
Q1 |
|
|
Q2 |
|
|
Q3 |
|
|
Q4 |
|
||||
|
|
|
2019 |
|
|
2019 |
|
|
2019 |
|
|
2019 |
|
||||
|
Total interest and related portfolio income |
|
$ |
5,799,410 |
|
|
$ |
6,914,169 |
|
|
$ |
7,076,196 |
|
|
$ |
6,705,361 |
|
|
Net Investment Income |
|
$ |
(2,195,187 |
) |
|
$ |
879,740 |
|
|
$ |
2,242,433 |
|
|
$ |
2,146,703 |
|
|
Net increase (decrease) in net assets resulting from operations |
|
$ |
(10,917,572 |
) |
|
$ |
(848,322 |
) |
|
$ |
(4,250,782 |
) |
|
$ |
3,516,714 |
|
|
Net increase (decrease) in net assets resulting from operations per share – basic |
|
$ |
(0.29 |
) |
|
$ |
(0.02 |
) |
|
$ |
(0.11 |
) |
|
$ |
0.09 |
|
|
Net increase (decrease) in net assets resulting from operations per share – diluted |
|
$ |
(0.29 |
) |
|
$ |
(0.02 |
) |
|
$ |
(0.11 |
) |
|
$ |
0.09 |
|
|
Net investment income per share – basic |
|
$ |
(0.06 |
) |
|
$ |
0.02 |
|
|
$ |
0.06 |
|
|
$ |
0.06 |
|
|
Net investment income per share – diluted |
|
$ |
(0.06 |
) |
|
$ |
0.02 |
|
|
$ |
0.06 |
|
|
$ |
0.06 |
|
|
|
|
Q1 |
|
|
Q2 |
|
|
Q3 |
|
|
Q4 |
|
||||
|
|
|
2018 |
|
|
2018 |
|
|
2018 |
|
|
2018 |
|
||||
|
Total interest and related portfolio income |
|
$ |
6,826,477 |
|
|
$ |
6,848,443 |
|
|
$ |
7,158,750 |
|
|
$ |
6,253,124 |
|
|
Net Investment Income |
|
$ |
2,460,742 |
|
|
$ |
2,528,920 |
|
|
$ |
2,954,529 |
|
|
$ |
2,060,286 |
|
|
Net increase (decrease) in net assets resulting from operations |
|
$ |
2,609,394 |
|
|
$ |
(1,311,771 |
) |
|
$ |
1,348,849 |
|
|
$ |
(12,218,016 |
) |
|
Net increase (decrease) in net assets resulting from operations per share – basic |
|
$ |
0.07 |
|
|
$ |
(0.04 |
) |
|
$ |
0.04 |
|
|
$ |
(0.33 |
) |
|
Net increase (decrease) in net assets resulting from operations per share – diluted |
|
$ |
0.07 |
|
|
$ |
(0.04 |
) |
|
$ |
0.04 |
|
|
$ |
(0.33 |
) |
|
Net investment income per share – basic |
|
$ |
0.07 |
|
|
$ |
0.07 |
|
|
$ |
0.08 |
|
|
$ |
0.06 |
|
|
Net investment income per share – diluted |
|
$ |
0.07 |
|
|
$ |
0.07 |
|
|
$ |
0.08 |
|
|
$ |
0.06 |
|
|
15. |
SUBSEQUENT EVENTS |
On February 5, 2020 the Company’s Board declared a distribution to shareholders of $0.06 per share for a total of $2.7 million. The record date was February 18, 2020 and the distribution was paid on February 28, 2020.
On March 5, 2020 our board of directors authorized a stock repurchase program of up to $10 million effective March 6, 2020 and terminating on March 5, 2021. Under this repurchase program, shares may be repurchased from time to time in open market transactions, in privately negotiated transactions or otherwise, subject to any agreement to which we are party including any restrictions in the indenture for our 6.125% Notes Due 2022. The timing and actual number of shares repurchased will depend on a variety of factors, including legal requirements, price, and economic and market conditions. This repurchase program may be suspended or discontinued at any time.
The Company has evaluated events and transactions occurring subsequent to December 31, 2019 for items that should potentially be recognized or disclosed in these financial statements. Other than as described above, management has determined that there are no other material subsequent events that would require adjustment to, or disclosure in, these consolidated financial statements.
F-61
INDEX TO OTHER FINANCIAL STATEMENTS AND FINANCIAL STATEMENT SCHEDULES
ASSET MANAGER AFFILIATES
|
|
|
S-2 |
|
|
|
|
|
S-3 |
|
|
|
Combined Statements of Operations for the years ended December 31, 2017, 2016 and 2015 |
|
|
S-4 |
|
|
|
|
S-5 |
|
|
|
Combined Statements of Cash Flows for the years ended December 31, 2017, 2016, and 2015 |
|
|
S-6 |
|
|
|
|
S-7 |
|
IMPORTANT NOTE
In accordance with certain SEC rules, Portman Ridge Finance Corporation (formerly known as KCAP Financial, Inc.) (the “Company”) is providing additional information regarding the following three portfolio companies: Katonah Debt Advisers, L.L.C., Trimaran Advisors, L.L.C. (collectively the Asset Manager Affiliates) and Katonah 2007-I CLO Ltd. However, pursuant to SEC rules, the Company does not consolidate portfolio company investments, including those in which it has a controlling interest. As a result, the additional financial information regarding these entities does not directly impact the Company’s financial position, results of operations or cash flows.
S-1
Report of Independent Auditors
The Board of Directors and Shareholder of
Asset Manager Affiliates
We have audited the accompanying combined financial statements of Asset Manager Affiliates, which comprise the combined balance sheets, as of December 31, 2017 and 2016, and the related combined statements of operations, changes in member’s equity, and cash flows for each of the three years in the period ended December 31, 2017, and the related notes to the combined financial statements.
Management’s Responsibility for the Financial Statements
Management is responsible for the preparation and fair presentation of these financial statements in conformity with U.S. generally accepted accounting principles; this includes the design, implementation and maintenance of internal control relevant to the preparation and fair presentation of financial statements that are free of material misstatement, whether due to fraud or error.
Auditor’s Responsibility
Our responsibility is to express an opinion on these financial statements based on our audits. We conducted our audits in accordance with auditing standards generally accepted in the United States. Those standards require that we plan and perform the audit to obtain reasonable assurance about whether the financial statements are free of material misstatement.
An audit involves performing procedures to obtain audit evidence about the amounts and disclosures in the financial statements. The procedures selected depend on the auditor’s judgment, including the assessment of the risks of material misstatement of the financial statements, whether due to fraud or error. In making those risk assessments, the auditor considers internal control relevant to the entity’s preparation and fair presentation of the financial statements in order to design audit procedures that are appropriate in the circumstances, but not for the purpose of expressing an opinion on the effectiveness of the entity’s internal control. Accordingly, we express no such opinion. An audit also includes evaluating the appropriateness of accounting policies used and the reasonableness of significant accounting estimates made by management, as well as evaluating the overall presentation of the financial statements.
We believe that the audit evidence we have obtained is sufficient and appropriate to provide a basis for our audit opinion.
Opinion
In our opinion, the financial statements referred to above present fairly, in all material respects, the combined financial position of Asset Manager Affiliates at December 31, 2017 and 2016, and the combined results of their operations and their cash flows for each of the three years in the period ended December 31, 2017, in conformity with U.S. generally accepted accounting principles.
/s/ Ernst & Young LLP
New York, New York
March 7, 2018
S-2
|
|
|
As of |
|
|
As of |
|
||
|
|
|
December 31, |
|
|
December 31, |
|
||
|
|
|
2017 |
|
|
2016 |
|
||
|
ASSETS |
|
|
|
|
|
|
|
|
|
Investments, at fair value (cost: 2017 – $82,576,095; 2016 – $0) |
|
$ |
79,901,209 |
|
|
$ |
— |
|
|
Cash |
|
|
4,655,662 |
|
|
|
3,425,709 |
|
|
Accrued management fees receivable |
|
|
2,346,490 |
|
|
|
2,176,833 |
|
|
Due from affiliates |
|
|
146,838 |
|
|
|
86,615 |
|
|
Intangible assets |
|
|
22,830,000 |
|
|
|
23,157,541 |
|
|
Other assets |
|
|
1,977,922 |
|
|
|
2,760,726 |
|
|
Total assets |
|
$ |
111,858,121 |
|
|
$ |
31,607,424 |
|
|
LIABILITIES |
|
|
|
|
|
|
|
|
|
Borrowings |
|
$ |
69,802,500 |
|
|
$ |
— |
|
|
Borrowings from related parties |
|
|
12,792,218 |
|
|
|
— |
|
|
Accrued interest payable |
|
|
230,034 |
|
|
|
— |
|
|
Accounts payable and accrued expenses |
|
|
3,724,943 |
|
|
|
3,431,496 |
|
|
Due to affiliates |
|
|
943,557 |
|
|
|
612,983 |
|
|
Deferred tax liability |
|
|
1,890,899 |
|
|
|
2,575,140 |
|
|
Total liabilities |
|
|
89,384,151 |
|
|
|
6,619,619 |
|
|
Commitments and Contingencies |
|
|
— |
|
|
|
— |
|
|
MEMBER’S EQUITY |
|
|
|
|
|
|
|
|
|
Member’s contributions |
|
|
52,519,916 |
|
|
|
52,519,916 |
|
|
Accumulated deficit |
|
|
(30,045,946 |
) |
|
|
(27,532,111 |
) |
|
Total member’s equity |
|
|
22,473,970 |
|
|
|
24,987,805 |
|
|
Total liabilities and member’s equity |
|
$ |
111,858,121 |
|
|
$ |
31,607,424 |
|
See accompanying notes to combined financial statements.
S-3
COMBINED STATEMENTS OF OPERATIONS
|
|
|
For the Years Ended December 31, |
|
|||||||||
|
|
|
2017 |
|
|
2016 |
|
|
2015 |
|
|||
|
Revenues |
|
|
|
|
|
|
|
|
|
|
|
|
|
Management and incentive fee revenues |
|
$ |
15,283,064 |
|
|
$ |
12,835,603 |
|
|
$ |
22,617,240 |
|
|
Investment income |
|
|
232,300 |
|
|
|
1,024,760 |
|
|
|
2,787,334 |
|
|
Total revenues |
|
|
15,515,364 |
|
|
|
13,860,363 |
|
|
|
25,404,574 |
|
|
Expenses |
|
|
|
|
|
|
|
|
|
|
|
|
|
Interest expense |
|
|
1,044,242 |
|
|
|
1,821,517 |
|
|
|
1,726,781 |
|
|
Compensation |
|
|
7,470,218 |
|
|
|
7,596,726 |
|
|
|
9,441,607 |
|
|
Insurance |
|
|
354,466 |
|
|
|
408,959 |
|
|
|
450,460 |
|
|
Professional fees |
|
|
575,067 |
|
|
|
980,605 |
|
|
|
903,119 |
|
|
Amortization of intangible assets |
|
|
327,541 |
|
|
|
1,310,164 |
|
|
|
2,308,123 |
|
|
Administrative and other |
|
|
2,538,229 |
|
|
|
2,457,029 |
|
|
|
2,391,184 |
|
|
Total expenses |
|
|
12,309,763 |
|
|
|
14,575,000 |
|
|
|
17,221,274 |
|
|
Income (loss) before unrealized losses on investments and income taxes |
|
|
3,205,601 |
|
|
|
(714,637 |
) |
|
|
8,183,300 |
|
|
Unrealized losses on investments |
|
|
(2,674,885 |
) |
|
— |
|
|
— |
|
||
|
Income (loss) before income taxes |
|
|
530,716 |
|
|
|
(714,637 |
) |
|
|
8,183,300 |
|
|
Income tax (benefit) expense |
|
|
(165,449 |
) |
|
|
(81,022 |
) |
|
|
5,642,225 |
|
|
Net income (loss) |
|
$ |
696,165 |
|
|
$ |
(633,615 |
) |
|
$ |
2,541,075 |
|
See accompanying notes to combined financial statements.
S-4
COMBINED STATEMENTS OF CHANGES IN MEMBER’S EQUITY
|
|
|
Member’s |
|
|
Accumulated Earnings |
|
|
Total Member’s |
|
|||
|
|
|
Contributions |
|
|
(Deficit) |
|
|
Equity |
|
|||
|
Total at January 1, 2015 |
|
$ |
52,519,916 |
|
|
$ |
(17,739,571 |
) |
|
$ |
34,780,345 |
|
|
Net income |
|
|
— |
|
|
|
2,541,075 |
|
|
|
2,541,075 |
|
|
Distributions |
|
|
— |
|
|
|
(9,050,000 |
) |
|
|
(9,050,000 |
) |
|
Total at December 31, 2015 |
|
|
52,519,916 |
|
|
|
(24,248,496 |
) |
|
|
28,271,420 |
|
|
Net loss |
|
|
— |
|
|
|
(633,615 |
) |
|
|
(633,615 |
) |
|
Distributions |
|
|
— |
|
|
|
(2,650,000 |
) |
|
|
(2,650,000 |
) |
|
Total at December 31, 2016 |
|
|
52,519,916 |
|
|
|
(27,532,111 |
) |
|
|
24,987,805 |
|
|
Net income |
|
|
— |
|
|
|
696,165 |
|
|
|
696,165 |
|
|
Distributions |
|
|
— |
|
|
|
(3,210,000 |
) |
|
|
(3,210,000 |
) |
|
Total at December 31, 2017 |
|
$ |
52,519,916 |
|
|
$ |
(30,045,946 |
) |
|
$ |
22,473,970 |
|
See accompanying notes to combined financial statements.
S-5
COMBINED STATEMENTS OF CASH FLOWS
|
|
|
Years Ended December 31, |
|
|||||||||
|
|
|
2017 |
|
|
2016 |
|
|
2015 |
|
|||
|
OPERATING ACTIVITIES: |
|
|
|
|
|
|
|
|
|
|
|
|
|
Net income (loss) |
|
$ |
696,165 |
|
|
$ |
(633,615 |
) |
|
$ |
2,541,075 |
|
|
Adjustments to reconcile net income (loss) to net cash provided by operating activities: |
|
|
|
|
|
|
|
|
|
|
|
|
|
Deferred taxes |
|
|
(684,241 |
) |
|
|
1,925,170 |
|
|
|
4,226,118 |
|
|
Amortization of intangible assets |
|
|
327,541 |
|
|
|
1,310,164 |
|
|
|
2,308,123 |
|
|
Accretion of interest income |
|
|
(2,687 |
) |
|
|
(1,016,614 |
) |
|
|
(1,089,679 |
) |
|
Unrealized depreciation |
|
|
2,674,885 |
|
|
|
— |
|
|
|
— |
|
|
Changes in operating assets and liabilities: |
|
|
|
|
|
|
|
|
|
|
|
|
|
(Increase) decrease in accrued management fees |
|
|
(169,657 |
) |
|
|
1,245,576 |
|
|
|
3,236,504 |
|
|
(Increase) decrease in due from affiliates |
|
|
(60,223 |
) |
|
|
556,737 |
|
|
|
(389,848 |
) |
|
Decrease (increase) in other assets |
|
|
782,805 |
|
|
|
45,251 |
|
|
|
(2,341,414 |
) |
|
Decrease (increase) in accounts payable and accrued expenses |
|
|
293,447 |
|
|
|
(866,355 |
) |
|
|
(5,505,086 |
) |
|
Increase (decrease) in accrued interest payable |
|
|
230,034 |
|
|
|
(178,250 |
) |
|
|
— |
|
|
Increase (decrease) in due to affiliates |
|
|
330,574 |
|
|
|
(1,504,112 |
) |
|
|
1,889,707 |
|
|
Net cash provided by operating activities |
|
|
4,418,643 |
|
|
|
883,952 |
|
|
|
4,875,500 |
|
|
Investing activities: |
|
|
|
|
|
|
|
|
|
|
|
|
|
Purchases of investment |
|
|
(102,573,408 |
) |
|
|
(7,000,000 |
) |
|
|
(22,000,000 |
) |
|
Proceeds from sales/redemptions/maturities of investments |
|
|
20,000,000 |
|
|
|
31,106,293 |
|
|
|
22,506,850 |
|
|
Net cash (used in) provided by investing activities |
|
|
(82,573,408 |
) |
|
|
24,106,293 |
|
|
|
506,850 |
|
|
Financing Activities: |
|
|
|
|
|
|
|
|
|
|
|
|
|
Member’s distributions |
|
|
(3,210,000 |
) |
|
|
(2,650,000 |
) |
|
|
(9,050,000 |
) |
|
Debt offering proceeds |
|
|
127,594,718 |
|
|
|
7,000,000 |
|
|
|
36,000,000 |
|
|
Repayments of Debt |
|
|
(45,000,000 |
) |
|
|
(30,000,000 |
) |
|
|
(36,000,000 |
) |
|
Net cash provided by (used in) financing activities |
|
|
79,384,718 |
|
|
|
(25,650,000 |
) |
|
|
(9,050,000 |
) |
|
CHANGE IN CASH |
|
|
1,229,953 |
|
|
|
(659,755 |
) |
|
|
(3,667,650 |
) |
|
CASH, BEGINNING OF YEAR |
|
|
3,425,709 |
|
|
|
4,085,464 |
|
|
|
7,753,114 |
|
|
CASH, END OF YEAR |
|
$ |
4,655,662 |
|
|
$ |
3,425,709 |
|
|
$ |
4,085,464 |
|
|
Supplemental Information: |
|
|
|
|
|
|
|
|
|
|
|
|
|
Cash paid for interest |
|
$ |
918,000 |
|
|
$ |
1,999,767 |
|
|
$ |
1,817,480 |
|
|
Cash paid for taxes |
|
$ |
17,526 |
|
|
$ |
170,000 |
|
|
$ |
5,477,493 |
|
See accompanying notes to combined financial statements.
S-6
1. ORGANIZATION
Katonah Debt Advisors, L.L.C. (“Katonah Debt Advisors”), a registered investment adviser under the Investment Advisors Act of 1940 (“the IA Act of 1940”), is a wholly-owned portfolio company of KCAP Financial, Inc. (“KCAP Financial” or the “Company”), which is an internally managed, non-diversified closed-end publicly traded investment company that is regulated as a business development company (“BDC”) under the Investment Company Act of 1940 (the “1940 Act”). Katonah Debt Advisors manages collateralized loan obligation funds (“CLO Funds”) which invest in broadly syndicated loans, high-yield bonds and other credit instruments. On February 29, 2012, KCAP Financial, through its newly formed wholly-owned subsidiary Commodore Holdings LLC (“Commodore”) purchased Trimaran Advisors, L.L.C. (“Trimaran Advisors”), a registered investment adviser and CLO manager similar to Katonah Debt Advisors, for total consideration of $13.0 million in cash and 3,600,000 shares of KCAP Financial’s common stock. Contemporaneous with the acquisition of Trimaran Advisors, KCAP Financial acquired from Trimaran Advisors equity interests in certain CLO Funds managed by Trimaran Advisors for an aggregate purchase price of $12.0 million in cash. As of December 31, 2017, Commodore and its wholly-owned subsidiaries Katonah Debt Advisors, Trimaran Advisors and Trimaran Advisors Management, L.L.C., as well as affiliated management companies Katonah 2007-1 Management, L.L.C., Katonah X Management, L.L.C. and KCAP Management, L.L.C. (collectively, the “Asset Manager Affiliates”) had approximately $3.0 billion of par value assets under management. The Asset Manager Affiliates provide investment management services to CLO Funds, making day-to-day investment decisions concerning the assets of the CLO Funds. In 2017, Trimaran formed and capitalized Trimaran Risk Retention Holdings, LLC, Trimaran RR I, LLC, and Trimaran RR II, LLC, in order to satisfy certain provisions of the Dodd-Frank Wall Street Reform and Consumer Protection Act (Dodd-Frank). The Asset Manager Affiliates have investment interests in certain of the CLO Funds they manage. In addition, KCAP Financial holds investments in a portion of the securities issued by the CLO Funds managed by the Asset Manager Affiliates.
2. SIGNIFICANT ACCOUNTING POLICIES
Basis of Accounting and Presentation
The combined financial statements have been prepared in accordance with Accounting Principles Generally Accepted in the United States (“U.S. GAAP”) and include the financial statements of the Asset Manager Affiliates. The Asset Manager Affiliates provide investment management services to various CLO Funds, making day-to-day investment decisions concerning the assets of the CLO Funds. The Asset Manager Affiliates are all under the common control of the Company and have similar business characteristics; therefore they report on a combined basis for financial reporting purposes.
In the opinion of management, the combined financial statements reflect all adjustments, consisting of normal recurring accruals, which are necessary for the fair presentation of the financial condition and results of operations for the periods presented. All significant intercompany transactions, balances, revenues and expenses are eliminated upon combination. Certain prior-year amounts have been reclassified to conform to the current year presentation. Furthermore, the preparation of the financial statements requires management to make significant estimates and assumptions including the fair value of investments that do not have a readily available market value. Actual results could differ from those estimates, and the differences could be material.
On February 18, 2015, the FASB issued Accounting Standards Update 2015-2 (“ASU 2015-2”), which updated consolidation standards under ASC Topic 810, “Consolidation”. Under this update, a new consolidation analysis is required for variable interest entities (“VIEs”), which limits the circumstances in which investment managers and similar entities are required to consolidate the entities that they manage. ASU 2015-02 eliminates some of the criteria under which the fees of investment managers and similar entities are considered a variable interest and limit the circumstances in which variable interests in a VIE held by related parties of a reporting enterprise require the reporting enterprise to consolidate the VIE. During 2016, the Asset Manager Affiliates adopted ASU 2015-02 on a retrospective basis for all periods presented. The consolidated financial statements and related note disclosures have been adjusted for the impact of the adoption. The adoption did not result in a cumulative effect adjustment to the Asset Manager Affiliates’ accumulated deficit.
FASB issued Accounting Standards Update 2014-09, Revenue from Contracts with Customers, which updated accounting guidance for all revenue recognition arising from contracts with customers, and also affects entities that enter into contracts to provide goods or services to their customers (unless the contracts are in the scope of other US GAAP requirements). This update provides a model for the measurement and recognition of gains and losses on the sale of certain nonfinancial assets, such as property and equipment, including real estate. The FASB also issued ASU 2015-14, Revenue from Contracts with Customers (Topic 606): Deferral of the Effective Date, which deferred the effective date of the standard for one year. As a result, the guidance is effective for public business entities for annual and interim periods in fiscal years beginning after December 15, 2018. Management has concluded that there will be no material impact from the adoption of ASU 2015-14. Management does not believe that the adoption of ASU 2014-09 will have a material impact to the Asset Manager Affiliates’ financial statements.
S-7
2. SIGNIFICANT ACCOUNTING POLICIES – (continued)
On February 25, 2016, the FASB issued Accounting Standards Update 2016-02, Leases (Topic 842). This update will require organizations to recognize leased assets and liabilities on the balance sheet for the rights and obligations created by those leases. The recognition, measurement, presentation and cash flows arising from a lease by a lessee will primarily depend on its classification as a finance or operating lease. The ASU will require that both types of leases to be recognized on the balance sheet. For public business entities, this guidance is effective for fiscal years beginning after December 15, 2018. Management is still evaluating the effect of the new standard.
Investments at Fair Value. Investment transactions are recorded on the applicable trade date. Realized gains or losses are determined using the specific identification method. Investments held by the Asset Manager Affiliates are stated at fair value. Accounting Standards Codification (“ASC”) 820 — Fair Value Measurements and Disclosures (“ASC 820: Fair Value”), requires, among other things, disclosures about assets and liabilities that are measured and reported at fair value. Investments are generally comprised of investments in first loss position in facilities which warehouse assets for a new CLO and certain investments in CLO Funds managed by the Asset Manager Affiliates. The Asset Manager Affiliates’ assessment of the significance of a particular input to the Fair Value measurement in its entirety requires judgment and considers factors specific to the financial instrument.
Hierarchy of Fair Value Inputs . The provisions of ASC 820: Fair Value establish a hierarchy that prioritizes inputs to valuation techniques used to measure fair value and require companies to disclose the fair value of their financial instruments according to the fair value hierarchy (i.e., Level I, II and III inputs, as defined). The fair value hierarchy gives the highest priority to quoted prices (unadjusted) in active markets for identical assets or liabilities and the lowest priority to unobservable inputs. Additionally, companies are required to provide additional disclosure regarding instruments in the Level III category (which have inputs to the valuation techniques that are unobservable and require significant management judgment), including a reconciliation of the beginning and ending balances separately for each major category of assets and liabilities.
Assets and liabilities measured and reported at fair value are classified and disclosed in one of the following categories:
Level I Inputs:
Quoted prices (unadjusted) in active markets for identical assets or liabilities at the reporting date.
Level II Inputs:
Quoted prices for similar assets or liabilities in active markets; quoted prices for identical or similar assets or liabilities that are not active; quotes from pricing services or brokers, for which the Asset Manager Affiliates can determine that orderly transactions took place at the quoted price or that the inputs used to arrive at the price were observable; and inputs other than quoted prices that are observable, such as models or other valuation methodologies.
|
|
• |
Level II assets in this category may include debt securities, bank loans, short-term floating rate notes and asset-backed securities, restricted public securities valued at a discount, as well as over-the-counter derivatives, including interest and inflation rate swaps and foreign currency exchange contracts that have inputs to the valuations that generally can be corroborated by observable market data. |
Level III Inputs:
Unobservable inputs may include non-binding broker quotes. Level III assets include investments for which there is little, if any, market activity. These inputs require significant management judgment or estimation.
|
|
• |
Level III assets in this category include, securities issued by CLO Funds. |
Significance of Inputs:
The Asset Manager Affiliates’ assessment of the significance of a particular input to the fair value measurement in its entirety requires judgment and considers factors specific to the financial instrument.
Cash. The Asset Manager Affiliates define cash as demand deposits. The Asset Manager Affiliates place their cash with financial institutions and, at times, cash held in these accounts may exceed the Federal Deposit Insurance Corporation insured limit.
Other Assets. Other assets are generally comprised of prepaid expenses and current income taxes receivable (if any). Prepaid expenses are amortized over their terms or expected useful life.
Interest Income. Interest income is recorded on the accrual basis on interest-bearing assets. Investment income on residual beneficial interests in warehouse facilities and CLO Funds is recognized using the effective interest method under ASC 325-40. GAAP-basis investment income on CLO equity investments is recorded using the effective interest method in accordance with the provisions of ASC 325-40, based on the anticipated yield and the estimated cash flows over the projected life of the investment. Yields are revised when there are changes in actual or estimated projected future cash flows due to changes in prepayments and/or re-investments, credit losses or asset pricing. Changes in estimated yield are recognized as an adjustment to the estimated yield prospectively over the remaining life of the investment from the date the estimated yield was changed. Accordingly, investment income recognized on CLO equity securities in the GAAP statement of operations differs from both the tax — basis investment income and from the cash distributions actually received by the Company during the period.
S-8
2. SIGNIFICANT ACCOUNTING POLICIES – (continued)
Management Fees. As a manager of CLO Funds, the Asset Manager Affiliates receive contractual and recurring management fees (and may receive one-time structuring fees) from the CLO Funds for their management and advisory services. The periodic fees which the Asset Manager Affiliates are generally based on a fixed percentage of assets under management (at par value and not subject to changes in market value). The periodic management fees the Asset Manager Affiliates receive have two components — a senior management fee and a subordinated management fee.
Incentive Fees. As a manager of CLO Funds, the Asset Manager Affiliates may receive incentive fees upon exceeding specified relative and/or absolute investment return thresholds. Such fees are recorded upon completion of the measurement period, which varies by CLO Fund.
Distributions to Member. Distributions to the Asset Manager Affiliates’ sole member are recognized on the ex-dividend date. Generally, distributions have been declared and paid on a quarterly basis.
Expenses. The Asset Manager Affiliates expense costs, as incurred, with regard to the running of their operations. Primary operating expenses include employee compensation and benefits, the costs of identifying, evaluating, monitoring and servicing the CLO Fund investments managed by the Asset Manager Affiliates, and related overhead charges and expenses, including rental expense. The Asset Manager Affiliates share office space and certain other operating expenses. Katonah Debt Advisors has entered into an Overhead Allocation Agreement with its sole member, KCAP Financial. Trimaran Advisors has entered into such an allocation agreement with Katonah Debt Advisors. The Agreements provide for the sharing of such expenses based on an equal sharing of office lease costs and the ratable usage of other shared resources. Katonah Debt Advisors accounts for its operating leases, which may include escalations, in accordance with ASC 840-10, Leases, and expenses the lease payments associated with operating leases evenly during the lease term (including rent-free periods), beginning on the commencement of the lease term.
Interest Expenses. Interest expense related to borrowings of the Asset Manager Affiliates is recorded on an accrual basis pursuant to the terms of the related borrowing agreements. Interest is accrued and generally paid quarterly.
Income Taxes. The Asset Manager Affiliates account for income taxes under the liability method prescribed by ASC 740, Income Taxes (“ASC 740”). Deferred income tax assets and liabilities are recognized for the future tax consequences attributable to temporary differences between the financial statement carrying amounts of existing assets and liabilities and their respective tax bases using currently enacted tax rates in effect for the year in which the differences are expected to reverse. The effect of a change in tax rates on deferred income tax assets and liabilities is recognized in income in the period that includes the enactment date.
Management periodically assesses the recoverability of its deferred income tax assets based upon expected future earnings, taxable income in prior carryback years, future deductibility of the asset, changes in applicable tax laws and other factors. If management determines that it is not more likely than not that the deferred tax asset will be fully recoverable in the future, a valuation allowance will be established for the difference between the asset balance and the amount expected to be recoverable in the future. This allowance will result in a charge to income tax expense on the combined statements of operations. The Asset Manager Affiliate record their income taxes receivables and payables based upon their estimated income tax liability.
ASC 740 clarifies the accounting for uncertainty in income taxes recognized in a company’s financial statements by prescribing a threshold for measurement and recognition in the financial statements of an asset or liability resulting from a tax position taken or expected to be taken in an income tax return. ASC 740 also provides guidance on derecognition, classification, interest and penalties, accounting in interim periods, disclosure and transition.
3. CLO FUNDS
A CLO Fund generally refers to a special purpose vehicle that owns a portfolio of investments and issues various tranches of debt and subordinated securities to finance the purchase of those investments. Investments purchased by the CLO Funds are governed by extensive investment guidelines, including limits on exposure to any single industry or issuer and limits on the ratings of the CLO Fund’s assets. The CLO Funds managed by the Asset Manager Affiliates have a defined investment period during which they are allowed to make investments or reinvest capital as it becomes available.
The Asset Manager Affiliates manage CLO Funds primarily for third party investors. The CLO Funds generally invest in syndicated loans and other credit instruments issued by corporations. At December 31, 2017 and 2016, the Asset Manager Affiliates had approximately $3.0 billion and $3.0 billion of par value of assets under management, respectively.
S-9
The CLO Funds are primarily financed via capital contributed by subordinated noteholders and debt holders. CLO Funds are investment vehicles created for the sole purpose of issuing collateralized loan instruments that offer investors the opportunity for returns that vary with the risk level of their investment. The securities issued by the CLO Funds are backed by diversified collateral asset portfolios consisting primarily of loans. For managing the collateral for the CLO Fund entities, the Asset Manager Affiliates earn investment management fees, including senior and subordinated management fees, as well as contingent incentive fees. For the years ending December 31, 2017, 2016 and 2015, management fee revenues included incentive fees earned of approximately $3.0 million, $983,000, and $8.0 million, respectively.
4. INVESTMENTS
The Asset Manager Affiliates may also make investments in the CLO Funds they manage in order to comply with the risk retention requirements of Dodd-Frank. As of December 31, 2017, the Asset Manager Affiliates have investments in in various classes of debt securities and residual interests of the following managed CLO Funds:
|
|
|
Fair Value |
|
|
|
|
|
(in millions) |
|
|
|
Catamaran 2013-1 |
|
$ |
26.7 |
|
|
Catamaran 2014-1 |
|
|
33.5 |
|
|
Catamaran 2015-1 |
|
|
19.7 |
|
|
|
|
$ |
79.9 |
|
In addition, their sole direct or indirect shareholder, KCAP Financial, has invested in certain of the CLO Funds, generally taking a portion of the unrated, junior subordinated position (generally subordinated to other interests) in the entities and entitle KCAP Financial and other subordinated tranche investors to receive the residual cash flows, if any, from the CLO Funds.
The following table shows the investments owned by the Asset Manager Affiliates by security type at December 31, 2017:
|
Security Type |
|
Cost/ Amortized Cost |
|
|
Fair Value |
|
||
|
Short-term investments |
|
$ |
— |
|
|
$ |
— |
|
|
Debt securities |
|
|
75,735,482 |
|
|
|
75,960,178 |
|
|
Residual interests in CLO Fund Securities |
|
|
6,840,613 |
|
|
|
3,941,031 |
|
|
Total |
|
$ |
82,576,095 |
|
|
$ |
79,901,209 |
|
Fair Value Measurements
The following table summarizes the fair value of investments by the above ASC 820: Fair Value hierarchy levels as of December 31, 2017 and 2016, respectively:
|
|
|
As of December 31, 2017 |
|
|||||||||||||
|
|
|
Level I |
|
|
Level II |
|
|
Level III |
|
|
Total |
|
||||
|
Debt securities |
|
$ |
— |
|
|
$ |
— |
|
|
$ |
75,960,178 |
|
|
$ |
75,960,178 |
|
|
Residual interests in CLO Fund Securities |
|
|
— |
|
|
|
— |
|
|
|
3,941,031 |
|
|
|
3,941,031 |
|
|
Total |
|
$ |
— |
|
|
$ |
— |
|
|
$ |
79,901,209 |
|
|
$ |
79,901,209 |
|
The Asset Manager Affiliates invest primarily in the debt and residual interests in CLO Fund Securities which are non-public companies for which there is little, if any, market-observable information. As a result, a significant portion of The Asset Manager Affiliates investments at any given time will likely be deemed Level III investments.
Investment values derived by a third party pricing service are generally deemed to be Level III values. For those that have observable trades, the Company considers them to be Level II.
S-10
The Asset Manager Affiliates policy for determining transfers between levels is based solely on the previously defined three-level hierarchy for fair value measurement. Transfers between the levels of the fair value hierarchy are separately noted in the tables below and the reason for such transfer described in each table’s respective footnotes. Certain information relating to investments measured at fair value for which the Asset Manager Affiliates has used unobservable inputs to determine fair value is as follows:
|
|
|
Year Ended December 31, 2017 |
|
|||||||||
|
|
|
Debt Securities |
|
|
Beneficial residual interests in CLO Fund Securities |
|
|
Total |
|
|||
|
Purchases |
|
$ |
75,735,481 |
|
|
$ |
26,837,926 |
|
|
$ |
102,573,407 |
|
|
Proceeds from sales/redemptions/maturities |
|
|
— |
|
|
|
(20,000,000 |
) |
|
|
(20,000,000 |
) |
|
Net accretion (amortization) |
|
|
— |
|
|
|
2,687 |
|
|
|
2,687 |
|
|
Total unrealized gain (loss) included in earnings |
|
|
224,697 |
|
|
|
(2,899,582 |
) |
|
|
(2,674,885 |
) |
|
Balance, December 31, 2017 |
|
$ |
75,960,178 |
|
|
$ |
3,941,031 |
|
|
$ |
79,901,209 |
|
|
Changes in unrealized gains (losses) included in earnings related to investments still held at reporting date |
|
$ |
224,697 |
|
|
$ |
(2,899,582 |
) |
|
$ |
(2,674,885 |
) |
As of December 31, 2017 the Company’s Level III portfolio investments had the following valuation techniques and significant inputs:
|
Type |
|
Fair Value |
|
|
Primary Valuation Methodology |
|
Unobservable Inputs |
|
Significant Inputs or Range of Inputs and (Weighted Average) |
|
|
Debt Securities |
|
$ |
75,960,178 |
|
|
Market Approach |
|
3 rd party quote |
|
93.1% – 100.5% (100.0%) |
|
Residual interests in CLO Fund Securities |
|
|
3,941,031 |
|
|
Market Approach |
|
3 rd party quote |
|
59.9% – 75.3% |
|
Total Level III Investments |
|
$ |
79,901,209 |
|
|
|
|
|
|
|
5. BORROWINGS
The Asset Management Affiliates’ debt obligations outstanding as of December 31, 2017 consist of the following:
|
Description |
|
Principal |
|
|
|
KCAP Term Loan 1 |
|
$ |
8,359,051 |
|
|
KCAP Term Loan 2 |
|
|
4,433,167 |
|
|
Third Party Borrowing I |
|
|
50,117,500 |
|
|
Third Party Borrowing II |
|
|
19,685,000 |
|
|
Total |
|
$ |
82,594,718 |
|
During 2017, Trimaran borrowed funds from KCAP under two term loan agreements. The KCAP Term Loan I bears interest at a fixed rate of 10.5% and matures on April 30, 2030. The KCAP Term Loan II also bears interest at a fixed rate of 10.5%., and matures on January 27, 2028. All amounts under these loans shall become due and payable in the event of default, as defined in the borrowing agreements, and Trimaran has the right to prepay these loans, in whole or in part, at any time or from time-to-time without penalty or premium.
In addition, during 2017, Trimaran Risk Retention I, LLC and Trimaran Risk Retention II, LLC borrowed funds from third parties under two facility agreements. Interest accrues on amounts outstanding under these third party borrowings at variable (floating) rates, generally based upon 3 month LIBOR plus a margin. The margins for the Third Party borrowings range from between 1.70% to 3.90%, with a weighted average all-in rate as of December 31, 2017 of 3.72%.
The Third Party borrowings are subject to various non-call provisions, and become immediately due and payable in the event of default, as defined in the underlying agreements.
The repayment of the third party borrowings of Trimaran Risk Retention I, LLC and Trimaran Risk Retention II, LLC, have been guaranteed by Trimaran Advisors.
S-11
6. GOODWILL AND INTANGIBLE ASSETS
On February 29, 2012, KCAP Financial and Commodore Holdings, L.L.C. (“Commodore”), a newly-formed, wholly-owned subsidiary of KCAP Financial, acquired all of the outstanding equity interests in Trimaran Advisors for $13.0 million in cash and 3,600,000 shares of KCAP Financial’s common stock, which were valued at the opening price on the closing date of the acquisition. Contemporaneously with the acquisition, KCAP Financial acquired the equity interests in four CLO Funds managed by Trimaran Advisors, at fair value, for $12.0 million in cash. The aggregate purchase price was $50.6 million.
In accordance with the purchase agreement, Commodore was deemed the acquirer of Trimaran Advisors and accounted for the acquisition as a business combination. The assets acquired (no liabilities were assumed) by Commodore through this acquisition were “pushed-down” to Trimaran. The purchase price allocation included the fair value of the identifiable intangible assets acquired, which consisted of four CLO management contracts, of approximately $15.7 million and goodwill of $22.8 million. The CLO management contracts were amortized over the estimated lives of the contracts (3 – 5 years). For the years ended December 31, 2017, 2016 and 2015, the Company recognized amortization expense of approximately $328,000, $1.3 million and $2.3 million, respectively, relating to the management contracts. The unamortized balance as of December 31, 2016 approximately $328,000 relating to Trimaran VII CLO Ltd., was amortized in 2017 in connection with its full liquidation.
Commodore, a taxable entity, has recognized the acquisition as an asset acquisition for tax purposes. The book and tax basis of the intangible assets and goodwill were identical; accordingly, Trimaran did not provide for any deferred taxes at the closing date of the acquisition. The tax basis of the intangible assets and goodwill are being amortized over 15 years, which gives rise to deferred taxes.
7. INCOME TAXES
The Asset Manager Affiliates are taxed at normal corporate rates.
For tax purposes, the Asset Manager Affiliates taxable net income will differ from GAAP net income because of deferred tax timing adjustments and permanent tax adjustments. Deferred tax timing adjustments may include differences for the recognition and timing of depreciation, bonuses to employees and restricted stock expense. Permanent differences may include adjustments, limitations or disallowances for meals and entertainment expenses, penalties, and tax goodwill amortization.
Goodwill amortization for tax purposes was created upon the purchase of 100% of the equity interests in Katonah Debt Advisors by its sole member, KCAP Financial, in exchange for shares of the KCAP Financial’s stock valued at $33 million. Although this transaction was a stock transaction rather than an asset purchase and thus no goodwill was recognized for GAAP purposes, such exchange was considered an asset purchase under Section 351(a) of the Internal Revenue Code (the “Code”). At the time of the transfer, Katonah Debt Advisors had equity of approximately $1 million resulting in tax goodwill of approximately $32 million which is being amortized for tax purposes on a straight-line basis over 15 years, which accounts for an annual difference between GAAP income and taxable income by approximately $2 million per year over such period. As of December 31, 2017 and 2016, there was approximately $8.8 million and $10.8 million of remaining unamortized tax-basis goodwill from the KDA acquisition.
As discussed in Note 6, additional goodwill amortization for tax purposes was created upon the purchase of Trimaran Advisors. The transaction was considered an asset purchase and resulted in tax goodwill of approximately $22.8 million which is being amortized for tax purposes on a straight-line basis over 15 years, which accounts for an annual difference between GAAP income and taxable income by approximately $1.5 million per year over such period. As of December 31, 2017 and 2016, there was approximately $6.0 million and $7.5 million of remaining unamortized tax-basis goodwill from the Trimaran Advisors acquisition.
During the second quarter of 2016, KCAP contributed 100% of its ownership interests in Katonah Debt Advisors and Trimaran Advisors Management to Commodore Holdings. These transactions simplify the tax structure of the Asset Manager Affiliates and facilitate the consolidation of tax basis goodwill deductions for the Asset Manager Affiliates, which may impact the tax character of distributions from the Asset Manager Affiliates.
KCAP Management, LLC is a disregarded entity for U.S. federal income tax purposes. Its taxable results are included in the tax returns of KCAP Financial. Trimaran Risk Retention Holdings, LLC, Trimaran RR I, LLC and Trimaran RR II, LLC are disregarded entities for U.S. federal income tax purposes. Their taxable results are included in the tax returns of Commodore Holdings.
S-12
The components of income tax expense (benefit) for the years ended December 31, 2017, 2016, and 2015 are as follows:
|
|
|
For the year ended December 31, |
|
|||||||||
|
|
|
2017 |
|
|
2016 |
|
|
2015 |
|
|||
|
Current income tax (benefit) expense: |
|
|
|
|
|
|
|
|
|
|
|
|
|
Federal |
|
$ |
518,921 |
|
|
$ |
(1,957,900 |
) |
|
$ |
1,290,664 |
|
|
State & local |
|
|
(129 |
) |
|
|
(48,292 |
) |
|
|
125,443 |
|
|
Total net current income tax (benefit) expense |
|
|
518,792 |
|
|
|
(2,006,192 |
) |
|
|
1,416,107 |
|
|
Deferred income tax expense (benefit): |
|
|
|
|
|
|
|
|
|
|
|
|
|
Federal |
|
|
(661,770 |
) |
|
|
2,011,068 |
|
|
|
3,250,138 |
|
|
State & local |
|
|
(22,471 |
) |
|
|
(85,898 |
) |
|
|
975,980 |
|
|
Total net deferred income tax expense (benefit) |
|
|
(684,241 |
) |
|
|
1,925,170 |
|
|
|
4,226,118 |
|
|
Total income tax (benefit) expense |
|
$ |
(165,449 |
) |
|
$ |
(81,022 |
) |
|
$ |
5,642,225 |
|
The Asset Manager Affiliates’ effective income tax rate was (31.2)%, (11.3)%, and 68.9% for tax years 2017, 2016 and 2015, respectively. For the year ended December 31, 2017 difference between the Company’s reported provision for income taxes and the U.S. federal statutory rate of 35% was significantly impacted by the Tax Cuts and Jobs Act (the “Tax Act”) signed into law on December 22, 2017. The Tax Act makes significant modifications to the federal tax code including, among other changes, a decrease in the current federal corporate income tax rate from a maximum of 35% to a flat 21%, effective January 1, 2018. As a result of this rate change, the Company's 2017 results include a $931 thousand increase to the income tax provision resulting from the revaluation of its net deferred tax asset, before valuation allowance. This represents a provisional estimate based on management's initial analysis and interpretation of the legislation. Given the complexity of the legislation, anticipated guidance from the Treasury Department and the potential for additional guidance from the FASB, this estimate may be adjusted during 2018.
Deferred income taxes are provided for the effects of temporary differences between the tax basis of an asset or liability and its reported amount in the combined financial statements. These temporary differences result in taxable or deductible amounts in future years.
The components of deferred income tax assets and liabilities are shown below:
|
|
|
For the year ended December 31, |
|
|||||
|
|
|
2017 |
|
|
2016 |
|
||
|
Deferred income tax assets: |
|
|
|
|
|
|
|
|
|
Net operating loss and tax credit carryforward |
|
$ |
213,152 |
|
|
$ |
44,125 |
|
|
Restricted stock |
|
|
80,705 |
|
|
|
322,008 |
|
|
Intangible depreciation/amortization |
|
|
2,005,236 |
|
|
|
3,522,391 |
|
|
Compensation |
|
|
464,736 |
|
|
|
715,400 |
|
|
Unrealized loss |
|
|
564,219 |
|
|
|
— |
|
|
Other |
|
|
75,450 |
|
|
|
73,228 |
|
|
Less: Valuation allowance |
|
|
(3,403,497 |
) |
|
|
(4,677,152 |
) |
|
Total deferred tax assets |
|
|
— |
|
|
|
— |
|
|
Deferred income tax liabilities: |
|
|
|
|
|
|
|
|
|
Goodwill amortization |
|
|
(1,899,477 |
) |
|
|
(2,575,140 |
) |
|
Other |
|
|
8,578 |
|
|
|
— |
|
|
Total deferred tax liabilities |
|
|
(1,890,899 |
) |
|
|
(2,575,140 |
) |
|
Net deferred tax liabilities |
|
$ |
(1,890,899 |
) |
|
$ |
(2,575,140 |
) |
The ultimate realization of deferred income tax assets is dependent upon the generation of future taxable income during the periods in which the temporary differences become deductible. If it is not more likely than not that some portion or all of the gross deferred income tax assets will be realized in future years, a valuation allowance is recorded.
S-13
At December 31, 2017, the Asset Manager Affiliates had net operating loss carryforwards available of $981,022 available to offset future Federal taxable income. In addition, the Asset Manager Affiliates had net operating loss carryforwards of $42,578 and $65,446 available to offset future state and local taxable income, respectively. The following table sets forth a schedule of the years in which the net operating loss carry-forwards would expire if not previously utilized:
|
|
|
Federal |
|
|
State |
|
|
Local |
|
|||
|
Year Ending December 31: |
|
|
|
|
|
|
|
|
|
|
|
|
|
2036 |
|
$ |
— |
|
|
$ |
36,699 |
|
|
$ |
— |
|
|
2037 |
|
|
981,022 |
|
|
|
5,879 |
|
|
|
65,446 |
|
|
|
|
$ |
981,022 |
|
|
$ |
42,578 |
|
|
$ |
65,446 |
|
ASC 740 provides guidance for how uncertain tax positions should be recognized, measured, presented, and disclosed in the financial statements. ASC 740 requires the evaluation of tax positions taken or expected to be taken in the course of preparing the tax returns to determine whether the tax positions are “more-likely-than-not” of being sustained by the applicable tax authority. Tax positions not deemed to meet the more-likely-than-not threshold are recorded as a tax benefit or expense in the current year. The Asset Manager Affiliates has not recorded a liability for any unrecognized tax benefits nor are they aware of any tax positions for which it is reasonably possible that the total amounts of unrecognized tax benefits will change materially in the next 12 months.
Management’s determinations regarding ASC 740 may be subject to review and adjustment at a later date based upon factors including, but not limited to, an ongoing analysis of tax laws, regulations and interpretations thereof. With a few exceptions, the Asset Manager Affiliates are no longer subject to U.S. federal, state and local tax examinations by tax authorities for years prior to 2014.
8. COMMITMENTS AND CONTINGENCIES
The Asset Manager Affiliates have commitments under lease obligations and have entered into Overhead Allocation agreement with KCAP Financial and Trimaran Advisors.
The repayment of the third party borrowings of Trimaran Risk Retention I, LLC and Trimaran Risk Retention II, LLC, have been guaranteed by Trimaran Advisors.
Rent expense, net of expense allocated to affiliates, was approximately $379,000, $361,000, and $360,000 for the years ended December 31, 2017, 2016 and 2015, respectively.
The following table summarizes minimum future lease payments as of December 31, 2017:
|
Contractual Obligations |
|
2018 |
|
|
2019 |
|
|
2020 |
|
|
2021 |
|
|
2022 |
|
|
More than 5 years |
|
||||||
|
Operating lease obligations |
|
$ |
738,864 |
|
|
$ |
7,747,811 |
|
|
$ |
800,436 |
|
|
$ |
800,436 |
|
|
$ |
800,436 |
|
|
$ |
1,133,951 |
|
9. MEMBER’S EQUITY
As of December 31, 2017, the membership interests of the Asset Manager Affiliates are held solely by KCAP Financial. KCAP Financial owns 100% of Commodore Holdings, which wholly owns Katonah Debt Advisors, Trimaran Advisors and its subsidiaries, and Trimaran Advisors Management. KCAP Management, LLC, Katonah 2007-1 Management, LLC, and Katonah X Management, LLC are wholly-owned by Katonah Management Holdings, LLC, which is wholly-owned by KCAP Financial.
10. OTHER EMPLOYEE COMPENSATION
The Asset Manager Affiliates adopted a 401(k) plan (“401K Plan”) effective January 1, 2007 that it shares with its sole shareholder, KCAP Financial. The 401K Plan is open to all full time employees. The 401K Plan permits an employee to defer a portion of his or her total annual compensation up to the Internal Revenue Service annual maximum based on age and eligibility. The Asset Manager Affiliates make contributions to the 401K Plan of up to 2.67% of the employee’s first 74.9% of maximum eligible compensation, which vests 20% per year over five years. For the year ended December 31, 2017, 2016 and 2015, Asset Manager Affiliates made contributions to the 401K Plan of approximately $67,000, $36,000 and $38,000 respectively.
The Asset Manager Affiliates also adopted a deferred compensation plan (“Profit-Sharing Plan”) effective January 1, 2007. Employees are eligible for the Profit-Sharing Plan provided that they are employed and working with the Asset Manager Affiliates for at least 100 days during the year and remain employed as of the last day of the year. Employees do not make contributions to the Profit-Sharing Plan. The Asset Manager Affiliates may contribute to the Profit-Sharing Plan 1) up to 8.0% of all compensation up to the Internal Revenue Service annual maximum and 2) up to 5.7% excess contributions on any incremental amounts above the social security wage base limitation and up to the Internal Revenue Service annual maximum. Employees vest 100% in the Profit-Sharing Plan after five years of service. For the years ended December 31, 2017, 2016 and 2015, the Asset Manager Affiliates made contributions of approximately $342,000, $371,000 and $394,000 to the Profit-Sharing Plan, respectively.
Certain employees of Asset Manager Affiliates may receive restricted stock grants in the stock of Asset Manager Affiliates’ sole member, KCAP Financial. For the years ended December 31, 2017, 2016 and 2015, compensation expense of approximately $703,000, $909,000 and $897,000, respectively, was recorded as expense in the Combined Statement of Operations related to an allocated expense for a grant of restricted stock of KCAP Financial.
S-14
11. RELATED PARTY TRANSACTIONS
All of the management and incentive fee revenues earned by the Asset Manager Affiliates is derived from the CLO funds which are considered affiliates.
On February 26, 2013, the KCAP Financial entered into a senior credit agreement (the “Trimaran Credit Facility”) with Trimaran Advisors, pursuant to which Trimaran Advisors may borrow from time to time up to $20 million from KCAP Financial in order to provide capital necessary to support one or more of Trimaran Advisors’ warehouse lines of credit and/or working capital in connection with Trimaran Advisors’ warehouse activities. The Trimaran Credit Facility was extended in November 2017 and now matures in November 2022 and bears interest at an annual rate of 9.0%. On April 15, 2013, the Trimaran Credit Facility was amended and increased from $20 million to $23 million. At December 31, 2017 and 2016, there was no loan outstanding under the Trimaran Credit Facility. Interest expense on this facility was $918,100, $1.8 million and $1.7 million for the years ending December 31, 2017, 2016 and 2015, respectively.
October 30, 2017, the Trimaran Advisors and KCAP Financial executed a Promissory Note under which Trimaran Advisors borrowed $8.4 million from KCAP Financial Borrowings under this agreement bear interest at a rate of 10.5% per annum, payable quarterly. The maturity date for this borrowing is April 30, 2030, unless there is an occurrence of an event in default, as defined in the Promissory Note, in which case KCAP Financial has the option to declare all of the amounts outstanding to be immediately due and payable.
December 19, 2017, the Trimaran Advisors and KCAP Financial executed a Promissory Note under which Trimaran Advisors borrowed $4.5 million from KCAP Financial Borrowings under this agreement bear interest at a rate of 10.5% per annum, payable quarterly. The maturity date for this borrowing is January 27, 2028, unless there is an occurrence of an event in default, as defined in the Promissory Note, in which case KCAP Financial has the option to declare all of the amounts outstanding to be immediately due and payable.
All of these borrowings were contributed as equity capital to Trimaran Advisor’s wholly-owned subsidiary Trimaran Risk Retention Holdings, LLC, which contributed the proceeds to its wholly-owned subsidiaries Trimaran RR I, LLC and Trimaran RR II, LLC.
12. SUBSEQUENT EVENTS
In January 2018, the trustee of Catamaran 2012-1 CLO received notice that the holders of a majority of the Subordinated Securities had exercised their right of optional redemption. It is expected the optional redemption will be effective on the March 2018 payment.
On February 9, 2018, the United States Court of Appeals for the District of Columbia (the “DC Circuit Court”) ruled in favor of an appeal brought by the Loan Syndications and Trading Association (the “LSTA”) on whether application of the risk retention rules to CLO managers is valid under Section 941 of the Dodd-Frank Act. If the decision stands, CLO managers of “open-market CLOs” (described in the ruling as CLOs where assets are acquired from “arms-length negotiations and trading on an open market”) will no longer be required to comply with the risk retention rules, and no party to such “open-market CLOs” would be required to acquire and retain an economic interest in the credit risk of the securitized assets. However, the DC Circuit Court’s decision remains subject to further appeal for a period of time.
The Company has evaluated events and transactions occurring subsequent to the balance sheet date of December 31, 2017 for items that should potentially be recognized or disclosed in these financial statements. Other than described above, management has determined that there are no material subsequent events that would require adjustment to, or disclosure in, these combined financial statements.
S-15
The following exhibits are filed as part of this report or hereby incorporated by reference to exhibits previously filed with the SEC:
|
Exhibit Number |
|
Description |
|
|
|
|
|
2.1 |
|
|
|
3.1 |
|
|
|
3.1.1 |
|
|
|
3.2 |
|
Second Amended and Restated Bylaws of KCAP Financial, Inc., dated as of December 12, 2018.(2) |
|
3.2.1 |
|
|
|
4.1 |
|
Specimen certificate of the Company’s common stock, par value $0.01 per share.(1) |
|
4.2 |
|
|
|
4.3 |
|
Form of Base Indenture between the Company and U.S. Bank National Association(4) |
|
4.4 |
|
|
|
4.5 |
|
Form of 6.125% Notes Due 2022 (included as part of Exhibit 4.6).(8) |
|
4.6 |
|
Description of Portman Ridge Finance Corporation’s Registered Securities.** |
|
10.1 |
|
|
|
10.2 |
|
|
|
10.3 |
|
|
|
10.4 |
|
|
|
10.5 |
|
|
|
10.6 |
|
|
|
10.7 |
|
|
|
10.8 |
|
|
|
10.9 |
|
|
|
10.10 |
|
|
|
11.1 |
|
|
|
21.1 |
|
|
|
23.1 |
|
E-1
|
|
||
|
23.3 |
|
Consent of Ernst & Young LLP, Independent Auditors relating to the Asset Manager Affiliates.** |
|
31.1 |
|
|
|
31.2 |
|
|
|
32.1 |
|
|
|
32.2 |
|
|
(1) |
Incorporated by reference to the exhibit included in Pre-Effective Amendment No. 1 on Form N-2, as filed on October 6, 2006 (File No. 333-136714). |
|
(2) |
Incorporated by reference to Exhibit 3.1 of the Current Report on Form 8-K, as filed on December 14, 2018 (File No. 814-00735). |
|
(3) |
Incorporated by reference to the exhibit included in Pre-Effective Amendment No. 2 to the Registration Statement on Form N-2, as filed on November 20, 2006 (File No. 333-136714). |
|
(4) |
Incorporated by reference to exhibit included in the Registration Statement in Form N-2, as filed on October 3, 2012 (File No. 333-183032). |
|
(5) |
Incorporated by reference to Exhibit 10.1 of the Quarterly Report on Form 10-Q, as filed on August 5, 2015 (File No. 814-00735). |
|
(6) |
Incorporated by reference to Exhibit 10.1 of the Quarterly Report on Form 10-Q, as filed on May 6, 2015 (File No. 814-00735). |
|
(7) |
Incorporated by reference to the exhibit included in Pre-Effective Amendment No. 3 to the Registration Statement on Form N-2, as filed on November 24, 2006 (File No. 333-136714). |
|
(8) |
Incorporated by reference to exhibit included in Post-Effective Amendment No. 1 to the Registration Statement in Form N-2, as filed on August 14, 2017 (File No. 333-218596). |
|
(9) |
Incorporated by reference to Exhibit 4.1 included in the Registration Statement on Form S-8, as filed on June 8, 2017 (File No. 333-218594). |
|
(10) |
Incorporated by reference to Exhibit 4.4 included in the Registration Statement on Form S-8, as filed on June 8, 2017 (File No. 333-218594)
|
|
(11) |
Incorporated by reference to Exhibit 10.1 of the Current Report on Form 8-K, as filed on July 20, 2017 (File No. 814-00735).
|
|
(12) |
Incorporated by reference to Exhibit 10.1 of the Current Report on Form 8-K, as filed on January 4, 2019 (File No. 814-00735).
|
|
(13) |
Incorporated by reference to Exhibit 10.1 of the Current Report on Form 8-K, as filed on December 20, 2018 (File No. 814-00735). |
|
|
|
|
* |
Indicates a management contract or compensatory plan, contract or agreement. |
|
** |
Filed herewith. |
E-2
Pursuant to the requirements of Section 13 or 15(d) of the Securities Exchange Act of 1934, the registrant has duly caused this report to be signed on its behalf by the undersigned, thereunto duly authorized.
|
|
|
|
|
PORTMAN RIDGE FINANCE CORPORATION |
||
|
Date: |
|
March 6, 2020 |
|
By |
|
/s/ EDWARD GOLDTHORPE |
|
|
|
|
|
|
|
EDWARD GOLDTHORPE |
|
|
|
|
|
|
|
President and Chief Executive Officer |
*****
Pursuant to the requirements of the Securities Exchange Act of 1934, this report has been signed below by the following persons on behalf of the registrant and in the capacities and on the dates indicated.
|
Signature |
|
Title |
|
Date |
|
|
|
|
|
|
|
/s/ EDWARD GOLDTHORPE |
|
President and Chief Executive Officer (principal executive officer) and Member of the Board of Directors |
|
March 6, 2020 |
|
EDWARD GOLDTHORPE |
|
|||
|
|
|
|
|
|
|
/s/ EDWARD U. GILPIN |
|
Chief Financial Officer, Secretary and Treasurer (principal financial and accounting officer) |
|
March 6, 2020 |
|
EDWARD U. GILPIN |
|
|||
|
|
|
|
|
|
|
/s/ GRAEME DELL |
|
Member of the Board of Directors |
|
March 6, 2020 |
|
GRAEME DELL |
|
|
|
|
|
|
|
|
|
|
|
/s/ DAVID MOFFITT |
|
Member of the Board of Directors |
|
March 6, 2020 |
|
DAVID MOFFITT |
|
|
|
|
|
|
|
|
|
|
|
/s/ GEORGE GRUNEBAUM |
|
Member of the Board of Directors |
|
March 6, 2020 |
|
GEORGE GRUNEBAUM |
|
|
|
|
|
|
|
|
|
|
|
/s/ ROBERT WARSHAUER |
|
Member of the Board of Directors |
|
March 6, 2020 |
|
ROBERT WARSHAUER |
|
|
|
|
|
|
|
|
|
|
|
/s/ ALEXANDER DUKA |
|
Member of the Board of Directors |
|
March 6, 2020 |
|
ALEXANDER DUKA |
|
|
|
|
|
|
|
|
|
|
|
/s/ CHRISTOPHER LACOVARA |
|
Member of the Board of Directors |
|
March 6, 2020 |
|
CHRISTOPHER LACOVARA |
|
|
|
|
|
|
|
|
|
|
|
/s/ DEAN C. KEHLER |
|
Member of the Board of Directors |
|
March 6, 2020 |
|
DEAN C. KEHLER |
|
|
|
|
71