Attached files
| file | filename |
|---|---|
| EX-32.2 - EXHIBIT 32.2 - IMMERSION CORP | immr-12312019ex322.htm |
| EX-32.1 - EXHIBIT 32.1 - IMMERSION CORP | immr-12312019ex321.htm |
| EX-31.2 - EXHIBIT 31.2 - IMMERSION CORP | immr-12312019ex312.htm |
| EX-31.1 - EXHIBIT 31.1 - IMMERSION CORP | immr-12312019ex311.htm |
| EX-23.1 - EXHIBIT 23.1 - IMMERSION CORP | immr-12312019ex231.htm |
| EX-21.1 - EXHIBIT 21.1 - IMMERSION CORP | immr-12312019ex211.htm |
| EX-10.22 - EXHIBIT 10.22 - IMMERSION CORP | immr-12312019ex1022.htm |
| EX-10.21 - EXHIBIT 10.21 - IMMERSION CORP | immr12312019ex1021.htm |
| EX-10.8 - EXHIBIT 10.8 - IMMERSION CORP | immr-12312019ex108.htm |
| EX-4.1 - EXHIBIT 4.1 - IMMERSION CORP | immr-12312019ex41.htm |
UNITED STATES
SECURITIES AND EXCHANGE COMMISSION
Washington, D.C. 20549
FORM 10-K
[x] | ANNUAL REPORT PURSUANT TO SECTION 13 OR 15(D) OF THE SECURITIES EXCHANGE ACT OF 1934 |
For the fiscal year ended December 31, 2019 or
[ ] | TRANSITION REPORT PURSUANT TO SECTION 13 OR 15(D) OF THE SECURITIES EXCHANGE ACT OF 1934 |
For the transition period from to
Commission File Number 000-38334
Immersion Corporation
(Exact name of registrant as specified in its charter)
Delaware | 94-3180138 | |
(State or other jurisdiction of incorporation or organization) | (IRS Employer Identification No.) | |
50 Rio Robles
San Jose, California 95134
(Address of principal executive offices, zip code)
(408) 467-1900
(Registrant’s telephone number, including area code)
Securities registered pursuant to Section 12(b) of the Act: None
Title of each class | Trading Symbol | Name of each exchange on which registered |
Common Stock, $0.001 par value | IMMR | NASDAQ Global Market |
Indicate by check mark if the registrant is a well-known seasoned issuer, as defined in Rule 405 of the Securities Act. Yes [ ] No [x]
Indicate by check mark if the registrant is not required to file reports pursuant to Section 13 or Section 15(d) of the Act. Yes [ ] No [x]
Indicate by check mark whether the registrant (1) has filed all reports required to be filed by Section 13 or 15(d) of the Securities Exchange Act of 1934 during the preceding 12 months (or for such shorter period that the registrant was required to file such reports), and (2) has been subject to such filing requirements for the past 90 days. Yes [x] No [ ]
Indicate by check mark whether the registrant has submitted electronically every Interactive Data File required to be submitted pursuant to Rule 405 of Regulation S-T (§
Indicate by check mark whether the registrant is a large accelerated filer, an accelerated filer, a non-accelerated filer, or a smaller reporting company. See the definitions of “large accelerated filer”, “accelerated filer” and “smaller reporting company” in Rule 12b-2 of the Exchange Act.
Large accelerated filer [ ] | Accelerated filer [x] | |||
Non-accelerated filer [ ] | Smaller reporting company [ ] | |||
Emerging Growth Company [ ] | ||||
If an emerging growth company, indicate by check mark if the registrant has elected not to use the extended transition period for complying with any new or revised financial accounting standards provided pursuant to Section 13(a) of the Exchange Act. ¨
Indicate by check mark whether the registrant is a shell company (as defined in Rule 12b-2 of the Act). Yes [ ] No [x]
The aggregate market value of the registrant’s common stock held by non-affiliates of the registrant on June 28, 2019, the last business day of the registrant’s most recently completed second fiscal quarter, was $159,319,574 (based on the closing sales price of the registrant’s common stock on that date). Shares of the registrant’s common stock held by each officer and director and each person whom owns 5% or more of the outstanding common stock of the registrant have been excluded in that such persons may be deemed to be affiliates. This determination of affiliate status is not necessarily a conclusive determination for other purposes. Number of shares of common stock outstanding at February 28, 2020 is 31,144,237.
DOCUMENTS INCORPORATED BY REFERENCE
Portions of the definitive Proxy Statement for the 2020 Annual Meeting are incorporated by reference into Part III hereof.
IMMERSION CORPORATION
2019 FORM 10-K ANNUAL REPORT
TABLE OF CONTENTS
Page | ||
Item 1. | ||
Item 1A. | ||
Item 1B. | ||
Item 2. | ||
Item 3. | ||
Item 4. | ||
Item 5. | ||
Item 6. | ||
Item 7. | ||
Item 7A. | ||
Item 8. | ||
Item 9. | ||
Item 9A. | ||
Item 9B. | ||
Item 10. | ||
Item 11. | ||
Item 12. | ||
Item 13. | ||
Item 14. | ||
Item 15. | ||
2
Forward-looking Statements
In addition to historical information this Annual Report on Form 10-K includes forward-looking statements within the meaning of Section 27A of the Securities Act of 1933, as amended (“the Securities Act”), and Section 21E of the Securities Exchange Act of 1934, as amended (the “Exchange Act”). The forward-looking statements involve risks and uncertainties. Forward-looking statements are frequently identified by words such as “anticipates,” “believes,” “expects,” “intends,” “may,” “will,” and other similar expressions. However, these words are not the only way we identify forward-looking statements. In addition, any statements which refer to expectations, projections, or other characterizations of future events, or circumstances, are forward-looking statements. Actual results could differ materially from those projected in the forward-looking statements as a result of a number of factors, including those set forth below in “Management’s Discussion and Analysis of Financial Condition and Results of Operations,” “Risk Factors” and those described elsewhere in this report, and those described in our other reports filed with the Securities and Exchange Commission (“SEC”). We caution you not to place undue reliance on these forward-looking statements, which speak only as of the date of this report, and we undertake no obligation to update these forward-looking statements after the filing of this report. You are urged to review carefully and consider our various disclosures in this report and in our other reports publicly disclosed or filed with the SEC that attempt to advise you of the risks and factors that may affect our business.
3
PART I
Item 1. Business
Overview
Immersion Corporation (“Immersion”) is a premier licensing company focused on the creation, design, development, and licensing of innovative haptic technologies that allow people to use their sense of touch to engage with products and experience the digital world around them. We are one of the leading experts in haptics, and our focus on innovation allows us to deliver world-class intellectual property (“IP”) and technology that enables the creation of products that delight end users. Our technologies are designed to facilitate the creation of high-quality haptic experiences, enable their widespread distribution, and ensure that their playback is optimized. Our primary business is currently in the mobility, gaming, and automotive markets, but we believe our technology is broadly applicable and see opportunities in evolving new markets, including entertainment, social content, virtual and augmented reality, sexual wellness and wearables, as well as residential, commercial, and industrial Internet of Things (“IoT”). In recent years, we have seen a trend towards broad market adoption of haptic technology, and estimate our technology is now in more than 3 billion devices worldwide. As other companies follow our leadership in recognizing how important tactile feedback can be in people's digital lives, we expect the opportunity to license our IP and technologies will continue to expand.
We have adopted a business model under which we provide advanced tactile software, related tools and technical assistance designed to integrate our patented technology into our customers’ products or enhance the functionality of our patented technology, and offer licenses to our patented technology to our customers. Our licenses enable our customers to deploy haptically-enabled devices, content and other offerings, which they typically sell under their own brand names. We and our wholly-owned subsidiaries hold approximately 3,200 issued or pending patents worldwide as of December 31, 2019. Our patents cover a wide range of digital technologies and ways in which touch-related technology can be incorporated into and between hardware products and components, systems software, application software, and digital content. We believe that our IP is relevant to many of the most important and cutting-edge ways in which haptic technology is and can be deployed, including in connection with mobile interfaces and user interactions, in association with pressure and other sensing technologies, as part of video and interactive content offerings, as related to virtual and augmented reality experiences, and in connection with advanced actuation technologies and techniques.
We were incorporated in 1993 in California and reincorporated in Delaware in 1999.
Our Business Strategy
Our goals are to continue to be a leading player in the haptics industry and to drive the adoption of our touch technology across markets and applications to improve user experiences in the digital realm. Our strategy is founded upon the ability to:
Innovate: Develop and patent our innovative technology to provide haptics in mobile, gaming, automotive, wearable, virtual and augmented reality, and other products and services to transform user experiences with unique and customizable tactile effects.
Drive Adoption: Communicate the advantages of our patented innovations and technologies to the relevant customers in target end-markets and encourage their adoption through demonstrations, incorporation in the offerings of world-class companies and participation in standards-setting organizations.
Monetize: License our technology to customers for use in the creation, distribution and playback of high-quality haptic experiences in various products, services and markets.
Expand Markets and Applications: Work closely with component suppliers, chip vendors, systems integrators, content enablers and other partners to broaden the use of haptics within our current core markets and to expand it into emerging markets, such as the wearables, virtual and augmented reality and sexual wellness markets.
We rely on the skills and talent of our employees to successfully execute our strategy through ongoing innovation, licensing activities, and collaboration with customers and partners to ensure that high-quality tactile experiences are brought to market. Accordingly, we seek to hire and retain employees with world class haptic expertise, as well as the executive management and operating personnel required to successfully execute our business strategies. To attract these high caliber employees, we have created an environment and culture that fosters and supports research, development, and innovation in breakthrough technologies with significant opportunities for broad industry adoption through licensing. We believe we have created a compelling company for inventive and entrepreneurial technology professionals who are able to work within our collaborative and supportive corporate environment to innovate and execute on our opportunities and to drive strong growth.
4
Haptics and Its Benefits
While the digital world offers many advanced technologies and capabilities, it often fails to provide us with the meaningful touch experiences that inform and enrich our real-world interactions. As we experience the physical world in our everyday lives, we rely on our sense of touch to provide us with reassuring context and confirmation, to bring us closer to one another through rich communications, and to enjoy entertainment, sports and other activities through realistic engagement. Without these tactile qualities, our digital experiences can feel flat and ineffective, pale reflections of the real world.
Immersion haptic technologies breathe life back into digital experiences, restoring the missing elements of confirmation, realism and rich communication to the digital world and help realize our vision: “With touch, we make people’s digital lives more personal, vivid, and meaningful”.
Confirmation: Today’s touchscreen, touch pad, and other touch surfaces often lack the physical feedback that is provided by mechanical keyboards, buttons, and switches that we need to fully understand the context of our interactions. By providing users with intuitive and unmistakable tactile confirmation as they push virtual buttons and scroll through lists, haptics can instill confidence, increase input speed, reduce errors and help improve safety. This is especially important in environments that involve distractions, such as automotive and commercial applications, where audio or visual confirmation is insufficient.
Realism: Haptics can inject a sense of realism into user experiences by exciting the senses and allowing the user to become immersed in the action and nuance of the application. For example, in haptically-enhanced videos, mobile games and simulations that integrate audio-visual content with tactile sensations, users can feel guns recoil, engines revving, and the crack of a baseball bat crushing a home run.
Rich Communications: When humans communicate through touch, they are better able to establish emotional connections and feelings of closeness. In mobile devices and wearables, haptics can enhance voice, chat and video applications by creating a sense of physical presence, allowing for more personal and engaging communications between users. Moreover, haptics can offer users a discreet and unobtrusive way of exchanging meaningful information without disruptive audio or visual feedback.
We believe these features of our haptic technology are broadly applicable to a number of markets and devices. By continuing to enhance these features through further research and development, we believe we will serve as a strategic partner for our customers and partners in helping them develop a more compelling user experience for consumers.
Our Offerings
We provide enabling technology, IP and haptic expertise to our customers through a variety of different offerings, including technology licenses, patent licenses, and combined licenses that cover both technology and patents. In most cases, our technology licenses include services, design tools, reference designs, and/or software development kits (“SDKs”), as well as licenses to our patents to the extent necessary to implement the licensed software, with the specific rights and restrictions to the applicable patents described in the license agreements. When we offer patent licenses, we generally provide the customer with a defined right to use our patented innovations in its own products, subject to limitations by specific field of use and other restrictions.
Our agreements are typically structured with fixed, variable or a mix of fixed and variable royalty and/or license payments over certain defined periods, as well as, in certain cases, fees for support or other services.
Technology Offerings
We generally license our technology as part of Immersion TouchSense-branded offerings that are intended to address the needs of our target markets. Our TouchSense offerings include haptic creation, deployment and playback software, SDKs, developer and enablement tools and documentation, technical and design and support services.
Targeted at manufacturers of mobile devices, wearables, gaming consoles/peripherals, automotive experiences, consumer electronics and their suppliers, our haptic reference implementations and reference designs consist of solutions enabling the design of tactile effects used in device interfaces and applications and enhancing the playback of haptic content. Our offerings consist of design tools, application programming interfaces (‘APIs”), reference designs, and firmware enabling the easy addition of new, customized haptic experiences to branded devices and other products.
Our SDKs are targeted at content and application developers and platforms and consist of design tools, integration software and effect libraries that allow for the design, encoding and playback of tactile effects in content. The SDKs offer high-fidelity tactile effects to augment and enhance content, while ensuring quality playback within consumer devices.
5
Patent Licenses
Through more than 26 years of innovative research, development and business activity, we have built a far-reaching and deep portfolio of patents covering many of the foundational aspects and commercial applications of haptic technology. We have implemented formal policies and procedures governing how we create, protect and maintain our IP assets, and we devote substantial resources to ensure that our IP coverage of the haptic landscape is as comprehensive as possible. Our growing portfolio now includes approximately 3,200 worldwide issued or pending patents, which support our TouchSense offerings, protect our business activities and prospects, and represent an important independent licensing and revenue channel for us. We believe that our IP is relevant to many of the most important ways in which haptic technology is and can be deployed, including in connection with mobile interfaces and user interactions, in association with pressure and other sensing technologies, related to virtual and augmented reality experiences, and in connection with advanced actuation technologies and techniques.
Haptic Expertise
We frequently offer our expertise to licensees to help them design and integrate touch effects into their products. This expertise includes engineering and integration services, design kits for prototyping, authoring tools, and APIs.
Engineering and Integration Services: We offer engineering assistance, including technical and design assistance and integration services that allow our licensees to incorporate our touch-enabling solutions and technologies into their products at a reasonable cost and within a shortened time frame, allowing them to bring products to market quickly by using our years of haptic development and solution deployment expertise. We offer product development solutions including software libraries, design, prototype creation, technology transfer, actuator selection, component sourcing, SDKs, sample source code, comprehensive documentation, and other engineering services. In addition, we help ensure a quality end-user experience by offering testing and certification services to a number of licensees and ecosystem participants such as actuator vendors.
Design Kits for Prototyping: We offer several design kits for customers to use for technology evaluation, internal evaluation, usability testing, and focus group testing. The kits include components and documentation that designers, engineers, and system integrators need for prototyping tactile effects into existing or sample products and applications.
Authoring Tools: In addition to TouchSense Haptic Development Kits, we license authoring tools that enable haptic designers and software developers in other markets, such as console gaming, to quickly design and incorporate customized touch feedback into their applications. Authoring tools allow designers to create, modify, experience, and save or restore haptic effects for a haptically enabled device.
Application Programming Interfaces: Our APIs provide haptic-effect generation capability. This allows designers and software programmers to focus on adding haptic effects to their applications instead of struggling with the mechanics of programming real-time algorithms and handling communications between computers and devices. Some of our haptic APIs are device independent (for example, they work with scroll wheels, rotary knobs, 2D joysticks, and other devices) to allow flexibility and reusability, and others are crafted to meet the needs of a particular customer or industry.
Platform Independent Solutions: Our software driver and API technologies have been designed to be easily ported to a variety of operating systems including Android, Tizen, Linux, and Windows.
Markets
Mobile Communications, Wearables, and Consumer Electronics: We offer haptic expertise to Original Equipment Manufacturers (‘OEM”) in the mobile device, wearables, consumer electronics markets and mobile communication market.
Our licensees currently include some of the top makers of mobile devices in the world, including Apple, LG Electronics, Google, Fujitsu, Sony, and Panasonic, as well as integrated manufacturers such as Awinic and Dongwoon.
Revenue generated from OEMs and integrated circuit customers in the mobile communications market, as a percentage of our total revenue, in 2019, 2018, and 2017, were 63%, 81%, and 48%, respectively, of our total revenue.
Automotive: We offer patent licenses and assistance such as reference designs, prototypes and enablement services to automotive makers and suppliers. Our current licensees include ALPS Electric Co., Continental, Marquardt, Bosch, Preh, Panasonic Automotive Systems, Seoyon Electronics and Tokai Rika.
Revenue generated from automotive customers, as a percentage of our total revenue, in 2019, 2018, and 2017 were 21%, 13%, and 15%, respectively.
Console and PC Gaming: We have licensed our patents directly to Microsoft, Sony and Nintendo for use in their console gaming products. Additionally, we have licensed our patents to third party gaming peripheral manufacturers and distributors for use in spinning mass and force feedback devices such as controllers, steering wheels and joysticks, to be used with PC platforms running on Microsoft Windows and other operating systems, as well as in connection with video game consoles made by Microsoft, Sony, Nintendo and others. Our gaming licensees include Guillemot, Microsoft, and Razer. We will not receive
6
any further royalties from Microsoft under our current agreement with Microsoft, including with respect to Microsoft’s gaming products or any other haptic-related product that Microsoft produces or sells.
Revenue generated from customers in the PC and console gaming market or gaming devices market, as a percentage of our total revenue, in 2019, 2018, and 2017 were 16%, 5%, and 31%, respectively.
Medical: We offer patent licenses to the medical market. Our current licensees include CAE Healthcare and Laerdal Medical A/S.
Revenue generated from medical customers, as a percentage of our total revenue, in 2019, 2018, and 2017 were 0%, 1%, and 6%, respectively.
We expect the mix of our total revenue from our markets to remain fairly consistent. However, certain markets may fluctuate significantly from quarter to quarter based upon the terms in our technology licenses, our revenue recognition policies and the seasonality of our licensee’s shipments.
Sales
Our revenue fluctuates quarterly and is generally higher in the third quarter of our fiscal year due to increased shipments by our customers of licensed products in preparation for the holiday season. However, significant fluctuations in the timing of our revenue are driven by the terms of our licensing agreements, the period in which such agreements become effective and our revenue recognition policies.
We employ a consolidated direct sales force in the United States, Europe and Asia to license our software and patents across our target markets and augment that sales force via partnerships and licensing agreements with component suppliers and system integrators.
Additional information about significant customers is incorporated herein by reference to Note 13. Segment Reporting, Geographic Information, and Significant Customers of the Notes to Consolidated Financial Statement in Item 8. Financial Statements and Supplementary Data.
Competition
Our biggest source of competition derives from decisions made by internal design groups at our OEM, haptic integrated circuit manufacturers, and other customers, as well as potential customers. Our strong patent position generally makes us unique in the market in that we may lose a software licensing opportunity, for example, to a competitor or in-house team but still secure a patent license when haptics are used.
We expect that these internal design groups will continue to make choices regarding whether to implement haptics or not, as well as the extent of their haptic investment and whether to develop their own haptic solutions.
The principal competitive factors impacting our business are the strength of the patents underlying our technology, as well as the technological expertise and design innovation and the use, reliability and cost-effectiveness of our software solutions. We believe we compete favorably in all these areas.
Our competitive position is also impacted by the competitive positions of our licensees’ products and other offerings. Our licensees’ markets are highly competitive. We believe that the principal competitive factors in our licensees’ markets include price, performance, user-centric design, ease-of-use, quality, and timeliness of products, as well as the licensee’s responsiveness, capacity, technical abilities, established customer relationships, distribution channels and access to retail shelf space, advertising, promotional programs, and brand recognition. Touch-related benefits in some of these markets may be viewed simply as marginal enhancements and may compete with non-touch-enabled technologies and price elasticity may be a significant factor in whether these markets incorporate haptic technologies.
Research and Development
Our success depends on our ability to continue to invent and improve our technologies in a timely manner; to design and develop software to meet specifications based on research and our understanding of customer needs and expectations; to offer tools and technology that enable high-quality, end-to-end haptic experiences, from the time of creation to the time of playback; and to collaborate with our licensees who are integrating our technologies into theirs. For the years ended December 31, 2019, 2018 and 2017, our research and development expenses were $7.8 million, $9.7 million and $11.8 million, respectively.
7
Engineering
We have assembled a multi-disciplinary team of highly skilled engineers and scientists with the experience required for development of touch-enabling technology. The team’s experience includes skills related to mechanical engineering, electrical engineering, embedded systems and firmware, control techniques, software, quality control, haptic content design, and project and process management. This team continues to generate patents that strengthen our IP position.
Application Engineering and Technical Support
We may provide application engineering and technical support during integration of our touch-enabling technology into customer products and other offerings, including content. To facilitate the validation and adoption of touch-enabling technology, we have developed various design kits. These kits may include actuators, mounting suggestions, controller boards, software libraries, programming examples, and documentation. Our application engineers support customer use of these design kits, including through phone and e-mail technical support and onsite training. This team continues to generate patents that strengthen our IP position.
Research
We have multi-disciplinary expertise in usability and multimodal user interface design, actuator design, sensors, integration, material science, real-time simulation algorithms, control, and software development. Our research team works with existing and potential partners to help them assess and prove the value of haptics in their field of interest, creating competitive differentiators and value-added solutions. This team continues to generate patents that strengthen our IP position.
User Experience
We have a dedicated team of user interaction specialists, focusing on user research and design to enable new and improved applications of haptics. We have unique expertise in haptics, usability, content creation, and interface design. Our team works with existing and potential partners to help them determine the best implementation of haptics in their specific application. This team works on the cutting edge of new user interface paradigms using haptics, resulting in an ongoing generation of patents, actively contributing to the strength of our IP portfolio.
Intellectual Property
Protection of our IP portfolio is crucial to our business. We rely on a combination of patents, copyrights, trade secrets, trademarks, nondisclosure agreements with employees and third parties, licensing arrangements, and other contractual agreements with third parties to protect our IP. We maintain and support an active program to protect our IP, primarily through the filing of patent applications and the defense of issued patents against infringement.
As of December 31, 2019, we and our wholly owned subsidiaries had approximately 3,200 currently issued or pending patents worldwide that cover various aspects of our technologies. The duration of our issued patents is determined by the laws of the country of issuance and is typically 20 years from the effective date of filing of the patent application resulting in the patent.
Investor Information
You can access financial and other information in the Investor Relations section of our web site at www.immersion.com. We make available, on our web site, free of charge, copies of our Annual Report on Form 10-K, quarterly reports on Form 10-Q, current reports on Form 8-K, and amendments to those reports filed or furnished pursuant to Section 13(a) or 15(d) of the Exchange Act as soon as reasonably practicable after filing such material electronically or otherwise furnishing it to the SEC.
The charters of our audit committee, our compensation committee, and our nominating/corporate governance committee, our Code of Business Conduct and Ethics (including Code of Ethics provisions that apply to our principal executive officer, principal financial officer, controller, and senior financial officers), our Corporate Governance Principles and our Stock Ownership Policy are also available at our web site under “Corporate Governance”. These items are also available to any stockholder who requests them by calling +1 408.467.1900.
The SEC maintains a Website that contains reports, proxy, and information statements, and other information regarding issuers that file electronically with the SEC at www.sec.gov.
8
Employees
As of December 31, 2019, we had 56 full-time employees.
9
Item 1A. Risk Factors
You should carefully consider the following risks and uncertainties, as well as other information in this report and our other SEC filings, in considering our business and prospects. If any of the following risks or uncertainties actually occurs, our business, financial condition, or results of operations could be materially adversely affected. The following risks and uncertainties are not the only ones facing us. Additional risks and uncertainties of which we are unaware or that we currently believe are immaterial could also materially adversely affect our business, financial condition, or results of operations. In any case, the trading price of our common stock could decline, and you could lose all or part of your investment. See also the Forward-looking Statements discussion in Item 7, Management’s Discussion and Analysis of Financial Condition and Results of Operations.
Company Risks
If we are unable to renew our existing licensing arrangements for our patents and other technologies on favorable terms that are consistent with our business objectives, our royalty and license revenue and cash flow could be materially adversely affected.
Our revenue and cash flow largely dependent on our ability to renew existing licensing arrangements. If we are unable to obtain renewed licenses on terms consistent with our business objectives or effectively maintain, expand, and support our relationships with our licensees, our licensing revenue and cash flow could decline. In addition, the process of negotiating license arrangements requires significant time, effort and expense. Due to the length of time required to negotiate a license arrangement, there may be delays in the receipt of the associated revenue, which could negatively impact our revenue and cash flow.
Specific challenges that we face related to negotiations with existing licensees include:
•difficulties in persuading existing customers to renew a license to our patents or other technologies (including delays associated with existing customers questioning the scope, validity, or enforceability) without the expenditure of significant resources;
•difficulties in persuading existing customers that they need a license to our patents as individual patents expire or become limited in scope, declared unenforceable or invalidated;
•reluctance of existing customers to renew their license to our patents or other technologies because other companies are not licensed;
•difficulties in renewing gaming licenses if video game console makers choose not to license third parties to make peripherals for their new consoles, if video game console makers no longer require peripherals to play video games, if video game console makers no longer utilize technology in the peripherals that are covered by our patents or if the overall market for video game consoles deteriorates substantially;
•the competition we may face from third parties, including the internal design and development teams of existing licensees;
• | difficulties in persuading existing licensees who compensate us for including our software in certain of their touch-enabled products to also license and compensate us for our patents that cover other touch-enabled products of theirs that do not include our software; |
•inability of current licensees to ship certain devices if they are involved in IP infringement claims by third parties that ultimately prevent them from shipping products or that impose substantial royalties on their products.
If we are unable to enter into new licensing arrangements for our patents or other technologies (including reference designs, firmware/software or other products) on favorable terms that are consistent with our business objectives, our royalty and license revenue and cash flow could be materially adversely affected.
Our revenue growth is largely dependent on our ability to enter into new licensing arrangements. If we are unable to obtain new licenses on terms consistent with our business objectives, our licensing revenue and cash flow could decline. In addition, the process of negotiating license arrangements requires significant time, effort and expense; due to the length of time required
10
to negotiate a license arrangement, there may be delays in the receipt of the associated revenue, which could negatively impact our revenue and cash flow.
Specific challenges that we face related to negotiations with prospective licensees include:
•difficulties in brand awareness among prospective customers, especially in markets in which we have not traditionally participated;
•difficulties in persuading prospective customers to take a license to our patents (including delays associated with prospective customers questioning the scope, validity or enforceability of our patents) without the expenditure of significant resources;
•reluctance of prospective customers to engage in discussions with us due to our history of litigation;
•difficulties in persuading prospective customers that they need a license to our patents as individual patents expire or become limited in scope, declared unenforceable or invalidated;
•reluctance of prospective customers to license our patents or other technologies because other companies are not licensed;
•the competition we may face from third parties, including the internal design teams of prospective customers;
• | difficulties in achieving and maintaining consumer and market demand or acceptance for our products; |
•difficulties in persuading third parties to work with us, to rely on us for critical technology, and to disclose to us proprietary product development and other strategies; and
•challenges in demonstrating the compelling value of our technologies and challenges associated with prospective customers’ ability to easily implement our technologies.
A limited number of customers account for a significant portion of our revenue, and the loss of major customers could harm our operating results.
A significant amount of our revenue is derived from a limited number of customers, and we expect that this will continue to be the case in the future. For example, for the year ended December 31, 2019, Samsung, accounted for 27% of our total revenues, for the year ended December 31, 2018, Apple Inc. accounted for 69% of our total revenues for the year ended December 31, 2018, and for the year ended December 31, 2017, three customers accounted for 20%, 18% and 11%, respectively, of our total revenues.
In addition, we cannot be certain that other customers that have accounted for significant revenue in past periods, individually or as a group, will continue to generate similar revenue in any future period.
If we fail to renew or lose a major customer or group of customers, or if a major customer decides that our patents no longer cover its products and stops paying us royalties, our revenue could decline if we are unable to replace the lost revenue with revenue from other sources. In addition, if potential customers or customers with expiring agreements view the loss of one of our major customers as an indicator of the value of our software and/or the strength of our intellectual property, they may choose not to take or renew a license which could adversely affect our operating results.
From time to time, stockholders have attempted and may continue to attempt to influence us, which could adversely affect our operations, financial condition and the value of our common stock.
Our stockholders have proposed and may continue to propose a variety of actions for our company, including seeking to acquire a controlling stake in our company, engaging in proxy solicitations, involving themselves in the governance and strategic direction of our company, or otherwise attempting to effect changes at our company. Campaigns by stockholders to effect changes at publicly-traded companies are sometimes led by investors seeking to increase short-term stockholder value through actions such as financial restructuring, increased debt, special dividends, stock repurchases, or sales of assets or the entire company or changes to our business strategy. Such campaigns can also be led by stockholders that have interests that are different from the majority of our stockholders and may not be in the best interests of the company. Responding to proxy contests and other actions by stockholders can be costly and time-consuming and could disrupt our operations and divert the
11
attention of our board of directors and senior management from the pursuit of our business strategies. These actions could adversely affect our operations, financial condition and the value of our common stock. For example, on March 5, 2020 we entered into a letter agreement with VIEX Capital Advisors, LLC pursuant to which, among other things, we agreed to add Stephen Domenik, Franz Fink and Eric Singer to our Board of Directors, and Sid Ganis and Jonathan Visbal will resign from our Board of Directors.
In addition, our Board of Directors was classified into three classes of directors with staggered three-year terms. However, in June of 2017, we filed an amended and restated certificate of incorporation providing for the gradual declassification of our Board of Directors beginning in 2018. The terms of the directors who were elected at the 2017 Annual Meeting expire in 2020, after which time all members of the Board of Directors will be elected on an annual basis. Without the classification of the Board of Directors or the staggering of elections, characteristics of our governance structure that have historically served as anti-takeover protections, we could be more vulnerable to a hostile takeover by an activist stockholder that may not be in the best interest of all stockholders. Such an attempt of a hostile takeover could distract our management team and could adversely affect our operating results.
If we fail to protect and enforce our patent rights and other IP rights, our ability to license our technologies and generate revenues could be impaired.
Our patent licensing business generates revenues by licensing our portfolio of patents to customers interested in selling products that incorporate our technologies. We have faced in the past, and expect to face in the future, challenges from third parties of the validity, enforceability, or scope of certain patents in our portfolio, and we have encountered situations in which third parties attempt to circumvent our patents through design changes. It is also possible that:
•our patents may not be broad enough to protect our proprietary rights;
•effective patent protection may not be available in every country, particularly in Asia, where some of our licensees do business; and
• | any litigation we are or may be involved in may be unsuccessful or may result in one or more of our patents becoming limited in scope, declared unenforceable or invalidated. |
If we are not able to protect and enforce the validity, enforceability and scope of the patents in our portfolio, or if a court or patent office were to limit the scope, declare unenforceable, or invalidate any of our patents, our ability to obtain future licenses could be impaired, and current licensees may refuse to make royalty payments or may choose to challenge one or more of our patents.
We also rely on licenses, confidentiality agreements, other contractual agreements, and copyright, trademark, and trade secret laws to establish and protect our proprietary rights. It is possible that:
•laws and contractual restrictions may not be sufficient to prevent misappropriation of our technologies or deter others from developing similar technologies; and
•policing unauthorized use of our patented technologies, trademarks, and other proprietary rights would be difficult, expensive, and time-consuming, within and particularly outside of the United States.
Our failure to continuously develop or acquire successful innovations and obtain patents on those innovations could significantly harm our business, financial condition, results of operations or cash flows.
We derive a significant portion of our revenues from licenses and royalties from our haptic patents. We devote significant engineering resources to develop new haptic patents to address the evolving haptic needs of our customers and potential customers. To remain competitive, we must introduce new haptic patents in a timely manner and the market must adopt such technology. Our initiatives to develop new and enhanced haptic innovations, to obtain patents on such innovations, and to commercialize these haptic innovations may not be successful or timely. Any new or enhanced haptic innovations may not be favorably received by our licensees, potential licensees, or consumers and we may not be able to monetize such haptic innovations. If our development efforts are not successful or are significantly delayed, companies may not incorporate our haptic innovations into their products and our revenues may not grow and could decline.
12
Potential patent and litigation reform legislation, potential United States Patent and Trademark Office (“USPTO”) and international patent rule changes, potential legislation affecting mechanisms for patent enforcement and available remedies, and potential changes to the intellectual property rights policies of worldwide standards bodies, as well as rulings in legal proceedings may affect our investments in research and development and our strategies for patent prosecution, licensing and enforcement and could have a material adverse effect on our licensing business as well as our business as a whole.
Potential changes to certain U.S. and international patent laws, rules and regulations may occur in the future, some or all of which may affect our research and development investments, patent prosecution costs, the scope of future patent coverage we secure, remedies that we may be entitled to in patent litigation, and attorneys’ fees or other remedies that could be sought against us, and may require us to reevaluate and modify our research and development activities and patent prosecution, licensing and enforcement strategies.
Similarly, legislation designed to reduce the jurisdiction and remedial authority of the United States International Trade Commission (the “USITC”) has periodically been introduced in Congress. Any potential changes in the law, the IP rights policies of standards bodies or other developments that reduce the number of forums available or the type of relief available in such forums (such as injunctive relief), restrict permissible licensing practices (such as our ability to license on a worldwide portfolio basis) or that otherwise cause us to seek alternative forums (such as arbitration or state court), could make it more difficult for us to enforce our patents, whether in adversarial proceedings or in negotiations. Because we have historically depended on the availability of certain forms of legal process to (i) enforce our patents and (ii) obtain fair and adequate compensation for our investments in research and development and for the unauthorized use of our intellectual property, developments in law and/or policy that undermine our ability to do so could have a negative impact on future licensing efforts and on revenue derived from such efforts.
.
Rulings of courts and administrative bodies may affect our strategies for patent prosecution, licensing and enforcement. For example, in recent years, the USITC and U.S. courts, including the U.S. Supreme Court and the U.S. Court of Appeals for the Federal Circuit, have taken actions that have been viewed as unfavorable to patentees. Decisions that occur in U.S. or in international forums may change the law applicable to various patent law issues, such as with respect to, patentability, validity, patent exhaustion, patent misuse, remedies, permissible licensing practices, claim construction, and damages in ways that could be detrimental to our ability to enforce patents in our IP portfolio and to obtain damages awards.
We continue to monitor and evaluate our strategies for prosecution, licensing and enforcement with regard to these developments in law and policy; however, any resulting change in such strategies could have a material adverse effect on our business and financial condition.
Our licenses with semiconductor and actuator manufacturers may cause confusion as to our licensing model and may prevent us from enforcing our patents based on the patent exhaustion doctrine, the implied license doctrine, or other legal doctrines.
We also license our software and/or patents to semiconductor and actuator manufacturers who incorporate our technologies into their integrated circuits or actuators for use in certain electronic devices. While our relationships with these manufacturers increase our distribution channels by leveraging their sales channels, this could introduce confusion into our licensing model which has traditionally been focused on licensing the OEM. In addition, licensing to semiconductor and actuator manufacturers increases the risk of patent exhaustion and implied licenses such that incorrectly structured licenses could negatively impact our business and financial results.
We had an accumulated deficit of $119 million as of December 31, 2019 and we may not return to consistent profitability in the future.
As of December 31, 2019, we had an accumulated deficit of $119 million. We need to generate significant ongoing revenues to return to consistent profitability. We will continue to incur expenses as we:
•increase our sales and marketing efforts;
•engage in research and develop our technologies;
•protect and enforce our IP; and
•incur costs related to litigation.
13
If our revenues grow more slowly than we anticipate or if our operating expenses exceed our expectations, we may not return to profitability.
We have experienced turnover in our senior management and our employee base, which could result in operational and administrative inefficiencies and could hinder the execution of our growth strategy.
We have recently experienced turnover in our senior management. For example, our Chief Executive Officer joined us in January 2019, our General Counsel joined us in June 2019, and our Chief Financial Officer joined us in January 2020. Lack of management continuity could harm our customer relationships, delay product development processes, adversely affect our ability to successfully execute our growth strategy, result in operational and administrative inefficiencies and added costs, and could impede our ability to recruit new talented individuals to senior management positions, which could adversely impact our results of operations, stock price and customer relationships. Our success largely depends on our ability to integrate any new senior management within our organization in order to achieve our operating objectives, and changes in other key positions may affect our financial performance and results of operations as new members of management become familiar with our business. General employee turnover also presents risks discussed in this paragraph.
If we are not able to attract, recruit and retain qualified personnel, we may not be able to effectively develop and deploy our technologies.
Our technologies are complex, and we rely upon our employees to identify new sales and business development opportunities, support and maintain positive relationships with our licensees, enhance existing technologies, and develop new technologies. Accordingly, we need to be able to attract, recruit, integrate, and retain sales, support, marketing, and research and development personnel, including individuals highly specialized in patent licensing and engineering in order to develop and deploy our technologies and to sustain revenue growth. Competition for talented candidates is intense, especially for individuals with patent licensing, engineering and haptics expertise, and we may not be successful in attracting, integrating, and continuing to motivate such qualified personnel. In this competitive recruiting environment, especially when hiring in Silicon Valley, our compensation packages need to be attractive to the candidates we recruit. However, given the protracted and uncertain nature of our royalty collection practices, it could be difficult to craft compensation plans that will attract and retain salespeople with the skills to secure complex licensing arrangements. In the greater San Francisco Bay Area and Montreal, Canada, candidates and employees view the stock component of compensation as an important factor in deciding both whether to accept an employment opportunity as well as whether to remain in a position at a company. Even if we are able to present robust compensation packages that enable us to attract and recruit new candidates for hire, we may not be able to retain our current executive officers and key employees if the structure of their compensation packages does not provide incentives for them to remain employed by us. Some of our executive officers and key employees hold stock options with exercise prices that may be above the current market price of our common stock or that are largely vested, which could impair our ability to retain their continued services.
We may incur greater tax liability than we have provided for or have anticipated and may incur additional tax liability due to certain indemnification agreements with certain licensees, which could adversely affect our financial condition and operating results.
In 2015, we completed a reorganization of our corporate organization in order to more closely align our corporate structure with the international nature of our business activities.
We began a second reorganization of our corporate organization in 2019 in order to address changing international tax laws and to re-align our corporate structure with the evolving nature of our international business activities. As a result of this second reorganization, we have maintained our overall effective tax rate through changes in how we develop and use our intellectual property and changes in the structure of our international sales operations, including by entering into intercompany arrangements. There can be no assurance that the taxing authorities of the jurisdictions in which we operate or to which we are otherwise deemed to have sufficient tax nexus will not challenge the restructuring or the tax position that we take.
Our tax rate is dependent on our ability to operate our business in a manner consistent with the second reorganization of our corporate organization and applicable tax provisions, as well as on our achieving our forecasted revenue growth rates. If the intended tax treatment is not accepted by the applicable taxing authorities, changes in tax law negatively impact the structure, or we do not operate our business consistent with the intended reorganization and applicable tax provisions, we may fail to achieve the financial efficiencies that we anticipate as a result of the second reorganization and our future operating results and financial condition may be negatively impacted. In addition, future changes to U.S. or non-U.S. tax laws, including legislation to reform U.S. or other countries' taxation of international business activities, could negatively impact the anticipated tax benefits of the reorganization.
14
Additionally, from time to time, we enter into license agreements with our licensees pursuant to which we may agree to indemnify a customer for certain taxes imposed on the customer by an applicable tax authority and related expense. We have received requests from certain licensees requesting that we reimburse them for certain tax liabilities. For example, on April 28, 2017, we received a letter from Samsung requesting that we reimburse Samsung with respect to withholding tax and penalties imposed on Samsung by the Korean tax authorities as a result of its determination that withholding taxes should have been withheld from certain payments made from Samsung to Immersion Software Ireland Limited, a request that was arbitrated by a panel of the International Chamber of Commerce. On March 27, 2019, the panel issued a final award. The award ordered us to pay Samsung KRW 7,841,324,165 (approximately $6.9 million as of March 31, 2019), which we paid on April 22, 2019, denied Samsung’s claim for interest from and after May 2, 2017; and ordered us to pay Samsung’s cost of the arbitration in the amount of approximately $871,454. In the first quarter of 2019, $6.9 million was recorded in the Company's Consolidated Balance Sheet. The Company is currently appealing in the Korean courts, on behalf of Samsung, the imposition of such withholding taxes and penalties. In the event that the Company does not ultimately prevail in its appeal in the Korean courts, the deposit included in Other assets would be recorded as additional income tax expense on the Company's Consolidated Statement of Operations and Comprehensive Income (Loss), in the period in which the Company does not ultimately prevail. For additional background on this matter, please see Part I, Item 3 Legal Proceedings.
In addition, on October 16, 2017, we received a letter from LG Electronics Inc. (“LGE”) requesting that we reimburse LGE with respect to withholding tax imposed on LGE by the Korean tax authorities following an investigation where the tax authority determined that LGE failed to withhold on LGE’s royalty payments to Immersion Software Ireland from 2012 to 2014. On November 3, 2017, on behalf of LGE, we filed an appeal with the Korea Tax Tribunal regarding their findings with respect to the withholding taxes. The Korea Tax Tribunal hearing took place on March 5, 2019. On March 19, 2019, the Korea Tax Tribunal issued its ruling in which it decided not to accept Immersion’s arguments with respect to the Korean tax authorities’ assessment of withholding tax and penalties imposed on LGE. On behalf of LGE, we filed an appeal with the Korea Administrative Court on June 10, 2019. The first hearing occurred on October 15, 2019. A second hearing occurred on December 19, 2019. A third hearing occurred on February 13, 2020. A fourth hearing is scheduled for April 7, 2020.
In the event that it is determined that we are obligated to further indemnify Samsung and/or LGE for such withholding taxes imposed by the Korean tax authorities, receive further requests for reimbursement of tax liabilities from other licensees, we could incur significant expenses.
We are or may become involved in litigation, arbitration and administrative proceedings to enforce or defend our intellectual property rights and to defend our licensing practices are expensive, disruptive and time consuming, and will continue to be, until resolved, and regardless of whether we are ultimately successful, could adversely affect our business.
If we believe that a third party is required, but has declined, to license our intellectual property in order to manufacture, sell, offer for sale, import or use products, we have in the past and may in the future commence legal or administrative action against such third party. In some cases, we have and may become party to legal proceedings in which we are adverse to companies that have significantly greater financial resources than us. For example, we had previously initiated patent infringement litigation against Samsung and Motorola. Due to the inherent uncertainties of litigation and administrative proceedings, we cannot accurately predict how these proceedings will ultimately be resolved. We anticipate that currently pending and any future legal proceedings will continue to be costly, especially in cases where our adverse parties have access to relatively more significant resources. Since there can be no assurance that we will be successful or be able to recover the costs we incur in connection with the legal proceedings (including outside counsel fees), as we incur additional legal costs, the cash available for other parts of our business may decrease. In addition, litigation could lead to counterclaims, adverse rulings affecting our patents, and could harm our relationship with our customers and potential customers, who may postpone licensing decisions pending the outcome of the litigation or dispute, or who may choose not to adopt our technologies. Although protecting our intellectual property is a fundamental part of our business, at times, our legal proceedings have diverted, and could continue to divert, the efforts and attention of some of our key management and personnel away from our licensing transactions and other aspects of our business. As a result, until such time as it is resolved or concluded, litigation, arbitration and administrative proceedings could cause our technology to be perceived as less valuable in the marketplace, which could reduce our sales and adversely affect our business. Further, any unfavorable outcome could adversely affect our business. For additional background on our litigation, please see Part I, Item 3 Legal Proceedings.
The terms in our agreements may be construed by our licensees in a manner that is inconsistent with the rights that we have granted to other licensees or in a manner that may require us to incur substantial costs to resolve conflicts over license terms.
15
In order to generate revenues from our patent and other technology licensing business, we regularly enter into agreements pursuant to which our licensees are granted certain rights to our patents and other technology. These rights vary in scope and nature depending on the customer: for example, we may grant a licensee the right to use our technology in certain fields of use or with respect to limited market sectors or product categories, and we may or may not grant a licensee exclusive rights or sublicensing rights. We refer to the license terms and restrictions in our agreements, including, but not limited to, field of use definitions, market sector, and product category definitions, collectively, as “License Provisions”.
Due to the continuing evolution of market sectors, product categories, and business models and to the compromises inherent in the drafting and negotiation of License Provisions, our licensees may interpret License Provisions in their agreements in a way that is different from our interpretation of such License Provisions or in a way that is inconsistent with the rights that we have granted to other licensees. Such conflicting interpretations by our licensees may lead to claims that we have granted rights to one licensee that are inconsistent with the rights that we have granted to another licensee or that create a dispute as to which products are covered by the license and are thus subject to a royalty payment.
Many of our customers report royalties to us based on (i) the number of products in their shipments that incorporate our patented technology or other technology or (ii) our customers’ revenues and their interpretation and allocation of contracted royalty rates. When assessing payments due by customers under these types of arrangements, we rely upon the accuracy of our customers’ recordkeeping and reporting, and inaccuracies or payment disputes regarding amounts our customers owe under their licensing agreements may negatively impact our results of operations. The royalties that are originally reported by a customer could differ materially from those determined by either a customer-self-reported correction or from an audit we have performed on a customer’s books and records. Differing interpretations of royalty calculations may also cause disagreements during customer audits, may lead to claims or litigation, and may have an adverse effect on the results of our operations. Further, although our agreements generally give us the right to audit books and records of our licensees, audits can be expensive and time consuming and may not be cost-justified based on our understanding of our licensees’ businesses. Pursuant to our license compliance program, we audit certain licensees to review the accuracy of the information contained in their royalty reports in an effort to decrease the risk of our not receiving royalty revenues to which we are entitled, but we cannot give assurances that such audits will be effective.
In addition, after we enter into an agreement, it is possible that markets and/or products that incorporate our patented technology or other technology, or legal and/or regulatory environments, will evolve in an unexpected manner that could affect the scope of our rights to royalties under such agreement or another one of our licensing agreements or our ability to enforce and defend the technology covered by such agreement or another one of our licensing agreements. As a result, in any agreement, we may have granted rights that will preclude or restrict our exploitation of new opportunities that arise after the execution of the agreement.
Our international operations subject us to additional risks and costs.
We currently have sales personnel in Japan, Korea, and China who engage customers and prospective customers in those regions. International revenues accounted for approximately 72% of our total revenues in 2019. International operations are subject to a number of difficulties, risks, and special costs, including:
•compliance with multiple, conflicting and changing governmental laws and regulations;
•laws and business practices favoring local competitors;
•foreign exchange and currency risks;
•changing import and export restrictions, duties, tariffs, quotas and other barriers;
•difficulties staffing and managing foreign operations;
•business risks, including fluctuations in demand for our technologies and products and the cost and effort to conduct international operations and travel abroad to promote international distribution and overall global economic conditions;
•multiple conflicting and changing tax laws and regulations;
•political and economic instability;
•the possibility of an outbreak of hostilities or unrest in markets where major customers are located, including Korea.
16
•potential economic disruption based on the United Kingdom’s recent withdrawal from the European Union, commonly referred to as Brexit; and
•the possibility of volatility in financial markets as certain market participants transition away from the London Inter-bank Offered Rate (LIBOR).
In addition, since we derive a significant portion of our revenues from licenses and royalties from our haptic patents in foreign countries, our ability to maintain and grow our revenue in foreign countries, such as China, will depend in part on our ability to obtain additional patent rights in these countries and our ability to effectively enforce such patents and contractual rights in these countries, which is uncertain. Our technology licenses with customers in foreign countries subject us to an increased risk of theft of our technology. It may be more difficult for us to protect our IP in foreign countries, and as a result foreign counterparties may be more likely to steal our know-how, reverse engineer our software, or infringe our patents.
Our failure to comply with complex US and foreign laws and regulations could have a material adverse effect on our operations.
We are subject to the U.S. Foreign Corrupt Practices Act of 1977, as amended (the “FCPA”) and other anticorruption, anti-bribery and anti-money laundering laws in the jurisdictions in which we do business, both domestic and abroad. These laws generally prohibit us and our employees from improperly influencing government officials in order to obtain or retain business, direct business to any person or gain any improper advantage. The FCPA and other applicable anti-bribery and anti-corruption laws also may hold us liable for acts of corruption and bribery committed by our third-party business partners, representatives and agents. While we have policies and procedure to address compliance with such laws, we cannot assure you that our employees and agents will not take actions in violation of our policies or applicable law, for which we may be ultimately held responsible and our exposure for violating these laws increases as our international presence expands and as we increase sales and operations in foreign jurisdictions. Any violation of such laws could result in whistleblower complaints, adverse media coverage, investigations, imposition of significant legal fees, and other consequences which may have an adverse effect on our reputation, business, results of operations and financial condition.
Our international operations could also increase our exposure to foreign and international laws and regulations, which are subject to change. If we cannot comply with foreign laws and regulations, which are often complex and subject to variation, differing or inconsistent government interpretation, and unexpected changes, we could incur unexpected costs and potential litigation. For example, the governments of foreign countries might attempt to regulate our products or levy sales or other taxes relating to our activities. In addition, foreign countries may impose tariffs, duties, price controls, or other restrictions on foreign currencies or trade barriers, any of which could make it more difficult for us to conduct our business internationally. Our international operations could also increase our exposure to complex international tax rules and regulations. Changes in, or interpretations of, tax rules and regulations may adversely affect our income tax provision. In addition, our operations outside the United States may be affected by changes in trade protection laws, policies and measures, and other regulatory requirements affecting trade and investment, including the U.S. Foreign Corrupt Practices Act and local laws prohibiting corrupt payments by our employees, vendors, or agents.
Our sales to customers or sales by our customers to their end customers in some areas outside the United States could be subject to government export regulations or restrictions that prohibit us or our licensees from selling to customers in some countries or that require us or our licensees to obtain licenses or approvals to export such products internationally. Delays or denial of the grant of any required license or approval, or changes to the regulations, could make it difficult or impossible to make sales to foreign customers in some countries and could adversely affect our revenue. In addition, we could be subject to fines and penalties for violation of these export regulations if we were found in violation. Such violation could result in penalties, including prohibiting us from exporting our products to one or more countries, and could materially and adversely affect our business.
We may not be able to continue to derive significant revenues from makers of peripherals for popular video gaming platforms.
A significant portion of our gaming royalty revenues comes from third-party peripheral makers who make licensed gaming products designed for use with popular video game console systems from Microsoft, Sony, and Nintendo. Video game console systems are closed, proprietary systems, and video game console system makers typically impose certain requirements or restrictions on third-party peripheral makers who wish to make peripherals that will be compatible with a particular video game console system. If third-party peripheral makers cannot or are not allowed to satisfy these requirements or restrictions, our gaming royalty revenues could be significantly reduced. Furthermore, should a significant video game console maker choose to
17
omit touch-enabling capabilities from its console systems or restrict or impede the ability of third parties to make touch-enabling peripherals, it could lead our gaming licensees to stop making products with touch-enabling capabilities, thereby significantly reducing our gaming royalty revenues. Also, if the video game industry changes such that mobile or other platforms increase in popularity at the expense of traditional video game consoles, our gaming royalty revenues could be substantially reduced if we are unable to enter into replacement arrangements enabling us to license our software, patents, or other IP in connection with gaming on such mobile or other platforms. Although we have a significant software and patent position with respect to virtual reality (or VR) peripherals and systems, the market may not become large enough to generate material revenues. Finally, as some of our litigated patents related to video game peripherals have expired, our gaming royalty revenues will likely decline until we are successful in proving the relevance of our patents for this market.
Because we have a fixed payment license with Microsoft, our royalty revenue from licensing in the gaming market and other consumer markets has previously declined and may further do so if Microsoft increases its volume of sales of touch-enabled products at the expense of our other licensees.
Under the terms of our present agreement with Microsoft, Microsoft receives a royalty-free, perpetual, irrevocable license (including sublicense rights) to our worldwide portfolio of patents. This license permits Microsoft to make, use, and sell hardware, software, and services, excluding specified products, covered by our patents. We will not receive any further revenues or royalties from Microsoft under our current agreement with Microsoft, including with respect to Microsoft’s Xbox One gaming product or any other haptic-related product that Microsoft produces or sells. Microsoft has a significant share of the market for touch-enabled console gaming computer peripherals and is pursuing other consumer markets such as mobile devices, tablets, personal computers, and VR and augmented reality (or AR). Microsoft has significantly greater financial, sales, and marketing resources, as well as greater name recognition and a larger customer base than some of our other licensees from whom, unlike with respect to Microsoft, we are able to collect royalty payments. In the event that Microsoft increases its share of these markets relative to companies from whom we are not precluded from collecting royalty payments, our royalty revenue from other licensees in these market segments may decline.
Automobiles incorporating our touch-enabling technologies are subject to lengthy product development periods, making it difficult to predict when and whether we will receive royalties for these product types.
The product development process for automobiles is very lengthy, sometimes longer than four years. We may not earn royalty revenue on our automotive device technologies unless and until products featuring our technologies are shipped to customers, which may not occur until several years after we enter into an agreement with a manufacturer or a supplier to a manufacturer. Throughout the product development process, we face the risk that a manufacturer or supplier may delay the incorporation of, or choose not to incorporate, our technologies into its products, making it difficult for us to predict the royalties we may receive, if any. After the product launches, our royalties still depend on market acceptance of the vehicle, or the option packages if our technology is an option (for example, a navigation unit), which is likely to be determined by many factors beyond our control.
Further, our revenues in the automotive market depend in large part on the number of haptic touch interfaces that are incorporated into vehicles. We believe that the automotive market provides opportunities for growth for us, especially if haptic touch interfaces are adopted in more mid-tier and entry-tier vehicles. However, if such opportunities fail to materialize and/or if less haptic touch interfaces are sold in the future, it may have a material and adverse effect on our business, financial position, results of operations or cash flows.
18
We have little or no control or influence on our licensees’ design, manufacturing, quality control, promotion, distribution, or pricing of their products incorporating our touch-enabling technologies, upon which we generate royalty revenue.
A key part of our business strategy is to license our software and patents (and other IP) to companies that manufacture and sell products incorporating our touch-enabling technologies. For the years ended December 31, 2019, 99% of our total revenues were royalty and license revenues, as compared to 97% and 98% for the years ended December 31, 2018 and 2017, respectively. We do not control or influence the design, manufacture, quality control, promotion, distribution or pricing of products that are manufactured and sold by our licensees, nor can we control consolidation within an industry which could either reduce the number of licensable products available or reduce royalty rates for the combined licensees. In addition, we generally do not have commitments from our licensees that they will continue to use our technologies in current or future products. As a result, products incorporating our technologies may not be brought to market, achieve commercial acceptance or otherwise generate meaningful royalty revenue for us. For us to generate royalty and license revenue, licensees that pay us per-unit royalties must manufacture and distribute products incorporating our touch-enabling technologies in a timely fashion and generate consumer demand through marketing and other promotional activities. If our licensees’ products fail to achieve commercial success, or if their products are recalled because of quality control problems or if they do not timely ship products incorporating our touch-enabling technologies or fail to achieve strong sales, our revenues could decline.
Catastrophic events, such as natural disasters, war, and acts of terrorism and epidemics could disrupt the business of our customers or harm our facilities which could harm our business and results of operations.
The production processes and operations of our customers are susceptible to the occurrence of catastrophic events, such as natural disasters, war, acts of terrorism, pandemic events and the spread of disease (including the recent outbreak of the coronavirus commonly referred to as “COVID-19”), all of which are outside of our control. Any such events could cause a serious business disruption to our customers’ ability to manufacture, distribute and sell products incorporating our touch-enabling technologies, which may adversely affect our business and results of operation.
Our facilities could be subject to a catastrophic loss such as fire, flood, earthquake, power outage, or terrorist activity. A substantial portion of our research and development activities, our corporate headquarters, and other critical business operations are located near major earthquake faults in or around San Jose, California, and the San Francisco Bay Area in general, areas with a history of seismic events.
An earthquake at or near our facilities could disrupt our operations and result in large expenses to repair and replace the facility. While we believe that we maintain insurance sufficient to cover most long-term potential losses at our facilities, our existing insurance may not be adequate for all possible losses including losses due to earthquakes.
Our business may suffer if third parties assert that we violate their IP rights.
Third parties have previously claimed and may in the future claim that we or our customers are infringing upon their IP rights. Even if we believe that such claims are without merit or that we are not responsible for them under the indemnification or other terms of our customer license agreements, such claims can be time-consuming and costly to defend against and may divert management’s attention and resources away from our business. Furthermore, third parties making such claims may be able to obtain injunctive or other equitable relief that could block our ability to further develop or commercialize some or all of our software technologies or services in the United States and abroad. Claims of IP infringement also might require us to enter into costly settlement or license agreements or pay costly damage awards. Even if we have an agreement that provides for a third party to indemnify us against such costs, the indemnifying party may be unable or unwilling to perform its contractual obligations.
We license some technologies from third parties and in doing so, we must rely upon the owners of these technologies for information on the origin and ownership of the technologies. As a result, our exposure to infringement claims may increase if the owners misrepresent, intentionally or unintentionally, the scope or validity of their ownership. We generally obtain representations as to the origin and ownership of acquired or licensed technologies and indemnification to cover any breach of these representations. However, representations may not be accurate, and indemnification may not provide adequate compensation for breach of the representations. If we cannot or do not license the infringed IP at all or on reasonable terms, or substitute similar technology from another source, our business, financial position, results of operations or cash flows could suffer.
19
Our business and operations could suffer in the event of any actual or perceived security breaches.
Our business involves the storage and transmission of customers’ proprietary and confidential information, including information that may be personal information, and other data. In addition, we collect, use and maintain our own confidential and proprietary business information, and maintain intellectual property internally on our systems. Computer malware, cyberattacks and other threats and methods used to gain unauthorized access to our information technology networks and systems have become more prevalent and sophisticated. These threats and attempts, which may be related to industrial or other espionage, could include covertly introducing malware such as viruses, worms and other malicious software programs to our computers and networks, impersonating authorized users, and fraudulently inducing employees or customers into disclosing sensitive information such as user names, passwords or other information in order to gain access to our data or our customers’ data, among other possible methods of security breach. These threats are constantly evolving, making it increasingly difficult to successfully defend against them or implement adequate protective measures.
Because the techniques used to obtain unauthorized access or to sabotage systems change frequently and generally are not recognized until launched against a target, we may be unable to anticipate these techniques or to implement adequate preventative measures. While we utilize certain measures in an effort to protect the security of our systems and the integrity, confidentiality and security of our intellectual property and personal information or other confidential business information, there can be no assurance that any security measures that we or our third-party service providers have implemented will be effective against current or future security threats. Our security measures or those of our third-party service providers could fail, whether as a result of third-party action, employee error, malfeasance or otherwise, and could result in unauthorized access to or use of our systems or unauthorized, accidental, or unlawful access to, or disclosure, modification, misuse, loss or destruction of, our intellectual property and data and data of our customers.
In addition, our customers may authorize third party technology providers to access their customer data. Because we do not control the transmissions between our customers and third-party technology providers or the processing of such data by third-party technology providers, we cannot ensure the integrity or security of such transmissions or processing.
We might be unaware of any actual or potential security breach or be delayed in detecting a security breach, or, even if we are able to identify a breach, we may be unaware of its magnitude and effects. Actual or perceived security breaches could result in unauthorized use of or access to our systems, system interruptions or shutdowns, unauthorized, accidental, or unlawful access to, or disclosure, modification, misuse, loss or destruction of, our or our customers’ data or intellectual property, may lead to litigation, indemnity obligations, regulatory investigations and other proceedings, severe reputational damage adversely affecting customer or investor confidence and causing damage to our brand, indemnity obligations, disruption to our operations, damages for contract breach, and other liability, reduction in the value of our investment in research and development and other strategic initiatives, and adverse effects upon our revenues and operating results. Additionally, our service providers may suffer, or be perceived to suffer, data security breaches or other incidents that may compromise data stored or processed for us that may give rise to any of the foregoing.
More generally, any of the foregoing types of security breaches, or the perception that any of them have occurred, may lead to the expenditure of significant financial and other resources in efforts to investigate or correct a breach or incident and to address and eliminate vulnerabilities and to prevent future security breaches, as well as significant costs for remediation that may include liability for stolen intellectual property or other assets or information and repair of system damage that may have been caused, incentives offered to customers in an effort to maintain business relationships, and other liabilities. We have incurred and expect to incur significant expenses in an effort to prevent security breaches and other security incidents.
We cannot be certain that our insurance coverage will be adequate for data security liabilities actually incurred, will cover any indemnification claims against us relating to any incident, that insurance will continue to be available to us on economically reasonable terms, or at all, or that any insurer will not deny coverage as to any future claim. The successful assertion of one or more large claims against us that exceed available insurance coverage, or the occurrence of changes in our insurance policies, including premium increases or the imposition of large deductible or co-insurance requirements, could have a material adverse effect on our business, including our financial condition, operating results, and reputation.
The rejection of our haptic technology by standards-setting organizations, or failure of the standards-setting organization to develop timely commercially viable standards may negatively impact our business.
As part of our growth plan, we intend to participate in standards-setting organizations. The rejection of our haptic technology or failure of the standards-setting organizations to develop timely commercially viable standards may negatively impact our business and financial results.
20
Entrance into the highly competitive and fragmented sexual wellness market may adversely impact our financial results.
As part of our strategy, we are considering entering the sexual wellness market. If we enter this market, our competitors may have significant competitive advantages over us, including longer operating histories, larger and broader customer bases, more established relationships with a broader set of suppliers, and greater brand recognition. In addition, the sexual wellness market vertical is highly fragmented, which may lead to unexpected challenges and expenses in licensing our technology. These factors could cause our entrance into the sexual wellness market to negatively impact our financial results. In addition, the sexual wellness market vertical we intend to license into may subject us to obscenity or other legal claims by third parties for which our financial position and results of operations could be harmed.
If we are unable to develop open source compliant products, our ability to license our technologies and generate revenues would be impaired.
We have seen, and believe that we will continue to see, an increase in customers requesting that we develop products that will operate in an “open source” environment. Developing open source compliant products without imperiling the IP rights upon which our licensing business depends may prove difficult under certain circumstances, thereby placing us at a competitive disadvantage for new product designs.
Already, some of our proprietary technologies incorporate open source software that may be subject to open source licenses, which licenses may require that source code subject to the license be released or made available to the public. Such open source licenses may mandate that software developed based on source code that is subject to the open source license, or combined in specific ways with such open source software, become subject to the open source license. We take steps to ensure that proprietary software we do not wish to disclose is not combined with, or does not incorporate, open source software in ways that would require such proprietary software to be subject to an open source license. However, there is currently uncertainty in the legal landscape around open source software, as few courts have interpreted open source licenses, and the manner in which these licenses may be legally interpreted and enforced is therefore not yet clear. We often take steps to disclose source code for which disclosure is required under an open source license, but it is possible that we have made or will make mistakes in doing so, which could negatively impact our brand or the adoption of our products by our customers or prospective customers or could expose us to additional liability.
In addition, we rely on multiple software programmers to design our proprietary products and technologies. Although we take steps to ensure that our programmers (both internal and outsourced) do not include open source software in products and technologies we intend to keep proprietary, we cannot be certain that open source software is not inadvertently incorporated into products and technologies we intend to keep proprietary. In the event that portions of our proprietary technology are determined to be subject to an open source license, or are intentionally released under an open source license, we could be required to publicly release the relevant portions of our source code, which could reduce or eliminate our ability to commercialize our products and technologies. As a result, our revenues may not grow and could decline.
Our business depends in part on access to third-party platforms and technologies. If such access is withdrawn, denied, or is not available on terms acceptable to us, or if the platforms or technologies change, our business and operating results could be adversely affected.
Many of our current and future software technologies are designed for use with third-party platforms and technologies. Our business relies on our access to these platforms and technologies of third parties, which can be withdrawn, denied or not be available on terms acceptable to us.
Our access to third-party platforms and technologies may require paying royalties or other amounts, which lowers our margins, or may otherwise be on terms that are not acceptable to us. In addition, the third-party platforms or technologies used to interact with our software technologies can be delayed in production or can change in ways that negatively impact the operation of our software.
If we are unable to access third-party platforms or technologies, or if our access is withdrawn, denied, or is not available on terms acceptable to us, or if the platforms or technologies are delayed or change, our business and operating results could be adversely affected.
21
The uncertain economic and political environment could reduce our revenues and could have an adverse effect on our financial condition and results of operations.
The current global economic conditions and political climate could materially hurt our business in a number of ways, including longer sales and renewal cycles, exchange rate volatility, delays in adoption of our products or technologies or those of our customers, increased risk of competition, higher taxes and tariffs on goods incorporating out technologies, higher overhead costs as a percentage of revenue, delays in signing or failing to sign customer agreements or signing customer agreements with reduced royalty rates. In addition, our customers, potential customers, and business partners would likely face similar challenges, which could materially and adversely affect the level of business they conduct with us or the sales volume of products that include our technology.
Our technologies are complex and may contain undetected errors, which could harm our reputation and future sales.
Any failure to provide high quality and reliable technologies, whether caused by our own failure or failures of our suppliers or customers, could damage our reputation and reduce demand for our technologies. Our technologies have in the past contained, and may in the future contain, undetected errors or defects. These errors or defects may increase as our technologies are introduced into new devices, markets and applications, including the automotive market, or as new versions are released. Some errors in our technologies may only be discovered after a customer’s product incorporating our technologies has been shipped to customers. Undiscovered vulnerabilities in our technologies or products could expose our customers to hackers or other unscrupulous third parties who develop and deploy viruses, worms and other malicious software programs that could attach to our products or technologies. Any errors or defects discovered in our technologies after commercial release could result in product recalls, loss of revenue, loss of customers, and increased service and warranty costs, any of which could adversely affect our business.
If we fail to adequately protect personal information or other information we process or maintain, our business, financial condition and operating results could be adversely affected.
A wide variety of state, national, and international laws and regulations apply to the collection, use, retention, protection, disclosure, transfer and other processing of personal data and other information. Evolving and changing definitions of personal data and personal information within the European Union (“EU”), the U.S., and elsewhere, especially relating to classification of IP addresses, machine identification, location data and other information, may limit or inhibit our ability to operate or expand our business, . For example, it may be more difficult for us to share data with commercial partners, conduct research, or market to customers. Heightened compliance requirements may lead to increased administrative expenses. . Data protection and privacy-related laws and regulations are evolving and may result in ever-increasing regulatory and public scrutiny and escalating levels of enforcement and sanctions.
For example, the EU General Data Protection Regulation (“GDPR”), which became fully effective on May 25, 2018, imposes more stringent data protection requirements than previously effective EU data protection law and provides for penalties for noncompliance of up to the greater of €20 million or four percent of worldwide annual revenues. The GDPR requires, among other things, that personal data only be transferred outside of the EU to certain jurisdictions, including the United States, if steps are taken to legitimize those data transfers. We rely on the EU-U.S. and Swiss-U.S. Privacy Shield programs, and the use of model contractual clauses approved by the EU Commission, to legitimize these transfers. Both the EU-U.S. Privacy Shield and these model contractual clauses have been subject to legal challenge, however, and it is unclear what effect these challenges will have and whether the means we presently use will continue as appropriate means for us to legitimize personal data transfers from the EU or Switzerland to the U.S.
Further, in June 2016, the United Kingdom voted to leave the European Union, commonly referred to as “Brexit,” which could also lead to further legislative and regulatory changes. The United Kingdom ceased to be an EU Member State on January 31, 2020, but remains subject to EU law for a transition period ending on December 31, 2020. The UK Data Protection Act that substantially implements the GDPR became law in May 2018 and was further amended to more closely align to GDPR post-Brexit. It remains unclear, however, how United Kingdom data protection laws or regulations will develop in the medium to longer term and how data transfers to and from the United Kingdom will be regulated. In addition, some countries are considering or have enacted legislation requiring local storage and processing of data that could increase the cost and complexity of delivering our services or performing research related to our technology.
.
In 2018, California enacted the California Consumer Privacy Act (“CCPA”), legislation that, among other things, requires covered companies to provide new disclosures to California consumers and affords such consumers new abilities to opt-out of certain sales of personal information. The CCPA has been amended on multiple occasions and is the subject of proposed regulations of the California Attorney General that were released on October 10, 2019. While the CCPA went into effect on
22
January 1, 2020, aspects of the legislation and its interpretation remain unclear at this time. We therefore cannot fully predict the impact of the CCPA on our business or operations, but it may require us to modify our data processing practices and policies and to incur substantial costs and expenses in an effort to comply.
Even the perception of privacy, data protection or information security concerns, whether or not valid, may harm our reputation, inhibit adoption of our products by current and future customers, or adversely impact our ability to hire and retain workforce talent. Our actual or perceived failure to adequately comply with applicable laws and regulations, or to protect personal data and other data we process or maintain, could result in regulatory investigations and enforcement actions against us, fines, penalties and other liabilities, imprisonment of company officials and public censure, claims for damages by customers and other affected individuals, required efforts to mitigate or otherwise respond to incidents, litigation, damage to our reputation and loss of goodwill (both in relation to existing customers and prospective customers), any of which could have a material adverse effect on our operations, financial performance and business.
If we fail to establish and maintain proper and effective internal controls, our ability to produce accurate financial statements on a timely basis could be impaired, which would adversely affect our consolidated operating results, our ability to operate our business and our stock price.
Pursuant to the Sarbanes-Oxley Act of 2002, we are required to maintain internal control over financial reporting and to assess and report on the effectiveness of our internal controls, including the disclosure of any material weaknesses that our management identifies in our internal control over financial reporting.
Our management concluded that our internal control over financial reporting was effective as of December 31, 2019. However, we have in the past had material weaknesses in our internal control over financial reporting, and there are inherent limitations on the effectiveness of internal controls. We do not expect that our internal control over financial reporting will prevent or detect all errors and all fraud. A control system, no matter how well designed and operated, can provide only reasonable, not absolute, assurance that the control system’s objectives will be met; no evaluation of controls can provide absolute assurance that misstatements due to error or fraud will not occur or that all control issues and instances of fraud, if any, within our company will have been detected.
Ensuring that we have adequate internal financial and accounting controls and procedures in place to produce accurate financial statements on a timely basis is a costly and time-consuming effort that needs to be re-evaluated frequently. Any delay or failure on our part to remedy identified material weaknesses or any additional delays or errors in our financial reporting controls or procedures could cause our financial reporting to be unreliable, could have a material adverse effect on our business, results of operations, or financial condition, and could have a substantial adverse impact on the trading price of our common stock.
Investment Risks
Our quarterly revenues and operating results are volatile, and if our future results are below the expectations of public market analysts or investors, the price of our common stock is likely to decline.
Our revenues and operating results are likely to vary significantly from quarter to quarter due to a number of factors, many of which are outside of our control and any of which could cause the price of our common stock to decline.
These factors include:
•the establishment or loss of licensing relationships;
•the timing and recognition of payments under fixed and/or up-front fee license agreements, as well as other multi-element arrangements;
•seasonality in the demand for our technologies or products or our licensees’ products;
•the timing of our expenses, including costs related to litigation, stock-based awards, acquisitions of technologies, or businesses;
•developments in and costs of pursuing or settling any pending litigation;
23
•the timing of introductions and market acceptance of new technologies and products and product enhancements by us, our licensees, our competitors, or their competitors;
•the timing of work performed under development agreements; and
•errors in our licensees’ royalty reports, and corrections and true-ups to royalty payments and royalty rates from prior periods.
Our stock price may fluctuate regardless of our performance.
The stock market has experienced extreme volatility that often has been unrelated or disproportionate to the performance of particular companies. These market fluctuations may cause our stock price to decline regardless of our performance. The market price of our common stock has been, and in the future could be, significantly affected by factors such as: actual or anticipated fluctuations in operating results; announcements of technical innovations; announcements regarding litigation in which we are involved; the acquisition or loss of customers; changes by game console manufacturers to not include touch-enabling capabilities in their products; new products or new contracts; sales or the perception in the market of possible sales of large number of shares of our common stock by insiders or others; stock repurchase activity; changes in securities analysts’ recommendations; personnel changes; changing circumstances regarding competitors or their customers; governmental regulatory action or inaction; developments with respect to patents or proprietary rights; inclusion in or exclusion from various stock indices; increased tariffs and international trade disputes; and general market conditions. In the past, following periods of volatility in the market price of a company’s securities, securities class action litigation has been initiated against that company, which could lead to increased litigation costs and could adversely affect our operating results and our stock price.
Our stock repurchase program could affect our stock price and add volatility.
Any repurchases pursuant to our stock repurchase program could affect our stock price and add volatility. There can be no assurance that any repurchases will continue to be made under the program, nor is there any assurance that a sufficient number of shares of our common stock will be repurchased to satisfy the market’s expectations. Furthermore, there can be no assurance that any repurchases conducted under the plan will be made at the best possible price. The existence of a stock repurchase program could also cause our stock price to be higher than it would be in the absence of such a program and could potentially reduce the market liquidity for our stock. Additionally, we are permitted to and could discontinue our stock repurchase program at any time and any such discontinuation could cause the market price of our stock to decline.
Changes in financial accounting standards or policies may affect our reported financial condition or results of operations and, in certain cases, could cause a decline and/or fluctuation in the price of our common stock.
From time to time, financial and accounting standard setters such as the Financial Accounting Standards Board (“FASB”) and the SEC change their guidance governing the form and content of registrants’ external financial statements or update their previous interpretations with regard to the application of certain General Accepted Accounting Principles (“GAAP”). Such change in GAAP or their interpretation have historically and could in the future have a significant effect on our reported financial condition and/or results of operations. If a change is applicable to us, we would be required to apply the new or revised guidance, which may result in retrospective adjustments to our financial statements and/or could change the way we account for certain transaction compared to under the existing guidance. Changes in GAAP and reporting standards could substantially change our reporting practices in a number of areas, including revenue recognition and recording of assets and liabilities, and could consequently affect our reported financial condition or results of operations.
For example, on January 1, 2018, we adopted Accounting Standard Codification 606, Revenue from Contracts with Customers, (“ASC 606”). The adoption has affected our revenue recognition model for both fixed fee license revenue and per-unit royalty revenue derived from our new and existing contracts with licensees. Under ASC 606, if a fixed fee license agreement contains both performance obligations to transfer rights to our patent portfolio as it exists when the contract is executed as well as rights to our patent portfolio as it evolves throughout the contract term, we are required to allocate the fixed fee between the two performance obligations which could result in the recognition of a substantial majority of the fixed fee as revenue upon the execution of the license agreement. Prior to the adoption, as a historical practice applied by many licensing companies, we recognized fixed license fees ratably over the contract term. In addition, our previous accounting practice was to recognize revenue from per-unit royalty agreements in the period in which the related royalty report was received from our licensees, generally one quarter in arrears from the period in which the underlying sales occurred (i.e. on a “quarter-lag”). Under ASC 606, we are required to record per-unit royalty revenue in the same period in which the licensee’s underlying sales occur. As we generally do not receive the per-unit licensee royalty reports for sales during a given quarter within the time frame
24
that allows us to adequately review the reports and include the actual amounts in our quarterly results for such quarter, we accrue the related revenue based on estimates of our licensees’ underlying sales, subject to certain contractual terms on our ability to estimate such amounts. As a result of accruing per-unit royalty revenue for the quarter based on estimates, adjustments will be required in the following quarter to true up revenue to the actual amounts reported by its licensees. Such changes have significantly affected our reported financial condition and/or results of operations, causing the amount of revenue we recognize to vary dramatically from quarter to quarter, and even year to year, depending on the timing of entry into license agreements and whether such agreements have fixed-fee or per-unit royalty terms. In addition, these reporting practices and the resulting fluctuations in our reported revenue could cause a decline and/or fluctuation in the price of our common stock.
Our business is subject to changing regulations regarding corporate governance and other compliance areas that will increase both our costs and the risk of noncompliance.
As a public company, we are subject to the laws, regulations and reporting requirements of the Exchange Act, the Sarbanes-Oxley Act of 2002, the rules and regulations of the Nasdaq Stock Market, and other regulations that may be enacted from time-to-time. The requirements of these and other rules and regulations have increased, and we expect will continue to increase our legal, accounting and financial compliance costs, will make some activities more difficult, time-consuming and costly, and may also place undue strain on our personnel, systems and resources. In addition, as laws, regulations and standards continue to change, often with varying degrees of specificity and clarity, we could face uncertainty regarding best practices and compliance with such evolving regimes, which could result in higher costs from increased attention paid to disclosure and governance practices and controls.
Provisions in our charter documents and Delaware law could prevent or delay a change in control, which could reduce the market price of our common stock.
Provisions in our certificate of incorporation and bylaws may have the effect of delaying or preventing a change of control or changes in our board of directors or management, including the following:
•our board of directors is classified into three classes of directors with staggered three-year terms which will be phased out over time through 2020;
•only our chairperson of the board of directors, a majority of our board of directors or 10% or greater stockholders are authorized to call a special meeting of stockholders;
•our stockholders can only take action at a meeting of stockholders and not by written consent;
•vacancies on our board of directors can be filled only by our board of directors and not by our stockholders;
•our restated certificate of incorporation authorizes undesignated preferred stock, the terms of which may be established and shares of which may be issued without stockholder approval; and
•advance notice procedures apply for stockholders to nominate candidates for election as directors or to bring matters before an annual meeting of stockholders.
In addition, certain provisions of Delaware law may discourage, delay, or prevent someone from acquiring or merging with us. These provisions could limit the price that investors might be willing to pay in the future for shares.
Item 1B. Unresolved Staff Comments
None.
Item 2. Properties
We lease a facility in San Jose, California of approximately 42,000 square feet, which served as our primary corporate headquarters during 2019 and included most of our sales, marketing, administration, and research and development functions. The lease for the San Jose, California facility expires in April 2023 and we have an option to renew through April 2028.
We lease a facility in Montreal, Quebec, Canada of approximately 10,000 square feet, for our subsidiary, Immersion Canada Corporation. The facility is used for research and development and administration functions. The lease for this property
25
expires in February 2024. During 2019, we transitioned the majority of our research and development functions to our existing office in Montreal, Quebec.
On February 3, 2020, we entered into an agreement to lease approximately 5,000 square feet of office space in San Francisco, California. This lease expires in 2022. We are in the process of transitioning certain of our sales, marketing and administrative functions from our San Jose office to our new San Francisco location and certain of our administrative functions to our existing Montreal office.
We also lease office space in Seocho-gu, Seoul, Korea; Shanghai, China; Tokyo, Japan; Mriehel, Birkirkara, Malta; Dublin, Ireland and temporary office space in San Francisco.
Item 3. Legal Proceedings
Immersion Corporation vs. Samsung Electronics Co., Ltd. and Samsung Electronics America, Inc. (C.A. No. 17-cv-572, 18-cv-55)
On August 3, 2017, we filed a complaint against Samsung Electronics Co., Ltd. and Samsung Electronics America, Inc. (collectively, “Samsung”) in the U.S. District Court for the Eastern District of Texas alleging that certain Samsung touchscreen phones, including those phones that Samsung had not commenced commercially producing, distributing and selling before January 1, 2016 (the “Accused Phones”), infringe certain of our patents that cover haptic feedback systems and methods. In the complaint, we sought to stop Samsung from further infringement as well as the recovery of damages. The complaints asserted
infringement by the Accused Phones of the following patents:
U.S. Patent No 6,429,846 (the ’846 patent): “Haptic Feedback for Touchpads and Other Touch Controls”
U.S. Patent No 7,969,288 (the ’288 patent): “Force Feedback System Including Multi-Tasking Graphical Host Environment and Interface Device”
U.S. Patent No 9,323,332 (the ’332 patent): “Force Feedback System Including Multi-Tasking Graphical Host Environment”
U.S. Patent No 7,982,720 (the ’720 patent): “Haptic Feedback for Touchpads and Other Touch Controls”
U.S. Patent No 8,031,181 (the ’181 patent): “Haptic Feedback for Touchpads and Other Touch Controls”
Samsung filed a response to the Complaint on October 24, 2017.
On December 15, 2017, the Court issued a Docket Control Order setting the claim construction hearing for August 15, 2018 and the first day of jury selection for February 4, 2019. On March 5, 2018, the Court issued an order resetting the first day of jury selection for February 19, 2019.
On March 8, 2018, we filed a complaint against Samsung in the U.S. District Court for the Eastern District of Texas alleging that the Accused Phones infringe U.S. Patent No 8,619,051, entitled “Haptic Feedback System with Stored Effects”, which covers haptic feedback systems and methods. In the complaint, we sought to stop Samsung from further infringement as well as the recovery of damages.
Samsung filed a response to the Complaint on April 20, 2018. On April 27, 2018, Samsung filed a motion to consolidate this case with the previously-filed case that we filed on August 3, 2017. On May 11, 2018, we filed an opposition to the motion to consolidate. On June 8, 2018, the Court granted Samsung’s motion to consolidate this case with the previously-filed case. On July 10, 2018, the Court entered a new scheduling order for the consolidated cases, setting the claim construction hearing for October 9, 2018, and the first day of jury selection for May 6, 2019. On July 24, 2018, we filed an amended complaint in the consolidated cases. On September 4, 2018, the Court moved the first day of jury selection to May 13, 2019. On October 15, 2018, the Court issued its Claim Construction Memorandum and Order. The parties filed motions for summary judgment and to exclude certain expert testimony. The Court ruled on those motions during a pretrial conference held April 22 and 23, 2019 and moved the first day of jury selection, previously scheduled for May 13, 2019 to May 9, 2019. On May 8, 2019, the Court granted the parties’ joint motion for continuance and issued an order continuing the first day of jury selection to May 20, 2019.
On May 12, 2019, the parties entered into a settlement and license agreement. Pursuant to that agreement, on May 15, 2019, the parties filed a joint motion to dismiss the consolidated cases with prejudice. On May 16, 2019, the Court granted the
26
motion and ordered that all claims and counterclaims in consolidated cases 2:17-cv-00572-JRG and 2:17-cv-00055-JRG be dismissed with prejudice, and that each party shall bear its own costs, expenses, and attorneys’ fees.
Samsung Petitions for Inter Partes Review (USPTO)
On August 6, 2018, Samsung filed in the USPTO two petitions for IPR of the ’846 patent (Case Nos. IPR2018-01467 and IPR2018-01468). In each of the IPR petitions, Samsung asserts that certain claims of the ’846 patent are invalid over alleged prior art patents and publications. Immersion filed Patent Owner’s Preliminary Responses in IPR2018-01467 and in IPR2018-01468 on November 21, 2018. On February 20, 2019, the USPTO entered Decisions Granting Institution in Case Nos. IPR2018-01467 and IPR2018-01468, both concerning the ’846 patent. The USPTO also issued Scheduling Orders in both cases. On May 22, 2019, pursuant to the parties’ settlement and license agreement, the parties filed a joint motion to terminate the IPR proceedings. On June 18, 2019, the USPTO granted the motion as to Samsung only and vacated the Scheduling Orders that had been entered earlier. On August 26, 2019, following the termination of the Motorola IPR proceedings, which removed the need to reach a decision on Motorola’s motions for joinder, the USPTO terminated the IPR proceedings.
On August 6, 2018, Samsung filed in the USPTO two petitions for IPR of the ’720 patent (Case Nos. IPR2018-01469 and IPR2018-01470). In each of the IPR petitions, Samsung asserts that certain claims of the ’720 patent are invalid over alleged prior art patents and publications. Immersion filed Patent Owner’s Preliminary Responses in both IPR2018-01469 and IPR2018-01470 on December 10, 2018. On March 7, 2019, the USPTO entered Decisions Granting Institution in Case Nos. IPR2018-01469 and IPR2018-01470, both concerning the ’720 patent. The USPTO also issued Scheduling Orders in both cases. On May 22, 2019, pursuant to the parties’ settlement and license agreement, the parties filed a joint motion to terminate the IPR proceedings. On June 18, 2019, the USPTO granted the motion as to Samsung only and vacated the Scheduling Orders that had been entered earlier. On August 26, 2019, following the termination of the Motorola IPR, which removed the need to reach a decision on Motorola’s motions for joinder, the USPTO terminated the IPR proceedings.
On August 6, 2018, Samsung filed in the USPTO a petition for IPR of the ’288 patent (Case No. IPR2018-01499). In the IPR petition, Samsung asserts that certain claims of the ’288 patent are invalid over alleged prior art patents and publications. Immersion filed a Patent Owner’s Preliminary Response on December 11, 2018. On March 6, 2019, the USPTO entered a Decision Granting Institution in Case No. IPR2018-01499 concerning the ’288 patent. The USPTO also issued a Scheduling Order. On May 22, 2019, pursuant to the parties’ settlement and license agreement, the parties filed a joint motion to terminate the IPR proceedings. On June 18, 2019, the USPTO granted the motion as to Samsung only and vacated the Scheduling Order that had been entered earlier. On August 26, 2019, following the termination of the Motorola IPR proceeding, which removed the need to reach a decision on Motorola’s motions for joinder, the USPTO terminated the IPR proceedings.
On August 6, 2018, Samsung filed in the USPTO two petitions for IPR of the ’181 patent (Case Nos. IPR2018-01500 and IPR2018-01501). In each of the IPR petitions, Samsung asserts that certain claims of the ’181 patent are invalid over alleged prior art patents and publications. Immersion filed Patent Owner’s Preliminary Responses in both IPR2018-01500 and IPR2018-01501 on January 5, 2019.On April 2, 2019, the USPTO entered Decisions Granting Institution in Case Nos. IPR2018-01500 and IPR2018-01501, both concerning the ’181 patent. The USPTO also issued Scheduling Orders in both cases. On June 18, 2019, the USPTO granted the motion as to Samsung only and vacated the Scheduling Orders that had been entered earlier. On August 26, 2019, following the termination of the Motorola IPR proceedings, which removed the need to reach a decision on Motorola’s motions for joinder, the USPTO terminated the IPR proceedings.
On August 6, 2018, Samsung filed in the USPTO a petition for IPR of the ’332 patent (Case No. IPR2018-01502). In the IPR petition, Samsung asserts that certain claims of the ’332 patent are invalid over alleged prior art patents and publications. Immersion filed a Patent Owner’s Preliminary Response on January 5, 2019. On March 29, 2019, the USPTO entered a Decision Granting Institution in Case No. IPR2018-01502 concerning the ’332 patent. The USPTO also issued a Scheduling Order. On May 22, 2019, pursuant to the parties’ settlement and license agreement, the parties filed a joint motion to terminate the IPR proceedings. On June 18, 2019, the USPTO granted the motion as to Samsung only and vacated the Scheduling Order that had been entered earlier. On August 26, 2019, following the termination of the Motorola IPR proceeding, which removed the need to reach a decision on Motorola’s motions for joinder, the USPTO terminated the IPR proceedings.
On March 12, 2019, Samsung filed in the USPTO a petition for IPR of the ’051 patent (Case No. IPR2019-00704). In the IPR petition, Samsung asserts that the claims of the ’051 patent are invalid over alleged prior art patents and publications. On May 23, 2019, pursuant to the parties’ settlement and license agreement, the parties filed a joint motion to terminate the IPR proceedings. On May 30, 2019, the USPTO granted the motion, dismissed Samsung’s petition, and terminated the IPR proceeding.
27
Immersion Corporation vs. Motorola Mobility LLC and Motorola Mobility Holdings LLC
On August 3, 2017, we filed a complaint against Motorola Mobility LLC and Motorola Mobility Holdings LLC (collectively, “Motorola”) in the U.S. District Court for the District of Delaware alleging that certain Motorola touchscreen phones, including the Moto G4, Moto G4 Play, Moto G4 Plus, Moto G5, Moto G5 Plus, Moto Z, Moto Z Force and Moto Z Play (the “Motorola Accused Phones”), infringe certain of our patents that cover haptic feedback systems and methods. In the complaint, we are seeking to stop Motorola from further infringement as well as the recovery of damages. The complaint asserts infringement by the Motorola Accused Phones of the following patents:
U.S. Patent No 6,429,846: “Haptic Feedback for Touchpads and Other Touch Controls”
U.S. Patent No 7,969,288: “Force Feedback System Including Multi-Tasking Graphical Host Environment and Interface Device”
U.S. Patent No 9,323,332: “Force Feedback System Including Multi-Tasking Graphical Host Environment”
U.S. Patent No 7,982,720: “Haptic Feedback for Touchpads and Other Touch Controls”
U.S. Patent No 8,031,181: “Haptic Feedback for Touchpads and Other Touch Controls”
On September 25, 2017, Motorola filed its Answer to the Complaint.
On December 5, 2017, the Court issued a Scheduling Order setting the claim construction hearing for September 12, 2018, and the trial date for September 23, 2019. On November 18, 2018, the Court issued an oral order changing the trial date to October 7, 2019.
On February 5, 2018, the Court entered an order setting a mediation conference for August 7, 2018. The mediation conference was rescheduled to October 8, 2018 at the request of the parties. The mediation conference was conducted on October 8, 2018 as rescheduled but did not result in a settlement. On October 25, 2018, the Court issued its Claim Construction Memorandum and Order.
Opening expert reports were served on February 8, 2019. Rebuttal expert reports were served on March 11, 2019. Reply expert reports were served on April 1, 2019. Expert depositions concluded on April 24, 2019. The parties filed motions for summary judgment and to exclude expert testimony on April 25, 2019.
On April 9, 2019, Motorola filed a motion to stay the litigation pending resolution of the inter partes review proceedings (described below) instituted by the USPTO involving the patents asserted in the Motorola litigation. On April 23, 2019, the Company filed an opposition to that motion. Motorola filed its reply in support of its motion on April 30, 2019. The Court heard Motorola’s motion on May 15, 2019 and suggested that the trial date should be continued to February 10, 2020 and that, if Motorola’s motions to join its inter partes review petitions with Samsung’s petitions were granted, the trial date would be vacated pending final written decisions in the IPR proceedings. The Court entered an order to that effect on June 5, 2019.
On July 31, 2019, the parties entered into a settlement and license agreement. Pursuant to that agreement, on August 12, 2019, the parties filed a joint motion to dismiss the case with prejudice. On August 13, 2019, the Court granted the motion and ordered that all claims and counterclaims in Civil Action No. 1:17-cv-01081-RGA be dismissed with prejudice, and that each party shall bear its own costs, expenses, and attorneys’ fees.
Motorola Petitions for Inter Partes Review (USPTO)
On March 20, 2019, Motorola filed in the USPTO two petitions for IPR of the ’846 patent (Case Nos. IPR2019-00847 and IPR2019-00848). The Motorola petitions are based on Samsung’s petitions in corresponding IPR proceedings (Case Nos. IPR2018-01467 and IPR2018-01468) on the ’846 patent. With the petitions, Motorola moved to join its IPR proceedings with Samsung’s corresponding IPR proceedings. Immersion filed an opposition to Motorola’s joinder motions on April 20, 2019. Immersion filed Patent Owner’s Preliminary Responses in IPR2019-00847 and IPR2019-00848 on June 28, 2019, and the last day for the USPTO to decide whether to institute Motorola’s IPRs of the ’846 patent is September 28, 2019. On July 31, 2019, the parties entered into a settlement and license agreement, in which the parties agreed to withdraw or terminate the IPRs and any associated motion for joinder with Samsung’s corresponding IPR proceedings. On August 19, 2019, the parties filed a joint motion to terminate the IPRs, and on August 26, 2019, the USPTO granted the motion and terminated the IPR proceedings.
28
On March 22, 2019, Motorola filed in the USPTO two petitions for IPR of the ’720 patent (Case Nos. IPR2019-00868 and IPR2019-00869). The Motorola petitions are based on Samsung’s petitions in corresponding IPR proceedings (Case Nos. IPR2018-01469 and IPR2018-01470) on the ’720 patent. With the petitions, Motorola moved to join its IPR proceedings with Samsung’s corresponding IPR proceedings. Immersion filed an opposition to Motorola’s joinder motions on April 22, 2019. Immersion filed Patent Owner’s Preliminary Responses in IPR2019-00868 and IPR2019-00869 on July 9, 2019 and June 28, 2019, respectively, and the last day for the USPTO to decide whether to institute Motorola’s IPRs of the ’720 patent is October 9, 2019 and September 28, 2019, respectively. On July 31, 2019, the parties entered into a settlement and license agreement, in which the parties agreed to withdraw or terminate the IPRs and any associated motion for joinder with Samsung’s corresponding IPR proceedings. On August 19, 2019, the parties filed a joint motion to terminate the IPRs, and on August 26, 2019, the USPTO granted the motion and terminated the IPR proceedings.
On March 22, 2019, Motorola filed in the USPTO a petition for IPR of the ’288 patent (Case No. IPR2019-00870). The Motorola petition is based on Samsung’s petition in corresponding IPR proceeding (Case No. IPR2018-01499) on the ’288 patent. With the petition, Motorola moved to join its IPR proceeding with Samsung’s corresponding IPR proceeding. Immersion filed an opposition to Motorola’s joinder motion on April 22, 2019. Immersion filed Patent Owner’s Preliminary Response in IPR2019-00870 on July 9, 2019, and the last day for the USPTO to decide whether to institute Motorola’s IPR of the ’288 patent is October 9, 2019. On July 31, 2019, the parties entered into a settlement and license agreement, in which the parties agreed to withdraw or terminate the IPRs and any associated motion for joinder with Samsung’s corresponding IPR proceedings. On August 19, 2019, the parties filed a joint motion to terminate the IPR, and on August 26, 2019, the USPTO granted the motion and terminated the IPR proceedings.
On April 4, 2019, Motorola filed in the USPTO two petitions for IPR of the ’181 patent (Case Nos. IPR2019-00920 and IPR2019-00921). The Motorola petitions are based on Samsung’s petitions in corresponding IPR proceedings (Case Nos. IPR2018-01500 and IPR2018-01501) on the ’181 patent. With the petitions, Motorola moved to join its IPR proceedings with Samsung’s corresponding IPR proceedings. Immersion filed an opposition to Motorola’s joinder motions on May 3, 2019. Immersion may file Patent Owner’s Preliminary Responses in IPR2019-00920 and IPR2019-00921 on July 18, 2019, and the last day for the USPTO to decide whether to institute Motorola’s IPRs of the ’181 patent is October 18, 2019. On July 31, 2019, the parties entered into a settlement and license agreement, in which the parties agreed to withdraw or terminate the IPRs and any associated motion for joinder with Samsung’s corresponding IPR proceedings. On August 19, 2019, the parties filed a joint motion to terminate the IPRs, and on August 26, 2019, the USPTO granted the motion and terminated the IPR proceedings.
On April 4, 2019, Motorola filed in the USPTO a petition for IPR of the ’332 patent (Case No. IPR2019-00922). The Motorola petition is based on Samsung’s petition in corresponding IPR proceeding (Case No. IPR2018-01502) on the ’332 patent. With the petition, Motorola moved to join its IPR proceeding with Samsung’s corresponding IPR proceeding. Immersion filed an opposition to Motorola’s joinder motion on May 3, 2019. Immersion filed a Patent Owner’s Preliminary Response in IPR2019-00922 on July 9, 2019, and the last day for the USPTO to decide whether to institute Motorola’s IPRs of the ’332 patent is October 9, 2019. On July 31, 2019, the parties entered into a settlement and license agreement, in which the parties agreed to withdraw or terminate the IPRs and any associated motion for joinder with Samsung’s corresponding IPR proceedings. On August 19, 2019, the parties filed a joint motion to terminate the IPR, and on August 26, 2019, the USPTO granted the motion and terminated the IPR proceedings.
Samsung Electronics Co. v. Immersion Corporation and Immersion Software Ireland Limited
On April 28, 2017, we received a letter from Samsung requesting that we reimburse Samsung with respect to withholding tax and penalties imposed on Samsung by the Korean tax authorities following an investigation where the tax authority determined that Samsung failed to withhold taxes on Samsung’s royalty payments to Immersion Software Ireland from 2012 to 2016. On July 12, 2017, on behalf of Samsung, we filed an appeal with the Korea Tax Tribunal regarding their findings with respect to the withholding taxes and penalties. On October 18, 2018, the Korea Tax Tribunal held a hearing and on November 19, 2018, the Korea Tax Tribunal issued its ruling in which it decided not to accept Immersion’s arguments with respect to the Korean tax authorities’ assessment of withholding tax and penalties imposed on Samsung. On behalf of Samsung, we filed an appeal with the Korea Administrative Court on February 15, 2019. The first hearing was scheduled for June 27, 2019. The first hearing occurred on June 27, 2019. A second hearing occurred on August 29, 2019. A third hearing occurred on October 31, 2019. A fourth hearing occurred December 19, 2019. A fifth hearing is scheduled for April 2, 2020.
On September 29, 2017, Samsung filed an arbitration demand with the International Chamber of Commerce against us demanding that we reimburse Samsung for the imposed tax and penalties that Samsung paid to the Korean tax authorities. Samsung is requesting that we pay Samsung the amount of KRW 7,841,324,165 (approximately $6.9 million) plus interest from and after May 2, 2017, plus the cost of the arbitration including legal fees. We deny liability and asked the International Chamber of Commerce to postpone the arbitration until the tax appeal is resolved. The arbitration panel conducted an initial
29
status conference on February 7, 2018. The International Chamber of Commerce denied our motion to postpone the arbitration, and on March 2, 2018, issued a Procedural Order setting the hearing date for July 23, 2018. We filed our Statement of Defense and Counterclaim on April 16, 2018. A short discovery phase followed, and each side produced documents in May. Samsung filed its Reply to our Statement of Defense on June 11, 2018, and we filed our Reply on June 25, 2018. The evidentiary hearing took place in Hawaii July 23-24, 2018. The parties submitted supplemental legal authorities on August 8, 2018 and submitted cost submissions on October 15, 2018. On August 15, 2018, the Secretariat of the International Court of Arbitration of the International Chamber of Commerce extended the time for rendering the final award until October 31, 2018. On October 31, 2018, the Secretariat of the International Court of Arbitration of the International Chamber of Commerce again extended the time for rendering the final award until November 30, 2018. On November 8, 2018, the Secretariat of the International Court of Arbitration of the International Chamber of Commerce again extended the time for rendering the final award until December 31, 2018. On December 6, 2018, the Secretariat of the International Court of Arbitration of the International Chamber of Commerce again extended the time for rendering the final award until January 31, 2019. On January 8, 2019, the Secretariat of the International Court of Arbitration of the International Chamber of Commerce informed us that it had received on that day a draft award submitted by the arbitration tribunal and that it would scrutinize the draft at one of its next sessions. On January 31, 2019, the International Chamber of Commerce reported to the parties that it had approved the draft award submitted by the arbitral tribunal, and would notify the award to the parties once the arbitral tribunal has considered the Court’s comments, finalized the award and signed it. Also on January 31, 2019, the Secretariat of the International Chamber of Commerce again extended the time for rendering the final award until February 28, 2019. On March 27, 2019, we received the final award. The award ordered Immersion to pay Samsung KRW 7,841,324,165 (approximately $6.9 million as of March 31, 2019), which we paid on April 22, 2019, denied Samsung’s claim for interest from and after May 2, 2017; and ordered Immersion to pay Samsung’s cost of the arbitration in the amount of approximately $871,454.
The Company believes that there are valid defenses to all of the claims from the Korean tax authorities. The Company intends to vigorously defend against the claims from the Korean tax authorities. The Company expects to be reimbursed by Samsung to the extent the Company ultimately prevails in the appeal in the Korean courts. At March 31, 2019, $6.9 million was recorded as a deposit included in Other assets on the Company's Consolidated Balance Sheets. In the event that the Company does not ultimately prevail in its appeal in the Korean courts, the deposit included in Other assets would be recorded as additional income tax expense on the Company's Consolidated Statement of Operations and Comprehensive Income (Loss), in the period in which the Company does not ultimately prevail.
Immersion Corporation vs. Samsung (China) Investment Co., Ltd., Huizhou Samsung Electronics Co., Ltd and Fujian Province Min Xin Household Electrical Appliances Technology Service Co., Ltd. (Fuzhou Intellectual Property Court - Case: Min 01 Min Chu No. 342 (2018))
On March 8, 2018, we filed a complaint against Samsung (China) Investment Co., Ltd. (“Samsung China”), Huizhou Samsung Electronics Co., Ltd. (“Samsung Huizhou”) (together with Samsung China, “Samsung”), and Fujian Province Min Xin Household Electrical Appliances Technology Service Co., Ltd. in the Fuzhou Intermediate Court in Fuzhou, China alleging that certain Samsung touchscreen phones, including the Galaxy S8, S8+, and Note8, infringe three Immersion Chinese patents. The three patents at issue, covering haptic feedback systems and methods in electronic devices, are Chinese Patent No. ZL02821854.X, entitled “Method and Apparatus for Providing Tactile Feedback Sensations”; Chinese Patent No. ZL201210005785.2, entitled “Method and Apparatus for Providing Tactile Feedback Sensations”; and Chinese Patent No. ZL201310253562.2, entitled “Method and Apparatus for Providing Tactile Feedback Sensations”. Immersion’s complaint seeks to stop defendants from using patented methods during manufacturing; to stop defendants from manufacturing, offering to sell, selling, or jointly selling infringing products; as well as the recovery of damages. The Fuzhou Intellectual Property Court accepted the case on March 8, 2018. Samsung China filed a jurisdictional objection on April 10, 2018 in which it asked the court to move the case to Beijing IP court. Samsung Huizhou filed a jurisdictional objection on April 10, 2018 in which it asked the court to move the case to Guangzhou IP court. On May 8, 2018, the court rejected both jurisdictional objections. Samsung Huizhou and Samsung China appealed and the pretrial conference originally scheduled for June 14-15, 2018 was postponed pending a ruling from the Fujian High Court. On September 20, 2018 the Fujian High Court rejected the jurisdictional objection appeals. Samsung China and Samsung Huizhou filed Petitions for Invalidation on April 16, 2018 with the Chinese Patent Office (“SIPO”) for all three patents. Samsung China and Samsung Huizhou supplemented their petitions in May, and we responded on June 1, 2018. A hearing on the petition for Chinese Patent No. ZL02821854.X occurred on July 18, 2018. Hearings on the petitions for Chinese Patent No. ZL201210005785.2 and Chinese Patent No. ZL201310253562.2 occurred on September 28, 2018. Trial was originally scheduled for November 12, and 14, 2018; the Fuzhou Intellectual Property Court granted Immersion's request to postpone trial but did not set revised dates. The Company and Samsung each submitted evidence for use at trial on or before October 26, 2018. The Patent Reexamination Board of SIPO issued invalidation decisions against Chinese Patent No. ZL02821854.X on November 21, 2018, against Chinese Patent No. ZL201310253562.2 on November 14, 2018, and against Chinese Patent No. ZL201210005785.2 on November 15, 2018, declaring all three Chinese patents invalid. The Company filed an application to withdraw its complaint from the Fuzhou
30
Intermediate Court on December 10, 2018 and received the ruling that allows Immersion to withdraw the case from the Fuzhou Intermediate Court on December 29, 2018. The Company pre-registered the appeals against the invalidation decisions with the Beijing IP Court on February 14, 2019. On April 28, 2019, the Company filed the appeal against the invalidation decisions with the Beijing IP court. On June 6, 2019, SIPO responded to the Company’s filing of the appeal with its counterarguments to the arguments set forth in our appeal filing. No hearings have yet been scheduled.
Immersion Corporation vs. Samsung Electronics GmbH
On February 25, 2019, we filed a patent infringement lawsuit against Samsung Electronics GmbH in Mannheim District Court in Germany alleging that certain Samsung touchscreen phones infringe German Patent 602008058897.1 (EP Patent 2463752), a counterpart of U.S. Patent No. 8,619,051, “Haptic Feedback System with Stored Effects,” which patent is being asserted against Samsung Electronics America, Inc. and Samsung Electronics Co., Ltd. and was previously asserted against Apple, Inc. In the complaint, we are seeking injunctive relief, a claim for accounting, declaratory judgment on liability for damages and additional remedies such as destruction and costs.
By order dated March 11, 2019, the Mannheim District Court scheduled a hearing on the merits for December 3, 2019. With such order, the court also ordered Samsung Electronics GmbH to announce a counsel of record and to file an answer to the complaint within 8 weeks of receiving service of such order. Samsung requested a four week extension of the deadline to file their answer which was granted by the Court on April 30, 2019. On May 12, 2019, the parties entered into a settlement and license agreement. Pursuant to that agreement, on May14, 2019, Immersion filed to withdraw its action against Samsung. By order dated May 24, 2019, the Mannheim District Court confirmed that the action was withdrawn.
We cannot predict the ultimate outcome of the above-mentioned actions, and we are unable to estimate any potential liability we may incur. Please also refer to our disclosures in Contingencies, Note 12 to the Consolidated Financial Statements.
Item 4. Mine Safety Disclosures
Not applicable.
31
PART II
Item 5. Market for Registrant’s Common Equity, Related Stockholder Matters and Issuer Purchases of Equity Securities
Market Information, Holders of Record and Dividends
Our common stock is traded on the Nasdaq Global Market under the symbol “IMMR”.
As of February 28, 2020, there were 70 holders of record of our common stock.
We do not anticipate paying cash dividends in the foreseeable future.
Unregistered Sales of Securities
During the period covered by this Annual Report on Form 10-K, we have not sold any equity securities that were not registered under the Securities Act of 1933, as amended.
Purchases of Equity Securities
On November 1, 2007, the Company announced its Board authorized the repurchase of up to $50 million of the Company’s common stock. In addition, on October 22, 2014, the Board authorized another $30 million under the share repurchase program. The Company may repurchase its stock for cash in the open market in accordance with applicable securities laws. The timing and amount of any stock repurchase will depend on share price, corporate and regulatory requirements, economic and market conditions, and other factors. The stock repurchase authorization has no expiration date, does not require the Company to repurchase a specific number of shares, and may be modified, suspended, or discontinued at any time.
In December 2019, we purchased 387,309 shares of our common stock for $2.7 million at the average cost of $7.08 per share, as such term is defined in Rule 10b-18(a)(3) under the Securities Exchange Act of 1934, as amended. As of December 31, 2019, the program has approximately $30.6 million available for future purchase.
Company Stock Performance Graph
The information contained in the Performance Graph shall not be deemed to be “soliciting material” or “filed” with the SEC or subject to the liabilities of Section 18 of the Exchange Act, as amended, except to the extent that we specifically incorporate it by reference into a document filed under the Securities Act, as amended, or the Exchange Act.
The graph below depicts a five-year comparison of cumulative total shareholder returns for Immersion common stock, the NASDAQ Composite Index, and the RDG Technology Composite Index. The graph assumes an investment of $100 for the five-year period commencing on December 31, 2014 and ending on December 31, 2019, in Immersion’s common stock, and in the NASDAQ Composite and the RDG Technology Composite indices, and reinvestment of dividends, if any.
The comparison below is based on historical data, and Immersion cautions that the stock price performance shown in the graph is not indicative of, nor intended to forecast, the potential future performance of Immersion’s common stock. Information used in the graph was obtained from a source believed to be reliable, but Immersion is not responsible for any errors or omissions in such information.
32
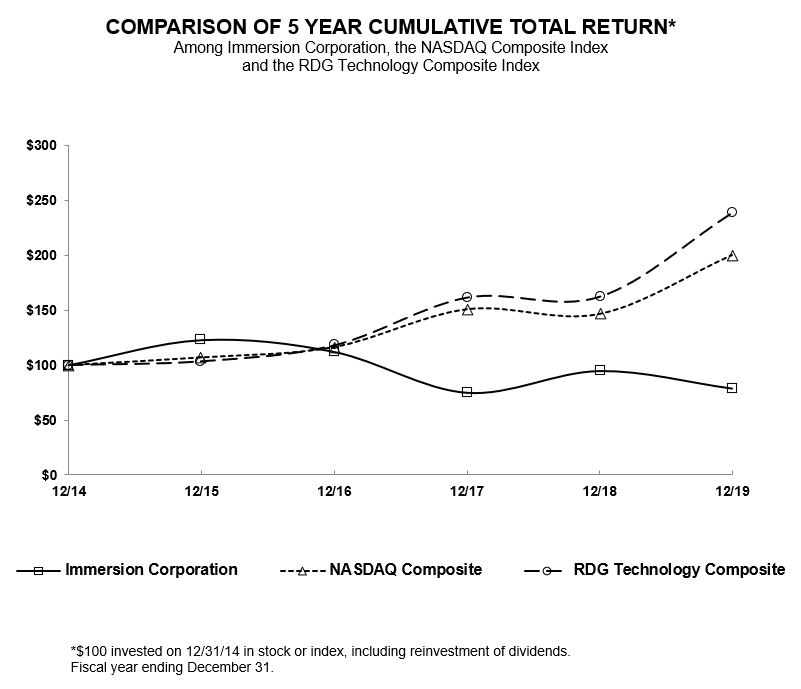
December 31, | |||||||||||||||||||||||
2014 | 2015 | 2016 | 2017 | 2018 | 2019 | ||||||||||||||||||
Immersion Corporation | $ | 100 | $ | 123 | $ | 112 | $ | 75 | $ | 95 | $ | 78 | |||||||||||
NASDAQ Composite | 100 | 107 | 116 | 151 | 147 | 200 | |||||||||||||||||
RDG Technology Composite | 100 | 103 | 118 | 162 | 162 | 239 | |||||||||||||||||
33
Item 6. Selected Financial Data
The following selected consolidated financial data is qualified in its entirety by, and should be read in conjunction with Item 7 Management’s Discussion and Analysis of Financial Condition and Results of Operations and the consolidated financial statements and notes thereto included elsewhere in this Annual Report on Form 10-K. The selected consolidated statement of operations data for each of the years ended December 31, 2019, 2018, and 2017 and the consolidated balance sheet data as of December 31, 2019 and 2018 are derived from our audited consolidated financial statements and accompanying notes, included in this Annual Report on Form 10-K. The selected consolidated statement of operations data for each of the years ended December 31, 2016 and 2015 and the consolidated balance sheet data as of December 31, 2017, 2016 and 2015 are derived from our audited consolidated financial statements which are not included in this Annual Report on Form 10-K. Effective January 1, 2018, we adopted ASC 606 using the modified retrospective transaction method. As a result, adjustments were recorded to certain line items on our financial statements as of January 1, 2018, and the financial data as of and for the year ended December 31, 2018 presented in the tables below were prepared in accordance with ASC 606. The financial data for the other years in the tables below (other than 2018) were as originally reported under the previous revenue standard ASC 605. The adoption had a material impact on our reported revenue recognition for which disclosure has been made within Note 2 Revenue Recognition of the consolidated financial statements included in this Annual Report on Form 10-K.
Selected consolidated statement of operations and the consolidated balance sheet data for the years ended December 31, 2019, 2018, 2017, 2016 and 2015 are as follows (in thousands, except for per share data):
Years Ended December 31, | |||||||||||||||||||
2019 | 2018 | 2017 | 2016 | 2015 | |||||||||||||||
CONSOLIDATED STATEMENTS OF OPERATIONS DATA: | |||||||||||||||||||
Revenues | $ | 35,953 | $ | 110,979 | $ | 35,013 | $ | 57,086 | $ | 63,393 | |||||||||
Costs and expenses | 57,404 | 57,878 | 80,435 | 72,349 | 58,674 | ||||||||||||||
Operating income (loss) | (21,451 | ) | 53,101 | (45,422 | ) | (15,263 | ) | 4,719 | |||||||||||
Income tax provision from continuing operations | (471 | ) | (392 | ) | (480 | ) | (25,521 | ) | (1,591 | ) | |||||||||
Income (loss) from continuing operations | (20,044 | ) | 54,343 | (45,291 | ) | (40,030 | ) | 2,858 | |||||||||||
Income from discontinued operations | — | — | — | 649 | — | ||||||||||||||
Net income (loss) | $ | (20,044 | ) | $ | 54,343 | $ | (45,291 | ) | $ | (39,381 | ) | $ | 2,858 | ||||||
Basic net income (loss) per share: | |||||||||||||||||||
Continuing operations | $ | (0.64 | ) | $ | 1.78 | $ | (1.55 | ) | $ | (1.39 | ) | $ | 0.10 | ||||||
Discontinued operations | — | — | — | 0.02 | — | ||||||||||||||
Basic net income (loss) per share | $ | (0.64 | ) | $ | 1.78 | $ | (1.55 | ) | $ | (1.37 | ) | $ | 0.10 | ||||||
Shares used in calculating basic net income (loss) per share | 31,529 | 30,459 | 29,179 | 28,759 | 28,097 | ||||||||||||||
Diluted net income (loss) per share: | |||||||||||||||||||
Continuing operations | $ | (0.64 | ) | $ | 1.73 | $ | (1.55 | ) | $ | (1.39 | ) | $ | 0.10 | ||||||
Discontinued operations | — | — | — | 0.02 | — | ||||||||||||||
Diluted net income (loss) per share | $ | (0.64 | ) | $ | 1.73 | $ | (1.55 | ) | $ | (1.37 | ) | $ | 0.10 | ||||||
Shares used in calculating diluted net income (loss) per share | 31,529 | 31,407 | 29,179 | 28,759 | 29,015 | ||||||||||||||
CONSOLIDATED BALANCE SHEET DATA: | |||||||||||||||||||
As of December 31, | |||||||||||||||||||
2019 | 2018 | 2017 | 2016 | 2015 | |||||||||||||||
Cash, cash equivalents, and short-term investments | $ | 89,497 | $ | 124,918 | $ | 46,538 | $ | 89,772 | $ | 64,931 | |||||||||
Working capital | 95,137 | 120,480 | 28,980 | 73,008 | 53,749 | ||||||||||||||
Total assets | 124,848 | 145,995 | 51,975 | 103,767 | 105,415 | ||||||||||||||
Total stockholders’ equity | 83,757 | 99,660 | 9,657 | 55,340 | 86,615 | ||||||||||||||
34
Item 7. Management’s Discussion and Analysis of Financial Condition and Results of Operations
The following discussion should be read in conjunction with the consolidated financial statements and notes thereto.
This Management’s Discussion and Analysis of Financial Condition and Results of Operations includes forward-looking statements within the meaning of Section 27A of the Securities Act, as amended, and Section 21E of the Securities Exchange Act of 1934, as amended (the “Exchange Act”). The forward-looking statements involve risks and uncertainties. Forward-looking statements are identified by words such as “anticipates”, “believes”, “expects”, “intends”, ““may”, “will”, “places”, and other similar expressions. However, these words are not the only way we identify forward-looking statements. In addition, any statements, which refer to expectations, projections, or other characterizations of future events or circumstances, are forward-looking statements. Actual results could differ materially from those projected in the forward-looking statements as a result of a number of factors, including those set forth below in “Management's Discussion and Analysis of Financial Conditions and Results of Operations” and in Item 1A, “Risk Factors”, those described elsewhere in this report, and those described in our other reports filed with the SEC. We caution you not to place undue reliance on these forward-looking statements, which speak only as of the date of this report, and we undertake no obligation to update these forward-looking statements after the filing of this report.
You are urged to review carefully and consider our various disclosures in this report and in our other reports publicly disclosed or filed with the SEC that attempt to advise you of the risks and factors that may affect our business.
Critical Accounting Policies and Estimates
Our discussion and analysis of our financial condition and results of operations are based upon our consolidated financial statements, which have been prepared in accordance with U.S. GAAP. The preparation of these consolidated financial statements requires management to make estimates and assumptions that affect the reported amounts of assets, liabilities, revenues, expenses, and related disclosure of contingent assets and liabilities. On an ongoing basis, we evaluate our estimates and assumptions, including those related to revenue recognition, stock-based compensation, short-term investments, leases, income taxes and contingencies. We base our estimates and assumptions on historical experience and on various other factors that we believe to be reasonable under the circumstances, the results of which form the basis for making judgments about the carrying values of assets and liabilities that are not readily apparent from other sources. Actual results may differ from these estimates and assumptions.
We believe the following are our most critical accounting policies as they require our significant judgments and estimates in the preparation of our consolidated financial statements:
Revenue Recognition
Our revenue is primarily derived from fixed fee license agreements and per-unit royalty agreements, along with less significant revenue earned from development, services and other revenue. On January 1, 2018, we adopted ASC 606 using the modified retrospective transition method. The new revenue standard has been applied to all contracts that were not completed as of the date of adoption. Revenues for the year ended December 31, 2019 and 2018 have been recognized in accordance with ASC 606 while revenues for the year ended December 31, 2017 have been recognized in accordance with ASC 605.
Fixed fee license revenue
We recognize revenue from a fixed fee license agreement when we have satisfied our performance obligations, which typically occurs upon the transfer of rights to our technology upon the execution of the license agreement. However, in certain contracts, we grant a license to our existing patent portfolio at the inception of the license agreement as well as rights to the portfolio as it evolves throughout the contract term. For such arrangements, we have concluded that it has two separate performance obligations:
• | Performance Obligation A - Transfer rights to our patent portfolio as it exists when the contract is executed; |
•Performance Obligation B - Transfer rights to our patent portfolio as it evolves over the term of the contract, including access to new patent applications that the licensee can benefit from over the term of the contract.
If a fixed fee license agreement contains only Performance Obligation A, we will recognize most or all of the revenue from the agreement at the inception of the contract. For fixed fee license agreements that contain both Performance Obligation A and B, we will be required to allocate the transaction price based on the standalone price for each of the two performance obligations. We have developed a process, and established internal controls around such process, to estimate standalone prices related to Performance Obligation A and B using a number of factors primarily related to the attributes of our patent portfolio. Once the transaction price is allocated, the portion of the transaction price allocable to Performance Obligation A will be recognized in the quarter the license agreement is signed and the customer can benefit from rights provided in the contract, and the portion allocable to Performance Obligation B will be recognized on a straight-line basis over the contract term. For such
35
contracts, a contract liability account will be established and included within “deferred revenue” on the consolidated balance sheet. As the rights and obligations in a contract are interdependent, contract assets and contract liabilities that arise in the same contract have been presented on a net basis.
Historically, certain of our license agreements contained fixed fees related to past infringements for which the fixed fees were recognized as revenue or recorded as a deduction to its operating expense in the quarter the license agreement was signed. After the adoption of ASC 606, we recognize revenue from such fixed fees related to past infringements in the same manner in the quarter the license agreement is signed.
Payments for fixed fee license contracts typically are due in full within 30 to 45 days from execution of the contract. From time to time, we enter into a fixed fee license contracts with payments due in a number of installments payable throughout the contract term. In such cases, we determine if a significant financing component exists and if it does, we will recognize more or less revenue and corresponding interest expense or income, as appropriate.
Per-unit Royalty revenue
ASC 606 requires an entity to record per-unit royalty revenue in the same period in which the licensee’s underlying sales occur. As we generally do not receive the per-unit licensee royalty reports for sales during a given quarter within the time frame that allows us to adequately review the reports and include the actual amounts in our quarterly results for such quarter, we accrue the related revenue based on estimates of our licensees’ underlying sales, subject to certain constraints on our ability to estimate such amounts. Our estimates are developed based on a combination of available data including, but not limited to, approved customer forecasts, a lookback at historical royalty reporting for each of its customers, and industry information available for the licensed products.
As a result of accruing per-unit royalty revenue for the quarter based on such estimates, adjustments will be required in the following quarter to true up revenue to the actual amounts reported by its licensees. The true-ups represent the difference between per-unit royalty based on actual sales reported by our licensees in a quarter-lag, and the estimate of per-unit royalty that was reported in the same quarter the underlying sales occurred.
Certain of our per-unit royalty agreements contains a minimum royalty provision which sets forth minimum amounts to be received by us during the contract term. Under ASC 606, minimum royalties are considered a fixed transaction price to which we will have an unconditional right once all other performance obligations are satisfied. Therefore, we recognize all minimum royalties as revenue at the inception of the license agreement, or in the period in which all remaining revenue recognition criteria have been met. We will establish contract assets for the unbilled minimum royalties on a contract basis. Such contract asset balance will be reduced by the actual royalties reported by the licensee during the contract term until fully utilized, after which point any excess per-unit royalties reported will be recognized as revenue. As the rights and obligations in a contract are interdependent, contract assets and contract liabilities that arise in the same contract have been presented on a net basis.
Payments of per-unit royalties typically are due within 30 to 60 days from the end of the calendar quarter in which the underlying sales took place.
Development, services, and other revenue
As a performance obligation related to our development, service and other revenue is satisfied over a period of time, such revenue is recognized evenly over the period of performance obligation, which is generally consistent with the contractual term.
Stock-based Compensation
Stock-based compensation cost is measured at the grant date based on the fair value of the award and is recognized as expense on a straight-line basis over the requisite service period, which is the vesting period.
Valuation and amortization methods — We use the Black-Scholes-Merton option pricing model, single-option approach to determine the fair value of standard stock options and Employee Stock Purchase Plan (“ESPP”) shares. All share-based payment awards are amortized on a straight-line basis over the requisite service periods of the awards, which are generally the vesting periods. Stock-based compensation expense recognized at fair value includes the impact of estimated forfeitures. We estimate future forfeitures at the date of grant and revise the estimates if necessary, in subsequent periods if actual forfeitures differ from these estimates. The determination of the fair value of stock-based payment awards on the date of grant using an option-pricing model is affected by our stock price as well as other business assumptions. These variables include actual and projected employee stock option exercise behaviors that impact the expected term, our expected stock price volatility over the term of the awards, risk-free interest rate, and expected dividends.
We use the Monte-Carlo Simulation model to value our stock options with a market condition. Valuation techniques such as the Monte-Carlo Simulation model have been developed to value path-dependent awards. The Monte-Carlo Simulation model is a generally accepted statistical technique used, in this instance, to simulate a range of our future stock prices.
36
If factors change and we employ different assumptions for estimating stock-based compensation expense in future periods, or if we decide to use a different valuation model, the future periods may differ significantly from what we have recorded in the current period and could materially affect our operating results.
Accounting for Income Taxes
We use the asset and liability method of accounting for income taxes as prescribed in ASC 740, Income Taxes. Under this method, income tax expense is recognized for the amount of taxes payable or refundable for the current year. In addition, deferred tax assets and liabilities are recognized for the expected future tax consequences of temporary differences between the carrying amounts of assets and liabilities for financial reporting purposes and the amounts used for income tax purposes, tax losses, and credit carryforwards. This method requires a reduction of the carrying amounts of deferred tax assets by a valuation allowance if, based on available evidence, it is more likely than not that such assets will not be realized. Accordingly, the need to establish valuation allowances for deferred tax assets is assessed periodically based on the ASC 740 more-likely-than-not realization (“MLTN”) threshold criterion. This assessment considers matters such as future reversals of existing taxable temporary differences, projected future taxable income, tax-planning strategies, and results of recent operations. The evaluation of the recoverability of the deferred tax assets requires that the Company weigh all positive and negative evidence to reach a conclusion that it is more likely than not that all or some portion of the deferred tax assets will not be realized. The weight given to the evidence is commensurate with the extent to which it can be objectively verified.
Our judgments, assumptions, and estimates relative to the current provision for income tax take into account current tax laws including the 2017 Tax Cuts and Jobs Act (the “Tax Act”), our interpretation of current tax laws, and possible outcomes of current and future audits conducted by foreign and domestic tax authorities. We have established reserves for income taxes to address potential exposures involving tax positions that could be challenged by tax authorities. Although we believe our judgments, assumptions, and estimates are reasonable, changes in tax laws or our interpretation of tax laws and any future tax audits could significantly impact the amounts provided for income taxes in our consolidated financial statements.
Our assumptions, judgments, and estimates relative to the value of a deferred tax asset take into account predictions of the amount and category of future taxable income, such as income from operations or capital gains income. Actual operating results and the underlying amount and category of income in future years could render inaccurate our current assumptions, judgments, and estimates of recoverable net deferred tax assets. Any of the assumptions, judgments, and estimates mentioned above could cause our actual income tax obligations to differ from our estimates, thus materially impacting our financial position and results of operations.
We are a U.S.-based multinational company subject to tax in multiple U.S. and foreign tax jurisdictions. Certain portions of our foreign earnings for the current fiscal year were earned by our Irish subsidiaries. In addition to providing for U.S. income taxes on earnings from the United States, we provide for U.S. income taxes on the earnings of foreign subsidiaries unless the subsidiaries’ earnings are considered permanently reinvested outside the United States. Our income tax rate depends in part on the extent to which our foreign earnings may be taxed by the U.S. through new provisions under the Tax Act such as the new Global Intangible Low-Taxed Income (“GILTI”) tax or as a result of our indefinite reinvestment assertion. Indefinite reinvestment is determined by management’s judgment about and intentions concerning our future operations.
Unanticipated changes in our tax rates could affect our future results of operations. Our future effective tax rates could be unfavorably affected by changes in the tax rates in jurisdictions where our income is earned, by changes in, our estimates related to, or our interpretation of, tax rules and regulations in the jurisdictions in which we do business, by unanticipated decreases in the amount of earnings in countries with low statutory tax rates, or by changes in the valuation of our deferred tax assets and liabilities. Countries in the European Union and other countries where we do business have been considering changes in relevant tax, accounting and other laws, regulations and interpretations, including changes to tax laws applicable to corporate multinationals. We began a reorganization of our corporate organization in 2019 in order to address changing international tax laws.
See Note 8 Income Taxes of the Notes to Consolidated Financial Statements for further information concerning income taxes.
37
Results of Operations
Overview of 2019
Total revenues for 2019 were $36.0 million, a decrease of $75.0 million, or 68%, versus 2018. The decrease was primarily driven by the $70.9 million decrease in fixed fee license revenue and the $4.0 million decrease in per-unit royalty revenue.
For 2019, we had a net loss of $20.0 million as compared to $54.3 million of net income for 2018. The $74.4 million decrease in net income was mainly related to the $75.0 million decrease in total revenue partially offset by a $0.5 million decrease in cost and operating expenses for 2019 compared to 2018.
We adopted ASC 606, effective January 1, 2018. Consistent with the modified retrospective transaction method, our results of operations for periods prior to the adoption of ASC 606 remain unchanged. As a result, the change in total revenues from 2018 to 2019 included a component of accounting policy change arising from the adoption of ASC 606.
The following table sets forth our consolidated statements of income data as a percentage of total revenues:
Years Ended December 31, | ||||||||
2019 | 2018 | 2017 | ||||||
Revenues: | ||||||||
Fixed fee license revenue | 35.1 | % | 75.3 | % | 36.0 | % | ||
Per-unit royalty revenue | 64.0 | 24.3 | 61.4 | |||||
Total royalty and license revenue | 99.1 | 99.6 | 97.4 | |||||
Development, services, and other | 0.9 | 0.4 | 2.6 | |||||
Total revenues | 100.0 | 100.0 | 100.0 | |||||
Costs and expenses: | ||||||||
Cost of revenues | 0.5 | 0.2 | 0.6 | |||||
Sales and marketing | 17.9 | 5.5 | 38.6 | |||||
Research and development | 21.8 | 8.8 | 33.6 | |||||
General and administrative | 119.4 | 37.7 | 152.4 | |||||
Restructuring costs | — | — | 4.6 | |||||
Total costs and expenses | 159.6 | 52.2 | 229.8 | |||||
Operating income (loss) | (59.6 | ) | 47.8 | (129.8 | ) | |||
Interest and other income | 5.0 | 1.7 | 1.0 | |||||
Other expense | 0.2 | (0.2 | ) | 0.9 | ||||
Income (loss) before provision for income taxes | (54.4 | ) | 49.3 | (127.9 | ) | |||
Provision for income taxes | (1.3 | ) | (0.4 | ) | (1.4 | ) | ||
Net income (loss) | (55.7 | )% | 48.9 | % | (129.3 | )% | ||
38
Revenues
Our revenue is primarily derived from fixed fee license agreements and per-unit royalty agreements, along with less significant revenue earned from development, services and other revenue. Royalty and license revenue is composed of per unit royalties earned based on usage or net sales by licensees and fixed payment license fees charged for our IP and software. A revenue summary for the years ended December 31, 2019, 2018 and 2017 are as follows (in thousands, except for percentages):
Change | Change | ||||||||||||||||||||||||
2019 | Amount | % | 2018 | Amount | % | 2017 | |||||||||||||||||||
Fixed fee license revenue | $ | 12,627 | $ | (70,946 | ) | (85 | )% | $ | 83,573 | $ | 70,998 | 565 | % | $ | 12,575 | ||||||||||
Per-Unit royalty revenue | 23,016 | (3,968 | ) | (15 | )% | 26,984 | 5,470 | 25 | % | 21,514 | |||||||||||||||
Total royalty and license revenue | 35,643 | (74,914 | ) | (68 | )% | 110,557 | 76,468 | 224 | % | 34,089 | |||||||||||||||
Development, services, and other | 310 | (112 | ) | (27 | )% | 422 | (502 | ) | (54 | )% | 924 | ||||||||||||||
Total revenues | $ | 35,953 | $ | (75,026 | ) | (68 | )% | $ | 110,979 | $ | 75,966 | 217 | % | $ | 35,013 | ||||||||||
2019 Compared to 2018
Royalty and license revenue - Total royalty and license revenue for 2019 was $35.6 million, a decrease of $74.9 million, or 68%, compared to $110.6 million for 2018.
Fixed fee license revenue was $12.6 million for 2019, a decrease of $70.9 million, or 85%, compared to $83.6 million in 2018. The decrease was primarily related to a material fixed fee license agreement entered into with a mobility customer during the first quarter of 2018.
Per-unit royalty revenue decreased by $4.0 million, or 15%, to $23.0 million for the year ended December 31, 2019 from $27.0 million for the year ended December 31, 2018. This decrease in per-unit royalty revenue was primarily caused by a $5.8 million decrease in automotive royalties, a $2.8 million decrease in gaming royalties and a $0.7 million decrease in medical royalties. The automotive, gaming and medical decreases in per-unit royalty revenue were partially offset by a $5.3 million increase in mobility royalties. The decrease in automotive royalties was mainly due to the impact of certain per-unit royalty agreements entered into during the first quarter of 2018 that contained a minimum royalty provision for which we recognized minimum royalties as revenue at the inception of such agreements. The decrease in gaming royalties was primarily due to lower shipments experienced by our licensees. The increase in mobility royalties was primarily due to revenue from per-unit royalty agreements entered into in 2019 partially offset by the impact of lower shipment volumes reported by other mobility licensees.
We expect royalty and license revenue to continue to be a major component of our future revenue as our technology is included in products and we succeed in our efforts to monetize our IP. Our fixed fee license revenue could fluctuate depending upon the timing of execution of new fixed license fee arrangements under ASC 606. We also anticipate that our royalty revenue will fluctuate relative to our customers' unit shipments. We historically experienced seasonally higher royalty revenue from our gaming and mobility customers due to the reporting of holiday sales in the first calendar quarter compared to other calendar quarters. Due to the elimination of the one-quarter lag in reporting royalty income, we now expect to experience this seasonal impact in the fourth calendar quarter.
Development, services and other revenue - Development, services, and other revenue for 2019 was $0.3 million, a decrease of $0.1 million, or 27%, compared to $0.4 million in 2018.
Geographically, revenues generated in Asia, North America and Europe for the year ended December 31, 2019 represented 65%, 28%, and 7%, respectively, of our total revenue as compared to 12%, 77%, and 11%, respectively, for the year ended December 31, 2018. The increase in revenue from Asia as a percentage of total revenue was primarily driven by an increase in revenues from mobility customers and partially offset by a decrease in revenues from automotive customers in the region. The decrease in revenue attributable to North America as a percentage of total revenue was primarily caused by lower revenues from mobility customers and partially offset by increased revenue from gaming and automotive customers in the region.
39
2018 Compared to 2017
Royalty and license revenue - Total royalty and license revenue for 2018 was $110.6 million, an increase of $76.5 million, or 224% compared to $34.1 million for 2017. Excluding the impact of adoption of ASC 606, royalty and license revenue for the year ended December 31, 2018 would be $0.1 million lower than the reported royalty and license revenue for the year ended December 31, 2017.
Per-unit royalty revenue for 2018 was $27.0 million, an increase of $5.5 million, or 25% compared to $21.5 million for 2017. Per-unit royalty revenue for the year ended December 31, 2018 would be $3.0 million lower, if reported under ASC 605, than per-unit royalty revenue for the year ended December 31, 2017. The $8.5 million change due to ASC 606 adoption was primarily related to minimum royalties recognized as revenue at the inception of certain license agreements entered into in 2018 that contain minimum royalty provision. Under ASC 606, minimum royalties are considered a fixed transaction price to which we will have an unconditional right once all other performance obligations, if any, are satisfied. Per our previous accounting policy under ASC 605, such minimum royalties were recognized as revenue at the end of each reporting period (usually a calendar year) if the actual royalties reported by the customer for that reporting period were below the minimum threshold set forth in the contract.
Fixed fee license revenue for 2018 was $83.6 million, an increase of $71.0 million, or 565% compared to $12.6 million for 2017. Excluding the impact of adoption of ASC 606, fixed fee license revenue for the year ended December 31, 2018 would be $2.9 million higher than fixed fee license revenue for the year ended December 31, 2017 resulting from new customer contracts entered into in 2018.
Development, services and other revenue - Development, services, and other revenue for the year ended December 31, 2018 decreased by $0.5 million, or 54%, compared to $0.9 million for the year ended December 31, 2017, primarily due to certain non-recurring service fees from customer contracts completed in 2017. The adoption of ASC 606 had little impact on the way we recognize development, service and other revenue.
Geographically, revenues generated in North America, Asia, and Europe for the year ended December 31, 2018 represented 77%, 12%, and 11%, respectively, of our total revenue as compared to 22%, 63%, and 15%, respectively, for the year ended December 31, 2017. The increase in revenue attributable to North America as a percentage of total revenue was primarily driven by increased revenues from mobility customers, including Apple, partially offset by decreased revenues from gaming and automotive customers in North America. The decrease in revenue attributable to Asia as a percentage of total revenue was caused by declining revenues from mobility, gaming and automotive customers in the region.
Expenses
A summary of operating expenses for the years ended December 31, 2019, 2018 and 2017 are as follows:
2019 | $ Change | % Change | 2018 | $ Change | % Change | 2017 | |||||||||||||||||||
Sales and marketing | $ | 6,426 | $ | 308 | 5 | % | $ | 6,118 | $ | (7,398 | ) | (55 | )% | $ | 13,516 | ||||||||||
Research and development | 7,840 | (1,887 | ) | (19 | )% | 9,727 | (2,032 | ) | (17 | )% | 11,759 | ||||||||||||||
General and administrative | 42,968 | 1,153 | 3 | % | 41,815 | (11,528 | ) | (22 | )% | 53,343 | |||||||||||||||
Restructuring Costs | — | — | — | % | — | (1,620 | ) | 100 | % | 1,620 | |||||||||||||||
2019 Compared to 2018
Sales and Marketing - Our sales and marketing expenses primarily consisted of employee compensation and benefits, sales commissions, advertising, trade shows, collateral marketing materials, market development funds, travel, and allocated facilities costs. Sales and marketing expenses increased $0.3 million, or 5%, for 2019 as compared to 2018 primarily attributable to a $0.3 million increase in compensation, benefits, and other related costs, $0.2 million increase in marketing and advertising costs and a $0.2 million increase in occupancy and depreciation expenses. These increases in sales and marketing expenses were partially offset by a $0.4 million decrease in outside services costs. The increase in compensation, benefits, and other related costs were primarily due to higher compensation during 2019 compared with 2018. We believe that continued investment in sales and marketing is critical to our future success, and we expect to continue making targeted investments to expand market acceptance for our touch technologies across the markets which we serve.
40
Research and Development - Our research and development expenses primarily consisted of employee compensation and benefits, outside services and consulting fees, tooling and supplies, and allocated facilities costs. Research and development expenses decreased $1.9 million, or 19%, during 2019 as compared to 2018 primarily due to a $1.8 million decrease in compensation, benefits, and other related costs and a $0.2 million decrease in facilities related costs partially offset by a $0.2 million increase in outside services costs. The decrease in compensation, benefits and other related costs was attributable to lower salaries and benefits as a result of reduced headcount, a decrease in stock-based compensation and a decrease in expenses related to employee retention.
We believe that continued investment in research and development is critical to our future success, and we expect to continue making targeted investments in areas of research and technology development to support future growth in key markets.
General and Administrative - Our general and administrative expenses primarily consisted of employee compensation and benefits, legal and professional fees, external legal costs for patents, office supplies, travel, and allocated facilities costs. General and administrative expenses increased $1.2 million, or 3%, in 2019 as compared to 2018 primarily due to a $1.9 million increase in consulting, recruiting and professional services fees, a $0.9 million increase in lease right-of-use ("ROU") asset impairment charge, a $0.3 million increase in legal expense, a $0.3 million increase in depreciation expense, a $0.4 million increase in public company fees, travel expense, and office expense and a $0.2 million increase in foreign currency transaction loss. These general and administrative expense increases were partially offset by a $3.0 million decrease in compensation, benefits and other related costs. The decrease in compensation, benefits and other related costs was primarily attributable to reduced headcount and lower stock-based compensation expense. During 2019, we began to shift general and administrative, research and development and executive functions and employees from the San Jose California Facility (“SJ Facility”) to offices maintained in San Francisco, California and Montreal, Canada. In the fourth quarter 2019, we announced the decision to exit the SJ Facility. The lease for the SJ Facility expires in April 2023. We expect to exit the SJ Facility by March 31, 2020. We are attempting to sublease the SJ Facility however, the cash flows from a sublease is expected to be less than the carrying value of the lease ROU asset. As a result of a significant change in use of our SJ Facility in December 2019, in the fourth quarter of 2019, we recorded a $0.9 million ROU asset impairment charge. Additionally, we recorded $0.3 million in accelerated amortization in the SJ Facility leasehold improvements due to the shortening in estimated useful life of these assets to March 31, 2020.
We expect our general and administrative expenses to decrease in the future as we complete certain outstanding litigation matters and achieve targeted reductions in consulting and professional services.
2018 Compared to 2017
Sales and Marketing - Sales and marketing expenses decreased $7.4 million, or 55%, for 2018 as compared to 2017 primarily due to decreases of $5.1 million in compensation, benefits, and other related costs, $0.9 million in marketing and advertising costs, and $0.8 million in travel costs. The decreases in compensation, benefits, and other related costs as well as travel costs were primarily due to reduced headcount following our restructuring actions in December 2017. We believe that continued investment in sales and marketing is critical to our future success, and we expect to continue making targeted investments to expand market acceptance for our touch technologies across the markets we serve.
Research and Development - Research and development expenses decreased $2.0 million, or 17% during 2018 as compared to 2017. The decrease was primarily related to decreases of $0.7 million in compensation, benefits, and other related costs and $0.3 million in travel cost as a result of reduced headcount following our restructuring actions in December 2017. In addition, outside services expense for research and development decreased $0.7 million reflecting our redirected development efforts.
General and Administrative - General and administrative expenses for 2018 decreased $11.5 million, or 22%, as compared to 2017 primarily due to a $12.7 million decrease in legal expense, partially offset by a $1.3 million increase in compensation, benefits, and other related costs mainly caused by higher stock compensation expense. The decrease in legal expenses was primarily due to $15.2 million decrease in litigation expense as we settled and concluded litigation against Apple and AT&T Mobility and Fitbit in 2018, partially offset by a $2.2 million increase in patent related legal, filing, and maintenance costs.
41
Interest and Other Income, Other Expense
A summary of interest and other income, other expense for the years ended December 31, 2019, 2018 and 2017 are as follows (in thousands):
2019 | $ Change | % Change | 2018 | $ Change | % Change | 2017 | |||||||||||||||||||
Interest and other income | $ | 1,787 | $ | (45 | ) | (2 | )% | $ | 1,832 | $ | 1,495 | 444 | % | $ | 337 | ||||||||||
Other income (expense) | $ | 91 | $ | 289 | (146 | )% | $ | (198 | ) | $ | (472 | ) | (172 | )% | $ | 274 | |||||||||
Interest and Other Income - Interest and other income consists primarily of interest income from cash and cash equivalents and short-term investments and other income. Interest and other income were relatively flat for the year ended December 31, 2019 compared to the year ended December 31, 2018. Interest and other income increased $1.5 million primarily driven by higher investment income earned during the year ended December 31, 2018 compared to the year ended December 31, 2017.
Other Income (Expense) - Other income (expense) consist primarily of translation gain (loss) from exchange rate fluctuations. Other income (expense) increased $0.3 million in 2019 compared to 2018 primarily due to a $0.2 million decrease in foreign currency translation loss and a $0.1 million increase in other income. Other income (expense) decreased $0.5 million in 2018 compared to 2017. We recorded $0.2 million other expense for 2018 as a result of exchange rate losses from our foreign subsidiaries, compared to $0.3 million other income for 2017.
Provision for Income Taxes
A summary of income provision and effective tax rates for the years ended December 31, 2019, 2018 and 2017 are as follows (in thousands):
Change | Change | ||||||||||||||||||||||||
2019 | Amount | % | 2018 | Amount | % | 2017 | |||||||||||||||||||
Provision for income taxes | $ | (471 | ) | $ | (79 | ) | (20 | )% | $ | (392 | ) | $ | 88 | (18 | )% | $ | (480 | ) | |||||||
Income (loss) before provision for income taxes | (19,573 | ) | 54,735 | (44,811 | ) | ||||||||||||||||||||
Effective tax rate | (2.4 | )% | 0.7 | % | (1.1 | )% | |||||||||||||||||||
For 2019, we recorded a provision for income taxes of $0.5 million yielding an effective tax rate of (2.4)%. The 2019 provision reflects estimated foreign taxes and foreign withholding tax expense. Based upon our assessment as of December 31, 2019 of the realizability of our deferred tax assets, we continue to maintain a full valuation allowance against all of our federal and state, and certain of our foreign net deferred tax assets. As of December 31, 2019, the aggregating balance of our deferred tax assets totaled $28.5 million with a valuation allowance of $28.1 million, resulting in a net deferred tax asset balance of $0.5 million.
On December 22, 2017, the Tax Act was passed into law. Among other changes, the Tax Act reduced the US federal corporate income tax rate from 35% to 21%, required companies to pay a one-time transition tax on earnings of certain foreign subsidiaries that were previously tax deferred and created new taxes on certain foreign sourced earnings. In addition, the Act introduced the Base Erosion and Anti-Abuse Tax (the “BEAT”), which creates a new tax on certain related-party payments. We concluded that we have not met the threshold requirements of the BEAT. Although the measurement period has closed, further technical guidance related to the Tax Act, including final regulations on a broad range of topics, is expected to be issued. In accordance with ASC 740, we will recognize any effects of the guidance in the period that such guidance is issued.
For 2018, we recorded a provision for income taxes of $0.4 million yielding an effective tax rate of 0.7%. The 2018 provision reflects estimated foreign taxes and foreign withholding tax expense. Based upon our assessment as of December 31, 2018 of the realizability of our deferred tax assets, we continued to maintain a full valuation allowance against all of our federal and state, and certain of our foreign net deferred tax assets. As of December 31, 2018, the aggregating balance of our deferred tax assets totaled $24.7 million with a valuation allowance of $24.4 million, resulting in a net deferred tax asset balance of $0.3 million.
42
For 2017 we recorded a provision for income taxes of $0.5 million yielding an effective tax rate of (1.1)%. The 2017 provision reflects estimated foreign taxes and foreign withholding tax expense. We continued to maintain a full valuation allowance against our state and certain of our foreign net deferred tax assets. As of December 31, 2017, the aggregating balance of our deferred tax assets, after recording the impact of the tax rate change described above, totaled $38.1 million with a valuation allowance of $37.7 million, resulting in a net deferred tax asset balance of $0.4 million.
As described above, we continue to maintain a valuation allowance of $28.1 million against certain of our deferred tax assets, including all federal, state, and certain foreign deferred tax assets as a result of uncertainties regarding the realization of the asset balance due to historical losses, the variability of operating results, and uncertainty regarding near term projected results. In the event that we determine the deferred tax assets are realizable based on an assessment of relevant factors, an adjustment to the valuation allowance may increase income in the period such determination is made. The valuation allowance does not impact our ability to utilize the underlying net operating loss carryforwards.
We also maintain liabilities for uncertain tax positions. As of December 31, 2019, we had unrecognized tax benefits under ASC 740 of approximately $4.8 million and applicable interest of $25,000. The total amount of unrecognized tax benefits that would affect our effective tax rate, if recognized, is $97,000. The Company’s policy is to account for interest and penalties related to uncertain tax positions as a component of income tax provision. We do not expect to have any significant changes to unrecognized tax benefits during the next twelve months.
Liquidity and Capital Resources
Our cash, cash equivalents, and short-term investments consist primarily of money market funds and U.S. treasury bills. All of our short-term investments are classified as available-for-sale. The securities are stated at market value, with unrealized gains and losses reported as a component of accumulated other comprehensive income, within stockholders’ equity.
As of December 31, 2019, our cash, cash equivalents, and short-term investments totaled $89.5 million, a decrease of $35.4 million from $124.9 million on December 31, 2018.
A summary of select cash flow information for the years ended December 31, 2019, 2018 and 2017 (in thousands):
Years Ended December 31, | |||||||||||
2019 | 2018 | 2017 | |||||||||
Net cash (used in) provided by operating activities | $ | (34,099 | ) | $ | 69,924 | $ | (43,829 | ) | |||
Net cash provided by investing activities | $ | 10,920 | $ | 8,237 | $ | 11,068 | |||||
Net cash (used in) provided by financing activities | $ | (1,331 | ) | $ | 8,205 | $ | 518 | ||||
2019 Compared to 2018
Cash provided by (used in) operating activities - Net cash used in operating activities was $34.1 million during 2019 compared to $69.9 million cash provided by operating activities during 2018, primarily due to a $74.4 million decrease in net income, a $25.6 million decrease in deferred revenue, a $4.2 million increase in other assets, a $2.1 million increase in accounts and other receivables and a $0.9 million decrease in accrued compensation partially offset by a $3.8 million increase in other long-term liabilities. The decrease in deferred revenue primarily reflects the effect of the adoption of ASC 606 on January 1, 2018. Cash used in operating activities was also affected by a $0.5 million decrease in non-cash charges primarily related to a $3.2 million decrease in stock-based compensation expense, partially offset by a $0.9 million impairment charge related to the SJ Facility right-of-use lease asset and a $1.3 million increase in depreciation and amortization expense. The increase in depreciation and amortization expense is due primarily to amortization of right-of-use lease assets and the shortened useful life of the SJ Facility leasehold improvements and a $0.3 million increase in deferred income taxes.
Cash provided by investing activities - Net cash provided by investing activities during 2019 was $10.9 million, a decrease of $2.7 million compared to $8.2 million cash provided by investing activities during 2018. Net cash provided by investing activities during 2019 consisted of maturities of short-term investments of $20.0 million. This was partially offset by purchases of short-term investments of $8.9 million and purchases of property, plant and equipment of $0.2 million. Net cash provided by investing activities during 2018 consisted of maturities of short-term investments of $26.0 million. This was partially offset by purchases of short-term investments of $17.7 million and purchases of property, plant, and equipment of $0.1 million.
Cash provided by financing activities — Net cash provided by financing activities during 2019 was $1.3 million, a decrease of $9.5 million compared to $8.2 million cash provided by financing activities during 2018. Net cash used in financing activities during 2019 consisted of $2.7 million used to purchase of treasury stock partially offset by $1.4 million in
43
cash proceeds from stock option exercises and stock purchases under our employee stock purchase plan. Net cash provided by financing activities during 2018 consisted primarily of $8.2 million in proceeds from stock option exercises and stock purchases under our employee stock purchase plan.
2018 Compared to 2017
Cash provided by (used in) operating activities - Net cash provided by operating activities was $69.9 million during 2018 compared to $43.8 million cash used in operating activities during 2017. The $113.8 million change was primarily driven by $99.6 million increase in net income (loss), from $45.3 million net loss for 2017 to $54.3 million net income for 2018 and $27.0 million increase in deferred revenue, partially offset by $7.0 million increase in other assets, $4.2 million increase in prepaid expenses and other current assets, and $3.7 million decrease in accounts payable. The increases in deferred revenue and other non-current assets primarily reflected the effect of the adoption of ASC 606 on January 1, 2018. Cash provided by operating activities was also affected by an increase in non-cash charges of $2.6 million primarily related to higher stock-based compensation expense incurred for 2018 compared to 2017.
Cash provided by (used in) investing activities - Net cash provided by investing activities during 2018 was $8.2 million, a decrease of $2.8 million compared to $11.1 million cash provided by investing activities during 2017. Net cash provided by investing activities during 2018 consisted of maturities of short-term investments of $26.0 million partially offset by purchases of short-term investments of $17.7 million and purchases of property, plant and equipment of $0.1 million. Net cash provided by investing activities during 2017 consisted of maturities of short-term investments of $35.0 million partially offset by purchases of short-term investments of $23.8 million and purchases of property, plant, and equipment of $0.1 million.
Cash provided by (used in) financing activities - Net cash provided by financing activities during 2018 was $8.2 million an increase of $7.7 million compared to $0.5 million net cash provided by financing activities during 2017. Net cash provided by financing activities during 2018 consisted primarily of $8.2 million in proceeds from stock option exercises and stock purchases under our employee stock purchase plan. Net cash provided by financing activities during 2017 consisted primarily of $0.8 million proceeds from stock option exercises and stock purchases under our employee stock purchase plan partially offset by repurchases of treasury stock of $0.3 million.
We believe that our cash, cash equivalents, and short-term investments will be sufficient to meet our working capital needs for at least the next twelve months. Of our total cash, cash equivalents, and short-term investments of $89.5 million as of December 31, 2019, 5% was held by our foreign subsidiaries and subject to repatriation tax effects. Our intent is to permanently reinvest all of our earnings from foreign operations, and current plans do not anticipate that we will need funds generated from foreign operations to fund our domestic operations. We will continue to invest in, protect, and defend our extensive IP portfolio, which is expected to result in the continued use of cash. At December 31, 2019 there was $30.6 million remaining under our previously-approved share repurchase program. We anticipate that capital expenditures for property and equipment for the year ending December 31, 2020 will be less than $1.0 million. Cash from operations could also be affected by various risks and uncertainties, including, but not limited to the risks detailed in Part I, Item 1A, Risk Factors of this Annual Report on Form 10-K.
Summary Disclosures about Contractual Obligations and Commercial Commitments
The following table reflects a summary of our contractual cash obligations and other commercial commitments as of December 31, 2019 (in thousands):
Contractual Obligations | Total | Less Than 1 Year | 1-3 Years | 3-5 Years | More Than 5 Years | ||||||||||||||
Operating Leases | $ | 4,079 | $ | 1,230 | $ | 2,825 | $ | 24 | $ | — | |||||||||
At December 31, 2019, we had a liability for unrecognized tax benefits totaling $4.8 million including interest of $25,000, none of which could be payable in cash. We did not have any other significant non-cancellable purchase commitments as of December 31, 2019.
Effective January 31, 2020, the Company entered into an agreement to lease approximately 5,000 square feet of office space in San Francisco, California. This facility will be used for administrative and corporate headquarter functions. This lease commenced in 2020 and expires in 2022. The Company's lease ROU assets resulting from this agreement are expected to increase by $0.6 million in the first quarter of 2020.
44
Recent Accounting Pronouncements
See Note 1 Significant Accounting Policies of the Notes to Consolidated Financial Statements for information regarding the effect of new accounting pronouncements on our financial statements.
45
Item 7A. Quantitative and Qualitative Disclosures about Market Risk
We are exposed to financial market risks, including changes in interest rates and foreign currency exchange rates. Changes in these factors may cause fluctuations in our earnings and cash flows. We evaluate and manage the exposure to these market risks as follows:
Cash Equivalents and Short-term Investments — We had cash equivalents and short-term investments of $89.5 million as of December 31, 2019, which are subject to interest rate fluctuations. An increase in interest rates could adversely affect the market value of our cash equivalents and short-term investments. A hypothetical 100 basis point increase in interest rates would not have material impact in the fair value of our cash equivalents and short-term investments as of December 31, 2019.
We limit our exposure to interest rate and credit risk by establishing and monitoring clear policies and guidelines for our cash equivalents and short-term investment portfolios. The primary objective of our policies is to preserve principal while at the same time maximizing yields, without significantly increasing risk. Our policy’s guidelines also limit exposure to loss by limiting the sums we can invest in any individual security and restricting investments to securities that meet certain defined credit ratings. We do not use derivative financial instruments in our investment portfolio to manage interest rate risk.
Foreign Currency Exchange Rates — A substantial majority of our revenue, expense, and capital purchasing activities are transacted in U.S. dollars. However, we do incur certain operating costs for our foreign operations in other currencies, but these operations are limited in scope and thus we are not materially exposed to foreign currency fluctuations. Additionally, we have some reliance on international revenues that are subject to the risks of fluctuations in currency exchange rates. Because a substantial majority of our international revenues, as well as expenses, are typically denominated in U.S. dollars, a strengthening of the U.S. dollar could cause our licenses to become relatively more expensive to customers in a particular country, leading to a reduction in sales or profitability in that country. We have no foreign exchange contracts, option contracts, or other foreign currency hedging arrangements and we do not expect to have such arrangements in the foreseeable future.
46
Item 8. Financial Statements and Supplementary Data
IMMERSION CORPORATION
INDEX TO CONSOLIDATED FINANCIAL STATEMENTS
Page | |
47
REPORT OF INDEPENDENT REGISTERED PUBLIC ACCOUNTING FIRM
To the Board Stockholders and Board of Directors of Immersion Corporation
Opinion on the Financial Statements
We have audited the accompanying consolidated balance sheets of Immersion Corporation and subsidiaries (the “Company”) as of December 31, 2019 and 2018, the related consolidated statements of operations and comprehensive income (loss), stockholders’ equity, and cash flows, for each of the three years in the period ended December 31, 2019, and the related notes. In our opinion, the financial statements present fairly, in all material respects, the financial position of the Company as of December 31, 2019 and 2018, and the results of its operations and its cash flows for each of the three years in the period ended December 31, 2019, in conformity with accounting principles generally accepted in the United States of America.
We have also audited, in accordance with the standards of the Public Company Accounting Oversight Board (United States) (PCAOB), the Company’s internal control over financial reporting as of December 31, 2019, based on criteria established in Internal Control - Integrated Framework (2013) issued by the Committee of Sponsoring Organizations of the Treadway Commission and our report dated March 6, 2020, expressed an unqualified opinion on the Company’s internal control over financial reporting.
Change in Accounting Principles
As discussed in Note 2 to the financial statements, the Company changed its method of accounting for revenue from contracts with customers in 2018 due to the adoption of ASC Topic 606, Revenue from Contracts with Customers.
As discussed in Note 11 to the financial statements, the Company has changed its method of accounting for leases in 2019 due to the adoption of ASC Topic 842, Leases.
Basis for Opinion
These financial statements are the responsibility of the Company’s management. Our responsibility is to express an opinion on the Company’s financial statements based on our audits. We are a public accounting firm registered with the PCAOB and are required to be independent with respect to the Company in accordance with the U.S. federal securities laws and the applicable rules and regulations of the Securities and Exchange Commission and the PCAOB.
We conducted our audits in accordance with the standards of the PCAOB. Those standards require that we plan and perform the audit to obtain reasonable assurance about whether the financial statements are free of material misstatement, whether due to error or fraud. Our audits included performing procedures to assess the risks of material misstatement of the financial statements, whether due to error or fraud, and performing procedures that respond to those risks. Such procedures included examining, on a test basis, evidence regarding the amounts and disclosures in the financial statements. Our audits also included evaluating the accounting principles used and significant estimates made by management, as well as evaluating the overall presentation of the financial statements. We believe that our audits provide a reasonable basis for our opinion.
/s/ DELOITTE & TOUCHE LLP
San Jose, California
March 6, 2020
We have served as the Company's auditor since 1997.
48
IMMERSION CORPORATION
CONSOLIDATED BALANCE SHEETS
(In thousands, except number of shares and per share amounts)
December 31, | |||||||
2019 | 2018 | ||||||
ASSETS | |||||||
Current assets: | |||||||
Cash and cash equivalents | $ | 86,478 | $ | 110,988 | |||
Short-term investments | 3,019 | 13,930 | |||||
Accounts and other receivables | 3,385 | 1,051 | |||||
Prepaid expenses and other current assets | 14,078 | 9,856 | |||||
Total current assets | 106,960 | 135,825 | |||||
Property and equipment, net | 1,226 | 2,343 | |||||
Other assets, net | 16,662 | 7,827 | |||||
Total assets | $ | 124,848 | $ | 145,995 | |||
LIABILITIES AND STOCKHOLDERS’ EQUITY | |||||||
Current liabilities: | |||||||
Accounts payable | $ | 809 | $ | 3,612 | |||
Accrued compensation | 2,844 | 3,948 | |||||
Other current liabilities | 3,478 | 3,194 | |||||
Deferred revenue | 4,692 | 4,591 | |||||
Total current liabilities | 11,823 | 15,345 | |||||
Long-term deferred revenue | 25,952 | 30,203 | |||||
Other long-term liabilities | 3,316 | 787 | |||||
Total liabilities | 41,091 | 46,335 | |||||
Commitments and contingencies (Note12) | |||||||
Stockholders’ equity: | |||||||
Common stock and additional paid-in capital – $0.001 par value; 100,000,000 shares authorized; 38,624,784 and 37,652,498 shares issued, respectively; 31,414,328 and 30,829,351 shares outstanding, respectively | 253,289 | 246,415 | |||||
Accumulated other comprehensive income | 124 | 116 | |||||
Accumulated deficit | (118,565 | ) | (98,521 | ) | |||
Treasury stock at cost: 7,210,456 and 6,823,147 shares, respectively | (51,091 | ) | (48,350 | ) | |||
Total stockholders’ equity | 83,757 | 99,660 | |||||
Total liabilities and stockholders’ equity | $ | 124,848 | $ | 145,995 | |||
See Notes to Consolidated Financial Statements.
49
IMMERSION CORPORATION
CONSOLIDATED STATEMENTS OF OPERATIONS AND COMPREHENSIVE INCOME (LOSS)
(In thousands, except per share amounts)
Years Ended December 31, | |||||||||||
2019 | 2018 | 2017 | |||||||||
Revenues: | |||||||||||
Royalty and license | $ | 35,643 | $ | 110,557 | $ | 34,089 | |||||
Development, services, and other | 310 | 422 | 924 | ||||||||
Total revenues | 35,953 | 110,979 | 35,013 | ||||||||
Costs and expenses: | |||||||||||
Cost of revenues | 170 | 218 | 197 | ||||||||
Sales and marketing | 6,426 | 6,118 | 13,516 | ||||||||
Research and development | 7,840 | 9,727 | 11,759 | ||||||||
General and administrative | 42,968 | 41,815 | 53,343 | ||||||||
Restructuring costs | — | — | 1,620 | ||||||||
Total costs and expenses | 57,404 | 57,878 | 80,435 | ||||||||
Operating income (loss) | (21,451 | ) | 53,101 | (45,422 | ) | ||||||
Interest and other income | 1,787 | 1,832 | 337 | ||||||||
Other income (expense), net | 91 | (198 | ) | 274 | |||||||
Income (loss) before provision for income taxes | (19,573 | ) | 54,735 | (44,811 | ) | ||||||
Provision for income taxes | (471 | ) | (392 | ) | (480 | ) | |||||
Net income (loss) | $ | (20,044 | ) | $ | 54,343 | $ | (45,291 | ) | |||
Basic net income (loss) per share | $ | (0.64 | ) | $ | 1.78 | $ | (1.55 | ) | |||
Shares used in calculating basic net income (loss) per share | 31,529 | 30,459 | 29,179 | ||||||||
Diluted net income (loss) per share: | $ | (0.64 | ) | $ | 1.73 | $ | (1.55 | ) | |||
Shares used in calculating diluted net income (loss) per share | 31,529 | 31,407 | 29,179 | ||||||||
Other comprehensive income (loss), net of tax | |||||||||||
Change in unrealized gains (losses) on short-term investments | $ | 8 | $ | 17 | $ | (16 | ) | ||||
Total other comprehensive income (loss) | 8 | 17 | (16 | ) | |||||||
Total comprehensive income (loss) | $ | (20,036 | ) | $ | 54,360 | $ | (45,307 | ) | |||
See Notes to Consolidated Financial Statements.
50
IMMERSION CORPORATION
CONSOLIDATED STATEMENTS OF STOCKHOLDERS’ EQUITY
(In thousands, except number of shares)
Common Stock and Additional Paid-In Capital | Accumulated Other Comprehensive Income (Loss) | Accumulated Deficit | Treasury Stock | Total Stockholders’ Equity | |||||||||||||||||||||
Shares | Amount | Shares | Amount | ||||||||||||||||||||||
Balances at January 1, 2017 | 35,555,562 | $ | 221,098 | $ | 115 | $ | (119,329 | ) | 6,638,003 | $ | (46,544 | ) | $ | 55,340 | |||||||||||
Net loss | (45,291 | ) | (45,291 | ) | |||||||||||||||||||||
Unrealized loss on available-for-sale securities, net of taxes | (16 | ) | (16 | ) | |||||||||||||||||||||
Stock repurchase | 48,687 | (328 | ) | (328 | ) | ||||||||||||||||||||
Exercise of stock options | 70,608 | 518 | 518 | ||||||||||||||||||||||
Release of restricted stock units and awards | 275,598 | 2,661 | 2,661 | ||||||||||||||||||||||
Issuance of stock for ESPP purchase | 48,750 | 328 | 328 | ||||||||||||||||||||||
Stock based compensation | 3,441 | 3,441 | |||||||||||||||||||||||
Effect of change in accounting policy (1) | (6,996 | ) | (6,996 | ) | |||||||||||||||||||||
Balances at December 31, 2017 | 35,950,518 | $ | 228,046 | $ | 99 | $ | (171,616 | ) | 6,686,690 | $ | (46,872 | ) | $ | 9,657 | |||||||||||
Net income | 54,343 | 54,343 | |||||||||||||||||||||||
Unrealized gain (loss) on available-for-sale securities, net of taxes | 17 | 17 | |||||||||||||||||||||||
Issuance of stock for ESPP purchase | 26,689 | 218 | 218 | ||||||||||||||||||||||
Exercise of stock options, net of shares withheld for employee taxes | 1,452,306 | 9,465 | 136,457 | (1,478 | ) | 7,987 | |||||||||||||||||||
Release of restricted stock units and awards, including related stock compensation | 222,985 | 2,806 | 2,806 | ||||||||||||||||||||||
Stock based compensation for stock options | 5,880 | 5,880 | |||||||||||||||||||||||
Effect of change in accounting policy (2) | 18,752 | 18,752 | |||||||||||||||||||||||
Balances at December 31, 2018 | 37,652,498 | $ | 246,415 | $ | 116 | $ | (98,521 | ) | 6,823,147 | $ | (48,350 | ) | $ | 99,660 | |||||||||||
Net loss | (20,044 | ) | (20,044 | ) | |||||||||||||||||||||
Unrealized gain (loss) on available-for-sale securities, net of taxes | 8 | 8 | |||||||||||||||||||||||
Stock repurchase | 387,309 | (2,741 | ) | (2,741 | ) | ||||||||||||||||||||
Issuance of stock for ESPP purchase | 21,741 | 165 | 165 | ||||||||||||||||||||||
Exercise of stock options, net of shares withheld for employee taxes | 173,993 | 1,245 | 1,245 | ||||||||||||||||||||||
Release of restricted stock units and awards, including related stock compensation | 776,552 | — | — | ||||||||||||||||||||||
Stock based compensation | 5,464 | 5,464 | |||||||||||||||||||||||
Balances at December 31, 2019 | 38,624,784 | $ | 253,289 | $ | 124 | $ | (118,565 | ) | 7,210,456 | $ | (51,091 | ) | $ | 83,757 | |||||||||||
(1) Effect of early adoption of ASU 2016-16 Income Taxes: Topic 740, Intra-Entity Transfers of Assets Other Than Inventory at the beginning of the first quarter of 2017. See Note 8. Income Taxes of Notes to Consolidated Financial Statements for detail disclosures.
(2) Effect of adoption of ASC 606 effective January 1, 2018. See Note 2. Revenue Recognition of the Notes to Consolidated Financial Statements for detail disclosures.
See Notes to Consolidated Financial Statements.
51
IMMERSION CORPORATION
CONSOLIDATED STATEMENTS OF CASH FLOWS
(In thousands)
Years Ended December 31, | |||||||||||
2019 | 2018 | 2017 | |||||||||
Cash flows from operating activities: | |||||||||||
Net income (loss) | $ | (20,044 | ) | $ | 54,343 | $ | (45,291 | ) | |||
Adjustments to reconcile net income (loss) to net cash (used in) provided by operating activities: | |||||||||||
Depreciation and amortization | 2,197 | 855 | 968 | ||||||||
Stock-based compensation | 5,464 | 8,686 | 6,102 | ||||||||
Impairment of right-of-use lease asset | 939 | — | — | ||||||||
Foreign currency translation loss | 102 | — | — | ||||||||
Deferred income taxes | 431 | 109 | (32 | ) | |||||||
Other | (3 | ) | 26 | 1 | |||||||
Changes in operating assets and liabilities: | |||||||||||
Accounts and other receivables | (2,334 | ) | (245 | ) | 576 | ||||||
Prepaid expenses and other current assets | (4,374 | ) | (4,015 | ) | 141 | ||||||
Other assets | (11,379 | ) | (7,188 | ) | (197 | ) | |||||
Accounts payable | (2,815 | ) | (3,035 | ) | 696 | ||||||
Accrued compensation | (1,104 | ) | (185 | ) | (620 | ) | |||||
Other current liabilities | (728 | ) | (702 | ) | (491 | ) | |||||
Deferred revenue | (4,150 | ) | 21,406 | (5,575 | ) | ||||||
Other long-term liabilities | 3,699 | (131 | ) | (107 | ) | ||||||
Net cash (used in) provided by operating activities | (34,099 | ) | 69,924 | (43,829 | ) | ||||||
Cash flows provided by (used in) investing activities: | |||||||||||
Purchases of short-term investments | (8,930 | ) | (17,693 | ) | (23,807 | ) | |||||
Proceeds from maturities of short-term investments | 20,000 | 26,004 | 35,000 | ||||||||
Purchases of property and equipment | (150 | ) | (74 | ) | (125 | ) | |||||
Net cash provided by investing activities | 10,920 | 8,237 | 11,068 | ||||||||
Cash flows provided by (used in) financing activities: | |||||||||||
Proceeds from issuance of common stock under employee stock purchase plan | 165 | 218 | 328 | ||||||||
Proceeds from stock options exercise | 1,245 | 7,987 | 518 | ||||||||
Cash paid for purchases of treasury stock | (2,741 | ) | — | (328 | ) | ||||||
Net cash (used in) provided by financing activities | (1,331 | ) | 8,205 | 518 | |||||||
Net (decrease) increase in cash and cash equivalents | (24,510 | ) | 86,366 | (32,243 | ) | ||||||
Cash and cash equivalents: | |||||||||||
Beginning of year | 110,988 | 24,622 | 56,865 | ||||||||
End of year | $ | 86,478 | $ | 110,988 | $ | 24,622 | |||||
Supplemental disclosure of cash flow information: | |||||||||||
Cash paid for taxes | $ | 160 | $ | 151 | $ | 191 | |||||
Supplemental disclosure of non-cash operating, investing, and financing activities: | |||||||||||
Cashless option exercise under company stock plan | $ | — | $ | 1,478 | $ | — | |||||
Release of Restricted Stock Units and Awards under company stock plan | $ | 7,190 | $ | 2,806 | $ | 2,661 | |||||
See Notes to Consolidated Financial Statements.
52
NOTES TO CONSOLIDATED FINANCIAL STATEMENTS
1. SIGNIFICANT ACCOUNTING POLICIES
Description of Business
Immersion Corporation (the “Company”) was incorporated in 1993 in California and reincorporated in Delaware in 1999. The Company focuses on the creation, design, development, and licensing of innovative haptic technologies that allow people to use their sense of touch more fully as they engage with products and experience the digital world around them. The Company has adopted a business model under which it provides advanced tactile software, related tools, and technical assistance designed to help integrate its patented technology into its customers’ products or enhance the functionality of its patented technology to certain customers; and offers licenses to the Company's patented technology to other customers.
Principles of Consolidation and Basis of Presentation
The accompanying consolidated financial statements include the accounts of Immersion Corporation and its wholly owned subsidiaries, Immersion Canada Corporation; Immersion International, LLC; Immersion Medical, Inc.; Immersion Japan K.K.; Immersion Ltd.; Immersion Software Ireland Ltd.; Haptify, Inc.; Immersion (Shanghai) Science & Technology Company, Ltd.; and Immersion Technology International Ltd. All intercompany accounts, transactions, and balances have been eliminated in consolidation. The Company has prepared the accompanying consolidated financial statements in conformity with U.S. GAAP.
Use of Estimates
The preparation of consolidated financial statements and related disclosures in accordance with U.S. GAAP and pursuant to the rules and regulations of the Securities and Exchange Commission (“SEC”) requires management to make estimates and assumptions that affect the reported amounts of assets and liabilities and disclosure of contingent assets and liabilities at the date of the consolidated financial statements and the reported amounts of revenues and expenses during the reporting period. Significant estimates include valuation of income taxes including uncertain tax provisions, and revenue recognition. Actual results may differ materially from those estimates which were made based on the best information known to management at that time.
Significant Accounting Policies
Cash Equivalents
The Company considers all highly liquid instruments purchased with an original or remaining maturity of less than three months at the date of purchase to be cash equivalents.
Short-term Investments
The Company’s short-term investments consist primarily of U.S treasury bills with an original or remaining maturity of greater than 90 days on the date of purchase. These investments are carried at fair market value. The Company classifies securities with readily determinable market values as available-for-sale. Even though the stated maturity dates of these debt securities may be one year or more beyond the balance sheet date, the Company has classified all debt securities as short-term investments as they are reasonably expected to be realized in cash or sold within one year. Unrealized gains or losses on such securities are included in accumulated other comprehensive income (loss) in stockholders’ equity. Realized gains and losses from maturities of all such securities are reported in earnings and computed using the specific identification cost method. Realized gains or losses and charges for other-than-temporary declines in value, if any, on available-for-sale securities are reported in other income (expense), net, as incurred. We periodically evaluate these investments for other-than-temporary impairment.
Fair Value of Financial Instruments
Financial instruments consist primarily of cash equivalents, short-term investments, accounts receivable and accounts payable. Cash equivalents and short-term investments are stated at fair value based on quoted market prices, broker or dealer quotations, or alternative pricing sources with reasonable levels of price transparency. The recorded cost of accounts receivable and accounts payable approximate the fair value of the respective assets and liabilities.
53
Property and Equipment
Property is stated at cost and is depreciated using the straight-line method over the estimated useful life of the related asset. The estimated useful lives are typically as follows:
Computer equipment and purchased software | 3 years |
Machinery and equipment | 3-5 years |
Furniture and fixtures | 5 years |
Leasehold improvements are amortized over the shorter of the lease term or their estimated useful life.
Long-lived Assets
The Company evaluates its long-lived assets for impairment whenever events or changes in circumstances indicate that the carrying amount of that asset may not be recoverable. An impairment loss would be recognized when the sum of the undiscounted future net cash flows expected to result from the use of the asset and its eventual disposition is less than its carrying amount. Measurement of an impairment loss for long-lived assets and certain identifiable intangible assets that management expects to hold and use is based on the fair value of the asset.
Leases
The Company leases all of its office space pursuant to lease arrangements, each of which have expiration dates on or before February 29, 2024. The Company's operating leases are accounted for as right-of-use (“ROU”) assets and lease liability obligations in the Company's Consolidated Balance Sheets under Other assets, Other current liabilities and Other long-term liabilities, respectively. ROU assets represent the Company's right to use an underlying asset for the lease term, and lease liability obligations represent the Company's obligation to make lease payments arising from the lease. ROU assets and lease liabilities are recognized at lease commencement date based on the present value of lease payments over the lease term. The Company has lease agreements that combine lease and non-lease components, and the Company elects to account for such components as a single lease component. As the Company's leases typically do not provide an implicit rate, the Company estimates its incremental borrowing rate based on the information available at commencement date in determining the present value of lease payments. ROU assets also include any lease payments made and exclude lease incentives and direct costs. Lease expense is recognized on a straight-line basis over the lease term. The Company elects to not present leases with an initial term of 12 months or less on its Consolidated Balance Sheet.
Revenue Recognition
The Company's revenue is primarily derived from fixed fee license agreements and per-unit royalty agreements, along with less significant revenue earned from development, services and other revenue.
Fixed fee license revenue
The Company recognizes revenue from a fixed fee license agreement when the Company's performance obligation is satisfied, which typically occurs upon the transfer of rights to the Company's technology upon the execution of the license agreement. In certain contracts, the Company grants a license to its existing patent portfolio at the inception of the license agreement as well as rights to the portfolio as it evolves throughout the contract term. For such arrangements, the Company has two separate performance obligations:
• | Performance Obligation A: transfer of rights to the Company's patent portfolio as it exists when the contract is executed; |
• | Performance Obligation B: transfer of rights to the Company's patent portfolio as it evolves over the term of the contract, including access to new patent applications that the licensee can benefit from over the term of the contract. |
If a fixed fee license agreement contains only Performance Obligation A, the Company will recognize most or all of the revenue from the agreement at the inception of the contract. For fixed fee license agreements that contain both Performance Obligation A and B, the Company will allocate the transaction price based on the standalone price for each of the two performance obligations. The Company uses a number of factors primarily related to the attributes of its patent portfolio to estimate standalone prices related to Performance Obligation A and B. Once the transaction price is allocated, the portion of the
54
transaction price allocable to Performance Obligation A will be recognized in the quarter the license agreement is signed and the customer can benefit from rights provided in the contract, and the portion allocable to Performance Obligation B will be recognized on a straight-line basis over the contract term. For such contracts, a contract liability account will be established and included within deferred revenue on the Consolidated Balance Sheets. As the rights and obligations in a contract are interdependent, contract assets and contract liabilities that arise in the same contract are presented on a net basis.
Some of the Company's license agreements contain fixed fees related to past infringements. Such fixed fees are recognized as revenue or recorded as a deduction to the Company's operating expense in the quarter the license agreement is signed.
Payments for fixed fee license contracts typically are due in full within 30 - 45 days from execution of the contract. From time to time, the Company enters into a fixed fee license contract with payments due in a number of installments payable throughout the contract term. In such cases, the Company will determine if a significant financing component exists and if it does, the Company will recognize more or less revenue and corresponding interest expense or income, as appropriate.
Per-unit Royalty revenue
ASC 606 requires an entity to record per-unit royalty revenue in the same period in which the licensee’s underlying sales occur. As the Company generally does not receive the per-unit licensee royalty reports for sales during a given quarter within the time frame that allows the Company to adequately review the reports and include the actual amounts in its quarterly results for such quarter, the Company accrues the related revenue based on estimates of its licensees’ underlying sales, subject to certain constraints on its ability to estimate such amounts. The Company develops such estimates based on a combination of available data including, but not limited to, approved customer forecasts, a lookback at historical royalty reporting for each of its customers, and industry information available for the licensed products.
As a result of accruing per-unit royalty revenue for the quarter based on such estimates, adjustments will be required in the following quarter to true up revenue to the actual amounts reported by its licensees. During the three months ended December 31, 2019, the Company recorded adjustments to decrease royalty revenue by $247,000. This adjustment represents the difference between the actual per-unit royalty revenue for the three months ended September 30, 2019 as reported by the Company's licensees during the three months ended December 31, 2019 and the estimated per-unit royalty revenue for the three months ended September 30, 2019 that the Company reported during the three months ended September 30, 2019. The Company recorded adjustments to decrease royalty revenue by $143,000 during the three months ended September 30, 2019. During the three months ended June 30 and March 31, 2019, the Company recorded adjustments to increase royalty revenue by $234,000 and $149,000, respectively, based on actual sales that occurred in the previous quarters. During the three months ended December 31, 2018, the Company recorded an adjustment to increase revenue by $189,000 and during the three months ended September 30 and June 30, 2018, the Company recorded adjustments to decrease royalty revenue by $333,000 and $326,000, respectively, based on actual sales that occurred in the previous quarters. The Company had no true-ups for the three months ended March 31, 2018.
Certain of the Company's per-unit royalty agreements contains minimum royalty provision which sets forth minimum amounts to be received by the Company during the contract term. Under ASC 606, minimum royalties are considered a fixed transaction price to which the Company will have an unconditional right once all other performance obligations, if any, are satisfied. The Company recognizes all minimum royalties as revenue at the inception of the license agreement or in the period in which all remaining revenue recognition criteria have been met. The Company accounts for the unbilled minimum royalties as contract assets on a contract basis on its Consolidated Balance Sheets, and the balance of such contract assets will be reduced by the actual royalties to be reported by the licensee during the contract term until fully utilized, after which point any excess per-unit royalties reported will be recognized as revenue. As the rights and obligations in a contract are interdependent, contract assets and contract liabilities that arise in the same contract are presented on a net basis.
Payments of per-unit royalties typically are due within 30 to 60 days from the end of the calendar quarter in which the underlying sales took place.
55
Development, services, and other revenue
As the performance obligation related to the Company's development, service and other revenue is satisfied over a period of time, the Company recognizes such revenue evenly as the performance obligation is satisfied which is generally consistent with the period of performance obligation, which is generally consistent with the contractual term.
Deferred Revenue
Deferred revenue consists of amounts that have been invoiced or paid, but have not been recognized as revenue. The amounts are primarily derived from the Company's fixed license fee agreements under which the Company is obliged to transfer both rights to its patent portfolio that exists when the contract is executed and rights to its patent portfolio as it evolves over the contract term. Refer to Note 2, Revenue Recognition for detailed discussion.
Deferred revenue that will be recognizable during the succeeding 12-month period is recorded as current, and the remaining deferred revenue is recorded as non-current.
Advertising
Advertising costs (including obligations under cooperative marketing programs) are expensed as incurred and included in sales and marketing expense. Advertising expense was as follows (in thousands):
Year ended December 31, | |||||||||||
2019 | 2018 | 2017 | |||||||||
Advertising expense | $ | 173 | $ | 67 | $ | 221 | |||||
Research and Development
Research and development costs are expensed as incurred.
Income Taxes
The Company uses the asset and liability method of accounting for income taxes. Under this method, income tax expense is recognized for the amount of taxes payable or refundable for the current year. In addition, deferred tax assets and liabilities are recognized for the expected future tax consequences of temporary differences between the financial reporting and tax bases of assets and liabilities, and for operating losses and tax credit carryforwards. Valuation allowances are established when necessary to reduce deferred tax assets to the amount expected to be realized and are reversed at such time that realization is believed to be more likely than not.
Software Development Costs
Costs for the development of new software products and substantial enhancements to existing software products are expensed as incurred until technological feasibility has been established, at which time any additional costs would be capitalized. The Company considers technological feasibility to be established upon completion of a working model of the software. Because the Company believes its current process for developing software is essentially completed concurrently with the establishment of technological feasibility, no costs have been capitalized to date.
Stock-based Compensation
Stock-based compensation cost is measured at the grant date based on the fair value of the award and is recognized as expense on a straight-line basis over the requisite service period, which is the vesting period.
Concentration of Credit Risks
Financial instruments that potentially subject the Company to a concentration of credit risk principally consist of cash, cash equivalents, short term investments, and accounts receivable. The Company is also subject to a concentration of revenues given certain key licensees that contributed a significant portion of the Company's total revenue. See Note 13. Segment Reporting,
56
Geographic Information and Significant Customers of the Notes to Consolidated Financial Statements for more details on customer revenue concentration.
The Company invests primarily in money market accounts and highly liquid debt instruments purchased with an original or remaining maturity of greater than 90 days on the date of purchase. Deposits held with banks may exceed the amount of insurance provided on such deposits. Generally, these deposits may be redeemed upon demand. The Company licenses technology primarily to companies in North America, Europe, and Asia. To reduce credit risk, management performs periodic credit evaluations of its customers’ financial condition. The Company periodically evaluates potential credit losses to ensure adequate reserves are maintained, but historically the Company has not experienced any significant losses related to individual customers or groups of customers in any particular industry or geographic area. As such, the Company had zero reserves for the years ended December 31, 2019 and December 31, 2018 due to its low credit risk.
Certain Significant Risks and Uncertainties
The Company operates in multiple industries and its operations can be affected by a variety of factors. For example, management believes that changes in any of the following areas could have a negative effect on the Company's future financial position and results of operations: the mix of revenues; the loss of significant customers; fundamental changes in the technologies underlying the Company’s and its licensees’ products; market acceptance of the Company’s and its licensees’ products under development; development of sales channels; litigation or other claims in which the Company is involved; the ability to successfully assert its patent rights against others; the impact of changing economic conditions; the hiring, training, and retention of key employees; successful and timely completion of product and technology development efforts; and new product or technology introductions by competitors.
Foreign Currency Translation
The functional currency of the Company’s foreign subsidiaries is U. S. dollars. Accordingly, gains and losses from the translation of the financial statements of the foreign subsidiaries and foreign currency transaction gains and losses are included in the Company's Consolidated Statements of Operations.
Recently Adopted Accounting Pronouncements
In July 2018, the Financial Accounting Standards Board (“FASB”) issued ASU 2018-09 Codification Improvement (“ASU 2018-09”). This ASU amends a wide variety of Topics in the Codification issued by FASB with technical corrections, clarifications, and other minor improvements, and should eliminate the need for periodic agenda requests for narrow and incremental items. Many of the amendments in this ASU are effective for annual reporting periods beginning after December 15, 2018 for public entities. The Company adopted this ASU as of January 1, 2019. The adoption of this ASU did not have a material impact on the Company's consolidated financial statements.
In June 2018, the FASB issued ASU 2018-07 Compensation - Stock Compensation (Topic 718): Improvements to Non-employee Share-Based Payment Accounting (”ASU 2018-07”). This ASU expands the scope of Topic 718 to include share-based payment transaction for acquiring goods and services from nonemployees and supersedes subtopic 505-50. The Company adopted this ASU as of January 1, 2019. The adoption of this ASU did not have a material impact on the Company's consolidated financial statements.
In February 2018, the FASB issued ASU 2018-02 Income Statement-Reporting Comprehensive Income (Topic 220): Reclassification of Certain Tax Effects from Accumulated Other Comprehensive Income (“ASU 2018-02”). The amendments in this ASU allow a reclassification from accumulated other comprehensive income to retained earnings for stranded tax effects resulting from the Tax Act. The guidance is effective for annual reporting periods beginning after December 15, 2018 and interim periods within those fiscal years, and early adoption is permitted. The Company adopted this ASU as of January 1, 2019. The amount of stranded tax effects that was reclassified from accumulated other comprehensive loss was not material to the Company's consolidated financial statements.
In February 2016, the FASB issued ASU 2016-02 Leases: Topic 842 (“ASU 2016-02”) in order to increase transparency and comparability among organizations by recognizing lease assets and lease liabilities on the balance sheet for those leases classified as operating leases under prior U.S. GAAP. Subsequently, the FASB issued numerous amendments to the initial guidance including ASU 2017-13, ASU 2018-10, ASU 2018-11, ASU 2018-20 and ASU 2019-01 (collectively, “ASC 842”). ASC 842 requires that a lessee should recognize a liability to make lease payments (“Lease Liabilities”) and a right-of-use (“ROU”) asset representing its right to use the underlying asset for the lease term on the balance sheet. ASC 842 also requires
57
additional disclosures related to key information about leasing arrangements, including, but not limited to, amounts, timing, and uncertainty of cash flows arising from leases.
The Company adopted ASC 842 on January 1, 2019 (the “Adoption Date”), using the alternative modified transition method, which requires a cumulative-effect adjustment, if any, to the opening balance of accumulated deficit to be recognized on the Adoption Date, with prior periods not restated. The Company elected certain practical expedients, including 1) not to reassess prior conclusions related to the identification, classification and accounting for initial direct costs for leases, 2) not to use hindsight to determine lease terms, 3) to not separate non-lease components within our lease portfolio, and 4) not to present leases with an initial term of 12 months or less on its Consolidated Balance Sheets. The adoption of ASC 842 resulted in the recognition of ROU assets of $4.0 million and lease liabilities for operating leases of $4.9 million. There was no cumulative effect adjustment recognized on the beginning accumulated deficit as a result of the adoption. The comparative period presented in this Form 10-K reflects the former lease U.S. GAAP accounting guidance. See Note 11. Leases for further information.
Accounting Pronouncements Not Yet Adopted
In December 2019, the FASB issued Accounting Standard Update No. 2019-12, Income Taxes (Topic 740): Simplifying the Accounting for Income Taxes (ASU 2019-12), which simplifies the accounting for income taxes. This guidance will be effective for us in the first quarter of 2021 on a prospective basis, and early adoption is permitted. We are currently evaluating the impact of the new guidance on our consolidated financial statements.
In June 2016, the FASB issued Accounting Standards Update No. 2016-13, Financial Instruments-Credit Losses (Topic 326): Measurement of Credit Losses on Financial Instruments (“ASU 2016-13”). This guidance requires financial assets measured at amortized cost to be presented at the net amount expected to be collected based on historical events, current conditions and forecast information. The standard will be effective for the first interim period within annual reporting periods beginning after December 15, 2019 and early adoption is permitted. The Company adopted ASU 2016-13 as of January 1, 2020. The adoption of this new accounting standard did not have a material impact on the Company's consolidated financial statements.
2. REVENUE RECOGNITION
The Company's revenue is primarily derived from fixed fee license agreements and per-unit royalty agreements, along with less significant revenue earned from development, services and other revenue.
Disaggregated Revenue
The following table presents the disaggregation of the Company's revenue for the years ended December 31, 2019, 2018 and 2017 (in thousands):
Years Ended December 31, | |||||||||||
2019 | 2018 | 2017 (1) | |||||||||
Fixed fee license revenue | $ | 12,627 | $ | 83,573 | $ | 12,575 | |||||
Per-Unit royalty revenue | 23,016 | 26,984 | 21,514 | ||||||||
Total royalty and license revenue | 35,643 | 110,557 | 34,089 | ||||||||
Development, services, and other | 310 | 422 | 924 | ||||||||
Total revenues | $ | 35,953 | $ | 110,979 | $ | 35,013 | |||||
(1) Revenues for the year ended December 31, 2017 are presented in accordance with ASC 605.
As of December 31, 2019, the Company had contract assets of $13.1 million included within prepaid expenses and other current assets, and $6.9 million included within other non-current assets, net, on the Consolidated Balance Sheets. As of December 31, 2018, the Company had contract assets of $9.0 million included within prepaid expenses and other current assets, and $7.2 million included within other non-current assets, net, on the Consolidated Balance Sheets. The balance of these contract assets increased by $3.9 million from January 1, 2019 to December 31, 2019, primarily related to certain contracts entered into during the year ended December 31, 2019 that included a minimum royalty arrangement. The balance of the contract assets as of December 31, 2019 also included the Company's estimate of per-unit royalty related to the underlying sales that occurred in the fourth quarter of 2019.
58
Contracted Revenue
Based on contracts signed and payments received as of December 31, 2019, the Company expects to recognize $30.0 million revenue related to Performance Obligation B under its fixed fee license agreements, which are satisfied over time, including $13.6 million over one to three years and $16.4 million over more than three years.
3. FAIR VALUE DISCLOSURES
Cash Equivalents and Short-term Investments
The financial instruments of the Company measured at fair value on a recurring basis are cash equivalents and short-term investments.
The Company’s fixed income available-for-sale securities consist of high quality, investment grade securities. The Company values these securities based on pricing from pricing vendors, who may use quoted prices in active markets for identical assets (Level 1) or inputs other than quoted prices that are observable either directly or indirectly (Level 2) in determining fair value.
The types of instruments valued based on quoted market prices in active markets include mostly money market securities. Such instruments are generally classified within Level 1 of the fair value hierarchy.
The types of instruments valued based on quoted prices in markets that are less active, broker or dealer quotations, or alternative pricing sources with reasonable levels of price transparency are generally classified within Level 2 of the fair value hierarchy and include U.S. treasury securities.
The types of instruments valued based on unobservable inputs which reflect the reporting entity’s own assumptions or data that market participants would use in valuing an instrument are generally classified within Level 3 of the fair value hierarchy. As of December 31, 2019 and 2018, the Company did not hold any Level 3 instruments.
The Company had no other-than-temporary impairment charges recorded in the years ended December 31, 2019, 2018, and 2017.
U.S. Treasury securities are classified as short-term investments, and money market accounts are classified as cash equivalents on the Company’s Consolidated Balance Sheets. Financial instruments measured at fair value on a recurring basis as of December 31, 2019 and 2018 are as follows (in thousands):
December 31, 2019 | Total | ||||||||||||||
Fair value measurements using | |||||||||||||||
Quoted Prices in Active Markets for Identical Assets (Level 1) | Significant Other Observable Inputs (Level 2) | Significant Unobservable Inputs (Level 3) | |||||||||||||
Money market funds | $ | 63,351 | $ | — | $ | — | $ | 63,351 | |||||||
U.S. Treasury securities | — | 3,019 | — | 3,019 | |||||||||||
Total assets at fair value (1) | $ | 63,351 | $ | 3,019 | $ | — | $ | 66,370 | |||||||
December 31, 2018 | Total | ||||||||||||||
Fair value measurements using | |||||||||||||||
Quoted Prices in Active Markets for Identical Assets (Level 1) | Significant Other Observable Inputs (Level 2) | Significant Unobservable Inputs (Level 3) | |||||||||||||
Money market funds | $ | 81,425 | $ | — | $ | — | $ | 81,425 | |||||||
U.S. Treasury securities | — | 13,930 | — | 13,930 | |||||||||||
Total assets at fair value (1) | $ | 81,425 | $ | 13,930 | $ | — | $ | 95,355 | |||||||
59
(1) The above tables exclude $23.1 million and $29.6 million of cash held in banks as of December 31, 2019 and 2018, respectively.
Short-term Investments
Short-term investments as of December 31, 2019 and 2018 consisted of the following (in thousands):
December 31, 2019 | |||||||||||||||
Amortized Cost | Gross Unrealized Holding Gains | Gross Unrealized Holding Losses | Fair Value | ||||||||||||
U.S. Treasury securities | $ | 3,018 | $ | 1 | $ | — | $ | 3,019 | |||||||
Total | $ | 3,018 | $ | 1 | $ | — | $ | 3,019 | |||||||
December 31, 2018 | |||||||||||||||
Amortized Cost | Gross Unrealized Holding Gains | Gross Unrealized Holding Losses | Fair Value | ||||||||||||
U.S. Treasury securities | $ | 13,936 | $ | — | $ | (6 | ) | $ | 13,930 | ||||||
Total | $ | 13,936 | $ | — | $ | (6 | ) | $ | 13,930 | ||||||
The contractual maturity dates of the Company’s available-for-sale securities on December 31, 2019 and 2018 were all due within one year. There were no transfers of instruments between Level 1 and 2 during the years ended December 31, 2019 and 2018.
4. BALANCE SHEETS DETAILS
Cash and Cash Equivalents
The Company's cash and cash equivalent balances were as follows (in thousands):
December 31, | |||||||
2019 | 2018 | ||||||
Cash | $ | 23,127 | $ | 29,563 | |||
Money market funds | 63,351 | 81,425 | |||||
Cash and cash equivalents | $ | 86,478 | $ | 110,988 | |||
Accounts and Other Receivables
Accounts and other receivables were as follows (in thousands):
December 31, | |||||||
2019 | 2018 | ||||||
Trade accounts receivable | $ | 2,972 | $ | 645 | |||
Receivables from vendors and other | 413 | 406 | |||||
Accounts and other receivables | $ | 3,385 | $ | 1,051 | |||
60
Property and Equipment
Property and equipment are as follows (in thousands):
December 31, | |||||||
2019 | 2018 | ||||||
Computer equipment and purchased software | $ | 3,011 | $ | 3,167 | |||
Machinery and equipment | 699 | 821 | |||||
Furniture and fixtures | 1,115 | 1,113 | |||||
Leasehold improvements (1) | 3,897 | 3,897 | |||||
Total | 8,722 | 8,998 | |||||
Less accumulated depreciation and amortization (1) | (7,496 | ) | (6,655 | ) | |||
Property and equipment, net | $ | 1,226 | $ | 2,343 | |||
(1) In the fourth quarter 2019, the Company announced its decision to exit the San Jose California facility (“SJ Facility”) by March 31, 2020. The Company accelerated the amortization of its SJ Facility leasehold improvements over the remaining estimated life which is estimated to be through March 31, 2020. As of December 31, 2019, the net book value of the SJ Facility leasehold improvements was $0.9 million and will be fully amortized by March 31, 2020.
Other Assets, Net
Other assets are as follows (in thousands):
December 31, | |||||||
2019 | 2018 | ||||||
Contract assets - Long-term | $ | 6,928 | $ | 7,231 | |||
Lease right-of-use assets | 2,202 | — | |||||
Deferred tax assets | 470 | 295 | |||||
Other assets and deposit | 7,062 | 301 | |||||
Total other assets, net | $ | 16,662 | $ | 7,827 | |||
Other Current Liabilities
Other liabilities are as follows (in thousands):
December 31, | |||||||
2019 | 2018 | ||||||
Accrued legal | $ | 1,077 | $ | 1,827 | |||
Lease liabilities - current | 1,150 | — | |||||
Income taxes payable | 46 | 204 | |||||
Other current liabilities | 1,205 | 1,163 | |||||
Total other current liabilities | $ | 3,478 | $ | 3,194 | |||
5. STOCK-BASED COMPENSATION
Stock Options and Awards
The Company’s equity incentive program is a long-term retention program that is intended to attract, retain, and provide incentives for talented employees, consultants, officers, and directors and to align stockholder and employee interests. The Company may grant time based options, market condition based options, stock appreciation rights, restricted stock awards (“RSAs”), restricted stock units (“RSUs”), performance shares, performance units, and other stock-based or cash-based awards to employees, officers, directors, and consultants. Under this program, stock options may be granted at prices not less than the fair market value on the date of grant for stock options. These stock options generally vest over four years and expire from seven to ten years from the grant date. In addition to time based vesting, market condition based options are subject to a market
61
condition whereby the closing price of the Company common stock must exceed a certain level for a number of trading days within a specified time period or the options will be canceled before the expiration date of the options. RSAs generally vests over one year. RSUs generally vest over three years. Awards granted other than an option or stock appreciation right shall reduce the common stock shares available for grant by 1.75 shares for every share issued.
On June 14, 2019, the Company's stockholders approved an increase to the number of shares reserved for issuance by 2,595,751 shares.
A summary of the Company's equity incentive program is as follows (in thousands):
December 31, 2019 | ||
Common stock shares available for grant | 4,214 | |
Standard and market condition-based stock options outstanding | 967 | |
RSAs outstanding | 91 | |
RSUs outstanding | 945 | |
Time-Based Stock Options
The following summarizes activities for the time-based stock options for the year ended December 31, 2019:
Number of Shares Underlying Stock Options (in thousands) | Weighted Average Exercise Price Per Share | Weighted Average Remaining Contractual Life (Years) | Aggregate Intrinsic Value | |||||||||
Outstanding at December 31, 2018 | 1,862 | $ | 9.44 | 2.85 | $ | 751 | ||||||
Granted | 783 | $ | 8.25 | |||||||||
Exercised | (174 | ) | $ | 7.15 | ||||||||
Canceled or expired | (1,504 | ) | $ | 9.65 | ||||||||
Outstanding as of December 31, 2019 | 967 | $ | 8.55 | 5.63 | $ | 16 | ||||||
Vested and expected to vest at December 31, 2019 | 967 | $ | 8.55 | 5.63 | $ | 16 | ||||||
Exercisable at December 31, 2019 | 161 | $ | 9.80 | 2.12 | $ | 0.4 | ||||||
Aggregate intrinsic value is calculated as the difference between the exercise price of the underlying awards and the exercise price of the Company’s common stock for the options that were in-the-money.
For the year ended December 31, 2019, the weighted average grant date fair value was $3.69.
Market Condition-Based Stock Options
In 2014, the Company began to grant market condition-based stock options. These stock options will vest if the closing price of the Company stock exceeds a certain level for a number of trading days within a specified time frame or the stock options will be canceled before the expiration of the stock options. The Company had 272,081 market condition-based stock options outstanding as of December 31, 2018 of which all expired during the year ended December 31, 2019. There were no market condition-based stock options outstanding as of December 31, 2019.
62
Restricted Stock Units
The following summarizes RSUs activities for the year ended December 31, 2019:
Number of Restricted Stock Units (in thousands) | Weighted Average Grant Date Fair Value | Weighted Average Remaining Contractual Life (Years) | Aggregate Intrinsic Value | |||||||||
Outstanding at December 31, 2018 | 1,091 | $ | 10.97 | 0.67 | $ | 9,773 | ||||||
Granted | 892 | $ | 8.54 | |||||||||
Released | (714 | ) | $ | 11.30 | ||||||||
Forfeited | (324 | ) | $ | 9.85 | ||||||||
Outstanding at December 31, 2019 | 945 | $ | 8.81 | 1.25 | $ | 7,020 | ||||||
The aggregate intrinsic value is calculated as the market value as of the end of the reporting period.
Restricted Stock Awards
The following summarizes RSA activities for the year ended December 31, 2019:
Number of Restricted Stock Awards (in thousands) | Weighted Average Grant Date Fair Value | Weighted Average Remaining Recognition Period (Years) | ||||||
Outstanding at December 31, 2018 | 55 | $ | 13.02 | 0.46 | ||||
Granted | 114 | $ | 7.60 | |||||
Released | (62 | ) | $ | 12.63 | ||||
Forfeited | (16 | ) | $ | 7.27 | ||||
Outstanding at December 31, 2019 | 91 | $ | 7.45 | 0.45 | ||||
Employee Stock Purchase Plan
Under the Company's 1999 Employee Stock Purchase Plan (“ESPP”), eligible employees may purchase common stock through payroll deductions at a purchase price of 85% of the lower of the fair market value of the Company’s common stock at the beginning of the offering period or the purchase date. Participants may not purchase more than 2,000 shares in a six months offering period or purchase stock having a value greater than $25,000 in any calendar year as measured at the beginning of the offering period. A total of 1.0 million shares of common stock has been reserved for issuance under the ESPP. During the year ended December 31, 2019, 21,741 shares were purchased under the ESPP with average purchase price of $7.60. As of December 31, 2019, 253,437 shares were available for future purchase under the ESPP.
63
Stock-based Compensation Expense
Valuation and amortization methods
Stock-based compensation is based on the estimated fair value of awards, net of estimated forfeitures, and recognized over the requisite service period. Estimated forfeitures are based on historical experience at the time of grant and revised, if necessary, in subsequent periods if actual forfeitures differ from those estimates. The stock-based compensation related to all of our stock-based awards and ESPP for the years ended December 31, 2019, 2018 and 2017 is as follows (in thousands):
For the Years Ended December 31, | |||||||||||
2019 | 2018 | 2017 | |||||||||
Stock options | $ | 701 | $ | 1,222 | $ | 3,735 | |||||
RSUs and RSAs | 4,692 | 7,372 | 2,234 | ||||||||
Employee stock purchase plan | 71 | 92 | $ | 133 | |||||||
Total | $ | 5,464 | $ | 8,686 | $ | 6,102 | |||||
Sales and marketing | $ | 947 | $ | 946 | $ | 1,025 | |||||
Research and development | 1,304 | 1,948 | 981 | ||||||||
General and administrative | 3,213 | 5,792 | 4,096 | ||||||||
Total | $ | 5,464 | $ | 8,686 | $ | 6,102 | |||||
The Company uses the Black-Scholes-Merton option pricing model for its time-based options, single-option approach to determine the fair value of standard stock options and ESPP shares. All share-based payment awards are amortized on a straight-line basis over the requisite service periods of the awards, which are generally the vesting periods.
The determination of the fair value of share-based awards on the date of grant using an option pricing model is affected by the Company’s stock price as well as assumptions regarding a number of complex and subjective variables. These variables include actual and projected employee stock option exercise behaviors that impact the expected term, the Company’s expected stock price volatility over the term of the awards, risk-free interest rate, and expected dividend.
Expected term — The Company estimates the expected term of options granted by calculating the average term from the Company’s historical stock option exercise experience. The expected term of ESPP shares is the length of the offering period.
Expected volatility — The Company estimates the volatility of its common stock taking into consideration its historical stock price movement and its expected future stock price trends based on known or anticipated events.
Risk-free interest rate — The Company bases the risk-free interest rate that it uses in the option pricing model on U.S. Treasury zero-coupon issues with remaining terms similar to the expected term on the options.
Expected dividend — The Company does not anticipate paying any cash dividends in the foreseeable future and therefore uses an expected dividend yield of zero in the option-pricing model.
Forfeitures — The Company is required to estimate future forfeitures at the time of grant and revise those estimates in subsequent periods if actual forfeitures differ from those estimates. The Company uses historical data to estimate pre-vesting option and RSUs forfeitures and records stock-based compensation expense only for those awards that are expected to vest.
The Company uses the Monte-Carlo Simulation model to value the stock options with a market condition. Valuation techniques such as a Monte-Carlo Simulation model have been developed to value path-dependent awards. The Monte-Carlo Simulation model is a generally accepted statistical technique used, in this instance, to simulate a range of future stock prices for the Company.
64
The assumptions used to value options granted under the Company’s equity incentive program are as follows:
Time-based stock options: | ||||||||
For the Year Ended December 31, | ||||||||
2019 | 2018 | 2017 | ||||||
Expected life (in years) | 4.4 | 4.4 | 4.6 | |||||
Volatility | 53 | % | 55 | % | 52 | % | ||
Interest rate | 2.0 | % | 3.0 | % | 2.0 | % | ||
Dividend yield | — | — | — | |||||
Market condition based stock options: | ||||||
For the Years Ended December 31, | ||||||
2019 (1) | 2018 (1) | 2017 | ||||
Expected life (in years) | N/A | N/A | 7.0 | |||
Volatility | N/A | N/A | 55 | % | ||
Interest rate | N/A | N/A | 2.0 | % | ||
Dividend yield | N/A | N/A | — | % | ||
(1) No market condition based stock options were granted during the years ended December 31, 2019 and 2018
As of December 31, 2019, there was $8.0 million of unrecognized compensation cost adjusted for estimated forfeitures related to non-vested stock options, restricted stock awards and RSUs granted to the Company’s employees and directors. This unrecognized compensation cost will be recognized over an estimated weighted-average period of approximately 2.6 years. Total unrecognized compensation cost will be adjusted for future changes in estimated forfeitures.
6. STOCKHOLDERS' EQUITY
Accumulated Other Comprehensive Income
The changes in accumulated other comprehensive income (loss) are included in the table below.
Year Ended December 31, 2019 | |||||||||||
Unrealized Gains and Losses on Available-for Sale Securities | Foreign Currency Items | Total | |||||||||
Beginning balance | $ | (6 | ) | $ | 122 | $ | 116 | ||||
Amounts reclassified from accumulated other comprehensive income (loss) | 8 | — | 8 | ||||||||
Ending balance | $ | 2 | $ | 122 | $ | 124 | |||||
65
Year Ended December 31, 2018 | |||||||||||
Unrealized Gains and Losses on Available-for Sale Securities | Foreign Currency Items | Total | |||||||||
Beginning balance | $ | (23 | ) | $ | 122 | $ | 99 | ||||
Amounts reclassified from accumulated other comprehensive income | 17 | — | 17 | ||||||||
Ending balance | $ | (6 | ) | $ | 122 | $ | 116 | ||||
Stock Repurchase Program
On November 1, 2007, the Company announced its Board authorized the repurchase of up to $50 million of the Company’s common stock. In addition, on October 22, 2014, the Board authorized another $30 million under the share repurchase program. The Company may repurchase its stock for cash in the open market in accordance with applicable securities laws. The timing and amount of any stock repurchase will depend on share price, corporate and regulatory requirements, economic and market conditions, and other factors. The stock repurchase authorization has no expiration date, does not require the Company to repurchase a specific number of shares, and may be modified, suspended, or discontinued at any time.
In December 2019, the Company repurchased 387,309 shares for $2.7 million at the average cost of $7.08 per share. There were no stock repurchases during the year ended December 31, 2018. During the year ended December 31, 2017, the Company repurchased 48,687 shares for $328,000 at an average cost of $6.73 per share, net of transaction costs through open market repurchases. As of December 31, 2019, approximately $30.6 million of the Company's common stock may yet be purchased. During the first quarter of 2020, the Company repurchased an additional 587,989 shares for $4.4 million at an average cost of $7.52 per share leaving approximately $26.2 million for purchases of the Company’s common stock.
7. RESTRUCTURING AND OTHER CHARGES
For the year ended December 31, 2017, the Company recorded restructuring expenses of $1.6 million which consisted of $1.5 million employee related restructuring charge and $0.1 million of facilities related and other restructuring costs. The Company recorded $44,000 in adjustments to the 2017 restructuring costs during the three months ended March 31, 2018. The restructuring plan was expected to increase internal efficiencies through the consolidation of certain sites of operation and resulted in the elimination of approximately 56 positions, or 41%, of the worldwide employee base.
In the fourth quarter of 2017, the Company executed a series of restructuring actions designed to sharpen the Company’s strategic focus and establish a more cost-efficient operating structure. The restructuring activities primarily focused on a reduction of the Company’s global workforce in conjunction with steps taken to:
•Significantly reduce the Company’s presence in China and focus its efforts on Mobile OEM licensing in that region;
•Cease its Mobile Advertising activities; and
•Narrow its focus in the Gaming and VR/AR markets on development efforts to bolster its IP licensing model in these markets.
All accrued amounts related to the 2017 restructuring activities were paid during the first quarter of 2018.
66
8. INCOME TAXES
Income tax provisions for the years ended December 31, 2019, 2018 and 2017 consisted of the following (in thousands):
Year Ended December 31, | |||||||||||
2019 | 2018 | 2017 | |||||||||
Income (loss) before provisions for income taxes | $ | (19,573 | ) | $ | 54,735 | $ | (44,811 | ) | |||
Provision for income taxes | (471 | ) | (392 | ) | (480 | ) | |||||
Effective tax rate | (2.4 | )% | 0.7 | % | (1.1 | )% | |||||
The 2019, 2018 and 2017 provision for income taxes resulted primarily from estimated foreign taxes and foreign withholding tax expense.
The Company reported pre-tax book income (loss) consisted of (in thousands):
Year Ended December 31, | |||||||||||
2019 | 2018 | 2017 | |||||||||
Domestic | $ | (17,970 | ) | $ | 49,509 | $ | (23,994 | ) | |||
Foreign | (1,603 | ) | 5,226 | (20,817 | ) | ||||||
Total | $ | (19,573 | ) | $ | 54,735 | $ | (44,811 | ) | |||
The provisions for income taxes consisted of the following (in thousands):
Year Ended December 31, | |||||||||||
2019 | 2018 | 2017 | |||||||||
Current: | |||||||||||
U.S. federal | — | $ | — | $ | — | ||||||
State and local | (3 | ) | (3 | ) | (5 | ) | |||||
Foreign | (190 | ) | (331 | ) | (448 | ) | |||||
Total current | $ | (193 | ) | $ | (334 | ) | $ | (453 | ) | ||
Deferred: | |||||||||||
U.S. federal | — | — | — | ||||||||
State and local | — | — | — | ||||||||
Foreign | (278 | ) | (58 | ) | (27 | ) | |||||
Total deferred | (278 | ) | (58 | ) | (27 | ) | |||||
Total provision for income taxes | $ | (471 | ) | $ | (392 | ) | $ | (480 | ) | ||
On July 27, 2015, a U.S. Tax Court opinion (Altera Corporation et. al v. Commissioner) concerning the treatment of stock-based compensation expense in an intercompany cost sharing arrangement was issued. In its opinion, the U.S. Tax Court accepted Altera's position of excluding stock-based compensation from its intercompany cost sharing arrangement. On February 19, 2016, the IRS appealed the ruling to the U.S. Court of Appeals for the Ninth Circuit (the “Ninth Circuit”). On July 24, 2018, the Ninth Circuit reversed the 2015 decision of the U.S. Tax Court that had found certain Treasury regulations related to stock-based compensation to be invalid. On August 7, 2018, the Ninth Circuit withdrew its July 24, 2018 opinion to allow a reconstituted panel to confer on the decision. This reconstituted panel reconsidered the validity of the cost sharing regulations at issue. The regulations at issue require related entities to share the cost of employee stock compensation in order for their cost-sharing arrangements to be classified as “qualified cost-sharing arrangements” and to avoid potential IRS adjustment. On June 7, 2019, the reconstituted panel of the Ninth Circuit upheld the 2018 decision of the Ninth Circuit, concluding stock-based compensation must be included in intercompany cost sharing agreements for the agreements to be classified as “qualified cost-sharing arrangements”. On July 22, 2019, Altera filed a petition for an en banc rehearing with the Ninth Circuit which was denied. On February 10, 2020, Altera filed an appeal to the United States Supreme Court (the “Supreme Court”) for review. Although the Company believes stock-based compensation is not required to be included in its pool of shared costs under its intercompany cost sharing arrangement, the Company has concluded that it is not more likely than not that Altera will prevail with an appeal to the Supreme Court. As such, the Company has made corresponding provisions. The Company will continue to monitor ongoing developments and potential impacts to its consolidated financial statements.
67
On December 22, 2017, the Tax Act was passed into law. Among other changes, the Tax Act reduced the US federal corporate income tax rate from 35% to 21%, required companies to pay a one-time transition tax on earnings of certain foreign subsidiaries that were previously tax deferred and created new taxes on certain foreign sourced earnings. In addition, the Act introduced the Base Erosion and Anti-Abuse Tax (the “BEAT”), which creates a new tax on certain related-party payments. The Company concluded that it has not met the threshold requirements of the BEAT. Although the measurement period has closed, further technical guidance related to the Tax Act, including final regulations on a broad range of topics, is expected to be issued. In accordance with ASC 740, the Company will recognize any effects of the guidance in the period that such guidance is issued.
Deferred tax assets and liabilities are recognized for the temporary differences between the carrying amounts of assets and liabilities for financial reporting purposes and the amounts used for income tax purposes, tax losses, and credit carryforwards. Significant components of the net deferred tax assets and liabilities consisted of (in thousands):
December 31, | |||||||
2019 | 2018 | ||||||
Deferred tax assets: | |||||||
Net operating loss carryforwards | $ | 4,936 | $ | 4,968 | |||
State income taxes | 1 | 1 | |||||
Deferred revenue | 6,291 | 2,347 | |||||
Research and development and other credits | 8,282 | 9,590 | |||||
Reserves and accruals recognized in different periods | 1,128 | 3,734 | |||||
Capitalized R&D expenses | 3,447 | 3,415 | |||||
Depreciation and amortization | 3,636 | 472 | |||||
Lease liability | 806 | — | |||||
Deferred rent | — | 160 | |||||
Other | — | 6 | |||||
Total deferred tax assets | 28,527 | 24,693 | |||||
Valuation allowance | (28,057 | ) | (24,398 | ) | |||
Net deferred tax assets | 470 | 295 | |||||
Right of use lease assets | (466 | ) | — | ||||
Foreign credits | (23 | ) | (29 | ) | |||
Other | (40 | ) | (17 | ) | |||
Net deferred tax liabilities | (529 | ) | (46 | ) | |||
Net deferred taxes | $ | (59 | ) | $ | 249 | ||
The Company accounts for deferred taxes under ASC 740 which requires a reduction of the carrying amounts of deferred tax assets by a valuation allowance if, based on available evidence, it is more likely than not that such assets will not be realized. Accordingly, the need to establish valuation allowances for deferred tax assets is assessed periodically based on the ASC 740 more-likely-than-not realization (“MLTN”) threshold criterion. This assessment considers matters such as future reversals of existing taxable temporary differences, projected future taxable income, tax-planning strategies, and results of recent operations. The evaluation of the recoverability of the deferred tax assets requires that the Company weigh all positive and negative evidence to reach a conclusion that it is more likely than not that all or some portion of the deferred tax assets will not be realized. The weight given to the evidence is commensurate with the extent to which it can be objectively verified. As of December 31, 2018, based on its assessment of the realizability of its deferred tax assets, the Company continued to maintain a full valuation allowance against all of its federal and state, and certain of its foreign net deferred tax assets.
As of December 31, 2019, the net operating loss carryforwards for federal and state income tax purposes were approximately $1.3 million and $53.0 million, respectively. The state net operating losses begin to expire in 2028. The federal net operating losses for tax years after 2017 can be carried forward indefinitely. The Company also has net operating loss (“NOL”) carryforwards from Ireland of $1.8 million that can be carried forward indefinitely and do not expire.
Based on the Company’s assessment of positive and negative evidence as of December 31, 2019, the Company concluded it was not more likely than not that the deferred tax asset arising from the Ireland NOL carryforward would be realized. Therefore, as of December 31, 2019 the Company recorded $1.6 million to reflect a full valuation allowance against Ireland’s deferred tax asset.
68
As of December 31, 2019, the Company had federal and state tax credit carryforwards of approximately $8.3 million and $2.4 million, respectively, available to offset future tax liabilities. The federal credit carryforwards will expire between 2020 and 2038 and the California tax credits will carryforward indefinitely. In addition, as of December 31, 2019, the Company has Canadian research and development credit carryforwards of $1.7 million, which will expire at various dates through 2039. These operating losses and credit carryforwards have not been reviewed by the relevant tax authorities and could be subject to adjustment upon examinations.
Section 382 of the Internal Revenue Code (“IRC Section 382”) imposes limitations on a corporation’s ability to utilize its net operating losses and credit carryforwards if it experiences an “ownership change” as defined by IRC Section 382. Utilization of a portion of the Company’s federal net operating loss carryforward was limited in accordance with IRC Section 382, due to an ownership change that occurred during 1999. This limitation has fully lapsed as of December 31, 2010. As of December 31, 2019, the Company conducted an IRC Section 382 analysis with respect to its net operating loss and credit carryforwards and determined there was no limitation. There can be no assurance that future issuances of the Company’s securities will not trigger limitations under IRC Section 382 which could limit utilization of these tax attributes.
For purposes of the reconciliation between the provision for income taxes at the statutory rate and the effective tax rate, a national U.S. 21% rate is applied for 2019 and 2018, the years in which the Tax Act took effect. For 2017, the national U.S. rate of 35%, the rate in effect prior to the Tax Act change, was applied for the reconciliation between the provision for income taxes at the statutory rate and the effective tax rate:
Years Ended December 31, | ||||||||
2019 | 2018 | 2017 | ||||||
Federal statutory tax rate | 21.0 | % | 21.0 | % | 35.0 | % | ||
Foreign withholding | (0.3 | )% | 0.1 | % | (0.2 | )% | ||
Stock compensation expense | (11.3 | )% | (1.0 | )% | (2.0 | )% | ||
Foreign rate differential | (2.6 | )% | (1.5 | )% | (17.0 | )% | ||
Prior year true-up items | 0.2 | % | — | % | (0.1 | )% | ||
Tax reserves | (2.1 | )% | (1.3 | )% | (0.1 | )% | ||
Loss on expiration of capital loss carryover | — | % | 1.1 | % | — | % | ||
Credits | 0.1 | % | (0.1 | )% | 0.4 | % | ||
Other | (1.6 | )% | 0.9 | % | — | % | ||
FTC conversion true up | (5.9 | )% | — | % | — | % | ||
2017 Tax Act impact | — | % | 1.1 | % | (28.7 | )% | ||
Valuation allowance | 0.1 | % | (19.6 | )% | 11.6 | % | ||
Effective tax rate | (2.4 | )% | 0.7 | % | (1.1 | )% | ||
Undistributed earnings of the Company’s foreign subsidiaries are considered to be indefinitely reinvested and accordingly, no provision for applicable income taxes has been provided thereon. Upon distribution of those earnings, the Company would be subject to withholding taxes payable to various foreign countries. As of December 31, 2019, any foreign withholding taxes on the undistributed earnings of the Company’s foreign subsidiaries were immaterial.
The Company maintains liabilities for uncertain tax positions. These liabilities involve considerable judgment and estimation and are continuously monitored by management based on the best information available, including changes in tax regulations, the outcome of relevant court cases, and other information. A reconciliation of the beginning and ending amount of gross unrecognized tax benefits is as follows (in thousands):
Years Ended December 31, | |||||||||||
2019 | 2018 | 2017 | |||||||||
Balance at beginning of year | $ | 4,611 | $ | 4,672 | $ | 6,232 | |||||
Gross increases for tax positions of prior years | 394 | — | — | ||||||||
Gross decreases for federal tax rate change for tax positions of prior years | — | — | (1,670 | ) | |||||||
Gross increases for tax positions of current year | 34 | 45 | 110 | ||||||||
Lapse of statute of limitations | (213 | ) | (106 | ) | — | ||||||
Balance at end of year | $ | 4,826 | $ | 4,611 | $ | 4,672 | |||||
69
The unrecognized tax benefits relate primarily to federal and state research and development credits and intercompany profit on the transfer of certain IP rights to one of the Company’s foreign subsidiaries as part of the Company’s tax reorganization completed in 2015. The Company’s policy is to account for interest and penalties related to uncertain tax positions as a component of income tax expense. As of December 31, 2019, the Company accrued interest or penalties related to uncertain tax positions in the amount of $25,000. As of December 31, 2019, the total amount of unrecognized tax benefits that would affect the Company’s effective tax rate, if recognized, is $97,000.
Because the Company has net operating loss and credit carryforwards, there are open statutes of limitations in which federal, state and foreign taxing authorities may examine the Company’s tax returns for all years from 2000 through the current period.
9. NET INCOME (LOSS) PER SHARE
Basic net income (loss) per share is computed using the weighted average number of common shares outstanding for the period, excluding unvested restricted stock and RSUs. Diluted net income (loss) per share is computed using the weighted average common shares outstanding for the period plus dilutive potential shares including assumed release of unvested restricted stock and RSUs, assumed exercise of stock options, and assumed issuance of common stock under ESPP using the treasury stock method. The following is a reconciliation of the numerators and denominators used in computing basic and diluted net income (loss) per share (in thousands, except for per share amounts):
Years Ended December 31, | |||||||||||
2019 | 2018 | 2017 | |||||||||
Numerator: | |||||||||||
Net income (loss) | $ | (20,044 | ) | $ | 54,343 | $ | (45,291 | ) | |||
Denominator: | |||||||||||
Weighted-average common stock outstanding, basic | 31,529 | 30,459 | 29,179 | ||||||||
Dilutive potential common shares: | |||||||||||
Stock options, RSU's, RSAs and ESPP | — | 948 | — | ||||||||
Shares used in computation of diluted net income (loss) per share | 31,529 | 31,407 | 29,179 | ||||||||
Basic net income (loss) per share | $ | (0.64 | ) | $ | 1.78 | $ | (1.55 | ) | |||
Diluted net income (loss) per share | $ | (0.64 | ) | $ | 1.73 | $ | (1.55 | ) | |||
The Company includes the underlying market condition stock options in the calculation of diluted earnings per share if the performance condition has been satisfied as of the end of the reporting period and excludes such options if the performance condition has not been met.
For the year ended December 31, 2019, approximately 1.0 million stock options and 1.0 million RSUs and RSAs were excluded from computation of diluted net loss per share because their effect would have been anti-dilutive.
For the year ended December 31, 2018, approximately 0.4 million stock options were excluded from computation of diluted net income per share because their effect would have been anti-dilutive.
For the year ended December 31, 2017, approximately 3.6 million stock options and 0.6 million RSUs and RSAs were excluded from computation of diluted net loss per share because their effect would have been anti-dilutive.
70
10. EMPLOYEE BENEFIT PLAN
The Company has a 401(k) tax-deferred savings plan under which eligible employees may elect to have a portion of their salary deferred and contributed to the 401(k) plan. Contributions may be matched by the Company at its discretion. The Company matched 50% of the employee’s contribution up to $4,000 for the years ended December 31, 2019, 2018 and 2017 (in thousands):
Year ended December 31, | |||||||||||
2019 | 2018 | 2017 | |||||||||
Company contribution to 401 (k) plan | $ | 125 | $ | 141 | $ | 259 | |||||
11. LEASES
The Company leases all of its office space pursuant to lease arrangements, each of which have expiration dates on or before February 29, 2024. On January 1, 2019 (the “Adoption Date”), the Company adopted ASC 842 Leases, using the alternative modified transition method to apply the standard and measure leases existed at, or entered into after the Adoption Date. Upon adoption of ASC 842, the Company recognized operating lease liabilities of $4.9 million, which represents the present value of the remaining lease payments of existing leases as of the Adoption Date using an estimated incremental borrowing rate of 3.25%. The Company also recognized lease ROU assets of $4.0 million which represent the Company's right to use an underlying asset for the lease term. In conjunction with the adoption of ASC 842, the Company elected the following practical expedients: (i) combining lease and non-lease components, (ii) leases with an initial term of 12 months or less are not recorded in the Consolidated Balance Sheets, and the associated lease payments are recognized in the Consolidated Statements of Operations and Comprehensive Income (Loss) on a straight-line basis over the lease term, and (iii) applying discount rates to operating leases using a portfolio approach.
There was no cumulative-effect adjustment recognized on the beginning accumulated deficit as a result of the adoption. The comparative periods presented reflect the former lease accounting guidance.
Below is a summary of our lease ROU assets and lease liabilities as of the Adoption Date and December 31, 2019, respectively (in thousands):
Balance Sheets Classification | December 31, 2019 | January 1, 2019 | |||||||
Assets | |||||||||
Operating lease assets | Other assets | $ | 2,202 | $ | 4,048 | ||||
Liabilities | |||||||||
Operating lease liabilities - current | Other current liabilities | 1,150 | 1,157 | ||||||
Operating lease liabilities - long-term | Other long-term liabilities | 2,664 | 3,693 | ||||||
Total lease liabilities | $ | 3,814 | $ | 4,850 | |||||
The table below provides supplemental information related to operating leases during the year ended December 31, 2019 (in thousands except for lease term):
Cash paid within operating cash flow | $ | 1,178 | |
Weighted average lease terms (in years) | 3.35 | ||
71
Operating lease ROU assets and liabilities commencing after the Adoption Date are recognized at commencement date based on the present value of lease payments over the lease term. Under ASC 842, all operating lease expenses are recognized on a straight-line basis over the lease term. During the years ended December 31, 2019, 2018 and 2017, the Company's operating lease expenses are as follows (in thousands):
Year ended December 31, | |||||||||||
2019 | 2018 | 2017 | |||||||||
Operating lease costs | $ | 1,120 | $ | 1,181 | $ | 1,307 | |||||
As of December 31, 2018, the Company had $0.8 million in deferred rent which represented unamortized lease incentives on its outstanding leases and was recorded as a reduction to the ROU assets recognized at the Adoption Date.
The Company leases several of its facilities under non-cancelable operating lease arrangements that expire at various dates through 2024. On November 12, 2014, the Company entered into an amendment to the lease of its primary facilities. The amendment terminated the prior lease of a San Jose, California facility of approximately 33,000 square feet as of May 2015, which had been scheduled to expire in December 2016. It also began the current lease of a San Jose, California facility of approximately 42,000 square feet as of February 2015. The lease contains provisions for leasehold improvement incentives and expires as of April 2023 and can be extended to April 2028.
During 2019, the Company began to shift general and administrative, research and development and executive functions and employees from the SJ Facility to temporary office space maintained in San Francisco, California and the Company's Montreal, Canada office. In the fourth quarter 2019, the Company announced the decision to exit the SJ Facility. The lease for the SJ Facility expires in April 2023. The Company's exit of the SJ Facility is expected to be completed by March 31, 2020. The Company is currently marketing the SJ Facility for a sublessor. In the fourth quarter of 2019, the Company recorded a $0.9 million impairment charge to the SJ Facility ROU asset.
Minimum future lease payments obligations as of December 31, 2019 are as follows (in thousands):
For the Years Ending December 31, | ||||
2020 | $ | 1,230 | ||
2021 | 1,197 | |||
2022 | 1,171 | |||
2023 | 457 | |||
2024 | 24 | |||
Total | $ | 4,079 | ||
Effective January 31, 2020, the Company entered into an agreement to lease approximately 5,000 square feet of office space in San Francisco, California. This facility will be used for administrative and headquarter functions. The lease expires in 2022. The lease commenced in the first quarter of 2020. The Company expects to increase its ROU assets by of $0.6 million in first quarter of 2020 related to this operating lease.
12. CONTINGENCIES
From time to time, the Company receives claims from third parties asserting that the Company’s technologies, or those of its licensees, infringe on the other parties’ IP rights. Management believes that these claims are without merit. Additionally, periodically, the Company is involved in routine legal matters and contractual disputes incidental to its normal operations. In management’s opinion, the resolution of such matters will not have a material adverse effect on the Company’s consolidated financial condition, results of operations, or liquidity.
In the normal course of business, the Company provides indemnification of varying scope to customers, most commonly to licensees in connection with licensing arrangements that include our IP, although these provisions can cover additional matters. Historically, costs related to these guarantees have not been significant, and the Company is unable to estimate the maximum potential impact of these guarantees on its future results of operations.
72
On April 28, 2017, the Company and Immersion Software Ireland Limited (collectively, “Immersion”) received a letter from Samsung Electronics Co. (“Samsung”) requesting that the Company reimburse Samsung with respect to withholding tax and penalties imposed on Samsung by the Korean tax authorities following an investigation where the tax authority determined that Samsung failed to withhold taxes on Samsung’s royalty payments to Immersion Software Ireland from 2012 to 2016. On July 12, 2017, on behalf of Samsung, Immersion filed an appeal with the Korea Tax Tribunal regarding their findings with respect to the withholding taxes and penalties. On October 18, 2018, the Korea Tax Tribunal held a hearing and on November 19, 2018, the Korea Tax Tribunal issued its ruling in which it decided not to accept the Company's arguments with respect to the Korean tax authorities’ assessment of withholding tax and penalties imposed on Samsung. On behalf of Samsung, we filed an appeal with the Korea Administrative Court on February 15, 2019. The first hearing occurred on June 27, 2019. A second hearing occurred on August 29, 2019. A third hearing occurred on October 31, 2019. A fourth hearing occurred on December 19, 2019. A fifth hearing is scheduled for April 2, 2020.
On September 29, 2017, Samsung filed an arbitration demand with the International Chamber of Commerce against Immersion demanding that the Company reimburse Samsung for the imposed tax and penalties that Samsung paid to the Korean tax authorities. On March 27, 2019, the Company received the final award. The award ordered Immersion to pay Samsung KRW 7,841,324,165 ($6.9 million) which Immersion paid on April 22, 2019, and recorded in Other Assets, net. The award also denied Samsung’s claim for interest from and after May 2, 2017, and ordered Immersion to pay Samsung’s cost of the arbitration in the amount of approximately $871,454.
The Company believes that there are valid defenses to all of the claims from the Korean tax authorities. The Company intends to vigorously defend against the claims from the Korean tax authorities. The Company expects to be reimbursed by Samsung to the extent the Company ultimately prevails in the appeal in the Korea courts. In the event that the Company does not ultimately prevail in its appeal in the Korean courts, the deposit included in Other assets would be recorded as additional income tax expense on the Company's Consolidated Statement of Operations and Comprehensive Income (Loss), in the period in which the Company does not ultimately prevail.
On October 16, 2017, the Company received a letter from LG Electronics Inc. (“LGE”) requesting that the Company reimburse LGE with respect to withholding tax imposed on LGE by the Korean tax authorities following an investigation where the tax authority determined that LGE failed to withhold on LGE’s royalty payments to Immersion Software Ireland
from 2012 to 2014. On November 3, 2017, on behalf of LGE, the Company filed an appeal with the Korea Tax Tribunal regarding their findings with respect to the withholding taxes. The Korea Tax Tribunal hearing took place on March 5, 2019. On March 19, 2019, the Korea Tax Tribunal issued its ruling in which it decided not to accept Immersion’s arguments with respect to the Korean tax authorities’ assessment of withholding tax and penalties imposed on LGE. On behalf of LGE, we filed an appeal with the Korea Administrative Court on June 10, 2019. The first hearing occurred on October 15, 2019. A second hearing occurred on December 19, 2019. A third hearing occurred on February 13, 2020. A fourth hearing is scheduled for April 7, 2020.
The Company believes that there are valid defenses to the claims raised by the Korean tax authorities and that LGE’s claims are without merit. The Company intends to vigorously defend itself against these claims. In the event that the Company does not ultimately prevail in its appeal in the Korean courts, any payments to LGE with respect to withholding tax imposed on LGE by the Korean tax authorities as described in the previous paragraph would be recorded as additional income tax expense on the Company's Consolidated Statement of Operations and Comprehensive Income (Loss), in the period in which the Company does not ultimately prevail.
On July 31, 2019, the Company entered into a settlement and license agreement with Motorola Mobility LLC and Motorola Mobility Holdings LLC (collectively, “Motorola”). Pursuant to that agreement, on August 12, 2019, the parties filed a joint motion to dismiss the case with prejudice. On August 13, 2019, the Court granted the motion and ordered that all claims and counterclaims in Civil Action No. 1:17-cv-01081-RGA be dismissed with prejudice, and that each party shall bear its own costs, expenses, and attorneys’ fees. The parties also terminated the related IPR proceedings. See Legal Proceedings in Part II, Item 1 of this Quarterly Report for more information related to this settlement and license agreement and the related IPR proceedings.
73
13. SEGMENT REPORTING, GEOGRAPHIC INFORMATION, AND SIGNIFICANT CUSTOMERS
Segment Information
The Company develops, licenses, and supports a wide range of software and IP that more fully engage users’ sense of touch when operating digital devices. The Company focuses on the following target application areas: mobile devices, wearables, consumer, mobile entertainment and other content; console gaming; automotive; medical; and commercial. The Company manages these application areas in one operating and reporting segment with only one set of management, development, and administrative personnel.
The Company’s chief operating decision maker (“CODM”) is the Chief Executive Officer. The CODM approves budgets and allocates resources to and assesses the performance of the Company using information about its revenue and operating loss. There is only one segment that is reported to management.
Revenue by Market Area
The following is a summary of revenues by market areas. Revenue as a percentage of total revenues by market was as follows:
Years Ended December 31, | ||||||||
2019 | 2018 | 2017 | ||||||
Mobile, Wearables, and Consumer | 63 | % | 81 | % | 48 | % | ||
Gaming Devices | 16 | % | 5 | % | 31 | % | ||
Automotive | 21 | % | 13 | % | 15 | % | ||
Medical | — | % | 1 | % | 6 | % | ||
Total | 100 | % | 100 | % | 100 | % | ||
Geographic Revenue
Revenues are broken out geographically by the location of the customer. A summary of revenue by region as a percentage of total revenues are as follows:
Years Ended December 31, | ||||||||
2019 | 2018 | 2017 | ||||||
Asia | 65 | % | 12 | % | 63 | % | ||
North America | 28 | % | 77 | % | 22 | % | ||
Europe | 7 | % | 11 | % | 15 | % | ||
Total | 100 | % | 100 | % | 100 | % | ||
A summary of revenue by country as a percentage of total revenues are as follows:
Years Ended December 31, | ||||||||
2019 | 2018 | 2017 | ||||||
Korea | 45 | % | * | 18 | % | |||
United States of America | 28 | % | 77 | % | 22 | % | ||
Japan | 17 | % | * | 39 | % | |||
Other countries with less than 10% in a year | 10 | % | 23 | % | 21 | % | ||
Total | 100 | % | 100 | % | 100 | % | ||
* Represents less than 10% of the Company’s total revenue for the year presented.
74
Property and Equipment, net by Country
Property and equipment, net by geographic areas as a percentage of total property and equipment, net are as follows (in thousands):
December 31, | |||||
2019 | 2018 | ||||
United States of America | 85 | % | 91 | % | |
Canada | 15 | % | 8 | % | |
Rest of World | — | % | 1 | % | |
Total | 100 | % | 100 | % | |
Significant Customers
A summary of revenues from customers with 10% or greater of the Company’s net revenues are as follows:
Years Ended December 31, | ||||||||
2019 | 2018 | 2017 | ||||||
Samsung Electronics | 27 | % | — | % | — | % | ||
Apple Inc. | * | 69 | % | — | % | |||
Customer A | * | — | % | 20 | % | |||
Customer B | * | * | 18 | % | ||||
Customer C | * | * | 11 | % | ||||
Total | 27 | % | 69 | % | 49 | % | ||
* Represents less than 10% of the Company’s total revenue for the year presented.
A summary of customers with 10% or greater of the Company’s outstanding accounts and other receivables are as follows:
December 31, | |||||
2019 | 2018 | ||||
Customer B | 22 | % | — | % | |
Customer E | — | % | 55 | % | |
Customer F | — | % | 36 | % | |
75
14. QUARTERLY RESULTS OF OPERATIONS (UNAUDITED)
Selected summarized quarterly financial information for the years ended December 31, 2019 and 2018 is as follows (in thousands, except per share amounts):
Q1 2019 | Q2 2019 | Q3 2019 | Q4 2019 | 2019 (1) | |||||||||||||||
Revenues | $ | 5,122 | $ | 8,743 | $ | 10,624 | $ | 11,464 | $ | 35,953 | |||||||||
Gross profit | $ | 5,107 | $ | 8,703 | $ | 10,562 | $ | 11,411 | $ | 35,783 | |||||||||
Operating income (loss) | $ | (11,499 | ) | $ | (9,155 | ) | $ | (1,275 | ) | $ | 478 | $ | (21,451 | ) | |||||
Income (loss) before provision for taxes | $ | (10,901 | ) | $ | (8,623 | ) | $ | (1,299 | ) | $ | 1,250 | $ | (19,573 | ) | |||||
Benefit (provision) for income taxes | $ | (115 | ) | $ | 3 | $ | (88 | ) | $ | (271 | ) | $ | (471 | ) | |||||
Net income (loss) | $ | (11,016 | ) | $ | (8,620 | ) | $ | (1,387 | ) | $ | 979 | $ | (20,044 | ) | |||||
Basic net income (loss) per share | $ | (0.35 | ) | $ | (0.27 | ) | $ | (0.04 | ) | $ | 0.03 | $ | (0.64 | ) | |||||
Shares used in calculating basic net income (loss) per share | 31,089 | 31,578 | 31,711 | 31,731 | 31,529 | ||||||||||||||
Diluted net income (loss) per share | $ | (0.35 | ) | $ | (0.27 | ) | $ | (0.04 | ) | $ | 0.03 | $ | (0.64 | ) | |||||
Shares used in calculating diluted net income (loss) per share | 31,089 | 31,578 | 31,711 | 31,904 | 31,529 | ||||||||||||||
(1) Quarterly income (loss) per share amounts were calculated separately for each period, therefore the sum of the quarterly amounts may differ from the total income (loss) per share amount for the year.
Q1 2018 | Q2 2018 | Q3 2018 | Q4 2018 | 2018 (1) | |||||||||||||||
Revenues | $ | 85,416 | $ | 6,144 | $ | 8,552 | $ | 10,867 | $ | 110,979 | |||||||||
Gross profit | $ | 85,381 | $ | 6,050 | $ | 8,491 | $ | 10,839 | $ | 110,761 | |||||||||
Operating income (loss) | $ | 70,105 | $ | (8,295 | ) | $ | (5,163 | ) | $ | (3,546 | ) | $ | 53,101 | ||||||
Income (loss) before provision for taxes | $ | 70,336 | $ | (7,920 | ) | $ | (4,618 | ) | $ | (3,063 | ) | $ | 54,735 | ||||||
Benefit (provision) for income taxes | $ | (453 | ) | $ | 162 | $ | (22 | ) | $ | (79 | ) | $ | (392 | ) | |||||
Net income (loss) | $ | 69,883 | $ | (7,758 | ) | $ | (4,640 | ) | $ | (3,142 | ) | $ | 54,343 | ||||||
Basic net income (loss) per share | $ | 2.35 | $ | (0.25 | ) | $ | (0.15 | ) | $ | (0.10 | ) | $ | 1.78 | ||||||
Shares used in calculating basic net income (loss) per share | 29,700 | 30,527 | 30,780 | 30,814 | 30,459 | ||||||||||||||
Diluted net income (loss) per share | $ | 2.29 | $ | (0.25 | ) | $ | (0.15 | ) | $ | (0.10 | ) | $ | 1.73 | ||||||
Shares used in calculating diluted net income (loss) per share | 30,566 | 30,527 | 30,780 | 30,814 | 31,407 | ||||||||||||||
(1) Quarterly income (loss) per share amounts were calculated separately for each period, therefore the sum of the quarterly amounts may differ from the total income (loss) per share amount for the year.
76
Item 9. Changes in and Disagreements with Accountants on Accounting and Financial Disclosure
None.
Item 9A. Control and Procedures
Management’s Evaluation of Disclosure Controls and Procedures
Based on their evaluation of our disclosure controls and procedures (as defined in Rules 13a-15(e) and 15d-15(e) under the Exchange Act, as amended) as of December 31, 2019, our management, with the participation of our Chief Executive Officer and Chief Financial Officer, have concluded that our disclosure controls and procedures were effective as of the end of the period covered by this report for the purpose of ensuring that the information required to be disclosed by us in this Annual Report on Form 10-K is made known to them by others on a timely basis, and that the information is accumulated and communicated to our management, including our Chief Executive Officer and Chief Financial Officer, in order to allow timely decisions regarding required disclosure, and that such information is recorded, processed, summarized, and reported by us within the time periods specified in the SEC’s rules and instructions for Form 10-K.
Our management, including our Executive Officer and Chief Financial Officer, does not expect that our disclosure controls and procedures or our internal controls over financial reporting will prevent all error and all fraud. A control system, no matter how well conceived and operated, can provide only reasonable, not absolute, assurance that the objectives of the control system are met. Further, the design of a control system must reflect the fact that there are resource constraints and the benefits of controls must be considered relative to their costs. Because of the inherent limitations in all control systems, no evaluation of controls can provide absolute assurance that all control issues and instances of fraud, if any, within Immersion have been detected.
Management’s Annual Report on Internal Control over Financial Reporting
Our management is responsible for establishing and maintaining adequate internal control over financial reporting (as defined in Rule 13a-15(f) under the Exchange Act). Internal control over financial reporting is a process designed by, or under the supervision of, our Chief Executive Officer and our Chief Financial Officer and affected by our board of directors and management to provide reasonable assurance regarding the reliability of financial reporting and the preparation of financial statements for external purposes in accordance with GAAP. Our management assessed the effectiveness of our internal control over financial reporting as of December 31, 2019. Management’s assessment of internal control over financial reporting was conducted using the criteria in Internal Control — Integrated Framework (2013) issued by the Committee of Sponsoring Organizations of the Treadway Commission (“COSO”). In performing the assessment, our management concluded that, as of December 31, 2019, our internal control over financial reporting is effective based on these criteria.
Deloitte and Touche LLP, the independent registered public accounting firm that audited our financial statements included in this Annual Report on Form 10-K, has issued an attestation report on our internal control over financial reporting, which is included herein.
Changes in internal control over financial reporting
There were no changes to internal controls over financial reporting that occurred during the quarter ended December 31, 2019 that have materially affected or are reasonably likely to materially affect our internal controls over financial reporting.
Item 9B. Other Information
None.
77
REPORT OF INDEPENDENT REGISTERED PUBLIC ACCOUNTING FIRM
To the Board of Directors and Stockholders of Immersion Corporation
Opinion on Internal Control over Financial Reporting
We have audited the internal control over financial reporting of Immersion Corporation and subsidiaries (the “Company”) as of December 31, 2019, based on criteria established in Internal Control - Integrated Framework (2013) issued by the Committee of Sponsoring Organizations of the Treadway Commission (COSO). In our opinion, the Company maintained, in all material respects, effective internal control over financial reporting as of December 31, 2019, based on criteria established in Internal Control - Integrated Framework (2013) issued by COSO.
We have also audited, in accordance with the standards of the Public Company Accounting Oversight Board (United States) (PCAOB), the consolidated financial statements as of and for the year ended December 31, 2019, of the Company and our report dated March 6, 2020, expressed an unqualified opinion on those financial statements and included explanatory paragraphs related to the Company’s change in method of accounting for revenue in 2018 due to the adoption of ASC 606 and change in method of accounting for leases in 2019 due to the adoption of ASC 842.
Basis for Opinion
The Company’s management is responsible for maintaining effective internal control over financial reporting and for its assessment of the effectiveness of internal control over financial reporting, included in the accompanying Management's Report on Internal Control Over Financial Reporting. Our responsibility is to express an opinion on the Company’s internal control over financial reporting based on our audit. We are a public accounting firm registered with the PCAOB and are required to be independent with respect to the Company in accordance with the U.S. federal securities laws and the applicable rules and regulations of the Securities and Exchange Commission and the PCAOB.
We conducted our audit in accordance with the standards of the PCAOB. Those standards require that we plan and perform the audit to obtain reasonable assurance about whether effective internal control over financial reporting was maintained in all material respects. Our audit included obtaining an understanding of internal control over financial reporting, assessing the risk that a material weakness exists, testing and evaluating the design and operating effectiveness of internal control based on the assessed risk, and performing such other procedures as we considered necessary in the circumstances. We believe that our audit provides a reasonable basis for our opinion.
Definition and Limitations of Internal Control over Financial Reporting
A company’s internal control over financial reporting is a process designed to provide reasonable assurance regarding the reliability of financial reporting and the preparation of financial statements for external purposes in accordance with generally accepted accounting principles. A company’s internal control over financial reporting includes those policies and procedures that (1) pertain to the maintenance of records that, in reasonable detail, accurately and fairly reflect the transactions and dispositions of the assets of the company; (2) provide reasonable assurance that transactions are recorded as necessary to permit preparation of financial statements in accordance with generally accepted accounting principles, and that receipts and expenditures of the company are being made only in accordance with authorizations of management and directors of the company; and (3) provide reasonable assurance regarding prevention or timely detection of unauthorized acquisition, use, or disposition of the company’s assets that could have a material effect on the financial statements.
Because of its inherent limitations, internal control over financial reporting may not prevent or detect misstatements. Also, projections of any evaluation of effectiveness to future periods are subject to the risk that controls may become inadequate because of changes in conditions, or that the degree of compliance with the policies or procedures may deteriorate.
/s/ DELOITTE & TOUCHE LLP
San Jose, California
March 6, 2020
78
PART III
The SEC allows us to include information required in this report by referring to other documents or reports we have already or will soon be filing. This is called “Incorporation by Reference”. We intend to file our definitive proxy statement pursuant to Regulation 14A not later than 120 days after the end of the fiscal year covered by this report, and certain information therein is incorporated in this report by reference.
Item 10. Directors, Executive Officers and Corporate Governance
The information required by Item 10 with respect to executive officers is incorporated by reference from the sections entitled “Election of Directors”, “Corporate Governance”, “Ownership of Our Equity Securities”, “Section 16(a) Beneficial Ownership Reporting Compliance”, and “Audit Committee Report” in Immersion’s definitive Proxy Statement for its 2020 annual stockholders’ meeting.
Item 11. Executive Compensation
The information required by Item 11 is incorporated by reference from the sections entitled “Election of Directors”, “Director Compensation”, “Corporate Governance”, “Compensation Discussion and Analysis”, “Compensation Committee Report”, “Compensation Committee Interlocks and Insider Participation”, and “Executive Compensation” in Immersion’s definitive Proxy Statement for its 2020 annual stockholders’ meeting.
Item 12. Security Ownership of Certain Beneficial Owners and Management and Related Stockholder Matters
The information required by Item 12 is incorporated by reference from the section entitled “Ownership of Our Equity Securities” and “Equity Compensation Plan Information” in Immersion’s definitive Proxy Statement for its 2020 annual stockholders’ meeting.
Item 13. Certain Relationships and Related Transactions, and Director Independence
The information required by Item 13 is incorporated by reference from the section entitled “Corporate Governance” and “Related Person Transactions” in Immersion’s definitive Proxy Statement for its 2020 annual stockholders’ meeting.
Item 14. Principal Accounting Fees and Services
The information required by Item 14 is incorporated by reference from the section entitled “Ratification of Appointment of Independent Registered Public Accounting Firm” in Immersion’s definitive Proxy Statement for its 2020 annual stockholders’ meeting.
79
PART IV
Item 15. Exhibits, Financial Statement Schedules
The following documents are filed as part of this Form:
1 | Financial Statements |
2 | Financial Statement Schedules |
Schedules not listed above have been omitted because the information required to be set forth therein is not applicable or is shown in the consolidated financial statements or notes herein.
80
3 | Exhibits: |
The following exhibits are filed herewith:
Exhibit Number | Exhibit Description | Incorporated by Reference | Filed Herewith | |||||||||
Form | File No. | Exhibit | Filing Date | |||||||||
8-K | 000-27969 | 3.1 | November 4, 2016 | |||||||||
8-K | 000-27969 | 3.1 | June 7, 2017 | |||||||||
8-K | 000-27969 | 3.1 | July 29, 2003 | |||||||||
8-K | 000-27969 | 3.1 | December 27, 2017 | |||||||||
X | ||||||||||||
* | S-1/A | 333-86361 | 10.21 | October 5, 1999 | ||||||||
# | S-3 | 333-108607 | 10.3 | September 8, 2003 | ||||||||
# | S-3/A | 333-108607 | 10.4 | February 13, 2004 | ||||||||
* | S-3/A | 333-108607 | 10.11 | March 25, 2004 | ||||||||
* | 8-K | 000-27969 | 99.1 | June 12, 2007 | ||||||||
* | 8-K | 000-27969 | 99.4 | June 12, 2007 | ||||||||
* | 8-K | 000-27969 | 99.5 | June 12, 2007 | ||||||||
* | X | |||||||||||
* | 8-K | 001-38334 | 10.1 | June 18, 2019 | ||||||||
* | S-8 | 333-233353 | 4.4 | August 19, 2019 | ||||||||
* | 10-Q | 000-27969 | 10.3 | August 5, 2011 | ||||||||
* | S-8 | 333-233353 | 4.6 | August 19, 2019 | ||||||||
10-Q | 000-27969 | 10.2 | November 7, 2011 | |||||||||
8-K | 000-27969 | 10.1 | November 14, 2014 | |||||||||
81
Exhibit Number | Exhibit Description | Incorporated by Reference | Filed Herewith | |||||||||
Form | File No. | Exhibit | Filing Date | |||||||||
# | 10-Q/A | 01-38334 | 10.2 | July 31, 2018 | ||||||||
* | 8-K | 01-38334 | 10.1 | January 7, 2019 | ||||||||
10-Q | 001-38334 | 10.1 | August 14, 2019 | |||||||||
* | 10-Q | 001-38334 | 10.4 | August 14, 2019 | ||||||||
* | 10-Q | 001-38334 | 10.5 | August 14, 2019 | ||||||||
* | 10-Q | 001-38334 | 10.1 | November 7, 2019 | ||||||||
* | X | |||||||||||
* | X | |||||||||||
X | ||||||||||||
X | ||||||||||||
X | ||||||||||||
X | ||||||||||||
+ | X | |||||||||||
+ | X | |||||||||||
82
Exhibit Number | Exhibit Description | Incorporated by Reference | Filed Herewith | |||||||||
Form | File No. | Exhibit | Filing Date | |||||||||
101.INS | XBRL Report Instance Document | X | ||||||||||
101.SCH | XBRL Taxonomy Extension Schema Document | X | ||||||||||
101.CAL | XBRL Taxonomy Calculation Linkbase Document | X | ||||||||||
101.DEF | XBRL Taxonomy Extension Definition Linkbase Document | X | ||||||||||
101.LAB | XBRL Taxonomy Label Linkbase Document | X | ||||||||||
101.PRE | XBRL Presentation Linkbase Document | X | ||||||||||
# | Confidential treatment has been granted for portions of this exhibit by the SEC. |
* | Constitutes a management contract or compensatory plan. |
+ | This certification is deemed not filed for purposes of section 18 of the Exchange Act, as amended, or otherwise subject to the liability of that section, nor shall it be deemed incorporated by reference into any filing under the Securities Act, as amended, or the Exchange Act, as amended. |
83
Item 16. Form 10-K Summary
None.
SIGNATURES
Pursuant to the requirements of Section 13 or 15(d) of the Exchange Act, the Registrant has duly caused this Report to be signed on its behalf by the undersigned thereunto duly authorized.
Date: March 6, 2020
IMMERSION CORPORATION | ||||
By | /S/ AARON AKERMAN | |||
Aaron Akerman | ||||
Chief Financial Officer | ||||
POWER OF ATTORNEY
KNOW ALL PERSONS BY THESE PRESENTS, that each person whose signature appears below constitutes and appoints Ramzi Haidamus and Aaron Akerman, jointly and severally, his or her his Annual Report on Form 10-K and to file the same, with exhibits thereto and other documents in connection therewith, with the Securities and Exchange Commission, hereby ratifying and confirming all that each of said attorneys-in-fact, or his or her substitute or substitutes, may do or cause to be done by virtue thereof.
Pursuant to the requirements of the Securities Exchange Act of 1934, this Annual Report on Form 10-K has been signed below by the following persons on behalf of the Registrant and in the capacities and on the dates indicated.
Name | Title | Date | ||
/s/ RAMZI HAIDAMUS | Chief Executive Officer and Director (Principal Executive Officer) | March 6, 2020 | ||
Ramzi Haidamus | ||||
/S/ AARON AKERMAN | Chief Financial Officer (Principal Financial Officer and Principal Accounting Officer) | March 6, 2020 | ||
Aaron Akerman | ||||
/S/ SHARON HOLT | Chairman of the Board and Director | March 6, 2020 | ||
Sharon Holt | ||||
/S/ SUMIT AGARWAL | Director | March 6, 2020 | ||
Sumit Agarwal | ||||
/S/ MATTHEW FREY | Director | March 6, 2020 | ||
Matthew Frey | ||||
/S/ SIDNEY GANIS | Director | March 6, 2020 | ||
Sidney Ganis | ||||
/S/WILLIAM C. MARTIN | Director | March 6, 2020 | ||
William C. Martin | ||||
/S/JONATHAN VISBAL | Director | March 6, 2020 | ||
Jonathan Visbal | ||||
84